UNITED STATES
SECURITIES AND EXCHANGE COMMISSION
Washington, D.C. 20549
FORM N-CSR
CERTIFIED SHAREHOLDER REPORT OF REGISTERED
MANAGEMENT INVESTMENT COMPANIES
Investment Company Act file number | 811-05624 |
|
Morgan Stanley Institutional Fund, Inc. |
(Exact name of registrant as specified in charter) |
|
522 Fifth Avenue, New York, New York | | 10036 |
(Address of principal executive offices) | | (Zip code) |
|
John H. Gernon 522 Fifth Avenue, New York, New York 10036 |
(Name and address of agent for service) |
|
Registrant’s telephone number, including area code: | 212-296-0289 | |
|
Date of fiscal year end: | December 31, | |
|
Date of reporting period: | December 31, 2019 | |
| | | | | | | | |
Item 1 - Report to Shareholders

Morgan Stanley Institutional Fund, Inc.
Active International Allocation Portfolio
Annual Report
December 31, 2019
Beginning on January 1, 2021, as permitted by regulations adopted by the Securities and Exchange Commission ("SEC"), paper copies of the Fund's Annual and Semi-Annual Reports to Shareholders ("Shareholder Reports") will no longer be sent by mail, unless you specifically request paper copies of the Shareholder Reports from the Fund or from your financial intermediary, such as a broker-dealer or a bank. Instead, the Shareholder Reports will be made available on the Fund's website, https://www.morganstanley.com/im/shareholderreports and you will be notified by mail each time a Shareholder Report is posted and provided with a website link to access the Shareholder Report. If you already elected to receive Shareholder Reports electronically, you will not be affected by this change and you need not take any action. You may elect to receive Shareholder Reports and other communications from the Fund electronically anytime by contacting your financial intermediary or, if you are a direct investor, please follow the instructions on the envelope.
Beginning on January 1, 2019, you may elect to receive all future Shareholder Reports in paper free of charge. If you invest through a financial intermediary, you can contact your financial intermediary to request that you continue to receive paper copies of your Shareholder Reports. If you invest directly with the Fund, please follow the instructions on the envelope to let the Fund know you wish to continue receiving paper copies of your Shareholder Reports. Your election to receive Shareholder Reports in paper will apply to all funds held in your account if you invest through your financial intermediary or all funds held with the fund complex if you invest directly with a fund.

Morgan Stanley Institutional Fund, Inc.
Annual Report — December 31, 2019
Shareholders' Letter | | | 2 | | |
Expense Example | | | 3 | | |
Investment Overview | | | 4 | | |
Portfolio of Investments | | | 8 | | |
Statement of Assets and Liabilities | | | 12 | | |
Statement of Operations | | | 14 | | |
Statements of Changes in Net Assets | | | 15 | | |
Financial Highlights | | | 17 | | |
Notes to Financial Statements | | | 23 | | |
Report of Independent Registered Public Accounting Firm | | | 35 | | |
Federal Tax Notice | | | 36 | | |
Privacy Notice | | | 37 | | |
Director and Officer Information | | | 39 | | |
This report is authorized for distribution only when preceded or accompanied by a prospectus or summary prospectus of the applicable Fund of Morgan Stanley Institutional Fund, Inc. To receive a prospectus and/or statement of additional information ("SAI"), which contains more complete information such as investment objectives, charges, expenses, policies for voting proxies, risk considerations and describes in detail each of the Fund's investment policies to the prospective investor, please call toll free 1 (800) 548-7786. Please read the prospectuses carefully before you invest or send money.
Additionally, you can access information about the Fund, including performance, characteristics and investment team commentary, through Morgan Stanley Investment Management's website: www.morganstanley.com/im/shareholderreports.
Market forecasts provided in this report may not necessarily come to pass. There is no guarantee that any sectors mentioned will continue to perform as discussed herein or that securities in such sectors will be held by the Fund in the future. There is no assurance that a fund will achieve its investment objective. Funds are subject to market risk, which is the possibility that market values of securities owned by the Fund will decline and, therefore, the value of the Fund's shares may be less than what you paid for them. Accordingly, you can lose money investing in this Fund. Please see the prospectus for more complete information on investment risks.
1
Morgan Stanley Institutional Fund, Inc.
Annual Report — December 31, 2019
Shareholders' Letter (unaudited)
Dear Shareholders,
We are pleased to provide this Annual Report, in which you will learn how your investment in Active International Allocation Portfolio (the "Fund") performed during the latest twelve-month period.
Morgan Stanley Investment Management is a client-centric, investor-led organization. Our global presence, intellectual capital, and breadth of products and services enable us to partner with investors to meet the evolving challenges of today's financial markets. We aim to deliver superior investment service and to empower our clients to make the informed decisions that help them reach their investment goals.
As always, we thank you for selecting Morgan Stanley Investment Management, and look forward to working with you in the months and years ahead.
Sincerely,

John H. Gernon
President and Principal Executive Officer
January 2020
2
Morgan Stanley Institutional Fund, Inc.
Annual Report — December 31, 2019
Expense Example (unaudited)
Active International Allocation Portfolio
As a shareholder of the Fund, you incur two types of costs: (1) transactional costs, including redemption fees; and (2) ongoing costs, which may include advisory fees, administration fees, distribution and shareholder services fees and other Fund expenses. This example is intended to help you understand your ongoing costs (in dollars) of investing in the Fund and to compare these costs with the ongoing costs of investing in other mutual funds.
This example is based on an investment of $1,000 invested at the beginning of the six-month period ended December 31, 2019 and held for the entire six-month period.
Actual Expenses
The table below provides information about actual account values and actual expenses. You may use the information in this table, together with the amount you invested, to estimate the expenses that you paid over the period. Simply divide your account value by $1,000 (for example, an $8,600 account value divided by $1,000 = 8.6), then multiply the result by the number in the table under the heading entitled "Actual Expenses Paid During Period" to estimate the expenses you paid on your account during this period.
Hypothetical Example for Comparison Purposes
The table below provides information about hypothetical account values and hypothetical expenses based on the Fund's actual expense ratio and an assumed rate of return of 5% per year before expenses, which is not the Fund's actual return. The hypothetical account values and expenses may not be used to estimate the actual ending account balance or expenses you paid for the period. You may use this information to compare the ongoing costs of investing in the Fund and other funds. To do so, compare this 5% hypothetical example with the 5% hypothetical examples that appear in the shareholder reports of the other funds.
Please note that the expenses shown in the table are meant to highlight your ongoing costs only and do not reflect any transactional costs, such as sales charges (loads) and redemption fees. Therefore, the information for each class in the table is useful in comparing ongoing costs only, and will not help you determine the relative total costs of owning different funds. In addition, if these transactional costs were included, your costs would have been higher.
| | | Beginning
Account
Value
7/1/19 | | Actual Ending
Account
Value
12/31/19 | | Hypothetical
Ending Account
Value | | Actual
Expenses
Paid
During
Period | | Hypothetical
Expenses Paid
During Period | | Net
Expense
Ratio
During
Period*** | |
Active International Allocation Portfolio Class I | | $ | 1,000.00 | | | $ | 1,066.70 | | | $ | 1,020.72 | | | $ | 4.64 | * | | $ | 4.53 | * | | | 0.89 | % | |
Active International Allocation Portfolio Class A | | | 1,000.00 | | | | 1,064.90 | | | | 1,019.16 | | | | 6.25 | * | | | 6.11 | * | | | 1.20 | | |
Active International Allocation Portfolio Class L | | | 1,000.00 | | | | 1,061.80 | | | | 1,016.38 | | | | 9.09 | * | | | 8.89 | * | | | 1.75 | | |
Active International Allocation Portfolio Class C | | | 1,000.00 | | | | 1,060.00 | | | | 1,015.17 | | | | 10.33 | * | | | 10.11 | * | | | 1.99 | | |
Active International Allocation Portfolio Class IS^ | | | 1,000.00 | | | | 1,071.50 | | | | 1,006.95 | | | | 1.45 | ** | | | 1.41 | ** | | | 0.84 | | |
Active International Allocation Portfolio Class IR^ | | | 1,000.00 | | | | 1,071.50 | | | | 1,006.95 | | | | 1.45 | ** | | | 1.41 | ** | | | 0.84 | | |
* Expenses are calculated using each Fund Class' annualized net expense ratio (as disclosed), multiplied by the average account value over the period and multiplied by 184/365 (to reflect the most recent one-half year period).
** Expenses are calculated using each Fund Class' annualized net expense ratio (as disclosed), multiplied by the average account value over the period and multiplied by 61/365 (to reflect the actual days accrued in the period).
*** Annualized.
^ The Fund commenced offering of Class IR and Class IS shares on October 31, 2019.
3
Morgan Stanley Institutional Fund, Inc.
Annual Report — December 31, 2019
Investment Overview (unaudited)
Active International Allocation Portfolio
The Fund seeks long-term capital appreciation.
Performance
For the fiscal year ended December 31, 2019, the Fund's Class I shares had a total return based on net asset value and reinvestment of distributions per share of 22.41%, net of fees. The Fund's Class I shares outperformed the Fund's benchmark, the MSCI All Country World ex USA Index (the "Index"), which returned 21.51%.
Please keep in mind that double-digit returns are highly unusual and cannot be sustained. Investors should also be aware that these returns were primarily achieved during favorable market conditions.
Factors Affecting Performance
• For 2019, the Fund benefited from positioning in and underweights to Japan, Korea and the U.K. The overweight to and positioning in technology was also additive to Fund returns. Fund performance was hurt by overweights to Argentina and India as well as positioning in emerging markets (EM) banks. The Fund sometimes uses derivative instruments to manage certain market or currency exposures. This contributed to performance in the period.
• This is a core portfolio and our regional/country allocation is geared towards stability and growth, as well as reform potential when we believe it will generate positive structural change. Currently, the Fund is overweight Germany, the Netherlands and India, is underweight Japan, China and Canada, and has zero allocation to Australia and Italy. The Fund has an allocation to the U.S. as a means to capture specific themes in technology and health care and for gold stocks. The Fund has a slight underweight to emerging markets where we expect to add to positions over time as specific countries, sectors, industries and stocks could offer attractive growth and reasonable valuations.
• We are focused on structural themes, namely technology (software, internet and the Internet of Things), health care (aging and innovation), and select staples/consumer stocks. We also have a number of value and cyclical investments such as oil
services, European airlines and DRAM (dynamic random-access memory) manufacturers where consolidation and supply rationalization are leading to much better industry dynamics.
• Our investment outlook continues to be cautiously optimistic for global equities. The headwinds markets faced earlier in 2019 (Federal Reserve [Fed] monetary tightening, slowing economic growth, falling corporate earnings) have been addressed or are showing signs of bottoming. While this is not the most optimal environment for equities, it certainly is not the worst.
• On a longer-term view for 2020 and beyond, we see the potential for non-U.S. markets, which are more attractively valued than the U.S., to re-rate if earnings growth exceeds current consensus forecasts. Importantly we also think that there will be increased dispersion in country, sector, industry and stock performance, which should provide greater opportunity for active managers to add value. Our more in-depth investment outlook follows.
• 2019's robust S&P 500® Index return has continued the multi-year trend of U.S. equities outperforming the Rest of the World with minimal dispersion in sectors and historically low levels of volatility. At this point, U.S. relative outperformance is more than two standard deviations above an established average trend line going back nearly 100 years.(i) This is an unprecedented development that looks to have run too far given much stretched relative valuations and weak earnings trends.
• Over time, we expect a new market regime to evolve and raise the currently low levels of country, sector and industry dispersion, and to result in more normal volatility of returns. As this occurs, it should open the door to a comeback for non-U.S. relative performance.
• Here are some of our key expectations:
1) U.S. outperformance looks hard to sustain. Many global investors have favored the U.S. economy and stock market because of the perception that the U.S. is mostly insulated
(i) Source: MSIM, Bloomberg L.P., FactSet, Haver Analytics.
4
Morgan Stanley Institutional Fund, Inc.
Annual Report — December 31, 2019
Investment Overview (unaudited) (cont'd)
Active International Allocation Portfolio
from trade tensions, helping drive its outperformance in 2019. U.S. earnings held up slightly better than non-U.S.; however, investors have paid for this by buying in at much higher valuations. With foreign markets currently much more attractively valued than their U.S. counterparts, and several signs that the growth outlook is improving, we believe it wouldn't take much improvement in fundamentals to drive strong relative outperformance.
2) The repo market fiasco of 2019 means that the liquidity environment will be more supportive towards non-U.S. assets. Developments in 2019 showed that the Fed's quantitative tightening policy destroyed too many excess reserves in a world where regulated financial institutions have rigorous capital standards. As global and U.S. economic growth undershot projections over the last 18 months, the Fed cut rates three times and was forced by repo market issues to once again actively expand its balance sheet. The exact duration and size of the Fed's response is still debated, but it is clear that policymakers' bias is towards maintaining ample liquidity. In turn, the Fed's easy posture should not only improve global funding, it should also result in better growth dynamics outside the U.S., attracting more currency inflows towards the high-yielding currencies (most of which are in EM). These dynamics illustrate that the strong headwinds facing non-U.S. growth are abating and argue for rotation away from U.S. equities.
3) The strong U.S. dollar faces weakening fundamentals and rising political uncertainty that could take its toll. Our proprietary foreign exchange (FX) framework, which considers many intrinsic variables to derive relative values for all currencies, shows that the U.S. dollar's strong run since 2011 has made it very expensive relative to virtually all global currencies. On top of stretched valuation, a large and widening fiscal deficit as well as a more accommodative Fed all make the U.S. dollar more of a sell than a buy. However, in our view, the challenged fundamentals outlined above, in addition to deepening political division in Washington and the uncertainty stemming from the upcoming 2020 presidential
and congressional elections, could dent the Teflon status of the U.S. dollar. As the 2020 electoral race gathers pace, foreign investors may struggle to handicap the election outcomes and the real-world impacts of the vastly different policy proposals being espoused by the two major parties. All of this is important, because in recent years FX volatility has been very low, and complacency about the U.S. dollar has been high. In sum, investors may increasingly question the premium valuation of the dollar, especially in the face of the fundamental challenges outlined above and a better non-U.S. growth and liquidity environment. Therefore, the strong U.S. dollar — a key pillar of support for U.S. asset outperformance since 2011 — could fade in the months to come.
4) EM offers better return prospects in 2020 and the decade to come. EM's painful decade of underperformance has produced relative valuations that are now at the most attractive levels in about 20 years. Over the next year, a trade truce should be good for the entirety of emerging markets and should broadly result in better growth and earnings trends. In sum, EM equities look poised to reverse their decade of underperformance, with a focused and highly active approach required to truly find those EM countries, sectors, industries and stocks that can sustain multi-year outperformance.
5) The FOMO market will fade and active management will come back into vogue. The U.S. FOMO (fear of missing out) market characterized not only 2019, but much of the 2010s. When investors are all making the same bet and profiting in an unusually calm market, there are less reasons to pay an active manager. As U.S. equity markets rose while volatility and dispersion plumbed new record lows, cheap passive funds took off over the last decade, exacerbating a tough environment for active investors. However, we think the pendulum is now poised to swing back to active. As we have argued, further decoupling, stretched U.S. relative valuations, and threats to the strong U.S. dollar are likely to result in greater dispersion in performance, and a rotation towards non-U.S. assets.
5
Morgan Stanley Institutional Fund, Inc.
Annual Report — December 31, 2019
Investment Overview (unaudited) (cont'd)
Active International Allocation Portfolio
• Calling a shift in market regimes is always difficult, but there are signs that investors will be less likely to continue piling on the big trends of the 2010s. Encouragingly, in recent months, non-U.S. markets have performed in line with the U.S. equity market, while the U.S. dollar has generally been weaker. While getting the timing right is hard, we believe our country allocation framework, coupled with our rigorous sector, industry and company selection process, is well suited to thrive in a regime that should reward a wider set of winners.
* Minimum Investment for Class I shares
In accordance with SEC regulations, the Fund's performance shown assumes that all recurring fees (including management fees) were deducted and all dividends and distributions were reinvested. The performance of Class A, L, C, IS and IR shares will vary from the performance of Class I shares based upon their different inception dates and will be negatively impacted by additional fees assessed to those classes (if applicable).
6
Morgan Stanley Institutional Fund, Inc.
Annual Report — December 31, 2019
Investment Overview (unaudited) (cont'd)
Active International Allocation Portfolio
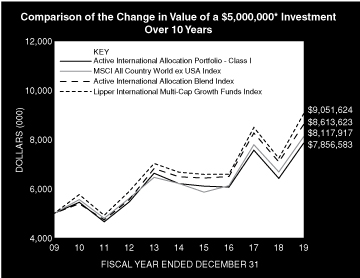
Performance Compared to the MSCI All Country World ex USA Index(1), the Active International Allocation Blend Index(2) and the Lipper International Multi-Cap Growth Funds Index(3)
| | | Period Ended December 31, 2019
Total Returns(4) | |
| | | | | Average Annual | |
| | | One
Year | | Five
Years | | Ten
Years | | Since
Inception(10) | |
Fund — Class I Shares
w/o sales charges(5) | | | 22.41 | % | | | 4.83 | % | | | 4.62 | % | | | 5.76 | % | |
Fund — Class A Shares
w/o sales charges(6) | | | 22.00 | | | | 4.48 | | | | 4.30 | | | | 5.03 | | |
Fund — Class A Shares with
maximum 5.25% sales charges(6) | | | 15.63 | | | | 3.36 | | | | 3.74 | | | | 4.80 | | |
Fund — Class L Shares
w/o sales charges(7) | | | 21.43 | | | | 3.94 | | | | — | | | | 6.51 | | |
Fund — Class C Shares
w/o sales charges(8) | | | 21.03 | | | | — | | | | — | | | | 1.96 | | |
Fund — Class C Shares with
maximum 1.00% deferred
sales charges(8) | | | 20.03 | | | | — | | | | — | | | | 1.96 | | |
Fund — Class IR Shares
w/o sales charges(9) | | | — | | | | — | | | | — | | | | 7.15 | | |
Fund — Class IS Shares
w/o sales charges(9) | | | — | | | | — | | | | — | | | | 7.15 | | |
MSCI All Country World ex
USA Index | | | 21.51 | | | | 5.51 | | | | 4.97 | | | | 5.84 | | |
Active International Allocation
Blend Index | | | 21.51 | | | | 5.85 | | | | 5.59 | | | | 5.66 | | |
Lipper International
Multi-Cap Growth Funds Index | | | 25.06 | | | | 6.30 | | | | 6.11 | | | | N/A | | |
Performance data quoted represents past performance, which is no guarantee of future results, and current performance may be lower or higher than the figures shown. Performance assumes that all dividends and distributions, if any, were reinvested. For the most recent month-end performance figures, please visit www.morganstanley.com/im/shareholderreports. Investment return and principal value will fluctuate so that Fund shares, when redeemed, may be worth more or less than their original cost. Returns for periods less than one year are not annualized. Total returns do not reflect the deduction of taxes that a shareholder would pay on Fund distributions or the redemption of Fund shares. Performance of share classes will vary due to difference in sales charges and expenses.
(1) The MSCI All Country World ex USA Index is a free float-adjusted market capitalization weighted index designed to measure the equity market performance of developed and emerging markets, excluding the United States. The term "free float" represents the portion of shares outstanding that are deemed to be available for purchase in the public equity markets by investors. The performance of the Index is listed in U.S. dollars and assumes reinvestment of net dividends. Returns, including periods prior to January 1, 2001, are calculated using the return data of the MSCI All Country World ex USA Index (gross dividends) through December 31, 2000 and the return data of the MSCI All Country World ex USA Index (net dividends) after December 31, 2000. Net total return indices reinvest dividends after the deduction of withholding taxes,
using (for international indices) a tax rate applicable to non-resident institutional investors who do not benefit from double taxation treaties. The Index is unmanaged and its returns do not include any sales charges or fees. Such costs would lower performance. It is not possible to invest directly in an index.
(2) The Active International Allocation Blend Index is performance linked benchmark of the old and new benchmark of the Fund, the old benchmark represented by MSCI EAFE Index (a benchmark that measures the international equity market performance of developed markets excluding the United States and Canada) from the Fund's inception to December 31, 2016 and the new benchmark represented by the MSCI All Country World ex USA Index for periods thereafter. The Index is unmanaged and its returns do not include any sales charges or fees. Such costs would lower performance. It is not possible to invest directly in an index.
(3) The Lipper International Multi-Cap Growth Funds Index is an equally weighted performance index of the largest qualifying funds (based on net assets) in the Lipper International Multi-Cap Growth Funds classification. The Index, which is adjusted for capital gains distributions and income dividends, is unmanaged and should not be considered an investment. There are currently 30 funds represented in this Index. As of the date of this report, the Fund was in the Lipper International Multi-Cap Growth Funds classification.
(4) Total returns for the Fund reflect fees waived and expenses reimbursed, if applicable, by the Adviser (as defined herein). Without such waivers and reimbursements, total returns would have been lower.
(5) Commenced operations on January 17, 1992.
(6) Commenced offering on January 2, 1996.
(7) Commenced offering on June 14, 2012.
(8) Commenced offering on April 30, 2015.
(9) Commenced offering on October 31, 2019.
(10) For comparative purposes, average annual since inception returns listed for the Indexes refer to the inception date of Class I of the Fund, not the inception of the Index.
7
Morgan Stanley Institutional Fund, Inc.
Annual Report — December 31, 2019
Portfolio of Investments
Active International Allocation Portfolio
| | | Shares | | Value
(000) | |
Common Stocks (98.9%) | |
Argentina (1.6%) | |
Banco BBVA Argentina SA ADR | | | 63,200 | | | $ | 352 | | |
Banco Macro SA ADR | | | 30,248 | | | | 1,096 | | |
Despegar.com Corp. (a)(b) | | | 28,000 | | | | 377 | | |
Grupo Financiero Galicia SA ADR | | | 47,500 | | | | 771 | | |
Pampa Energia SA ADR (a)(b) | | | 28,885 | | | | 475 | | |
| | | | 3,071 | | |
Belgium (1.5%) | |
Anheuser-Busch InBev SA N.V. | | | 35,512 | | | | 2,896 | | |
Brazil (2.1%) | |
Ambev SA ADR | | | 183,888 | | | | 857 | | |
Banco Bradesco SA (Preference) | | | 46,728 | | | | 422 | | |
Banco Santander Brasil SA (Units) (c) | | | 22,600 | | | | 279 | | |
Itau Unibanco Holding SA (Preference) | | | 42,388 | | | | 393 | | |
Petroleo Brasileiro SA (Preference) | | | 230,481 | | | | 1,741 | | |
Raia Drogasil SA | | | 7,400 | | | | 206 | | |
| | | | 3,898 | | |
Canada (2.4%) | |
Agnico Eagle Mines Ltd. | | | 21,600 | | | | 1,330 | | |
First Quantum Minerals Ltd. | | | 216,494 | | | | 2,196 | | |
Gildan Activewear, Inc. | | | 34,390 | | | | 1,017 | | |
| | | | 4,543 | | |
China (5.3%) | |
Alibaba Group Holding Ltd. ADR (a) | | | 12,000 | | | | 2,545 | | |
Tencent Holdings Ltd. (d) | | | 114,200 | | | | 5,505 | | |
Tencent Holdings Ltd. ADR (b) | | | 43,200 | | | | 2,074 | | |
| | | | 10,124 | | |
Colombia (0.6%) | |
Banco Davivienda SA (Preference) | | | 45,317 | | | | 635 | | |
Bancolombia SA ADR | | | 10,700 | | | | 587 | | |
| | | | 1,222 | | |
Denmark (2.2%) | |
Maersk Drilling A/S (a) | | | 14,139 | | | | 933 | | |
Novo Nordisk A/S Series B | | | 51,579 | | | | 2,989 | | |
Novozymes A/S Series B | | | 6,145 | | | | 301 | | |
| | | | 4,223 | | |
Egypt (1.1%) | |
Commercial International Bank Egypt SAE | | | 383,522 | | | | 1,983 | | |
Finland (0.2%) | |
Nokia Oyj | | | 110,241 | | | | 408 | | |
France (8.4%) | |
Air Liquide SA | | | 5,440 | | | | 770 | | |
Airbus SE | | | 5,515 | | | | 807 | | |
Bureau Veritas SA | | | 14,281 | | | | 373 | | |
Capgemini SE | | | 4,960 | | | | 606 | | |
Danone SA | | | 13,919 | | | | 1,154 | | |
Dassault Systemes SE | | | 5,767 | | | | 948 | | |
EssilorLuxottica SA | | | 4,581 | | | | 698 | | |
| | | Shares | | Value
(000) | |
Hermes International | | | 463 | | | $ | 346 | | |
Kering SA | | | 2,026 | | | | 1,330 | | |
L'Oreal SA (BSRM) | | | 1,420 | | | | 420 | | |
L'Oreal SA (PAR) | | | 2,311 | | | | 684 | | |
Legrand SA | | | 6,555 | | | | 534 | | |
LVMH Moet Hennessy Louis Vuitton SE | | | 1,997 | | | | 928 | | |
Pernod Ricard SA | | | 4,095 | | | | 732 | | |
Safran SA | | | 3,213 | | | | 496 | | |
Sanofi | | | 20,368 | | | | 2,048 | | |
TOTAL SA | | | 28,333 | | | | 1,564 | | |
Vivendi SA | | | 48,795 | | | | 1,413 | | |
| | | | 15,851 | | |
Germany (11.5%) | |
Adidas AG | | | 5,217 | | | | 1,698 | | |
Allianz SE (Registered) | | | 8,904 | | | | 2,182 | | |
BASF SE | | | 13,754 | | | | 1,036 | | |
Bayer AG (Registered) | | | 59,423 | | | | 4,831 | | |
Bayerische Motoren Werke AG | | | 4,266 | | | | 349 | | |
Commerzbank AG | | | 75,123 | | | | 464 | | |
Continental AG | | | 2,122 | | | | 274 | | |
Daimler AG (Registered) | | | 18,270 | | | | 1,010 | | |
Duerr AG | | | 12,569 | | | | 429 | | |
Henkel AG & Co., KGaA (Preference) | | | 6,784 | | | | 701 | | |
Infineon Technologies AG | | | 47,928 | | | | 1,083 | | |
Jungheinrich AG (Preference) | | | 31,250 | | | | 750 | | |
Linde PLC (a) | | | 3,570 | | | | 766 | | |
Muenchener Rueckversicherungs-Gesellschaft
AG in Muenchen (Registered) | | | 3,877 | | | | 1,144 | | |
Porsche Automobil Holding SE (Preference) | | | 3,698 | | | | 274 | | |
QIAGEN N.V. (a) | | | 25,820 | | | | 873 | | |
QIAGEN N.V. (a) (XETR) | | | 24,063 | | | | 820 | | |
SAP SE | | | 23,453 | | | | 3,157 | | |
| | | | 21,841 | | |
Hong Kong (0.9%) | |
AIA Group Ltd. | | | 122,800 | | | | 1,289 | | |
Hong Kong Exchanges & Clearing Ltd. | | | 13,716 | | | | 445 | | |
| | | | 1,734 | | |
India (4.3%) | |
Apollo Hospitals Enterprise Ltd. | | | 45,661 | | | | 923 | | |
Ashok Leyland Ltd. | | | 758,490 | | | | 866 | | |
Eicher Motors Ltd. | | | 2,421 | | | | 764 | | |
HDFC Bank Ltd. ADR | | | 16,796 | | | | 1,064 | | |
ICICI Bank Ltd. | | | 129,188 | | | | 975 | | |
ICICI Prudential Life Insurance Co., Ltd. | | | 144,760 | | | | 979 | | |
L&T Finance Holdings Ltd. | | | 227,174 | | | | 377 | | |
Larsen & Toubro Ltd. | | | 55,746 | | | | 1,014 | | |
Maruti Suzuki India Ltd. | | | 12,004 | | | | 1,239 | | |
| | | | 8,201 | | |
The accompanying notes are an integral part of the financial statements.
8
Morgan Stanley Institutional Fund, Inc.
Annual Report — December 31, 2019
Portfolio of Investments (cont'd)
Active International Allocation Portfolio
| | | Shares | | Value
(000) | |
Indonesia (2.0%) | |
Astra International Tbk PT | | | 1,008,100 | | | $ | 502 | | |
Bank Central Asia Tbk PT | | | 1,399,780 | | | | 3,367 | | |
| | | | 3,869 | | |
Ireland (2.0%) | |
Kerry Group PLC, Class A | | | 4,867 | | | | 607 | | |
Ryanair Holdings PLC ADR (a) | | | 36,126 | | | | 3,165 | | |
| | | | 3,772 | | |
Japan (11.2%) | |
Asahi Group Holdings Ltd. (b) | | | 7,200 | | | | 328 | | |
Dai-ichi Life Holdings, Inc. | | | 24,400 | | | | 402 | | |
Daiichi Sankyo Co., Ltd. | | | 7,500 | | | | 495 | | |
Daikin Industries Ltd. | | | 4,200 | | | | 593 | | |
East Japan Railway Co. | | | 5,300 | | | | 478 | | |
FANUC Corp. | | | 5,150 | | | | 951 | | |
Honda Motor Co., Ltd. | | | 15,113 | | | | 428 | | |
Hoya Corp. | | | 7,800 | | | | 745 | | |
Kao Corp. | | | 8,400 | | | | 693 | | |
Keyence Corp. | | | 5,600 | | | | 1,966 | | |
Mitsubishi Corp. | | | 24,300 | | | | 644 | | |
Mitsubishi UFJ Financial Group, Inc. (See Note G) | | | 46,206 | | | | 250 | | |
Murata Manufacturing Co., Ltd. | | | 8,700 | | | | 535 | | |
Nexon Co., Ltd. (a) | | | 120,400 | | | | 1,597 | | |
Nidec Corp. | | | 4,800 | | | | 656 | | |
Nintendo Co., Ltd. | | | 1,808 | | | | 723 | | |
Omron Corp. | | | 4,404 | | | | 257 | | |
Shimano, Inc. | | | 4,350 | | | | 706 | | |
Shiseido Co., Ltd. (b) | | | 10,300 | | | | 731 | | |
SMC Corp. | | | 2,105 | | | | 963 | | |
Sony Corp. | | | 41,493 | | | | 2,817 | | |
Sony Corp. ADR | | | 27,612 | | | | 1,878 | | |
Tokio Marine Holdings, Inc. | | | 11,620 | | | | 651 | | |
Toyota Motor Corp. | | | 18,155 | | | | 1,279 | | |
Unicharm Corp. | | | 13,300 | | | | 449 | | |
| | | | 21,215 | | |
Korea, Republic of (3.2%) | |
Samsung Electronics Co., Ltd. | | | 104,272 | | | | 5,025 | | |
SK Hynix, Inc. (a) | | | 12,076 | | | | 982 | | |
| | | | 6,007 | | |
Malta (0.0%) | |
BGP Holdings PLC (a)(e) | | | 72,261 | | | | — | @ | |
Netherlands (5.3%) | |
Akzo Nobel N.V. | | | 4,230 | | | | 430 | | |
ASML Holding N.V. | | | 7,180 | | | | 2,124 | | |
Koninklijke Philips N.V. | | | 75,492 | | | | 3,685 | | |
OCI N.V. (a) | | | 12,960 | | | | 273 | | |
Unilever N.V. | | | 38,935 | | | | 2,237 | | |
Wolters Kluwer N.V. | | | 19,131 | | | | 1,395 | | |
| | | | 10,144 | | |
| | | Shares | | Value
(000) | |
Norway (0.7%) | |
DNB ASA | | | 48,078 | | | $ | 900 | | |
Subsea 7 SA | | | 36,850 | | | | 441 | | |
| | | | 1,341 | | |
Peru (1.4%) | |
Cia de Minas Buenaventura SAA ADR | | | 42,331 | | | | 639 | | |
Credicorp Ltd. | | | 9,700 | | | | 2,068 | | |
| | | | 2,707 | | |
Poland (0.5%) | |
Dino Polska SA (a) | | | 24,148 | | | | 916 | | |
Portugal (0.1%) | |
Galp Energia SGPS SA | | | 12,270 | | | | 205 | | |
Singapore (2.3%) | |
Sea Ltd. ADR (a)(b) | | | 108,014 | | | | 4,344 | | |
Spain (2.2%) | |
Aena SME SA | | | 4,497 | | | | 860 | | |
Amadeus IT Group SA | | | 19,720 | | | | 1,610 | | |
Endesa SA | | | 29,309 | | | | 782 | | |
Industria de Diseno Textil SA | | | 26,756 | | | | 944 | | |
| | | | 4,196 | | |
Sweden (1.6%) | |
Atlas Copco AB, Class A | | | 12,660 | | | | 505 | | |
Epiroc AB, Class A | | | 35,510 | | | | 434 | | |
Hexagon AB, Class B | | | 9,186 | | | | 515 | | |
Telefonaktiebolaget LM Ericsson, Class B | | | 181,320 | | | | 1,585 | | |
| | | | 3,039 | | |
Switzerland (4.7%) | |
Givaudan SA (Registered) | | | 246 | | | | 771 | | |
Nestle SA (Registered) | | | 52,421 | | | | 5,675 | | |
Roche Holding AG (Genusschein) | | | 3,611 | | | | 1,174 | | |
Swiss Life Holding AG (Registered) | | | 995 | | | | 499 | | |
Zurich Insurance Group AG | | | 2,096 | | | | 860 | | |
| | | | 8,979 | | |
Taiwan (1.7%) | |
Airtac International Group | | | 32,000 | | | | 498 | | |
Taiwan Semiconductor Manufacturing Co., Ltd. | | | 246,000 | | | | 2,716 | | |
| | | | 3,214 | | |
Thailand (0.6%) | |
Muangthai Capital PCL (Foreign Shares) | | | 532,400 | | | | 1,132 | | |
United Kingdom (8.3%) | |
AstraZeneca PLC | | | 21,371 | | | | 2,153 | | |
BAE Systems PLC | | | 130,645 | | | | 977 | | |
Diageo PLC | | | 27,352 | | | | 1,160 | | |
Intertek Group PLC | | | 3,793 | | | | 294 | | |
Keywords Studios PLC | | | 80,635 | | | | 1,600 | | |
Lloyds Banking Group PLC | | | 483,664 | | | | 400 | | |
Reckitt Benckiser Group PLC | | | 16,042 | | | | 1,302 | | |
Royal Bank of Scotland Group PLC | | | 116,102 | | | | 370 | | |
Royal Dutch Shell PLC, Class A | | | 42,335 | | | | 1,253 | | |
Royal Dutch Shell PLC, Class B | | | 31,111 | | | | 923 | | |
The accompanying notes are an integral part of the financial statements.
9
Morgan Stanley Institutional Fund, Inc.
Annual Report — December 31, 2019
Portfolio of Investments (cont'd)
Active International Allocation Portfolio
| | | Shares | | Value
(000) | |
United Kingdom (cont'd) | |
Sage Group PLC (The) | | | 72,435 | | | $ | 719 | | |
Smith & Nephew PLC | | | 35,901 | | | | 872 | | |
Spectris PLC | | | 16,492 | | | | 635 | | |
Unilever PLC | | | 44,586 | | | | 2,569 | | |
Weir Group PLC (The) | | | 25,917 | | | | 518 | | |
| | | | 15,745 | | |
United States (9.0%) | |
Alphabet, Inc., Class A (a) | | | 900 | | | | 1,205 | | |
Booking Holdings, Inc. (a) | | | 944 | | | | 1,939 | | |
Bristol-Myers Squibb Co. | | | 12,100 | | | | 777 | | |
Charles River Laboratories International, Inc. (a) | | | 2,300 | | | | 351 | | |
Cognex Corp. | | | 7,900 | | | | 443 | | |
Estee Lauder Cos., Inc. (The), Class A | | | 2,250 | | | | 465 | | |
Halliburton Co. | | | 12,600 | | | | 308 | | |
ICON PLC (a) | | | 4,120 | | | | 710 | | |
Medtronic PLC | | | 10,859 | | | | 1,232 | | |
MercadoLibre, Inc. (a) | | | 700 | | | | 400 | | |
Micron Technology, Inc. (a) | | | 15,843 | | | | 852 | | |
Microsoft Corp. | | | 1,741 | | | | 275 | | |
Newmont Goldcorp Corp. | | | 32,659 | | | | 1,419 | | |
Newmont Goldcorp Corp. (TSX) (b) | | | 29,323 | | | | 1,274 | | |
Palo Alto Networks, Inc. (a) | | | 2,900 | | | | 671 | | |
Schlumberger Ltd. | | | 46,230 | | | | 1,858 | | |
Transocean Ltd. (a)(b) | | | 398,325 | | | | 2,740 | | |
Xilinx, Inc. | | | 1,930 | | | | 189 | | |
| | | | 17,108 | | |
Total Common Stocks (Cost $146,711) | | | 187,928 | | |
Investment Company (0.7%) | |
United States (0.7%) | |
Morgan Stanley China A Share Fund, Inc.
(See Note G) (Cost $1,324) | | | 56,878 | | | | 1,235 | | |
Short-Term Investments (4.1%) | |
Securities held as Collateral on Loaned Securities (3.7%) | |
Investment Company (3.3%) | |
Morgan Stanley Institutional Liquidity
Funds — Treasury Securities Portfolio —
Institutional Class (See Note G) | | | 6,229,660 | | | | 6,230 | | |
| | | Face
Amount
(000) | |
| |
Repurchase Agreements (0.4%) | |
HSBC Securities USA, Inc., (1.55%, dated
12/31/19, due 1/2/20; proceeds $215; fully
collateralized by a U.S. Government
obligation; 2.88% due 8/15/28;
valued at $219) | | $ | 215 | | | | 215 | | |
Merrill Lynch & Co., Inc., (1.55%, dated
12/31/19, due 1/2/20; proceeds $645; fully
collateralized by a U.S. Government obligation;
1.63% due 11/30/26; valued at $657) | | | 644 | | | | 644 | | |
| | | | 859 | | |
Total Securities held as Collateral on Loaned
Securities (Cost $7,089) | | | 7,089 | | |
| | | Shares | | Value
(000) | |
Investment Company (0.4%) | |
Morgan Stanley Institutional Liquidity
Funds — Treasury Securities Portfolio —
Institutional Class (See Note G)
(Cost $668) | | | 668,103 | | | $ | 668 | | |
Total Short-Term Investments (Cost $7,757) | | | 7,757 | | |
Total Investments (103.7%) (Cost $155,792)
Including $12,078 of Securities Loaned (f)(g)(h) | | | 196,920 | | |
Liabilities in Excess of Other Assets (–3.7%) | | | (7,010 | ) | |
Net Assets (100.0%) | | $ | 189,910 | | |
Country assignments and aggregations are based generally on third party vendor classifications and information, and may be different from the assignments and aggregations under the policies set forth in the Fund's prospectus and/or statement of additional information relating to geographic classifications.
@ Value is less than $500.
(a) Non-income producing security.
(b) All or a portion of this security was on loan at December 31, 2019.
(c) Consists of one or more classes of securities traded together as a unit; stocks with attached warrants.
(d) Security trades on the Hong Kong exchange.
(e) At December 31, 2019, the Fund held a fair valued security valued at less than $500, representing less than 0.05% of net assets. This security has been fair valued as determined in good faith under procedures established by and under the general supervision of the Company's (as defined herein) Directors.
(f) Securities are available for collateral in connection with open foreign currency forward exchange contracts and futures contract.
(g) The approximate fair value and percentage of net assets, $72,763,000 and 38.3%, respectively, represent the securities that have been fair valued under the fair valuation policy for international investments as described in Note A-1 within the Notes to the Financial Statements.
(h) At December 31, 2019, the aggregate cost for federal income tax purposes is approximately $156,757,000. The aggregate gross unrealized appreciation is approximately $47,152,000 and the aggregate gross unrealized depreciation is approximately $6,971,000, resulting in net unrealized appreciation of approximately $40,181,000.
ADR American Depositary Receipt.
BSRM Berlin Second Regulated Market.
PAR Paris Stock Exchange.
TSX Toronto Stock Exchange.
XETR Xetra.
The accompanying notes are an integral part of the financial statements.
10
Morgan Stanley Institutional Fund, Inc.
Annual Report — December 31, 2019
Portfolio of Investments (cont'd)
Active International Allocation Portfolio
Foreign Currency Forward Exchange Contracts:
The Fund had the following foreign currency forward exchange contracts open at December 31, 2019:
Counterparty | | Contracts to
Deliver
(000) | | In Exchange
For
(000) | | Delivery
Date | | Unrealized
Appreciation
(Depreciation)
(000) | |
Citibank NA | | EUR | 1,593 | | | $ | 1,788 | | | 3/19/20 | | $ | (8 | ) | |
State Street Bank and Trust Co. | | HKD | 35,433 | | | $ | 4,544 | | | 3/19/20 | | | (— | @) | |
State Street Bank and Trust Co. | | $ | 2,494 | | | GBP | 1,894 | | | 3/19/20 | | | 19 | | |
State Street Bank and Trust Co. | | $ | 1,953 | | | JPY | 212,626 | | | 3/19/20 | | | 12 | | |
| | | | | | | | | $ | 23 | | |
Futures Contract:
The Fund had the following futures contract open at December 31, 2019:
| | | Number
of
Contracts | | Expiration
Date | | Notional
Amount
(000) | | Value
(000) | | Unrealized
Depreciation
(000) | |
Long: | |
DAX Index (Germany) | | | 2 | | | Mar-20 | | EUR | — | @ | | $ | 743 | | | $ | (5 | ) | |
@ Value is less than $500.
EUR — Euro
GBP — British Pound
HKD — Hong Kong Dollar
JPY — Japanese Yen
Portfolio Composition*
Classification | | Percentage of
Total Investments | |
Other** | | | 83.8 | % | |
Banks | | | 8.6 | | |
Pharmaceuticals | | | 7.6 | | |
Total Investments | | | 100.0 | %*** | |
* Percentages indicated are based upon total investments (excluding Securities held as Collateral on Loaned Securities) as of December 31, 2019.
** Industries and/or investment types representing less than 5% of total investments.
*** Does not include open long futures contract with a value of approximately $743,000 and unrealized depreciation of approximately $5,000. Does not include open foreign currency forward exchange contracts with net unrealized appreciation of approximately $23,000.
The accompanying notes are an integral part of the financial statements.
11
Morgan Stanley Institutional Fund, Inc.
Annual Report — December 31, 2019
Active International Allocation Portfolio
Statement of Assets and Liabilities | | December 31, 2019
(000) | |
Assets: | |
Investments in Securities of Unaffiliated Issuers, at Value(1) (Cost $147,060) | | $ | 188,537 | | |
Investment in Securities of Affiliated Issuers, at Value (Cost $8,732) | | | 8,383 | | |
Total Investments in Securities, at Value (Cost $155,792) | | | 196,920 | | |
Cash from Securities Lending | | | 114 | | |
Tax Reclaim Receivable | | | 551 | | |
Dividends Receivable | | | 143 | | |
Receivable for Variation Margin on Futures Contracts | | | 90 | | |
Receivable for Investments Sold | | | 76 | | |
Unrealized Appreciation on Foreign Currency Forward Exchange Contracts | | | 31 | | |
Receivable for Fund Shares Sold | | | 21 | | |
Receivable from Affiliate | | | 1 | | |
Receivable from Securities Lending Income | | | 1 | | |
Other Assets | | | 79 | | |
Total Assets | | | 198,027 | | |
Liabilities: | |
Collateral on Securities Loaned, at Value | | | 7,203 | | |
Payable for Fund Shares Redeemed | | | 443 | | |
Payable for Advisory Fees | | | 248 | | |
Deferred Capital Gain Country Tax | | | 76 | | |
Payable for Professional Fees | | | 32 | | |
Payable for Sub Transfer Agency Fees | | | — | @ | |
Payable for Sub Transfer Agency Fees — Class I | | | 14 | | |
Payable for Sub Transfer Agency Fees — Class A | | | 5 | | |
Payable for Sub Transfer Agency Fees — Class L | | | 1 | | |
Payable for Sub Transfer Agency Fees — Class C | | | — | @ | |
Payable for Shareholder Services Fees — Class A | | | 12 | | |
Payable for Distribution and Shareholder Services Fees — Class L | | | 3 | | |
Payable for Distribution and Shareholder Services Fees — Class C | | | — | @ | |
Payable for Custodian Fees | | | 15 | | |
Payable for Administration Fees | | | 13 | | |
Unrealized Depreciation on Foreign Currency Forward Exchange Contracts | | | 8 | | |
Payable for Transfer Agency Fees — Class I | | | 1 | | |
Payable for Transfer Agency Fees — Class A | | | 2 | | |
Payable for Transfer Agency Fees — Class L | | | 1 | | |
Payable for Transfer Agency Fees — Class C | | | — | @ | |
Bank Overdraft | | | 4 | | |
Other Liabilities | | | 36 | | |
Total Liabilities | | | 8,117 | | |
Net Assets | | $ | 189,910 | | |
Net Assets Consist of: | |
Paid-in-Capital | | $ | 154,762 | | |
Total Distributable Earnings | | | 35,148 | | |
Net Assets | | $ | 189,910 | | |
The accompanying notes are an integral part of the financial statements.
12
Morgan Stanley Institutional Fund, Inc.
Annual Report — December 31, 2019
Active International Allocation Portfolio
Statement of Assets and Liabilities (cont'd) | | December 31, 2019
(000) | |
CLASS I: | |
Net Assets | | $ | 126,860 | | |
| Shares Outstanding $0.001 par value shares of beneficial interest (unlimited shares authorized) (not in 000's) | | | 8,696,381 | | |
Net Asset Value, Offering and Redemption Price Per Share | | $ | 14.59 | | |
CLASS A: | |
Net Assets | | $ | 58,339 | | |
| Shares Outstanding $0.001 par value shares of beneficial interest (unlimited shares authorized) (not in 000's) | | | 3,905,765 | | |
Net Asset Value, Redemption Price Per Share | | $ | 14.94 | | |
Maximum Sales Load | | | 5.25 | % | |
Maximum Sales Charge | | $ | 0.83 | | |
Maximum Offering Price Per Share | | $ | 15.77 | | |
CLASS L: | |
Net Assets | | $ | 4,644 | | |
| Shares Outstanding $0.001 par value shares of beneficial interest (unlimited shares authorized) (not in 000's) | | | 311,795 | | |
Net Asset Value, Offering and Redemption Price Per Share | | $ | 14.90 | | |
CLASS C: | |
Net Assets | | $ | 45 | | |
| Shares Outstanding $0.001 par value shares of beneficial interest (unlimited shares authorized) (not in 000's) | | | 3,030 | | |
Net Asset Value, Offering and Redemption Price Per Share | | $ | 14.89 | | |
CLASS IS: | |
Net Assets | | $ | 11 | | |
| Shares Outstanding $0.001 par value shares of beneficial interest (unlimited shares authorized) (not in 000's) | | | 734 | | |
Net Asset Value, Offering and Redemption Price Per Share | | $ | 14.59 | | |
CLASS IR: | |
Net Assets | | $ | 11 | | |
| Shares Outstanding $0.001 par value shares of beneficial interest (unlimited shares authorized) (not in 000's) | | | 734 | | |
Net Asset Value, Offering and Redemption Price Per Share | | $ | 14.59 | | |
(1) Including:
Securities on Loan, at Value: | | $ | 12,078 | | |
@ Amount is less than $500.
The accompanying notes are an integral part of the financial statements.
13
Morgan Stanley Institutional Fund, Inc.
Annual Report — December 31, 2019
Active International Allocation Portfolio
Statement of Operations | | Year Ended
December 31, 2019
(000) | |
Investment Income: | |
Dividends from Securities of Unaffiliated Issuers (Net of $420 of Foreign Taxes Withheld) | | $ | 3,635 | | |
Dividends from Securities of Affiliated Issuers (Note G) | | | 193 | | |
Income from Securities Loaned — Net | | | 24 | | |
Total Investment Income | | | 3,852 | | |
Expenses: | |
Advisory Fees (Note B) | | | 1,200 | | |
Shareholder Services Fees — Class A (Note D) | | | 134 | | |
Distribution and Shareholder Services Fees — Class L (Note D) | | | 34 | | |
Distribution and Shareholder Services Fees — Class C (Note D) | | | — | @ | |
Administration Fees (Note C) | | | 148 | | |
Professional Fees | | | 121 | | |
Sub Transfer Agency Fees — Class I | | | 69 | | |
Sub Transfer Agency Fees — Class A | | | 39 | | |
Sub Transfer Agency Fees — Class L | | | 3 | | |
Sub Transfer Agency Fees — Class C | | | — | @ | |
Custodian Fees (Note F) | | | 59 | | |
Registration Fees | | | 57 | | |
Shareholder Reporting Fees | | | 52 | | |
Transfer Agency Fees — Class I (Note E) | | | 5 | | |
Transfer Agency Fees — Class A (Note E) | | | 9 | | |
Transfer Agency Fees — Class L (Note E) | | | 3 | | |
Transfer Agency Fees — Class C (Note E) | | | 2 | | |
Transfer Agency Fees — Class IS (Note E) | | | — | @ | |
Transfer Agency Fees — Class IR (Note E) | | | — | @ | |
Pricing Fees | | | 15 | | |
Directors' Fees and Expenses | | | 11 | | |
Other Expenses | | | 25 | | |
Total Expenses | | | 1,986 | | |
Reimbursement of Class Specific Expenses — Class I (Note B) | | | (64 | ) | |
Reimbursement of Class Specific Expenses — Class L (Note B) | | | (2 | ) | |
Reimbursement of Class Specific Expenses — Class C (Note B) | | | (2 | ) | |
Reimbursement of Class Specific Expenses — Class IS (Note B) | | | (— | @) | |
Reimbursement of Class Specific Expenses — Class IR (Note B) | | | (— | @) | |
Waiver of Advisory Fees (Note B) | | | (42 | ) | |
Rebate from Morgan Stanley Affiliates (Note G) | | | (26 | ) | |
Net Expenses | | | 1,850 | | |
Net Investment Income | | | 2,002 | | |
Realized Gain: | |
Investments Sold (Net of $20 of Capital Gain Country Tax) | | | 6,406 | | |
Foreign Currency Forward Exchange Contracts | | | 349 | | |
Foreign Currency Translation | | | (49 | ) | |
Futures Contracts | | | 223 | | |
Options Written | | | 5 | | |
Net Realized Gain | | | 6,934 | | |
Change in Unrealized Appreciation (Depreciation): | |
Investments (Net of Increase in Deferred Capital Gain Country Tax of $46) | | | 28,085 | | |
Investments in Affiliates | | | (67 | ) | |
Foreign Currency Forward Exchange Contracts | | | (128 | ) | |
Foreign Currency Translation | | | (1 | ) | |
Futures Contracts | | | (37 | ) | |
Net Change in Unrealized Appreciation (Depreciation) | | | 27,852 | | |
Net Realized Gain and Change in Unrealized Appreciation (Depreciation) | | | 34,786 | | |
Net Increase in Net Assets Resulting from Operations | | $ | 36,788 | | |
@ Amount is less than $500.
The accompanying notes are an integral part of the financial statements.
14
Morgan Stanley Institutional Fund, Inc.
Annual Report — December 31, 2019
Active International Allocation Portfolio
Statements of Changes in Net Assets | | Year Ended
December 31, 2019
(000) | | Year Ended
December 31, 2018
(000) | |
Increase (Decrease) in Net Assets: | |
Operations: | |
Net Investment Income | | $ | 2,002 | | | $ | 3,250 | | |
Net Realized Gain | | | 6,934 | | | | 4,127 | | |
Net Change in Unrealized Appreciation (Depreciation) | | | 27,852 | | | | (39,587 | ) | |
Net Increase (Decrease) in Net Assets Resulting from Operations | | | 36,788 | | | | (32,210 | ) | |
Dividends and Distributions to Shareholders: | |
Class I | | | (1,578 | ) | | | (2,041 | ) | |
Class A | | | (537 | ) | | | (655 | ) | |
Class L | | | (19 | ) | | | (29 | ) | |
Class C | | | (— | @) | | | (— | @) | |
Class IS | | | (— | @) | | | — | | |
Class IR | | | (— | @) | | | — | | |
Total Dividends and Distributions to Shareholders | | | (2,134 | ) | | | (2,725 | ) | |
Capital Share Transactions:(1) | |
Class I: | |
Subscribed | | | 8,659 | | | | 10,181 | | |
Distributions Reinvested | | | 1,571 | | | | 2,032 | | |
Redeemed | | | (26,981 | ) | | | (23,890 | ) | |
Class A: | |
Subscribed | | | 9,097 | | | | 9,153 | | |
Distributions Reinvested | | | 531 | | | | 646 | | |
Redeemed | | | (12,119 | ) | | | (14,703 | ) | |
Class L: | |
Exchanged | | | 29 | | | | 50 | | |
Distributions Reinvested | | | 18 | | | | 28 | | |
Redeemed | | | (632 | ) | | | (1,267 | ) | |
Class C: | |
Subscribed | | | 7 | | | | 27 | | |
Distributions Reinvested | | | — | @ | | | — | @ | |
Redeemed | | | (12 | ) | | | (— | @) | |
Class IS: | |
Subscribed | | | 10 | (a) | | | — | | |
Distributions Reinvested | | | — | @(a) | | | — | | |
Class IR: | |
Subscribed | | | 10 | (a) | | | — | | |
Distributions Reinvested | | | — | @(a) | | | — | | |
Net Decrease in Net Assets Resulting from Capital Share Transactions | | | (19,812 | ) | | | (17,743 | ) | |
Redemption Fees | | | — | @ | | | — | @ | |
Total Increase (Decrease) in Net Assets | | | 14,842 | | | | (52,678 | ) | |
Net Assets: | |
Beginning of Period | | | 175,068 | | | | 227,746 | | |
End of Period | | $ | 189,910 | | | $ | 175,068 | | |
The accompanying notes are an integral part of the financial statements.
15
Morgan Stanley Institutional Fund, Inc.
Annual Report — December 31, 2019
Active International Allocation Portfolio
Statements of Changes in Net Assets (cont'd) | | Year Ended
December 31, 2019
(000) | | Year Ended
December 31, 2018
(000) | |
(1) Capital Share Transactions: | |
Class I: | |
Shares Subscribed | | | 654 | | | | 736 | | |
Shares Issued on Distributions Reinvested | | | 109 | | | | 164 | | |
Shares Redeemed | | | (2,005 | ) | | | (1,720 | ) | |
Net Decrease in Class I Shares Outstanding | | | (1,242 | ) | | | (820 | ) | |
Class A: | |
Shares Subscribed | | | 654 | | | | 668 | | |
Shares Issued on Distributions Reinvested | | | 36 | | | | 51 | | |
Shares Redeemed | | | (890 | ) | | | (1,056 | ) | |
Net Decrease in Class A Shares Outstanding | | | (200 | ) | | | (337 | ) | |
Class L: | |
Shares Exchanged | | | 3 | | | | 4 | | |
Shares Issued on Distributions Reinvested | | | 1 | | | | 2 | | |
Shares Redeemed | | | (47 | ) | | | (90 | ) | |
Net Decrease in Class L Shares Outstanding | | | (43 | ) | | | (84 | ) | |
Class C: | |
Shares Subscribed | | | 1 | | | | 2 | | |
Shares Issued on Distributions Reinvested | | | — | @@ | | | — | @@ | |
Shares Redeemed | | | (1 | ) | | | (— | @@) | |
Net Increase (Decrease) in Class C Shares Outstanding | | | (— | @@) | | | 2 | | |
Class IS: | |
Shares Subscribed | | | 1 | | | | — | | |
Shares Issued on Distributions Reinvested | | | — | @@ | | | — | | |
Net Increase in Class IS Shares Outstanding | | | 1 | (a) | | | — | | |
Class IR: | |
Shares Subscribed | | | 1 | | | | — | | |
Shares Issued on Distributions Reinvested | | | — | @@ | | | — | | |
Net Increase in Class IR Shares Outstanding | | | 1 | (a) | | | — | | |
(a) For the period October 31, 2019 through December 31, 2019.
@ Amount is less than $500.
@@ Amount is less than 500 shares.
The accompanying notes are an integral part of the financial statements.
16
Morgan Stanley Institutional Fund, Inc.
Annual Report — December 31, 2019
Financial Highlights
Active International Allocation Portfolio
| | | Class I | |
| | | Year Ended December 31, | |
Selected Per Share Data and Ratios | | 2019 | | 2018 | | 2017 | | 2016(1) | | 2015 | |
Net Asset Value, Beginning of Period | | $ | 12.07 | | | $ | 14.46 | | | $ | 11.83 | | | $ | 12.20 | | | $ | 12.52 | | |
Income (Loss) from Investment Operations: | |
Net Investment Income(2) | | | 0.16 | | | | 0.23 | | | | 0.19 | | | | 0.26 | | | | 0.22 | | |
Net Realized and Unrealized Gain (Loss) | | | 2.54 | | | | (2.41 | ) | | | 2.74 | | | | (0.34 | ) | | | (0.42 | ) | |
Total from Investment Operations | | | 2.70 | | | | (2.18 | ) | | | 2.93 | | | | (0.08 | ) | | | (0.20 | ) | |
Distributions from and/or in Excess of: | |
Net Investment Income | | | (0.18 | ) | | | (0.21 | ) | | | (0.30 | ) | | | (0.29 | ) | | | (0.12 | ) | |
Redemption Fees | | | 0.00 | (3) | | | 0.00 | (3) | | | 0.00 | (3) | | | 0.00 | (3) | | | 0.00 | (3) | |
Net Asset Value, End of Period | | $ | 14.59 | | | $ | 12.07 | | | $ | 14.46 | | | $ | 11.83 | | | $ | 12.20 | | |
Total Return(4) | | | 22.41 | % | | | (15.14 | )% | | | 24.76 | % | | | (0.67 | )% | | | (1.63 | )% | |
Ratios to Average Net Assets and Supplemental Data: | |
Net Assets, End of Period (Thousands) | | $ | 126,860 | | | $ | 119,925 | | | $ | 155,550 | | | $ | 169,589 | | | $ | 197,733 | | |
Ratio of Expenses Before Expense Limitation | | | 0.97 | % | | | 0.97 | % | | | 1.14 | % | | | 0.94 | % | | | 0.92 | % | |
Ratio of Expenses After Expense Limitation | | | 0.89 | %(5) | | | 0.88 | %(5) | | | 0.88 | %(5) | | | 0.76 | %(5) | | | 0.89 | %(5) | |
Ratio of Net Investment Income | | | 1.22 | %(5) | | | 1.67 | %(5) | | | 1.44 | %(5) | | | 2.18 | %(5) | | | 1.66 | %(5) | |
Ratio of Rebate from Morgan Stanley Affiliates | | | 0.01 | % | | | 0.02 | % | | | 0.02 | % | | | 0.01 | % | | | 0.01 | % | |
Portfolio Turnover Rate | | | 34 | % | | | 43 | % | | | 22 | % | | | 40 | % | | | 30 | % | |
(1) Reflects prior period custodian out-of-pocket expenses that were reimbursed in September 2016. The amount of the reimbursement was immaterial on a per share basis and did not impact the total return of Class I shares. The Ratio of Expenses After Expense Limitation would have been 0.13% higher and the Ratio of Net Investment Income would have been 0.13% lower had the custodian not reimbursed the Fund.
(2) Per share amount is based on average shares outstanding.
(3) Amount is less than $0.005 per share.
(4) Calculated based on the net asset value as of the last business day of the period.
(5) The Ratio of Expenses After Expense Limitation and Ratio of Net Investment Income reflect the rebate of certain Fund expenses in connection with the investments in Morgan Stanley affiliates during the period. The effect of the rebate on the ratios is disclosed in the above table as "Ratio of Rebate from Morgan Stanley Affiliates."
The accompanying notes are an integral part of the financial statements.
17
Morgan Stanley Institutional Fund, Inc.
Annual Report — December 31, 2019
Financial Highlights
Active International Allocation Portfolio
| | | Class A | |
| | | Year Ended December 31, | |
Selected Per Share Data and Ratios | | 2019 | | 2018 | | 2017 | | 2016(1) | | 2015 | |
Net Asset Value, Beginning of Period | | $ | 12.36 | | | $ | 14.79 | | | $ | 12.10 | | | $ | 12.47 | | | $ | 12.79 | | |
Income (Loss) from Investment Operations: | |
Net Investment Income(2) | | | 0.11 | | | | 0.19 | | | | 0.14 | | | | 0.21 | | | | 0.17 | | |
Net Realized and Unrealized Gain (Loss) | | | 2.61 | | | | (2.46 | ) | | | 2.80 | | | | (0.34 | ) | | | (0.42 | ) | |
Total from Investment Operations | | | 2.72 | | | | (2.27 | ) | | | 2.94 | | | | (0.13 | ) | | | (0.25 | ) | |
Distributions from and/or in Excess of: | |
Net Investment Income | | | (0.14 | ) | | | (0.16 | ) | | | (0.25 | ) | | | (0.24 | ) | | | (0.07 | ) | |
Redemption Fees | | | 0.00 | (3) | | | 0.00 | (3) | | | 0.00 | (3) | | | 0.00 | (3) | | | 0.00 | (3) | |
Net Asset Value, End of Period | | $ | 14.94 | | | $ | 12.36 | | | $ | 14.79 | | | $ | 12.10 | | | $ | 12.47 | | |
Total Return(4) | | | 22.00 | % | | | (15.38 | )% | | | 24.29 | % | | | (1.05 | )% | | | (1.95 | )% | |
Ratios to Average Net Assets and Supplemental Data: | |
Net Assets, End of Period (Thousands) | | $ | 58,339 | | | $ | 50,726 | | | $ | 65,710 | | | $ | 56,934 | | | $ | 64,482 | | |
Ratio of Expenses Before Expense Limitation | | | 1.25 | % | | | 1.26 | % | | | 1.48 | % | | | 1.32 | % | | | 1.28 | % | |
Ratio of Expenses After Expense Limitation | | | 1.22 | %(5) | | | 1.19 | %(5) | | | 1.23 | %(5) | | | 1.14 | %(5) | | | 1.24 | %(5) | |
Ratio of Net Investment Income | | | 0.82 | %(5) | | | 1.37 | %(5) | | | 1.02 | %(5) | | | 1.79 | %(5) | | | 1.31 | %(5) | |
Ratio of Rebate from Morgan Stanley Affiliates | | | 0.01 | % | | | 0.02 | % | | | 0.02 | % | | | 0.01 | % | | | 0.01 | % | |
Portfolio Turnover Rate | | | 34 | % | | | 43 | % | | | 22 | % | | | 40 | % | | | 30 | % | |
(1) Reflects prior period custodian out-of-pocket expenses that were reimbursed in September 2016. The amount of the reimbursement was immaterial on a per share basis and did not impact the total return of Class A shares. The Ratio of Expenses After Expense Limitation would have been 0.10% higher and the Ratio of Net Investment Income would have been 0.10% lower had the custodian not reimbursed the Fund.
(2) Per share amount is based on average shares outstanding.
(3) Amount is less than $0.005 per share.
(4) Calculated based on the net asset value which does not reflect sales charges, if applicable, as of the last business day of the period.
(5) The Ratio of Expenses After Expense Limitation and Ratio of Net Investment Income reflect the rebate of certain Fund expenses in connection with the investments in Morgan Stanley affiliates during the period. The effect of the rebate on the ratios is disclosed in the above table as "Ratio of Rebate from Morgan Stanley Affiliates."
The accompanying notes are an integral part of the financial statements.
18
Morgan Stanley Institutional Fund, Inc.
Annual Report — December 31, 2019
Financial Highlights
Active International Allocation Portfolio
| | | Class L | |
| | | Year Ended December 31, | |
Selected Per Share Data and Ratios | | 2019 | | 2018 | | 2017 | | 2016(1) | | 2015 | |
Net Asset Value, Beginning of Period | | $ | 12.32 | | | $ | 14.73 | | | $ | 12.04 | | | $ | 12.41 | | | $ | 12.74 | | |
Income (Loss) from Investment Operations: | |
Net Investment Income(2) | | | 0.05 | | | | 0.13 | | | | 0.07 | | | | 0.14 | | | | 0.11 | | |
Net Realized and Unrealized Gain (Loss) | | | 2.59 | | | | (2.46 | ) | | | 2.79 | | | | (0.35 | ) | | | (0.42 | ) | |
Total from Investment Operations | | | 2.64 | | | | (2.33 | ) | | | 2.86 | | | | (0.21 | ) | | | (0.31 | ) | |
Distributions from and/or in Excess of: | |
Net Investment Income | | | (0.06 | ) | | | (0.08 | ) | | | (0.17 | ) | | | (0.16 | ) | | | (0.02 | ) | |
Redemption Fees | | | 0.00 | (3) | | | 0.00 | (3) | | | 0.00 | (3) | | | 0.00 | (3) | | | 0.00 | (3) | |
Net Asset Value, End of Period | | $ | 14.90 | | | $ | 12.32 | | | $ | 14.73 | | | $ | 12.04 | | | $ | 12.41 | | |
Total Return(4) | | | 21.43 | % | | | (15.87 | )% | | | 23.80 | % | | | (1.68 | )% | | | (2.44 | )% | |
Ratios to Average Net Assets and Supplemental Data: | |
Net Assets, End of Period (Thousands) | | $ | 4,644 | | | $ | 4,375 | | | $ | 6,463 | | | $ | 6,053 | | | $ | 7,495 | | |
Ratio of Expenses Before Expense Limitation | | | 1.81 | % | | | 1.76 | % | | | 2.07 | % | | | 1.93 | % | | | 1.87 | % | |
Ratio of Expenses After Expense Limitation | | | 1.74 | %(5) | | | 1.69 | %(5) | | | 1.73 | %(5) | | | 1.74 | %(5) | | | 1.74 | %(5) | |
Ratio of Net Investment Income | | | 0.35 | %(5) | | | 0.92 | %(5) | | | 0.54 | %(5) | | | 1.20 | %(5) | | | 0.82 | %(5) | |
Ratio of Rebate from Morgan Stanley Affiliates | | | 0.01 | % | | | 0.02 | % | | | 0.02 | % | | | 0.01 | % | | | 0.01 | % | |
Portfolio Turnover Rate | | | 34 | % | | | 43 | % | | | 22 | % | | | 40 | % | | | 30 | % | |
(1) Reflects prior period custodian out-of-pocket expenses that were reimbursed in September 2016. The amount of the reimbursement was immaterial on a per share basis and did not impact the total return of Class L shares. The Ratio of Expenses After Expense Limitation and the Ratio of Net Investment Income would be unchanged as the reimbursement of custodian fees was offset against expense waivers/reimbursements with no impact to net expenses or net investment income.
(2) Per share amount is based on average shares outstanding.
(3) Amount is less than $0.005 per share.
(4) Calculated based on the net asset value as of the last business day of the period.
(5) The Ratio of Expenses After Expense Limitation and Ratio of Net Investment Income reflect the rebate of certain Fund expenses in connection with the investments in Morgan Stanley affiliates during the period. The effect of the rebate on the ratios is disclosed in the above table as "Ratio of Rebate from Morgan Stanley Affiliates."
The accompanying notes are an integral part of the financial statements.
19
Morgan Stanley Institutional Fund, Inc.
Annual Report — December 31, 2019
Financial Highlights
Active International Allocation Portfolio
| | | Class C | |
| | | Year Ended December 31, | | Period from
April 30, 2015(2) to | |
Selected Per Share Data and Ratios | | 2019 | | 2018 | | 2017 | | 2016(1) | | December 31, 2015 | |
Net Asset Value, Beginning of Period | | $ | 12.34 | | | $ | 14.77 | | | $ | 12.15 | | | $ | 12.38 | | | $ | 13.94 | | |
Income (Loss) from Investment Operations: | |
Net Investment Income (Loss)(3) | | | 0.00 | (4) | | | 0.09 | | | | (0.00 | )(4) | | | 0.14 | | | | (0.00 | )(4) | |
Net Realized and Unrealized Gain (Loss) | | | 2.59 | | | | (2.45 | ) | | | 2.83 | | | | (0.37 | ) | | | (1.53 | ) | |
Total from Investment Operations | | | 2.59 | | | | (2.36 | ) | | | 2.83 | | | | (0.23 | ) | | | (1.53 | ) | |
Distributions from and/or in Excess of: | |
Net Investment Income | | | (0.04 | ) | | | (0.07 | ) | | | (0.21 | ) | | | — | | | | (0.03 | ) | |
Redemption Fees | | | 0.00 | (4) | | | 0.00 | (4) | | | 0.00 | (4) | | | 0.00 | (4) | | | 0.00 | (4) | |
Net Asset Value, End of Period | | $ | 14.89 | | | $ | 12.34 | | | $ | 14.77 | | | $ | 12.15 | | | $ | 12.38 | | |
Total Return(5) | | | 21.03 | % | | | (16.04 | )% | | | 23.42 | % | | | (1.94 | )% | | | (10.96 | )%(7) | |
Ratios to Average Net Assets and Supplemental Data: | |
Net Assets, End of Period (Thousands) | | $ | 45 | | | $ | 42 | | | $ | 23 | | | $ | 9 | | | $ | 32 | | |
Ratio of Expenses Before Expense Limitation | | | 7.49 | % | | | 7.18 | % | | | 20.06 | % | | | 8.58 | % | | | 4.26 | %(8) | |
Ratio of Expenses After Expense Limitation | | | 1.99 | %(6) | | | 1.98 | %(6) | | | 1.97 | %(6) | | | 1.99 | %(6) | | | 1.99 | %(6)(8) | |
Ratio of Net Investment Income (Loss) | | | 0.03 | %(6) | | | 0.67 | %(6) | | | (0.03 | )%(6) | | | 1.19 | %(6) | | | (0.04 | )%(6)(8) | |
Ratio of Rebate from Morgan Stanley Affiliates | | | 0.01 | % | | | 0.02 | % | | | 0.03 | % | | | 0.01 | % | | | 0.01 | %(8) | |
Portfolio Turnover Rate | | | 34 | % | | | 43 | % | | | 22 | % | | | 40 | % | | | 30 | % | |
(1) Reflects prior period custodian out-of-pocket expenses that were reimbursed in September 2016. The amount of the reimbursement was immaterial on a per share basis and did not impact the total return of Class C shares. The Ratio of Expenses After Expense Limitation and the Ratio of Net Investment Income would be unchanged as the reimbursement of custodian fees was offset against expense waivers/reimbursements with no impact to net expenses or net investment income.
(2) Commencement of Offering.
(3) Per share amount is based on average shares outstanding.
(4) Amount is less than $0.005 per share.
(5) Calculated based on the net asset value which does not reflect sales charges, if applicable, as of the last business day of the period.
(6) The Ratio of Expenses After Expense Limitation and Ratio of Net Investment Income (Loss) reflect the rebate of certain Fund expenses in connection with the investments in Morgan Stanley affiliates during the period. The effect of the rebate on the ratios is disclosed in the above table as "Ratio of Rebate from Morgan Stanley Affiliates."
(7) Not annualized.
(8) Annualized.
The accompanying notes are an integral part of the financial statements.
20
Morgan Stanley Institutional Fund, Inc.
Annual Report — December 31, 2019
Financial Highlights
Active International Allocation Portfolio
| | | Class IS | |
Selected Per Share Data and Ratios | | Period from
October 31, 2019(1) to
December 31, 2019 | |
Net Asset Value, Beginning of Period | | $ | 13.79 | | |
Income from Investment Operations: | |
Net Investment Income(2) | | | 0.00 | (3) | |
Net Realized and Unrealized Gain | | | 0.98 | | |
Total from Investment Operations | | | 0.98 | | |
Distributions from and/or in Excess of: | |
Net Investment Income | | | (0.18 | ) | |
Net Asset Value, End of Period | | $ | 14.59 | | |
Total Return(4) | | | 7.15 | %(6) | |
Ratios to Average Net Assets and Supplemental Data: | |
Net Assets, End of Period (Thousands) | | $ | 11 | | |
Ratio of Expenses Before Expense Limitation | | | 14.33 | %(7) | |
Ratio of Expenses After Expense Limitation | | | 0.84 | %(5)(7) | |
Ratio of Net Investment Income | | | 0.18 | %(5)(7) | |
Ratio of Rebate from Morgan Stanley Affiliates | | | 0.01 | %(7) | |
Portfolio Turnover Rate | | | 34 | % | |
(1) Commencement of Offering.
(2) Per share amount is based on average shares outstanding.
(3) Amount is less than $0.005 per share.
(4) Calculated based on the net asset value as of the last business day of the period.
(5) The Ratio of Expenses After Expense Limitation and Ratio of Net Investment Income reflect the rebate of certain Fund expenses in connection with the investments in Morgan Stanley affiliates during the period. The effect of the rebate on the ratios is disclosed in the above table as "Ratio of Rebate from Morgan Stanley Affiliates."
(6) Not annualized.
(7) Annualized.
The accompanying notes are an integral part of the financial statements.
21
Morgan Stanley Institutional Fund, Inc.
Annual Report — December 31, 2019
Financial Highlights
Active International Allocation Portfolio
| | | Class IR | |
Selected Per Share Data and Ratios | | Period from
October 31, 2019(1) to
December 31, 2019 | |
Net Asset Value, Beginning of Period | | $ | 13.79 | | |
Income from Investment Operations: | |
Net Investment Income(2) | | | 0.00 | (3) | |
Net Realized and Unrealized Gain on Investments | | | 0.98 | | |
Total from Investment Operations | | | 0.98 | | |
Distributions from and/or in Excess of: | |
Net Investment Income | | | (0.18 | ) | |
Net Asset Value, End of Period | | $ | 14.59 | | |
Total Return(4) | | | 7.15 | %(6) | |
Ratios to Average Net Assets and Supplemental Data: | |
Net Assets, End of Period, (Thousands) | | $ | 11 | | |
Ratio of Expenses Before Expense Limitation | | | 14.33 | %(7) | |
Ratio of Expenses After Expense Limitation | | | 0.84 | %(5)(7) | |
Ratio of Net Investment Income | | | 0.18 | %(5)(7) | |
Ratio of Rebate from Morgan Stanley Affiliates | | | 0.01 | %(7) | |
Portfolio Turnover Rate | | | 34 | % | |
(1) Commencement of Offering.
(2) Per share amount is based on average shares outstanding.
(3) Amount is less than $0.005 per share.
(4) Calculated based on the net asset value as of the last business day of the period.
(5) The Ratio of Expenses After Expense Limitation and Ratio of Net Investment Income reflect the rebate of certain Fund expenses in connection with the investments in Morgan Stanley affiliates during the period. The effect of the rebate on the ratios is disclosed in the above table as "Ratio of Rebate from Morgan Stanley Affiliates."
(6) Not annualized.
(7) Annualized.
The accompanying notes are an integral part of the financial statements.
22
Morgan Stanley Institutional Fund, Inc.
Annual Report — December 31, 2019
Notes to Financial Statements
Morgan Stanley Institutional Fund, Inc. (the "Company") is registered under the Investment Company Act of 1940, as amended (the "Act"), as an open-end management investment company. The Company is comprised of thirty-two separate, active, diversified and non-diversified funds (individually referred to as a "Fund," collectively as the "Funds"). The Company applies investment company accounting and reporting guidance.
The accompanying financial statements relate to the Active International Allocation Portfolio. The Fund seeks long-term capital appreciation.
The Fund offers six classes of shares — Class I, Class A, Class L, Class C, Class IS and Class IR. On April 30, 2015, the Fund suspended offering of Class L shares. Existing Class L shareholders may invest through reinvestment of dividends and distributions. On October 31, 2019, the Fund commenced offering Class IS and Class IR shares.
A. Significant Accounting Policies: The following significant accounting policies are in conformity with U.S. generally accepted accounting principles ("GAAP"). Such policies are consistently followed by the Company in the preparation of its financial statements. GAAP may require management to make estimates and assumptions that affect the reported amounts and disclosures in the financial statements. Actual results may differ from those estimates.
In August 2018, the Financial Accounting Standards Board ("FASB") issued Accounting Standards Update ("ASU") 2018-13, Fair Value Measurement (Topic 820) — Disclosures Framework — Changes to Disclosure Requirements of Fair Value Measurement ("ASU 2018-13") which introduces new fair value disclosure requirements as well as eliminates and modifies certain existing fair value disclosure requirements. ASU 2018-13 would be effective for fiscal years beginning after December 15, 2019 and for interim periods within those fiscal years; however, management has elected to early adopt ASU 2018-13 as permitted by the standard. The impact of the Fund's adoption was limited to changes in the Fund's financial statement disclosures regarding fair value, primarily those disclosures related to transfers between levels of the fair value hierarchy and disclosure of the range and weighted average used to develop significant unobservable inputs for Level 3 fair value measurements, when applicable.
1. Security Valuation: (1) An equity portfolio security listed or traded on an exchange is valued at its latest reported sales price (or at the exchange official closing price if such exchange reports an official closing price), and if
there were no sales on a given day and if there is no official exchange closing price for that day, the security is valued at the mean between the last reported bid and asked prices if such bid and asked prices are available on the relevant exchanges. If only bid prices are available then the latest bid price may be used. Listed equity securities not traded on the valuation date with no reported bid and asked prices available on the exchange are valued at the mean between the current bid and asked prices obtained from one or more reputable brokers or dealers. In cases where a security is traded on more than one exchange, the security is valued on the exchange designated as the primary market; (2) all other equity portfolio securities for which over-the-counter ("OTC") market quotations are readily available are valued at the latest reported sales price (or at the market official closing price if such market reports an official closing price), and if there was no trading in the security on a given day and if there is no official closing price from relevant markets for that day, the security is valued at the mean between the last reported bid and asked prices if such bid and asked prices are available on the relevant markets. An unlisted equity security that does not trade on the valuation date and for which bid and asked prices from the relevant markets are unavailable is valued at the mean between the current bid and asked prices obtained from one or more reputable brokers or dealers; (3) certain portfolio securities may be valued by an outside pricing service/vendor approved by the Company's Board of Directors (the "Directors"). The pricing service/vendor may employ a pricing model that takes into account, among other things, bids, yield spreads and/or other market data and specific security characteristics. Alternatively, if a valuation is not available from an outside pricing service/vendor, and the security trades on an exchange, the security may be valued at its latest reported sale price (or at the exchange official closing price if such exchange reports an official closing price), prior to the time when assets are valued. If there are no sales on a given day and if there is no official exchange closing price for that day, the security is valued at the mean between the last reported bid and asked prices if such bid and asked prices are available in the relevant exchanges. If Morgan Stanley Investment Management Inc. (the "Adviser"), a wholly-owned subsidiary of Morgan Stanley, determines that the price provided by the outside pricing service/vendor or exchange does not reflect the security's fair value or is unable to provide a price, prices from brokers or dealers may also be
23
Morgan Stanley Institutional Fund, Inc.
Annual Report — December 31, 2019
Notes to Financial Statements (cont'd)
utilized. In these circumstances, the value of the security will be the mean of bid and asked prices obtained from brokers or dealers; (4) futures are valued at the settlement price on the exchange on which they trade or, if a settlement price is unavailable, at the last sale price on the exchange; (5) when market quotations are not readily available, including circumstances under which the Adviser determines that the closing price, last sale price or the mean between the last reported bid and asked prices are not reflective of a security's market value, portfolio securities are valued at their fair value as determined in good faith under procedures established by and under the general supervision of the Directors. Occasionally, developments affecting the closing prices of securities and other assets may occur between the times at which valuations of such securities are determined (that is, close of the foreign market on which the securities trade) and the close of business of the New York Stock Exchange ("NYSE"). If developments occur during such periods that are expected to materially affect the value of such securities, such valuations may be adjusted to reflect the estimated fair value of such securities as of the close of the NYSE, as determined in good faith by the Directors or by the Adviser using a pricing service and/or procedures approved by the Directors; (6) quotations of foreign portfolio securities, other assets and liabilities and forward contracts stated in foreign currency are translated into U.S. dollar equivalents at the prevailing market rates prior to the close of the NYSE; and (7) investments in mutual funds, including the Morgan Stanley Institutional Liquidity Funds, are valued at the net asset value ("NAV") as of the close of each business day.
The Directors have responsibility for determining in good faith the fair value of the investments, and the Directors may appoint others, such as the Company's Adviser or a valuation committee, to assist the Directors in determining fair value and to make the actual calculations pursuant to the fair valuation methodologies previously approved by the Directors. Under procedures approved by the Directors, the Company's Adviser has formed a Valuation Committee whose members are approved by the Directors. The Valuation Committee provides administration and oversight of the Company's valuation policies and procedures, which are reviewed at least annually by the Directors. These procedures allow the Company to utilize independent pricing services, quotations from securities and financial instrument dealers and other market sources to determine fair value.
2. Fair Value Measurement: FASB Accounting Standards CodificationTM ("ASC") 820, "Fair Value Measurement" ("ASC 820"), defines fair value as the value that the Fund would receive to sell an investment or pay to transfer a liability in a timely transaction with an independent buyer in the principal market, or in the absence of a principal market, the most advantageous market for the investment or liability. ASC 820 establishes a three-tier hierarchy to distinguish between (1) inputs that reflect the assumptions market participants would use in valuing an asset or liability developed based on market data obtained from sources independent of the reporting entity (observable inputs) and (2) inputs that reflect the reporting entity's own assumptions about the assumptions market participants would use in valuing an asset or liability developed based on the best information available in the circumstances (unobservable inputs) and to establish classification of fair value measurements for disclosure purposes. Various inputs are used in determining the value of the Fund's investments. The inputs are summarized in the three broad levels listed below:
• Level 1 – unadjusted quoted prices in active markets for identical investments
• Level 2 – other significant observable inputs (including quoted prices for similar investments, interest rates, prepayment speeds, credit risk, etc.)
• Level 3 – significant unobservable inputs including the Fund's own assumptions in determining the fair value of investments. Factors considered in making this determination may include, but are not limited to, information obtained by contacting the issuer, analysts, or the appropriate stock exchange (for exchange-traded securities), analysis of the issuer's financial statements or other available documents and, if necessary, available information concerning other securities in similar circumstances.
The inputs or methodology used for valuing securities are not necessarily an indication of the risk associated with investing in those securities and the determination of the significance of a particular input to the fair value measurement in its entirety requires judgment and considers factors specific to each security.
24
Morgan Stanley Institutional Fund, Inc.
Annual Report — December 31, 2019
Notes to Financial Statements (cont'd)
The following is a summary of the inputs used to value the Fund's investments as of December 31, 2019:
Investment Type | | Level 1
Unadjusted
quoted
prices
(000) | | Level 2
Other
significant
observable
inputs
(000) | | Level 3
Significant
unobservable
inputs
(000) | | Total
(000) | |
Assets: | |
Common Stocks | |
Aerospace & Defense | | $ | 2,280 | | | $ | — | | | $ | — | | | $ | 2,280 | | |
Airlines | | | 3,165 | | | | — | | | | — | | | | 3,165 | | |
Auto Components | | | — | | | | 274 | | | | — | | | | 274 | | |
Automobiles | | | 2,003 | | | | 3,842 | | | | — | | | | 5,845 | | |
Banks | | | 9,666 | | | | 6,710 | | | | — | | | | 16,376 | | |
Beverages | | | 5,645 | | | | 328 | | | | — | | | | 5,973 | | |
Building Products | | | — | | | | 593 | | | | — | | | | 593 | | |
Capital Markets | | | 445 | | | | — | | | | — | | | | 445 | | |
Chemicals | | | 703 | | | | 3,644 | | | | — | | | | 4,347 | | |
Communications
Equipment | | | — | | | | 1,993 | | | | — | | | | 1,993 | | |
Construction &
Engineering | | | 1,014 | | | | — | | | | — | | | | 1,014 | | |
Consumer Finance | | | — | | | | 1,132 | | | | — | | | | 1,132 | | |
Diversified Financial
Services | | | 377 | | | | — | | | | — | | | | 377 | | |
Electric Utilities | | | 1,257 | | | | — | | | | — | | | | 1,257 | | |
Electrical Equipment | | | 534 | | | | 656 | | | | — | | | | 1,190 | | |
Electronic Equipment,
Instruments &
Components | | | 1,078 | | | | 3,273 | | | | — | | | | 4,351 | | |
Energy Equipment &
Services | | | 4,906 | | | | 1,374 | | | | — | | | | 6,280 | | |
Entertainment | | | 5,757 | | | | 2,320 | | | | — | | | | 8,077 | | |
Food & Staples Retailing | | | — | | | | 1,122 | | | | — | | | | 1,122 | | |
Food Products | | | 1,761 | | | | 5,675 | | | | — | | | | 7,436 | | |
Health Care Equipment &
Supplies | | | 5,789 | | | | 745 | | | | — | | | | 6,534 | | |
Health Care Providers &
Services | | | 923 | | | | — | | | | — | | | | 923 | | |
Household Durables | | | 1,878 | | | | 2,817 | | | | — | | | | 4,695 | | |
Household Products | | | 1,302 | | | | 1,150 | | | | — | | | | 2,452 | | |
Information Technology
Services | | | 3,816 | | | | — | | | | — | | | | 3,816 | | |
Insurance | | | 2,268 | | | | 5,738 | | | | — | | | | 8,006 | | |
Interactive Media &
Services | | | 8,784 | | | | — | | | | — | | | | 8,784 | | |
Internet & Direct
Marketing Retail | | | 5,261 | | | | — | | | | — | | | | 5,261 | | |
Leisure Products | | | — | | | | 706 | | | | — | | | | 706 | | |
Life Sciences Tools &
Services | | | 1,934 | | | | 820 | | | | — | | | | 2,754 | | |
Machinery | | | 1,882 | | | | 4,032 | | | | — | | | | 5,914 | | |
Metals & Mining | | | 6,858 | | | | — | | | | — | | | | 6,858 | | |
Oil, Gas & Consumable
Fuels | | | 3,945 | | | | 1,741 | | | | — | | | | 5,686 | | |
Personal Products | | | 5,691 | | | | 2,108 | | | | — | | | | 7,799 | | |
Pharmaceuticals | | | 4,978 | | | | 9,489 | | | | — | | | | 14,467 | | |
Professional Services | | | 2,062 | | | | — | | | | — | | | | 2,062 | | |
Real Estate
Management &
Development | | | — | | | | — | | | | — | @ | | | — | | |
Road & Rail | | | — | | | | 478 | | | | — | | | | 478 | | |
Semiconductors &
Semiconductor
Equipment | | | 5,881 | | | | 2,065 | | | | — | | | | 7,946 | | |
Investment Type | | Level 1
Unadjusted
quoted
prices
(000) | | Level 2
Other
significant
observable
inputs
(000) | | Level 3
Significant
unobservable
inputs
(000) | | Total
(000) | |
Software | | $ | 2,613 | | | $ | 3,157 | | | $ | — | | | $ | 5,770 | | |
Specialty Retail | | | 944 | | | | — | | | | — | | | | 944 | | |
Tech Hardware,
Storage & Peripherals | | | — | | | | 5,025 | | | | — | | | | 5,025 | | |
Textiles, Apparel &
Luxury Goods | | | 4,319 | | | | 1,698 | | | | — | | | | 6,017 | | |
Trading Companies &
Distributors | | | — | | | | 644 | | | | — | | | | 644 | | |
Transportation
Infrastructure | | | 860 | | | | — | | | | — | | | | 860 | | |
Total Common Stocks | | | 112,579 | | | | 75,349 | | | | — | @ | | | 187,928 | | |
Investment Company | | | 1,235 | | | | — | | | | — | | | | 1,235 | | |
Short-Term Investments | |
Investment Company | | | 6,898 | | | | — | | | | — | | | | 6,898 | | |
Repurchase Agreements | | | — | | | | 859 | | | | — | | | | 859 | | |
Total Short-Term
Investments | | | 6,898 | | | | 859 | | | | — | | | | 7,757 | | |
Foreign Currency
Forward Exchange Contracts | | | — | | | | 31 | | | | — | | | | 31 | | |
Total Assets | | | 120,712 | | | | 76,239 | | | | — | @ | | | 196,951 | | |
Liabilities: | |
Foreign Currency Forward
Exchange Contracts | | | — | | | | (8 | ) | | | — | | | | (8 | ) | |
Futures Contract | | | (5 | ) | | | — | | | | — | | | | (5 | ) | |
Total Liabilities | | | (5 | ) | | | (8 | ) | | | — | | | | (13 | ) | |
Total | | $ | 120,707 | | | $ | 76,231 | | | $ | — | @ | | $ | 196,938 | | |
@ Value is less than $500.
Transfers between investment levels may occur as the markets fluctuate and/or the availability of data used in an investment's valuation changes.
Following is a reconciliation of investments in which significant unobservable inputs (Level 3) were used in determining fair value:
| | | Common
Stock
(000) | |
Beginning Balance | | $ | — | @ | |
Purchases | | | — | | |
Sales | | | — | | |
Amortization of discount | | | — | | |
Transfers in | | | — | | |
Transfers out | | | — | | |
Corporate actions | | | — | | |
Change in unrealized appreciation (depreciation) | | | — | @ | |
Realized gains (losses) | | | — | | |
Ending Balance | | $ | — | @ | |
Net change in unrealized appreciation (depreciation) from investments
still held as of December 31, 2019 | | $ | — | @ | |
@ Value is less than $500.
25
Morgan Stanley Institutional Fund, Inc.
Annual Report — December 31, 2019
Notes to Financial Statements (cont'd)
3. Repurchase Agreements: The Fund may enter into repurchase agreements under which the Fund lends cash and takes possession of securities with an agreement that the counterparty will repurchase such securities. In connection with transactions in repurchase agreements, a bank as custodian for the Fund takes possession of the underlying securities which are held as collateral, with a market value at least equal to the amount of the repurchase transaction, including principal and accrued interest. To the extent that any repurchase transaction exceeds one business day, the value of the collateral is marked-to-market on a daily basis to determine that the value of the collateral does not decrease below the repurchase price plus accrued interest as earned. If such a decrease occurs, additional collateral will be requested and, when received, will be added to the account to maintain full collateralization. In the event of default on the obligation to repurchase, the Fund has the right to liquidate the collateral and apply the proceeds in satisfaction of the obligation. In the event of default or bankruptcy by the counterparty to the agreement, realization of the collateral proceeds may be subject to cost and delays. The Fund, along with other affiliated investment companies, may utilize a joint trading account for the purpose of entering into repurchase agreements.
4. Foreign Currency Translation and Foreign Investments: The books and records of the Fund are maintained in U.S. dollars. Foreign currency amounts are translated into U.S. dollars as follows:
– investments, other assets and liabilities at the prevailing rate of exchange on the valuation date;
– investment transactions and investment income at the prevailing rates of exchange on the dates of such transactions.
Although the net assets of the Fund are presented at the foreign exchange rates and market values at the close of the period, the Fund does not isolate that portion of the results of operations arising as a result of changes in the foreign exchange rates from the fluctuations arising from changes in the market prices of securities held at period end. Similarly, the Fund does not isolate the effect of changes in foreign exchange rates from the fluctuations arising from changes in the market prices of securities sold during the period. Accordingly, realized and unrealized foreign currency gains (losses) on
investments in securities are included in the reported net realized and unrealized gains (losses) on investment transactions and balances. However, pursuant to U.S. federal income tax regulations, gains and losses from certain foreign currency transactions and the foreign currency portion of gains and losses realized on sales and maturities of foreign denominated debt securities are treated as ordinary income for U.S. federal income tax purposes.
Net realized gains (losses) on foreign currency transactions represent net foreign exchange gains (losses) from foreign currency forward exchange contracts, disposition of foreign currencies, currency gains (losses) realized between the trade and settlement dates on securities transactions, and the difference between the amount of investment income and foreign withholding taxes recorded on the Fund's books and the U.S. dollar equivalent amounts actually received or paid. The change in unrealized currency gains (losses) on foreign currency transactions for the period is reflected in the Statement of Operations.
Foreign security and currency transactions may involve certain considerations and risks not typically associated with those of U.S. dollar denominated transactions as a result of, among other factors, fluctuations of exchange rates in relation to the U.S. dollar, the possibility of lower levels of governmental supervision and regulation of foreign securities markets and the possibility of political or economic instability.
Governmental approval for foreign investments may be required in advance of making an investment under certain circumstances in some countries, and the extent of foreign investments in domestic companies may be subject to limitation in other countries. Foreign ownership limitations also may be imposed by the charters of individual companies to prevent, among other concerns, violations of foreign investment limitations. As a result, an additional class of shares (identified as "Foreign" in the Portfolio of Investments) may be created and offered for investment. The "local" and "foreign shares" market values may differ. In the absence of trading of the foreign shares in such markets, the Fund values the foreign shares at the closing exchange price of the local shares.
5. Derivatives: The Fund may, but is not required to, use derivative instruments for a variety of purposes, including
26
Morgan Stanley Institutional Fund, Inc.
Annual Report — December 31, 2019
Notes to Financial Statements (cont'd)
hedging, risk management, portfolio management or to earn income. Derivatives are financial instruments whose value is based, in part, on the value of an underlying asset, interest rate, index or financial instrument. Prevailing interest rates and volatility levels, among other things, also affect the value of derivative instruments. A derivative instrument often has risks similar to its underlying asset and may have additional risks, including imperfect correlation between the value of the derivative and the underlying asset, risks of default by the counterparty to certain transactions, magnification of losses incurred due to changes in the market value of the securities, instruments, indices or interest rates to which the derivative instrument relates, risks that the transactions may not be liquid and risks arising from margin requirements. The use of derivatives involves risks that are different from, and possibly greater than, the risks associated with other portfolio investments. Derivatives may involve the use of highly specialized instruments that require investment techniques and risk analyses different from those associated with other portfolio investments. All of the Fund's holdings, including derivative instruments, are marked-to-market each day with the change in value reflected in unrealized appreciation (depreciation). Upon disposition, a realized gain or loss is recognized.
Certain derivative transactions may give rise to a form of leverage. Leverage magnifies the potential for gain and the risk of loss. Leverage associated with derivative transactions may cause the Fund to liquidate portfolio positions when it may not be advantageous to do so to satisfy its obligations or to meet earmarking or segregation requirements, pursuant to applicable Securities and Exchange Commission ("SEC") rules and regulations, or may cause the Fund to be more volatile than if the Fund had not been leveraged. Although the Adviser seeks to use derivatives to further the Fund's investment objectives, there is no assurance that the use of derivatives will achieve this result.
Following is a description of the derivative instruments and techniques that the Fund used during the period and their associated risks:
Options: With respect to options, the Fund is subject to equity risk, interest rate risk and foreign currency exchange risk in the normal course of pursuing its investment objectives. If the Fund buys an option, it buys a legal contract giving it the right to buy or sell a specific
amount of the underlying instrument or foreign currency, or futures contract on the underlying instrument or foreign currency, at an agreed-upon price during a period of time or on a specified date typically in exchange for a premium paid by the Fund. The Fund may purchase and/or sell put and call options. Purchasing call options tends to increase the Fund's exposure to the underlying (or similar) instrument. Purchasing put options tends to decrease the Fund's exposure to the underlying (or similar) instrument. When entering into purchased option contracts, the Fund bears the risk of interest or exchange rates or securities prices moving unexpectedly, in which case, the Fund may not achieve the anticipated benefits of the purchased option contracts; however the risk of loss is limited to the premium paid. Purchased options are reported as part of "Total Investments in Securities" in the Statement of Assets and Liabilities. Premium paid for purchasing options which expired are treated as realized losses. If the Fund sells an option, it sells to another party the right to buy from or sell to the Fund a specific amount of the underlying instrument or foreign currency, or futures contract on the underlying instrument or foreign currency, at an agreed-upon price during a period of time or on a specified date typically in exchange for a premium received by the Fund. The Fund may write call and put options on stock indexes, futures, securities or currencies it owns or in which it may invest. Writing put options tend to increase the Fund's exposure to the underlying instrument. Writing call options tend to decrease the Fund's exposure to the underlying instruments. When the Fund writes a call or put option, an amount equal to the premium received is recorded as a liability. Any liability recorded is subsequently adjusted to reflect the current value of the options written. Premiums received from writing options which expire are treated as realized gains. Premiums received from writing options which are exercised or are closed are added to or offset against the proceeds or amount paid on the transaction to determine the net realized gain or loss. The Fund as a writer of an option has no control over whether the underlying future, security or currency may be sold (call) or purchased (put) and as a result bears the market risk of an unfavorable change in the price of the future, security or currency underlying the written option. When options are purchased OTC, the Fund bears the risk that the counterparty that wrote the option will be unable or
27
Morgan Stanley Institutional Fund, Inc.
Annual Report — December 31, 2019
Notes to Financial Statements (cont'd)
unwilling to perform its obligations under the option contract. Options may also be illiquid and the Fund may have difficulty closing out its position. A decision as to whether, when and how to use options involves the exercise of skill and judgment and even a well-conceived option transaction may be unsuccessful because of market behavior or unexpected events. The prices of options can be highly volatile and the use of options can lower total returns.
As of December 31, 2019, the Fund did not have any outstanding options written.
Futures: A futures contract is a standardized, exchange-traded agreement to buy or sell a specific quantity of an underlying asset, reference rate or index at a specific price at a specific future time. The value of a futures contract tends to increase and decrease in tandem with the value of the underlying instrument. Depending on the terms of the particular contract, futures contracts are settled through either physical delivery of the underlying instrument on the settlement date or by payment of a cash settlement amount on the settlement date. During the period the futures contract is open, payments are received from or made to the broker based upon changes in the value of the contract (the variation margin). A decision as to whether, when and how to use futures contracts involves the exercise of skill and judgment and even a well-conceived futures transaction may be unsuccessful because of market behavior or unexpected events. In addition to the derivatives risks discussed above, the prices of futures contracts can be highly volatile, using futures contracts can lower total return and the potential loss from futures contracts can exceed the Fund's initial investment in such contracts. No assurance can be given that a liquid market will exist for any particular futures contract at any particular time. There is also the risk of loss by the Fund of margin deposits in the event of bankruptcy of a broker with which the Fund has open positions in the futures contract.
Foreign Currency Forward Exchange Contracts: In connection with its investments in foreign securities, the Fund also entered into contracts with banks, brokers or dealers to purchase or sell securities or foreign currencies at a future date. A foreign currency forward exchange
contract ("currency contract") is a negotiated agreement between the contracting parties to exchange a specified amount of currency at a specified future time at a specified rate. The rate can be higher or lower than the spot rate between the currencies that are the subject of the contract. Currency contracts may be used to protect against uncertainty in the level of future foreign currency exchange rates or to gain or modify exposure to a particular currency. To the extent hedged by the use of currency contracts, the precise matching of the currency contract amounts and the value of the securities involved will not generally be possible because the future value of such securities in foreign currencies will change as a consequence of market movements in the value of those securities between the date on which the contract is entered into and the date it matures. Furthermore, such transactions may reduce or preclude the opportunity for gain if the value of the currency should move in the direction opposite to the position taken. There is additional risk to the extent that currency contracts create exposure to currencies in which the Fund's securities are not denominated. Unanticipated changes in currency prices may result in poorer overall performance for the Fund than if it had not entered into such contracts. The use of currency contracts involves the risk of loss from the insolvency or bankruptcy of the counterparty to the contract or the failure of the counterparty to make payments or otherwise comply with the terms of the contract. A currency contract is marked-to-market daily and the change in market value is recorded by the Fund as unrealized gain or loss. The Fund records realized gains (losses) when the currency contract is closed equal to the difference between the value of the currency contract at the time it was opened and the value at the time it was closed.
FASB ASC 815, "Derivatives and Hedging" ("ASC 815"), is intended to improve financial reporting about derivative instruments by requiring enhanced disclosures to enable investors to better understand how and why the Fund uses derivative instruments, how these derivative instruments are accounted for and their effects on the Fund's financial position and results of operations.
28
Morgan Stanley Institutional Fund, Inc.
Annual Report — December 31, 2019
Notes to Financial Statements (cont'd)
The following tables set forth the fair value of the Fund's derivative contracts by primary risk exposure as of December 31, 2019:
| | | Asset Derivatives
Statement of Assets and
Liabilities Location | | Primary Risk
Exposure | | Value
(000) | |
Foreign Currency Forward
Exchange Contracts | | Unrealized Appreciation on
Exchange Contracts | | Currency Risk | | Foreign Currency Forward
$31 | |
| | | Liability Derivatives
Statement of Assets and
Liabilities Location | | Primary Risk
Exposure | | Value
(000) | |
Foreign Currency Forward
Exchange Contracts | | Unrealized Depreciation on
Foreign Currency Forward
Exchange Contracts | | Currency Risk | | $(8) | |
Futures Contracts | | Variation Margin on
Futures Contracts | | Equity Risk | | (5)(a) | |
Total | | | | | | $ | (13 | ) | |
(a) This amount represents the cumulative appreciation (depreciation) as reported in the Portfolio of Investments. The Statement of Assets and Liabilities only reflects the current day's net variation margin.
The following tables set forth by primary risk exposure the Fund's realized gains (losses) and change in unrealized appreciation (depreciation) by type of derivative contract for the year ended December 31, 2019 in accordance with ASC 815:
Realized Gain (Loss) | |
Primary Risk Exposure | | Derivative Type | | Value
(000) | |
Currency Risk | | Foreign Currency Forward
Exchange Contracts | | $ | 349 | | |
Equity Risk | | Futures Contracts | | | 223 | | |
Currency Risk | | Written Option | | | 5 | | |
| | | Total | | $ | 577 | | |
Change in Unrealized Appreciation (Depreciation) | |
Primary Risk Exposure | | Derivative Type | | Value
(000) | |
Currency Risk | | Foreign Currency Forward
Exchange Contracts | | $ | (128 | ) | |
Equity Risk | | Futures Contracts | | | (37 | ) | |
| | | Total | | $ | (165 | ) | |
At December 31, 2019, the Fund's derivative assets and liabilities are as follows:
Gross Amounts of Assets and Liabilities Presented in the
Statement of Assets and Liabilities | |
Derivatives(b) | | Assets(c)
(000) | | Liabilities(c)
(000) | |
Foreign Currency Forward
Exchange Contracts | | $ | 31 | | | $ | (8 | ) | |
(b) Excludes exchange-traded derivatives.
(c) Absent an event of default or early termination, OTC derivative assets and liabilities are presented gross and not offset in the Statement of Assets and Liabilities.
The Fund typically enters into International Swaps and Derivatives Association, Inc. Master Agreements ("ISDA Master Agreements") or similar master agreements (collectively, "Master Agreements") with its contract counterparties for certain OTC derivatives in order to, among other things, reduce its credit risk to counterparties. ISDA Master Agreements include provisions for general obligations, representations, collateral and events of default or termination. Under an ISDA Master Agreement, the Fund typically may offset with the counterparty certain OTC derivative financial instruments' payables and/or receivables with collateral held and/or posted and create one single net payment (close-out netting) in the event of default, termination and/or potential deterioration in the credit quality of the counterparty. Various Master Agreements govern the terms of certain transactions with counterparties, including transactions such as swap, forward, repurchase and reverse repurchase agreements. These Master Agreements typically attempt to reduce the counterparty risk associated with such transactions by specifying credit protection mechanisms and providing standardization that improves legal certainty. Cross-termination provisions under Master Agreements typically provide that a default in connection with one transaction between the Fund and a counterparty gives the non-defaulting party the right to terminate any other transactions in place with the defaulting party to create one single net payment due to/due from the defaulting party and may be a feature in certain Master Agreements. In the event the Fund exercises its right to terminate a Master Agreement after a counterparty experiences a termination event as defined in the Master Agreement, the return of collateral with market value in excess of the Fund's net liability may be delayed or denied.
The following tables present derivative financial instruments that are subject to enforceable netting arrangements as of December 31, 2019:
Gross Amounts Not Offset in the Statement of Assets and Liabilities | |
Counterparty | | Gross Asset
Derivatives
Presented in the
Statement of
Assets and
Liabilities
(000) | | Financial
Instrument
(000) | | Collateral
Received
(000) | | Net Amount
(not less
than $0)
(000) | |
State Street Bank and Trust Co. | | $ | 31 | | | $ | (— | @) | | $ | — | | | $ | 31 | | |
29
Morgan Stanley Institutional Fund, Inc.
Annual Report — December 31, 2019
Notes to Financial Statements (cont'd)
Gross Amounts Not Offset in the Statement of Assets and Liabilities | |
Counterparty | | Gross Liability
Derivatives
Presented in the
Statement of
Assets and
Liabilities
(000) | | Financial
Instrument
(000) | | Collateral
Pledged
(000) | | Net Amount
(not less
than $0)
(000) | |
Citibank NA | | $ | 8 | | | $ | — | | | $ | — | | | $ | 8 | | |
State Street Bank and Trust Co. | | | — | @ | | | (— | @) | | | — | | | | 0 | | |
Total | | $ | 8 | | | $ | (— | @) | | $ | — | | | $ | 8 | | |
@ Value is less than $500.
For the year ended December 31, 2019, the approximate average monthly amount outstanding for each derivative type is as follows:
Foreign Currency Forward Exchange Contracts: | |
Average monthly principal amount | | $ | 14,865,000 | | |
Futures Contracts: | |
Average monthly notional value | | $ | 8,377,000 | | |
Written Options: | |
Average monthly notional amount | | | 6,000 | | |
6. Securities Lending: The Fund lends securities to qualified financial institutions, such as broker-dealers, to earn additional income. Any increase or decrease in the fair value of the securities loaned that might occur and any interest earned or dividends declared on those securities during the term of the loan would remain in the Fund. The Fund would receive cash or securities as collateral in an amount equal to or exceeding 100% of the current fair value of the loaned securities. The collateral is marked-to-market daily by State Street Bank and Trust Company ("State Street"), the securities lending agent, to ensure that a minimum of 100% collateral coverage is maintained.
Based on pre-established guidelines, the securities lending agent invests any cash collateral that is received in an affiliated money market portfolio and repurchase agreements. Securities lending income is generated from the earnings on the invested collateral and borrowing fees, less any rebates owed to the borrowers and compensation to the lending agent, and is recorded as "Income from Securities Loaned — Net" in the Fund's Statement of Operations. Risks in securities lending transactions are that a borrower may not provide additional collateral when required or return the securities when due, and that the value of the short-term investments will be less than the amount of cash collateral plus any rebate that is required to be returned to the borrower.
The Fund has the right under the securities lending agreement to recover the securities from the borrower on demand.
The following table presents financial instruments that are subject to enforceable netting arrangements as of December 31, 2019:
Gross Amounts Not Offset in the Statement of Assets and Liabilities | |
Gross Asset
Amounts
Presented in
the Statement
of Assets and
Liabilities
(000) | | Financial
Instrument
(000) | | Collateral
Received
(000) | | Net Amount
(not less
than $0)
(000) | |
| $ | 12,078 | (d) | | $ | — | | | $ | (12,078 | )(e)(f) | | $ | 0 | | |
(d) Represents market value of loaned securities at year end.
(e) The Fund received cash collateral of approximately $7,203,000, of which approximately $7,089,000 was subsequently invested in Repurchase Agreements and Morgan Stanley Institutional Liquidity Funds as reported in the Portfolio of Investments. As of December 31, 2019, there was uninvested cash of approximately $114,000, which is not reflected in the Portfolio of Investments. In addition, the Fund received non-cash collateral of approximately $5,128,000 in the form of U.S. Government obligations, which the Fund cannot sell or repledge, and accordingly are not reflected in the Portfolio of Investments.
(f) The actual collateral received is greater than the amount shown here due to overcollateralization.
FASB ASC 860, "Transfers & Servicing: Repurchase-to-Maturity Transactions, Repurchase Financings, and Disclosures", is intended to provide increased transparency about the types of collateral pledged in securities lending transactions and other similar transactions that are accounted for as secured borrowing.
The following table displays a breakdown of transactions accounted for as secured borrowings, the gross obligations by class of collateral pledged and the remaining contractual maturity of those transactions as of December 31, 2019:
Remaining Contractual Maturity of the Agreements | |
| | | Overnight and
Continuous
(000) | | <30 days
(000) | | Between
30 &
90 days
(000) | | >90 days
(000) | | Total
(000) | |
Securities Lending
Transactions | |
Common Stocks | | $ | 7,203 | | | $ | — | | | $ | — | | | $ | — | | | $ | 7,203 | | |
Total Borrowings | | $ | 7,203 | | | $ | — | | | $ | — | | | $ | — | | | $ | 7,203 | | |
Gross amount of
recognized liabilities
for securities lending
transactions | | | | | | | | | | $ | 7,203 | | |
30
Morgan Stanley Institutional Fund, Inc.
Annual Report — December 31, 2019
Notes to Financial Statements (cont'd)
7. Redemption Fees: The Fund will assess a 2% redemption fee on Class I shares, Class A shares, Class L shares, Class C shares, Class IS shares and Class IR shares, which is paid directly to the Fund, for shares redeemed or exchanged within thirty days of purchase, subject to certain exceptions. The redemption fee is designed to protect the Fund and its remaining shareholders from the effects of short-term trading. These fees, if any, are included in the Statements of Changes in Net Assets.
8. Indemnifications: The Company enters into contracts that contain a variety of indemnifications. The Company's maximum exposure under these arrangements is unknown. However, the Company has not had prior claims or losses pursuant to these contracts and expects the risk of loss to be remote.
9. Dividends and Distributions to Shareholders: Dividends and distributions to shareholders are recorded on the ex-dividend date. Dividends from net investment income, if any, are declared and paid annually. Net realized capital gains, if any, are distributed at least annually.
10. Security Transactions, Income and Expenses: Security transactions are accounted for on the trade date (date the order to buy or sell is executed). Realized gains and losses on the sale of investment securities are determined on the specific identified cost method. Dividend income and other distributions are recorded on the ex-dividend date (except for certain foreign dividends which may be recorded as soon as the Fund is informed of such dividends) net of applicable withholding taxes. Interest income is recognized on the accrual basis except where collection is in doubt. Discounts are accreted and premiums are amortized over the life of the respective securities. Most expenses of the Company can be directly attributed to a particular Fund. Expenses which cannot be directly attributed are apportioned among the Funds based upon relative net assets or other appropriate methods. Income, expenses (other than class specific expenses — distribution and shareholder services, transfer agency and sub transfer agency fees) and realized and unrealized gains or losses are allocated to each class of shares based upon their relative net assets.
B. Advisory Fees: The Adviser, a wholly-owned subsidiary of Morgan Stanley, provides the Fund with advisory services under the terms of an Investment Advisory Agreement, paid quarterly, at the annual rate based on the daily net assets as follows:
First $1
billion | | Over $1
billion | |
| | 0.65 | % | | | 0.60 | % | |
For the year ended December 31, 2019, the advisory fee rate (net of waiver/rebate) was equivalent to an annual effective rate of 0.61% of the Fund's average daily net assets.
The Adviser has agreed to reduce its advisory fee and/or reimburse the Fund so that total annual Fund operating expenses, excluding certain investment related expenses, taxes, interest and other extraordinary expenses (including litigation), will not exceed 0.90% for Class I shares, 1.25% for Class A shares, 1.75% for Class L shares, 2.00% for Class C shares, 0.85% for Class IS shares and 0.85% for Class IR shares. The fee waivers and/or expense reimbursements will continue for at least one year from the date of the Fund's prospectus or until such time as the Directors act to discontinue all or a portion of such waivers and/or reimbursements when they deem such action is appropriate. For the year ended December 31, 2019, approximately $42,000 of advisory fees were waived and approximately $68,000 of other expenses were reimbursed by the Adviser pursuant to this arrangement.
C. Administration Fees: The Adviser also serves as Administrator to the Company and provides administrative services pursuant to an Administration Agreement for an annual fee, accrued daily and paid monthly, of 0.08% of the Fund's average daily net assets.
Under a Sub-Administration Agreement between the Administrator and State Street, State Street provides certain administrative services to the Company. For such services, the Administrator pays State Street a portion of the fee the Administrator receives from the Fund.
D. Distribution and Shareholder Services Fees: Morgan Stanley Distribution, Inc. ("MSDI" or the "Distributor"), a wholly-owned subsidiary of the Adviser and an indirect subsidiary of Morgan Stanley, serves as the Company's Distributor of Fund shares pursuant to a Distribution Agreement. The Company has adopted a Shareholder Services Plan with respect to Class A shares pursuant to Rule 12b-1 under the Act. Under the Shareholder Services Plan, the Fund pays the Distributor a shareholder services fee, accrued daily and paid
31
Morgan Stanley Institutional Fund, Inc.
Annual Report — December 31, 2019
Notes to Financial Statements (cont'd)
monthly, at an annual rate of 0.25% of the Fund's average daily net assets attributable to Class A shares.
The Company has adopted a Distribution and Shareholder Services Plan with respect to Class L shares pursuant to Rule 12b-1 under the Act. Under the Distribution and Shareholder Services Plan, the Fund pays the Distributor a distribution fee, accrued daily and paid monthly, at an annual rate of 0.50% and a shareholder services fee, accrued daily and paid monthly, at an annual rate of 0.25% of the Fund's average daily net assets attributable to Class L shares.
The Company has adopted a Distribution and Shareholder Services Plan with respect to Class C shares pursuant to Rule 12b-1 under the Act. Under the Distribution and Shareholder Services Plan, the Fund pays the Distributor a distribution fee, accrued daily and paid monthly, at an annual rate of 0.75% and a shareholder services fee, accrued daily and paid monthly, at an annual rate of 0.25% of the Fund's average daily net assets attributable to Class C shares.
The distribution and shareholder services fees are used to support the expenses associated with servicing and maintaining accounts. The Distributor may compensate other parties for providing shareholder support services to investors who purchase Class A, Class L and Class C shares.
E. Dividend Disbursing and Transfer Agent: The Company's dividend disbursing and transfer agent is DST Asset Manager Solutions, Inc. ("DST"). Pursuant to a Transfer Agency Agreement, the Company pays DST a fee based on the number of classes, accounts and transactions relating to the Funds of the Company.
F. Custodian Fees: State Street (the "Custodian") also serves as Custodian for the Company in accordance with a Custodian Agreement. The Custodian holds cash, securities and other assets of the Company as required by the Act. Custody fees are payable monthly based on assets held in custody, investment purchases and sales activity and account maintenance fees, plus reimbursement for certain out-of-pocket expenses.
G. Security Transactions and Transactions with Affiliates: For the year ended December 31, 2019, purchases and sales of investment securities for the Fund, other than long-term U.S. Government securities and short-term investments were approximately $60,080,000 and $65,598,000, respectively. There were no purchases and sales of long-term U.S. Government securities for the year ended December 31, 2019.
The Fund invests in the Institutional Class of the Morgan Stanley Institutional Liquidity Funds — Treasury Securities Portfolio (the "Liquidity Funds"), an open-end management investment company managed by the Adviser, both directly and as a portion of the securities held as collateral on loaned securities. Advisory fees paid by the Fund are reduced by an amount equal to its pro-rata share of the advisory and administration fees paid by the Fund due to its investment in the Liquidity Funds. For the year ended December 31, 2019, advisory fees paid were reduced by approximately $12,000 relating to the Fund's investment in the Liquidity Funds.
The Fund invests in Morgan Stanley China A Share Fund, Inc., a closed-end management investment company advised by an affiliate of the Adviser. Advisory fees paid by the Fund are reduced by an amount equal to its pro-rata share of the advisory and administration fees paid by the Morgan Stanley China A Share Fund, Inc., For the year ended December 31, 2019, advisory fees paid were reduced by approximately $14,000 relating to the Fund's investment in the Morgan Stanley China A Share Fund, Inc.
The Fund had transactions with Morgan Stanley China A Shares Fund, Inc., Mitsubishi UFJ Financial Group, Inc., and its affiliated broker-dealers, which may be deemed affiliates of the Adviser/Administrator and Distributor under Section 17 the Act.
A summary of the Fund's transactions in shares of affiliated investments during the year ended December 31, 2019 is as follows:
Affiliated
Investment
Company | | Value
December 31,
2018
(000) | | Purchases
at Cost
(000) | | Proceeds
from Sales
(000) | | Dividend
Income
(000) | |
Liquidity Funds | | $ | 9,271 | | | $ | 41,360 | | | $ | 43,733 | | | $ | 136 | | |
Morgan Stanley
China A
Share Fund | | | — | | | | 1,324 | | | | — | | | | 47 | | |
Mitsubishi UFJ
Financial
Group, Inc. | | | 228 | | | | — | | | | — | | | | 10 | | |
Total | | $ | 9,499 | | | $ | 42,684 | | | $ | 43,733 | | | $ | 193 | | |
Affiliated
Investment
Company (cont'd) | | Realized
Gain
(Loss)
(000) | | Change in
Unrealized
Appreciation
(Depreciation)
(000) | | Value
December 31,
2019
(000) | |
Liquidity Funds | | $ | — | | | $ | — | | | $ | 6,898 | | |
Morgan Stanley
China A
Share Fund | | | — | | | | (89 | ) | | | 1,235 | | |
Mitsubishi UFJ
Financial
Group, Inc. | | | — | | | | 22 | | | | 250 | | |
Total | | $ | — | | | $ | (67 | ) | | $ | 8,383 | | |
32
Morgan Stanley Institutional Fund, Inc.
Annual Report — December 31, 2019
Notes to Financial Statements (cont'd)
The Fund is permitted to purchase and sell securities ("cross-trade") from and to other Morgan Stanley funds as well as other funds and client accounts for which the Adviser or an affiliate of the Adviser serves as investment adviser, pursuant to procedures approved by the Directors in compliance with Rule 17a-7 under the Act (the "Rule"). Each cross-trade is executed at the current market price in compliance with provisions of the Rule. For the year ended December 31, 2019, the Fund did not engage in any cross-trade transactions.
The Fund has an unfunded Deferred Compensation Plan (the "Compensation Plan"), which allows each independent Director to defer payment of all, or a portion, of the fees he or she receives for serving on the Board of Directors. Each eligible Director generally may elect to have the deferred amounts credited with a return equal to the total return on one or more of the Morgan Stanley funds that are offered as investment options under the Compensation Plan. Appreciation/depreciation and distributions received from these investments are recorded with an offsetting increase/decrease in the deferred compensation obligation and do not affect the NAV of the Fund.
H. Federal Income Taxes: It is the Fund's intention to continue to qualify as a regulated investment company and distribute all of its taxable and tax-exempt income. Accordingly, no provision for federal income taxes is required in the financial statements.
The Fund may be subject to taxes imposed by countries in which it invests. Such taxes are generally based on income and/or capital gains earned or repatriated. Taxes are accrued based on net investment income, net realized gains and net unrealized appreciation as such income and/or gains are earned. Taxes may also be based on transactions in foreign currency and are accrued based on the value of investments denominated in such currency.
FASB ASC 740-10, "Income Taxes — Overall", sets forth a minimum threshold for financial statement recognition of the benefit of a tax position taken or expected to be taken in a tax return. Management has concluded there are no significant uncertain tax positions that would require recognition in the financial statements. If applicable, the Fund recognizes interest accrued related to unrecognized tax benefits in "Interest Expense" and penalties in "Other Expenses" in the Statement of Operations. The Fund files tax returns with the U.S. Internal Revenue Service, New York and various states. Generally, each of the tax years in the four-year period ended December 31, 2019 remains subject to examination by taxing authorities.
The tax character of distributions paid may differ from the character of distributions shown for GAAP purposes due to short-term capital gains being treated as ordinary income for tax purposes. The tax character of distributions paid during fiscal years 2019 and 2018 was as follows:
2019 Distributions
Paid From:
Ordinary Income
(000) | | 2018 Distributions
Paid From:
Ordinary Income
(000) | |
| $ | 2,134 | | | $ | 2,725 | | |
The amount and character of income and gains to be distributed are determined in accordance with income tax regulations which may differ from GAAP. These book/tax differences are either considered temporary or permanent in nature.
Temporary differences are attributable to differing book and tax treatments for the timing of the recognition of gains (losses) on certain investment transactions and the timing of the deductibility of certain expenses.
The Fund had no permanent differences causing reclassifications among the components of net assets for the year ended December 31, 2019.
At December 31, 2019, the components of distributable earnings for the Fund on a tax basis were as follows:
Undistributed
Ordinary
Income
(000) | | Undistributed
Long-Term
Capital Gain
(000) | |
| $ | 86 | | | | — | | |
At December 31, 2019, the Fund had available for federal income tax purposes unused short-term and long-term capital losses of approximately $3,660,000 and $1,365,000, respectively, that do not have an expiration date.
To the extent that capital loss carryforwards are used to offset any future capital gains realized, no capital gains tax liability will be incurred by the Fund for gains realized and not distributed. To the extent that capital gains are offset, such gains will not be distributed to the shareholders. During the year ended December 31, 2019, the Fund utilized capital loss carryforwards for U.S. federal income tax purposes of approximately $6,515,000.
I. Credit Facility: The Company and other Morgan Stanley funds participated in a $150,000,000 committed, unsecured revolving line of credit facility (the "Facility") with State Street. Effective April 22, 2019, the committed line amount increased to $300,000,000. This Facility is to be used for temporary emergency purposes or funding of shareholder redemption requests. The interest rate on borrowings is based on the
33
Morgan Stanley Institutional Fund, Inc.
Annual Report — December 31, 2019
Notes to Financial Statements (cont'd)
federal funds rate or 1 month LIBOR rate plus a spread. The Facility also has a commitment fee of 0.25% per annum based on the unused portion of the Facility. During the year ended December 31, 2019, the Fund did not have any borrowings under the Facility.
J. Other: At December 31, 2019, the Fund had record owners of 10% or greater. Investment activities of these shareholders could have a material impact on the Fund. The aggregate percentage of such owners was 83.4%.
34
Morgan Stanley Institutional Fund, Inc.
Annual Report — December 31, 2019
Report of Independent Registered Public Accounting Firm
To the Shareholders and Board of Directors of
Morgan Stanley Institutional Fund, Inc. —
Active International Allocation Portfolio
Opinion on the Financial Statements
We have audited the accompanying statement of assets and liabilities of Active International Allocation Portfolio (the "Fund") (one of the funds constituting Morgan Stanley Institutional Fund, Inc. (the "Company")), including the portfolio of investments, as of December 31, 2019, and the related statement of operations for the year then ended, the statements of changes in net assets for each of the two years in the period then ended, the financial highlights for each of the five years in the period then ended and the related notes (collectively referred to as the "financial statements"). In our opinion, the financial statements present fairly, in all material respects, the financial position of Active International Allocation Portfolio (one of the funds constituting Morgan Stanley Institutional Fund, Inc.) at December 31, 2019, the results of its operations for the year then ended, the changes in its net assets for each of the two years in the period then ended and its financial highlights for each of the five years in the period then ended, in conformity with U.S. generally accepted accounting principles.
Basis for Opinion
These financial statements are the responsibility of the Company's management. Our responsibility is to express an opinion on the Fund's financial statements based on our audits. We are a public accounting firm registered with the Public Company Accounting Oversight Board (United States) ("PCAOB") and are required to be independent with respect to the Company in accordance with the U.S. federal securities law and the applicable rules and regulations of the Securities and Exchange Commission and the PCAOB.
We conducted our audits in accordance with the standards of the PCAOB. Those standards require that we plan and perform the audit to obtain reasonable assurance about whether the financial statements are free of material misstatement, whether due to error or fraud. The Company is not required to have, nor were we engaged to perform, an audit of the Company's internal control over financial reporting. As part of our audits, we are required to obtain an understanding of internal control over financial reporting, but not for the purpose of expressing an opinion on the effectiveness of the Company's internal control over financial reporting. Accordingly, we express no such opinion.
Our audits included performing procedures to assess the risks of material misstatement of the financial statements, whether due to error or fraud, and performing procedures that respond to those risks. Such procedures included examining, on a test basis, evidence regarding the amounts and disclosures in the financial statements. Our procedures included confirmation of securities owned as of December 31, 2019 by correspondence with the custodian and others or by other appropriate auditing procedures where replies from others were not received. Our audits also included evaluating the accounting principles used and significant estimates made by management, as well as evaluating the overall presentation of the financial statements. We believe that our audits provide a reasonable basis for our opinion.

We have served as the auditor of one or more Morgan Stanley investment companies since 2000.
Boston, Massachusetts
February 27, 2020
35
Morgan Stanley Institutional Fund, Inc.
Annual Report — December 31, 2019
Federal Tax Notice (unaudited)
For federal income tax purposes, the following information is furnished with respect to the Fund's earnings for its taxable year ended December 31, 2019. When distributed, certain earnings may be subject to a maximum tax rate of 15% as provided for by the Jobs and Growth Tax Relief Reconciliation Act of 2003. The Fund designated up to a maximum of approximately $2,495,000 as taxable at this lower rate.
The Fund intends to pass through foreign tax credits of approximately $361,000 and has derived net income from sources within foreign countries amounting to approximately $4,113,000.
In January, the Fund provides tax information to shareholders for the preceding calendar year.
36
Privacy Notice (unaudited) April 2019
FACTS | | WHAT DOES MSIM DO WITH YOUR PERSONAL INFORMATION? | |
Why? | | Financial companies choose how they share your personal information. Federal law gives consumers the right to limit some but not all sharing. Federal law also requires us to tell you how we collect, share, and protect your personal information. Please read this notice carefully to understand what we do. | |
What? | | The types of personal information we collect and share depend on the product or service you have with us. This information can include:
n Social Security number and income
n investment experience and risk tolerance
n checking account number and wire transfer instructions | |
How? | | All financial companies need to share customers' personal information to run their everyday business. In the section below, we list the reasons financial companies can share their customers' personal information; the reasons MSIM chooses to share; and whether you can limit this sharing. | |
Reasons we can share your personal information | | Does MSIM share? | | Can you limit this sharing? | |
For our everyday business purposes —
such as to process your transactions, maintain your account(s), respond to court orders and legal investigations, or report to credit bureaus | | Yes | | No | |
For our marketing purposes —
to offer our products and services to you | | Yes | | No | |
For joint marketing with other financial companies | | No | | We don't share | |
For our affiliates' everyday business purposes —
information about your transactions and experiences | | Yes | | No | |
For our affiliates' everyday business purposes —
information about your creditworthiness | | No | | We don't share | |
For our affiliates to market to you | | No | | We don't share | |
For non-affiliates to market to you | | No | | We don't share | |
Questions? Call toll-free (844) 312-6327 or email: imprivacyinquiries@morganstanley.com
37
Privacy Notice (unaudited) (cont'd) April 2019
Who we are
Who is providing this notice? | | Morgan Stanley Investment Management, Inc. and its affiliated registered investment advisers, registered broker-dealers, and registered and unregistered funds ("MSIM") | |
What we do
How does MSIM protect my personal information? | | To protect your personal information from unauthorized access and use, we use security measures that comply with federal law. These measures include computer safeguards and secured files and buildings. We have policies governing the proper handling of customer information by personnel and requiring third parties that provide support to adhere to appropriate security standards with respect to such information. | |
How does MSIM collect my personal information? | | We collect your personal information, for example, when you
n open an account or make deposits or withdrawals from your account
n buy securities from us or make a wire transfer
n give us your contact information
We also collect your personal information from others, such as credit bureaus, affiliates, or other companies. | |
Why can't I limit all sharing? | | Federal law gives you the right to limit only
n sharing for affiliates' everyday business purposes — information about your creditworthiness
n affiliates from using your information to market to you
n sharing for non-affiliates to market to you
State laws and individual companies may give you additional rights to limit sharing. See below for more on your rights under state law. | |
Definitions
Affiliates | | Companies related by common ownership or control. They can be financial and non-financial companies.
n Our affiliates include companies with a Morgan Stanley name and financial companies such as Morgan Stanley Smith Barney LLC and Morgan Stanley & Co. | |
Non-affiliates | | Companies not related by common ownership or control. They can be financial and non-financial companies.
n MSIM does not share with non-affiliates so they can market to you. | |
Joint marketing | | A formal agreement between non-affiliated financial companies that together market financial products or services to you.
n MSIM doesn't jointly market | |
Other Important Information
Vermont: Except as permitted by law, we will not share personal information we collect about Vermont residents with Non-affiliates unless you provide us with your written consent to share such information.
California: Except as permitted by law, we will not share personal information we collect about California residents with Non-affiliates and we will limit sharing such personal information with our Affiliates to comply with California privacy laws that apply to us.
38
Morgan Stanley Institutional Fund, Inc.
Annual Report — December 31, 2019
Director and Officer Information (unaudited)
Independent Directors:
Name, Birth Year
and Address of
Independent Director | | Position(s)
Held with
Registrant | | Length of Time
Served* | | Principal Occupation(s) During Past 5 Years
and Other Relevant Professional Experience | | Number of
Funds in
Fund Complex
Overseen by
Independent
Director** | | Other Directorships
Held by Independent
Director*** | |
Frank L. Bowman
c/o Perkins Coie LLP
Counsel to the Independent Directors
1155 Avenue of the Americas
New York, NY 10036
Birth Year 1944 | | Director | | Since
August 2006 | | President, Strategic Decisions, LLC (consulting) (since February 2009); Director or Trustee of various Morgan Stanley Funds (since August 2006); Chairperson of the Compliance and Insurance Committee (since October 2015); formerly, Chairperson of the Insurance Sub-Committee of the Compliance and Insurance Committee (2007-2015); served as President and Chief Executive Officer of the Nuclear Energy Institute (policy organization) (February 2005-November 2008); retired as Admiral, U.S. Navy after serving over 38 years on active duty including 8 years as Director of the Naval Nuclear Propulsion Program in the Department of the Navy and the U.S. Department of Energy (1996-2004); served as Chief of Naval Personnel (July 1994-September 1996) and on the Joint Staff as Director of Political Military Affairs (June 1992-July 1994); knighted as Honorary Knight Commander of the Most Excellent Order of the British Empire; awarded the Officier de l'Orde National du Mérite by the French Government; elected to the National Academy of Engineering (2009). | | | 86 | | | Director of Naval and Nuclear Technologies LLP; Director Emeritus of the Armed Services YMCA; Member of the National Security Advisory Council of the Center for U.S. Global Engagement and a member of the CNA Military Advisory Board; Trustee of Fairhaven United Methodist Church; Member of the Board of Advisors of the Dolphin Scholarship Foundation; Director of other various non-profit organizations; formerly, Director of BP p.l.c. (November 2010-May 2019). | |
Kathleen A. Dennis
c/o Perkins Coie LLP
Counsel to the Independent Directors
1155 Avenue of the Americas
New York, NY 10036
Birth Year 1953 | | Director | | Since August 2006 | | President, Cedarwood Associates (mutual fund and investment management consulting) (since July 2006); Chairperson of the Liquidity and Alternatives Sub-Committee of the Investment Committee (since October 2006) and Director or Trustee of various Morgan Stanley Funds (since August 2006); formerly, Senior Managing Director of Victory Capital Management (1993-2006). | | | 86 | | | Director of various non-profit organizations. | |
Nancy C. Everett
c/o Perkins Coie LLP
Counsel to the Independent Directors
1155 Avenue of the Americas
New York, NY 10036
Birth Year 1955 | | Director | | Since January 2015 | | Chief Executive Officer, Virginia Commonwealth University Investment Company (since November 2015); Owner, OBIR, LLC (institutional investment management consulting) (since June 2014); formerly, Managing Director, BlackRock, Inc. (February 2011-December 2013); and Chief Executive Officer, General Motors Asset Management (a/k/a Promark Global Advisors, Inc.) (June 2005-May 2010). | | | 87 | | | Formerly, Member of Virginia Commonwealth University School of Business Foundation (2005-2016); Member of Virginia Commonwealth University Board of Visitors (2013-2015); Member of Committee on Directors for Emerging Markets Growth Fund, Inc. (2007-2010); Chairperson of Performance Equity Management, LLC (2006-2010); and Chairperson, GMAM Absolute Return Strategies Fund, LLC (2006-2010). | |
39
Morgan Stanley Institutional Fund, Inc.
Annual Report — December 31, 2019
Director and Officer Information (unaudited) (cont'd)
Independent Directors: (cont'd)
Name, Birth Year
and Address of
Independent Director | | Position(s)
Held with
Registrant | | Length of Time
Served* | | Principal Occupation(s) During Past 5 Years
and Other Relevant Professional Experience | | Number of
Funds in
Fund Complex
Overseen by
Independent
Director** | | Other Directorships
Held by Independent
Director*** | |
Jakki L. Haussler
c/o Perkins Coie LLP
Counsel to the Independent Directors
1155 Avenue of the Americas
New York, NY 10036
Birth Year 1957 | | Director | | Since January 2015 | | Chairman, Opus Capital Group (since 1996); formerly, Chief Executive Officer, Opus Capital Group (1996-2019); Director, Capvest Venture Fund, LP (May 2000-December 2011); Partner, Adena Ventures, LP (July 1999-December 2010); Director, The Victory Funds (February 2005-July 2008). | | | 87 | | | Director of Service Corporation International and Member, Audit Committee and Investment Committee; Director of Cincinnati Bell Inc. and Member, Audit Committee and Governance and Nominating Committee; Chairman of Northern Kentucky University Member Investment Committee; Member of Chase College of Law Transactional Law Practice Center Board of Advisors; Director of Best Transport; Director of Chase College of Law Board of Visitors; formerly, Member, University of Cincinnati Foundation Investment Committee; Member, Miami University Board of Visitors (2008-2011); Trustee of Victory Funds (2005-2008) and Chairman, Investment Committee (2007-2008) and Member, Service Provider Committee (2005-2008). | |
Dr. Manuel H. Johnson
c/o Johnson Smick International, Inc.
220 I Street, NE — Suite 200
Washington, D.C. 20002
Birth Year 1949 | | Director | | Since July 1991 | | Senior Partner, Johnson Smick International, Inc. (consulting firm); Chairperson of the Investment Committee (since October 2006) and Director or Trustee of various Morgan Stanley Funds (since July 1991); Co-Chairman and a founder of the Group of Seven Council (G7C) (international economic commission); formerly, Chairperson of the Audit Committee (July 1991-September 2006), Vice Chairman of the Board of Governors of the Federal Reserve System and Assistant Secretary of the U.S. Treasury. | | | 86 | | | Director of NVR, Inc. (home construction). | |
Joseph J. Kearns
c/o Perkins Coie LLP
Counsel to the Independent Directors
1155 Avenue of the Americas
New York, NY 10036
Birth Year 1942 | | Director | | Since August 1994 | | Senior Adviser, Kearns & Associates LLC (investment consulting); Chairperson of the Audit Committee (since October 2006) and Director or Trustee of various Morgan Stanley Funds (since August 1994); formerly, Deputy Chairperson of the Audit Committee (July 2003-September 2006) and Chairperson of the Audit Committee of various Morgan Stanley Funds (since August 1994); CFO of the J. Paul Getty Trust. | | | 87 | | | Prior to August 10, 2016, Director of Electro Rent Corporation (equipment leasing); Prior to December 31, 2013, Director of The Ford Family Foundation. | |
40
Morgan Stanley Institutional Fund, Inc.
Annual Report — December 31, 2019
Director and Officer Information (unaudited) (cont'd)
Independent Directors: (cont'd)
Name, Birth Year
and Address of
Independent Director | | Position(s)
Held with
Registrant | | Length of Time
Served* | | Principal Occupation(s) During Past 5 Years
and Other Relevant Professional Experience | | Number of
Funds in
Fund Complex
Overseen by
Independent
Director** | | Other Directorships
Held by Independent
Director*** | |
Michael F. Klein
c/o Perkins Coie LLP
Counsel to the Independent Directors
1155 Avenue of the Americas
New York, NY 10036
Birth Year 1958 | | Director | | Since August 2006 | | Managing Director, Aetos Alternatives Management, LP (since March 2000); Co-President, Aetos Alternatives Management, LP (since January 2004) and Co-Chief Executive Officer of Aetos Alternatives Management, LP (since August 2013); Chairperson of the Fixed Income Sub-Committee of the Investment Committee (since October 2006) and Director or Trustee of various Morgan Stanley Funds (since August 2006); formerly, Managing Director, Morgan Stanley & Co. Inc. and Morgan Stanley Dean Witter Investment Management and President, various Morgan Stanley Funds (June 1998-March 2000); Principal, Morgan Stanley & Co. Inc. and Morgan Stanley Dean Witter Investment Management (August 1997-December 1999). | | | 86 | | | Director of certain investment funds managed or sponsored by Aetos Alternatives Management, LP; Director of Sanitized AG and Sanitized Marketing AG (specialty chemicals). | |
Patricia Maleski
c/o Perkins Coie LLP
Counsel to the Independent Directors
1155 Avenue of the Americas
New York, NY 10036
Birth Year 1960 | | Director | | Since January 2017 | | Managing Director, JPMorgan Asset Management (2004-2016); Oversight and Control Head of Fiduciary and Conflicts of Interest Program (2015-2016); Chief Control Officer-Global Asset Management (2013-2015); President, JPMorgan Funds (2010-2013); Chief Administrative Officer (2004-2013); various other positions including Treasurer and Board Liaison (since 2001). | | | 87 | | | None. | |
Michael E. Nugent
522 Fifth Avenue
New York, NY 10036
Birth Year 1936 | | Chair of the Board and Director | | Chair of the Boards since July 2006 and Director since July 1991 | | Chair of the Boards of various Morgan Stanley Funds (since July 2006); Chairperson of the Governance Committee (since January 2019) and Director or Trustee of various Morgan Stanley Funds (since July 1991); formerly, Chairperson of each of the Closed-End Fund committee (until December 2019) and the Insurance Committee (until July 2006); General Partner, Triumph Capital, L.P. (private investment partnership) (1988-2013). | | | 86 | | | None. | |
W. Allen Reed
c/o Perkins Coie LLP
Counsel to the Independent Directors
1155 Avenue of the Americas
New York, NY 10036
Birth Year 1947 | | Vice Chair of the Board and Director | | Vice Chair of the Boards since January 2020 and Director since August 2006 | | Chairperson of the Equity Sub-Committee of the Investment Committee (since October 2006) and Director or Trustee of various Morgan Stanley Funds (since August 2006); formerly, President and CEO of General Motors Asset Management; Chairman and Chief Executive Officer of the GM Trust Bank and Corporate Vice President of General Motors Corporation (August 1994-December 2005). | | | 86 | | | Formerly, Director of Legg Mason, Inc.; formerly, Director of the Auburn University Foundation (2010-2015). | |
* This is the earliest date the Director began serving the Morgan Stanley Funds. Each Director serves an indefinite term, until his or her successor is elected.
** The Fund Complex includes (as of December 31, 2019) all open-end and closed-end funds (including all of their portfolios) advised by Morgan Stanley Investment Management Inc. (the "Adviser") and any funds that have an adviser that is an affiliated person of the Adviser (including, but not limited to, Morgan Stanley AIP GP LP).
*** This includes any directorships at public companies and registered investment companies held by the Director at any time during the past five years.
41
Morgan Stanley Institutional Fund, Inc.
Annual Report — December 31, 2019
Director and Officer Information (unaudited) (cont'd)
Executive Officers:
Name, Birth Year and Address of
Executive Officer | | Position(s) Held
with
Registrant | | Length of
Time Served* | | Principal Occupation(s) During Past 5 Years | |
John H. Gernon
522 Fifth Avenue
New York, NY 10036
Birth Year 1963 | | President and Principal Executive Officer | | Since September 2013 | | President and Principal Executive Officer of the Equity and Fixed Income Funds and the Morgan Stanley AIP Funds (since September 2013) and the Liquidity Funds and various money market funds (since May 2014) in the Fund Complex; Managing Director of the Adviser; Head of Product (since 2006). | |
Timothy J. Knierim
522 Fifth Avenue
New York, NY 10036
Birth Year 1959 | | Chief Compliance Officer | | Since December 2016 | | Managing Director of the Adviser and various entities affiliated with the Adviser; Chief Compliance Officer of various Morgan Stanley Funds and the Adviser (since December 2016) and Chief Compliance Officer of Morgan Stanley AIP GP LP (since 2014). Formerly, Managing Director and Deputy Chief Compliance Officer of the Adviser (2014-2016); and formerly, Chief Compliance Officer of Prudential Investment Management, Inc. (2007-2014). | |
Francis J. Smith
522 Fifth Avenue
New York, NY 10036
Birth Year 1965 | | Treasurer and Principal Financial Officer | | Treasurer since July 2003 and Principal Financial Officer since September 2002 | | Managing Director of the Adviser and various entities affiliated with the Adviser; Treasurer (since July 2003) and Principal Financial Officer of various Morgan Stanley Funds (since September 2002). | |
Mary E. Mullin
522 Fifth Avenue
New York, NY 10036
Birth Year 1967 | | Secretary | | Since June 1999 | | Managing Director of the Adviser; Secretary of various Morgan Stanley Funds (since June 1999). | |
Michael J. Key
522 Fifth Avenue
New York, NY 10036
Birth Year 1979 | | Vice President | | Since June 2017 | | Vice President of the Equity and Fixed Income Funds, Liquidity Funds, various money market funds and the Morgan Stanley AIP Funds in the Fund Complex (since June 2017); Executive Director of the Adviser; Head of Product Development for Equity and Fixed Income Funds (since August 2013). | |
* This is the earliest date the officer began serving the Morgan Stanley Funds. Each officer serves a one-year term, until his or her successor is elected and qualifies.
42
Morgan Stanley Institutional Fund, Inc.
Annual Report — December 31, 2019
Adviser and Administrator
Morgan Stanley Investment Management Inc.
522 Fifth Avenue
New York, New York 10036
Distributor
Morgan Stanley Distribution, Inc.
522 Fifth Avenue
New York, New York 10036
Dividend Disbursing and Transfer Agent
DST Asset Manager Solutions, Inc.
2000 Crown Colony Drive
Quincy, Massachusetts 02169
Custodian
State Street Bank and Trust Company
One Lincoln Street
Boston, Massachusetts 02111
Legal Counsel
Dechert LLP
1095 Avenue of the Americas
New York, New York 10036
Counsel to the Independent Directors
Perkins Coie LLP
1155 Avenue of the Americas
New York, New York 10036
Independent Registered Public Accounting Firm
Ernst & Young LLP
200 Clarendon Street
Boston, Massachusetts 02116
Reporting to Shareholders
Each Morgan Stanley fund provides a complete schedule of portfolio holdings in its Semi-Annual and the Annual Reports within 60 days of the end of the fund's second and fourth fiscal quarters. The Semi-Annual and Annual Reports are filed electronically with the Securities and Exchange Commission ("SEC") on Form N-CSRS and Form N-CSR, respectively. Morgan Stanley also delivers the Semi-Annual and Annual Reports to fund shareholders and makes these reports available on its public website, www.morganstanley.com/im/shareholderreports. Each Morgan Stanley non-money market fund also files a complete schedule of portfolio holdings with the SEC for the fund's first and third fiscal quarters as an attachment to Form N-PORT. Morgan Stanley does not deliver the reports for the first and third fiscal quarters to shareholders, nor are the reports posted to the Morgan Stanley public website. However, the holdings for each money market fund are posted to the Morgan Stanley public website. You may obtain the Form N-PORT filings (as well as the Form N-CSR and N-CSRS filings) by accessing the SEC's website, www.sec.gov. You can also request copies of these materials, upon payment of a duplicating fee, by electronic request at the SEC's email address (publicinfo@sec.gov).
Proxy Voting Policies and Procedures and Proxy Voting Record
You may obtain a copy of the Company's Proxy Voting Policy and Procedures and information regarding how the Company voted proxies relating to portfolio securities during the most recent twelve-month period ended June 30, without charge, upon request, by calling toll free 1 (800) 548-7786 or by visiting our website at www.morganstanley.com/im/shareholderreports. This information is also available on the SEC's website at www.sec.gov.
This report is authorized for distribution only when preceded or accompanied by a prospectus or summary prospectus of the applicable fund of Morgan Stanley Institutional Fund, Inc., which describes in detail the fund's investment policies, risks, fees and expenses. Please read the prospectus carefully before you invest or send money. For additional information, including information regarding the investments comprising the Fund, please visit our website at www.morganstanley.com/im/shareholderreports or call toll free 1 (800) 548-7786.
43
Printed in U.S.A.
This Report has been prepared for shareholders and may be distributed to others only if preceded or accompanied by a current prospectus.
Morgan Stanley Investment Management Inc.
522 Fifth Avenue
New York, New York 10036
© 2020 Morgan Stanley. Morgan Stanley Distribution, Inc.

IFIAIAANN
2918218 EXP. 02.28.21

Morgan Stanley Institutional Fund, Inc.
Advantage Portfolio
Annual Report
December 31, 2019
Beginning on January 1, 2021, as permitted by regulations adopted by the Securities and Exchange Commission ("SEC"), paper copies of the Fund's Annual and Semi-Annual Reports to Shareholders ("Shareholder Reports") will no longer be sent by mail, unless you specifically request paper copies of the Shareholder Reports from the Fund or from your financial intermediary, such as a broker-dealer or a bank. Instead, the Shareholder Reports will be made available on the Fund's website, https://www.morganstanley.com/im/shareholderreports and you will be notified by mail each time a Shareholder Report is posted and provided with a website link to access the Shareholder Report. If you already elected to receive Shareholder Reports electronically, you will not be affected by this change and you need not take any action. You may elect to receive Shareholder Reports and other communications from the Fund electronically anytime by contacting your financial intermediary or, if you are a direct investor, please follow the instructions on the envelope.
Beginning on January 1, 2019, you may elect to receive all future Shareholder Reports in paper free of charge. If you invest through a financial intermediary, you can contact your financial intermediary to request that you continue to receive paper copies of your Shareholder Reports. If you invest directly with the Fund, please follow the instructions on the envelope to let the Fund know you wish to continue receiving paper copies of your Shareholder Reports. Your election to receive Shareholder Reports in paper will apply to all funds held in your account if you invest through your financial intermediary or all funds held with the fund complex if you invest directly with a fund.

Morgan Stanley Institutional Fund, Inc.
Annual Report — December 31, 2019
Shareholders' Letter | | | 2 | | |
Expense Example | | | 3 | | |
Investment Overview | | | 4 | | |
Portfolio of Investments | | | 7 | | |
Statement of Assets and Liabilities | | | 9 | | |
Statement of Operations | | | 11 | | |
Statements of Changes in Net Assets | | | 12 | | |
Financial Highlights | | | 14 | | |
Notes to Financial Statements | | | 19 | | |
Report of Independent Registered Public Accounting Firm | | | 28 | | |
Federal Tax Notice | | | 29 | | |
Privacy Notice | | | 30 | | |
Director and Officer Information | | | 32 | | |
This report is authorized for distribution only when preceded or accompanied by a prospectus or summary prospectus of the applicable Fund of Morgan Stanley Institutional Fund, Inc. To receive a prospectus and/or statement of additional information ("SAI"), which contains more complete information such as investment objectives, charges, expenses, policies for voting proxies, risk considerations and describes in detail each of the Fund's investment policies to the prospective investor, please call toll free 1 (800) 548-7786. Please read the prospectuses carefully before you invest or send money.
Additionally, you can access information about the Fund, including performance, characteristics and investment team commentary, through Morgan Stanley Investment Management's website: www.morganstanley.com/im/shareholderreports.
Market forecasts provided in this report may not necessarily come to pass. There is no guarantee that any sectors mentioned will continue to perform as discussed herein or that securities in such sectors will be held by the Fund in the future. There is no assurance that a fund will achieve its investment objective. Funds are subject to market risk, which is the possibility that market values of securities owned by the Fund will decline and, therefore, the value of the Fund's shares may be less than what you paid for them. Accordingly, you can lose money investing in this Fund. Please see the prospectus for more complete information on investment risks.
1
Morgan Stanley Institutional Fund, Inc.
Annual Report — December 31, 2019
Shareholders' Letter (unaudited)
Dear Shareholders,
We are pleased to provide this Annual Report, in which you will learn how your investment in Advantage Portfolio (the "Fund") performed during the latest twelve-month period.
Morgan Stanley Investment Management is a client-centric, investor-led organization. Our global presence, intellectual capital, and breadth of products and services enable us to partner with investors to meet the evolving challenges of today's financial markets. We aim to deliver superior investment service and to empower our clients to make the informed decisions that help them reach their investment goals.
As always, we thank you for selecting Morgan Stanley Investment Management, and look forward to working with you in the months and years ahead.
Sincerely,

John H. Gernon
President and Principal Executive Officer
January 2020
2
Morgan Stanley Institutional Fund, Inc.
Annual Report — December 31, 2019
Expense Example (unaudited)
Advantage Portfolio
As a shareholder of the Fund, you incur two types of costs: (1) transactional costs; and (2) ongoing costs, which may include advisory fees, administration fees, distribution and shareholder services fees and other Fund expenses. This example is intended to help you understand your ongoing costs (in dollars) of investing in the Fund and to compare these costs with the ongoing costs of investing in other mutual funds.
This example is based on an investment of $1,000 invested at the beginning of the six-month period ended December 31, 2019 and held for the entire six-month period.
Actual Expenses
The table below provides information about actual account values and actual expenses. You may use the information in this table, together with the amount you invested, to estimate the expenses that you paid over the period. Simply divide your account value by $1,000 (for example, an $8,600 account value divided by $1,000 = 8.6), then multiply the result by the number in the table under the heading entitled "Actual Expenses Paid During Period" to estimate the expenses you paid on your account during this period.
Hypothetical Example for Comparison Purposes
The table below provides information about hypothetical account values and hypothetical expenses based on the Fund's actual expense ratio and an assumed rate of return of 5% per year before expenses, which is not the Fund's actual return. The hypothetical account values and expenses may not be used to estimate the actual ending account balance or expenses you paid for the period. You may use this information to compare the ongoing costs of investing in the Fund and other funds. To do so, compare this 5% hypothetical example with the 5% hypothetical examples that appear in the shareholder reports of the other funds.
Please note that the expenses shown in the table are meant to highlight your ongoing costs only and do not reflect any transactional costs, such as sales charges (loads). Therefore, the information for each class in the table is useful in comparing ongoing costs only, and will not help you determine the relative total costs of owning different funds. In addition, if these transactional costs were included, your costs would have been higher.
| | | Beginning
Account
Value
7/1/19 | | Actual Ending
Account
Value
12/31/19 | | Hypothetical
Ending Account
Value | | Actual
Expenses
Paid
During
Period* | | Hypothetical
Expenses Paid
During Period* | | Net
Expense
Ratio
During
Period** | |
Advantage Portfolio Class I | | $ | 1,000.00 | | | $ | 1,000.00 | | | $ | 1,020.97 | | | $ | 4.23 | | | $ | 4.28 | | | | 0.84 | % | |
Advantage Portfolio Class A | | | 1,000.00 | | | | 998.10 | | | | 1,019.16 | | | | 6.04 | | | | 6.11 | | | | 1.20 | | |
Advantage Portfolio Class L | | | 1,000.00 | | | | 999.30 | | | | 1,020.47 | | | | 4.74 | | | | 4.79 | | | | 0.94 | | |
Advantage Portfolio Class C | | | 1,000.00 | | | | 994.50 | | | | 1,015.53 | | | | 9.65 | | | | 9.75 | | | | 1.92 | | |
Advantage Portfolio Class IS | | | 1,000.00 | | | | 1,000.00 | | | | 1,021.17 | | | | 4.03 | | | | 4.08 | | | | 0.80 | | |
* Expenses are calculated using each Fund Class' annualized net expense ratio (as disclosed), multiplied by the average account value over the period and multiplied by 184/365 (to reflect the most recent one-half year period).
** Annualized.
3
Morgan Stanley Institutional Fund, Inc.
Annual Report — December 31, 2019
Investment Overview (unaudited)
Advantage Portfolio
The Fund seeks long-term capital appreciation.
Performance
For the fiscal year ended December 31, 2019, the Fund's Class I shares had a total return based on net asset value and reinvestment of distributions per share of 26.60%, net of fees. The Fund's Class I shares underperformed the Fund's benchmark, the Russell 1000® Growth Index (the "Index"), which returned 36.39%.
Please keep in mind that double-digit returns are highly unusual and cannot be sustained. Investors should also be aware that these returns were primarily achieved during favorable market conditions.
Factors Affecting Performance
• Easing geopolitical tensions, reduced recession fears and central bank support drove U.S. equities sharply higher over 2019. The U.S.-China trade war dampened the U.S. manufacturing sector and weighed on business confidence. However, consumers' resilience helped the U.S. economy maintain slow but steady growth. Acknowledging the downside risks to the economy, the U.S. Federal Reserve stopped raising its benchmark interest rate in the first half of the year, then cut rates three times to try to prolong the economic cycle. Volatility increased in 2019, but stock prices continued to rally higher, notably at year end when the U.S. and China announced a partial trade deal.
• U.S. large-cap growth stocks advanced during the year. Within the Index, information technology and communication services were the top-performing sectors for the year. All sectors had positive performance, with energy posting the smallest gain.
• Counterpoint Global seeks high quality companies, which we define primarily as those with sustainable competitive advantages. We manage concentrated portfolios that are highly differentiated from the benchmark, with securities weighted on our assessment of the quality of the company and our conviction. The value added or detracted in any period of time will result from stock selection, given our philosophy and process. For the year, the Fund underperformed the Index.
• The long-term investment horizon and conviction-weighted investment approach embraced by the team since 1998 can result in periods of performance deviation from the benchmark and peers. The Fund underperformed the Index in this reporting period due to unfavorable results from both stock selection and sector allocations.
• The Fund's stock selection in the information technology and communication services sectors was the main driver of relative underperformance. The Fund's lack of exposure or smaller exposure to some of the largest benchmark holdings in the two sectors weighed on relative performance as these index-heavyweights performed very strongly in 2019. This offset the relative gains produced by many of the information technology and communication services stocks the Fund did hold. A sector underweight in the information technology sector was also detrimental.
• Our stock selection in consumer discretionary was more favorable, however. Holdings in a France-based luxury goods maker and a Latin American e-commerce company were among the top contributing holdings in the sector and across the whole Fund. Additionally, a sector underweight in consumer staples was modestly beneficial to performance, as was stock selection in financials.
Management Strategies
• As a team, we believe having a market outlook can be an anchor. Our focus is on assessing company prospects over a five-year horizon, and owning a portfolio of unique companies whose market value we believe can increase significantly for underlying fundamental reasons.
4
Morgan Stanley Institutional Fund, Inc.
Annual Report — December 31, 2019
Investment Overview (unaudited) (cont'd)
Advantage Portfolio
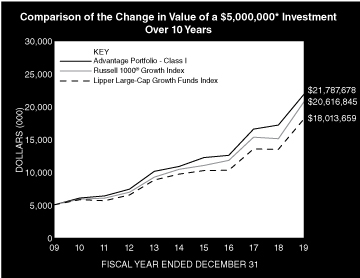
* Minimum Investment for Class I shares
In accordance with SEC regulations, the Fund's performance shown assumes that all recurring fees (including management fees) were deducted and all dividends and distributions were reinvested. The performance of Class A, L, C and IS shares will vary from the performance of Class I shares based upon their different inception dates and will be negatively impacted by additional fees assessed to those classes (if applicable).
Performance Compared to the Russell 1000® Growth Index(1) and the Lipper Large-Cap Growth Funds Index(2)
| | | Period Ended December 31, 2019
Total Returns(3) | |
| | | | | Average Annual | |
| | | One
Year | | Five
Years | | Ten
Years | | Since
Inception(7) | |
Fund — Class I Shares
w/o sales charges(4) | | | 26.60 | % | | | 14.95 | % | | | 15.86 | % | | | 12.92 | % | |
Fund — Class A Shares
w/o sales charges(4) | | | 26.20 | | | | 14.57 | | | | — | | | | 16.28 | | |
Fund — Class A Shares with
maximum 5.25% sales charges(4) | | | 19.56 | | | | 13.34 | | | | — | | | | 15.63 | | |
Fund — Class L Shares
w/o sales charges(4) | | | 26.44 | | | | 14.84 | | | | 15.77 | | | | 12.78 | | |
Fund — Class C Shares
w/o sales charges(6) | | | 25.27 | | | | — | | | | — | | | | 13.10 | | |
Fund — Class C Shares with
maximum 1.00% deferred
sales charges(6) | | | 24.27 | | | | — | | | | — | | | | 13.10 | | |
Fund — Class IS Shares
w/o sales charges(5) | | | 26.64 | | | | 15.00 | | | | — | | | | 15.58 | | |
Russell 1000® Growth Index | | | 36.39 | | | | 14.63 | | | | 15.22 | | | | 12.38 | | |
Lipper Large-Cap Growth
Funds Index | | | 33.56 | | | | 13.23 | | | | 13.67 | | | | 10.82 | | |
Performance data quoted represents past performance, which is no guarantee of future results, and current performance may be lower or higher than the figures shown. Performance assumes that all dividends and distributions, if any, were reinvested. For the most recent month-end performance figures, please visit www.morganstanley.com/im/shareholderreports. Investment return and principal value will fluctuate so that Fund shares, when redeemed, may be worth more or less than their original cost. Total returns do not reflect the deduction of taxes that a shareholder would pay on Fund distributions or the redemption of Fund shares. Performance of share classes will vary due to difference in sales charges and expenses.
(1) The Russell 1000® Growth Index measures the performance of the large-cap growth segment of the U.S. equity universe. It includes those Russell 1000® Index companies with higher price-to-book ratios and higher forecasted growth values. The Russell 1000® Index is an index of approximately 1,000 of the largest U.S. companies based on a combination of market capitalization and current index membership. The Index is unmanaged and its returns do not include any sales charges or fees. Such costs would lower performance. It is not possible to invest directly in an index.
(2) The Lipper Large-Cap Growth Funds Index is an equally weighted performance index of the largest qualifying funds (based on net assets) in the Lipper Large-Cap Growth Funds classification. The Index, which is adjusted for capital gains distributions and income dividends, is unmanaged and should not be considered an investment. There are currently 30 funds represented in this Index. As of the date of this report, the Fund was in the Lipper Large-Cap Growth Funds classification.
(3) Total returns for the Fund reflect fees waived and expenses reimbursed, if applicable, by the Adviser (as defined herein). Without such waivers and reimbursements, total returns would have been lower.
5
Morgan Stanley Institutional Fund, Inc.
Annual Report — December 31, 2019
Investment Overview (unaudited) (cont'd)
Advantage Portfolio
(4) On May 21, 2010 Class C and Class I shares of Van Kampen Core Growth Fund (the "Predecessor Fund") were reorganized into Class L and Class I shares of Morgan Stanley Advantage Portfolio (the "Fund"), respectively. Class L and Class I shares' returns of the Fund will differ from the Predecessor Fund as they have different expenses. Performance shown for the Fund's Class I and Class L shares reflects the performance of the shares of the Predecessor Fund for periods prior to May 21, 2010. The Class C and I shares of the Predecessor Fund commenced operations on June 30, 2008. Class P shares, which were renamed Class A shares effective September 9, 2013, commenced operations on May 21, 2010.
(5) Commenced offering on September 13, 2013.
(6) Commenced offering on April 30, 2015.
(7) For comparative purposes, average annual since inception returns listed for the Indexes refer to the inception date of Class I of the Fund, not the inception of the Index.
6
Morgan Stanley Institutional Fund, Inc.
Annual Report — December 31, 2019
Portfolio of Investments
Advantage Portfolio
| | | Shares | | Value
(000) | |
Common Stocks (93.8%) | |
Aerospace & Defense (1.3%) | |
HEICO Corp., Class A | | | 65,906 | | | $ | 5,901 | | |
Capital Markets (4.5%) | |
CME Group, Inc. | | | 32,388 | | | | 6,501 | | |
Intercontinental Exchange, Inc. | | | 70,950 | | | | 6,566 | | |
S&P Global, Inc. | | | 26,116 | | | | 7,131 | | |
| | | | 20,198 | | |
Chemicals (4.8%) | |
Ecolab, Inc. | | | 111,478 | | | | 21,514 | | |
Commercial Services & Supplies (4.5%) | |
Copart, Inc. (a) | | | 80,869 | | | | 7,354 | | |
Rollins, Inc. | | | 192,522 | | | | 6,384 | | |
Waste Connections, Inc. | | | 72,373 | | | | 6,571 | | |
| | | | 20,309 | | |
Containers & Packaging (1.5%) | |
Ball Corp. | | | 103,759 | | | | 6,710 | | |
Entertainment (7.5%) | |
Spotify Technology SA (a) | | | 113,944 | | | | 17,040 | | |
Walt Disney Co. (The) | | | 116,772 | | | | 16,889 | | |
| | | | 33,929 | | |
Health Care Equipment & Supplies (6.8%) | |
Danaher Corp. | | | 47,267 | | | | 7,255 | | |
Intuitive Surgical, Inc. (a) | | | 40,190 | | | | 23,758 | | |
| | | | 31,013 | | |
Health Care Technology (3.5%) | |
Veeva Systems, Inc., Class A (a) | | | 113,475 | | | | 15,961 | | |
Hotels, Restaurants & Leisure (2.0%) | |
Starbucks Corp. | | | 101,852 | | | | 8,955 | | |
Industrial Conglomerates (1.5%) | |
Roper Technologies, Inc. | | | 19,045 | | | | 6,746 | | |
Information Technology Services (12.3%) | |
Adyen N.V. (Netherlands) (a) | | | 8,456 | | | | 6,934 | | |
Broadridge Financial Solutions, Inc. | | | 53,604 | | | | 6,622 | | |
Gartner, Inc. (a) | | | 66,886 | | | | 10,307 | | |
Okta, Inc. (a) | | | 98,477 | | | | 11,361 | | |
Shopify, Inc., Class A (Canada) (a) | | | 40,956 | | | | 16,283 | | |
Twilio, Inc., Class A (a) | | | 44,611 | | | | 4,385 | | |
| | | | 55,892 | | |
Interactive Media & Services (7.8%) | |
Alphabet, Inc., Class C (a) | | | 8,806 | | | | 11,774 | | |
Facebook, Inc., Class A (a) | | | 32,384 | | | | 6,647 | | |
Twitter, Inc. (a) | | | 533,229 | | | | 17,090 | | |
| | | | 35,511 | | |
Internet & Direct Marketing Retail (9.0%) | |
Amazon.com, Inc. (a) | | | 16,274 | | | | 30,072 | | |
MercadoLibre, Inc. (a) | | | 19,058 | | | | 10,900 | | |
| | | | 40,972 | | |
Personal Products (1.6%) | |
Estee Lauder Cos., Inc. (The), Class A | | | 34,186 | | | | 7,061 | | |
| | | Shares | | Value
(000) | |
Pharmaceuticals (2.7%) | |
Zoetis, Inc. | | | 92,089 | | | $ | 12,188 | | |
Professional Services (1.5%) | |
Verisk Analytics, Inc. | | | 45,451 | | | | 6,788 | | |
Road & Rail (2.6%) | |
Union Pacific Corp. | | | 65,691 | | | | 11,876 | | |
Software (16.9%) | |
Atlassian Corp. PLC, Class A (United Kingdom) (a) | | | 54,116 | | | | 6,512 | | |
Autodesk, Inc. (a) | | | 39,604 | | | | 7,266 | | |
Coupa Software, Inc. (a) | | | 76,958 | | | | 11,255 | | |
Intuit, Inc. | | | 25,722 | | | | 6,737 | | |
ServiceNow, Inc. (a) | | | 87,695 | | | | 24,758 | | |
Workday, Inc., Class A (a) | | | 121,720 | | | | 20,017 | | |
| | | | 76,545 | | |
Textiles, Apparel & Luxury Goods (1.5%) | |
LVMH Moet Hennessy Louis Vuitton SE (France) | | | 14,294 | | | | 6,641 | | |
Total Common Stocks (Cost $346,716) | | | 424,710 | | |
Short-Term Investment (6.7%) | |
Investment Company (6.7%) | |
Morgan Stanley Institutional Liquidity
Funds — Treasury Securities Portfolio —
Institutional Class (See Note G)
(Cost $30,479) | | | 30,479,059 | | | | 30,479 | | |
Total Investments Excluding Purchased Options
(100.5%) (Cost $377,195) | | | | | 455,189 | | |
Total Purchased Options Outstanding (0.0%)
(Cost $1,100) | | | 139 | | |
Total Investments (100.5%) (Cost $378,295) (b) | | | 455,328 | | |
Liabilities in Excess of Other Assets (–0.5%) | | | (2,342 | ) | |
Net Assets (100.0%) | | $ | 452,986 | | |
(a) Non-income producing security.
(b) At December 31, 2019, the aggregate cost for federal income tax purposes is approximately $379,545,000. The aggregate gross unrealized appreciation is approximately $79,938,000 and the aggregate gross unrealized depreciation is approximately $4,155,000, resulting in net unrealized appreciation of approximately $75,783,000.
The accompanying notes are an integral part of the financial statements.
7
Morgan Stanley Institutional Fund, Inc.
Annual Report — December 31, 2019
Portfolio of Investments (cont'd)
Advantage Portfolio
Call Options Purchased:
The Fund had the following call options purchased open at December 31, 2019:
Counterparty | | Description | | Strike
Price | | Expiration
Date | | Number of
Contracts | | Notional
Amount
(000) | | Value
(000) | | Premiums
Paid
(000) | | Unrealized
Depreciation
(000) | |
BNP Paribas | | USD/CNH | | CNH | 7.58 | | | Jan-20 | | | 54,647,487 | | | | 54,647 | | | $ | — | @ | | $ | 280 | | | $ | (280 | ) | |
Royal Bank of Scotland | | USD/CNH | | CNH | 7.85 | | | Jun-20 | | | 73,805,968 | | | | 73,806 | | | | 49 | | | | 381 | | | | (332 | ) | |
Royal Bank of Scotland | | USD/CNH | | CNH | 8.09 | | | Sep-20 | | | 81,340,578 | | | | 81,341 | | | | 90 | | | | 439 | | | | (349 | ) | |
| | | | | | | | | | | | | $ | 139 | | | $ | 1,100 | | | $ | (961 | ) | |
@ Value is less than $500.
CNH — Chinese Yuan Renminbi Offshore
USD — United States Dollar
Portfolio Composition
Classification | | Percentage of
Total Investments | |
Other* | | | 33.1 | % | |
Software | | | 16.8 | | |
Information Technology Services | | | 12.3 | | |
Internet & Direct Marketing Retail | | | 9.0 | | |
Interactive Media & Services | | | 7.8 | | |
Entertainment | | | 7.5 | | |
Health Care Equipment & Supplies | | | 6.8 | | |
Short-Term Investments | | | 6.7 | | |
Total Investments | | | 100.0 | % | |
* Industries and/or investment types representing less than 5% of total investments.
The accompanying notes are an integral part of the financial statements.
8
Morgan Stanley Institutional Fund, Inc.
Annual Report — December 31, 2019
Statement of Assets and Liabilities | | December 31, 2019
(000) | |
Assets: | |
Investments in Securities of Unaffiliated Issuers, at Value (Cost $347,816) | | $ | 424,849 | | |
Investment in Security of Affiliated Issuer, at Value (Cost $30,479) | | | 30,479 | | |
Total Investments in Securities, at Value (Cost $378,295) | | | 455,328 | | |
Foreign Currency, at Value (Cost $1) | | | 1 | | |
Receivable for Fund Shares Sold | | | 1,119 | | |
Dividends Receivable | | | 280 | | |
Receivable from Affiliate | | | 27 | | |
Tax Reclaim Receivable | | | 21 | | |
Other Assets | | | 58 | | |
Total Assets | | | 456,834 | | |
Liabilities: | |
Payable for Investments Purchased | | | 2,186 | | |
Payable for Advisory Fees | | | 596 | | |
Due to Broker | | | 450 | | |
Payable for Fund Shares Redeemed | | | 399 | | |
Payable for Shareholder Services Fees — Class A | | | 17 | | |
Payable for Distribution and Shareholder Services Fees — Class L | | | — | @ | |
Payable for Distribution and Shareholder Services Fees — Class C | | | 35 | | |
Payable for Professional Fees | | | 50 | | |
Payable for Sub Transfer Agency Fees — Class I | | | 34 | | |
Payable for Sub Transfer Agency Fees — Class A | | | 8 | | |
Payable for Sub Transfer Agency Fees — Class L | | | — | @ | |
Payable for Sub Transfer Agency Fees — Class C | | | 5 | | |
Payable for Administration Fees | | | 30 | | |
Payable for Transfer Agency Fees — Class I | | | 2 | | |
Payable for Transfer Agency Fees — Class A | | | 1 | | |
Payable for Transfer Agency Fees — Class L | | | 1 | | |
Payable for Transfer Agency Fees — Class C | | | 2 | | |
Payable for Transfer Agency Fees — Class IS | | | — | @ | |
Payable for Custodian Fees | | | 5 | | |
Other Liabilities | | | 27 | | |
Total Liabilities | | | 3,848 | | |
Net Assets | | $ | 452,986 | | |
Net Assets Consist of: | |
Paid-in-Capital | | $ | 373,680 | | |
Total Distributable Earnings | | | 79,306 | | |
Net Assets | | $ | 452,986 | | |
The accompanying notes are an integral part of the financial statements.
9
Morgan Stanley Institutional Fund, Inc.
Annual Report — December 31, 2019
Statement of Assets and Liabilities (cont'd) | | December 31, 2019
(000) | |
CLASS I: | |
Net Assets | | $ | 296,843 | | |
| Shares Outstanding $0.001 par value shares of beneficial interest (unlimited shares authorized) (not in 000's) | | | 11,390,620 | | |
Net Asset Value, Offering and Redemption Price Per Share | | $ | 26.06 | | |
CLASS A: | |
Net Assets | | $ | 80,743 | | |
| Shares Outstanding $0.001 par value shares of beneficial interest (unlimited shares authorized) (not in 000's) | | | 3,176,449 | | |
Net Asset Value, Redemption Price Per Share | | $ | 25.42 | | |
Maximum Sales Load | | | 5.25 | % | |
Maximum Sales Charge | | $ | 1.41 | | |
Maximum Offering Price Per Share | | $ | 26.83 | | |
CLASS L: | |
Net Assets | | $ | 4,363 | | |
| Shares Outstanding $0.001 par value shares of beneficial interest (unlimited shares authorized) (not in 000's) | | | 168,110 | | |
Net Asset Value, Offering and Redemption Price Per Share | | $ | 25.95 | | |
CLASS C: | |
Net Assets | | $ | 42,054 | | |
| Shares Outstanding $0.001 par value shares of beneficial interest (unlimited shares authorized) (not in 000's) | | | 1,703,975 | | |
Net Asset Value, Offering and Redemption Price Per Share | | $ | 24.68 | | |
CLASS IS: | |
Net Assets | | $ | 28,983 | | |
| Shares Outstanding $0.001 par value shares of beneficial interest (unlimited shares authorized) (not in 000's) | | | 1,109,420 | | |
Net Asset Value, Offering and Redemption Price Per Share | | $ | 26.12 | | |
@ Amount is less than $500.
The accompanying notes are an integral part of the financial statements.
10
Morgan Stanley Institutional Fund, Inc.
Annual Report — December 31, 2019
Statement of Operations | | Year Ended
December 31, 2019
(000) | |
Investment Income: | |
Dividends from Securities of Unaffiliated Issuers (Net of $87 of Foreign Taxes Withheld) | | $ | 2,046 | | |
Dividends from Security of Affiliated Issuer (Note G) | | | 415 | | |
Income from Securities Loaned — Net | | | 180 | | |
Total Investment Income | | | 2,641 | | |
Expenses: | |
Advisory Fees (Note B) | | | 2,487 | | |
Shareholder Services Fees — Class A (Note D) | | | 161 | | |
Distribution and Shareholder Services Fees — Class L (Note D) | | | 33 | | |
Distribution and Shareholder Services Fees — Class C (Note D) | | | 395 | | |
Sub Transfer Agency Fees — Class I | | | 262 | | |
Sub Transfer Agency Fees — Class A | | | 81 | | |
Sub Transfer Agency Fees — Class L | | | 2 | | |
Sub Transfer Agency Fees — Class C | | | 33 | | |
Administration Fees (Note C) | | | 306 | | |
Registration Fees | | | 129 | | |
Professional Fees | | | 99 | | |
Shareholder Reporting Fees | | | 36 | | |
Custodian Fees (Note F) | | | 24 | | |
Transfer Agency Fees — Class I (Note E) | | | 4 | | |
Transfer Agency Fees — Class A (Note E) | | | 6 | | |
Transfer Agency Fees — Class L (Note E) | | | 3 | | |
Transfer Agency Fees — Class C (Note E) | | | 7 | | |
Transfer Agency Fees — Class IS (Note E) | | | 2 | | |
Directors' Fees and Expenses | | | 14 | | |
Pricing Fees | | | 3 | | |
Reorganization Expense | | | 20 | | |
Other Expenses | | | 35 | | |
Expenses Before Non Operating Expenses | | | 4,142 | | |
Bank Overdraft Expense | | | 1 | | |
Total Expenses | | | 4,143 | | |
Reimbursement of Class Specific Expenses — Class I (Note B) | | | (169 | ) | |
Reimbursement of Class Specific Expenses — Class IS (Note B) | | | (2 | ) | |
Waiver of Advisory Fees (Note B) | | | (53 | ) | |
Rebate from Morgan Stanley Affiliate (Note G) | | | (40 | ) | |
Distribution Fees — Class L Shares Waived (Note D) | | | (31 | ) | |
Net Expenses | | | 3,848 | | |
Net Investment Loss | | | (1,207 | ) | |
Realized Gain (Loss): | |
Investments Sold | | | 14,613 | | |
Foreign Currency Translation | | | (5 | ) | |
Net Realized Gain | | | 14,608 | | |
Change in Unrealized Appreciation (Depreciation): | |
Investments | | | 59,736 | | |
Foreign Currency Translation | | | (1 | ) | |
Net Change in Unrealized Appreciation (Depreciation) | | | 59,735 | | |
Net Realized Gain and Change in Unrealized Appreciation (Depreciation) | | | 74,343 | | |
Net Increase in Net Assets Resulting from Operations | | $ | 73,136 | | |
The accompanying notes are an integral part of the financial statements.
11
Morgan Stanley Institutional Fund, Inc.
Annual Report — December 31, 2019
Statements of Changes in Net Assets | | Year Ended
December 31, 2019
(000) | | Year Ended
December 31, 2018
(000) | |
Increase (Decrease) in Net Assets: | |
Operations: | |
Net Investment Loss | | $ | (1,207 | ) | | $ | (339 | ) | |
Net Realized Gain | | | 14,608 | | | | 4,790 | | |
Net Change in Unrealized Appreciation (Depreciation) | | | 59,735 | | | | (8,649 | ) | |
Net Increase (Decrease) in Net Assets Resulting from Operations | | | 73,136 | | | | (4,198 | ) | |
Dividends and Distributions to Shareholders: | |
Class I | | | (5,355 | ) | | | (4,501 | ) | |
Class A | | | (1,499 | ) | | | (1,722 | ) | |
Class L | | | (82 | ) | | | (233 | ) | |
Class C | | | (792 | ) | | | (1,230 | ) | |
Class IS | | | (548 | ) | | | (1,253 | ) | |
Total Dividends and Distributions to Shareholders | | | (8,276 | ) | | | (8,939 | ) | |
Capital Share Transactions:(1) | |
Class I: | |
Subscribed | | | 196,712 | | | | 71,760 | | |
Issued due to a Tax-free Reorganization | | | — | | | | 74,516 | | |
Distributions Reinvested | | | 5,237 | | | | 4,501 | | |
Redeemed | | | (102,075 | ) | | | (40,550 | ) | |
Class A: | |
Subscribed | | | 52,689 | | | | 22,223 | | |
Issued due to a Tax-free Reorganization | | | — | | | | 12,842 | | |
Distributions Reinvested | | | 1,446 | | | | 1,722 | | |
Redeemed | | | (26,447 | ) | | | (15,270 | ) | |
Class L: | |
Issued due to a Tax-free Reorganization | | | — | | | | 107 | | |
Distributions Reinvested | | | 81 | | | | 233 | | |
Redeemed | | | (361 | ) | | | (618 | ) | |
Class C: | |
Subscribed | | | 16,430 | | | | 17,251 | | |
Issued due to a Tax-free Reorganization | | | — | | | | 9,885 | | |
Distributions Reinvested | | | 762 | | | | 1,228 | | |
Redeemed | | | (15,239 | ) | | | (5,204 | ) | |
Class IS: | |
Subscribed | | | 2,008 | | | | 10,421 | | |
Distributions Reinvested | | | 548 | | | | 1,252 | | |
Redeemed | | | (6,464 | ) | | | (1,534 | ) | |
Net Increase in Net Assets Resulting from Capital Share Transactions | | | 125,327 | | | | 164,765 | | |
Total Increase in Net Assets | | | 190,187 | | | | 151,628 | | |
Net Assets: | |
Beginning of Period | | | 262,799 | | | | 111,171 | | |
End of Period | | $ | 452,986 | | | $ | 262,799 | | |
The accompanying notes are an integral part of the financial statements.
12
Morgan Stanley Institutional Fund, Inc.
Annual Report — December 31, 2019
Statements of Changes in Net Assets (cont'd) | | Year Ended
December 31, 2019
(000) | | Year Ended
December 31, 2018
(000) | |
(1) Capital Share Transactions: | |
Class I: | |
Shares Subscribed | | | 7,750 | | | | 3,152 | | |
Shares Issued due to a Tax-free Reorganization | | | — | | | | 3,393 | | |
Shares Issued on Distributions Reinvested | | | 205 | | | | 203 | | |
Shares Redeemed | | | (4,038 | ) | | | (1,792 | ) | |
Net Increase in Class I Shares Outstanding | | | 3,917 | | | | 4,956 | | |
Class A: | |
Shares Subscribed | | | 2,101 | | | | 991 | | |
Shares Issued due to a Tax-free Reorganization | | | — | | | | 597 | | |
Shares Issued on Distributions Reinvested | | | 58 | | | | 79 | | |
Shares Redeemed | | | (1,074 | ) | | | (700 | ) | |
Net Increase in Class A Shares Outstanding | | | 1,085 | | | | 967 | | |
Class L: | |
Shares Issued due to a tax-free reorganization | | | — | | | | 5 | | |
Shares Issued on Distributions Reinvested | | | 3 | | | | 10 | | |
Shares Redeemed | | | (14 | ) | | | (26 | ) | |
Net Decrease in Class L Shares Outstanding | | | (11 | ) | | | (11 | ) | |
Class C: | |
Shares Subscribed | | | 675 | | | | 771 | | |
Shares Issued due to a Tax-free Reorganization | | | — | | | | 469 | | |
Shares Issued on Distributions Reinvested | | | 31 | | | | 58 | | |
Shares Redeemed | | | (629 | ) | | | (239 | ) | |
Net Increase in Class C Shares Outstanding | | | 77 | | | | 1,059 | | |
Class IS: | |
Shares Subscribed | | | 78 | | | | 461 | | |
Shares Issued on Distributions Reinvested | | | 21 | | | | 56 | | |
Shares Redeemed | | | (255 | ) | | | (68 | ) | |
Net Increase (Decrease) in Class IS Shares Outstanding | | | (156 | ) | | | 449 | | |
The accompanying notes are an integral part of the financial statements.
13
Morgan Stanley Institutional Fund, Inc.
Annual Report — December 31, 2019
Financial Highlights
Advantage Portfolio
| | | Class I | |
| | | Year Ended December 31, | |
Selected Per Share Data and Ratios | | 2019 | | 2018 | | 2017 | | 2016(1) | | 2015 | |
Net Asset Value, Beginning of Period | | $ | 20.98 | | | $ | 21.45 | | | $ | 17.47 | | | $ | 17.40 | | | $ | 16.83 | | |
Income (Loss) from Investment Operations: | |
Net Investment Income (Loss)(2) | | | (0.04 | ) | | | (0.01 | ) | | | 0.00 | (3) | | | 0.07 | | | | 0.01 | | |
Net Realized and Unrealized Gain | | | 5.61 | | | | 0.87 | | | | 5.57 | | | | 0.42 | | | | 2.11 | | |
Total from Investment Operations | | | 5.57 | | | | 0.86 | | | | 5.57 | | | | 0.49 | | | | 2.12 | | |
Distributions from and/or in Excess of: | |
Net Investment Income | | | — | | | | — | | | | — | | | | (0.04 | ) | | | (0.02 | ) | |
Net Realized Gain | | | (0.49 | ) | | | (1.33 | ) | | | (1.59 | ) | | | (0.38 | ) | | | (1.53 | ) | |
Total Distributions | | | (0.49 | ) | | | (1.33 | ) | | | (1.59 | ) | | | (0.42 | ) | | | (1.55 | ) | |
Net Asset Value, End of Period | | $ | 26.06 | | | $ | 20.98 | | | $ | 21.45 | | | $ | 17.47 | | | $ | 17.40 | | |
Total Return(4) | | | 26.60 | % | | | 3.74 | % | | | 32.06 | % | | | 2.82 | % | | | 12.56 | % | |
Ratios to Average Net Assets and Supplemental Data: | |
Net Assets, End of Period (Thousands) | | $ | 296,843 | | | $ | 156,782 | | | $ | 54,002 | | | $ | 42,695 | | | $ | 24,718 | | |
Ratio of Expenses Before Expense Limitation | | | 0.93 | % | | | 1.01 | % | | | 1.09 | % | | | 1.15 | % | | | 1.49 | % | |
Ratio of Expenses After Expense Limitation | | | 0.84 | %(5) | | | 0.84 | %(5) | | | 0.84 | %(5) | | | 0.84 | %(5) | | | 0.86 | %(5)(6) | |
Ratio of Expenses After Expense Limitation Excluding Non-Operating Expenses | | | 0.84 | %(5) | | | N/A | | | | N/A | | | | N/A | | | | N/A | | |
Ratio of Net Investment Income (Loss) | | | (0.15 | )%(5) | | | (0.02 | )%(5) | | | 0.02 | %(5) | | | 0.38 | %(5) | | | 0.06 | %(5) | |
Ratio of Rebate from Morgan Stanley Affiliates | | | 0.01 | % | | | 0.01 | % | | | 0.01 | % | | | 0.01 | % | | | 0.00 | %(7) | |
Portfolio Turnover Rate | | | 70 | % | | | 79 | % | | | 65 | % | | | 79 | % | | | 51 | % | |
(1) Reflects prior period custodian out-of-pocket expenses that were reimbursed in September 2016. The amount of the reimbursement was immaterial on a per share basis and did not impact the total return of Class I shares. The Ratio of Expenses After Expense Limitation and the Ratio of Net Investment Income would be unchanged as the reimbursement of custodian fees was offset against expense waivers/reimbursements with no impact to net expenses or net investment income.
(2) Per share amount is based on average shares outstanding.
(3) Amount is less than $0.005 per share.
(4) Calculated based on the net asset value as of the last business day of the period.
(5) The Ratio of Expenses After Expense Limitation and Ratio of Net Investment Income (Loss) reflect the rebate of certain Fund expenses in connection with the investments in Morgan Stanley affiliates during the period. The effect of the rebate on the ratios is disclosed in the above table as "Ratio of Rebate from Morgan Stanley Affiliates."
(6) Effective January 23, 2015, the Adviser has agreed to limit the ratio of expenses to average net assets to the maximum ratio of 0.85% for Class I shares. Prior to January 23, 2015, the maximum ratio was 1.05% for Class I shares.
(7) Amount is less than 0.005%.
The accompanying notes are an integral part of the financial statements.
14
Morgan Stanley Institutional Fund, Inc.
Annual Report — December 31, 2019
Financial Highlights
Advantage Portfolio
| | | Class A | |
| | | Year Ended December 31, | |
Selected Per Share Data and Ratios | | 2019 | | 2018 | | 2017 | | 2016(1) | | 2015 | |
Net Asset Value, Beginning of Period | | $ | 20.54 | | | $ | 21.10 | | | $ | 17.26 | | | $ | 17.22 | | | $ | 16.70 | | |
Income (Loss) from Investment Operations: | |
Net Investment Income (Loss)(2) | | | (0.13 | ) | | | (0.08 | ) | | | (0.06 | ) | | | 0.01 | | | | (0.06 | ) | |
Net Realized and Unrealized Gain | | | 5.50 | | | | 0.85 | | | | 5.49 | | | | 0.41 | | | | 2.11 | | |
Total from Investment Operations | | | 5.37 | | | | 0.77 | | | | 5.43 | | | | 0.42 | | | | 2.05 | | |
Distributions from and/or in Excess of: | |
Net Realized Gain | | | (0.49 | ) | | | (1.33 | ) | | | (1.59 | ) | | | (0.38 | ) | | | (1.53 | ) | |
Net Asset Value, End of Period | | $ | 25.42 | | | $ | 20.54 | | | $ | 21.10 | | | $ | 17.26 | | | $ | 17.22 | | |
Total Return(3) | | | 26.20 | % | | | 3.37 | % | | | 31.64 | % | | | 2.47 | % | | | 12.20 | % | |
Ratios to Average Net Assets and Supplemental Data: | |
Net Assets, End of Period (Thousands) | | $ | 80,743 | | | $ | 42,959 | | | $ | 23,715 | | | $ | 19,850 | | | $ | 11,939 | | |
Ratio of Expenses Before Expense Limitation | | | 1.21 | % | | | 1.29 | % | | | 1.39 | % | | | 1.43 | % | | | 1.87 | % | |
Ratio of Expenses After Expense Limitation | | | 1.19 | %(4) | | | 1.17 | %(4) | | | 1.19 | %(4) | | | 1.19 | %(4) | | | 1.18 | %(4)(5) | |
Ratio of Expenses After Expense Limitation Excluding Non-Operating Expenses | | | 1.19 | %(4) | | | N/A | | | | N/A | | | | N/A | | | | N/A | | |
Ratio of Net Investment Income (Loss) | | | (0.50 | )%(4) | | | (0.37 | )%(4) | | | (0.32 | )%(4) | | | 0.04 | %(4) | | | (0.31 | )%(4) | |
Ratio of Rebate from Morgan Stanley Affiliates | | | 0.01 | % | | | 0.01 | % | | | 0.01 | % | | | 0.01 | % | | | 0.01 | % | |
Portfolio Turnover Rate | | | 70 | % | | | 79 | % | | | 65 | % | | | 79 | % | | | 51 | % | |
(1) Reflects prior period custodian out-of-pocket expenses that were reimbursed in September 2016. The amount of the reimbursement was immaterial on a per share basis and did not impact the total return of Class A shares. The Ratio of Expenses After Expense Limitation and the Ratio of Net Investment Income would be unchanged as the reimbursement of custodian fees was offset against expense waivers/reimbursements with no impact to net expenses or net investment income.
(2) Per share amount is based on average shares outstanding.
(3) Calculated based on the net asset value which does not reflect sales charges, if applicable, as of the last business day of the period.
(4) The Ratio of Expenses After Expense Limitation and Ratio of Net Investment Income (Loss) reflect the rebate of certain Fund expenses in connection with the investments in Morgan Stanley affiliates during the period. The effect of the rebate on the ratios is disclosed in the above table as "Ratio of Rebate from Morgan Stanley Affiliates."
(5) Effective January 23, 2015, the Adviser has agreed to limit the ratio of expenses to average net assets to the maximum ratio of 1.20% for Class A shares. Prior to January 23, 2015, the maximum ratio was 1.40% for Class A shares.
The accompanying notes are an integral part of the financial statements.
15
Morgan Stanley Institutional Fund, Inc.
Annual Report — December 31, 2019
Financial Highlights
Advantage Portfolio
| | | Class L | |
| | | Year Ended December 31, | |
Selected Per Share Data and Ratios | | 2019 | | 2018 | | 2017 | | 2016(1) | | 2015 | |
Net Asset Value, Beginning of Period | | $ | 20.92 | | | $ | 21.42 | | | $ | 17.46 | | | $ | 17.40 | | | $ | 16.82 | | |
Income (Loss) from Investment Operations: | |
Net Investment Income (Loss)(2) | | | (0.06 | ) | | | (0.05 | ) | | | (0.02 | ) | | | 0.04 | | | | (0.01 | ) | |
Net Realized and Unrealized Gain | | | 5.58 | | | | 0.88 | | | | 5.57 | | | | 0.43 | | | | 2.12 | | |
Total from Investment Operations | | | 5.52 | | | | 0.83 | | | | 5.55 | | | | 0.47 | | | | 2.11 | | |
Distributions from and/or in Excess of: | |
Net Investment Income | | | — | | | | — | | | | — | | | | (0.03 | ) | | | — | | |
Net Realized Gain | | | (0.49 | ) | | | (1.33 | ) | | | (1.59 | ) | | | (0.38 | ) | | | (1.53 | ) | |
Total Distributions | | | (0.49 | ) | | | (1.33 | ) | | | (1.59 | ) | | | (0.41 | ) | | | (1.53 | ) | |
Net Asset Value, End of Period | | $ | 25.95 | | | $ | 20.92 | | | $ | 21.42 | | | $ | 17.46 | | | $ | 17.40 | | |
Total Return(3) | | | 26.44 | % | | | 3.61 | % | | | 31.96 | % | | | 2.72 | % | | | 12.47 | % | |
Ratios to Average Net Assets and Supplemental Data: | |
Net Assets, End of Period (Thousands) | | $ | 4,363 | | | $ | 3,751 | | | $ | 4,077 | | | $ | 3,684 | | | $ | 5,369 | | |
Ratio of Expenses Before Expense Limitation | | | 1.69 | % | | | 1.82 | % | | | 1.87 | % | | | 1.85 | % | | | 2.33 | % | |
Ratio of Expenses After Expense Limitation | | | 0.95 | %(4) | | | 0.98 | %(4) | | | 0.96 | %(4) | | | 0.91 | %(4) | | | 0.97 | %(4)(5) | |
Ratio of Expenses After Expense Limitation Excluding Non-Operating Expenses | | | 0.95 | %(4) | | | N/A | | | | N/A | | | | N/A | | | | N/A | | |
Ratio of Net Investment Income (Loss) | | | (0.25 | )%(4) | | | (0.21 | )%(4) | | | (0.10 | )%(4) | | | 0.26 | %(4) | | | (0.03 | )%(4) | |
Ratio of Rebate from Morgan Stanley Affiliates | | | 0.01 | % | | | 0.01 | % | | | 0.01 | % | | | 0.01 | % | | | 0.01 | % | |
Portfolio Turnover Rate | | | 70 | % | | | 79 | % | | | 65 | % | | | 79 | % | | | 51 | % | |
(1) Reflects prior period custodian out-of-pocket expenses that were reimbursed in September 2016. The amount of the reimbursement was immaterial on a per share basis and did not impact the total return of Class L shares. The Ratio of Expenses After Expense Limitation and the Ratio of Net Investment Income would be unchanged as the reimbursement of custodian fees was offset against expense waivers/reimbursements with no impact to net expenses or net investment income.
(2) Per share amount is based on average shares outstanding.
(3) Calculated based on the net asset value as of the last business day of the period.
(4) The Ratio of Expenses After Expense Limitation and Ratio of Net Investment Income (Loss) reflect the rebate of certain Fund expenses in connection with the investments in Morgan Stanley affiliates during the period. The effect of the rebate on the ratios is disclosed in the above table as "Ratio of Rebate from Morgan Stanley Affiliates."
(5) Effective January 23, 2015, the Adviser has agreed to limit the ratio of expenses to average net assets to the maximum ratio of 0.99% for Class L shares. Prior to January 23, 2015, the maximum ratio was 1.19% for Class L shares.
The accompanying notes are an integral part of the financial statements.
16
Morgan Stanley Institutional Fund, Inc.
Annual Report — December 31, 2019
Financial Highlights
Advantage Portfolio
| | | Class C | |
| | | Year Ended December 31, | | Period from
April 30, 2015(2) to | |
Selected Per Share Data and Ratios | | 2019 | | 2018 | | 2017 | | 2016(1) | | December 31, 2015 | |
Net Asset Value, Beginning of Period | | $ | 20.10 | | | $ | 20.82 | | | $ | 17.16 | | | $ | 17.25 | | | $ | 18.08 | | |
Income (Loss) from Investment Operations: | |
Net Investment Loss(3) | | | (0.29 | ) | | | (0.24 | ) | | | (0.20 | ) | | | (0.12 | ) | | | (0.14 | ) | |
Net Realized and Unrealized Gain | | | 5.36 | | | | 0.85 | | | | 5.45 | | | | 0.41 | | | | 0.86 | | |
Total from Investment Operations | | | 5.07 | | | | 0.61 | | | | 5.25 | | | | 0.29 | | | | 0.72 | | |
Distributions from and/or in Excess of: | |
Net Investment Income | | | — | | | | — | | | | — | | | | — | | | | (0.02 | ) | |
Net Realized Gain | | | (0.49 | ) | | | (1.33 | ) | | | (1.59 | ) | | | (0.38 | ) | | | (1.53 | ) | |
Total Distributions | | | (0.49 | ) | | | (1.33 | ) | | | (1.59 | ) | | | (0.38 | ) | | | (1.55 | ) | |
Net Asset Value, End of Period | | $ | 24.68 | | | $ | 20.10 | | | $ | 20.82 | | | $ | 17.16 | | | $ | 17.25 | | |
Total Return(4) | | | 25.27 | % | | | 2.64 | % | | | 30.77 | % | | | 1.71 | % | | | 3.91 | %(6) | |
Ratios to Average Net Assets and Supplemental Data: | |
Net Assets, End of Period (Thousands) | | $ | 42,054 | | | $ | 32,706 | | | $ | 11,835 | | | $ | 6,376 | | | $ | 1,776 | | |
Ratio of Expenses Before Expense Limitation | | | 1.93 | % | | | 2.00 | % | | | 2.10 | % | | | 2.20 | % | | | 2.83 | %(7) | |
Ratio of Expenses After Expense Limitation | | | 1.90 | %(5) | | | 1.88 | %(5) | | | 1.90 | %(5) | | | 1.94 | %(5) | | | 1.94 | %(5)(7) | |
Ratio of Expenses After Expense Limitation Excluding Non-Operating Expenses | | | 1.90 | %(5) | | | N/A | | | | N/A | | | | N/A | | | | N/A | | |
Ratio of Net Investment Loss | | | (1.20 | )%(5) | | | (1.08 | )%(5) | | | (1.01 | )%(5) | | | (0.72 | )%(5) | | | (1.15 | )%(5)(7) | |
Ratio of Rebate from Morgan Stanley Affiliates | | | 0.01 | % | | | 0.01 | % | | | 0.01 | % | | | 0.01 | % | | | 0.01 | %(7) | |
Portfolio Turnover Rate | | | 70 | % | | | 79 | % | | | 65 | % | | | 79 | % | | | 51 | % | |
(1) Reflects prior period custodian out-of-pocket expenses that were reimbursed in September 2016. The amount of the reimbursement was immaterial on a per share basis and did not impact the total return of Class C shares. The Ratio of Expenses After Expense Limitation and the Ratio of Net Investment Loss would be unchanged as the reimbursement of custodian fees was offset against expense waivers/reimbursements with no impact to net expenses or net investment loss.
(2) Commencement of Offering.
(3) Per share amount is based on average shares outstanding.
(4) Calculated based on the net asset value which does not reflect sales charges, if applicable, as of the last business day of the period.
(5) The Ratio of Expenses After Expense Limitation and Ratio of Net Investment Loss reflect the rebate of certain Fund expenses in connection with the investments in Morgan Stanley affiliates during the period. The effect of the rebate on the ratios is disclosed in the above table as "Ratio of Rebate from Morgan Stanley Affiliates."
(6) Not annualized.
(7) Annualized.
The accompanying notes are an integral part of the financial statements.
17
Morgan Stanley Institutional Fund, Inc.
Annual Report — December 31, 2019
Financial Highlights
Advantage Portfolio
| | | Class IS | |
| | | Year Ended December 31, | |
Selected Per Share Data and Ratios | | 2019 | | 2018 | | 2017 | | 2016(1) | | 2015 | |
Net Asset Value, Beginning of Period | | $ | 21.02 | | | $ | 21.49 | | | $ | 17.48 | | | $ | 17.42 | | | $ | 16.84 | | |
Income (Loss) from Investment Operations: | |
Net Investment Income (Loss)(2) | | | (0.03 | ) | | | (0.01 | ) | | | 0.01 | | | | 0.08 | | | | 0.02 | | |
Net Realized and Unrealized Gain | | | 5.62 | | | | 0.87 | | | | 5.59 | | | | 0.41 | | | | 2.11 | | |
Total from Investment Operations | | | 5.59 | | | | 0.86 | | | | 5.60 | | | | 0.49 | | | | 2.13 | | |
Distributions from and/or in Excess of: | |
Net Investment Income | | | — | | | | — | | | | — | | | | (0.05 | ) | | | (0.02 | ) | |
Net Realized Gain | | | (0.49 | ) | | | (1.33 | ) | | | (1.59 | ) | | | (0.38 | ) | | | (1.53 | ) | |
Total Distributions | | | (0.49 | ) | | | (1.33 | ) | | | (1.59 | ) | | | (0.43 | ) | | | (1.55 | ) | |
Net Asset Value, End of Period | | $ | 26.12 | | | $ | 21.02 | | | $ | 21.49 | | | $ | 17.48 | | | $ | 17.42 | | |
Total Return(3) | | | 26.64 | % | | | 3.74 | % | | | 32.22 | % | | | 2.79 | % | | | 12.65 | % | |
Ratios to Average Net Assets and Supplemental Data: | |
Net Assets, End of Period (Thousands) | | $ | 28,983 | | | $ | 26,601 | | | $ | 17,542 | | | $ | 13,273 | | | $ | 12 | | |
Ratio of Expenses Before Expense Limitation | | | 0.83 | % | | | 0.93 | % | | | 1.01 | % | | | 1.05 | % | | | 14.53 | % | |
Ratio of Expenses After Expense Limitation | | | 0.80 | %(4) | | | 0.80 | %(4) | | | 0.80 | %(4) | | | 0.80 | %(4) | | | 0.82 | %(4)(5) | |
Ratio of Expenses After Expense Limitation Excluding Non-Operating Expenses | | | 0.80 | %(4) | | | N/A | | | | N/A | | | | N/A | | | | N/A | | |
Ratio of Net Investment Income (Loss) | | | (0.10 | )%(4) | | | (0.04 | )%(4) | | | 0.07 | %(4) | | | 0.46 | %(4) | | | 0.10 | %(4) | |
Ratio of Rebate from Morgan Stanley Affiliates | | | 0.01 | % | | | 0.01 | % | | | 0.01 | % | | | 0.01 | % | | | 0.00 | %(6) | |
Portfolio Turnover Rate | | | 70 | % | | | 79 | % | | | 65 | % | | | 79 | % | | | 51 | % | |
(1) Reflects prior period custodian out-of-pocket expenses that were reimbursed in September 2016. The amount of the reimbursement was immaterial on a per share basis and did not impact the total return of Class IS shares. The Ratio of Expenses After Expense Limitation and the Ratio of Net Investment Income would be unchanged as the reimbursement of custodian fees was offset against expense waivers/reimbursements with no impact to net expenses or net investment income.
(2) Per share amount is based on average shares outstanding.
(3) Calculated based on the net asset value as of the last business day of the period.
(4) The Ratio of Expenses After Expense Limitation and Ratio of Net Investment Income (Loss) reflect the rebate of certain Fund expenses in connection with the investments in Morgan Stanley affiliates during the period. The effect of the rebate on the ratios is disclosed in the above table as "Ratio of Rebate from Morgan Stanley Affiliates."
(5) Effective January 23, 2015, the Adviser has agreed to limit the ratio of expenses to average net assets to the maximum ratio of 0.81% for Class IS shares. Prior to January 23, 2015, the maximum ratio was 1.01% for Class IS shares.
(6) Amount is less than 0.005%.
The accompanying notes are an integral part of the financial statements.
18
Morgan Stanley Institutional Fund, Inc.
Annual Report — December 31, 2019
Notes to Financial Statements
Morgan Stanley Institutional Fund, Inc. (the "Company") is registered under the Investment Company Act of 1940, as amended (the "Act"), as an open-end management investment company. The Company is comprised of thirty-two separate, active, diversified and non-diversified funds (individually referred to as a "Fund," collectively as the "Funds"). The Company applies investment company accounting and reporting guidance.
The accompanying financial statements relate to the Advantage Portfolio. The Fund seeks long-term capital appreciation.
The Fund offers five classes of shares — Class I, Class A, Class L, Class C and Class IS. On April 30, 2015, the Fund suspended offering of Class L shares. Existing Class L shareholders may invest through reinvestment of dividends and distributions.
On November 16, 2018, the Fund acquired the net assets of the Company's Insight Portfolio ("Insight"), an open-end investment company, based on the respective valuations as of the close of business on November 16, 2018, pursuant to a Plan of Reorganization approved by the shareholders of Insight on October 17, 2018 ("Reorganization"). The purpose of the transaction was to combine two portfolios managed by Morgan Stanley Investment Management Inc., (the "Adviser") with comparable investment objectives and strategies. The acquisition was accomplished by a tax-free exchange of 3,393,240 Class I shares of the Fund at a net asset value ("NAV") of $21.96 for 4,949,201 Class I shares of Insight; 597,044 Class A shares of the Fund at a NAV of $21.51 for 860,147 Class A shares of Insight; 4,867 Class L shares of the Fund at a NAV of $21.90 for 7,388 Class L shares of Insight; 469,147 Class C shares of the Fund at a NAV of $21.07 for 691,884 Class C shares of Insight. The net assets of Insight before the Reorganization were approximately $97,349,000, including unrealized appreciation (depreciation) of approximately $(29,000) at November 16, 2018. The investment portfolio of Insight, with a fair value of approximately $97,367,000 and identified cost of approximately $97,396,000, on November 16, 2018, was the principal asset acquired by the Fund. For financial reporting purposes, assets received and shares issued by the Fund were recorded at fair value; however, the cost basis of the investments received from Insight was carried forward to align ongoing reporting of the Fund's realized and unrealized gains and losses with amounts distributable to shareholders for tax purposes. Immediately prior to the Reorganization, the net assets of the Fund were approximately $160,556,000.
Immediately after the Reorganization, the net assets of the Fund were approximately $257,906,000.
Upon closing of the Reorganization, shareholders of Insight received shares of the Fund as follows:
| Insight Portfolio | | Advantage Portfolio | |
| Class I | | Class I | |
| Class A | | Class A | |
| Class L | | Class L | |
| Class C | | Class C | |
Assuming the acquisition had been completed on January 1, 2018, the beginning of the annual reporting period of the Fund, the Fund's pro-forma results of operations for the year ended December 31, 2018, are approximately as follows:
Net investment income(1) | | $ | 1,964,000 | | |
Net realized gain and unrealized gain(2) | | $ | 861,000 | | |
Net increase in net assets resulting from operations | | $ | 2,825,000 | | |
(1) Approximately $(339,000) as reported, plus approximately $1,183,000 Insight prior to the Reorganization, plus approximately $1,120,000 of estimated pro-forma eliminated expenses.
(2) Approximately $(3,859,000) as reported, plus approximately $4,720,000 Insight prior to the Reorganization.
Because the combined investment portfolios have been managed as a single integrated portfolio since the acquisition was completed, it is not practicable to separate the amounts of revenue and earnings of Insight that have been included in the Fund's Statement of Operations since November 16, 2018.
A. Significant Accounting Policies: The following significant accounting policies are in conformity with U.S. generally accepted accounting principles ("GAAP"). Such policies are consistently followed by the Company in the preparation of its financial statements. GAAP may require management to make estimates and assumptions that affect the reported amounts and disclosures in the financial statements. Actual results may differ from those estimates.
In August 2018, the Financial Accounting Standards Board ("FASB") issued Accounting Standards Update ("ASU") 2018-13, Fair Value Measurement (Topic 820) — Disclosures Framework — Changes to Disclosure Requirements of Fair Value Measurement ("ASU 2018-13") which introduces new fair value disclosure requirements as well as eliminates and modifies certain existing fair value disclosure requirements. ASU 2018-13 would be effective for fiscal years beginning after December 15, 2019 and for interim periods within those fiscal years; however, management has elected to early adopt ASU 2018-13 as permitted by the standard. The impact of the Fund's adoption was limited to changes in the Fund's financial statement disclosures regarding fair value,
19
Morgan Stanley Institutional Fund, Inc.
Annual Report — December 31, 2019
Notes to Financial Statements (cont'd)
primarily those disclosures related to transfers between levels of the fair value hierarchy and disclosure of the range and weighted average used to develop significant unobservable inputs for Level 3 fair value measurements, when applicable.
1. Security Valuation: (1) An equity portfolio security listed or traded on an exchange is valued at its latest reported sales price (or at the exchange official closing price if such exchange reports an official closing price), and if there were no sales on a given day and if there is no official exchange closing price for that day, the security is valued at the mean between the last reported bid and asked prices if such bid and asked prices are available on the relevant exchanges. If only bid prices are available then the latest bid price may be used. Listed equity securities not traded on the valuation date with no reported bid and asked prices available on the exchange are valued at the mean between the current bid and asked prices obtained from one or more reputable brokers or dealers. In cases where a security is traded on more than one exchange, the security is valued on the exchange designated as the primary market; (2) all other equity portfolio securities for which over-the-counter ("OTC") market quotations are readily available are valued at the latest reported sales price (or at the market official closing price if such market reports an official closing price), and if there was no trading in the security on a given day and if there is no official closing price from relevant markets for that day, the security is valued at the mean between the last reported bid and asked prices if such bid and asked prices are available on the relevant markets. An unlisted equity security that does not trade on the valuation date and for which bid and asked prices from the relevant markets are unavailable is valued at the mean between the current bid and asked prices obtained from one or more reputable brokers or dealers; (3) listed options are valued at the last reported sales price on the exchange on which they are listed (or at the exchange official closing price if such exchange reports an official closing price). If an official closing price or last reported sales price is unavailable, the listed option should be fair valued at the mean between its latest bid and ask prices. Unlisted options are valued at the mean between their latest bid and ask prices from a broker/dealer or valued by a pricing service/vendor; (4) certain portfolio securities may be valued by an outside pricing service/vendor approved by the Company's Board of Directors (the "Directors"). The pricing service/vendor may employ a pricing model that
takes into account, among other things, bids, yield spreads and/or other market data and specific security characteristics. Alternatively, if a valuation is not available from an outside pricing service/vendor, and the security trades on an exchange, the security may be valued at its latest reported sale price (or at the exchange official closing price if such exchange reports an official closing price), prior to the time when assets are valued. If there are no sales on a given day and if there is no official exchange closing price for that day, the security is valued at the mean between the last reported bid and asked prices if such bid and asked prices are available in the relevant exchanges. If the Adviser, a wholly-owned subsidiary of Morgan Stanley, determines that the price provided by the outside pricing service/vendor or exchange does not reflect the security's fair value or is unable to provide a price, prices from brokers or dealers may also be utilized. In these circumstances, the value of the security will be the mean of bid and asked prices obtained from brokers or dealers; (5) when market quotations are not readily available, including circumstances under which the Adviser determines that the closing price, last sale price or the mean between the last reported bid and asked prices are not reflective of a security's market value, portfolio securities are valued at their fair value as determined in good faith under procedures established by and under the general supervision of the Directors. Occasionally, developments affecting the closing prices of securities and other assets may occur between the times at which valuations of such securities are determined (that is, close of the foreign market on which the securities trade) and the close of business of the New York Stock Exchange ("NYSE"). If developments occur during such periods that are expected to materially affect the value of such securities, such valuations may be adjusted to reflect the estimated fair value of such securities as of the close of the NYSE, as determined in good faith by the Directors or by the Adviser using a pricing service and/or procedures approved by the Directors; (6) quotations of foreign portfolio securities, other assets and liabilities and forward contracts stated in foreign currency are translated into U.S. dollar equivalents at the prevailing market rates prior to the close of the NYSE; and (7) investments in mutual funds, including the Morgan Stanley Institutional Liquidity Funds, are valued at the NAV as of the close of each business day.
20
Morgan Stanley Institutional Fund, Inc.
Annual Report — December 31, 2019
Notes to Financial Statements (cont'd)
The Directors have responsibility for determining in good faith the fair value of the investments, and the Directors may appoint others, such as the Company's Adviser or a valuation committee, to assist the Directors in determining fair value and to make the actual calculations pursuant to the fair valuation methodologies previously approved by the Directors. Under procedures approved by the Directors, the Company's Adviser has formed a Valuation Committee whose members are approved by the Directors. The Valuation Committee provides administration and oversight of the Company's valuation policies and procedures, which are reviewed at least annually by the Directors. These procedures allow the Company to utilize independent pricing services, quotations from securities and financial instrument dealers and other market sources to determine fair value.
2. Fair Value Measurement: FASB Accounting Standards CodificationTM ("ASC") 820, "Fair Value Measurement" ("ASC 820"), defines fair value as the value that the Fund would receive to sell an investment or pay to transfer a liability in a timely transaction with an independent buyer in the principal market, or in the absence of a principal market, the most advantageous market for the investment or liability. ASC 820 establishes a three-tier hierarchy to distinguish between (1) inputs that reflect the assumptions market participants would use in valuing an asset or liability developed based on market data obtained from sources independent of the reporting entity (observable inputs) and (2) inputs that reflect the reporting entity's own assumptions about the assumptions market participants would use in valuing an asset or liability developed based on the best information available in the circumstances (unobservable inputs) and to establish classification of fair value measurements for disclosure purposes. Various inputs are used in determining the value of the Fund's investments. The inputs are summarized in the three broad levels listed below:
• Level 1 – unadjusted quoted prices in active markets for identical investments
• Level 2 – other significant observable inputs (including quoted prices for similar investments, interest rates, prepayment speeds, credit risk, etc.)
• Level 3 – significant unobservable inputs including the Fund's own assumptions in determining the fair value of investments. Factors
considered in making this determination may include, but are not limited to, information obtained by contacting the issuer, analysts, or the appropriate stock exchange (for exchange-traded securities), analysis of the issuer's financial statements or other available documents and, if necessary, available information concerning other securities in similar circumstances.
The inputs or methodology used for valuing securities are not necessarily an indication of the risk associated with investing in those securities and the determination of the significance of a particular input to the fair value measurement in its entirety requires judgment and considers factors specific to each security.
The following is a summary of the inputs used to value the Fund's investments as of December 31, 2019:
Investment Type | | Level 1
Unadjusted
quoted
prices
(000) | | Level 2
Other
significant
observable
inputs
(000) | | Level 3
Significant
unobservable
inputs
(000) | | Total
(000) | |
Assets: | |
Common Stocks | |
Aerospace & Defense | | $ | 5,901 | | | $ | — | | | $ | — | | | $ | 5,901 | | |
Capital Markets | | | 20,198 | | | | — | | | | — | | | | 20,198 | | |
Chemicals | | | 21,514 | | | | — | | | | — | | | | 21,514 | | |
Commercial Services &
Supplies | | | 20,309 | | | | — | | | | — | | | | 20,309 | | |
Containers & Packaging | | | 6,710 | | | | — | | | | — | | | | 6,710 | | |
Entertainment | | | 33,929 | | | | — | | | | — | | | | 33,929 | | |
Health Care Equipment &
Supplies | | | 31,013 | | | | — | | | | — | | | | 31,013 | | |
Health Care Technology | | | 15,961 | | | | — | | | | — | | | | 15,961 | | |
Hotels, Restaurants &
Leisure | | | 8,955 | | | | — | | | | — | | | | 8,955 | | |
Industrial Conglomerates | | | 6,746 | | | | — | | | | — | | | | 6,746 | | |
Information Technology
Services | | | 55,892 | | | | — | | | | — | | | | 55,892 | | |
Interactive Media &
Services | | | 35,511 | | | | — | | | | — | | | | 35,511 | | |
Internet & Direct
Marketing Retail | | | 40,972 | | | | — | | | | — | | | | 40,972 | | |
Personal Products | | | 7,061 | | | | — | | | | — | | | | 7,061 | | |
Pharmaceuticals | | | 12,188 | | | | — | | | | — | | | | 12,188 | | |
Professional Services | | | 6,788 | | | | — | | | | — | | | | 6,788 | | |
Road & Rail | | | 11,876 | | | | — | | | | — | | | | 11,876 | | |
Software | | | 76,545 | | | | — | | | | — | | | | 76,545 | | |
Textiles, Apparel &
Luxury Goods | | | 6,641 | | | | — | | | | — | | | | 6,641 | | |
Total Common Stocks | | | 424,710 | | | | — | | | | — | | | | 424,710 | | |
Call Options Purchased | | | — | | | | 139 | | | | — | | | | 139 | | |
Short-Term Investment | |
Investment Company | | | 30,479 | | | | — | | | | — | | | | 30,479 | | |
Total Assets | | $ | 455,189 | | | $ | 139 | | | $ | — | | | $ | 455,328 | | |
21
Morgan Stanley Institutional Fund, Inc.
Annual Report — December 31, 2019
Notes to Financial Statements (cont'd)
Transfers between investment levels may occur as the markets fluctuate and/or the availability of data used in an investment's valuation changes.
3. Foreign Currency Translation and Foreign Investments: The books and records of the Fund are maintained in U.S. dollars. Foreign currency amounts are translated into U.S. dollars as follows:
– investments, other assets and liabilities at the prevailing rate of exchange on the valuation date;
– investment transactions and investment income at the prevailing rates of exchange on the dates of such transactions.
Although the net assets of the Fund are presented at the foreign exchange rates and market values at the close of the period, the Fund does not isolate that portion of the results of operations arising as a result of changes in the foreign exchange rates from the fluctuations arising from changes in the market prices of securities held at period end. Similarly, the Fund does not isolate the effect of changes in foreign exchange rates from the fluctuations arising from changes in the market prices of securities sold during the period. Accordingly, realized and unrealized foreign currency gains (losses) on investments in securities are included in the reported net realized and unrealized gains (losses) on investment transactions and balances. However, pursuant to U.S. federal income tax regulations, gains and losses from certain foreign currency transactions and the foreign currency portion of gains and losses realized on sales and maturities of foreign denominated debt securities are treated as ordinary income for U.S. federal income tax purposes.
Net realized gains (losses) on foreign currency transactions represent net foreign exchange gains (losses) from foreign currency forward exchange contracts, disposition of foreign currencies, currency gains (losses) realized between the trade and settlement dates on securities transactions, and the difference between the amount of investment income and foreign withholding taxes recorded on the Fund's books and the U.S. dollar equivalent amounts actually received or paid. The change in unrealized currency gains (losses) on foreign currency transactions for the period is reflected in the Statement of Operations.
Foreign security and currency transactions may involve certain considerations and risks not typically associated with those of U.S. dollar denominated transactions as a result of, among other factors, fluctuations of exchange rates in relation to the U.S. dollar, the possibility of lower levels of governmental supervision and regulation of foreign securities markets and the possibility of political or economic instability.
Governmental approval for foreign investments may be required in advance of making an investment under certain circumstances in some countries, and the extent of foreign investments in domestic companies may be subject to limitation in other countries. Foreign ownership limitations also may be imposed by the charters of individual companies to prevent, among other concerns, violations of foreign investment limitations. As a result, an additional class of shares (identified as "Foreign" in the Portfolio of Investments) may be created and offered for investment. The "local" and "foreign shares" market values may differ. In the absence of trading of the foreign shares in such markets, the Fund values the foreign shares at the closing exchange price of the local shares.
4. Derivatives: The Fund may, but is not required to, use derivative instruments for a variety of purposes, including hedging, risk management, portfolio management or to earn income. Derivatives are financial instruments whose value is based, in part, on the value of an underlying asset, interest rate, index or financial instrument. Prevailing interest rates and volatility levels, among other things, also affect the value of derivative instruments. A derivative instrument often has risks similar to its underlying asset and may have additional risks, including imperfect correlation between the value of the derivative and the underlying asset, risks of default by the counterparty to certain transactions, magnification of losses incurred due to changes in the market value of the securities, instruments, indices or interest rates to which the derivative instrument relates, risks that the transactions may not be liquid and risks arising from margin requirements. The use of derivatives involves risks that are different from, and possibly greater than, the risks associated with other portfolio investments. Derivatives may involve the use of highly specialized instruments that require investment techniques and risk analyses different from those associated with other portfolio investments. All of the Fund's holdings, including derivative instruments, are marked-to-market each day with
22
Morgan Stanley Institutional Fund, Inc.
Annual Report — December 31, 2019
Notes to Financial Statements (cont'd)
the change in value reflected in unrealized appreciation (depreciation). Upon disposition, a realized gain or loss is recognized.
Certain derivative transactions may give rise to a form of leverage. Leverage magnifies the potential for gain and the risk of loss. Leverage associated with derivative transactions may cause the Fund to liquidate portfolio positions when it may not be advantageous to do so to satisfy its obligations or to meet earmarking or segregation requirements, pursuant to applicable Securities and Exchange Commission ("SEC") rules and regulations, or may cause the Fund to be more volatile than if the Fund had not been leveraged. Although the Adviser seeks to use derivatives to further the Fund's investment objectives, there is no assurance that the use of derivatives will achieve this result.
Following is a description of the derivative instruments and techniques that the Fund used during the period and their associated risks:
Options: With respect to options, the Fund is subject to equity risk, interest rate risk and foreign currency exchange risk in the normal course of pursuing its investment objectives. If the Fund buys an option, it buys a legal contract giving it the right to buy or sell a specific amount of the underlying instrument or foreign currency, or futures contract on the underlying instrument or foreign currency, at an agreed-upon price during a period of time or on a specified date typically in exchange for a premium paid by the Fund. The Fund may purchase and/or sell put and call options. Purchasing call options tends to increase the Fund's exposure to the underlying (or similar) instrument. Purchasing put options tends to decrease the Fund's exposure to the underlying (or similar) instrument. When entering into purchased option contracts, the Fund bears the risk of interest or exchange rates or securities prices moving unexpectedly, in which case, the Fund may not achieve the anticipated benefits of the purchased option contracts; however the risk of loss is limited to the premium paid. Purchased options are reported as part of "Total Investments in Securities" in the Statement of Assets and Liabilities. Premiums paid for purchasing options which expired are treated as realized losses. If the Fund sells an option, it sells to another party the right to buy from or sell to the Fund a specific amount of the underlying instrument or foreign currency, or futures contract on the
underlying instrument or foreign currency, at an agreed-upon price during a period of time or on a specified date typically in exchange for a premium received by the Fund. When options are purchased OTC, the Fund bears the risk that the counterparty that wrote the option will be unable or unwilling to perform its obligations under the option contract. Options may also be illiquid and the Fund may have difficulty closing out its position. A decision as to whether, when and how to use options involves the exercise of skill and judgment and even a well-conceived option transaction may be unsuccessful because of market behavior or unexpected events. The prices of options can be highly volatile and the use of options can lower total returns.
FASB ASC 815, "Derivatives and Hedging" ("ASC 815"), is intended to improve financial reporting about derivative instruments by requiring enhanced disclosures to enable investors to better understand how and why the Fund uses derivative instruments, how these derivative instruments are accounted for and their effects on the Fund's financial position and results of operations.
The following table sets forth the fair value of the Fund's derivative contracts by primary risk exposure as of December 31, 2019:
| | | Asset Derivatives
Statement of Assets and
Liabilities Location | | Primary Risk
Exposure | | Value
(000) | |
Purchased Options | | Investments, at Value
(Purchased Options) | | Currency Risk | | $ | 139 | (a) | |
(a) Amounts are included in Investments in Securities in the Statement of Assets and Liabilities.
The following tables set forth by primary risk exposure the Fund's realized gains (losses) and change in unrealized appreciation (depreciation) by type of derivative contract for the year ended December 31, 2019 in accordance with ASC 815:
Realized Gain (Loss) | |
Primary Risk Exposure | | Derivative Type | | Value
(000) | |
| Currency Risk Investments | |
(Purchased Options) | | $ | (610 | )(b) | |
(b) Amounts are included in Investments Sold in the Statement of Operations.
Change in Unrealized Appreciation (Depreciation) | |
Primary Risk Exposure | | Derivative Type | | Value
(000) | |
| Currency Risk Investments | |
(Purchased Options) | | $ | (487 | )(c) | |
(c) Amounts are included in Investments in the Statement of Operations.
23
Morgan Stanley Institutional Fund, Inc.
Annual Report — December 31, 2019
Notes to Financial Statements (cont'd)
At December 31, 2019, the Fund's derivative assets and liabilities are as follows:
Gross Amounts of Assets and Liabilities
Presented in the Statement of Assets and Liabilities | |
Derivatives | | Assets(d)
(000) | | Liabilities(d)
(000) | |
Purchased Options | | $ | 139 | (a) | | $ | — | | |
(a) Amounts are included in Investments in Securities in the Statement of Assets and Liabilities.
(d) Absent an event of default or early termination, OTC derivative assets and liabilities are presented gross and not offset in the Statement of Assets and Liabilities.
The Fund typically enters into International Swaps and Derivatives Association, Inc. Master Agreements ("ISDA Master Agreements") or similar master agreements (collectively, "Master Agreements") with its contract counterparties for certain OTC derivatives in order to, among other things, reduce its credit risk to counterparties. ISDA Master Agreements include provisions for general obligations, representations, collateral and events of default or termination. Under an ISDA Master Agreement, the Fund typically may offset with the counterparty certain OTC derivative financial instruments' payables and/or receivables with collateral held and/or posted and create one single net payment (close-out netting) in the event of default, termination and/or potential deterioration in the credit quality of the counterparty. Various Master Agreements govern the terms of certain transactions with counterparties, including transactions such as swap, forward, repurchase and reverse repurchase agreements. These Master Agreements typically attempt to reduce the counterparty risk associated with such transactions by specifying credit protection mechanisms and providing standardization that improves legal certainty. Cross-termination provisions under Master Agreements typically provide that a default in connection with one transaction between the Fund and a counterparty gives the non-defaulting party the right to terminate any other transactions in place with the defaulting party to create one single net payment due to/due from the defaulting party and may be a feature in certain Master Agreements. In the event the Fund exercises its right to terminate a Master Agreement after a counterparty experiences a termination event as defined in the Master Agreement, the return of collateral with market value in excess of the Fund's net liability may be delayed or denied.
The following table presents derivative financial instruments that are subject to enforceable netting arrangements as of December 31, 2019:
Gross Amounts Not Offset in the Statement of Assets and Liabilities | |
Counterparty | | Gross Asset
Derivatives
Presented in the
Statement of
Assets and
Liabilities
(000) | | Financial
Instrument
(000) | | Collateral
Received(e)
(000) | | Net Amount
(not less
than $0)
(000) | |
BNP Paribas | | $ | — | @ | | $ | — | | | $ | (— | @) | | $ | 0 | | |
Royal Bank of Scotland | | | 139 | | | | — | | | | (139 | ) | | | 0 | | |
Total | | $ | 139 | (a) | | $ | — | | | $ | (139 | ) | | $ | 0 | | |
@ Value is less than $500.
(a) Amounts are included in Investments in Securities in the Statement of Assets and Liabilities.
(e) In some instances, the actual collateral received may be more than the amount shown here due to overcollateralization.
For the year ended December 31, 2019, the approximate average monthly amount outstanding for each derivative type is as follows:
Purchased Options: | |
Average monthly notional amount | | | 182,075,000 | | |
5. Securities Lending: The Fund lends securities to qualified financial institutions, such as broker-dealers, to earn additional income. Any increase or decrease in the fair value of the securities loaned that might occur and any interest earned or dividends declared on those securities during the term of the loan would remain in the Fund.
The Fund would receive cash or securities as collateral in an amount equal to or exceeding 100% of the current fair value of the loaned securities. The collateral is marked-to-market daily by State Street Bank and Trust Company ("State Street"), the securities lending agent, to ensure that a minimum of 100% collateral coverage is maintained.
Based on pre-established guidelines, the securities lending agent invests any cash collateral that is received in an affiliated money market portfolio and repurchase agreements. Securities lending income is generated from the earnings on the invested collateral and borrowing fees, less any rebates owed to the borrowers and compensation to the lending agent, and is recorded as "Income from Securities Loaned — Net" in the Fund's Statement of Operations. Risks in securities lending transactions are that a borrower may not provide additional collateral when required or return the securities when due, and
24
Morgan Stanley Institutional Fund, Inc.
Annual Report — December 31, 2019
Notes to Financial Statements (cont'd)
that the value of the short-term investments will be less than the amount of cash collateral plus any rebate that is required to be returned to the borrower.
The Fund has the right under the securities lending agreement to recover the securities from the borrower on demand.
At December 31, 2019, the Fund did not have any outstanding securities on loan.
6. Indemnifications: The Company enters into contracts that contain a variety of indemnifications. The Company's maximum exposure under these arrangements is unknown. However, the Company has not had prior claims or losses pursuant to these contracts and expects the risk of loss to be remote.
7. Dividends and Distributions to Shareholders: Dividends and distributions to shareholders are recorded on the ex-dividend date. Dividends from net investment income, if any, are declared and paid annually. Net realized capital gains, if any, are distributed at least annually.
8. Security Transactions, Income and Expenses: Security transactions are accounted for on the trade date (date the order to buy or sell is executed). Realized gains and losses on the sale of investment securities are determined on the specific identified cost method. Dividend income and other distributions are recorded on the ex-dividend date (except for certain foreign dividends which may be recorded as soon as the Fund is informed of such dividends) net of applicable withholding taxes. Interest income is recognized on the accrual basis except where collection is in doubt. Discounts are accreted and premiums are amortized over the life of the respective securities. Most expenses of the Company can be directly attributed to a particular Fund. Expenses which cannot be directly attributed are apportioned among the Funds based upon relative net assets or other appropriate methods. Income, expenses (other than class specific expenses — distribution and shareholder services, transfer agency and sub transfer agency fees) and realized and unrealized gains or losses are allocated to each class of shares based upon their relative net assets.
B. Advisory Fees: The Adviser, a wholly-owned subsidiary of Morgan Stanley, provides the Fund with advisory services under the terms of an Investment Advisory Agreement, paid
quarterly, at the annual rate based on the daily net assets as follows:
First $750
million | | Next $750
million | | Over $1.5
billion | |
| | 0.65 | % | | | 0.60 | % | | | 0.55 | % | |
For the year ended December 31, 2019, the advisory fee rate (net of waiver/rebate) was equivalent to an annual effective rate of 0.63% of the Fund's average daily net assets.
The Adviser has agreed to reduce its advisory fee and/or reimburse the Fund so that total annual Fund operating expenses, excluding certain investment related expenses, taxes, interest and other extraordinary expenses (including litigation), will not exceed 0.85% for Class I shares, 1.20% for Class A shares, 0.99% for Class L shares, 1.95% for Class C shares and 0.81% for Class IS shares. The fee waivers and/or expense reimbursements will continue for at least two years from the date of the Reorganization or until such time as the Directors act to discontinue all or a portion of such waivers and/or reimbursements when they deem such action is appropriate. For the year ended December 31, 2019, approximately $53,000 of advisory fees were waived and approximately $171,000 of other expenses were reimbursed by the Adviser pursuant to this arrangement.
C. Administration Fees: The Adviser also serves as Administrator to the Company and provides administrative services pursuant to an Administration Agreement for an annual fee, accrued daily and paid monthly, of 0.08% of the Fund's average daily net assets.
Under a Sub-Administration Agreement between the Administrator and State Street, State Street provides certain administrative services to the Company. For such services, the Administrator pays State Street a portion of the fee the Administrator receives from the Fund.
D. Distribution and Shareholder Services Fees: Morgan Stanley Distribution, Inc. ("MSDI" or the "Distributor"), a wholly-owned subsidiary of the Adviser and an indirect subsidiary of Morgan Stanley, serves as the Company's Distributor of Fund shares pursuant to a Distribution Agreement. The Company has adopted a Shareholder Services Plan with respect to Class A shares pursuant to Rule 12b-1 under the Act. Under the Shareholder Services Plan, the Fund pays the Distributor a shareholder services fee, accrued daily and paid monthly, at an annual rate of 0.25% of the Fund's average daily net assets attributable to Class A shares.
25
Morgan Stanley Institutional Fund, Inc.
Annual Report — December 31, 2019
Notes to Financial Statements (cont'd)
The Company has adopted a Distribution and Shareholder Services Plan with respect to Class L shares pursuant to Rule 12b-1 under the Act. Under the Distribution and Shareholder Services Plan, the Fund pays the Distributor a distribution fee, accrued daily and paid monthly, at an annual rate of 0.50% and a shareholder services fee, accrued daily and paid monthly, at an annual rate of 0.25% of the Fund's average daily net assets attributable to Class L shares. The Distributor has agreed to waive for at least two years from the date of the Reorganization or until such time as the Directors act to discontinue all or a portion of such waivers and/or reimbursements when they deem such action is appropriate, the 12b-1 fees on Class L shares of the Fund to the extent it exceeds 0.04% of the average daily net assets of such shares on an annualized basis. For the year ended December 31, 2019, this waiver amounted to approximately $31,000.
The Company has adopted a Distribution and Shareholder Services Plan with respect to Class C shares pursuant to Rule 12b-1 under the Act. Under the Distribution and Shareholder Services Plan, the Fund pays the Distributor a distribution fee, accrued daily and paid monthly, at an annual rate of 0.75% and a shareholder services fee, accrued daily and paid monthly, at an annual rate of 0.25% of the Fund's average daily net assets attributable to Class C shares.
The distribution and shareholder services fees are used to support the expenses associated with servicing and maintaining accounts. The Distributor may compensate other parties for providing shareholder support services to investors who purchase Class A, Class L and Class C shares.
E. Dividend Disbursing and Transfer Agent: The Company's dividend disbursing and transfer agent is DST Asset Manager Solutions, Inc. ("DST"). Pursuant to a Transfer Agency Agreement, the Company pays DST a fee based on the number of classes, accounts and transactions relating to the Funds of the Company.
F. Custodian Fees: State Street (the "Custodian") also serves as Custodian for the Company in accordance with a Custodian Agreement. The Custodian holds cash, securities and other assets of the Company as required by the Act. Custody fees are payable monthly based on assets held in custody, investment purchases and sales activity and account maintenance fees, plus reimbursement for certain out-of-pocket expenses.
G. Security Transactions and Transactions with Affiliates: For the year ended December 31, 2019, purchases and sales of investment securities for the Fund, other than
long-term U.S. Government securities and short-term investments were approximately $354,954,000 and $254,534,000, respectively. There were no purchases and sales of long-term U.S. Government securities for the year ended December 31, 2019.
The Fund invests in the Institutional Class of the Morgan Stanley Institutional Liquidity Funds (the "Liquidity Funds"), an open-end management investment company managed by the Adviser, both directly and as a portion of the securities held as collateral on loaned securities. Advisory fees paid by the Fund are reduced by an amount equal to its pro-rata share of the advisory and administration fees paid by the Fund due to its investment in the Liquidity Funds. For the year ended December 31, 2019, advisory fees paid were reduced by approximately $40,000 relating to the Fund's investment in the Liquidity Funds.
A summary of the Fund's transactions in shares of affiliated investments during the year ended December 31, 2019 is as follows:
Affiliated
Investment
Company | | Value
December 31,
2018
(000) | | Purchases
at Cost
(000) | | Proceeds
from Sales
(000) | | Dividend
Income
(000) | |
Liquidity Funds | | $ | 18,432 | | | $ | 207,488 | | | $ | 195,441 | | | $ | 415 | | |
Affiliated
Investment
Company (cont'd) | | Realized
Gain
(Loss)
(000) | | Change in
Unrealized
Appreciation
(Depreciation)
(000) | | Value
December 31,
2019
(000) | |
Liquidity Funds | | $ | — | | | $ | — | | | $ | 30,479 | | |
The Fund is permitted to purchase and sell securities ("cross-trade") from and to other Morgan Stanley funds as well as other funds and client accounts for which the Adviser or an affiliate of the Adviser serves as investment adviser, pursuant to procedures approved by the Directors in compliance with Rule 17a-7 under the Act (the "Rule"). Each cross-trade is executed at the current market price in compliance with provisions of the Rule. For the year ended December 31, 2019, the Fund did not engage in any cross-trade transactions.
The Fund has an unfunded Deferred Compensation Plan (the "Compensation Plan"), which allows each independent Director to defer payment of all, or a portion, of the fees he or she receives for serving on the Board of Directors. Each eligible Director generally may elect to have the deferred amounts credited with a return equal to the total return on one or more of the Morgan Stanley funds that are offered as investment options under the Compensation Plan. Appreciation/depreciation and distributions received from these investments are recorded
26
Morgan Stanley Institutional Fund, Inc.
Annual Report — December 31, 2019
Notes to Financial Statements (cont'd)
with an offsetting increase/decrease in the deferred compensation obligation and do not affect the NAV of the Fund.
H. Federal Income Taxes: It is the Fund's intention to continue to qualify as a regulated investment company and distribute all of its taxable and tax-exempt income. Accordingly, no provision for federal income taxes is required in the financial statements.
The Fund may be subject to taxes imposed by countries in which it invests. Such taxes are generally based on income and/or capital gains earned or repatriated. Taxes are accrued based on net investment income, net realized gains and net unrealized appreciation as such income and/or gains are earned. Taxes may also be based on transactions in foreign currency and are accrued based on the value of investments denominated in such currency.
FASB ASC 740-10, "Income Taxes — Overall", sets forth a minimum threshold for financial statement recognition of the benefit of a tax position taken or expected to be taken in a tax return. Management has concluded there are no significant uncertain tax positions that would require recognition in the financial statements. If applicable, the Fund recognizes interest accrued related to unrecognized tax benefits in "Interest Expense" and penalties in "Other Expenses" in the Statement of Operations. The Fund files tax returns with the U.S. Internal Revenue Service, New York and various states. Generally, each of the tax years in the four-year period ended December 31, 2019 remains subject to examination by taxing authorities.
The tax character of distributions paid may differ from the character of distributions shown for GAAP purposes due to short-term capital gains being treated as ordinary income for tax purposes. The tax character of distributions paid during fiscal years 2019 and 2018 was as follows:
2019
Distributions
Paid From: | | 2018
Distributions
Paid From: | |
Ordinary
Income
(000) | | Long-Term
Capital Gain
(000) | | Ordinary
Income
(000) | | Long-Term
Capital Gain
(000) | |
| $ | 1,435 | | | $ | 6,841 | | | $ | 542 | | | $ | 8,397 | | |
The amount and character of income and gains to be distributed are determined in accordance with income tax regulations which may differ from GAAP. These book/tax differences are either considered temporary or permanent in nature.
Temporary differences are attributable to differing book and tax treatments for the timing of the recognition of gains
(losses) on certain investment transactions and the timing of the deductibility of certain expenses.
Permanent differences, primarily due to equalization debits and a nondeductible expense, resulted in the following reclassifications among the components of net assets at December 31, 2019:
Total
Distributable
Earnings
(000) | | Paid-in
Capital
(000) | |
| $ | 8 | | | $ | (8 | ) | |
At December 31, 2019, the components of distributable earnings for the Fund on a tax basis were as follows:
Undistributed
Ordinary
Income
(000) | | Undistributed
Long-Term
Capital Gain
(000) | |
| $ | 1,088 | | | $ | 2,444 | | |
I. Credit Facility: The Company and other Morgan Stanley funds participated in a $150,000,000 committed, unsecured revolving line of credit facility (the "Facility") with State Street. Effective April 22, 2019, the committed line amount increased to $300,000,000. This Facility is to be used for temporary emergency purposes or funding of shareholder redemption requests. The interest rate on borrowings is based on the federal funds rate or 1 month LIBOR rate plus a spread. The Facility also has a commitment fee of 0.25% per annum based on the unused portion of the Facility. During the year ended December 31, 2019, the Fund did not have any borrowings under the Facility.
J. Other: At December 31, 2019, the Fund had record owners of 10% or greater. Investment activities of these shareholders could have a material impact on the Fund. The aggregate percentage of such owners was 17.4%.
27
Morgan Stanley Institutional Fund, Inc.
Annual Report — December 31, 2019
Report of Independent Registered Public Accounting Firm
To the Shareholders and Board of Directors of
Morgan Stanley Institutional Fund, Inc. —
Advantage Portfolio
Opinion on the Financial Statements
We have audited the accompanying statement of assets and liabilities of Advantage Portfolio (the "Fund") (one of the funds constituting Morgan Stanley Institutional Fund, Inc. (the "Company")), including the portfolio of investments, as of December 31, 2019, and the related statement of operations for the year then ended, the statements of changes in net assets for each of the two years in the period then ended, the financial highlights for each of the five years in the period then ended and the related notes (collectively referred to as the "financial statements"). In our opinion, the financial statements present fairly, in all material respects, the financial position of Advantage Portfolio (one of the funds constituting Morgan Stanley Institutional Fund, Inc.) at December 31, 2019, the results of its operations for the year then ended, the changes in its net assets for each of the two years in the period then ended and its financial highlights for each of the five years in the period then ended, in conformity with U.S. generally accepted accounting principles.
Basis for Opinion
These financial statements are the responsibility of the Company's management. Our responsibility is to express an opinion on the Fund's financial statements based on our audits. We are a public accounting firm registered with the Public Company Accounting Oversight Board (United States) ("PCAOB") and are required to be independent with respect to the Company in accordance with the U.S. federal securities law and the applicable rules and regulations of the Securities and Exchange Commission and the PCAOB.
We conducted our audits in accordance with the standards of the PCAOB. Those standards require that we plan and perform the audit to obtain reasonable assurance about whether the financial statements are free of material misstatement, whether due to error or fraud. The Company is not required to have, nor were we engaged to perform, an audit of the Company's internal control over financial reporting. As part of our audits, we are required to obtain an understanding of internal control over financial reporting, but not for the purpose of expressing an opinion on the effectiveness of the Company's internal control over financial reporting. Accordingly, we express no such opinion.
Our audits included performing procedures to assess the risks of material misstatement of the financial statements, whether due to error or fraud, and performing procedures that respond to those risks. Such procedures included examining, on a test basis, evidence regarding the amounts and disclosures in the financial statements. Our procedures included confirmation of securities owned as of December 31, 2019 by correspondence with the custodian and others or by other appropriate auditing procedures where replies from others were not received. Our audits also included evaluating the accounting principles used and significant estimates made by management, as well as evaluating the overall presentation of the financial statements. We believe that our audits provide a reasonable basis for our opinion.

We have served as the auditor of one or more Morgan Stanley investment companies since 2000.
Boston, Massachusetts
February 27, 2020
28
Morgan Stanley Institutional Fund, Inc.
Annual Report — December 31, 2019
Federal Tax Notice (unaudited)
For federal income tax purposes, the following information is furnished with respect to the distributions paid by the Fund during its taxable year ended December 31, 2019. For corporate shareholders 61.65% of the dividends qualified for the dividends received deduction.
The Fund designated and paid approximately $6,841,000 as a long-term capital gain distribution.
For federal income tax purposes, the following information is furnished with respect to the Fund's earnings for its taxable year ended December 31, 2019. When distributed, certain earnings may be subject to a maximum tax rate of 15% as provided for by the Jobs and Growth Tax Relief Reconciliation Act of 2003. The Fund designated up to a maximum of approximately $1,435,000 as taxable at this lower rate.
In January, the Fund provides tax information to shareholders for the preceding calendar year.
29
Privacy Notice (unaudited) April 2019
FACTS | | WHAT DOES MSIM DO WITH YOUR PERSONAL INFORMATION? | |
Why? | | Financial companies choose how they share your personal information. Federal law gives consumers the right to limit some but not all sharing. Federal law also requires us to tell you how we collect, share, and protect your personal information. Please read this notice carefully to understand what we do. | |
What? | | The types of personal information we collect and share depend on the product or service you have with us. This information can include:
n Social Security number and income
n investment experience and risk tolerance
n checking account number and wire transfer instructions | |
How? | | All financial companies need to share customers' personal information to run their everyday business. In the section below, we list the reasons financial companies can share their customers' personal information; the reasons MSIM chooses to share; and whether you can limit this sharing. | |
Reasons we can share your personal information | | Does MSIM share? | | Can you limit this sharing? | |
For our everyday business purposes —
such as to process your transactions, maintain your account(s), respond to court orders and legal investigations, or report to credit bureaus | | Yes | | No | |
For our marketing purposes —
to offer our products and services to you | | Yes | | No | |
For joint marketing with other financial companies | | No | | We don't share | |
For our affiliates' everyday business purposes —
information about your transactions and experiences | | Yes | | No | |
For our affiliates' everyday business purposes —
information about your creditworthiness | | No | | We don't share | |
For our affiliates to market to you | | No | | We don't share | |
For non-affiliates to market to you | | No | | We don't share | |
Questions? Call toll-free (844) 312-6327 or email: imprivacyinquiries@morganstanley.com
30
Privacy Notice (unaudited) (cont'd) April 2019
Who we are
Who is providing this notice? | | Morgan Stanley Investment Management, Inc. and its affiliated registered investment advisers, registered broker-dealers, and registered and unregistered funds ("MSIM") | |
What we do
How does MSIM protect my personal information? | | To protect your personal information from unauthorized access and use, we use security measures that comply with federal law. These measures include computer safeguards and secured files and buildings. We have policies governing the proper handling of customer information by personnel and requiring third parties that provide support to adhere to appropriate security standards with respect to such information. | |
How does MSIM collect my personal information? | | We collect your personal information, for example, when you
n open an account or make deposits or withdrawals from your account
n buy securities from us or make a wire transfer
n give us your contact information
We also collect your personal information from others, such as credit bureaus, affiliates, or other companies. | |
Why can't I limit all sharing? | | Federal law gives you the right to limit only
n sharing for affiliates' everyday business purposes — information about your creditworthiness
n affiliates from using your information to market to you
n sharing for non-affiliates to market to you
State laws and individual companies may give you additional rights to limit sharing. See below for more on your rights under state law. | |
Definitions
Affiliates | | Companies related by common ownership or control. They can be financial and non-financial companies.
n Our affiliates include companies with a Morgan Stanley name and financial companies such as Morgan Stanley Smith Barney LLC and Morgan Stanley & Co. | |
Non-affiliates | | Companies not related by common ownership or control. They can be financial and non-financial companies.
n MSIM does not share with non-affiliates so they can market to you. | |
Joint marketing | | A formal agreement between non-affiliated financial companies that together market financial products or services to you.
n MSIM doesn't jointly market | |
Other Important Information
Vermont: Except as permitted by law, we will not share personal information we collect about Vermont residents with Non-affiliates unless you provide us with your written consent to share such information.
California: Except as permitted by law, we will not share personal information we collect about California residents with Non-affiliates and we will limit sharing such personal information with our Affiliates to comply with California privacy laws that apply to us.
31
Morgan Stanley Institutional Fund, Inc.
Annual Report — December 31, 2019
Director and Officer Information (unaudited)
Independent Directors:
Name, Birth Year
and Address of
Independent Director | | Position(s)
Held with
Registrant | | Length of Time
Served* | | Principal Occupation(s) During Past 5 Years
and Other Relevant Professional Experience | | Number of
Funds in
Fund Complex
Overseen by
Independent
Director** | | Other Directorships
Held by Independent
Director*** | |
Frank L. Bowman
c/o Perkins Coie LLP
Counsel to the Independent Directors
1155 Avenue of the Americas
New York, NY 10036
Birth Year 1944 | | Director | | Since
August
2006 | | President, Strategic Decisions, LLC (consulting) (since February 2009); Director or Trustee of various Morgan Stanley Funds (since August 2006); Chairperson of the Compliance and Insurance Committee (since October 2015); formerly, Chairperson of the Insurance Sub-Committee of the Compliance and Insurance Committee (2007-2015); served as President and Chief Executive Officer of the Nuclear Energy Institute (policy organization) (February 2005-November 2008); retired as Admiral, U.S. Navy after serving over 38 years on active duty including 8 years as Director of the Naval Nuclear Propulsion Program in the Department of the Navy and the U.S. Department of Energy (1996-2004); served as Chief of Naval Personnel (July 1994-September 1996) and on the Joint Staff as Director of Political Military Affairs (June 1992-July 1994); knighted as Honorary Knight Commander of the Most Excellent Order of the British Empire; awarded the Officier de l'Orde National du Mérite by the French Government; elected to the National Academy of Engineering (2009). | | | 86 | | | Director of Naval and Nuclear Technologies LLP; Director Emeritus of the Armed Services YMCA; Member of the National Security Advisory Council of the Center for U.S. Global Engagement and a member of the CNA Military Advisory Board; Trustee of Fairhaven United Methodist Church; Member of the Board of Advisors of the Dolphin Scholarship Foundation; Director of other various non-profit organizations; formerly, Director of BP p.l.c. (November 2010-May 2019). | |
Kathleen A. Dennis
c/o Perkins Coie LLP
Counsel to the Independent Directors
1155 Avenue of the Americas
New York, NY 10036
Birth Year 1953 | | Director | | Since
August
2006 | | President, Cedarwood Associates (mutual fund and investment management consulting) (since July 2006); Chairperson of the Liquidity and Alternatives Sub-Committee of the Investment Committee (since October 2006) and Director or Trustee of various Morgan Stanley Funds (since August 2006); formerly, Senior Managing Director of Victory Capital Management (1993-2006). | | | 86 | | | Director of various non-profit organizations. | |
Nancy C. Everett
c/o Perkins Coie LLP
Counsel to the Independent Directors
1155 Avenue of the Americas
New York, NY 10036
Birth Year 1955 | | Director | | Since
January
2015 | | Chief Executive Officer, Virginia Commonwealth University Investment Company (since November 2015); Owner, OBIR, LLC (institutional investment management consulting) (since June 2014); formerly, Managing Director, BlackRock, Inc. (February 2011-December 2013); and Chief Executive Officer, General Motors Asset Management (a/k/a Promark Global Advisors, Inc.) (June 2005-May 2010). | | | 87 | | | Formerly, Member of Virginia Commonwealth University School of Business Foundation (2005-2016); Member of Virginia Commonwealth University Board of Visitors (2013-2015); Member of Committee on Directors for Emerging Markets Growth Fund, Inc. (2007-2010); Chairperson of Performance Equity Management, LLC (2006-2010); and Chairperson, GMAM Absolute Return Strategies Fund, LLC (2006-2010). | |
32
Morgan Stanley Institutional Fund, Inc.
Annual Report — December 31, 2019
Director and Officer Information (unaudited) (cont'd)
Independent Directors: (cont'd)
Name, Birth Year
and Address of
Independent Director | | Position(s)
Held with
Registrant | | Length of Time
Served* | | Principal Occupation(s) During Past 5 Years
and Other Relevant Professional Experience | | Number of
Funds in
Fund Complex
Overseen by
Independent
Director** | | Other Directorships
Held by Independent
Director*** | |
Jakki L. Haussler
c/o Perkins Coie LLP
Counsel to the Independent Directors
1155 Avenue of the Americas
New York, NY 10036
Birth Year 1957 | | Director | | Since
January
2015 | | Chairman, Opus Capital Group (since 1996); formerly, Chief Executive Officer, Opus Capital Group (1996-2019); Director, Capvest Venture Fund, LP (May 2000-December 2011); Partner, Adena Ventures, LP (July 1999-December 2010); Director, The Victory Funds (February 2005-July 2008). | | | 87 | | | Director of Service Corporation International and Member, Audit Committee and Investment Committee; Director of Cincinnati Bell Inc. and Member, Audit Committee and Governance and Nominating Committee; Chairman of Northern Kentucky University Member Investment Committee; Member of Chase College of Law Transactional Law Practice Center Board of Advisors; Director of Best Transport; Director of Chase College of Law Board of Visitors; formerly, Member, University of Cincinnati Foundation Investment Committee; Member, Miami University Board of Visitors (2008-2011); Trustee of Victory Funds (2005-2008) and Chairman, Investment Committee (2007-2008) and Member, Service Provider Committee (2005-2008). | |
Dr. Manuel H. Johnson
c/o Johnson Smick International, Inc.
220 I Street, NE — Suite 200
Washington, D.C. 20002
Birth Year 1949 | | Director | | Since
July
1991 | | Senior Partner, Johnson Smick International, Inc. (consulting firm); Chairperson of the Investment Committee (since October 2006) and Director or Trustee of various Morgan Stanley Funds (since July 1991); Co-Chairman and a founder of the Group of Seven Council (G7C) (international economic commission); formerly, Chairperson of the Audit Committee (July 1991-September 2006), Vice Chairman of the Board of Governors of the Federal Reserve System and Assistant Secretary of the U.S. Treasury. | | | 86 | | | Director of NVR, Inc. (home construction). | |
Joseph J. Kearns
c/o Perkins Coie LLP
Counsel to the Independent Directors
1155 Avenue of the Americas
New York, NY 10036
Birth Year 1942 | | Director | | Since
August
1994 | | Senior Adviser, Kearns & Associates LLC (investment consulting); Chairperson of the Audit Committee (since October 2006) and Director or Trustee of various Morgan Stanley Funds (since August 1994); formerly, Deputy Chairperson of the Audit Committee (July 2003-September 2006) and Chairperson of the Audit Committee of various Morgan Stanley Funds (since August 1994); CFO of the J. Paul Getty Trust. | | | 87 | | | Prior to August 10, 2016, Director of Electro Rent Corporation (equipment leasing); Prior to December 31, 2013, Director of The Ford Family Foundation. | |
33
Morgan Stanley Institutional Fund, Inc.
Annual Report — December 31, 2019
Director and Officer Information (unaudited) (cont'd)
Independent Directors: (cont'd)
Name, Birth Year
and Address of
Independent Director | | Position(s)
Held with
Registrant | | Length of Time
Served* | | Principal Occupation(s) During Past 5 Years
and Other Relevant Professional Experience | | Number of
Funds in
Fund Complex
Overseen by
Independent
Director** | | Other Directorships
Held by Independent
Director*** | |
Michael F. Klein
c/o Perkins Coie LLP
Counsel to the Independent Directors
1155 Avenue of the Americas
New York, NY 10036
Birth Year 1958 | | Director | | Since
August
2006 | | Managing Director, Aetos Alternatives Management, LP (since March 2000); Co-President, Aetos Alternatives Management, LP (since January 2004) and Co-Chief Executive Officer of Aetos Alternatives Management, LP (since August 2013); Chairperson of the Fixed Income Sub-Committee of the Investment Committee (since October 2006) and Director or Trustee of various Morgan Stanley Funds (since August 2006); formerly, Managing Director, Morgan Stanley & Co. Inc. and Morgan Stanley Dean Witter Investment Management and President, various Morgan Stanley Funds (June 1998-March 2000); Principal, Morgan Stanley & Co. Inc. and Morgan Stanley Dean Witter Investment Management (August 1997-December 1999). | | | 86 | | | Director of certain investment funds managed or sponsored by Aetos Alternatives Management, LP; Director of Sanitized AG and Sanitized Marketing AG (specialty chemicals). | |
Patricia Maleski
c/o Perkins Coie LLP
Counsel to the Independent Directors
1155 Avenue of the Americas
New York, NY 10036
Birth Year 1960 | | Director | | Since
January
2017 | | Managing Director, JPMorgan Asset Management (2004-2016); Oversight and Control Head of Fiduciary and Conflicts of Interest Program (2015-2016); Chief Control Officer-Global Asset Management (2013-2015); President, JPMorgan Funds (2010-2013); Chief Administrative Officer (2004-2013); various other positions including Treasurer and Board Liaison (since 2001). | | | 87 | | | None. | |
Michael E. Nugent
522 Fifth Avenue
New York, NY 10036
Birth Year 1936 | | Chair of the Board and Director | | Chair of the Boards since July 2006 and Director since July 1991 | | Chair of the Boards of various Morgan Stanley Funds (since July 2006); Chairperson of the Governance Committee (since January 2019) and Director or Trustee of various Morgan Stanley Funds (since July 1991); formerly, Chairperson of each of the Closed-End Fund committee (until December 2019) and the Insurance Committee (until July 2006); General Partner, Triumph Capital, L.P. (private investment partnership) (1988-2013). | | | 86 | | | None. | |
W. Allen Reed
c/o Perkins Coie LLP
Counsel to the Independent Directors
1155 Avenue of the Americas
New York, NY 10036
Birth Year 1947 | | Vice Chair of the Board and Director | | Vice Chair of the Boards since January 2020 and Director since August 2006 | | Chairperson of the Equity Sub-Committee of the Investment Committee (since October 2006) and Director or Trustee of various Morgan Stanley Funds (since August 2006); formerly, President and CEO of General Motors Asset Management; Chairman and Chief Executive Officer of the GM Trust Bank and Corporate Vice President of General Motors Corporation (August 1994-December 2005). | | | 86 | | | Formerly, Director of Legg Mason, Inc.; formerly, Director of the Auburn University Foundation (2010-2015). | |
* This is the earliest date the Director began serving the Morgan Stanley Funds. Each Director serves an indefinite term, until his or her successor is elected.
** The Fund Complex includes (as of December 31, 2019) all open-end and closed-end funds (including all of their portfolios) advised by Morgan Stanley Investment Management Inc. (the "Adviser") and any funds that have an adviser that is an affiliated person of the Adviser (including, but not limited to, Morgan Stanley AIP GP LP).
*** This includes any directorships at public companies and registered investment companies held by the Director at any time during the past five years.
34
Morgan Stanley Institutional Fund, Inc.
Annual Report — December 31, 2019
Director and Officer Information (unaudited) (cont'd)
Executive Officers:
Name, Birth Year and Address of
Executive Officer | | Position(s) Held
with
Registrant | | Length of Time
Served* | | Principal Occupation(s) During Past 5 Years | |
John H. Gernon
522 Fifth Avenue
New York, NY 10036
Birth Year 1963 | | President and Principal Executive Officer | | Since September 2013 | | President and Principal Executive Officer of the Equity and Fixed Income Funds and the Morgan Stanley AIP Funds (since September 2013) and the Liquidity Funds and various money market funds (since May 2014) in the Fund Complex; Managing Director of the Adviser; Head of Product (since 2006). | |
Timothy J. Knierim
522 Fifth Avenue
New York, NY 10036
Birth Year 1959 | | Chief Compliance Officer | | Since December 2016 | | Managing Director of the Adviser and various entities affiliated with the Adviser; Chief Compliance Officer of various Morgan Stanley Funds and the Adviser (since December 2016) and Chief Compliance Officer of Morgan Stanley AIP GP LP (since 2014). Formerly, Managing Director and Deputy Chief Compliance Officer of the Adviser (2014-2016); and formerly, Chief Compliance Officer of Prudential Investment Management, Inc. (2007-2014). | |
Francis J. Smith
522 Fifth Avenue
New York, NY 10036
Birth Year 1965 | | Treasurer and Principal Financial Officer | | Treasurer since July 2003 and Principal Financial Officer since September 2002 | | Managing Director of the Adviser and various entities affiliated with the Adviser; Treasurer (since July 2003) and Principal Financial Officer of various Morgan Stanley Funds (since September 2002). | |
Mary E. Mullin
522 Fifth Avenue
New York, NY 10036
Birth Year 1967 | | Secretary | | Since
June
1999 | | Managing Director of the Adviser; Secretary of various Morgan Stanley Funds (since June 1999). | |
Michael J. Key
522 Fifth Avenue
New York, NY 10036
Birth Year 1979 | | Vice President | | Since
June
2017 | | Vice President of the Equity and Fixed Income Funds, Liquidity Funds, various money market funds and the Morgan Stanley AIP Funds in the Fund Complex (since June 2017); Executive Director of the Adviser; Head of Product Development for Equity and Fixed Income Funds (since August 2013). | |
* This is the earliest date the officer began serving the Morgan Stanley Funds. Each officer serves a one-year term, until his or her successor is elected and qualifies.
35
Morgan Stanley Institutional Fund, Inc.
Annual Report — December 31, 2019
Adviser and Administrator
Morgan Stanley Investment Management Inc.
522 Fifth Avenue
New York, New York 10036
Distributor
Morgan Stanley Distribution, Inc.
522 Fifth Avenue
New York, New York 10036
Dividend Disbursing and Transfer Agent
DST Asset Manager Solutions, Inc.
2000 Crown Colony Drive
Quincy, Massachusetts 02169
Custodian
State Street Bank and Trust Company
One Lincoln Street
Boston, Massachusetts 02111
Legal Counsel
Dechert LLP
1095 Avenue of the Americas
New York, New York 10036
Counsel to the Independent Directors
Perkins Coie LLP
1155 Avenue of the Americas
New York, New York 10036
Independent Registered Public Accounting Firm
Ernst & Young LLP
200 Clarendon Street
Boston, Massachusetts 02116
Reporting to Shareholders
Each Morgan Stanley fund provides a complete schedule of portfolio holdings in its Semi-Annual and the Annual Reports within 60 days of the end of the fund's second and fourth fiscal quarters. The Semi-Annual and Annual Reports are filed electronically with the Securities and Exchange Commission ("SEC") on Form N-CSRS and Form N-CSR, respectively. Morgan Stanley also delivers the Semi-Annual and Annual Reports to fund shareholders and makes these reports available on its public website, www.morganstanley.com/im/shareholderreports. Each Morgan Stanley non-money market fund also files a complete schedule of portfolio holdings with the SEC for the fund's first and third fiscal quarters as an attachment to Form N-PORT. Morgan Stanley does not deliver the reports for the first and third fiscal quarters to shareholders, nor are the reports posted to the Morgan Stanley public website. However, the holdings for each money market fund are posted to the Morgan Stanley public website. You may obtain the Form N-PORT filings (as well as the Form N-CSR and N-CSRS filings) by accessing the SEC's website, www.sec.gov. You can also request copies of these materials, upon payment of a duplicating fee, by electronic request at the SEC's email address (publicinfo@sec.gov).
Proxy Voting Policies and Procedures and Proxy Voting Record
You may obtain a copy of the Company's Proxy Voting Policy and Procedures and information regarding how the Company voted proxies relating to portfolio securities during the most recent twelve-month period ended June 30, without charge, upon request, by calling toll free 1 (800) 548-7786 or by visiting our website at www.morganstanley.com/im/shareholderreports. This information is also available on the SEC's website at www.sec.gov.
This report is authorized for distribution only when preceded or accompanied by a prospectus or summary prospectus of the applicable fund of Morgan Stanley Institutional Fund, Inc., which describes in detail the fund's investment policies, risks, fees and expenses. Please read the prospectus carefully before you invest or send money. For additional information, including information regarding the investments comprising the Fund, please visit our website at www.morganstanley.com/im/shareholderreports or call toll free 1 (800) 548-7786.
36
Printed in U.S.A.
This Report has been prepared for shareholders and may be distributed to others only if preceded or accompanied by a current prospectus.
Morgan Stanley Investment Management Inc.
522 Fifth Avenue
New York, New York 10036
© 2020 Morgan Stanley. Morgan Stanley Distribution, Inc.

IFIADVANN
2922364 EXP. 02.28.21

Morgan Stanley Institutional Fund, Inc.
Emerging Markets Portfolio
Annual Report
December 31, 2019
Beginning on January 1, 2021, as permitted by regulations adopted by the Securities and Exchange Commission ("SEC"), paper copies of the Fund's Annual and Semi-Annual Reports to Shareholders ("Shareholder Reports") will no longer be sent by mail, unless you specifically request paper copies of the Shareholder Reports from the Fund or from your financial intermediary, such as a broker-dealer or a bank. Instead, the Shareholder Reports will be made available on the Fund's website, https://www.morganstanley.com/im/shareholderreports and you will be notified by mail each time a Shareholder Report is posted and provided with a website link to access the Shareholder Report. If you already elected to receive Shareholder Reports electronically, you will not be affected by this change and you need not take any action. You may elect to receive Shareholder Reports and other communications from the Fund electronically anytime by contacting your financial intermediary or, if you are a direct investor, please follow the instructions on the envelope.
Beginning on January 1, 2019, you may elect to receive all future Shareholder Reports in paper free of charge. If you invest through a financial intermediary, you can contact your financial intermediary to request that you continue to receive paper copies of your Shareholder Reports. If you invest directly with the Fund, please follow the instructions on the envelope to let the Fund know you wish to continue receiving paper copies of your Shareholder Reports. Your election to receive Shareholder Reports in paper will apply to all funds held in your account if you invest through your financial intermediary or all funds held with the fund complex if you invest directly with a fund.

Morgan Stanley Institutional Fund, Inc.
Annual Report — December 31, 2019
Shareholders' Letter | | | 2 | | |
Expense Example | | | 3 | | |
Investment Overview | | | 4 | | |
Portfolio of Investments | | | 8 | | |
Statement of Assets and Liabilities | | | 11 | | |
Statement of Operations | | | 13 | | |
Statements of Changes in Net Assets | | | 14 | | |
Financial Highlights | | | 16 | | |
Notes to Financial Statements | | | 22 | | |
Report of Independent Registered Public Accounting Firm | | | 33 | | |
Federal Tax Notice | | | 34 | | |
Privacy Notice | | | 35 | | |
Director and Officer Information | | | 37 | | |
This report is authorized for distribution only when preceded or accompanied by a prospectus or summary prospectus of the applicable Fund of Morgan Stanley Institutional Fund, Inc. To receive a prospectus and/or statement of additional information ("SAI"), which contains more complete information such as investment objectives, charges, expenses, policies for voting proxies, risk considerations and describes in detail each of the Fund's investment policies to the prospective investor, please call toll free 1 (800) 548-7786. Please read the prospectuses carefully before you invest or send money.
Additionally, you can access information about the Fund, including performance, characteristics and investment team commentary, through Morgan Stanley Investment Management's website: www.morganstanley.com/im/shareholderreports.
Market forecasts provided in this report may not necessarily come to pass. There is no guarantee that any sectors mentioned will continue to perform as discussed herein or that securities in such sectors will be held by the Fund in the future. There is no assurance that a fund will achieve its investment objective. Funds are subject to market risk, which is the possibility that market values of securities owned by the Fund will decline and, therefore, the value of the Fund's shares may be less than what you paid for them. Accordingly, you can lose money investing in this Fund. Please see the prospectus for more complete information on investment risks.
1
Morgan Stanley Institutional Fund, Inc.
Annual Report — December 31, 2019
Shareholders' Letter (unaudited)
Dear Shareholders,
We are pleased to provide this Annual Report, in which you will learn how your investment in Emerging Markets Portfolio (the "Fund") performed during the latest twelve-month period.
Morgan Stanley Investment Management is a client-centric, investor-led organization. Our global presence, intellectual capital, and breadth of products and services enable us to partner with investors to meet the evolving challenges of today's financial markets. We aim to deliver superior investment service and to empower our clients to make the informed decisions that help them reach their investment goals.
As always, we thank you for selecting Morgan Stanley Investment Management, and look forward to working with you in the months and years ahead.
Sincerely,

John H. Gernon
President and Principal Executive Officer
January 2020
2
Morgan Stanley Institutional Fund, Inc.
Annual Report — December 31, 2019
Expense Example (unaudited)
Emerging Markets Portfolio
As a shareholder of the Fund, you incur two types of costs: (1) transactional costs, including redemption fees; and (2) ongoing costs, which may include advisory fees, administration fees, distribution and shareholder services fees and other Fund expenses. This example is intended to help you understand your ongoing costs (in dollars) of investing in the Fund and to compare these costs with the ongoing costs of investing in other mutual funds.
This example is based on an investment of $1,000 invested at the beginning of the six-month period ended December 31, 2019 and held for the entire six-month period.
Actual Expenses
The table below provides information about actual account values and actual expenses. You may use the information in this table, together with the amount you invested, to estimate the expenses that you paid over the period. Simply divide your account value by $1,000 (for example, an $8,600 account value divided by $1,000 = 8.6), then multiply the result by the number in the table under the heading entitled "Actual Expenses Paid During Period" to estimate the expenses you paid on your account during this period.
Hypothetical Example for Comparison Purposes
The table below provides information about hypothetical account values and hypothetical expenses based on the Fund's actual expense ratio and an assumed rate of return of 5% per year before expenses, which is not the Fund's actual return. The hypothetical account values and expenses may not be used to estimate the actual ending account balance or expenses you paid for the period. You may use this information to compare the ongoing costs of investing in the Fund and other funds. To do so, compare this 5% hypothetical example with the 5% hypothetical examples that appear in the shareholder reports of the other funds.
Please note that the expenses shown in the table are meant to highlight your ongoing costs only and do not reflect any transactional costs, such as sales charges (loads) and redemption fees. Therefore, the information for each class in the table is useful in comparing ongoing costs only, and will not help you determine the relative total costs of owning different funds. In addition, if these transactional costs were included, your costs would have been higher.
| | | Beginning
Account
Value
7/1/19 | | Actual Ending
Account
Value
12/31/19 | | Hypothetical
Ending Account
Value | | Actual
Expenses
Paid
During
Period* | | Hypothetical
Expenses Paid
During Period* | | Net
Expense
Ratio
During
Period** | |
Emerging Markets Portfolio Class I | | $ | 1,000.00 | | | $ | 1,087.30 | | | $ | 1,019.91 | | | $ | 5.52 | | | $ | 5.35 | | | | 1.05 | % | |
Emerging Markets Portfolio Class A | | | 1,000.00 | | | | 1,086.20 | | | | 1,018.60 | | | | 6.89 | | | | 6.67 | | | | 1.31 | | |
Emerging Markets Portfolio Class L | | | 1,000.00 | | | | 1,082.70 | | | | 1,015.63 | | | | 9.97 | | | | 9.65 | | | | 1.90 | | |
Emerging Markets Portfolio Class C | | | 1,000.00 | | | | 1,081.40 | | | | 1,014.37 | | | | 11.28 | | | | 10.92 | | | | 2.15 | | |
Emerging Markets Portfolio Class IS | | | 1,000.00 | | | | 1,088.10 | | | | 1,020.42 | | | | 5.00 | | | | 4.84 | | | | 0.95 | | |
Emerging Markets Portfolio Class IR | | | 1,000.00 | | | | 1,088.10 | | | | 1,020.42 | | | | 5.00 | | | | 4.84 | | | | 0.95 | | |
* Expenses are calculated using each Fund Class' annualized net expense ratio (as disclosed), multiplied by the average account value over the period and multiplied by 184/365 (to reflect the most recent one-half year period).
** Annualized.
3
Morgan Stanley Institutional Fund, Inc.
Annual Report — December 31, 2019
Investment Overview (unaudited)
Emerging Markets Portfolio
The Fund seeks long-term capital appreciation by investing primarily in growth-oriented equity securities of issuers in emerging market countries.
Performance
For the fiscal year ended December 31, 2019, the Fund's Class I shares had a total return based on net asset value and reinvestment of distributions per share of 19.44%, net of fees. The Fund's Class I shares outperformed the Fund's benchmark, the MSCI Emerging Markets Index (the "Index"), which returned 18.42%.
Factors Affecting Performance
• In broad terms, the regime shift we have expected — of greater dispersion in country returns and investor recognition of not only improving country growth but also a wider number of quality companies delivering steady earnings — began to play out in 2019. While information technology companies delivered the highest aggregate returns, companies in other compelling sectors — which had lagged in the previous three years when tech was all-encompassing — were recognized and rewarded by investors. China outperformed the Index for the year, but in a shift from 2016-2018, even higher equity returns occurred in several other countries where investors recognized and rewarded reforms that have been enacted, accelerating economic growth, cheap currencies, low debt levels and the beginnings of healthy credit cycles. We are confident these trends could play out even further in 2020 and beyond.
• For the full year, our aggregate stock selection contributed positively to performance and country allocation contributed effectively in all but a handful of cases. Our underweight allocation to and stock selection in Korea and stock selection in China were the top contributors to performance.
• Our stock selection in Taiwan and Russia also contributed strongly. In Russia we continue to like selected domestic names for their secular growth opportunities and market share gains, namely a food retailer, a banking/financial services company and internet search engine. Our overweight to a nickel producer was a top contributor. Our allocation to selected technology names in Taiwan, such as a semiconductor manufacturer and a fabless chip maker, also added to performance.
• The primary detractor from returns was our stock selection in India. Similar to much of 2018, 2019 was characterized by a domestic growth slowdown which led to a narrow rally where investors flocked to the safety of index heavyweights. Detractors included our overweight allocation to a commercial vehicle manufacturer, which benefited from years of industry upscale but suffered from the economic slowdown, and a mass media company, which underperformed from group-level complexities and the pledged share sale transmission mechanism.
• Our stock selection in and overweight allocation to Peru and overweight allocation to Turkey also hampered returns.
• The Fund sometimes uses derivative instruments to manage certain market or currency exposures. In the period, the use of currency forward contracts had a negative impact.
Management Strategies
• In our portfolio we remain invested in good quality, growth-oriented companies capable of sustaining or expanding their earnings as a result of healthy or improving domestic demand and resistance to declines in global trade. Our aggregate sector overweights are in the financials, health care and consumer staples and discretionary sectors — which we believe should benefit from the economic recovery and expansion phase that most emerging market countries only began to enter in the past couple years. We remain underweight those countries where growth is slowing down, owing to a combination of high debt, overvalued currencies, demographic pressures or major exposure to trade hindrances.
• We continue to overweight the Central and Eastern European region primarily through our exposure to stocks in Poland and Hungary. We think that growth in Central and Eastern Europe should remain healthy, driven by sustainable domestic demand and the lack of major imbalances. Many of these markets have also been largely ignored in the last three years as investors focused on technology-driven companies and North Asia. We see the region as offering attractive investment opportunities through a combination of this solid economic growth and overlooked equity markets.
4
Morgan Stanley Institutional Fund, Inc.
Annual Report — December 31, 2019
Investment Overview (unaudited) (cont'd)
Emerging Markets Portfolio
Poland and Hungary both feature consumer growth accelerating at a faster pace than overall growth as households and businesses tap credit markets from a low base. We continue to like stocks that are exposed to secular growth opportunities in banks, staples, health care and industrial sectors in the region. We have focused the portfolio on stocks with earnings driven by volume growth and operating leverage independent of policy rates.
• We remain overweight Brazil. The market has been driven by a broad reform narrative since the election of President Bolsonaro in 2018, and we believe the recovery will start to take the lead this year. The recovery has been slow to materialize as the economy comes off a deep five-year recession, and 2019 gross domestic product (GDP) growth disappointed. However, the positive signs we saw in the fourth quarter of 2019 should continue in 2020, particularly as structural reforms — including more privatization, concessions, increased fiscal reform and the potential for tax reform — continue leading into elections later this year. The critical passage of pension reform in October 2019 helped reduce the fiscal headwind. We believe the economy is showing signs of a recovery, supported by the low base, easy financial conditions and continuing macroeconomic reforms.
• We remain overweight Indonesia as the country continues to make reform progress, delivers high and accelerating growth relative to northern Asian markets vulnerable to trade disruptions, and is benefiting from some improvements in foreign direct investment (FDI). The country should continue to post GDP growth around 5%.(i) Indonesia has room to be accommodative on monetary policy, as long as inflation remains benign and overall stability is maintained, which appears likely. Overall policy direction is focused on supply-side reform and policy makers are aware that they need to focus on this in order to generate much needed FDI to fund their current account deficit. Other reforms which should be supportive of growth include enhancements to education/vocational training and review of the 2003 labor law, which would ideally make it easier for employers to right-size their formal workforce
and invest in better training. Additionally, the administration of President Joko Widodo has put forth plans to roll back some of the subsidies of 2019 (subject to budget approval) and is studying a new tax law which includes potentially reducing corporate tax and introducing a digital tax.
• We remain overweight Mexico. Investors worried about the policy intentions of President-elect Andres Manuel Lopez Obrador (AMLO), when he announced in October 2018 that the new Mexico City Airport construction project was voted down in a narrow referendum. After AMLO was sworn in as president on December 1, 2018, however, his administration sent more encouraging signals on a fairly responsible fiscal budget. We remain broadly constructive on the steadily improving Mexican consumer story, which has been bolstered by a combination of AMLO's victory, strong remittance flows, the potential for minimum wage hikes and continuing improved access to credit from a low base. All of this should support private consumption at the lower income levels. North American trade fears largely subsided as the U.S., Mexico and Canada agreed to replace the North American Free Trade Agreement with a new agreement the U.S. refers to as the USMCA (U.S.-Mexico-Canada Agreement). We remain focused on stocks that can benefit from stable growth, a healthy consumer and structural improvements stemming from direct investment.
• Korea remains our largest underweight in the portfolio. The economy continues to be impacted by the global slowdown, the cyclical decline in DRAM memory storage and the fall in Chinese auto demand. On domestic policy, there have been negative consequences from the Moon administration's increase in the minimum wage — chiefly higher unemployment as the traditional mom-and-pop stores struggled to keep up with rising costs. The Supreme Court-ordered retrial of Samsung billionaire J.Y. Lee — who had been indicted for bribery charges — is a reflection of the anti-business sentiment of the government. On the back of poor market performance, securities — particularly in the DRAM segment — saw earnings downgrades across the board. Given all these
(i) Source: International Monetary Fund, World Economic Outlook, October 2019.
5
Morgan Stanley Institutional Fund, Inc.
Annual Report — December 31, 2019
Investment Overview (unaudited) (cont'd)
Emerging Markets Portfolio
negative pressures, our stock selection in Korea remains focused on identifying growth opportunities within the specific themes of biotechnology, gaming, select global cyclicals (as they relate to the International Maritime Organization 2020 regulation) and China plays linked to improving relations between the two nations (largely in the consumer discretionary segment).
• We remain underweight China as it is hard hit by a "four D" world (de-globalization, debt accumulation, declining productivity and demographic pressures). The country still faces continued slowing growth, stemming from a combination of high debt levels, a demographic overhang, an expensive currency and declining trade as deglobalization continues for years to come. Growth has been trending lower steadily since the Global Financial Crisis, which China responded to with a massive issuance of debt, though we note this is largely in the state-owned sector. By contrast, companies in so-called "New China," primarily focused on tech, education and services linked to rising consumption, have very little debt. There are many positive structural themes that will likely play out in China, including ongoing industry consolidation and additional consumption upgrades as income per capita rises. Many sectors have passed the rapidly rising penetration stage. We believe that industry leaders with strong competitive advantages and financial strength should be able to gain market share and become even bigger and stronger. In our portfolio, we continue to focus on industry consolidators with sustainable, compounding growth. We expect the market appetite to resume for the "New China" companies as growth expectations are reset and valuation levels find support.

* Minimum Investment for Class I shares
In accordance with SEC regulations, the Fund's performance shown assumes that all recurring fees (including management fees) were deducted and all dividends and distributions were reinvested. The performance of Class A, L, C, IS and IR shares will vary from the performance of Class I shares based upon their different inception dates and will be negatively impacted by additional fees assessed to those classes (if applicable).
6
Morgan Stanley Institutional Fund, Inc.
Annual Report — December 31, 2019
Investment Overview (unaudited) (cont'd)
Emerging Markets Portfolio
Performance Compared to the MSCI Emerging Markets Index(1) and the Lipper Emerging Markets Funds Index(2)
| | | Period Ended December 31, 2019
Total Returns(3) | |
| | | | | Average Annual | |
| | | One
Year | | Five
Years | | Ten
Years | | Since
Inception(10) | |
Fund — Class I Shares
w/o sales charges(4) | | | 19.44 | % | | | 4.99 | % | | | 3.45 | % | | | 7.54 | % | |
Fund — Class A Shares
w/o sales charges(5) | | | 19.08 | | | | 4.65 | | | | 3.15 | | | | 6.46 | | |
Fund — Class A Shares with
maximum 5.25% sales charges(5) | | | 12.83 | | | | 3.53 | | | | 2.60 | | | | 6.23 | | |
Fund — Class L Shares
w/o sales charges(6) | | | 18.37 | | | | 4.07 | | | | — | | | | 2.50 | | |
Fund — Class C Shares
w/o sales charges(8) | | | 18.16 | | | | — | | | | — | | | | 2.36 | | |
Fund — Class C Shares with
maximum 1.00% deferred
sales charges(8) | | | 17.16 | | | | — | | | | — | | | | 2.36 | | |
Fund — Class IS Shares
w/o sales charges(7) | | | 19.58 | | | | 5.07 | | | | — | | | | 3.57 | | |
Fund — Class IR Shares
w/o sales charges(9) | | | 19.53 | | | | — | | | | — | | | | 3.47 | | |
MSCI Emerging Markets Index | | | 18.42 | | | | 5.61 | | | | 3.68 | | | | 7.44 | | |
Lipper Emerging Markets Funds Index | | | 21.13 | | | | 5.91 | | | | 4.19 | | | | N/A | | |
Performance data quoted represents past performance, which is no guarantee of future results, and current performance may be lower or higher than the figures shown. Performance assumes that all dividends and distributions, if any, were reinvested. For the most recent month-end performance figures, please visit www.morganstanley.com/im/shareholderreports. Investment return and principal value will fluctuate so that Fund shares, when redeemed, may be worth more or less than their original cost. Total returns do not reflect the deduction of taxes that a shareholder would pay on Fund distributions or the redemption of Fund shares. Performance of share classes will vary due to difference in sales charges and expenses.
(1) The MSCI Emerging Markets Index is a free float-adjusted market capitalization weighted index that is designed to measure equity market performance of emerging markets. The term "free float" represents the portion of shares outstanding that are deemed to be available for purchase in the public equity markets by investors. The MSCI Emerging Markets Index currently consists of 26 emerging market country indices. The performance of the Index is listed in U.S. dollars and assumes reinvestment of net dividends. Returns, including periods prior to January 1, 2001, are calculated using the return data of the MSCI Emerging Markets Index (gross dividends) through December 31, 2000 and the return data of the MSCI Emerging Markets Net Index (net dividends) after December 31, 2000. Net total return indices reinvest dividends after the deduction of withholding taxes, using (for international indices) a tax rate applicable to non-resident institutional investors who do not benefit from double taxation treaties. The Index is unmanaged and its returns do not include any sales charges or fees. Such costs would lower performance. It is not possible to invest directly in an index.
(2) The Lipper Emerging Markets Funds Index is an equally weighted performance index of the largest qualifying funds (based on net assets) in the Lipper Emerging Markets Funds classification. The Index, which is adjusted for capital gains distributions and income dividends, is unmanaged and should not be considered an investment. There are currently 30 funds represented in this Index. As of the date of this report, the Fund was in the Lipper Emerging Market Funds classification.
(3) Total returns for the Fund reflect fees waived and expenses reimbursed, if applicable, by the Adviser (as defined herein). Without such waivers and reimbursements, total returns would have been lower.
(4) Commenced operations on September 25, 1992.
(5) Commenced offering on January 2, 1996.
(6) Commenced offering on April 27, 2012.
(7) Commenced offering on September 13, 2013.
(8) Commenced offering on April 30, 2015.
(9) Commenced offering on June 15, 2018.
(10) For comparative purposes, average annual since inception returns listed for the Indexes refer to the inception date of Class I of the Fund, not the inception of the Index.
7
Morgan Stanley Institutional Fund, Inc.
Annual Report — December 31, 2019
Portfolio of Investments
Emerging Markets Portfolio
| | | Shares | | Value
(000) | |
Common Stocks (99.5%) | |
Brazil (10.7%) | |
Ambev SA | | | 2,457,273 | | | $ | 11,439 | | |
Atacadao SA | | | 1,496,416 | | | | 8,716 | | |
B3 SA — Brasil Bolsa Balcao | | | 1,026,671 | | | | 11,029 | | |
Banco do Brasil SA | | | 254,456 | | | | 3,359 | | |
Hapvida Participacoes e Investimentos SA | | | 450,233 | | | | 7,171 | | |
Itau Unibanco Holding SA (Preference) | | | 920,413 | | | | 8,525 | | |
Lojas Renner SA | | | 723,538 | | | | 10,154 | | |
Petroleo Brasileiro SA | | | 1,089,486 | | | | 8,727 | | |
Petroleo Brasileiro SA (Preference) | | | 1,188,295 | | | | 8,975 | | |
Telefonica Brasil SA (Preference) | | | 593,100 | | | | 8,573 | | |
| | | | 86,668 | | |
China (28.8%) | |
Alibaba Group Holding Ltd. ADR (a) | | | 176,618 | | | | 37,461 | | |
Anhui Conch Cement Co., Ltd., Class A | | | 1,004,367 | | | | 7,901 | | |
Baidu, Inc. ADR (a) | | | 24,148 | | | | 3,052 | | |
Bank of China Ltd. H Shares (b) | | | 27,368,000 | | | | 11,696 | | |
China Construction Bank Corp. H Shares (b) | | | 16,370,120 | | | | 14,138 | | |
China International Capital Corp., Ltd.
H Shares (b)(c) | | | 1,260,000 | | | | 2,429 | | |
China Life Insurance Co., Ltd. H Shares (b) | | | 2,879,000 | | | | 7,999 | | |
China Mengniu Dairy Co., Ltd. (a)(b) | | | 2,386,000 | | | | 9,645 | | |
China Mobile Ltd. (b) | | | 624,780 | | | | 5,252 | | |
China Overseas Land & Investment Ltd. (b) | | | 1,540,000 | | | | 5,998 | | |
China Resources Beer Holdings Co., Ltd. (b) | | | 1,668,000 | | | | 9,226 | | |
China Resources Land Ltd. (b) | | | 858,000 | | | | 4,272 | | |
CSPC Pharmaceutical Group Ltd. (b) | | | 3,280,000 | | | | 7,821 | | |
Inner Mongolia Yili Industrial Group
Co., Ltd., Class A | | | 910,894 | | | | 4,046 | | |
Kweichow Moutai Co., Ltd., Class A | | | 56,662 | | | | 9,623 | | |
New Oriental Education & Technology
Group, Inc. ADR (a) | | | 69,053 | | | | 8,373 | | |
Pinduoduo, Inc. ADR (a) | | | 122,100 | | | | 4,618 | | |
Ping An Insurance Group Co. of China Ltd.,
Class A | | | 474,674 | | | | 5,824 | | |
Ping An Insurance Group Co. of China Ltd.
H Shares (b) | | | 587,000 | | | | 6,938 | | |
Shanghai Pharmaceuticals Holding Co., Ltd.
H Shares (b) | | | 877,700 | | | | 1,708 | | |
Shenzhou International Group Holdings Ltd. (b) | | | 697,300 | | | | 10,192 | | |
Sino Biopharmaceutical Ltd. (b) | | | 3,628,000 | | | | 5,075 | | |
Sinopharm Group Co., Ltd. H Shares (b) | | | 446,800 | | | | 1,631 | | |
TAL Education Group ADR (a) | | | 95,142 | | | | 4,586 | | |
Tencent Holdings Ltd. (b) | | | 817,600 | | | | 39,410 | | |
Universal Scientific Industrial Shanghai
Co., Ltd., Class A | | | 1,482,389 | | | | 4,092 | | |
Yihai International Holding Ltd. (a)(b) | | | 205,000 | | | | 1,202 | | |
| | | | 234,208 | | |
Egypt (0.9%) | |
Commercial International Bank Egypt SAE | | | 1,482,283 | | | | 7,665 | | |
Germany (0.5%) | |
Adidas AG | | | 12,236 | | | | 3,983 | | |
| | | Shares | | Value
(000) | |
Hong Kong (0.4%) | |
Budweiser Brewing Co. APAC Ltd. (a) | | | 1,050,900 | | | $ | 3,547 | | |
Hungary (2.6%) | |
OTP Bank Nyrt | | | 242,864 | | | | 12,716 | | |
Richter Gedeon Nyrt | | | 379,056 | | | | 8,243 | | |
| | | | 20,959 | | |
India (8.2%) | |
Axis Bank Ltd. | | | 777,306 | | | | 8,212 | | |
Eicher Motors Ltd. | | | 15,121 | | | | 4,770 | | |
HDFC Bank Ltd. ADR | | | 99,332 | | | | 6,295 | | |
ICICI Bank Ltd. | | | 1,289,120 | | | | 9,733 | | |
ICICI Prudential Life Insurance Co., Ltd. | | | 1,010,126 | | | | 6,827 | | |
IndusInd Bank Ltd. | | | 273,023 | | | | 5,776 | | |
Infosys Ltd. | | | 612,094 | | | | 6,270 | | |
Infosys Ltd. ADR | | | 191,980 | | | | 1,981 | | |
L&T Finance Holdings Ltd. | | | 2,096,722 | | | | 3,482 | | |
Larsen & Toubro Ltd. | | | 389,082 | | | | 7,076 | | |
Shree Cement Ltd. | | | 21,958 | | | | 6,265 | | |
| | | | 66,687 | | |
Indonesia (5.0%) | |
Astra International Tbk PT | | | 12,908,600 | | | | 6,430 | | |
Bank Central Asia Tbk PT | | | 7,533,500 | | | | 18,118 | | |
Bank Mandiri Persero Tbk PT | | | 5,526,200 | | | | 3,054 | | |
Bank Rakyat Indonesia Persero Tbk PT | | | 25,370,650 | | | | 8,030 | | |
Telekomunikasi Indonesia Persero Tbk PT | | | 17,471,400 | | | | 5,005 | | |
| | | | 40,637 | | |
Korea, Republic of (5.1%) | |
Hotel Shilla Co., Ltd. | | | 56,919 | | | | 4,449 | | |
LG Chem Ltd. | | | 7,286 | | | | 1,997 | | |
LG Household & Health Care Ltd. | | | 4,368 | | | | 4,745 | | |
Macquarie Korea Infrastructure Fund | | | 200,259 | | | | 2,008 | | |
NCSoft Corp. | | | 11,636 | | | | 5,429 | | |
S-Oil Corp. | | | 31,675 | | | | 2,602 | | |
Samsung Biologics Co., Ltd. (a)(c) | | | 6,864 | | | | 2,561 | | |
Samsung Electronics Co., Ltd. | | | 369,177 | | | | 17,789 | | |
| | | | 41,580 | | |
Malaysia (0.9%) | |
Malayan Banking Bhd | | | 1,422,029 | | | | 3,003 | | |
Public Bank Bhd | | | 984,900 | | | | 4,681 | | |
| | | | 7,684 | | |
Mexico (3.8%) | |
Alsea SAB de CV (a) | | | 1,625,023 | | | | 4,283 | | |
Grupo Financiero Banorte SAB de CV Series O | | | 1,733,475 | | | | 9,678 | | |
Infraestructura Energetica Nova SAB de CV | | | 1,386,123 | | | | 6,508 | | |
Wal-Mart de Mexico SAB de CV | | | 3,514,928 | | | | 10,091 | | |
| | | | 30,560 | | |
Peru (2.2%) | |
Cia de Minas Buenaventura SAA ADR | | | 663,493 | | | | 10,019 | | |
Credicorp Ltd. | | | 35,630 | | | | 7,594 | | |
| | | | 17,613 | | |
The accompanying notes are an integral part of the financial statements.
8
Morgan Stanley Institutional Fund, Inc.
Annual Report — December 31, 2019
Portfolio of Investments (cont'd)
Emerging Markets Portfolio
| | | Shares | | Value
(000) | |
Philippines (1.0%) | |
Ayala Land, Inc. | | | 4,523,110 | | | $ | 4,057 | | |
Jollibee Foods Corp. | | | 940,310 | | | | 4,006 | | |
SM Investments Corp. | | | 16,995 | | | | 350 | | |
| | | | 8,413 | | |
Poland (2.7%) | |
Jeronimo Martins SGPS SA | | | 427,147 | | | | 7,027 | | |
LPP SA | | | 3,339 | | | | 7,762 | | |
Santander Bank Polska SA | | | 91,828 | | | | 7,439 | | |
| | | | 22,228 | | |
Russia (5.3%) | |
MMC Norilsk Nickel PJSC ADR (OTCBB) | | | 344,070 | | | | 10,511 | | |
MMC Norilsk Nickel PJSC ADR (XLON) | | | 26,330 | | | | 803 | | |
Sberbank of Russia PJSC ADR | | | 747,721 | | | | 12,293 | | |
X5 Retail Group N.V. GDR | | | 315,407 | | | | 10,882 | | |
Yandex N.V., Class A (a) | | | 192,098 | | | | 8,354 | | |
| | | | 42,843 | | |
Singapore (0.5%) | |
DBS Group Holdings Ltd. | | | 216,000 | | | | 4,156 | | |
South Africa (5.7%) | |
Bidvest Group Ltd. (The) | | | 600,826 | | | | 8,784 | | |
Capitec Bank Holdings Ltd. | | | 81,596 | | | | 8,425 | | |
Clicks Group Ltd. | | | 451,970 | | | | 8,280 | | |
Nedbank Group Ltd. | | | 373,740 | | | | 5,719 | | |
Reunert Ltd. | | | 783,864 | | | | 4,063 | | |
Sanlam Ltd. | | | 2,008,988 | | | | 11,346 | | |
| | | | 46,617 | | |
Taiwan (10.4%) | |
ASE Technology Holding Co., Ltd. | | | 1,507,626 | | | | 4,185 | | |
Cathay Financial Holding Co., Ltd. | | | 1,397,000 | | | | 1,983 | | |
CTBC Financial Holding Co., Ltd. | | | 7,409,000 | | | | 5,536 | | |
Eclat Textile Co., Ltd. | | | 185,000 | | | | 2,487 | | |
Hon Hai Precision Industry Co., Ltd. | | | 663,360 | | | | 2,009 | | |
Largan Precision Co., Ltd. | | | 13,000 | | | | 2,169 | | |
MediaTek, Inc. | | | 476,000 | | | | 7,042 | | |
Mega Financial Holding Co., Ltd. | | | 4,726,000 | | | | 4,824 | | |
Nanya Technology Corp. | | | 710,000 | | | | 1,975 | | |
President Chain Store Corp. | | | 84,000 | | | | 852 | | |
Taiwan Cement Corp. | | | 1,044,702 | | | | 1,523 | | |
Taiwan Semiconductor Manufacturing Co., Ltd. | | | 4,280,205 | | | | 47,261 | | |
Vanguard International Semiconductor Corp. | | | 1,091,000 | | | | 2,886 | | |
| | | | 84,732 | | |
Thailand (2.2%) | |
Bangkok Dusit Medical Services PCL
(Foreign Shares) | | | 4,941,200 | | | | 4,282 | | |
CP ALL PCL (Foreign Shares) | | | 1,925,100 | | | | 4,639 | | |
Muangthai Capital PCL (Foreign Shares) | | | 1,624,200 | | | | 3,452 | | |
PTT PCL (Foreign Shares) | | | 3,952,600 | | | | 5,800 | | |
| | | | 18,173 | | |
| | | Shares | | Value
(000) | |
Turkey (1.8%) | |
Akbank T.A.S. (a) | | | 6,258,251 | | | $ | 8,532 | | |
Tupras Turkiye Petrol Rafinerileri AS | | | 279,261 | | | | 5,952 | | |
| | | | 14,484 | | |
United States (0.8%) | |
NIKE, Inc., Class B | | | 60,594 | | | | 6,139 | | |
Total Common Stocks (Cost $624,371) | | | 809,576 | | |
Short-Term Investments (1.2%) | |
Securities held as Collateral on Loaned Securities (0.5%) | |
Investment Company (0.5%) | |
Morgan Stanley Institutional Liquidity
Funds — Government Portfolio —
Institutional Class (See Note G)
(Cost $4,264) | | | 4,263,543 | | | | 4,264 | | |
Investment Company (0.7%) | |
Morgan Stanley Institutional Liquidity
Funds — Government Portfolio —
Institutional Class (See Note G)
(Cost $5,308) | | | 5,308,294 | | | | 5,308 | | |
Total Short-Term Investments (Cost $9,572) | | | 9,572 | | |
Total Investments (100.7%) (Cost $633,943)
Including $4,042 of Securities Loaned (d)(e)(f) | | | 819,148 | | |
Liabilities in Excess of Other Assets (–0.7%) | | | (5,749 | ) | |
Net Assets (100.0%) | | $ | 813,399 | | |
Country assignments and aggregations are based generally on third party vendor classifications and information, and may be different from the assignments and aggregations under the policies set forth in the Fund's prospectus and/or statement of additional information relating to geographic classifications.
(a) Non-income producing security.
(b) Security trades on the Hong Kong exchange.
(c) All or a portion of this security was on loan at December 31, 2019.
(d) Securities are available for collateral in connection with open foreign currency forward exchange contract.
(e) The approximate fair value and percentage of net assets, $217,441,000 and 26.7%, respectively, represent the securities that have been fair valued under the fair valuation policy for international investments as described in Note A-1 within the Notes to the Financial Statements.
(f) At December 31, 2019, the aggregate cost for federal income tax purposes is approximately $648,195,000. The aggregate gross unrealized appreciation is approximately $183,974,000 and the aggregate gross unrealized depreciation is approximately $13,531,000, resulting in net unrealized appreciation of approximately $170,443,000.
ADR American Depositary Receipt.
GDR Global Depositary Receipt.
OTCBB OTC Bulletin Board.
PJSC Public Joint Stock Company.
XLON London Stock Exchange.
The accompanying notes are an integral part of the financial statements.
9
Morgan Stanley Institutional Fund, Inc.
Annual Report — December 31, 2019
Portfolio of Investments (cont'd)
Emerging Markets Portfolio
Foreign Currency Forward Exchange Contract:
The Fund had the following foreign currency forward exchange contract open at December 31, 2019:
Counterparty | | Contract to
Deliver
(000) | | In Exchange
For
(000) | | Delivery
Date | | Unrealized
Depreciation
(000) | |
Goldman Sachs International | | HKD | 934,717 | | | $ | 119,401 | | | 2/7/20 | | $ | (510 | ) | |
HKD — Hong Kong Dollar
Portfolio Composition*
Classification | | Percentage of
Total Investments | |
Other** | | | 45.2 | % | |
Banks | | | 24.4 | | |
Semiconductors & Semiconductor Equipment | | | 7.8 | | |
Interactive Media & Services | | | 6.2 | | |
Food & Staples Retailing | | | 6.2 | | |
Internet & Direct Marketing Retail | | | 5.2 | | |
Insurance | | | 5.0 | | |
Total Investments | | | 100.0 | %*** | |
* Percentages indicated are based upon total investments (excluding Securities held as Collateral on Loaned Securities) as of December 31, 2019.
** Industries and/or investment types representing less than 5% of total investments.
*** Does not include an open foreign currency forward exchange contract with unrealized depreciation of approximately $510,000.
The accompanying notes are an integral part of the financial statements.
10
Morgan Stanley Institutional Fund, Inc.
Annual Report — December 31, 2019
Emerging Markets Portfolio
Statement of Assets and Liabilities | | December 31, 2019
(000) | |
Assets: | |
Investments in Securities of Unaffiliated Issuers, at Value(1) (Cost $624,371) | | $ | 809,576 | | |
Investment in Security of Affiliated Issuer, at Value (Cost $9,572) | | | 9,572 | | |
Total Investments in Securities, at Value (Cost $633,943) | | | 819,148 | | |
Foreign Currency, at Value (Cost $812) | | | 819 | | |
Receivable for Investments Sold | | | 3,150 | | |
Dividends Receivable | | | 1,786 | | |
Receivable for Fund Shares Sold | | | 722 | | |
Tax Reclaim Receivable | | | 194 | | |
Receivable from Affiliate | | | 11 | | |
Receivable from Securities Lending Income | | | 3 | | |
Other Assets | | | 117 | | |
Total Assets | | | 825,950 | | |
Liabilities: | |
Collateral on Securities Loaned, at Value | | | 4,264 | | |
Payable for Investments Purchased | | | 2,612 | | |
Payable for Fund Shares Redeemed | | | 2,278 | | |
Payable for Advisory Fees | | | 1,523 | | |
Deferred Capital Gain Country Tax | | | 793 | | |
Unrealized Depreciation on Foreign Currency Forward Exchange Contract | | | 510 | | |
Payable for Reorganization Expense | | | 191 | | |
Payable for Custodian Fees | | | 113 | | |
Payable for Sub Transfer Agency Fees — Class I | | | 50 | | |
Payable for Sub Transfer Agency Fees — Class A | | | 1 | | |
Payable for Sub Transfer Agency Fees — Class L | | | — | @ | |
Payable for Sub Transfer Agency Fees — Class C | | | — | @ | |
Payable for Administration Fees | | | 42 | | |
Payable for Professional Fees | | | 41 | | |
Payable for Transfer Agency Fees — Class I | | | 10 | | |
Payable for Transfer Agency Fees — Class A | | | 1 | | |
Payable for Transfer Agency Fees — Class L | | | — | @ | |
Payable for Transfer Agency Fees — Class C | | | — | @ | |
Payable for Transfer Agency Fees — Class IS | | | — | @ | |
Payable for Transfer Agency Fees — Class IR | | | — | @ | |
Payable for Shareholder Services Fees — Class A | | | 3 | | |
Payable for Distribution and Shareholder Services Fees — Class L | | | — | @ | |
Payable for Distribution and Shareholder Services Fees — Class C | | | — | @ | |
Other Liabilities | | | 119 | | |
Total Liabilities | | | 12,551 | | |
Net Assets | | $ | 813,399 | | |
Net Assets Consist of: | |
Paid-in-Capital | | $ | 636,472 | | |
Total Distributable Earnings | | | 176,927 | | |
Net Assets | | $ | 813,399 | | |
The accompanying notes are an integral part of the financial statements.
11
Morgan Stanley Institutional Fund, Inc.
Annual Report — December 31, 2019
Emerging Markets Portfolio
Statement of Assets and Liabilities (cont'd) | | December 31, 2019
(000) | |
CLASS I: | |
Net Assets | | $ | 277,114 | | |
| Shares Outstanding $0.001 par value shares of beneficial interest (unlimited shares authorized) (not in 000's) | | | 11,698,325 | | |
Net Asset Value, Offering and Redemption Price Per Share | | $ | 23.69 | | |
CLASS A: | |
Net Assets | | $ | 11,195 | | |
| Shares Outstanding $0.001 par value shares of beneficial interest (unlimited shares authorized) (not in 000's) | | | 485,629 | | |
Net Asset Value, Redemption Price Per Share | | $ | 23.05 | | |
Maximum Sales Load | | | 5.25 | % | |
Maximum Sales Charge | | $ | 1.28 | | |
Maximum Offering Price Per Share | | $ | 24.33 | | |
CLASS L: | |
Net Assets | | $ | 210 | | |
| Shares Outstanding $0.001 par value shares of beneficial interest (unlimited shares authorized) (not in 000's) | | | 9,301 | | |
Net Asset Value, Offering and Redemption Price Per Share | | $ | 22.59 | | |
CLASS C: | |
Net Assets | | $ | 454 | | |
| Shares Outstanding $0.001 par value shares of beneficial interest (unlimited shares authorized) (not in 000's) | | | 20,237 | | |
Net Asset Value, Offering and Redemption Price Per Share | | $ | 22.45 | | |
CLASS IS: | |
Net Assets | | $ | 524,416 | | |
| Shares Outstanding $0.001 par value shares of beneficial interest (unlimited shares authorized) (not in 000's) | | | 22,145,622 | | |
Net Asset Value, Offering and Redemption Price Per Share | | $ | 23.68 | | |
CLASS IR: | |
Net Assets | | $ | 10 | | |
| Shares Outstanding $0.001 par value shares of beneficial interest (unlimited shares authorized) (not in 000's) | | | 434 | | |
Net Asset Value, Offering and Redemption Price Per Share | | $ | 23.68 | | |
(1) Including:
Securities on Loan, at Value: | | $ | 4,042 | | |
@ Amount is less than $500.
The accompanying notes are an integral part of the financial statements.
12
Morgan Stanley Institutional Fund, Inc.
Annual Report — December 31, 2019
Emerging Markets Portfolio
Year Ended
Statement of Operations | | December 31, 2019
(000) | |
Investment Income: | |
Dividends from Securities of Unaffiliated Issuers (Net of $2,820 of Foreign Taxes Withheld) | | $ | 21,522 | | |
Dividends from Security of Affiliated Issuer (Note G) | | | 449 | | |
Income from Securities Loaned — Net | | | 77 | | |
Total Investment Income | | | 22,048 | | |
Expenses: | |
Advisory Fees (Note B) | | | 6,997 | | |
Administration Fees (Note C) | | | 694 | | |
Custodian Fees (Note F) | | | 481 | | |
Excise Tax | | | 440 | | |
Sub Transfer Agency Fees — Class I | | | 309 | | |
Sub Transfer Agency Fees — Class A | | | 16 | | |
Sub Transfer Agency Fees — Class L | | | — | @ | |
Sub Transfer Agency Fees — Class C | | | — | @ | |
Professional Fees | | | 144 | | |
Registration Fees | | | 105 | | |
Transfer Agency Fees — Class I (Note E) | | | 65 | | |
Transfer Agency Fees — Class A (Note E) | | | 4 | | |
Transfer Agency Fees — Class L (Note E) | | | 2 | | |
Transfer Agency Fees — Class C (Note E) | | | 2 | | |
Transfer Agency Fees — Class IS (Note E) | | | 2 | | |
Transfer Agency Fees — Class IR (Note E) | | | 2 | | |
Shareholder Reporting Fees | | | 50 | | |
Shareholder Services Fees — Class A (Note D) | | | 35 | | |
Distribution and Shareholder Services Fees — Class L (Note D) | | | 2 | | |
Distribution and Shareholder Services Fees — Class C (Note D) | | | 4 | | |
Directors' Fees and Expenses | | | 41 | | |
Pricing Fees | | | 7 | | |
Other Expenses | | | 56 | | |
Expenses Before Non Operating Expenses | | | 9,458 | | |
Bank Overdraft Expense | | | 35 | | |
Total Expenses | | | 9,493 | | |
Waiver of Advisory Fees (Note B) | | | (777 | ) | |
Reimbursement of Class Specific Expenses — Class I (Note B) | | | (51 | ) | |
Reimbursement of Class Specific Expenses — Class L (Note B) | | | (1 | ) | |
Reimbursement of Class Specific Expenses — Class C (Note B) | | | (1 | ) | |
Reimbursement of Class Specific Expenses — Class IS (Note B) | | | (2 | ) | |
Reimbursement of Class Specific Expenses — Class IR (Note B) | | | (2 | ) | |
Rebate from Morgan Stanley Affiliate (Note G) | | | (33 | ) | |
Net Expenses | | | 8,626 | | |
Net Investment Income | | | 13,422 | | |
Realized Gain (Loss): | |
Investments Sold (Net of $245 of Capital Gain Country Tax) | | | 106,005 | | |
Foreign Currency Forward Exchange Contracts | | | (3,050 | ) | |
Foreign Currency Translation | | | (619 | ) | |
Futures Contracts | | | 4,893 | | |
Net Realized Gain | | | 107,229 | | |
Change in Unrealized Appreciation (Depreciation): | |
Investments (Net of Increase in Deferred Capital Gain Country Tax of $219) | | | 35,592 | | |
Foreign Currency Forward Exchange Contracts | | | 1,260 | | |
Foreign Currency Translation | | | (32 | ) | |
Futures Contracts | | | 363 | | |
Net Change in Unrealized Appreciation (Depreciation) | | | 37,183 | | |
Net Realized Gain and Change in Unrealized Appreciation (Depreciation) | | | 144,412 | | |
Net Increase in Net Assets Resulting from Operations | | $ | 157,834 | | |
@ Amount is less than $500.
The accompanying notes are an integral part of the financial statements.
13
Morgan Stanley Institutional Fund, Inc.
Annual Report — December 31, 2019
Emerging Markets Portfolio
Statements of Changes in Net Assets | | Year Ended
December 31, 2019
(000) | | Year Ended
December 31, 2018
(000) | |
Increase (Decrease) in Net Assets: | |
Operations: | |
Net Investment Income | | $ | 13,422 | | | $ | 15,055 | | |
Net Realized Gain | | | 107,229 | | | | 49,116 | | |
Net Change in Unrealized Appreciation (Depreciation) | | | 37,183 | | | | (303,741 | ) | |
Net Increase (Decrease) in Net Assets Resulting from Operations | | | 157,834 | | | | (239,570 | ) | |
Dividends and Distributions to Shareholders: | |
Class I | | | (33,365 | ) | | | (5,586 | ) | |
Class A | | | (1,495 | ) | | | (266 | ) | |
Class L | | | (29 | ) | | | (3 | ) | |
Class C | | | (55 | ) | | | (3 | ) | |
Class IS | | | (62,373 | ) | | | (20,307 | ) | |
Class IR | | | (1 | ) | | | (— | @) | |
Total Dividends and Distributions to Shareholders | | | (97,318 | ) | | | (26,165 | ) | |
Capital Share Transactions:(1) | |
Class I: | |
Subscribed | | | 28,345 | | | | 60,621 | | |
Issued due to a Tax-free Reorganization | | | 438,765 | | | | — | | |
Distributions Reinvested | | | 31,579 | | | | 5,497 | | |
Redeemed | | | (457,409 | ) | | | (120,158 | ) | |
Class A: | |
Subscribed | | | 3,722 | | | | 7,227 | | |
Distributions Reinvested | | | 1,482 | | | | 258 | | |
Redeemed | | | (8,421 | ) | | | (13,497 | ) | |
Class L: | |
Exchanged | | | — | | | | 118 | | |
Distributions Reinvested | | | 29 | | | | 3 | | |
Redeemed | | | (127 | ) | | | (33 | ) | |
Class C: | |
Subscribed | | | 108 | | | | 96 | | |
Distributions Reinvested | | | 55 | | | | 3 | | |
Redeemed | | | (28 | ) | | | (500 | ) | |
Class IS: | |
Subscribed | | | 100,062 | | | | 135,108 | | |
Distributions Reinvested | | | 52,608 | | | | 18,614 | | |
Redeemed | | | (478,275 | ) | | | (189,029 | ) | |
Class IR: | |
Subscribed | | | — | | | | 10 | (a) | |
Distributions Reinvested | | | 1 | | | | — | | |
Net Decrease in Net Assets Resulting from Capital Share Transactions | | | (287,504 | ) | | | (95,662 | ) | |
Redemption Fees | | | 11 | | | | 3 | | |
Total Decrease in Net Assets | | | (226,977 | ) | | | (361,394 | ) | |
Net Assets: | |
Beginning of Period | | | 1,040,376 | | | | 1,401,770 | | |
End of Period | | $ | 813,399 | | | $ | 1,040,376 | | |
The accompanying notes are an integral part of the financial statements.
14
Morgan Stanley Institutional Fund, Inc.
Annual Report — December 31, 2019
Emerging Markets Portfolio
Statements of Changes in Net Assets (cont'd) | | Year Ended
December 31, 2019
(000) | | Year Ended
December 31, 2018
(000) | |
(1) Capital Share Transactions: | |
Class I: | |
Shares Subscribed | | | 1,180 | | | | 2,291 | | |
Shares Issued due to a Tax-free Reorganization | | | 17,868 | | | | — | | |
Shares Issued on Distributions Reinvested | | | 1,359 | | | | 246 | | |
Shares Redeemed | | | (18,880 | ) | | | (4,615 | ) | |
Net Increase (Decrease) in Class I Shares Outstanding | | | 1,527 | | | | (2,078 | ) | |
Class A: | |
Shares Subscribed | | | 157 | | | | 277 | | |
Shares Issued on Distributions Reinvested | | | 66 | | | | 12 | | |
Shares Redeemed | | | (356 | ) | | | (549 | ) | |
Net Decrease in Class A Shares Outstanding | | | (133 | ) | | | (260 | ) | |
Class L: | |
Shares Exchanged | | | — | | | | 5 | | |
Shares Issued on Distributions Reinvested | | | 1 | | | | — | @@ | |
Shares Redeemed | | | (5 | ) | | | (1 | ) | |
Net Increase (Decrease) in Class L Shares Outstanding | | | (4 | ) | | | 4 | | |
Class C: | |
Shares Subscribed | | | 5 | | | | 4 | | |
Shares Issued on Distributions Reinvested | | | 2 | | | | — | | |
Shares Redeemed | | | (1 | ) | | | (20 | ) | |
Net Increase (Decrease) in Class C Shares Outstanding | | | 6 | | | | (16 | ) | |
Class IS: | |
Shares Subscribed | | | 4,177 | | | | 4,875 | | |
Shares Issued on Distributions Reinvested | | | 2,266 | | | | 834 | | |
Shares Redeemed | | | (19,685 | ) | | | (7,321 | ) | |
Net Decrease in Class IS Shares Outstanding | | | (13,242 | ) | | | (1,612 | ) | |
Class IR: | |
Shares Subscribed | | | — | | | | — | @@(a) | |
Shares Issued on Distributions Reinvested | | | — | @@ | | | — | | |
Net Increase in Class IR Shares Outstanding | | | — | @@ | | | — | @@(a) | |
(a) For the period June 15, 2018 through December 31, 2018.
@ Amount is less than $500.
@@ Amount is less than 500 shares.
The accompanying notes are an integral part of the financial statements.
15
Morgan Stanley Institutional Fund, Inc.
Annual Report — December 31, 2019
Financial Highlights
Emerging Markets Portfolio
| | | Class I | |
| | | Year Ended December 31, | |
Selected Per Share Data and Ratios | | 2019 | | 2018 | | 2017 | | 2016(1) | | 2015 | |
Net Asset Value, Beginning of Period | | $ | 22.53 | | | $ | 27.95 | | | $ | 20.83 | | | $ | 19.68 | | | $ | 22.13 | | |
Income (Loss) from Investment Operations: | |
Net Investment Income(2) | | | 0.41 | | | | 0.28 | | | | 0.19 | | | | 0.17 | | | | 0.15 | | |
Net Realized and Unrealized Gain (Loss) | | | 3.92 | | | | (5.15 | ) | | | 7.10 | | | | 1.15 | | | | (2.43 | ) | |
Total from Investment Operations | | | 4.33 | | | | (4.87 | ) | | | 7.29 | | | | 1.32 | | | | (2.28 | ) | |
Distributions from and/or in Excess of: | |
Net Investment Income | | | (0.18 | ) | | | (0.35 | ) | | | (0.17 | ) | | | (0.17 | ) | | | (0.17 | ) | |
Net Realized Gain | | | (2.99 | ) | | | (0.20 | ) | | | — | | | | — | | | | — | | |
Total Distributions | | | (3.17 | ) | | | (0.55 | ) | | | (0.17 | ) | | | (0.17 | ) | | | (0.17 | ) | |
Redemption Fees | | | 0.00 | (3) | | | 0.00 | (3) | | | 0.00 | (3) | | | 0.00 | (3) | | | 0.00 | (3) | |
Net Asset Value, End of Period | | $ | 23.69 | | | $ | 22.53 | | | $ | 27.95 | | | $ | 20.83 | | | $ | 19.68 | | |
Total Return(4) | | | 19.44 | % | | | (17.32 | )% | | | 34.97 | % | | | 6.73 | % | | | (10.33 | )% | |
Ratios to Average Net Assets and Supplemental Data: | |
Net Assets, End of Period (Thousands) | | $ | 277,114 | | | $ | 229,132 | | | $ | 342,400 | | | $ | 282,674 | | | $ | 531,194 | | |
Ratio of Expenses Before Expense Limitation | | | 1.16 | % | | | N/A | | | | 1.07 | % | | | 1.16 | % | | | 1.45 | % | |
Ratio of Expenses After Expense Limitation | | | 1.05 | %(5) | | | 1.03 | %(5) | | | 1.04 | %(5) | | | 1.11 | %(5)(7) | | | 1.24 | %(5)(6) | |
Ratio of Expenses After Expense Limitation Excluding Non-Operating Expenses | | | 1.05 | %(5) | | | N/A | | | | N/A | | | | N/A | | | | N/A | | |
Ratio of Net Investment Income | | | 1.69 | %(5) | | | 1.08 | %(5) | | | 0.75 | %(5) | | | 0.83 | %(5) | | | 0.68 | %(5) | |
Ratio of Rebate from Morgan Stanley Affiliates | | | 0.00 | %(8) | | | 0.01 | % | | | 0.00 | %(8) | | | 0.00 | %(8) | | | 0.00 | %(8) | |
Portfolio Turnover Rate | | | 58 | % | | | 56 | % | | | 35 | % | | | 33 | % | | | 40 | % | |
(1) Reflects prior period custodian out-of-pocket expenses that were reimbursed in September 2016. The amount of the reimbursement was immaterial on a per share basis and did not impact the total return of Class I shares. The Ratio of Expenses After Expense Limitation and the Ratio of Net Investment Income would be unchanged as the reimbursement of custodian fees was offset against expense waivers/reimbursements with no impact to net expenses or net investment income.
(2) Per share amount is based on average shares outstanding.
(3) Amount is less than $0.005 per share.
(4) Calculated based on the net asset value as of the last business day of the period.
(5) The Ratio of Expenses After Expense Limitation and Ratio of Net Investment Income reflect the rebate of certain Fund expenses in connection with the investments in Morgan Stanley affiliates during the period. The effect of the rebate on the ratios is disclosed in the above table as "Ratio of Rebate from Morgan Stanley Affiliates."
(6) Effective September 30, 2015, the Adviser has agreed to limit the ratio of expenses to average net assets to the maximum ratio of 1.20% for Class I shares. Prior to September 30, 2015, the maximum ratio was 1.25% for Class I shares.
(7) Effective September 30, 2016, the Adviser has agreed to limit the ratio of expenses to average net assets to the maximum ratio of 1.05% for Class I shares. Prior to September 30, 2016, the maximum ratio was 1.20% for Class I shares.
(8) Amount is less than 0.005%.
The accompanying notes are an integral part of the financial statements.
16
Morgan Stanley Institutional Fund, Inc.
Annual Report — December 31, 2019
Financial Highlights
Emerging Markets Portfolio
| | | Class A | |
| | | Year Ended December 31, | |
Selected Per Share Data and Ratios | | 2019 | | 2018 | | 2017 | | 2016(1) | | 2015 | |
Net Asset Value, Beginning of Period | | $ | 21.99 | | | $ | 27.24 | | | $ | 20.31 | | | $ | 19.19 | | | $ | 21.57 | | |
Income (Loss) from Investment Operations: | |
Net Investment Income(2) | | | 0.30 | | | | 0.20 | | | | 0.10 | | | | 0.11 | | | | 0.07 | | |
Net Realized and Unrealized Gain (Loss) | | | 3.85 | | | | (5.01 | ) | | | 6.92 | | | | 1.11 | | | | (2.36 | ) | |
Total from Investment Operations | | | 4.15 | | | | (4.81 | ) | | | 7.02 | | | | 1.22 | | | | (2.29 | ) | |
Distributions from and/or in Excess of: | |
Net Investment Income | | | (0.10 | ) | | | (0.24 | ) | | | (0.09 | ) | | | (0.10 | ) | | | (0.09 | ) | |
Net Realized Gain | | | (2.99 | ) | | | (0.20 | ) | | | — | | | | — | | | | — | | |
Total Distributions | | | (3.09 | ) | | | (0.44 | ) | | | (0.09 | ) | | | (0.10 | ) | | | (0.09 | ) | |
Redemption Fees | | | 0.00 | (3) | | | 0.00 | (3) | | | 0.00 | (3) | | | 0.00 | (3) | | | 0.00 | (3) | |
Net Asset Value, End of Period | | $ | 23.05 | | | $ | 21.99 | | | $ | 27.24 | | | $ | 20.31 | | | $ | 19.19 | | |
Total Return(4) | | | 19.08 | % | | | (17.58 | )% | | | 34.54 | % | | | 6.37 | % | | | (10.63 | )% | |
Ratios to Average Net Assets and Supplemental Data: | |
Net Assets, End of Period (Thousands) | | $ | 11,195 | | | $ | 13,605 | | | $ | 23,952 | | | $ | 18,824 | | | $ | 19,065 | | |
Ratio of Expenses Before Expense Limitation | | | 1.43 | % | | | N/A | | | | 1.40 | % | | | 1.48 | % | | | 1.76 | % | |
Ratio of Expenses After Expense Limitation | | | 1.34 | %(5) | | | 1.34 | %(5) | | | 1.36 | %(5) | | | 1.45 | %(5)(7) | | | 1.56 | %(5)(6) | |
Ratio of Expenses After Expense Limitation Excluding Non-Operating Expenses | | | 1.34 | %(5) | | | N/A | | | | N/A | | | | N/A | | | | N/A | | |
Ratio of Net Investment Income | | | 1.26 | %(5) | | | 0.78 | %(5) | | | 0.42 | %(5) | | | 0.55 | %(5) | | | 0.34 | %(5) | |
Ratio of Rebate from Morgan Stanley Affiliates | | | 0.00 | %(8) | | | 0.01 | % | | | 0.00 | %(8) | | | 0.00 | %(8) | | | 0.00 | %(8) | |
Portfolio Turnover Rate | | | 58 | % | | | 56 | % | | | 35 | % | | | 33 | % | | | 40 | % | |
(1) Reflects prior period custodian out-of-pocket expenses that were reimbursed in September 2016. The amount of the reimbursement was immaterial on a per share basis and did not impact the total return of Class A shares. The Ratio of Expenses After Expense Limitation and the Ratio of Net Investment Income would be unchanged as the reimbursement of custodian fees was offset against expense waivers/reimbursements with no impact to net expenses or net investment income.
(2) Per share amount is based on average shares outstanding.
(3) Amount is less than $0.005 per share.
(4) Calculated based on the net asset value which does not reflect sales charges, if applicable, as of the last business day of the period.
(5) The Ratio of Expenses After Expense Limitation and Ratio of Net Investment Income reflect the rebate of certain Fund expenses in connection with the investments in Morgan Stanley affiliates during the period. The effect of the rebate on the ratios is disclosed in the above table as "Ratio of Rebate from Morgan Stanley Affiliates."
(6) Effective September 30, 2015, the Adviser has agreed to limit the ratio of expenses to average net assets to the maximum ratio of 1.55% for Class A shares. Prior to September 30, 2015, the maximum ratio was 1.60% for Class A shares.
(7) Effective September 30, 2016, the Adviser has agreed to limit the ratio of expenses to average net assets to the maximum ratio of 1.40% for Class A shares. Prior to September 30, 2016, the maximum ratio was 1.55% for Class A shares.
(8) Amount is less than 0.005%.
The accompanying notes are an integral part of the financial statements.
17
Morgan Stanley Institutional Fund, Inc.
Annual Report — December 31, 2019
Financial Highlights
Emerging Markets Portfolio
| | | Class L | |
| | | Year Ended December 31, | |
Selected Per Share Data and Ratios | | 2019 | | 2018 | | 2017 | | 2016(1) | | 2015 | |
Net Asset Value, Beginning of Period | | $ | 21.64 | | | $ | 26.85 | | | $ | 20.08 | | | $ | 18.98 | | | $ | 21.39 | | |
Income (Loss) from Investment Operations: | |
Net Investment Income (Loss)(2) | | | 0.17 | | | | 0.05 | | | | (0.01 | ) | | | 0.00 | (3) | | | (0.04 | ) | |
Net Realized and Unrealized Gain (Loss) | | | 3.77 | | | | (4.91 | ) | | | 6.80 | | | | 1.10 | | | | (2.33 | ) | |
Total from Investment Operations | | | 3.94 | | | | (4.86 | ) | | | 6.79 | | | | 1.10 | | | | (2.37 | ) | |
Distributions from and/or in Excess of: | |
Net Investment Income | | | — | | | | (0.15 | ) | | | (0.02 | ) | | | — | | | | (0.04 | ) | |
Net Realized Gain | | | (2.99 | ) | | | (0.20 | ) | | | — | | | | — | | | | — | | |
Total Distributions | | | (2.99 | ) | | | (0.35 | ) | | | (0.02 | ) | | | — | | | | (0.04 | ) | |
Redemption Fees | | | 0.00 | (3) | | | 0.00 | (3) | | | 0.00 | (3) | | | 0.00 | (3) | | | 0.00 | (3) | |
Net Asset Value, End of Period | | $ | 22.59 | | | $ | 21.64 | | | $ | 26.85 | | | $ | 20.08 | | | $ | 18.98 | | |
Total Return(4) | | | 18.37 | % | | | (18.03 | )% | | | 33.80 | % | | | 5.80 | % | | | (11.11 | )% | |
Ratios to Average Net Assets and Supplemental Data: | |
Net Assets, End of Period (Thousands) | | $ | 210 | | | $ | 292 | | | $ | 253 | | | $ | 239 | | | $ | 226 | | |
Ratio of Expenses Before Expense Limitation | | | 2.47 | % | | | 2.55 | % | | | 2.54 | % | | | 2.69 | % | | | 2.78 | % | |
Ratio of Expenses After Expense Limitation | | | 1.90 | %(5) | | | 1.89 | %(5) | | | 1.90 | %(5) | | | 2.01 | %(5)(7) | | | 2.09 | %(5)(6) | |
Ratio of Expenses After Expense Limitation Excluding Non-Operating Expenses | | | 1.90 | %(5) | | | N/A | | | | N/A | | | | N/A | | | | N/A | | |
Ratio of Net Investment Income (Loss) | | | 0.73 | %(5) | | | 0.20 | %(5) | | | (0.03 | )%(5) | | | 0.00 | %(5)(8) | | | (0.19 | )%(5) | |
Ratio of Rebate from Morgan Stanley Affiliates | | | 0.00 | %(8) | | | 0.01 | % | | | 0.00 | %(8) | | | 0.00 | %(8) | | | 0.00 | %(8) | |
Portfolio Turnover Rate | | | 58 | % | | | 56 | % | | | 35 | % | | | 33 | % | | | 40 | % | |
(1) Reflects prior period custodian out-of-pocket expenses that were reimbursed in September 2016. The amount of the reimbursement was immaterial on a per share basis and did not impact the total return of Class L shares. The Ratio of Expenses After Expense Limitation and the Ratio of Net Investment Income would be unchanged as the reimbursement of custodian fees was offset against expense waivers/reimbursements with no impact to net expenses or net investment income.
(2) Per share amount is based on average shares outstanding.
(3) Amount is less than $0.005 per share.
(4) Calculated based on the net asset value as of the last business day of the period.
(5) The Ratio of Expenses After Expense Limitation and Ratio of Net Investment Income (Loss) reflect the rebate of certain Fund expenses in connection with the investments in Morgan Stanley affiliates during the period. The effect of the rebate on the ratios is disclosed in the above table as "Ratio of Rebate from Morgan Stanley Affiliates."
(6) Effective September 30, 2015, the Adviser has agreed to limit the ratio of expenses to average net assets to the maximum ratio of 2.05% for Class L shares. Prior to September 30, 2015, the maximum ratio was 2.10% for Class L shares.
(7) Effective September 30, 2016, the Adviser has agreed to limit the ratio of expenses to average net assets to the maximum ratio of 1.90% for Class L shares. Prior to September 30, 2016, the maximum ratio was 2.05% for Class L shares.
(8) Amount is less than 0.005%.
The accompanying notes are an integral part of the financial statements.
18
Morgan Stanley Institutional Fund, Inc.
Annual Report — December 31, 2019
Financial Highlights
Emerging Markets Portfolio
| | | Class C | |
| | | | | Year Ended December 31, | | Period from
April 30, 2015(2) to | |
Selected Per Share Data and Ratios | | 2019 | | 2018 | | 2017 | | 2016(1) | | December 31, 2015 | |
Net Asset Value, Beginning of Period | | $ | 21.57 | | | $ | 26.66 | | | $ | 19.99 | | | $ | 18.95 | | | $ | 23.16 | | |
Income (Loss) from Investment Operations: | |
Net Investment Income (Loss)(3) | | | 0.11 | | | | 0.04 | | | | (0.09 | ) | | | (0.04 | ) | | | (0.03 | ) | |
Net Realized and Unrealized Gain (Loss) | | | 3.76 | | | | (4.93 | ) | | | 6.78 | | | | 1.09 | | | | (4.14 | ) | |
Total from Investment Operations | | | 3.87 | | | | (4.89 | ) | | | 6.69 | | | | 1.05 | | | | (4.17 | ) | |
Distributions from and/or in Excess of: | |
Net Investment Income | | | — | | | | (0.00 | )(4) | | | (0.02 | ) | | | (0.01 | ) | | | (0.04 | ) | |
Net Realized Gain | | | (2.99 | ) | | | (0.20 | ) | | | — | | | | — | | | | — | | |
Total Distributions | | | (2.99 | ) | | | (0.20 | ) | | | (0.02 | ) | | | (0.01 | ) | | | (0.04 | ) | |
Redemption Fees | | | 0.00 | (4) | | | 0.00 | (4) | | | 0.00 | (4) | | | 0.00 | (4) | | | 0.00 | (4) | |
Net Asset Value, End of Period | | $ | 22.45 | | | $ | 21.57 | | | $ | 26.66 | | | $ | 19.99 | | | $ | 18.95 | | |
Total Return(5) | | | 18.16 | % | | | (18.26 | )% | | | 33.45 | % | | | 5.56 | % | | | (18.03 | )%(10) | |
Ratios to Average Net Assets and Supplemental Data: | |
Net Assets, End of Period (Thousands) | | $ | 454 | | | $ | 309 | | | $ | 817 | | | $ | 608 | | | $ | 10 | | |
Ratio of Expenses Before Expense Limitation | | | 2.58 | % | | | 2.37 | % | | | 2.30 | % | | | 2.58 | % | | | 22.89 | %(11) | |
Ratio of Expenses After Expense Limitation | | | 2.15 | %(6) | | | 2.14 | %(6) | | | 2.15 | %(6) | | | 2.24 | %(6)(8) | | | 2.33 | %(6)(7)(11) | |
Ratio of Expenses After Expense Limitation Excluding
Non-Operating Expenses | | | 2.15 | %(6) | | | N/A | | | | N/A | | | | N/A | | | | N/A | | |
Ratio of Net Investment Income (Loss) | | | 0.47 | %(6) | | | 0.17 | %(6) | | | (0.36 | )%(6) | | | (0.19 | )%(6) | | | (0.23 | )%(6)(11) | |
Ratio of Rebate from Morgan Stanley Affiliates | | | 0.00 | %(9) | | | 0.01 | % | | | 0.00 | %(9) | | | 0.00 | %(9) | | | 0.00 | %(9)(11) | |
Portfolio Turnover Rate | | | 58 | % | | | 56 | % | | | 35 | % | | | 33 | % | | | 40 | % | |
(1) Reflects prior period custodian out-of-pocket expenses that were reimbursed in September 2016. The amount of the reimbursement was immaterial on a per share basis and did not impact the total return of Class C shares. The Ratio of Expenses After Expense Limitation and the Ratio of Net Investment Loss would be unchanged as the reimbursement of custodian fees was offset against expense waivers/reimbursements with no impact to net expenses or net investment loss.
(2) Commencement of Offering.
(3) Per share amount is based on average shares outstanding.
(4) Amount is less than $0.005 per share.
(5) Calculated based on the net asset value which does not reflect sales charges, if applicable, as of the last business day of the period.
(6) The Ratio of Expenses After Expense Limitation and Ratio of Net Investment Income (Loss) reflect the rebate of certain Fund expenses in connection with the investments in Morgan Stanley affiliates during the period. The effect of the rebate on the ratios is disclosed in the above table as "Ratio of Rebate from Morgan Stanley Affiliates."
(7) Effective September 30, 2015, the Adviser has agreed to limit the ratio of expenses to average net assets to the maximum ratio of 2.30% for Class C shares. Prior to September 30, 2015, the maximum ratio was 2.35% for Class C shares.
(8) Effective September 30, 2016, the Adviser has agreed to limit the ratio of expenses to average net assets to the maximum ratio of 2.15% for Class C shares. Prior to September 30, 2016, the maximum ratio was 2.30% for Class C shares.
(9) Amount is less than 0.005%.
(10) Not annualized.
(11) Annualized.
The accompanying notes are an integral part of the financial statements.
19
Morgan Stanley Institutional Fund, Inc.
Annual Report — December 31, 2019
Financial Highlights
Emerging Markets Portfolio
| | | Class IS | |
| | | Year Ended December 31, | |
Selected Per Share Data and Ratios | | 2019 | | 2018 | | 2017 | | 2016(1) | | 2015 | |
Net Asset Value, Beginning of Period | | $ | 22.52 | | | $ | 27.96 | | | $ | 20.83 | | | $ | 19.68 | | | $ | 22.14 | | |
Income (Loss) from Investment Operations: | |
Net Investment Income(2) | | | 0.36 | | | | 0.31 | | | | 0.21 | | | | 0.21 | | | | 0.17 | | |
Net Realized and Unrealized Gain (Loss) | | | 4.00 | | | | (5.17 | ) | | | 7.11 | | | | 1.12 | | | | (2.44 | ) | |
Total from Investment Operations | | | 4.36 | | | | (4.86 | ) | | | 7.32 | | | | 1.33 | | | | (2.27 | ) | |
Distributions from and/or in Excess of: | |
Net Investment Income | | | (0.21 | ) | | | (0.38 | ) | | | (0.19 | ) | | | (0.18 | ) | | | (0.19 | ) | |
Net Realized Gain | | | (2.99 | ) | | | (0.20 | ) | | | — | | | | — | | | | — | | |
Total Distributions | | | (3.20 | ) | | | (0.58 | ) | | | (0.19 | ) | | | (0.18 | ) | | | (0.19 | ) | |
Redemption Fees | | | 0.00 | (3) | | | 0.00 | (3) | | | 0.00 | (3) | | | 0.00 | (3) | | | 0.00 | (3) | |
Net Asset Value, End of Period | | $ | 23.68 | | | $ | 22.52 | | | $ | 27.96 | | | $ | 20.83 | | | $ | 19.68 | | |
Total Return(4) | | | 19.58 | % | | | (17.25 | )% | | | 35.09 | % | | | 6.79 | % | | | (10.29 | )% | |
Ratios to Average Net Assets and Supplemental Data: | |
Net Assets, End of Period (Thousands) | | $ | 524,416 | | | $ | 797,029 | | | $ | 1,034,348 | | | $ | 657,106 | | | $ | 297,469 | | |
Ratio of Expenses Before Expense Limitation | | | 1.04 | % | | | N/A | | | | 0.98 | % | | | 1.07 | % | | | 1.35 | % | |
Ratio of Expenses After Expense Limitation | | | 0.95 | %(5) | | | 0.92 | %(5) | | | 0.95 | %(5) | | | 1.04 | %(5)(7) | | | 1.16 | %(5)(6) | |
Ratio of Expenses After Expense Limitation Excluding Non-Operating Expenses | | | 0.95 | %(5) | | | N/A | | | | N/A | | | | N/A | | | | N/A | | |
Ratio of Net Investment Income | | | 1.47 | %(5) | | | 1.21 | %(5) | | | 0.82 | %(5) | | | 0.99 | %(5) | | | 0.75 | %(5) | |
Ratio of Rebate from Morgan Stanley Affiliates | | | 0.00 | %(8) | | | 0.01 | % | | | 0.00 | %(8) | | | 0.00 | %(8) | | | 0.00 | %(8) | |
Portfolio Turnover Rate | | | 58 | % | | | 56 | % | | | 35 | % | | | 33 | % | | | 40 | % | |
(1) Reflects prior period custodian out-of-pocket expenses that were reimbursed in September 2016. The amount of the reimbursement was immaterial on a per share basis and did not impact the total return of Class IS shares. The Ratio of Expenses After Expense Limitation and the Ratio of Net Investment Income would be unchanged as the reimbursement of custodian fees was offset against expense waivers/reimbursements with no impact to net expenses or net investment income.
(2) Per share amount is based on average shares outstanding.
(3) Amount is less than $0.005 per share.
(4) Calculated based on the net asset value as of the last business day of the period.
(5) The Ratio of Expenses After Expense Limitation and Ratio of Net Investment Income reflect the rebate of certain Fund expenses in connection with the investments in Morgan Stanley affiliates during the period. The effect of the rebate on the ratios is disclosed in the above table as "Ratio of Rebate from Morgan Stanley Affiliates."
(6) Effective September 30, 2015, the Adviser has agreed to limit the ratio of expenses to average net assets to the maximum ratio of 1.10% for Class IS shares. Prior to September 30, 2015, the maximum ratio was 1.18% for Class IS shares.
(7) Effective September 30, 2016, the Adviser has agreed to limit the ratio of expenses to average net assets to the maximum ratio of 0.95% for Class IS shares. Prior to September 30, 2016, the maximum ratio was 1.10% for Class IS shares.
(8) Amount is less than 0.005%.
The accompanying notes are an integral part of the financial statements.
20
Morgan Stanley Institutional Fund, Inc.
Annual Report — December 31, 2019
Financial Highlights
Emerging Markets Portfolio
| | | Class IR | |
Selected Per Share Data and Ratios | | Year Ended
December 31, 2019 | | Period from
June 15, 2018(1) to
December 31, 2018 | |
Net Asset Value, Beginning of Period | | $ | 22.54 | | | $ | 26.23 | | |
Income (Loss) from Investment Operations: | |
Net Investment Income(2) | | | 0.40 | | | | 0.20 | | |
Net Realized and Unrealized Gain (Loss) | | | 3.94 | | | | (3.31 | ) | |
Total from Investment Operations | | | 4.34 | | | | (3.11 | ) | |
Distributions from and/or in Excess of: | |
Net Investment Income | | | (0.21 | ) | | | (0.38 | ) | |
Net Realized Gain | | | (2.99 | ) | | | (0.20 | ) | |
Total Distributions | | | (3.20 | ) | | | (0.58 | ) | |
Redemption Fees | | | 0.00 | (3) | | | 0.00 | (3) | |
Net Asset Value, End of Period | | $ | 23.68 | | | $ | 22.54 | | |
Total Return(4) | | | 19.53 | % | | | (11.82 | )%(7) | |
Ratios to Average Net Assets and Supplemental Data: | |
Net Assets, End of Period, (Thousands) | | $ | 10 | | | $ | 9 | | |
Ratio of Expenses Before Expense Limitation | | | 21.52 | % | | | 19.46 | %(8) | |
Ratio of Expenses After Expense Limitation | | | 0.95 | %(5) | | | 0.93 | %(5)(8) | |
Ratios of Expenses After Expense Limitation Excluding Non-Operating Expenses | | | 0.95 | %(5) | | | N/A | | |
Ratio of Net Investment Income | | | 1.62 | %(5) | | | 1.56 | %(5)(8) | |
Ratio of Rebate from Morgan Stanley Affiliates | | | 0.00 | %(6) | | | 0.01 | %(8) | |
Portfolio Turnover Rate | | | 58 | % | | | 56 | % | |
(1) Commencement of Offering.
(2) Per share amount is based on average shares outstanding.
(3) Amount is less than $0.005 per share.
(4) Calculated based on the net asset value as of the last business day of the period.
(5) The Ratio of Expenses After Expense Limitation and Ratio of Net Investment Income reflect the rebate of certain Fund expenses in connection with the investments in Morgan Stanley affiliates during the period. The effect of the rebate on the ratios is disclosed in the above table as "Ratio of Rebate from Morgan Stanley Affiliates."
(6) Amount is less than 0.005%.
(7) Not annualized.
(8) Annualized.
The accompanying notes are an integral part of the financial statements.
21
Morgan Stanley Institutional Fund, Inc.
Annual Report — December 31, 2019
Notes to Financial Statements
Morgan Stanley Institutional Fund, Inc. (the "Company") is registered under the Investment Company Act of 1940, as amended (the "Act"), as an open-end management investment company. The Company is comprised of thirty-two separate, active, diversified and non-diversified funds (individually referred to as a "Fund," collectively as the "Funds"). The Company applies investment company accounting and reporting guidance.
The accompanying financial statements relate to the Emerging Markets Portfolio. The Fund seeks long-term capital appreciation by investing primarily in growth-oriented equity securities of issuers in emerging market countries.
The Fund offers six classes of shares — Class I, Class A, Class L, Class C, Class IS and Class IR. On April 30, 2015, the Fund suspended offering of Class L shares. Existing Class L shareholders may invest through reinvestment of dividends and distributions.
On February 22, 2019, the Fund acquired the net assets of Morgan Stanley Emerging Markets Fund, Inc. ("Emerging Markets Fund"), a closed-end management investment company, based on the respective valuations as of the close of business on February 22, 2019, pursuant to a Plan of Reorganization approved by the shareholders of Emerging Markets Fund on January 7, 2019 ("Reorganization A"). The purpose of the transaction was to combine two portfolios managed by Morgan Stanley Investment Management Inc., (the "Adviser") with comparable investment objectives and strategies. The acquisition was accomplished by a tax-free exchange of 9,264,009 Class I shares of the Fund at a net asset value ("NAV") of $24.31 for 13,428,781 shares of Emerging Markets Fund. The net assets of Emerging Markets Fund before Reorganization A were approximately $225,208,000, including unrealized appreciation (depreciation) of approximately $24,269,000 at February 22, 2019. The investment portfolio of Emerging Markets Fund, with a fair value of approximately $220,642,000 and identified cost of approximately $196,373,000, on February 22, 2019, was the principal asset acquired by the Fund. For financial reporting purposes, assets received and shares issued by the Fund were recorded at fair value; however, the cost basis of the investments received from Emerging Markets Fund was carried forward to align ongoing reporting of the Fund's realized and unrealized gains and losses with amounts distributable to shareholders for tax purposes. Immediately prior to Reorganization A, the net assets of the Fund were approximately $1,130,576,000. Immediately after
Reorganization A, the net assets of the Fund were approximately $1,355,784,000.
Upon closing of Reorganization A, shareholders of Emerging Markets Fund received shares of the Fund as follows:
Emerging
Markets Fund | | Emerging
Markets Portfolio | |
| Common Shares | | Class I | |
Assuming the acquisition had been completed on January 1, 2019, the beginning of the annual reporting period of the Fund, the Fund's pro-forma results of operations for the year ended December 31, 2019, are approximately as follows:
Net investment income(1) | | $ | 14,773,000 | | |
Net realized gain and unrealized gain(2) | | $ | 189,147,000 | | |
Net increase in net assets resulting
from operations | | $ | 203,920,000 | | |
(1) Approximately $13,422,000 as reported, plus approximately $361,000 Emerging Markets Fund prior to Reorganization A, plus approximately $990,000 of estimated pro-forma eliminated expenses.
(2) Approximately $144,412,000 as reported, plus approximately $44,735,000 Emerging Markets Fund prior to Reorganization A.
Because the combined investment portfolios have been managed as a single integrated portfolio since the acquisition was completed, it is not practicable to separate the amounts of revenue and earnings of Emerging Markets Fund that have been included in the Fund's Statement of Operations since February 22, 2019.
On April 5, 2019, the Fund acquired the net assets of Morgan Stanley Asia-Pacific Fund, Inc. ("Asia-Pacific Fund"), a closed-end management investment company, based on the respective valuations as of the close of business on April 5, 2019, pursuant to a Plan of Reorganization approved by the shareholders of Asia-Pacific Fund on March 8, 2019 ("Reorganization B"). The purpose of the transaction was to combine two portfolios managed by the Adviser with comparable investment objectives and strategies. The acquisition was accomplished by a tax-free exchange of 8,604,225 Class I shares of the Fund at a NAV of $24.82 for 12,679,878 shares of Asia-Pacific Fund. The net assets of Asia-Pacific Fund before Reorganization B were approximately $213,557,000, including unrealized appreciation (depreciation) of approximately $20,463,000 at April 5, 2019. The investment portfolio of Asia-Pacific Fund, with a fair value of approximately $209,696,000 and identified cost of approximately $189,233,000, on April 5, 2019, was the principal asset acquired by the Fund. For financial reporting purposes, assets received and shares issued by the Fund were recorded at fair value; however, the cost basis of the investments received from Asia-Pacific Fund was carried forward to
22
Morgan Stanley Institutional Fund, Inc.
Annual Report — December 31, 2019
Notes to Financial Statements (cont'd)
align ongoing reporting of the Fund's realized and unrealized gains and losses with amounts distributable to shareholders for tax purposes. Immediately prior to Reorganization B, the net assets of the Fund were approximately $840,351,000. Immediately after Reorganization B, the net assets of the Fund were approximately $1,053,908,000.
Upon closing of Reorganization B, shareholders of Asia-Pacific Fund received shares of the Fund as follows:
Asia-Pacific
Fund | | Emerging
Markets Portfolio | |
| Common Shares | | Class I | |
Assuming the acquisition had been completed on January 1, 2019, the beginning of the annual reporting period of the Fund, the Fund's pro-forma results of operations for the year ended December 31, 2019, are approximately as follows:
Net investment income(1) | | $ | 15,510,000 | | |
Net realized gain and unrealized gain(2) | | $ | 190,531,000 | | |
Net increase in net assets resulting
from operations | | $ | 206,041,000 | | |
(1) Approximately $13,422,000 as reported, plus approximately $994,000 Asia-Pacific Fund prior to Reorganization B, plus approximately $1,094,000 of estimated pro-forma eliminated expenses.
(2) Approximately $144,412,000 as reported, plus approximately $46,119,000 Asia-Pacific Fund prior to Reorganization B.
Because the combined investment portfolios have been managed as a single integrated portfolio since the acquisition was completed, it is not practicable to separate the amounts of revenue and earnings of Asia-Pacific Fund that have been included in the Fund's Statement of Operations since April 5, 2019.
A. Significant Accounting Policies: The following significant accounting policies are in conformity with U.S. generally accepted accounting principles ("GAAP"). Such policies are consistently followed by the Company in the preparation of its financial statements. GAAP may require management to make estimates and assumptions that affect the reported amounts and disclosures in the financial statements. Actual results may differ from those estimates.
In August 2018, the Financial Accounting Standards Board ("FASB") issued Accounting Standards Update ("ASU") 2018-13, Fair Value Measurement (Topic 820) — Disclosures Framework — Changes to Disclosure Requirements of Fair Value Measurement ("ASU 2018-13") which introduces new fair value disclosure requirements as well as eliminates and modifies certain existing fair value disclosure requirements. ASU 2018-13 would be effective for fiscal years beginning after December 15, 2019 and for interim periods within those
fiscal years; however, management has elected to early adopt ASU 2018-13 as permitted by the standard. The impact of the Fund's adoption was limited to changes in the Fund's financial statement disclosures regarding fair value, primarily those disclosures related to transfers between levels of the fair value hierarchy and disclosure of the range and weighted average used to develop significant unobservable inputs for Level 3 fair value measurements, when applicable.
1. Security Valuation: (1) An equity portfolio security listed or traded on an exchange is valued at its latest reported sales price (or at the exchange official closing price if such exchange reports an official closing price), and if there were no sales on a given day and if there is no official exchange closing price for that day, the security is valued at the mean between the last reported bid and asked prices if such bid and asked prices are available on the relevant exchanges. If only bid prices are available then the latest bid price may be used. Listed equity securities not traded on the valuation date with no reported bid and asked prices available on the exchange are valued at the mean between the current bid and asked prices obtained from one or more reputable brokers or dealers. In cases where a security is traded on more than one exchange, the security is valued on the exchange designated as the primary market; (2) all other equity portfolio securities for which over-the-counter ("OTC") market quotations are readily available are valued at the latest reported sales price (or at the market official closing price if such market reports an official closing price), and if there was no trading in the security on a given day and if there is no official closing price from relevant markets for that day, the security is valued at the mean between the last reported bid and asked prices if such bid and asked prices are available on the relevant markets. An unlisted equity security that does not trade on the valuation date and for which bid and asked prices from the relevant markets are unavailable is valued at the mean between the current bid and asked prices obtained from one or more reputable brokers or dealers; (3) certain portfolio securities may be valued by an outside pricing service/vendor approved by the Company's Board of Directors (the "Directors"). The pricing service/vendor may employ a pricing model that takes into account, among other things, bids, yield spreads and/or other market data and specific security characteristics. Alternatively, if a valuation is not available from an outside pricing service/vendor, and the security trades on an exchange, the
23
Morgan Stanley Institutional Fund, Inc.
Annual Report — December 31, 2019
Notes to Financial Statements (cont'd)
security may be valued at its latest reported sale price (or at the exchange official closing price if such exchange reports an official closing price), prior to the time when assets are valued. If there are no sales on a given day and if there is no official exchange closing price for that day, the security is valued at the mean between the last reported bid and asked prices if such bid and asked prices are available in the relevant exchanges. If the Adviser or Morgan Stanley Investment Management Company ("MSIM Company") (the "Sub-Adviser"), each a wholly-owned subsidiary of Morgan Stanley, determines that the price provided by the outside pricing service/vendor or exchange does not reflect the security's fair value or is unable to provide a price, prices from brokers or dealers may also be utilized. In these circumstances, the value of the security will be the mean of bid and asked prices obtained from brokers or dealers; (4) when market quotations are not readily available, including circumstances under which the Adviser or the Sub-Adviser determines that the closing price, last sale price or the mean between the last reported bid and asked prices are not reflective of a security's market value, portfolio securities are valued at their fair value as determined in good faith under procedures established by and under the general supervision of the Directors. Occasionally, developments affecting the closing prices of securities and other assets may occur between the times at which valuations of such securities are determined (that is, close of the foreign market on which the securities trade) and the close of business of the New York Stock Exchange ("NYSE"). If developments occur during such periods that are expected to materially affect the value of such securities, such valuations may be adjusted to reflect the estimated fair value of such securities as of the close of the NYSE, as determined in good faith by the Directors or by the Adviser using a pricing service and/or procedures approved by the Directors; (5) quotations of foreign portfolio securities, other assets and liabilities and forward contracts stated in foreign currency are translated into U.S. dollar equivalents at the prevailing market rates prior to the close of the NYSE; and (6) investments in mutual funds, including the Morgan Stanley Institutional Liquidity Funds, are valued at the NAV as of the close of each business day.
The Directors have responsibility for determining in good faith the fair value of the investments, and the Directors may appoint others, such as the Company's
Adviser or a valuation committee, to assist the Directors in determining fair value and to make the actual calculations pursuant to the fair valuation methodologies previously approved by the Directors. Under procedures approved by the Directors, the Company's Adviser has formed a Valuation Committee whose members are approved by the Directors. The Valuation Committee provides administration and oversight of the Company's valuation policies and procedures, which are reviewed at least annually by the Directors. These procedures allow the Company to utilize independent pricing services, quotations from securities and financial instrument dealers and other market sources to determine fair value.
2. Fair Value Measurement: FASB Accounting Standards CodificationTM ("ASC") 820, "Fair Value Measurement" ("ASC 820"), defines fair value as the value that the Fund would receive to sell an investment or pay to transfer a liability in a timely transaction with an independent buyer in the principal market, or in the absence of a principal market, the most advantageous market for the investment or liability. ASC 820 establishes a three-tier hierarchy to distinguish between (1) inputs that reflect the assumptions market participants would use in valuing an asset or liability developed based on market data obtained from sources independent of the reporting entity (observable inputs) and (2) inputs that reflect the reporting entity's own assumptions about the assumptions market participants would use in valuing an asset or liability developed based on the best information available in the circumstances (unobservable inputs) and to establish classification of fair value measurements for disclosure purposes. Various inputs are used in determining the value of the Fund's investments. The inputs are summarized in the three broad levels listed below:
• Level 1 – unadjusted quoted prices in active markets for identical investments
• Level 2 – other significant observable inputs (including quoted prices for similar investments, interest rates, prepayment speeds, credit risk, etc.)
• Level 3 – significant unobservable inputs including the Fund's own assumptions in determining the fair value of investments. Factors considered in making this determination may
24
Morgan Stanley Institutional Fund, Inc.
Annual Report — December 31, 2019
Notes to Financial Statements (cont'd)
include, but are not limited to, information obtained by contacting the issuer, analysts, or the appropriate stock exchange (for exchange-traded securities), analysis of the issuer's financial statements or other available documents and, if necessary, available information concerning other securities in similar circumstances.
The inputs or methodology used for valuing securities are not necessarily an indication of the risk associated with investing in those securities and the determination of the significance of a particular input to the fair value measurement in its entirety requires judgment and considers factors specific to each security.
The following is a summary of the inputs used to value the Fund's investments as of December 31, 2019:
Investment Type | | Level 1
Unadjusted
quoted
prices
(000) | | Level 2
Other
significant
observable
inputs
(000) | | Level 3
Significant
unobservable
inputs
(000) | | Total
(000) | |
Assets: | |
Common Stocks | |
Automobiles | | $ | 4,770 | | | $ | 6,430 | | | $ | — | | | $ | 11,200 | | |
Banks | | | 137,956 | | | | 61,241 | | | | — | | | | 199,197 | | |
Beverages | | | 22,396 | | | | 11,439 | | | | — | | | | 33,835 | | |
Capital Markets | | | 2,429 | | | | 13,037 | | | | — | | | | 15,466 | | |
Chemicals | | | — | | | | 1,997 | | | | — | | | | 1,997 | | |
Construction & Engineering | | | 7,076 | | | | — | | | | — | | | | 7,076 | | |
Construction Materials | | | 15,689 | | | | — | | | | — | | | | 15,689 | | |
Consumer Finance | | | — | | | | 3,452 | | | | — | | | | 3,452 | | |
Diversified Consumer
Services | | | 12,959 | | | | — | | | | — | | | | 12,959 | | |
Diversified Financial
Services | | | 3,482 | | | | — | | | | — | | | | 3,482 | | |
Diversified
Telecommunication
Services | | | — | | | | 13,578 | | | | — | | | | 13,578 | | |
Electronic Equipment,
Instruments &
Components | | | 8,270 | | | | — | | | | — | | | | 8,270 | | |
Entertainment | | | — | | | | 5,429 | | | | — | | | | 5,429 | | |
Food & Staples Retailing | | | 37,132 | | | | 13,355 | | | | — | | | | 50,487 | | |
Food Products | | | 14,893 | | | | — | | | | — | | | | 14,893 | | |
Gas Utilities | | | 6,508 | | | | — | | | | — | | | | 6,508 | | |
Health Care Providers &
Services | | | 3,339 | | | | 11,453 | | | | — | | | | 14,792 | | |
Hotels, Restaurants &
Leisure | | | 4,283 | | | | 4,006 | | | | — | | | | 8,289 | | |
Industrial Conglomerates | | | 12,847 | | | | 350 | | | | — | | | | 13,197 | | |
Information Technology
Services | | | 8,251 | | | | — | | | | — | | | | 8,251 | | |
Insurance | | | 40,917 | | | | — | | | | — | | | | 40,917 | | |
Interactive Media &
Services | | | 50,816 | | | | — | | | | — | | | | 50,816 | | |
Internet & Direct
Marketing Retail | | | 42,079 | | | | — | | | | — | | | | 42,079 | | |
Investment Type | | Level 1
Unadjusted
quoted
prices
(000) | | Level 2
Other
significant
observable
inputs
(000) | | Level 3
Significant
unobservable
inputs
(000) | | Total
(000) | |
Common Stocks (cont'd) | |
Life Sciences Tools &
Services | | $ | — | | | $ | 2,561 | | | $ | — | | | $ | 2,561 | | |
Metals & Mining | | | 21,333 | | | | — | | | | — | | | | 21,333 | | |
Multi-Line Retail | | | — | | | | 10,154 | | | | — | | | | 10,154 | | |
Oil, Gas & Consumable
Fuels | | | 5,952 | | | | 26,104 | | | | — | | | | 32,056 | | |
Personal Products | | | — | | | | 4,745 | | | | — | | | | 4,745 | | |
Pharmaceuticals | | | 12,896 | | | | 8,243 | | | | — | | | | 21,139 | | |
Real Estate Management &
Development | | | 10,270 | | | | 4,057 | | | | — | | | | 14,327 | | |
Semiconductors &
Semiconductor
Equipment | | | 63,349 | | | | — | | | | — | | | | 63,349 | | |
Specialty Retail | | | — | | | | 4,449 | | | | — | | | | 4,449 | | |
Tech Hardware,
Storage & Peripherals | | | — | | | | 17,789 | | | | — | | | | 17,789 | | |
Textiles, Apparel & Luxury
Goods | | | 18,818 | | | | 11,745 | | | | — | | | | 30,563 | | |
Wireless
Telecommunication
Services | | | 5,252 | | | | — | | | | — | | | | 5,252 | | |
Total Common Stocks | | | 573,962 | | | | 235,614 | | | | — | | | | 809,576 | | |
Short-Term Investments | |
Investment Company | | | 9,572 | | | | — | | | | — | | | | 9,572 | | |
Total Assets | | $ | 583,534 | | | $ | 235,614 | | | $ | — | | | $ | 819,148 | | |
Liabilities: | |
Foreign Currency Forward
Exchange Contract | | | — | | | | (510 | ) | | | — | | | | (510 | ) | |
Total | | $ | 583,534 | | | $ | 235,104 | | | $ | — | | | $ | 818,638 | | |
Transfers between investment levels may occur as the markets fluctuate and/or the availability of data used in an investment's valuation changes.
3. Foreign Currency Translation and Foreign Investments: The books and records of the Fund are maintained in U.S. dollars. Foreign currency amounts are translated into U.S. dollars as follows:
– investments, other assets and liabilities at the prevailing rate of exchange on the valuation date;
– investment transactions and investment income at the prevailing rates of exchange on the dates of such transactions.
Although the net assets of the Fund are presented at the foreign exchange rates and market values at the close of the period, the Fund does not isolate that portion of the results of operations arising as a result of changes in the foreign exchange rates from the fluctuations arising from changes in the market prices of securities held at period end. Similarly, the Fund does not isolate the
25
Morgan Stanley Institutional Fund, Inc.
Annual Report — December 31, 2019
Notes to Financial Statements (cont'd)
effect of changes in foreign exchange rates from the fluctuations arising from changes in the market prices of securities sold during the period. Accordingly, realized and unrealized foreign currency gains (losses) on investments in securities are included in the reported net realized and unrealized gains (losses) on investment transactions and balances. However, pursuant to U.S. federal income tax regulations, gains and losses from certain foreign currency transactions and the foreign currency portion of gains and losses realized on sales and maturities of foreign denominated debt securities are treated as ordinary income for U.S. federal income tax purposes.
Net realized gains (losses) on foreign currency transactions represent net foreign exchange gains (losses) from foreign currency forward exchange contracts, disposition of foreign currencies, currency gains (losses) realized between the trade and settlement dates on securities transactions, and the difference between the amount of investment income and foreign withholding taxes recorded on the Fund's books and the U.S. dollar equivalent amounts actually received or paid. The change in unrealized currency gains (losses) on foreign currency transactions for the period is reflected in the Statement of Operations.
Foreign security and currency transactions may involve certain considerations and risks not typically associated with those of U.S. dollar denominated transactions as a result of, among other factors, fluctuations of exchange rates in relation to the U.S. dollar, the possibility of lower levels of governmental supervision and regulation of foreign securities markets and the possibility of political or economic instability.
Governmental approval for foreign investments may be required in advance of making an investment under certain circumstances in some countries, and the extent of foreign investments in domestic companies may be subject to limitation in other countries. Foreign ownership limitations also may be imposed by the charters of individual companies to prevent, among other concerns, violations of foreign investment limitations. As a result, an additional class of shares (identified as "Foreign" in the Portfolio of Investments) may be created and offered
for investment. The "local" and "foreign shares" market values may differ. In the absence of trading of the foreign shares in such markets, the Fund values the foreign shares at the closing exchange price of the local shares.
4. Derivatives: The Fund may, but is not required to, use derivative instruments for a variety of purposes, including hedging, risk management, portfolio management or to earn income. Derivatives are financial instruments whose value is based, in part, on the value of an underlying asset, interest rate, index or financial instrument. Prevailing interest rates and volatility levels, among other things, also affect the value of derivative instruments. A derivative instrument often has risks similar to its underlying asset and may have additional risks, including imperfect correlation between the value of the derivative and the underlying asset, risks of default by the counterparty to certain transactions, magnification of losses incurred due to changes in the market value of the securities, instruments, indices or interest rates to which the derivative instrument relates, risks that the transactions may not be liquid and risks arising from margin requirements. The use of derivatives involves risks that are different from, and possibly greater than, the risks associated with other portfolio investments. Derivatives may involve the use of highly specialized instruments that require investment techniques and risk analyses different from those associated with other portfolio investments. All of the Fund's holdings, including derivative instruments, are marked-to-market each day with the change in value reflected in unrealized appreciation (depreciation). Upon disposition, a realized gain or loss is recognized.
Certain derivative transactions may give rise to a form of leverage. Leverage magnifies the potential for gain and the risk of loss. Leverage associated with derivative transactions may cause the Fund to liquidate portfolio positions when it may not be advantageous to do so to satisfy its obligations or to meet earmarking or segregation requirements, pursuant to applicable Securities and Exchange Commission ("SEC") rules and regulations, or may cause the Fund to be more volatile than if the Fund had not been leveraged. Although the Adviser and/or Sub-Adviser seek to use derivatives to further the Fund's investment objectives, there is no assurance that the use of derivatives will achieve this result.
26
Morgan Stanley Institutional Fund, Inc.
Annual Report — December 31, 2019
Notes to Financial Statements (cont'd)
Following is a description of the derivative instruments and techniques that the Fund used during the period and their associated risks:
Foreign Currency Forward Exchange Contracts: In connection with its investments in foreign securities, the Fund also entered into contracts with banks, brokers or dealers to purchase or sell securities or foreign currencies at a future date. A foreign currency forward exchange contract ("currency contract") is a negotiated agreement between the contracting parties to exchange a specified amount of currency at a specified future time at a specified rate. The rate can be higher or lower than the spot rate between the currencies that are the subject of the contract. Currency contracts may be used to protect against uncertainty in the level of future foreign currency exchange rates or to gain or modify exposure to a particular currency. To the extent hedged by the use of currency contracts, the precise matching of the currency contract amounts and the value of the securities involved will not generally be possible because the future value of such securities in foreign currencies will change as a consequence of market movements in the value of those securities between the date on which the contract is entered into and the date it matures. Furthermore, such transactions may reduce or preclude the opportunity for gain if the value of the currency should move in the direction opposite to the position taken. There is additional risk to the extent that currency contracts create exposure to currencies in which the Fund's securities are not denominated. Unanticipated changes in currency prices may result in poorer overall performance for the Fund than if it had not entered into such contracts. The use of currency contracts involves the risk of loss from the insolvency or bankruptcy of the counterparty to the contract or the failure of the counterparty to make payments or otherwise comply with the terms of the contract. A currency contract is marked-to-market daily and the change in market value is recorded by the Fund as unrealized gain or loss. The Fund records realized gains (losses) when the currency contract is closed equal to the difference between the value of the currency contract at the time it was opened and the value at the time it was closed.
Futures: A futures contract is a standardized, exchange-traded agreement to buy or sell a specific quantity of an underlying asset, reference rate or index at a specific price at a specific future time. The value of a futures contract tends to increase and decrease in tandem with the value of the underlying instrument. Depending on the terms of the particular contract, futures contracts are settled through either physical delivery of the underlying instrument on the settlement date or by payment of a cash settlement amount on the settlement date. During the period the futures contract is open, payments are received from or made to the broker based upon changes in the value of the contract (the variation margin). A decision as to whether, when and how to use futures contracts involves the exercise of skill and judgment and even a well-conceived futures transaction may be unsuccessful because of market behavior or unexpected events. In addition to the derivatives risks discussed above, the prices of futures contracts can be highly volatile, using futures contracts can lower total return and the potential loss from futures contracts can exceed the Fund's initial investment in such contracts. No assurance can be given that a liquid market will exist for any particular futures contract at any particular time. There is also the risk of loss by the Fund of margin deposits in the event of bankruptcy of a broker with which the Fund has open positions in the futures contract.
As of December 31, 2019, the Fund did not have any open futures contracts.
FASB ASC 815, "Derivatives and Hedging" ("ASC 815"), is intended to improve financial reporting about derivative instruments by requiring enhanced disclosures to enable investors to better understand how and why the Fund uses derivative instruments, how these derivative instruments are accounted for and their effects on the Fund's financial position and results of operations.
The following table sets forth the fair value of the Fund's derivative contracts by primary risk exposure as of December 31, 2019:
| | | Liability Derivatives
Statement of Assets and
Liabilities Location | | Primary Risk
Exposure | | Value
(000) | |
Foreign Currency
Forward Exchange
Contract | | Unrealized Depreciation on
Foreign Currency Forward
Exchange Contract | | Currency Risk | | $ | (510 | ) | |
27
Morgan Stanley Institutional Fund, Inc.
Annual Report — December 31, 2019
Notes to Financial Statements (cont'd)
The following tables set forth by primary risk exposure the Fund's realized gains (losses) and change in unrealized appreciation (depreciation) by type of derivative contract for the year ended December 31, 2019 in accordance with ASC 815:
Realized Gain (Loss) | |
Primary Risk Exposure | | Derivative Type | | Value
(000) | |
Currency Risk | | Foreign Currency Forward
Exchange Contracts | | $ | (3,050 | ) | |
Equity Risk | | Futures Contract | | | 4,893 | | |
| | | Total | | $ | 1,843 | | |
Change in Unrealized Appreciation (Depreciation) | |
Primary Risk Exposure | | Derivative Type | | Value
(000) | |
Currency Risk | | Foreign Currency Forward
Exchange Contracts | | $ | 1,260 | | |
Equity Risk | | Futures Contract | | | 363 | | |
| | | Total | | $ | 1,623 | | |
At December 31, 2019, the Fund's derivative assets and liabilities are as follows:
Gross Amounts of Assets and Liabilities
Presented in the Statement of Assets and Liabilities | |
Derivatives(a) | | Assets(b)
(000) | | Liabilities(b)
(000) | |
Foreign Currency
Forward Exchange Contracts | | $ | — | | | $ | (510 | ) | |
(a) Excludes exchange-traded derivatives.
(b) Absent an event of default or early termination, OTC derivative assets and liabilities are presented gross and not offset in the Statement of Assets and Liabilities.
The Fund typically enters into International Swaps and Derivatives Association, Inc. Master Agreements ("ISDA Master Agreements") or similar master agreements (collectively, "Master Agreements") with its contract counterparties for certain OTC derivatives in order to, among other things, reduce its credit risk to counterparties. ISDA Master Agreements include provisions for general obligations, representations, collateral and events of default or termination. Under an ISDA Master Agreement, the Fund typically may offset with the counterparty certain OTC derivative financial instruments' payables and/or receivables with collateral held and/or posted and create one single net payment (close-out netting) in the event of default, termination and/or potential deterioration in the credit quality of the counterparty. Various Master Agreements govern the terms of certain transactions with counterparties, including transactions such as swap, forward, repurchase and reverse repurchase agreements. These Master Agreements
typically attempt to reduce the counterparty risk associated with such transactions by specifying credit protection mechanisms and providing standardization that improves legal certainty. Cross-termination provisions under Master Agreements typically provide that a default in connection with one transaction between the Fund and a counterparty gives the non-defaulting party the right to terminate any other transactions in place with the defaulting party to create one single net payment due to/due from the defaulting party and may be a feature in certain Master Agreements. In the event the Fund exercises its right to terminate a Master Agreement after a counterparty experiences a termination event as defined in the Master Agreement, the return of collateral with market value in excess of the Fund's net liability may be delayed or denied.
The following table presents derivative financial instruments that are subject to enforceable netting arrangements as of December 31, 2019:
Gross Amounts Not Offset in the Statement of Assets and Liabilities | |
Counterparty | | Gross Liability
Derivatives
Presented in the
Statement of
Assets and
Liabilities
(000) | | Financial
Instrument
(000) | | Collateral
Pledged
(000) | | Net Amount
(not less
than $0)
(000) | |
Goldman Sachs International | | $ | 510 | | | $ | — | | | $ | — | | | $ | 510 | | |
For the year ended December 31, 2019, the approximate average monthly amount outstanding for each derivative type is as follows:
Foreign Currency Forward Exchange Contracts: | |
Average monthly principal amount | | $ | 156,533,000 | | |
Futures Contracts: | |
Average monthly notional value | | $ | 40,498,000 | | |
5. Securities Lending: The Fund lends securities to qualified financial institutions, such as broker-dealers, to earn additional income. Any increase or decrease in the fair value of the securities loaned that might occur and any interest earned or dividends declared on those securities during the term of the loan would remain in the Fund. The Fund would receive cash or securities as collateral in an amount equal to or exceeding 100% of the current fair value of the loaned securities. The collateral is marked-to-market daily by State Street Bank and Trust Company ("State Street"), the securities lending agent, to ensure that a minimum of 100% collateral coverage is maintained.
28
Morgan Stanley Institutional Fund, Inc.
Annual Report — December 31, 2019
Notes to Financial Statements (cont'd)
Based on pre-established guidelines, the securities lending agent invests any cash collateral that is received in an affiliated money market portfolio and repurchase agreements. Securities lending income is generated from the earnings on the invested collateral and borrowing fees, less any rebates owed to the borrowers and compensation to the lending agent, and is recorded as "Income from Securities Loaned — Net" in the Fund's Statement of Operations. Risks in securities lending transactions are that a borrower may not provide additional collateral when required or return the securities when due, and that the value of the short-term investments will be less than the amount of cash collateral plus any rebate that is required to be returned to the borrower.
The Fund has the right under the securities lending agreement to recover the securities from the borrower on demand.
The following table presents financial instruments that are subject to enforceable netting arrangements as of December 31, 2019:
Gross Amounts Not Offset in the Statement of Assets and Liabilities | |
Gross Asset
Amounts
Presented in the
Statement of
Assets and
Liabilities
(000) | | Financial
Instrument
(000) | | Collateral
Received
(000) | | Net Amount
(not less
than $0)
(000) | |
| $ | 4,042 | (c) | | $ | — | | | $ | (4,042 | )(d)(e) | | $ | 0 | | |
(c) Represents market value of loaned securities at year end.
(d) The Fund received cash collateral of approximately $4,264,000, which was subsequently invested in Morgan Stanley Institutional Liquidity Funds as reported in the Portfolio of Investments.
(e) The actual collateral received is greater than the amount shown here due to overcollateralization.
FASB ASC 860, "Transfers & Servicing: Repurchase-to-Maturity Transactions, Repurchase Financings, and Disclosures", is intended to provide increased transparency about the types of collateral pledged in securities lending transactions and other similar transactions that are accounted for as secured borrowing.
The following table displays a breakdown of transactions accounted for as secured borrowings, the gross obligations by class of collateral pledged and the remaining
contractual maturity of those transactions as of December 31, 2019:
Remaining Contractual Maturity of the Agreements | |
| | | Overnight and
Continuous
(000) | | <30 days
(000) | | Between
30 &
90 days
(000) | | >90 days
(000) | | Total
(000) | |
Securities Lending
Transactions | |
Common Stocks | | $ | 4,264 | | | $ | — | | | $ | — | | | $ | — | | | $ | 4,264 | | |
Total Borrowings | | $ | 4,264 | | | $ | — | | | $ | — | | | $ | — | | | $ | 4,264 | | |
Gross amount of
recognized liabilities
for securities lending
transactions | | | | | | | | | | $ | 4,264 | | |
6. Redemption Fees: The Fund will assess a 2% redemption fee on Class I shares, Class A shares, Class L shares, Class C shares, Class IS shares and Class IR shares which is paid directly to the Fund, for shares redeemed or exchanged within thirty days of purchase, subject to certain exceptions. The redemption fee is designed to protect the Fund and its remaining shareholders from the effects of short-term trading. These fees, if any, are included in the Statements of Changes in Net Assets.
7. Indemnifications: The Company enters into contracts that contain a variety of indemnifications. The Company's maximum exposure under these arrangements is unknown. However, the Company has not had prior claims or losses pursuant to these contracts and expects the risk of loss to be remote.
8. Dividends and Distributions to Shareholders: Dividends and distributions to shareholders are recorded on the ex-dividend date. Dividends from net investment income, if any, are declared and paid annually. Net realized capital gains, if any, are distributed at least annually.
9. Security Transactions, Income and Expenses: Security transactions are accounted for on the trade date (date the order to buy or sell is executed). Realized gains and losses on the sale of investment securities are determined on the specific identified cost method. Dividend income and other distributions are recorded on the ex-dividend date (except for certain foreign dividends which may be recorded as soon as the Fund is informed of such dividends) net of applicable withholding taxes. Interest income is recognized on the accrual basis except where collection is in doubt. Discounts are accreted and premiums are amortized over the life of the respective securities. Most expenses of the Company can be directly attributed
29
Morgan Stanley Institutional Fund, Inc.
Annual Report — December 31, 2019
Notes to Financial Statements (cont'd)
to a particular Fund. Expenses which cannot be directly attributed are apportioned among the Funds based upon relative net assets or other appropriate methods. Income, expenses (other than class specific expenses — distribution and shareholder services, transfer agency and sub transfer agency fees) and realized and unrealized gains or losses are allocated to each class of shares based upon their relative net assets.
B. Advisory/Sub-Advisory Fees: The Adviser, a wholly-owned subsidiary of Morgan Stanley, provides the Fund with advisory services under the terms of an Investment Advisory Agreement, paid quarterly, at the annual rate based on the daily net assets as follows:
First $500
million | | Next $500
million | | Next $1.5
billion | | Over $2.5
billion | |
| | 0.85 | % | | | 0.75 | % | | | 0.70 | % | | | 0.65 | % | |
For the year ended December 31, 2019, the advisory fee rate (net of waiver/rebate) was equivalent to an annual effective rate of 0.71% of the Fund's average daily net assets.
The Adviser has agreed to reduce its advisory fee and/or reimburse the Fund so that total annual Fund operating expenses, excluding certain investment related expenses, taxes, interest and other extraordinary expenses (including litigation), will not exceed 1.05% for Class I shares, 1.40% for Class A shares, 1.90% for Class L shares, 2.15% for Class C shares, 0.95% for Class IS shares and 0.95% for Class IR shares. The fee waivers and/or expense reimbursements will continue for at least one year from the date of the Fund's prospectus or until such time as the Directors act to discontinue all or a portion of such waivers and/or reimbursements when they deem such action is appropriate. For the year ended December 31, 2019, approximately $777,000 of advisory fees were waived and approximately $57,000 of other expenses were reimbursed by the Adviser pursuant to this arrangement.
The Adviser has entered into a Sub-Advisory Agreement with the Sub-Adviser, a wholly-owned subsidiary of Morgan Stanley. The Sub-Adviser provides the Fund with advisory services subject to the overall supervision of the Adviser and the Fund's Officers and Directors. The Adviser pays the Sub-Adviser on a monthly basis a portion of the net advisory fees the Adviser receives from the Fund.
C. Administration Fees: The Adviser also serves as Administrator to the Company and provides administrative services pursuant to an Administration Agreement for an annual fee, accrued daily and paid monthly, of 0.08% of the Fund's average daily net assets.
Under a Sub-Administration Agreement between the Administrator and State Street, State Street provides certain administrative services to the Company. For such services, the Administrator pays State Street a portion of the fee the Administrator receives from the Fund.
D. Distribution and Shareholder Services Fees: Morgan Stanley Distribution, Inc. ("MSDI" or the "Distributor"), a wholly-owned subsidiary of the Adviser and an indirect subsidiary of Morgan Stanley, serves as the Company's Distributor of Fund shares pursuant to a Distribution Agreement. The Company has adopted a Shareholder Services Plan with respect to Class A shares pursuant to Rule 12b-1 under the Act. Under the Shareholder Services Plan, the Fund pays the Distributor a shareholder services fee, accrued daily and paid monthly, at an annual rate of 0.25% of the Fund's average daily net assets attributable to Class A shares.
The Company has adopted a Distribution and Shareholder Services Plan with respect to Class L shares pursuant to Rule 12b-1 under the Act. Under the Distribution and Shareholder Services Plan, the Fund pays the Distributor a distribution fee, accrued daily and paid monthly, at an annual rate of 0.50% and a shareholder services fee, accrued daily and paid monthly, at an annual rate of 0.25% of the Fund's average daily net assets attributable to Class L shares.
The Company has adopted a Distribution and Shareholder Services Plan with respect to Class C shares pursuant to Rule 12b-1 under the Act. Under the Distribution and Shareholder Services Plan, the Fund pays the Distributor a distribution fee, accrued daily and paid monthly, at an annual rate of 0.75% and a shareholder services fee, accrued daily and paid monthly, at an annual rate of 0.25% of the Fund's average daily net assets attributable to Class C shares.
The distribution and shareholder services fees are used to support the expenses associated with servicing and maintaining accounts. The Distributor may compensate other parties for providing shareholder support services to investors who purchase Class A, Class L and Class C shares.
E. Dividend Disbursing and Transfer Agent: The Company's dividend disbursing and transfer agent is DST Asset Manager Solutions, Inc. ("DST"). Pursuant to a Transfer Agency Agreement, the Company pays DST a fee based on the number of classes, accounts and transactions relating to the Funds of the Company.
30
Morgan Stanley Institutional Fund, Inc.
Annual Report — December 31, 2019
Notes to Financial Statements (cont'd)
F. Custodian Fees: State Street (the "Custodian") also serves as Custodian for the Company in accordance with a Custodian Agreement. The Custodian holds cash, securities and other assets of the Company as required by the Act. Custody fees are payable monthly based on assets held in custody, investment purchases and sales activity and account maintenance fees, plus reimbursement for certain out-of-pocket expenses.
G. Security Transactions and Transactions with Affiliates: For the year ended December 31, 2019, purchases and sales of investment securities for the Fund, other than long-term U.S. Government securities and short-term investments were approximately $492,376,000 and $993,115,000, respectively. There were no purchases and sales of long-term U.S. Government securities for the year ended December 31, 2019.
The Fund invests in the Institutional Class of the Morgan Stanley Institutional Liquidity Funds — Government Portfolio (the "Liquidity Funds"), an open-end management investment company managed by the Adviser, both directly and as a portion of the securities held as collateral on loaned securities. Advisory fees paid by the Fund are reduced by an amount equal to its pro-rata share of the advisory and administration fees paid by the Fund due to its investment in the Liquidity Funds. For the year ended December 31, 2019, advisory fees paid were reduced by approximately $33,000 relating to the Fund's investment in the Liquidity Funds.
A summary of the Fund's transactions in shares of affiliated investments during the year ended December 31, 2019 is as follows:
Affiliated
Investment
Company | | Value
December 31,
2018
(000) | | Purchases
at Cost
(000) | | Proceeds
from Sales
(000) | | Dividend
Income
(000) | |
Liquidity Funds | | $ | 78,197 | | | $ | 728,613 | | | $ | 797,238 | | | $ | 449 | | |
Affiliated
Investment
Company (cont'd) | | Realized
Gain (Loss)
(000) | | Change in
Unrealized
Appreciation
(Depreciation)
(000) | | Value
December 31,
2019
(000) | |
Liquidity Funds | | $ | — | | | $ | — | | | $ | 9,572 | | |
During the year ended December 31, 2019, the Fund incurred approximately $2,000 in brokerage commissions with Morgan Stanley & Co. LLC, an affiliate of the Adviser/Administrator, Sub-Adviser and Distributor, for portfolio transactions executed on behalf of the Fund.
The Fund is permitted to purchase and sell securities ("cross-trade") from and to other Morgan Stanley funds as well as
other funds and client accounts for which the Adviser or an affiliate of the Adviser serves as investment adviser, pursuant to procedures approved by the Directors in compliance with Rule 17a-7 under the Act (the "Rule"). Each cross-trade is executed at the current market price in compliance with provisions of the Rule. For the year ended December 31, 2019, the Fund did not engage in any cross-trade transactions.
The Fund has an unfunded Deferred Compensation Plan (the "Compensation Plan"), which allows each independent Director to defer payment of all, or a portion, of the fees he or she receives for serving on the Board of Directors. Each eligible Director generally may elect to have the deferred amounts credited with a return equal to the total return on one or more of the Morgan Stanley funds that are offered as investment options under the Compensation Plan. Appreciation/depreciation and distributions received from these investments are recorded with an offsetting increase/decrease in the deferred compensation obligation and do not affect the NAV of the Fund.
H. Federal Income Taxes: It is the Fund's intention to continue to qualify as a regulated investment company and distribute all of its taxable and tax-exempt income. Accordingly, no provision for federal income taxes is required in the financial statements.
The Fund may be subject to taxes imposed by countries in which it invests. Such taxes are generally based on income and/or capital gains earned or repatriated. Taxes are accrued based on net investment income, net realized gains and net unrealized appreciation as such income and/or gains are earned. Taxes may also be based on transactions in foreign currency and are accrued based on the value of investments denominated in such currency.
FASB ASC 740-10, "Income Taxes — Overall", sets forth a minimum threshold for financial statement recognition of the benefit of a tax position taken or expected to be taken in a tax return. Management has concluded there are no significant uncertain tax positions that would require recognition in the financial statements. If applicable, the Fund recognizes interest accrued related to unrecognized tax benefits in "Interest Expense" and penalties in "Other Expenses" in the Statement of Operations. The Fund files tax returns with the U.S. Internal Revenue Service, New York and various states. Generally, each of the tax years in the four-year period ended December 31, 2019 remains subject to examination by taxing authorities.
The tax character of distributions paid may differ from the character of distributions shown for GAAP purposes due to
31
Morgan Stanley Institutional Fund, Inc.
Annual Report — December 31, 2019
Notes to Financial Statements (cont'd)
short-term capital gains being treated as ordinary income for tax purposes. The tax character of distributions paid during fiscal years 2019 and 2018 was as follows:
2019
Distributions
Paid From: | | 2018
Distributions
Paid From: | |
Ordinary
Income
(000) | | Long-Term
Capital Gain
(000) | | Ordinary
Income
(000) | | Long-Term
Capital Gain
(000) | |
| $ | 6,000 | | | $ | 91,318 | | | $ | 17,069 | | | $ | 9,096 | | |
The amount and character of income and gains to be distributed are determined in accordance with income tax regulations which may differ from GAAP. These book/tax differences are either considered temporary or permanent in nature.
Temporary differences are attributable to differing book and tax treatments for the timing of the recognition of gains (losses) on certain investment transactions and the timing of the deductibility of certain expenses.
Permanent differences, primarily due to equalization debits and tax adjustments related to the Reorganization A and B, resulted in the following reclassifications among the components of net assets at December 31, 2019:
Total
Distributable
Earnings
(000) | | Paid-in
Capital
(000) | |
| $ | (26,073 | ) | | $ | 26,073 | | |
At December 31, 2019, the components of distributable earnings for the Fund on a tax basis were as follows:
Undistributed
Ordinary
Income
(000) | | Undistributed
Long-Term
Capital Gain
(000) | |
| $ | 2,837 | | | $ | 4,178 | | |
I. Credit Facility: The Company and other Morgan Stanley funds participated in a $150,000,000 committed, unsecured revolving line of credit facility (the "Facility") with State Street. Effective April 22, 2019, the committed line amount increased to $300,000,000. This Facility is to be used for temporary emergency purposes or funding of shareholder redemption requests. The interest rate on borrowings is based on the federal funds rate or 1 month LIBOR rate plus a spread. The Facility also has a commitment fee of 0.25% per annum based on the unused portion of the Facility. During the year ended December 31, 2019, the Fund did not have any borrowings under the Facility.
J. Other: At December 31, 2019, the Fund had record owners of 10% or greater. Investment activities of these shareholders could have a material impact on the Fund. The aggregate percentage of such owners was 57.5%.
32
Morgan Stanley Institutional Fund, Inc.
Annual Report — December 31, 2019
Report of Independent Registered Public Accounting Firm
To the Shareholders and Board of Directors of
Morgan Stanley Institutional Fund, Inc. —
Emerging Markets Portfolio
Opinion on the Financial Statements
We have audited the accompanying statement of assets and liabilities of Emerging Markets Portfolio (the "Fund") (one of the funds constituting Morgan Stanley Institutional Fund, Inc. (the "Company")), including the portfolio of investments, as of December 31, 2019, and the related statement of operations for the year then ended, the statements of changes in net assets for each of the two years in the period then ended, the financial highlights for each of the five years in the period then ended and the related notes (collectively referred to as the "financial statements"). In our opinion, the financial statements present fairly, in all material respects, the financial position of Emerging Markets Portfolio (one of the funds constituting Morgan Stanley Institutional Fund, Inc.) at December 31, 2019, the results of its operations for the year then ended, the changes in its net assets for each of the two years in the period then ended and its financial highlights for each of the five years in the period then ended, in conformity with U.S. generally accepted accounting principles.
Basis for Opinion
These financial statements are the responsibility of the Company's management. Our responsibility is to express an opinion on the Fund's financial statements based on our audits. We are a public accounting firm registered with the Public Company Accounting Oversight Board (United States) ("PCAOB") and are required to be independent with respect to the Company in accordance with the U.S. federal securities law and the applicable rules and regulations of the Securities and Exchange Commission and the PCAOB.
We conducted our audits in accordance with the standards of the PCAOB. Those standards require that we plan and perform the audit to obtain reasonable assurance about whether the financial statements are free of material misstatement, whether due to error or fraud. The Company is not required to have, nor were we engaged to perform, an audit of the Company's internal control over financial reporting. As part of our audits, we are required to obtain an understanding of internal control over financial reporting, but not for the purpose of expressing an opinion on the effectiveness of the Company's internal control over financial reporting. Accordingly, we express no such opinion.
Our audits included performing procedures to assess the risks of material misstatement of the financial statements, whether due to error or fraud, and performing procedures that respond to those risks. Such procedures included examining, on a test basis, evidence regarding the amounts and disclosures in the financial statements. Our procedures included confirmation of securities owned as of December 31, 2019 by correspondence with the custodian and others or by other appropriate auditing procedures where replies from others were not received. Our audits also included evaluating the accounting principles used and significant estimates made by management, as well as evaluating the overall presentation of the financial statements. We believe that our audits provide a reasonable basis for our opinion.

We have served as the auditor of one or more Morgan Stanley investment companies since 2000.
Boston, Massachusetts
February 27, 2020
33
Morgan Stanley Institutional Fund, Inc.
Annual Report — December 31, 2019
Federal Tax Notice (unaudited)
For federal income tax purposes, the following information is furnished with respect to the distributions paid by the Fund during its taxable year ended December 31, 2019. For corporate shareholders 0.17% of the dividends qualified for the dividends received deduction.
The Fund designated and paid approximately $116,931,000 as a long-term capital gain distribution.
For federal income tax purposes, the following information is furnished with respect to the Fund's earnings for its taxable year ended December 31, 2019. When distributed, certain earnings may be subject to a maximum tax rate of 15% as provided for by the Jobs and Growth Tax Relief Reconciliation Act of 2003. The Fund designated up to a maximum of approximately $8,745,000 as taxable at this lower rate.
The Fund intends to pass through foreign tax credits of approximately $2,745,000 and has derived net income from sources within foreign countries amounting to approximately $25,307,000.
In January, the Fund provides tax information to shareholders for the preceding calendar year.
34
Privacy Notice (unaudited) April 2019
FACTS | | WHAT DOES MSIM DO WITH YOUR PERSONAL INFORMATION? | |
Why? | | Financial companies choose how they share your personal information. Federal law gives consumers the right to limit some but not all sharing. Federal law also requires us to tell you how we collect, share, and protect your personal information. Please read this notice carefully to understand what we do. | |
What? | | The types of personal information we collect and share depend on the product or service you have with us. This information can include:
n Social Security number and income
n investment experience and risk tolerance
n checking account number and wire transfer instructions | |
How? | | All financial companies need to share customers' personal information to run their everyday business. In the section below, we list the reasons financial companies can share their customers' personal information; the reasons MSIM chooses to share; and whether you can limit this sharing. | |
Reasons we can share your personal information | | Does MSIM share? | | Can you limit this sharing? | |
For our everyday business purposes —
such as to process your transactions, maintain your account(s), respond to court orders and legal investigations, or report to credit bureaus | | Yes | | No | |
For our marketing purposes —
to offer our products and services to you | | Yes | | No | |
For joint marketing with other financial companies | | No | | We don't share | |
For our affiliates' everyday business purposes —
information about your transactions and experiences | | Yes | | No | |
For our affiliates' everyday business purposes —
information about your creditworthiness | | No | | We don't share | |
For our affiliates to market to you | | No | | We don't share | |
For non-affiliates to market to you | | No | | We don't share | |
Questions? Call toll-free (844) 312-6327 or email: imprivacyinquiries@morganstanley.com
35
Privacy Notice (unaudited) (cont'd) April 2019
Who we are
Who is providing this notice? | | Morgan Stanley Investment Management, Inc. and its affiliated registered investment advisers, registered broker-dealers, and registered and unregistered funds ("MSIM") | |
What we do
How does MSIM protect my personal information? | | To protect your personal information from unauthorized access and use, we use security measures that comply with federal law. These measures include computer safeguards and secured files and buildings. We have policies governing the proper handling of customer information by personnel and requiring third parties that provide support to adhere to appropriate security standards with respect to such information. | |
How does MSIM collect my personal information? | | We collect your personal information, for example, when you
n open an account or make deposits or withdrawals from your account
n buy securities from us or make a wire transfer
n give us your contact information
We also collect your personal information from others, such as credit bureaus, affiliates, or other companies. | |
Why can't I limit all sharing? | | Federal law gives you the right to limit only
n sharing for affiliates' everyday business purposes — information about your creditworthiness
n affiliates from using your information to market to you
n sharing for non-affiliates to market to you
State laws and individual companies may give you additional rights to limit sharing. See below for more on your rights under state law. | |
Definitions
Affiliates | | Companies related by common ownership or control. They can be financial and non-financial companies.
n Our affiliates include companies with a Morgan Stanley name and financial companies such as Morgan Stanley Smith Barney LLC and Morgan Stanley & Co. | |
Non-affiliates | | Companies not related by common ownership or control. They can be financial and non-financial companies.
n MSIM does not share with non-affiliates so they can market to you. | |
Joint marketing | | A formal agreement between non-affiliated financial companies that together market financial products or services to you.
n MSIM doesn't jointly market | |
Other Important Information
Vermont: Except as permitted by law, we will not share personal information we collect about Vermont residents with Non-affiliates unless you provide us with your written consent to share such information.
California: Except as permitted by law, we will not share personal information we collect about California residents with Non-affiliates and we will limit sharing such personal information with our Affiliates to comply with California privacy laws that apply to us.
36
Morgan Stanley Institutional Fund, Inc.
Annual Report — December 31, 2019
Director and Officer Information (unaudited)
Independent Directors:
Name, Birth Year
and Address of
Independent Director | | Position(s)
Held with
Registrant | | Length of Time
Served* | | Principal Occupation(s) During Past 5 Years
and Other Relevant Professional Experience | | Number of
Funds in
Fund Complex
Overseen by
Independent
Director** | | Other Directorships
Held by Independent
Director*** | |
Frank L. Bowman
c/o Perkins Coie LLP
Counsel to the Independent Directors
1155 Avenue of the Americas
New York, NY 10036
Birth Year 1944 | | Director | | Since
August 2006 | | President, Strategic Decisions, LLC (consulting) (since February 2009); Director or Trustee of various Morgan Stanley Funds (since August 2006); Chairperson of the Compliance and Insurance Committee (since October 2015); formerly, Chairperson of the Insurance Sub-Committee of the Compliance and Insurance Committee (2007-2015); served as President and Chief Executive Officer of the Nuclear Energy Institute (policy organization) (February 2005-November 2008); retired as Admiral, U.S. Navy after serving over 38 years on active duty including 8 years as Director of the Naval Nuclear Propulsion Program in the Department of the Navy and the U.S. Department of Energy (1996-2004); served as Chief of Naval Personnel (July 1994-September 1996) and on the Joint Staff as Director of Political Military Affairs (June 1992-July 1994); knighted as Honorary Knight Commander of the Most Excellent Order of the British Empire; awarded the Officier de l'Orde National du Mérite by the French Government; elected to the National Academy of Engineering (2009). | | | 86 | | | Director of Naval and Nuclear Technologies LLP; Director Emeritus of the Armed Services YMCA; Member of the National Security Advisory Council of the Center for U.S. Global Engagement and a member of the CNA Military Advisory Board; Trustee of Fairhaven United Methodist Church; Member of the Board of Advisors of the Dolphin Scholarship Foundation; Director of other various non-profit organizations; formerly, Director of BP p.l.c. (November 2010-May 2019). | |
Kathleen A. Dennis
c/o Perkins Coie LLP
Counsel to the Independent Directors
1155 Avenue of the Americas
New York, NY 10036
Birth Year 1953 | | Director | | Since August 2006 | | President, Cedarwood Associates (mutual fund and investment management consulting) (since July 2006); Chairperson of the Liquidity and Alternatives Sub-Committee of the Investment Committee (since October 2006) and Director or Trustee of various Morgan Stanley Funds (since August 2006); formerly, Senior Managing Director of Victory Capital Management (1993-2006). | | | 86 | | | Director of various non-profit organizations. | |
Nancy C. Everett
c/o Perkins Coie LLP
Counsel to the Independent Directors
1155 Avenue of the Americas
New York, NY 10036
Birth Year 1955 | | Director | | Since January 2015 | | Chief Executive Officer, Virginia Commonwealth University Investment Company (since November 2015); Owner, OBIR, LLC (institutional investment management consulting) (since June 2014); formerly, Managing Director, BlackRock, Inc. (February 2011-December 2013); and Chief Executive Officer, General Motors Asset Management (a/k/a Promark Global Advisors, Inc.) (June 2005-May 2010). | | | 87 | | | Formerly, Member of Virginia Commonwealth University School of Business Foundation (2005-2016); Member of Virginia Commonwealth University Board of Visitors (2013-2015); Member of Committee on Directors for Emerging Markets Growth Fund, Inc. (2007-2010); Chairperson of Performance Equity Management, LLC (2006-2010); and Chairperson, GMAM Absolute Return Strategies Fund, LLC (2006-2010). | |
37
Morgan Stanley Institutional Fund, Inc.
Annual Report — December 31, 2019
Director and Officer Information (unaudited) (cont'd)
Independent Directors: (cont'd)
Name, Birth Year
and Address of
Independent Director | | Position(s)
Held with
Registrant | | Length of Time
Served* | | Principal Occupation(s) During Past 5 Years
and Other Relevant Professional Experience | | Number of
Funds in
Fund Complex
Overseen by
Independent
Director** | | Other Directorships
Held by Independent
Director*** | |
Jakki L. Haussler
c/o Perkins Coie LLP
Counsel to the Independent Directors
1155 Avenue of the Americas
New York, NY 10036
Birth Year 1957 | | Director | | Since January 2015 | | Chairman, Opus Capital Group (since 1996); formerly, Chief Executive Officer, Opus Capital Group (1996-2019); Director, Capvest Venture Fund, LP (May 2000-December 2011); Partner, Adena Ventures, LP (July 1999-December 2010); Director, The Victory Funds (February 2005-July 2008). | | | 87 | | | Director of Service Corporation International and Member, Audit Committee and Investment Committee; Director of Cincinnati Bell Inc. and Member, Audit Committee and Governance and Nominating Committee; Chairman of Northern Kentucky University Member Investment Committee; Member of Chase College of Law Transactional Law Practice Center Board of Advisors; Director of Best Transport; Director of Chase College of Law Board of Visitors; formerly, Member, University of Cincinnati Foundation Investment Committee; Member, Miami University Board of Visitors (2008-2011); Trustee of Victory Funds (2005-2008) and Chairman, Investment Committee (2007-2008) and Member, Service Provider Committee (2005-2008). | |
Dr. Manuel H. Johnson
c/o Johnson Smick International, Inc.
220 I Street, NE — Suite 200
Washington, D.C. 20002
Birth Year 1949 | | Director | | Since July 1991 | | Senior Partner, Johnson Smick International, Inc. (consulting firm); Chairperson of the Investment Committee (since October 2006) and Director or Trustee of various Morgan Stanley Funds (since July 1991); Co-Chairman and a founder of the Group of Seven Council (G7C) (international economic commission); formerly, Chairperson of the Audit Committee (July 1991-September 2006), Vice Chairman of the Board of Governors of the Federal Reserve System and Assistant Secretary of the U.S. Treasury. | | | 86 | | | Director of NVR, Inc. (home construction). | |
Joseph J. Kearns
c/o Perkins Coie LLP
Counsel to the Independent Directors
1155 Avenue of the Americas
New York, NY 10036
Birth Year 1942 | | Director | | Since August 1994 | | Senior Adviser, Kearns & Associates LLC (investment consulting); Chairperson of the Audit Committee (since October 2006) and Director or Trustee of various Morgan Stanley Funds (since August 1994); formerly, Deputy Chairperson of the Audit Committee (July 2003-September 2006) and Chairperson of the Audit Committee of various Morgan Stanley Funds (since August 1994); CFO of the J. Paul Getty Trust. | | | 87 | | | Prior to August 10, 2016, Director of Electro Rent Corporation (equipment leasing); Prior to December 31, 2013, Director of The Ford Family Foundation. | |
38
Morgan Stanley Institutional Fund, Inc.
Annual Report — December 31, 2019
Director and Officer Information (unaudited) (cont'd)
Independent Directors: (cont'd)
Name, Birth Year
and Address of
Independent Director | | Position(s)
Held with
Registrant | | Length of Time
Served* | | Principal Occupation(s) During Past 5 Years
and Other Relevant Professional Experience | | Number of
Funds in
Fund Complex
Overseen by
Independent
Director** | | Other Directorships
Held by Independent
Director*** | |
Michael F. Klein
c/o Perkins Coie LLP
Counsel to the Independent Directors
1155 Avenue of the Americas
New York, NY 10036
Birth Year 1958 | | Director | | Since August 2006 | | Managing Director, Aetos Alternatives Management, LP (since March 2000); Co-President, Aetos Alternatives Management, LP (since January 2004) and Co-Chief Executive Officer of Aetos Alternatives Management, LP (since August 2013); Chairperson of the Fixed Income Sub-Committee of the Investment Committee (since October 2006) and Director or Trustee of various Morgan Stanley Funds (since August 2006); formerly, Managing Director, Morgan Stanley & Co. Inc. and Morgan Stanley Dean Witter Investment Management and President, various Morgan Stanley Funds (June 1998-March 2000); Principal, Morgan Stanley & Co. Inc. and Morgan Stanley Dean Witter Investment Management (August 1997-December 1999). | | | 86 | | | Director of certain investment funds managed or sponsored by Aetos Alternatives Management, LP; Director of Sanitized AG and Sanitized Marketing AG (specialty chemicals). | |
Patricia Maleski
c/o Perkins Coie LLP
Counsel to the Independent Directors
1155 Avenue of the Americas
New York, NY 10036
Birth Year 1960 | | Director | | Since January 2017 | | Managing Director, JPMorgan Asset Management (2004-2016); Oversight and Control Head of Fiduciary and Conflicts of Interest Program (2015-2016); Chief Control Officer-Global Asset Management (2013-2015); President, JPMorgan Funds (2010-2013); Chief Administrative Officer (2004-2013); various other positions including Treasurer and Board Liaison (since 2001). | | | 87 | | | None. | |
Michael E. Nugent
522 Fifth Avenue
New York, NY 10036
Birth Year 1936 | | Chair of the Board and Director | | Chair of the Boards since July 2006 and Director since July 1991 | | Chair of the Boards of various Morgan Stanley Funds (since July 2006); Chairperson of the Governance Committee (since January 2019) and Director or Trustee of various Morgan Stanley Funds (since July 1991); formerly, Chairperson of each of the Closed-End Fund committee (until December 2019) and the Insurance Committee (until July 2006); General Partner, Triumph Capital, L.P. (private investment partnership) (1988-2013). | | | 86 | | | None. | |
W. Allen Reed
c/o Perkins Coie LLP
Counsel to the Independent Directors
1155 Avenue of the Americas
New York, NY 10036
Birth Year 1947 | | Vice Chair of the Board and Director | | Vice Chair of the Boards since January 2020 and Director since August 2006 | | Chairperson of the Equity Sub-Committee of the Investment Committee (since October 2006) and Director or Trustee of various Morgan Stanley Funds (since August 2006); formerly, President and CEO of General Motors Asset Management; Chairman and Chief Executive Officer of the GM Trust Bank and Corporate Vice President of General Motors Corporation (August 1994-December 2005). | | | 86 | | | Formerly, Director of Legg Mason, Inc.; formerly, Director of the Auburn University Foundation (2010-2015). | |
* This is the earliest date the Director began serving the Morgan Stanley Funds. Each Director serves an indefinite term, until his or her successor is elected.
** The Fund Complex includes (as of December 31, 2019) all open-end and closed-end funds (including all of their portfolios) advised by Morgan Stanley Investment Management Inc. (the "Adviser") and any funds that have an adviser that is an affiliated person of the Adviser (including, but not limited to, Morgan Stanley AIP GP LP).
*** This includes any directorships at public companies and registered investment companies held by the Director at any time during the past five years.
39
Morgan Stanley Institutional Fund, Inc.
Annual Report — December 31, 2019
Director and Officer Information (unaudited) (cont'd)
Executive Officers:
Name, Birth Year and Address of
Executive Officer | | Position(s) Held
with
Registrant | | Length of
Time Served* | | Principal Occupation(s) During Past 5 Years | |
John H. Gernon
522 Fifth Avenue
New York, NY 10036
Birth Year 1963 | | President and Principal Executive Officer | | Since September 2013 | | President and Principal Executive Officer of the Equity and Fixed Income Funds and the Morgan Stanley AIP Funds (since September 2013) and the Liquidity Funds and various money market funds (since May 2014) in the Fund Complex; Managing Director of the Adviser; Head of Product (since 2006). | |
Timothy J. Knierim
522 Fifth Avenue
New York, NY 10036
Birth Year 1959 | | Chief Compliance Officer | | Since December 2016 | | Managing Director of the Adviser and various entities affiliated with the Adviser; Chief Compliance Officer of various Morgan Stanley Funds and the Adviser (since December 2016) and Chief Compliance Officer of Morgan Stanley AIP GP LP (since 2014). Formerly, Managing Director and Deputy Chief Compliance Officer of the Adviser (2014-2016); and formerly, Chief Compliance Officer of Prudential Investment Management, Inc. (2007-2014). | |
Francis J. Smith
522 Fifth Avenue
New York, NY 10036
Birth Year 1965 | | Treasurer and Principal Financial Officer | | Treasurer since July 2003 and Principal Financial Officer since September 2002 | | Managing Director of the Adviser and various entities affiliated with the Adviser; Treasurer (since July 2003) and Principal Financial Officer of various Morgan Stanley Funds (since September 2002). | |
Mary E. Mullin
522 Fifth Avenue
New York, NY 10036
Birth Year 1967 | | Secretary | | Since June 1999 | | Managing Director of the Adviser; Secretary of various Morgan Stanley Funds (since June 1999). | |
Michael J. Key
522 Fifth Avenue
New York, NY 10036
Birth Year 1979 | | Vice President | | Since June 2017 | | Vice President of the Equity and Fixed Income Funds, Liquidity Funds, various money market funds and the Morgan Stanley AIP Funds in the Fund Complex (since June 2017); Executive Director of the Adviser; Head of Product Development for Equity and Fixed Income Funds (since August 2013). | |
* This is the earliest date the officer began serving the Morgan Stanley Funds. Each officer serves a one-year term, until his or her successor is elected and qualifies.
40
Morgan Stanley Institutional Fund, Inc.
Annual Report — December 31, 2019
Adviser and Administrator
Morgan Stanley Investment Management Inc.
522 Fifth Avenue
New York, New York 10036
Sub-Adviser
Morgan Stanley Investment Management Company
23 Church Street
16-01 Capital Square, Singapore 049481
Distributor
Morgan Stanley Distribution, Inc.
522 Fifth Avenue
New York, New York 10036
Dividend Disbursing and Transfer Agent
DST Asset Manager Solutions, Inc.
2000 Crown Colony Drive
Quincy, Massachusetts 02169
Custodian
State Street Bank and Trust Company
One Lincoln Street
Boston, Massachusetts 02111
Legal Counsel
Dechert LLP
1095 Avenue of the Americas
New York, New York 10036
Counsel to the Independent Directors
Perkins Coie LLP
1155 Avenue of the Americas
New York, New York 10036
Independent Registered Public Accounting Firm
Ernst & Young LLP
200 Clarendon Street
Boston, Massachusetts 02116
Reporting to Shareholders
Each Morgan Stanley fund provides a complete schedule of portfolio holdings in its Semi-Annual and the Annual Reports within 60 days of the end of the fund's second and fourth fiscal quarters. The Semi-Annual and Annual Reports are filed electronically with the Securities and Exchange Commission ("SEC") on Form N-CSRS and Form N-CSR, respectively. Morgan Stanley also delivers the Semi-Annual and Annual Reports to fund shareholders and makes these reports available on its public website, www.morganstanley.com/im/shareholderreports. Each Morgan Stanley non-money market fund also files a complete schedule of portfolio holdings with the SEC for the fund's first and third fiscal quarters as an attachment to Form N-PORT. Morgan Stanley does not deliver the reports for the first and third fiscal quarters to shareholders, nor are the reports posted to the Morgan Stanley public website. However, the holdings for each money market fund are posted to the Morgan Stanley public website. You may obtain the Form N-PORT filings (as well as the Form N-CSR and N-CSRS filings) by accessing the SEC's website, www.sec.gov. You can also request copies of these materials, upon payment of a duplicating fee, by electronic request at the SEC's email address (publicinfo@sec.gov).
Proxy Voting Policies and Procedures and Proxy Voting Record
You may obtain a copy of the Company's Proxy Voting Policy and Procedures and information regarding how the Company voted proxies relating to portfolio securities during the most recent twelve-month period ended June 30, without charge, upon request, by calling toll free 1 (800) 548-7786 or by visiting our website at www.morganstanley.com/im/shareholderreports. This information is also available on the SEC's website at www.sec.gov.
This report is authorized for distribution only when preceded or accompanied by a prospectus or summary prospectus of the applicable fund of Morgan Stanley Institutional Fund, Inc., which describes in detail the fund's investment policies, risks, fees and expenses. Please read the prospectus carefully before you invest or send money. For additional information, including information regarding the investments comprising the Fund, please visit our website at www.morganstanley.com/im/shareholderreports or call toll free 1 (800) 548-7786.
41
Printed in U.S.A.
This Report has been prepared for shareholders and may be distributed to others only if preceded or accompanied by a current prospectus.
Morgan Stanley Investment Management Inc.
522 Fifth Avenue
New York, New York 10036
© 2020 Morgan Stanley. Morgan Stanley Distribution, Inc.

IFIEMANN
2904495 EXP. 02.28.21

Morgan Stanley Institutional Fund, Inc.
Emerging Markets Fixed Income Opportunities Portfolio
Annual Report
December 31, 2019
Beginning on January 1, 2021, as permitted by regulations adopted by the Securities and Exchange Commission ("SEC"), paper copies of the Fund's Annual and Semi-Annual Reports to Shareholders ("Shareholder Reports") will no longer be sent by mail, unless you specifically request paper copies of the Shareholder Reports from the Fund or from your financial intermediary, such as a broker-dealer or a bank. Instead, the Shareholder Reports will be made available on the Fund's website, https://www.morganstanley.com/im/shareholderreports and you will be notified by mail each time a Shareholder Report is posted and provided with a website link to access the Shareholder Report. If you already elected to receive Shareholder Reports electronically, you will not be affected by this change and you need not take any action. You may elect to receive Shareholder Reports and other communications from the Fund electronically anytime by contacting your financial intermediary or, if you are a direct investor, please follow the instructions on the envelope.
Beginning on January 1, 2019, you may elect to receive all future Shareholder Reports in paper free of charge. If you invest through a financial intermediary, you can contact your financial intermediary to request that you continue to receive paper copies of your Shareholder Reports. If you invest directly with the Fund, please follow the instructions on the envelope to let the Fund know you wish to continue receiving paper copies of your Shareholder Reports. Your election to receive Shareholder Reports in paper will apply to all funds held in your account if you invest through your financial intermediary or all funds held with the fund complex if you invest directly with a fund.

Morgan Stanley Institutional Fund, Inc.
Annual Report — December 31, 2019
Shareholders' Letter | | | 2 | | |
Expense Example | | | 3 | | |
Investment Overview | | | 4 | | |
Portfolio of Investments | | | 7 | | |
Statement of Assets and Liabilities | | | 13 | | |
Statement of Operations | | | 15 | | |
Statements of Changes in Net Assets | | | 16 | | |
Financial Highlights | | | 18 | | |
Notes to Financial Statements | | | 23 | | |
Report of Independent Registered Public Accounting Firm | | | 32 | | |
Privacy Notice | | | 33 | | |
Director and Officer Information | | | 35 | | |
This report is authorized for distribution only when preceded or accompanied by a prospectus or summary prospectus of the applicable Fund of Morgan Stanley Institutional Fund, Inc. To receive a prospectus and/or statement of additional information ("SAI"), which contains more complete information such as investment objectives, charges, expenses, policies for voting proxies, risk considerations and describes in detail each of the Fund's investment policies to the prospective investor, please call toll free 1 (800) 548-7786. Please read the prospectuses carefully before you invest or send money.
Additionally, you can access information about the Fund, including performance, characteristics and investment team commentary, through Morgan Stanley Investment Management's website: www.morganstanley.com/im/shareholderreports.
Market forecasts provided in this report may not necessarily come to pass. There is no guarantee that any sectors mentioned will continue to perform as discussed herein or that securities in such sectors will be held by the Fund in the future. There is no assurance that a fund will achieve its investment objective. Funds are subject to market risk, which is the possibility that market values of securities owned by the Fund will decline and, therefore, the value of the Fund's shares may be less than what you paid for them. Accordingly, you can lose money investing in this Fund. Please see the prospectus for more complete information on investment risks.
1
Morgan Stanley Institutional Fund, Inc.
Annual Report — December 31, 2019
Shareholders' Letter (unaudited)
Dear Shareholders,
We are pleased to provide this Annual Report, in which you will learn how your investment in Emerging Markets Fixed Income Opportunities Portfolio (the "Fund") performed during the latest twelve-month period.
Morgan Stanley Investment Management is a client-centric, investor-led organization. Our global presence, intellectual capital, and breadth of products and services enable us to partner with investors to meet the evolving challenges of today's financial markets. We aim to deliver superior investment service and to empower our clients to make the informed decisions that help them reach their investment goals.
As always, we thank you for selecting Morgan Stanley Investment Management, and look forward to working with you in the months and years ahead.
Sincerely,

John H. Gernon
President and Principal Executive Officer
January 2020
2
Morgan Stanley Institutional Fund, Inc.
Annual Report — December 31, 2019
Expense Example (unaudited)
Emerging Markets Fixed Income Opportunities Portfolio
As a shareholder of the Fund, you incur two types of costs: (1) transactional costs, including redemption fees; and (2) ongoing costs, which may include advisory fees, administration fees, distribution and shareholder services fees and other Fund expenses. This example is intended to help you understand your ongoing costs (in dollars) of investing in the Fund and to compare these costs with the ongoing costs of investing in other mutual funds.
This example is based on an investment of $1,000 invested at the beginning of the six-month period ended December 31, 2019 and held for the entire six-month period.
Actual Expenses
The table below provides information about actual account values and actual expenses. You may use the information in this table, together with the amount you invested, to estimate the expenses that you paid over the period. Simply divide your account value by $1,000 (for example, an $8,600 account value divided by $1,000 = 8.6), then multiply the result by the number in the table under the heading entitled "Actual Expenses Paid During Period" to estimate the expenses you paid on your account during this period.
Hypothetical Example for Comparison Purposes
The table below provides information about hypothetical account values and hypothetical expenses based on the Fund's actual expense ratio and an assumed rate of return of 5% per year before expenses, which is not the Fund's actual return. The hypothetical account values and expenses may not be used to estimate the actual ending account balance or expenses you paid for the period. You may use this information to compare the ongoing costs of investing in the Fund and other funds. To do so, compare this 5% hypothetical example with the 5% hypothetical examples that appear in the shareholder reports of the other funds.
Please note that the expenses shown in the table are meant to highlight your ongoing costs only and do not reflect any transactional costs, such as sales charges (loads) and redemption fees. Therefore, the information for each class in the table is useful in comparing ongoing costs only, and will not help you determine the relative total costs of owning different funds. In addition, if these transactional costs were included, your costs would have been higher.
| | | Beginning
Account
Value
7/1/19 | | Actual Ending
Account
Value
12/31/19 | | Hypothetical
Ending Account
Value | | Actual
Expenses
Paid
During
Period* | | Hypothetical
Expenses Paid
During Period* | | Net
Expense
Ratio
During
Period** | |
Emerging Markets Fixed Income Opportunities Portfolio Class I | | $ | 1,000.00 | | | $ | 1,033.20 | | | $ | 1,020.97 | | | $ | 4.30 | | | $ | 4.28 | | | | 0.84 | % | |
Emerging Markets Fixed Income Opportunities Portfolio Class A | | | 1,000.00 | | | | 1,031.70 | | | | 1,019.26 | | | | 6.04 | | | | 6.01 | | | | 1.18 | | |
Emerging Markets Fixed Income Opportunities Portfolio Class L | | | 1,000.00 | | | | 1,030.90 | | | | 1,018.00 | | | | 7.32 | | | | 7.27 | | | | 1.43 | | |
Emerging Markets Fixed Income Opportunities Portfolio Class C | | | 1,000.00 | | | | 1,028.50 | | | | 1,015.43 | | | | 9.92 | | | | 9.86 | | | | 1.94 | | |
Emerging Markets Fixed Income Opportunities Portfolio Class IS | | | 1,000.00 | | | | 1,033.40 | | | | 1,021.12 | | | | 4.15 | | | | 4.13 | | | | 0.81 | | |
* Expenses are calculated using each Fund Class' annualized net expense ratio (as disclosed), multiplied by the average account value over the period and multiplied by 184/365 (to reflect the most recent one-half year period).
** Annualized.
3
Morgan Stanley Institutional Fund, Inc.
Annual Report — December 31, 2019
Investment Overview (unaudited)
Emerging Markets Fixed Income Opportunities Portfolio
The Fund seeks high total return.
Performance
For the fiscal year ended December 31, 2019, the Fund's Class I shares had a total return based on net asset value and reinvestment of distributions per share of 14.41% net of fees. The Fund's Class I shares outperformed the Fund's new benchmark, the J.P. Morgan Emerging Markets Blended Index (JEMB) — Equal Weighted (the "Index"), which returned 13.93% for the year ended December 31, 2019 and was composed of one-third J.P. Morgan Emerging Markets Bond Global Diversified Index (returned 15.04%), one-third J.P. Morgan GBI-EM Global Diversified Index (returned 13.47%) and one-third J.P. Morgan CEMBI Broad Diversified Index (returned 13.09%). The Fund's Class I shares outperformed the Fund's old benchmark, the Blended Index, which for the year ended December 31, 2019 returned 13.73% and was composed of one-third J.P. Morgan Emerging Markets Bond Global Index (returned 14.42%), one-third J.P. Morgan GBI-EM Diversified Bond Index (returned 13.47%) and one-third J.P. Morgan CEMBI Broad Diversified Index (returned 13.09%). Effective close of business on December 31, 2019, the Fund's primary benchmark has changed to J.P. Morgan Emerging Markets Blended Index (JEMB) — Equal Weighted.
Please keep in mind that double-digit returns are highly unusual and cannot be sustained. Investors should also be aware that these returns were primarily achieved during favorable market conditions.
Factors Affecting Performance
• Emerging market (EM) fixed income debt returned 13.93% in 2019, as measured by the Index. Dollar-denominated sovereign debt outperformed dollar-denominated corporate debt during the year, and both of which outperformed EM domestic debt as EM local bond performance outpaced currency returns.
• During the period, broad duration and yield curve positioning contributed to relative performance, as did allocations across and security selection within countries. Specifically, overweight positions in Nigeria, Ukraine, Ecuador, Angola, Senegal, Paraguay and Indonesia contributed the most, as did security selection in Mexico, Nigeria and South Africa.
• Conversely, currency positions and an overweight position in Argentina detracted from relative performance, as did an underweight position in Turkey, primarily local bond positions and dollar-denominated corporates. Amid a rallying market and falling U.S. Treasury yields, countries where we were underweight detracted from relative performance, specifically those with higher credit qualities and longer duration, specifically China, Thailand, Chile, the Philippines, Peru, Hong Kong and Oman. Security selection in Israel and positioning in Russia also detracted from relative performance.
• Derivative usage, aside from the use of currency forwards and bond futures to hedge interest rates, did not have a material impact on performance in the period.
Management Strategies
• In our view, stabilizing but still subpar global growth will reign in 2020. Our baseline scenario envisions a global economic backdrop only marginally better than in 2019, thus leaving global monetary policy accommodation largely in place. Though we see widening emerging market-developed market growth differentials supporting EM assets, we expect EM fixed income to deliver more subdued returns relative to 2019, given our views on current valuations and limited scope for aggressive monetary policy accommodation in the developed world.
• In local rates, we see the most attractive opportunities in countries with subdued inflation and generous real rates (Russia, Indonesia and Mexico) or implementing reforms that could cause risk premiums to compress (most notably, Brazil). EM currencies, relative laggards versus the U.S. dollar in 2019, could also offer value. However, we believe opportunities may arise in currencies of economies experiencing cyclical rebounds and showing robust external accounts (for example, Russian ruble and Brazilian real). In hard currency debt, valuations are less convincing after a solid performance in 2019, with limited opportunities in investment grade and potentially more interesting alternatives in high yield sovereigns undergoing structural reforms, such as Ukraine, Egypt or Angola. We will also monitor countries currently
4
Morgan Stanley Institutional Fund, Inc.
Annual Report — December 31, 2019
Investment Overview (unaudited) (cont'd)
Emerging Markets Fixed Income Opportunities Portfolio
undergoing political transitions such as Sri Lanka and Argentina, but we remain sidelined for the time being, awaiting more clarity on politics. As for EM corporates, we see the benign macro outlook as supportive of credit fundamentals, with the financial discipline practiced by EM companies' managements leading us to expect default rates to remain limited and idiosyncratic. As such, we believe there will be interest to return to high yield at the expense of investment grade credit and higher quality duration, which were very much the market's focus in second half of 2019. We think that, on the margin, risks are skewed to the downside, given the optimism already priced in on trade issues and heightened and increasing social tensions in EM economies, which could give rise to populism and a deterioration in economic policymaking.

* Minimum Investment for Class I shares
** Commenced Operations on May 24, 2012.
In accordance with SEC regulations, the Fund's performance shown assumes that all recurring fees (including management fees) were deducted and all dividends and distributions were reinvested. The performance of Class A, L, C and IS shares will vary from the performance of Class I shares based upon their different inception dates and will be negatively impacted by additional fees assessed to those classes (if applicable).
5
Morgan Stanley Institutional Fund, Inc.
Annual Report — December 31, 2019
Investment Overview (unaudited) (cont'd)
Emerging Markets Fixed Income Opportunities Portfolio
Performance Compared to the J.P. Morgan Emerging Markets Blended Index (JEMB) — Equal Weighted(1), the Emerging Markets Fixed Income Blend Index(2), the Blended Index(3) and the Lipper Emerging Markets Hard Currency Debt Funds Index(4)
| | | Period Ended December 31, 2019
Total Returns(5) | |
| | | | | Average Annual | |
| | | One
Year | | Five
Years | | Ten
Years | | Since
Inception(9) | |
Fund — Class I Shares
w/o sales charges(6) | | | 14.41 | % | | | 5.89 | % | | | — | | | | 4.93 | % | |
Fund — Class A Shares
w/o sales charges(6) | | | 14.03 | | | | 5.55 | | | | — | | | | 4.58 | | |
Fund — Class A Shares with
maximum 3.25% sales charges(6) | | | 10.27 | | | | 4.86 | | | | — | | | | 4.12 | | |
Fund — Class L Shares
w/o sales charges(6) | | | 13.76 | | | | 5.25 | | | | — | | | | 4.28 | | |
Fund — Class C Shares
w/o sales charges(8) | | | 13.19 | | | | — | | | | — | | | | 4.14 | | |
Fund — Class C Shares with
maximum 1.00% deferred
sales charges(8) | | | 12.19 | | | | — | | | | — | | | | 4.14 | | |
Fund — Class IS Shares
w/o sales charges(7) | | | 14.44 | | | | 5.91 | | | | — | | | | 5.54 | | |
J.P. Morgan Emerging Markets
Blended Index (JEMB) — Equal
Weighted | | | 13.93 | | | | 5.05 | | | | — | | | | 4.46 | | |
Emerging Markets Fixed Income
Blend Index | | | 13.73 | | | | 5.97 | | | | — | | | | 5.50 | | |
Blended Index | | | 13.73 | | | | 4.93 | | | | — | | | | 4.26 | | |
Lipper Emerging Markets Hard
Currency Debt Funds Index | | | 13.26 | | | | 5.20 | | | | — | | | | 4.64 | | |
Performance data quoted represents past performance, which is no guarantee of future results, and current performance may be lower or higher than the figures shown. Performance assumes that all dividends and distributions, if any, were reinvested. For the most recent month-end performance figures, please visit www.morganstanley.com/im/shareholderreports. Investment return and principal value will fluctuate so that Fund shares, when redeemed, may be worth more or less than their original cost. Total returns do not reflect the deduction of taxes that a shareholder would pay on Fund distributions or the redemption of Fund shares. Performance of share classes will vary due to difference in sales charges and expenses.
(1) The J.P. Morgan Emerging Markets Blended Index (JEMB) — Equal Weighted is an equal weighted index of 1/3 J.P. Morgan Emerging Markets Bond Global Diversified Index (EMBI Global Diversified Index) (a benchmark that tracks total returns for U.S. dollar-denominated debt instruments issued by emerging markets sovereign and quasi-sovereign entities but limits the weights of countries with larger debt stocks by only including a specified portion of these countries' eligible current face amounts of debt outstanding), 1/3 J.P. Morgan Government Bond Index-Emerging Markets Global Diversified Index (GBI-EM Global Diversified Index) (a benchmark that tracks local currency government bonds issued by emerging markets) and 1/3 J.P. Morgan Corporate Emerging Markets Bond
Index Broad Diversified (CEMBI Broad Diversified Index) (a benchmark that tracks performance of corporate issued debt instruments issued by emerging markets) that blends U.S. Dollar local currency denominated sovereign, quasi-sovereign and corporate bonds in equal proportion. The Index is unmanaged and its returns do not include any sales charges or fees. Such costs would lower performance. It is not possible to invest directly in an index. Effective close of business on December 31, 2019, the Fund changed it's primary benchmark to J.P. Morgan Emerging Markets Blended Index (JEMB)-Equal Weighted because the Investment Adviser believes it's a more appropriate benchmark for the Fund.
(2) The Emerging Markets Fixed Income Blend Index is a performance linked benchmark of the old and new benchmarks of the Fund, the old benchmarks represented by J.P. Morgan Emerging Markets Bond Global Index (EMBI Global Index) for period from the Fund's inception to September 25, 2015 and also the Blended Index which consists of 1/3 J.P. Morgan EMBI Global Index, 1/3 J.P. Morgan GBI-EM Global Diversified Index, 1/3 J.P. Morgan CEMBI Broad Diversified Index for periods from September 26, 2015 to December 31, 2019 and the new benchmark represented by J.P. Morgan Emerging Markets Blended Index (JEMB)-Equal Weighted for periods thereafter. Following close of business on September 25, 2015, Morgan Stanley Institutional Fund, Inc. Emerging Markets Domestic Debt Portfolio merged into Morgan Stanley Institutional Fund, Inc. Emerging Markets External Debt Portfolio. In conjunction with this Reorganization, the Fund was renamed Morgan Stanley Institutional Fund, Inc. Emerging Markets Fixed Income Opportunities Portfolio and changed its principal investment policy. The Index is unmanaged and its returns do not include any sales charges or fees. Such costs would lower performance. It is not possible to invest directly in an index.
(3) The Blended Index which is comprised of 1/3 J.P. Morgan Emerging Markets Bond Global Index (a benchmark that tracks total returns for U.S. dollar-denominated debt instruments issued by emerging markets sovereign and quasi-sovereign entities), 1/3 J.P. Morgan Government Bond Index- Emerging Markets Global Diversified Index (a benchmark that tracks local currency government bonds issued by emerging markets) and 1/3 J.P. Morgan Corporate Emerging Markets Bond Index Broad Diversified (a benchmark that tracks performance of corporate issued debt instruments issued by emerging markets). The Index is unmanaged and its returns do not include any sales charges or fees. Such costs would lower performance. It is not possible to invest directly in an index.
(4) The Lipper Emerging Markets Hard Currency Debt Funds Index is an equally weighted performance index of the largest qualifying funds (based on net assets) in the Lipper Emerging Markets Hard Currency Debt Funds classification. The Index, which is adjusted for capital gains distributions and income dividends, is unmanaged and should not be considered an investment. There are currently 30 funds represented in this Index. As of the date of this report, the Fund was in the Lipper Emerging Markets Hard Currency Debt Funds classification.
(5) Total returns for the Fund reflect fees waived and expenses reimbursed, if applicable, by the Adviser (as defined herein). Without such waivers and reimbursements, total returns would have been lower.
(6) Commenced operations on May 24, 2012.
(7) Commenced offering on September 13, 2013.
(8) Commenced offering on April 30, 2015.
(9) For comparative purposes, average annual since inception returns listed for the Indexes refer to the inception date of Class I of the Fund, not the inception of the Index.
6
Morgan Stanley Institutional Fund, Inc.
Annual Report — December 31, 2019
Portfolio of Investments
Emerging Markets Fixed Income Opportunities Portfolio
| | | Face
Amount
(000) | | Value
(000) | |
Fixed Income Securities (89.4%) | |
Angola (0.6%) | |
Sovereign (0.6%) | |
Angolan Government International Bond, | |
8.00%, 11/26/29 (a) | | $ | 330 | | | $ | 353 | | |
Argentina (1.4%) | |
Corporate Bonds (1.4%) | |
Pampa Energia SA, | |
9.13%, 4/15/29 (a) | | | 150 | | | | 130 | | |
Province of Santa Fe, | |
6.90%, 11/1/27 (a) | | | 400 | | | | 318 | | |
Provincia de Cordoba, | |
7.45%, 9/1/24 (a) | | | 330 | | | | 239 | | |
Provincia de Entre Rios Argentina, | |
8.75%, 2/8/25 (a) | | | 230 | | | | 139 | | |
Telecom Argentina SA, | |
8.00%, 7/18/26 (a) | | | 50 | | | | 48 | | |
| | | | 874 | | |
Azerbaijan (0.6%) | |
Sovereign (0.6%) | |
Republic of Azerbaijan International Bond, | |
3.50%, 9/1/32 | | | 360 | | | | 355 | | |
Bahrain (0.6%) | |
Sovereign (0.6%) | |
Bahrain Government International Bond, | |
7.50%, 9/20/47 | | | 300 | | | | 366 | | |
Belarus (0.7%) | |
Sovereign (0.7%) | |
Republic of Belarus International Bond, | |
6.20%, 2/28/30 (a) | | | 400 | | | | 426 | | |
Brazil (8.6%) | |
Corporate Bonds (3.2%) | |
Braskem Netherlands Finance BV, | |
4.50%, 1/31/30 (a) | | | 300 | | | | 299 | | |
CSN Resources SA, | |
7.63%, 4/17/26 (a) | | | 260 | | | | 277 | | |
Embraer Netherlands Finance BV, | |
5.05%, 6/15/25 | | | 240 | | | | 264 | | |
5.40%, 2/1/27 | | | 82 | | | | 93 | | |
Hidrovias International Finance SARL, | |
5.95%, 1/24/25 (a) | | | 200 | | | | 208 | | |
5.95%, 1/24/25 | | | 400 | | | | 415 | | |
Minerva Luxembourg SA, | |
5.88%, 1/19/28 (a) | | | 200 | | | | 210 | | |
6.50%, 9/20/26 | | | 200 | | | | 213 | | |
| | | | 1,979 | | |
Sovereign (5.4%) | |
Brazil Notas do Tesouro Nacional, Series F, | |
10.00%, 1/1/25 – 1/1/27 | | BRL | 11,513 | | | | 3,331 | | |
| | | | 5,310 | | |
| | | Face
Amount
(000) | | Value
(000) | |
Chile (1.7%) | |
Corporate Bond (0.7%) | |
Geopark Ltd., | |
6.50%, 9/21/24 (a) | | $ | 400 | | | $ | 418 | | |
Sovereign (1.0%) | |
Bonos de la Tesoreria de la Republica en pesos, | |
4.50%, 3/1/26 | | CLP | 405,000 | | | | 594 | | |
| | | | 1,012 | | |
China (3.4%) | |
Corporate Bonds (2.7%) | |
China Evergrande Group, | |
8.25%, 3/23/22 | | $ | 250 | | | | 235 | | |
China SCE Group Holdings Ltd., | |
7.38%, 4/9/24 | | | 250 | | | | 256 | | |
Country Garden Holdings Co., Ltd., | |
7.25%, 4/8/26 | | | 260 | | | | 284 | | |
Kaisa Group Holdings Ltd., | |
11.75%, 2/26/21 | | | 270 | | | | 284 | | |
Scenery Journey Ltd., | |
11.00%, 11/6/20 | | | 270 | | | | 276 | | |
Sunac China Holdings Ltd., | |
7.50%, 2/1/24 | | | 300 | | | | 310 | | |
| | | | 1,645 | | |
Sovereign (0.7%) | |
Sinopec Group Overseas Development 2018 Ltd., | |
2.95%, 11/12/29 (a) | | | 400 | | | | 402 | | |
| | | | 2,047 | | |
Colombia (4.6%) | |
Corporate Bonds (2.6%) | |
Canacol Energy Ltd., | |
7.25%, 5/3/25 (a) | | | 400 | | | | 423 | | |
Millicom International Cellular SA, | |
6.00%, 3/15/25 | | | 685 | | | | 712 | | |
Termocandelaria Power Ltd., | |
7.88%, 1/30/29 (a) | | | 400 | | | | 442 | | |
| | | | 1,577 | | |
Sovereign (2.0%) | |
Colombian TES, Series B | |
6.00%, 4/28/28 | | COP | 1,852,200 | | | | 561 | | |
7.00%, 6/30/32 | | | 253,800 | | | | 81 | | |
7.50%, 8/26/26 | | | 1,315,100 | | | | 437 | | |
10.00%, 7/24/24 | | | 454,100 | | | | 164 | | |
| | | | 1,243 | | |
| | | | 2,820 | | |
Costa Rica (0.3%) | |
Sovereign (0.3%) | |
Costa Rica Government International Bond, | |
6.13%, 2/19/31 (a) | | $ | 200 | | | | 213 | | |
The accompanying notes are an integral part of the financial statements.
7
Morgan Stanley Institutional Fund, Inc.
Annual Report — December 31, 2019
Portfolio of Investments (cont'd)
Emerging Markets Fixed Income Opportunities Portfolio
| | | Face
Amount
(000) | | Value
(000) | |
Dominican Republic (1.0%) | |
Corporate Bond (0.7%) | |
AES Andres BV/Dominican Power Partners/
Empresa Generadora de Electricidad It,
(Units) | |
7.95%, 5/11/26 (a)(b) | | $ | 400 | | | $ | 426 | | |
Sovereign (0.3%) | |
Dominican Republic International Bond, | |
9.75%, 6/5/26 (a) | | DOP | 10,550 | | | | 205 | | |
| | | | 631 | | |
Ecuador (1.1%) | |
Sovereign (1.1%) | |
Ecuador Government International Bond, | |
7.88%, 1/23/28 | | $ | 240 | | | | 214 | | |
8.88%, 10/23/27 | | | 290 | | | | 267 | | |
10.75%, 1/31/29 | | | 200 | | | | 195 | | |
| | | | 676 | | |
Egypt (3.3%) | |
Corporate Bond (1.0%) | |
African Export-Import Bank (The), | |
3.99%, 9/21/29 (a) | | | 590 | | | | 600 | | |
Sovereign (2.3%) | |
Egypt Government Bond, | |
15.90%, 7/2/24 | | EGP | 9,250 | | | | 624 | | |
Egypt Government International Bond, | |
4.75%, 4/16/26 | | EUR | 100 | | | | 118 | | |
6.38%, 4/11/31 (a) | | | 330 | | | | 397 | | |
8.15%, 11/20/59 (a) | | $ | 260 | | | | 279 | | |
| | | | 1,418 | | |
| | | | 2,018 | | |
El Salvador (0.4%) | |
Sovereign (0.4%) | |
El Salvador Government International Bond, | |
7.12%, 1/20/50 (a) | | | 150 | | | | 160 | | |
8.63%, 2/28/29 (a) | | | 80 | | | | 96 | | |
| | | | 256 | | |
Georgia (0.6%) | |
Corporate Bonds (0.6%) | |
Bank of Georgia JSC, | |
11.00%, 6/1/20 (a) | | GEL | 500 | | | | 175 | | |
TBC Bank JSC, | |
5.75%, 6/19/24 (a) | | $ | 200 | | | | 207 | | |
| | | | 382 | | |
Ghana (1.5%) | |
Corporate Bond (0.7%) | |
Kosmos Energy Ltd., | |
7.13%, 4/4/26 (a) | | | 400 | | | | 410 | | |
| | | Face
Amount
(000) | | Value
(000) | |
Sovereign (0.8%) | |
Ghana Government International Bond, | |
8.63%, 6/16/49 (a) | | $ | 260 | | | $ | 260 | | |
8.95%, 3/26/51 (a) | | | 200 | | | | 205 | | |
| | | | 465 | | |
| | | | 875 | | |
Guatemala (0.5%) | |
Sovereign (0.5%) | |
Guatemala Government Bond, | |
4.88%, 2/13/28 | | | 300 | | | | 320 | | |
Hungary (0.8%) | |
Sovereign (0.8%) | |
Hungary Government Bond, | |
3.00%, 10/27/27 | | HUF | 94,900 | | | | 355 | | |
5.50%, 6/24/25 | | | 39,170 | | | | 164 | | |
| | | | 519 | | |
India (0.7%) | |
Corporate Bonds (0.7%) | |
Greenko Investment Co., | |
4.88%, 8/16/23 (a) | | $ | 240 | | | | 239 | | |
Shriram Transport Finance Co., Ltd., | |
5.95%, 10/24/22 (a) | | | 200 | | | | 206 | | |
| | | | 445 | | |
Indonesia (5.4%) | |
Corporate Bonds (1.0%) | |
Jababeka International BV, | |
6.50%, 10/5/23 (a) | | | 460 | | | | 421 | | |
Soechi Capital Pte Ltd., | |
8.38%, 1/31/23 (a) | | | 200 | | | | 175 | | |
| | | | 596 | | |
Sovereign (4.4%) | |
Indonesia Government International Bond, | |
5.35%, 2/11/49 | | | 200 | | | | 257 | | |
Indonesia Treasury Bond, | |
7.50%, 8/15/32 | | IDR | 10,890,000 | | | | 787 | | |
8.13%, 5/15/24 | | | 10,167,000 | | | | 782 | | |
8.38%, 3/15/34 – 4/15/39 | | | 5,600,000 | | | | 433 | | |
8.75%, 5/15/31 | | | 1,310,000 | | | | 105 | | |
9.00%, 3/15/29 | | | 1,395,000 | | | | 113 | | |
Pertamina Persero PT, | |
6.50%, 11/7/48 (a) | | $ | 200 | | | | 263 | | |
| | | | 2,740 | | |
| | | | 3,336 | | |
Iraq (0.3%) | |
Sovereign (0.3%) | |
Iraq International Bond, | |
6.75%, 3/9/23 (a) | | | 200 | | | | 205 | | |
The accompanying notes are an integral part of the financial statements.
8
Morgan Stanley Institutional Fund, Inc.
Annual Report — December 31, 2019
Portfolio of Investments (cont'd)
Emerging Markets Fixed Income Opportunities Portfolio
| | | Face
Amount
(000) | | Value
(000) | |
Israel (0.7%) | |
Corporate Bonds (0.7%) | |
Teva Pharmaceutical Finance Co., BV, | |
2.95%, 12/18/22 | | $ | 220 | | | $ | 210 | | |
Teva Pharmaceutical Finance Netherlands III BV, | |
2.20%, 7/21/21 | | | 210 | | | | 204 | | |
| | | | 414 | | |
Jamaica (0.8%) | |
Sovereign (0.8%) | |
Jamaica Government International Bond, | |
8.00%, 3/15/39 | | | 350 | | | | 477 | | |
Jordan (0.7%) | |
Sovereign (0.7%) | |
Jordan Government International Bond, | |
7.38%, 10/10/47 (a) | | | 400 | | | | 428 | | |
Lebanon (0.2%) | |
Sovereign (0.2%) | |
Lebanon Government International Bond, | |
6.85%, 3/23/27 | | | 266 | | | | 120 | | |
Lithuania (0.5%) | |
Corporate Bond (0.5%) | |
ASG Finance Designated Activity Co., | |
7.88%, 12/3/24 (a) | | | 340 | | | | 331 | | |
Malaysia (1.9%) | |
Sovereign (1.9%) | |
Malaysia Government Bond, | |
3.66%, 10/15/20 | | MYR | 137 | | | | 34 | | |
3.96%, 9/15/25 | | | 2,077 | | | | 526 | | |
4.16%, 7/15/21 | | | 875 | | | | 218 | | |
4.18%, 7/15/24 | | | 762 | | | | 194 | | |
4.23%, 6/30/31 | | | 246 | | | | 64 | | |
4.50%, 4/15/30 | | | 559 | | | | 148 | | |
| | | | 1,184 | | |
Mexico (10.4%) | |
Corporate Bonds (2.5%) | |
Alfa SAB de CV, | |
6.88%, 3/25/44 | | $ | 400 | | | | 487 | | |
Alpha Holding SA de CV, | |
10.00%, 12/19/22 (a) | | | 200 | | | | 205 | | |
Financiera Independencia SAB de
CV SOFOM ENR, | |
8.00%, 7/19/24 (a) | | | 250 | | | | 234 | | |
Trust F/1401, | |
6.39%, 1/15/50 (a) | | | 240 | | | | 259 | | |
Unifin Financiera SAB de CV SOFOM ENR, | |
8.38%, 1/27/28 (a) | | | 350 | | | | 358 | | |
| | | | 1,543 | | |
| | | Face
Amount
(000) | | Value
(000) | |
Sovereign (7.9%) | |
Mexican Bonos, Series M | |
6.50%, 6/10/21 | | MXN | 9,837 | | | $ | 519 | | |
7.50%, 6/3/27 | | | 18,442 | | | | 1,014 | | |
7.75%, 5/29/31 | | | 3,017 | | | | 170 | | |
8.00%, 6/11/20 – 12/7/23 | | | 7,672 | | | | 412 | | |
10.00%, 12/5/24 | | | 16,528 | | | | 993 | | |
Mexico Government International Bond, | |
4.60%, 1/23/46 | | $ | 260 | | | | 283 | | |
Petroleos Mexicanos, | |
6.35%, 2/12/48 | | | 300 | | | | 290 | | |
6.50%, 3/13/27 – 1/23/29 | | | 626 | | | | 664 | | |
6.75%, 9/21/47 | | | 490 | | | | 493 | | |
| | | | 4,838 | | |
| | | | 6,381 | | |
Moldova (0.4%) | |
Corporate Bond (0.4%) | |
Aragvi Finance International DAC, | |
12.00%, 4/9/24 (a) | | | 260 | | | | 278 | | |
Nigeria (3.2%) | |
Corporate Bonds (2.2%) | |
Fidelity Bank PLC, | |
10.50%, 10/16/22 (a) | | | 420 | | | | 471 | | |
IHS Netherlands Holdco BV, | |
8.00%, 9/18/27 (a) | | | 270 | | | | 288 | | |
United Bank for Africa PLC, | |
7.75%, 6/8/22 (a) | | | 540 | | | | 576 | | |
| | | | 1,335 | | |
Sovereign (1.0%) | |
Nigeria Government International Bond, | |
7.14%, 2/23/30 (a) | | | 400 | | | | 409 | | |
9.25%, 1/21/49 (a) | | | 200 | | | | 224 | | |
| | | | 633 | | |
| | | | 1,968 | | |
Oman (0.6%) | |
Sovereign (0.6%) | |
Oman Government International Bond, | |
6.00%, 8/1/29 (a) | | | 350 | | | | 366 | | |
Panama (0.4%) | |
Sovereign (0.4%) | |
Aeropuerto Internacional de Tocumen SA, | |
5.63%, 5/18/36 (a) | | | 200 | | | | 236 | | |
Paraguay (1.8%) | |
Sovereign (1.8%) | |
Paraguay Government International Bond, | |
4.70%, 3/27/27 | | | 200 | | | | 221 | | |
4.70%, 3/27/27 (a) | | | 400 | | | | 441 | | |
5.40%, 3/30/50 (a) | | | 400 | | | | 463 | | |
| | | | 1,125 | | |
The accompanying notes are an integral part of the financial statements.
9
Morgan Stanley Institutional Fund, Inc.
Annual Report — December 31, 2019
Portfolio of Investments (cont'd)
Emerging Markets Fixed Income Opportunities Portfolio
| | | Face
Amount
(000) | | Value
(000) | |
Peru (2.0%) | |
Corporate Bonds (0.6%) | |
Banco de Credito del Peru, | |
2.70%, 1/11/25 (a) | | $ | 155 | | | $ | 154 | | |
Lima Metro Line 2 Finance Ltd., | |
4.35%, 4/5/36 (a) | | | 200 | | | | 213 | | |
| | | | 367 | | |
Sovereign (1.4%) | |
Peru Government Bond, | |
5.35%, 8/12/40 (a) | | PEN | 370 | | | | 113 | | |
5.40%, 8/12/34 (a) | | | 869 | | | | 276 | | |
6.15%, 8/12/32 (a) | | | 1 | | | | — | @ | |
Peruvian Government International Bond, | |
(Units) | |
6.35%, 8/12/28 (b) | | | 1,273 | | | | 446 | | |
| | | | 835 | | |
| | | | 1,202 | | |
Philippines (0.3%) | |
Corporate Bond (0.3%) | |
SMC Global Power Holdings Corp.,
6.50%, 4/25/24 (c) | | $ | 200 | | | | 209 | | |
Poland (4.7%) | |
Sovereign (4.7%) | |
Republic of Poland Government Bond, | |
2.50%, 7/25/27 | | PLN | 3,330 | | | | 904 | | |
3.25%, 7/25/25 | | | 3,014 | | | | 850 | | |
4.00%, 10/25/23 | | | 1,455 | | | | 416 | | |
5.75%, 10/25/21 – 9/23/22 | | | 400 | | | | 114 | | |
Republic of Poland Government
International Bond, | |
5.00%, 3/23/22 | | $ | 570 | | | | 610 | | |
| | | | 2,894 | | |
Qatar (1.7%) | |
Sovereign (1.7%) | |
Qatar Government International Bond, | |
4.82%, 3/14/49 (a) | | | 830 | | | | 1,030 | | |
Romania (0.9%) | |
Sovereign (0.9%) | |
Romania Government Bond,
4.75%, 2/24/25 | | RON | 2,180 | | | | 528 | | |
Russia (4.5%) | |
Sovereign (4.5%) | |
Russian Federal Bond — OFZ, | |
6.90%, 5/23/29 | | RUB | 118,605 | | | | 2,015 | | |
Russian Foreign Bond — Eurobond, | |
5.63%, 4/4/42 | | $ | 600 | | | | 787 | | |
| | | | 2,802 | | |
Saudi Arabia (1.1%) | |
Sovereign (1.1%) | |
Saudi Government International Bond, | |
5.25%, 1/16/50 (a) | | | 540 | | | | 672 | | |
| | | Face
Amount
(000) | | Value
(000) | |
Senegal (1.0%) | |
Sovereign (1.0%) | |
Senegal Government International Bond,
6.25%, 5/23/33 (a) | | $ | 600 | | | $ | 633 | | |
South Africa (4.0%) | |
Sovereign (4.0%) | |
Eskom Holdings SOC Ltd., | |
7.13%, 2/11/25 | | | 200 | | | | 205 | | |
8.45%, 8/10/28 (a) | | | 400 | | | | 433 | | |
Republic of South Africa Government Bond, | |
8.25%, 3/31/32 | | ZAR | 7,857 | | | | 515 | | |
8.75%, 1/31/44 | | | 820 | | | | 52 | | |
9.00%, 1/31/40 | | | 1,500 | | | | 98 | | |
South Africa Government Bond, | |
6.75%, 3/31/21 | | | 770 | | | | 55 | | |
8.00%, 1/31/30 | | | 16,721 | | | | 1,115 | | |
| | | | 2,473 | | |
Supernational (0.6%) | |
Sovereign (0.6%) | |
Banque Ouest Africaine de Developpement,
4.70%, 10/22/31 (a) | | $ | 370 | | | | 377 | | |
Tanzania, United Republic of (0.7%) | |
Corporate Bond (0.7%) | |
HTA Group Ltd., | |
9.13%, 3/8/22 (a) | | | 400 | | | | 414 | | |
Thailand (2.0%) | |
Sovereign (2.0%) | |
Thailand Government Bond, | |
3.63%, 6/16/23 | | THB | 12,500 | | | | 451 | | |
4.88%, 6/22/29 | | | 17,434 | | | | 756 | | |
| | | | 1,207 | | |
Turkey (2.3%) | |
Sovereign (2.3%) | |
Turkey Government Bond, | |
8.00%, 3/12/25 | | TRY | 133 | | | | 19 | | |
10.50%, 8/11/27 | | | 2,170 | | | | 341 | | |
11.00%, 2/24/27 | | | 586 | | | | 94 | | |
Turkey Government International Bond, | |
6.35%, 8/10/24 | | $ | 530 | | | | 555 | | |
7.25%, 12/23/23 | | | 400 | | | | 434 | | |
| | | | 1,443 | | |
Ukraine (2.5%) | |
Sovereign (2.5%) | |
Ukraine Government International Bond, | |
6.75%, 6/20/26 (a) | | EUR | 100 | | | | 126 | | |
7.75%, 9/1/23 – 9/1/26 | | $ | 513 | | | | 561 | | |
9.75%, 11/1/28 (a) | | | 200 | | | | 244 | | |
9.75%, 11/1/28 | | | 520 | | | | 634 | | |
| | | | 1,565 | | |
The accompanying notes are an integral part of the financial statements.
10
Morgan Stanley Institutional Fund, Inc.
Annual Report — December 31, 2019
Portfolio of Investments (cont'd)
Emerging Markets Fixed Income Opportunities Portfolio
| | | Face
Amount
(000) | | Value
(000) | |
United Arab Emirates (1.2%) | |
Corporate Bonds (1.2%) | |
DP World PLC, | |
5.63%, 9/25/48 (a) | | $ | 400 | | | $ | 463 | | |
MAF Global Securities Ltd., | |
6.38%, 3/20/26 (c) | | | 250 | | | | 260 | | |
| | | | 723 | | |
Venezuela (0.2%) | |
Sovereign (0.2%) | |
Petroleos de Venezuela SA, | |
6.00%, 11/15/26 (d)(e) | | | 1,582 | | | | 131 | | |
Total Fixed Income Securities (Cost $52,996) | | | 55,050 | | |
| | | No. of
Warrants | | | |
Warrants (0.0%) | |
Venezuela (0.0%) | |
Venezuela Government International Bond,
Oil-Linked Payment Obligation, 0.00%,
expires 4/15/20 (Cost $—) | | | 495 | | | | 1 | | |
| | | Shares | | | |
Short-Term Investments (8.9%) | |
United States (7.2%) | |
Investment Company (7.2%) | |
Morgan Stanley Institutional Liquidity
Funds — Treasury Securities Portfolio —
Institutional Class (See Note G)
(Cost $4,403) | | | 4,402,838 | | | | 4,403 | | |
| | | Face
Amount
(000) | | | |
Egypt (1.0%) | |
Sovereign (1.0%) | |
Egypt Treasury Bills, | |
15.60%, 3/10/20 | | EGP | 5,100 | | | | 310 | | |
15.80%, 3/10/20 | | | 3,000 | | | | 183 | | |
15.95%, 3/10/20 | | | 1,525 | | | | 93 | | |
| | | | 586 | | |
Nigeria (0.7%) | |
Sovereign (0.7%) | |
Nigeria Treasury Bills, | |
17.95%, 2/27/20 | | NGN | 38,372 | | | | 103 | | |
18.30%, 2/27/20 | | | 46,512 | | | | 125 | | |
19.10%, 2/27/20 | | | 86,116 | | | | 231 | | |
| | | | 459 | | |
Total Sovereign (Cost $1,036) | | | 1,045 | | |
| | | Face
Amount
(000) | | Value
(000) | |
United States (0.0%) | |
U.S. Treasury Security (0.0%) | |
U.S. Treasury Bill, | |
| 1.50%, 2/27/20 (f) (Cost $30) | | $ | 30 | | | $ | 30 | | |
Total Short-Term Investments (Cost $5,469) | | | 5,478 | | |
Total Investments (98.3%) (Cost $58,465) (g)(h) | | | 60,529 | | |
| Other Assets in Excess of Liabilities (1.7%) | | | 1,071 | | |
Net Assets (100.0%) | | $ | 61,600 | | |
Country assignments and aggregations are based generally on third party vendor classifications and information, and may be different from the assignments and aggregations under the policies set forth in the Fund's prospectus and/or statement of additional information relating to geographic classifications.
(a) 144A security — Certain conditions for public sale may exist. Unless otherwise noted, these securities are deemed to be liquid.
(b) Consists of one or more classes of securities traded together as a unit.
(c) Perpetual — One or more securities do not have a predetermined maturity date. Rates for these securities are fixed for a period of time, after which they revert to a floating rate. Interest rates in effect are as of December 31, 2019.
(d) Non-income producing security; bond in default.
(e) Issuer in bankruptcy.
(f) Rate shown is the yield to maturity at December 31, 2019.
(g) Securities are available for collateral in connection with open foreign currency forward exchange contracts.
(h) At December 31, 2019, the aggregate cost for federal income tax purposes is approximately $58,674,000. The aggregate gross unrealized appreciation is approximately $2,984,000 and the aggregate gross unrealized depreciation is approximately $1,175,000, resulting in net unrealized appreciation of approximately $1,809,000.
@ Value is less than $500.
OFZ Obilgatsyi Federal'novo Zaima (Russian Federal Loan Obligation).
The accompanying notes are an integral part of the financial statements.
11
Morgan Stanley Institutional Fund, Inc.
Annual Report — December 31, 2019
Portfolio of Investments (cont'd)
Emerging Markets Fixed Income Opportunities Portfolio
Foreign Currency Forward Exchange Contracts:
The Fund had the following foreign currency forward exchange contracts open at December 31, 2019:
Counterparty | | Contracts to
Deliver
(000) | | In Exchange
For
(000) | | Delivery
Date | | Unrealized
(Depreciation)
(000) | |
State Street Bank and Trust Co. | | BRL | 2,453 | | | $ | 581 | | | 2/4/20 | | $ | (29 | ) | |
Barclays Bank PLC | | MXN | 16,260 | | | $ | 841 | | | 3/18/20 | | | (9 | ) | |
Citibank NA | | EUR | 570 | | | $ | 638 | | | 3/18/20 | | | (5 | ) | |
JPMorgan Chase Bank NA | | RUB | 13,000 | | | $ | 205 | | | 3/18/20 | | | (3 | ) | |
| | | | | | | | | $ | (46 | ) | |
BRL — Brazilian Real
CLP — Chilean Peso
COP — Colombian Peso
DOP — Dominican Peso
EGP — Egyptian Pound
EUR — Euro
GEL — Georgian Lari
HUF — Hungarian Forint
IDR — Indonesian Rupiah
MXN — Mexican Peso
MYR — Malaysian Ringgit
NGN — Nigerian Naira
PEN — Peruvian Nuevo Sol
PLN — Polish Zloty
RON — Romanian New Leu
RUB — Russian Ruble
THB — Thai Baht
TRY — Turkish Lira
ZAR — South African Rand
Portfolio Composition
Classification | | Percentage of
Total Investments | |
Sovereign | | | 65.6 | % | |
Corporate Bonds | | | 25.4 | | |
Short-Term Investments | | | 9.0 | | |
Other* | | | 0.0 | ** | |
Total Investments | | | 100.0 | %*** | |
* Industries and/or investment types representing less than 5% of total investments.
** Amount is less than 0.05%.
*** Does not include open foreign currency forward exchange contracts with total unrealized depreciation of approximately $46,000.
The accompanying notes are an integral part of the financial statements.
12
Morgan Stanley Institutional Fund, Inc.
Annual Report — December 31, 2019
Emerging Markets Fixed Income Opportunities Portfolio
Statement of Assets and Liabilities | | December 31, 2019
(000) | |
Assets: | |
Investments in Securities of Unaffiliated Issuers, at Value (Cost $54,062) | | $ | 56,126 | | |
Investment in Security of Affiliated Issuer, at Value (Cost $4,403) | | | 4,403 | | |
Total Investments in Securities, at Value (Cost $58,465) | | | 60,529 | | |
Foreign Currency, at Value (Cost $177) | | | 178 | | |
Interest Receivable | | | 1,026 | | |
Receivable for Fund Shares Sold | | | 24 | | |
Tax Reclaim Receivable | | | 20 | | |
Receivable from Affiliate | | | 5 | | |
Other Assets | | | 32 | | |
Total Assets | | | 61,814 | | |
Liabilities: | |
Deferred Capital Gain Country Tax | | | 55 | | |
Payable for Professional Fees | | | 51 | | |
Unrealized Depreciation on Foreign Currency Forward Exchange Contracts | | | 46 | | |
Payable for Advisory Fees | | | 22 | | |
Payable for Fund Shares Redeemed | | | 9 | | |
Payable for Custodian Fees | | | 7 | | |
Payable for Administration Fees | | | 4 | | |
Payable for Transfer Agency Fees — Class I | | | 1 | | |
Payable for Transfer Agency Fees — Class A | | | 1 | | |
Payable for Transfer Agency Fees — Class L | | | — | @ | |
Payable for Transfer Agency Fees — Class C | | | — | @ | |
Payable for Transfer Agency Fees — Class IS | | | — | @ | |
Payable for Sub Transfer Agency Fees — Class I | | | 2 | | |
Payable for Sub Transfer Agency Fees — Class A | | | — | @ | |
Payable for Sub Transfer Agency Fees — Class L | | | — | @ | |
Payable for Sub Transfer Agency Fees — Class C | | | — | @ | |
Payable for Shareholder Services Fees — Class A | | | — | @ | |
Payable for Distribution and Shareholder Services Fees — Class L | | | — | @ | |
Payable for Distribution and Shareholder Services Fees — Class C | | | — | @ | |
Other Liabilities | | | 16 | | |
Total Liabilities | | | 214 | | |
Net Assets | | $ | 61,600 | | |
Net Assets Consist of: | |
Paid-in-Capital | | $ | 65,358 | | |
Total Accumulated Loss | | | (3,758 | ) | |
Net Assets | | $ | 61,600 | | |
The accompanying notes are an integral part of the financial statements.
13
Morgan Stanley Institutional Fund, Inc.
Annual Report — December 31, 2019
Emerging Markets Fixed Income Opportunities Portfolio
Statement of Assets and Liabilities (cont'd) | | December 31, 2019
(000) | |
CLASS I: | |
Net Assets | | $ | 58,152 | | |
| Shares Outstanding $0.001 par value shares of beneficial interest (unlimited shares authorized) (not in 000's) | | | 6,281,525 | | |
Net Asset Value, Offering and Redemption Price Per Share | | $ | 9.25 | | |
CLASS A: | |
Net Assets | | $ | 2,141 | | |
| Shares Outstanding $0.001 par value shares of beneficial interest (unlimited shares authorized) (not in 000's) | | | 231,474 | | |
Net Asset Value, Redemption Price Per Share | | $ | 9.24 | | |
Maximum Sales Load | | | 3.25 | % | |
Maximum Sales Charge | | $ | 0.31 | | |
Maximum Offering Price Per Share | | $ | 9.55 | | |
CLASS L: | |
Net Assets | | $ | 764 | | |
| Shares Outstanding $0.001 par value shares of beneficial interest (unlimited shares authorized) (not in 000's) | | | 82,623 | | |
Net Asset Value, Offering and Redemption Price Per Share | | $ | 9.23 | | |
CLASS C: | |
Net Assets | | $ | 524 | | |
| Shares Outstanding $0.001 par value shares of beneficial interest (unlimited shares authorized) (not in 000's) | | | 56,904 | | |
Net Asset Value, Offering and Redemption Price Per Share | | $ | 9.21 | | |
CLASS IS: | |
Net Assets | | $ | 19 | | |
| Shares Outstanding $0.001 par value shares of beneficial interest (unlimited shares authorized) (not in 000's) | | | 2,013 | | |
Net Asset Value, Offering and Redemption Price Per Share | | $ | 9.25 | | |
@ Amount is less than $500.
The accompanying notes are an integral part of the financial statements.
14
Morgan Stanley Institutional Fund, Inc.
Annual Report — December 31, 2019
Emerging Markets Fixed Income Opportunities Portfolio
Statement of Operations | | Year Ended
December 31, 2019
(000) | |
Investment Income: | |
Interest from Securities of Unaffiliated Issuers (Net of $53 of Foreign Taxes Withheld) | | $ | 3,143 | | |
Dividends from Security of Affiliated Issuer (Note G) | | | 88 | | |
Total Investment Income | | | 3,231 | | |
Expenses: | |
Advisory Fees (Note B) | | | 374 | | |
Professional Fees | | | 95 | | |
Registration Fees | | | 70 | | |
Administration Fees (Note C) | | | 40 | | |
Custodian Fees (Note F) | | | 31 | | |
Shareholder Reporting Fees | | | 22 | | |
Sub Transfer Agency Fees — Class I | | | 17 | | |
Sub Transfer Agency Fees — Class A | | | 1 | | |
Sub Transfer Agency Fees — Class L | | | — | @ | |
Sub Transfer Agency Fees — Class C | | | — | @ | |
Pricing Fees | | | 15 | | |
Shareholder Services Fees — Class A (Note D) | | | 5 | | |
Distribution and Shareholder Services Fees — Class L (Note D) | | | 4 | | |
Distribution and Shareholder Services Fees — Class C (Note D) | | | 4 | | |
Transfer Agency Fees — Class I (Note E) | | | 3 | | |
Transfer Agency Fees — Class A (Note E) | | | 2 | | |
Transfer Agency Fees — Class L (Note E) | | | 2 | | |
Transfer Agency Fees — Class C (Note E) | | | 2 | | |
Transfer Agency Fees — Class IS (Note E) | | | 2 | | |
Directors' Fees and Expenses | | | 5 | | |
Other Expenses | | | 21 | | |
Total Expenses | | | 715 | | |
Waiver of Advisory Fees (Note B) | | | (265 | ) | |
Reimbursement of Class Specific Expenses — Class I (Note B) | | | (6 | ) | |
Reimbursement of Class Specific Expenses — Class A (Note B) | | | (1 | ) | |
Reimbursement of Class Specific Expenses — Class L (Note B) | | | (1 | ) | |
Reimbursement of Class Specific Expenses — Class C (Note B) | | | (2 | ) | |
Reimbursement of Class Specific Expenses — Class IS (Note B) | | | (2 | ) | |
Rebate from Morgan Stanley Affiliate (Note G) | | | (8 | ) | |
Net Expenses | | | 430 | | |
Net Investment Income | | | 2,801 | | |
Realized Loss: | |
Investments Sold (Net of $20 of Capital Gain Country Tax) | | | (856 | ) | |
Foreign Currency Forward Exchange Contracts | | | (116 | ) | |
Foreign Currency Translation | | | (8 | ) | |
Net Realized Loss | | | (980 | ) | |
Change in Unrealized Appreciation (Depreciation): | |
Investments (Net of Increase in Deferred Capital Gain Country Tax of $34) | | | 4,418 | | |
Foreign Currency Forward Exchange Contracts | | | (13 | ) | |
Foreign Currency Translation | | | 6 | | |
Net Change in Unrealized Appreciation (Depreciation) | | | 4,411 | | |
Net Realized Loss and Change in Unrealized Appreciation (Depreciation) | | | 3,431 | | |
Net Increase in Net Assets Resulting from Operations | | $ | 6,232 | | |
@ Amount is less than $500.
The accompanying notes are an integral part of the financial statements.
15
Morgan Stanley Institutional Fund, Inc.
Annual Report — December 31, 2019
Emerging Markets Fixed Income Opportunities Portfolio
Statements of Changes in Net Assets | | Year Ended
December 31, 2019
(000) | | Year Ended
December 31, 2018
(000) | |
Increase (Decrease) in Net Assets: | |
Operations: | |
Net Investment Income | | $ | 2,801 | | | $ | 1,695 | | |
Net Realized Loss | | | (980 | ) | | | (736 | ) | |
Net Change in Unrealized Appreciation (Depreciation) | | | 4,411 | | | | (2,875 | ) | |
Net Increase (Decrease) in Net Assets Resulting from Operations | | | 6,232 | | | | (1,916 | ) | |
Dividends and Distributions to Shareholders: | |
Class I | | | (2,260 | ) | | | (1,377 | ) | |
Class A | | | (82 | ) | | | (66 | ) | |
Class L | | | (30 | ) | | | (36 | ) | |
Class C | | | (18 | ) | | | (12 | ) | |
Class IS | | | (18 | ) | | | (39 | ) | |
Paid-in-Capital: | |
Class I | | | (275 | ) | | | — | | |
Class A | | | (10 | ) | | | — | | |
Class L | | | (4 | ) | | | — | | |
Class C | | | (2 | ) | | | — | | |
Class IS | | | (2 | ) | | | — | | |
Total Dividends and Distributions to Shareholders | | | (2,701 | ) | | | (1,530 | ) | |
Capital Share Transactions:(1) | |
Class I: | |
Subscribed | | | 22,927 | | | | 16,805 | | |
Distributions Reinvested | | | 2,529 | | | | 407 | | |
Redeemed | | | (3,153 | ) | | | (3,837 | ) | |
Class A: | |
Subscribed | | | 1,620 | | | | 2,017 | | |
Distributions Reinvested | | | 92 | | | | 57 | | |
Redeemed | | | (1,006 | ) | | | (1,712 | ) | |
Class L: | |
Distributions Reinvested | | | 34 | | | | 32 | | |
Redeemed | | | (58 | ) | | | (51 | ) | |
Class C: | |
Subscribed | | | 453 | | | | 17 | | |
Distributions Reinvested | | | 20 | | | | 11 | | |
Redeemed | | | (13 | ) | | | (230 | ) | |
Class IS: | |
Subscribed | | | 725 | | | | — | | |
Distributions Reinvested | | | 1 | | | | — | | |
Redeemed | | | (1,430 | ) | | | — | | |
Net Increase in Net Assets Resulting from Capital Share Transactions | | | 22,741 | | | | 13,516 | | |
Redemption Fees | | | — | @ | | | — | @ | |
Total Increase in Net Assets | | | 26,272 | | | | 10,070 | | |
Net Assets: | |
Beginning of Period | | | 35,328 | | | | 25,258 | | |
End of Period | | $ | 61,600 | | | $ | 35,328 | | |
The accompanying notes are an integral part of the financial statements.
16
Morgan Stanley Institutional Fund, Inc.
Annual Report — December 31, 2019
Emerging Markets Fixed Income Opportunities Portfolio
Statements of Changes in Net Assets (cont'd) | | Year Ended
December 31, 2019
(000) | | Year Ended
December 31, 2018
(000) | |
(1) Capital Share Transactions: | |
Class I: | |
Shares Subscribed | | | 2,527 | | | | 1,896 | | |
Shares Issued on Distributions Reinvested | | | 278 | | | | 47 | | |
Shares Redeemed | | | (349 | ) | | | (414 | ) | |
Net Increase in Class I Shares Outstanding | | | 2,456 | | | | 1,529 | | |
Class A: | |
Shares Subscribed | | | 178 | | | | 213 | | |
Shares Issued on Distributions Reinvested | | | 10 | | | | 6 | | |
Shares Redeemed | | | (110 | ) | | | (185 | ) | |
Net Increase in Class A Shares Outstanding | | | 78 | | | | 34 | | |
Class L: | |
Shares Issued on Distributions Reinvested | | | 4 | | | | 4 | | |
Shares Redeemed | | | (7 | ) | | | (6 | ) | |
Net Decrease in Class L Shares Outstanding | | | (3 | ) | | | (2 | ) | |
Class C: | |
Shares Subscribed | | | 50 | | | | 2 | | |
Shares Issued on Distributions Reinvested | | | 2 | | | | 1 | | |
Shares Redeemed | | | (1 | ) | | | (27 | ) | |
Net Increase (Decrease) in Class C Shares Outstanding | | | 51 | | | | (24 | ) | |
Class IS: | |
Shares Subscribed | | | 81 | | | | — | | |
Shares Issued on Distributions Reinvested | | | — | @@ | | | — | | |
Shares Redeemed | | | (158 | ) | | | — | | |
Net Decrease in Class IS Shares Outstanding | | | (77 | ) | | | — | | |
@ Amount is less than $500.
@@ Amount is less than 500 shares.
The accompanying notes are an integral part of the financial statements.
17
Morgan Stanley Institutional Fund, Inc.
Annual Report — December 31, 2019
Financial Highlights
Emerging Markets Fixed Income Opportunities Portfolio
| | | Class I | |
| | | Year Ended December 31, | |
Selected Per Share Data and Ratios | | 2019 | | 2018 | | 2017 | | 2016(1) | | 2015 | |
Net Asset Value, Beginning of Period | | $ | 8.52 | | | $ | 9.68 | | | $ | 9.07 | | | $ | 8.53 | | | $ | 9.22 | | |
Income (Loss) from Investment Operations: | |
Net Investment Income(2) | | | 0.51 | | | | 0.57 | | | | 0.65 | | | | 0.67 | | | | 0.52 | | |
Net Realized and Unrealized Gain (Loss) | | | 0.70 | | | | (1.24 | ) | | | 0.52 | | | | 0.42 | | | | (0.68 | ) | |
Total from Investment Operations | | | 1.21 | | | | (0.67 | ) | | | 1.17 | | | | 1.09 | | | | (0.16 | ) | |
Distributions from and/or in Excess of: | |
Net Investment Income | | | (0.43 | ) | | | (0.49 | ) | | | (0.56 | ) | | | (0.55 | ) | | | (0.53 | ) | |
Paid-in-Capital | | | (0.05 | ) | | | — | | | | — | | | | — | | | | — | | |
Total Distributions | | | (0.48 | ) | | | (0.49 | ) | | | (0.56 | ) | | | (0.55 | ) | | | (0.53 | ) | |
Redemption Fees | | | 0.00 | (3) | | | 0.00 | (3) | | | 0.00 | (3) | | | 0.00 | (3) | | | 0.00 | (3) | |
Net Asset Value, End of Period | | $ | 9.25 | | | $ | 8.52 | | | $ | 9.68 | | | $ | 9.07 | | | $ | 8.53 | | |
Total Return(4) | | | 14.41 | % | | | (6.93 | )% | | | 12.94 | % | | | 12.80 | % | | | (1.83 | )% | |
Ratios to Average Net Assets and Supplemental Data: | |
Net Assets, End of Period (Thousands) | | $ | 58,152 | | | $ | 32,575 | | | $ | 22,219 | | | $ | 20,332 | | | $ | 19,219 | | |
Ratio of Expenses Before Expense Limitation | | | 1.39 | % | | | 1.98 | % | | | 2.01 | % | | | 2.03 | % | | | 1.82 | % | |
Ratio of Expenses After Expense Limitation | | | 0.83 | %(5) | | | 0.84 | %(5) | | | 0.83 | %(5) | | | 0.84 | %(5) | | | 0.83 | %(5) | |
Ratio of Net Investment Income | | | 5.65 | %(5) | | | 6.24 | %(5) | | | 6.73 | %(5) | | | 7.32 | %(5) | | | 5.74 | %(5) | |
Ratio of Rebate from Morgan Stanley Affiliates | | | 0.02 | % | | | 0.01 | % | | | 0.01 | % | | | 0.00 | %(6) | | | 0.00 | %(6) | |
Portfolio Turnover Rate | | | 58 | % | | | 47 | % | | | 77 | % | | | 116 | % | | | 111 | % | |
(1) Reflects prior period custodian out-of-pocket expenses that were reimbursed in September 2016. The amount of the reimbursement was immaterial on a per share basis and did not impact the total return of Class I shares. The Ratio of Expenses After Expense Limitation and the Ratio of Net Investment Income would be unchanged as the reimbursement of custodian fees was offset against expense waivers/reimbursements with no impact to net expenses or net investment income.
(2) Per share amount is based on average shares outstanding.
(3) Amount is less than $0.005 per share.
(4) Calculated based on the net asset value as of the last business day of the period.
(5) The Ratio of Expenses After Expense Limitation and Ratio of Net Investment Income reflect the rebate of certain Fund expenses in connection with the investments in Morgan Stanley affiliates during the period. The effect of the rebate on the ratios is disclosed in the above table as "Ratio of Rebate from Morgan Stanley Affiliates."
(6) Amount is less than 0.005%.
The accompanying notes are an integral part of the financial statements.
18
Morgan Stanley Institutional Fund, Inc.
Annual Report — December 31, 2019
Financial Highlights
Emerging Markets Fixed Income Opportunities Portfolio
| | | Class A | |
| | | Year Ended December 31, | |
Selected Per Share Data and Ratios | | 2019 | | 2018 | | 2017 | | 2016(1) | | 2015 | |
Net Asset Value, Beginning of Period | | $ | 8.51 | | | $ | 9.67 | | | $ | 9.06 | | | $ | 8.52 | | | $ | 9.21 | | |
Income (Loss) from Investment Operations: | |
Net Investment Income(2) | | | 0.48 | | | | 0.52 | | | | 0.61 | | | | 0.64 | | | | 0.50 | | |
Net Realized and Unrealized Gain (Loss) | | | 0.70 | | | | (1.22 | ) | | | 0.52 | | | | 0.42 | | | | (0.69 | ) | |
Total from Investment Operations | | | 1.18 | | | | (0.70 | ) | | | 1.13 | | | | 1.06 | | | | (0.19 | ) | |
Distributions from and/or in Excess of: | |
Net Investment Income | | | (0.40 | ) | | | (0.46 | ) | | | (0.52 | ) | | | (0.52 | ) | | | (0.50 | ) | |
Paid-in-Capital | | | (0.05 | ) | | | — | | | | — | | | | — | | | | — | | |
Total Distributions | | | (0.45 | ) | | | (0.46 | ) | | | (0.52 | ) | | | (0.52 | ) | | | (0.50 | ) | |
Redemption Fees | | | 0.00 | (3) | | | 0.00 | (3) | | | 0.00 | (3) | | | 0.00 | (3) | | | 0.00 | (3) | |
Net Asset Value, End of Period | | $ | 9.24 | | | $ | 8.51 | | | $ | 9.67 | | | $ | 9.06 | | | $ | 8.52 | | |
Total Return(4) | | | 14.03 | % | | | (7.29 | )% | | | 12.54 | % | | | 12.53 | % | | | (2.14 | )% | |
Ratios to Average Net Assets and Supplemental Data: | |
Net Assets, End of Period (Thousands) | | $ | 2,141 | | | $ | 1,306 | | | $ | 1,150 | | | $ | 972 | | | $ | 1,103 | | |
Ratio of Expenses Before Expense Limitation | | | 1.81 | % | | | 2.49 | % | | | 2.51 | % | | | 2.28 | % | | | 2.49 | % | |
Ratio of Expenses After Expense Limitation | | | 1.18 | %(5) | | | 1.19 | %(5) | | | 1.19 | %(5) | | | 1.09 | %(5) | | | 1.20 | %(5) | |
Ratio of Net Investment Income | | | 5.31 | %(5) | | | 5.74 | %(5) | | | 6.37 | %(5) | | | 7.03 | %(5) | | | 5.61 | %(5) | |
Ratio of Rebate from Morgan Stanley Affiliates | | | 0.02 | % | | | 0.01 | % | | | 0.01 | % | | | 0.00 | %(6) | | | 0.00 | %(6) | |
Portfolio Turnover Rate | | | 58 | % | | | 47 | % | | | 77 | % | | | 116 | % | | | 111 | % | |
(1) Reflects prior period custodian out-of-pocket expenses that were reimbursed in September 2016. The amount of the reimbursement was immaterial on a per share basis and did not impact the total return of Class A shares. The Ratio of Expenses After Expense Limitation and the Ratio of Net Investment Income would be unchanged as the reimbursement of custodian fees was offset against expense waivers/reimbursements with no impact to net expenses or net investment income.
(2) Per share amount is based on average shares outstanding.
(3) Amount is less than $0.005 per share.
(4) Calculated based on the net asset value which does not reflect sales charges, if applicable, as of the last business day of the period.
(5) The Ratio of Expenses After Expense Limitation and Ratio of Net Investment Income reflect the rebate of certain Fund expenses in connection with the investments in Morgan Stanley affiliates during the period. The effect of the rebate on the ratios is disclosed in the above table as "Ratio of Rebate from Morgan Stanley Affiliates."
(6) Amount is less than 0.005%.
The accompanying notes are an integral part of the financial statements.
19
Morgan Stanley Institutional Fund, Inc.
Annual Report — December 31, 2019
Financial Highlights
Emerging Markets Fixed Income Opportunities Portfolio
| | | Class L | |
| | | Year Ended December 31, | |
Selected Per Share Data and Ratios | | 2019 | | 2018 | | 2017 | | 2016(1) | | 2015 | |
Net Asset Value, Beginning of Period | | $ | 8.50 | | | $ | 9.65 | | | $ | 9.05 | | | $ | 8.51 | | | $ | 9.22 | | |
Income (Loss) from Investment Operations: | |
Net Investment Income(2) | | | 0.46 | | | | 0.50 | | | | 0.59 | | | | 0.62 | | | | 0.49 | | |
Net Realized and Unrealized Gain (Loss) | | | 0.70 | | | | (1.22 | ) | | | 0.51 | | | | 0.41 | | | | (0.72 | ) | |
Total from Investment Operations | | | 1.16 | | | | (0.72 | ) | | | 1.10 | | | | 1.03 | | | | (0.23 | ) | |
Distributions from and/or in Excess of: | |
Net Investment Income | | | (0.38 | ) | | | (0.43 | ) | | | (0.50 | ) | | | (0.49 | ) | | | (0.48 | ) | |
Paid-in-Capital | | | (0.05 | ) | | | — | | | | — | | | | — | | | | — | | |
Total Distributions | | | (0.43 | ) | | | (0.43 | ) | | | (0.50 | ) | | | (0.49 | ) | | | (0.48 | ) | |
Redemption Fees | | | 0.00 | (3) | | | 0.00 | (3) | | | 0.00 | (3) | | | 0.00 | (3) | | | 0.00 | (3) | |
Net Asset Value, End of Period | | $ | 9.23 | | | $ | 8.50 | | | $ | 9.65 | | | $ | 9.05 | | | $ | 8.51 | | |
Total Return(4) | | | 13.76 | % | | | (7.52 | )% | | | 12.28 | % | | | 12.15 | % | | | (2.53 | )% | |
Ratios to Average Net Assets and Supplemental Data: | |
Net Assets, End of Period (Thousands) | | $ | 764 | | | $ | 727 | | | $ | 842 | | | $ | 777 | | | $ | 735 | | |
Ratio of Expenses Before Expense Limitation | | | 2.16 | % | | | 2.78 | % | | | 2.77 | % | | | 2.78 | % | | | 2.94 | % | |
Ratio of Expenses After Expense Limitation | | | 1.43 | %(5) | | | 1.44 | %(5) | | | 1.44 | %(5) | | | 1.45 | %(5) | | | 1.45 | %(5) | |
Ratio of Net Investment Income | | | 5.05 | %(5) | | | 5.51 | %(5) | | | 6.11 | %(5) | | | 6.70 | %(5) | | | 5.44 | %(5) | |
Ratio of Rebate from Morgan Stanley Affiliates | | | 0.02 | % | | | 0.01 | % | | | 0.01 | % | | | 0.00 | %(6) | | | 0.00 | %(6) | |
Portfolio Turnover Rate | | | 58 | % | | | 47 | % | | | 77 | % | | | 116 | % | | | 111 | % | |
(1) Reflects prior period custodian out-of-pocket expenses that were reimbursed in September 2016. The amount of the reimbursement was immaterial on a per share basis and did not impact the total return of Class L shares. The Ratio of Expenses After Expense Limitation and the Ratio of Net Investment Income would be unchanged as the reimbursement of custodian fees was offset against expense waivers/reimbursements with no impact to net expenses or net investment income.
(2) Per share amount is based on average shares outstanding.
(3) Amount is less than $0.005 per share.
(4) Calculated based on the net asset value as of the last business day of the period.
(5) The Ratio of Expenses After Expense Limitation and Ratio of Net Investment Income reflect the rebate of certain Fund expenses in connection with the investments in Morgan Stanley affiliates during the period. The effect of the rebate on the ratios is disclosed in the above table as "Ratio of Rebate from Morgan Stanley Affiliates."
(6) Amount is less than 0.005%.
The accompanying notes are an integral part of the financial statements.
20
Morgan Stanley Institutional Fund, Inc.
Annual Report — December 31, 2019
Financial Highlights
Emerging Markets Fixed Income Opportunities Portfolio
| | | Class C | |
| | | Year Ended December 31, | | Period from
April 30, 2015(2) to | |
Selected Per Share Data and Ratios | | 2019 | | 2018 | | 2017 | | 2016(1) | | December 31, 2015 | |
Net Asset Value, Beginning of Period | | $ | 8.50 | | | $ | 9.65 | �� | | $ | 9.05 | | | $ | 8.52 | | | $ | 9.52 | | |
Income (Loss) from Investment Operations: | |
Net Investment Income(3) | | | 0.41 | | | | 0.46 | | | | 0.50 | | | | 0.54 | | | | 0.32 | | |
Net Realized and Unrealized Gain (Loss) | | | 0.70 | | | | (1.22 | ) | | | 0.55 | | | | 0.43 | | | | (0.97 | ) | |
Total from Investment Operations | | | 1.11 | | | | (0.76 | ) | | | 1.05 | | | | 0.97 | | | | (0.65 | ) | |
Distributions from and/or in Excess of: | |
Net Investment Income | | | (0.35 | ) | | | (0.39 | ) | | | (0.45 | ) | | | (0.44 | ) | | | (0.35 | ) | |
Paid-in-Capital | | | (0.05 | ) | | | — | | | | — | | | | — | | | | — | | |
Total Distributions | | | (0.40 | ) | | | (0.39 | ) | | | (0.45 | ) | | | (0.44 | ) | | | (0.35 | ) | |
Redemption Fees | | | 0.00 | (4) | | | 0.00 | (4) | | | 0.00 | (4) | | | 0.00 | (4) | | | 0.00 | (4) | |
Net Asset Value, End of Period | | $ | 9.21 | | | $ | 8.50 | | | $ | 9.65 | | | $ | 9.05 | | | $ | 8.52 | | |
Total Return(5) | | | 13.19 | % | | | (7.98 | )% | | | 11.76 | % | | | 11.60 | % | | | (6.95 | )%(8) | |
Ratios to Average Net Assets and Supplemental Data: | |
Net Assets, End of Period (Thousands) | | $ | 524 | | | $ | 48 | | | $ | 284 | | | $ | 225 | | | $ | 202 | | |
Ratio of Expenses Before Expense Limitation | | | 2.92 | % | | | 3.79 | % | | | 3.84 | % | | | 3.97 | % | | | 6.28 | %(9) | |
Ratio of Expenses After Expense Limitation | | | 1.93 | %(6) | | | 1.94 | %(6) | | | 1.94 | %(6) | | | 1.95 | %(6) | | | 1.95 | %(6)(9) | |
Ratio of Net Investment Income | | | 4.54 | %(6) | | | 5.09 | %(6) | | | 5.18 | %(6) | | | 5.87 | %(6) | | | 5.34 | %(6)(9) | |
Ratio of Rebate from Morgan Stanley Affiliates | | | 0.02 | % | | | 0.01 | % | | | 0.01 | % | | | 0.00 | %(7) | | | 0.00 | %(7)(9) | |
Portfolio Turnover Rate | | | 58 | % | | | 47 | % | | | 77 | % | | | 116 | % | | | 111 | % | |
(1) Reflects prior period custodian out-of-pocket expenses that were reimbursed in September 2016. The amount of the reimbursement was immaterial on a per share basis and did not impact the total return of Class C shares. The Ratio of Expenses After Expense Limitation and the Ratio of Net Investment Income would be unchanged as the reimbursement of custodian fees was offset against expense waivers/reimbursements with no impact to net expenses or net investment income.
(2) Commencement of Offering.
(3) Per share amount is based on average shares outstanding.
(4) Amount is less than $0.005 per share.
(5) Calculated based on the net asset value which does not reflect sales charges, if applicable, as of the last business day of the period.
(6) The Ratio of Expenses After Expense Limitation and Ratio of Net Investment Income reflect the rebate of certain Fund expenses in connection with the investments in Morgan Stanley affiliates during the period. The effect of the rebate on the ratios is disclosed in the above table as "Ratio of Rebate from Morgan Stanley Affiliates."
(7) Amount is less than 0.005%.
(8) Not annualized.
(9) Annualized.
The accompanying notes are an integral part of the financial statements.
21
Morgan Stanley Institutional Fund, Inc.
Annual Report — December 31, 2019
Financial Highlights
Emerging Markets Fixed Income Opportunities Portfolio
| | | Class IS | |
| | | Year Ended December 31, | |
Selected Per Share Data and Ratios | | 2019 | | 2018 | | 2017 | | 2016(1) | | 2015 | |
Net Asset Value, Beginning of Period | | $ | 8.52 | | | $ | 9.68 | | | $ | 9.07 | | | $ | 8.53 | | | $ | 9.22 | | |
Income (Loss) from Investment Operations: | |
Net Investment Income(2) | | | 0.52 | | | | 0.56 | | | | 0.65 | | | | 0.67 | | | | 0.50 | | |
Net Realized and Unrealized Gain (Loss) | | | 0.69 | | | | (1.23 | ) | | | 0.52 | | | | 0.42 | | | | (0.66 | ) | |
Total from Investment Operations | | | 1.21 | | | | (0.67 | ) | | | 1.17 | | | | 1.09 | | | | (0.16 | ) | |
Distributions from and/or in Excess of: | |
Net Investment Income | | | (0.43 | ) | | | (0.49 | ) | | | (0.56 | ) | | | (0.55 | ) | | | (0.53 | ) | |
Paid-in-Capital | | | (0.05 | ) | | | — | | | | — | | | | — | | | | — | | |
Total Distributions | | | (0.48 | ) | | | (0.49 | ) | | | (0.56 | ) | | | (0.55 | ) | | | (0.53 | ) | |
Redemption Fees | | | 0.00 | (3) | | | 0.00 | (3) | | | 0.00 | (3) | | | 0.00 | (3) | | | 0.00 | (3) | |
Net Asset Value, End of Period | | $ | 9.25 | | | $ | 8.52 | | | $ | 9.68 | | | $ | 9.07 | | | $ | 8.53 | | |
Total Return(4) | | | 14.44 | % | | | (6.91 | )% | | | 12.95 | % | | | 12.81 | % | | | (1.83 | )% | |
Ratios to Average Net Assets and Supplemental Data: | |
Net Assets, End of Period (Thousands) | | $ | 19 | | | $ | 672 | | | $ | 763 | | | $ | 716 | | | $ | 673 | | |
Ratio of Expenses Before Expense Limitation | | | 1.73 | % | | | 2.22 | % | | | 2.25 | % | | | 2.25 | % | | | 1.86 | % | |
Ratio of Expenses After Expense Limitation | | | 0.80 | %(5) | | | 0.81 | %(5) | | | 0.81 | %(5) | | | 0.82 | %(5) | | | 0.82 | %(5) | |
Ratio of Net Investment Income | | | 5.72 | %(5) | | | 6.15 | %(5) | | | 6.74 | %(5) | | | 7.33 | %(5) | | | 5.45 | %(5) | |
Ratio of Rebate from Morgan Stanley Affiliates | | | 0.02 | % | | | 0.01 | % | | | 0.01 | % | | | 0.00 | %(6) | | | 0.00 | %(6) | |
Portfolio Turnover Rate | | | 58 | % | | | 47 | % | | | 77 | % | | | 116 | % | | | 111 | % | |
(1) Reflects prior period custodian out-of-pocket expenses that were reimbursed in September 2016. The amount of the reimbursement was immaterial on a per share basis and did not impact the total return of Class IS shares. The Ratio of Expenses After Expense Limitation and the Ratio of Net Investment Income would be unchanged as the reimbursement of custodian fees was offset against expense waivers/reimbursements with no impact to net expenses or net investment income.
(2) Per share amount is based on average shares outstanding.
(3) Amount is less than $0.005 per share.
(4) Calculated based on the net asset value as of the last business day of the period.
(5) The Ratio of Expenses After Expense Limitation and Ratio of Net Investment Income reflect the rebate of certain Fund expenses in connection with the investments in Morgan Stanley affiliates during the period. The effect of the rebate on the ratios is disclosed in the above table as "Ratio of Rebate from Morgan Stanley Affiliates."
(6) Amount is less than 0.005%.
The accompanying notes are an integral part of the financial statements.
22
Morgan Stanley Institutional Fund, Inc.
Annual Report — December 31, 2019
Notes to Financial Statements
Morgan Stanley Institutional Fund, Inc. (the "Company") is registered under the Investment Company Act of 1940, as amended (the "Act"), as an open-end management investment company. The Company is comprised of thirty-two separate, active, diversified and non-diversified funds (individually referred to as a "Fund," collectively as the "Funds"). The Company applies investment company accounting and reporting guidance.
The accompanying financial statements relate to the Emerging Markets Fixed Income Opportunities Portfolio. The Fund seeks high total return.
The Fund offers five classes of shares — Class I, Class A, Class L, Class C and Class IS. On April 30, 2015, the Fund suspended offering of Class L shares. Existing Class L shareholders may invest through reinvestment of dividends and distributions.
A. Significant Accounting Policies: The following significant accounting policies are in conformity with U.S. generally accepted accounting principles ("GAAP"). Such policies are consistently followed by the Company in the preparation of its financial statements. GAAP may require management to make estimates and assumptions that affect the reported amounts and disclosures in the financial statements. Actual results may differ from those estimates.
In August 2018, the Financial Accounting Standards Board ("FASB") issued Accounting Standards Update ("ASU") 2018-13, Fair Value Measurement (Topic 820) — Disclosures Framework — Changes to Disclosure Requirements of Fair Value Measurement ("ASU 2018-13") which introduces new fair value disclosure requirements as well as eliminates and modifies certain existing fair value disclosure requirements. ASU 2018-13 would be effective for fiscal years beginning after December 15, 2019 and for interim periods within those fiscal years; however, management has elected to early adopt ASU 2018-13 as permitted by the standard. The impact of the Fund's adoption was limited to changes in the Fund's financial statement disclosures regarding fair value, primarily those disclosures related to transfers between levels of the fair value hierarchy and disclosure of the range and weighted average used to develop significant unobservable inputs for Level 3 fair value measurements, when applicable.
1. Security Valuation: (1) Certain portfolio securities may be valued by an outside pricing service/vendor approved by the Company's Board of Directors (the "Directors"). The pricing service/vendor may employ a pricing model
that takes into account, among other things, bids, yield spreads and/or other market data and specific security characteristics. Alternatively, if a valuation is not available from an outside pricing service/vendor, and the security trades on an exchange, the security may be valued at its latest reported sale price (or at the exchange official closing price if such exchange reports an official closing price), prior to the time when assets are valued. If there are no sales on a given day and if there is no official exchange closing price for that day, the security is valued at the mean between the last reported bid and asked prices if such bid and asked prices are available in the relevant exchanges. If Morgan Stanley Investment Management Inc. (the "Adviser") or Morgan Stanley Investment Management Limited ("MSIM Limited") and Morgan Stanley Investment Management Company ("MSIM Company") (together, the "Sub-Advisers"), each a wholly-owned subsidiary of Morgan Stanley, determines that the price provided by the outside pricing service/vendor or exchange does not reflect the security's fair value or is unable to provide a price, prices from brokers or dealers may also be utilized. In these circumstances, the value of the security will be the mean of bid and asked prices obtained from brokers or dealers; (2) an equity portfolio security listed or traded on an exchange is valued at its latest reported sales price (or at the exchange official closing price if such exchange reports an official closing price), and if there were no sales on a given day and if there is no official exchange closing price for that day, the security is valued at the mean between the last reported bid and asked prices if such bid and asked prices are available on the relevant exchanges. If only bid prices are available then the latest bid price may be used. Listed equity securities not traded on the valuation date with no reported bid and asked prices available on the exchange are valued at the mean between the current bid and asked prices obtained from one or more reputable brokers or dealers. In cases where a security is traded on more than one exchange, the security is valued on the exchange designated as the primary market; (3) all other equity portfolio securities for which over-the-counter ("OTC") market quotations are readily available are valued at the latest reported sales price (or at the market official closing price if such market reports an official closing price), and if there was no trading in the security on a given day and if there is no official closing price from relevant markets for that day, the security is valued at the mean between the last reported bid and asked prices if
23
Morgan Stanley Institutional Fund, Inc.
Annual Report — December 31, 2019
Notes to Financial Statements (cont'd)
such bid and asked prices are available on the relevant markets. An unlisted equity security that does not trade on the valuation date and for which bid and asked prices from the relevant markets are unavailable is valued at the mean between the current bid and asked prices obtained from one or more reputable brokers or dealers; (4) when market quotations are not readily available, including circumstances under which the Adviser or the Sub-Adviser determines that the closing price, last sale price or the mean between the last reported bid and asked prices are not reflective of a security's market value, portfolio securities are valued at their fair value as determined in good faith under procedures established by and under the general supervision of the Directors. Occasionally, developments affecting the closing prices of securities and other assets may occur between the times at which valuations of such securities are determined (that is, close of the foreign market on which the securities trade) and the close of business of the New York Stock Exchange ("NYSE"). If developments occur during such periods that are expected to materially affect the value of such securities, such valuations may be adjusted to reflect the estimated fair value of such securities as of the close of the NYSE, as determined in good faith by the Directors or by the Adviser using a pricing service and/or procedures approved by the Directors; (5) quotations of foreign portfolio securities, other assets and liabilities and forward contracts stated in foreign currency are translated into U.S. dollar equivalents at the prevailing market rates prior to the close of the NYSE; and (6) investments in mutual funds, including the Morgan Stanley Institutional Liquidity Funds, are valued at the net asset value ("NAV") as of the close of each business day.
The Directors have responsibility for determining in good faith the fair value of the investments, and the Directors may appoint others, such as the Company's Adviser or a valuation committee, to assist the Directors in determining fair value and to make the actual calculations pursuant to the fair valuation methodologies previously approved by the Directors. Under procedures approved by the Directors, the Company's Adviser has formed a Valuation Committee whose members are approved by the Directors. The Valuation Committee provides administration and oversight of the Company's valuation policies and procedures, which are reviewed at least annually by the Directors. These procedures allow the Company to utilize independent pricing services, quotations from securities and financial instrument dealers and other market sources to determine fair value.
2. Fair Value Measurement: FASB Accounting Standards CodificationTM ("ASC") 820, "Fair Value Measurement" ("ASC 820"), defines fair value as the value that the Fund would receive to sell an investment or pay to transfer a liability in a timely transaction with an independent buyer in the principal market, or in the absence of a principal market, the most advantageous market for the investment or liability. ASC 820 establishes a three-tier hierarchy to distinguish between (1) inputs that reflect the assumptions market participants would use in valuing an asset or liability developed based on market data obtained from sources independent of the reporting entity (observable inputs) and (2) inputs that reflect the reporting entity's own assumptions about the assumptions market participants would use in valuing an asset or liability developed based on the best information available in the circumstances (unobservable inputs) and to establish classification of fair value measurements for disclosure purposes. Various inputs are used in determining the value of the Fund's investments. The inputs are summarized in the three broad levels listed below:
• Level 1 – unadjusted quoted prices in active markets for identical investments
• Level 2 – other significant observable inputs (including quoted prices for similar investments, interest rates, prepayment speeds, credit risk, etc.)
• Level 3 – significant unobservable inputs including the Fund's own assumptions in determining the fair value of investments. Factors considered in making this determination may include, but are not limited to, information obtained by contacting the issuer, analysts, or the appropriate stock exchange (for exchange-traded securities), analysis of the issuer's financial statements or other available documents and, if necessary, available information concerning other securities in similar circumstances.
The inputs or methodology used for valuing securities are not necessarily an indication of the risk associated with investing in those securities and the determination of the significance of a particular input to the fair value measurement in its entirety requires judgment and considers factors specific to each security.
24
Morgan Stanley Institutional Fund, Inc.
Annual Report — December 31, 2019
Notes to Financial Statements (cont'd)
The following is a summary of the inputs used to value the Fund's investments as of December 31, 2019:
Investment Type | | Level 1
Unadjusted
quoted
prices
(000) | | Level 2
Other
significant
observable
inputs
(000) | | Level 3
Significant
unobservable
inputs
(000) | | Total
(000) | |
Assets: | |
Fixed Income Securities | |
Corporate Bonds | | $ | — | | | $ | 14,966 | | | $ | — | | | $ | 14,966 | | |
Sovereign | | | — | | | | 40,084 | | | | — | | | | 40,084 | | |
Total Fixed Income
Securities | | | — | | | | 55,050 | | | | — | | | | 55,050 | | |
Warrant | | | — | | | | 1 | | | | — | | | | 1 | | |
Short-Term Investments | |
Investment Company | | | 4,403 | | | | — | | | | — | | | | 4,403 | | |
Sovereign | | | — | | | | 1,045 | | | | — | | | | 1,045 | | |
U.S. Treasury Security | | | — | | | | 30 | | | | — | | | | 30 | | |
Total Short-Term
Investments | | | 4,403 | | | | 1,075 | | | | — | | | | 5,478 | | |
Total Assets | | | 4,403 | | | | 56,126 | | | | — | | | | 60,529 | | |
Liabilities: | |
Foreign Currency
Forward Exchange
Contracts | | | — | | | | (46 | ) | | | — | | | | (46 | ) | |
Total | | $ | 4,403 | | | $ | 56,080 | | | $ | — | | | $ | 60,483 | | |
Transfers between investment levels may occur as the markets fluctuate and/or the availability of data used in an investment's valuation changes.
3. Foreign Currency Translation and Foreign Investments: The books and records of the Fund are maintained in U.S. dollars. Foreign currency amounts are translated into U.S. dollars as follows:
– investments, other assets and liabilities at the prevailing rate of exchange on the valuation date;
– investment transactions and investment income at the prevailing rates of exchange on the dates of such transactions.
Although the net assets of the Fund are presented at the foreign exchange rates and market values at the close of the period, the Fund does not isolate that portion of the results of operations arising as a result of changes in the foreign exchange rates from the fluctuations arising from changes in the market prices of securities held at period end. Similarly, the Fund does not isolate the effect of changes in foreign exchange rates from the fluctuations arising from changes in the market prices of securities sold during the period. Accordingly, realized and unrealized foreign currency gains (losses) on investments in securities
are included in the reported net realized and unrealized gains (losses) on investment transactions and balances. However, pursuant to U.S. federal income tax regulations, gains and losses from certain foreign currency transactions and the foreign currency portion of gains and losses realized on sales and maturities of foreign denominated debt securities are treated as ordinary income for U.S. federal income tax purposes.
Net realized gains (losses) on foreign currency transactions represent net foreign exchange gains (losses) from foreign currency forward exchange contracts, disposition of foreign currencies, currency gains (losses) realized between the trade and settlement dates on securities transactions, and the difference between the amount of investment income and foreign withholding taxes recorded on the Fund's books and the U.S. dollar equivalent amounts actually received or paid. The change in unrealized currency gains (losses) on foreign currency transactions for the period is reflected in the Statement of Operations.
Foreign security and currency transactions may involve certain considerations and risks not typically associated with those of U.S. dollar denominated transactions as a result of, among other factors, fluctuations of exchange rates in relation to the U.S. dollar, the possibility of lower levels of governmental supervision and regulation of foreign securities markets and the possibility of political or economic instability.
Governmental approval for foreign investments may be required in advance of making an investment under certain circumstances in some countries, and the extent of foreign investments in domestic companies may be subject to limitation in other countries. Foreign ownership limitations also may be imposed by the charters of individual companies to prevent, among other concerns, violations of foreign investment limitations. As a result, an additional class of shares (identified as "Foreign" in the Portfolio of Investments) may be created and offered for investment. The "local" and "foreign shares" market values may differ. In the absence of trading of the foreign shares in such markets, the Fund values the foreign shares at the closing exchange price of the local shares.
4. Structured Investments: The Fund invested a portion of its assets in structured investments. A structured investment is a derivative security designed to offer a return
25
Morgan Stanley Institutional Fund, Inc.
Annual Report — December 31, 2019
Notes to Financial Statements (cont'd)
linked to a particular underlying security, currency, commodity or market. Structured investments may come in various forms including notes (such as exchange-traded notes), warrants and options to purchase securities. The Fund will typically use structured investments to gain exposure to a permitted underlying security, currency, commodity or market when direct access to a market is limited or inefficient from a tax or cost standpoint. There can be no assurance that structured investments will trade at the same price or have the same value as the underlying security, currency, commodity or market. Investments in structured investments involve risks including issuer risk, counterparty risk and market risk. Holders of structured investments bear risks of the underlying investment and are subject to issuer or counterparty risk because the Fund is relying on the creditworthiness of such issuer or counterparty and has no rights with respect to the underlying investment. Certain structured investments may be thinly traded or have a limited trading market and may have the effect of increasing the Fund's illiquidity to the extent that the Fund, at a particular time, may be unable to find qualified buyers for these securities.
5. Derivatives: The Fund may, but is not required to, use derivative instruments for a variety of purposes, including hedging, risk management, portfolio management or to earn income. Derivatives are financial instruments whose value is based, in part, on the value of an underlying asset, interest rate, index or financial instrument. Prevailing interest rates and volatility levels, among other things, also affect the value of derivative instruments. A derivative instrument often has risks similar to its underlying asset and may have additional risks, including imperfect correlation between the value of the derivative and the underlying asset, risks of default by the counterparty to certain transactions, magnification of losses incurred due to changes in the market value of the securities, instruments, indices or interest rates to which the derivative instrument relates, risks that the transactions may not be liquid and risks arising from margin requirements. The use of derivatives involves risks that are different from, and possibly greater than, the risks associated with other portfolio investments. Derivatives may involve the use of highly specialized instruments that require investment techniques and risk analyses different from those associated with other portfolio investments. All of the Fund's holdings, including derivative instruments, are marked-to-market each day with
the change in value reflected in unrealized appreciation (depreciation). Upon disposition, a realized gain or loss is recognized.
Certain derivative transactions may give rise to a form of leverage. Leverage magnifies the potential for gain and the risk of loss. Leverage associated with derivative transactions may cause the Fund to liquidate portfolio positions when it may not be advantageous to do so to satisfy its obligations or to meet earmarking or segregation requirements, pursuant to applicable Securities and Exchange Commission ("SEC") rules and regulations, or may cause the Fund to be more volatile than if the Fund had not been leveraged. Although the Adviser seeks to use derivatives to further the Fund's investment objectives, there is no assurance that the use of derivatives will achieve this result.
Following is a description of the derivative instruments and techniques that the Fund used during the period and their associated risks:
Foreign Currency Forward Exchange Contracts: In connection with its investments in foreign securities, the Fund also entered into contracts with banks, brokers or dealers to purchase or sell securities or foreign currencies at a future date. A foreign currency forward exchange contract ("currency contract") is a negotiated agreement between the contracting parties to exchange a specified amount of currency at a specified future time at a specified rate. The rate can be higher or lower than the spot rate between the currencies that are the subject of the contract. Currency contracts may be used to protect against uncertainty in the level of future foreign currency exchange rates or to gain or modify exposure to a particular currency. To the extent hedged by the use of currency contracts, the precise matching of the currency contract amounts and the value of the securities involved will not generally be possible because the future value of such securities in foreign currencies will change as a consequence of market movements in the value of those securities between the date on which the contract is entered into and the date it matures. Furthermore, such transactions may reduce or preclude the opportunity for gain if the value of the currency should move in the direction opposite to the position taken. There is additional risk to the extent that currency contracts create exposure to currencies in which the Fund's securities are not denominated. Unanticipated changes in currency
26
Morgan Stanley Institutional Fund, Inc.
Annual Report — December 31, 2019
Notes to Financial Statements (cont'd)
prices may result in poorer overall performance for the Fund than if it had not entered into such contracts. The use of currency contracts involves the risk of loss from the insolvency or bankruptcy of the counterparty to the contract or the failure of the counterparty to make payments or otherwise comply with the terms of the contract. A currency contract is marked-to-market daily and the change in market value is recorded by the Fund as unrealized gain or loss. The Fund records realized gains (losses) when the currency contract is closed equal to the difference between the value of the currency contract at the time it was opened and the value at the time it was closed.
FASB ASC 815, "Derivatives and Hedging" ("ASC 815"), is intended to improve financial reporting about derivative instruments by requiring enhanced disclosures to enable investors to better understand how and why the Fund uses derivative instruments, how these derivative instruments are accounted for and their effects on the Fund's financial position and results of operations.
The following table sets forth the fair value of the Fund's derivative contracts by primary risk exposure as of December 31, 2019:
| | | Liability Derivatives
Statement of Assets and
Liabilities Location | | Primary Risk
Exposure | | Value
(000) | |
Foreign Currency
Forward
Exchange Contracts | | Unrealized Depreciation on
Foreign Currency Forward
Exchange Contracts | | Currency Risk | | $ | (46 | ) | |
The following tables set forth by primary risk exposure the Fund's realized gains (losses) and change in unrealized appreciation (depreciation) by type of derivative contract for the year ended December 31, 2019 in accordance with ASC 815:
Realized Gain (Loss) | |
Primary Risk Exposure | | Derivative Type | | Value
(000) | |
Currency Risk
| | Foreign Currency Forward
Exchange Contracts | | $ | (116 | ) | |
Change in Unrealized Appreciation (Depreciation) | |
Primary Risk Exposure | | Derivative Type | | Value
(000) | |
Currency Risk
| | Foreign Currency Forward
Exchange Contracts | | $ | (13 | ) | |
At December 31, 2019, the Fund's derivative assets and liabilities are as follows:
Gross Amounts of Assets and Liabilities
Presented in the Statement of Assets and Liabilities | |
Derivatives | | Assets(a)
(000) | | Liabilities(a)
(000) | |
Foreign Currency Forward Exchange Contracts | | $ | — | | | $ | 46 | | |
(a) Absent an event of default or early termination, OTC derivative assets and liabilities are presented gross and not offset in the Statement of Assets and Liabilities.
The Fund typically enters into International Swaps and Derivatives Association, Inc. Master Agreements ("ISDA Master Agreements") or similar master agreements (collectively, "Master Agreements") with its contract counterparties for certain OTC derivatives in order to, among other things, reduce its credit risk to counterparties. ISDA Master Agreements include provisions for general obligations, representations, collateral and events of default or termination. Under an ISDA Master Agreement, the Fund typically may offset with the counterparty certain OTC derivative financial instruments' payables and/or receivables with collateral held and/or posted and create one single net payment (close-out netting) in the event of default, termination and/or potential deterioration in the credit quality of the counterparty. Various Master Agreements govern the terms of certain transactions with counterparties, including transactions such as swap, forward, repurchase and reverse repurchase agreements. These Master Agreements typically attempt to reduce the counterparty risk associated with such transactions by specifying credit protection mechanisms and providing standardization that improves legal certainty. Cross-termination provisions under Master Agreements typically provide that a default in connection with one transaction between the Fund and a counterparty gives the non-defaulting party the right to terminate any other transactions in place with the defaulting party to create one single net payment due to/due from the defaulting party and may be a feature in certain Master Agreements. In the event the Fund exercises its right to terminate a Master Agreement after a counterparty experiences a termination event as defined in the Master Agreement, the return of collateral with market value in excess of the Fund's net liability may be delayed or denied.
27
Morgan Stanley Institutional Fund, Inc.
Annual Report — December 31, 2019
Notes to Financial Statements (cont'd)
The following tables present derivative financial instruments that are subject to enforceable netting arrangements as of December 31, 2019:
Gross Amounts Not Offset in the Statement of Assets and Liabilities | |
Counterparty | | Gross Liability
Derivatives
Presented in the
Statement of
Assets and
Liabilities
(000) | | Financial
Instrument
(000) | | Collateral
Pledged
(000) | | Net Amount
(not less
than $0)
(000) | |
Barclays Bank PLC | | $ | 9 | | | $ | — | | | $ | — | | | $ | 9 | | |
Citibank NA | | | 5 | | | | — | | | | — | | | | 5 | | |
JPMorgan Chase Bank NA | | | 3 | | | | — | | | | — | | | | 3 | | |
State Street Bank and Trust Co. | | | 29 | | | | — | | | | — | | | | 29 | | |
Total | | $ | 46 | | | $ | — | | | $ | — | | | $ | 46 | | |
For the year ended December 31, 2019, the approximate average monthly amount outstanding for each derivative type is as follows:
Foreign Currency Forward Exchange Contracts: | |
Average monthly principal amount | | $ | 4,623,000 | | |
6. Redemption Fees: The Fund will assess a 2% redemption fee on Class I shares, Class A shares, Class L shares, Class C shares and Class IS shares, which is paid directly to the Fund, for shares redeemed or exchanged within thirty days of purchase, subject to certain exceptions. The redemption fee is designed to protect the Fund and its remaining shareholders from the effects of short-term trading. These fees, if any, are included in the Statements of Changes in Net Assets.
7. Indemnifications: The Company enters into contracts that contain a variety of indemnifications. The Company's maximum exposure under these arrangements is unknown. However, the Company has not had prior claims or losses pursuant to these contracts and expects the risk of loss to be remote.
8. Dividends and Distributions to Shareholders: Dividends and distributions to shareholders are recorded on the ex-dividend date. Dividends from net investment income, if any, are declared and paid quarterly. Net realized capital gains, if any, are distributed at least annually.
9. Security Transactions, Income and Expenses: Security transactions are accounted for on the trade date (date the order to buy or sell is executed). Realized gains and losses on the sale of investment securities are determined on the specific identified cost method. Dividend
income and other distributions are recorded on the ex-dividend date. Interest income is recognized on the accrual basis except where collection is in doubt. Discounts are accreted and premiums are amortized over the life of the respective securities. Most expenses of the Company can be directly attributed to a particular Fund. Expenses which cannot be directly attributed are apportioned among the Funds based upon relative net assets or other appropriate methods. Income, expenses (other than class specific expenses — distribution and shareholder services, transfer agency and sub transfer agency fees) and realized and unrealized gains or losses are allocated to each class of shares based upon their relative net assets.
B. Advisory/Sub-Advisory Fees: The Adviser, a wholly-owned subsidiary of Morgan Stanley, provides the Fund with advisory services under the terms of an Investment Advisory Agreement, paid quarterly, at the annual rate based on the daily net assets as follows:
First $500
million | | Next $500
million | | Over $1
billion | |
| | 0.75 | % | | | 0.70 | % | | | 0.65 | % | |
For the year ended December 31, 2019, the advisory fee rate (net of waiver/rebate) was equivalent to an annual effective rate of 0.20% of the Fund's average daily net assets.
The Adviser has agreed to reduce its advisory fee and/or reimburse the Fund so that total annual Fund operating expenses, excluding certain investment related expenses, taxes, interest and other extraordinary expenses (including litigation), will not exceed 0.85% for Class I shares, 1.20% for Class A shares, 1.45% for Class L shares, 1.95% for Class C shares and 0.82% for Class IS shares. The fee waivers and/or expense reimbursements will continue for at least one year from the date of the Fund's prospectus or until such time as the Directors act to discontinue all or a portion of such waivers and/or reimbursements when they deem such action is appropriate. For the year ended December 31, 2019, approximately $265,000 of advisory fees were waived and approximately $12,000 of other expenses were reimbursed by the Adviser pursuant to this arrangement.
Effective August 1, 2019, the Adviser entered into a Sub-Advisory Agreement with MSIM Limited and effective December 31, 2019, the Adviser entered into a Sub-Advisery Agreement with MSIM Company, each a wholly-owned subsidiary of Morgan Stanley. The Sub-Advisers provide the Fund with advisory services subject to the overall supervision of the
28
Morgan Stanley Institutional Fund, Inc.
Annual Report — December 31, 2019
Notes to Financial Statements (cont'd)
Adviser and the Company's Officers and Directors. The Adviser pays the Sub-Advisers on a monthly basis a portion of the net advisory fees the Adviser receives from the Fund.
C. Administration Fees: The Adviser also serves as Administrator to the Company and provides administrative services pursuant to an Administration Agreement for an annual fee, accrued daily and paid monthly, of 0.08% of the Fund's average daily net assets.
Under a Sub-Administration Agreement between the Administrator and State Street Bank and Trust Company ("State Street"), State Street provides certain administrative services to the Company. For such services, the Administrator pays State Street a portion of the fee the Administrator receives from the Fund.
D. Distribution and Shareholder Services Fees: Morgan Stanley Distribution, Inc. ("MSDI" or the "Distributor"), a wholly-owned subsidiary of the Adviser and an indirect subsidiary of Morgan Stanley, serves as the Company's Distributor of Fund shares pursuant to a Distribution Agreement. The Company has adopted a Shareholder Services Plan with respect to Class A shares pursuant to Rule 12b-1 under the Act. Under the Shareholder Services Plan, the Fund pays the Distributor a shareholder services fee, accrued daily and paid monthly, at an annual rate of 0.25% of the Fund's average daily net assets attributable to Class A shares.
The Company has adopted a Distribution and Shareholder Services Plan with respect to Class L shares pursuant to Rule 12b-1 under the Act. Under the Distribution and Shareholder Services Plan, the Fund pays the Distributor a distribution fee, accrued daily and paid monthly, at an annual rate of 0.25% and a shareholder services fee, accrued daily and paid monthly, at an annual rate of 0.25% of the Fund's average daily net assets attributable to Class L shares.
The Company has adopted a Distribution and Shareholder Services Plan with respect to Class C shares pursuant to Rule 12b-1 under the Act. Under the Distribution and Shareholder Services Plan, the Fund pays the Distributor a distribution fee, accrued daily and paid monthly, at an annual rate of 0.75% and a shareholder services fee, accrued daily and paid monthly, at an annual rate of 0.25% of the Fund's average daily net assets attributable to Class C shares.
The distribution and shareholder services fees are used to support the expenses associated with servicing and maintaining accounts. The Distributor may compensate other parties for
providing shareholder support services to investors who purchase Class A, Class L and Class C shares.
E. Dividend Disbursing and Transfer Agent: The Company's dividend disbursing and transfer agent is DST Asset Manager Solutions, Inc. ("DST"). Pursuant to a Transfer Agency Agreement, the Company pays DST a fee based on the number of classes, accounts and transactions relating to the Funds of the Company.
F. Custodian Fees: State Street (the "Custodian") also serves as Custodian for the Company in accordance with a Custodian Agreement. The Custodian holds cash, securities and other assets of the Company as required by the Act. Custody fees are payable monthly based on assets held in custody, investment purchases and sales activity and account maintenance fees, plus reimbursement for certain out-of-pocket expenses.
G. Security Transactions and Transactions with Affiliates: For the year ended December 31, 2019, purchases and sales of investment securities for the Fund, other than long-term U.S. Government securities and short-term investments were approximately $44,332,000 and $25,104,000, respectively. There were no purchases and sales of long-term U.S. Government securities for the year ended December 31, 2019.
The Fund invests in the Institutional Class of the Morgan Stanley Institutional Liquidity Funds — Treasury Securities Portfolio (the "Liquidity Funds"), an open-end management investment company managed by the Adviser. Advisory fees paid by the Fund are reduced by an amount equal to its pro-rata share of the advisory and administration fees paid by the Fund due to its investment in the Liquidity Funds. For the year ended December 31, 2019, advisory fees paid were reduced by approximately $8,000 relating to the Fund's investment in the Liquidity Funds.
A summary of the Fund's transactions in shares of affiliated investments during the year ended December 31, 2019 is as follows:
Affiliated
Investment
Company | | Value
December 31,
2018
(000) | | Purchases
at Cost
(000) | | Proceeds
from Sales
(000) | | Dividend
Income
(000) | |
Liquidity Funds | | $ | 1,580 | | | $ | 33,808 | | | $ | 30,985 | | | $ | 88 | | |
29
Morgan Stanley Institutional Fund, Inc.
Annual Report — December 31, 2019
Notes to Financial Statements (cont'd)
Affiliated
Investment
Company (cont'd) | | Realized
Gain
(Loss)
(000) | | Change in
Unrealized
Appreciation
(Depreciation)
(000) | | Value
December 31,
2019
(000) | |
Liquidity Funds | | $ | — | | | $ | — | | | $ | 4,403 | | |
The Fund is permitted to purchase and sell securities ("cross-trade") from and to other Morgan Stanley funds as well as other funds and client accounts for which the Adviser or an affiliate of the Adviser serves as investment adviser, pursuant to procedures approved by the Directors in compliance with Rule 17a-7 under the Act (the "Rule"). Each cross-trade is executed at the current market price in compliance with provisions of the Rule. For the year ended December 31, 2019, the Fund did not engage in any cross-trade transactions.
The Fund has an unfunded Deferred Compensation Plan (the "Compensation Plan"), which allows each independent Director to defer payment of all, or a portion, of the fees he or she receives for serving on the Board of Directors. Each eligible Director generally may elect to have the deferred amounts credited with a return equal to the total return on one or more of the Morgan Stanley funds that are offered as investment options under the Compensation Plan. Appreciation/depreciation and distributions received from these investments are recorded with an offsetting increase/decrease in the deferred compensation obligation and do not affect the NAV of the Fund.
H. Federal Income Taxes: It is the Fund's intention to continue to qualify as a regulated investment company and distribute all of its taxable and tax-exempt income. Accordingly, no provision for federal income taxes is required in the financial statements.
The Fund may be subject to taxes imposed by countries in which it invests. Such taxes are generally based on income and/or capital gains earned or repatriated. Taxes are accrued based on net investment income, net realized gains and net unrealized appreciation as such income and/or gains are earned. Taxes may also be based on transactions in foreign currency and are accrued based on the value of investments denominated in such currency.
FASB ASC 740-10, "Income Taxes — Overall", sets forth a minimum threshold for financial statement recognition of the benefit of a tax position taken or expected to be taken in a tax return. Management has concluded there are no significant uncertain tax positions that would require recognition in the financial statements. If applicable, the Fund recognizes interest
accrued related to unrecognized tax benefits in "Interest Expense" and penalties in "Other Expenses" in the Statement of Operations. The Fund files tax returns with the U.S. Internal Revenue Service, New York and various states. Generally, each of the tax years in the four-year period ended December 31, 2019 remains subject to examination by taxing authorities.
The tax character of distributions paid may differ from the character of distributions shown for GAAP purposes due to short-term capital gains being treated as ordinary income for tax purposes. The tax character of distributions paid during fiscal years 2019 and 2018 was as follows:
2019
Distributions
Paid From: | | 2018
Distributions
Paid From: | |
Ordinary
Income
(000) | | Paid-in-
Capital
(000) | | Ordinary
Income
(000) | | Long-Term
Capital Gain
(000) | |
| $ | 2,408 | | | $ | 293 | | | $ | 1,530 | | | $ | — | | |
The amount and character of income and gains to be distributed are determined in accordance with income tax regulations which may differ from GAAP. These book/tax differences are either considered temporary or permanent in nature.
Temporary differences are attributable to differing book and tax treatments for the timing of the recognition of gains (losses) on certain investment transactions and the timing of the deductibility of certain expenses.
Permanent differences, primarily due to a nondeductible expense, resulted in the following reclassifications among the components of net assets at December 31, 2019:
Total
Accumulated
Loss
(000) | | Paid-in-
Capital
(000) | |
| $ | @ | | | | $(@) | | |
@ Amount is less than $500.
At December 31, 2019, the Fund had no distributable earnings on a tax basis.
At December 31, 2019, the Fund had available for federal income tax purposes unused short-term and long-term capital losses of approximately $1,135,000 and $4,171,000, respectively, that do not have an expiration date. These amounts include capital losses acquired from MSIF Emerging Markets Domestic Debt that may be subject to limitation under IRC Section 382 in future years.
30
Morgan Stanley Institutional Fund, Inc.
Annual Report — December 31, 2019
Notes to Financial Statements (cont'd)
To the extent that capital loss carryforwards are used to offset any future capital gains realized, no capital gains tax liability will be incurred by the Fund for gains realized and not distributed. To the extent that capital gains are offset, such gains will not be distributed to the shareholders.
I. Credit Facility: The Company and other Morgan Stanley funds participated in a $150,000,000 committed, unsecured revolving line of credit facility (the "Facility") with State Street. Effective April 22, 2019, the committed line amount increased to $300,000,000. This Facility is to be used for temporary emergency purposes or funding of shareholder redemption requests. The interest rate on borrowings is based on the federal funds rate or 1 month LIBOR rate plus a spread. The Facility also has a commitment fee of 0.25% per annum based on the unused portion of the Facility. During the year ended December 31, 2019, the Fund did not have any borrowings under the Facility.
J. Other: At December 31, 2019, the Fund had record owners of 10% or greater. Investment activities of these shareholders could have a material impact on the Fund. The aggregate percentage of such owners was 54.2%.
K. Accounting Pronouncement: In March 2017, FASB issued an Accounting Standard Update, ASU 2017-08, Receivables-Nonrefundable Fees and Other Costs (Subtopic 310-20), Premium Amortization on Purchased Callable Debt Securities ("ASU 2017-08") which amends the amortization period for certain purchased callable debt securities held at a premium, shortening such period to the earliest call date. ASU 2017-08 does not require any accounting change for debt securities held at a discount; the discount continues to be accreted to maturity. ASU 2017-08 is effective for fiscal years, and interim periods within those fiscal years, beginning after December 15, 2018. The adoption resulted in a change in accounting principle, since the Fund had historically amortized such premiums to maturity for U.S. GAAP. Accordingly, the Fund has adopted ASU 2017-08 to amend the premium amortization period for certain purchased callable debt securities with non-contingent call features to the earliest call date. It is impracticable to evaluate the effect on individual prior periods, therefore the Fund applied the amendments on a modified retrospective basis by recognizing a cumulative effect adjustment that decreased the beginning of period cost of investments and increased the unrealized appreciation on investments less than $500.
This change in accounting policy has been made to comply with the newly issued accounting standard and had no impact on total accumulated earnings (loss) or the net asset value of the Fund. With respect to the Fund's results of operations, amortization of premium to first call date accelerates amortization with the intent of more closely aligning the recognition of income on such bonds with the economics of the instrument.
31
Morgan Stanley Institutional Fund, Inc.
Annual Report — December 31, 2019
Report of Independent Registered Public Accounting Firm
To the Shareholders and Board of Directors of
Morgan Stanley Institutional Fund, Inc. —
Emerging Markets Fixed Income Opportunities Portfolio
Opinion on the Financial Statements
We have audited the accompanying statement of assets and liabilities of Emerging Markets Fixed Income Opportunities Portfolio (the "Fund") (one of the funds constituting Morgan Stanley Institutional Fund, Inc. (the "Company")), including the portfolio of investments, as of December 31, 2019, and the related statement of operations for the year then ended, the statements of changes in net assets for each of the two years in the period then ended, the financial highlights for each of the five years in the period then ended and the related notes (collectively referred to as the "financial statements"). In our opinion, the financial statements present fairly, in all material respects, the financial position of Emerging Markets Fixed Income Opportunities Portfolio (one of the funds constituting Morgan Stanley Institutional Fund, Inc.) at December 31, 2019, the results of its operations for the year then ended, the changes in its net assets for each of the two years in the period then ended and its financial highlights for each of the five years in the period then ended, in conformity with U.S. generally accepted accounting principles.
Basis for Opinion
These financial statements are the responsibility of the Company's management. Our responsibility is to express an opinion on the Fund's financial statements based on our audits. We are a public accounting firm registered with the Public Company Accounting Oversight Board (United States) ("PCAOB") and are required to be independent with respect to the Company in accordance with the U.S. federal securities law and the applicable rules and regulations of the Securities and Exchange Commission and the PCAOB.
We conducted our audits in accordance with the standards of the PCAOB. Those standards require that we plan and perform the audit to obtain reasonable assurance about whether the financial statements are free of material misstatement, whether due to error or fraud. The Company is not required to have, nor were we engaged to perform, an audit of the Company's internal control over financial reporting. As part of our audits, we are required to obtain an understanding of internal control over financial reporting, but not for the purpose of expressing an opinion on the effectiveness of the Company's internal control over financial reporting. Accordingly, we express no such opinion.
Our audits included performing procedures to assess the risks of material misstatement of the financial statements, whether due to error or fraud, and performing procedures that respond to those risks. Such procedures included examining, on a test basis, evidence regarding the amounts and disclosures in the financial statements. Our procedures included confirmation of securities owned as of December 31, 2019 by correspondence with the custodian and others or by other appropriate auditing procedures where replies from others were not received. Our audits also included evaluating the accounting principles used and significant estimates made by management, as well as evaluating the overall presentation of the financial statements. We believe that our audits provide a reasonable basis for our opinion.

We have served as the auditor of one or more Morgan Stanley investment companies since 2000.
Boston, Massachusetts
February 27, 2020
32
Privacy Notice (unaudited) April 2019
FACTS | | WHAT DOES MSIM DO WITH YOUR PERSONAL INFORMATION? | |
Why? | | Financial companies choose how they share your personal information. Federal law gives consumers the right to limit some but not all sharing. Federal law also requires us to tell you how we collect, share, and protect your personal information. Please read this notice carefully to understand what we do. | |
What? | | The types of personal information we collect and share depend on the product or service you have with us. This information can include:
n Social Security number and income
n investment experience and risk tolerance
n checking account number and wire transfer instructions | |
How? | | All financial companies need to share customers' personal information to run their everyday business. In the section below, we list the reasons financial companies can share their customers' personal information; the reasons MSIM chooses to share; and whether you can limit this sharing. | |
Reasons we can share your personal information | | Does MSIM share? | | Can you limit this sharing? | |
For our everyday business purposes —
such as to process your transactions, maintain your account(s), respond to court orders and legal investigations, or report to credit bureaus | | Yes | | No | |
For our marketing purposes —
to offer our products and services to you | | Yes | | No | |
For joint marketing with other financial companies | | No | | We don't share | |
For our affiliates' everyday business purposes —
information about your transactions and experiences | | Yes | | No | |
For our affiliates' everyday business purposes —
information about your creditworthiness | | No | | We don't share | |
For our affiliates to market to you | | No | | We don't share | |
For non-affiliates to market to you | | No | | We don't share | |
Questions? Call toll-free (844) 312-6327 or email: imprivacyinquiries@morganstanley.com
33
Privacy Notice (unaudited) (cont'd) April 2019
Who we are
Who is providing this notice? | | Morgan Stanley Investment Management, Inc. and its affiliated registered investment advisers, registered broker-dealers, and registered and unregistered funds ("MSIM") | |
What we do
How does MSIM protect my personal information? | | To protect your personal information from unauthorized access and use, we use security measures that comply with federal law. These measures include computer safeguards and secured files and buildings. We have policies governing the proper handling of customer information by personnel and requiring third parties that provide support to adhere to appropriate security standards with respect to such information. | |
How does MSIM collect my personal information? | | We collect your personal information, for example, when you
n open an account or make deposits or withdrawals from your account
n buy securities from us or make a wire transfer
n give us your contact information
We also collect your personal information from others, such as credit bureaus, affiliates, or other companies. | |
Why can't I limit all sharing? | | Federal law gives you the right to limit only
n sharing for affiliates' everyday business purposes — information about your creditworthiness
n affiliates from using your information to market to you
n sharing for non-affiliates to market to you
State laws and individual companies may give you additional rights to limit sharing. See below for more on your rights under state law. | |
Definitions
Affiliates | | Companies related by common ownership or control. They can be financial and non-financial companies.
n Our affiliates include companies with a Morgan Stanley name and financial companies such as Morgan Stanley Smith Barney LLC and Morgan Stanley & Co. | |
Non-affiliates | | Companies not related by common ownership or control. They can be financial and non-financial companies.
n MSIM does not share with non-affiliates so they can market to you. | |
Joint marketing | | A formal agreement between non-affiliated financial companies that together market financial products or services to you.
n MSIM doesn't jointly market | |
Other Important Information
Vermont: Except as permitted by law, we will not share personal information we collect about Vermont residents with Non-affiliates unless you provide us with your written consent to share such information.
California: Except as permitted by law, we will not share personal information we collect about California residents with Non-affiliates and we will limit sharing such personal information with our Affiliates to comply with California privacy laws that apply to us.
34
Morgan Stanley Institutional Fund, Inc.
Annual Report — December 31, 2019
Director and Officer Information (unaudited)
Independent Directors:
Name, Birth Year
and Address of
Independent Director | | Position(s)
Held with
Registrant | | Length of
Time Served* | | Principal Occupation(s) During Past 5 Years
and Other Relevant Professional Experience | | Number of
Funds in
Fund Complex
Overseen by
Independent
Director** | | Other Directorships
Held by Independent
Director*** | |
Frank L. Bowman
c/o Perkins Coie LLP
Counsel to the Independent Directors
1155 Avenue of the Americas
New York, NY 10036
Birth Year 1944 | | Director | | Since
August 2006 | | President, Strategic Decisions, LLC (consulting) (since February 2009); Director or Trustee of various Morgan Stanley Funds (since August 2006); Chairperson of the Compliance and Insurance Committee (since October 2015); formerly, Chairperson of the Insurance Sub-Committee of the Compliance and Insurance Committee (2007-2015); served as President and Chief Executive Officer of the Nuclear Energy Institute (policy organization) (February 2005-November 2008); retired as Admiral, U.S. Navy after serving over 38 years on active duty including 8 years as Director of the Naval Nuclear Propulsion Program in the Department of the Navy and the U.S. Department of Energy (1996-2004); served as Chief of Naval Personnel (July 1994-September 1996) and on the Joint Staff as Director of Political Military Affairs (June 1992-July 1994); knighted as Honorary Knight Commander of the Most Excellent Order of the British Empire; awarded the Officier de l'Orde National du Mérite by the French Government; elected to the National Academy of Engineering (2009). | | | 86 | | | Director of Naval and Nuclear Technologies LLP; Director Emeritus of the Armed Services YMCA; Member of the National Security Advisory Council of the Center for U.S. Global Engagement and a member of the CNA Military Advisory Board; Trustee of Fairhaven United Methodist Church; Member of the Board of Advisors of the Dolphin Scholarship Foundation; Director of other various non-profit organizations; formerly, Director of BP p.l.c. (November 2010-May 2019). | |
Kathleen A. Dennis
c/o Perkins Coie LLP
Counsel to the Independent Directors
1155 Avenue of the Americas
New York, NY 10036
Birth Year 1953 | | Director | | Since August 2006 | | President, Cedarwood Associates (mutual fund and investment management consulting) (since July 2006); Chairperson of the Liquidity and Alternatives Sub-Committee of the Investment Committee (since October 2006) and Director or Trustee of various Morgan Stanley Funds (since August 2006); formerly, Senior Managing Director of Victory Capital Management (1993-2006). | | | 86 | | | Director of various non-profit organizations. | |
Nancy C. Everett
c/o Perkins Coie LLP
Counsel to the Independent Directors
1155 Avenue of the Americas
New York, NY 10036
Birth Year 1955 | | Director | | Since January 2015 | | Chief Executive Officer, Virginia Commonwealth University Investment Company (since November 2015); Owner, OBIR, LLC (institutional investment management consulting) (since June 2014); formerly, Managing Director, BlackRock, Inc. (February 2011-December 2013); and Chief Executive Officer, General Motors Asset Management (a/k/a Promark Global Advisors, Inc.) (June 2005-May 2010). | | | 87 | | | Formerly, Member of Virginia Commonwealth University School of Business Foundation (2005-2016); Member of Virginia Commonwealth University Board of Visitors (2013-2015); Member of Committee on Directors for Emerging Markets Growth Fund, Inc. (2007-2010); Chairperson of Performance Equity Management, LLC (2006-2010); and Chairperson, GMAM Absolute Return Strategies Fund, LLC (2006-2010). | |
35
Morgan Stanley Institutional Fund, Inc.
Annual Report — December 31, 2019
Director and Officer Information (unaudited) (cont'd)
Independent Directors: (cont'd)
Name, Birth Year
and Address of
Independent Director | | Position(s)
Held with
Registrant | | Length of
Time Served* | | Principal Occupation(s) During Past 5 Years
and Other Relevant Professional Experience | | Number of
Funds in
Fund Complex
Overseen by
Independent
Director** | | Other Directorships
Held by Independent
Director*** | |
Jakki L. Haussler
c/o Perkins Coie LLP
Counsel to the Independent Directors
1155 Avenue of the Americas
New York, NY 10036
Birth Year 1957 | | Director | | Since January 2015 | | Chairman, Opus Capital Group (since 1996); formerly, Chief Executive Officer, Opus Capital Group (1996-2019); Director, Capvest Venture Fund, LP (May 2000-December 2011); Partner, Adena Ventures, LP (July 1999-December 2010); Director, The Victory Funds (February 2005-July 2008). | | | 87 | | | Director of Service Corporation International and Member, Audit Committee and Investment Committee; Director of Cincinnati Bell Inc. and Member, Audit Committee and Governance and Nominating Committee; Chairman of Northern Kentucky University Member Investment Committee; Member of Chase College of Law Transactional Law Practice Center Board of Advisors; Director of Best Transport; Director of Chase College of Law Board of Visitors; formerly, Member, University of Cincinnati Foundation Investment Committee; Member, Miami University Board of Visitors (2008-2011); Trustee of Victory Funds (2005-2008) and Chairman, Investment Committee (2007-2008) and Member, Service Provider Committee (2005-2008). | |
Dr. Manuel H. Johnson
c/o Johnson Smick International, Inc.
220 I Street, NE — Suite 200
Washington, D.C. 20002
Birth Year 1949 | | Director | | Since July 1991 | | Senior Partner, Johnson Smick International, Inc. (consulting firm); Chairperson of the Investment Committee (since October 2006) and Director or Trustee of various Morgan Stanley Funds (since July 1991); Co-Chairman and a founder of the Group of Seven Council (G7C) (international economic commission); formerly, Chairperson of the Audit Committee (July 1991-September 2006), Vice Chairman of the Board of Governors of the Federal Reserve System and Assistant Secretary of the U.S. Treasury. | | | 86 | | | Director of NVR, Inc. (home construction). | |
Joseph J. Kearns
c/o Perkins Coie LLP
Counsel to the Independent Directors
1155 Avenue of the Americas
New York, NY 10036
Birth Year 1942 | | Director | | Since August 1994 | | Senior Adviser, Kearns & Associates LLC (investment consulting); Chairperson of the Audit Committee (since October 2006) and Director or Trustee of various Morgan Stanley Funds (since August 1994); formerly, Deputy Chairperson of the Audit Committee (July 2003-September 2006) and Chairperson of the Audit Committee of various Morgan Stanley Funds (since August 1994); CFO of the J. Paul Getty Trust. | | | 87 | | | Prior to August 10, 2016, Director of Electro Rent Corporation (equipment leasing); Prior to December 31, 2013, Director of The Ford Family Foundation. | |
36
Morgan Stanley Institutional Fund, Inc.
Annual Report — December 31, 2019
Director and Officer Information (unaudited) (cont'd)
Independent Directors: (cont'd)
Name, Birth Year
and Address of
Independent Director | | Position(s)
Held with
Registrant | | Length of
Time Served* | | Principal Occupation(s) During Past 5 Years
and Other Relevant Professional Experience | | Number of
Funds in
Fund Complex
Overseen by
Independent
Director** | | Other Directorships
Held by Independent
Director*** | |
Michael F. Klein
c/o Perkins Coie LLP
Counsel to the Independent Directors
1155 Avenue of the Americas
New York, NY 10036
Birth Year 1958 | | Director | | Since August 2006 | | Managing Director, Aetos Alternatives Management, LP (since March 2000); Co-President, Aetos Alternatives Management, LP (since January 2004) and Co-Chief Executive Officer of Aetos Alternatives Management, LP (since August 2013); Chairperson of the Fixed Income Sub-Committee of the Investment Committee (since October 2006) and Director or Trustee of various Morgan Stanley Funds (since August 2006); formerly, Managing Director, Morgan Stanley & Co. Inc. and Morgan Stanley Dean Witter Investment Management and President, various Morgan Stanley Funds (June 1998-March 2000); Principal, Morgan Stanley & Co. Inc. and Morgan Stanley Dean Witter Investment Management (August 1997-December 1999). | | | 86 | | | Director of certain investment funds managed or sponsored by Aetos Alternatives Management, LP; Director of Sanitized AG and Sanitized Marketing AG (specialty chemicals). | |
Patricia Maleski
c/o Perkins Coie LLP
Counsel to the Independent Directors
1155 Avenue of the Americas
New York, NY 10036
Birth Year 1960 | | Director | | Since January 2017 | | Managing Director, JPMorgan Asset Management (2004-2016); Oversight and Control Head of Fiduciary and Conflicts of Interest Program (2015-2016); Chief Control Officer-Global Asset Management (2013-2015); President, JPMorgan Funds (2010-2013); Chief Administrative Officer (2004-2013); various other positions including Treasurer and Board Liaison (since 2001). | | | 87 | | | None. | |
Michael E. Nugent
522 Fifth Avenue
New York, NY 10036
Birth Year 1936 | | Chair of the Board and Director | | Chair of the Boards since July 2006 and Director since July 1991 | | Chair of the Boards of various Morgan Stanley Funds (since July 2006); Chairperson of the Governance Committee (since January 2019) and Director or Trustee of various Morgan Stanley Funds (since July 1991); formerly, Chairperson of each of the Closed-End Fund committee (until December 2019) and the Insurance Committee (until July 2006); General Partner, Triumph Capital, L.P. (private investment partnership) (1988-2013). Chairperson of the Equity | | | 86 | | | None. | |
W. Allen Reed
c/o Perkins Coie LLP
Counsel to the Independent Directors
1155 Avenue of the Americas
New York, NY 10036
Birth Year 1947 | | Vice Chair of the Board and Director | | Vice Chair of the Boards since January 2020 and Director since August 2006 | | Sub-Committee of the Investment Committee (since October 2006) and Director or Trustee of various Morgan Stanley Funds (since August 2006); formerly, President and CEO of General Motors Asset Management; Chairman and Chief Executive Officer of the GM Trust Bank and Corporate Vice President of General Motors Corporation (August 1994- December 2005). | | | 86 | | | Formerly, Director of Legg Mason, Inc.; formerly, Director of the Auburn University Foundation (2010-2015). | |
* This is the earliest date the Director began serving the Morgan Stanley Funds. Each Director serves an indefinite term, until his or her successor is elected.
** The Fund Complex includes (as of December 31, 2019) all open-end and closed-end funds (including all of their portfolios) advised by Morgan Stanley Investment Management Inc. (the "Adviser") and any funds that have an adviser that is an affiliated person of the Adviser (including, but not limited to, Morgan Stanley AIP GP LP).
*** This includes any directorships at public companies and registered investment companies held by the Director at any time during the past five years.
37
Morgan Stanley Institutional Fund, Inc.
Annual Report — December 31, 2019
Director and Officer Information (unaudited) (cont'd)
Executive Officers:
Name, Birth Year and Address of
Executive Officer | | Position(s) Held
with
Registrant | | Length of
Time Served* | | Principal Occupation(s) During Past 5 Years | |
John H. Gernon
522 Fifth Avenue
New York, NY 10036
Birth Year 1963 | | President and Principal Executive Officer | | Since September 2013 | | President and Principal Executive Officer of the Equity and Fixed Income Funds and the Morgan Stanley AIP Funds (since September 2013) and the Liquidity Funds and various money market funds (since May 2014) in the Fund Complex; Managing Director of the Adviser; Head of Product (since 2006). | |
Timothy J. Knierim
522 Fifth Avenue
New York, NY 10036
Birth Year 1959 | | Chief Compliance Officer | | Since December 2016 | | Managing Director of the Adviser and various entities affiliated with the Adviser; Chief Compliance Officer of various Morgan Stanley Funds and the Adviser (since December 2016) and Chief Compliance Officer of Morgan Stanley AIP GP LP (since 2014). Formerly, Managing Director and Deputy Chief Compliance Officer of the Adviser (2014-2016); and formerly, Chief Compliance Officer of Prudential Investment Management, Inc. (2007-2014). | |
Francis J. Smith
522 Fifth Avenue
New York, NY 10036
Birth Year 1965 | | Treasurer and Principal Financial Officer | | Treasurer since July 2003 and Principal Financial Officer since September 2002 | | Managing Director of the Adviser and various entities affiliated with the Adviser; Treasurer (since July 2003) and Principal Financial Officer of various Morgan Stanley Funds (since September 2002). | |
Mary E. Mullin
522 Fifth Avenue
New York, NY 10036
Birth Year 1967 | | Secretary | | Since June 1999 | | Managing Director of the Adviser; Secretary of various Morgan Stanley Funds (since June 1999). | |
Michael J. Key
522 Fifth Avenue
New York, NY 10036
Birth Year 1979 | | Vice President | | Since June 2017 | | Vice President of the Equity and Fixed Income Funds, Liquidity Funds, various money market funds and the Morgan Stanley AIP Funds in the Fund Complex (since June 2017); Executive Director of the Adviser; Head of Product Development for Equity and Fixed Income Funds (since August 2013). | |
* This is the earliest date the officer began serving the Morgan Stanley Funds. Each officer serves a one-year term, until his or her successor is elected and qualifies.
38
Morgan Stanley Institutional Fund, Inc.
Annual Report — December 31, 2019
Adviser and Administrator
Morgan Stanley Investment Management Inc.
522 Fifth Avenue
New York, New York 10036
Sub-Advisers
Morgan Stanley Investment Management Limited
25 Cabot Square, Canary Wharf
London, E14 4QA, England
Morgan Stanley Investment Management Company
23 Church Street
16-01 Capital Square, Singapore 049481
Distributor
Morgan Stanley Distribution, Inc.
522 Fifth Avenue
New York, New York 10036
Dividend Disbursing and Transfer Agent
DST Asset Manager Solutions, Inc.
2000 Crown Colony Drive
Quincy, Massachusetts 02169
Custodian
State Street Bank and Trust Company
One Lincoln Street
Boston, Massachusetts 02111
Legal Counsel
Dechert LLP
1095 Avenue of the Americas
New York, New York 10036
Counsel to the Independent Directors
Perkins Coie LLP
1155 Avenue of the Americas
New York, New York 10036
Independent Registered Public Accounting Firm
Ernst & Young LLP
200 Clarendon Street
Boston, Massachusetts 02116
Reporting to Shareholders
Each Morgan Stanley fund provides a complete schedule of portfolio holdings in its Semi-Annual and the Annual Reports within 60 days of the end of the fund's second and fourth fiscal quarters. The Semi-Annual and Annual Reports are filed electronically with the Securities and Exchange Commission ("SEC") on Form N-CSRS and Form N-CSR, respectively. Morgan Stanley also delivers the Semi-Annual and Annual Reports to fund shareholders and makes these reports available on its public website, www.morganstanley.com/im/shareholderreports. Each Morgan Stanley non-money market fund also files a complete schedule of portfolio holdings with the SEC for the fund's first and third fiscal quarters as an attachment to Form N-PORT. Morgan Stanley does not deliver the reports for the first and third fiscal quarters to shareholders, nor are the reports posted to the Morgan Stanley public website. However, the holdings for each money market fund are posted to the Morgan Stanley public website. You may obtain the Form N-PORT filings (as well as the Form N-CSR and N-CSRS filings) by accessing the SEC's website, www.sec.gov. You can also request copies of these materials, upon payment of a duplicating fee, by electronic request at the SEC's email address (publicinfo@sec.gov).
Proxy Voting Policies and Procedures and Proxy Voting Record
You may obtain a copy of the Company's Proxy Voting Policy and Procedures and information regarding how the Company voted proxies relating to portfolio securities during the most recent twelve-month period ended June 30, without charge, upon request, by calling toll free 1 (800) 548-7786 or by visiting our website at www.morganstanley.com/im/shareholderreports. This information is also available on the SEC's website at www.sec.gov.
This report is authorized for distribution only when preceded or accompanied by a prospectus or summary prospectus of the applicable fund of Morgan Stanley Institutional Fund, Inc., which describes in detail the fund's investment policies, risks, fees and expenses. Please read the prospectus carefully before you invest or send money. For additional information, including information regarding the investments comprising the Fund, please visit our website at www.morganstanley.com/im/shareholderreports or call toll free 1 (800) 548-7786.
39
Printed in U.S.A.
This Report has been prepared for shareholders and may be distributed to others only if preceded or accompanied by a current prospectus.
Morgan Stanley Investment Management Inc.
522 Fifth Avenue
New York, New York 10036
© 2020 Morgan Stanley. Morgan Stanley Distribution, Inc.

IFIEMEDANN
2918220 EXP. 02.28.21

Morgan Stanley Institutional Fund, Inc.
Emerging Markets Breakout Nations Portfolio
Annual Report
December 31, 2019
Beginning on January 1, 2021, as permitted by regulations adopted by the Securities and Exchange Commission ("SEC"), paper copies of the Fund's Annual and Semi-Annual Reports to Shareholders ("Shareholder Reports") will no longer be sent by mail, unless you specifically request paper copies of the Shareholder Reports from the Fund or from your financial intermediary, such as a broker-dealer or a bank. Instead, the Shareholder Reports will be made available on the Fund's website, https://www.morganstanley.com/im/shareholderreports and you will be notified by mail each time a Shareholder Report is posted and provided with a website link to access the Shareholder Report. If you already elected to receive Shareholder Reports electronically, you will not be affected by this change and you need not take any action. You may elect to receive Shareholder Reports and other communications from the Fund electronically anytime by contacting your financial intermediary or, if you are a direct investor, please follow the instructions on the envelope.
Beginning on January 1, 2019, you may elect to receive all future Shareholder Reports in paper free of charge. If you invest through a financial intermediary, you can contact your financial intermediary to request that you continue to receive paper copies of your Shareholder Reports. If you invest directly with the Fund, please follow the instructions on the envelope to let the Fund know you wish to continue receiving paper copies of your Shareholder Reports. Your election to receive Shareholder Reports in paper will apply to all funds held in your account if you invest through your financial intermediary or all funds held with the fund complex if you invest directly with a fund.

Morgan Stanley Institutional Fund, Inc.
Annual Report — December 31, 2019
Shareholders' Letter | | | 2 | | |
Expense Example | | | 3 | | |
Investment Overview | | | 4 | | |
Portfolio of Investments | | | 6 | | |
Statement of Assets and Liabilities | | | 9 | | �� |
Statement of Operations | | | 10 | | |
Statements of Changes in Net Assets | | | 11 | | |
Financial Highlights | | | 12 | | |
Notes to Financial Statements | | | 16 | | |
Report of Independent Registered Public Accounting Firm | | | 25 | | |
Federal Tax Notice | | | 26 | | |
Privacy Notice | | | 27 | | |
Director and Officer Information | | | 29 | | |
This report is authorized for distribution only when preceded or accompanied by a prospectus or summary prospectus of the applicable Fund of Morgan Stanley Institutional Fund, Inc. To receive a prospectus and/or statement of additional information ("SAI"), which contains more complete information such as investment objectives, charges, expenses, policies for voting proxies, risk considerations and describes in detail each of the Fund's investment policies to the prospective investor, please call toll free 1 (800) 548-7786. Please read the prospectuses carefully before you invest or send money.
Additionally, you can access information about the Fund, including performance, characteristics and investment team commentary, through Morgan Stanley Investment Management's website: www.morganstanley.com/im/shareholderreports.
Market forecasts provided in this report may not necessarily come to pass. There is no guarantee that any sectors mentioned will continue to perform as discussed herein or that securities in such sectors will be held by the Fund in the future. There is no assurance that a fund will achieve its investment objective. Funds are subject to market risk, which is the possibility that market values of securities owned by the Fund will decline and, therefore, the value of the Fund's shares may be less than what you paid for them. Accordingly, you can lose money investing in this Fund. Please see the prospectus for more complete information on investment risks.
1
Morgan Stanley Institutional Fund, Inc.
Annual Report — December 31, 2019
Shareholders' Letter (unaudited)
Dear Shareholders,
We are pleased to provide this Annual Report, in which you will learn how your investment in Emerging Markets Breakout Nations Portfolio (the "Fund") performed during the latest twelve-month period.
Morgan Stanley Investment Management is a client-centric, investor-led organization. Our global presence, intellectual capital, and breadth of products and services enable us to partner with investors to meet the evolving challenges of today's financial markets. We aim to deliver superior investment service and to empower our clients to make the informed decisions that help them reach their investment goals.
As always, we thank you for selecting Morgan Stanley Investment Management, and look forward to working with you in the months and years ahead.
Sincerely,

John H. Gernon
President and Principal Executive Officer
January 2020
2
Morgan Stanley Institutional Fund, Inc.
Annual Report — December 31, 2019
Expense Example (unaudited)
Emerging Markets Breakout Nations Portfolio
As a shareholder of the Fund, you incur two types of costs: (1) transactional costs, including redemption fees; and (2) ongoing costs, which may include advisory fees, administration fees, distribution and shareholder services fees and other Fund expenses. This example is intended to help you understand your ongoing costs (in dollars) of investing in the Fund and to compare these costs with the ongoing costs of investing in other mutual funds.
This example is based on an investment of $1,000 invested at the beginning of the six-month period ended December 31, 2019 and held for the entire six-month period.
Actual Expenses
The table below provides information about actual account values and actual expenses. You may use the information in this table, together with the amount you invested, to estimate the expenses that you paid over the period. Simply divide your account value by $1,000 (for example, an $8,600 account value divided by $1,000 = 8.6), then multiply the result by the number in the table under the heading entitled "Actual Expenses Paid During Period" to estimate the expenses you paid on your account during this period.
Hypothetical Example for Comparison Purposes
The table below provides information about hypothetical account values and hypothetical expenses based on the Fund's actual expense ratio and an assumed rate of return of 5% per year before expenses, which is not the Fund's actual return. The hypothetical account values and expenses may not be used to estimate the actual ending account balance or expenses you paid for the period. You may use this information to compare the ongoing costs of investing in the Fund and other funds. To do so, compare this 5% hypothetical example with the 5% hypothetical examples that appear in the shareholder reports of the other funds.
Please note that the expenses shown in the table are meant to highlight your ongoing costs only and do not reflect any transactional costs, such as sales charges (loads) and redemption fees. Therefore, the information for each class in the table is useful in comparing ongoing costs only, and will not help you determine the relative total costs of owning different funds. In addition, if these transactional costs were included, your costs would have been higher.
| | | Beginning
Account
Value
7/1/19 | | Actual Ending
Account
Value
12/31/19 | | Hypothetical
Ending Account
Value | | Actual
Expenses
Paid
During
Period* | | Hypothetical
Expenses Paid
During Period* | | Net
Expense
Ratio
During
Period** | |
Emerging Markets Breakout Nations Portfolio Class I | | $ | 1,000.00 | | | $ | 1,009.30 | | | $ | 1,019.56 | | | $ | 5.67 | | | $ | 5.70 | | | | 1.12 | % | |
Emerging Markets Breakout Nations Portfolio Class A | | | 1,000.00 | | | | 1,007.20 | | | | 1,017.49 | | | | 7.74 | | | | 7.78 | | | | 1.53 | | |
Emerging Markets Breakout Nations Portfolio Class C | | | 1,000.00 | | | | 1,002.90 | | | | 1,013.71 | | | | 11.51 | | | | 11.57 | | | | 2.28 | | |
Emerging Markets Breakout Nations Portfolio Class IS | | | 1,000.00 | | | | 1,008.70 | | | | 1,019.76 | | | | 5.47 | | | | 5.50 | | | | 1.08 | | |
* Expenses are calculated using each Fund Class' annualized net expense ratio (as disclosed), multiplied by the average account value over the period and multiplied by 184/365 (to reflect the most recent one-half year period).
** Annualized.
3
Morgan Stanley Institutional Fund, Inc.
Annual Report — December 31, 2019
Investment Overview (unaudited)
Emerging Markets Breakout Nations Portfolio
The Fund seeks long-term capital appreciation.
Performance
For the fiscal year ended December 31, 2019, the Fund's Class I shares had a total return based on net asset value and reinvestment of distributions per share of 11.72%, net of fees. The Fund's Class I shares underperformed the Fund's new benchmark, the MSCI Emerging Markets ex China Net Index (the "Index"), which returned 16.21%, and underperformed the Fund's old benchmark, MSCI Emerging Markets Net Index, which returned 18.42%. Effective January 1, 2019, the primary benchmark changed from the MSCI Emerging Markets Net Index to the MSCI Emerging Markets ex China Net Index.
Factors Affecting Performance
• During the year, top performing countries in the Index included Russia (+51%), Greece (+43%), Egypt (+42%), Taiwan (+36%) and Colombia (+31%). Argentina (-23%), Chile (-17%), Poland (-6%) and Saudi Arabia (-5%) underperformed the Index.
• Top contributors to the Fund's relative performance were the overweight allocation to Egypt, along with the allocation to China and our focus on "New China." The Fund sometimes uses derivative instruments to manage certain market or currency exposures. This contributed to performance in the period.
• The Fund's zero weight allocations to Saudi Arabia, Korea, Thailand and Qatar contributed to relative performance as these markets, which are included in the Index, underperformed during the period. The underweight allocation to and selection in South Africa was also positive for relative returns.
• Having no exposure to Taiwan and Russia, overweight allocations to Argentina and Poland, and overweight allocations to and stock selection in Peru and Chile hampered relative performance returns.
• The Fund sometimes uses derivative instruments to manage certain market or currency exposures. This contributed to performance in the period.
Management Strategies
• As de-globalization, debt accumulation, declining productivity and demographic pressures keep global growth constrained, equity investors are increasingly
rewarding those emerging markets countries and companies that can generate accelerating growth. To invest in a world economy slowed by these factors, we think investors need to adjust downward their expectations of what is considered "fast" growth and focus on the most resilient and promising economies. For countries with average incomes under $5,000, we think that 5% is the new 7%; for those with income up to $15,000, 3% to 4% should be considered successful growth. With expectations thus recalibrated, we are focusing our portfolio on economies largely insulated against the "four Ds." This includes countries that still have growing populations (such as India, the Philippines and Mexico) or strong domestic markets relatively immune to trade wars (Brazil, India, Indonesia and Egypt) or low debt burdens and solid banks (Mexico, Hungary, India, Indonesia and Egypt).
• In our portfolio we remain invested in good quality, growth-oriented companies capable of sustaining or expanding their earnings as a result of healthy or improving domestic demand and resistance to declines in global trade. Our aggregate sector overweights are in the financials and consumer staples — which we believe should benefit from the economic recovery in primarily domestic demand-driven countries with inexpensive currencies.

* Minimum Investment for Class I shares
** Commenced Operations on December 15, 2016.
In accordance with SEC regulations, the Fund's performance shown assumes that all recurring fees (including management fees) were deducted and all dividends and distributions were reinvested. The performance of Class A, C and IS shares will vary from the performance of Class I shares and will be negatively impacted by additional fees assessed to those classes (if applicable).
4
Morgan Stanley Institutional Fund, Inc.
Annual Report — December 31, 2019
Investment Overview (unaudited) (cont'd)
Emerging Markets Breakout Nations Portfolio
Performance Compared to the MSCI Emerging Markets ex China Net Index(1), the MSCI Emerging Markets/MSCI Emerging Markets ex China Blended Index(2), the MSCI Emerging Markets Net Index(3) and the Lipper Emerging Markets Funds Index(4)
| | | Period Ended December 31, 2019
Total Returns(5) | |
| | | | | Average Annual | |
| | | One
Year | | Five
Years | | Ten
Years | | Since
Inception(7) | |
Fund — Class I Shares
w/o sales charges(6) | | | 11.72 | % | | | — | | | | — | | | | 4.73 | % | |
Fund — Class A Shares
w/o sales charges(6) | | | 11.23 | | | | — | | | | — | | | | 4.28 | | |
Fund — Class A Shares with
maximum 5.25% sales charges(6) | | | 5.35 | | | | — | | | | — | | | | 2.46 | | |
Fund — Class C Shares
w/o sales charges(6) | | | 10.39 | | | | — | | | | — | | | | 3.49 | | |
Fund — Class C Shares with
maximum 1.00% deferred
sales charges(6) | | | 9.39 | | | | — | | | | — | | | | 3.49 | | |
Fund — Class IS Shares
w/o sales charges(6) | | | 11.76 | | | | — | | | | — | | | | 4.75 | | |
MSCI Emerging Markets
ex China Net Index | | | 16.21 | | | | — | | | | — | | | | 10.65 | | |
MSCI Emerging Markets/
MSCI Emerging Markets ex
China Blended Index | | | 16.21 | | | | — | | | | — | | | | 10.96 | | |
MSCI Emerging Markets
Net Index | | | 18.42 | | | | — | | | | — | | | | 11.65 | | |
Lipper Emerging Markets
Funds Index | | | 21.13 | | | | — | | | | — | | | | 11.55 | | |
Performance data quoted represents past performance, which is no guarantee of future results, and current performance may be lower or higher than the figures shown. Performance assumes that all dividends and distributions, if any, were reinvested. For the most recent month-end performance figures, please visit www.morganstanley.com/im/shareholderreports. Investment return and principal value will fluctuate so that Fund shares, when redeemed, may be worth more or less than their original cost. Total returns do not reflect the deduction of taxes that a shareholder would pay on Fund distributions or the redemption of Fund shares. Performance of share classes will vary due to difference in sales charges and expenses.
(1) The MSCI Emerging Markets ex China Net Index is a free float-adjusted market capitalization weighted index that is designed to measure equity market performance of emerging markets excluding China. The term "free float" represents the portion of shares outstanding that are deemed to be available for purchase in the public equity markets by investors. The performance of the Index is listed in U.S. dollars and assumes reinvestment of net dividends. Net total return indices reinvest dividends after the deduction of withholding taxes, using (for international indices) a tax rate applicable to non-resident institutional investors who do not benefit from double taxation treaties. The Index is unmanaged and its returns do not include any sales charges or fees. Such costs would lower performance. It is not possible to invest directly in an index. The
Board of Directors approved to change the Fund's primary benchmark from the MSCI Emerging Markets Net Index to the MSCI Emerging Markets ex China Net Index effective January 1, 2019 because of investment strategy change.
(2) The MSCI Emerging Markets/ MSCI Emerging Markets ex China Blended Index is performance linked benchmark of the old and new benchmark of the Fund. The old benchmark represented by MSCI Emerging Markets Net Index from the Fund's inception to December 31, 2018 and the new benchmark represented by the MSCI Emerging Markets ex China Net Index for periods thereafter. The Index is unmanaged and its returns do not include any sales charges or fees. Such costs would lower performance. It is not possible to invest directly in an index.
(3) The MSCI Emerging Markets Net Index is a free float-adjusted market capitalization weighted index that is designed to measure equity market performance of emerging markets. The term "free float" represents the portion of shares outstanding that are deemed to be available for purchase in the public equity markets by investors. The MSCI Emerging Markets Net Index currently consists of 26 emerging market country indices. The performance of the Index is listed in U.S. dollars and assumes reinvestment of net dividends. Net total return indices reinvest dividends after the deduction of withholding taxes, using (for international indices) a tax rate applicable to non-resident institutional investors who do not benefit from double taxation treaties. The Index is unmanaged and its returns do not include any sales charges or fees. Such costs would lower performance. It is not possible to invest directly in an index.
(4) The Lipper Emerging Markets Funds Index is an equally weighted performance index of the largest qualifying funds (based on net assets) in the Lipper Emerging Markets Funds classification. The Index, which is adjusted for capital gains distributions and income dividends, is unmanaged and should not be considered an investment. There are currently 30 funds represented in this Index. As of the date of this report, the Fund was in the Lipper Emerging Markets Funds classification.
(5) Total returns for the Fund reflect fees waived and expenses reimbursed, if applicable, by the Adviser (as defined herein). Without such waivers and reimbursements, total returns would have been lower.
(6) Commenced operations on December 15, 2016.
(7) For comparative purposes, average annual since inception returns listed for the Indexes refer to the inception date of the Fund, not the inception of the Index.
5
Morgan Stanley Institutional Fund, Inc.
Annual Report — December 31, 2019
Portfolio of Investments
Emerging Markets Breakout Nations Portfolio
| | | Shares | | Value
(000) | |
Common Stocks (77.9%) | |
Argentina (2.5%) | |
Banco Macro SA ADR | | | 854 | | | $ | 31 | | |
Globant SA (a) | | | 372 | | | | 39 | | |
Grupo Financiero Galicia SA ADR | | | 1,855 | | | | 30 | | |
Grupo Supervielle SA ADR | | | 874 | | | | 3 | | |
Pampa Energia SA ADR (a) | | | 592 | | | | 10 | | |
YPF SA ADR | | | 1,887 | | | | 22 | | |
| | | | 135 | | |
Brazil (16.3%) | |
Ambev SA | | | 24,763 | | | | 115 | | |
Atacadao SA | | | 15,294 | | | | 89 | | |
B3 SA - Brasil Bolsa Balcao | | | 10,255 | | | | 110 | | |
Hapvida Participacoes e Investimentos SA | | | 4,522 | | | | 72 | | |
Itau Unibanco Holding SA (Preference) | | | 13,643 | | | | 126 | | |
Lojas Renner SA | | | 7,198 | | | | 101 | | |
Petroleo Brasileiro SA | | | 10,973 | | | | 88 | | |
Petroleo Brasileiro SA (Preference) | | | 15,174 | | | | 115 | | |
Telefonica Brasil SA (Preference) | | | 4,600 | | | | 67 | | |
| | | | 883 | | |
Chile (1.2%) | |
Banco Santander Chile | | | 1,164,068 | | | | 66 | | |
China (12.2%) | |
Alibaba Group Holding Ltd. ADR (a) | | | 796 | | | | 169 | | |
China Resources Beer Holdings Co., Ltd. (b) | | | 4,000 | | | | 22 | | |
CSPC Pharmaceutical Group Ltd. (b) | | | 16,000 | | | | 38 | | |
Kweichow Moutai Co., Ltd., Class A | | | 200 | | | | 34 | | |
New Oriental Education & Technology
Group, Inc. ADR (a) | | | 354 | | | | 43 | | |
Sinopharm Group Co., Ltd. H Shares (b) | | | 1,600 | | | | 6 | | |
TAL Education Group ADR (a) | | | 887 | | | | 43 | | |
Tencent Holdings Ltd. (b) | | | 6,400 | | | | 308 | | |
| | | | 663 | | |
Egypt (5.2%) | |
Commercial International Bank Egypt SAE | | | 5,226 | | | | 27 | | |
Commercial International Bank Egypt SAE GDR | | | 26,345 | | | | 135 | | |
Egyptian Financial Group-Hermes Holding Co. | | | 29,948 | | | | 31 | | |
Egyptian Financial Group-Hermes Holding Co. GDR | | | 23,239 | | | | 51 | | |
Integrated Diagnostics Holdings PLC | | | 10,325 | | | | 41 | | |
| | | | 285 | | |
India (4.2%) | |
HDFC Bank Ltd. ADR | | | 558 | | | | 35 | | |
ICICI Bank Ltd. ADR | | | 8,639 | | | | 131 | | |
Larsen & Toubro Ltd. GDR | | | 3,314 | | | | 61 | | |
| | | | 227 | | |
Indonesia (7.3%) | |
Astra International Tbk PT | | | 127,900 | | | | 64 | | |
Bank Central Asia Tbk PT | | | 75,000 | | | | 180 | | |
Bank Mandiri Persero Tbk PT | | | 52,600 | | | | 29 | | |
Bank Rakyat Indonesia Persero Tbk PT | | | 243,000 | | | | 77 | | |
Telekomunikasi Indonesia Persero Tbk PT | | | 172,200 | | | | 49 | | |
| | | | 399 | | |
| | | Shares | | Value
(000) | |
Malaysia (1.3%) | |
Malayan Banking Bhd | | | 17,440 | | | $ | 37 | | |
Public Bank Bhd | | | 6,900 | | | | 33 | | |
| | | | 70 | | |
Mexico (5.2%) | |
Alsea SAB de CV (a) | | | 16,998 | | | | 45 | | |
Grupo Financiero Banorte SAB de CV Series O | | | 16,526 | | | | 92 | | |
Infraestructura Energetica Nova SAB de CV | | | 8,023 | | | | 38 | | |
Wal-Mart de Mexico SAB de CV | | | 38,389 | | | | 110 | | |
| | | | 285 | | |
Pakistan (1.1%) | |
MCB Bank Ltd. | | | 44,891 | | | | 61 | | |
Peru (4.7%) | |
Cia de Minas Buenaventura SAA ADR | | | 5,030 | | | | 76 | | |
Credicorp Ltd. | | | 840 | | | | 179 | | |
| | | | 255 | | |
Philippines (2.4%) | |
Ayala Land, Inc. | | | 62,100 | | | | 56 | | |
Jollibee Foods Corp. | | | 12,390 | | | | 53 | | |
SM Investments Corp. | | | 940 | | | | 19 | | |
| | | | 128 | | |
Poland (3.4%) | |
Jeronimo Martins SGPS SA | | | 2,673 | | | | 44 | | |
LPP SA | | | 31 | | | | 72 | | |
Santander Bank Polska SA | | | 841 | | | | 68 | | |
| | | | 184 | | |
South Africa (4.9%) | |
Bidvest Group Ltd. (The) | | | 3,433 | | | | 50 | | |
Capitec Bank Holdings Ltd. | | | 462 | | | | 48 | | |
Clicks Group Ltd. | | | 2,720 | | | | 50 | | |
Nedbank Group Ltd. | | | 2,099 | | | | 32 | | |
Reunert Ltd. | | | 4,257 | | | | 22 | | |
Sanlam Ltd. | | | 11,665 | | | | 66 | | |
| | | | 268 | | |
Turkey (3.1%) | |
Akbank T.A.S. (a) | | | 51,276 | | | | 70 | | |
Tupras Turkiye Petrol Rafinerileri AS | | | 1,389 | | | | 30 | | |
Turkiye Garanti Bankasi AS (a) | | | 38,072 | | | | 71 | | |
| | | | 171 | | |
Vietnam (2.9%) | |
Masan Group Corp. (a) | | | 7,380 | | | | 18 | | |
Sai Gon Cargo Service Corp. | | | 2,060 | | | | 11 | | |
Saigon Beer Alcohol Beverage Corp. | | | 2,530 | | | | 25 | | |
Vietjet Aviation JSC | | | 3,858 | | | | 24 | | |
Vincom Retail JSC | | | 26,503 | | | | 39 | | |
Vinhomes JSC | | | 10,380 | | | | 38 | | |
| | | | 155 | | |
Total Common Stocks (Cost $3,826) | | | 4,235 | | |
The accompanying notes are an integral part of the financial statements.
6
Morgan Stanley Institutional Fund, Inc.
Annual Report — December 31, 2019
Portfolio of Investments (cont'd)
Emerging Markets Breakout Nations Portfolio
| | | Shares | | Value
(000) | |
Investment Companies (6.3%) | |
India (5.3%) | |
iShares MSCI India ETF | | | 8,204 | | | $ | 288 | | |
Pakistan (1.0%) | |
Global X MSCI Pakistan ETF | | | 6,701 | | | | 53 | | |
Total Investment Companies
(Cost $318) | | | 341 | | |
Short-Term Investment (14.3%) | |
Investment Company (14.3%) | |
Morgan Stanley Institutional Liquidity
Funds — Government Portfolio —
Institutional Class (See Note G)
(Cost $777) | | | 777,031 | | | | 777 | | |
Total Investments (98.5%)
(Cost $4,921) (c)(d)(e) | | | 5,353 | | |
Other Assets in Excess of Liabilities (1.5%) | | | 80 | | |
Net Assets (100.0%) | | $ | 5,433 | | |
Country assignments and aggregations are based generally on third party vendor classifications and information, and may be different from the assignments and aggregations under the policies set forth in the Fund's prospectus and/or statement of additional information relating to geographic classifications.
(a) Non-income producing security.
(b) Security trades on the Hong Kong exchange.
(c) Securities are available for collateral in connection with an open foreign currency forward exchange contract and futures contracts.
(d) The approximate fair value and percentage of net assets, $1,616,000 and 29.7%, respectively, represent the securities that have been fair valued under the fair valuation policy for international investments as described in Note A-1 within the Notes to the Financial Statements.
(e) At December 31, 2019, the aggregate cost for federal income tax purposes is approximately $4,931,000. The aggregate gross unrealized appreciation is approximately $641,000 and the aggregate gross unrealized depreciation is approximately $218,000, resulting in net unrealized appreciation of approximately $423,000.
ADR American Depositary Receipt.
ETF Exchange Traded Fund.
GDR Global Depositary Receipt.
Foreign Currency Forward Exchange Contract:
The Fund had the following foreign currency forward exchange contract open at December 31, 2019:
Counterparty | | Contracts to
Deliver
(000) | | In Exchange
For
(000) | | Delivery
Date | | Unrealized
Appreciation
(000) | |
JPMorgan Chase Bank NA | | $ | 60 | | | INR | 4,325 | | | 1/9/20 | | $ | — | @ | |
Futures Contracts:
The Fund had the following futures contracts open at December 31, 2019:
| | | Number
of
Contracts | | Expiration
Date | | Notional
Amount
(000) | | Value
(000) | | Unrealized
Appreciation
(Depreciation)
(000) | |
Long: | |
MSCI Emerging Market
E Mini (United States) | | | 3 | | | Mar-20 | | $ | — | @ | | $ | 168 | | | $ | 5 | | |
SGX NIFTY 50 (Singapore) | | | 26 | | | Jan-20 | | | — | @ | | | 637 | | | | (5 | ) | |
| | | | | | | | | | | $ | — | @ | |
@ — Value is less than $500.
INR — Indian Rupee
USD — United States Dollar
SGD — Singapore Currency
The accompanying notes are an integral part of the financial statements.
7
Morgan Stanley Institutional Fund, Inc.
Annual Report — December 31, 2019
Portfolio of Investments (cont'd)
Emerging Markets Breakout Nations Portfolio
Portfolio Composition
Classification | | Percentage of
Total Investments | |
Other* | | | 38.7 | % | |
Banks | | | 29.2 | | |
Short-Term Investments | | | 14.5 | | |
Investment Companies | | | 6.4 | | |
Interactive Media & Services | | | 5.7 | | |
Food & Staples Retailing | | | 5.5 | | |
Total Investments | | | 100.0 | %** | |
* Industries and/or investment types representing less than 5% of total investments.
** Does not include an open long futures contracts with a value of approximately $805,000 with unrealized depreciation of less than $500. Also does not include an open foreign currency forward exchange contract with total unrealized depreciation of less than $500.
The accompanying notes are an integral part of the financial statements.
8
Morgan Stanley Institutional Fund, Inc.
Annual Report — December 31, 2019
Emerging Markets Breakout Nations Portfolio
Statement of Assets and Liabilities | | December 31, 2019
(000) | |
Assets: | |
Investments in Securities of Unaffiliated Issuers, at Value (Cost $4,144) | | $ | 4,576 | | |
Investment in Security of Affiliated Issuer, at Value (Cost $777) | | | 777 | | |
Total Investments in Securities, at Value (Cost $4,921) | | | 5,353 | | |
Foreign Currency, at Value (Cost $15) | | | 15 | | |
Receivable for Variation Margin on Futures Contracts | | | 50 | | |
Due from Adviser | | | 40 | | |
Receivable for Investments Sold | | | 7 | | |
Dividends Receivable | | | 4 | | |
Tax Reclaim Receivable | | | 1 | | |
Receivable from Affiliate | | | 1 | | |
Unrealized Appreciation on Foreign Currency Forward Exchange Contract | | | — | @ | |
Other Assets | | | 39 | | |
Total Assets | | | 5,510 | | |
Liabilities: | |
Payable for Professional Fees | | | 60 | | |
Payable for Custodian Fees | | | 3 | | |
Payable for Investments Purchased | | | 3 | | |
Payable for Transfer Agency Fees — Class I | | | — | @ | |
Payable for Transfer Agency Fees — Class A | | | — | @ | |
Payable for Transfer Agency Fees — Class C | | | — | @ | |
Payable for Transfer Agency Fees — Class IS | | | — | @ | |
Deferred Capital Gain Country Tax | | | 1 | | |
Payable for Shareholder Services Fees — Class A | | | — | @ | |
Payable for Distribution and Shareholder Services Fees — Class C | | | — | @ | |
Payable for Administration Fees | | | — | @ | |
Other Liabilities | | | 10 | | |
Total Liabilities | | | 77 | | |
Net Assets | | $ | 5,433 | | |
Net Assets Consist of: | |
Paid-in-Capital | | $ | 5,037 | | |
Total Distributable Earnings | | | 396 | | |
Net Assets | | $ | 5,433 | | |
CLASS I: | |
Net Assets | | $ | 5,400 | | |
| Shares Outstanding $0.001 par value shares of beneficial interest (unlimited shares authorized) (not in 000's) | | | 501,148 | | |
Net Asset Value, Offering and Redemption Price Per Share | | $ | 10.78 | | |
CLASS A: | |
Net Assets | | $ | 11 | | |
| Shares Outstanding $0.001 par value shares of beneficial interest (unlimited shares authorized) (not in 000's) | | | 1,004 | | |
Net Asset Value, Redemption Price Per Share | | $ | 10.72 | | |
Maximum Sales Load | | | 5.25 | % | |
Maximum Sales Charge | | $ | 0.59 | | |
Maximum Offering Price Per Share | | $ | 11.31 | | |
CLASS C: | |
Net Assets | | $ | 11 | | |
| Shares Outstanding $0.001 par value shares of beneficial interest (unlimited shares authorized) (not in 000's) | | | 1,000 | | |
Net Asset Value, Offering and Redemption Price Per Share | | $ | 10.52 | | |
CLASS IS: | |
Net Assets | | $ | 11 | | |
| Shares Outstanding $0.001 par value shares of beneficial interest (unlimited shares authorized) (not in 000's) | | | 1,009 | | |
Net Asset Value, Offering and Redemption Price Per Share | | $ | 10.78 | | |
@ Amount is less than $500.
The accompanying notes are an integral part of the financial statements.
9
Morgan Stanley Institutional Fund, Inc.
Annual Report — December 31, 2019
Emerging Markets Breakout Nations Portfolio
Statement of Operations | | Year Ended
December 31, 2019
(000) | |
Investment Income: | |
Dividends from Securities of Unaffiliated Issuers (Net of $10 of Foreign Taxes Withheld) | | $ | 92 | | |
Dividends from Security of Affiliated Issuer (Note G) | | | 14 | | |
Total Investment Income | | | 106 | | |
Expenses: | |
Professional Fees | | | 132 | | |
Registration Fees | | | 55 | | |
Advisory Fees (Note B) | | | 47 | | |
Custodian Fees (Note F) | | | 35 | | |
Shareholder Reporting Fees | | | 17 | | |
Transfer Agency Fees — Class I (Note E) | | | 2 | | |
Transfer Agency Fees — Class A (Note E) | | | 2 | | |
Transfer Agency Fees — Class C (Note E) | | | 2 | | |
Transfer Agency Fees — Class IS (Note E) | | | 2 | | |
Pricing Fees | | | 5 | | |
Administration Fees (Note C) | | | 4 | | |
Directors' Fees and Expenses | | | 4 | | |
Shareholder Services Fees — Class A (Note D) | | | — | @ | |
Distribution and Shareholder Services Fees — Class C (Note D) | | | — | @ | |
Other Expenses | | | 23 | | |
Total Expenses | | | 330 | | |
Expenses Reimbursed by Adviser (Note B) | | | (218 | ) | |
Waiver of Advisory Fees (Note B) | | | (47 | ) | |
Reimbursement of Class Specific Expenses — Class A (Note B) | | | (2 | ) | |
Reimbursement of Class Specific Expenses — Class C (Note B) | | | (2 | ) | |
Reimbursement of Class Specific Expenses — Class IS (Note B) | | | (2 | ) | |
Rebate from Morgan Stanley Affiliate (Note G) | | | (1 | ) | |
Net Expenses | | | 58 | | |
Net Investment Income | | | 48 | | |
Realized Gain (Loss): | |
Investments Sold | | | (11 | ) | |
Foreign Currency Forward Exchange Contracts | | | (13 | ) | |
Foreign Currency Translation | | | (1 | ) | |
Futures Contracts | | | 43 | | |
Net Realized Gain | | | 18 | | |
Change in Unrealized Appreciation (Depreciation): | |
Investments (Net of Increase in Deferred Capital Gain Country Tax of $1) | | | 494 | | |
Foreign Currency Forward Exchange Contracts | | | 7 | | |
Foreign Currency Translation | | | — | @ | |
Futures Contracts | | | 5 | | |
Net Change in Unrealized Appreciation (Depreciation) | | | 506 | | |
Net Realized Gain and Change in Unrealized Appreciation (Depreciation) | | | 524 | | |
Net Increase in Net Assets Resulting from Operations | | $ | 572 | | |
@ Amount is less than $500.
The accompanying notes are an integral part of the financial statements.
10
Morgan Stanley Institutional Fund, Inc.
Annual Report — December 31, 2019
Emerging Markets Breakout Nations Portfolio
Statements of Changes in Net Assets | | Year Ended
December 31, 2019
(000) | | Year Ended
December 31, 2018
(000) | |
Increase (Decrease) in Net Assets: | |
Operations: | |
Net Investment Income | | $ | 48 | | | $ | 29 | | |
Net Realized Gain (Loss) | | | 18 | | | | (78 | ) | |
Net Change in Unrealized Appreciation (Depreciation) | | | 506 | | | | (966 | ) | |
Net Increase (Decrease) in Net Assets Resulting from Operations | | | 572 | | | | (1,015 | ) | |
Dividends and Distributions to Shareholders: | |
Class I | | | (44 | ) | | | (77 | ) | |
Class A | | | (— | @) | | | (— | @) | |
Class C | | | — | | | | (— | @) | |
Class IS | | | (— | @) | | | (— | @) | |
Total Dividends and Distributions to Shareholders | | | (44 | ) | | | (77 | ) | |
Capital Share Transactions:(1) | |
Class I: | |
Distributions Reinvested | | | 44 | | | | — | | |
Class A: | |
Distributions Reinvested | | | — | @ | | | — | | |
Class IS: | |
Distributions Reinvested | | | — | @ | | | — | | |
Net Increase in Net Assets Resulting from Capital Share Transactions | | | 44 | | | | — | | |
Total Increase (Decrease) in Net Assets | | | 572 | | | | (1,092 | ) | |
Net Assets: | |
Beginning of Period | | | 4,861 | | | | 5,953 | | |
End of Period | | $ | 5,433 | | | $ | 4,861 | | |
(1) Capital Share Transactions: | |
Class I: | |
Shares Issued on Distributions Reinvested | | | 4 | | | | — | | |
Class A: | |
Shares Issued on Distributions Reinvested | | | — | @@ | | | — | | |
Class IS: | |
Shares Issued on Distributions Reinvested | | | — | @@ | | | — | | |
@ Amount is less than $500.
@@ Amount is less than 500 shares.
The accompanying notes are an integral part of the financial statements.
11
Morgan Stanley Institutional Fund, Inc.
Annual Report — December 31, 2019
Financial Highlights
Emerging Markets Breakout Nations Portfolio
| | | Class I | |
| | | Year Ended December 31, | | Period from
December 15, 2016(1) to | |
Selected Per Share Data and Ratios | | 2019 | | 2018 | | 2017 | | December 31, 2016 | |
Net Asset Value, Beginning of Period | | $ | 9.72 | | | $ | 11.91 | | | $ | 10.15 | | | $ | 10.00 | | |
Income (Loss) from Investment Operations: | |
Net Investment Income(2) | | | 0.10 | | | | 0.06 | | | | 0.08 | | | | 0.00 | (3) | |
Net Realized and Unrealized Gain (Loss) | | | 1.05 | | | | (2.09 | ) | | | 2.19 | | | | 0.15 | | |
Total from Investment Operations | | | 1.15 | | | | (2.03 | ) | | | 2.27 | | | | 0.15 | | |
Distributions from and/or in Excess of: | |
Net Investment Income | | | (0.09 | ) | | | (0.03 | ) | | | (0.05 | ) | | | — | | |
Net Realized Gain | | | — | | | | (0.13 | ) | | | (0.46 | ) | | | — | | |
Total Distributions | | | (0.09 | ) | | | (0.16 | ) | | | (0.51 | ) | | | — | | |
Net Asset Value, End of Period | | $ | 10.78 | | | $ | 9.72 | | | $ | 11.91 | | | $ | 10.15 | | |
Total Return(4) | | | 11.72 | % | | | (17.10 | )% | | | 22.44 | % | | | 1.50 | %(6) | |
Ratios to Average Net Assets and Supplemental Data: | |
Net Assets, End of Period (Thousands) | | $ | 5,400 | | | $ | 4,831 | | | $ | 5,917 | | | $ | 5,043 | | |
Ratio of Expenses Before Expense Limitation | | | 6.24 | % | | | 6.28 | % | | | 9.42 | % | | | 22.93 | %(7) | |
Ratio of Expenses After Expense Limitation | | | 1.12 | %(5) | | | 1.12 | %(5) | | | 1.11 | %(5) | | | 1.09 | %(5)(7) | |
Ratio of Net Investment Income | | | 0.92 | %(5) | | | 0.54 | %(5) | | | 0.66 | %(5) | | | 0.67 | %(5)(7) | |
Ratio of Rebate from Morgan Stanley Affiliates | | | 0.02 | % | | | 0.02 | % | | | 0.02 | % | | | 0.04 | %(7) | |
Portfolio Turnover Rate | | | 26 | % | | | 36 | % | | | 79 | % | | | 16 | %(6) | |
(1) Commencement of Operations.
(2) Per share amount is based on average shares outstanding.
(3) Amount is less than $0.005 per share.
(4) Calculated based on the net asset value as of the last business day of the period.
(5) The Ratio of Expenses After Expense Limitation and Ratio of Net Investment Income reflect the rebate of certain Fund expenses in connection with the investments in Morgan Stanley affiliates during the period. The effect of the rebate on the ratios is disclosed in the above table as "Ratio of Rebate from Morgan Stanley Affiliates."
(6) Not annualized.
(7) Annualized.
The accompanying notes are an integral part of the financial statements.
12
Morgan Stanley Institutional Fund, Inc.
Annual Report — December 31, 2019
Financial Highlights
Emerging Markets Breakout Nations Portfolio
| | | Class A | |
| | | Year Ended December 31, | | Period from
December 15, 2016(1) to | |
Selected Per Share Data and Ratios | | 2019 | | 2018 | | 2017 | | December 31, 2016 | |
Net Asset Value, Beginning of Period | | $ | 9.67 | | | $ | 11.90 | | | $ | 10.14 | | | $ | 10.00 | | |
Income (Loss) from Investment Operations: | |
Net Investment Income(2) | | | 0.05 | | | | 0.01 | | | | 0.03 | | | | 0.00 | (3) | |
Net Realized and Unrealized Gain (Loss) | | | 1.05 | | | | (2.08 | ) | | | 2.20 | | | | 0.14 | | |
Total from Investment Operations | | | 1.10 | | | | (2.07 | ) | | | 2.23 | | | | 0.14 | | |
Distributions from and/or in Excess of: | |
Net Investment Income | | | (0.05 | ) | | | (0.03 | ) | | | (0.01 | ) | | | — | | |
Net Realized Gain | | | — | | | | (0.13 | ) | | | (0.46 | ) | | | — | | |
Total Distributions | | | (0.05 | ) | | | (0.16 | ) | | | (0.47 | ) | | | — | | |
Net Asset Value, End of Period | | $ | 10.72 | | | $ | 9.67 | | | $ | 11.90 | | | $ | 10.14 | | |
Total Return(4) | | | 11.23 | % | | | (17.45 | )% | | | 22.01 | % | | | 1.40 | %(6) | |
Ratios to Average Net Assets and Supplemental Data: | |
Net Assets, End of Period (Thousands) | | $ | 11 | | | $ | 10 | | | $ | 12 | | | $ | 10 | | |
Ratio of Expenses Before Expense Limitation | | | 24.83 | % | | | 23.28 | % | | | 27.13 | % | | | 37.02 | %(7) | |
Ratio of Expenses After Expense Limitation | | | 1.53 | %(5) | | | 1.53 | %(5) | | | 1.53 | %(5) | | | 1.51 | %(5)(7) | |
Ratio of Net Investment Income | | | 0.50 | %(5) | | | 0.12 | %(5) | | | 0.25 | %(5) | | | 0.24 | %(5)(7) | |
Ratio of Rebate from Morgan Stanley Affiliates | | | 0.02 | % | | | 0.02 | % | | | 0.02 | % | | | 0.04 | %(7) | |
Portfolio Turnover Rate | | | 26 | % | | | 36 | % | | | 79 | % | | | 16 | %(6) | |
(1) Commencement of Operations.
(2) Per share amount is based on average shares outstanding.
(3) Amount is less than $0.005 per share.
(4) Calculated based on the net asset value which does not reflect sales charges, if applicable, as of the last business day of the period.
(5) The Ratio of Expenses After Expense Limitation and Ratio of Net Investment Income reflect the rebate of certain Fund expenses in connection with the investments in Morgan Stanley affiliates during the period. The effect of the rebate on the ratios is disclosed in the above table as "Ratio of Rebate from Morgan Stanley Affiliates."
(6) Not annualized.
(7) Annualized.
The accompanying notes are an integral part of the financial statements.
13
Morgan Stanley Institutional Fund, Inc.
Annual Report — December 31, 2019
Financial Highlights
Emerging Markets Breakout Nations Portfolio
| | | Class C | |
| | | Year Ended December 31, | | Period from
December 15, 2016(1) to | |
Selected Per Share Data and Ratios | | 2019 | | 2018 | | 2017 | | December 31, 2016 | |
Net Asset Value, Beginning of Period | | $ | 9.53 | | | $ | 11.80 | | | $ | 10.14 | | | $ | 10.00 | | |
Income (Loss) from Investment Operations: | |
Net Investment Loss(2) | | | (0.02 | ) | | | (0.07 | ) | | | (0.06 | ) | | | (0.00 | )(3) | |
Net Realized and Unrealized Gain (Loss) | | | 1.01 | | | | (2.04 | ) | | | 2.18 | | | | 0.14 | | |
Total from Investment Operations | | | 0.99 | | | | (2.11 | ) | | | 2.12 | | | | 0.14 | | |
Distributions from and/or in Excess of: | |
Net Investment Income | | | — | | | | (0.03 | ) | | | 0.00 | (3) | | | — | | |
Net Realized Gain | | | — | | | | (0.13 | ) | | | (0.46 | ) | | | — | | |
Total Distributions | | | — | | | | (0.16 | ) | | | (0.46 | ) | | | — | | |
Net Asset Value, End of Period | | $ | 10.52 | | | $ | 9.53 | | | $ | 11.80 | | | $ | 10.14 | | |
Total Return(4) | | | 10.39 | % | | | (18.09 | )% | | | 21.09 | % | | | 1.40 | %(6) | |
Ratios to Average Net Assets and Supplemental Data: | |
Net Assets, End of Period (Thousands) | | $ | 11 | | | $ | 10 | | | $ | 12 | | | $ | 10 | | |
Ratio of Expenses Before Expense Limitation | | | 25.82 | % | | | 24.22 | % | | | 26.78 | % | | | 37.76 | %(7) | |
Ratio of Expenses After Expense Limitation | | | 2.28 | %(5) | | | 2.28 | %(5) | | | 2.28 | %(5) | | | 2.26 | %(5)(7) | |
Ratio of Net Investment Loss | | | (0.24 | )%(5) | | | (0.62 | )%(5) | | | (0.50 | )%(5) | | | (0.50 | )%(5)(7) | |
Ratio of Rebate from Morgan Stanley Affiliates | | | 0.02 | % | | | 0.02 | % | | | 0.02 | % | | | 0.04 | %(7) | |
Portfolio Turnover Rate | | | 26 | % | | | 36 | % | | | 79 | % | | | 16 | %(6) | |
(1) Commencement of Operations.
(2) Per share amount is based on average shares outstanding.
(3) Amount is less than $0.005 per share.
(4) Calculated based on the net asset value which does not reflect sales charges, if applicable, as of the last business day of the period.
(5) The Ratio of Expenses After Expense Limitation and Ratio of Net Investment Loss reflect the rebate of certain Fund expenses in connection with the investments in Morgan Stanley affiliates during the period. The effect of the rebate on the ratios is disclosed in the above table as "Ratio of Rebate from Morgan Stanley Affiliates."
(6) Not annualized.
(7) Annualized.
The accompanying notes are an integral part of the financial statements.
14
Morgan Stanley Institutional Fund, Inc.
Annual Report — December 31, 2019
Financial Highlights
Emerging Markets Breakout Nations Portfolio
| | | Class IS | |
| | | Year Ended December 31, | | Period from
December 15, 2016(1) to | |
Selected Per Share Data and Ratios | | 2019 | | 2018 | | 2017 | | December 31, 2016 | |
Net Asset Value, Beginning of Period | | $ | 9.73 | | | $ | 11.91 | | | $ | 10.15 | | | $ | 10.00 | | |
Income (Loss) from Investment Operations: | |
Net Investment Income(2) | | | 0.10 | | | | 0.06 | | | | 0.08 | | | | 0.00 | (3) | |
Net Realized and Unrealized Gain (Loss) | | | 1.04 | | | | (2.08 | ) | | | 2.19 | | | | 0.15 | | |
Total from Investment Operations | | | 1.14 | | | | (2.02 | ) | | | 2.27 | | | | 0.15 | | |
Distributions from and/or in Excess of: | |
Net Investment Income | | | (0.09 | ) | | | (0.03 | ) | | | (0.05 | ) | | | — | | |
Net Realized Gain | | | — | | | | (0.13 | ) | | | (0.46 | ) | | | — | | |
Total Distributions | | | (0.09 | ) | | | (0.16 | ) | | | (0.51 | ) | | | — | | |
Net Asset Value, End of Period | | $ | 10.78 | | | $ | 9.73 | | | $ | 11.91 | | | $ | 10.15 | | |
Total Return(4) | | | 11.76 | % | | | (17.10 | )% | | | 22.47 | % | | | 1.50 | %(6) | |
Ratios to Average Net Assets and Supplemental Data: | |
Net Assets, End of Period (Thousands) | | $ | 11 | | | $ | 10 | | | $ | 12 | | | $ | 10 | | |
Ratio of Expenses Before Expense Limitation | | | 24.32 | % | | | 20.74 | % | | | 25.68 | % | | | 36.76 | %(7) | |
Ratio of Expenses After Expense Limitation | | | 1.08 | %(5) | | | 1.08 | %(5) | | | 1.08 | %(5) | | | 1.06 | %(5)(7) | |
Ratio of Net Investment Income | | | 0.96 | %(5) | | | 0.58 | %(5) | | | 0.69 | %(5) | | | 0.70 | %(5)(7) | |
Ratio of Rebate from Morgan Stanley Affiliates | | | 0.02 | % | | | 0.02 | % | | | 0.02 | % | | | 0.04 | %(7) | |
Portfolio Turnover Rate | | | 26 | % | | | 36 | % | | | 79 | % | | | 16 | %(6) | |
(1) Commencement of Operations.
(2) Per share amount is based on average shares outstanding.
(3) Amount is less than $0.005 per share.
(4) Calculated based on the net asset value as of the last business day of the period.
(5) The Ratio of Expenses After Expense Limitation and Ratio of Net Investment Income reflect the rebate of certain Fund expenses in connection with the investments in Morgan Stanley affiliates during the period. The effect of the rebate on the ratios is disclosed in the above table as "Ratio of Rebate from Morgan Stanley Affiliates."
(6) Not annualized.
(7) Annualized.
The accompanying notes are an integral part of the financial statements.
15
Morgan Stanley Institutional Fund, Inc.
Annual Report — December 31, 2019
Notes to Financial Statements
Morgan Stanley Institutional Fund, Inc. (the "Company") is registered under the Investment Company Act of 1940, as amended (the "Act"), as an open-end management investment company. The Company is comprised of thirty-two separate, active, diversified and non-diversified funds (individually referred to as a "Fund," collectively as the "Funds"). The Company applies investment company accounting and reporting guidance.
The accompanying financial statements relate to the Emerging Markets Breakout Nations Portfolio. The Fund seeks long-term capital appreciation.
The Fund offers four classes of shares — Class I, Class A, Class C and Class IS.
A. Significant Accounting Policies: The following significant accounting policies are in conformity with U.S. generally accepted accounting principles ("GAAP"). Such policies are consistently followed by the Company in the preparation of its financial statements. GAAP may require management to make estimates and assumptions that affect the reported amounts and disclosures in the financial statements. Actual results may differ from those estimates.
In August 2018, the Financial Accounting Standards Board ("FASB") issued Accounting Standards Update ("ASU") 2018-13, Fair Value Measurement (Topic 820) — Disclosures Framework — Changes to Disclosure Requirements of Fair Value Measurement ("ASU 2018-13") which introduces new fair value disclosure requirements as well as eliminates and modifies certain existing fair value disclosure requirements. ASU 2018-13 would be effective for fiscal years beginning after December 15, 2019 and for interim periods within those fiscal years; however, management has elected to early adopt ASU 2018-13 as permitted by the standard. The impact of the Fund's adoption was limited to changes in the Fund's financial statement disclosures regarding fair value, primarily those disclosures related to transfers between levels of the fair value hierarchy and disclosure of the range and weighted average used to develop significant unobservable inputs for Level 3 fair value measurements, when applicable.
1. Security Valuation: (1) An equity portfolio security listed or traded on an exchange is valued at its latest reported sales price (or at the exchange official closing price if such exchange reports an official closing price), and if there were no sales on a given day and if there is no official exchange closing price for that day, the security is valued at the mean between the last reported bid and asked prices
if such bid and asked prices are available on the relevant exchanges. If only bid prices are available then the latest bid price may be used. Listed equity securities not traded on the valuation date with no reported bid and asked prices available on the exchange are valued at the mean between the current bid and asked prices obtained from one or more reputable brokers or dealers. In cases where a security is traded on more than one exchange, the security is valued on the exchange designated as the primary market; (2) all other equity portfolio securities for which over-the-counter ("OTC") market quotations are readily available are valued at the latest reported sales price (or at the market official closing price if such market reports an official closing price), and if there was no trading in the security on a given day and if there is no official closing price from relevant markets for that day, the security is valued at the mean between the last reported bid and asked prices if such bid and asked prices are available on the relevant markets. An unlisted equity security that does not trade on the valuation date and for which bid and asked prices from the relevant markets are unavailable is valued at the mean between the current bid and asked prices obtained from one or more reputable brokers or dealers; (3) certain portfolio securities may be valued by an outside pricing service/vendor approved by the Company's Board of Directors (the "Directors"). The pricing service/vendor may employ a pricing model that takes into account, among other things, bids, yield spreads and/or other market data and specific security characteristics. Alternatively, if a valuation is not available from an outside pricing service/vendor, and the security trades on an exchange, the security may be valued at its latest reported sale price (or at the exchange official closing price if such exchange reports an official closing price), prior to the time when assets are valued. If there are no sales on a given day and if there is no official exchange closing price for that day, the security is valued at the mean between the last reported bid and asked prices if such bid and asked prices are available in the relevant exchanges. If Morgan Stanley Investment Management Inc. (the "Adviser"), a wholly-owned subsidiary of Morgan Stanley, determines that the price provided by the outside pricing service/vendor or exchange does not reflect the security's fair value or is unable to provide a price, prices from brokers or dealers may also be utilized. In these circumstances, the value of the security will be the mean of bid and asked prices obtained from brokers or dealers; (4) futures are valued at the settlement price on
16
Morgan Stanley Institutional Fund, Inc.
Annual Report — December 31, 2019
Notes to Financial Statements (cont'd)
the exchange on which they trade or, if a settlement price is unavailable, at the last sale price on the exchange; (5) when market quotations are not readily available, including circumstances under which the Adviser determines that the closing price, last sale price or the mean between the last reported bid and asked prices are not reflective of a security's market value, portfolio securities are valued at their fair value as determined in good faith under procedures established by and under the general supervision of the Directors. Occasionally, developments affecting the closing prices of securities and other assets may occur between the times at which valuations of such securities are determined (that is, close of the foreign market on which the securities trade) and the close of business of the New York Stock Exchange ("NYSE"). If developments occur during such periods that are expected to materially affect the value of such securities, such valuations may be adjusted to reflect the estimated fair value of such securities as of the close of the NYSE, as determined in good faith by the Directors or by the Adviser using a pricing service and/or procedures approved by the Directors; (6) quotations of foreign portfolio securities, other assets and liabilities and forward contracts stated in foreign currency are translated into U.S. dollar equivalents at the prevailing market rates prior to the close of the NYSE; and (7) investments in mutual funds, including the Morgan Stanley Institutional Liquidity Funds, are valued at the net asset value ("NAV") as of the close of each business day.
The Directors have responsibility for determining in good faith the fair value of the investments, and the Directors may appoint others, such as the Company's Adviser or a valuation committee, to assist the Directors in determining fair value and to make the actual calculations pursuant to the fair valuation methodologies previously approved by the Directors. Under procedures approved by the Directors, the Company's Adviser has formed a Valuation Committee whose members are approved by the Directors. The Valuation Committee provides administration and oversight of the Company's valuation policies and procedures, which are reviewed at least annually by the Directors. These procedures allow the Company to utilize independent pricing services, quotations from securities and financial instrument dealers and other market sources to determine fair value.
2. Fair Value Measurement: FASB Accounting Standards CodificationTM ("ASC") 820, "Fair Value Measurement" ("ASC 820"), defines fair value as the value that the Fund would receive to sell an investment or pay to transfer a liability in a timely transaction with an independent buyer in the principal market, or in the absence of a principal market, the most advantageous market for the investment or liability. ASC 820 establishes a three-tier hierarchy to distinguish between (1) inputs that reflect the assumptions market participants would use in valuing an asset or liability developed based on market data obtained from sources independent of the reporting entity (observable inputs) and (2) inputs that reflect the reporting entity's own assumptions about the assumptions market participants would use in valuing an asset or liability developed based on the best information available in the circumstances (unobservable inputs) and to establish classification of fair value measurements for disclosure purposes. Various inputs are used in determining the value of the Fund's investments. The inputs are summarized in the three broad levels listed below:
• Level 1 – unadjusted quoted prices in active markets for identical investments
• Level 2 – other significant observable inputs (including quoted prices for similar investments, interest rates, prepayment speeds, credit risk, etc.)
• Level 3 – significant unobservable inputs including the Fund's own assumptions in determining the fair value of investments. Factors considered in making this determination may include, but are not limited to, information obtained by contacting the issuer, analysts, or the appropriate stock exchange (for exchange-traded securities), analysis of the issuer's financial statements or other available documents and, if necessary, available information concerning other securities in similar circumstances.
The inputs or methodology used for valuing securities are not necessarily an indication of the risk associated with investing in those securities and the determination of the significance of a particular input to the fair value measurement in its entirety requires judgment and considers factors specific to each security.
17
Morgan Stanley Institutional Fund, Inc.
Annual Report — December 31, 2019
Notes to Financial Statements (cont'd)
The following is a summary of the inputs used to value the Fund's investments as of December 31, 2019:
Investment Type | | Level 1
Unadjusted
quoted
prices
(000) | | Level 2
Other
significant
observable
inputs
(000) | | Level 3
Significant
unobservable
inputs
(000) | | Total
(000) | |
Assets: | |
Common Stocks | |
Air Freight & Logistics | | $ | 11 | | | $ | — | | | $ | — | | | $ | 11 | | |
Airlines | | | 24 | | | | — | | | | — | | | | 24 | | |
Automobiles | | | — | | | | 64 | | | | — | | | | 64 | | |
Banks | | | 1,015 | | | | 546 | | | | — | | | | 1,561 | | |
Beverages | | | 81 | | | | 115 | | | | — | | | | 196 | | |
Capital Markets | | | 82 | | | | 110 | | | | — | | | | 192 | | |
Construction &
Engineering | | | 61 | | | | — | | | | — | | | | 61 | | |
Diversified Consumer
Services | | | 86 | | | | — | | | | — | | | | 86 | | |
Diversified
Telecommunication
Services | | | — | | | | 116 | | | | — | | | | 116 | | |
Electric Utilities | | | 10 | | | | — | | | | — | | | | 10 | | |
Food & Staples Retailing | | | 204 | | | | 89 | | | | — | | | | 293 | | |
Food Products | | | 18 | | | | — | | | | — | | | | 18 | | |
Gas Utilities | | | 38 | | | | — | | | | — | | | | 38 | | |
Health Care Providers &
Services | | | 47 | | | | 72 | | | | — | | | | 119 | | |
Hotels, Restaurants &
Leisure | | | 45 | | | | 53 | | | | — | | | | 98 | | |
Industrial Conglomerates | | | 72 | | | | 19 | | | | — | | | | 91 | | |
Insurance | | | 66 | | | | — | | | | — | | | | 66 | | |
Interactive Media &
Services | | | 308 | | | | — | | | | — | | | | 308 | | |
Internet & Direct
Marketing Retail | | | 169 | | | | — | | | | — | | | | 169 | | |
Metals & Mining | | | 76 | | | | — | | | | — | | | | 76 | | |
Multi-Line Retail | | | — | | | | 101 | | | | — | | | | 101 | | |
Oil, Gas & Consumable
Fuels | | | 52 | | | | 203 | | | | — | | | | 255 | | |
Pharmaceuticals | | | 38 | | | | — | | | | — | | | | 38 | | |
Real Estate Management &
Development | | | 77 | | | | 56 | | | | — | | | | 133 | | |
Software | | | 39 | | | | — | | | | — | | | | 39 | | |
Textiles, Apparel & Luxury
Goods | | | — | | | | 72 | | | | — | | | | 72 | | |
Total Common Stocks | | | 2,619 | | | | 1,616 | | | | — | | | | 4,235 | | |
Investment Companies | | | 341 | | | | — | | | | — | | | | 341 | | |
Short-Term Investment | |
Investment Company | | | 777 | | | | — | | | | — | | | | 777 | | |
Foreign Currency Forward
Exchange Contract | | | — | | | | — | @ | | | — | | | | — | @ | |
Futures Contracts | | | 5 | | | | — | | | | — | | | | 5 | | |
Total Assets | | | 3,742 | | | | 1,616 | | | | — | | | | 5,358 | | |
Liabilities: | |
Futures Contracts | | | (5 | ) | | | — | | | | — | | | | (5 | ) | |
Total | | $ | 3,737 | | | $ | 1,616 | | | $ | — | | | $ | 5,353 | | |
Transfers between investment levels may occur as the markets fluctuate and/or the availability of data used in an investment's valuation changes.
3. Foreign Currency Translation and Foreign Investments: The books and records of the Fund are
maintained in U.S. dollars. Foreign currency amounts are translated into U.S. dollars as follows:
– investments, other assets and liabilities at the prevailing rate of exchange on the valuation date;
– investment transactions and investment income at the prevailing rates of exchange on the dates of such transactions.
Although the net assets of the Fund are presented at the foreign exchange rates and market values at the close of the period, the Fund does not isolate that portion of the results of operations arising as a result of changes in the foreign exchange rates from the fluctuations arising from changes in the market prices of securities held at period end. Similarly, the Fund does not isolate the effect of changes in foreign exchange rates from the fluctuations arising from changes in the market prices of securities sold during the period. Accordingly, realized and unrealized foreign currency gains (losses) on investments in securities are included in the reported net realized and unrealized gains (losses) on investment transactions and balances. However, pursuant to U.S. federal income tax regulations, gains and losses from certain foreign currency transactions and the foreign currency portion of gains and losses realized on sales and maturities of foreign denominated debt securities are treated as ordinary income for U.S. federal income tax purposes.
Net realized gains (losses) on foreign currency transactions represent net foreign exchange gains (losses) from foreign currency forward exchange contracts, disposition of foreign currencies, currency gains (losses) realized between the trade and settlement dates on securities transactions, and the difference between the amount of investment income and foreign withholding taxes recorded on the Fund's books and the U.S. dollar equivalent amounts actually received or paid. The change in unrealized currency gains (losses) on foreign currency transactions for the period is reflected in the Statement of Operations.
A significant portion of the Fund's net assets consist of securities of issuers located in emerging markets, which are denominated in foreign currencies. Such securities may be concentrated in a limited number of countries and regions and may vary throughout the year. Changes in currency exchange rates will affect the value of
18
Morgan Stanley Institutional Fund, Inc.
Annual Report — December 31, 2019
Notes to Financial Statements (cont'd)
securities and investment income from foreign currency denominated securities. Emerging market securities are often subject to greater price volatility, limited capitalization and liquidity, and higher rates of inflation than securities of companies based in the U.S. In addition, emerging market issuers may be subject to substantial governmental involvement in the economy and greater social, economic and political uncertainty.
Governmental approval for foreign investments may be required in advance of making an investment under certain circumstances in some countries, and the extent of foreign investments in domestic companies may be subject to limitation in other countries. Foreign ownership limitations also may be imposed by the charters of individual companies to prevent, among other concerns, violations of foreign investment limitations. As a result, an additional class of shares (identified as "Foreign" in the Portfolio of Investments) may be created and offered for investment. The "local" and "foreign shares" market values may differ. In the absence of trading of the foreign shares in such markets, the Fund values the foreign shares at the closing exchange price of the local shares.
4. Derivatives: The Fund may, but is not required to, use derivative instruments for a variety of purposes, including hedging, risk management, portfolio management or to earn income. Derivatives are financial instruments whose value is based, in part, on the value of an underlying asset, interest rate, index or financial instrument. Prevailing interest rates and volatility levels, among other things, also affect the value of derivative instruments. A derivative instrument often has risks similar to its underlying asset and may have additional risks, including imperfect correlation between the value of the derivative and the underlying asset, risks of default by the counterparty to certain transactions, magnification of losses incurred due to changes in the market value of the securities, instruments, indices or interest rates to which the derivative instrument relates, risks that the transactions may not be liquid and risks arising from margin requirements. The use of derivatives involves risks that are different from, and possibly greater than, the risks associated with other portfolio investments. Derivatives may involve the use of highly specialized instruments that require investment techniques and risk analyses different from those associated with other portfolio investments. All of the Fund's holdings, including derivative instruments, are marked-to-market each day with
the change in value reflected in unrealized appreciation (depreciation). Upon disposition, a realized gain or loss is recognized.
Certain derivative transactions may give rise to a form of leverage. Leverage magnifies the potential for gain and the risk of loss. Leverage associated with derivative transactions may cause the Fund to liquidate portfolio positions when it may not be advantageous to do so to satisfy its obligations or to meet earmarking or segregation requirements, pursuant to applicable Securities and Exchange Commission ("SEC") rules and regulations, or may cause the Fund to be more volatile than if the Fund had not been leveraged. Although the Adviser seeks to use derivatives to further the Fund's investment objectives, there is no assurance that the use of derivatives will achieve this result.
Following is a description of the derivative instruments and techniques that the Fund used during the period and their associated risks:
Foreign Currency Forward Exchange Contracts: In connection with its investments in foreign securities, the Fund also entered into contracts with banks, brokers or dealers to purchase or sell securities or foreign currencies at a future date. A foreign currency forward exchange contract ("currency contract") is a negotiated agreement between the contracting parties to exchange a specified amount of currency at a specified future time at a specified rate. The rate can be higher or lower than the spot rate between the currencies that are the subject of the contract. Currency contracts may be used to protect against uncertainty in the level of future foreign currency exchange rates or to gain or modify exposure to a particular currency. To the extent hedged by the use of currency contracts, the precise matching of the currency contract amounts and the value of the securities involved will not generally be possible because the future value of such securities in foreign currencies will change as a consequence of market movements in the value of those securities between the date on which the contract is entered into and the date it matures. Furthermore, such transactions may reduce or preclude the opportunity for gain if the value of the currency should move in the direction opposite to the position taken. There is additional risk to the extent that currency contracts create exposure to currencies in which the Fund's securities are not denominated. Unanticipated changes in currency
19
Morgan Stanley Institutional Fund, Inc.
Annual Report — December 31, 2019
Notes to Financial Statements (cont'd)
prices may result in poorer overall performance for the Fund than if it had not entered into such contracts. The use of currency contracts involves the risk of loss from the insolvency or bankruptcy of the counterparty to the contract or the failure of the counterparty to make payments or otherwise comply with the terms of the contract. A currency contract is marked-to-market daily and the change in market value is recorded by the Fund as unrealized gain or loss. The Fund records realized gains (losses) when the currency contract is closed equal to the difference between the value of the currency contract at the time it was opened and the value at the time it was closed.
Futures: A futures contract is a standardized, exchange-traded agreement to buy or sell a specific quantity of an underlying asset, reference rate or index at a specific price at a specific future time. The value of a futures contract tends to increase and decrease in tandem with the value of the underlying instrument. Depending on the terms of the particular contract, futures contracts are settled through either physical delivery of the underlying instrument on the settlement date or by payment of a cash settlement amount on the settlement date. During the period the futures contract is open, payments are received from or made to the broker based upon changes in the value of the contract (the variation margin). A decision as to whether, when and how to use futures contracts involves the exercise of skill and judgment and even a well-conceived futures transaction may be unsuccessful because of market behavior or unexpected events. In addition to the derivatives risks discussed above, the prices of futures contracts can be highly volatile, using futures contracts can lower total return and the potential loss from futures contracts can exceed the Fund's initial investment in such contracts. No assurance can be given that a liquid market will exist for any particular futures contract at any particular time. There is also the risk of loss by the Fund of margin deposits in the event of bankruptcy of a broker with which the Fund has open positions in the futures contract.
FASB ASC 815, "Derivatives and Hedging" ("ASC 815"), is intended to improve financial reporting about derivative instruments by requiring enhanced disclosures to enable investors to better understand how and why the Fund uses derivative instruments, how these derivative
instruments are accounted for and their effects on the Fund's financial position and results of operations.
The following tables set forth the fair value of the Fund's derivative contracts by primary risk exposure as of December 31, 2019:
| | | Asset Derivatives
Statement of Assets and
Liabilities Location | | Primary Risk
Exposure | | Value
(000) | |
Foreign Currency
Forward Exchange
Contract | | Unrealized Appreciation on
Foreign Currency Forward
Exchange Contract | |
Currency Risk | | $ | — | @ | |
Futures Contracts
| | Variation Margin on
Futures Contracts | |
Equity Risk | | | 5 | (a) | |
Total | | | | | | $ | 5 | | |
| | | Liability Derivatives
Statement of Assets and
Liabilities Location | | Primary Risk
Exposure | | Value
(000) | |
Futures Contracts
| | Variation Margin on
Futures Contracts | |
Equity Risk | | | (5 | )(a) | |
@ Value is less than $500.
(a) This amount represents the cumulative appreciation (depreciation) as reported in the Portfolio of Investments. The Statement of Assets and Liabilities only reflects the current day's net variation margin.
The following tables set forth by primary risk exposure the Fund's realized gains (losses) and change in unrealized appreciation (depreciation) by type of derivative contract for the year ended December 31, 2019 in accordance with ASC 815:
Realized Gain (Loss) | |
Primary Risk Exposure | | Derivative Type | | Value
(000) | |
Currency Risk | | Foreign Currency Forward
Exchange Contracts | | $ | (13 | ) | |
Equity Risk | | Futures Contracts | | | 43 | | |
Total | | | | $ | 30 | | |
Change in Unrealized Appreciation (Depreciation) | |
Primary Risk Exposure | | Derivative Type | | Value
(000) | |
Currency Risk | | Foreign Currency Forward
Exchange Contracts | | $ | 7 | | |
Equity Risk | | Futures Contracts | | | 5 | | |
Total | | | | $ | 12 | | |
At December 31, 2019, the Fund's derivative assets and liabilities are as follows:
Gross Amounts of Assets and Liabilities
Presented in the Statement of Assets and Liabilities | |
Derivatives(b) | | Assets(c)
(000) | | Liabilities(c)
(000) | |
Foreign Currency Forward Exchange Contract | | $ | — | @ | | $ | — | | |
@ Value is less than $500.
(b) Excludes exchange-traded derivatives.
(c) Absent an event of default or early termination, OTC derivative assets and liabilities are presented gross and not offset in the Statement of Assets and Liabilities.
20
Morgan Stanley Institutional Fund, Inc.
Annual Report — December 31, 2019
Notes to Financial Statements (cont'd)
The Fund typically enters into International Swaps and Derivatives Association, Inc. Master Agreements ("ISDA Master Agreements") or similar master agreements (collectively, "Master Agreements") with its contract counterparties for certain OTC derivatives in order to, among other things, reduce its credit risk to counterparties. ISDA Master Agreements include provisions for general obligations, representations, collateral and events of default or termination. Under an ISDA Master Agreement, the Fund typically may offset with the counterparty certain OTC derivative financial instruments' payables and/or receivables with collateral held and/or posted and create one single net payment (close-out netting) in the event of default, termination and/or potential deterioration in the credit quality of the counterparty. Various Master Agreements govern the terms of certain transactions with counterparties, including transactions such as swap, forward, repurchase and reverse repurchase agreements. These Master Agreements typically attempt to reduce the counterparty risk associated with such transactions by specifying credit protection mechanisms and providing standardization that improves legal certainty. Cross-termination provisions under Master Agreements typically provide that a default in connection with one transaction between the Fund and a counterparty gives the non-defaulting party the right to terminate any other transactions in place with the defaulting party to create one single net payment due to/due from the defaulting party and may be a feature in certain Master Agreements. In the event the Fund exercises its right to terminate a Master Agreement after a counterparty experiences a termination event as defined in the Master Agreement, the return of collateral with market value in excess of the Fund's net liability may be delayed or denied.
The following table presents derivative financial instruments that are subject to enforceable netting arrangements as of December 31, 2019:
Gross Amounts Not Offset in the Statement of Assets and Liabilities | |
Counterparty | | Gross Asset
Derivatives
Presented in the
Statement of
Assets and
Liabilities
(000) | | Financial
Instrument
(000) | | Collateral
Received
(000) | | Net Amount
(not less
than $0)
(000) | |
JPMorgan Chase Bank NA | | $ | — | @ | | $ | — | | | $ | — | | | $ | — | @ | |
@ Value is less than $500.
For the year ended December 31, 2019, the approximate average monthly amount outstanding for each derivative type is as follows:
Foreign Currency Forward Exchange Contracts: | |
Average monthly principal amount | | $ | 51,000 | | |
Futures Contracts: | |
Average monthly notional value | | $ | 1,242,000 | | |
5. Redemption Fees: The Fund will assess a 2% redemption fee on Class I shares, Class A shares, Class C shares and Class IS shares, which is paid directly to the Fund, for shares redeemed or exchanged within thirty days of purchase, subject to certain exceptions. The redemption fee is designed to protect the Fund and its remaining shareholders from the effects of short-term trading. These fees, if any, are included in the Statements of Changes in Net Assets.
6. Indemnifications: The Company enters into contracts that contain a variety of indemnifications. The Company's maximum exposure under these arrangements is unknown. However, the Company has not had prior claims or losses pursuant to these contracts and expects the risk of loss to be remote.
7. Dividends and Distributions to Shareholders: Dividend income and distributions to shareholders are recorded on the ex-dividend date. Dividends from net investment income, if any, are declared and paid annually. Net realized capital gains, if any, are distributed at least annually.
8. Security Transactions, Income and Expenses: Security transactions are accounted for on the trade date (date the order to buy or sell is executed). Realized gains and losses on the sale of investment securities are determined on the specific identified cost method. Dividend income and other distributions are recorded on the ex-dividend date (except for certain foreign dividends which may be recorded as soon as the Fund is informed of such dividends) net of applicable withholding taxes. Interest income is recognized on the accrual basis except where collection is in doubt. Discounts are accreted and premiums are amortized over the life of the respective securities. Most expenses of the Company can be directly attributed to a particular Fund. Expenses which cannot be directly attributed are apportioned among the Funds based upon relative net assets or other appropriate methods. Income, expenses (other than class specific expenses — distribution and shareholder services, transfer agency and sub transfer
21
Morgan Stanley Institutional Fund, Inc.
Annual Report — December 31, 2019
Notes to Financial Statements (cont'd)
agency fees) and realized and unrealized gains or losses are allocated to each class of shares based upon their relative net assets.
B. Advisory Fees: The Adviser, a wholly-owned subsidiary of Morgan Stanley, provides the Fund with advisory services under the terms of an Investment Advisory Agreement, paid quarterly, at the annual rate based on the daily net assets as follows:
First $1
billion | | Over $1
billion | |
| | 0.90 | % | | | 0.85 | % | |
For the year ended December 31, 2019, the advisory fee rate (net of waiver/rebate) was equivalent to an annual effective rate of 0.00% of the Fund's average daily net assets.
The Adviser has agreed to reduce its advisory fee and/or reimburse the Fund so that total annual Fund operating expenses, excluding certain investment related expenses, taxes, interest and other extraordinary expenses (including litigation), will not exceed 1.20% for Class I shares, 1.55% for Class A shares, 2.30% for Class C shares and 1.10% for Class IS shares. The fee waivers and/or expense reimbursements will continue for at least one year from the date of the Fund's prospectus or until such time as the Directors act to discontinue all or a portion of such waivers and/or reimbursements when they deem such action is appropriate. For the year ended December 31, 2019, approximately $47,000 of advisory fees were waived and approximately $224,000 of other expenses were reimbursed by the Adviser pursuant to this arrangement.
C. Administration Fees: The Adviser also serves as Administrator to the Company and provides administrative services pursuant to an Administration Agreement for an annual fee, accrued daily and paid monthly, of 0.08% of the Fund's average daily net assets.
Under a Sub-Administration Agreement between the Administrator and State Street Bank and Trust Company ("State Street"), State Street provides certain administrative services to the Company. For such services, the Administrator pays State Street a portion of the fee the Administrator receives from the Fund.
D. Distribution and Shareholder Services Fees: Morgan Stanley Distribution, Inc. ("MSDI" or the "Distributor"), a wholly-owned subsidiary of the Adviser and an indirect subsidiary of Morgan Stanley, serves as the Company's Distributor of Fund shares pursuant to a Distribution Agreement. The Company has adopted a Shareholder Services Plan with
respect to Class A shares pursuant to Rule 12b-1 under the Act. Under the Shareholder Services Plan, the Fund pays the Distributor a shareholder services fee, accrued daily and paid monthly, at an annual rate of 0.25% of the Fund's average daily net assets attributable to Class A shares.
The Company has adopted a Distribution and Shareholder Services Plan with respect to Class C shares pursuant to Rule 12b-1 under the Act. Under the Distribution and Shareholder Services Plan, the Fund pays the Distributor a distribution fee, accrued daily and paid monthly, at an annual rate of 0.75% and a shareholder services fee, accrued daily and paid monthly, at an annual rate of 0.25% of the Fund's average daily net assets attributable to Class C shares.
The distribution and shareholder services fees are used to support the expenses associated with servicing and maintaining accounts. The Distributor may compensate other parties for providing shareholder support services to investors who purchase Class A and Class C shares.
E. Dividend Disbursing and Transfer Agent: The Company's dividend disbursing and transfer agent is DST Asset Manager Solutions, Inc. ("DST"). Pursuant to a Transfer Agency Agreement, the Company pays DST a fee based on the number of classes, accounts and transactions relating to the Funds of the Company.
F. Custodian Fees: State Street (the "Custodian") also serves as Custodian for the Company in accordance with a Custodian Agreement. The Custodian holds cash, securities and other assets of the Company as required by the Act. Custody fees are payable monthly based on assets held in custody, investment purchases and sales activity and account maintenance fees, plus reimbursement for certain out-of-pocket expenses.
G. Security Transactions and Transactions with Affiliates: For the year ended December 31, 2019, purchases and sales of investment securities for the Fund, other than long-term U.S. Government securities and short-term investments were approximately $1,341,000 and $1,164,000, respectively. There were no purchases and sales of long-term U.S. Government securities for the year ended December 31, 2019.
The Fund invests in the Institutional Class of the Morgan Stanley Institutional Liquidity Funds — Government Portfolio (the "Liquidity Funds"), an open-end management investment company managed by the Adviser. Advisory fees paid by the Fund are reduced by an amount equal to its pro-rata share
22
Morgan Stanley Institutional Fund, Inc.
Annual Report — December 31, 2019
Notes to Financial Statements (cont'd)
of the advisory and administration fees paid by the Fund due to its investment in the Liquidity Funds. For the year ended December 31, 2019, advisory fees paid were reduced by approximately $1,000 relating to the Fund's investment in the Liquidity Funds.
A summary of the Fund's transactions in shares of affiliated investments during the year ended December 31, 2019 is as follows:
Affiliated
Investment
Company | | Value
December 31,
2018
(000) | | Purchases
at Cost
(000) | | Proceeds
from Sales
(000) | | Dividend
Income
(000) | |
Liquidity Funds | | $ | 819 | | | $ | 1,031 | | | $ | 1,073 | | | $ | 14 | | |
Affiliated
Investment
Company | | Realized
Gain (Loss)
(000) | | Change in
Unrealized
Appreciation
(Depreciation)
(000) | | Value
December 31,
2019
(000) | |
Liquidity Funds | | $ | — | | | $ | — | | | $ | 777 | | |
The Fund is permitted to purchase and sell securities ("cross-trade") from and to other Morgan Stanley Funds as well as other funds and client accounts for which the Adviser or an affiliate of the Adviser serves as investment adviser, pursuant to procedures approved by the Directors in compliance with Rule 17a-7 under the Act (the "Rule"). Each cross-trade is executed at the current market price in compliance with provisions of the Rule. For the period ended December 31, 2019, the Fund did not engage in any cross-trade transactions.
The Fund has an unfunded Deferred Compensation Plan (the "Compensation Plan"), which allows each independent Director to defer payment of all, or a portion, of the fees he or she receives for serving on the Board of Directors. Each eligible Director generally may elect to have the deferred amounts credited with a return equal to the total return on one or more of the Morgan Stanley funds that are offered as investment options under the Compensation Plan. Appreciation/depreciation and distributions received from these investments are recorded with an offsetting increase/decrease in the deferred compensation obligation and do not affect the NAV of the Fund.
H. Federal Income Taxes: It is the Fund's intention to continue to qualify as a regulated investment company and distribute all of its taxable and tax-exempt income. Accordingly, no provision for federal income taxes is required in the financial statements.
The Fund may be subject to taxes imposed by countries in which it invests. Such taxes are generally based on income and/or capital gains earned or repatriated. Taxes are accrued
based on net investment income, net realized gains and net unrealized appreciation as such income and/or gains are earned. Taxes may also be based on transactions in foreign currency and are accrued based on the value of investments denominated in such currency.
FASB ASC 740-10, "Income Taxes — Overall", sets forth a minimum threshold for financial statement recognition of the benefit of a tax position taken or expected to be taken in a tax return. Management has concluded there are no significant uncertain tax positions that would require recognition in the financial statements. If applicable, the Fund recognizes interest accrued related to unrecognized tax benefits in "Interest Expense" and penalties in "Other Expenses" in the Statement of Operations. The Fund files tax returns with the U.S. Internal Revenue Service, New York and various states. Generally, each of the tax years in the four-year period ended December 31, 2019 remains subject to examination by taxing authorities.
The tax character of distributions paid may differ from the character of distributions shown for GAAP purposes due to short-term capital gains being treated as ordinary income for tax purposes. The tax character of distributions paid during fiscal years 2019 and 2018 was as follows:
2019
Distributions
Paid From: | | 2018
Distributions
Paid From: | |
Ordinary
Income
(000) | | Long-Term
Capital Gain
(000) | | Ordinary
Income
(000) | | Long-Term
Capital Gain
(000) | |
| $ | 44 | | | | — | | �� | $ | 35 | | | $ | 35 | | |
The amount and character of income and gains to be distributed are determined in accordance with income tax regulations which may differ from GAAP. These book/tax differences are either considered temporary or permanent in nature.
Temporary differences are attributable to differing book and tax treatments for the timing of the recognition of gains (losses) on certain investment transactions and the timing of the deductibility of certain expenses.
The Fund had no permanent differences causing reclassifications among the components of net assets for the year ended December 31, 2019.
At December 31, 2019, the components of distributable earnings for the Fund on a tax basis were as follows:
Undistributed
Ordinary
Income
(000) | | Undistributed
Long-Term
Capital Gain
(000) | |
| $ | 4 | | | | — | | |
23
Morgan Stanley Institutional Fund, Inc.
Annual Report — December 31, 2019
Notes to Financial Statements (cont'd)
At December 31, 2019, the Fund had available for federal income tax purposes unused short-term capital losses of approximately $28,000 that do not have an expiration date.
To the extent that capital loss carryforwards are used to offset any future capital gains realized, no capital gains tax liability will be incurred by the Fund for gains realized and not distributed. To the extent that capital gains are offset, such gains will not be distributed to the shareholders. During the year ended December 31, 2019, the Fund utilized capital loss carryforwards for U.S. federal income tax purposes of approximately $36,000.
I. Credit Facility: The Company and other Morgan Stanley funds participated in a $150,000,000 committed, unsecured revolving line of credit facility (the "Facility") with State Street. Effective April 22, 2019, the committed line amount increased to $300,000,000. This Facility is to be used for temporary emergency purposes or funding of shareholder redemption requests. The interest rate on borrowings is based on the federal funds rate or 1 month LIBOR rate plus a spread. The Facility also has a commitment fee of 0.25% per annum based on the unused portion of the Facility. During the year ended December 31, 2019, the Fund did not have any borrowings under the Facility.
J. Other: At December 31, 2019, the Fund did not have record owners of 10% or greater.
24
Morgan Stanley Institutional Fund, Inc.
Annual Report — December 31, 2019
Report of Independent Registered Public Accounting Firm
To the Shareholders and Board of Directors of
Morgan Stanley Institutional Fund, Inc. —
Emerging Markets Breakout Nations Portfolio
Opinion on the Financial Statements
We have audited the accompanying statement of assets and liabilities of Emerging Markets Breakout Nations Portfolio (the "Fund") (one of the funds constituting Morgan Stanley Institutional Fund, Inc. (the "Company")), including the portfolio of investments, as of December 31, 2019, and the related statement of operations for the year then ended, the statements of changes in net assets for each of the two years in the period then ended, the financial highlights for each of the three years then ended and the period from December 15, 2016 (commencement of operations) through December 31, 2016 and the related notes (collectively referred to as the "financial statements"). In our opinion, the financial statements present fairly, in all material respects, the financial position of Emerging Markets Breakout Nations Portfolio (one of the funds constituting Morgan Stanley Institutional Fund, Inc.) at December 31, 2019, the results of its operations for the year then ended, the changes in its net assets for each of the two years in the period then ended and its financial highlights for each of the three years in the period then ended and the period from December 15, 2016 (commencement of operations) through December 31, 2016, in conformity with U.S. generally accepted accounting principles.
Basis for Opinion
These financial statements are the responsibility of the Company's management. Our responsibility is to express an opinion on the Fund's financial statements based on our audits. We are a public accounting firm registered with the Public Company Accounting Oversight Board (United States) ("PCAOB") and are required to be independent with respect to the Company in accordance with the U.S. federal securities law and the applicable rules and regulations of the Securities and Exchange Commission and the PCAOB.
We conducted our audits in accordance with the standards of the PCAOB. Those standards require that we plan and perform the audit to obtain reasonable assurance about whether the financial statements are free of material misstatement, whether due to error or fraud. The Company is not required to have, nor were we engaged to perform, an audit of the Company's internal control over financial reporting. As part of our audits, we are required to obtain an understanding of internal control over financial reporting, but not for the purpose of expressing an opinion on the effectiveness of the Company's internal control over financial reporting. Accordingly, we express no such opinion.
Our audits included performing procedures to assess the risks of material misstatement of the financial statements, whether due to error or fraud, and performing procedures that respond to those risks. Such procedures included examining, on a test basis, evidence regarding the amounts and disclosures in the financial statements. Our procedures included confirmation of securities owned as of December 31, 2019 by correspondence with the custodian and others or by other appropriate auditing procedures where replies from others were not received. Our audits also included evaluating the accounting principles used and significant estimates made by management, as well as evaluating the overall presentation of the financial statements. We believe that our audits provide a reasonable basis for our opinion.

We have served as the auditor of one or more Morgan Stanley investment companies since 2000.
Boston, Massachusetts
February 27, 2020
25
Morgan Stanley Institutional Fund, Inc.
Annual Report — December 31, 2019
Federal Tax Notice (unaudited)
For federal income tax purposes, the following information is furnished with respect to the Fund's earnings for its taxable year ended December 31, 2019. When distributed, certain earnings may be subject to a maximum tax rate of 15% as provided for by the Jobs and Growth Tax Relief Reconciliation Act of 2003. The Fund designated up to a maximum of approximately $54,000 as taxable at this lower rate.
The Fund intends to pass through foreign tax credits of approximately $10,000 and has derived net income from sources within foreign countries amounting to approximately $98,000.
In January, the Fund provides tax information to shareholders for the preceding calendar year.
26
Privacy Notice (unaudited) April 2019
FACTS | | WHAT DOES MSIM DO WITH YOUR PERSONAL INFORMATION? | |
Why? | | Financial companies choose how they share your personal information. Federal law gives consumers the right to limit some but not all sharing. Federal law also requires us to tell you how we collect, share, and protect your personal information. Please read this notice carefully to understand what we do. | |
What? | | The types of personal information we collect and share depend on the product or service you have with us. This information can include:
n Social Security number and income
n investment experience and risk tolerance
n checking account number and wire transfer instructions | |
How? | | All financial companies need to share customers' personal information to run their everyday business. In the section below, we list the reasons financial companies can share their customers' personal information; the reasons MSIM chooses to share; and whether you can limit this sharing. | |
Reasons we can share your personal information | | Does MSIM share? | | Can you limit this sharing? | |
For our everyday business purposes —
such as to process your transactions, maintain your account(s), respond to court orders and legal investigations, or report to credit bureaus | | Yes | | No | |
For our marketing purposes —
to offer our products and services to you | | Yes | | No | |
For joint marketing with other financial companies | | No | | We don't share | |
For our affiliates' everyday business purposes —
information about your transactions and experiences | | Yes | | No | |
For our affiliates' everyday business purposes —
information about your creditworthiness | | No | | We don't share | |
For our affiliates to market to you | | No | | We don't share | |
For non-affiliates to market to you | | No | | We don't share | |
Questions? Call toll-free (844) 312-6327 or email: imprivacyinquiries@morganstanley.com
27
Privacy Notice (unaudited) (cont'd) April 2019
Who we are
Who is providing this notice? | | Morgan Stanley Investment Management, Inc. and its affiliated registered investment advisers, registered broker-dealers, and registered and unregistered funds ("MSIM") | |
What we do
How does MSIM protect my personal information? | | To protect your personal information from unauthorized access and use, we use security measures that comply with federal law. These measures include computer safeguards and secured files and buildings. We have policies governing the proper handling of customer information by personnel and requiring third parties that provide support to adhere to appropriate security standards with respect to such information. | |
How does MSIM collect my personal information? | | We collect your personal information, for example, when you
n open an account or make deposits or withdrawals from your account
n buy securities from us or make a wire transfer
n give us your contact information
We also collect your personal information from others, such as credit bureaus, affiliates, or other companies. | |
Why can't I limit all sharing? | | Federal law gives you the right to limit only
n sharing for affiliates' everyday business purposes — information about your creditworthiness
n affiliates from using your information to market to you
n sharing for non-affiliates to market to you
State laws and individual companies may give you additional rights to limit sharing. See below for more on your rights under state law. | |
Definitions
Affiliates | | Companies related by common ownership or control. They can be financial and non-financial companies.
n Our affiliates include companies with a Morgan Stanley name and financial companies such as Morgan Stanley Smith Barney LLC and Morgan Stanley & Co. | |
Non-affiliates | | Companies not related by common ownership or control. They can be financial and non-financial companies.
n MSIM does not share with non-affiliates so they can market to you. | |
Joint marketing | | A formal agreement between non-affiliated financial companies that together market financial products or services to you.
n MSIM doesn't jointly market | |
Other Important Information
Vermont: Except as permitted by law, we will not share personal information we collect about Vermont residents with Non-affiliates unless you provide us with your written consent to share such information.
California: Except as permitted by law, we will not share personal information we collect about California residents with Non-affiliates and we will limit sharing such personal information with our Affiliates to comply with California privacy laws that apply to us.
28
Morgan Stanley Institutional Fund, Inc.
Annual Report — December 31, 2019
Director and Officer Information (unaudited)
Independent Directors:
Name, Birth Year
and Address of
Independent Director | | Position(s)
Held with
Registrant | | Length of Time
Served* | | Principal Occupation(s) During Past 5 Years
and Other Relevant Professional Experience | | Number of
Funds in
Fund Complex
Overseen by
Independent
Director** | | Other Directorships
Held by Independent
Director*** | |
Frank L. Bowman
c/o Perkins Coie LLP
Counsel to the Independent Directors
1155 Avenue of the Americas
New York, NY 10036
Birth Year 1944 | | Director | | Since August 2006 | | President, Strategic Decisions, LLC (consulting) (since February 2009); Director or Trustee of various Morgan Stanley Funds (since August 2006); Chairperson of the Compliance and Insurance Committee (since October 2015); formerly, Chairperson of the Insurance Sub-Committee of the Compliance and Insurance Committee (2007-2015); served as President and Chief Executive Officer of the Nuclear Energy Institute (policy organization) (February 2005-November 2008); retired as Admiral, U.S. Navy after serving over 38 years on active duty including 8 years as Director of the Naval Nuclear Propulsion Program in the Department of the Navy and the U.S. Department of Energy (1996-2004); served as Chief of Naval Personnel (July 1994-September 1996) and on the Joint Staff as Director of Political Military Affairs (June 1992-July 1994); knighted as Honorary Knight Commander of the Most Excellent Order of the British Empire; awarded the Officier de l'Orde National du Mérite by the French Government; elected to the National Academy of Engineering (2009). | | | 86 | | | Director of Naval and Nuclear Technologies LLP; Director Emeritus of the Armed Services YMCA; Member of the National Security Advisory Council of the Center for U.S. Global Engagement and a member of the CNA Military Advisory Board; Trustee of Fairhaven United Methodist Church; Member of the Board of Advisors of the Dolphin Scholarship Foundation; Director of other various non-profit organizations; formerly, Director of BP p.l.c. (November 2010-May 2019). | |
Kathleen A. Dennis
c/o Perkins Coie LLP
Counsel to the Independent Directors
1155 Avenue of the Americas
New York, NY 10036
Birth Year 1953 | | Director | | Since August 2006 | | President, Cedarwood Associates (mutual fund and investment management consulting) (since July 2006); Chairperson of the Liquidity and Alternatives Sub-Committee of the Investment Committee (since October 2006) and Director or Trustee of various Morgan Stanley Funds (since August 2006); formerly, Senior Managing Director of Victory Capital Management (1993-2006). | | | 86 | | | Director of various non-profit organizations. | |
Nancy C. Everett
c/o Perkins Coie LLP
Counsel to the Independent Directors
1155 Avenue of the Americas
New York, NY 10036
Birth Year 1955 | | Director | | Since January 2015 | | Chief Executive Officer, Virginia Commonwealth University Investment Company (since November 2015); Owner, OBIR, LLC (institutional investment management consulting) (since June 2014); formerly, Managing Director, BlackRock, Inc. (February 2011-December 2013); and Chief Executive Officer, General Motors Asset Management (a/k/a Promark Global Advisors, Inc.) (June 2005-May 2010). | | | 87 | | | Formerly, Member of Virginia Commonwealth University School of Business Foundation (2005-2016); Member of Virginia Commonwealth University Board of Visitors (2013-2015); Member of Committee on Directors for Emerging Markets Growth Fund, Inc. (2007-2010); Chairperson of Performance Equity Management, LLC (2006-2010); and Chairperson, GMAM Absolute Return Strategies Fund, LLC (2006-2010). | |
29
Morgan Stanley Institutional Fund, Inc.
Annual Report — December 31, 2019
Director and Officer Information (unaudited) (cont'd)
Independent Directors: (cont'd)
Name, Birth Year
and Address of
Independent Director | | Position(s)
Held with
Registrant | | Length of Time
Served* | | Principal Occupation(s) During Past 5 Years
and Other Relevant Professional Experience | | Number of
Funds in
Fund Complex
Overseen by
Independent
Director** | | Other Directorships
Held by Independent
Director*** | |
Jakki L. Haussler
c/o Perkins Coie LLP
Counsel to the Independent Directors
1155 Avenue of the
Americas
New York, NY 10036
Birth Year 1957 | | Director | | Since January 2015 | | Chairman, Opus Capital Group (since 1996); formerly, Chief Executive Officer, Opus Capital Group (1996-2019); Director, Capvest Venture Fund, LP (May 2000-December 2011); Partner, Adena Ventures, LP (July 1999-December 2010); Director, The Victory Funds (February 2005-July 2008). | | | 87 | | | Director of Service Corporation International and Member, Audit Committee and Investment Committee; Director of Cincinnati Bell Inc. and Member, Audit Committee and Governance and Nominating Committee; Chairman of Northern Kentucky University Member Investment Committee; Member of Chase College of Law Transactional Law Practice Center Board of Advisors; Director of Best Transport; Director of Chase College of Law Board of Visitors; formerly, Member, University of Cincinnati Foundation Investment Committee; Member, Miami University Board of Visitors (2008-2011); Trustee of Victory Funds (2005-2008) and Chairman, Investment Committee (2007-2008) and Member, Service Provider Committee (2005-2008). | |
Dr. Manuel H. Johnson
c/o Johnson Smick International, Inc.
220 I Street, NE — Suite 200
Washington, D.C. 20002
Birth Year 1949 | | Director | | Since July 1991 | | Senior Partner, Johnson Smick International, Inc. (consulting firm); Chairperson of the Investment Committee (since October 2006) and Director or Trustee of various Morgan Stanley Funds (since July 1991); Co-Chairman and a founder of the Group of Seven Council (G7C) (international economic commission); formerly, Chairperson of the Audit Committee (July 1991-September 2006), Vice Chairman of the Board of Governors of the Federal Reserve System and Assistant Secretary of the U.S. Treasury. | | | 86 | | | Director of NVR, Inc. (home construction). | |
Joseph J. Kearns
c/o Perkins Coie LLP
Counsel to the Independent Directors
1155 Avenue of the Americas
New York, NY 10036
Birth Year 1942 | | Director | | Since August 1994 | | Senior Adviser, Kearns & Associates LLC (investment consulting); Chairperson of the Audit Committee (since October 2006) and Director or Trustee of various Morgan Stanley Funds (since August 1994); formerly, Deputy Chairperson of the Audit Committee (July 2003-September 2006) and Chairperson of the Audit Committee of various Morgan Stanley Funds (since August 1994); CFO of the J. Paul Getty Trust. | | | 87 | | | Prior to August 10, 2016, Director of Electro Rent Corporation (equipment leasing); Prior to December 31, 2013, Director of The Ford Family Foundation. | |
30
Morgan Stanley Institutional Fund, Inc.
Annual Report — December 31, 2019
Director and Officer Information (unaudited) (cont'd)
Independent Directors: (cont'd)
Name, Birth Year
and Address of
Independent Director | | Position(s)
Held with
Registrant | | Length of Time
Served* | | Principal Occupation(s) During Past 5 Years
and Other Relevant Professional Experience | | Number of
Funds in
Fund Complex
Overseen by
Independent
Director** | | Other Directorships
Held by Independent
Director*** | |
Michael F. Klein
c/o Perkins Coie LLP
Counsel to the Independent Directors
1155 Avenue of the Americas
New York, NY 10036
Birth Year 1958 | | Director | | Since August 2006 | | Managing Director, Aetos Alternatives Management, LP (since March 2000); Co-President, Aetos Alternatives Management, LP (since January 2004) and Co-Chief Executive Officer of Aetos Alternatives Management, LP (since August 2013); Chairperson of the Fixed Income Sub-Committee of the Investment Committee (since October 2006) and Director or Trustee of various Morgan Stanley Funds (since August 2006); formerly, Managing Director, Morgan Stanley & Co. Inc. and Morgan Stanley Dean Witter Investment Management and President, various Morgan Stanley Funds (June 1998-March 2000); Principal, Morgan Stanley & Co. Inc. and Morgan Stanley Dean Witter Investment Management (August 1997-December 1999). | | | 86 | | | Director of certain investment funds managed or sponsored by Aetos Alternatives Management, LP; Director of Sanitized AG and Sanitized Marketing AG (specialty chemicals). | |
Patricia Maleski
c/o Perkins Coie LLP
Counsel to the Independent Directors
1155 Avenue of the Americas
New York, NY 10036
Birth Year 1960 | | Director | | Since January 2017 | | Managing Director, JPMorgan Asset Management (2004-2016); Oversight and Control Head of Fiduciary and Conflicts of Interest Program (2015-2016); Chief Control Officer-Global Asset Management (2013-2015); President, JPMorgan Funds (2010-2013); Chief Administrative Officer (2004-2013); various other positions including Treasurer and Board Liaison (since 2001). | | | 87 | | | None. | |
Michael E. Nugent
522 Fifth Avenue
New York, NY 10036
Birth Year 1936 | | Chair of the Board and Director | | Chair of the Boards since July 2006 and Director since July 1991 | | Chair of the Boards of various Morgan Stanley Funds (since July 2006); Chairperson of the Governance Committee (since January 2019) and Director or Trustee of various Morgan Stanley Funds (since July 1991); formerly, Chairperson of each of the Closed-End Fund committee (until December 2019) and the Insurance Committee (until July 2006); General Partner, Triumph Capital, L.P. (private investment partnership) (1988-2013). | | | 86 | | | None. | |
W. Allen Reed
c/o Perkins Coie LLP
Counsel to the Independent Directors
1155 Avenue of the Americas
New York, NY 10036
Birth Year 1947 | | Vice Chair of the Board and Director | | Vice Chair of the Boards since January 2020 and Director since August 2006 | | Chairperson of the Equity Sub-Committee of the Investment Committee (since October 2006) and Director or Trustee of various Morgan Stanley Funds (since August 2006); formerly, President and CEO of General Motors Asset Management; Chairman and Chief Executive Officer of the GM Trust Bank and Corporate Vice President of General Motors Corporation (August 1994-December 2005). | | | 86 | | | Formerly, Director of Legg Mason, Inc.; formerly, Director of the Auburn University Foundation (2010-2015). | |
* This is the earliest date the Director began serving the Morgan Stanley Funds. Each Director serves an indefinite term, until his or her successor is elected.
** The Fund Complex includes (as of December 31, 2019) all open-end and closed-end funds (including all of their portfolios) advised by Morgan Stanley Investment Management Inc. (the "Adviser") and any funds that have an adviser that is an affiliated person of the Adviser (including, but not limited to, Morgan Stanley AIP GP LP).
*** This includes any directorships at public companies and registered investment companies held by the Director at any time during the past five years.
31
Morgan Stanley Institutional Fund, Inc.
Annual Report — December 31, 2019
Director and Officer Information (unaudited) (cont'd)
Executive Officers:
Name, Birth Year and Address of
Executive Officer | | Position(s)
Held with
Registrant | | Length of Time
Served* | | Principal Occupation(s) During Past 5 Years | |
John H. Gernon
522 Fifth Avenue
New York, NY 10036
Birth Year 1963 | | President and Principal Executive Officer | | Since September 2013 | | President and Principal Executive Officer of the Equity and Fixed Income Funds and the Morgan Stanley AIP Funds (since September 2013) and the Liquidity Funds and various money market funds (since May 2014) in the Fund Complex; Managing Director of the Adviser; Head of Product (since 2006). | |
Timothy J. Knierim
522 Fifth Avenue
New York, NY 10036
Birth Year 1959 | | Chief Compliance Officer | | Since December 2016 | | Managing Director of the Adviser and various entities affiliated with the Adviser; Chief Compliance Officer of various Morgan Stanley Funds and the Adviser (since December 2016) and Chief Compliance Officer of Morgan Stanley AIP GP LP (since 2014). Formerly, Managing Director and Deputy Chief Compliance Officer of the Adviser (2014-2016); and formerly, Chief Compliance Officer of Prudential Investment Management, Inc. (2007-2014). | |
Francis J. Smith
522 Fifth Avenue
New York, NY 10036
Birth Year 1965 | | Treasurer and Principal Financial Officer | | Treasurer since July 2003 and Principal Financial Officer since September 2002 | | Managing Director of the Adviser and various entities affiliated with the Adviser; Treasurer (since July 2003) and Principal Financial Officer of various Morgan Stanley Funds (since September 2002). | |
Mary E. Mullin
522 Fifth Avenue
New York, NY 10036
Birth Year 1967 | | Secretary | | Since June 1999 | | Managing Director of the Adviser; Secretary of various Morgan Stanley Funds (since June 1999). | |
Michael J. Key
522 Fifth Avenue
New York, NY 10036
Birth Year 1979 | | Vice President | | Since June 2017 | | Vice President of the Equity and Fixed Income Funds, Liquidity Funds, various money market funds and the Morgan Stanley AIP Funds in the Fund Complex (since June 2017); Executive Director of the Adviser; Head of Product Development for Equity and Fixed Income Funds (since August 2013). | |
* This is the earliest date the officer began serving the Morgan Stanley Funds. Each officer serves a one-year term, until his or her successor is elected and qualifies.
32
Morgan Stanley Institutional Fund, Inc.
Annual Report — December 31, 2019
Adviser and Administrator
Morgan Stanley Investment Management Inc.
522 Fifth Avenue
New York, New York 10036
Distributor
Morgan Stanley Distribution, Inc.
522 Fifth Avenue
New York, New York 10036
Dividend Disbursing and Transfer Agent
DST Asset Manager Solutions, Inc.
2000 Crown Colony Drive
Quincy, Massachusetts 02169
Custodian
State Street Bank and Trust Company
One Lincoln Street
Boston, Massachusetts 02111
Legal Counsel
Dechert LLP
1095 Avenue of the Americas
New York, New York 10036
Counsel to the Independent Directors
Perkins Coie LLP
1155 Avenue of the Americas
New York, New York 10036
Independent Registered Public Accounting Firm
Ernst & Young LLP
200 Clarendon Street
Boston, Massachusetts 02116
Reporting to Shareholders
Each Morgan Stanley fund provides a complete schedule of portfolio holdings in its Semi-Annual and the Annual Reports within 60 days of the end of the fund's second and fourth fiscal quarters. The Semi-Annual and Annual Reports are filed electronically with the Securities and Exchange Commission ("SEC") on Form N-CSRS and Form N-CSR, respectively. Morgan Stanley also delivers the Semi-Annual and Annual Reports to fund shareholders and makes these reports available on its public website, www.morganstanley.com/im/shareholderreports. Each Morgan Stanley non-money market fund also files a complete schedule of portfolio holdings with the SEC for the fund's first and third fiscal quarters as an attachment to Form N-PORT. Morgan Stanley does not deliver the reports for the first and third fiscal quarters to shareholders, nor are the reports posted to the Morgan Stanley public website. However, the holdings for each money market fund are posted to the Morgan Stanley public website. You may obtain the Form N-PORT filings (as well as the Form N-CSR and N-CSRS filings) by accessing the SEC's website, www.sec.gov. You can also request copies of these materials, upon payment of a duplicating fee, by electronic request at the SEC's email address (publicinfo@sec.gov).
Proxy Voting Policies and Procedures and Proxy Voting Record
You may obtain a copy of the Company's Proxy Voting Policy and Procedures and information regarding how the Company voted proxies relating to portfolio securities during the most recent twelve-month period ended June 30, without charge, upon request, by calling toll free 1 (800) 548-7786 or by visiting our website at www.morganstanley.com/im/shareholderreports. This information is also available on the SEC's website at www.sec.gov.
This report is authorized for distribution only when preceded or accompanied by a prospectus or summary prospectus of the applicable fund of Morgan Stanley Institutional Fund, Inc., which describes in detail the fund's investment policies, risks, fees and expenses. Please read the prospectus carefully before you invest or send money. For additional information, including information regarding the investments comprising the Fund, please visit our website at www.morganstanley.com/im/shareholderreports or call toll free 1 (800) 548-7786.
33
Printed in U.S.A.
This Report has been prepared for shareholders and may be distributed to others only if preceded or accompanied by a current prospectus.
Morgan Stanley Investment Management Inc.
522 Fifth Avenue
New York, New York 10036
© 2020 Morgan Stanley. Morgan Stanley Distribution, Inc.

IFIEMBONANN
2925758 EXP. 02.28.21

Morgan Stanley Institutional Fund, Inc.
Global Advantage Portfolio
Annual Report
December 31, 2019
Beginning on January 1, 2021, as permitted by regulations adopted by the Securities and Exchange Commission ("SEC"), paper copies of the Fund's Annual and Semi-Annual Reports to Shareholders ("Shareholder Reports") will no longer be sent by mail, unless you specifically request paper copies of the Shareholder Reports from the Fund or from your financial intermediary, such as a broker-dealer or a bank. Instead, the Shareholder Reports will be made available on the Fund's website, https://www.morganstanley.com/im/shareholderreports and you will be notified by mail each time a Shareholder Report is posted and provided with a website link to access the Shareholder Report. If you already elected to receive Shareholder Reports electronically, you will not be affected by this change and you need not take any action. You may elect to receive Shareholder Reports and other communications from the Fund electronically anytime by contacting your financial intermediary or, if you are a direct investor, please follow the instructions on the envelope.
Beginning on January 1, 2019, you may elect to receive all future Shareholder Reports in paper free of charge. If you invest through a financial intermediary, you can contact your financial intermediary to request that you continue to receive paper copies of your Shareholder Reports. If you invest directly with the Fund, please follow the instructions on the envelope to let the Fund know you wish to continue receiving paper copies of your Shareholder Reports. Your election to receive Shareholder Reports in paper will apply to all funds held in your account if you invest through your financial intermediary or all funds held with the fund complex if you invest directly with a fund.

Morgan Stanley Institutional Fund, Inc.
Annual Report — December 31, 2019
Shareholders' Letter | | | 2 | | |
Expense Example | | | 3 | | |
Investment Overview | | | 4 | | |
Portfolio of Investments | | | 6 | | |
Statement of Assets and Liabilities | | | 8 | | |
Statement of Operations | | | 10 | | |
Statements of Changes in Net Assets | | | 11 | | |
Financial Highlights | | | 13 | | |
Notes to Financial Statements | | | 17 | | |
Report of Independent Registered Public Accounting Firm | | | 28 | | |
Federal Tax Notice | | | 29 | | |
Privacy Notice | | | 30 | | |
Director and Officer Information | | | 32 | | |
This report is authorized for distribution only when preceded or accompanied by a prospectus or summary prospectus of the applicable Fund of Morgan Stanley Institutional Fund, Inc. To receive a prospectus and/or statement of additional information ("SAI"), which contains more complete information such as investment objectives, charges, expenses, policies for voting proxies, risk considerations and describes in detail each of the Fund's investment policies to the prospective investor, please call toll free 1 (800) 548-7786. Please read the prospectuses carefully before you invest or send money.
Additionally, you can access information about the Fund, including performance, characteristics and investment team commentary, through Morgan Stanley Investment Management's website: www.morganstanley.com/im/shareholderreports.
Market forecasts provided in this report may not necessarily come to pass. There is no guarantee that any sectors mentioned will continue to perform as discussed herein or that securities in such sectors will be held by the Fund in the future. There is no assurance that a fund will achieve its investment objective. Funds are subject to market risk, which is the possibility that market values of securities owned by the Fund will decline and, therefore, the value of the Fund's shares may be less than what you paid for them. Accordingly, you can lose money investing in this Fund. Please see the prospectus for more complete information on investment risks.
1
Morgan Stanley Institutional Fund, Inc.
Annual Report — December 31, 2019
Shareholders' Letter (unaudited)
Dear Shareholders,
We are pleased to provide this Annual Report, in which you will learn how your investment in Global Advantage Portfolio (the "Fund") performed during the latest twelve-month period.
Morgan Stanley Investment Management is a client-centric, investor-led organization. Our global presence, intellectual capital, and breadth of products and services enable us to partner with investors to meet the evolving challenges of today's financial markets. We aim to deliver superior investment service and to empower our clients to make the informed decisions that help them reach their investment goals.
As always, we thank you for selecting Morgan Stanley Investment Management, and look forward to working with you in the months and years ahead.
Sincerely,

John H. Gernon
President and Principal Executive Officer
January 2020
2
Morgan Stanley Institutional Fund, Inc.
Annual Report — December 31, 2019
Expense Example (unaudited)
Global Advantage Portfolio
As a shareholder of the Fund, you incur two types of costs: (1) transactional costs; and (2) ongoing costs, which may include advisory fees, administration fees, distribution and shareholder services fees and other Fund expenses. This example is intended to help you understand your ongoing costs (in dollars) of investing in the Fund and to compare these costs with the ongoing costs of investing in other mutual funds.
This example is based on an investment of $1,000 invested at the beginning of the six-month period ended December 31, 2019 and held for the entire six-month period.
Actual Expenses
The table below provides information about actual account values and actual expenses. You may use the information in this table, together with the amount you invested, to estimate the expenses that you paid over the period. Simply divide your account value by $1,000 (for example, an $8,600 account value divided by $1,000 = 8.6), then multiply the result by the number in the table under the heading entitled "Actual Expenses Paid During Period" to estimate the expenses you paid on your account during this period.
Hypothetical Example for Comparison Purposes
The table below provides information about hypothetical account values and hypothetical expenses based on the Fund's actual expense ratio and an assumed rate of return of 5% per year before expenses, which is not the Fund's actual return. The hypothetical account values and expenses may not be used to estimate the actual ending account balance or expenses you paid for the period. You may use this information to compare the ongoing costs of investing in the Fund and other funds. To do so, compare this 5% hypothetical example with the 5% hypothetical examples that appear in the shareholder reports of the other funds.
Please note that the expenses shown in the table are meant to highlight your ongoing costs only and do not reflect any transactional costs, such as sales charges (loads). Therefore, the information for each class in the table is useful in comparing ongoing costs only, and will not help you determine the relative total costs of owning different funds. In addition, if these transactional costs were included, your costs would have been higher.
| | | Beginning
Account
Value
7/1/19 | | Actual Ending
Account
Value
12/31/19 | | Hypothetical
Ending Account
Value | | Actual
Expenses
Paid
During
Period* | | Hypothetical
Expenses Paid
During Period* | | Net
Expense
Ratio
During
Period** | |
Global Advantage Portfolio Class I | | $ | 1,000.00 | | | $ | 1,023.70 | | | $ | 1,019.71 | | | $ | 5.56 | | | $ | 5.55 | | | | 1.09 | % | |
Global Advantage Portfolio Class A | | | 1,000.00 | | | | 1,021.90 | | | | 1,018.10 | | | | 7.19 | | | | 7.17 | | | | 1.41 | | |
Global Advantage Portfolio Class L | | | 1,000.00 | | | | 1,019.30 | | | | 1,015.43 | | | | 9.87 | | | | 9.86 | | | | 1.94 | | |
Global Advantage Portfolio Class C | | | 1,000.00 | | | | 1,017.80 | | | | 1,014.17 | | | | 11.14 | | | | 11.12 | | | | 2.19 | | |
* Expenses are calculated using each Fund Class' annualized net expense ratio (as disclosed), multiplied by the average account value over the period and multiplied by 184/365 (to reflect the most recent one-half year period).
** Annualized.
3
Morgan Stanley Institutional Fund, Inc.
Annual Report — December 31, 2019
Investment Overview (unaudited)
Global Advantage Portfolio
The Fund seeks long-term capital appreciation.
Performance
For the fiscal year ended December 31, 2019, the Fund's Class I shares had a total return based on net asset value and reinvestment of distributions per share of 31.49%, net of fees. The Fund's Class I shares outperformed the Fund's benchmark, the MSCI All Country World Net Index (the "Index"), which returned 26.60%.
Please keep in mind that double-digit returns are highly unusual and cannot be sustained. Investors should also be aware that these returns were primarily achieved during favorable market conditions.
Factors Affecting Performance
• Easing geopolitical tensions, reduced recession fears and central bank support drove global equities sharply higher over 2019. Although the U.S.-China trade relations dampened global manufacturing and export activity, many economies remained supported by relatively stronger consumer sectors that had remained mostly unaffected by the manufacturing slowdown. To further extend the economic cycle, global central banks resumed cutting policy interest rates and enacting other stimulus measures. Volatility increased in 2019, but stock prices continued to rally higher, notably at year end when the U.S. and China announced a partial trade deal, Brexit uncertainty eased with the Conservative Party winning a large majority in the U.K. general election, and some economic indicators appeared to be stabilizing.
• Global equities, as measured by the Index, performed well during the year, with information technology, consumer discretionary and industrials the best performing sectors in the Index. All sectors advanced over the period, but the energy sector lagged the Index by the widest margin.
• Counterpoint Global seeks high quality companies, which we define primarily as those with sustainable competitive advantages. We manage concentrated portfolios that are highly differentiated from the benchmark, with securities weighted on our assessment of the quality of the company and our conviction. The value added or detracted in any period of time will result from stock selection, given our philosophy and process. For the year, the Fund outperformed the Index.
• The long-term investment horizon and conviction-weighted investment approach embraced by the team since 1998 can result in periods of performance deviation from the benchmark and peers. The Fund outperformed the Index in this reporting period due to favorable stock selection and sector allocations.
• The largest contribution came from our stock selection and overweight allocation in the consumer discretionary sector. A Latin American e-commerce company was the top contributor in the sector and the overall Fund for the year. Stock selection and an overweight in the information technology sector added to relative gains, led by a Canada-based software developer. The financials sector added value, with our strong stock selection among capital markets companies and a beneficial underweight to the sector overall.
• The chief detractor from performance was our stock selection in communication services and health care. The Fund's lack of exposure to large benchmark holdings in the communication services sector weighed on relative performance as these index-heavyweights performed very strongly in 2019. This offset the relative gains produced by many of the communication services stocks the Fund did hold. The leading detractor in the health care sector was a poor-performing animal health care company. Stock selection in the materials sector modestly dampened relative performance as well.
Management Strategies
• As a team, we believe having a market outlook can be an anchor. Our focus is on assessing company prospects over a five-year horizon, and owning a portfolio of unique companies whose market value we believe can increase significantly for underlying fundamental reasons.
4
Morgan Stanley Institutional Fund, Inc.
Annual Report — December 31, 2019
Investment Overview (unaudited) (cont'd)
Global Advantage Portfolio
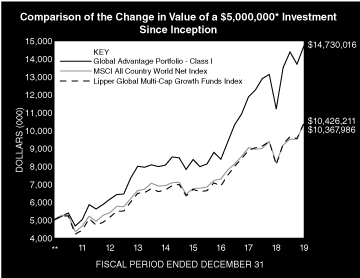
* Minimum Investment for Class I shares
** Commenced Operations on December 28, 2010.
In accordance with SEC regulations, the Fund's performance shown assumes that all recurring fees (including management fees) were deducted and all dividends and distributions were reinvested. The performance of Class A, L and C shares will vary from the performance of Class I shares based upon their different inception dates and will be negatively impacted by additional fees assessed to those classes.
Performance Compared to the MSCI All Country World Net Index(1) and the Lipper Global Multi-Cap Growth Funds Index(2)
| | | Period Ended December 31, 2019
Total Returns(3) | |
| | | | | Average Annual | |
| | | One
Year | | Five
Years | | Ten
Years | | Since
Inception(6) | |
Fund — Class I Shares
w/o sales charges(4) | | | 31.49 | % | | | 12.80 | % | | | — | | | | 12.74 | % | |
Fund — Class A Shares
w/o sales charges(4) | | | 31.04 | | | | 12.39 | | | | — | | | | 12.38 | | |
Fund — Class A Shares with
maximum 5.25% sales charges(4) | | | 24.16 | | | | 11.19 | | | | — | | | | 11.71 | | |
Fund — Class L Shares
w/o sales charges(4) | | | 30.32 | | | | 11.82 | | | | — | | | | 11.81 | | |
Fund — Class C Shares
w/o sales charges(5) | | | 29.97 | | | | — | | | | — | | | | 11.04 | | |
Fund — Class C Shares with
maximum 1.00% deferred
sales charges(5) | | | 28.97 | | | | — | | | | — | | | | 11.04 | | |
MSCI All Country World Net Index | | | 26.60 | | | | 8.41 | | | | — | | | | 8.43 | | |
Lipper Global Multi-Cap Growth
Funds Index | | | 29.00 | | | | 9.32 | | | | — | | | | 8.50 | | |
Performance data quoted represents past performance, which is no guarantee of future results, and current performance may be lower or higher than the figures shown. Performance assumes that all dividends and distributions, if any, were reinvested. For the most recent month-end performance figures, please visit www.morganstanley.com/im/shareholderreports. Investment return and principal value will fluctuate so that Fund shares, when redeemed, may be worth more or less than their original cost. Total returns do not reflect the deduction of taxes that a shareholder would pay on Fund distributions or the redemption of Fund shares. Performance of share classes will vary due to difference in sales charges and expenses.
(1) The MSCI All Country World Net Index is a free float-adjusted market capitalization weighted index designed to measure the equity market performance of developed and emerging markets. The term "free float" represents the portion of shares outstanding that are deemed to be available for purchase in the public equity markets by investors. The performance of the Index is listed in U.S. dollars and assumes reinvestment of net dividends. Net total return indices reinvest dividends after the deduction of withholding taxes, using (for international indices) a tax rate applicable to non-resident institutional investors who do not benefit from double taxation treaties. The Index is unmanaged and its returns do not include any sales charges or fees. Such costs would lower performance. It is not possible to invest directly in an index.
(2) The Lipper Global Multi-Cap Growth Funds Index is an equally weighted performance index of the largest qualifying funds (based on net assets) in the Lipper Global Multi-Cap Growth Funds classification. The Index, which is adjusted for capital gains distributions and income dividends, is unmanaged and should not be considered an investment. There are currently 30 funds represented in this Index. As of the date of this report, the Fund was in the Lipper Global Multi-Cap Growth Funds classification.
(3) Total returns for the Fund reflect fees waived and expenses reimbursed, if applicable, by the Adviser (as defined herein). Without such waivers and reimbursements, total returns would have been lower.
(4) Commenced operations on December 28, 2010.
(5) Commenced offering on April 30, 2015.
(6) For comparative purposes, average annual since inception returns listed for the Indexes refer to the inception date of Class I of the Fund, not the inception of the Index.
5
Morgan Stanley Institutional Fund, Inc.
Annual Report — December 31, 2019
Portfolio of Investments
Global Advantage Portfolio
| | | Shares | | Value
(000) | |
Common Stocks (98.3%) | |
Canada (10.1%) | |
Constellation Software, Inc. | | | 3,617 | | | $ | 3,513 | | |
FirstService Corp. | | | 38,523 | | | | 3,586 | | |
Shopify, Inc., Class A (a) | | | 18,501 | | | | 7,356 | | |
| | | | 14,455 | | |
Denmark (3.6%) | |
Chr Hansen Holding A/S | | | 64,970 | | | | 5,165 | | |
France (13.2%) | |
Christian Dior SE | | | 13,271 | | | | 6,800 | | |
EssilorLuxottica SA | | | 43,946 | | | | 6,694 | | |
Hermes International | | | 7,098 | | | | 5,304 | | |
| | | | 18,798 | | |
Germany (1.1%) | |
Zalando SE (a) | | | 30,132 | | | | 1,520 | | |
India (3.0%) | |
HDFC Bank Ltd. ADR | | | 67,302 | | | | 4,265 | | |
Netherlands (5.0%) | |
Adyen N.V. (a) | | | 8,753 | | | | 7,177 | | |
New Zealand (4.9%) | |
Xero Ltd. (a) | | | 123,866 | | | | 6,954 | | |
United Kingdom (6.5%) | |
Atlassian Corp. PLC, Class A (a) | | | 27,970 | | | | 3,366 | | |
Rentokil Initial PLC | | | 991,941 | | | | 5,952 | | |
| | | | 9,318 | | |
United States (50.9%) | |
Amazon.com, Inc. (a) | | | 2,763 | | | | 5,106 | | |
CME Group, Inc. | | | 6,857 | | | | 1,376 | | |
Coupa Software, Inc. (a) | | | 24,946 | | | | 3,648 | | |
Ecolab, Inc. | | | 26,703 | | | | 5,153 | | |
Farfetch Ltd., Class A (a) | | | 243,640 | | | | 2,522 | | |
Intercontinental Exchange, Inc. | | | 15,057 | | | | 1,394 | | |
Intuitive Surgical, Inc. (a) | | | 9,585 | | | | 5,666 | | |
MercadoLibre, Inc. (a) | | | 11,843 | | | | 6,774 | | |
Okta, Inc. (a) | | | 31,216 | | | | 3,601 | | |
S&P Global, Inc. | | | 5,147 | | | | 1,405 | | |
ServiceNow, Inc. (a) | | | 19,625 | | | | 5,541 | | |
Spotify Technology SA (a) | | | 46,897 | | | | 7,014 | | |
Twitter, Inc. (a) | | | 132,319 | | | | 4,241 | | |
Veeva Systems, Inc., Class A (a) | | | 36,065 | | | | 5,073 | | |
Walt Disney Co. (The) | | | 24,056 | | | | 3,479 | | |
Workday, Inc., Class A (a) | | | 27,476 | | | | 4,518 | | |
XP, Inc., Class A (a) | | | 99,640 | | | | 3,838 | | |
Zoetis, Inc. | | | 17,433 | | | | 2,307 | | |
| | | | 72,656 | | |
Total Common Stocks (Cost $117,632) | | | 140,308 | | |
| | | Shares | | Value
(000) | |
Preferred Stocks (0.2%) | |
United States (0.2%) | |
Airbnb, Inc. Series D (a)(b)(c)
(acquisition cost — $78; acquired 4/16/14) | | | 1,917 | | | $ | 252 | | |
Lookout, Inc. Series F (a)(b)(c)
(acquisition cost — $73; acquired 6/17/14) | | | 6,374 | | | | 16 | | |
Palantir Technologies, Inc. Series G (a)(b)(c)
(acquisition cost — $9; acquired 7/19/12) | | | 2,935 | | | | 18 | | |
Palantir Technologies, Inc. Series H (a)(b)(c)
(acquisition cost — $6; acquired 10/25/13) | | | 1,572 | | | | 10 | | |
Palantir Technologies, Inc. Series H1 (a)(b)(c)
(acquisition cost — $6; acquired 10/25/13) | | | 1,572 | | | | 10 | | |
Total Preferred Stocks (Cost $171) | | | 306 | | |
Short-Term Investment (2.1%) | |
Investment Company (2.1%) | |
Morgan Stanley Institutional Liquidity
Funds — Treasury Securities Portfolio —
Institutional Class (See Note G)
(Cost $2,991) | | | 2,991,398 | | | | 2,991 | | |
Total Investments Excluding Purchased
Options (100.6%) (Cost $120,794) | | | | | 143,605 | | |
Total Purchased Options Outstanding (0.0%)
(Cost $382) | | | 46 | | |
Total Investments (100.6%)
(Cost $121,176) (d)(e) | | | 143,651 | | |
Liabilities in Excess of Other Assets (–0.6%) | | | (923 | ) | |
Net Assets (100.0%) | | $ | 142,728 | | |
Country assignments and aggregations are based generally on third party vendor classifications and information, and may be different from the assignments and aggregations under the policies set forth in the Fund's prospectus and/or statement of additional information relating to geographic classifications.
(a) Non-income producing security.
(b) At December 31, 2019, the Fund held fair valued securities valued at approximately $306,000, representing 0.2% of net assets. These securities have been fair valued as determined in good faith under procedures established by and under the general supervision of the Company's (as defined herein) Directors.
(c) Security cannot be offered for public resale without first being registered under the Securities Act of 1933 and related rules ("restricted security"). Acquisition date represents the day on which an enforceable right to acquire such security is obtained and is presented along with related cost in the security description. The Fund has registration rights for certain restricted securities. Any costs related to such registration are borne by the issuer. The aggregate value of restricted securities (excluding 144A holdings) at December 31, 2019 amounts to approximately $306,000 and represents 0.2% of net assets.
(d) The approximate fair value and percentage of net assets, $6,685,000 and 4.7%, respectively, represent the securities that have been fair valued under the fair valuation policy for international investments as described in Note A-1 within the Notes to the Financial Statements.
(e) At December 31, 2019, the aggregate cost for federal income tax purposes is approximately $121,961,000. The aggregate gross unrealized appreciation is approximately $25,104,000 and the aggregate gross unrealized depreciation is approximately $3,413,000, resulting in net unrealized appreciation of approximately $21,691,000.
ADR American Depositary Receipt.
The accompanying notes are an integral part of the financial statements.
6
Morgan Stanley Institutional Fund, Inc.
Annual Report — December 31, 2019
Portfolio of Investments (cont'd)
Global Advantage Portfolio
Call Options Purchased:
The Fund had the following call options purchased open at December 31, 2019:
Counterparty | | Description | | Strike
Price | | Expiration
Date | | Number of
Contracts | | Notional
Amount
(000) | | Value
(000) | | Premiums
Paid
(000) | | Unrealized
Depreciation
(000) | |
BNP Paribas | | USD/CNH | | CNH | 7.58 | | | Jan-20 | | | 21,248,072 | | | | 21,248 | | | $ | — | @ | | $ | 109 | | | $ | (109 | ) | |
Royal Bank of Scotland | | USD/CNH | | CNH | 7.85 | | | Jun-20 | | | 25,784,929 | | | | 25,785 | | | | 17 | | | | 133 | | | | (116 | ) | |
Royal Bank of Scotland | | USD/CNH | | CNH | 8.09 | | | Sep-20 | | | 25,839,776 | | | | 25,840 | | | | 29 | | | | 140 | | | | (111 | ) | |
| | | | | | | | | | | | | $ | 46 | | | $ | 382 | | | $ | (336 | ) | |
CNH — Chinese Yuan Renminbi Offshore
USD — United States Dollar
@ — Value is less than $500.
Portfolio Composition
Classification | | Percentage of
Total Investments | |
Other* | | | 23.7 | % | |
Software | | | 19.2 | | |
Textiles, Apparel & Luxury Goods | | | 13.1 | | |
Information Technology Services | | | 12.6 | | |
Internet & Direct Marketing Retail | | | 11.3 | | |
Entertainment | | | 7.3 | | |
Chemicals | | | 7.2 | | |
Capital Markets | | | 5.6 | | |
Total Investments | | | 100.0 | % | |
* Industries and/or investment types representing less than 5% of total investments.
The accompanying notes are an integral part of the financial statements.
7
Morgan Stanley Institutional Fund, Inc.
Annual Report — December 31, 2019
Global Advantage Portfolio
Statement of Assets and Liabilities | | December 31, 2019
(000) | |
Assets: | |
Investments in Securities of Unaffiliated Issuers, at Value (Cost $118,185) | | $ | 140,660 | | |
Investment in Security of Affiliated Issuer, at Value (Cost $2,991) | | | 2,991 | | |
Total Investments in Securities, at Value (Cost $121,176) | | | 143,651 | | |
Foreign Currency, at Value (Cost $3) | | | 4 | | |
Receivable for Fund Shares Sold | | | 169 | | |
Dividends Receivable | | | 77 | | |
Tax Reclaim Receivable | | | 49 | | |
Receivable from Affiliate | | | 3 | | |
Other Assets | | | 39 | | |
Total Assets | | | 143,992 | | |
Liabilities: | |
Payable for Investments Purchased | | | 478 | | |
Due to Broker | | | 270 | | |
Payable for Advisory Fees | | | 238 | | |
Payable for Fund Shares Redeemed | | | 142 | | |
Payable for Professional Fees | | | 55 | | |
Payable for Sub Transfer Agency Fees—Class I | | | 13 | | |
Payable for Sub Transfer Agency Fees—Class A | | | 6 | | |
Payable for Sub Transfer Agency Fees—Class L | | | — | @ | |
Payable for Sub Transfer Agency Fees—Class C | | | 1 | | |
Payable for Shareholder Services Fees—Class A | | | 9 | | |
Payable for Distribution and Shareholder Services Fees—Class L | | | — | @ | |
Payable for Distribution and Shareholder Services Fees—Class C | | | 9 | | |
Payable for Transfer Agency Fees—Class I | | | 7 | | |
Payable for Transfer Agency Fees—Class A | | | 1 | | |
Payable for Transfer Agency Fees—Class L | | | — | @ | |
Payable for Transfer Agency Fees—Class C | | | 2 | | |
Payable for Administration Fees | | | 10 | | |
Payable for Custodian Fees | | | 4 | | |
Other Liabilities | | | 19 | | |
Total Liabilities | | | 1,264 | | |
Net Assets | | $ | 142,728 | | |
Net Assets Consist of: | |
Paid-in-Capital | | $ | 119,343 | | |
Total Distributable Earnings | | | 23,385 | | |
Net Assets | | $ | 142,728 | | |
The accompanying notes are an integral part of the financial statements.
8
Morgan Stanley Institutional Fund, Inc.
Annual Report — December 31, 2019
Global Advantage Portfolio
Statement of Assets and Liabilities (cont'd) | | December 31, 2019
(000) | |
CLASS I: | |
Net Assets | | $ | 87,595 | | |
| Shares Outstanding $0.001 par value shares of beneficial interest (unlimited shares authorized) (not in 000's) | | | 4,877,337 | | |
Net Asset Value, Offering and Redemption Price Per Share | | $ | 17.96 | | |
CLASS A: | |
Net Assets | | $ | 43,576 | | |
| Shares Outstanding $0.001 par value shares of beneficial interest (unlimited shares authorized) (not in 000's) | | | 2,479,755 | | |
Net Asset Value, Redemption Price Per Share | | $ | 17.57 | | |
Maximum Sales Load | | | 5.25 | % | |
Maximum Sales Charge | | $ | 0.97 | | |
Maximum Offering Price Per Share | | $ | 18.54 | | |
CLASS L: | |
Net Assets | | $ | 573 | | |
| Shares Outstanding $0.001 par value shares of beneficial interest (unlimited shares authorized) (not in 000's) | | | 34,074 | | |
Net Asset Value, Offering and Redemption Price Per Share | | $ | 16.82 | | |
CLASS C: | |
Net Assets | | $ | 10,984 | | |
| Shares Outstanding $0.001 par value shares of beneficial interest (unlimited shares authorized) (not in 000's) | | | 664,069 | | |
Net Asset Value, Offering and Redemption Price Per Share | | $ | 16.54 | | |
@ Amount is less than $500.
The accompanying notes are an integral part of the financial statements.
9
Morgan Stanley Institutional Fund, Inc.
Annual Report — December 31, 2019
Global Advantage Portfolio
Statement of Operations | | Year Ended
December 31, 2019
(000) | |
Investment Income: | |
Dividends from Securities of Unaffiliated Issuers (Net of $147 of Foreign Taxes Withheld) | | $ | 1,157 | | |
Dividends from Security of Affiliated Issuer (Note G) | | | 75 | | |
Income from Securities Loaned — Net | | | 41 | | |
Total Investment Income | | | 1,273 | | |
Expenses: | |
Advisory Fees (Note B) | | | 1,044 | | |
Shareholder Services Fees — Class A (Note D) | | | 100 | | |
Distribution and Shareholder Services Fees — Class L (Note D) | | | 4 | | |
Distribution and Shareholder Services Fees — Class C (Note D) | | | 102 | | |
Sub Transfer Agency Fees — Class I | | | 71 | | |
Sub Transfer Agency Fees — Class A | | | 50 | | |
Sub Transfer Agency Fees — Class L | | | — | @ | |
Sub Transfer Agency Fees — Class C | | | 6 | | |
Registration Fees | | | 120 | | |
Administration Fees (Note C) | | | 104 | | |
Professional Fees | | | 78 | | |
Transfer Agency Fees — Class I (Note E) | | | 22 | | |
Transfer Agency Fees — Class A (Note E) | | | 3 | | |
Transfer Agency Fees — Class L (Note E) | | | 1 | | |
Transfer Agency Fees — Class C (Note E) | | | 8 | | |
Shareholder Reporting Fees | | | 23 | | |
Custodian Fees (Note F) | | | 21 | | |
Directors' Fees and Expenses | | | 10 | | |
Pricing Fees | | | 2 | | |
Reorganization Expense | | | 1 | | |
Other Expenses | | | 27 | | |
Expenses Before Non Operating Expenses | | | 1,797 | | |
Bank Overdraft Expense | | | 2 | | |
Total Expenses | | | 1,799 | | |
Reimbursement of Class Specific Expenses — Class I (Note B) | | | (91 | ) | |
Reimbursement of Class Specific Expenses — Class A (Note B) | | | (23 | ) | |
Reimbursement of Class Specific Expenses — Class L (Note B) | | | (1 | ) | |
Reimbursement of Class Specific Expenses — Class C (Note B) | | | (4 | ) | |
Rebate from Morgan Stanley Affiliate (Note G) | | | (7 | ) | |
Net Expenses | | | 1,673 | | |
Net Investment Loss | | | (400 | ) | |
Realized Gain (Loss): | |
Investments Sold | | | 8,402 | | |
Foreign Currency Translation | | | (1 | ) | |
Net Realized Gain | | | 8,401 | | |
Change in Unrealized Appreciation (Depreciation): | |
Investments | | | 24,236 | | |
Foreign Currency Translation | | | (— | @) | |
Net Change in Unrealized Appreciation (Depreciation) | | | 24,236 | | |
Net Realized Gain and Change in Unrealized Appreciation (Depreciation) | | | 32,637 | | |
Net Increase in Net Assets Resulting from Operations | | $ | 32,237 | | |
@ Amount is less than $500.
The accompanying notes are an integral part of the financial statements.
10
Morgan Stanley Institutional Fund, Inc.
Annual Report — December 31, 2019
Global Advantage Portfolio
Statements of Changes in Net Assets | | Year Ended
December 31, 2019
(000) | | Year Ended
December 31, 2018
(000) | |
Increase (Decrease) in Net Assets: | |
Operations: | |
Net Investment Loss | | $ | (400 | ) | | $ | (123 | ) | |
Net Realized Gain (Loss) | | | 8,401 | | | | (3,518 | ) | |
Net Change in Unrealized Appreciation (Depreciation) | | | 24,236 | | | | (3,994 | ) | |
Net Increase (Decrease) in Net Assets Resulting from Operations | | | 32,237 | | | | (7,635 | ) | |
Dividends and Distributions to Shareholders: | |
Class I | | | (1,881 | ) | | | (727 | ) | |
Class A | | | (956 | ) | | | (314 | ) | |
Class L | | | (13 | ) | | | (14 | ) | |
Class C | | | (250 | ) | | | (47 | ) | |
Total Dividends and Distributions to Shareholders | | | (3,100 | ) | | | (1,102 | ) | |
Capital Share Transactions:(1) | |
Class I: | |
Subscribed | | | 29,609 | | | | 25,380 | | |
Issued due to a Tax-free Reorganization | | | — | | | | 58,648 | | |
Distributions Reinvested | | | 1,880 | | | | 619 | | |
Redeemed | | | (21,827 | ) | | | (25,880 | ) | |
Class A: | |
Subscribed | | | 10,308 | | | | 6,300 | | |
Issued due to a Tax-free Reorganization | | | — | | | | 29,480 | | |
Distributions Reinvested | | | 955 | | | | 313 | | |
Redeemed | | | (9,908 | ) | | | (4,930 | ) | |
Class L: | |
Exchanged | | | — | | | | 16 | | |
Issued due to a Tax-free Reorganization | | | — | | | | 191 | | |
Distributions Reinvested | | | 13 | | | | 14 | | |
Redeemed | | | (28 | ) | | | (40 | ) | |
Class C: | |
Subscribed | | | 1,557 | | | | 930 | | |
Issued due to a Tax-free Reorganization | | | — | | | | 9,958 | | |
Distributions Reinvested | | | 250 | | | | 46 | | |
Redeemed | | | (2,463 | ) | | | (1,521 | ) | |
Net Increase in Net Assets Resulting from Capital Share Transactions | | | 10,346 | | | | 99,524 | | |
Total Increase in Net Assets | | | 39,483 | | | | 90,787 | | |
Net Assets: | |
Beginning of Period | | | 103,245 | | | | 12,458 | | |
End of Period | | $ | 142,728 | | | $ | 103,245 | | |
The accompanying notes are an integral part of the financial statements.
11
Morgan Stanley Institutional Fund, Inc.
Annual Report — December 31, 2019
Global Advantage Portfolio
Statements of Changes in Net Assets (cont'd) | | Year Ended
December 31, 2019
(000) | | Year Ended
December 31, 2018
(000) | |
(1) Capital Share Transactions: | |
Class I: | |
Shares Subscribed | | | 1,751 | | | | 1,627 | | |
Shares Issued due to a Tax-free Reorganization | | | — | | | | 3,982 | | |
Shares Issued on Distributions Reinvested | | | 106 | | | | 40 | | |
Shares Redeemed | | | (1,296 | ) | | | (1,786 | ) | |
Net Increase in Class I Shares Outstanding | | | 561 | | | | 3,863 | | |
Class A: | |
Shares Subscribed | | | 615 | | | | 411 | | |
Shares Issued due to a Tax-free Reorganization | | | — | | | | 2,037 | | |
Shares Issued on Distributions Reinvested | | | 55 | | | | 21 | | |
Shares Redeemed | | | (614 | ) | | | (346 | ) | |
Net Increase in Class A Shares Outstanding | | | 56 | | | | 2,123 | | |
Class L: | |
Shares Exchanged | | | — | | | | 1 | | |
Shares Issued due to a Tax-free Reorganization | | | — | | | | 14 | | |
Shares Issued on Distributions Reinvested | | | 1 | | | | 1 | | |
Shares Redeemed | | | (2 | ) | | | (3 | ) | |
Net Increase (Decrease) in Class L Shares Outstanding | | | (1 | ) | | | 13 | | |
Class C: | |
Shares Subscribed | | | 97 | | | | 62 | | |
Shares Issued due to a Tax-free Reorganization | | | — | | | | 724 | | |
Shares Issued on Distributions Reinvested | | | 15 | | | | 3 | | |
Shares Redeemed | | | (160 | ) | | | (115 | ) | |
Net Increase (Decrease) in Class C Shares Outstanding | | | (48 | ) | | | 674 | | |
The accompanying notes are an integral part of the financial statements.
12
Morgan Stanley Institutional Fund, Inc.
Annual Report — December 31, 2019
Financial Highlights
Global Advantage Portfolio
| | | Class I | |
| | | Year Ended December 31, | |
Selected Per Share Data and Ratios | | 2019 | | 2018 | | 2017 | | 2016(1) | | 2015 | |
Net Asset Value, Beginning of Period | | $ | 13.96 | | | $ | 15.43 | | | $ | 12.12 | | | $ | 12.36 | | | $ | 12.74 | | |
Income (Loss) from Investment Operations: | |
Net Investment Income (Loss)(2) | | | (0.02 | ) | | | (0.03 | ) | | | (0.03 | ) | | | 0.00 | (3) | | | 0.05 | | |
Net Realized and Unrealized Gain (Loss) | | | 4.41 | | | | (0.80 | ) | | | 5.07 | | | | 0.02 | | | | 0.46 | | |
Total from Investment Operations | | | 4.39 | | | | (0.83 | ) | | | 5.04 | | | | 0.02 | | | | 0.51 | | |
Distributions from and/or in Excess of: | |
Net Investment Income | | | — | | | | — | | | | — | | | | — | | | | (0.03 | ) | |
Net Realized Gain | | | (0.39 | ) | | | (0.64 | ) | | | (1.73 | ) | | | (0.26 | ) | | | (0.86 | ) | |
Total Distributions | | | (0.39 | ) | | | (0.64 | ) | | | (1.73 | ) | | | (0.26 | ) | | | (0.89 | ) | |
Net Asset Value, End of Period | | $ | 17.96 | | | $ | 13.96 | | | $ | 15.43 | | | $ | 12.12 | | | $ | 12.36 | | |
Total Return(4) | | | 31.49 | % | | | (5.75 | )% | | | 41.56 | % | | | 0.21 | % | | | 3.85 | % | |
Ratios to Average Net Assets and Supplemental Data: | |
Net Assets, End of Period (Thousands) | | $ | 87,595 | | | $ | 60,271 | | | $ | 7,005 | | | $ | 3,229 | | | $ | 1,785 | | |
Ratio of Expenses Before Expense Limitation | | | 1.21 | % | | | 1.82 | % | | | 3.67 | % | | | 3.82 | % | | | 5.38 | % | |
Ratio of Expenses After Expense Limitation | | | 1.09 | %(5) | | | 1.09 | %(5) | | | 1.09 | %(5) | | | 1.09 | %(5) | | | 1.11 | %(5)(6) | |
Ratio of Expenses After Expense Limitation Excluding Non-Operating Expenses | | | 1.09 | %(5) | | | N/A | | | | N/A | | | | N/A | | | | N/A | | |
Ratio of Net Investment Income (Loss) | | | (0.11 | )%(5) | | | (0.19 | )%(5) | | | (0.19 | )%(5) | | | 0.04 | %(5) | | | 0.37 | %(5) | |
Ratio of Rebate from Morgan Stanley Affiliates | | | 0.01 | % | | | 0.01 | % | | | 0.01 | % | | | 0.01 | % | | | 0.00 | %(7) | |
Portfolio Turnover Rate | | | 95 | % | | | 130 | % | | | 103 | % | | | 90 | % | | | 90 | % | |
(1) Reflects prior period custodian out-of-pocket expenses that were reimbursed in September 2016. The amount of the reimbursement was immaterial on a per share basis and did not impact the total return of Class I shares. The Ratio of Expenses After Expense Limitation and the Ratio of Net Investment Income would be unchanged as the reimbursement of custodian fees was offset against expense waivers/reimbursements with no impact to net expenses or net investment income.
(2) Per share amount is based on average shares outstanding.
(3) Amount is less than $0.005 per share.
(4) Calculated based on the net asset value as of the last business day of the period.
(5) The Ratio of Expenses After Expense Limitation and Ratio of Net Investment Income (Loss) reflect the rebate of certain Fund expenses in connection with the investments in Morgan Stanley affiliates during the period. The effect of the rebate on the ratios is disclosed in the above table as "Ratio of Rebate from Morgan Stanley Affiliates."
(6) Effective January 23, 2015, the Adviser has agreed to limit the ratio of expenses to average net assets to the maximum ratio of 1.10% for Class I shares. Prior to January 23, 2015, the maximum ratio was 1.30% for Class I shares.
(7) Amount is less than 0.005%.
The accompanying notes are an integral part of the financial statements.
13
Morgan Stanley Institutional Fund, Inc.
Annual Report — December 31, 2019
Financial Highlights
Global Advantage Portfolio
| | | Class A | |
| | | Year Ended December 31, | |
Selected Per Share Data and Ratios | | 2019 | | 2018 | | 2017 | | 2016(1) | | 2015 | |
Net Asset Value, Beginning of Period | | $ | 13.71 | | | $ | 15.21 | | | $ | 12.01 | | | $ | 12.29 | | | $ | 12.70 | | |
Income (Loss) from Investment Operations: | |
Net Investment Loss(2) | | | (0.07 | ) | | | (0.08 | ) | | | (0.08 | ) | | | (0.05 | ) | | | (0.04 | ) | |
Net Realized and Unrealized Gain (Loss) | | | 4.32 | | | | (0.78 | ) | | | 5.01 | | | | 0.03 | | | | 0.49 | | |
Total from Investment Operations | | | 4.25 | | | | (0.86 | ) | | | 4.93 | | | | (0.02 | ) | | | 0.45 | | |
Distributions from and/or in Excess of: | |
Net Realized Gain | | | (0.39 | ) | | | (0.64 | ) | | | (1.73 | ) | | | (0.26 | ) | | | (0.86 | ) | |
Net Asset Value, End of Period | | $ | 17.57 | | | $ | 13.71 | | | $ | 15.21 | | | $ | 12.01 | | | $ | 12.29 | | |
Total Return(3) | | | 31.04 | % | | | (6.03 | )% | | | 41.02 | % | | | (0.11 | )% | | | 3.40 | % | |
Ratios to Average Net Assets and Supplemental Data: | |
Net Assets, End of Period (Thousands) | | $ | 43,576 | | | $ | 33,240 | | | $ | 4,577 | | | $ | 2,640 | | | $ | 3,414 | | |
Ratio of Expenses Before Expense Limitation | | | 1.48 | % | | | 1.95 | % | | | 3.88 | % | | | 4.09 | % | | | 5.92 | % | |
Ratio of Expenses After Expense Limitation | | | 1.41 | %(4) | | | 1.41 | %(4)(6) | | | 1.41 | %(4) | | | 1.44 | %(4) | | | 1.45 | %(4)(5) | |
Ratio of Expenses After Expense Limitation Excluding Non-Operating Expenses | | | 1.41 | %(4) | | | N/A | | | | N/A | | | | N/A | | | | N/A | | |
Ratio of Net Investment Loss | | | (0.43 | )%(4) | | | (0.54 | )%(4) | | | (0.52 | )%(4) | | | (0.38 | )%(4) | | | (0.34 | )%(4) | |
Ratio of Rebate from Morgan Stanley Affiliates | | | 0.01 | % | | | 0.01 | % | | | 0.01 | % | | | 0.01 | % | | | 0.01 | % | |
Portfolio Turnover Rate | | | 95 | % | | | 130 | % | | | 103 | % | | | 90 | % | | | 90 | % | |
(1) Reflects prior period custodian out-of-pocket expenses that were reimbursed in September 2016. The amount of the reimbursement was immaterial on a per share basis and did not impact the total return of Class A shares. The Ratio of Expenses After Expense Limitation and the Ratio of Net Investment Loss would be unchanged as the reimbursement of custodian fees was offset against expense waivers/reimbursements with no impact to net expenses or net investment loss.
(2) Per share amount is based on average shares outstanding.
(3) Calculated based on the net asset value which does not reflect sales charges, if applicable, as of the last business day of the period.
(4) The Ratio of Expenses After Expense Limitation and Ratio of Net Investment Loss reflect the rebate of certain Fund expenses in connection with the investments in Morgan Stanley affiliates during the period. The effect of the rebate on the ratios is disclosed in the above table as "Ratio of Rebate from Morgan Stanley Affiliates."
(5) Effective January 23, 2015, the Adviser has agreed to limit the ratio of expenses to average net assets to the maximum ratio of 1.45% for Class A shares. Prior to January 23, 2015, the maximum ratio was 1.65% for Class A share.
(6) Effective November 19, 2018, the Adviser has agreed to limit the ratio of expenses to average net assets to the maximum ratio of 1.42% for Class A shares. Prior to November 19, 2018, the maximum ratio was 1.45% for Class A shares.
The accompanying notes are an integral part of the financial statements.
14
Morgan Stanley Institutional Fund, Inc.
Annual Report — December 31, 2019
Financial Highlights
Global Advantage Portfolio
| | | Class L | |
| | | Year Ended December 31, | |
Selected Per Share Data and Ratios | | 2019 | | 2018 | | 2017 | | 2016(1) | | 2015 | |
Net Asset Value, Beginning of Period | | $ | 13.21 | | | $ | 14.75 | | | $ | 11.74 | | | $ | 12.09 | | | $ | 12.56 | | |
Income (Loss) from Investment Operations: | |
Net Investment Loss(2) | | | (0.16 | ) | | | (0.16 | ) | | | (0.15 | ) | | | (0.10 | ) | | | (0.08 | ) | |
Net Realized and Unrealized Gain (Loss) | | | 4.16 | | | | (0.74 | ) | | | 4.89 | | | | 0.01 | | | | 0.47 | | |
Total from Investment Operations | | | 4.00 | | | | (0.90 | ) | | | 4.74 | | | | (0.09 | ) | | | 0.39 | | |
Distributions from and/or in Excess of: | |
Net Realized Gain | | | (0.39 | ) | | | (0.64 | ) | | | (1.73 | ) | | | (0.26 | ) | | | (0.86 | ) | |
Net Asset Value, End of Period | | $ | 16.82 | | | $ | 13.21 | | | $ | 14.75 | | | $ | 11.74 | | | $ | 12.09 | | |
Total Return(3) | | | 30.32 | % | | | (6.50 | )% | | | 40.34 | % | | | (0.70 | )% | | | 2.96 | % | |
Ratios to Average Net Assets and Supplemental Data: | |
Net Assets, End of Period (Thousands) | | $ | 573 | | | $ | 462 | | | $ | 327 | | | $ | 217 | | | $ | 382 | | |
Ratio of Expenses Before Expense Limitation | | | 2.16 | % | | | 3.29 | % | | | 5.07 | % | | | 5.12 | % | | | 6.58 | % | |
Ratio of Expenses After Expense Limitation | | | 1.94 | %(4) | | | 1.94 | %(4) | | | 1.94 | %(4) | | | 1.94 | %(4) | | | 1.96 | %(4)(5) | |
Ratio of Expenses After Expense Limitation Excluding Non-Operating Expenses | | | 1.94 | %(4) | | | N/A | | | | N/A | | | | N/A | | | | N/A | | |
Ratio of Net Investment Loss | | | (0.96 | )%(4) | | | (1.03 | )%(4) | | | (1.05 | )%(4) | | | (0.86 | )%(4) | | | (0.60 | )%(4) | |
Ratio of Rebate from Morgan Stanley Affiliates | | | 0.01 | % | | | 0.01 | % | | | 0.01 | % | | | 0.01 | % | | | 0.00 | %(6) | |
Portfolio Turnover Rate | | | 95 | % | | | 130 | % | | | 103 | % | | | 90 | % | | | 90 | % | |
(1) Reflects prior period custodian out-of-pocket expenses that were reimbursed in September 2016. The amount of the reimbursement was immaterial on a per share basis and did not impact the total return of Class L shares. The Ratio of Expenses After Expense Limitation and the Ratio of Net Investment Loss would be unchanged as the reimbursement of custodian fees was offset against expense waivers/reimbursements with no impact to net expenses or net investment loss.
(2) Per share amount is based on average shares outstanding.
(3) Calculated based on the net asset value as of the last business day of the period.
(4) The Ratio of Expenses After Expense Limitation and Ratio of Net Investment Loss reflect the rebate of certain Fund expenses in connection with the investments in Morgan Stanley affiliates during the period. The effect of the rebate on the ratios is disclosed in the above table as "Ratio of Rebate from Morgan Stanley Affiliates."
(5) Effective January 23, 2015, the Adviser has agreed to limit the ratio of expenses to average net assets to the maximum ratio of 1.95% for Class L shares. Prior to January 23, 2015, the maximum ratio was 2.15% for Class L shares.
(6) Amount is less than 0.005%.
The accompanying notes are an integral part of the financial statements.
15
Morgan Stanley Institutional Fund, Inc.
Annual Report — December 31, 2019
Financial Highlights
Global Advantage Portfolio
| | | Class C | |
| | | Year Ended December 31, | | Period from
April 30, 2015(2) to | |
Selected Per Share Data and Ratios | | 2019 | | 2018 | | 2017 | | 2016(1) | | December 31, 2015 | |
Net Asset Value, Beginning of Period | | $ | 13.03 | | | $ | 14.60 | | | $ | 11.66 | | | $ | 12.04 | | | $ | 13.30 | | |
Income (Loss) from Investment Operations: | |
Net Investment Loss(3) | | | (0.19 | ) | | | (0.18 | ) | | | (0.19 | ) | | | (0.13 | ) | | | (0.11 | ) | |
Net Realized and Unrealized Gain (Loss) | | | 4.09 | | | | (0.75 | ) | | | 4.86 | | | | 0.01 | | | | (0.26 | ) | |
Total from Investment Operations | | | 3.90 | | | | (0.93 | ) | | | 4.67 | | | | (0.12 | ) | | | (0.37 | ) | |
Distributions from and/or in Excess of: | |
Net Investment Income | | | — | | | | — | | | | — | | | | — | | | | (0.03 | ) | |
Net Realized Gain | | | (0.39 | ) | | | (0.64 | ) | | | (1.73 | ) | | | (0.26 | ) | | | (0.86 | ) | |
Total Distributions | | | (0.39 | ) | | | (0.64 | ) | | | (1.73 | ) | | | (0.26 | ) | | | (0.89 | ) | |
Net Asset Value, End of Period | | $ | 16.54 | | | $ | 13.03 | | | $ | 14.60 | | | $ | 11.66 | | | $ | 12.04 | | |
Total Return(4) | | | 29.97 | % | | | (6.77 | )% | | | 40.02 | % | | | (0.95 | )% | | | (2.94 | )%(7) | |
Ratios to Average Net Assets and Supplemental Data: | |
Net Assets, End of Period (Thousands) | | $ | 10,984 | | | $ | 9,272 | | | $ | 549 | | | $ | 180 | | | $ | 59 | | |
Ratio of Expenses Before Expense Limitation | | | 2.24 | % | | | 2.70 | % | | | 5.22 | % | | | 6.12 | % | | | 12.84 | %(8) | |
Ratio of Expenses After Expense Limitation | | | 2.19 | %(5) | | | 2.19 | %(5) | | | 2.19 | %(5) | | | 2.19 | %(5) | | | 2.20 | %(5)(8) | |
Ratio of Expenses After Expense Limitation Excluding Non-Operating Expenses | | | 2.19 | %(5) | | | N/A | | | | N/A | | | | N/A | | | | N/A | | |
Ratio of Net Investment Loss | | | (1.21 | )%(5) | | | (1.29 | )%(5) | | | (1.30 | )%(5) | | | (1.12 | )%(5) | | | (1.33 | )%(5)(8) | |
Ratio of Rebate from Morgan Stanley Affiliates | | | 0.01 | % | | | 0.01 | % | | | 0.01 | % | | | 0.01 | % | | | 0.00 | %(6)(8) | |
Portfolio Turnover Rate | | | 95 | % | | | 130 | % | | | 103 | % | | | 90 | % | | | 90 | % | |
(1) Reflects prior period custodian out-of-pocket expenses that were reimbursed in September 2016. The amount of the reimbursement was immaterial on a per share basis and did not impact the total return of Class C shares. The Ratio of Expenses After Expense Limitation and the Ratio of Net Investment Loss would be unchanged as the reimbursement of custodian fees was offset against expense waivers/reimbursements with no impact to net expenses or net investment loss.
(2) Commencement of Offering.
(3) Per share amount is based on average shares outstanding.
(4) Calculated based on the net asset value which does not reflect sales charges, if applicable, as of the last business day of the period.
(5) The Ratio of Expenses After Expense Limitation and Ratio of Net Investment Loss reflect the rebate of certain Fund expenses in connection with the investments in Morgan Stanley affiliates during the period. The effect of the rebate on the ratios is disclosed in the above table as "Ratio of Rebate from Morgan Stanley Affiliates."
(6) Amount is less than 0.005%.
(7) Not annualized.
(8) Annualized.
The accompanying notes are an integral part of the financial statements.
16
Morgan Stanley Institutional Fund, Inc.
Annual Report — December 31, 2019
Notes to Financial Statements
Morgan Stanley Institutional Fund, Inc. (the "Company") is registered under the Investment Company Act of 1940, as amended (the "Act"), as an open-end management investment company. The Company is comprised of thirty-two separate, active, diversified and non-diversified funds (individually referred to as a "Fund," collectively as the "Funds"). The Company applies investment company accounting and reporting guidance.
The accompanying financial statements relate to the Global Advantage Portfolio. The Fund seeks long-term capital appreciation.
The Fund offers four classes of shares — Class I, Class A, Class L and Class C. On April 30, 2015, the Fund suspended offering Class L shares. Existing Class L shareholders may invest through reinvestment of dividends and distributions.
On November 16, 2018, the Fund acquired the net assets of the Company's Global Insight Portfolio ("Global Insight") and Global Discovery Portfolio ("Global Discovery"), an open-end investment company, based on the respective valuations as of the close of business on November 16, 2018, pursuant to a Plan of Reorganization approved by the shareholders of Global Insight and Global Discovery on October 17, 2018 ("Reorganization"). The purpose of the transaction was to combine three portfolios managed by Morgan Stanley Investment Management Inc., (the "Adviser") with comparable investment objectives and strategies. The acquisition was accomplished by a tax-free exchange of 454,229 Class I shares of the Fund at a net asset value ("NAV") of $14.73 for 541,872 Class I shares of Global Insight and 3,527,274 Class I shares of the Fund at a NAV of $14.73 for 3,735,808 Class I shares of Global Discovery; 153,953 Class A shares of the Fund at a NAV of $14.47 for 180,488 Class A shares of Global Insight and 1,883,383 Class A shares of the Fund at a NAV of $14.47 for 1,972,973 Class A shares of Global Discovery; 4,092 Class L shares of the Fund at a NAV of $13.95 for 4,734 Class L shares of Global Insight and 9,567 Class L shares of the Fund at a NAV of $13.95 for 9,832 Class L shares of Global Discovery; 20,813 Class C shares of the Fund at a NAV of $13.76 for 24,021 Class C shares of Global Insight and 702,884 Class C shares of the Fund at a NAV of $13.76 for 725,549 Class C shares of Global Discovery. The net assets of Global Insight and Global Discovery before the Reorganization were approximately $9,262,000 and $89,014,000, respectively, including unrealized appreciation (depreciation) of approximately $462,000 and $(32,000), respectively at November 16, 2018. The investment portfolio of Global Insight and Global Discovery,
with a fair value of approximately $9,273,000 and $92,205,000, respectively and identified cost of approximately $8,811,000 and $92,237,000, respectively, on November 16, 2018, was the principal asset acquired by the Fund. For financial reporting purposes, assets received and shares issued by the Fund were recorded at fair value; however, the cost basis of the investments received from Global Insight and Global Discovery was carried forward to align ongoing reporting of the Fund's realized and unrealized gains and losses with amounts distributable to shareholders for tax purposes. Immediately prior to the Reorganization, the net assets of the Fund were approximately $29,406,000. Immediately after the Reorganization, the net assets of the Fund were approximately $127,682,000.
Upon closing of the Reorganization, shareholders of Global Insight and Global Discovery received shares of the Fund as follows:
Global
Insight Portfolio | | Global
Discovery Portfolio | | Global
Advantage Portfolio | |
Class I | | Class I | | Class I | |
Class A | | Class A | | Class A | |
Class L | | Class L | | Class L | |
Class C | | Class C | | Class C | |
Assuming the acquisition had been completed on January 1, 2018, the beginning of the annual reporting period of the Fund, the Fund's pro forma results of operations for the year ended December 31, 2018, are as follows:
Net investment Income(1) | | $ | 3,545,000 | | |
Net realized gain and unrealized gain(2) | | $ | 5,637,000 | | |
Net increase in net assets resulting from operations | | $ | 9,182,000 | | |
(1) Approximately $(123,000) as reported, plus approximately $167,000 from Global Insight and $1,695,000 from Global Discovery prior to the Reorganization, plus approximately $153,000 Global Insight and $1,653,000 from Global Discovery of estimated pro-forma eliminated expenses.
(2) Approximately $(7,512,000) as reported, plus approximately $1,936,000 from Global Insight and $11,213,000 from Global Discovery prior to the Reorganization.
Because the combined investment portfolios have been managed as a single integrated portfolio since the acquisition was completed, it is not practicable to separate the amounts of revenue and earnings of Global Insight and Global Discovery that have been included in the Fund's Statement of Operations since November 16, 2018.
A. Significant Accounting Policies: The following significant accounting policies are in conformity with U.S. generally accepted accounting principles ("GAAP"). Such policies are consistently followed by the Company in the preparation of its financial statements. GAAP may require management to make estimates and assumptions that affect the reported amounts
17
Morgan Stanley Institutional Fund, Inc.
Annual Report — December 31, 2019
Notes to Financial Statements (cont'd)
and disclosures in the financial statements. Actual results may differ from those estimates.
In August 2018, the Financial Accounting Standards Board ("FASB") issued Accounting Standards Update ("ASU") 2018-13, Fair Value Measurement (Topic 820) — Disclosures Framework — Changes to Disclosure Requirements of Fair Value Measurement ("ASU 2018-13") which introduces new fair value disclosure requirements as well as eliminates and modifies certain existing fair value disclosure requirements. ASU 2018-13 would be effective for fiscal years beginning after December 15, 2019 and for interim periods within those fiscal years; however, management has elected to early adopt ASU 2018-13 as permitted by the standard. The impact of the Fund's adoption was limited to changes in the Fund's financial statement disclosures regarding fair value, primarily those disclosures related to transfers between levels of the fair value hierarchy and disclosure of the range and weighted average used to develop significant unobservable inputs for Level 3 fair value measurements, when applicable.
1. Security Valuation: (1) An equity portfolio security listed or traded on an exchange is valued at its latest reported sales price (or at the exchange official closing price if such exchange reports an official closing price), and if there were no sales on a given day and if there is no official exchange closing price for that day, the security is valued at the mean between the last reported bid and asked prices if such bid and asked prices are available on the relevant exchanges. If only bid prices are available then the latest bid price may be used. Listed equity securities not traded on the valuation date with no reported bid and asked prices available on the exchange are valued at the mean between the current bid and asked prices obtained from one or more reputable brokers or dealers. In cases where a security is traded on more than one exchange, the security is valued on the exchange designated as the primary market; (2) all other equity portfolio securities for which over-the-counter ("OTC") market quotations are readily available are valued at the latest reported sales price (or at the market official closing price if such market reports an official closing price), and if there was no trading in the security on a given day and if there is no official closing price from relevant markets for that day, the security is valued at the mean between the last reported bid and asked prices if such bid and asked prices are available on the relevant markets. An unlisted equity security that does not trade on the valuation date and for which bid and asked prices
from the relevant markets are unavailable is valued at the mean between the current bid and asked prices obtained from one or more reputable brokers or dealers; (3) listed options are valued at the last reported sales price on the exchange on which they are listed (or at the exchange official closing price if such exchange reports an official closing price). If an official closing price or last reported sales price is unavailable, the listed option should be fair valued at the mean between its latest bid and ask prices. Unlisted options are valued at the mean between their latest bid and ask prices from a broker/dealer or valued by a pricing service/vendor; (4) certain portfolio securities may be valued by an outside pricing service/vendor approved by the Company's Board of Directors (the "Directors"). The pricing service/vendor may employ a pricing model that takes into account, among other things, bids, yield spreads and/or other market data and specific security characteristics. Alternatively, if a valuation is not available from an outside pricing service/vendor, and the security trades on an exchange, the security may be valued at its latest reported sale price (or at the exchange official closing price if such exchange reports an official closing price), prior to the time when assets are valued. If there are no sales on a given day and if there is no official exchange closing price for that day, the security is valued at the mean between the last reported bid and asked prices if such bid and asked prices are available in the relevant exchanges. If the Adviser, a wholly-owned subsidiary of Morgan Stanley, determines that the price provided by the outside pricing service/vendor or exchange does not reflect the security's fair value or is unable to provide a price, prices from brokers or dealers may also be utilized. In these circumstances, the value of the security will be the mean of bid and asked prices obtained from brokers or dealers; (5) when market quotations are not readily available, including circumstances under which the Adviser determines that the closing price, last sale price or the mean between the last reported bid and asked prices are not reflective of a security's market value, portfolio securities are valued at their fair value as determined in good faith under procedures established by and under the general supervision of the Directors. Occasionally, developments affecting the closing prices of securities and other assets may occur between the times at which valuations of such securities are determined (that is, close of the foreign market on which the securities trade) and the close of business of the New York Stock Exchange ("NYSE"). If developments occur
18
Morgan Stanley Institutional Fund, Inc.
Annual Report — December 31, 2019
Notes to Financial Statements (cont'd)
during such periods that are expected to materially affect the value of such securities, such valuations may be adjusted to reflect the estimated fair value of such securities as of the close of the NYSE, as determined in good faith by the Directors or by the Adviser using a pricing service and/or procedures approved by the Directors; (6) quotations of foreign portfolio securities, other assets and liabilities and forward contracts stated in foreign currency are translated into U.S. dollar equivalents at the prevailing market rates prior to the close of the NYSE; and (7) investments in mutual funds, including the Morgan Stanley Institutional Liquidity Funds, are valued at the NAV as of the close of each business day.
The Directors have responsibility for determining in good faith the fair value of the investments, and the Directors may appoint others, such as the Company's Adviser or a valuation committee, to assist the Directors in determining fair value and to make the actual calculations pursuant to the fair valuation methodologies previously approved by the Directors. Under procedures approved by the Directors, the Company's Adviser has formed a Valuation Committee whose members are approved by the Directors. The Valuation Committee provides administration and oversight of the Company's valuation policies and procedures, which are reviewed at least annually by the Directors. These procedures allow the Company to utilize independent pricing services, quotations from securities and financial instrument dealers and other market sources to determine fair value.
2. Fair Value Measurement: FASB Accounting Standards CodificationTM ("ASC") 820, "Fair Value Measurement" ("ASC 820"), defines fair value as the value that the Fund would receive to sell an investment or pay to transfer a liability in a timely transaction with an independent buyer in the principal market, or in the absence of a principal market, the most advantageous market for the investment or liability. ASC 820 establishes a three-tier hierarchy to distinguish between (1) inputs that reflect the assumptions market participants would use in valuing an asset or liability developed based on market data obtained from sources independent of the reporting entity (observable inputs) and (2) inputs that reflect the reporting entity's own assumptions about the assumptions market participants would use in valuing an asset or liability developed based on the best information available in the circumstances (unobservable inputs) and to establish classification of fair value measurements for disclosure
purposes. Various inputs are used in determining the value of the Fund's investments. The inputs are summarized in the three broad levels listed below:
• Level 1 – unadjusted quoted prices in active markets for identical investments
• Level 2 – other significant observable inputs (including quoted prices for similar investments, interest rates, prepayment speeds, credit risk, etc.)
• Level 3 – significant unobservable inputs including the Fund's own assumptions in determining the fair value of investments. Factors considered in making this determination may include, but are not limited to, information obtained by contacting the issuer, analysts, or the appropriate stock exchange (for exchange-traded securities), analysis of the issuer's financial statements or other available documents and, if necessary, available information concerning other securities in similar circumstances.
The inputs or methodology used for valuing securities are not necessarily an indication of the risk associated with investing in those securities and the determination of the significance of a particular input to the fair value measurement in its entirety requires judgment and considers factors specific to each security.
The following is a summary of the inputs used to value the Fund's investments as of December 31, 2019:
Investment Type | | Level 1
Unadjusted
quoted
prices
(000) | | Level 2
Other
significant
observable
inputs
(000) | | Level 3
Significant
unobservable
inputs
(000) | | Total
(000) | |
Assets: | |
Common Stocks | |
Banks | | $ | 4,265 | | | $ | — | | | $ | — | | | $ | 4,265 | | |
Capital Markets | | | 8,013 | | | | — | | | | — | | | | 8,013 | | |
Chemicals | | | 5,153 | | | | 5,165 | | | | — | | | | 10,318 | | |
Commercial Services &
Supplies | | | 5,952 | | | | — | | | | — | | | | 5,952 | | |
Entertainment | | | 10,493 | | | | — | | | | — | | | | 10,493 | | |
Health Care Equipment &
Supplies | | | 5,666 | | | | — | | | | — | | | | 5,666 | | |
Health Care Technology | | | 5,073 | | | | — | | | | — | | | | 5,073 | | |
Information Technology
Services | | | 18,134 | | | | — | | | | — | | | | 18,134 | | |
Interactive Media &
Services | | | 4,241 | | | | — | | | | — | | | | 4,241 | | |
19
Morgan Stanley Institutional Fund, Inc.
Annual Report — December 31, 2019
Notes to Financial Statements (cont'd)
Investment Type | | Level 1
Unadjusted
quoted
prices
(000) | | Level 2
Other
significant
observable
inputs
(000) | | Level 3
Significant
unobservable
inputs
(000) | | Total
(000) | |
Common Stocks (cont'd) | |
Internet & Direct
Marketing Retail | | $ | 14,402 | | | $ | 1,520 | | | $ | — | | | $ | 15,922 | | |
Pharmaceuticals | | | 2,307 | | | | — | | | | — | | | | 2,307 | | |
Real Estate
Management &
Development | | | 3,586 | | | | — | | | | — | | | | 3,586 | | |
Software | | | 27,540 | | | | — | | | | — | | | | 27,540 | | |
Textiles, Apparel &
Luxury Goods | | | 18,798 | | | | — | | | | — | | | | 18,798 | | |
Total Common Stocks | | | 133,623 | | | | 6,685 | | | | — | | | | 140,308 | | |
Preferred Stocks | |
Internet & Direct
Marketing Retail | | | — | | | | — | | | | 252 | | | | 252 | | |
Software | | | — | | | | — | | | | 54 | | | | 54 | | |
Total Preferred Stocks | | | — | | | | — | | | | 306 | | | | 306 | | |
Call Options Purchased | | | — | | | | 46 | | | | — | | | | 46 | | |
Short-Term Investment | |
Investment Company | | | 2,991 | | | | — | | | | — | | | | 2,991 | | |
Total Assets | | $ | 136,614 | | | $ | 6,731 | | | $ | 306 | | | $ | 143,651 | | |
Transfers between investment levels may occur as the markets fluctuate and/or the availability of data used in an investment's valuation changes.
Following is a reconciliation of investments in which significant unobservable inputs (Level 3) were used in determining fair value:
| | | Preferred
Stocks
(000) | |
Beginning Balance | | $ | 273 | | |
Purchases | | | — | | |
Sales | | | — | | |
Amortization of discount | | | — | | |
Transfers in | | | — | | |
Transfers out | | | — | | |
Corporate actions | | | — | | |
Change in unrealized appreciation (depreciation) | | | 33 | | |
Realized gains (losses) | | | — | | |
Ending Balance | | $ | 306 | | |
Net change in unrealized appreciation (depreciation) from investments
still held as of December 31, 2019 | | $ | 33 | | |
The following table presents additional information about valuation techniques and inputs used for investments that are measured at fair value and categorized within Level 3 as of December 31, 2019. Various valuation techniques were used in the valuation of certain investments and weighted based on the level of significance. The Fund calculated the weighted averages of the unobservable inputs relative to each investment's fair value as of December 31, 2019.
| | | Fair Value at
December 31, 2019
(000) | | Valuation
Technique | | Unobservable
Input | | Amount or Range/
Weighted Average* | | Impact to
Valuation from an
Increase in Input** | |
Preferred Stocks | | $ | 306 | | | Discounted Cash Flow | | Weighted Average
Cost of Capital | | 12.5%–17.5%/13.9% | | Decrease | |
| | | | | | | Perpetual Growth Rate | | 3.0%–4.0%/3.5% | | Increase | |
| | | | | Market Comparable
Companies | | Enterprise
Value/Revenue | | 1.4x–19.3x/7.5x | | Increase | |
| | | | | | | Discount for Lack
of Marketability | | 8.5%–16.0%/9.7% | | Decrease | |
| | | | | Comparable
Transactions | | Enterprise
Value/Revenue | | 2.3x–16.0x/11.5x | | Increase | |
* Amount is indicative of the weighted average.
** Represents the expected directional change in the fair value of the Level 3 investments that would result from an increase in the corresponding input. A decrease to the unobservable input would have the opposite effect. Significant changes in these inputs could result in significantly higher or lower fair value measurements.
20
Morgan Stanley Institutional Fund, Inc.
Annual Report — December 31, 2019
Notes to Financial Statements (cont'd)
3. Foreign Currency Translation and Foreign Investments: The books and records of the Fund are maintained in U.S. dollars. Foreign currency amounts are translated into U.S. dollars as follows:
– investments, other assets and liabilities at the prevailing rate of exchange on the valuation date;
– investment transactions and investment income at the prevailing rates of exchange on the dates of such transactions.
Although the net assets of the Fund are presented at the foreign exchange rates and market values at the close of the period, the Fund does not isolate that portion of the results of operations arising as a result of changes in the foreign exchange rates from the fluctuations arising from changes in the market prices of securities held at period end. Similarly, the Fund does not isolate the effect of changes in foreign exchange rates from the fluctuations arising from changes in the market prices of securities sold during the period. Accordingly, realized and unrealized foreign currency gains (losses) on investments in securities are included in the reported net realized and unrealized gains (losses) on investment transactions and balances. However, pursuant to U.S. federal income tax regulations, gains and losses from certain foreign currency transactions and the foreign currency portion of gains and losses realized on sales and maturities of foreign denominated debt securities are treated as ordinary income for U.S. federal income tax purposes.
Net realized gains (losses) on foreign currency transactions represent net foreign exchange gains (losses) from foreign currency forward exchange contracts, disposition of foreign currencies, currency gains (losses) realized between the trade and settlement dates on securities transactions, and the difference between the amount of investment income and foreign withholding taxes recorded on the Fund's books and the U.S. dollar equivalent amounts actually received or paid. The change in unrealized currency gains (losses) on foreign currency transactions for the period is reflected in the Statement of Operations.
Foreign security and currency transactions may involve certain considerations and risks not typically associated with those of U.S. dollar denominated transactions as a result of, among other factors, fluctuations of exchange
rates in relation to the U.S. dollar, the possibility of lower levels of governmental supervision and regulation of foreign securities markets and the possibility of political or economic instability.
Governmental approval for foreign investments may be required in advance of making an investment under certain circumstances in some countries, and the extent of foreign investments in domestic companies may be subject to limitation in other countries. Foreign ownership limitations also may be imposed by the charters of individual companies to prevent, among other concerns, violations of foreign investment limitations. As a result, an additional class of shares (identified as "Foreign" in the Portfolio of Investments) may be created and offered for investment. The "local" and "foreign shares" market values may differ. In the absence of trading of the foreign shares in such markets, the Fund values the foreign shares at the closing exchange price of the local shares.
4. Derivatives: The Fund may, but is not required to, use derivative instruments for a variety of purposes, including hedging, risk management, portfolio management or to earn income. Derivatives are financial instruments whose value is based, in part, on the value of an underlying asset, interest rate, index or financial instrument. Prevailing interest rates and volatility levels, among other things, also affect the value of derivative instruments. A derivative instrument often has risks similar to its underlying asset and may have additional risks, including imperfect correlation between the value of the derivative and the underlying asset, risks of default by the counterparty to certain transactions, magnification of losses incurred due to changes in the market value of the securities, instruments, indices or interest rates to which the derivative instrument relates, risks that the transactions may not be liquid and risks arising from margin requirements. The use of derivatives involves risks that are different from, and possibly greater than, the risks associated with other portfolio investments. Derivatives may involve the use of highly specialized instruments that require investment techniques and risk analyses different from those associated with other portfolio investments. All of the Fund's holdings, including derivative instruments, are marked-to-market each day with the change in value reflected in unrealized appreciation (depreciation). Upon disposition, a realized gain or loss is recognized.
21
Morgan Stanley Institutional Fund, Inc.
Annual Report — December 31, 2019
Notes to Financial Statements (cont'd)
Certain derivative transactions may give rise to a form of leverage. Leverage magnifies the potential for gain and the risk of loss. Leverage associated with derivative transactions may cause the Fund to liquidate portfolio positions when it may not be advantageous to do so to satisfy its obligations or to meet earmarking or segregation requirements, pursuant to applicable Securities and Exchange Commission ("SEC") rules and regulations, or may cause the Fund to be more volatile than if the Fund had not been leveraged. Although the Adviser seeks to use derivatives to further the Fund's investment objectives, there is no assurance that the use of derivatives will achieve this result.
Following is a description of the derivative instruments and techniques that the Fund used during the period and their associated risks:
Options: With respect to options, the Fund is subject to equity risk, interest rate risk and foreign currency exchange risk in the normal course of pursuing its investment objectives. If the Fund buys an option, it buys a legal contract giving it the right to buy or sell a specific amount of the underlying instrument or foreign currency, or futures contract on the underlying instrument or foreign currency, at an agreed-upon price during a period of time or on a specified date typically in exchange for a premium paid by the Fund. The Fund may purchase and/or sell put and call options. Purchasing call options tends to increase the Fund's exposure to the underlying (or similar) instrument. Purchasing put options tends to decrease the Fund's exposure to the underlying (or similar) instrument. When entering into purchased option contracts, the Fund bears the risk of interest or exchange rates or securities prices moving unexpectedly, in which case, the Fund may not achieve the anticipated benefits of the purchased option contracts; however the risk of loss is limited to the premium paid. Purchased options are reported as part of "Total Investments in Securities" in the Statement of Assets and Liabilities. Premiums paid for purchasing options which expired are treated as realized losses. If the Fund sells an option, it sells to another party the right to buy from or sell to the Fund a specific amount of the underlying instrument or foreign currency, or futures contract on the underlying instrument or foreign currency, at an agreed-upon price during a period of time or on a specified date typically in exchange for a premium received by the
Fund. When options are purchased OTC, the Fund bears the risk that the counterparty that wrote the option will be unable or unwilling to perform its obligations under the option contract. Options may also be illiquid and the Fund may have difficulty closing out its position. A decision as to whether, when and how to use options involves the exercise of skill and judgment and even a well-conceived option transaction may be unsuccessful because of market behavior or unexpected events. The prices of options can be highly volatile and the use of options can lower total returns.
FASB ASC 815, "Derivatives and Hedging" ("ASC 815"), is intended to improve financial reporting about derivative instruments by requiring enhanced disclosures to enable investors to better understand how and why the Fund uses derivative instruments, how these derivative instruments are accounted for and their effects on the Fund's financial position and results of operations.
The following table sets forth the fair value of the Fund's derivative contracts by primary risk exposure as of December 31, 2019:
| | | Asset Derivatives
Statement of Assets and
Liabilities Location | | Primary Risk
Exposure | | Value
(000) | |
Purchased Options | | Investments, at Value
(Purchased Options) | | Currency Risk | | $ | 46 | (a) | |
(a) Amounts are included in Investments in Securities in the Statement of Assets and Liabilities.
The following tables set forth by primary risk exposure the Fund's realized gains (losses) and change in unrealized appreciation (depreciation) by type of derivative contract for the year ended December 31, 2019 in accordance with ASC 815:
Realized Gain (Loss) | |
Primary Risk Exposure | | Derivative Type | | Value
(000) | |
Currency Risk | | Investments
(Purchased Options) | | | $(299)(b) | | |
(b) Amounts are included in Investments Sold in the Statement of Operations.
Change in Unrealized Appreciation (Depreciation) | |
Primary Risk Exposure | | Derivative Type | | Value
(000) | |
Currency Risk | | Investments
(Purchased Options) | | | $(114)(c) | | |
(c) Amounts are included in Investments in the Statement of Operations.
22
Morgan Stanley Institutional Fund, Inc.
Annual Report — December 31, 2019
Notes to Financial Statements (cont'd)
At December 31, 2019, the Fund's derivative assets and liabilities are as follows:
Gross Amounts of Assets and Liabilities
Presented in the Statement of Assets and Liabilities | |
Derivatives | | Assets(d)
(000) | | Liabilities(d)
(000) | |
Purchased Options | | $ | 46 | (a) | | $ | — | | |
(a) Amounts are included in Investments in Securities in the Statement of Assets and Liabilities.
(d) Absent an event of default or early termination, OTC derivative assets and liabilities are presented gross and not offset in the Statement of Assets and Liabilities.
The Fund typically enters into International Swaps and Derivatives Association, Inc. Master Agreements ("ISDA Master Agreements") or similar master agreements (collectively, "Master Agreements") with its contract counterparties for certain OTC derivatives in order to, among other things, reduce its credit risk to counterparties. ISDA Master Agreements include provisions for general obligations, representations, collateral and events of default or termination. Under an ISDA Master Agreement, the Fund typically may offset with the counterparty certain OTC derivative financial instruments' payables and/or receivables with collateral held and/or posted and create one single net payment (close-out netting) in the event of default, termination and/or potential deterioration in the credit quality of the counterparty. Various Master Agreements govern the terms of certain transactions with counterparties, including transactions such as swap, forward, repurchase and reverse repurchase agreements. These Master Agreements typically attempt to reduce the counterparty risk associated with such transactions by specifying credit protection mechanisms and providing standardization that improves legal certainty. Cross-termination provisions under Master Agreements typically provide that a default in connection with one transaction between the Fund and a counterparty gives the non-defaulting party the right to terminate any other transactions in place with the defaulting party to create one single net payment due to/due from the defaulting party and may be a feature in certain Master Agreements. In the event the Fund exercises its right to terminate a Master Agreement after a counterparty experiences a termination event as defined in the Master Agreement, the return of collateral with market value in excess of the Fund's net liability may be delayed or denied.
The following table presents derivative financial instruments that are subject to enforceable netting arrangements as of December 31, 2019:
Gross Amounts Not Offset in the Statement of Assets and Liabilities | |
Counterparty | | Gross Asset
Derivatives
Presented in
the Statement of
Assets and
Liabilities(a)
(000) | | Financial
Instrument
(000) | | Collateral
Received(e)
(000) | | Net Amount
(not less
than $0)
(000) | |
BNP Paribas | | $ | — | @ | | $ | — | | | $ | — | | | $ | — | @ | |
Royal Bank of Scotland | | | 46 | | | | — | | | | (46 | ) | | | 0 | | |
Total | | $ | 46 | | | $ | — | | | $ | (46 | ) | | $ | — | @ | |
@ Value is less than $500.
(a) Amounts are included in Investments in Securities in the Statement of Assets and Liabilities.
(e) In some instances, the actual collateral received or pledged may be more than the amount shown here due to overcollateralization.
For the year ended December 31, 2019, the approximate average monthly amount outstanding for each derivative type is as follows:
Purchased Options: | |
Average monthly notional amount | | | 77,876,000 | | |
5. Securities Lending: The Fund lends securities to qualified financial institutions, such as broker-dealers, to earn additional income. Any increase or decrease in the fair value of the securities loaned that might occur and any interest earned or dividends declared on those securities during the term of the loan would remain in the Fund.
The Fund would receive cash or securities as collateral in an amount equal to or exceeding 100% of the current fair value of the loaned securities. The collateral is marked-to-market daily by State Street Bank and Trust Company ("State Street"), the securities lending agent, to ensure that a minimum of 100% collateral coverage is maintained.
Based on pre-established guidelines, the securities lending agent invests any cash collateral that is received in an affiliated money market portfolio and repurchase agreements. Securities lending income is generated from the earnings on the invested collateral and borrowing fees, less any rebates owed to the borrowers and compensation to the lending agent, and is recorded as "Income from Securities Loaned — Net" in the Fund's Statement of Operations. Risks in securities lending transactionsare that a borrower may not provide additional collateral when required or return the securities when due, and
23
Morgan Stanley Institutional Fund, Inc.
Annual Report — December 31, 2019
Notes to Financial Statements (cont'd)
that the value of the short-term investments will be less than the amount of cash collateral plus any rebate that is required to be returned to the borrower.
The Fund has the right under the securities lending agreement to recover the securities from the borrower on demand.
At December 31, 2019, the Fund did not have any outstanding securities on loan.
6. Restricted Securities: The Fund invests in unregistered or otherwise restricted securities. The term "restricted securities" refers to securities that are unregistered or are held by control persons of the issuer and securities that are subject to contractual restrictions on their resale. As a result, restricted securities may be more difficult to value and the Fund may have difficulty disposing of such assets either in a timely manner or for a reasonable price. In order to dispose of an unregistered security, the Fund, where it has contractual rights to do so, may have to cause such security to be registered. A considerable period may elapse between the time the decision is made to sell the security and the time the security is registered so that the Fund can sell it. Contractual restrictions on the resale of securities vary in length and scope and are generally the result of a negotiation between the issuer and the acquirer of the securities. The Fund would, in either case, bear market risks during that period. Restricted securities are identified in the Portfolio of Investments.
7. Indemnifications: The Company enters into contracts that contain a variety of indemnifications. The Company's maximum exposure under these arrangements is unknown. However, the Company has not had prior claims or losses pursuant to these contracts and expects the risk of loss to be remote.
8. Dividends and Distributions to Shareholders: Dividends and distributions to shareholders are recorded on the ex-dividend date. Dividends from net investment income, if any, are declared and paid annually. Net realized capital gains, if any, are distributed at least annually.
9. Security Transactions, Income and Expenses: Security transactions are accounted for on the trade date (date the order to buy or sell is executed). Realized gains and losses on the sale of investment securities are determined on the specific identified cost method. Dividend income and other distributions are recorded on the ex-dividend date (except for certain foreign dividends which
may be recorded as soon as the Fund is informed of such dividends) net of applicable withholding taxes. Interest income is recognized on the accrual basis except where collection is in doubt. Discounts are accreted and premiums are amortized over the life of the respective securities. Most expenses of the Company can be directly attributed to a particular Fund. Expenses which cannot be directly attributed are apportioned among the Funds based upon relative net assets or other appropriate methods. Income, expenses (other than class specific expenses — distribution and shareholder services, transfer agency and sub transfer agency fees) and realized and unrealized gains or losses are allocated to each class of shares based upon their relative net assets.
B. Advisory Fees: The Adviser, a wholly-owned subsidiary of Morgan Stanley, provides the Fund with advisory services under the terms of an Investment Advisory Agreement, paid quarterly, at the annual rate based on the daily net assets as follows:
First $1
billion | | Over $1
billion | |
| | 0.80 | % | | | 0.75 | % | |
For the year ended December 31, 2019, the advisory fee rate (net of rebate) was equivalent to an annual effective rate of 0.79% of the Fund's average daily net assets.
The Adviser has agreed to reduce its advisory fee and/or reimburse the Fund so that total annual Fund operating expenses, excluding certain investment related expenses, taxes, interest and other extraordinary expenses (including litigation), will not exceed 1.10% for Class I shares, 1.42% for Class A shares, 1.95% for Class L shares and 2.20% for Class C shares. The fee waivers and/or expense reimbursements will continue for at least two years from the date of the Reorganization or until such time as the Directors act to discontinue all or a portion of such waivers and/or reimbursements when they deem such action is appropriate. For the year ended December 31, 2019, approximately $119,000 of other expenses were reimbursed by the Adviser pursuant to this arrangement.
C. Administration Fees: The Adviser also serves as Administrator to the Company and provides administrative services pursuant to an Administration Agreement for an annual fee, accrued daily and paid monthly, of 0.08% of the Fund's average daily net assets.
Under a Sub-Administration Agreement between the Administrator and State Street, State Street provides certain administrative services to the Company. For such services, the
24
Morgan Stanley Institutional Fund, Inc.
Annual Report — December 31, 2019
Notes to Financial Statements (cont'd)
Administrator pays State Street a portion of the fee the Administrator receives from the Fund.
D. Distribution and Shareholder Services Fees: Morgan Stanley Distribution, Inc. ("MSDI" or the "Distributor"), a wholly-owned subsidiary of the Adviser and an indirect subsidiary of Morgan Stanley, serves as the Company's Distributor of Fund shares pursuant to a Distribution Agreement. The Company has adopted a Shareholder Services Plan with respect to Class A shares pursuant to Rule 12b-1 under the Act. Under the Shareholder Services Plan, the Fund pays the Distributor a shareholder services fee, accrued daily and paid monthly, at an annual rate of 0.25% of the Fund's average daily net assets attributable to Class A shares.
The Company has adopted a Distribution and Shareholder Services Plan with respect to Class L shares pursuant to Rule 12b-1 under the Act. Under the Distribution and Shareholder Services Plan, the Fund pays the Distributor a distribution fee, accrued daily and paid monthly, at an annual rate of 0.50% and a shareholder services fee, accrued daily and paid monthly, at an annual rate of 0.25% of the Fund's average daily net assets attributable to Class L shares.
The Company has adopted a Distribution and Shareholder Services Plan with respect to Class C shares pursuant to Rule 12b-1 under the Act. Under the Distribution and Shareholder Services Plan, the Fund pays the Distributor a distribution fee, accrued daily and paid monthly, at an annual rate of 0.75% and a shareholder services fee, accrued daily and paid monthly, at an annual rate of 0.25% of the Fund's average daily net assets attributable to Class C shares.
The distribution and shareholder services fees are used to support the expenses associated with servicing and maintaining accounts. The Distributor may compensate other parties for providing shareholder support services to investors who purchase Class A, Class L and Class C shares.
E. Dividend Disbursing and Transfer Agent: The Company's dividend disbursing and transfer agent is DST Asset Manager Solutions, Inc. ("DST"). Pursuant to a Transfer Agency Agreement, the Company pays DST a fee based on the number of classes, accounts and transactions relating to the Funds of the Company.
F. Custodian Fees: State Street (the "Custodian") also serves as Custodian for the Company in accordance with a Custodian Agreement. The Custodian holds cash, securities and other assets of the Company as required by the Act. Cus-
tody fees are payable monthly based on assets held in custody, investment purchases and sales activity and account maintenance fees, plus reimbursement for certain out-of-pocket expenses.
G. Security Transactions and Transactions with Affiliates: For the year ended December 31, 2019, purchases and sales of investment securities for the Fund, other than long-term U.S. Government securities and short-term investments were approximately $127,025,000 and $120,678,000, respectively. There were no purchases and sales of long-term U.S. Government securities for the year ended December 31, 2019.
The Fund invests in the Institutional Class of the Morgan Stanley Institutional Liquidity Funds — Treasury Securities Portfolio (the "Liquidity Funds"), an open-end management investment company managed by the Adviser, both directly and as a portion of the securities held as collateral on loaned securities. Advisory fees paid by the Fund are reduced by an amount equal to its pro-rata share of the advisory and administration fees paid by the Fund due to its investment in the Liquidity Funds. For the year ended December 31, 2019, advisory fees paid were reduced by approximately $7,000 relating to the Fund's investment in the Liquidity Funds.
A summary of the Fund's transactions in shares of affiliated investments during the year ended December 31, 2019 is as follows:
Affiliated
Investment
Company | | Value
December 31,
2018
(000) | | Purchases
at Cost
(000) | | Proceeds
from Sales
(000) | | Dividend
Income
(000) | |
Liquidity Funds | | $ | 2,648 | | | $ | 58,630 | | | $ | 58,287 | | | $ | 75 | | |
Affiliated
Investment
Company (cont'd) | | Realized
Gain (Loss)
(000) | | Change in
Unrealized
Appreciation
(Depreciation)
(000) | | Value
December 31,
2019
(000) | |
Liquidity Funds | | $ | — | | | $ | — | | | $ | 2,991 | | |
The Fund is permitted to purchase and sell securities ("cross-trade") from and to other Morgan Stanley Funds as well as other funds and client accounts for which the Adviser or an affiliate of the Adviser serves as investment adviser, pursuant to procedures approved by the Directors in compliance with Rule 17a-7 under the Act (the "Rule"). Each cross-trade is executed at the current market price in compliance with provisions of the Rule. For the year ended December 31, 2019, the Fund did not engage in any cross-trade transactions.
The Fund has an unfunded Deferred Compensation Plan (the "Compensation Plan"), which allows each independent Direc-
25
Morgan Stanley Institutional Fund, Inc.
Annual Report — December 31, 2019
Notes to Financial Statements (cont'd)
tor to defer payment of all, or a portion, of the fees he or she receives for serving on the Board of Directors. Each eligible Director generally may elect to have the deferred amounts credited with a return equal to the total return on one or more of the Morgan Stanley funds that are offered as investment options under the Compensation Plan. Appreciation/depreciation and distributions received from these investments are recorded with an offsetting increase/decrease in the deferred compensation obligation and do not affect the NAV of the Fund.
H. Federal Income Taxes: It is the Fund's intention to continue to qualify as a regulated investment company and distribute all of its taxable and tax-exempt income. Accordingly, no provision for federal income taxes is required in the financial statements.
The Fund may be subject to taxes imposed by countries in which it invests. Such taxes are generally based on income and/or capital gains earned or repatriated. Taxes are accrued based on net investment income, net realized gains and net unrealized appreciation as such income and/or gains are earned. Taxes may also be based on transactions in foreign currency and are accrued based on the value of investments denominated in such currency.
FASB ASC 740-10, "Income Taxes — Overall", sets forth a minimum threshold for financial statement recognition of the benefit of a tax position taken or expected to be taken in a tax return. Management has concluded there are no significant uncertain tax positions that would require recognition in the financial statements. If applicable, the Fund recognizes interest accrued related to unrecognized tax benefits in "Interest Expense" and penalties in "Other Expenses" in the Statement of Operations. The Fund files tax returns with the U.S. Internal Revenue Service, New York and various states. Generally, each of the tax years in the four-year period ended December 31, 2019 remains subject to examination by taxing authorities.
The tax character of distributions paid may differ from the character of distributions shown for GAAP purposes due to short-term capital gains being treated as ordinary income for tax purposes. The tax character of distributions paid during fiscal years 2019 and 2018 was as follows:
2019
Distributions
Paid From: | | 2018
Distributions
Paid From: | |
Ordinary
Income
(000) | | Long-Term
Capital Gain
(000) | | Ordinary
Income
(000) | | Long-Term
Capital Gain
(000) | | Paid-in-
Capital
(000) | |
| $ | — | | | $ | 3,100 | | | $ | 126 | | | $ | 974 | | | $ | 2 | | |
The amount and character of income and gains to be distributed are determined in accordance with income tax regulations which may differ from GAAP. These book/tax differences are either considered temporary or permanent in nature.
Temporary differences are attributable to differing book and tax treatments for the timing of the recognition of gains (losses) on certain investment transactions and the timing of the deductibility of certain expenses.
Permanent differences, primarily due to a net operating loss, resulted in the following reclassifications among the components of net assets at December 31, 2019:
Total
Distributable
Earnings
(000) | | Paid-in
Capital
(000) | |
| $ | 699 | | | $ | (699 | ) | |
At December 31, 2019, the components of distributable earnings for the Fund on a tax basis were as follows:
Undistributed
Ordinary
Income
(000) | | Undistributed
Long-Term
Capital Gain
(000) | |
| $ | — | | | $ | 1,767 | | |
Qualified late year losses are capital losses and specified ordinary losses, including currency losses, incurred after October 31 but within the taxable year that, if elected, are deemed to arise on the first day of the Fund's next taxable year. For the year ended December 31, 2019, the Fund intends to defer to January 1, 2020 for U.S. federal income tax purposes the following losses:
Qualified
Late Year
Ordinary
Losses
(000) | | Post-October
Capital
Losses
(000) | |
| $ | 66 | | | $ | — | | |
I. Credit Facility: The Company and other Morgan Stanley funds participated in a $150,000,000 committed, unsecured revolving line of credit facility (the "Facility") with State Street. Effective April 22, 2019, the committed line amount increased to $300,000,000. This Facility is to be used for temporary emergency purposes or funding of shareholder redemption requests. The interest rate on borrowings is based on the federal funds rate or 1 month LIBOR rate plus a spread. The Facility also has a commitment fee of 0.25% per annum based on the unused portion of the Facility. During the year ended December 31, 2019, the Fund did not have any borrowings under the Facility.
26
Morgan Stanley Institutional Fund, Inc.
Annual Report — December 31, 2019
Notes to Financial Statements (cont'd)
J. Other: At December 31, 2019, the Fund had record owners of 10% or greater. Investment activities of these shareholders could have a material impact on the Fund. The aggregate percentage of such owners was 27.7%.
27
Morgan Stanley Institutional Fund, Inc.
Annual Report — December 31, 2019
Report of Independent Registered Public Accounting Firm
To the Shareholders and Board of Directors of
Morgan Stanley Institutional Fund, Inc. —
Global Advantage Portfolio
Opinion on the Financial Statements
We have audited the accompanying statement of assets and liabilities of Global Advantage Portfolio (the "Fund") (one of the funds constituting Morgan Stanley Institutional Fund, Inc. (the "Company")), including the portfolio of investments, as of December 31, 2019, and the related statement of operations for the year then ended, the statements of changes in net assets for each of the two years in the period then ended, the financial highlights for each of the five years in the period then ended and the related notes (collectively referred to as the "financial statements"). In our opinion, the financial statements present fairly, in all material respects, the financial position of Global Advantage Portfolio (one of the funds constituting Morgan Stanley Institutional Fund, Inc.) at December 31, 2019, the results of its operations for the year then ended, the changes in its net assets for each of the two years in the period then ended and its financial highlights for each of the five years in the period then ended, in conformity with U.S. generally accepted accounting principles.
Basis for Opinion
These financial statements are the responsibility of the Company's management. Our responsibility is to express an opinion on the Fund's financial statements based on our audits. We are a public accounting firm registered with the Public Company Accounting Oversight Board (United States) ("PCAOB") and are required to be independent with respect to the Company in accordance with the U.S. federal securities law and the applicable rules and regulations of the Securities and Exchange Commission and the PCAOB.
We conducted our audits in accordance with the standards of the PCAOB. Those standards require that we plan and perform the audit to obtain reasonable assurance about whether the financial statements are free of material misstatement, whether due to error or fraud. The Company is not required to have, nor were we engaged to perform, an audit of the Company's internal control over financial reporting. As part of our audits, we are required to obtain an understanding of internal control over financial reporting, but not for the purpose of expressing an opinion on the effectiveness of the Company's internal control over financial reporting. Accordingly, we express no such opinion.
Our audits included performing procedures to assess the risks of material misstatement of the financial statements, whether due to error or fraud, and performing procedures that respond to those risks. Such procedures included examining, on a test basis, evidence regarding the amounts and disclosures in the financial statements. Our procedures included confirmation of securities owned as of December 31, 2019 by correspondence with the custodian and others or by other appropriate auditing procedures where replies from others were not received. Our audits also included evaluating the accounting principles used and significant estimates made by management, as well as evaluating the overall presentation of the financial statements. We believe that our audits provide a reasonable basis for our opinion.

We have served as the auditor of one or more Morgan Stanley investment companies since 2000.
Boston, Massachusetts
February 27, 2020
28
Morgan Stanley Institutional Fund, Inc.
Annual Report — December 31, 2019
Federal Tax Notice (unaudited)
For federal income tax purposes, the following information is furnished with respect to the distributions paid by the Fund during its taxable year ended December 31, 2019.
The Fund designated and paid approximately $3,100,000 as a long-term capital gain distribution.
For federal income tax purposes, the following information is furnished with respect to the Fund's earnings for its taxable year ended December 31, 2019. When distributed, certain earnings may be subject to a maximum tax rate of 15% as provided for by the Jobs and Growth Tax Relief Reconciliation Act of 2003. The Fund designated up to a maximum of approximately $155,000 as taxable at this lower rate.
In January, the Fund provides tax information to shareholders for the preceding calendar year.
29
Privacy Notice (unaudited) April 2019
FACTS | | WHAT DOES MSIM DO WITH YOUR PERSONAL INFORMATION? | |
Why? | | Financial companies choose how they share your personal information. Federal law gives consumers the right to limit some but not all sharing. Federal law also requires us to tell you how we collect, share, and protect your personal information. Please read this notice carefully to understand what we do. | |
What? | | The types of personal information we collect and share depend on the product or service you have with us. This information can include:
n Social Security number and income
n investment experience and risk tolerance
n checking account number and wire transfer instructions | |
How? | | All financial companies need to share customers' personal information to run their everyday business. In the section below, we list the reasons financial companies can share their customers' personal information; the reasons MSIM chooses to share; and whether you can limit this sharing. | |
Reasons we can share your personal information | | Does MSIM share? | | Can you limit this sharing? | |
For our everyday business purposes —
such as to process your transactions, maintain your account(s), respond to court orders and legal investigations, or report to credit bureaus | | Yes | | No | |
For our marketing purposes —
to offer our products and services to you | | Yes | | No | |
For joint marketing with other financial companies | | No | | We don't share | |
For our affiliates' everyday business purposes —
information about your transactions and experiences | | Yes | | No | |
For our affiliates' everyday business purposes —
information about your creditworthiness | | No | | We don't share | |
For our affiliates to market to you | | No | | We don't share | |
For non-affiliates to market to you | | No | | We don't share | |
Questions? Call toll-free (844) 312-6327 or email: imprivacyinquiries@morganstanley.com
30
Privacy Notice (unaudited) (cont'd) April 2019
Who we are
Who is providing this notice? | | Morgan Stanley Investment Management, Inc. and its affiliated registered investment advisers, registered broker-dealers, and registered and unregistered funds ("MSIM") | |
What we do
How does MSIM protect my personal information? | | To protect your personal information from unauthorized access and use, we use security measures that comply with federal law. These measures include computer safeguards and secured files and buildings. We have policies governing the proper handling of customer information by personnel and requiring third parties that provide support to adhere to appropriate security standards with respect to such information. | |
How does MSIM collect my personal information? | | We collect your personal information, for example, when you
n open an account or make deposits or withdrawals from your account
n buy securities from us or make a wire transfer
n give us your contact information
We also collect your personal information from others, such as credit bureaus, affiliates, or other companies. | |
Why can't I limit all sharing? | | Federal law gives you the right to limit only
n sharing for affiliates' everyday business purposes — information about your creditworthiness
n affiliates from using your information to market to you
n sharing for non-affiliates to market to you
State laws and individual companies may give you additional rights to limit sharing. See below for more on your rights under state law. | |
Definitions
Affiliates | | Companies related by common ownership or control. They can be financial and non-financial companies.
n Our affiliates include companies with a Morgan Stanley name and financial companies such as Morgan Stanley Smith Barney LLC and Morgan Stanley & Co. | |
Non-affiliates | | Companies not related by common ownership or control. They can be financial and non-financial companies.
n MSIM does not share with non-affiliates so they can market to you. | |
Joint marketing | | A formal agreement between non-affiliated financial companies that together market financial products or services to you.
n MSIM doesn't jointly market | |
Other Important Information
Vermont: Except as permitted by law, we will not share personal information we collect about Vermont residents with Non-affiliates unless you provide us with your written consent to share such information.
California: Except as permitted by law, we will not share personal information we collect about California residents with Non-affiliates and we will limit sharing such personal information with our Affiliates to comply with California privacy laws that apply to us.
31
Morgan Stanley Institutional Fund, Inc.
Annual Report — December 31, 2019
Director and Officer Information (unaudited)
Independent Directors:
Name, Birth Year
and Address of
Independent Director | | Position(s)
Held with
Registrant | | Length of Time
Served* | | Principal Occupation(s) During Past 5 Years
and Other Relevant Professional Experience | | Number of
Funds in
Fund Complex
Overseen by
Independent
Director** | | Other Directorships
Held by Independent
Director*** | |
Frank L. Bowman
c/o Perkins Coie LLP
Counsel to the Independent Directors
1155 Avenue of the Americas
New York, NY 10036
Birth Year 1944 | | Director | | Since
August 2006 | | President, Strategic Decisions, LLC (consulting) (since February 2009); Director or Trustee of various Morgan Stanley Funds (since August 2006); Chairperson of the Compliance and Insurance Committee (since October 2015); formerly, Chairperson of the Insurance Sub-Committee of the Compliance and Insurance Committee (2007-2015); served as President and Chief Executive Officer of the Nuclear Energy Institute (policy organization) (February 2005-November 2008); retired as Admiral, U.S. Navy after serving over 38 years on active duty including 8 years as Director of the Naval Nuclear Propulsion Program in the Department of the Navy and the U.S. Department of Energy (1996-2004); served as Chief of Naval Personnel (July 1994-September 1996) and on the Joint Staff as Director of Political Military Affairs (June 1992-July 1994); knighted as Honorary Knight Commander of the Most Excellent Order of the British Empire; awarded the Officier de l'Orde National du Mérite by the French Government; elected to the National Academy of Engineering (2009). | | | 86 | | | Director of Naval and Nuclear Technologies LLP; Director Emeritus of the Armed Services YMCA; Member of the National Security Advisory Council of the Center for U.S. Global Engagement and a member of the CNA Military Advisory Board; Trustee of Fairhaven United Methodist Church; Member of the Board of Advisors of the Dolphin Scholarship Foundation; Director of other various non-profit organizations; formerly, Director of BP p.l.c. (November 2010-May 2019). | |
Kathleen A. Dennis
c/o Perkins Coie LLP
Counsel to the Independent Directors
1155 Avenue of the Americas
New York, NY 10036
Birth Year 1953 | | Director | | Since August 2006 | | President, Cedarwood Associates (mutual fund and investment management consulting) (since July 2006); Chairperson of the Liquidity and Alternatives Sub-Committee of the Investment Committee (since October 2006) and Director or Trustee of various Morgan Stanley Funds (since August 2006); formerly, Senior Managing Director of Victory Capital Management (1993-2006). | | | 86 | | | Director of various non-profit organizations. | |
Nancy C. Everett
c/o Perkins Coie LLP
Counsel to the Independent Directors
1155 Avenue of the Americas
New York, NY 10036
Birth Year 1955 | | Director | | Since January 2015 | | Chief Executive Officer, Virginia Commonwealth University Investment Company (since November 2015); Owner, OBIR, LLC (institutional investment management consulting) (since June 2014); formerly, Managing Director, BlackRock, Inc. (February 2011-December 2013); and Chief Executive Officer, General Motors Asset Management (a/k/a Promark Global Advisors, Inc.) (June 2005-May 2010). | | | 87 | | | Formerly, Member of Virginia Commonwealth University School of Business Foundation (2005-2016); Member of Virginia Commonwealth University Board of Visitors (2013-2015); Member of Committee on Directors for Emerging Markets Growth Fund, Inc. (2007-2010); Chairperson of Performance Equity Management, LLC (2006-2010); and Chairperson, GMAM Absolute Return Strategies Fund, LLC (2006-2010). | |
32
Morgan Stanley Institutional Fund, Inc.
Annual Report — December 31, 2019
Director and Officer Information (unaudited) (cont'd)
Independent Directors: (cont'd)
Name, Birth Year
and Address of
Independent Director | | Position(s)
Held with
Registrant | | Length of Time
Served* | | Principal Occupation(s) During Past 5 Years
and Other Relevant Professional Experience | | Number of
Funds in
Fund Complex
Overseen by
Independent
Director** | | Other Directorships
Held by Independent
Director*** | |
Jakki L. Haussler
c/o Perkins Coie LLP
Counsel to the Independent Directors
1155 Avenue of the Americas
New York, NY 10036
Birth Year 1957 | | Director | | Since January 2015 | | Chairman, Opus Capital Group (since 1996); formerly, Chief Executive Officer, Opus Capital Group (1996-2019); Director, Capvest Venture Fund, LP (May 2000-December 2011); Partner, Adena Ventures, LP (July 1999-December 2010); Director, The Victory Funds (February 2005-July 2008). | | | 87 | | | Director of Service Corporation International and Member, Audit Committee and Investment Committee; Director of Cincinnati Bell Inc. and Member, Audit Committee and Governance and Nominating Committee; Chairman of Northern Kentucky University Member Investment Committee; Member of Chase College of Law Transactional Law Practice Center Board of Advisors; Director of Best Transport; Director of Chase College of Law Board of Visitors; formerly, Member, University of Cincinnati Foundation Investment Committee; Member, Miami University Board of Visitors (2008-2011); Trustee of Victory Funds (2005-2008) and Chairman, Investment Committee (2007-2008) and Member, Service Provider Committee (2005-2008). | |
Dr. Manuel H. Johnson
c/o Johnson Smick International, Inc.
220 I Street, NE — Suite 200
Washington, D.C. 20002
Birth Year 1949 | | Director | | Since July 1991 | | Senior Partner, Johnson Smick International, Inc. (consulting firm); Chairperson of the Investment Committee (since October 2006) and Director or Trustee of various Morgan Stanley Funds (since July 1991); Co-Chairman and a founder of the Group of Seven Council (G7C) (international economic commission); formerly, Chairperson of the Audit Committee (July 1991-September 2006), Vice Chairman of the Board of Governors of the Federal Reserve System and Assistant Secretary of the U.S. Treasury. | | | 86 | | | Director of NVR, Inc. (home construction). | |
Joseph J. Kearns
c/o Perkins Coie LLP
Counsel to the Independent Directors
1155 Avenue of the Americas
New York, NY 10036
Birth Year 1942 | | Director | | Since August 1994 | | Senior Adviser, Kearns & Associates LLC (investment consulting); Chairperson of the Audit Committee (since October 2006) and Director or Trustee of various Morgan Stanley Funds (since August 1994); formerly, Deputy Chairperson of the Audit Committee (July 2003-September 2006) and Chairperson of the Audit Committee of various Morgan Stanley Funds (since August 1994); CFO of the J. Paul Getty Trust. | | | 87 | | | Prior to August 10, 2016, Director of Electro Rent Corporation (equipment leasing); Prior to December 31, 2013, Director of The Ford Family Foundation. | |
33
Morgan Stanley Institutional Fund, Inc.
Annual Report — December 31, 2019
Director and Officer Information (unaudited) (cont'd)
Independent Directors: (cont'd)
Name, Birth Year
and Address of
Independent Director | | Position(s)
Held with
Registrant | | Length of Time
Served* | | Principal Occupation(s) During Past 5 Years
and Other Relevant Professional Experience | | Number of
Funds in
Fund Complex
Overseen by
Independent
Director** | | Other Directorships
Held by Independent
Director*** | |
Michael F. Klein
c/o Perkins Coie LLP
Counsel to the Independent Directors
1155 Avenue of the Americas
New York, NY 10036
Birth Year 1958 | | Director | | Since August 2006 | | Managing Director, Aetos Alternatives Management, LP (since March 2000); Co-President, Aetos Alternatives Management, LP (since January 2004) and Co-Chief Executive Officer of Aetos Alternatives Management, LP (since August 2013); Chairperson of the Fixed Income Sub-Committee of the Investment Committee (since October 2006) and Director or Trustee of various Morgan Stanley Funds (since August 2006); formerly, Managing Director, Morgan Stanley & Co. Inc. and Morgan Stanley Dean Witter Investment Management and President, various Morgan Stanley Funds (June 1998-March 2000); Principal, Morgan Stanley & Co. Inc. and Morgan Stanley Dean Witter Investment Management (August 1997-December 1999). | | | 86 | | | Director of certain investment funds managed or sponsored by Aetos Alternatives Management, LP; Director of Sanitized AG and Sanitized Marketing AG (specialty chemicals). | |
Patricia Maleski
c/o Perkins Coie LLP
Counsel to the Independent Directors
1155 Avenue of the Americas
New York, NY 10036
Birth Year 1960 | | Director | | Since January 2017 | | Managing Director, JPMorgan Asset Management (2004-2016); Oversight and Control Head of Fiduciary and Conflicts of Interest Program (2015-2016); Chief Control Officer-Global Asset Management (2013-2015); President, JPMorgan Funds (2010-2013); Chief Administrative Officer (2004-2013); various other positions including Treasurer and Board Liaison (since 2001). | | | 87 | | | None. | |
Michael E. Nugent
522 Fifth Avenue
New York, NY 10036
Birth Year 1936 | | Chair of the Board and Director | | Chair of the Boards since July 2006 and Director since July 1991 | | Chair of the Boards of various Morgan Stanley Funds (since July 2006); Chairperson of the Governance Committee (since January 2019) and Director or Trustee of various Morgan Stanley Funds (since July 1991); formerly, Chairperson of each of the Closed-End Fund committee (until December 2019) and the Insurance Committee (until July 2006); General Partner, Triumph Capital, L.P. (private investment partnership) (1988-2013). | | | 86 | | | None. | |
W. Allen Reed
c/o Perkins Coie LLP
Counsel to the Independent Directors
1155 Avenue of the Americas
New York, NY 10036
Birth Year 1947 | | Vice Chair of the Board and Director | | Vice Chair of the Boards since January 2020 and Director Since August 2006 | | Chairperson of the Equity Sub-Committee of the Investment Committee (since October 2006) and Director or Trustee of various Morgan Stanley Funds (since August 2006); formerly, President and CEO of General Motors Asset Management; Chairman and Chief Executive Officer of the GM Trust Bank and Corporate Vice President of General Motors Corporation (August 1994- December 2005). | | | 86 | | | Formerly, Director of Legg Mason, Inc.; formerly, Director of the Auburn University Foundation (2010-2015). | |
* This is the earliest date the Director began serving the Morgan Stanley Funds. Each Director serves an indefinite term, until his or her successor is elected.
** The Fund Complex includes (as of December 31, 2019) all open-end and closed-end funds (including all of their portfolios) advised by Morgan Stanley Investment Management Inc. (the "Adviser") and any funds that have an adviser that is an affiliated person of the Adviser (including, but not limited to, Morgan Stanley AIP GP LP).
*** This includes any directorships at public companies and registered investment companies held by the Director at any time during the past five years.
34
Morgan Stanley Institutional Fund, Inc.
Annual Report — December 31, 2019
Director and Officer Information (unaudited) (cont'd)
Executive Officers:
Name, Birth Year and Address of
Executive Officer | | Position(s) Held
with
Registrant | | Length of
Time Served* | | Principal Occupation(s) During Past 5 Years | |
John H. Gernon
522 Fifth Avenue
New York, NY 10036
Birth Year 1963 | | President and Principal Executive Officer | | Since September 2013 | | President and Principal Executive Officer of the Equity and Fixed Income Funds and the Morgan Stanley AIP Funds (since September 2013) and the Liquidity Funds and various money market funds (since May 2014) in the Fund Complex; Managing Director of the Adviser; Head of Product (since 2006). | |
Timothy J. Knierim
522 Fifth Avenue
New York, NY 10036
Birth Year 1959 | | Chief Compliance Officer | | Since December 2016 | | Managing Director of the Adviser and various entities affiliated with the Adviser; Chief Compliance Officer of various Morgan Stanley Funds and the Adviser (since December 2016) and Chief Compliance Officer of Morgan Stanley AIP GP LP (since 2014). Formerly, Managing Director and Deputy Chief Compliance Officer of the Adviser (2014-2016); and formerly, Chief Compliance Officer of Prudential Investment Management, Inc. (2007-2014). | |
Francis J. Smith
522 Fifth Avenue
New York, NY 10036
Birth Year 1965 | | Treasurer and Principal Financial Officer | | Treasurer since July 2003 and Principal Financial Officer since September 2002 | | Managing Director of the Adviser and various entities affiliated with the Adviser; Treasurer (since July 2003) and Principal Financial Officer of various Morgan Stanley Funds (since September 2002). | |
Mary E. Mullin
522 Fifth Avenue
New York, NY 10036
Birth Year 1967 | | Secretary | | Since June 1999 | | Managing Director of the Adviser; Secretary of various Morgan Stanley Funds (since June 1999). | |
Michael J. Key
522 Fifth Avenue
New York, NY 10036
Birth Year 1979 | | Vice President | | Since June 2017 | | Vice President of the Equity and Fixed Income Funds, Liquidity Funds, various money market funds and the Morgan Stanley AIP Funds in the Fund Complex (since June 2017); Executive Director of the Adviser; Head of Product Development for Equity and Fixed Income Funds (since August 2013). | |
* This is the earliest date the officer began serving the Morgan Stanley Funds. Each officer serves a one-year term, until his or her successor is elected and qualifies.
35
Morgan Stanley Institutional Fund, Inc.
Annual Report — December 31, 2019
Adviser and Administrator
Morgan Stanley Investment Management Inc.
522 Fifth Avenue
New York, New York 10036
Distributor
Morgan Stanley Distribution, Inc.
522 Fifth Avenue
New York, New York 10036
Dividend Disbursing and Transfer Agent
DST Asset Manager Solutions, Inc.
2000 Crown Colony Drive
Quincy, Massachusetts 02169
Custodian
State Street Bank and Trust Company
One Lincoln Street
Boston, Massachusetts 02111
Legal Counsel
Dechert LLP
1095 Avenue of the Americas
New York, New York 10036
Counsel to the Independent Directors
Perkins Coie LLP
1155 Avenue of the Americas
New York, New York 10036
Independent Registered Public Accounting Firm
Ernst & Young LLP
200 Clarendon Street
Boston, Massachusetts 02116
Reporting to Shareholders
Each Morgan Stanley fund provides a complete schedule of portfolio holdings in its Semi-Annual and the Annual Reports within 60 days of the end of the fund's second and fourth fiscal quarters. The Semi-Annual and Annual Reports are filed electronically with the Securities and Exchange Commission ("SEC") on Form N-CSRS and Form N-CSR, respectively. Morgan Stanley also delivers the Semi-Annual and Annual Reports to fund shareholders and makes these reports available on its public website, www.morganstanley.com/im/shareholderreports. Each Morgan Stanley non-money market fund also files a complete schedule of portfolio holdings with the SEC for the fund's first and third fiscal quarters as an attachment to Form N-PORT. Morgan Stanley does not deliver the reports for the first and third fiscal quarters to shareholders, nor are the reports posted to the Morgan Stanley public website. However, the holdings for each money market fund are posted to the Morgan Stanley public website. You may obtain the Form N-PORT filings (as well as the Form N-CSR and N-CSRS filings) by accessing the SEC's website, www.sec.gov. You can also request copies of these materials, upon payment of a duplicating fee, by electronic request at the SEC's email address (publicinfo@sec.gov).
Proxy Voting Policies and Procedures and Proxy Voting Record
You may obtain a copy of the Company's Proxy Voting Policy and Procedures and information regarding how the Company voted proxies relating to portfolio securities during the most recent twelve-month period ended June 30, without charge, upon request, by calling toll free 1 (800) 548-7786 or by visiting our website at www.morganstanley.com/im/shareholderreports. This information is also available on the SEC's website at www.sec.gov.
This report is authorized for distribution only when preceded or accompanied by a prospectus or summary prospectus of the applicable fund of Morgan Stanley Institutional Fund, Inc., which describes in detail the fund's investment policies, risks, fees and expenses. Please read the prospectus carefully before you invest or send money. For additional information, including information regarding the investments comprising the Fund, please visit our website at www.morganstanley.com/im/shareholderreports or call toll free 1 (800) 548-7786.
36
Printed in U.S.A.
This Report has been prepared for shareholders and may be distributed to others only if preceded or accompanied by a current prospectus.
Morgan Stanley Investment Management Inc.
522 Fifth Avenue
New York, New York 10036
© 2020 Morgan Stanley. Morgan Stanley Distribution, Inc.

IFIGAANN
2920365 EXP. 02.28.21

Morgan Stanley Institutional Fund, Inc.
Global Franchise Portfolio
Annual Report
December 31, 2019
Beginning on January 1, 2021, as permitted by regulations adopted by the Securities and Exchange Commission ("SEC"), paper copies of the Fund's Annual and Semi-Annual Reports to Shareholders ("Shareholder Reports") will no longer be sent by mail, unless you specifically request paper copies of the Shareholder Reports from the Fund or from your financial intermediary, such as a broker-dealer or a bank. Instead, the Shareholder Reports will be made available on the Fund's website, https://www.morganstanley.com/im/shareholderreports and you will be notified by mail each time a Shareholder Report is posted and provided with a website link to access the Shareholder Report. If you already elected to receive Shareholder Reports electronically, you will not be affected by this change and you need not take any action. You may elect to receive Shareholder Reports and other communications from the Fund electronically anytime by contacting your financial intermediary or, if you are a direct investor, please follow the instructions on the envelope.
Beginning on January 1, 2019, you may elect to receive all future Shareholder Reports in paper free of charge. If you invest through a financial intermediary, you can contact your financial intermediary to request that you continue to receive paper copies of your Shareholder Reports. If you invest directly with the Fund, please follow the instructions on the envelope to let the Fund know you wish to continue receiving paper copies of your Shareholder Reports. Your election to receive Shareholder Reports in paper will apply to all funds held in your account if you invest through your financial intermediary or all funds held with the fund complex if you invest directly with a fund.

Morgan Stanley Institutional Fund, Inc.
Annual Report — December 31, 2019
Shareholders' Letter | | | 2 | | |
Expense Example | | | 3 | | |
Investment Overview | | | 4 | | |
Portfolio of Investments | | | 8 | | |
Statement of Assets and Liabilities | | | 9 | | |
Statement of Operations | | | 11 | | |
Statements of Changes in Net Assets | | | 12 | | |
Financial Highlights | | | 14 | | |
Notes to Financial Statements | | | 19 | | |
Report of Independent Registered Public Accounting Firm | | | 25 | | |
Federal Tax Notice | | | 26 | | |
Privacy Notice | | | 27 | | |
Director and Officer Information | | | 29 | | |
This report is authorized for distribution only when preceded or accompanied by a prospectus or summary prospectus of the applicable Fund of Morgan Stanley Institutional Fund, Inc. To receive a prospectus and/or statement of additional information ("SAI"), which contains more complete information such as investment objectives, charges, expenses, policies for voting proxies, risk considerations and describes in detail each of the Fund's investment policies to the prospective investor, please call toll free 1 (800) 548-7786. Please read the prospectuses carefully before you invest or send money.
Additionally, you can access information about the Fund, including performance, characteristics and investment team commentary, through Morgan Stanley Investment Management's website: www.morganstanley.com/im/shareholderreports.
Market forecasts provided in this report may not necessarily come to pass. There is no guarantee that any sectors mentioned will continue to perform as discussed herein or that securities in such sectors will be held by the Fund in the future. There is no assurance that a fund will achieve its investment objective. Funds are subject to market risk, which is the possibility that market values of securities owned by the Fund will decline and, therefore, the value of the Fund's shares may be less than what you paid for them. Accordingly, you can lose money investing in this Fund. Please see the prospectus for more complete information on investment risks.
1
Morgan Stanley Institutional Fund, Inc.
Annual Report — December 31, 2019
Shareholders' Letter (unaudited)
Dear Shareholders,
We are pleased to provide this Annual Report, in which you will learn how your investment in Global Franchise Portfolio (the "Fund") performed during the latest twelve-month period.
Morgan Stanley Investment Management is a client-centric, investor-led organization. Our global presence, intellectual capital, and breadth of products and services enable us to partner with investors to meet the evolving challenges of today's financial markets. We aim to deliver superior investment service and to empower our clients to make the informed decisions that help them reach their investment goals.
As always, we thank you for selecting Morgan Stanley Investment Management, and look forward to working with you in the months and years ahead.
Sincerely,

John H. Gernon
President and Principal Executive Officer
January 2020
2
Morgan Stanley Institutional Fund, Inc.
Annual Report — December 31, 2019
Expense Example (unaudited)
Global Franchise Portfolio
As a shareholder of the Fund, you incur two types of costs: (1) transactional costs; and (2) ongoing costs, which may include advisory fees, administration fees, distribution and shareholder services fees and other Fund expenses. This example is intended to help you understand your ongoing costs (in dollars) of investing in the Fund and to compare these costs with the ongoing costs of investing in other mutual funds.
This example is based on an investment of $1,000 invested at the beginning of the six-month period ended December 31, 2019 and held for the entire six-month period.
Actual Expenses
The table below provides information about actual account values and actual expenses. You may use the information in this table, together with the amount you invested, to estimate the expenses that you paid over the period. Simply divide your account value by $1,000 (for example, an $8,600 account value divided by $1,000 = 8.6), then multiply the result by the number in the table under the heading entitled "Actual Expenses Paid During Period" to estimate the expenses you paid on your account during this period.
Hypothetical Example for Comparison Purposes
The table below provides information about hypothetical account values and hypothetical expenses based on the Fund's actual expense ratio and an assumed rate of return of 5% per year before expenses, which is not the Fund's actual return. The hypothetical account values and expenses may not be used to estimate the actual ending account balance or expenses you paid for the period. You may use this information to compare the ongoing costs of investing in the Fund and other funds. To do so, compare this 5% hypothetical example with the 5% hypothetical examples that appear in the shareholder reports of the other funds.
Please note that the expenses shown in the table are meant to highlight your ongoing costs only and do not reflect any transactional costs, such as sales charges (loads). Therefore, the information for each class in the table is useful in comparing ongoing costs only, and will not help you determine the relative total costs of owning different funds. In addition, if these transactional costs were included, your costs would have been higher.
| | | Beginning
Account
Value
7/1/19 | | Actual Ending
Account
Value
12/31/19 | | Hypothetical
Ending Account
Value | | Actual
Expenses
Paid
During
Period* | | Hypothetical
Expenses Paid
During Period* | | Net
Expense
Ratio
During
Period** | |
Global Franchise Portfolio Class I | | $ | 1,000.00 | | | $ | 1,070.10 | | | $ | 1,020.47 | | | $ | 4.90 | | | $ | 4.79 | | | | 0.94 | % | |
Global Franchise Portfolio Class A | | | 1,000.00 | | | | 1,069.30 | | | | 1,019.21 | | | | 6.21 | | | | 6.06 | | | | 1.19 | | |
Global Franchise Portfolio Class L | | | 1,000.00 | | | | 1,066.40 | | | | 1,016.74 | | | | 8.75 | | | | 8.54 | | | | 1.68 | | |
Global Franchise Portfolio Class C | | | 1,000.00 | | | | 1,064.80 | | | | 1,015.32 | | | | 10.20 | | | | 9.96 | | | | 1.96 | | |
Global Franchise Portfolio Class IS | | | 1,000.00 | | | | 1,070.80 | | | | 1,020.92 | | | | 4.44 | | | | 4.33 | | | | 0.85 | | |
* Expenses are calculated using each Fund Class' annualized net expense ratio (as disclosed), multiplied by the average account value over the period and multiplied by 184/365 (to reflect the most recent one-half year period).
** Annualized.
3
Morgan Stanley Institutional Fund, Inc.
Annual Report — December 31, 2019
Investment Overview (unaudited)
Global Franchise Portfolio
The Fund seeks long-term capital appreciation.
Performance
For the fiscal year ended December 31, 2019, the Fund's Class I shares had a total return based on net asset value and reinvestment of distributions per share of 29.60%, net of fees. The Fund's Class I shares outperformed the Fund's benchmark, the MSCI World Net Index (the "Index"), which returned 27.67%.
Please keep in mind that double-digit returns are highly unusual and cannot be sustained. Investors should also be aware that these returns were primarily achieved during favorable market conditions.
Factors Affecting Performance
• The strong fourth quarter of 2019 rounded off a very strong year, with the Index finishing up 27.7% in U.S. dollars (USD). In sector terms, there were two major outliers, with information technology up a massive 48%, while energy by contrast only gained 11%. The other sectors were relatively tightly bunched, though the more defensive sectors such as consumer staples, health care and utilities (all +23%) were a little behind the index. The U.S. (+31%), once again outperformed the Index, along with the Netherlands (+32% USD) and Switzerland (+32%). At the other end of the spectrum, Hong Kong (+10%), Spain (+12%) and the U.K. (+21%) were affected by political uncertainties, while Singapore (+15%), Japan (+20%) and Germany (+21%) were hit by worries about trade and industrial production. Country returns are represented by the respective MSCI country indexes in U.S. dollars.
• For the year, the Fund's sector allocation and stock selection were both positive. The overweight in information technology and the lack of energy stocks were both helpful for sector allocation, more than making up for the overweight in consumer staples and the drag from the small cash allocation in the very strong year for the markets. The outperformance in the health care and financials sectors drove the positive stock selection, despite underperformance in communication services and consumer staples.
• Over the year, the largest absolute contributors were Microsoft, Philip Morris International and Accenture. The two absolute detractors were Fox Corporation and Altria. The smallest absolute contributor was Walt Disney.
Management Strategies
• As simple souls we attempt to disaggregate investing into earnings and multiples. Concerned as we are with the preservation of capital, we continue to maintain that there are only two ways to lose money in equities: if the earnings go away, or the multiple goes away. While our daily business is at the stock level, we also attempt to apply this logic to markets as a whole. At the end of 2017, our concern was multiples, with the MSCI World Index on 17.0x forward consensus estimates.(i) This fear proved well founded, as 2018 was a down year despite double-digit earnings growth, as the market de-rated to 13.4x.(i) Given this de-rating, our concern for 2019 switched to earnings... and we were a quarter right! We say a quarter, as we were half right on earnings, which mildly disappointed being down a fraction for the year rather than the expected 7% rise, but did not foresee that the multiple would bounce back to 17.0x.(i) If we disaggregate the 2019 return of 28% for the MSCI World Index, a massive 26% came from the re-rating, –1% from earnings, and the remainder from dividends.(i) This is an extreme example of the pattern we've been seeing since 2012, where more of the market return has come from multiple expansion than from earnings growth, with only 2017 offering a strong return year driven by earnings.
• This significant re-rating implies a large increase in optimism during 2019. This was clearly not driven by the actual earnings, which disappointed in 2019 and have yet to revive, but rather by hopes for the future. Monetary policy was one clear shift. The U.S. Federal Reserve's (the Fed) rate-raising cycle, which saw four rises in 2018 amidst talk of "normalization," ended in December of that year, and 2019 saw three cuts, along with more dovish noises, and a return to a growing balance sheet as it battled the crisis in the repo market. The European Central Bank (ECB) and the People's Bank of
(i) Source: FactSet, December 2019.
4
Morgan Stanley Institutional Fund, Inc.
Annual Report — December 31, 2019
Investment Overview (unaudited) (cont'd)
Global Franchise Portfolio
China have followed suit in easing monetary conditions in an attempt to boost growth. Markets were also helped by a reduction in fears about a trade war between the U.S. and China, with talk of an imminent "Phase 1" deal, which would at least imply a truce.
• So where does this revival of market morale leave us for 2020? Frankly, we are now nervous about both multiples and earnings. Our fear about multiples is natural enough, with the MSCI World Index back up to 17.0x, and this time without the benefit of the imminent earnings boost from the Trump tax cuts that it had in early 2018. Even putting the risk of multiple compression to one side, it is tough to see how there can be much mileage for the markets from expanding multiples; a 10% boost would require the MSCI World Index to be on close to 19x!
• This leaves earnings as the main potential driver of any significant upside for markets, and here we are skeptical for the broad market in the medium term. It may well be that an industrial recovery can drive progress in 2020, but our structural concerns remain. Our anxiety is based on the fact that most of the levers for earnings growth have been pulled hard already, particularly in the U.S., leaving limited opportunity for them to help further and skewing the risk to the downside. Margins are high, as corporates have been advantaged relative to labor, given globalization and the political move to the right over the last few decades, and also relative to consumers, given the falling role of anti-trust. Profits have also been boosted by low interest rates and increased leverage, decreasing interest payments and allowing earnings-per-share-boosting buybacks. On top of all this, the gap between the "adjusted" numbers, used for consensus and paying management, and the actual profit at the bottom of the income statement has ballooned, reaching $600 billion over the last three years in the U.S. alone.(ii) These were all tailwinds for earnings over the last few years that are unlikely to be repeated, and may turn into headwinds if they go into reverse.
• This may not matter in 2020. It is quite possible that the U.S. can continue to steer between the Scylla of recession and the Charybdis of inflation, delivering economic and earnings growth without the Fed having to tighten and end the party. With the MSCI USA Index earnings multiple now at 18.7x, and double-digit earnings growth forecast for 2020 after the slight fall in 2019,(i) success seems to be what the market is expecting. Europe looks distinctly cheaper, in relative terms at least, at a "mere" 14.6x,(i) as there is far less optimism about growth. Part of this is down to the relative shortage of fast growing technology companies, but it is also down to the continent as a whole being mired in very slow growth. Here, there could be a positive story if there is a move towards fiscal reflation in 2020. The block, as ever, is Germany, given its balanced budget requirement. But if this is eased, perhaps using the need for infrastructure to deal with the climate emergency as an excuse to issue green bonds, then this could drive faster growth, or at the very least the hope of faster growth, which may be all that is needed to drive a rally. The ECB under Christine Lagarde is likely to remain helpful. By contrast, it is probably fruitless to expect structural change in Japan, which at 14.3x(i) is marginally cheaper than Europe. However, having suffered a double-digit earnings fall in 2019, as industrial production struggled, it may well be a beneficiary of any industrial bounce-back.
• Alongside the U.S. premium to the rest of the developed world, growth is thriving relative to value, trading at a relative multiple not seen since the tech-media-telecom (TMT) bubble at the start of the millennium. We are agnostic on the growth versus value debate, since we are wary of both of them! The valuations for fast growing companies make us nervous, and we have moved around 1,000 basis points of the portfolio over the last two years from the faster growing companies, with estimated sales growth of 6% or higher, to the "duller" side of the portfolio with 3% to 5% top-line growth,(iii) where valuations are more reasonable. As for value, it is the companies' prospects that often look relatively dim, with several of the struggling sectors facing genuine threats, be it
(i) Source: FactSet, December 2019.
(ii) Source: FactSet, Morgan Stanley Investment Management, December 2019.
(iii) Source: Morgan Stanley Investment Management, December 2019.
5
Morgan Stanley Institutional Fund, Inc.
Annual Report — December 31, 2019
Investment Overview (unaudited) (cont'd)
Global Franchise Portfolio
trapped assets for energy, the rise of electric vehicles for autos and low interest rates for financials.
• As ever, we advocate the case for quality. We look for companies with the intangible assets to give them the combination of recurring revenue and pricing power, along with the ability to sustain high returns on operating capital. One of the pluses they offer is resilience in tough times: the recurring revenue protects sales and the pricing power protects margins. 2019 was yet another time that the portfolio's companies displayed this economic resilience, with the earnings continuing to compound steadily all year while the market as a whole failed to deliver any earnings growth at all. At a time of raised multiples and high uncertainty (uncertainty that is arguably not properly reflected in the markets), we would argue that it makes sense to go with the relative safety and durability of high-quality compounders.

* Minimum Investment for Class I shares
In accordance with SEC regulations, the Fund's performance shown assumes that all recurring fees (including management fees) were deducted and all dividends and distributions were reinvested. The performance of Class A, L , C and IS shares will vary from the performance of Class I shares based upon their different inception dates and will be negatively impacted by additional fees assessed to those classes (if applicable).
6
Morgan Stanley Institutional Fund, Inc.
Annual Report — December 31, 2019
Investment Overview (unaudited) (cont'd)
Global Franchise Portfolio
Performance Compared to the MSCI World Net Index(1) and the Lipper Global Large-Cap Growth Funds Index(2)
| | | Period Ended December 31, 2019
Total Returns(3) | |
| | | | | Average Annual | |
| | | One
Year | | Five
Years | | Ten
Years | | Since
Inception(8) | |
Fund — Class I Shares
w/o sales charges(4) | | | 29.60 | % | | | 12.57 | % | | | 12.56 | % | | | 11.70 | % | |
Fund — Class A Shares
w/o sales charges(4) | | | 29.24 | | | | 12.28 | | | | 12.26 | | | | 11.40 | | |
Fund — Class A Shares with
maximum 5.25% sales charges(4) | | | 22.44 | | | | 11.08 | | | | 11.66 | | | | 11.07 | | |
Fund — Class L Shares
w/o sales charges(5) | | | 28.62 | | | | 11.72 | | | | — | | | | 10.68 | | |
Fund — Class C Shares
w/o sales charges(7) | | | 28.27 | | | | — | | | | — | | | | 13.50 | | |
Fund — Class C Shares with
maximum 1.00% deferred
sales charges(7) | | | 27.27 | | | | — | | | | — | | | | 13.50 | | |
Fund — Class IS Shares w/o
sales charges(6) | | | 29.67 | | | | — | | | | — | | | | 12.39 | | |
MSCI World Net Index | | | 27.67 | | | | 8.74 | | | | 9.47 | | | | 6.99 | | |
Lipper Global Large-Cap Growth
Funds Index | | | 30.20 | | | | 10.48 | | | | 10.09 | | | | 6.98 | | |
Performance data quoted represents past performance, which is no guarantee of future results, and current performance may be lower or higher than the figures shown. Performance assumes that all dividends and distributions, if any, were reinvested. For the most recent month-end performance figures, please visit www.morganstanley.com/im/shareholderreports. Investment return and principal value will fluctuate so that Fund shares, when redeemed, may be worth more or less than their original cost. Total returns do not reflect the deduction of taxes that a shareholder would pay on Fund distributions or the redemption of Fund shares. Performance of share classes will vary due to difference in sales charges and expenses.
(1) The MSCI World Net Index is a free float-adjusted market capitalization weighted index that is designed to measure the global equity market performance of developed markets. The term "free float" represents the portion of shares outstanding that are deemed to be available for purchase in the public equity markets by investors. The MSCI World Net Index currently consists of 23 developed market country indices. The performance of the Index is listed in U.S. dollars and assumes reinvestment of net dividends. Net total return indices reinvest dividends after the deduction of withholding taxes, using (for international indices) a tax rate applicable to non-resident institutional investors who do not benefit from double taxation treaties. The Index is unmanaged and its returns do not include any sales charges or fees. Such costs would lower performance. It is not possible to invest directly in an index.
(2) The Lipper Global Large-Cap Growth Funds Index is an equally weighted performance index of the largest qualifying funds (based on net assets) in the Lipper Global Large-Cap Growth Funds classification. The Index, which is adjusted for capital gains distributions and income dividends, is unmanaged and should not be considered an investment. There are currently 30 funds represented in this Index. As of the date of this report, the Fund was in the Lipper Global Large-Cap Growth Funds classification.
(3) Total returns for the Fund reflect fees waived and expenses reimbursed, if applicable, by the Adviser (as defined herein). Without such waivers and reimbursements, total returns would have been lower.
(4) Commenced operations on November 28, 2001.
(5) Commenced offering on April 27, 2012.
(6) Commenced offering on May 29, 2015.
(7) Commenced offering on September 30, 2015.
(8) For comparative purposes, average annual since inception returns listed for the Indexes refer to the inception date of Class I of the Fund, not the inception of the Index.
7
Morgan Stanley Institutional Fund, Inc.
Annual Report — December 31, 2019
Portfolio of Investments
Global Franchise Portfolio
| | | Shares | | Value
(000) | |
Common Stocks (97.3%) | |
France (5.6%) | |
L'Oreal SA | | | 214,321 | | | $ | 63,467 | | |
Pernod Ricard SA | | | 314,226 | | | | 56,183 | | |
| | | | 119,650 | | |
Germany (5.5%) | |
SAP SE | | | 877,352 | | | | 118,090 | | |
Italy (0.9%) | |
Davide Campari-Milano SpA | | | 2,016,367 | | | | 18,424 | | |
Netherlands (3.3%) | |
Heineken N.V. | | | 659,843 | | | | 70,255 | | |
United Kingdom (18.3%) | |
British American Tobacco PLC | | | 1,517,124 | | | | 64,940 | | |
Experian PLC | | | 1,609,965 | | | | 54,423 | | |
Reckitt Benckiser Group PLC | | | 1,932,913 | | | | 156,923 | | |
RELX PLC (LSE) | | | 2,073,457 | | | | 52,334 | | |
RELX PLC (Euronext N.V.) | | | 801,863 | | | | 20,202 | | |
Unilever PLC | | | 693,100 | | | | 39,941 | | |
| | | | 388,763 | | |
United States (63.7%) | |
Abbott Laboratories | | | 773,062 | | | | 67,148 | | |
Accenture PLC, Class A | | | 484,293 | | | | 101,978 | | |
Automatic Data Processing, Inc. | | | 518,751 | | | | 88,447 | | |
Baxter International, Inc. | | | 1,000,613 | | | | 83,671 | | |
Becton Dickinson & Co. | | | 281,175 | | | | 76,471 | | |
Church & Dwight Co., Inc. | | | 343,038 | | | | 24,129 | | |
Coca-Cola Co. (The) | | | 1,331,012 | | | | 73,671 | | |
Danaher Corp. | | | 518,678 | | | | 79,607 | | |
Factset Research Systems, Inc. | | | 95,673 | | | | 25,669 | | |
Fidelity National Information Services, Inc. | | | 344,440 | | | | 47,908 | | |
Fox Corp., Class A | | | 444,737 | | | | 16,486 | | |
Fox Corp., Class B (a) | | | 370,348 | | | | 13,481 | | |
Microsoft Corp. | | | 1,118,473 | | | | 176,383 | | |
Moody's Corp. | | | 132,470 | | | | 31,450 | | |
NIKE, Inc., Class B | | | 433,669 | | | | 43,935 | | |
Philip Morris International, Inc. | | | 1,951,264 | | | | 166,033 | | |
Thermo Fisher Scientific, Inc. | | | 230,464 | | | | 74,871 | | |
Visa, Inc., Class A | | | 604,072 | | | | 113,505 | | |
Zoetis, Inc. | | | 397,624 | | | | 52,626 | | |
| | | | 1,357,469 | | |
Total Common Stocks (Cost $1,561,838) | | | 2,072,651 | | |
Short-Term Investment (2.5%) | |
Investment Company (2.5%) | |
Morgan Stanley Institutional Liquidity
Funds — Treasury Securities Portfolio —
Institutional Class (See Note G)
(Cost $52,999) | | | 52,999,117 | | | | 52,999 | | |
Total Investments (99.8%) (Cost $1,614,837) (b)(c) | | | 2,125,650 | | |
Other Assets in Excess of Liabilities (0.2%) | | | 4,745 | | |
Net Assets (100.0%) | | $ | 2,130,395 | | |
Country assignments and aggregations are based generally on third party vendor classifications and information, and may be different from the assignments and aggregations under the policies set forth in the Fund's prospectus and/or statement of additional information relating to geographic classifications.
(a) Non-income producing security.
(b) The approximate fair value and percentage of net assets, $136,514,000 and 6.4%, respectively, represent the securities that have been fair valued under the fair valuation policy for international investments as described in Note A-1 within the Notes to the Financial Statements.
(c) At December 31, 2019, the aggregate cost for federal income tax purposes is approximately $1,625,153,000. The aggregate gross unrealized appreciation is approximately $510,754,000 and the aggregate gross unrealized depreciation is approximately $10,257,000, resulting in net unrealized appreciation of approximately $500,497,000.
Euronext N.V. Euronext Amsterdam Stock Market.
LSE London Stock Exchange.
Portfolio Composition
Classification | | Percentage of
Total Investments | |
Other* | | | 19.5 | % | |
Information Technology Services | | | 16.5 | | |
Health Care Equipment & Supplies | | | 14.4 | | |
Software | | | 13.9 | | |
Tobacco | | | 10.9 | | |
Beverages | | | 10.3 | | |
Household Products | | | 8.5 | | |
Professional Services | | | 6.0 | | |
Total Investments | | | 100.0 | % | |
* Industries and/or investment types representing less than 5% of total investments.
The accompanying notes are an integral part of the financial statements.
8
Morgan Stanley Institutional Fund, Inc.
Annual Report — December 31, 2019
Global Franchise Portfolio
Statement of Assets and Liabilities | | December 31, 2019
(000) | |
Assets: | |
Investments in Securities of Unaffiliated Issuers, at Value (Cost $1,561,838) | | $ | 2,072,651 | | |
Investment in Security of Affiliated Issuer, at Value (Cost $52,999) | | | 52,999 | | |
Total Investments in Securities, at Value (Cost $1,614,837) | | | 2,125,650 | | |
Receivable for Fund Shares Sold | | | 4,439 | | |
Dividends Receivable | | | 4,213 | | |
Tax Reclaim Receivable | | | 566 | | |
Receivable for Investments Sold | | | 145 | | |
Receivable from Affiliate | | | 58 | | |
Other Assets | | | 90 | | |
Total Assets | | | 2,135,161 | | |
Liabilities: | |
Payable for Advisory Fees | | | 3,683 | | |
Payable for Fund Shares Redeemed | | | 439 | | |
Payable for Sub Transfer Agency Fees — Class I | | | 140 | | |
Payable for Sub Transfer Agency Fees — Class A | | | 28 | | |
Payable for Sub Transfer Agency Fees — Class L | | | 1 | | |
Payable for Sub Transfer Agency Fees — Class C | | | 10 | | |
Payable for Shareholder Services Fees — Class A | | | 61 | | |
Payable for Distribution and Shareholder Services Fees — Class L | | | 5 | | |
Payable for Distribution and Shareholder Services Fees — Class C | | | 81 | | |
Payable for Administration Fees | | | 141 | | |
Payable for Professional Fees | | | 54 | | |
Payable for Custodian Fees | | | 20 | | |
Payable for Transfer Agency Fees — Class I | | | 4 | | |
Payable for Transfer Agency Fees — Class A | | | 1 | | |
Payable for Transfer Agency Fees — Class L | | | — | @ | |
Payable for Transfer Agency Fees — Class C | | | 1 | | |
Payable for Transfer Agency Fees — Class IS | | | 1 | | |
Other Liabilities | | | 96 | | |
Total Liabilities | | | 4,766 | | |
Net Assets | | $ | 2,130,395 | | |
Net Assets Consist of: | |
Paid-in-Capital | | $ | 1,627,875 | | |
Total Distributable Earnings | | | 502,520 | | |
Net Assets | | $ | 2,130,395 | | |
The accompanying notes are an integral part of the financial statements.
9
Morgan Stanley Institutional Fund, Inc.
Annual Report — December 31, 2019
Global Franchise Portfolio
Statement of Assets and Liabilities (cont'd) | | December 31, 2019
(000) | |
CLASS I: | |
Net Assets | | $ | 1,593,092 | | |
| Shares Outstanding $0.001 par value shares of beneficial interest (unlimited shares authorized) (not in 000's) | | | 55,839,581 | | |
Net Asset Value, Offering and Redemption Price Per Share | | $ | 28.53 | | |
CLASS A: | |
Net Assets | | $ | 292,491 | | |
| Shares Outstanding $0.001 par value shares of beneficial interest (unlimited shares authorized) (not in 000's) | | | 10,500,332 | | |
Net Asset Value, Redemption Price Per Share | | $ | 27.86 | | |
Maximum Sales Load | | | 5.25 | % | |
Maximum Sales Charge | | $ | 1.54 | | |
Maximum Offering Price Per Share | | $ | 29.40 | | |
CLASS L: | |
Net Assets | | $ | 8,388 | | |
| Shares Outstanding $0.001 par value shares of beneficial interest (unlimited shares authorized) (not in 000's) | | | 301,328 | | |
Net Asset Value, Offering and Redemption Price Per Share | | $ | 27.84 | | |
CLASS C: | |
Net Assets | | $ | 99,141 | | |
| Shares Outstanding $0.001 par value shares of beneficial interest (unlimited shares authorized) (not in 000's) | | | 3,631,940 | | |
Net Asset Value, Offering and Redemption Price Per Share | | $ | 27.30 | | |
CLASS IS: | |
Net Assets | | $ | 137,283 | | |
| Shares Outstanding $0.001 par value shares of beneficial interest (unlimited shares authorized) (not in 000's) | | | 4,811,581 | | |
Net Asset Value, Offering and Redemption Price Per Share | | $ | 28.53 | | |
@ Amount is less than $500.
The accompanying notes are an integral part of the financial statements.
10
Morgan Stanley Institutional Fund, Inc.
Annual Report — December 31, 2019
Global Franchise Portfolio
Statement of Operations | | Year Ended
December 31, 2019
(000) | |
Investment Income: | |
Dividends from Securities of Unaffiliated Issuers (Net of $682 of Foreign Taxes Withheld) | | $ | 34,731 | | |
Dividends from Security of Affiliated Issuer (Note G) | | | 872 | | |
Total Investment Income | | | 35,603 | | |
Expenses: | |
Advisory Fees (Note B) | | | 13,054 | | |
Administration Fees (Note C) | | | 1,406 | | |
Shareholder Services Fees — Class A (Note D) | | | 575 | | |
Distribution and Shareholder Services Fees — Class L (Note D) | | | 58 | | |
Distribution and Shareholder Services Fees — Class C (Note D) | | | 767 | | |
Sub Transfer Agency Fees — Class I | | | 958 | | |
Sub Transfer Agency Fees — Class A | | | 184 | | |
Sub Transfer Agency Fees — Class L | | | 4 | | |
Sub Transfer Agency Fees — Class C | | | 69 | | |
Registration Fees | | | 126 | | |
Professional Fees | | | 118 | | |
Directors' Fees and Expenses | | | 83 | | |
Shareholder Reporting Fees | | | 77 | | |
Custodian Fees (Note F) | | | 74 | | |
Transfer Agency Fees — Class I (Note E) | | | 15 | | |
Transfer Agency Fees — Class A (Note E) | | | 4 | | |
Transfer Agency Fees — Class L (Note E) | | | 2 | | |
Transfer Agency Fees — Class C (Note E) | | | 6 | | |
Transfer Agency Fees — Class IS (Note E) | | | 3 | | |
Pricing Fees | | | 2 | | |
Other Expenses | | | 62 | | |
Expenses Before Non Operating Expenses | | | 17,647 | | |
Bank Overdraft Expense | | | 3 | | |
Total Expenses | | | 17,650 | | |
Rebate from Morgan Stanley Affiliate (Note G) | | | (84 | ) | |
Net Expenses | | | 17,566 | | |
Net Investment Income | | | 18,037 | | |
Realized Gain (Loss): | |
Investments Sold | | | 75,634 | | |
Foreign Currency Translation | | | (217 | ) | |
Net Realized Gain | | | 75,417 | | |
Change in Unrealized Appreciation (Depreciation): | |
Investments | | | 342,087 | | |
Foreign Currency Translation | | | 26 | | |
Net Change in Unrealized Appreciation (Depreciation) | | | 342,113 | | |
Net Realized Gain and Change in Unrealized Appreciation (Depreciation) | | | 417,530 | | |
Net Increase in Net Assets Resulting from Operations | | $ | 435,567 | | |
The accompanying notes are an integral part of the financial statements.
11
Morgan Stanley Institutional Fund, Inc.
Annual Report — December 31, 2019
Global Franchise Portfolio
Statements of Changes in Net Assets | | Year Ended
December 31, 2019
(000) | | Year Ended
December 31, 2018
(000) | |
Increase (Decrease) in Net Assets: | |
Operations: | |
Net Investment Income | | $ | 18,037 | | | $ | 13,172 | | |
Net Realized Gain | | | 75,417 | | | | 53,237 | | |
Net Change in Unrealized Appreciation (Depreciation) | | | 342,113 | | | | (97,028 | ) | |
Net Increase (Decrease) in Net Assets Resulting from Operations | | | 435,567 | | | | (30,619 | ) | |
Dividends and Distributions to Shareholders: | |
Class I | | | (69,422 | ) | | | (46,526 | ) | |
Class A | | | (12,386 | ) | | | (7,892 | ) | |
Class L | | | (324 | ) | | | (359 | ) | |
Class C | | | (3,695 | ) | | | (2,499 | ) | |
Class IS | | | (6,101 | ) | | | (11,432 | ) | |
Total Dividends and Distributions to Shareholders | | | (91,928 | ) | | | (68,708 | ) | |
Capital Share Transactions:(1) | |
Class I: | |
Subscribed | | | 610,415 | | | | 408,679 | | |
Distributions Reinvested | | | 66,894 | | | | 45,332 | | |
Redeemed | | | (243,674 | ) | | | (223,714 | ) | |
Class A: | |
Subscribed | | | 129,760 | | | | 40,032 | | |
Distributions Reinvested | | | 11,893 | | | | 7,833 | | |
Redeemed | | | (42,410 | ) | | | (32,392 | ) | |
Class L: | |
Exchanged | | | 153 | | | | 199 | | |
Distributions Reinvested | | | 324 | | | | 358 | | |
Redeemed | | | (971 | ) | | | (728 | ) | |
Class C: | |
Subscribed | | | 39,565 | | | | 19,817 | | |
Distributions Reinvested | | | 3,620 | | | | 2,481 | | |
Redeemed | | | (13,421 | ) | | | (10,618 | ) | |
Class IS: | |
Subscribed | | | 27,633 | | | | 125,041 | | |
Distributions Reinvested | | | 6,101 | | | | 11,432 | | |
Redeemed | | | (145,085 | ) | | | (4,502 | ) | |
Net Increase in Net Assets Resulting from Capital Share Transactions | | | 450,797 | | | | 389,250 | | |
Total Increase in Net Assets | | | 794,436 | | | | 289,923 | | |
Net Assets: | |
Beginning of Period | | | 1,335,959 | | | | 1,046,036 | | |
End of Period | | $ | 2,130,395 | | | $ | 1,335,959 | | |
The accompanying notes are an integral part of the financial statements.
12
Morgan Stanley Institutional Fund, Inc.
Annual Report — December 31, 2019
Global Franchise Portfolio
Statements of Changes in Net Assets (cont'd) | | Year Ended
December 31, 2019
(000) | | Year Ended
December 31, 2018
(000) | |
(1) Capital Share Transactions: | |
Class I: | |
Shares Subscribed | | | 22,755 | | | | 16,522 | | |
Shares Issued on Distributions Reinvested | | | 2,357 | | | | 1,916 | | |
Shares Redeemed | | | (9,143 | ) | | | (9,029 | ) | |
Net Increase in Class I Shares Outstanding | | | 15,969 | | | | 9,409 | | |
Class A: | |
Shares Subscribed | | | 4,988 | | | | 1,634 | | |
Shares Issued on Distributions Reinvested | | | 429 | | | | 338 | | |
Shares Redeemed | | | (1,617 | ) | | | (1,333 | ) | |
Net Increase in Class A Shares Outstanding | | | 3,800 | | | | 639 | | |
Class L: | |
Shares Exchanged | | | 5 | | | | 9 | | |
Shares Issued on Distributions Reinvested | | | 12 | | | | 15 | | |
Shares Redeemed | | | (41 | ) | | | (30 | ) | |
Net Decrease in Class L Shares Outstanding | | | (24 | ) | | | (6 | ) | |
Class C: | |
Shares Subscribed | | | 1,520 | | | | 830 | | |
Shares Issued on Distributions Reinvested | | | 133 | | | | 109 | | |
Shares Redeemed | | | (519 | ) | | | (445 | ) | |
Net Increase in Class C Shares Outstanding | | | 1,134 | | | | 494 | | |
Class IS: | |
Shares Subscribed | | | 988 | | | | 4,898 | | |
Shares Issued on Distributions Reinvested | | | 215 | | | | 483 | | |
Shares Redeemed | | | (5,250 | ) | | | (183 | ) | |
Net Increase (Decrease) in Class IS Shares Outstanding | | | (4,047 | ) | | | 5,198 | | |
The accompanying notes are an integral part of the financial statements.
13
Morgan Stanley Institutional Fund, Inc.
Annual Report — December 31, 2019
Financial Highlights
Global Franchise Portfolio
| | | Class I | |
| | | Year Ended December 31, | |
Selected Per Share Data and Ratios | | 2019 | | 2018 | | 2017 | | 2016(1) | | 2015 | |
Net Asset Value, Beginning of Period | | $ | 23.03 | | | $ | 24.72 | | | $ | 20.56 | | | $ | 20.33 | | | $ | 20.27 | | |
Income (Loss) from Investment Operations: | |
Net Investment Income(2) | | | 0.30 | | | | 0.29 | | | | 0.27 | | | | 0.30 | | | | 0.31 | | |
Net Realized and Unrealized Gain (Loss) | | | 6.51 | | | | (0.63 | ) | | | 5.05 | | | | 0.84 | | | | 1.02 | | |
Total from Investment Operations | | | 6.81 | | | | (0.34 | ) | | | 5.32 | | | | 1.14 | | | | 1.33 | | |
Distributions from and/or in Excess of: | |
Net Investment Income | | | (0.27 | ) | | | (0.27 | ) | | | (0.24 | ) | | | (0.28 | ) | | | (0.35 | ) | |
Net Realized Gain | | | (1.04 | ) | | | (1.08 | ) | | | (0.92 | ) | | | (0.63 | ) | | | (0.92 | ) | |
Total Distributions | | | (1.31 | ) | | | (1.35 | ) | | | (1.16 | ) | | | (0.91 | ) | | | (1.27 | ) | |
Net Asset Value, End of Period | | $ | 28.53 | | | $ | 23.03 | | | $ | 24.72 | | | $ | 20.56 | | | $ | 20.33 | | |
Total Return(3) | | | 29.60 | % | | | (1.50 | )% | | | 25.85 | % | | | 5.64 | % | | | 6.50 | % | |
Ratios to Average Net Assets and Supplemental Data: | |
Net Assets, End of Period (Thousands) | | $ | 1,593,092 | | | $ | 918,409 | | | $ | 753,107 | | | $ | 601,340 | | | $ | 505,321 | | |
Ratio of Expenses Before Expense Limitation | | | N/A | | | | N/A | | | | N/A | | | | 0.98 | % | | | 0.99 | % | |
Ratio of Expenses After Expense Limitation | | | 0.93 | %(4) | | | 0.94 | %(4) | | | 0.98 | %(4) | | | 0.97 | %(4) | | | 0.98 | %(4) | |
Ratio of Expenses After Expense Limitation Excluding Non-Operating Expenses | | | 0.93 | %(4) | | | N/A | | | | N/A | | | | N/A | | | | N/A | | |
Ratio of Net Investment Income | | | 1.09 | %(4) | | | 1.14 | %(4) | | | 1.17 | %(4) | | | 1.40 | %(4) | | | 1.46 | %(4) | |
Ratio of Rebate from Morgan Stanley Affiliates | | | 0.00 | %(5) | | | 0.00 | %(5) | | | 0.00 | %(5) | | | 0.00 | %(5) | | | 0.00 | %(5) | |
Portfolio Turnover Rate | | | 16 | % | | | 27 | % | | | 28 | % | | | 30 | % | | | 37 | % | |
(1) Reflects prior period custodian out-of-pocket expenses that were reimbursed in September 2016. The amount of the reimbursement was immaterial on a per share basis and did not impact the total return of Class I shares. The Ratio of Expenses After Expense Limitation would have been 0.01% higher and the Ratio of Net Investment Income would have been 0.01% lower had the custodian not reimbursed the Fund.
(2) Per share amount is based on average shares outstanding.
(3) Calculated based on the net asset value as of the last business day of the period.
(4) The Ratio of Expenses After Expense Limitation and Ratio of Net Investment Income reflect the rebate of certain Fund expenses in connection with the investments in Morgan Stanley affiliates during the period. The effect of the rebate on the ratios is disclosed in the above table as "Ratio of Rebate from Morgan Stanley Affiliates."
(5) Amount is less than 0.005%.
The accompanying notes are an integral part of the financial statements.
14
Morgan Stanley Institutional Fund, Inc.
Annual Report — December 31, 2019
Financial Highlights
Global Franchise Portfolio
| | | Class A | |
| | | Year Ended December 31, | |
Selected Per Share Data and Ratios | | 2019 | | 2018 | | 2017 | | 2016(1) | | 2015 | |
Net Asset Value, Beginning of Period | | $ | 22.53 | | | $ | 24.21 | | | $ | 20.16 | | | $ | 19.96 | | | $ | 19.92 | | |
Income (Loss) from Investment Operations: | |
Net Investment Income(2) | | | 0.23 | | | | 0.21 | | | | 0.22 | | | | 0.23 | | | | 0.24 | | |
Net Realized and Unrealized Gain (Loss) | | | 6.35 | | | | (0.61 | ) | | | 4.94 | | | | 0.83 | | | | 1.02 | | |
Total from Investment Operations | | | 6.58 | | | | (0.40 | ) | | | 5.16 | | | | 1.06 | | | | 1.26 | | |
Distributions from and/or in Excess of: | |
Net Investment Income | | | (0.21 | ) | | | (0.20 | ) | | | (0.19 | ) | | | (0.23 | ) | | | (0.30 | ) | |
Net Realized Gain | | | (1.04 | ) | | | (1.08 | ) | | | (0.92 | ) | | | (0.63 | ) | | | (0.92 | ) | |
Total Distributions | | | (1.25 | ) | | | (1.28 | ) | | | (1.11 | ) | | | (0.86 | ) | | | (1.22 | ) | |
Net Asset Value, End of Period | | $ | 27.86 | | | $ | 22.53 | | | $ | 24.21 | | | $ | 20.16 | | | $ | 19.96 | | |
Total Return(3) | | | 29.24 | % | | | (1.77 | )% | | | 25.58 | % | | | 5.36 | % | | | 6.25 | % | |
Ratios to Average Net Assets and Supplemental Data: | |
Net Assets, End of Period (Thousands) | | $ | 292,491 | | | $ | 150,936 | | | $ | 146,722 | | | $ | 104,306 | | | $ | 75,297 | | |
Ratio of Expenses Before Expense Limitation | | | N/A | | | | N/A | | | | N/A | | | | 1.23 | % | | | 1.25 | % | |
Ratio of Expenses After Expense Limitation | | | 1.19 | %(4) | | | 1.23 | %(4) | | | 1.21 | %(4) | | | 1.22 | %(4) | | | 1.25 | %(4) | |
Ratio of Expenses After Expense Limitation Excluding Non-Operating Expenses | | | 1.19 | %(4) | | | N/A | | | | N/A | | | | N/A | | | | N/A | | |
Ratio of Net Investment Income | | | 0.83 | %(4) | | | 0.84 | %(4) | | | 0.94 | %(4) | | | 1.13 | %(4) | | | 1.15 | %(4) | |
Ratio of Rebate from Morgan Stanley Affiliates | | | 0.00 | %(5) | | | 0.00 | %(5) | | | 0.00 | %(5) | | | 0.00 | %(5) | | | 0.00 | %(5) | |
Portfolio Turnover Rate | | | 16 | % | | | 27 | % | | | 28 | % | | | 30 | % | | | 37 | % | |
(1) Reflects prior period custodian out-of-pocket expenses that were reimbursed in September 2016. The amount of the reimbursement was immaterial on a per share basis and did not impact the total return of Class A shares. The Ratio of Expenses After Expense Limitation would have been 0.01% higher and the Ratio of Net Investment Income would have been 0.01% lower had the custodian not reimbursed the Fund.
(2) Per share amount is based on average shares outstanding.
(3) Calculated based on the net asset value which does not reflect sales charges, if applicable, as of the last business day of the period.
(4) The Ratio of Expenses After Expense Limitation and Ratio of Net Investment Income reflect the rebate of certain Fund expenses in connection with the investments in Morgan Stanley affiliates during the period. The effect of the rebate on the ratios is disclosed in the above table as "Ratio of Rebate from Morgan Stanley Affiliates."
(5) Amount is less than 0.005%.
The accompanying notes are an integral part of the financial statements.
15
Morgan Stanley Institutional Fund, Inc.
Annual Report — December 31, 2019
Financial Highlights
Global Franchise Portfolio
| | | Class L | |
| | | Year Ended December 31, | |
Selected Per Share Data and Ratios | | 2019 | | 2018 | | 2017 | | 2016(1) | | 2015 | |
Net Asset Value, Beginning of Period | | $ | 22.51 | | | $ | 24.18 | | | $ | 20.13 | | | $ | 19.91 | | | $ | 19.87 | | |
Income (Loss) from Investment Operations: | |
Net Investment Income(2) | | | 0.09 | | | | 0.09 | | | | 0.10 | | | | 0.13 | | | | 0.15 | | |
Net Realized and Unrealized Gain (Loss) | | | 6.35 | | | | (0.62 | ) | | | 4.93 | | | | 0.82 | | | | 1.00 | | |
Total from Investment Operations | | | 6.44 | | | | (0.53 | ) | | | 5.03 | | | | 0.95 | | | | 1.15 | | |
Distributions from and/or in Excess of: | |
Net Investment Income | | | (0.07 | ) | | | (0.06 | ) | | | (0.06 | ) | | | (0.10 | ) | | | (0.19 | ) | |
Net Realized Gain | | | (1.04 | ) | | | (1.08 | ) | | | (0.92 | ) | | | (0.63 | ) | | | (0.92 | ) | |
Total Distributions | | | (1.11 | ) | | | (1.14 | ) | | | (0.98 | ) | | | (0.73 | ) | | | (1.11 | ) | |
Net Asset Value, End of Period | | $ | 27.84 | | | $ | 22.51 | | | $ | 24.18 | | | $ | 20.13 | | | $ | 19.91 | | |
Total Return(3) | | | 28.62 | % | | | (2.29 | )% | | | 24.98 | % | | | 4.82 | % | | | 5.72 | % | |
Ratios to Average Net Assets and Supplemental Data: | |
Net Assets, End of Period (Thousands) | | $ | 8,388 | | | $ | 7,312 | | | $ | 7,993 | | | $ | 7,449 | | | $ | 8,898 | | |
Ratio of Expenses Before Expense Limitation | | | N/A | | | | N/A | | | | N/A | | | | 1.72 | % | | | 1.73 | % | |
Ratio of Expenses After Expense Limitation | | | 1.69 | %(4) | | | 1.73 | %(4) | | | 1.70 | %(4) | | | 1.71 | %(4) | | | 1.72 | %(4) | |
Ratio of Expenses After Expense Limitation Excluding Non-Operating Expenses | | | 1.69 | %(4) | | | N/A | | | | N/A | | | | N/A | | | | N/A | | |
Ratio of Net Investment Income | | | 0.31 | %(4) | | | 0.36 | %(4) | | | 0.44 | %(4) | | | 0.65 | %(4) | | | 0.72 | %(4) | |
Ratio of Rebate from Morgan Stanley Affiliates | | | 0.00 | %(5) | | | 0.00 | %(5) | | | 0.00 | %(5) | | | 0.00 | %(5) | | | 0.00 | %(5) | |
Portfolio Turnover Rate | | | 16 | % | | | 27 | % | | | 28 | % | | | 30 | % | | | 37 | % | |
(1) Reflects prior period custodian out-of-pocket expenses that were reimbursed in September 2016. The amount of the reimbursement was immaterial on a per share basis and did not impact the total return of Class L shares. The Ratio of Expenses After Expense Limitation would have been 0.01% higher and the Ratio of Net Investment Income would have been 0.01% lower had the custodian not reimbursed the Fund.
(2) Per share amount is based on average shares outstanding.
(3) Calculated based on the net asset value as of the last business day of the period.
(4) The Ratio of Expenses After Expense Limitation and Ratio of Net Investment Income reflect the rebate of certain Fund expenses in connection with the investments in Morgan Stanley affiliates during the period. The effect of the rebate on the ratios is disclosed in the above table as "Ratio of Rebate from Morgan Stanley Affiliates."
(5) Amount is less than 0.005%.
The accompanying notes are an integral part of the financial statements.
16
Morgan Stanley Institutional Fund, Inc.
Annual Report — December 31, 2019
Financial Highlights
Global Franchise Portfolio
| | | Class C | |
| | | Year Ended December 31, | | Period from
September 30, 2015(2) to | |
Selected Per Share Data and Ratios | | 2019 | | 2018 | | 2017 | | 2016(1) | | December 31, 2015 | |
Net Asset Value, Beginning of Period | | $ | 22.13 | | | $ | 23.82 | | | $ | 19.88 | | | $ | 19.75 | | | $ | 19.79 | | |
Income (Loss) from Investment Operations: | |
Net Investment Income(3) | | | 0.02 | | | | 0.03 | | | | 0.04 | | | | 0.06 | | | | 0.01 | | |
Net Realized and Unrealized Gain (Loss) | | | 6.23 | | | | (0.60 | ) | | | 4.86 | | | | 0.84 | | | | 1.02 | | |
Total from Investment Operations | | | 6.25 | | | | (0.57 | ) | | | 4.90 | | | | 0.90 | | | | 1.03 | | |
Distributions from and/or in Excess of: | |
Net Investment Income | | | (0.04 | ) | | | (0.04 | ) | | | (0.04 | ) | | | (0.14 | ) | | | (0.28 | ) | |
Net Realized Gain | | | (1.04 | ) | | | (1.08 | ) | | | (0.92 | ) | | | (0.63 | ) | | | (0.79 | ) | |
Total Distributions | | | (1.08 | ) | | | (1.12 | ) | | | (0.96 | ) | | | (0.77 | ) | | | (1.07 | ) | |
Net Asset Value, End of Period | | $ | 27.30 | | | $ | 22.13 | | | $ | 23.82 | | | $ | 19.88 | | | $ | 19.75 | | |
Total Return(4) | | | 28.27 | % | | | (2.51 | )% | | | 24.63 | % | | | 4.58 | % | | | 5.11 | %(7) | |
Ratios to Average Net Assets and Supplemental Data: | |
Net Assets, End of Period (Thousands) | | $ | 99,141 | | | $ | 55,271 | | | $ | 47,726 | | | $ | 29,650 | | | $ | 5,765 | | |
Ratio of Expenses Before Expense Limitation | | | N/A | | | | N/A | | | | N/A | | | | 2.00 | % | | | N/A | | |
Ratio of Expenses After Expense Limitation | | | 1.95 | %(5) | | | 1.96 | %(5) | | | 1.98 | %(5) | | | 1.99 | %(5) | | | 2.03 | %(5)(8) | |
Ratio of Expenses After Expense Limitation Excluding Non-Operating Expenses | | | 1.95 | %(5) | | | N/A | | | | N/A | | | | N/A | | | | N/A | | |
Ratio of Net Investment Income | | | 0.07 | %(5) | | | 0.12 | %(5) | | | 0.16 | %(5) | | | 0.29 | %(5) | | | 0.11 | %(5)(8) | |
Ratio of Rebate from Morgan Stanley Affiliates | | | 0.00 | %(6) | | | 0.00 | %(6) | | | 0.00 | %(6) | | | 0.00 | %(6) | | | 0.00 | %(6)(8) | |
Portfolio Turnover Rate | | | 16 | % | | | 27 | % | | | 28 | % | | | 30 | % | | | 37 | % | |
(1) Reflects prior period custodian out-of-pocket expenses that were reimbursed in September 2016. The amount of the reimbursement was immaterial on a per share basis and did not impact the total return of Class C shares. The Ratio of Expenses After Expense Limitation would have been 0.01% higher and the Ratio of Net Investment Income would have been 0.01% lower had the custodian not reimbursed the Fund.
(2) Commencement of Offering.
(3) Per share amount is based on average shares outstanding.
(4) Calculated based on the net asset value which does not reflect sales charges, if applicable, as of the last business day of the period.
(5) The Ratio of Expenses After Expense Limitation and Ratio of Net Investment Income reflect the rebate of certain Fund expenses in connection with the investments in Morgan Stanley affiliates during the period. The effect of the rebate on the ratios is disclosed in the above table as "Ratio of Rebate from Morgan Stanley Affiliates."
(6) Amount is less than 0.005%.
(7) Not annualized.
(8) Annualized.
The accompanying notes are an integral part of the financial statements.
17
Morgan Stanley Institutional Fund, Inc.
Annual Report — December 31, 2019
Financial Highlights
Global Franchise Portfolio
| | | Class IS | |
| | | Year Ended December 31, | | Period from
December 15, 2015(2) to | |
Selected Per Share Data and Ratios | | 2019 | | 2018 | | 2017 | | 2016(1) | | December 31, 2015 | |
Net Asset Value, Beginning of Period | | $ | 23.03 | | | $ | 24.72 | | | $ | 20.55 | | | $ | 20.33 | | | $ | 21.49 | | |
Income (Loss) from Investment Operations: | |
Net Investment Income(3) | | | 0.32 | | | | 0.32 | | | | 0.29 | | | | 0.21 | | | | 0.12 | | |
Net Realized and Unrealized Gain (Loss) | | | 6.51 | | | | (0.65 | ) | | | 5.05 | | | | 0.93 | | | | 0.00 | (4) | |
Total from Investment Operations | | | 6.83 | | | | (0.33 | ) | | | 5.34 | | | | 1.14 | | | | 0.12 | | |
Distributions from and/or in Excess of: | |
Net Investment Income | | | (0.29 | ) | | | (0.28 | ) | | | (0.25 | ) | | | (0.29 | ) | | | (0.36 | ) | |
Net Realized Gain | | | (1.04 | ) | | | (1.08 | ) | | | (0.92 | ) | | | (0.63 | ) | | | (0.92 | ) | |
Total Distributions | | | (1.33 | ) | | | (1.36 | ) | | | (1.17 | ) | | | (0.92 | ) | | | (1.28 | ) | |
Net Asset Value, End of Period | | $ | 28.53 | | | $ | 23.03 | | | $ | 24.72 | | | $ | 20.55 | | | $ | 20.33 | | |
Total Return(5) | | | 29.67 | % | | | (1.45 | )% | | | 26.00 | % | | | 5.70 | % | | | 0.45 | %(8) | |
Ratios to Average Net Assets and Supplemental Data: | |
Net Assets, End of Period (Thousands) | | $ | 137,283 | | | $ | 204,031 | | | $ | 90,488 | | | $ | 19,334 | | | $ | 9 | | |
Ratio of Expenses Before Expense Limitation | | | N/A | | | | N/A | | | | N/A | | | | 0.94 | % | | | 16.54 | %(9) | |
Ratio of Expenses After Expense Limitation | | | 0.86 | %(6) | | | 0.88 | %(6) | | | 0.91 | %(6) | | | 0.92 | %(6) | | | 0.94 | %(6)(9) | |
Ratio of Expenses After Expense Limitation Excluding Non-Operating Expenses | | | 0.86 | %(6) | | | N/A | | | | N/A | | | | N/A | | | | N/A | | |
Ratio of Net Investment Income | | | 1.21 | %(6) | | | 1.30 | %(6) | | | 1.23 | %(6) | | | 0.99 | %(6) | | | 0.95 | %(6)(9) | |
Ratio of Rebate from Morgan Stanley Affiliates | | | 0.00 | %(7) | | | 0.00 | %(7) | | | 0.00 | %(7) | | | 0.00 | %(7) | | | 0.00 | %(7)(9) | |
Portfolio Turnover Rate | | | 16 | % | | | 27 | % | | | 28 | % | | | 30 | % | | | 37 | % | |
(1) Reflects prior period custodian out-of-pocket expenses that were reimbursed in September 2016. The amount of the reimbursement was immaterial on a per share basis and did not impact the total return of Class IS shares. The Ratio of Expenses After Expense Limitation would have been 0.01% higher and the Ratio of Net Investment Income would have been 0.01% lower had the custodian not reimbursed the Fund.
(2) Commencement of Offering.
(3) Per share amount is based on average shares outstanding.
(4) Amount is less than $0.005 per share.
(5) Calculated based on the net asset value as of the last business day of the period.
(6) The Ratio of Expenses After Expense Limitation and Ratio of Net Investment Income reflect the rebate of certain Fund expenses in connection with the investments in Morgan Stanley affiliates during the period. The effect of the rebate on the ratios is disclosed in the above table as "Ratio of Rebate from Morgan Stanley Affiliates."
(7) Amount is less than 0.005%.
(8) Not annualized.
(9) Annualized.
The accompanying notes are an integral part of the financial statements.
18
Morgan Stanley Institutional Fund, Inc.
Annual Report — December 31, 2019
Notes to Financial Statements
Morgan Stanley Institutional Fund, Inc. (the "Company") is registered under the Investment Company Act of 1940, as amended (the "Act"), as an open-end management investment company. The Company is comprised of thirty-two separate, active, diversified and non-diversified funds (individually referred to as a "Fund," collectively as the "Funds"). The Company applies investment company accounting and reporting guidance.
The accompanying financial statements relate to the Global Franchise Portfolio. The Fund seeks long-term capital appreciation.
The Fund offers five classes of shares — Class I, Class A, Class L, Class C and Class IS. On April 30, 2015, the Fund suspended offering of Class L shares. Existing Class L shareholders may invest through reinvestment of dividends and distributions.
A. Significant Accounting Policies: The following significant accounting policies are in conformity with U.S. generally accepted accounting principles ("GAAP"). Such policies are consistently followed by the Company in the preparation of its financial statements. GAAP may require management to make estimates and assumptions that affect the reported amounts and disclosures in the financial statements. Actual results may differ from those estimates.
In August 2018, the Financial Accounting Standards Board ("FASB") issued Accounting Standards Update ("ASU") 2018-13, Fair Value Measurement (Topic 820) — Disclosures Framework — Changes to Disclosure Requirements of Fair Value Measurement ("ASU 2018-13") which introduces new fair value disclosure requirements as well as eliminates and modifies certain existing fair value disclosure requirements. ASU 2018-13 would be effective for fiscal years beginning after December 15, 2019 and for interim periods within those fiscal years; however, management has elected to early adopt ASU 2018-13 as permitted by the standard. The impact of the Fund's adoption was limited to changes in the Fund's financial statement disclosures regarding fair value, primarily those disclosures related to transfers between levels of the fair value hierarchy and disclosure of the range and weighted average used to develop significant unobservable inputs for Level 3 fair value measurements, when applicable.
1. Security Valuation: (1) An equity portfolio security listed or traded on an exchange is valued at its latest reported sales price (or at the exchange official closing price if such exchange reports an official closing price),
and if there were no sales on a given day and if there is no official exchange closing price for that day, the security is valued at the mean between the last reported bid and asked prices if such bid and asked prices are available on the relevant exchanges. If only bid prices are available then the latest bid price may be used. Listed equity securities not traded on the valuation date with no reported bid and asked prices available on the exchange are valued at the mean between the current bid and asked prices obtained from one or more reputable brokers or dealers. In cases where a security is traded on more than one exchange, the security is valued on the exchange designated as the primary market; (2) all other equity portfolio securities for which over-the-counter ("OTC") market quotations are readily available are valued at the latest reported sales price (or at the market official closing price if such market reports an official closing price), and if there was no trading in the security on a given day and if there is no official closing price from relevant markets for that day, the security is valued at the mean between the last reported bid and asked prices if such bid and asked prices are available on the relevant markets. An unlisted equity security that does not trade on the valuation date and for which bid and asked prices from the relevant markets are unavailable is valued at the mean between the current bid and asked prices obtained from one or more reputable brokers or dealers; (3) certain portfolio securities may be valued by an outside pricing service/vendor approved by the Company's Board of Directors (the "Directors"). The pricing service/vendor may employ a pricing model that takes into account, among other things, bids, yield spreads and/or other market data and specific security characteristics. Alternatively, if a valuation is not available from an outside pricing service/vendor, and the security trades on an exchange, the security may be valued at its latest reported sale price (or at the exchange official closing price if such exchange reports an official closing price), prior to the time when assets are valued. If there are no sales on a given day and if there is no official exchange closing price for that day, the security is valued at the mean between the last reported bid and asked prices if such bid and asked prices are available in the relevant exchanges. If Morgan Stanley Investment Management Inc. (the "Adviser") or Morgan Stanley Investment Management Limited ("MSIM Limited") (the "Sub-Adviser"), each a wholly-owned subsidiary of Morgan Stanley, determines that the price provided by the outside pricing service/vendor or
19
Morgan Stanley Institutional Fund, Inc.
Annual Report — December 31, 2019
Notes to Financial Statements (cont'd)
exchange does not reflect the security's fair value or is unable to provide a price, prices from brokers or dealers may also be utilized. In these circumstances, the value of the security will be the mean of bid and asked prices obtained from brokers or dealers; (4) when market quotations are not readily available, including circumstances under which the Adviser or the Sub-Adviser determines that the closing price, last sale price or the mean between the last reported bid and asked prices are not reflective of a security's market value, portfolio securities are valued at their fair value as determined in good faith under procedures established by and under the general supervision of the Directors. Occasionally, developments affecting the closing prices of securities and other assets may occur between the times at which valuations of such securities are determined (that is, close of the foreign market on which the securities trade) and the close of business of the New York Stock Exchange ("NYSE"). If developments occur during such periods that are expected to materially affect the value of such securities, such valuations may be adjusted to reflect the estimated fair value of such securities as of the close of the NYSE, as determined in good faith by the Directors or by the Adviser using a pricing service and/or procedures approved by the Directors; (5) quotations of foreign portfolio securities, other assets and liabilities and forward contracts stated in foreign currency are translated into U.S. dollar equivalents at the prevailing market rates prior to the close of the NYSE; and (6) investments in mutual funds, including the Morgan Stanley Institutional Liquidity Funds, are valued at the net asset value ("NAV") as of the close of each business day.
The Directors have responsibility for determining in good faith the fair value of the investments, and the Directors may appoint others, such as the Company's Adviser or a valuation committee, to assist the Directors in determining fair value and to make the actual calculations pursuant to the fair valuation methodologies previously approved by the Directors. Under procedures approved by the Directors, the Company's Adviser has formed a Valuation Committee whose members are approved by the Directors. The Valuation Committee provides administration and oversight of the Company's valuation policies and procedures, which are reviewed at least annually by the Directors. These procedures allow the Company to utilize independent pricing services, quotations from securities and financial instrument dealers and other market sources to determine fair value.
2. Fair Value Measurement: FASB Accounting Standards CodificationTM ("ASC") 820, "Fair Value Measurement" ("ASC 820"), defines fair value as the value that the Fund would receive to sell an investment or pay to transfer a liability in a timely transaction with an independent buyer in the principal market, or in the absence of a principal market, the most advantageous market for the investment or liability. ASC 820 establishes a three-tier hierarchy to distinguish between (1) inputs that reflect the assumptions market participants would use in valuing an asset or liability developed based on market data obtained from sources independent of the reporting entity (observable inputs) and (2) inputs that reflect the reporting entity's own assumptions about the assumptions market participants would use in valuing an asset or liability developed based on the best information available in the circumstances (unobservable inputs) and to establish classification of fair value measurements for disclosure purposes. Various inputs are used in determining the value of the Fund's investments. The inputs are summarized in the three broad levels listed below:
• Level 1 – unadjusted quoted prices in active markets for identical investments
• Level 2 – other significant observable inputs (including quoted prices for similar investments, interest rates, prepayment speeds, credit risk, etc.)
• Level 3 – significant unobservable inputs including the Fund's own assumptions in determining the fair value of investments. Factors considered in making this determination may include, but are not limited to, information obtained by contacting the issuer, analysts, or the appropriate stock exchange (for exchange-traded securities), analysis of the issuer's financial statements or other available documents and, if necessary, available information concerning other securities in similar circumstances.
The inputs or methodology used for valuing securities are not necessarily an indication of the risk associated with investing in those securities and the determination of the significance of a particular input to the fair value measurement in its entirety requires judgment and considers factors specific to each security.
20
Morgan Stanley Institutional Fund, Inc.
Annual Report — December 31, 2019
Notes to Financial Statements (cont'd)
The following is a summary of the inputs used to value the Fund's investments as of December 31, 2019:
Investment Type | | Level 1
Unadjusted
quoted
prices
(000) | | Level 2
Other
significant
observable
inputs
(000) | | Level 3
Significant
unobservable
inputs
(000) | | Total
(000) | |
Assets: | |
Common Stocks | |
Beverages | | $ | 200,109 | | | $ | 18,424 | | | $ | — | | | $ | 218,533 | | |
Capital Markets | | | 57,119 | | | | — | | | | — | | | | 57,119 | | |
Health Care
Equipment &
Supplies | | | 306,897 | | | | — | | | | — | | | | 306,897 | | |
Household Products | | | 181,052 | | | | — | | | | — | | | | 181,052 | | |
Information Technology
Services | | | 351,838 | | | | — | | | | — | | | | 351,838 | | |
Life Sciences Tools &
Services | | | 74,871 | | | | — | | | | — | | | | 74,871 | | |
Media | | | 29,967 | | | | — | | | | — | | | | 29,967 | | |
Personal Products | | | 103,408 | | | | — | | | | — | | | | 103,408 | | |
Pharmaceuticals | | | 52,626 | | | | — | | | | — | | | | 52,626 | | |
Professional Services | | | 126,959 | | | | — | | | | — | | | | 126,959 | | |
Software | | | 176,383 | | | | 118,090 | | | | — | | | | 294,473 | | |
Textiles, Apparel &
Luxury Goods | | | 43,935 | | | | — | | | | — | | | | 43,935 | | |
Tobacco | | | 230,973 | | | | — | | | | — | | | | 230,973 | | |
Total Common Stocks | | | 1,936,137 | | | | 136,514 | | | | — | | | | 2,072,651 | | |
Short-Term Investment | |
Investment Company | | | 52,999 | | | | — | | | | — | | | | 52,999 | | |
Total Assets | | $ | 1,989,136 | | | $ | 136,514 | | | $ | — | | | $ | 2,125,650 | | |
Transfers between investment levels may occur as the markets fluctuate and/or the availability of data used in an investment's valuation changes.
3. Foreign Currency Translation and Foreign Investments: The books and records of the Fund are maintained in U.S. dollars. Foreign currency amounts are translated into U.S. dollars as follows:
– investments, other assets and liabilities at the prevailing rate of exchange on the valuation date;
– investment transactions and investment income at the prevailing rates of exchange on the dates of such transactions.
Although the net assets of the Fund are presented at the foreign exchange rates and market values at the close of the period, the Fund does not isolate that portion of the results of operations arising as a result of changes in the foreign exchange rates from the fluctuations arising from changes in the market prices of securities held at period end. Similarly, the Fund does not isolate the effect of changes in foreign exchange rates from the fluctuations arising from changes in the market prices of
securities sold during the period. Accordingly, realized and unrealized foreign currency gains (losses) on investments in securities are included in the reported net realized and unrealized gains (losses) on investment transactions and balances. However, pursuant to U.S. federal income tax regulations, gains and losses from certain foreign currency transactions and the foreign currency portion of gains and losses realized on sales and maturities of foreign denominated debt securities are treated as ordinary income for U.S. federal income tax purposes.
Net realized gains (losses) on foreign currency transactions represent net foreign exchange gains (losses) from foreign currency forward exchange contracts, disposition of foreign currencies, currency gains (losses) realized between the trade and settlement dates on securities transactions, and the difference between the amount of investment income and foreign withholding taxes recorded on the Fund's books and the U.S. dollar equivalent amounts actually received or paid. The change in unrealized currency gains (losses) on foreign currency transactions for the period is reflected in the Statement of Operations.
Foreign security and currency transactions may involve certain considerations and risks not typically associated with those of U.S. dollar denominated transactions as a result of, among other factors, fluctuations of exchange rates in relation to the U.S. dollar, the possibility of lower levels of governmental supervision and regulation of foreign securities markets and the possibility of political or economic instability.
Governmental approval for foreign investments may be required in advance of making an investment under certain circumstances in some countries, and the extent of foreign investments in domestic companies may be subject to limitation in other countries. Foreign ownership limitations also may be imposed by the charters of individual companies to prevent, among other concerns, violations of foreign investment limitations. As a result, an additional class of shares (identified as "Foreign" in the Portfolio of Investments) may be created and offered for investment. The "local" and "foreign shares" market values may differ. In the absence of trading of the foreign shares in such markets, the Fund values the foreign shares at the closing exchange price of the local shares.
21
Morgan Stanley Institutional Fund, Inc.
Annual Report — December 31, 2019
Notes to Financial Statements (cont'd)
4. Indemnifications: The Company enters into contracts that contain a variety of indemnifications. The Company's maximum exposure under these arrangements is unknown. However, the Company has not had prior claims or losses pursuant to these contracts and expects the risk of loss to be remote.
5. Dividends and Distributions to Shareholders: Dividends and distributions to shareholders are recorded on the ex-dividend date. Dividends from net investment income, if any, are declared and paid annually. Net realized capital gains, if any, are distributed at least annually.
6. Security Transactions, Income and Expenses: Security transactions are accounted for on the trade date (date the order to buy or sell is executed). Realized gains and losses on the sale of investment securities are determined on the specific identified cost method. Dividend income and other distributions are recorded on the ex-dividend date (except for certain foreign dividends which may be recorded as soon as the Fund is informed of such dividends) net of applicable withholding taxes. Interest income is recognized on the accrual basis except where collection is in doubt. Discounts are accreted and premiums are amortized over the life of the respective securities. Most expenses of the Company can be directly attributed to a particular Fund. Expenses which cannot be directly attributed are apportioned among the Funds based upon relative net assets or other appropriate methods. Income, expenses (other than class specific expenses — distribution and shareholder services, transfer agency and sub transfer agency fees) and realized and unrealized gains or losses are allocated to each class of shares based upon their relative net assets.
B. Advisory/Sub-Advisory Fees: The Adviser, a wholly-owned subsidiary of Morgan Stanley, provides the Fund with advisory services under the terms of an Investment Advisory Agreement, paid quarterly, at the annual rate based on the daily net assets as follows:
First $500
million | | Next $500
million | | Over $1
billion | |
| | 0.80 | % | | | 0.75 | % | | | 0.70 | % | |
For the year ended December 31, 2019, the advisory fee rate (net of rebate) was equivalent to an annual effective rate of 0.74% of the Fund's average daily net assets.
The Adviser has agreed to reduce its advisory fee and/or reimburse the Fund so that total annual Fund operating expenses,
excluding certain investment related expenses, taxes, interest and other extraordinary expenses (including litigation), will not exceed 1.00% for Class I shares, 1.35% for Class A shares, 1.85% for Class L shares, 2.10% for Class C shares and 0.95% for Class IS shares. The fee waivers and/or expense reimbursements will continue for at least one year from the date of the Fund's prospectus or until such time as the Directors act to discontinue all or a portion of such waivers and/or reimbursements when they deem such action is appropriate. This arrangement had no effect for the year ended December 31, 2019.
The Adviser has entered into a Sub-Advisory Agreement with the Sub-Adviser, a wholly-owned subsidiary of Morgan Stanley. The Sub-Adviser provides the Fund with advisory services subject to the overall supervision of the Adviser and the Fund's Officers and Directors. The Adviser pays the Sub-Adviser on a monthly basis a portion of the net advisory fees the Adviser receives from the Fund.
C. Administration Fees: The Adviser also serves as Administrator to the Company and provides administrative services pursuant to an Administration Agreement for an annual fee, accrued daily and paid monthly, of 0.08% of the Fund's average daily net assets.
Under a Sub-Administration Agreement between the Administrator and State Street Bank and Trust Company ("State Street"), State Street provides certain administrative services to the Company. For such services, the Administrator pays State Street a portion of the fee the Administrator receives from the Fund.
D. Distribution and Shareholder Services Fees: Morgan Stanley Distribution, Inc. ("MSDI" or the "Distributor"), a wholly-owned subsidiary of the Adviser and an indirect subsidiary of Morgan Stanley, serves as the Company's Distributor of Fund shares pursuant to a Distribution Agreement. The Company has adopted a Shareholder Services Plan with respect to Class A shares pursuant to Rule 12b-1 under the Act. Under the Shareholder Services Plan, the Fund pays the Distributor a shareholder services fee, accrued daily and paid monthly, at an annual rate of 0.25% of the Fund's average daily net assets attributable to Class A shares.
The Company has adopted a Distribution and Shareholder Services Plan with respect to Class L shares pursuant to Rule 12b-1 under the Act. Under the Distribution and Shareholder Services Plan, the Fund pays the Distributor a distribution fee, accrued daily and paid monthly, at an annual rate of
22
Morgan Stanley Institutional Fund, Inc.
Annual Report — December 31, 2019
Notes to Financial Statements (cont'd)
0.50% and a shareholder services fee, accrued daily and paid monthly, at an annual rate of 0.25% of the Fund's average daily net assets attributable to Class L shares.
The Company has adopted a Distribution and Shareholder Services Plan with respect to Class C shares pursuant to Rule 12b-1 under the Act. Under the Distribution and Shareholder Services Plan, the Fund pays the Distributor a distribution fee, accrued daily and paid monthly, at an annual rate of 0.75% and a shareholder services fee, accrued daily and paid monthly, at an annual rate of 0.25% of the Fund's average daily net assets attributable to Class C shares.
The distribution and shareholder services fees are used to support the expenses associated with servicing and maintaining accounts. The Distributor may compensate other parties for providing shareholder support services to investors who purchase Class A, Class L and Class C shares.
E. Dividend Disbursing and Transfer Agent: The Company's dividend disbursing and transfer agent is DST Asset Manager Solutions, Inc. ("DST"). Pursuant to a Transfer Agency Agreement, the Company pays DST a fee based on the number of classes, accounts and transactions relating to the Funds of the Company.
F. Custodian Fees: State Street (the "Custodian") also serves as Custodian for the Company in accordance with a Custodian Agreement. The Custodian holds cash, securities and other assets of the Company as required by the Act. Custody fees are payable monthly based on assets held in custody, investment purchases and sales activity and account maintenance fees, plus reimbursement for certain out-of-pocket expenses.
G. Security Transactions and Transactions with Affiliates: For the year ended December 31, 2019, purchases and sales of investment securities for the Fund, other than long-term U.S. Government securities and short-term investments were approximately $712,037,000 and $278,634,000, respectively. There were no purchases and sales of long-term U.S. Government securities for the year ended December 31, 2019.
The Fund invests in the Institutional Class of the Morgan Stanley Institutional Liquidity Funds — Treasury Securities Portfolio (the "Liquidity Funds"), an open-end management investment company managed by the Adviser. Advisory fees paid by the Fund are reduced by an amount equal to its pro-rata share of the advisory and administration fees paid by the
Fund due to its investment in the Liquidity Funds. For the year ended December 31, 2019, advisory fees paid were reduced by approximately $84,000 relating to the Fund's investment in the Liquidity Funds.
A summary of the Fund's transactions in shares of affiliated investments during the year ended December 31, 2019 is as follows:
Affiliated
Investment
Company | | Value
December 31,
2018
(000) | | Purchases
at Cost
(000) | | Proceeds
from Sales
(000) | | Dividend
Income
(000) | |
Liquidity Funds | | $ | 63,220 | | | $ | 635,056 | | | $ | 645,277 | | | $ | 872 | | |
Affiliated
Investment
Company (cont'd) | | Realized
Gain (Loss)
(000) | | Change in
Unrealized
Appreciation
(Depreciation)
(000) | | Value
December 31,
2019
(000) | |
Liquidity Funds | | $ | — | | | $ | — | | | $ | 52,999 | | |
The Fund is permitted to purchase and sell securities ("cross-trade") from and to other Morgan Stanley funds as well as other funds and client accounts for which the Adviser or an affiliate of the Adviser serves as investment adviser, pursuant to procedures approved by the Directors in compliance with Rule 17a-7 under the Act (the "Rule"). Each cross-trade is executed at the current market price in compliance with provisions of the Rule. For the year ended December 31, 2019, the Fund did not engage in any cross-trade transactions.
The Fund has an unfunded Deferred Compensation Plan (the "Compensation Plan"), which allows each independent Director to defer payment of all, or a portion, of the fees he or she receives for serving on the Board of Directors. Each eligible Director generally may elect to have the deferred amounts credited with a return equal to the total return on one or more of the Morgan Stanley funds that are offered as investment options under the Compensation Plan. Appreciation/depreciation and distributions received from these investments are recorded with an offsetting increase/decrease in the deferred compensation obligation and do not affect the NAV of the Fund.
H. Federal Income Taxes: It is the Fund's intention to continue to qualify as a regulated investment company and distribute all of its taxable and tax-exempt income. Accordingly, no provision for federal income taxes is required in the financial statements.
The Fund may be subject to taxes imposed by countries in which it invests. Such taxes are generally based on income and/or capital gains earned or repatriated. Taxes are accrued based on net investment income, net realized gains and net unrealized appreciation as such income and/or gains are earned.
23
Morgan Stanley Institutional Fund, Inc.
Annual Report — December 31, 2019
Notes to Financial Statements (cont'd)
Taxes may also be based on transactions in foreign currency and are accrued based on the value of investments denominated in such currency.
FASB ASC 740-10, "Income Taxes — Overall", sets forth a minimum threshold for financial statement recognition of the benefit of a tax position taken or expected to be taken in a tax return. Management has concluded there are no significant uncertain tax positions that would require recognition in the financial statements. If applicable, the Fund recognizes interest accrued related to unrecognized tax benefits in "Interest Expense" and penalties in "Other Expenses" in the Statement of Operations. The Fund files tax returns with the U.S. Internal Revenue Service, New York and various states. Generally, each of the tax years in the four-year period ended December 31, 2019 remains subject to examination by taxing authorities.
The tax character of distributions paid may differ from the character of distributions shown for GAAP purposes due to short-term capital gains being treated as ordinary income for tax purposes. The tax character of distributions paid during fiscal years 2019 and 2018 was as follows:
2019
Distributions
Paid From: | | 2018
Distributions
Paid From: | |
Ordinary
Income
(000) | | Long-Term
Capital Gain
(000) | | Ordinary
Income
(000) | | Long-Term
Capital Gain
(000) | |
| $ | 22,253 | | | $ | 69,675 | | | $ | 12,935 | | | $ | 55,773 | | |
The amount and character of income and gains to be distributed are determined in accordance with income tax regulations which may differ from GAAP. These book/tax differences are either considered temporary or permanent in nature.
Temporary differences are attributable to differing book and tax treatments for the timing of the recognition of gains (losses) on certain investment transactions and the timing of the deductibility of certain expenses.
Permanent differences, primarily due to equalization debits, resulted in the following reclassifications among the components of net assets at December 31, 2019:
Total
Distributable
Earnings
(000) | | Paid-in
Capital
(000) | |
| $ | (8,583 | ) | | $ | 8,583 | | |
At December 31, 2019, the components of distributable earnings for the Fund on a tax basis were as follows:
Undistributed
Ordinary
Income
(000) | | Undistributed
Long-Term
Capital Gain
(000) | |
| $ | 575 | | | $ | 1,469 | | |
I. Credit Facility: The Company and other Morgan Stanley funds participated in a $150,000,000 committed, unsecured revolving line of credit facility (the "Facility") with State Street. Effective April 22, 2019, the committed line amount increased to $300,000,000. This Facility is to be used for temporary emergency purposes or funding of shareholder redemption requests. The interest rate on borrowings is based on the federal funds rate or 1 month LIBOR rate plus a spread. The Facility also has a commitment fee of 0.25% per annum based on the unused portion of the Facility. During the year ended December 31, 2019, the Fund did not have any borrowings under the Facility.
J. Other: At December 31, 2019, the Fund had record owners of 10% or greater. Investment activities of these shareholders could have a material impact on the Fund. The aggregate percentage of such owners was 31.3%.
24
Morgan Stanley Institutional Fund, Inc.
Annual Report — December 31, 2019
Report of Independent Registered Public Accounting Firm
To the Shareholders and Board of Directors of
Morgan Stanley Institutional Fund, Inc. —
Global Franchise Portfolio
Opinion on the Financial Statements
We have audited the accompanying statement of assets and liabilities of Global Franchise Portfolio (the "Fund") (one of the funds constituting Morgan Stanley Institutional Fund, Inc. (the "Company")), including the portfolio of investments, as of December 31, 2019, and the related statement of operations for the year then ended, the statements of changes in net assets for each of the two years in the period then ended, the financial highlights for each of the five years in the period then ended and the related notes (collectively referred to as the "financial statements"). In our opinion, the financial statements present fairly, in all material respects, the financial position of Global Franchise Portfolio (one of the funds constituting Morgan Stanley Institutional Fund, Inc.) at December 31, 2019, the results of its operations for the year then ended, the changes in its net assets for each of the two years in the period then ended and its financial highlights for each of the five years in the period then ended, in conformity with U.S. generally accepted accounting principles.
Basis for Opinion
These financial statements are the responsibility of the Company's management. Our responsibility is to express an opinion on the Fund's financial statements based on our audits. We are a public accounting firm registered with the Public Company Accounting Oversight Board (United States) ("PCAOB") and are required to be independent with respect to the Company in accordance with the U.S. federal securities law and the applicable rules and regulations of the Securities and Exchange Commission and the PCAOB.
We conducted our audits in accordance with the standards of the PCAOB. Those standards require that we plan and perform the audit to obtain reasonable assurance about whether the financial statements are free of material misstatement, whether due to error or fraud. The Company is not required to have, nor were we engaged to perform, an audit of the Company's internal control over financial reporting. As part of our audits, we are required to obtain an understanding of internal control over financial reporting, but not for the purpose of expressing an opinion on the effectiveness of the Company's internal control over financial reporting. Accordingly, we express no such opinion.
Our audits included performing procedures to assess the risks of material misstatement of the financial statements, whether due to error or fraud, and performing procedures that respond to those risks. Such procedures included examining, on a test basis, evidence regarding the amounts and disclosures in the financial statements. Our procedures included confirmation of securities owned as of December 31, 2019 by correspondence with the custodian. Our audits also included evaluating the accounting principles used and significant estimates made by management, as well as evaluating the overall presentation of the financial statements. We believe that our audits provide a reasonable basis for our opinion.

We have served as the auditor of one or more Morgan Stanley investment companies since 2000.
Boston, Massachusetts
February 27, 2020
25
Morgan Stanley Institutional Fund, Inc.
Annual Report — December 31, 2019
Federal Tax Notice (unaudited)
For federal income tax purposes, the following information is furnished with respect to the distributions paid by the Fund during its taxable year ended December 31, 2019. For corporate shareholders 81.86% of the dividends qualified for the dividends received deduction.
The Fund designated and paid approximately $78,260,000 as a long-term capital gain distribution.
For federal income tax purposes, the following information is furnished with respect to the Fund's earnings for its taxable year ended December 31, 2019. When distributed, certain earnings may be subject to a maximum tax rate of 15% as provided for by the Jobs and Growth Tax Relief Reconciliation Act of 2003. The Fund designated up to a maximum of approximately $22,253,000 as taxable at this lower rate.
In January, the Fund provides tax information to shareholders for the preceding calendar year.
26
Privacy Notice (unaudited) April 2019
FACTS | | WHAT DOES MSIM DO WITH YOUR PERSONAL INFORMATION? | |
Why? | | Financial companies choose how they share your personal information. Federal law gives consumers the right to limit some but not all sharing. Federal law also requires us to tell you how we collect, share, and protect your personal information. Please read this notice carefully to understand what we do. | |
What? | | The types of personal information we collect and share depend on the product or service you have with us. This information can include:
n Social Security number and income
n investment experience and risk tolerance
n checking account number and wire transfer instructions | |
How? | | All financial companies need to share customers' personal information to run their everyday business. In the section below, we list the reasons financial companies can share their customers' personal information; the reasons MSIM chooses to share; and whether you can limit this sharing. | |
Reasons we can share your personal information | | Does MSIM share? | | Can you limit this sharing? | |
For our everyday business purposes —
such as to process your transactions, maintain your account(s), respond to court orders and legal investigations, or report to credit bureaus | | Yes | | No | |
For our marketing purposes —
to offer our products and services to you | | Yes | | No | |
For joint marketing with other financial companies | | No | | We don't share | |
For our affiliates' everyday business purposes —
information about your transactions and experiences | | Yes | | No | |
For our affiliates' everyday business purposes —
information about your creditworthiness | | No | | We don't share | |
For our affiliates to market to you | | No | | We don't share | |
For non-affiliates to market to you | | No | | We don't share | |
Questions? Call toll-free (844) 312-6327 or email: imprivacyinquiries@morganstanley.com
27
Privacy Notice (unaudited) (cont'd) April 2019
Who we are
Who is providing this notice? | | Morgan Stanley Investment Management, Inc. and its affiliated registered investment advisers, registered broker-dealers, and registered and unregistered funds ("MSIM") | |
What we do
How does MSIM protect my personal information? | | To protect your personal information from unauthorized access and use, we use security measures that comply with federal law. These measures include computer safeguards and secured files and buildings. We have policies governing the proper handling of customer information by personnel and requiring third parties that provide support to adhere to appropriate security standards with respect to such information. | |
How does MSIM collect my personal information? | | We collect your personal information, for example, when you
n open an account or make deposits or withdrawals from your account
n buy securities from us or make a wire transfer
n give us your contact information
We also collect your personal information from others, such as credit bureaus, affiliates, or other companies. | |
Why can't I limit all sharing? | | Federal law gives you the right to limit only
n sharing for affiliates' everyday business purposes — information about your creditworthiness
n affiliates from using your information to market to you
n sharing for non-affiliates to market to you
State laws and individual companies may give you additional rights to limit sharing. See below for more on your rights under state law. | |
Definitions
Affiliates | | Companies related by common ownership or control. They can be financial and non-financial companies.
n Our affiliates include companies with a Morgan Stanley name and financial companies such as Morgan Stanley Smith Barney LLC and Morgan Stanley & Co. | |
Non-affiliates | | Companies not related by common ownership or control. They can be financial and non-financial companies.
n MSIM does not share with non-affiliates so they can market to you. | |
Joint marketing | | A formal agreement between non-affiliated financial companies that together market financial products or services to you.
n MSIM doesn't jointly market | |
Other Important Information
Vermont: Except as permitted by law, we will not share personal information we collect about Vermont residents with Non-affiliates unless you provide us with your written consent to share such information.
California: Except as permitted by law, we will not share personal information we collect about California residents with Non-affiliates and we will limit sharing such personal information with our Affiliates to comply with California privacy laws that apply to us.
28
Morgan Stanley Institutional Fund, Inc.
Annual Report — December 31, 2019
Director and Officer Information (unaudited)
Independent Directors:
Name, Birth Year
and Address of
Independent Director | | Position(s)
Held with
Registrant | | Length of
Time Served* | | Principal Occupation(s) During Past 5 Years
and Other Relevant Professional Experience | | Number of
Funds in
Fund Complex
Overseen by
Independent
Director** | | Other Directorships
Held by Independent
Director*** | |
Frank L. Bowman
c/o Perkins Coie LLP
Counsel to the Independent Directors
1155 Avenue of the Americas
New York, NY 10036
Birth Year 1944 | | Director | | Since
August
2006 | | President, Strategic Decisions, LLC (consulting) (since February 2009); Director or Trustee of various Morgan Stanley Funds (since August 2006); Chairperson of the Compliance and Insurance Committee (since October 2015); formerly, Chairperson of the Insurance Sub-Committee of the Compliance and Insurance Committee (2007-2015); served as President and Chief Executive Officer of the Nuclear Energy Institute (policy organization) (February 2005-November 2008); retired as Admiral, U.S. Navy after serving over 38 years on active duty including 8 years as Director of the Naval Nuclear Propulsion Program in the Department of the Navy and the U.S. Department of Energy (1996-2004); served as Chief of Naval Personnel (July 1994-September 1996) and on the Joint Staff as Director of Political Military Affairs (June 1992-July 1994); knighted as Honorary Knight Commander of the Most Excellent Order of the British Empire; awarded the Officier de l'Orde National du Mérite by the French Government; elected to the National Academy of Engineering (2009). | | | 86 | | | Director of Naval and Nuclear Technologies LLP; Director Emeritus of the Armed Services YMCA; Member of the National Security Advisory Council of the Center for U.S. Global Engagement and a member of the CNA Military Advisory Board; Trustee of Fairhaven United Methodist Church; Member of the Board of Advisors of the Dolphin Scholarship Foundation; Director of other various non-profit organizations; formerly, Director of BP p.l.c. (November 2010-May 2019). | |
Kathleen A. Dennis
c/o Perkins Coie LLP
Counsel to the Independent Directors
1155 Avenue of the Americas
New York, NY 10036
Birth Year 1953 | | Director | | Since
August
2006 | | President, Cedarwood Associates (mutual fund and investment management consulting) (since July 2006); Chairperson of the Liquidity and Alternatives Sub-Committee of the Investment Committee (since October 2006) and Director or Trustee of various Morgan Stanley Funds (since August 2006); formerly, Senior Managing Director of Victory Capital Management (1993-2006). | | | 86 | | | Director of various non-profit organizations. | |
Nancy C. Everett
c/o Perkins Coie LLP
Counsel to the Independent Directors
1155 Avenue of the Americas
New York, NY 10036
Birth Year 1955 | | Director | | Since
January
2015 | | Chief Executive Officer, Virginia Commonwealth University Investment Company (since November 2015); Owner, OBIR, LLC (institutional investment management consulting) (since June 2014); formerly, Managing Director, BlackRock, Inc. (February 2011-December 2013); and Chief Executive Officer, General Motors Asset Management (a/k/a Promark Global Advisors, Inc.) (June 2005-May 2010). | | | 87 | | | Formerly, Member of Virginia Commonwealth University School of Business Foundation (2005-2016); Member of Virginia Commonwealth University Board of Visitors (2013-2015); Member of Committee on Directors for Emerging Markets Growth Fund, Inc. (2007-2010); Chairperson of Performance Equity Management, LLC (2006-2010); and Chairperson, GMAM Absolute Return Strategies Fund, LLC (2006-2010). | |
29
Morgan Stanley Institutional Fund, Inc.
Annual Report — December 31, 2019
Director and Officer Information (unaudited) (cont'd)
Independent Directors: (cont'd)
Name, Birth Year
and Address of
Independent Director | | Position(s)
Held with
Registrant | | Length of
Time Served* | | Principal Occupation(s) During Past 5 Years
and Other Relevant Professional Experience | | Number of
Funds in
Fund Complex
Overseen by
Independent
Director** | | Other Directorships
Held by Independent
Director*** | |
Jakki L. Haussler
c/o Perkins Coie LLP
Counsel to the Independent Directors
1155 Avenue of the Americas
New York, NY 10036
Birth Year 1957 | | Director | | Since
January
2015 | | Chairman, Opus Capital Group (since 1996); formerly, Chief Executive Officer, Opus Capital Group (1996-2019); Director, Capvest Venture Fund, LP (May 2000-December 2011); Partner, Adena Ventures, LP (July 1999-December 2010); Director, The Victory Funds (February 2005-July 2008). | | | 87 | | | Director of Service Corporation International and Member, Audit Committee and Investment Committee; Director of Cincinnati Bell Inc. and Member, Audit Committee and Governance and Nominating Committee; Chairman of Northern Kentucky University Member Investment Committee; Member of Chase College of Law Transactional Law Practice Center Board of Advisors; Director of Best Transport; Director of Chase College of Law Board of Visitors; formerly, Member, University of Cincinnati Foundation Investment Committee; Member, Miami University Board of Visitors (2008-2011); Trustee of Victory Funds (2005-2008) and Chairman, Investment Committee (2007-2008) and Member, Service Provider Committee (2005-2008). | |
Dr. Manuel H. Johnson
c/o Johnson Smick International, Inc.
220 I Street, NE — Suite 200
Washington, D.C. 20002
Birth Year 1949 | | Director | | Since
July
1991 | | Senior Partner, Johnson Smick International, Inc. (consulting firm); Chairperson of the Investment Committee (since October 2006) and Director or Trustee of various Morgan Stanley Funds (since July 1991); Co-Chairman and a founder of the Group of Seven Council (G7C) (international economic commission); formerly, Chairperson of the Audit Committee (July 1991-September 2006), Vice Chairman of the Board of Governors of the Federal Reserve System and Assistant Secretary of the U.S. Treasury. | | | 86 | | | Director of NVR, Inc. (home construction). | |
Joseph J. Kearns
c/o Perkins Coie LLP
Counsel to the Independent Directors
1155 Avenue of the Americas
New York, NY 10036
Birth Year 1942 | | Director | | Since
August
1994 | | Senior Adviser, Kearns & Associates LLC (investment consulting); Chairperson of the Audit Committee (since October 2006) and Director or Trustee of various Morgan Stanley Funds (since August 1994); formerly, Deputy Chairperson of the Audit Committee (July 2003-September 2006) and Chairperson of the Audit Committee of various Morgan Stanley Funds (since August 1994); CFO of the J. Paul Getty Trust. | | | 87 | | | Prior to August 10, 2016, Director of Electro Rent Corporation (equipment leasing); Prior to December 31, 2013, Director of The Ford Family Foundation. | |
30
Morgan Stanley Institutional Fund, Inc.
Annual Report — December 31, 2019
Director and Officer Information (unaudited) (cont'd)
Independent Directors: (cont'd)
Name, Birth Year
and Address of
Independent Director | | Position(s)
Held with
Registrant | | Length of
Time Served* | | Principal Occupation(s) During Past 5 Years
and Other Relevant Professional Experience | | Number of
Funds in
Fund Complex
Overseen by
Independent
Director** | | Other Directorships
Held by Independent
Director*** | |
Michael F. Klein
c/o Perkins Coie LLP
Counsel to the Independent Directors
1155 Avenue of the Americas
New York, NY 10036
Birth Year 1958 | | Director | | Since
August
2006 | | Managing Director, Aetos Alternatives Management, LP (since March 2000); Co-President, Aetos Alternatives Management, LP (since January 2004) and Co-Chief Executive Officer of Aetos Alternatives Management, LP (since August 2013); Chairperson of the Fixed Income Sub-Committee of the Investment Committee (since October 2006) and Director or Trustee of various Morgan Stanley Funds (since August 2006); formerly, Managing Director, Morgan Stanley & Co. Inc. and Morgan Stanley Dean Witter Investment Management and President, various Morgan Stanley Funds (June 1998-March 2000); Principal, Morgan Stanley & Co. Inc. and Morgan Stanley Dean Witter Investment Management (August 1997-December 1999). | | | 86 | | | Director of certain investment funds managed or sponsored by Aetos Alternatives Management, LP; Director of Sanitized AG and Sanitized Marketing AG (specialty chemicals). | |
Patricia Maleski
c/o Perkins Coie LLP
Counsel to the Independent Directors
1155 Avenue of the Americas
New York, NY 10036
Birth Year 1960 | | Director | | Since
January
2017 | | Managing Director, JPMorgan Asset Management (2004-2016); Oversight and Control Head of Fiduciary and Conflicts of Interest Program (2015-2016); Chief Control Officer-Global Asset Management (2013-2015); President, JPMorgan Funds (2010-2013); Chief Administrative Officer (2004-2013); various other positions including Treasurer and Board Liaison (since 2001). | | | 87 | | | None. | |
Michael E. Nugent
522 Fifth Avenue
New York, NY 10036
Birth Year 1936 | | Chair of the Board and Director | | Chair of the Boards since July 2006 and Director since July 1991 | | Chair of the Boards of various Morgan Stanley Funds (since July 2006); Chairperson of the Governance Committee (since January 2019) and Director or Trustee of various Morgan Stanley Funds (since July 1991); formerly, Chairperson of each of the Closed-End Fund committee (until December 2019) and the Insurance Committee (until July 2006); General Partner, Triumph Capital, L.P. (private investment partnership) (1988-2013). | | | 86 | | | None. | |
W. Allen Reed
c/o Perkins Coie LLP
Counsel to the Independent Directors
1155 Avenue of the Americas
New York, NY 10036
Birth Year 1947 | | Vice Chair of the Board and Director | | Vice Chair of the Boards since
January 2020 and Director since August 2006 | | Chairperson of the Equity Sub-Committee of the Investment Committee (since October 2006) and Director or Trustee of various Morgan Stanley Funds (since August 2006); formerly, President and CEO of General Motors Asset Management; Chairman and Chief Executive Officer of the GM Trust Bank and Corporate Vice President of General Motors Corporation (August 1994-December 2005). | | | 86 | | | Formerly, Director of Legg Mason, Inc.; formerly, Director of the Auburn University Foundation (2010-2015). | |
* This is the earliest date the Director began serving the Morgan Stanley Funds. Each Director serves an indefinite term, until his or her successor is elected.
** The Fund Complex includes (as of December 31, 2019) all open-end and closed-end funds (including all of their portfolios) advised by Morgan Stanley Investment Management Inc. (the "Adviser") and any funds that have an adviser that is an affiliated person of the Adviser (including, but not limited to, Morgan Stanley AIP GP LP).
*** This includes any directorships at public companies and registered investment companies held by the Director at any time during the past five years.
31
Morgan Stanley Institutional Fund, Inc.
Annual Report — December 31, 2019
Director and Officer Information (unaudited) (cont'd)
Executive Officers:
Name, Birth Year and Address of
Executive Officer | | Position(s) Held
with
Registrant | | Length of
Time Served* | | Principal Occupation(s) During Past 5 Years | |
John H. Gernon
522 Fifth Avenue
New York, NY 10036
Birth Year 1963 | | President and Principal Executive Officer | | Since September 2013 | | President and Principal Executive Officer of the Equity and Fixed Income Funds and the Morgan Stanley AIP Funds (since September 2013) and the Liquidity Funds and various money market funds (since May 2014) in the Fund Complex; Managing Director of the Adviser; Head of Product (since 2006). | |
Timothy J. Knierim
522 Fifth Avenue
New York, NY 10036
Birth Year 1959 | | Chief Compliance Officer | | Since December 2016 | | Managing Director of the Adviser and various entities affiliated with the Adviser; Chief Compliance Officer of various Morgan Stanley Funds and the Adviser (since December 2016) and Chief Compliance Officer of Morgan Stanley AIP GP LP (since 2014). Formerly, Managing Director and Deputy Chief Compliance Officer of the Adviser (2014-2016); and formerly, Chief Compliance Officer of Prudential Investment Management, Inc. (2007-2014). | |
Francis J. Smith
522 Fifth Avenue
New York, NY 10036
Birth Year 1965 | | Treasurer and Principal Financial Officer | | Treasurer since July 2003 and Principal Financial Officer since September 2002 | | Managing Director of the Adviser and various entities affiliated with the Adviser; Treasurer (since July 2003) and Principal Financial Officer of various Morgan Stanley Funds (since September 2002). | |
Mary E. Mullin
522 Fifth Avenue
New York, NY 10036
Birth Year 1967 | | Secretary | | Since June 1999 | | Managing Director of the Adviser; Secretary of various Morgan Stanley Funds (since June 1999). | |
Michael J. Key
522 Fifth Avenue
New York, NY 10036
Birth Year 1979 | | Vice President | | Since June 2017 | | Vice President of the Equity and Fixed Income Funds, Liquidity Funds, various money market funds and the Morgan Stanley AIP Funds in the Fund Complex (since June 2017); Executive Director of the Adviser; Head of Product Development for Equity and Fixed Income Funds (since August 2013). | |
* This is the earliest date the officer began serving the Morgan Stanley Funds. Each officer serves a one-year term, until his or her successor is elected and qualifies.
32
Morgan Stanley Institutional Fund, Inc.
Annual Report — December 31, 2019
Director and Officer Information (unaudited)
Adviser and Administrator
Morgan Stanley Investment Management Inc.
522 Fifth Avenue
New York, New York 10036
Sub-Adviser
Morgan Stanley Investment Management Limited
25 Cabot Square, Canary Wharf
London, E14 4QA, England
Distributor
Morgan Stanley Distribution, Inc.
522 Fifth Avenue
New York, New York 10036
Dividend Disbursing and Transfer Agent
DST Asset Manager Solutions, Inc.
2000 Crown Colony Drive
Quincy, Massachusetts 02169
Custodian
State Street Bank and Trust Company
One Lincoln Street
Boston, Massachusetts 02111
Legal Counsel
Dechert LLP
1095 Avenue of the Americas
New York, New York 10036
Counsel to the Independent Directors
Perkins Coie LLP
1155 Avenue of the Americas
New York, New York 10036
Independent Registered Public Accounting Firm
Ernst & Young LLP
200 Clarendon Street
Boston, Massachusetts 02116
Reporting to Shareholders
Each Morgan Stanley fund provides a complete schedule of portfolio holdings in its Semi-Annual and the Annual Reports within 60 days of the end of the fund's second and fourth fiscal quarters. The Semi-Annual and Annual Reports are filed electronically with the Securities and Exchange Commission ("SEC") on Form N-CSRS and Form N-CSR, respectively. Morgan Stanley also delivers the Semi-Annual and Annual Reports to fund shareholders and makes these reports available on its public website, www.morganstanley.com/im/shareholderreports. Each Morgan Stanley non-money market fund also files a complete schedule of portfolio holdings with the SEC for the fund's first and third fiscal quarters as an attachment to Form N-PORT. Morgan Stanley does not deliver the reports for the first and third fiscal quarters to shareholders, nor are the reports posted to the Morgan Stanley public website. However, the holdings for each money market fund are posted to the Morgan Stanley public website. You may obtain the Form N-PORT filings (as well as the Form N-CSR and N-CSRS filings) by accessing the SEC's website, www.sec.gov. You can also request copies of these materials, upon payment of a duplicating fee, by electronic request at the SEC's email address (publicinfo@sec.gov).
Proxy Voting Policies and Procedures and Proxy Voting Record
You may obtain a copy of the Company's Proxy Voting Policy and Procedures and information regarding how the Company voted proxies relating to portfolio securities during the most recent twelve-month period ended June 30, without charge, upon request, by calling toll free 1 (800) 548-7786 or by visiting our website at www.morganstanley.com/im/shareholderreports. This information is also available on the SEC's website at www.sec.gov.
This report is authorized for distribution only when preceded or accompanied by a prospectus or summary prospectus of the applicable fund of Morgan Stanley Institutional Fund, Inc., which describes in detail the fund's investment policies, risks, fees and expenses. Please read the prospectus carefully before you invest or send money. For additional information, including information regarding the investments comprising the Fund, please visit our website at www.morganstanley.com/im/shareholderreports or call toll free 1 (800) 548-7786.
33
Printed in U.S.A.
This Report has been prepared for shareholders and may be distributed to others only if preceded or accompanied by a current prospectus.
Morgan Stanley Investment Management Inc.
522 Fifth Avenue
New York, New York 10036
© 2020 Morgan Stanley. Morgan Stanley Distribution, Inc.

IFIGFANN
2909106 EXP. 02.28.21

Morgan Stanley Institutional Fund, Inc.
Global Opportunity Portfolio
Annual Report
December 31, 2019
Beginning on January 1, 2021, as permitted by regulations adopted by the Securities and Exchange Commission ("SEC"), paper copies of the Fund's Annual and Semi-Annual Reports to Shareholders ("Shareholder Reports") will no longer be sent by mail, unless you specifically request paper copies of the Shareholder Reports from the Fund or from your financial intermediary, such as a broker-dealer or a bank. Instead, the Shareholder Reports will be made available on the Fund's website, https://www.morganstanley.com/im/shareholderreports and you will be notified by mail each time a Shareholder Report is posted and provided with a website link to access the Shareholder Report. If you already elected to receive Shareholder Reports electronically, you will not be affected by this change and you need not take any action. You may elect to receive Shareholder Reports and other communications from the Fund electronically anytime by contacting your financial intermediary or, if you are a direct investor, please follow the instructions on the envelope.
Beginning on January 1, 2019, you may elect to receive all future Shareholder Reports in paper free of charge. If you invest through a financial intermediary, you can contact your financial intermediary to request that you continue to receive paper copies of your Shareholder Reports. If you invest directly with the Fund, please follow the instructions on the envelope to let the Fund know you wish to continue receiving paper copies of your Shareholder Reports. Your election to receive Shareholder Reports in paper will apply to all funds held in your account if you invest through your financial intermediary or all funds held with the fund complex if you invest directly with a fund.

Morgan Stanley Institutional Fund, Inc.
Annual Report — December 31, 2019
Shareholders' Letter | | | 2 | | |
Expense Example | | | 3 | | |
Investment Overview | | | 4 | | |
Portfolio of Investments | | | 7 | | |
Statement of Assets and Liabilities | | | 9 | | |
Statement of Operations | | | 11 | | |
Statements of Changes in Net Assets | | | 12 | | |
Financial Highlights | | | 14 | | |
Notes to Financial Statements | | | 20 | | |
Report of Independent Registered Public Accounting Firm | | | 30 | | |
Privacy Notice | | | 31 | | |
Director and Officer Information | | | 33 | | |
This report is authorized for distribution only when preceded or accompanied by a prospectus or summary prospectus of the applicable Fund of Morgan Stanley Institutional Fund, Inc. To receive a prospectus and/or statement of additional information ("SAI"), which contains more complete information such as investment objectives, charges, expenses, policies for voting proxies, risk considerations and describes in detail each of the Fund's investment policies to the prospective investor, please call toll free 1 (800) 548-7786. Please read the prospectuses carefully before you invest or send money.
Additionally, you can access information about the Fund, including performance, characteristics and investment team commentary, through Morgan Stanley Investment Management's website: www.morganstanley.com/im/shareholderreports.
Market forecasts provided in this report may not necessarily come to pass. There is no guarantee that any sectors mentioned will continue to perform as discussed herein or that securities in such sectors will be held by the Fund in the future. There is no assurance that a fund will achieve its investment objective. Funds are subject to market risk, which is the possibility that market values of securities owned by the Fund will decline and, therefore, the value of the Fund's shares may be less than what you paid for them. Accordingly, you can lose money investing in this Fund. Please see the prospectus for more complete information on investment risks.
1
Morgan Stanley Institutional Fund, Inc.
Annual Report — December 31, 2019
Shareholders' Letter (unaudited)
Dear Shareholders,
We are pleased to provide this Annual Report, in which you will learn how your investment in Global Opportunity Portfolio (the "Fund") performed during the latest twelve-month period.
Morgan Stanley Investment Management is a client-centric, investor-led organization. Our global presence, intellectual capital, and breadth of products and services enable us to partner with investors to meet the evolving challenges of today's financial markets. We aim to deliver superior investment service and to empower our clients to make the informed decisions that help them reach their investment goals.
As always, we thank you for selecting Morgan Stanley Investment Management, and look forward to working with you in the months and years ahead.
Sincerely,

John H. Gernon
President and Principal Executive Officer
January 2020
2
Morgan Stanley Institutional Fund, Inc.
Annual Report — December 31, 2019
Expense Example (unaudited)
Global Opportunity Portfolio
As a shareholder of the Fund, you incur two types of costs: (1) transactional costs; and (2) ongoing costs, which may include advisory fees, administration fees, distribution and shareholder services fees and other Fund expenses. This example is intended to help you understand your ongoing costs (in dollars) of investing in the Fund and to compare these costs with the ongoing costs of investing in other mutual funds.
This example is based on an investment of $1,000 invested at the beginning of the six-month period ended December 31, 2019 and held for the entire six-month period.
Actual Expenses
The table below provides information about actual account values and actual expenses. You may use the information in this table, together with the amount you invested, to estimate the expenses that you paid over the period. Simply divide your account value by $1,000 (for example, an $8,600 account value divided by $1,000 = 8.6), then multiply the result by the number in the table under the heading entitled "Actual Expenses Paid During Period" to estimate the expenses you paid on your account during this period.
Hypothetical Example for Comparison Purposes
The table below provides information about hypothetical account values and hypothetical expenses based on the Fund's actual expense ratio and an assumed rate of return of 5% per year before expenses, which is not the Fund's actual return. The hypothetical account values and expenses may not be used to estimate the actual ending account balance or expenses you paid for the period. You may use this information to compare the ongoing costs of investing in the Fund and other funds. To do so, compare this 5% hypothetical example with the 5% hypothetical examples that appear in the shareholder reports of the other funds.
Please note that the expenses shown in the table are meant to highlight your ongoing costs only and do not reflect any transactional costs, such as sales charges (loads). Therefore, the information for each class in the table is useful in comparing ongoing costs only, and will not help you determine the relative total costs of owning different funds. In addition, if these transactional costs were included, your costs would have been higher.
| | | Beginning
Account
Value
7/1/19 | | Actual Ending
Account
Value
12/31/19 | | Hypothetical
Ending Account
Value | | Actual
Expenses
Paid
During
Period* | | Hypothetical
Expenses Paid
During Period* | | Net
Expense
Ratio
During
Period** | |
Global Opportunity Portfolio Class I | | $ | 1,000.00 | | | $ | 1,075.30 | | | $ | 1,020.37 | | | $ | 5.02 | | | $ | 4.89 | | | | 0.96 | % | |
Global Opportunity Portfolio Class A | | | 1,000.00 | | | | 1,074.20 | | | | 1,019.06 | | | | 6.38 | | | | 6.21 | | | | 1.22 | | |
Global Opportunity Portfolio Class L | | | 1,000.00 | | | | 1,073.60 | | | | 1,018.80 | | | | 6.64 | | | | 6.46 | | | | 1.27 | | |
Global Opportunity Portfolio Class C | | | 1,000.00 | | | | 1,069.60 | | | | 1,015.32 | | | | 10.22 | | | | 9.96 | | | | 1.96 | | |
Global Opportunity Portfolio Class IS | | | 1,000.00 | | | | 1,076.00 | | | | 1,020.97 | | | | 4.40 | | | | 4.28 | | | | 0.84 | | |
Global Opportunity Portfolio Class IR | | | 1,000.00 | | | | 1,075.80 | | | | 1,020.97 | | | | 4.40 | | | | 4.28 | | | | 0.84 | | |
* Expenses are calculated using each Fund Class' annualized net expense ratio (as disclosed), multiplied by the average account value over the period and multiplied by 184/365 (to reflect the most recent one-half year period).
** Annualized.
3
Morgan Stanley Institutional Fund, Inc.
Annual Report — December 31, 2019
Investment Overview (unaudited)
Global Opportunity Portfolio
The Fund seeks long-term capital appreciation.
Performance
For the year ended December 31, 2019, the Fund's Class I shares had a total return based on net asset value and reinvestment of distributions per share of 35.44%, net of fees. The Fund's Class I shares outperformed the Fund's benchmark, the MSCI All Country World Net Index (the "Index"), which returned 26.60%.
Please keep in mind that double-digit returns are highly unusual and cannot be sustained. Investors should also be aware that these returns were primarily achieved during favorable market conditions.
Factors Affecting Performance
• Easing geopolitical tensions, reduced recession fears and central bank support drove global equities sharply higher over 2019. Although the U.S.-China trade relations dampened global manufacturing and export activity, many economies remained supported by relatively stronger consumer sectors that had remained mostly unaffected by the manufacturing slowdown. To further extend the economic cycle, global central banks resumed cutting policy interest rates and enacting other stimulus measures. Volatility increased in 2019, but stock prices continued to rally higher, notably at year end when the U.S. and China announced a partial trade deal, Brexit uncertainty eased with the Conservative Party winning a large majority in the U.K. general election, and some economic indicators appeared to be stabilizing.
• Global equity markets advanced by 26.60% for the 12-month period ended December 31, 2019, as measured by the Index. Our team remained focused on assessing company prospects over a longer-term period of three to five years, and owning a portfolio of high quality companies with diverse business drivers not tied to a particular market environment.
• The team manages concentrated portfolios that are highly differentiated from the benchmark, with securities weighted on our assessment of the quality of the company and our conviction. Our longer-term focus results in lower turnover than many of our peers. The value added or detracted in any period of time will typically result from stock selection, given our philosophy and process. For the
twelve-month period, the Fund outperformed the Index due to favorable stock selection and sector allocation.
• The primary contributors to the Fund's relative performance were our stock selection and sector overweight in information technology, along with our stock selection in the materials sector.
• The main detractors from relative performance were our stock selection in the consumer discretionary sector and underweight allocations in the real estate and industrials sectors.
Management Strategies
• There were no changes to our bottom-up investment process during the period. The Fund seeks long-term capital appreciation by investing globally in high quality established and emerging companies that the investment team believes are undervalued at the time of purchase. To achieve its objective, we seek companies with sustainable competitive advantages and long-term growth that creates value, rather than focusing on short-term events, with stock selection informed by rigorous fundamental analysis.
• At the close of the period, information technology represented the largest sector weight in the Fund, followed by consumer discretionary and communication services. Our bottom-up investment process resulted in sector overweight positions in consumer discretionary, information technology and communication services, and underweight positions in financials, health care, energy, industrials, real estate, utilities, materials and consumer staples. The Fund had no energy, real estate and utilities holdings at the end of the reporting period.
4
Morgan Stanley Institutional Fund, Inc.
Annual Report — December 31, 2019
Investment Overview (unaudited) (cont'd)
Global Opportunity Portfolio
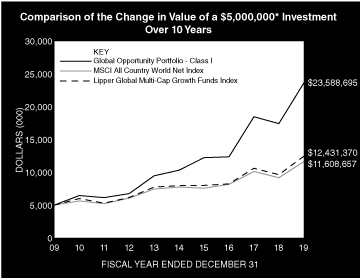
* Minimum Investment for Class I shares
In accordance with SEC regulations, the Fund's performance shown assumes that all recurring fees (including management fees) were deducted and all dividends and distributions were reinvested. The performance of Class A, L, C, IS and IR shares will vary from the performance of Class I shares based upon their different inception dates and will be negatively impacted by additional fees assessed to those classes (if applicable).
Performance Compared to the MSCI All Country World Net Index(1) and the Lipper Global Multi-Cap Growth Funds Index(2)
| | | Period Ended December 31, 2019
Total Returns(3) | |
| | | | | Average Annual | |
| | | One
Year | | Five
Years | | Ten
Years | | Since
Inception(8) | |
Fund — Class I Shares
w/o sales charges(4) | | | 35.44 | % | | | 17.99 | % | | | 16.78 | % | | | 13.29 | % | |
Fund — Class A Shares
w/o sales charges(4) | | | 35.03 | | | | 17.61 | | | | — | | | | 17.62 | | |
Fund — Class A Shares with
maximum 5.25% sales charges(4) | | | 27.96 | | | | 16.35 | | | | — | | | | 16.96 | | |
Fund — Class L Shares
w/o sales charges(4) | | | 34.96 | | | | 17.52 | | | | 16.33 | | | | 12.88 | | |
Fund — Class C Shares
w/o sales charges(6) | | | 34.03 | | | | — | | | | — | | | | 15.30 | | |
Fund — Class C Shares with
maximum 1.00% deferred
sales charges(6) | | | 33.03 | | | | — | | | | — | | | | 15.30 | | |
Fund — Class IS Shares
w/o sales charges(5) | | | 35.53 | | | | 18.03 | | | | — | | | | 18.76 | | |
Fund — Class IR Shares
w/o sales charges(7) | | | 35.53 | | | | — | | | | — | | | | 6.54 | | |
MSCI All Country World Net Index | | | 26.60 | | | | 8.41 | | | | 8.79 | | | | 5.49 | | |
Lipper Global Multi-Cap
Growth Funds Index | | | 29.00 | | | | 9.32 | | | | 9.54 | | | | 6.34 | | |
Performance data quoted represents past performance, which is no guarantee of future results, and current performance may be lower or higher than the figures shown. Performance assumes that all dividends and distributions, if any, were reinvested. For the most recent month-end performance figures, please visit www.morganstanley.com/im/shareholderreports. Investment return and principal value will fluctuate so that Fund shares, when redeemed, may be worth more or less than their original cost. Total returns do not reflect the deduction of taxes that a shareholder would pay on Fund distributions or the redemption of Fund shares. Performance of share classes will vary due to difference in sales charges and expenses.
(1) The MSCI All Country World Net Index is a free float-adjusted market capitalization weighted index designed to measure the equity market performance of developed and emerging markets. The term "free float" represents the portion of shares outstanding that are deemed to be available for purchase in the public equity markets by investors. The performance of the Index is listed in U.S. dollars and assumes reinvestment of net dividends. Net total return indices reinvest dividends after the deduction of withholding taxes, using (for international indices) a tax rate applicable to non-resident institutional investors who do not benefit from double taxation treaties. The Index is unmanaged and its returns do not include any sales charges or fees. Such costs would lower performance. It is not possible to invest directly in an index.
(2) The Lipper Global Multi-Cap Growth Funds Index is an equally weighted performance index of the largest qualifying funds (based on net assets) in the Lipper Global Multi-Cap Growth Funds classification. The Index, which is adjusted for capital gains distributions and income dividends, is unmanaged and should not be considered an investment. There are currently 30 funds represented in this Index. As of the date of this report, the Fund was in the Lipper Global Multi-Cap Growth Funds classification.
5
Morgan Stanley Institutional Fund, Inc.
Annual Report — December 31, 2019
Investment Overview (unaudited) (cont'd)
Global Opportunity Portfolio
(3) Total returns for the Fund reflect fees waived and expenses reimbursed, if applicable, by the Adviser (as defined herein). Without such waivers and reimbursements, total returns would have been lower.
(4) On May 21, 2010, Class C and Class I shares of Van Kampen Global Growth Fund ("the Predecessor Fund") were reorganized into Class L and Class I shares of Morgan Stanley Global Growth Portfolio (the "Fund"), respectively. Class L and Class I shares' returns of the Fund will differ from the Predecessor Fund as they have different expenses. Performance shown for the Fund's Class I and Class L shares reflects the performance of the shares of the Predecessor Fund for periods prior to May 21, 2010. The Class C and I shares of the Predecessor Fund commenced operations on May 30, 2008. Class P shares, which were renamed Class A shares effective September 9, 2013, commenced operations on May 21, 2010. In October 2010, the Morgan Stanley Global Growth Portfolio changed its name to the Morgan Stanley Global Opportunity Portfolio.
(5) Commenced offering on September 13, 2013.
(6) Commenced offering on April 30, 2015.
(7) Commenced offering on June 15, 2018.
(8) For comparative purposes, average annual since inception returns listed for the Indexes refer to the inception date of Class I of the Fund, not the inception of the Index.
6
Morgan Stanley Institutional Fund, Inc.
Annual Report — December 31, 2019
Portfolio of Investments
Global Opportunity Portfolio
| | | Shares | | Value
(000) | |
Common Stocks (92.2%) | |
Argentina (1.0%) | |
Globant SA (a) | | | 366,226 | | | $ | 38,838 | | |
China (13.6%) | |
China Resources Beer Holdings Co., Ltd. (b) | | | 7,347,333 | | | | 40,639 | | |
Foshan Haitian Flavouring & Food Co., Ltd.,
Class A | | | 3,721,776 | | | | 57,443 | | |
Haidilao International Holding Ltd. (b)(c) | | | 6,481,000 | | | | 26,033 | | |
Meituan Dianping, Class B (a)(b) | | | 6,384,100 | | | | 83,485 | | |
TAL Education Group ADR (a) | | | 5,547,580 | | | | 267,393 | | |
Trip.com Group Ltd. ADR (a) | | | 1,157,078 | | | | 38,808 | | |
| | | | 513,801 | | |
Denmark (5.0%) | |
DSV A/S | | | 1,627,498 | | | | 187,612 | | |
France (3.2%) | |
Hermes International | | | 164,064 | | | | 122,601 | | |
India (4.2%) | |
HDFC Bank Ltd. | | | 8,884,972 | | | | 158,348 | | |
Italy (3.6%) | |
Moncler SpA | | | 2,976,124 | | | | 133,948 | | |
Japan (5.0%) | |
Calbee, Inc. | | | 1,400,300 | | | | 45,624 | | |
Keyence Corp. | | | 314,000 | | | | 110,257 | | |
Nihon M&A Center, Inc. | | | 997,600 | | | | 34,330 | | |
| | | | 190,211 | | |
Korea, Republic of (1.0%) | |
NAVER Corp. | | | 229,669 | | | | 36,952 | | |
Switzerland (0.9%) | |
Chocoladefabriken Lindt & Spruengli AG
(Registered) | | | 384 | | | | 33,910 | | |
United Kingdom (2.0%) | |
Fevertree Drinks PLC | | | 1,358,414 | | | | 37,660 | | |
Reckitt Benckiser Group PLC | | | 475,380 | | | | 38,594 | | |
| | | | 76,254 | | |
United States (52.7%) | |
Adobe, Inc. (a) | | | 477,757 | | | | 157,569 | | |
Agilon Health Topco, Inc. (a)(d)(e)
(acquisition cost — $11,376;
acquired 11/7/18) | | | 30,083 | | | | 13,521 | | |
Alphabet, Inc., Class C (a) | | | 130,067 | | | | 173,902 | | |
Amazon.com, Inc. (a) | | | 122,366 | | | | 226,113 | | |
Booking Holdings, Inc. (a) | | | 47,003 | | | | 96,531 | | |
EPAM Systems, Inc. (a) | | | 595,760 | | | | 126,396 | | |
Facebook, Inc., Class A (a) | | | 611,375 | | | | 125,485 | | |
Farfetch Ltd., Class A (a) | | | 2,423,385 | | | | 25,082 | | |
Intuitive Surgical, Inc. (a) | | | 104,692 | | | | 61,889 | | |
Martin Marietta Materials, Inc. | | | 163,251 | | | | 45,652 | | |
Mastercard, Inc., Class A | | | 912,101 | | | | 272,344 | | |
salesforce.com, Inc. (a) | | | 660,626 | | | | 107,444 | | |
ServiceNow, Inc. (a) | | | 595,863 | | | | 168,224 | | |
Spotify Technology SA (a) | | | 363,095 | | | | 54,301 | | |
Uber Technologies, Inc. (a) | | | 2,175,854 | | | | 64,710 | | |
| | | Shares | | Value
(000) | |
Visa, Inc., Class A | | | 810,985 | | | $ | 152,384 | | |
Vulcan Materials Co. | | | 299,284 | | | | 43,094 | | |
Workday, Inc., Class A (a) | | | 236,116 | | | | 38,829 | | |
Zillow Group, Inc., Class A (a) | | | 630,142 | | | | 28,823 | | |
Zillow Group, Inc., Class C (a) | | | 199,211 | | | | 9,152 | | |
| | | | 1,991,445 | | |
Total Common Stocks (Cost $2,217,872) | | | 3,483,920 | | |
Preferred Stocks (0.2%) | |
United States (0.2%) | |
Airbnb, Inc. Series D (a)(d)(e)
(acquisition cost — $1,594;
acquired 4/16/14) | | | 39,153 | | | | 5,144 | | |
Magic Leap Series C (a)(d)(e)
(acquisition cost — $3,175;
acquired 12/22/15) | | | 137,829 | | | | 3,359 | | |
Total Preferred Stocks (Cost $4,769) | | | 8,503 | | |
Short-Term Investment (7.8%) | |
Investment Company (7.8%) | |
Morgan Stanley Institutional Liquidity
Funds — Treasury Securities Portfolio —
Institutional Class (See Note G)
(Cost $295,110) | | | 295,109,751 | | | | 295,110 | | |
Total Investments Excluding Purchased
Options (100.2%) (Cost $2,517,751) | | | | | 3,787,533 | | |
Total Purchased Options Outstanding (0.0%)
(Cost $9,109) | | | 1,100 | | |
Total Investments (100.2%)
(Cost $2,526,860) (f)(g) | | | 3,788,633 | | |
Liabilities in Excess of Other Assets (–0.2%) | | | (8,552 | ) | |
Net Assets (100.0%) | | $ | 3,780,081 | | |
Country assignments and aggregations are based generally on third party vendor classifications and information, and may be different from the assignments and aggregations under the policies set forth in the Fund's prospectus and/or statement of additional information relating to geographic classifications.
(a) Non-income producing security.
(b) Security trades on the Hong Kong exchange.
(c) 144A security — Certain conditions for public sale may exist. Unless otherwise noted, these securities are deemed to be liquid.
(d) Security cannot be offered for public resale without first being registered under the Securities Act of 1933 and related rules ("restricted security"). Acquisition date represents the day on which an enforceable right to acquire such security is obtained and is presented along with related cost in the security description. The Fund has registration rights for certain restricted securities. Any costs related to such registration are borne by the issuer. The aggregate value of restricted securities (excluding 144A holdings) at December 31, 2019 amounts to approximately $22,024,000 and represents 0.6% of net assets.
(e) At December 31, 2019, the Fund held fair valued securities valued at approximately $22,024,000, representing 0.6% of net assets. These securities have been fair valued as determined in good faith under procedures established by and under the general supervision of the Company's (as defined herein) Directors.
The accompanying notes are an integral part of the financial statements.
7
Morgan Stanley Institutional Fund, Inc.
Annual Report — December 31, 2019
Portfolio of Investments (cont'd)
Global Opportunity Portfolio
(f) The approximate fair value and percentage of net assets, $582,633,000 and 15.4%, respectively, represent the securities that have been fair valued under the fair valuation policy for international investments as described in Note A-1 within the Notes to the Financial Statements.
(g) At December 31, 2019, the aggregate cost for federal income tax purposes is approximately $2,530,415,000. The aggregate gross unrealized appreciation is approximately $1,318,680,000 and the aggregate gross unrealized depreciation is approximately $60,462,000, resulting in net unrealized appreciation of approximately $1,258,218,000.
ADR American Depositary Receipt.
Call Options Purchased:
The Fund had the following call options purchased open at December 31, 2019:
Counterparty | | Description | | Strike
Price | | Expiration
Date | | Number of
Contracts | | Notional
Amount
(000) | | Value
(000) | | Premiums
Paid
(000) | | Unrealized
Depreciation
(000) | |
BNP Paribas | | USD/CNH | | CNH | 7.58 | | | Jan-20 | | | 491,307,627 | | | | 491,308 | | | $ | 2 | | | $ | 2,515 | | | $ | (2,513 | ) | |
Royal Bank of Scotland | | USD/CNH | | CNH | 7.85 | | | Jun-20 | | | 634,542,637 | | | | 634,543 | | | | 415 | | | | 3,274 | | | | (2,859 | ) | |
Royal Bank of Scotland | | USD/CNH | | CNH | 8.09 | | | Sep-20 | | | 615,152,760 | | | | 615,153 | | | | 683 | | | | 3,320 | | | | (2,637 | ) | |
| | | | | | | | | | | $ | 1,100 | | | $ | 9,109 | | | $ | (8,009 | ) | |
CNH — Chinese Yuan Renminbi Offshore.
USD — United States Dollar.
Portfolio Composition
Classification | | Percentage of
Total Investments | |
Other* | | | 22.9 | % | |
Information Technology Services | | | 14.5 | | |
Software | | | 13.5 | | |
Internet & Direct Marketing Retail | | | 12.5 | | |
Interactive Media & Services | | | 9.9 | | |
Short-Term Investments | | | 7.8 | | |
Diversified Consumer Services | | | 7.1 | | |
Textiles, Apparel & Luxury Goods | | | 6.8 | | |
Air Freight & Logistics | | | 5.0 | | |
Total Investments | | | 100.0 | % | |
* Industries and/or investment types representing less than 5% of total investments.
The accompanying notes are an integral part of the financial statements.
8
Morgan Stanley Institutional Fund, Inc.
Annual Report — December 31, 2019
Global Opportunity Portfolio
Statement of Assets and Liabilities | | December 31, 2019
(000) | |
Assets: | |
Investments in Securities of Unaffiliated Issuers, at Value (Cost $2,231,750) | | $ | 3,493,523 | | |
Investment in Security of Affiliated Issuer, at Value (Cost $295,110) | | | 295,110 | | |
Total Investments in Securities, at Value (Cost $2,526,860) | | | 3,788,633 | | |
Foreign Currency, at Value (Cost $2,495) | | | 2,489 | | |
Receivable for Fund Shares Sold | | | 10,208 | | |
Receivable for Investments Sold | | | 617 | | |
Receivable from Affiliate | | | 429 | | |
Tax Reclaim Receivable | | | 278 | | |
Other Assets | | | 196 | | |
Total Assets | | | 3,802,850 | | |
Liabilities: | |
Payable for Investments Purchased | | | 8,435 | | |
Payable for Advisory Fees | | | 6,319 | | |
Deferred Capital Gain Country Tax | | | 2,866 | | |
Payable for Fund Shares Redeemed | | | 2,221 | | |
Due to Broker | | | 1,540 | | |
Payable for Shareholder Services Fees — Class A | | | 223 | | |
Payable for Distribution and Shareholder Services Fees — Class L | | | 10 | | |
Payable for Distribution and Shareholder Services Fees — Class C | | | 208 | | |
Payable for Sub Transfer Agency Fees — Class I | | | 198 | | |
Payable for Sub Transfer Agency Fees — Class A | | | 96 | | |
Payable for Sub Transfer Agency Fees — Class L | | | 3 | | |
Payable for Sub Transfer Agency Fees — Class C | | | 23 | | |
Payable for Administration Fees | | | 250 | | |
Payable for Transfer Agency Fees — Class I | | | 7 | | |
Payable for Transfer Agency Fees — Class A | | | 60 | | |
Payable for Transfer Agency Fees — Class L | | | 10 | | |
Payable for Transfer Agency Fees — Class C | | | 5 | | |
Payable for Transfer Agency Fees — Class IS | | | 1 | | |
Payable for Transfer Agency Fees — Class IR | | | — | @ | |
Payable for Professional Fees | | | 70 | | |
Payable for Custodian Fees | | | 53 | | |
Other Liabilities | | | 171 | | |
Total Liabilities | | | 22,769 | | |
Net Assets | | $ | 3,780,081 | | |
Net Assets Consist of: | |
Paid-in-Capital | | $ | 2,587,276 | | |
Total Distributable Earnings | | | 1,192,805 | | |
Net Assets | | $ | 3,780,081 | | |
The accompanying notes are an integral part of the financial statements.
9
Morgan Stanley Institutional Fund, Inc.
Annual Report — December 31, 2019
Global Opportunity Portfolio
Statement of Assets and Liabilities (cont'd) | | December 31, 2019
(000) | |
CLASS I: | |
Net Assets | | $ | 2,220,219 | | |
| Shares Outstanding $0.001 par value shares of beneficial interest (unlimited shares authorized) (not in 000's) | | | 76,253,978 | | |
Net Asset Value, Offering and Redemption Price Per Share | | $ | 29.12 | | |
CLASS A: | |
Net Assets | | $ | 1,070,124 | | |
| Shares Outstanding $0.001 par value shares of beneficial interest (unlimited shares authorized) (not in 000's) | | | 38,088,681 | | |
Net Asset Value, Redemption Price Per Share | | $ | 28.10 | | |
Maximum Sales Load | | | 5.25 | % | |
Maximum Sales Charge | | $ | 1.56 | | |
Maximum Offering Price Per Share | | $ | 29.66 | | |
CLASS L: | |
Net Assets | | $ | 40,836 | | |
| Shares Outstanding $0.001 par value shares of beneficial interest (unlimited shares authorized) (not in 000's) | | | 1,473,302 | | |
Net Asset Value, Offering and Redemption Price Per Share | | $ | 27.72 | | |
CLASS C: | |
Net Assets | | $ | 251,160 | | |
| Shares Outstanding $0.001 par value shares of beneficial interest (unlimited shares authorized) (not in 000's) | | | 9,335,447 | | |
Net Asset Value, Offering and Redemption Price Per Share | | $ | 26.90 | | |
CLASS IS: | |
Net Assets | | $ | 124,173 | | |
| Shares Outstanding $0.001 par value shares of beneficial interest (unlimited shares authorized) (not in 000's) | | | 4,254,811 | | |
Net Asset Value, Offering and Redemption Price Per Share | | $ | 29.18 | | |
CLASS IR: | |
Net Assets | | $ | 73,569 | | |
| Shares Outstanding $0.001 par value shares of beneficial interest (unlimited shares authorized) (not in 000's) | | | 2,517,723 | | |
Net Asset Value, Offering and Redemption Price Per Share | | $ | 29.22 | | |
@ Amount is less than $500.
The accompanying notes are an integral part of the financial statements.
10
Morgan Stanley Institutional Fund, Inc.
Annual Report — December 31, 2019
Global Opportunity Portfolio
Statement of Operations | | Year Ended
December 31, 2019
(000) | |
Investment Income: | |
Dividends from Securities of Unaffiliated Issuers (Net of $688 of Foreign Taxes Withheld) | | $ | 11,056 | | |
Dividends from Security of Affiliated Issuer (Note G) | | | 4,699 | | |
Total Investment Income | | | 15,755 | | |
Expenses: | |
Advisory Fees (Note B) | | | 23,456 | | |
Shareholder Services Fees — Class A (Note D) | | | 2,394 | | |
Distribution and Shareholder Services Fees — Class L (Note D) | | | 290 | | |
Distribution and Shareholder Services Fees — Class C (Note D) | | | 2,094 | | |
Sub Transfer Agency Fees — Class I | | | 1,804 | | |
Sub Transfer Agency Fees — Class A | | | 1,055 | | |
Sub Transfer Agency Fees — Class L | | | 23 | | |
Sub Transfer Agency Fees — Class C | | | 202 | | |
Administration Fees (Note C) | | | 2,552 | | |
Custodian Fees (Note F) | | | 350 | | |
Transfer Agency Fees — Class I (Note E) | | | 40 | | |
Transfer Agency Fees — Class A (Note E) | | | 211 | | |
Transfer Agency Fees — Class L (Note E) | | | 31 | | |
Transfer Agency Fees — Class C (Note E) | | | 18 | | |
Transfer Agency Fees — Class IS (Note E) | | | 4 | | |
Transfer Agency Fees — Class IR (Note E) | | | 2 | | |
Shareholder Reporting Fees | | | 286 | | |
Registration Fees | | | 278 | | |
Professional Fees | | | 159 | | |
Directors' Fees and Expenses | | | 72 | | |
Pricing Fees | | | 3 | | |
Other Expenses | | | 84 | | |
Expenses Before Non Operating Expenses | | | 35,408 | | |
Bank Overdraft Expense | | | 1 | | |
Total Expenses | | | 35,409 | | |
Rebate from Morgan Stanley Affiliate (Note G) | | | (450 | ) | |
Distribution Fees — Class L Shares Waived (Note D) | | | (174 | ) | |
Reimbursement of Class Specific Expenses — Class IS (Note B) | | | (3 | ) | |
Net Expenses | | | 34,782 | | |
Net Investment Loss | | | (19,027 | ) | |
Realized Loss: | |
Investments Sold | | | (32,820 | ) | |
Foreign Currency Translation | | | (19 | ) | |
Net Realized Loss | | | (32,839 | ) | |
Change in Unrealized Appreciation (Depreciation): | |
Investments (Net of Increase in Deferred Capital Gain Country Tax of $2,489) | | | 951,534 | | |
Foreign Currency Translation | | | (28 | ) | |
Net Change in Unrealized Appreciation (Depreciation) | | | 951,506 | | |
Net Realized Loss and Change in Unrealized Appreciation (Depreciation) | | | 918,667 | | |
Net Increase in Net Assets Resulting from Operations | | $ | 899,640 | | |
The accompanying notes are an integral part of the financial statements.
11
Morgan Stanley Institutional Fund, Inc.
Annual Report — December 31, 2019
Global Opportunity Portfolio
Statements of Changes in Net Assets | | Year Ended
December 31, 2019
(000) | | Year Ended
December 31, 2018
(000) | |
Increase (Decrease) in Net Assets: | |
Operations: | |
Net Investment Loss | | $ | (19,027 | ) | | $ | (12,237 | ) | |
Net Realized Loss | | | (32,839 | ) | | | (26,956 | ) | |
Net Change in Unrealized Appreciation (Depreciation) | | | 951,506 | | | | (199,476 | ) | |
Net Increase (Decrease) in Net Assets Resulting from Operations | | | 899,640 | | | | (238,669 | ) | |
Dividends and Distributions to Shareholders: | |
Class I | | | — | | | | (9,846 | ) | |
Class A | | | — | | | | (7,319 | ) | |
Class L | | | — | | | | (294 | ) | |
Class C | | | — | | | | (1,269 | ) | |
Class IS | | | — | | | | (438 | ) | |
Class IR | | | — | | | | (— | @)(a) | |
Total Dividends and Distributions to Shareholders | | | — | | | | (19,166 | ) | |
Capital Share Transactions:(1) | |
Class I: | |
Subscribed | | | 904,534 | | | | 1,221,941 | | |
Distributions Reinvested | | | — | | | | 9,644 | | |
Redeemed | | | (546,491 | ) | | | (639,457 | ) | |
Class A: | |
Subscribed | | | 219,604 | | | | 467,352 | | |
Distributions Reinvested | | | — | | | | 7,236 | | |
Redeemed | | | (216,191 | ) | | | (393,036 | ) | |
Class L: | |
Exchanged | | | 46 | | | | 247 | | |
Distributions Reinvested | | | — | | | | 275 | | |
Redeemed | | | (4,481 | ) | | | (4,377 | ) | |
Class C: | |
Subscribed | | | 70,635 | | | | 107,428 | | |
Distributions Reinvested | | | — | | | | 1,268 | | |
Redeemed | | | (36,622 | ) | | | (33,797 | ) | |
Class IS: | |
Subscribed | | | 115,916 | | | | 65,885 | | |
Distributions Reinvested | | | — | | | | 438 | | |
Redeemed | | | (4,208 | ) | | | (66,763 | ) | |
Class IR: | |
Subscribed | | | — | | | | 66,544 | (a) | |
Net Increase in Net Assets Resulting from Capital Share Transactions | | | 502,742 | | | | 810,828 | | |
Total Increase in Net Assets | | | 1,402,382 | | | | 552,993 | | |
Net Assets: | |
Beginning of Period | | | 2,377,699 | | | | 1,824,706 | | |
End of Period | | $ | 3,780,081 | | | $ | 2,377,699 | | |
The accompanying notes are an integral part of the financial statements.
12
Morgan Stanley Institutional Fund, Inc.
Annual Report — December 31, 2019
Global Opportunity Portfolio
Statements of Changes in Net Assets (cont'd) | | Year Ended
December 31, 2019
(000) | | Year Ended
December 31, 2018
(000) | |
(1) Capital Share Transactions: | |
Class I: | |
Shares Subscribed | | | 34,981 | | | | 49,756 | | |
Shares Issued on Distributions Reinvested | | | — | | | | 373 | | |
Shares Redeemed | | | (20,909 | ) | | | (27,089 | ) | |
Net Increase in Class I Shares Outstanding | | | 14,072 | | | | 23,040 | | |
Class A: | |
Shares Subscribed | | | 8,760 | | | | 19,389 | | |
Shares Issued on Distributions Reinvested | | | — | | | | 289 | | |
Shares Redeemed | | | (8,663 | ) | | | (16,730 | ) | |
Net Increase in Class A Shares Outstanding | | | 97 | | | | 2,948 | | |
Class L: | |
Shares Exchanged | | | 2 | | | | 10 | | |
Shares Issued on Distributions Reinvested | | | — | | | | 11 | | |
Shares Redeemed | | | (180 | ) | | | (187 | ) | |
Net Decrease in Class L Shares Outstanding | | | (178 | ) | | | (166 | ) | |
Class C: | |
Shares Subscribed | | | 2,895 | | | | 4,605 | | |
Shares Issued on Distributions Reinvested | | | — | | | | 52 | | |
Shares Redeemed | | | (1,514 | ) | | | (1,526 | ) | |
Net Increase in Class C Shares Outstanding | | | 1,381 | | | | 3,131 | | |
Class IS: | |
Shares Subscribed | | | 4,310 | | | | 2,537 | | |
Shares Issued on Distributions Reinvested | | | — | | | | 17 | | |
Shares Redeemed | | | (155 | ) | | | (2,526 | ) | |
Net Increase in Class IS Shares Outstanding | | | 4,155 | | | | 28 | �� | |
Class IR: | |
Shares Subscribed | | | — | | | | 2,518 | (a) | |
(a) For the period June 15, 2018 through December 31, 2018.
@ Amount is less than $500.
The accompanying notes are an integral part of the financial statements.
13
Morgan Stanley Institutional Fund, Inc.
Annual Report — December 31, 2019
Financial Highlights
Global Opportunity Portfolio
| | | Class I | |
| | | Year Ended December 31, | |
Selected Per Share Data and Ratios | | 2019 | | 2018 | | 2017 | | 2016(1) | | 2015 | |
Net Asset Value, Beginning of Period | | $ | 21.50 | | | $ | 22.94 | | | $ | 15.41 | | | $ | 16.36 | | | $ | 13.98 | | |
Income (Loss) from Investment Operations: | |
Net Investment Loss(2) | | | (0.12 | ) | | | (0.07 | ) | | | (0.06 | ) | | | (0.05 | ) | | | (0.05 | ) | |
Net Realized and Unrealized Gain (Loss) | | | 7.74 | | | | (1.20 | ) | | | 7.68 | | | | 0.18 | | | | 2.64 | | |
Total from Investment Operations | | | 7.62 | | | | (1.27 | ) | | | 7.62 | | | | 0.13 | | | | 2.59 | | |
Distributions from and/or in Excess of: | |
Net Realized Gain | | | — | | | | (0.17 | ) | | | (0.09 | ) | | | (1.08 | ) | | | (0.21 | ) | |
Net Asset Value, End of Period | | $ | 29.12 | | | $ | 21.50 | | | $ | 22.94 | | | $ | 15.41 | | | $ | 16.36 | | |
Total Return(3) | | | 35.44 | % | | | (5.66 | )% | | | 49.44 | % | | | 1.05 | % | | | 18.50 | % | |
Ratios to Average Net Assets and Supplemental Data: | |
Net Assets, End of Period (Thousands) | | $ | 2,220,219 | | | $ | 1,337,133 | | | $ | 898,008 | | | $ | 255,187 | | | $ | 238,920 | | |
Ratio of Expenses Before Expense Limitation | | | N/A | | | | N/A | | | | 0.99 | % | | | 1.07 | % | | | 1.20 | % | |
Ratio of Expenses After Expense Limitation | | | 0.94 | %(4) | | | 0.94 | %(4)(6) | | | 0.79 | %(4) | | | 0.80 | %(4) | | | 0.98 | %(4)(5) | |
Ratio of Expenses After Expense Limitation Excluding Non-Operating Expenses | | | 0.94 | %(4) | | | N/A | | | | N/A | | | | N/A | | | | N/A | | |
Ratio of Net Investment Loss | | | (0.44 | )%(4) | | | (0.30 | )%(4) | | | (0.31 | )%(4) | | | (0.34 | )%(4) | | | (0.33 | )%(4) | |
Ratio of Rebate from Morgan Stanley Affiliates | | | 0.01 | % | | | 0.01 | % | | | 0.01 | % | | | 0.01 | % | | | 0.01 | % | |
Portfolio Turnover Rate | | | 15 | % | | | 28 | % | | | 30 | % | | | 37 | % | | | 115 | % | |
(1) Reflects prior period custodian out-of-pocket expenses that were reimbursed in September 2016. The amount of the reimbursement was immaterial on a per share basis and did not impact the total return of Class I shares. The Ratio of Expenses After Expense Limitation and the Ratio of Net Investment Loss would be unchanged as the reimbursement of custodian fees was offset against expense waivers/reimbursements with no impact to net expenses or net investment loss.
(2) Per share amount is based on average shares outstanding.
(3) Calculated based on the net asset value as of the last business day of the period.
(4) The Ratio of Expenses After Expense Limitation and Ratio of Net Investment Loss reflect the rebate of certain Fund expenses in connection with the investments in Morgan Stanley affiliates during the period. The effect of the rebate on the ratios is disclosed in the above table as "Ratio of Rebate from Morgan Stanley Affiliates."
(5) Effective December 7, 2015, the Adviser has agreed to limit the ratio of expenses to average net assets to the maximum ratio of 0.81% for Class I shares. Prior to December 7, 2015, the maximum ratio was 1.10% for Class I shares. Prior to January 23, 2015, the maximum ratio was 1.25% for Class I shares.
(6) Effective January 1, 2018, the Adviser has agreed to limit the ratio of expenses to average net assets to the maximum ratio of 1.00% for Class I shares. Prior to January 1, 2018, the maximum ratio was 0.81% for Class I shares.
The accompanying notes are an integral part of the financial statements.
14
Morgan Stanley Institutional Fund, Inc.
Annual Report — December 31, 2019
Financial Highlights
Global Opportunity Portfolio
| | | Class A | |
| | | Year Ended December 31, | |
Selected Per Share Data and Ratios | | 2019 | | 2018 | | 2017 | | 2016(1) | | 2015 | |
Net Asset Value, Beginning of Period | | $ | 20.81 | | | $ | 22.28 | | | $ | 15.01 | | | $ | 16.03 | | | $ | 13.75 | | |
Income (Loss) from Investment Operations: | |
Net Investment Loss(2) | | | (0.18 | ) | | | (0.14 | ) | | | (0.12 | ) | | | (0.11 | ) | | | (0.10 | ) | |
Net Realized and Unrealized Gain (Loss) | | | 7.47 | | | | (1.16 | ) | | | 7.48 | | | | 0.17 | | | | 2.59 | | |
Total from Investment Operations | | | 7.29 | | | | (1.30 | ) | | | 7.36 | | | | 0.06 | | | | 2.49 | | |
Distributions from and/or in Excess of: | |
Net Realized Gain | | | — | | | | (0.17 | ) | | | (0.09 | ) | | | (1.08 | ) | | | (0.21 | ) | |
Net Asset Value, End of Period | | $ | 28.10 | | | $ | 20.81 | | | $ | 22.28 | | | $ | 15.01 | | | $ | 16.03 | | |
Total Return(3) | | | 35.03 | % | | | (5.96 | )% | | | 49.03 | % | | | 0.62 | % | | | 18.16 | % | |
Ratios to Average Net Assets and Supplemental Data: | |
Net Assets, End of Period (Thousands) | | $ | 1,070,124 | | | $ | 790,571 | | | $ | 780,705 | | | $ | 340,092 | | | $ | 347,683 | | |
Ratio of Expenses Before Expense Limitation | | | N/A | | | | N/A | | | | 1.32 | % | | | 1.41 | % | | | 1.50 | % | |
Ratio of Expenses After Expense Limitation | | | 1.22 | %(4) | | | 1.26 | %(4)(6) | | | 1.12 | %(4) | | | 1.17 | %(4) | | | 1.25 | %(4)(5) | |
Ratio of Expenses After Expense Limitation Excluding Non-Operating Expenses | | | 1.22 | %(4) | | | N/A | | | | N/A | | | | N/A | | | | N/A | | |
Ratio of Net Investment Loss | | | (0.72 | )%(4) | | | (0.59 | )%(4) | | | (0.63 | )%(4) | | | (0.70 | )%(4) | | | (0.64 | )%(4) | |
Ratio of Rebate from Morgan Stanley Affiliates | | | 0.01 | % | | | 0.01 | % | | | 0.01 | % | | | 0.01 | % | | | 0.01 | % | |
Portfolio Turnover Rate | | | 15 | % | | | 28 | % | | | 30 | % | | | 37 | % | | | 115 | % | |
(1) Reflects prior period custodian out-of-pocket expenses that were reimbursed in September 2016. The amount of the reimbursement was immaterial on a per share basis and did not impact the total return of Class A shares. The Ratio of Expenses After Expense Limitation and the Ratio of Net Investment Loss would be unchanged as the reimbursement of custodian fees was offset against expense waivers/reimbursements with no impact to net expenses or net investment loss.
(2) Per share amount is based on average shares outstanding.
(3) Calculated based on the net asset value which does not reflect sales charges, if applicable, as of the last business day of the period.
(4) The Ratio of Expenses After Expense Limitation and Ratio of Net Investment Loss reflect the rebate of certain Fund expenses in connection with the investments in Morgan Stanley affiliates during the period. The effect of the rebate on the ratios is disclosed in the above table as "Ratio of Rebate from Morgan Stanley Affiliates."
(5) Effective December 7, 2015, the Adviser has agreed to limit the ratio of expenses to average net assets to the maximum ratio of 1.23% for Class A Shares. Prior to December 7, 2015, the maximum ratio was 1.45% for Class A Share. Prior to January 23, 2015, the maximum ratio was 1.60% for class A shares.
(6) Effective January 1, 2018, the Adviser has agreed to limit the ratio of expenses to average net assets to the maximum ratio of 1.35% for Class A shares. Prior to January 1, 2018, the maximum ratio was 1.23% for Class A shares.
The accompanying notes are an integral part of the financial statements.
15
Morgan Stanley Institutional Fund, Inc.
Annual Report — December 31, 2019
Financial Highlights
Global Opportunity Portfolio
| | | Class L | |
| | | Year Ended December 31, | |
Selected Per Share Data and Ratios | | 2019 | | 2018 | | 2017 | | 2016(1) | | 2015 | |
Net Asset Value, Beginning of Period | | $ | 20.54 | | | $ | 22.01 | | | $ | 14.84 | | | $ | 15.87 | | | $ | 13.62 | | |
Income (Loss) from Investment Operations: | |
Net Investment Loss(2) | | | (0.19 | ) | | | (0.15 | ) | | | (0.13 | ) | | | (0.12 | ) | | | (0.11 | ) | |
Net Realized and Unrealized Gain (Loss) | | | 7.37 | | | | (1.15 | ) | | | 7.39 | | | | 0.17 | | | | 2.57 | | |
Total from Investment Operations | | | 7.18 | | | | (1.30 | ) | | | 7.26 | | | | 0.05 | | | | 2.46 | | |
Distributions from and/or in Excess of: | |
Net Realized Gain | | | — | | | | (0.17 | ) | | | (0.09 | ) | | | (1.08 | ) | | | (0.21 | ) | |
Net Asset Value, End of Period | | $ | 27.72 | | | $ | 20.54 | | | $ | 22.01 | | | $ | 14.84 | | | $ | 15.87 | | |
Total Return(3) | | | 34.96 | % | | | (6.04 | )% | | | 48.91 | % | | | 0.56 | % | | | 18.03 | % | |
Ratios to Average Net Assets and Supplemental Data: | |
Net Assets, End of Period (Thousands) | | $ | 40,836 | | | $ | 33,913 | | | $ | 39,979 | | | $ | 30,133 | | | $ | 34,628 | | |
Ratio of Expenses Before Expense Limitation | | | 1.74 | % | | | 1.78 | % | | | 1.86 | % | | | 1.93 | % | | | 2.03 | % | |
Ratio of Expenses After Expense Limitation | | | 1.28 | %(4) | | | 1.32 | %(4)(6) | | | 1.20 | %(4) | | | 1.25 | %(4) | | | 1.30 | %(4)(5) | |
Ratio of Expenses After Expense Limitation Excluding Non-Operating Expenses | | | 1.28 | %(4) | | | N/A | | | | N/A | | | | N/A | | | | N/A | | |
Ratio of Net Investment Loss | | | (0.78 | )%(4) | | | (0.65 | )%(4) | | | (0.67 | )%(4) | | | (0.79 | )%(4) | | | (0.70 | )%(4) | |
Ratio of Rebate from Morgan Stanley Affiliates | | | 0.01 | % | | | 0.01 | % | | | 0.01 | % | | | 0.01 | % | | | 0.01 | % | |
Portfolio Turnover Rate | | | 15 | % | | | 28 | % | | | 30 | % | | | 37 | % | | | 115 | % | |
(1) Reflects prior period custodian out-of-pocket expenses that were reimbursed in September 2016. The amount of the reimbursement was immaterial on a per share basis and did not impact the total return of Class L shares. The Ratio of Expenses After Expense Limitation and the Ratio of Net Investment Loss would be unchanged as the reimbursement of custodian fees was offset against expense waivers/reimbursements with no impact to net expenses or net investment loss.
(2) Per share amount is based on average shares outstanding.
(3) Calculated based on the net asset value as of the last business day of the period.
(4) The Ratio of Expenses After Expense Limitation and Ratio of Net Investment Loss reflect the rebate of certain Fund expenses in connection with the investments in Morgan Stanley affiliates during the period. The effect of the rebate on the ratios is disclosed in the above table as "Ratio of Rebate from Morgan Stanley Affiliates."
(5) Effective January 23, 2015, the Adviser has agreed to limit the ratio of expenses to average net assets to the maximum ratio of 1.50% for Class L shares. Prior to January 23, 2015, the maximum ratio was 1.65% for Class L shares.
(6) Effective January 1, 2018, the Adviser has agreed to limit the ratio of expenses to average net assets to the maximum ratio of 1.40% for Class L shares. Prior to January 1, 2018, the maximum ratio was 1.50% for Class L shares.
The accompanying notes are an integral part of the financial statements.
16
Morgan Stanley Institutional Fund, Inc.
Annual Report — December 31, 2019
Financial Highlights
Global Opportunity Portfolio
| | | Class C | |
| | | Year Ended December 31, | | Period from
April 30, 2015(2) to | |
Selected Per Share Data and Ratios | | 2019 | | 2018 | | 2017 | | 2016(1) | | December 31, 2015 | |
Net Asset Value, Beginning of Period | | $ | 20.07 | | | $ | 21.64 | | | $ | 14.69 | | | $ | 15.80 | | | $ | 15.25 | | |
Income (Loss) from Investment Operations: | |
Net Investment Loss(3) | | | (0.35 | ) | | | (0.30 | ) | | | (0.26 | ) | | | (0.21 | ) | | | (0.15 | ) | |
Net Realized and Unrealized Gain (Loss) | | | 7.18 | | | | (1.10 | ) | | | 7.30 | | | | 0.18 | | | | 0.91 | | |
Total from Investment Operations | | | 6.83 | | | | (1.40 | ) | | | 7.04 | | | | (0.03 | ) | | | 0.76 | | |
Distributions from and/or in Excess of: | |
Net Realized Gain | | | — | | | | (0.17 | ) | | | (0.09 | ) | | | (1.08 | ) | | | (0.21 | ) | |
Net Asset Value, End of Period | | $ | 26.90 | | | $ | 20.07 | | | $ | 21.64 | | | $ | 14.69 | | | $ | 15.80 | | |
Total Return(4) | | | 34.03 | % | | | (6.61 | )% | | | 47.92 | % | | | 0.05 | % | | | 4.95 | %(7) | |
Ratios to Average Net Assets and Supplemental Data: | |
Net Assets, End of Period (Thousands) | | $ | 251,160 | | | $ | 159,642 | | | $ | 104,364 | | | $ | 33,801 | | | $ | 20,475 | | |
Ratio of Expenses Before Expense Limitation | | | N/A | | | | N/A | | | | 2.01 | % | | | 2.08 | % | | | 2.22 | %(8) | |
Ratio of Expenses After Expense Limitation | | | 1.94 | %(5) | | | 1.95 | %(5)(6) | | | 1.81 | %(5) | | | 1.84 | %(5) | | | 2.03 | %(5)(8) | |
Ratio of Expenses After Expense Limitation Excluding Non-Operating Expenses | | | 1.94 | %(5) | | | N/A | | | | N/A | | | | N/A | | | | N/A | | |
Ratio of Net Investment Loss | | | (1.45 | )%(5) | | | (1.30 | )%(5) | | | (1.33 | )%(5) | | | (1.38 | )%(5) | | | (1.40 | )%(5)(8) | |
Ratio of Rebate from Morgan Stanley Affiliates | | | 0.01 | % | | | 0.01 | % | | | 0.01 | % | | | 0.01 | % | | | 0.01 | %(8) | |
Portfolio Turnover Rate | | | 15 | % | | | 28 | % | | | 30 | % | | | 37 | % | | | 115 | % | |
(1) Reflects prior period custodian out-of-pocket expenses that were reimbursed in September 2016. The amount of the reimbursement was immaterial on a per share basis and did not impact the total return of Class C shares. The Ratio of Expenses After Expense Limitation and the Ratio of Net Investment Loss would be unchanged as the reimbursement of custodian fees was offset against expense waivers/reimbursements with no impact to net expenses or net investment loss.
(2) Commencement of Offering.
(3) Per share amount is based on average shares outstanding.
(4) Calculated based on the net asset value which does not reflect sales charges, if applicable, as of the last business day of the period.
(5) The Ratio of Expenses After Expense Limitation and Ratio of Net Investment Loss reflect the rebate of certain Fund expenses in connection with the investments in Morgan Stanley affiliates during the period. The effect of the rebate on the ratios is disclosed in the above table as "Ratio of Rebate from Morgan Stanley Affiliates."
(6) Effective January 1, 2018, the Adviser has agreed to limit the ratio of expenses to average net assets to the maximum ratio of 2.10% for Class C shares. Prior to January 1, 2018, the maximum ratio was 2.20% for Class C shares.
(7) Not annualized.
(8) Annualized.
The accompanying notes are an integral part of the financial statements.
17
Morgan Stanley Institutional Fund, Inc.
Annual Report — December 31, 2019
Financial Highlights
Global Opportunity Portfolio
| | | Class IS | |
| | | Year Ended December 31, | |
Selected Per Share Data and Ratios | | 2019 | | 2018 | | 2017 | | 2016(1) | | 2015 | |
Net Asset Value, Beginning of Period | | $ | 21.53 | | | $ | 23.00 | | | $ | 15.44 | | | $ | 16.38 | | | $ | 13.99 | | |
Income (Loss) from Investment Operations: | |
Net Investment Loss(2) | | | (0.14 | ) | | | (0.00 | )(3) | | | (0.05 | ) | | | (0.06 | ) | | | (0.05 | ) | |
Net Realized and Unrealized Gain (Loss) | | | 7.79 | | | | (1.30 | ) | | | 7.70 | | | | 0.20 | | | | 2.65 | | |
Total from Investment Operations | | | 7.65 | | | | (1.30 | ) | | | 7.65 | | | | 0.14 | | | | 2.60 | | |
Distributions from and/or in Excess of: | |
Net Realized Gain | | | — | | | | (0.17 | ) | | | (0.09 | ) | | | (1.08 | ) | | | (0.21 | ) | |
Net Asset Value, End of Period | | $ | 29.18 | | | $ | 21.53 | | | $ | 23.00 | | | $ | 15.44 | | | $ | 16.38 | | |
Total Return(4) | | | 35.53 | % | | | (5.78 | )% | | | 49.54 | % | | | 1.11 | % | | | 18.64 | % | |
Ratios to Average Net Assets and Supplemental Data: | |
Net Assets, End of Period (Thousands) | | $ | 124,173 | | | $ | 2,156 | | | $ | 1,650 | | | $ | 23 | | | $ | 804 | | |
Ratio of Expenses Before Expense Limitation | | | 0.86 | % | | | N/A | | | | 1.24 | % | | | 3.82 | % | | | 3.56 | % | |
Ratio of Expenses After Expense Limitation | | | 0.84 | %(5) | | | 0.88 | %(5)(7) | | | 0.71 | %(5) | | | 0.71 | %(5) | | | 0.77 | %(5)(6) | |
Ratio of Expenses After Expense Limitation Excluding Non-Operating Expenses | | | 0.84 | %(5) | | | N/A | | | | N/A | | | | N/A | | | | N/A | | |
Ratio of Net Investment Loss | | | (0.51 | )%(5) | | | (0.02 | )%(5) | | | (0.23 | )%(5) | | | (0.41 | )%(5) | | | (0.28 | )%(5) | |
Ratio of Rebate from Morgan Stanley Affiliates | | | 0.01 | % | | | 0.01 | % | | | 0.01 | % | | | 0.01 | % | | | 0.01 | % | |
Portfolio Turnover Rate | | | 15 | % | | | 28 | % | | | 30 | % | | | 37 | % | | | 115 | % | |
(1) Reflects prior period custodian out-of-pocket expenses that were reimbursed in September 2016. The amount of the reimbursement was immaterial on a per share basis and did not impact the total return of Class IS shares. The Ratio of Expenses After Expense Limitation and the Ratio of Net Investment Loss would be unchanged as the reimbursement of custodian fees was offset against expense waivers/reimbursements with no impact to net expenses or net investment loss.
(2) Per share amount is based on average shares outstanding.
(3) Amount is less than $0.005 per share.
(4) Calculated based on the net asset value as of the last business day of the period.
(5) The Ratio of Expenses After Expense Limitation and Ratio of Net Investment Loss reflect the rebate of certain Fund expenses in connection with the investments in Morgan Stanley affiliates during the period. The effect of the rebate on the ratios is disclosed in the above table as "Ratio of Rebate from Morgan Stanley Affiliates."
(6) Effective December 7, 2015, the Adviser has agreed to limit the ratio of expenses to average net assets to the maximum ratio of 0.72% for Class IS shares. Prior to December 7, 2015, the maximum ratio was 1.03% for Class IS shares. Prior to January 23, 2015, the maximum ratio was 1.18% for Class IS shares.
(7) Effective January 1, 2018, the Adviser has agreed to limit the ratio of expenses to average net assets to the maximum ratio of 0.95% for Class IS shares. Prior to January 1, 2018, the maximum ratio was 0.72% for Class IS shares.
The accompanying notes are an integral part of the financial statements.
18
Morgan Stanley Institutional Fund, Inc.
Annual Report — December 31, 2019
Financial Highlights
Global Opportunity Portfolio
| | | Class IR | |
Selected Per Share Data and Ratios | | Year Ended
December 31, 2019 | | Period from
June 15, 2018(1) to
December 31, 2018 | |
Net Asset Value, Beginning of Period | | $ | 21.56 | | | $ | 26.67 | | |
Income (Loss) from Investment Operations: | |
Net Investment Loss(2) | | | (0.09 | ) | | | (0.06 | ) | |
Net Realized and Unrealized Gain on Investments Gain (Loss) | | | 7.75 | | | | (4.88 | ) | |
Total from Investment Operations | | | 7.66 | | | | (4.94 | ) | |
Distributions from and/or in Excess of: | |
Net Realized Gain | | | — | | | | (0.17 | ) | |
Net Asset Value, End of Period | | $ | 29.22 | | | $ | 21.56 | | |
Total Return(3) | | | 35.53 | % | | | (18.63 | )%(5) | |
Ratios to Average Net Assets and Supplemental Data: | |
Net Assets, End of Period, (Thousands) | | $ | 73,569 | | | $ | 54,284 | | |
Ratio of Expenses Before Expense Limitation | | | N/A | | | | N/A | | |
Ratio of Expenses After Expense Limitation | | | 0.84 | %(4) | | | 0.88 | %(4)(6) | |
Ratios of Expenses After Expense Limitation Excluding Non-Operating Expenses | | | 0.84 | %(4) | | | N/A | | |
Ratio of Net Investment Loss | | | (0.35 | )%(4) | | | (0.46 | )%(4)(6) | |
Ratio of Rebate from Morgan Stanley Affiliates | | | 0.01 | % | | | (0.01 | )%(6) | |
Portfolio Turnover Rate | | | 15 | % | | | 28 | % | |
(1) Commencement of Offering.
(2) Per share amount is based on average shares outstanding.
(3) Calculated based on the net asset value as of the last business day of the period.
(4) The Ratio of Expenses After Expense Limitation and Ratio of Net Investment Loss reflect the rebate of certain Fund expenses in connection with the investments in Morgan Stanley affiliates during the period. The effect of the rebate on the ratios is disclosed in the above table as "Ratio of Rebate from Morgan Stanley Affiliates."
(5) Not annualized.
(6) Annualized.
The accompanying notes are an integral part of the financial statements.
19
Morgan Stanley Institutional Fund, Inc.
Annual Report — December 31, 2019
Notes to Financial Statements
Morgan Stanley Institutional Fund, Inc. (the "Company") is registered under the Investment Company Act of 1940, as amended (the "Act"), as an open-end management investment company. The Company is comprised of thirty-two separate, active, diversified and non-diversified funds (individually referred to as a "Fund," collectively as the "Funds"). The Company applies investment company accounting and reporting guidance.
The accompanying financial statements relate to the Global Opportunity Portfolio. The Fund seeks long-term capital appreciation.
The Fund offers six classes of shares — Class I, Class A, Class L, Class C, Class IS and Class IR. On April 30, 2015, the Fund suspended offering of Class L shares. Existing Class L shareholders may invest through reinvestment of dividends and distributions.
A. Significant Accounting Policies: The following significant accounting policies are in conformity with U.S. generally accepted accounting principles ("GAAP"). Such policies are consistently followed by the Company in the preparation of its financial statements. GAAP may require management to make estimates and assumptions that affect the reported amounts and disclosures in the financial statements. Actual results may differ from those estimates.
In August 2018, the Financial Accounting Standards Board ("FASB") issued Accounting Standards Update ("ASU") 2018-13, Fair Value Measurement (Topic 820) — Disclosures Framework — Changes to Disclosure Requirements of Fair Value Measurement ("ASU 2018-13") which introduces new fair value disclosure requirements as well as eliminates and modifies certain existing fair value disclosure requirements. ASU 2018-13 would be effective for fiscal years beginning after December 15, 2019 and for interim periods within those fiscal years; however, management has elected to early adopt ASU 2018-13 as permitted by the standard. The impact of the Fund's adoption was limited to changes in the Fund's financial statement disclosures regarding fair value, primarily those disclosures related to transfers between levels of the fair value hierarchy and disclosure of the range and weighted average used to develop significant unobservable inputs for Level 3 fair value measurements, when applicable.
1. Security Valuation: (1) An equity portfolio security listed or traded on an exchange is valued at its latest reported sales price (or at the exchange official closing price if such exchange reports an official closing price), and if there were no sales on a given day and if there is no official
exchange closing price for that day, the security is valued at the mean between the last reported bid and asked prices if such bid and asked prices are available on the relevant exchanges. If only bid prices are available then the latest bid price may be used. Listed equity securities not traded on the valuation date with no reported bid and asked prices available on the exchange are valued at the mean between the current bid and asked prices obtained from one or more reputable brokers or dealers. In cases where a security is traded on more than one exchange, the security is valued on the exchange designated as the primary market; (2) all other equity portfolio securities for which over-the-counter ("OTC") market quotations are readily available are valued at the latest reported sales price (or at the market official closing price if such market reports an official closing price), and if there was no trading in the security on a given day and if there is no official closing price from relevant markets for that day, the security is valued at the mean between the last reported bid and asked prices if such bid and asked prices are available on the relevant markets. An unlisted equity security that does not trade on the valuation date and for which bid and asked prices from the relevant markets are unavailable is valued at the mean between the current bid and asked prices obtained from one or more reputable brokers or dealers; (3) certain portfolio securities may be valued by an outside pricing service/vendor approved by the Company's Board of Directors (the "Directors"). The pricing service/vendor may employ a pricing model that takes into account, among other things, bids, yield spreads and/or other market data and specific security characteristics. Alternatively, if a valuation is not available from an outside pricing service/vendor, and the security trades on an exchange, the security may be valued at its latest reported sale price (or at the exchange official closing price if such exchange reports an official closing price), prior to the time when assets are valued. If there are no sales on a given day and if there is no official exchange closing price for that day, the security is valued at the mean between the last reported bid and asked prices if such bid and asked prices are available in the relevant exchanges. If Morgan Stanley Investment Management Inc. (the "Adviser"), a wholly-owned subsidiary of Morgan Stanley, determines that the price provided by the outside pricing service/vendor or exchange does not reflect the security's fair value or is unable to provide a price, prices from brokers or dealers may also be utilized. In these circumstances, the value of
20
Morgan Stanley Institutional Fund, Inc.
Annual Report — December 31, 2019
Notes to Financial Statements (cont'd)
the security will be the mean of bid and asked prices obtained from brokers or dealers; (4) listed options are valued at the last reported sales price on the exchange on which they are listed (or at the exchange official closing price if such exchange reports an official closing price). If an official closing price or last reported sales price is unavailable, the listed option should be fair valued at the mean between its latest bid and ask prices. Unlisted options are valued at the mean between their latest bid and ask prices from a broker/dealer or valued by a pricing service/vendor; (5) when market quotations are not readily available, including circumstances under which the Adviser determines that the closing price, last sale price or the mean between the last reported bid and asked prices are not reflective of a security's market value, portfolio securities are valued at their fair value as determined in good faith under procedures established by and under the general supervision of the Directors. Occasionally, developments affecting the closing prices of securities and other assets may occur between the times at which valuations of such securities are determined (that is, close of the foreign market on which the securities trade) and the close of business of the New York Stock Exchange ("NYSE"). If developments occur during such periods that are expected to materially affect the value of such securities, such valuations may be adjusted to reflect the estimated fair value of such securities as of the close of the NYSE, as determined in good faith by the Directors or by the Adviser using a pricing service and/or procedures approved by the Directors; (6) quotations of foreign portfolio securities, other assets and liabilities and forward contracts stated in foreign currency are translated into U.S. dollar equivalents at the prevailing market rates prior to the close of the NYSE; and (7) investments in mutual funds, including the Morgan Stanley Institutional Liquidity Funds, are valued at the net asset value ("NAV") as of the close of each business day.
The Directors have responsibility for determining in good faith the fair value of the investments, and the Directors may appoint others, such as the Company's Adviser or a valuation committee, to assist the Directors in determining fair value and to make the actual calculations pursuant to the fair valuation methodologies previously approved by the Directors. Under procedures approved by the Directors, the Company's Adviser has formed a Valuation Committee whose members are approved by the Directors. The Valuation Committee
provides administration and oversight of the Company's valuation policies and procedures, which are reviewed at least annually by the Directors. These procedures allow the Company to utilize independent pricing services, quotations from securities and financial instrument dealers and other market sources to determine fair value.
2. Fair Value Measurement: FASB Accounting Standards CodificationTM ("ASC") 820, "Fair Value Measurement" ("ASC 820"), defines fair value as the value that the Fund would receive to sell an investment or pay to transfer a liability in a timely transaction with an independent buyer in the principal market, or in the absence of a principal market, the most advantageous market for the investment or liability. ASC 820 establishes a three-tier hierarchy to distinguish between (1) inputs that reflect the assumptions market participants would use in valuing an asset or liability developed based on market data obtained from sources independent of the reporting entity (observable inputs) and (2) inputs that reflect the reporting entity's own assumptions about the assumptions market participants would use in valuing an asset or liability developed based on the best information available in the circumstances (unobservable inputs) and to establish classification of fair value measurements for disclosure purposes. Various inputs are used in determining the value of the Fund's investments. The inputs are summarized in the three broad levels listed below:
• Level 1 – unadjusted quoted prices in active markets for identical investments
• Level 2 – other significant observable inputs (including quoted prices for similar investments, interest rates, prepayment speeds, credit risk, etc.)
• Level 3 – significant unobservable inputs including the Fund's own assumptions in determining the fair value of investments. Factors considered in making this determination may include, but are not limited to, information obtained by contacting the issuer, analysts, or the appropriate stock exchange (for exchange-traded securities), analysis of the issuer's financial statements or other available documents and, if necessary, available information concerning other securities in similar circumstances.
21
Morgan Stanley Institutional Fund, Inc.
Annual Report — December 31, 2019
Notes to Financial Statements (cont'd)
The inputs or methodology used for valuing securities are not necessarily an indication of the risk associated with investing in those securities and the determination of the significance of a particular input to the fair value measurement in its entirety requires judgment and considers factors specific to each security.
The following is a summary of the inputs used to value the Fund's investments as of December 31, 2019:
Investment Type | | Level 1
Unadjusted
quoted
prices
(000) | | Level 2
Other
significant
observable
inputs
(000) | | Level 3
Significant
unobservable
inputs
(000) | | Total
(000) | |
Assets: | |
Common Stocks | |
Air Freight &
Logistics | | $ | — | | | $ | 187,612 | | | $ | — | | | $ | 187,612 | | |
Banks | | | 158,348 | | | | — | | | | — | | | | 158,348 | | |
Beverages | | | 78,299 | | | | — | | | | — | | | | 78,299 | | |
Construction
Materials | | | 88,746 | | | | — | | | | — | | | | 88,746 | | |
Diversified
Consumer
Services | | | 267,393 | | | | — | | | | — | | | | 267,393 | | |
Electronic
Equipment,
Instruments &
Components | | | — | | | | 110,257 | | | | — | | | | 110,257 | | |
Entertainment | | | 54,301 | | | | — | | | | — | | | | 54,301 | | |
Food Products | | | 57,443 | | | | 79,534 | | | | — | | | | 136,977 | | |
Health Care
Equipment &
Supplies | | | 61,889 | | | | — | | | | — | | | | 61,889 | | |
Health Care
Technology | | | — | | | | — | | | | 13,521 | | | | 13,521 | | |
Hotels,
Restaurants &
Leisure | | | 26,033 | | | | — | | | | — | | | | 26,033 | | |
Household
Products | | | 38,594 | | | | — | | | | — | | | | 38,594 | | |
Information
Technology
Services | | | 551,124 | | | | — | | | | — | | | | 551,124 | | |
Interactive Media &
Services | | | 337,362 | | | | 36,952 | | | | — | | | | 374,314 | | |
Internet & Direct
Marketing Retail | | | 470,019 | | | | — | | | | — | | | | 470,019 | | |
Professional
Services | | | — | | | | 34,330 | | | | — | | | | 34,330 | | |
Road & Rail | | | 64,710 | | | | — | | | | — | | | | 64,710 | | |
Software | | | 510,904 | | | | — | | | | — | | | | 510,904 | | |
Textiles, Apparel &
Luxury Goods | | | 122,601 | | | | 133,948 | | | | — | | | | 256,549 | | |
Total Common
Stocks | | | 2,887,766 | | | | 582,633 | | | | 13,521 | | | | 3,483,920 | | |
Investment Type | | Level 1
Unadjusted
quoted
prices
(000) | | Level 2
Other
significant
observable
inputs
(000) | | Level 3
Significant
unobservable
inputs
(000) | | Total
(000) | |
Preferred Stocks | |
Electronic
Equipment,
Instruments &
Components | | $ | — | | | $ | — | | | $ | 3,359 | | | $ | 3,359 | | |
Internet & Direct
Marketing Retail | | | — | | | | — | | | | 5,144 | | | | 5,144 | | |
Total Preferred
Stocks | | | — | | | | — | | | | 8,503 | | | | 8,503 | | |
Call Options
Purchased | | | — | | | | 1,100 | | | | — | | | | 1,100 | | |
Short-Term
Investment | |
Investment
Company | | | 295,110 | | | | — | | | | — | | | | 295,110 | | |
Total Assets | | $ | 3,182,876 | | | $ | 583,733 | | | $ | 22,024 | | | $ | 3,788,633 | | |
Transfers between investment levels may occur as the markets fluctuate and/or the availability of data used in an investment's valuation changes.
Following is a reconciliation of investments in which significant unobservable inputs (Level 3) were used in determining fair value:
| | | Common
Stock
(000) | | Preferred
Stocks
(000) | |
Beginning Balance | | $ | 11,394 | | | $ | 16,235 | | |
Purchases | | | — | | | | — | | |
Sales | | | — | | | | — | | |
Amortization of discount | | | — | | | | — | | |
Transfers in | | | — | | | | — | | |
Transfers out | | | — | | | | — | | |
Corporate actions | | | — | | | | (7,786 | ) | |
Change in unrealized appreciation (depreciation) | | | 2,127 | | | | 54 | | |
Realized gains (losses) | | | — | | | | — | | |
Ending Balance | | $ | 13,521 | | | $ | 8,503 | | |
Net change in unrealized appreciation (depreciation)
from investments still held as of December 31, 2019 | | $ | 2,127 | | | $ | 54 | | |
22
Morgan Stanley Institutional Fund, Inc.
Annual Report — December 31, 2019
Notes to Financial Statements (cont'd)
The following table presents additional information about valuation techniques and inputs used for investments that are measured at fair value and categorized within Level 3 as of December 31, 2019. Various valuation techniques were used in the valuation of certain investments and weighted based on the level of significance. The Fund calculated the weighted averages of the unobservable inputs relative to each investment's fair value as of December 31, 2019.
| | | Fair Value at
December 31, 2019
(000) | | Valuation
Technique | | Unobservable
Input | | Amount or Range/
Weighted Average* | | Impact to
Valuation from an
Increase in Input** | |
Common Stock | | $ | 13,521 | | | Market Transaction Method | | Precedent Transaction | | $449.46 | | Increase | |
Preferred Stocks | | $ | 8,503 | | | Market Transaction Method | | Precedent Transaction | | $27.00 | | Increase | |
| | | | | Discounted Cash Flow | | Weighted Average
Cost of Capital | | 12.5%–24.5% / 17.5% | | Decrease | |
| | | | | | | Perpetual Growth Rate | | 3.0%–4.0% / 3.5% | | Increase | |
| | | | | Market Comparable
Companies | | Enterprise Value/Revenue | | 0.6x–15.1x / 4.9x | | Increase | |
| | | | | | | Discount for Lack of
Marketability | | 8.5%–17.0% / 11.9% | | Decrease | |
* Amount is indicative of the weighted average.
** Represents the expected directional change in the fair value of the Level 3 investments that would result from an increase in the corresponding input. A decrease to the unobservable input would have the opposite effect. Significant changes in these inputs could result in significantly higher or lower fair value measurements.
3. Foreign Currency Translation and Foreign Investments: The books and records of the Fund are maintained in U.S. dollars. Foreign currency amounts are translated into U.S. dollars as follows:
– investments, other assets and liabilities at the prevailing rate of exchange on the valuation date;
– investment transactions and investment income at the prevailing rates of exchange on the dates of such transactions.
Although the net assets of the Fund are presented at the foreign exchange rates and market values at the close of the period, the Fund does not isolate that portion of the results of operations arising as a result of changes in the foreign exchange rates from the fluctuations arising from changes in the market prices of securities held at period end. Similarly, the Fund does not isolate the effect of changes in foreign exchange rates from the fluctuations arising from changes in the market prices of securities sold during the period. Accordingly, realized and unrealized foreign currency gains (losses) on investments in securities are included in the reported net realized and unrealized gains (losses) on investment transactions and balances. However, pursuant to U.S. federal income tax regulations, gains and losses from certain foreign currency transactions and the foreign currency portion of gains and losses realized on sales and maturities of foreign denominated debt securities are
treated as ordinary income for U.S. federal income tax purposes.
Net realized gains (losses) on foreign currency transactions represent net foreign exchange gains (losses) from foreign currency forward exchange contracts, disposition of foreign currencies, currency gains (losses) realized between the trade and settlement dates on securities transactions, and the difference between the amount of investment income and foreign withholding taxes recorded on the Fund's books and the U.S. dollar equivalent amounts actually received or paid. The change in unrealized currency gains (losses) on foreign currency transactions for the period is reflected in the Statement of Operations.
Foreign security and currency transactions may involve certain considerations and risks not typically associated with those of U.S. dollar denominated transactions as a result of, among other factors, fluctuations of exchange rates in relation to the U.S. dollar, the possibility of lower levels of governmental supervision and regulation of foreign securities markets and the possibility of political or economic instability.
Governmental approval for foreign investments may be required in advance of making an investment under certain circumstances in some countries, and the extent of foreign investments in domestic companies may be subject to limitation in other countries. Foreign ownership
23
Morgan Stanley Institutional Fund, Inc.
Annual Report — December 31, 2019
Notes to Financial Statements (cont'd)
limitations also may be imposed by the charters of individual companies to prevent, among other concerns, violations of foreign investment limitations. As a result, an additional class of shares (identified as "Foreign" in the Portfolio of Investments) may be created and offered for investment. The "local" and "foreign shares" market values may differ. In the absence of trading of the foreign shares in such markets, the Fund values the foreign shares at the closing exchange price of the local shares.
4. Derivatives: The Fund may, but is not required to, use derivative instruments for a variety of purposes, including hedging, risk management, portfolio management or to earn income. Derivatives are financial instruments whose value is based, in part, on the value of an underlying asset, interest rate, index or financial instrument. Prevailing interest rates and volatility levels, among other things, also affect the value of derivative instruments. A derivative instrument often has risks similar to its underlying asset and may have additional risks, including imperfect correlation between the value of the derivative and the underlying asset, risks of default by the counterparty to certain transactions, magnification of losses incurred due to changes in the market value of the securities, instruments, indices or interest rates to which the derivative instrument relates, risks that the transactions may not be liquid and risks arising from margin requirements. The use of derivatives involves risks that are different from, and possibly greater than, the risks associated with other portfolio investments. Derivatives may involve the use of highly specialized instruments that require investment techniques and risk analyses different from those associated with other portfolio investments. All of the Fund's holdings, including derivative instruments, are marked-to-market each day with the change in value reflected in unrealized appreciation (depreciation). Upon disposition, a realized gain or loss is recognized.
Certain derivative transactions may give rise to a form of leverage. Leverage magnifies the potential for gain and the risk of loss. Leverage associated with derivative transactions may cause the Fund to liquidate portfolio positions when it may not be advantageous to do so to satisfy its obligations or to meet earmarking or segregation requirements, pursuant to applicable Securities and Exchange Commission ("SEC") rules and regulations, or may cause the Fund to be more volatile than if the Fund had not been leveraged. Although the Adviser seeks to use derivatives to further the Fund's investment
objectives, there is no assurance that the use of derivatives will achieve this result.
Following is a description of the derivative instruments and techniques that the Fund used during the period and their associated risks:
Options: With respect to options, the Fund is subject to equity risk, interest rate risk and foreign currency exchange risk in the normal course of pursuing its investment objectives. If the Fund buys an option, it buys a legal contract giving it the right to buy or sell a specific amount of the underlying instrument or foreign currency, or futures contract on the underlying instrument or foreign currency, at an agreed-upon price during a period of time or on a specified date typically in exchange for a premium paid by the Fund. The Fund may purchase and/or sell put and call options. Purchasing call options tends to increase the Fund's exposure to the underlying (or similar) instrument. Purchasing put options tends to decrease the Fund's exposure to the underlying (or similar) instrument. When entering into purchased option contracts, the Fund bears the risk of interest or exchange rates or securities prices moving unexpectedly, in which case, the Fund may not achieve the anticipated benefits of the purchased option contracts; however the risk of loss is limited to the premium paid. Purchased options are reported as part of "Total Investments in Securities" in the Statement of Assets and Liabilities. Premiums paid for purchasing options which expired are treated as realized losses. If the Fund sells an option, it sells to another party the right to buy from or sell to the Fund a specific amount of the underlying instrument or foreign currency, or futures contract on the underlying instrument or foreign currency, at an agreed-upon price during a period of time or on a specified date typically in exchange for a premium received by the Fund. When options are purchased OTC, the Fund bears the risk that the counterparty that wrote the option will be unable or unwilling to perform its obligations under the option contract. Options may also be illiquid and the Fund may have difficulty closing out its position. A decision as to whether, when and how to use options involves the exercise of skill and judgment and even a well-conceived option transaction may be unsuccessful because of market behavior or unexpected events. The prices of options can be highly volatile and the use of options can lower total returns.
24
Morgan Stanley Institutional Fund, Inc.
Annual Report — December 31, 2019
Notes to Financial Statements (cont'd)
FASB ASC 815, "Derivatives and Hedging" ("ASC 815"), is intended to improve financial reporting about derivative instruments by requiring enhanced disclosures to enable investors to better understand how and why the Fund uses derivative instruments, how these derivative instruments are accounted for and their effects on the Fund's financial position and results of operations.
The following table sets forth the fair value of the Fund's derivative contracts by primary risk exposure as of December 31, 2019:
| | | Asset Derivatives
Statement of Assets and
Liabilities Location | | Primary Risk
Exposure | | Value
(000) | |
Purchased Options | | Investments, at Value
(Purchased Options) | | Currency Risk | | $ | 1,100 | (a) | |
(a) Amounts are included in Investments in Securities in the Statement of Assets and Liabilities.
The following tables set forth by primary risk exposure the Fund's realized gains (losses) and change in unrealized appreciation (depreciation) by type of derivative contract for the year ended December 31, 2019 in accordance with ASC 815:
Realized Gain (Loss) | |
Primary Risk Exposure | | Derivative Type | | Value
(000) | |
Currency Risk | | Investments
(Purchased Options) | | | $(7,519)(b) | | |
(b) Amounts are included in Investments Sold in the Statement of Operations.
Change in Unrealized Appreciation (Depreciation) | |
Primary Risk Exposure | | Derivative Type | | Value
(000) | |
Currency Risk | | Investments
(Purchased Options) | | | $(2,008)(c) | | |
(c) Amounts are included in Investments in the Statement of Operations.
At December 31, 2019, the Fund's derivative assets and liabilities are as follows:
Gross Amounts of Assets and Liabilities
Presented in the Statement of Assets and Liabilities | |
Derivatives | | Assets(d)
(000) | | Liabilities(d)
(000) | |
Purchased Options | | $ | 1,100 | (a) | | $ | — | | |
(a) Amounts are included in Investments in Securities in the Statement of Assets and Liabilities.
(d) Absent an event of default or early termination, OTC derivative assets and liabilities are presented gross and not offset in the Statement of Assets and Liabilities.
The Fund typically enters into International Swaps and Derivatives Association, Inc. Master Agreements ("ISDA Master Agreements") or similar master agreements (collectively, "Master Agreements") with its contract
counterparties for certain OTC derivatives in order to, among other things, reduce its credit risk to counterparties. ISDA Master Agreements include provisions for general obligations, representations, collateral and events of default or termination. Under an ISDA Master Agreement, the Fund typically may offset with the counterparty certain OTC derivative financial instruments' payables and/or receivables with collateral held and/or posted and create one single net payment (close-out netting) in the event of default, termination and/or potential deterioration in the credit quality of the counterparty. Various Master Agreements govern the terms of certain transactions with counterparties, including transactions such as swap, forward, repurchase and reverse repurchase agreements. These Master Agreements typically attempt to reduce the counterparty risk associated with such transactions by specifying credit protection mechanisms and providing standardization that improves legal certainty. Cross-termination provisions under Master Agreements typically provide that a default in connection with one transaction between the Fund and a counterparty gives the non-defaulting party the right to terminate any other transactions in place with the defaulting party to create one single net payment due to/due from the defaulting party and may be a feature in certain Master Agreements. In the event the Fund exercises its right to terminate a Master Agreement after a counterparty experiences a termination event as defined in the Master Agreement, the return of collateral with market value in excess of the Fund's net liability may be delayed or denied.
The following table presents derivative financial instruments that are subject to enforceable netting arrangements as of December 31, 2019:
Gross Amounts Not Offset in the Statement of Assets and Liabilities | |
Counterparty | | Gross Asset
Derivatives
Presented in
the Statement of
Assets and
Liabilities
(000) | | Financial
Instrument
(000) | | Collateral
Received(e)
(000) | | Net Amount
(not less
than $0)
(000) | |
BNP Paribas | | $ | 2 | | | $ | — | | | $ | (2 | ) | | $ | 0 | | |
Royal Bank of Scotland | | | 1,098 | | | | — | | | | (1,098 | ) | | | 0 | | |
Total | | $ | 1,100 | (a) | | $ | — | | | $ | (1,100 | ) | | $ | 0 | | |
(a) Amounts are included in Investments in Securities in the Statement of Assets and Liabilities.
(e) In some instances, the actual collateral received may be more than the amount shown here due to overcollateralization.
25
Morgan Stanley Institutional Fund, Inc.
Annual Report — December 31, 2019
Notes to Financial Statements (cont'd)
For the year ended December 31, 2019, the approximate average monthly amount outstanding for each derivative type is as follows:
Purchased Options: | |
Average monthly notional amount | | | 1,700,498,000 | | |
5. Restricted Securities: The Fund invests in unregistered or otherwise restricted securities. The term "restricted securities" refers to securities that are unregistered or are held by control persons of the issuer and securities that are subject to contractual restrictions on their resale. As a result, restricted securities may be more difficult to value and the Fund may have difficulty disposing of such assets either in a timely manner or for a reasonable price. In order to dispose of an unregistered security, the Fund, where it has contractual rights to do so, may have to cause such security to be registered. A considerable period may elapse between the time the decision is made to sell the security and the time the security is registered so that the Fund can sell it. Contractual restrictions on the resale of securities vary in length and scope and are generally the result of a negotiation between the issuer and the acquirer of the securities. The Fund would, in either case, bear market risks during that period. Restricted securities are identified in the Portfolio of Investments.
6. Indemnifications: The Company enters into contracts that contain a variety of indemnifications. The Company's maximum exposure under these arrangements is unknown. However, the Company has not had prior claims or losses pursuant to these contracts and expects the risk of loss to be remote.
7. Dividends and Distributions to Shareholders: Dividend income and distributions to shareholders are recorded on the ex-dividend date. Dividends from net investment income, if any, are declared and paid annually. Net realized capital gains, if any, are distributed at least annually.
8. Security Transactions, Income and Expenses: Security transactions are accounted for on the trade date (date the order to buy or sell is executed). Realized gains and losses on the sale of investment securities are determined on the specific identified cost method. Dividend income and other distributions are recorded on the ex-dividend date (except for certain foreign dividends which may be recorded as soon as the Fund is informed of such dividends) net of applicable withholding taxes. Interest income is recognized on the accrual basis except where
collection is in doubt. Discounts are accreted and premiums are amortized over the life of the respective securities. Most expenses of the Company can be directly attributed to a particular Fund. Expenses which cannot be directly attributed are apportioned among the Funds based upon relative net assets or other appropriate methods. Income, expenses (other than class specific expenses — distribution and shareholder services, transfer agency and sub transfer agency fees) and realized and unrealized gains or losses are allocated to each class of shares based upon their relative net assets.
B. Advisory Fees: The Adviser, a wholly-owned subsidiary of Morgan Stanley, provides the Fund with advisory services under the terms of an Investment Advisory Agreement, paid quarterly, at the annual rate based on the daily net assets as follows:
First $750
million | | Next $750
million | | Over $1.5
billion | |
| | 0.80 | % | | | 0.75 | % | | | 0.70 | % | |
For the year ended December 31, 2019, the advisory fee rate (net of waiver/rebate) was equivalent to an annual effective rate of 0.72% of the Fund's average daily net assets.
The Adviser has agreed to reduce its advisory fee and/or reimburse the Fund so that total annual Fund operating expenses, excluding certain investment related expenses, taxes, interest and other extraordinary expenses (including litigation), will not exceed 1.00% for Class I shares, 1.35% for Class A shares, 1.40% for Class L shares, 2.10% for Class C shares, 0.95% for Class IS shares and 0.95% for Class IR shares. The fee waivers and/or expense reimbursements will continue for at least one year from the date of the Fund's prospectus or until such time as the Directors act to discontinue all or a portion of such waivers and/or reimbursements when they deem such action is appropriate. For the year ended December 31, 2019, approximately $3,000 of other expenses were reimbursed by the Adviser pursuant to this arrangement.
C. Administration Fees: The Adviser also serves as Administrator to the Company and provides administrative services pursuant to an Administration Agreement for an annual fee, accrued daily and paid monthly, of 0.08% of the Fund's average daily net assets.
Under a Sub-Administration Agreement between the Administrator and State Street Bank and Trust Company ("State Street"), State Street provides certain administrative services to the Company. For such services, the Administrator pays State
26
Morgan Stanley Institutional Fund, Inc.
Annual Report — December 31, 2019
Notes to Financial Statements (cont'd)
Street a portion of the fee the Administrator receives from the Fund.
D. Distribution and Shareholder Services Fees: Morgan Stanley Distribution, Inc. ("MSDI" or the "Distributor"), a wholly-owned subsidiary of the Adviser and an indirect subsidiary of Morgan Stanley, serves as the Company's Distributor of Fund shares pursuant to a Distribution Agreement. The Company has adopted a Shareholder Services Plan with respect to Class A shares pursuant to Rule 12b-1 under the Act. Under the Shareholder Services Plan, the Fund pays the Distributor a shareholder services fee, accrued daily and paid monthly, at an annual rate of 0.25% of the Fund's average daily net assets attributable to Class A shares.
The Company has adopted a Distribution and Shareholder Services Plan with respect to Class L shares pursuant to Rule 12b-1 under the Act. Under the Distribution and Shareholder Services Plan, the Fund pays the Distributor a distribution fee, accrued daily and paid monthly, at an annual rate of 0.50% and a shareholder services fee, accrued daily and paid monthly, at an annual rate of 0.25% of the Fund's average daily net assets attributable to Class L shares. The Distributor has agreed to waive for at least one year from the date of the Fund's prospectus or until such time that the Directors act to discontinue all or a portion of such waivers and/or reimbursements when they deem such action is appropriate, the 12b-1 fees on Class L shares of the Fund to the extent it exceeds 0.30% of the average daily net assets of such shares on an annualized basis. For the year ended December 31, 2019, this waiver amounted to approximately $174,000.
The Company has adopted a Distribution and Shareholder Services Plan with respect to Class C shares pursuant to Rule 12b-1 under the Act. Under the Distribution and Shareholder Services Plan, the Fund pays the Distributor a distribution fee, accrued daily and paid monthly, at an annual rate of 0.75% and a shareholder services fee, accrued daily and paid monthly, at an annual rate of 0.25% of the Fund 's average daily net assets attributable to Class C shares.
The distribution and shareholder services fees are used to support the expenses associated with servicing and maintaining accounts. The Distributor may compensate other parties for providing shareholder support services to investors who purchase Class A, Class L and Class C shares.
E. Dividend Disbursing and Transfer Agent: The Company's dividend disbursing and transfer agent is DST
Asset Manager Solutions, Inc. ("DST"). Pursuant to a Transfer Agency Agreement, the Company pays DST a fee based on the number of classes, accounts and transactions relating to the Funds of the Company.
F. Custodian Fees: State Street (the "Custodian") also serves as Custodian for the Company in accordance with a Custodian Agreement. The Custodian holds cash, securities and other assets of the Company as required by the Act. Custody fees are payable monthly based on assets held in custody, investment purchases and sales activity and account maintenance fees, plus reimbursement for certain out-of-pocket expenses.
G. Security Transactions and Transactions with Affiliates: For the year ended December 31, 2019, purchases and sales of investment securities for the Fund, other than long-term U.S. Government securities and short-term investments were approximately $699,116,000 and $432,791,000, respectively. There were no purchases and sales of long-term U.S. Government securities for the year ended December 31, 2019.
The Fund invests in the Institutional Class of the Morgan Stanley Institutional Liquidity Funds — Treasury Securities Portfolio (the "Liquidity Funds"), an open-end management investment company managed by the Adviser. Advisory fees paid by the Fund are reduced by an amount equal to its pro-rata share of the advisory and administration fees paid by the Liquidity Funds. For the year ended December 31, 2019, advisory fees paid were reduced by approximately $450,000 relating to the Fund's investment in the Liquidity Funds.
A summary of the Fund's transactions in shares of affiliated investments during the year ended December 31, 2019 is as follows:
Affiliated
Investment
Company | | Value
December 31,
2018
(000) | | Purchases
at Cost
(000) | | Proceeds
from Sales
(000) | | Dividend
Income
(000) | |
Liquidity Funds | | $ | 122,351 | | | $ | 745,459 | | | $ | 572,700 | | | $ | 4,699 | | |
Affiliated
Investment
Company (cont'd) | | Realized
Gain (Loss)
(000) | | Change in
Unrealized
Appreciation
(Depreciation)
(000) | | Value
December 31,
2019
(000) | |
Liquidity Funds | | $ | — | | | $ | — | | | $ | 295,110 | | |
The Fund is permitted to purchase and sell securities ("cross-trade") from and to other Morgan Stanley funds as well as other funds and client accounts for which the Adviser or an affiliate of the Adviser serves as investment adviser, pursuant to
27
Morgan Stanley Institutional Fund, Inc.
Annual Report — December 31, 2019
Notes to Financial Statements (cont'd)
procedures approved by the Directors in compliance with Rule 17a-7 under the Act (the "Rule"). Each cross-trade is executed at the current market price in compliance with provisions of the Rule. For the year ended December 31, 2019, the Fund did not engage in any cross-trade transactions.
The Fund has an unfunded Deferred Compensation Plan (the "Compensation Plan"), which allows each independent Director to defer payment of all, or a portion, of the fees he or she receives for serving on the Board of Directors. Each eligible Director generally may elect to have the deferred amounts credited with a return equal to the total return on one or more of the Morgan Stanley funds that are offered as investment options under the Compensation Plan. Appreciation/depreciation and distributions received from these investments are recorded with an offsetting increase/decrease in the deferred compensation obligation and do not affect the NAV of the Fund.
H. Federal Income Taxes: It is the Fund's intention to continue to qualify as a regulated investment company and distribute all of its taxable and tax-exempt income. Accordingly, no provision for federal income taxes is required in the financial statements.
The Fund may be subject to taxes imposed by countries in which it invests. Such taxes are generally based on income and/or capital gains earned or repatriated. Taxes are accrued based on net investment income, net realized gains and net unrealized appreciation as such income and/or gains are earned. Taxes may also be based on transactions in foreign currency and are accrued based on the value of investments denominated in such currency.
FASB ASC 740-10, "Income Taxes — Overall", sets forth a minimum threshold for financial statement recognition of the benefit of a tax position taken or expected to be taken in a tax return. Management has concluded there are no significant uncertain tax positions that would require recognition in the financial statements. If applicable, the Fund recognizes interest accrued related to unrecognized tax benefits in "Interest Expense" and penalties in "Other Expenses" in the Statement of Operations. The Fund files tax returns with the U.S. Internal Revenue Service, New York and various states. Generally, each of the tax years in the four-year period ended December 31, 2019 remains subject to examination by taxing authorities.
The tax character of distributions paid may differ from the character of distributions shown for GAAP purposes due to short-term capital gains being treated as ordinary income for
tax purposes. The tax character of distributions paid during fiscal years 2019 and 2018 was as follows:
2019
Distributions
Paid From: | | 2018
Distributions
Paid From: | |
Ordinary
Income
(000) | | Long-Term
Capital Gain
(000) | | Ordinary
Income
(000) | | Long-Term
Capital Gain
(000) | |
| $ | — | | | $ | — | | | $ | 12,718 | | | $ | 6,448 | | |
The amount and character of income and gains to be distributed are determined in accordance with income tax regulations which may differ from GAAP. These book/tax differences are either considered temporary or permanent in nature.
Temporary differences are attributable to differing book and tax treatments for the timing of the recognition of gains (losses) on certain investment transactions and the timing of the deductibility of certain expenses.
Permanent differences, primarily due to a net operating loss, resulted in the following reclassifications among the components of net assets at December 31, 2019:
Total
Distributable
Earnings
(000) | | Paid-in
Capital
(000) | |
| $ | 18,982 | | | $ | (18,982 | ) | |
At December 31, 2019, the Fund had no distributable earnings on a tax basis.
At December 31, 2019, the Fund had available for federal income tax purposes unused short-term capital losses of approximately $50,341,000 that do not have an expiration date.
To the extent that capital loss carryforwards are used to offset any future capital gains realized, no capital gains tax liability will be incurred by the Fund for gains realized and not distributed. To the extent that capital gains are offset, such gains will not be distributed to the shareholders.
Qualified late year losses are capital losses and specified ordinary losses, including currency losses, incurred after October 31 but within the taxable year that, if elected, are deemed to arise on the first day of the Fund's next taxable year. For the year ended December 31, 2019, the Fund intends to defer to January 1, 2020 for U.S. federal income tax purposes the following losses:
Qualified Late
Year Ordinary
Losses
(000) | | Post-October
Capital Losses
(000) | |
| $ | 12,127 | | | $ | — | | |
28
Morgan Stanley Institutional Fund, Inc.
Annual Report — December 31, 2019
Notes to Financial Statements (cont'd)
I. Credit Facility: The Company and other Morgan Stanley funds participated in a $150,000,000 committed, unsecured revolving line of credit facility (the "Facility") with State Street. Effective April 22, 2019, the committed line amount increased to $300,000,000. This Facility is to be used for temporary emergency purposes or funding of shareholder redemption requests. The interest rate on borrowings is based on the federal funds rate or 1 month LIBOR rate plus a spread. The Facility also has a commitment fee of 0.25% per annum based on the unused portion of the Facility. During the year ended December 31, 2019, the Fund did not have any borrowings under the Facility.
J. Other: At December 31, 2019, the Fund had record owners of 10% or greater. Investment activities of these shareholders could have a material impact on the Fund. The aggregate percentage of such owners was 33.8%.
29
Morgan Stanley Institutional Fund, Inc.
Annual Report — December 31, 2019
Report of Independent Registered Public Accounting Firm
To the Shareholders and Board of Directors of
Morgan Stanley Institutional Fund, Inc. —
Global Opportunity Portfolio
Opinion on the Financial Statements
We have audited the accompanying statement of assets and liabilities of Global Opportunity Portfolio (the "Fund") (one of the funds constituting Morgan Stanley Institutional Fund, Inc. (the "Company")), including the portfolio of investments, as of December 31, 2019, and the related statement of operations for the year then ended, the statements of changes in net assets for each of the two years in the period then ended, the financial highlights for each of the five years in the period then ended and the related notes (collectively referred to as the "financial statements"). In our opinion, the financial statements present fairly, in all material respects, the financial position of Global Opportunity Portfolio (one of the funds constituting Morgan Stanley Institutional Fund, Inc.) at December 31, 2019, the results of its operations for the year then ended, the changes in its net assets for each of the two years in the period then ended and its financial highlights for each of the five years in the period then ended, in conformity with U.S. generally accepted accounting principles.
Basis for Opinion
These financial statements are the responsibility of the Company's management. Our responsibility is to express an opinion on the Fund's financial statements based on our audits. We are a public accounting firm registered with the Public Company Accounting Oversight Board (United States) ("PCAOB") and are required to be independent with respect to the Company in accordance with the U.S. federal securities law and the applicable rules and regulations of the Securities and Exchange Commission and the PCAOB.
We conducted our audits in accordance with the standards of the PCAOB. Those standards require that we plan and perform the audit to obtain reasonable assurance about whether the financial statements are free of material misstatement, whether due to error or fraud. The Company is not required to have, nor were we engaged to perform, an audit of the Company's internal control over financial reporting. As part of our audits, we are required to obtain an understanding of internal control over financial reporting, but not for the purpose of expressing an opinion on the effectiveness of the Company's internal control over financial reporting. Accordingly, we express no such opinion.
Our audits included performing procedures to assess the risks of material misstatement of the financial statements, whether due to error or fraud, and performing procedures that respond to those risks. Such procedures included examining, on a test basis, evidence regarding the amounts and disclosures in the financial statements. Our procedures included confirmation of securities owned as of December 31, 2019 by correspondence with the custodian and others or by other appropriate auditing procedures where replies from others were not received. Our audits also included evaluating the accounting principles used and significant estimates made by management, as well as evaluating the overall presentation of the financial statements. We believe that our audits provide a reasonable basis for our opinion.

We have served as the auditor of one or more Morgan Stanley investment companies since 2000.
Boston, Massachusetts
February 27, 2020
30
Privacy Notice (unaudited) April 2019
FACTS | | WHAT DOES MSIM DO WITH YOUR PERSONAL INFORMATION? | |
Why? | | Financial companies choose how they share your personal information. Federal law gives consumers the right to limit some but not all sharing. Federal law also requires us to tell you how we collect, share, and protect your personal information. Please read this notice carefully to understand what we do. | |
What? | | The types of personal information we collect and share depend on the product or service you have with us. This information can include:
n Social Security number and income
n investment experience and risk tolerance
n checking account number and wire transfer instructions | |
How? | | All financial companies need to share customers' personal information to run their everyday business. In the section below, we list the reasons financial companies can share their customers' personal information; the reasons MSIM chooses to share; and whether you can limit this sharing. | |
Reasons we can share your personal information | | Does MSIM share? | | Can you limit this sharing? | |
For our everyday business purposes —
such as to process your transactions, maintain your account(s), respond to court orders and legal investigations, or report to credit bureaus | | Yes | | No | |
For our marketing purposes —
to offer our products and services to you | | Yes | | No | |
For joint marketing with other financial companies | | No | | We don't share | |
For our affiliates' everyday business purposes —
information about your transactions and experiences | | Yes | | No | |
For our affiliates' everyday business purposes —
information about your creditworthiness | | No | | We don't share | |
For our affiliates to market to you | | No | | We don't share | |
For non-affiliates to market to you | | No | | We don't share | |
Questions?
Call toll-free (844) 312-6327 or email: imprivacyinquiries@morganstanley.com
31
Privacy Notice (unaudited) (cont'd) April 2019
Who we are
Who is providing this notice? | | Morgan Stanley Investment Management, Inc. and its affiliated registered investment advisers, registered broker-dealers, and registered and unregistered funds ("MSIM") | |
What we do
How does MSIM protect my personal information? | | To protect your personal information from unauthorized access and use, we use security measures that comply with federal law. These measures include computer safeguards and secured files and buildings. We have policies governing the proper handling of customer information by personnel and requiring third parties that provide support to adhere to appropriate security standards with respect to such information. | |
How does MSIM collect my personal information? | | We collect your personal information, for example, when you
n open an account or make deposits or withdrawals from your account
n buy securities from us or make a wire transfer
n give us your contact information
We also collect your personal information from others, such as credit bureaus, affiliates, or other companies. | |
Why can't I limit all sharing? | | Federal law gives you the right to limit only
n sharing for affiliates' everyday business purposes — information about your creditworthiness
n affiliates from using your information to market to you
n sharing for non-affiliates to market to you
State laws and individual companies may give you additional rights to limit sharing. See below for more on your rights under state law. | |
Definitions
Affiliates | | Companies related by common ownership or control. They can be financial and non-financial companies.
n Our affiliates include companies with a Morgan Stanley name and financial companies such as Morgan Stanley Smith Barney LLC and Morgan Stanley & Co. | |
Non-affiliates | | Companies not related by common ownership or control. They can be financial and non-financial companies.
n MSIM does not share with non-affiliates so they can market to you. | |
Joint marketing | | A formal agreement between non-affiliated financial companies that together market financial products or services to you.
n MSIM doesn't jointly market | |
Other important information
Vermont: Except as permitted by law, we will not share personal information we collect about Vermont residents with Non-affiliates unless you provide us with your written consent to share such information.
California: Except as permitted by law, we will not share personal information we collect about California residents with Non-affiliates and we will limit sharing such personal information with our Affiliates to comply with California privacy laws that apply to us.
32
Morgan Stanley Institutional Fund, Inc.
Annual Report — December 31, 2019
Director and Officer Information (unaudited)
Independent Directors:
Name, Birth Year
and Address of
Independent Director | | Position(s)
Held with
Registrant | | Length of Time
Served* | | Principal Occupation(s) During Past 5 Years
and Other Relevant Professional Experience | | Number of
Funds in Fund
Complex
Overseen by
Independent
Director** | | Other Directorships
Held by Independent
Director*** | |
Frank L. Bowman
c/o Perkins Coie LLP
Counsel to the Independent Directors
1155 Avenue of the Americas
New York, NY 10036
Birth Year 1944 | | Director | | Since August 2006 | | President, Strategic Decisions, LLC (consulting) (since February 2009); Director or Trustee of various Morgan Stanley Funds (since August 2006); Chairperson of the Compliance and Insurance Committee (since October 2015); formerly, Chairperson of the Insurance Sub-Committee of the Compliance and Insurance Committee (2007-2015); served as President and Chief Executive Officer of the Nuclear Energy Institute (policy organization) (February 2005-November 2008); retired as Admiral, U.S. Navy after serving over 38 years on active duty including 8 years as Director of the Naval Nuclear Propulsion Program in the Department of the Navy and the U.S. Department of Energy (1996-2004); served as Chief of Naval Personnel (July 1994-September 1996) and on the Joint Staff as Director of Political Military Affairs (June 1992-July 1994); knighted as Honorary Knight Commander of the Most Excellent Order of the British Empire; awarded the Officier de l'Orde National du Mérite by the French Government; elected to the National Academy of Engineering (2009). | | | 86 | | | Director of Naval and Nuclear Technologies LLP; Director Emeritus of the Armed Services YMCA; Member of the National Security Advisory Council of the Center for U.S. Global Engagement and a member of the CNA Military Advisory Board; Trustee of Fairhaven United Methodist Church; Member of the Board of Advisors of the Dolphin Scholarship Foundation; Director of other various non-profit organizations; formerly, Director of BP p.l.c. (November 2010-May 2019). | |
Kathleen A. Dennis
c/o Perkins Coie LLP
Counsel to the Independent Directors
1155 Avenue of the Americas
New York, NY 10036
Birth Year 1953 | | Director | | Since August 2006 | | President, Cedarwood Associates (mutual fund and investment management consulting) (since July 2006); Chairperson of the Liquidity and Alternatives Sub-Committee of the Investment Committee (since October 2006) and Director or Trustee of various Morgan Stanley Funds (since August 2006); formerly, Senior Managing Director of Victory Capital Management (1993-2006). | | | 86 | | | Director of various non-profit organizations. | |
Nancy C. Everett
c/o Perkins Coie LLP
Counsel to the Independent Directors
1155 Avenue of the Americas
New York, NY 10036
Birth Year 1955 | | Director | | Since January 2015 | | Chief Executive Officer, Virginia Commonwealth University Investment Company (since November 2015); Owner, OBIR, LLC (institutional investment management consulting) (since June 2014); formerly, Managing Director, BlackRock, Inc. (February 2011-December 2013); and Chief Executive Officer, General Motors Asset Management (a/k/a Promark Global Advisors, Inc.) (June 2005-May 2010). | | | 87 | | | Formerly, Member of Virginia Commonwealth University School of Business Foundation (2005-2016); Member of Virginia Commonwealth University Board of Visitors (2013-2015); Member of Committee on Directors for Emerging Markets Growth Fund, Inc. (2007-2010); Chairperson of Performance Equity Management, LLC (2006-2010); and Chairperson, GMAM Absolute Return Strategies Fund, LLC (2006-2010). | |
33
Morgan Stanley Institutional Fund, Inc.
Annual Report — December 31, 2019
Director and Officer Information (unaudited) (cont'd)
Independent Directors: (cont'd)
Name, Birth Year
and Address of
Independent Director | | Position(s)
Held with
Registrant | | Length of Time
Served* | | Principal Occupation(s) During Past 5 Years
and Other Relevant Professional Experience | | Number of
Funds in Fund
Complex
Overseen by
Independent
Director** | | Other Directorships
Held by Independent
Director*** | |
Jakki L. Haussler
c/o Perkins Coie LLP
Counsel to the Independent Directors
1155 Avenue of the Americas
New York, NY 10036
Birth Year 1957 | | Director | | Since January 2015 | | Chairman, Opus Capital Group (since 1996); formerly, Chief Executive Officer, Opus Capital Group (1996-2019); Director, Capvest Venture Fund, LP (May 2000-December 2011); Partner, Adena Ventures, LP (July 1999-December 2010); Director, The Victory Funds (February 2005-July 2008). | | | 87 | | | Director of Service Corporation International and Member, Audit Committee and Investment Committee; Director of Cincinnati Bell Inc. and Member, Audit Committee and Governance and Nominating Committee; Chairman of Northern Kentucky University Member Investment Committee; Member of Chase College of Law Transactional Law Practice Center Board of Advisors; Director of Best Transport; Director of Chase College of Law Board of Visitors; formerly, Member, University of Cincinnati Foundation Investment Committee; Member, Miami University Board of Visitors (2008-2011); Trustee of Victory Funds (2005-2008) and Chairman, Investment Committee (2007-2008) and Member, Service Provider Committee (2005-2008). | |
Dr. Manuel H. Johnson
c/o Johnson Smick International, Inc.
220 I Street, NE — Suite 200
Washington, D.C. 20002
Birth Year 1949 | | Director | | Since July 1991 | | Senior Partner, Johnson Smick International, Inc. (consulting firm); Chairperson of the Investment Committee (since October 2006) and Director or Trustee of various Morgan Stanley Funds (since July 1991); Co-Chairman and a founder of the Group of Seven Council (G7C) (international economic commission); formerly, Chairperson of the Audit Committee (July 1991-September 2006), Vice Chairman of the Board of Governors of the Federal Reserve System and Assistant Secretary of the U.S. Treasury. | | | 86 | | | Director of NVR, Inc. (home construction). | |
Joseph J. Kearns
c/o Perkins Coie LLP
Counsel to the Independent Directors
1155 Avenue of the Americas
New York, NY 10036
Birth Year 1942 | | Director | | Since August 1994 | | Senior Adviser, Kearns & Associates LLC (investment consulting); Chairperson of the Audit Committee (since October 2006) and Director or Trustee of various Morgan Stanley Funds (since August 1994); formerly, Deputy Chairperson of the Audit Committee (July 2003-September 2006) and Chairperson of the Audit Committee of various Morgan Stanley Funds (since August 1994); CFO of the J. Paul Getty Trust. | | | 87 | | | Prior to August 10, 2016, Director of Electro Rent Corporation (equipment leasing); Prior to December 31, 2013, Director of The Ford Family Foundation. | |
34
Morgan Stanley Institutional Fund, Inc.
Annual Report — December 31, 2019
Director and Officer Information (unaudited) (cont'd)
Independent Directors: (cont'd)
Name, Birth Year
and Address of
Independent Director | | Position(s)
Held with
Registrant | | Length of Time
Served* | | Principal Occupation(s) During Past 5 Years
and Other Relevant Professional Experience | | Number of
Funds in Fund
Complex
Overseen by
Independent
Director** | | Other Directorships
Held by Independent
Director*** | |
Michael F. Klein
c/o Perkins Coie LLP
Counsel to the Independent Directors
1155 Avenue of the Americas
New York, NY 10036
Birth Year 1958 | | Director | | Since August 2006 | | Managing Director, Aetos Alternatives Management, LP (since March 2000); Co-President, Aetos Alternatives Management, LP (since January 2004) and Co-Chief Executive Officer of Aetos Alternatives Management, LP (since August 2013); Chairperson of the Fixed Income Sub-Committee of the Investment Committee (since October 2006) and Director or Trustee of various Morgan Stanley Funds (since August 2006); formerly, Managing Director, Morgan Stanley & Co. Inc. and Morgan Stanley Dean Witter Investment Management and President, various Morgan Stanley Funds (June 1998-March 2000); Principal, Morgan Stanley & Co. Inc. and Morgan Stanley Dean Witter Investment Management (August 1997-December 1999). | | | 86 | | | Director of certain investment funds managed or sponsored by Aetos Alternatives Management, LP; Director of Sanitized AG and Sanitized Marketing AG (specialty chemicals). | |
Patricia Maleski
c/o Perkins Coie LLP
Counsel to the Independent Directors
1155 Avenue of the Americas
New York, NY 10036
Birth Year 1960 | | Director | | Since January 2017 | | Managing Director, JPMorgan Asset Management (2004-2016); Oversight and Control Head of Fiduciary and Conflicts of Interest Program (2015-2016); Chief Control Officer-Global Asset Management (2013-2015); President, JPMorgan Funds (2010-2013); Chief Administrative Officer (2004-2013); various other positions including Treasurer and Board Liaison (since 2001). | | | 87 | | | None. | |
Michael E. Nugent
522 Fifth Avenue
New York, NY 10036
Birth Year 1936 | | Chair of the Board and Director | | Chair of the Boards since July 2006 and Director since July 1991 | | Chair of the Boards of various Morgan Stanley Funds (since July 2006); Chairperson of the Governance Committee (since January 2019) and Director or Trustee of various Morgan Stanley Funds (since July 1991); formerly, Chairperson of each of the Closed-End Fund committee (until December 2019) and the Insurance Committee (until July 2006); General Partner, Triumph Capital, L.P. (private investment partnership) (1988-2013). | | | 86 | | | None. | |
W. Allen Reed
c/o Perkins Coie LLP
Counsel to the Independent Directors
1155 Avenue of the Americas
New York, NY 10036
Birth Year 1947 | | Vice Chair of the Board and Director | | Vice Chair of the Boards since January 2020 and Director since August 2006 | | Chairperson of the Equity Sub-Committee of the Investment Committee (since October 2006) and Director or Trustee of various Morgan Stanley Funds (since August 2006); formerly, President and CEO of General Motors Asset Management; Chairman and Chief Executive Officer of the GM Trust Bank and Corporate Vice President of General Motors Corporation (August 1994-December 2005). | | | 86 | | | Formerly, Director of Legg Mason, Inc.; formerly, Director of the Auburn University Foundation (2010-2015). | |
* This is the earliest date the Director began serving the Morgan Stanley Funds. Each Director serves an indefinite term, until his or her successor is elected.
** The Fund Complex includes (as of December 31, 2019) all open-end and closed-end funds (including all of their portfolios) advised by Morgan Stanley Investment Management Inc. (the "Adviser") and any funds that have an adviser that is an affiliated person of the Adviser (including, but not limited to, Morgan Stanley AIP GP LP).
*** This includes any directorships at public companies and registered investment companies held by the Director at any time during the past five years.
35
Morgan Stanley Institutional Fund, Inc.
Annual Report — December 31, 2019
Director and Officer Information (unaudited) (cont'd)
Executive Officers:
Name, Birth Year and Address of
Executive Officer | | Position(s)
Held with
Registrant | | Length of Time
Served* | | Principal Occupation(s) During Past 5 Years | |
John H. Gernon
522 Fifth Avenue
New York, NY 10036
Birth Year 1963 | | President and Principal Executive Officer | | Since September 2013 | | President and Principal Executive Officer of the Equity and Fixed Income Funds and the Morgan Stanley AIP Funds (since September 2013) and the Liquidity Funds and various money market funds (since May 2014) in the Fund Complex; Managing Director of the Adviser; Head of Product (since 2006). | |
Timothy J. Knierim
522 Fifth Avenue
New York, NY 10036
Birth Year 1959 | | Chief Compliance Officer | | Since December 2016 | | Managing Director of the Adviser and various entities affiliated with the Adviser; Chief Compliance Officer of various Morgan Stanley Funds and the Adviser (since December 2016) and Chief Compliance Officer of Morgan Stanley AIP GP LP (since 2014). Formerly, Managing Director and Deputy Chief Compliance Officer of the Adviser (2014-2016); and formerly, Chief Compliance Officer of Prudential Investment Management, Inc. (2007-2014). | |
Francis J. Smith
522 Fifth Avenue
New York, NY 10036
Birth Year 1965 | | Treasurer and Principal Financial Officer | | Treasurer since July 2003 and Principal Financial Officer since September 2002 | | Managing Director of the Adviser and various entities affiliated with the Adviser; Treasurer (since July 2003) and Principal Financial Officer of various Morgan Stanley Funds (since September 2002). | |
Mary E. Mullin
522 Fifth Avenue
New York, NY 10036
Birth Year 1967 | | Secretary | | Since June 1999 | | Managing Director of the Adviser; Secretary of various Morgan Stanley Funds (since June 1999). | |
Michael J. Key
522 Fifth Avenue
New York, NY 10036
Birth Year 1979 | | Vice President | | Since June 2017 | | Vice President of the Equity and Fixed Income Funds, Liquidity Funds, various money market funds and the Morgan Stanley AIP Funds in the Fund Complex (since June 2017); Executive Director of the Adviser; Head of Product Development for Equity and Fixed Income Funds (since August 2013). | |
* This is the earliest date the officer began serving the Morgan Stanley Funds. Each officer serves a one-year term, until his or her successor is elected and qualifies.
36
Morgan Stanley Institutional Fund, Inc.
Annual Report — December 31, 2019
Adviser and Administrator
Morgan Stanley Investment Management Inc.
522 Fifth Avenue
New York, New York 10036
Distributor
Morgan Stanley Distribution, Inc.
522 Fifth Avenue
New York, New York 10036
Dividend Disbursing and Transfer Agent
DST Asset Manager Solutions, Inc.
2000 Crown Colony Drive
Quincy, Massachusetts 02169
Custodian
State Street Bank and Trust Company
One Lincoln Street
Boston, Massachusetts 02111
Legal Counsel
Dechert LLP
1095 Avenue of the Americas
New York, New York 10036
Counsel to the Independent Directors
Perkins Coie LLP
1155 Avenue of the Americas
New York, New York 10036
Independent Registered Public Accounting Firm
Ernst & Young LLP
200 Clarendon Street
Boston, Massachusetts 02116
Reporting to Shareholders
Each Morgan Stanley fund provides a complete schedule of portfolio holdings in its Semi-Annual and the Annual Reports within 60 days of the end of the fund's second and fourth fiscal quarters. The Semi-Annual and Annual Reports are filed electronically with the Securities and Exchange Commission ("SEC") on Form N-CSRS and Form N-CSR, respectively. Morgan Stanley also delivers the Semi-Annual and Annual Reports to fund shareholders and makes these reports available on its public website, www.morganstanley.com/im/shareholderreports. Each Morgan Stanley non-money market fund also files a complete schedule of portfolio holdings with the SEC for the fund's first and third fiscal quarters as an attachment to Form N-PORT. Morgan Stanley does not deliver the reports for the first and third fiscal quarters to shareholders, nor are the reports posted to the Morgan Stanley public website. However, the holdings for each money market fund are posted to the Morgan Stanley public website. You may obtain the Form N-PORT filings (as well as the Form N-CSR and N-CSRS filings) by accessing the SEC's website, www.sec.gov. You can also request copies of these materials, upon payment of a duplicating fee, by electronic request at the SEC's email address (publicinfo@sec.gov).
Proxy Voting Policies and Procedures and Proxy Voting Record
You may obtain a copy of the Company's Proxy Voting Policy and Procedures and information regarding how the Company voted proxies relating to portfolio securities during the most recent twelve-month period ended June 30, without charge, upon request, by calling toll free 1 (800) 548-7786 or by visiting our website at www.morganstanley.com/im/shareholderreports. This information is also available on the SEC's website at www.sec.gov.
This report is authorized for distribution only when preceded or accompanied by a prospectus or summary prospectus of the applicable fund of Morgan Stanley Institutional Fund, Inc., which describes in detail the fund's investment policies, risks, fees and expenses. Please read the prospectus carefully before you invest or send money. For additional information, including information regarding the investments comprising the Fund, please visit our website at www.morganstanley.com/im/shareholderreports or call toll free 1 (800) 548-7786.
37
Printed in U.S.A.
This Report has been prepared for shareholders and may be distributed to others only if preceded or accompanied by a current prospectus.
Morgan Stanley Investment Management Inc.
522 Fifth Avenue
New York, New York 10036
© 2020 Morgan Stanley. Morgan Stanley Distribution, Inc.

IFIGOANN
2920392 EXP. 02.28.21

Morgan Stanley Institutional Fund, Inc.
Global Real Estate Portfolio
Annual Report
December 31, 2019
Beginning on January 1, 2021, as permitted by regulations adopted by the Securities and Exchange Commission ("SEC"), paper copies of the Fund's Annual and Semi-Annual Reports to Shareholders ("Shareholder Reports") will no longer be sent by mail, unless you specifically request paper copies of the Shareholder Reports from the Fund or from your financial intermediary, such as a broker-dealer or a bank. Instead, the Shareholder Reports will be made available on the Fund's website, https://www.morganstanley.com/im/shareholderreports and you will be notified by mail each time a Shareholder Report is posted and provided with a website link to access the Shareholder Report. If you already elected to receive Shareholder Reports electronically, you will not be affected by this change and you need not take any action. You may elect to receive Shareholder Reports and other communications from the Fund electronically anytime by contacting your financial intermediary or, if you are a direct investor, please follow the instructions on the envelope.
Beginning on January 1, 2019, you may elect to receive all future Shareholder Reports in paper free of charge. If you invest through a financial intermediary, you can contact your financial intermediary to request that you continue to receive paper copies of your Shareholder Reports. If you invest directly with the Fund, please follow the instructions on the envelope to let the Fund know you wish to continue receiving paper copies of your Shareholder Reports. Your election to receive Shareholder Reports in paper will apply to all funds held in your account if you invest through your financial intermediary or all funds held with the fund complex if you invest directly with a fund.

Morgan Stanley Institutional Fund, Inc.
Annual Report — December 31, 2019
Shareholders' Letter | | | 2 | | |
Expense Example | | | 3 | | |
Investment Overview | | | 4 | | |
Portfolio of Investments | | | 8 | | |
Statement of Assets and Liabilities | | | 11 | | |
Statement of Operations | | | 13 | | |
Statements of Changes in Net Assets | | | 14 | | |
Financial Highlights | | | 16 | | |
Notes to Financial Statements | | | 22 | | |
Report of Independent Registered Public Accounting Firm | | | 29 | | |
Federal Tax Notice | | | 30 | | |
Privacy Notice | | | 31 | | |
Director and Officer Information | | | 33 | | |
This report is authorized for distribution only when preceded or accompanied by a prospectus or summary prospectus of the applicable Fund of Morgan Stanley Institutional Fund, Inc. To receive a prospectus and/or statement of additional information ("SAI"), which contains more complete information such as investment objectives, charges, expenses, policies for voting proxies, risk considerations and describes in detail each of the Fund's investment policies to the prospective investor, please call toll free 1 (800) 548-7786. Please read the prospectuses carefully before you invest or send money.
Additionally, you can access information about the Fund, including performance, characteristics and investment team commentary, through Morgan Stanley Investment Management's website: www.morganstanley.com/im/shareholderreports.
Market forecasts provided in this report may not necessarily come to pass. There is no guarantee that any sectors mentioned will continue to perform as discussed herein or that securities in such sectors will be held by the Fund in the future. There is no assurance that a fund will achieve its investment objective. Funds are subject to market risk, which is the possibility that market values of securities owned by the Fund will decline and, therefore, the value of the Fund's shares may be less than what you paid for them. Accordingly, you can lose money investing in this Fund. Please see the prospectus for more complete information on investment risks.
1
Morgan Stanley Institutional Fund, Inc.
Annual Report — December 31, 2019
Shareholders' Letter (unaudited)
Dear Shareholders,
We are pleased to provide this Annual Report, in which you will learn how your investment in Global Real Estate Portfolio (the "Fund") performed during the latest twelve-month period.
Morgan Stanley Investment Management is a client-centric, investor-led organization. Our global presence, intellectual capital, and breadth of products and services enable us to partner with investors to meet the evolving challenges of today's financial markets. We aim to deliver superior investment service and to empower our clients to make the informed decisions that help them reach their investment goals.
As always, we thank you for selecting Morgan Stanley Investment Management, and look forward to working with you in the months and years ahead.
Sincerely,

John H. Gernon
President and Principal Executive Officer
January 2020
2
Morgan Stanley Institutional Fund, Inc.
Annual Report — December 31, 2019
Expense Example (unaudited)
Global Real Estate Portfolio
As a shareholder of the Fund, you incur two types of costs: (1) transactional costs; and (2) ongoing costs, which may include advisory fees, administration fees, distribution and shareholder services fees and other Fund expenses. This example is intended to help you understand your ongoing costs (in dollars) of investing in the Fund and to compare these costs with the ongoing costs of investing in other mutual funds.
This example is based on an investment of $1,000 invested at the beginning of the six-month period ended December 31, 2019 and held for the entire six-month period.
Actual Expenses
The table below provides information about actual account values and actual expenses. You may use the information in this table, together with the amount you invested, to estimate the expenses that you paid over the period. Simply divide your account value by $1,000 (for example, an $8,600 account value divided by $1,000 = 8.6), then multiply the result by the number in the table under the heading entitled "Actual Expenses Paid During Period" to estimate the expenses you paid on your account during this period.
Hypothetical Example for Comparison Purposes
The table below provides information about hypothetical account values and hypothetical expenses based on the Fund's actual expense ratio and an assumed rate of return of 5% per year before expenses, which is not the Fund's actual return. The hypothetical account values and expenses may not be used to estimate the actual ending account balance or expenses you paid for the period. You may use this information to compare the ongoing costs of investing in the Fund and other funds. To do so, compare this 5% hypothetical example with the 5% hypothetical examples that appear in the shareholder reports of the other funds.
Please note that the expenses shown in the table are meant to highlight your ongoing costs only and do not reflect any transactional costs, such as sales charges (loads). Therefore, the information for each class in the table is useful in comparing ongoing costs only, and will not help you determine the relative total costs of owning different funds. In addition, if these transactional costs were included, your costs would have been higher.
| | | Beginning
Account
Value
7/1/19 | | Actual Ending
Account
Value
12/31/19 | | Hypothetical
Ending Account
Value | | Actual
Expenses
Paid
During
Period* | | Hypothetical
Expenses Paid
During Period* | | Net
Expense
Ratio
During
Period** | |
Global Real Estate Portfolio Class I | | $ | 1,000.00 | | | $ | 1,051.90 | | | $ | 1,020.16 | | | $ | 5.17 | | | $ | 5.09 | | | | 1.00 | % | |
Global Real Estate Portfolio Class A | | | 1,000.00 | | | | 1,049.70 | | | | 1,018.40 | | | | 6.97 | | | | 6.87 | | | | 1.35 | | |
Global Real Estate Portfolio Class L | | | 1,000.00 | | | | 1,048.00 | | | | 1,015.88 | | | | 9.55 | | | | 9.40 | | | | 1.85 | | |
Global Real Estate Portfolio Class C | | | 1,000.00 | | | | 1,045.60 | | | | 1,014.62 | | | | 10.83 | | | | 10.66 | | | | 2.10 | | |
Global Real Estate Portfolio Class IS | | | 1,000.00 | | | | 1,051.60 | | | | 1,020.47 | | | | 4.86 | | | | 4.79 | | | | 0.94 | | |
Global Real Estate Portfolio Class IR | | | 1,000.00 | | | | 1,052.70 | | | | 1,020.47 | | | | 4.86 | | | | 4.79 | | | | 0.94 | | |
* Expenses are calculated using each Fund Class' annualized net expense ratio (as disclosed), multiplied by the average account value over the period and multiplied by 184/365 (to reflect the most recent one-half year period).
** Annualized.
3
Morgan Stanley Institutional Fund, Inc.
Annual Report — December 31, 2019
Investment Overview (unaudited)
Global Real Estate Portfolio
The Fund seeks to provide current income and capital appreciation.
Performance
For the fiscal year ended December 31, 2019, the Fund's Class I shares had a total return based on net asset value and reinvestment of distributions per share of 18.35%, net of fees. The Fund's Class I shares underperformed the Fund's benchmark, the FTSE EPRA Nareit Developed Real Estate Index — Net Total Return to U.S. Investors (the "Index"), which returned 22.70%, and underperformed the MSCI World Net Index, which returned 27.67%.
Factors Affecting Performance
• Overall returns have been strong in the real estate investment trust (REIT) market for full year 2019, but there was a wide disparity in share price performance; sectors viewed as defensive generally outperformed as the lower-for-longer investment theme strengthened and segments of the equity market appeared to be pricing in an economic slowdown/recession scenario. Bond yields continued to decline, achieving all-time lows in late August 2019; a phase that began in the fourth quarter of 2018, resulting in negative sovereign bond yields in certain markets (Germany, Japan) and significant bond yield declines in the U.S. and Australia. Given this combination of thematic investing and all-time low bond yields, we have witnessed a continued willingness among investors to pay premium valuations for segments of the market that are viewed as having greater predictability in cash flows. We suspect that underlying private market property valuation has become a less relevant metric as generalist investors and passive funds have become the marginal buyer of real estate securities. Generalist investors appear to place a greater focus on secular themes and are untethered to private market valuations.
• With share prices generally appearing untethered to private real estate values, there are sectors trading at relative valuations previously witnessed during the 2008-09 global financial crisis and some sectors trading in excess of 50% premiums to net asset values (NAVs). There has been a continued willingness to pay premium valuations for segments of the REIT market that are viewed as having greater predictability in cash flows (e.g., U.S. net lease and health care REITs, Japan REITs [J-REITs]) or benefiting from a secular investment
theme (e.g., U.S. industrial and data centers). In addition, the concerns with regard to economic growth have generally placed downward pressure on segments that are viewed as more vulnerable — office, retail and hotels. Many of these stocks are trading at large discounts to NAVs, despite significant transactional evidence in the private markets in the office and hotel sectors. This has resulted in a further widening of the disparity in share price valuations among market segments. The Fund continues to be underweight to segments that have benefited from this theme due to premium share price valuations, and overweight to market segments which trade at very attractive discounted valuations.
• The global real estate securities market gained 22.7% during the 12-month period ending December 31, 2019, as measured by the Index.
o In the U.S., property stocks gained 24.3%, as measured by the FTSE EPRA Nareit U.S. Index.(i) Continued negative sentiment and share price weakness in NYC office and Class A malls resulted in very wide discounts to NAVs, while data centers and net lease assets experienced share price strength due to being viewed as defensive in a lower-for-longer interest rate environment (in the case of net lease) or having a secular growth theme (in the case of data centers).
o In Asia, property stocks gained 17.1%, as measured by the FTSE EPRA Nareit Developed Asia Index.(i) There have been three important macro events impacting Asia: the protests in Hong Kong, the ongoing U.S.-China trade war and the overall view of the market from lower-for-longer (this sentiment peaked in August 2019) to a more recent shift towards modestly higher sovereign bond yields. Following declines due to the continuation of anti-government protests, Hong Kong stocks traded at a wide discount to NAV and continue to trade at the widest discounts on a global basis. In Japan, REITs posted gains due to investors' search for yield, the Bank of Japan's commitment to monetary easing and the asset purchase program, and the segment's defensive characteristics.
4
Morgan Stanley Institutional Fund, Inc.
Annual Report — December 31, 2019
Investment Overview (unaudited) (cont'd)
Global Real Estate Portfolio
o In Europe, property stocks gained 27.3%, as measured by the FTSE EPRA Nareit Developed Europe Index.(i) The U.K. posted the largest gains on a global basis due to currency strength and less uncertainty over Brexit.
• The top contributors to performance were the underweight to German residential and overweight to the U.K. Majors and London office specialists.
o German residential underweight — the Fund's underweight to this sector was a key contributor as the sector experienced steep declines and volatility, particularly after the second quarter of 2019 when the City of Berlin proposed to freeze rents and have rental reductions in some cases, in response to a surge in housing costs.
o U.K. Majors and London office specialists overweight — the U.K. Majors and London office specialists traded at attractive discounted valuations throughout the year, and experienced a strong recovery in share prices in the fourth quarter of 2019 on reduced concerns over Brexit.
• The key detractors from performance were the Fund's overweight to and stock selection within the U.S. malls sector and Hong Kong real estate operating companies (REOCs), and underweights to the U.S. net lease and U.S. industrial sectors and J-REITs.
o U.S. malls — the Fund remained overweight to select owners of Class A malls, as tenant sales in the "A mall" portfolios continue to experience growth despite retailer challenges, but the sector underperformed in the period as sentiment towards retail remains negative.
o Hong Kong REOCs — the overweight to Hong Kong REOCs detracted for the period due to escalation of anti-government protests and market sentiment on the economic uncertainties related to the U.S.-Sino trade war. The stocks experienced a recovery in the fourth quarter of 2019, but still ended the year trading at a significant 47% discount to NAVs.
o U.S. net lease sector underweight — the sector traded at one of the most significant premiums to NAV (+47% at the end of December) but the companies experienced share price gains on investor preference for stocks viewed as more defensive, given that net lease companies generally feature more bond-like cash flows.
o U.S. industrial sector underweight — this sector outperformed as it continued to benefit from a secular investment theme despite trading at a +23% premium to NAVs at the end of December 2019.
o J-REITs underweight — this sector significantly outperformed for the period and traded at a +22% premium to NAVs as investors continued to favor J-REITs due to being viewed as defensive and attractive in a lower-for-longer Japanese government bond yield environment.
Management Strategies
• We believe listed real estate security returns should mirror private real estate performance. This strategy may result in periods of underperformance, particularly when the market is driven more by thematic/momentum investing and macro factors, as opposed to fundamentals and intrinsic value. The current prolonged period in which underlying private market valuation is not a relevant determinant of share prices has been surprising. The private market is more than six times larger than the
(i) The FTSE EPRA Nareit U.S. Index is a subset of the FTSE EPRA Nareit Developed Index and is a free float-adjusted market capitalization weighted index composed of listed real estate securities in the U.S. real estate markets. The FTSE EPRA Nareit Developed Asia Index is a subset of the FTSE EPRA Nareit Developed Index and is a free float-adjusted market capitalization weighted index composed of listed real estate securities in the Asia real estate markets. The FTSE EPRA Nareit Developed Europe Index is a subset of the FTSE EPRA Nareit Developed Index and is a free float-adjusted market capitalization weighted index composed of listed real estate securities in the European real estate markets. The performance of the indexes are listed in U.S. dollars and assume reinvestment of dividends. The indexes are unmanaged and their returns do not include any sales charges or fees. Such costs would lower performance. It is not possible to invest directly in an index.
5
Morgan Stanley Institutional Fund, Inc.
Annual Report — December 31, 2019
Investment Overview (unaudited) (cont'd)
Global Real Estate Portfolio
public markets and has, up until this period, always served as a key determinant of share prices and our key metric. It is logical to us that persistent discounts cannot exist when there is so much capital on the sidelines needing to invest, and we believe we will be rewarded as these stocks provide favorable risk-adjusted return opportunities based on our analysis.
• We would note the lack of focus on valuations/fundamentals has been, in our opinion, prolonged due to the following factors:
o Institutional investors have demonstrated a significant preference for private real estate (as opposed to public real estate); as a result, generalist and passive investors have become the marginal buyers.
o Generalist investors tend to focus less on valuations and more on traditional stock market metrics (such as earnings growth and dividend yields) and secular themes.
o Growth of passive investing in the REIT space has contributed to exacerbating the dislocation due to a lack of focus on differentiating among stocks based on fundamentals, and instead adding to overvalued stocks that have grown in market capitalization and reducing exposure to undervalued stocks that have decreased in size.
o Untethered to private real estate valuations, earnings multiples have expanded to record levels in sectors viewed as more defensive or benefiting from favorable secular themes. This has resulted in a willingness to ignore the distinction in multiples used to value assets in the private real estate sector and therefore indifference about the quality of the real estate cash flow when buying stocks based on fund from operations (FFO) multiples, as shown by net lease and health care REITs trading at higher multiples than NYC office REITs.
• Regional bets are currently relatively muted due to a lack of large valuation disparities among the regions and due to macro uncertainties which may impact regional share prices far more than underlying fundamentals and valuations, and we have instead focused more on the significant disparity in valuations within each of the regions. While the overall global real estate securities market ended the period trading at a 5% premium to NAVs, we see significant disparities in valuations among market segments within each of the major regions, with the most attractive expected return prospects from companies concentrated in U.S. central business district office (especially NYC office), U.S. and Continental European high quality retail, the Hong Kong commercial property companies, the U.K. Majors, U.S. hotels, and select opportunities to invest in other core assets at attractive discounted valuations in a number of other global markets.

* Minimum Investment for Class I shares
In accordance with SEC regulations, the Fund's performance shown assumes that all recurring fees (including management fees) were deducted and all dividends and distributions were reinvested. The performance of Class A, L, C, IS and IR shares will vary from the performance of Class I shares based upon their different inception dates and will be negatively impacted by additional fees assessed to those classes (if applicable).
6
Morgan Stanley Institutional Fund, Inc.
Annual Report — December 31, 2019
Investment Overview (unaudited) (cont'd)
Global Real Estate Portfolio
Performance Compared to the FTSE EPRA Nareit Developed Real Estate Index — Net Total Return to U.S. Investors(1), the MSCI World Net Index(2) and the Lipper Global Real Estate Funds Index(3)
| | | Period Ended December 31, 2019
Total Returns(4) | |
| | | | | Average Annual | |
| | | One
Year | | Five
Years | | Ten
Years | | Since
Inception(10) | |
Fund — Class I Shares
w/o sales charges(5) | | | 18.35 | % | | | 4.14 | % | | | 7.42 | % | | | 4.12 | % | |
Fund — Class A Shares
w/o sales charges(5) | | | 17.90 | | | | 3.82 | | | | 7.12 | | | | 3.83 | | |
Fund — Class A Shares with
maximum 5.25% sales charges(5) | | | 11.69 | | | | 2.71 | | | | 6.55 | | | | 3.41 | | |
Fund — Class L Shares
w/o sales charges(6) | | | 17.37 | | | | 3.31 | | | | 6.59 | | | | 3.72 | | |
Fund — Class C Shares
w/o sales charges(8) | | | 16.98 | | | | — | | | | — | | | | 2.60 | | |
Fund — Class C Shares with
maximum 1.00% deferred
sales charges(8) | | | 15.98 | | | | — | | | | — | | | | 2.60 | | |
Fund — Class IS Shares
w/o sales charges(7) | | | 18.43 | | | | 4.22 | | | | — | | | | 5.73 | | |
Fund — Class IR Shares
w/o sales charges(9) | | | 18.44 | | | | — | | | | — | | | | 6.09 | | |
FTSE EPRA Nareit Developed
Real Estate Index — Net Total
Return to U.S. Investors | | | 22.70 | | | | 6.23 | | | | 8.96 | | | | 4.66 | | |
MSCI World Net Index | | | 27.67 | | | | 8.74 | | | | 9.47 | | | | 6.37 | | |
Lipper Global Real Estate
Funds Index | | | 23.63 | | | | 6.28 | | | | 8.49 | | | | N/A | | |
Performance data quoted represents past performance, which is no guarantee of future results, and current performance may be lower or higher than the figures shown. Performance assumes that all dividends and distributions, if any, were reinvested. For the most recent month-end performance figures, please visit www.morganstanley.com/im/shareholderreports. Investment return and principal value will fluctuate so that Fund shares, when redeemed, may be worth more or less than their original cost. Total returns do not reflect the deduction of taxes that a shareholder would pay on Fund distributions or the redemption of Fund shares. Performance of share classes will vary due to difference in sales charges and expenses.
(1) The FTSE EPRA Nareit Developed Real Estate Index — Net Total Return to U.S. Investors is a market capitalization weighted index designed to reflect the stock performance of companies engaged in the North American, European and Asian real estate markets. The performance of the Index is listed in U.S. dollars and assumes reinvestment of net dividends. "Net Total Return to U.S. investors" reflects a reduction in total returns after taking into account the withholding tax on dividends by certain foreign countries represented in the Index for periods after 1/31/05 (gross returns used prior to 1/31/05). The Index is unmanaged and its returns do not include any sales charges or fees. Such costs would lower performance. It is not possible to invest directly in an index.
(2) The MSCI World Net Index is a free float-adjusted market capitalization weighted index that is designed to measure the global equity market performance of developed markets. The term "free float" represents the portion of shares outstanding that are deemed to be available for purchase in the public equity markets by investors. The MSCI World Net Index currently consists of 23 developed market country indices. The performance of the Index is listed in U.S. dollars and assumes reinvestment of net dividends. Net total return indices reinvest dividends after the deduction of withholding taxes, using (for international indices) a tax rate applicable to non-resident institutional investors who do not benefit from double taxation treaties. The Index is unmanaged and its returns do not include any sales charges or fees. Such costs would lower performance. It is not possible to invest directly in an index.
(3) The Lipper Global Real Estate Funds Index is an equally weighted performance index of the largest qualifying funds (based on net assets) in the Lipper Global Real Estate Funds classification. The Index, which is adjusted for capital gains distributions and income dividends, is unmanaged and should not be considered an investment. There are currently 30 funds represented in this Index. As of the date of this report, the Fund was in the Lipper Global Real Estate Funds classification.
(4) Total returns for the Fund reflect fees waived and expenses reimbursed, if applicable, by the Adviser (as defined herein). Without such waivers and reimbursements, total returns would have been lower.
(5) Commenced operations on August 30, 2006.
(6) Commenced offering on June 16, 2008.
(7) Commenced offering September 13, 2013.
(8) Commenced offering on April 30, 2015.
(9) Commenced offering on June 15, 2018
(10) For comparative purposes, average annual since inception returns listed for the Indexes refer to the inception date of Class I of the Fund, not the inception of the Index.
7
Morgan Stanley Institutional Fund, Inc.
Annual Report — December 31, 2019
Portfolio of Investments
Global Real Estate Portfolio
| | | Shares | | Value
(000) | |
Common Stocks (98.9%) | |
Australia (2.8%) | |
Dexus REIT | | | 643,341 | | | $ | 5,282 | | |
GPT Group (The) REIT | | | 606,648 | | | | 2,384 | | |
Mirvac Group REIT | | | 1,195,073 | | | | 2,667 | | |
Scentre Group REIT | | | 2,759,700 | | | | 7,417 | | |
Stockland REIT | | | 25,925 | | | | 84 | | |
Vicinity Centres REIT | | | 908,503 | | | | 1,588 | | |
| | | | 19,422 | | |
Austria (0.1%) | |
Atrium European Real Estate Ltd. (a) | | | 142,973 | | | | 552 | | |
Canada (1.9%) | |
Boardwalk REIT | | | 3,871 | | | | 137 | | |
Crombie Real Estate Investment Trust REIT | | | 91,816 | | | | 1,127 | | |
First Capital Real Estate Investment Trust | | | 292,602 | | | | 4,658 | | |
H&R Real Estate Investment Trust REIT | | | 66,063 | | | | 1,073 | | |
RioCan Real Estate Investment Trust REIT | | | 265,803 | | | | 5,477 | | |
SmartCentres Real Estate Investment Trust REIT | | | 23,544 | | | | 566 | | |
| | | | 13,038 | | |
China (1.2%) | |
China Overseas Land & Investment Ltd. (b) | | | 754,000 | | | | 2,937 | | |
China Resources Land Ltd. (b) | | | 606,000 | | | | 3,017 | | |
Longfor Group Holdings Ltd. (b) | | | 413,500 | | | | 1,937 | | |
Poly Property Development Co., Ltd. (a)(b) | | | 10,000 | | | | 60 | | |
| | | | 7,951 | | |
Finland (0.3%) | |
Kojamo Oyj | | | 106,682 | | | | 1,939 | | |
France (5.5%) | |
Carmila SA REIT | | | 52,828 | | | | 1,185 | | |
Covivio REIT | | | 18,322 | | | | 2,080 | | |
Gecina SA REIT | | | 40,908 | | | | 7,323 | | |
ICADE REIT | | | 13,939 | | | | 1,517 | | |
Klepierre SA REIT | | | 323,221 | | | | 12,273 | | |
Mercialys SA REIT | | | 195,495 | | | | 2,704 | | |
Unibail-Rodamco-Westfield REIT | | | 65,990 | | | | 10,411 | | |
| | | | 37,493 | | |
Germany (3.3%) | |
ADO Properties SA | | | 26,190 | | | | 943 | | |
Alstria Office AG REIT | | | 121,867 | | | | 2,289 | | |
Deutsche Wohnen SE | | | 172,541 | | | | 7,018 | | |
LEG Immobilien AG | | | 21,810 | | | | 2,576 | | |
Vonovia SE | | | 184,316 | | | | 9,900 | | |
| | | | 22,726 | | |
Hong Kong (8.5%) | |
China Merchants Commercial Real Estate
Investment Trust REIT (a) | | | 1,187,165 | | | | 507 | | |
CK Asset Holdings Ltd. | | | 557,000 | | | | 4,021 | | |
Hang Lung Properties Ltd. | | | 874,000 | | | | 1,918 | | |
Hongkong Land Holdings Ltd. | | | 1,603,200 | | | | 9,218 | | |
Hysan Development Co., Ltd. | | | 129,014 | | | | 506 | | |
Link REIT | | | 1,182,775 | | | | 12,523 | | |
| | | Shares | | Value
(000) | |
Midea Real Estate Holding Ltd. | | | 164,000 | | | $ | 503 | | |
New World Development Co., Ltd. | | | 1,934,758 | | | | 2,652 | | |
Sino Land Co., Ltd. | | | 535,048 | | | | 777 | | |
Sun Hung Kai Properties Ltd. | | | 902,367 | | | | 13,815 | | |
Swire Properties Ltd. | | | 2,335,900 | | | | 7,749 | | |
Wharf Real Estate Investment Co., Ltd. | | | 650,075 | | | | 3,967 | | |
| | | | 58,156 | | |
Ireland (0.5%) | |
Hibernia REIT PLC | | | 2,105,876 | | | | 3,331 | | |
Japan (10.3%) | |
Activia Properties, Inc. REIT | | | 204 | | | | 1,022 | | |
Advance Residence Investment Corp. REIT | | | 740 | | | | 2,346 | | |
Daiwa Office Investment Corp. REIT | | | 117 | | | | 898 | | |
Frontier Real Estate Investment Corp. REIT | | | 57 | | | | 240 | | |
GLP J-REIT | | | 1,799 | | | | 2,238 | | |
Hulic Co., Ltd. | | | 103,100 | | | | 1,241 | | |
Hulic REIT, Inc. | | | 484 | | | | 878 | | |
Industrial & Infrastructure Fund
Investment Corp. REIT | | | 65 | | | | 99 | | |
Invincible Investment Corp. REIT | | | 724 | | | | 413 | | |
Japan Excellent, Inc. REIT | | | 399 | | | | 646 | | |
Japan Hotel REIT Investment Corp. | | | 2,964 | | | | 2,214 | | |
Japan Real Estate Investment Corp. REIT | | | 908 | | | | 6,026 | | |
Japan Retail Fund Investment Corp. REIT | | | 965 | | | | 2,077 | | |
Kenedix Office Investment Corp. REIT | | | 138 | | | | 1,066 | | |
Mitsubishi Estate Co., Ltd. | | | 603,300 | | | | 11,544 | | |
Mitsui Fudosan Co., Ltd. | | | 451,800 | | | | 11,042 | | |
Mori Trust Sogo Reit, Inc. | | | 504 | | | | 905 | | |
Nippon Building Fund, Inc. REIT | | | 1,076 | | | | 7,887 | | |
Nippon Prologis, Inc. REIT | | | 905 | | | | 2,305 | | |
Nomura Real Estate Master Fund, Inc. REIT | | | 2,025 | | | | 3,464 | | |
Orix, Inc. J-REIT | | | 454 | | | | 984 | | |
Premier Investment Corp. REIT | | | 406 | | | | 574 | | |
Sumitomo Realty & Development Co., Ltd. | | | 221,100 | | | | 7,714 | | |
Tokyo Tatemono Co., Ltd. | | | 17,700 | | | | 276 | | |
United Urban Investment Corp. REIT | | | 1,537 | | | | 2,887 | | |
| | | | 70,986 | | |
Malta (0.0%) | |
BGP Holdings PLC (a)(c) | | | 12,867,024 | | | | 19 | | |
Netherlands (0.7%) | |
Eurocommercial Properties N.V. CVA REIT | | | 99,116 | | | | 2,779 | | |
NSI N.V. REIT | | | 32,775 | | | | 1,596 | | |
Wereldhave N.V. REIT | | | 19,315 | | | | 436 | | |
| | | | 4,811 | | |
Norway (0.4%) | |
Entra ASA | | | 152,990 | | | | 2,529 | | |
Norwegian Property ASA | | | 341,441 | | | | 540 | | |
| | | | 3,069 | | |
Singapore (1.6%) | |
Ascendas Real Estate Investment Trust REIT | | | 1,473,489 | | | | 3,254 | | |
CapitaLand Commercial Trust REIT | | | 1,341,995 | | | | 1,986 | | |
CapitaLand Ltd. | | | 124,100 | | | | 346 | | |
The accompanying notes are an integral part of the financial statements.
8
Morgan Stanley Institutional Fund, Inc.
Annual Report — December 31, 2019
Portfolio of Investments (cont'd)
Global Real Estate Portfolio
| | | Shares | | Value
(000) | |
Singapore (cont'd) | |
CapitaLand Mall Trust REIT | | | 741,400 | | | $ | 1,356 | | |
Frasers Logistics & Industrial Trust REIT | | | 1,133,900 | | | | 1,045 | | |
Mapletree Commercial Trust REIT | | | 769,246 | | | | 1,367 | | |
Mapletree Logistics Trust REIT | | | 423,000 | | | | 547 | | |
UOL Group Ltd. | | | 222,976 | | | | 1,379 | | |
| | | | 11,280 | | |
Spain (1.2%) | |
Inmobiliaria Colonial Socimi SA REIT | | | 219,072 | | | | 2,792 | | |
Merlin Properties Socimi SA REIT | | | 362,136 | | | | 5,195 | | |
| | | | 7,987 | | |
Sweden (0.9%) | |
Atrium Ljungberg AB, Class B | | | 49,602 | | | | 1,196 | | |
Castellum AB | | | 40,407 | | | | 950 | | |
Fabege AB | | | 40,800 | | | | 678 | | |
Hufvudstaden AB, Class A | | | 126,255 | | | | 2,496 | | |
Kungsleden AB | | | 56,012 | | | | 588 | | |
| | | | 5,908 | | |
Switzerland (0.2%) | |
PSP Swiss Property AG (Registered) | | | 12,370 | | | | 1,708 | | |
United Kingdom (5.4%) | |
British Land Co., PLC (The) REIT | | | 989,549 | | | | 8,373 | | |
Capital & Counties Properties PLC | | | 387,408 | | | | 1,343 | | |
Derwent London PLC REIT | | | 73,730 | | | | 3,917 | | |
Grainger PLC | | | 179,798 | | | | 746 | | |
Great Portland Estates PLC REIT | | | 301,473 | | | | 3,434 | | |
Hammerson PLC REIT | | | 859,853 | | | | 3,516 | | |
Intu Properties PLC REIT (a) | | | 379,871 | | | | 171 | | |
Land Securities Group PLC REIT | | | 651,924 | | | | 8,549 | | |
Segro PLC REIT | | | 133,516 | | | | 1,587 | | |
Shaftesbury PLC REIT | | | 55,057 | | | | 689 | | |
St. Modwen Properties PLC | | | 240,463 | | | | 1,583 | | |
Urban & Civic PLC | | | 630,246 | | | | 2,880 | | |
| | | | 36,788 | | |
United States (54.1%) | |
Alexandria Real Estate Equities, Inc. REIT | | | 33,395 | | | | 5,396 | | |
American Campus Communities, Inc. REIT | | | 77,460 | | | | 3,643 | | |
American Homes 4 Rent, Class A REIT | | | 145,522 | | | | 3,814 | | |
Apartment Investment & Management Co.,
Class A REIT | | | 62,809 | | | | 3,244 | | |
AvalonBay Communities, Inc. REIT | | | 123,242 | | | | 25,844 | | |
Boston Properties, Inc. REIT | | | 167,926 | | | | 23,150 | | |
Camden Property Trust REIT | | | 77,535 | | | | 8,226 | | |
Cousins Properties, Inc. REIT | | | 127,820 | | | | 5,266 | | |
CubeSmart REIT | | | 193,064 | | | | 6,078 | | |
DiamondRock Hospitality Co. REIT | | | 873,010 | | | | 9,673 | | |
Digital Realty Trust, Inc. REIT | | | 76,500 | | | | 9,160 | | |
Duke Realty Corp. REIT | | | 68,560 | | | | 2,377 | | |
Equity Residential REIT | | | 156,439 | | | | 12,659 | | |
Essex Property Trust, Inc. REIT | | | 17,287 | | | | 5,201 | | |
Exeter Industrial Value Fund, LP (a)(c)(d) | | | 1,860,000 | | | | 128 | | |
Extra Space Storage, Inc. REIT | | | 33,935 | | | | 3,584 | | |
| | | Shares | | Value
(000) | |
Gaming and Leisure Properties, Inc. REIT | | | 91,540 | | | $ | 3,941 | | |
Healthcare Realty Trust, Inc. REIT | | | 301,090 | | | | 10,047 | | |
Healthcare Trust of America, Inc., Class A REIT | | | 100,959 | | | | 3,057 | | |
Healthpeak Properties, Inc. REIT | | | 60,724 | | | | 2,093 | | |
Highwoods Properties, Inc. REIT | | | 30,850 | | | | 1,509 | | |
Host Hotels & Resorts, Inc. REIT | | | 987,906 | | | | 18,326 | | |
Hudson Pacific Properties, Inc. REIT | | | 216,686 | | | | 8,158 | | |
Invitation Homes, Inc. REIT | | | 220,720 | | | | 6,615 | | |
JBG SMITH Properties REIT | | | 101,269 | | | | 4,040 | | |
Kilroy Realty Corp. REIT | | | 42,629 | | | | 3,576 | | |
Lexington Realty Trust REIT | | | 133,090 | | | | 1,413 | | |
Liberty Property Trust REIT | | | 50,593 | | | | 3,038 | | |
Life Storage, Inc. REIT | | | 12,994 | | | | 1,407 | | |
Macerich Co. (The) REIT | | | 541,182 | | | | 14,569 | | |
Mack-Cali Realty Corp. REIT | | | 103,237 | | | | 2,388 | | |
Mid-America Apartment Communities, Inc. REIT | | | 30,993 | | | | 4,087 | | |
Paramount Group, Inc. REIT | | | 435,285 | | | | 6,059 | | |
ProLogis, Inc. REIT | | | 248,693 | | | | 22,168 | | |
Public Storage REIT | | | 32,920 | | | | 7,011 | | |
QTS Realty Trust, Inc., Class A REIT | | | 7,979 | | | | 433 | | |
Regency Centers Corp. REIT | | | 102,632 | | | | 6,475 | | |
Senior Housing Properties Trust REIT | | | 92,680 | | | | 782 | | |
Simon Property Group, Inc. REIT | | | 289,367 | | | | 43,104 | | |
SL Green Realty Corp. REIT | | | 421,060 | | | | 38,687 | | |
Sunstone Hotel Investors, Inc. REIT | | | 525,559 | | | | 7,316 | | |
UDR, Inc. REIT | | | 69,095 | | | | 3,227 | | |
Ventas, Inc. REIT | | | 8,965 | | | | 518 | | |
Vornado Realty Trust REIT | | | 169,182 | | | | 11,251 | | |
Weingarten Realty Investors REIT | | | 161,390 | | | | 5,042 | | |
Welltower, Inc. REIT | | | 46,305 | | | | 3,787 | | |
| | | | 371,567 | | |
Total Common Stocks (Cost $503,784) | | | 678,731 | | |
Short-Term Investment (0.0%) | |
Investment Company (0.0%) | |
Morgan Stanley Institutional Liquidity
Funds — Treasury Portfolio —
Institutional Class (See Note G)
(Cost $287) | | | 287,355 | | | | 287 | | |
Total Investments (98.9%) (Cost $504,071) (e)(f) | | | 679,018 | | |
Other Assets in Excess of Liabilities (1.1%) | | | 7,285 | | |
Net Assets (100.0%) | | $ | 686,303 | | |
Country assignments and aggregations are based generally on third party vendor classifications and information, and may be different from the assignments and aggregations under the policies set forth in the Fund's prospectus and/or statement of additional information relating to geographic classifications.
(a) Non-income producing security.
(b) Security trades on the Hong Kong exchange.
(c) At December 31, 2019, the Fund held fair valued securities valued at approximately $147,000, representing less than 0.05% of net assets. These securities have been fair valued as determined in good faith under procedures established by and under the general supervision of the Company's (as defined herein) Directors.
The accompanying notes are an integral part of the financial statements.
9
Morgan Stanley Institutional Fund, Inc.
Annual Report — December 31, 2019
Portfolio of Investments (cont'd)
Global Real Estate Portfolio
(d) Restricted security valued at fair value and not registered under the Securities Act of 1933. Exeter Industrial Value Fund, LP was acquired between 11/07 - 4/11 and has a current cost basis of $0. At December 31, 2019, this security had an aggregate market value of approximately $128,000, representing less than 0.05% of net assets.
(e) The approximate fair value and percentage of net assets, $106,888,000 and 15.6%, respectively, represent the securities that have been fair valued under the fair valuation policy for international investments as described in Note A-1 within the Notes to the Financial Statements.
(f) At December 31, 2019, the aggregate cost for federal income tax purposes is approximately $541,924,000. The aggregate gross unrealized appreciation is approximately $151,784,000 and the aggregate gross unrealized depreciation is approximately $14,690,000, resulting in net unrealized appreciation of approximately $137,094,000.
CVA Certificaten Van Aandelen.
REIT Real Estate Investment Trust.
Portfolio Composition
Classification | | Percentage of
Total Investments | |
Diversified | | | 23.7 | % | |
Office | | | 22.2 | | |
Retail | | | 20.6 | | |
Residential | | | 15.5 | | |
Other* | | | 7.0 | | |
Lodging/Resorts | | | 5.6 | | |
Industrial | | | 5.4 | | |
Total Investments | | | 100.0 | % | |
* Industries and/or investment types representing less than 5% of total investments.
The accompanying notes are an integral part of the financial statements.
10
Morgan Stanley Institutional Fund, Inc.
Annual Report — December 31, 2019
Global Real Estate Portfolio
Statement of Assets and Liabilities | | December 31, 2019
(000) | |
Assets: | |
Investments in Securities of Unaffiliated Issuers, at Value (Cost $503,784) | | $ | 678,731 | | |
Investment in Security of Affiliated Issuer, at Value (Cost $287) | | | 287 | | |
Total Investments in Securities, at Value (Cost $504,071) | | | 679,018 | | |
Foreign Currency, at Value (Cost $1,960) | | | 1,978 | | |
Receivable for Fund Shares Sold | | | 3,322 | | |
Dividends Receivable | | | 3,013 | | |
Receivable for Investments Sold | | | 1,311 | | |
Tax Reclaim Receivable | | | 247 | | |
Receivable from Affiliate | | | 2 | | |
Other Assets | | | 110 | | |
Total Assets | | | 689,001 | | |
Liabilities: | |
Payable for Advisory Fees | | | 1,436 | | |
Payable for Fund Shares Redeemed | | | 852 | | |
Deferred Capital Gain Country Tax | | | 109 | | |
Payable for Sub Transfer Agency Fees — Class I | | | 63 | | |
Payable for Sub Transfer Agency Fees — Class A | | | 2 | | |
Payable for Sub Transfer Agency Fees — Class L | | | — | @ | |
Payable for Sub Transfer Agency Fees — Class C | | | — | @ | |
Payable for Professional Fees | | | 53 | | |
Payable for Administration Fees | | | 47 | | |
Payable for Custodian Fees | | | 33 | | |
Payable for Transfer Agency Fees — Class I | | | 4 | | |
Payable for Transfer Agency Fees — Class A | | | 3 | | |
Payable for Transfer Agency Fees — Class L | | | — | @ | |
Payable for Transfer Agency Fees — Class C | | | — | @ | |
Payable for Transfer Agency Fees — Class IS | | | 3 | | |
Payable for Transfer Agency Fees — Class IR | | | — | @ | |
Payable for Shareholder Services Fees — Class A | | | 2 | | |
Payable for Distribution and Shareholder Services Fees — Class L | | | 1 | | |
Payable for Distribution and Shareholder Services Fees — Class C | | | — | @ | |
Payable for Investments Purchased | | | 3 | | |
Other Liabilities | | | 87 | | |
Total Liabilities | | | 2,698 | | |
Net Assets | | $ | 686,303 | | |
Net Assets Consist of: | |
Paid-in-Capital | | $ | 546,213 | | |
Total Distributable Earnings | | | 140,090 | | |
Net Assets | | $ | 686,303 | | |
The accompanying notes are an integral part of the financial statements.
11
Morgan Stanley Institutional Fund, Inc.
Annual Report — December 31, 2019
Global Real Estate Portfolio
Statement of Assets and Liabilities (cont'd) | | December 31, 2019
(000) | |
CLASS I: | |
Net Assets | | $ | 323,386 | | |
| Shares Outstanding $0.001 par value shares of beneficial interest (unlimited shares authorized) (not in 000's) | | | 32,753,062 | | |
Net Asset Value, Offering and Redemption Price Per Share | | $ | 9.87 | | |
CLASS A: | |
Net Assets | | $ | 10,728 | | |
| Shares Outstanding $0.001 par value shares of beneficial interest (unlimited shares authorized) (not in 000's) | | | 1,089,218 | | |
Net Asset Value, Redemption Price Per Share | | $ | 9.85 | | |
Maximum Sales Load | | | 5.25 | % | |
Maximum Sales Charge | | $ | 0.55 | | |
Maximum Offering Price Per Share | | $ | 10.40 | | |
CLASS L: | |
Net Assets | | $ | 1,419 | | |
| Shares Outstanding $0.001 par value shares of beneficial interest (unlimited shares authorized) (not in 000's) | | | 145,592 | | |
Net Asset Value, Offering and Redemption Price Per Share | | $ | 9.75 | | |
CLASS C: | |
Net Assets | | $ | 397 | | |
| Shares Outstanding $0.001 par value shares of beneficial interest (unlimited shares authorized) (not in 000's) | | | 41,554 | | |
Net Asset Value, Offering and Redemption Price Per Share | | $ | 9.56 | | |
CLASS IS: | |
Net Assets | | $ | 350,363 | | |
| Shares Outstanding $0.001 par value shares of beneficial interest (unlimited shares authorized) (not in 000's) | | | 35,497,675 | | |
Net Asset Value, Offering and Redemption Price Per Share | | $ | 9.87 | | |
CLASS IR: | |
Net Assets | | $ | 10 | | |
| Shares Outstanding $0.001 par value shares of beneficial interest (unlimited shares authorized) (not in 000's) | | | 994 | | |
Net Asset Value, Offering and Redemption Price Per Share | | $ | 9.87 | | |
@ Amount is less than $500.
The accompanying notes are an integral part of the financial statements.
12
Morgan Stanley Institutional Fund, Inc.
Annual Report — December 31, 2019
Global Real Estate Portfolio
Statement of Operations | | Year Ended
December 31, 2019
(000) | |
Investment Income: | |
Dividends from Securities of Unaffiliated Issuers (Net of $1,249 of Foreign Taxes Withheld) | | $ | 27,707 | | |
Dividends from Security of Affiliated Issuer (Note G) | | | 129 | | |
Total Investment Income | | | 27,836 | | |
Expenses: | |
Advisory Fees (Note B) | | | 6,642 | | |
Administration Fees (Note C) | | | 664 | | |
Sub Transfer Agency Fees — Class I | | | 399 | | |
Sub Transfer Agency Fees — Class A | | | 13 | | |
Sub Transfer Agency Fees — Class L | | | 1 | | |
Sub Transfer Agency Fees — Class C | | | — | @ | |
Professional Fees | | | 135 | | |
Custodian Fees (Note F) | | | 123 | | |
Registration Fees | | | 107 | | |
Shareholder Reporting Fees | | | 69 | | |
Shareholder Services Fees — Class A (Note D) | | | 33 | | |
Distribution and Shareholder Services Fees — Class L (Note D) | | | 10 | | |
Distribution and Shareholder Services Fees — Class C (Note D) | | | 5 | | |
Transfer Agency Fees — Class I (Note E) | | | 13 | | |
Transfer Agency Fees — Class A (Note E) | | | 11 | | |
Transfer Agency Fees — Class L (Note E) | | | 2 | | |
Transfer Agency Fees — Class C (Note E) | | | 2 | | |
Transfer Agency Fees — Class IS (Note E) | | | 10 | | |
Transfer Agency Fees — Class IR (Note E) | | | 2 | | |
Directors' Fees and Expenses | | | 27 | | |
Pricing Fees | | | 11 | | |
Other Expenses | | | 31 | | |
Expenses Before Non Operating Expenses | | | 8,310 | | |
Bank Overdraft Expense | | | 19 | | |
Total Expenses | | | 8,329 | | |
Reimbursement of Class Specific Expenses — Class I (Note B) | | | (193 | ) | |
Reimbursement of Class Specific Expenses — Class A (Note B) | | | (2 | ) | |
Reimbursement of Class Specific Expenses — Class L (Note B) | | | (1 | ) | |
Reimbursement of Class Specific Expenses — Class C (Note B) | | | (2 | ) | |
Reimbursement of Class Specific Expenses — Class IS (Note B) | | | (7 | ) | |
Reimbursement of Class Specific Expenses — Class IR (Note B) | | | (2 | ) | |
Rebate from Morgan Stanley Affiliate (Note G) | | | (11 | ) | |
Waiver of Advisory Fees (Note B) | | | (6 | ) | |
Net Expenses | | | 8,105 | | |
Net Investment Income | | | 19,731 | | |
Realized Gain (Loss): | |
Investments Sold | | | 51,679 | | |
Foreign Currency Translation | | | (71 | ) | |
Net Realized Gain | | | 51,608 | | |
Change in Unrealized Appreciation (Depreciation): | |
Investments (Net of Increase in Deferred Capital Gain Country Tax of $109) | | | 74,782 | | |
Foreign Currency Translation | | | 24 | | |
Net Change in Unrealized Appreciation (Depreciation) | | | 74,806 | | |
Net Realized Gain and Change in Unrealized Appreciation (Depreciation) | | | 126,414 | | |
Net Increase in Net Assets Resulting from Operations | | $ | 146,145 | | |
@ Amount is less than $500.
The accompanying notes are an integral part of the financial statements.
13
Morgan Stanley Institutional Fund, Inc.
Annual Report — December 31, 2019
Global Real Estate Portfolio
Statements of Changes in Net Assets | | Year Ended
December 31, 2019
(000) | | Year Ended
December 31, 2018
(000) | |
Increase (Decrease) in Net Assets: | |
Operations: | |
Net Investment Income | | $ | 19,731 | | | $ | 31,927 | | |
Net Realized Gain | | | 51,608 | | | | 97,874 | | |
Net Change in Unrealized Appreciation (Depreciation) | | | 74,806 | | | | (211,792 | ) | |
Net Increase (Decrease) in Net Assets Resulting from Operations | | | 146,145 | | | | (81,991 | ) | |
Dividends and Distributions to Shareholders: | |
Class I | | | (30,795 | ) | | | (43,049 | ) | |
Class A | | | (992 | ) | | | (1,425 | ) | |
Class L | | | (121 | ) | | | (74 | ) | |
Class C | | | (33 | ) | | | (44 | ) | |
Class IS | | | (31,992 | ) | | | (59,675 | ) | |
Class IR | | | (1 | ) | | | (1 | ) | |
Total Dividends and Distributions to Shareholders | | | (63,934 | ) | | | (104,268 | ) | |
Capital Share Transactions:(1) | |
Class I: | |
Subscribed | | | 52,386 | | | | 88,211 | | |
Distributions Reinvested | | | 21,514 | | | | 32,086 | | |
Redeemed | | | (143,648 | ) | | | (235,198 | ) | |
Class A: | |
Subscribed | | | 1,398 | | | | 1,604 | | |
Distributions Reinvested | | | 985 | | | | 1,415 | | |
Redeemed | | | (5,586 | ) | | | (5,260 | ) | |
Class L: | |
Exchanged | | | 25 | | | | 518 | | |
Distributions Reinvested | | | 121 | | | | 74 | | |
Redeemed | | | (39 | ) | | | (567 | ) | |
Class C: | |
Subscribed | | | 110 | | | | 200 | | |
Distributions Reinvested | | | 33 | | | | 43 | | |
Redeemed | | | (208 | ) | | | (53 | ) | |
Class IS: | |
Subscribed | | | 44,869 | | | | 106,012 | | |
Distributions Reinvested | | | 30,673 | | | | 57,230 | | |
Redeemed | | | (292,311 | ) | | | (588,634 | ) | |
Class IR: | |
Subscribed | | | — | | | | 10 | (a) | |
Distributions Reinvested | | | 1 | | | | — | | |
Net Decrease in Net Assets Resulting from Capital Share Transactions | | | (289,677 | ) | | | (542,309 | ) | |
Total Decrease in Net Assets | | | (207,466 | ) | | | (728,568 | ) | |
Net Assets: | |
Beginning of Period | | | 893,769 | | | | 1,622,337 | | |
End of Period | | $ | 686,303 | | | $ | 893,769 | | |
The accompanying notes are an integral part of the financial statements.
14
Morgan Stanley Institutional Fund, Inc.
Annual Report — December 31, 2019
Global Real Estate Portfolio
Statements of Changes in Net Assets (cont'd) | | Year Ended
December 31, 2019
(000) | | Year Ended
December 31, 2018
(000) | |
(1) Capital Share Transactions: | |
Class I: | |
Shares Subscribed | | | 5,134 | | | | 8,284 | | |
Shares Issued on Distributions Reinvested | | | 2,227 | | | | 3,281 | | |
Shares Redeemed | | | (13,954 | ) | | | (21,915 | ) | |
Net Decrease in Class I Shares Outstanding | | | (6,593 | ) | | | (10,350 | ) | |
Class A: | |
Shares Subscribed | | | 136 | | | | 149 | | |
Shares Issued on Distributions Reinvested | | | 102 | | | | 145 | | |
Shares Redeemed | | | (543 | ) | | | (495 | ) | |
Net Decrease in Class A Shares Outstanding | | | (305 | ) | | | (201 | ) | |
Class L: | |
Shares Exchanged | | | 3 | | | | 57 | | |
Shares Issued on Distributions Reinvested | | | 13 | | | | 8 | | |
Shares Redeemed | | | (4 | ) | | | (53 | ) | |
Net Increase in Class L Shares Outstanding | | | 12 | | | | 12 | | |
Class C: | |
Shares Subscribed | | | 11 | | | | 18 | | |
Shares Issued on Distributions Reinvested | | | 4 | | | | 5 | | |
Shares Redeemed | | | (21 | ) | | | (5 | ) | |
Net Increase (Decrease) in Class C Shares Outstanding | | | (6 | ) | | | 18 | | |
Class IS: | |
Shares Subscribed | | | 4,341 | | | | 9,846 | | |
Shares Issued on Distributions Reinvested | | | 3,175 | | | | 5,868 | | |
Shares Redeemed | | | (28,336 | ) | | | (53,663 | ) | |
Net Decrease in Class IS Shares Outstanding | | | (20,820 | ) | | | (37,949 | ) | |
Class IR: | |
Shares Subscribed | | | — | | | | 1 | (a) | |
Shares Issued on Distributions Reinvested | | | — | @@ | | | — | | |
Net Increase in Class IR Shares Outstanding | | | — | @@ | | | 1 | (a) | |
(a) For the period June 15, 2018 through December 31, 2018.
@@ Amount is less than 500 shares.
The accompanying notes are an integral part of the financial statements.
15
Morgan Stanley Institutional Fund, Inc.
Annual Report — December 31, 2019
Financial Highlights
Global Real Estate Portfolio
| | | Class I | |
| | | Year Ended December 31, | |
Selected Per Share Data and Ratios | | 2019 | | 2018 | | 2017 | | 2016(1) | | 2015 | |
Net Asset Value, Beginning of Period | | $ | 9.19 | | | $ | 11.13 | | | $ | 10.76 | | | $ | 10.80 | | | $ | 11.10 | | |
Income (Loss) from Investment Operations: | |
Net Investment Income(2) | | | 0.24 | | | | 0.27 | | | | 0.25 | | | | 0.21 | | | | 0.18 | | |
Net Realized and Unrealized Gain (Loss) | | | 1.43 | | | | (1.11 | ) | | | 0.80 | | | | 0.15 | | | | (0.28 | ) | |
Total from Investment Operations | | | 1.67 | | | | (0.84 | ) | | | 1.05 | | | | 0.36 | | | | (0.10 | ) | |
Distributions from and/or in Excess of: | |
Net Investment Income | | | (0.54 | ) | | | (0.51 | ) | | | (0.15 | ) | | | (0.34 | ) | | | (0.20 | ) | |
Net Realized Gain | | | (0.45 | ) | | | (0.59 | ) | | | (0.53 | ) | | | (0.04 | ) | | | — | | |
Paid-in-Capital | | | — | | | | — | | | | — | | | | (0.02 | ) | | | — | | |
Total Distributions | | | (0.99 | ) | | | (1.10 | ) | | | (0.68 | ) | | | (0.40 | ) | | | (0.20 | ) | |
Net Asset Value, End of Period | | $ | 9.87 | | | $ | 9.19 | | | $ | 11.13 | | | $ | 10.76 | | | $ | 10.80 | | |
Total Return(3) | | | 18.35 | % | | | (7.92 | )% | | | 9.73 | % | | | 3.42 | % | | | (0.94 | )% | |
Ratios to Average Net Assets and Supplemental Data: | |
Net Assets, End of Period (Thousands) | | $ | 323,386 | | | $ | 361,680 | | | $ | 553,319 | | | $ | 471,790 | | | $ | 1,192,624 | | |
Ratio of Expenses Before Expense Limitation | | | 1.05 | % | | | 1.10 | % | | | 1.07 | % | | | 1.04 | % | | | 1.05 | % | |
Ratio of Expenses After Expense Limitation | | | 1.00 | %(4) | | | 1.03 | %(4)(5) | | | 1.05 | %(4) | | | 1.04 | %(4) | | | 1.05 | %(4) | |
Ratio of Expenses After Expense Limitation
Excluding Non Operating Expenses | | | 1.00 | %(4) | | | 1.03 | %(4) | | | 1.05 | %(4) | | | N/A | | | | 1.05 | %(4) | |
Ratio of Net Investment Income | | | 2.36 | %(4) | | | 2.54 | %(4) | | | 2.20 | %(4) | | | 1.88 | %(4) | | | 1.65 | %(4) | |
Ratio of Rebate from Morgan Stanley Affiliates | | | 0.00 | %(6) | | | 0.00 | %(6) | | | 0.00 | %(6) | | | 0.00 | %(6) | | | 0.00 | %(6) | |
Portfolio Turnover Rate | | | 24 | % | | | 38 | % | | | 39 | % | | | 26 | % | | | 29 | % | |
(1) Reflects prior period custodian out-of-pocket expenses that were reimbursed in September 2016. The amount of the reimbursement was immaterial on a per share basis and did not impact the total return of Class I shares. The Ratio of Expenses After Expense Limitation would have been less than 0.005% higher and the Ratio of Net Investment Income would have been less than 0.005% lower had the custodian not reimbursed the Fund.
(2) Per share amount is based on average shares outstanding.
(3) Calculated based on the net asset value as of the last business day of the period.
(4) The Ratio of Expenses After Expense Limitation and Ratio of Net Investment Income reflect the rebate of certain Fund expenses in connection with the investments in Morgan Stanley affiliates during the period. The effect of the rebate on the ratios is disclosed in the above table as "Ratio of Rebate from Morgan Stanley Affiliates."
(5) Effective July 1, 2018, the Adviser has agreed to limit the ratio of expenses to average net assets to the maximum ratio of 1.00% for Class I shares. Prior to July 1, 2018, the maximum ratio was 1.05% for Class I shares.
(6) Amount is less than 0.005%.
The accompanying notes are an integral part of the financial statements.
16
Morgan Stanley Institutional Fund, Inc.
Annual Report — December 31, 2019
Financial Highlights
Global Real Estate Portfolio
| | | Class A | |
| | | Year Ended December 31, | |
Selected Per Share Data and Ratios | | 2019 | | 2018 | | 2017 | | 2016(1) | | 2015 | |
Net Asset Value, Beginning of Period | | $ | 9.17 | | | $ | 11.10 | | | $ | 10.71 | | | $ | 10.74 | | | $ | 11.05 | | |
Income (Loss) from Investment Operations: | |
Net Investment Income(2) | | | 0.21 | | | | 0.23 | | | | 0.17 | | | | 0.17 | | | | 0.16 | | |
Net Realized and Unrealized Gain (Loss) | | | 1.41 | | | | (1.10 | ) | | | 0.84 | | | | 0.16 | | | | (0.30 | ) | |
Total from Investment Operations | | | 1.62 | | | | (0.87 | ) | | | 1.01 | | | | 0.33 | | | | (0.14 | ) | |
Distributions from and/or in Excess of: | |
Net Investment Income | | | (0.49 | ) | | | (0.47 | ) | | | (0.09 | ) | | | (0.30 | ) | | | (0.17 | ) | |
Net Realized Gain | | | (0.45 | ) | | | (0.59 | ) | | | (0.53 | ) | | | (0.04 | ) | | | — | | |
Paid-in-Capital | | | — | | | | — | | | | — | | | | (0.02 | ) | | | — | | |
Total Distributions | | | (0.94 | ) | | | (1.06 | ) | | | (0.62 | ) | | | (0.36 | ) | | | (0.17 | ) | |
Net Asset Value, End of Period | | $ | 9.85 | | | $ | 9.17 | | | $ | 11.10 | | | $ | 10.71 | | | $ | 10.74 | | |
Total Return(3) | | | 17.90 | % | | | (8.19 | )% | | | 9.44 | % | | | 3.12 | % | | | (1.25 | )% | |
Ratios to Average Net Assets and Supplemental Data: | |
Net Assets, End of Period (Thousands) | | $ | 10,728 | | | $ | 12,775 | | | $ | 17,701 | | | $ | 92,730 | | | $ | 135,517 | | |
Ratio of Expenses Before Expense Limitation | | | 1.37 | % | | | 1.39 | % | | | N/A | | | | 1.36 | % | | | N/A | | |
Ratio of Expenses After Expense Limitation | | | 1.35 | %(4) | | | 1.38 | %(4)(5) | | | 1.35 | %(4) | | | 1.35 | %(4) | | | 1.34 | %(4) | |
Ratio of Expenses After Expense Limitation
Excluding Non Operating Expenses | | | 1.35 | %(4) | | | 1.38 | %(4) | | | 1.35 | %(4) | | | N/A | | | | 1.34 | %(4) | |
Ratio of Net Investment Income | | | 2.00 | %(4) | | | 2.18 | %(4) | | | 1.55 | %(4) | | | 1.51 | %(4) | | | 1.47 | %(4) | |
Ratio of Rebate from Morgan Stanley Affiliates | | | 0.00 | %(6) | | | 0.00 | %(6) | | | 0.00 | %(6) | | | 0.00 | %(6) | | | 0.00 | %(6) | |
Portfolio Turnover Rate | | | 24 | % | | | 38 | % | | | 39 | % | | | 26 | % | | | 29 | % | |
(1) Reflects prior period custodian out-of-pocket expenses that were reimbursed in September 2016. The amount of the reimbursement was immaterial on a per share basis and did not impact the total return of Class A shares. The Ratio of Expenses After Expense Limitation would have been 0.01% higher and the Ratio of Net Investment Income would have been 0.01% lower had the custodian not reimbursed the Fund.
(2) Per share amount is based on average shares outstanding.
(3) Calculated based on the net asset value which does not reflect sales charges, if applicable, as of the last business day of the period.
(4) The Ratio of Expenses After Expense Limitation and Ratio of Net Investment Income reflect the rebate of certain Fund expenses in connection with the investments in Morgan Stanley affiliates during the period. The effect of the rebate on the ratios is disclosed in the above table as "Ratio of Rebate from Morgan Stanley Affiliates."
(5) Effective July 1, 2018, the Adviser has agreed to limit the ratio of expenses to average net assets to the maximum ratio of 1.35% for Class A shares. Prior to July 1, 2018, the maximum ratio was 1.40% for Class A shares.
(6) Amount is less than 0.005%.
The accompanying notes are an integral part of the financial statements.
17
Morgan Stanley Institutional Fund, Inc.
Annual Report — December 31, 2019
Financial Highlights
Global Real Estate Portfolio
| | | Class L | |
| | | Year Ended December 31, | |
Selected Per Share Data and Ratios | | 2019 | | 2018 | | 2017 | | 2016(1) | | 2015 | |
Net Asset Value, Beginning of Period | | $ | 9.09 | | | $ | 11.01 | | | $ | 10.64 | | | $ | 10.61 | | | $ | 10.91 | | |
Income (Loss) from Investment Operations: | |
Net Investment Income(2) | | | 0.16 | | | | 0.17 | | | | 0.14 | | | | 0.12 | | | | 0.12 | | |
Net Realized and Unrealized Gain (Loss) | | | 1.40 | | | | (1.09 | ) | | | 0.81 | | | | 0.16 | | | | (0.31 | ) | |
Total from Investment Operations | | | 1.56 | | | | (0.92 | ) | | | 0.95 | | | | 0.28 | | | | (0.19 | ) | |
Distributions from and/or in Excess of: | |
Net Investment Income | | | (0.45 | ) | | | (0.41 | ) | | | (0.05 | ) | | | (0.19 | ) | | | (0.11 | ) | |
Net Realized Gain | | | (0.45 | ) | | | (0.59 | ) | | | (0.53 | ) | | | (0.04 | ) | | | — | | |
Paid-in-Capital | | | — | | | | — | | | | — | | | | (0.02 | ) | | | — | | |
Total Distributions | | | (0.90 | ) | | | (1.00 | ) | | | (0.58 | ) | | | (0.25 | ) | | | (0.11 | ) | |
Net Asset Value, End of Period | | $ | 9.75 | | | $ | 9.09 | | | $ | 11.01 | | | $ | 10.64 | | | $ | 10.61 | | |
Total Return(3) | | | 17.37 | % | | | (8.74 | )% | | | 8.89 | % | | | 2.65 | % | | | (1.71 | )% | |
Ratios to Average Net Assets and Supplemental Data: | |
Net Assets, End of Period (Thousands) | | $ | 1,419 | | | $ | 1,220 | | | $ | 1,344 | | | $ | 1,483 | | | $ | 4,509 | | |
Ratio of Expenses Before Expense Limitation | | | 1.91 | % | | | 2.02 | % | | | 1.93 | % | | | 1.82 | % | | | N/A | | |
Ratio of Expenses After Expense Limitation | | | 1.85 | %(4) | | | 1.88 | %(4)(5) | | | 1.90 | %(4) | | | 1.82 | %(4) | | | 1.78 | %(4) | |
Ratio of Expenses After Expense Limitation
Excluding Non Operating Expenses | | | 1.85 | %(4) | | | 1.88 | %(4) | | | 1.90 | %(4) | | | N/A | | | | 1.77 | %(4) | |
Ratio of Net Investment Income | | | 1.54 | %(4) | | | 1.64 | %(4) | | | 1.32 | %(4) | | | 1.07 | %(4) | | | 1.12 | %(4) | |
Ratio of Rebate from Morgan Stanley Affiliates | | | 0.00 | %(6) | | | 0.00 | %(6) | | | 0.00 | %(6) | | | 0.00 | %(6) | | | 0.00 | %(6) | |
Portfolio Turnover Rate | | | 24 | % | | | 38 | % | | | 39 | % | | | 26 | % | | | 29 | % | |
(1) Reflects prior period custodian out-of-pocket expenses that were reimbursed in September 2016. The amount of the reimbursement was immaterial on a per share basis and did not impact the total return of Class L shares. The Ratio of Expenses After Expense Limitation would have been less than 0.005% higher and the Ratio of Net Investment Income would have been less than 0.005% lower had the custodian not reimbursed the Fund.
(2) Per share amount is based on average shares outstanding.
(3) Calculated based on the net asset value as of the last business day of the period.
(4) The Ratio of Expenses After Expense Limitation and Ratio of Net Investment Income reflect the rebate of certain Fund expenses in connection with the investments in Morgan Stanley affiliates during the period. The effect of the rebate on the ratios is disclosed in the above table as "Ratio of Rebate from Morgan Stanley Affiliates."
(5) Effective July 1, 2018, the Adviser has agreed to limit the ratio of expenses to average net assets to the maximum ratio of 1.85% for Class L shares. Prior to July 1, 2018, the maximum ratio was 1.90% for Class L shares.
(6) Amount is less than 0.005%.
The accompanying notes are an integral part of the financial statements.
18
Morgan Stanley Institutional Fund, Inc.
Annual Report — December 31, 2019
Financial Highlights
Global Real Estate Portfolio
| | | Class C | |
| | | Year Ended December 31, | | Period from
April 30, 2015(2) to | |
Selected Per Share Data and Ratios | | 2019 | | 2018 | | 2017 | | 2016(1) | | December 31, 2015 | |
Net Asset Value, Beginning of Period | | $ | 8.92 | | | $ | 10.83 | | | $ | 10.49 | | | $ | 10.56 | | | $ | 11.23 | | |
Income (Loss) from Investment Operations: | |
Net Investment Income(3) | | | 0.13 | | | | 0.16 | | | | 0.12 | | | | 0.08 | | | | 0.07 | | |
Net Realized and Unrealized Gain (Loss) | | | 1.37 | | | | (1.09 | ) | | | 0.78 | | | | 0.16 | | | | (0.60 | ) | |
Total from Investment Operations | | | 1.50 | | | | (0.93 | ) | | | 0.90 | | | | 0.24 | | | | (0.53 | ) | |
Distributions from and/or in Excess of: | |
Net Investment Income | | | (0.41 | ) | | | (0.39 | ) | | | (0.03 | ) | | | (0.25 | ) | | | (0.14 | ) | |
Net Realized Gain | | | (0.45 | ) | | | (0.59 | ) | | | (0.53 | ) | | | (0.04 | ) | | | — | | |
Paid-in-Capital | | | — | | | | — | | | | — | | | | (0.02 | ) | | | — | | |
Total Distributions | | | (0.86 | ) | | | (0.98 | ) | | | (0.56 | ) | | | (0.31 | ) | | | (0.14 | ) | |
Net Asset Value, End of Period | | $ | 9.56 | | | $ | 8.92 | | | $ | 10.83 | | | $ | 10.49 | | | $ | 10.56 | | |
Total Return(4) | | | 16.98 | % | | | (8.93 | )% | | | 8.54 | % | | | 2.31 | % | | | (4.71 | )%(8) | |
Ratios to Average Net Assets and Supplemental Data: | |
Net Assets, End of Period (Thousands) | | $ | 397 | | | $ | 428 | | | $ | 327 | | | $ | 305 | | | $ | 191 | | |
Ratio of Expenses Before Expense Limitation | | | 2.51 | % | | | 2.47 | % | | | 2.69 | % | | | 2.86 | % | | | 3.25 | %(9) | |
Ratio of Expenses After Expense Limitation | | | 2.10 | %(5) | | | 2.12 | %(5)(6) | | | 2.15 | %(5) | | | 2.15 | %(5) | | | 2.15 | %(5)(9) | |
Ratio of Expenses After Expense Limitation
Excluding Non Operating Expenses | | | 2.10 | %(5) | | | 2.12 | %(5) | | | 2.15 | %(5) | | | N/A | | | | 2.15 | %(5)(9) | |
Ratio of Net Investment Income | | | 1.26 | %(5) | | | 1.53 | %(5) | | | 1.11 | %(5) | | | 0.75 | %(5) | | | 1.01 | %(5)(9) | |
Ratio of Rebate from Morgan Stanley Affiliates | | | 0.00 | %(7) | | | 0.00 | %(7) | | | 0.00 | %(7) | | | 0.00 | %(7) | | | 0.00 | %(7)(9) | |
Portfolio Turnover Rate | | | 24 | % | | | 38 | % | | | 39 | % | | | 26 | % | | | 29 | % | |
(1) Reflects prior period custodian out-of-pocket expenses that were reimbursed in September 2016. The amount of the reimbursement was immaterial on a per share basis and did not impact the total return of Class C shares. The Ratio of Expenses After Expense Limitation and the Ratio of Net Investment Income would be unchanged as the reimbursement of custodian fees was offset against expense waivers/reimbursements with no impact to net expenses or net investment income.
(2) Commencement of Offering.
(3) Per share amount is based on average shares outstanding.
(4) Calculated based on the net asset value which does not reflect sales charges, if applicable, as of the last business day of the period.
(5) The Ratio of Expenses After Expense Limitation and Ratio of Net Investment Income reflect the rebate of certain Fund expenses in connection with the investments in Morgan Stanley affiliates during the period. The effect of the rebate on the ratios is disclosed in the above table as "Ratio of Rebate from Morgan Stanley Affiliates."
(6) Effective July 1, 2018, the Adviser has agreed to limit the ratio of expenses to average net assets to the maximum ratio of 2.10% for Class C shares. Prior to July 1, 2018, the maximum ratio was 2.15% for Class C shares.
(7) Amount is less than 0.005%.
(8) Not annualized.
(9) Annualized.
The accompanying notes are an integral part of the financial statements.
19
Morgan Stanley Institutional Fund, Inc.
Annual Report — December 31, 2019
Financial Highlights
Global Real Estate Portfolio
| | | Class IS | |
| | | Year Ended December 31, | |
Selected Per Share Data and Ratios | | 2019 | | 2018 | | 2017 | | 2016(1) | | 2015 | |
Net Asset Value, Beginning of Period | | $ | 9.19 | | | $ | 11.13 | | | $ | 10.76 | | | $ | 10.81 | | | $ | 11.11 | | |
Income (Loss) from Investment Operations: | |
Net Investment Income(2) | | | 0.25 | | | | 0.28 | | | | 0.25 | | | | 0.22 | | | | 0.20 | | |
Net Realized and Unrealized Gain (Loss) | | | 1.43 | | | | (1.11 | ) | | | 0.81 | | | | 0.15 | | | | (0.29 | ) | |
Total from Investment Operations | | | 1.68 | | | | (0.83 | ) | | | 1.06 | | | | 0.37 | | | | (0.09 | ) | |
Distributions from and/or in Excess of: | |
Net Investment Income | | | (0.55 | ) | | | (0.52 | ) | | | (0.16 | ) | | | (0.36 | ) | | | (0.21 | ) | |
Net Realized Gain | | | (0.45 | ) | | | (0.59 | ) | | | (0.53 | ) | | | (0.04 | ) | | | — | | |
Paid-in-Capital | | | — | | | | — | | | | — | | | | (0.02 | ) | | | — | | |
Total Distributions | | | (1.00 | ) | | | (1.11 | ) | | | (0.69 | ) | | | (0.42 | ) | | | (0.21 | ) | |
Net Asset Value, End of Period | | $ | 9.87 | | | $ | 9.19 | | | $ | 11.13 | | | $ | 10.76 | | | $ | 10.81 | | |
Total Return(3) | | | 18.43 | % | | | (7.83 | )% | | | 9.80 | % | | | 3.45 | % | | | (0.84 | )% | |
Ratios to Average Net Assets and Supplemental Data: | |
Net Assets, End of Period (Thousands) | | $ | 350,363 | | | $ | 517,658 | | | $ | 1,049,646 | | | $ | 1,255,498 | | | $ | 1,012,883 | | |
Ratio of Expenses Before Expense Limitation | | | 0.94 | % | | | N/A | | | | N/A | | | | 0.97 | % | | | N/A | | |
Ratio of Expenses After Expense Limitation | | | 0.94 | %(4) | | | 0.95 | %(4)(5) | | | 0.97 | %(4) | | | 0.96 | %(4) | | | 0.97 | %(4) | |
Ratio of Expenses After Expense Limitation
Excluding Non Operating Expenses | | | 0.94 | %(4) | | | 0.95 | %(4) | | | 0.97 | %(4) | | | N/A | | | | 0.97 | %(4) | |
Ratio of Net Investment Income | | | 2.41 | %(4) | | | 2.58 | % | | | 2.26 | %(4) | | | 2.01 | %(4) | | | 1.78 | %(4) | |
Ratio of Rebate from Morgan Stanley Affiliates | | | 0.00 | %(6) | | | 0.00 | %(6) | | | 0.00 | %(6) | | | 0.00 | %(6) | | | 0.00 | %(6) | |
Portfolio Turnover Rate | | | 24 | % | | | 38 | % | | | 39 | % | | | 26 | % | | | 29 | % | |
(1) Reflects prior period custodian out-of-pocket expenses that were reimbursed in September 2016. The amount of the reimbursement was immaterial on a per share basis and did not impact the total return of Class IS shares. The Ratio of Expenses After Expense Limitation would have been 0.01% higher and the Ratio of Net Investment Income would have been 0.01% lower had the custodian not reimbursed the Fund.
(2) Per share amount is based on average shares outstanding.
(3) Calculated based on the net asset value as of the last business day of the period.
(4) The Ratio of Expenses After Expense Limitation and Ratio of Net Investment Income reflect the rebate of certain Fund expenses in connection with the investments in Morgan Stanley affiliates during the period. The effect of the rebate on the ratios is disclosed in the above table as "Ratio of Rebate from Morgan Stanley Affiliates."
(5) Effective July 1, 2018, the Adviser has agreed to limit the ratio of expenses to average net assets to the maximum ratio of 0.94% for Class IS shares. Prior to July 1, 2018, the maximum ratio was 0.99% for Class IS shares.
(6) Amount is less than 0.005%.
The accompanying notes are an integral part of the financial statements.
20
Morgan Stanley Institutional Fund, Inc.
Annual Report — December 31, 2019
Financial Highlights
Global Real Estate Portfolio
| | | Class IR | |
Selected Per Share Data and Ratios | | Year Ended
December 31, 2019 | | Period from
June 15, 2018(1) to
December 31, 2018 | |
Net Asset Value, Beginning of Period | | $ | 9.19 | | | $ | 11.09 | | |
Income (Loss) from Investment Operations: | |
Net Investment Income(2) | | | 0.25 | | | | 0.23 | | |
Net Realized and Unrealized Gain (Loss) | | | 1.43 | | | | (1.02 | ) | |
Total from Investment Operations | | | 1.68 | | | | (0.79 | ) | |
Distributions from and/or in Excess of: | |
Net Investment Income | | | (0.55 | ) | | | (0.52 | ) | |
Net Realized Gain | | | (0.45 | ) | | | (0.59 | ) | |
Total Distributions | | | (1.00 | ) | | | (1.11 | ) | |
Net Asset Value, End of Period | | $ | 9.87 | | | $ | 9.19 | | |
Total Return(3) | | | 18.44 | % | | | (7.49 | )%(7) | |
Ratios to Average Net Assets and Supplemental Data: | |
Net Assets, End of Period, (Thousands) | | $ | 10 | | | $ | 8 | | |
Ratio of Expenses Before Expense Limitation | | | 21.38 | % | | | 18.72 | %(8) | |
Ratio of Expenses After Expense Limitation | | | 0.94 | %(4) | | | 0.94 | %(4)(5)(8) | |
Ratios of Expenses After Expense Limitation Excluding Non Operating Expenses | | | 0.94 | %(4) | | | N/A | | |
Ratio of Net Investment Income | | | 2.45 | %(4) | | | 3.94 | %(4)(8) | |
Ratio of Rebate from Morgan Stanley Affiliates | | | 0.00 | %(6) | | | 0.00 | %(6)(8) | |
Portfolio Turnover Rate | | | 24 | % | | | 38 | % | |
(1) Commencement of Offering.
(2) Per share amount is based on average shares outstanding.
(3) Calculated based on the net asset value as of the last business day of the period.
(4) The Ratio of Expenses After Expense Limitation and Ratio of Net Investment Income reflect the rebate of certain Fund expenses in connection with the investments in Morgan Stanley affiliates during the period. The effect of the rebate on the ratios is disclosed in the above table as "Ratio of Rebate from Morgan Stanley Affiliates."
(5) Effective July 1, 2018, the Adviser has agreed to limit the ratio of expenses to average net assets to the maximum ratio of 0.94% for Class IR shares. Prior to July 1, 2018, the maximum ratio was 0.99% for Class IR shares.
(6) Amount is less than 0.005%.
(7) Not annualized.
(8) Annualized.
The accompanying notes are an integral part of the financial statements.
21
Morgan Stanley Institutional Fund, Inc.
Annual Report — December 31, 2019
Notes to Financial Statements
Morgan Stanley Institutional Fund, Inc. (the "Company") is registered under the Investment Company Act of 1940, as amended (the "Act"), as an open-end management investment company. The Company is comprised of thirty-two separate, active, diversified and non-diversified funds (individually referred to as a "Fund," collectively as the "Funds"). The Company applies investment company accounting and reporting guidance.
The accompanying financial statements relate to the Global Real Estate Portfolio. The Fund seeks to provide current income and capital appreciation. The Fund has capital subscription commitments to an investee company for this same purpose, the details of which are disclosed in the Unfunded Commitments note.
The Fund offers six classes of shares — Class I, Class A, Class L, Class C, Class IS, and Class IR. On April 30, 2015, the Fund suspended offering of Class L shares. Existing Class L shareholders may invest through reinvestment of dividends and distributions.
A. Significant Accounting Policies: The following significant accounting policies are in conformity with U.S. generally accepted accounting principles ("GAAP"). Such policies are consistently followed by the Company in the preparation of its financial statements. GAAP may require management to make estimates and assumptions that affect the reported amounts and disclosures in the financial statements. Actual results may differ from those estimates.
In August 2018, the Financial Accounting Standards Board ("FASB") issued Accounting Standards Update ("ASU") 2018-13, Fair Value Measurement (Topic 820) — Disclosures Framework — Changes to Disclosure Requirements of Fair Value Measurement ("ASU 2018-13") which introduces new fair value disclosure requirements as well as eliminates and modifies certain existing fair value disclosure requirements. ASU 2018-13 would be effective for fiscal years beginning after December 15, 2019 and for interim periods within those fiscal years; however, management has elected to early adopt ASU 2018-13 as permitted by the standard. The impact of the Fund's adoption was limited to changes in the Fund's financial statement disclosures regarding fair value, primarily those disclosures related to transfers between levels of the fair value hierarchy and disclosure of the range and weighted average used to develop significant unobservable inputs for Level 3 fair value measurements, when applicable.
1. Security Valuation: (1) An equity portfolio security listed or traded on an exchange is valued at its latest reported sales price (or at the exchange official closing price
if such exchange reports an official closing price), and if there were no sales on a given day and if there is no official exchange closing price for that day, the security is valued at the mean between the last reported bid and asked prices if such bid and asked prices are available on the relevant exchanges. If only bid prices are available then the latest bid price may be used. Listed equity securities not traded on the valuation date with no reported bid and asked prices available on the exchange are valued at the mean between the current bid and asked prices obtained from one or more reputable brokers or dealers. In cases where a security is traded on more than one exchange, the security is valued on the exchange designated as the primary market; (2) all other equity portfolio securities for which over-the-counter ("OTC") market quotations are readily available are valued at the latest reported sales price (or at the market official closing price if such market reports an official closing price), and if there was no trading in the security on a given day and if there is no official closing price from relevant markets for that day, the security is valued at the mean between the last reported bid and asked prices if such bid and asked prices are available on the relevant markets. An unlisted equity security that does not trade on the valuation date and for which bid and asked prices from the relevant markets are unavailable is valued at the mean between the current bid and asked prices obtained from one or more reputable brokers or dealers; (3) certain portfolio securities may be valued by an outside pricing service/vendor approved by the Company's Board of Directors (the "Directors"). The pricing service/vendor may employ a pricing model that takes into account, among other things, bids, yield spreads and/or other market data and specific security characteristics. Alternatively, if a valuation is not available from an outside pricing service/vendor, and the security trades on an exchange, the security may be valued at its latest reported sale price (or at the exchange official closing price if such exchange reports an official closing price), prior to the time when assets are valued. If there are no sales on a given day and if there is no official exchange closing price for that day, the security is valued at the mean between the last reported bid and asked prices if such bid and asked prices are available in the relevant exchanges. If Morgan Stanley Investment Management Inc. (the "Adviser") or Morgan Stanley Investment Management Limited ("MSIM Limited") and Morgan Stanley Investment Management Company ("MSIM Company") (together, the "Sub-Advisers"), each
22
Morgan Stanley Institutional Fund, Inc.
Annual Report — December 31, 2019
Notes to Financial Statements (cont'd)
a wholly-owned subsidiary of Morgan Stanley, determines that the price provided by the outside pricing service/vendor or exchange does not reflect the security's fair value or is unable to provide a price, prices from brokers or dealers may also be utilized. In these circumstances, the value of the security will be the mean of bid and asked prices obtained from brokers or dealers; (4) when market quotations are not readily available, including circumstances under which the Adviser or Sub-Advisers determine that the closing price, last sale price or the mean between the last reported bid and asked prices are not reflective of a security's market value, portfolio securities are valued at their fair value as determined in good faith under procedures established by and under the general supervision of the Directors. Occasionally, developments affecting the closing prices of securities and other assets may occur between the times at which valuations of such securities are determined (that is, close of the foreign market on which the securities trade) and the close of business of the New York Stock Exchange ("NYSE"). If developments occur during such periods that are expected to materially affect the value of such securities, such valuations may be adjusted to reflect the estimated fair value of such securities as of the close of the NYSE, as determined in good faith by the Directors or by the Adviser using a pricing service and/or procedures approved by the Directors; (5) quotations of foreign portfolio securities, other assets and liabilities and forward contracts stated in foreign currency are translated into U.S. dollar equivalents at the prevailing market rates prior to the close of the NYSE; and (6) investments in mutual funds, including the Morgan Stanley Institutional Liquidity Funds, are valued at the net asset value ("NAV") as of the close of each business day.
The Directors have responsibility for determining in good faith the fair value of the investments, and the Directors may appoint others, such as the Company's Adviser or a valuation committee, to assist the Directors in determining fair value and to make the actual calculations pursuant to the fair valuation methodologies previously approved by the Directors. Under procedures approved by the Directors, the Company's Adviser has formed a Valuation Committee whose members are approved by the Directors. The Valuation Committee provides administration and oversight of the Company's valuation policies and procedures, which are reviewed at least annually by the Directors. These procedures allow the Company to utilize independent pricing services, quotations from securities
and financial instrument dealers and other market sources to determine fair value.
The Fund invests a significant portion of its assets in securities of real estate investment trusts ("REITs"). The market's perception of prospective declines in private real estate values and other financial assets may result in increased volatility of market prices that can negatively impact the valuation of certain issuers held by the Fund.
2. Fair Value Measurement: FASB Accounting Standards CodificationTM ("ASC") 820, "Fair Value Measurement" ("ASC 820"), defines fair value as the value that the Fund would receive to sell an investment or pay to transfer a liability in a timely transaction with an independent buyer in the principal market, or in the absence of a principal market, the most advantageous market for the investment or liability. ASC 820 establishes a three-tier hierarchy to distinguish between (1) inputs that reflect the assumptions market participants would use in valuing an asset or liability developed based on market data obtained from sources independent of the reporting entity (observable inputs) and (2) inputs that reflect the reporting entity's own assumptions about the assumptions market participants would use in valuing an asset or liability developed based on the best information available in the circumstances (unobservable inputs) and to establish classification of fair value measurements for disclosure purposes. Various inputs are used in determining the value of the Fund's investments. The inputs are summarized in the three broad levels listed below:
• Level 1 – unadjusted quoted prices in active markets for identical investments
• Level 2 – other significant observable inputs (including quoted prices for similar investments, interest rates, prepayment speeds, credit risk, etc.)
• Level 3 – significant unobservable inputs including the Fund's own assumptions in determining the fair value of investments. Factors considered in making this determination may include, but are not limited to, information obtained by contacting the issuer, analysts, or the appropriate stock exchange (for exchange-traded securities), analysis of the issuer's financial statements or other available documents and, if necessary, available information concerning other securities in similar circumstances.
23
Morgan Stanley Institutional Fund, Inc.
Annual Report — December 31, 2019
Notes to Financial Statements (cont'd)
The inputs or methodology used for valuing securities are not necessarily an indication of the risk associated with investing in those securities and the determination of the significance of a particular input to the fair value measurement in its entirety requires judgment and considers factors specific to each security.
The following is a summary of the inputs used to value the Fund's investments as of December 31, 2019:
Investment Type | | Level 1
Unadjusted
quoted
prices
(000) | | Level 2
Other
significant
observable
inputs
(000) | | Level 3
Significant
unobservable
inputs
(000) | | Total
(000) | |
Assets: | |
Common Stocks | |
Diversified | | $ | 113,077 | | | $ | 47,655 | | | $ | — | | | $ | 160,732 | | |
Health Care | | | 20,284 | | | | — | | | | — | | | | 20,284 | | |
Industrial | | | 32,175 | | | | 4,642 | | | | 128 | | | | 36,945 | | |
Industrial/
Office Mixed | | | 3,254 | | | | 1,538 | | | | — | | | | 4,792 | | |
Lodging/Resorts | | | 35,315 | | | | 2,627 | | | | — | | | | 37,942 | | |
Office | | | 127,753 | | | | 22,835 | | | | — | | | | 150,588 | | |
Residential | | | 80,440 | | | | 24,722 | | | | 19 | | | | 105,181 | | |
Retail | | | 137,377 | | | | 2,869 | | | | — | | | | 140,246 | | |
Self Storage | | | 18,080 | | | | — | | | | — | | | | 18,080 | | |
Specialty | | | 3,941 | | | | — | | | | — | | | | 3,941 | | |
Total Common Stocks | | | 571,696 | | | | 106,888 | | | | 147 | | | | 678,731 | | |
Short-Term Investment | |
Investment Company | | | 287 | | | | — | | | | — | | | | 287 | | |
Total Assets | | $ | 571,983 | | | $ | 106,888 | | | $ | 147 | | | $ | 679,018 | | |
Transfers between investment levels may occur as the markets fluctuate and/or the availability of data used in an investment's valuation changes.
Following is a reconciliation of investments in which significant unobservable inputs (Level 3) were used in determining fair value:
| | | Common
Stocks
(000) | |
Beginning Balance | | $ | 145 | | |
Purchases | | | — | | |
Sales | | | — | | |
Amortization of discount | | | — | | |
Transfers in | | | — | | |
Transfers out | | | — | | |
Corporate actions | | | — | | |
Change in unrealized appreciation (depreciation) | | | 2 | | |
Realized gains (losses) | | | — | | |
Ending Balance | | $ | 147 | | |
Net change in unrealized appreciation (depreciation) from investments
still held as of December 31, 2019 | | $ | 2 | | |
The following table presents additional information about valuation techniques and inputs used for investments that are measured at fair value and categorized within Level 3 as of December 31, 2019. Various valuation techniques were used in the valuation of certain investments and weighted based on the level of significance.
| | | Fair Value at
December 31, 2019
(000) | | Valuation
Technique | | Unobservable
Input | | Amount* | | Impact to
Valuation from an
Increase in Input** | |
Common Stocks
| | $ | 147
| | | Reported Capital balance,
adjustments for NAV practical
expedient; including adjustments
for subsequent Capital Calls,
Return of Capital and Significant
Market Changes between last
Capital Statement and
Valuation Date | | Adjusted
Capital Balance | | | | | |
| |
| | Market Transaction Method
| | Transaction
Valuation | | $ | 0.001 | | | Increase | |
| |
| |
| | Discount for Lack
of Marketability | | | 50.0 | % | | Decrease | |
* Amount is indicative of the weighted average.
** Represents the expected directional change in the fair value of the Level 3 investments that would result from an increase in the corresponding input. A decrease to the unobservable input would have the opposite effect. Significant changes in these inputs could result in significantly higher or lower fair value measurements.
24
Morgan Stanley Institutional Fund, Inc.
Annual Report — December 31, 2019
Notes to Financial Statements (cont'd)
3. Foreign Currency Translation and Foreign Investments: The books and records of the Fund are maintained in U.S. dollars. Foreign currency amounts are translated into U.S. dollars as follows:
– investments, other assets and liabilities at the prevailing rate of exchange on the valuation date;
– investment transactions and investment income at the prevailing rates of exchange on the dates of such transactions.
Although the net assets of the Fund are presented at the foreign exchange rates and market values at the close of the period, the Fund does not isolate that portion of the results of operations arising as a result of changes in the foreign exchange rates from the fluctuations arising from changes in the market prices of securities held at period end. Similarly, the Fund does not isolate the effect of changes in foreign exchange rates from the fluctuations arising from changes in the market prices of securities sold during the period. Accordingly, realized and unrealized foreign currency gains (losses) on investments in securities are included in the reported net realized and unrealized gains (losses) on investment transactions and balances. However, pursuant to U.S. federal income tax regulations, gains and losses from certain foreign currency transactions and the foreign currency portion of gains and losses realized on sales and maturities of foreign denominated debt securities are treated as ordinary income for U.S. federal income tax purposes.
Net realized gains (losses) on foreign currency transactions represent net foreign exchange gains (losses) from foreign currency forward exchange contracts, disposition of foreign currencies, currency gains (losses) realized between the trade and settlement dates on securities transactions, and the difference between the amount of investment income and foreign withholding taxes recorded on the Fund's books and the U.S. dollar equivalent amounts actually received or paid. The change in unrealized currency gains (losses) on foreign currency transactions for the period is reflected in the Statement of Operations.
Foreign security and currency transactions may involve certain considerations and risks not typically associated with those of U.S. dollar denominated transactions as a result of, among other factors, fluctuations of exchange
rates in relation to the U.S. dollar, the possibility of lower levels of governmental supervision and regulation of foreign securities markets and the possibility of political or economic instability.
Governmental approval for foreign investments may be required in advance of making an investment under certain circumstances in some countries, and the extent of foreign investments in domestic companies may be subject to limitation in other countries. Foreign ownership limitations also may be imposed by the charters of individual companies to prevent, among other concerns, violations of foreign investment limitations. As a result, an additional class of shares (identified as "Foreign" in the Portfolio of Investments) may be created and offered for investment. The "local" and "foreign shares" market values may differ. In the absence of trading of the foreign shares in such markets, the Fund values the foreign shares at the closing exchange price of the local shares.
4. Unfunded Commitments: Subject to the terms of a Subscription Agreement between the Fund and Exeter Industrial Value Fund LP, the Fund has made a subscription commitment of $2,000,000 for which it will receive 2,000,000 shares of common stock. As of December 31, 2019, Exeter Industrial Value Fund LP has drawn down approximately $1,860,000, which represents 93.0% of the commitment.
5. Restricted Securities: The Fund invests in unregistered or otherwise restricted securities. The term "restricted securities" refers to securities that are unregistered or are held by control persons of the issuer and securities that are subject to contractual restrictions on their resale. As a result, restricted securities may be more difficult to value and the Fund may have difficulty disposing of such assets either in a timely manner or for a reasonable price. In order to dispose of an unregistered security, the Fund, where it has contractual rights to do so, may have to cause such security to be registered. A considerable period may elapse between the time the decision is made to sell the security and the time the security is registered so that the Fund can sell it. Contractual restrictions on the resale of securities vary in length and scope and are generally the result of a negotiation between the issuer and the acquirer of the securities. The Fund would, in either case, bear market risks during that period. Restricted securities are identified in the Portfolio of Investments.
25
Morgan Stanley Institutional Fund, Inc.
Annual Report — December 31, 2019
Notes to Financial Statements (cont'd)
6. Indemnifications: The Company enters into contracts that contain a variety of indemnifications. The Company's maximum exposure under these arrangements is unknown. However, the Company has not had prior claims or losses pursuant to these contracts and expects the risk of loss to be remote.
7. Dividends and Distributions to Shareholders: Dividends and distributions to shareholders are recorded on the ex-dividend date. Dividends from net investment income, if any, are declared and paid annually. Net realized capital gains, if any, are distributed at least annually.
8. Security Transactions, Income and Expenses: Security transactions are accounted for on the trade date (date the order to buy or sell is executed). Realized gains and losses on the sale of investment securities are determined on the specific identified cost method. Dividend income and other distributions are recorded on the ex-dividend date (except for certain foreign dividends which may be recorded as soon as the Fund is informed of such dividends) net of applicable withholding taxes. Interest income is recognized on the accrual basis except where collection is in doubt. Discounts are accreted and premiums are amortized over the life of the respective securities. Most expenses of the Company can be directly attributed to a particular Fund. Expenses which cannot be directly attributed are apportioned among the Funds based upon relative net assets or other appropriate methods. Income, expenses (other than class specific expenses — distribution and shareholder services, transfer agency and sub transfer agency fees) and realized and unrealized gains or losses are allocated to each class of shares based upon their relative net assets.
The Fund owns shares of REITs which report information on the source of their distributions annually in the following calendar year. A portion of distributions received from REITs during the year is estimated to be a return of capital and is recorded as a reduction of their cost.
B. Advisory/Sub-Advisory Fees: The Adviser, a wholly-owned subsidiary of Morgan Stanley, provides the Fund with advisory services under the terms of an Investment Advisory Agreement, paid quarterly, at the annual rate based on the daily net assets as follows:
First $2
billion | | Over $2
billion | |
| | 0.80 | % | | | 0.75 | % | |
For the year ended December 31, 2019, the advisory fee rate (net of rebate) was equivalent to an annual effective rate of 0.80% of the Fund's average daily net assets.
The Adviser has agreed to reduce its advisory fee and/or reimburse the Fund so that total annual Fund operating expenses, excluding certain investment related expenses, taxes, interest and other extraordinary expenses (including litigation), will not exceed 1.00% Class I shares, 1.35% for Class A shares, 1.85% for Class L shares, 2.10% for Class C shares, 0.94% for Class IS shares and 0.94% for Class IR shares. The fee waivers and/or expense reimbursements will continue for at least one year from the date of the Fund's prospectus or until such time that the Directors act to discontinue all or a portion of such waivers or reimbursements when they deem such action is appropriate. For the year ended December 31, 2019, approximately $6,000 of advisory fees were waived and approximately $207,000 of other expenses were reimbursed by the Adviser pursuant to this arrangement.
The Adviser has entered into Sub-Advisory Agreements with the Sub-Advisers, each a wholly-owned subsidiary of Morgan Stanley. The Sub-Advisers provide the Fund with advisory services subject to the overall supervision of the Adviser and the Company's Officers and Directors. The Adviser pays the Sub-Advisers on a monthly basis a portion of the net advisory fees the Adviser receives from the Fund.
C. Administration Fees: The Adviser also serves as Administrator to the Company and provides administrative services pursuant to an Administration Agreement for an annual fee, accrued daily and paid monthly, of 0.08% of the Fund's average daily net assets.
Under a Sub-Administration Agreement between the Administrator and State Street Bank and Trust Company ("State Street"), State Street provides certain administrative services to the Company. For such services, the Administrator pays State Street a portion of the fee the Administrator receives from the Fund.
D. Distribution and Shareholder Services Fees: Morgan Stanley Distribution, Inc. ("MSDI" or the "Distributor"), a wholly-owned subsidiary of the Adviser and an indirect subsidiary of Morgan Stanley, serves as the Company's Distributor of Fund shares pursuant to a Distribution Agreement. The Company has adopted a Shareholder Services Plan with respect to Class A shares pursuant to Rule 12b-1 under the Act. Under the Shareholder Services Plan, the Fund pays the Distributor a shareholder services fee, accrued daily and paid
26
Morgan Stanley Institutional Fund, Inc.
Annual Report — December 31, 2019
Notes to Financial Statements (cont'd)
monthly, at an annual rate of 0.25% of the Fund's average daily net assets attributable to Class A shares.
The Company has adopted a Distribution and Shareholder Services Plan with respect to Class L shares pursuant to Rule 12b-1 under the Act. Under the Distribution and Shareholder Services Plan, the Fund pays the Distributor a distribution fee, accrued daily and paid monthly, at an annual rate of 0.50% and a shareholder services fee, accrued daily and paid monthly, at an annual rate of 0.25% of the Fund's average daily net assets attributable to Class L shares.
The Company has adopted a Distribution and Shareholder Services Plan with respect to Class C shares pursuant to Rule 12b-1 under the Act. Under the Distribution and Shareholder Services Plan, the Fund pays the Distributor a distribution fee, accrued daily and paid monthly, at an annual rate of 0.75% and a shareholder services fee, accrued daily and paid monthly, at an annual rate of 0.25% of the Fund's average daily net assets attributable to Class C shares.
The distribution and shareholder services fees are used to support the expenses associated with servicing and maintaining accounts. The Distributor may compensate other parties for providing shareholder support services to investors who purchase Class A, Class L and Class C shares.
E. Dividend Disbursing and Transfer Agent: The Company's dividend disbursing and transfer agent is DST Asset Manager Solutions, Inc. ("DST"). Pursuant to a Transfer Agency Agreement, the Company pays DST a fee based on the number of classes, accounts and transactions relating to the Funds of the Company.
F. Custodian Fees: State Street (the "Custodian") also serves as Custodian for the Company in accordance with a Custodian Agreement. The Custodian holds cash, securities and other assets of the Company as required by the Act. Custody fees are payable monthly based on assets held in custody, investment purchases and sales activity and account maintenance fees, plus reimbursement for certain out-of-pocket expenses.
G. Security Transactions and Transactions with Affiliates: For the year ended December 31, 2019, purchases and sales of investment securities for the Fund, other than long-term U.S. Government securities and short-term investments were approximately $200,325,000 and $533,223,000, respectively. There were no purchases and sales of long-term
U.S. Government securities for the year ended December 31, 2019.
The Fund invests in the Institutional Class of the Morgan Stanley Institutional Liquidity Funds — Treasury Portfolio (the "Liquidity Funds"), an open-end management investment company managed by the Adviser. Advisory fees paid by the Fund are reduced by an amount equal to its pro-rata share of the advisory and administration fees paid by the Fund due to its investment in the Liquidity Funds. For the year ended December 31, 2019, advisory fees paid were reduced by approximately $11,000 relating to the Fund's investment in the Liquidity Funds.
A summary of the Fund's transactions in shares of affiliated investments during the year ended December 31, 2019 is as follows:
Value
Affiliated
Investment
Company | | December 31,
2018
(000) | | Purchases
at Cost
(000) | | Proceeds
from Sales
(000) | | Dividend
Income
(000) | |
Liquidity Funds | | $ | — | | | $ | 148,816 | | | $ | 148,529 | | | $ | 129 | | |
Affiliated
Investment
Company (cont'd) | | Realized
Gain (Loss)
(000) | | Change in
Unrealized
Appreciation
(Depreciation)
(000) | | Value
December 31,
2019
(000) | |
Liquidity Funds | | $ | — | | | $ | — | | | $ | 287 | | |
The Fund is permitted to purchase and sell securities ("cross-trade") from and to other Morgan Stanley funds as well as other funds and client accounts for which the Adviser or an affiliate of the Adviser serves as investment adviser, pursuant to procedures approved by the Directors in compliance with Rule 17a-7 under the Act (the "Rule"). Each cross-trade is executed at the current market price in compliance with provisions of the Rule. For the year ended December 31, 2019, the Fund did not engage in any cross-trade transactions.
The Fund has an unfunded Deferred Compensation Plan (the "Compensation Plan"), which allows each independent Director to defer payment of all, or a portion, of the fees he or she receives for serving on the Board of Directors. Each eligible Director generally may elect to have the deferred amounts credited with a return equal to the total return on one or more of the Morgan Stanley funds that are offered as investment options under the Compensation Plan. Appreciation/depreciation and distributions received from these investments are recorded with an offsetting increase/decrease in the deferred compensation obligation and do not affect the NAV of the Fund.
27
Morgan Stanley Institutional Fund, Inc.
Annual Report — December 31, 2019
Notes to Financial Statements (cont'd)
H. Federal Income Taxes: It is the Fund's intention to continue to qualify as a regulated investment company and distribute all of its taxable and tax-exempt income. Accordingly, no provision for federal income taxes is required in the financial statements.
The Fund may be subject to taxes imposed by countries in which it invests. Such taxes are generally based on income and/or capital gains earned or repatriated. Taxes are accrued based on net investment income, net realized gains and net unrealized appreciation as such income and/or gains are earned. Taxes may also be based on transactions in foreign currency and are accrued based on the value of investments denominated in such currency.
FASB ASC 740-10, "Income Taxes — Overall", sets forth a minimum threshold for financial statement recognition of the benefit of a tax position taken or expected to be taken in a tax return. Management has concluded there are no significant uncertain tax positions that would require recognition in the financial statements. If applicable, the Fund recognizes interest accrued related to unrecognized tax benefits in "Interest Expense" and penalties in "Other Expenses" in the Statement of Operations. The Fund files tax returns with the U.S. Internal Revenue Service, New York and various states. Generally, each of the tax years in the four-year period ended December 31, 2019 remains subject to examination by taxing authorities.
The tax character of distributions paid may differ from the character of distributions shown for GAAP purposes due to short-term capital gains being treated as ordinary income for tax purposes. The tax character of distributions paid during fiscal years 2019 and 2018 was as follows:
2019
Distributions
Paid From: | | 2018
Distributions
Paid From: | |
Ordinary
Income
(000) | | Long-Term
Capital Gain
(000) | | Ordinary
Income
(000) | | Long-Term
Capital Gain
(000) | |
| $ | 37,385 | | | $ | 26,549 | | | $ | 53,497 | | | $ | 50,771 | | |
The amount and character of income and gains to be distributed are determined in accordance with income tax regulations which may differ from GAAP. These book/tax differences are either considered temporary or permanent in nature.
Temporary differences are attributable to differing book and tax treatments for the timing of the recognition of gains (losses) on certain investment transactions and the timing of the deductibility of certain expenses.
Permanent differences, primarily due to equalization debits, resulted in the following reclassifications among the components of net assets at December 31, 2019:
Total
Distributable
Earnings
(000) | | Paid-in
Capital
(000) | |
| $ | (13,077 | ) | | $ | 13,077 | | |
At December 31, 2019, the components of distributable earnings for the Fund on a tax basis were as follows:
Undistributed
Ordinary
Income
(000) | | Undistributed
Long-Term
Capital Gain
(000) | |
| $ | — | | | $ | 3,138 | | |
I. Credit Facility: The Company and other Morgan Stanley funds participated in a $150,000,000 committed, unsecured revolving line of credit facility (the "Facility") with State Street. Effective April 22, 2019, the committed line amount increased to $300,000,000. This Facility is to be used for temporary emergency purposes or funding of shareholder redemption requests. The interest rate on borrowings is based on the federal funds rate or 1 month LIBOR rate plus a spread. The Facility also has a commitment fee of 0.25% per annum based on the unused portion of the Facility. During the year ended December 31, 2019, the Fund did not have any borrowings under the Facility.
J. Other: At December 31, 2019, the Fund had record owners of 10% or greater. Investment activities of these shareholders could have a material impact on the Fund. The aggregate percentage of such owners was 36.6%.
28
Morgan Stanley Institutional Fund, Inc.
Annual Report — December 31, 2019
Report of Independent Registered Public Accounting Firm
To the Shareholders and Board of Directors of
Morgan Stanley Institutional Fund, Inc. —
Global Real Estate Portfolio
Opinion on the Financial Statements
We have audited the accompanying statement of assets and liabilities of Global Real Estate Portfolio (the "Fund") (one of the funds constituting Morgan Stanley Institutional Fund, Inc. (the "Company")), including the portfolio of investments, as of December 31, 2019, and the related statement of operations for the year then ended, the statements of changes in net assets for each of the two years in the period then ended, the financial highlights for each of the five years in the period then ended and the related notes (collectively referred to as the "financial statements"). In our opinion, the financial statements present fairly, in all material respects, the financial position of Global Real Estate Portfolio (one of the funds constituting Morgan Stanley Institutional Fund, Inc.) at December 31, 2019, the results of its operations for the year then ended, the changes in its net assets for each of the two years in the period then ended and its financial highlights for each of the five years in the period then ended, in conformity with U.S. generally accepted accounting principles.
Basis for Opinion
These financial statements are the responsibility of the Company's management. Our responsibility is to express an opinion on the Fund's financial statements based on our audits. We are a public accounting firm registered with the Public Company Accounting Oversight Board (United States) ("PCAOB") and are required to be independent with respect to the Company in accordance with the U.S. federal securities law and the applicable rules and regulations of the Securities and Exchange Commission and the PCAOB.
We conducted our audits in accordance with the standards of the PCAOB. Those standards require that we plan and perform the audit to obtain reasonable assurance about whether the financial statements are free of material misstatement, whether due to error or fraud. The Company is not required to have, nor were we engaged to perform, an audit of the Company's internal control over financial reporting. As part of our audits, we are required to obtain an understanding of internal control over financial reporting, but not for the purpose of expressing an opinion on the effectiveness of the Company's internal control over financial reporting. Accordingly, we express no such opinion.
Our audits included performing procedures to assess the risks of material misstatement of the financial statements, whether due to error or fraud, and performing procedures that respond to those risks. Such procedures included examining, on a test basis, evidence regarding the amounts and disclosures in the financial statements. Our procedures included confirmation of securities owned as of December 31, 2019 by correspondence with the custodian and others or by other appropriate auditing procedures where replies from others were not received. Our audits also included evaluating the accounting principles used and significant estimates made by management, as well as evaluating the overall presentation of the financial statements. We believe that our audits provide a reasonable basis for our opinion.

We have served as the auditor of one or more Morgan Stanley investment companies since 2000.
Boston, Massachusetts
February 27, 2020
29
Morgan Stanley Institutional Fund, Inc.
Annual Report — December 31, 2019
Federal Tax Notice (unaudited)
For federal income tax purposes, the following information is furnished with respect to the distributions paid by the Fund during its taxable year ended December 31, 2019.
The Fund designated and paid approximately $39,631,000 as a long-term capital gain distribution.
For federal income tax purposes, the following information is furnished with respect to the Fund's earnings for its taxable year ended December 31, 2019. When distributed, certain earnings may be subject to a maximum tax rate of 15% as provided for by the Jobs and Growth Tax Relief Reconciliation Act of 2003. The Fund designated up to a maximum of approximately $6,374,000 as taxable at this lower rate.
In January, the Fund provides tax information to shareholders for the preceding calendar year.
30
Privacy Notice (unaudited) April 2019
FACTS | | WHAT DOES MSIM DO WITH YOUR PERSONAL INFORMATION? | |
Why? | | Financial companies choose how they share your personal information. Federal law gives consumers the right to limit some but not all sharing. Federal law also requires us to tell you how we collect, share, and protect your personal information. Please read this notice carefully to understand what we do. | |
What? | | The types of personal information we collect and share depend on the product or service you have with us. This information can include:
n Social Security number and income
n investment experience and risk tolerance
n checking account number and wire transfer instructions | |
How? | | All financial companies need to share customers' personal information to run their everyday business. In the section below, we list the reasons financial companies can share their customers' personal information; the reasons MSIM chooses to share; and whether you can limit this sharing. | |
Reasons we can share your personal information | | Does MSIM share? | | Can you limit this sharing? | |
For our everyday business purposes —
such as to process your transactions, maintain your account(s), respond to court orders and legal investigations, or report to credit bureaus | | Yes | | No | |
For our marketing purposes —
to offer our products and services to you | | Yes | | No | |
For joint marketing with other financial companies | | No | | We don't share | |
For our affiliates' everyday business purposes —
information about your transactions and experiences | | Yes | | No | |
For our affiliates' everyday business purposes —
information about your creditworthiness | | No | | We don't share | |
For our affiliates to market to you | | No | | We don't share | |
For non-affiliates to market to you | | No | | We don't share | |
Questions? Call toll-free (844) 312-6327 or email: imprivacyinquiries@morganstanley.com
31
Privacy Notice (unaudited) (cont'd) April 2019
Who we are
Who is providing this notice? | | Morgan Stanley Investment Management, Inc. and its affiliated registered investment advisers, registered broker-dealers, and registered and unregistered funds ("MSIM") | |
What we do
How does MSIM protect my personal information? | | To protect your personal information from unauthorized access and use, we use security measures that comply with federal law. These measures include computer safeguards and secured files and buildings. We have policies governing the proper handling of customer information by personnel and requiring third parties that provide support to adhere to appropriate security standards with respect to such information. | |
How does MSIM collect my personal information? | | We collect your personal information, for example, when you
n open an account or make deposits or withdrawals from your account
n buy securities from us or make a wire transfer
n give us your contact information
We also collect your personal information from others, such as credit bureaus, affiliates, or other companies. | |
Why can't I limit all sharing? | | Federal law gives you the right to limit only
n sharing for affiliates' everyday business purposes — information about your creditworthiness
n affiliates from using your information to market to you
n sharing for non-affiliates to market to you
State laws and individual companies may give you additional rights to limit sharing. See below for more on your rights under state law. | |
Definitions
Affiliates | | Companies related by common ownership or control. They can be financial and non-financial companies.
n Our affiliates include companies with a Morgan Stanley name and financial companies such as Morgan Stanley Smith Barney LLC and Morgan Stanley & Co. | |
Non-affiliates | | Companies not related by common ownership or control. They can be financial and non-financial companies.
n MSIM does not share with non-affiliates so they can market to you. | |
Joint marketing | | A formal agreement between non-affiliated financial companies that together market financial products or services to you.
n MSIM doesn't jointly market | |
Other Important Information
Vermont: Except as permitted by law, we will not share personal information we collect about Vermont residents with Non-affiliates unless you provide us with your written consent to share such information.
California: Except as permitted by law, we will not share personal information we collect about California residents with Non-affiliates and we will limit sharing such personal information with our Affiliates to comply with California privacy laws that apply to us.
32
Morgan Stanley Institutional Fund, Inc.
Annual Report — December 31, 2019
Director and Officer Information (unaudited)
Independent Directors:
Name, Birth Year
and Address of
Independent Director | | Position(s)
Held with
Registrant | | Length of Time
Served* | | Principal Occupation(s) During Past 5 Years
and Other Relevant Professional Experience | | Number of
Funds in
Fund Complex
Overseen by
Independent
Director** | | Other Directorships
Held by Independent
Director*** | |
Frank L. Bowman
c/o Perkins Coie LLP
Counsel to the Independent Directors
1155 Avenue of the Americas
New York, NY 10036
Birth Year 1944 | | Director | | Since
August 2006 | | President, Strategic Decisions, LLC (consulting) (since February 2009); Director or Trustee of various Morgan Stanley Funds (since August 2006); Chairperson of the Compliance and Insurance Committee (since October 2015); formerly, Chairperson of the Insurance Sub-Committee of the Compliance and Insurance Committee (2007-2015); served as President and Chief Executive Officer of the Nuclear Energy Institute (policy organization) (February 2005-November 2008); retired as Admiral, U.S. Navy after serving over 38 years on active duty including 8 years as Director of the Naval Nuclear Propulsion Program in the Department of the Navy and the U.S. Department of Energy (1996-2004); served as Chief of Naval Personnel (July 1994-September 1996) and on the Joint Staff as Director of Political Military Affairs (June 1992-July 1994); knighted as Honorary Knight Commander of the Most Excellent Order of the British Empire; awarded the Officier de l'Orde National du Mérite by the French Government; elected to the National Academy of Engineering (2009). | | | 86 | | | Director of Naval and Nuclear Technologies LLP; Director Emeritus of the Armed Services YMCA; Member of the National Security Advisory Council of the Center for U.S. Global Engagement and a member of the CNA Military Advisory Board; Trustee of Fairhaven United Methodist Church; Member of the Board of Advisors of the Dolphin Scholarship Foundation; Director of other various non-profit organizations; formerly, Director of BP p.l.c. (November 2010-May 2019). | |
Kathleen A. Dennis
c/o Perkins Coie LLP
Counsel to the Independent Directors
1155 Avenue of the Americas
New York, NY 10036
Birth Year 1953 | | Director | | Since August 2006 | | President, Cedarwood Associates (mutual fund and investment management consulting) (since July 2006); Chairperson of the Liquidity and Alternatives Sub-Committee of the Investment Committee (since October 2006) and Director or Trustee of various Morgan Stanley Funds (since August 2006); formerly, Senior Managing Director of Victory Capital Management (1993-2006). | | | 86 | | | Director of various non-profit organizations. | |
Nancy C. Everett
c/o Perkins Coie LLP
Counsel to the Independent Directors
1155 Avenue of the Americas
New York, NY 10036
Birth Year 1955 | | Director | | Since January 2015 | | Chief Executive Officer, Virginia Commonwealth University Investment Company (since November 2015); Owner, OBIR, LLC (institutional investment management consulting) (since June 2014); formerly, Managing Director, BlackRock, Inc. (February 2011-December 2013); and Chief Executive Officer, General Motors Asset Management (a/k/a Promark Global Advisors, Inc.) (June 2005-May 2010). | | | 87 | | | Formerly, Member of Virginia Commonwealth University School of Business Foundation (2005-2016); Member of Virginia Commonwealth University Board of Visitors (2013-2015); Member of Committee on Directors for Emerging Markets Growth Fund, Inc. (2007-2010); Chairperson of Performance Equity Management, LLC (2006-2010); and Chairperson, GMAM Absolute Return Strategies Fund, LLC (2006-2010). | |
33
Morgan Stanley Institutional Fund, Inc.
Annual Report — December 31, 2019
Director and Officer Information (unaudited) (cont'd)
Independent Directors: (cont'd)
Name, Birth Year
and Address of
Independent Director | | Position(s)
Held with
Registrant | | Length of Time
Served* | | Principal Occupation(s) During Past 5 Years
and Other Relevant Professional Experience | | Number of
Funds in
Fund Complex
Overseen by
Independent
Director** | | Other Directorships
Held by Independent
Director*** | |
Jakki L. Haussler
c/o Perkins Coie LLP
Counsel to the Independent Directors
1155 Avenue of the Americas
New York, NY 10036
Birth Year 1957 | | Director | | Since January 2015 | | Chairman, Opus Capital Group (since 1996); formerly, Chief Executive Officer, Opus Capital Group (1996-2019); Director, Capvest Venture Fund, LP (May 2000-December 2011); Partner, Adena Ventures, LP (July 1999-December 2010); Director, The Victory Funds (February 2005-July 2008). | | | 87 | | | Director of Service Corporation International and Member, Audit Committee and Investment Committee; Director of Cincinnati Bell Inc. and Member, Audit Committee and Governance and Nominating Committee; Chairman of Northern Kentucky University Member Investment Committee; Member of Chase College of Law Transactional Law Practice Center Board of Advisors; Director of Best Transport; Director of Chase College of Law Board of Visitors; formerly, Member, University of Cincinnati Foundation Investment Committee; Member, Miami University Board of Visitors (2008-2011); Trustee of Victory Funds (2005-2008) and Chairman, Investment Committee (2007-2008) and Member, Service Provider Committee (2005-2008). | |
Dr. Manuel H. Johnson
c/o Johnson Smick International, Inc.
220 I Street, NE — Suite 200
Washington, D.C. 20002
Birth Year 1949 | | Director | | Since July 1991 | | Senior Partner, Johnson Smick International, Inc. (consulting firm); Chairperson of the Investment Committee (since October 2006) and Director or Trustee of various Morgan Stanley Funds (since July 1991); Co-Chairman and a founder of the Group of Seven Council (G7C) (international economic commission); formerly, Chairperson of the Audit Committee (July 1991-September 2006), Vice Chairman of the Board of Governors of the Federal Reserve System and Assistant Secretary of the U.S. Treasury. | | | 86 | | | Director of NVR, Inc. (home construction). | |
Joseph J. Kearns
c/o Perkins Coie LLP
Counsel to the Independent Directors
1155 Avenue of the Americas
New York, NY 10036
Birth Year 1942 | | Director | | Since August 1994 | | Senior Adviser, Kearns & Associates LLC (investment consulting); Chairperson of the Audit Committee (since October 2006) and Director or Trustee of various Morgan Stanley Funds (since August 1994); formerly, Deputy Chairperson of the Audit Committee (July 2003-September 2006) and Chairperson of the Audit Committee of various Morgan Stanley Funds (since August 1994); CFO of the J. Paul Getty Trust. | | | 87 | | | Prior to August 10, 2016, Director of Electro Rent Corporation (equipment leasing); Prior to December 31, 2013, Director of The Ford Family Foundation. | |
34
Morgan Stanley Institutional Fund, Inc.
Annual Report — December 31, 2019
Director and Officer Information (unaudited) (cont'd)
Independent Directors: (cont'd)
Name, Birth Year
and Address of
Independent Director | | Position(s)
Held with
Registrant | | Length of Time
Served* | | Principal Occupation(s) During Past 5 Years
and Other Relevant Professional Experience | | Number of
Funds in
Fund Complex
Overseen by
Independent
Director** | | Other Directorships
Held by Independent
Director*** | |
Michael F. Klein
c/o Perkins Coie LLP
Counsel to the Independent Directors
1155 Avenue of the Americas
New York, NY 10036
Birth Year 1958 | | Director | | Since August 2006 | | Managing Director, Aetos Alternatives Management, LP (since March 2000); Co-President, Aetos Alternatives Management, LP (since January 2004) and Co-Chief Executive Officer of Aetos Alternatives Management, LP (since August 2013); Chairperson of the Fixed Income Sub-Committee of the Investment Committee (since October 2006) and Director or Trustee of various Morgan Stanley Funds (since August 2006); formerly, Managing Director, Morgan Stanley & Co. Inc. and Morgan Stanley Dean Witter Investment Management and President, various Morgan Stanley Funds (June 1998-March 2000); Principal, Morgan Stanley & Co. Inc. and Morgan Stanley Dean Witter Investment Management (August 1997-December 1999). | | | 86 | | | Director of certain investment funds managed or sponsored by Aetos Alternatives Management, LP; Director of Sanitized AG and Sanitized Marketing AG (specialty chemicals). | |
Patricia Maleski
c/o Perkins Coie LLP
Counsel to the Independent Directors
1155 Avenue of the Americas
New York, NY 10036
Birth Year 1960 | | Director | | Since January 2017 | | Managing Director, JPMorgan Asset Management (2004-2016); Oversight and Control Head of Fiduciary and Conflicts of Interest Program (2015-2016); Chief Control Officer-Global Asset Management (2013-2015); President, JPMorgan Funds (2010-2013); Chief Administrative Officer (2004-2013); various other positions including Treasurer and Board Liaison (since 2001). | | | 87 | | | None. | |
Michael E. Nugent
522 Fifth Avenue
New York, NY 10036
Birth Year 1936 | | Chair of the Board and Director | | Chair of the Boards since July 2006 and Director since July 1991 | | Chair of the Boards of various Morgan Stanley Funds (since July 2006); Chairperson of the Governance Committee (since January 2019) and Director or Trustee of various Morgan Stanley Funds (since July 1991); formerly, Chairperson of each of the Closed-End Fund committee (until December 2019) and the Insurance Committee (until July 2006); General Partner, Triumph Capital, L.P. (private investment partnership) (1988-2013). | | | 86 | | | None. | |
W. Allen Reed
c/o Perkins Coie LLP
Counsel to the Independent Directors
1155 Avenue of the Americas
New York, NY 10036
Birth Year 1947 | | Vice Chair of the Board and Director | | Vice Chair of the Boards since January 2020 and Director since August 2006 | | Chairperson of the Equity Sub-Committee of the Investment Committee (since October 2006) and Director or Trustee of various Morgan Stanley Funds (since August 2006); formerly, President and CEO of General Motors Asset Management; Chairman and Chief Executive Officer of the GM Trust Bank and Corporate Vice President of General Motors Corporation (August 1994-December 2005). | | | 86 | | | Formerly, Director of Legg Mason, Inc.; formerly, Director of the Auburn University Foundation (2010-2015). | |
* This is the earliest date the Director began serving the Morgan Stanley Funds. Each Director serves an indefinite term, until his or her successor is elected.
** The Fund Complex includes (as of December 31, 2019) all open-end and closed-end funds (including all of their portfolios) advised by Morgan Stanley Investment Management Inc. (the "Adviser") and any funds that have an adviser that is an affiliated person of the Adviser (including, but not limited to, Morgan Stanley AIP GP LP).
*** This includes any directorships at public companies and registered investment companies held by the Director at any time during the past five years.
35
Morgan Stanley Institutional Fund, Inc.
Annual Report — December 31, 2019
Director and Officer Information (unaudited) (cont'd)
Executive Officers:
Name, Birth Year and Address of
Executive Officer | | Position(s) Held
with
Registrant | | Length of
Time Served* | | Principal Occupation(s) During Past 5 Years | |
John H. Gernon
522 Fifth Avenue
New York, NY 10036
Birth Year 1963 | | President and Principal Executive Officer | | Since September 2013 | | President and Principal Executive Officer of the Equity and Fixed Income Funds and the Morgan Stanley AIP Funds (since September 2013) and the Liquidity Funds and various money market funds (since May 2014) in the Fund Complex; Managing Director of the Adviser; Head of Product (since 2006). | |
Timothy J. Knierim
522 Fifth Avenue
New York, NY 10036
Birth Year 1959 | | Chief Compliance Officer | | Since December 2016 | | Managing Director of the Adviser and various entities affiliated with the Adviser; Chief Compliance Officer of various Morgan Stanley Funds and the Adviser (since December 2016) and Chief Compliance Officer of Morgan Stanley AIP GP LP (since 2014). Formerly, Managing Director and Deputy Chief Compliance Officer of the Adviser (2014-2016); and formerly, Chief Compliance Officer of Prudential Investment Management, Inc. (2007-2014). | |
Francis J. Smith
522 Fifth Avenue
New York, NY 10036
Birth Year 1965 | | Treasurer and Principal Financial Officer | | Treasurer since July 2003 and Principal Financial Officer since September 2002 | | Managing Director of the Adviser and various entities affiliated with the Adviser; Treasurer (since July 2003) and Principal Financial Officer of various Morgan Stanley Funds (since September 2002). | |
Mary E. Mullin
522 Fifth Avenue
New York, NY 10036
Birth Year 1967 | | Secretary | | Since June 1999 | | Managing Director of the Adviser; Secretary of various Morgan Stanley Funds (since June 1999). | |
Michael J. Key
522 Fifth Avenue
New York, NY 10036
Birth Year 1979 | | Vice President | | Since June 2017 | | Vice President of the Equity and Fixed Income Funds, Liquidity Funds, various money market funds and the Morgan Stanley AIP Funds in the Fund Complex (since June 2017); Executive Director of the Adviser; Head of Product Development for Equity and Fixed Income Funds (since August 2013). | |
* This is the earliest date the officer began serving the Morgan Stanley Funds. Each officer serves a one-year term, until his or her successor is elected and qualifies.
36
Morgan Stanley Institutional Fund, Inc.
Annual Report — December 31, 2019
Adviser and Administrator
Morgan Stanley Investment Management Inc.
522 Fifth Avenue
New York, New York 10036
Sub-Advisers
Morgan Stanley Investment Management Limited
25 Cabot Square, Canary Wharf
London, E14 4QA, England
Morgan Stanley Investment Management Company
23 Church Street
16-01 Capital Square, Singapore 049481
Distributor
Morgan Stanley Distribution, Inc.
522 Fifth Avenue
New York, New York 10036
Dividend Disbursing and Transfer Agent
DST Asset Manager Solutions, Inc.
2000 Crown Colony Drive
Quincy, Massachusetts 02169
Custodian
State Street Bank and Trust Company
One Lincoln Street
Boston, Massachusetts 02111
Legal Counsel
Dechert LLP
1095 Avenue of the Americas
New York, New York 10036
Counsel to the Independent Directors
Perkins Coie LLP
1155 Avenue of the Americas
New York, New York 10036
Independent Registered Public Accounting Firm
Ernst & Young LLP
200 Clarendon Street
Boston, Massachusetts 02116
Reporting to Shareholders
Each Morgan Stanley fund provides a complete schedule of portfolio holdings in its Semi-Annual and the Annual Reports within 60 days of the end of the fund's second and fourth fiscal quarters. The Semi-Annual and Annual Reports are filed electronically with the Securities and Exchange Commission ("SEC") on Form N-CSRS and Form N-CSR, respectively. Morgan Stanley also delivers the Semi-Annual and Annual Reports to fund shareholders and makes these reports available on its public website, www.morganstanley.com/im/shareholderreports. Each Morgan Stanley non-money market fund also files a complete schedule of portfolio holdings with the SEC for the fund's first and third fiscal quarters as an attachment to Form N-PORT. Morgan Stanley does not deliver the reports for the first and third fiscal quarters to shareholders, nor are the reports posted to the Morgan Stanley public website. However, the holdings for each money market fund are posted to the Morgan Stanley public website. You may obtain the Form N-PORT filings (as well as the Form N-CSR and N-CSRS filings) by accessing the SEC's website, www.sec.gov. You can also request copies of these materials, upon payment of a duplicating fee, by electronic request at the SEC's email address (publicinfo@sec.gov).
Proxy Voting Policies and Procedures and Proxy Voting Record
You may obtain a copy of the Company's Proxy Voting Policy and Procedures and information regarding how the Company voted proxies relating to portfolio securities during the most recent twelve-month period ended June 30, without charge, upon request, by calling toll free 1 (800) 548-7786 or by visiting our website at www.morganstanley.com/im/shareholderreports. This information is also available on the SEC's website at www.sec.gov.
This report is authorized for distribution only when preceded or accompanied by a prospectus or summary prospectus of the applicable fund of Morgan Stanley Institutional Fund, Inc., which describes in detail the fund's investment policies, risks, fees and expenses. Please read the prospectus carefully before you invest or send money. For additional information, including information regarding the investments comprising the Fund, please visit our website at www.morganstanley.com/im/shareholderreports or call toll free 1 (800) 548-7786.
37
Printed in U.S.A.
This Report has been prepared for shareholders and may be distributed to others only if preceded or accompanied by a current prospectus.
Morgan Stanley Investment Management Inc.
522 Fifth Avenue
New York, New York 10036
© 2020 Morgan Stanley. Morgan Stanley Distribution, Inc.

IFIGREANN
2922340 EXP. 02.28.21

Morgan Stanley Institutional Fund, Inc.
Growth Portfolio
Annual Report
December 31, 2019
Beginning on January 1, 2021, as permitted by regulations adopted by the Securities and Exchange Commission ("SEC"), paper copies of the Fund's Annual and Semi-Annual Reports to Shareholders ("Shareholder Reports") will no longer be sent by mail, unless you specifically request paper copies of the Shareholder Reports from the Fund or from your financial intermediary, such as a broker-dealer or a bank. Instead, the Shareholder Reports will be made available on the Fund's website, https://www.morganstanley.com/im/shareholderreports and you will be notified by mail each time a Shareholder Report is posted and provided with a website link to access the Shareholder Report. If you already elected to receive Shareholder Reports electronically, you will not be affected by this change and you need not take any action. You may elect to receive Shareholder Reports and other communications from the Fund electronically anytime by contacting your financial intermediary or, if you are a direct investor, please follow the instructions on the envelope.
Beginning on January 1, 2019, you may elect to receive all future Shareholder Reports in paper free of charge. If you invest through a financial intermediary, you can contact your financial intermediary to request that you continue to receive paper copies of your Shareholder Reports. If you invest directly with the Fund, please follow the instructions on the envelope to let the Fund know you wish to continue receiving paper copies of your Shareholder Reports. Your election to receive Shareholder Reports in paper will apply to all funds held in your account if you invest through your financial intermediary or all funds held with the fund complex if you invest directly with a fund.

Morgan Stanley Institutional Fund, Inc.
Annual Report — December 31, 2019
Shareholders' Letter | | | 2 | | |
Expense Example | | | 3 | | |
Investment Overview | | | 4 | | |
Portfolio of Investments | | | 6 | | |
Statement of Assets and Liabilities | | | 8 | | |
Statement of Operations | | | 10 | | |
Statements of Changes in Net Assets | | | 11 | | |
Financial Highlights | | | 13 | | |
Notes to Financial Statements | | | 19 | | |
Report of Independent Registered Public Accounting Firm | | | 29 | | |
Federal Tax Notice | | | 30 | | |
Privacy Notice | | | 31 | | |
Director and Officer Information | | | 33 | | |
This report is authorized for distribution only when preceded or accompanied by a prospectus or summary prospectus of the applicable Fund of Morgan Stanley Institutional Fund, Inc. To receive a prospectus and/or statement of additional information ("SAI"), which contains more complete information such as investment objectives, charges, expenses, policies for voting proxies, risk considerations and describes in detail each of the Fund's investment policies to the prospective investor, please call toll free 1 (800) 548-7786. Please read the prospectuses carefully before you invest or send money.
Additionally, you can access information about the Fund, including performance, characteristics and investment team commentary, through Morgan Stanley Investment Management's website: www.morganstanley.com/im/shareholderreports.
Market forecasts provided in this report may not necessarily come to pass. There is no guarantee that any sectors mentioned will continue to perform as discussed herein or that securities in such sectors will be held by the Fund in the future. There is no assurance that a fund will achieve its investment objective. Funds are subject to market risk, which is the possibility that market values of securities owned by the Fund will decline and, therefore, the value of the Fund's shares may be less than what you paid for them. Accordingly, you can lose money investing in this Fund. Please see the prospectus for more complete information on investment risks.
1
Morgan Stanley Institutional Fund, Inc.
Annual Report — December 31, 2019
Shareholders' Letter (unaudited)
Dear Shareholders,
We are pleased to provide this Annual Report, in which you will learn how your investment in Growth Portfolio (the "Fund") performed during the latest twelve-month period.
Morgan Stanley Investment Management is a client-centric, investor-led organization. Our global presence, intellectual capital, and breadth of products and services enable us to partner with investors to meet the evolving challenges of today's financial markets. We aim to deliver superior investment service and to empower our clients to make the informed decisions that help them reach their investment goals.
As always, we thank you for selecting Morgan Stanley Investment Management, and look forward to working with you in the months and years ahead.
Sincerely,

John H. Gernon
President and Principal Executive Officer
January 2020
2
Morgan Stanley Institutional Fund, Inc.
Annual Report — December 31, 2019
Expense Example (unaudited)
Growth Portfolio
As a shareholder of the Fund, you incur two types of costs: (1) transactional costs; and (2) ongoing costs, which may include advisory fees, administration fees, distribution and shareholder services fees and other Fund expenses. This example is intended to help you understand your ongoing costs (in dollars) of investing in the Fund and to compare these costs with the ongoing costs of investing in other mutual funds.
This example is based on an investment of $1,000 invested at the beginning of the six-month period ended December 31, 2019 and held for the entire six-month period.
Actual Expenses
The table below provides information about actual account values and actual expenses. You may use the information in this table, together with the amount you invested, to estimate the expenses that you paid over the period. Simply divide your account value by $1,000 (for example, an $8,600 account value divided by $1,000 = 8.6), then multiply the result by the number in the table under the heading entitled "Actual Expenses Paid During Period" to estimate the expenses you paid on your account during this period.
Hypothetical Example for Comparison Purposes
The table below provides information about hypothetical account values and hypothetical expenses based on the Fund's actual expense ratio and an assumed rate of return of 5% per year before expenses, which is not the Fund's actual return. The hypothetical account values and expenses may not be used to estimate the actual ending account balance or expenses you paid for the period. You may use this information to compare the ongoing costs of investing in the Fund and other funds. To do so, compare this 5% hypothetical example with the 5% hypothetical examples that appear in the shareholder reports of the other funds.
Please note that the expenses shown in the table are meant to highlight your ongoing costs only and do not reflect any transactional costs, such as sales charges (loads). Therefore, the information for each class in the table is useful in comparing ongoing costs only, and will not help you determine the relative total costs of owning different funds. In addition, if these transactional costs were included, your costs would have been higher.
| | | Beginning
Account
Value
7/1/19 | | Actual Ending
Account
Value
12/31/19 | | Hypothetical
Ending Account
Value | | Actual
Expenses
Paid
During
Period* | | Hypothetical
Expenses Paid
During Period* | | Net
Expense
Ratio
During
Period** | |
Growth Portfolio Class I | | $ | 1,000.00 | | | $ | 961.30 | | | $ | 1,022.18 | | | $ | 2.97 | | | $ | 3.06 | | | | 0.60 | % | |
Growth Portfolio Class A | | | 1,000.00 | | | | 959.90 | | | | 1,020.92 | | | | 4.20 | | | | 4.33 | | | | 0.85 | | |
Growth Portfolio Class L | | | 1,000.00 | | | | 957.50 | | | | 1,018.50 | | | | 6.56 | | | | 6.77 | | | | 1.33 | | |
Growth Portfolio Class C | | | 1,000.00 | | | | 956.20 | | | | 1,017.09 | | | | 7.94 | | | | 8.19 | | | | 1.61 | | |
Growth Portfolio Class IS | | | 1,000.00 | | | | 961.80 | | | | 1,022.74 | | | | 2.42 | | | | 2.50 | | | | 0.49 | | |
Growth Portfolio Class IR | | | 1,000.00 | | | | 961.80 | | | | 1,022.74 | | | | 2.42 | | | | 2.50 | | | | 0.49 | | |
* Expenses are calculated using each Fund Class' annualized net expense ratio (as disclosed), multiplied by the average account value over the period and multiplied by 184/365 (to reflect the most recent one-half year period).
** Annualized.
3
Morgan Stanley Institutional Fund, Inc.
Annual Report — December 31, 2019
Investment Overview (unaudited)
Growth Portfolio
The Fund seeks long-term capital appreciation by investing primarily in growth-oriented equity securities of large capitalization companies.
Performance
For the fiscal year ended December 31, 2019, the Fund's Class I shares had a total return based on net asset value and reinvestment of distributions per share of 23.16%, net of fees. The Fund's Class I shares underperformed the Fund's benchmark, the Russell 1000® Growth Index (the "Index"), which returned 36.39%.
Please keep in mind that double-digit returns are highly unusual and cannot be sustained. Investors should also be aware that these returns were primarily achieved during favorable market conditions.
Factors Affecting Performance
• Easing geopolitical tensions, reduced recession fears and central bank support drove U.S. equities sharply higher over 2019. The U.S.-China trade war dampened the U.S. manufacturing sector and weighed on business confidence. However, consumers' resilience helped the U.S. economy maintain slow but steady growth. Acknowledging the downside risks to the economy, the U.S. Federal Reserve stopped raising its benchmark interest rate in the first half of the year, then cut rates three times to try to prolong the economic cycle. Volatility increased in 2019, but stock prices continued to rally higher, notably at year end when the U.S. and China announced a partial trade deal.
• U.S. large-cap growth stocks advanced during the year. Within the Index, information technology and communication services were the top-performing sectors for the year. All sectors had positive performance, with energy posting the smallest gain.
• Counterpoint Global seeks high quality companies, which we define primarily as those with sustainable competitive advantages. We manage concentrated portfolios that are highly differentiated from the benchmark, with securities weighted on our assessment of the quality of the company and our conviction. The value added or detracted in any period of time will result from stock selection, given our philosophy and process. For the year, the Fund underperformed the Index.
• The long-term investment horizon and conviction-weighted investment approach embraced by the team since 1998 can result in periods of performance deviation from the benchmark and peers. The Fund underperformed the Index in this reporting period due to unfavorable results from both stock selection and sector allocations.
• Stock selection in information technology, consumer discretionary and communication services was detrimental to relative performance. The Fund's lack of exposure to some of the largest benchmark holdings in the information technology and communication services sectors weighed on relative performance as these index-heavyweights performed very strongly in 2019. This offset the relative gains produced by many of the information technology and communication services stocks the Fund did hold. In the consumer discretionary sector, holdings in an online furniture and home goods retailer and a global online marketplace for luxury goods were the biggest laggards.
• Stock selection in health care was advantageous and made up for most of the relative underperformance from stock selection in the other sectors. Among the sector's largest contributors to Fund performance were holdings in a provider of cloud-based software solutions to the life sciences industry, a leading provider of continuous glucose monitoring devices used by diabetics and a leading provider of robotics-assisted surgical equipment. However, a sector overweight to health care partially detracted from performance.
Management Strategies
• As a team, we believe having a market outlook can be an anchor. Our focus is on assessing company prospects over a five-year horizon, and owning a portfolio of unique companies whose market value we believe can increase significantly for underlying fundamental reasons.
4
Morgan Stanley Institutional Fund, Inc.
Annual Report — December 31, 2019
Investment Overview (unaudited) (cont'd)
Growth Portfolio
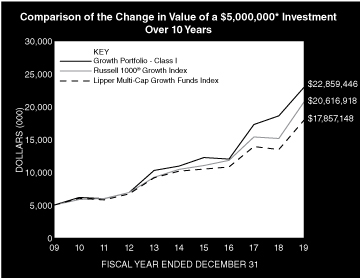
* Minimum Investment for Class I shares
In accordance with SEC regulations, the Fund's performance shown assumes that all recurring fees (including management fees) were deducted and all dividends and distributions were reinvested. The performance of Class A, L, C, IS and IR shares will vary from the performance of Class I shares based upon their different inception dates and will be negatively impacted by additional fees assessed to those classes (if applicable).
Performance Compared to the Russell 1000® Growth Index(1) and the Lipper Multi-Cap Growth Funds Index(2)
| | | Period Ended December 31, 2019
Total Returns(3) | |
| | | | | Average Annual | |
| | | One
Year | | Five
Years | | Ten
Years | | Since
Inception(10) | |
Fund — Class I Shares
w/o sales charges(4) | | | 23.16 | % | | | 15.92 | % | | | 16.42 | % | | | 11.31 | % | |
Fund — Class A Shares
w/o sales charges(5) | | | 22.81 | | | | 15.59 | | | | 16.11 | | | | 10.42 | | |
Fund — Class A Shares with
maximum 5.25% sales charges(5) | | | 16.35 | | | | 14.35 | | | | 15.49 | | | | 10.17 | | |
Fund — Class L Shares
w/o sales charges(6) | | | 22.22 | | | | 14.99 | | | | — | | | | 15.40 | | |
Fund — Class C Shares
w/o sales charges(8) | | | 21.91 | | | | — | | | | — | | | | 14.01 | | |
Fund — Class C Shares with
maximum 1.00% deferred
sales charges(8) | | | 20.91 | | | | — | | | | — | | | | 14.01 | | |
Fund — Class IS Shares
w/o sales charges(7) | | | 23.26 | | | | 16.02 | | | | — | | | | 16.40 | | |
Fund — Class IR Shares
w/o sales charges(9) | | | 23.26 | | | | — | | | | — | | | | 4.26 | | |
Russell 1000® Growth Index | | | 36.39 | | | | 14.63 | | | | 15.22 | | | | 9.77 | | |
Lipper Multi-Cap Growth Funds Index | | | 32.94 | | | | 11.97 | | | | 13.58 | | | | 9.56 | | |
Performance data quoted represents past performance, which is no guarantee of future results, and current performance may be lower or higher than the figures shown. Performance assumes that all dividends and distributions, if any, were reinvested. For the most recent month-end performance figures, please visit www.morganstanley.com/im/shareholderreports. Investment return and principal value will fluctuate so that Fund shares, when redeemed, may be worth more or less than their original cost. Total returns do not reflect the deduction of taxes that a shareholder would pay on Fund distributions or the redemption of Fund shares. Performance of share classes will vary due to difference in sales charges and expenses.
(1) The Russell 1000® Growth Index measures the performance of the large-cap growth segment of the U.S. equity universe. It includes those Russell 1000® Index companies with higher price-to-book ratios and higher forecasted growth values. The Russell 1000® Index is an index of approximately 1,000 of the largest U.S. companies based on a combination of market capitalization and current index membership. The Index is unmanaged and its returns do not include any sales charges or fees. Such costs would lower performance. It is not possible to invest directly in an index.
(2) The Lipper Multi-Cap Growth Funds Index is an equally weighted performance index of the largest qualifying funds (based on net assets) in the Lipper Multi-Cap Growth Funds classification. The Index, which is adjusted for capital gains distributions and income dividends, is unmanaged and should not be considered an investment. There are currently 30 funds represented in this Index. As of the date of this report, the Fund was in the Lipper Multi-Cap Growth Funds classification.
(3) Total returns for the Fund reflect fees waived and expenses reimbursed, if applicable, by the Adviser (as defined herein). Without such waivers and reimbursements, total returns would have been lower.
(4) Commenced operations on April 2, 1991.
(5) Commenced offering on January 2, 1996.
(6) Commenced offering on April 27, 2012.
(7) Commenced offering on September 13, 2013.
(8) Commenced offering on April 30, 2015.
(9) Commenced offering on June 15, 2018.
(10) For comparative purposes, average annual since inception returns listed for the Indexes refer to the inception date of Class I of the Fund, not the inception of the Index.
5
Morgan Stanley Institutional Fund, Inc.
Annual Report — December 31, 2019
Portfolio of Investments
Growth Portfolio
| | | Shares | | Value
(000) | |
Common Stocks (96.6%) | |
Biotechnology (1.0%) | |
Alnylam Pharmaceuticals, Inc. (a) | | | 406,022 | | | $ | 46,762 | | |
Moderna, Inc. (a) | | | 1,298,888 | | | | 25,406 | | |
| | | | 72,168 | | |
Entertainment (7.3%) | |
Roku, Inc. (a) | | | 1,213,550 | | | | 162,494 | | |
Spotify Technology SA (a) | | | 2,297,920 | | | | 343,654 | | |
| | | | 506,148 | | |
Health Care Equipment & Supplies (9.4%) | |
DexCom, Inc. (a) | | | 1,150,116 | | | | 251,577 | | |
Intuitive Surgical, Inc. (a) | | | 672,131 | | | | 397,330 | | |
| | | | 648,907 | | |
Health Care Providers & Services (2.4%) | |
Covetrus, Inc. | | | 3,882,112 | | | | 51,244 | | |
Guardant Health, Inc. (a) | | | 1,510,691 | | | | 118,045 | | |
| | | | 169,289 | | |
Health Care Technology (4.0%) | |
Agilon Health Topco, Inc. (a)(b)(c)
(acquisition cost — $25,030;
acquired 11/7/18) | | | 66,188 | | | | 29,749 | | |
Veeva Systems, Inc., Class A (a) | | | 1,751,729 | | | | 246,398 | | |
| | | | 276,147 | | |
Information Technology Services (17.0%) | |
Adyen N.V. (Netherlands) (a) | | | 157,068 | | | | 128,790 | | |
MongoDB, Inc. (a) | | | 854,655 | | | | 112,481 | | |
Okta, Inc. (a) | | | 2,371,847 | | | | 273,640 | | |
Shopify, Inc., Class A (Canada) (a) | | | 866,809 | | | | 344,626 | | |
Square, Inc., Class A (a) | | | 1,653,114 | | | | 103,419 | | |
Twilio, Inc., Class A (a) | | | 2,211,047 | | | | 217,301 | | |
| | | | 1,180,257 | | |
Interactive Media & Services (12.0%) | |
Alphabet, Inc., Class C (a) | | | 146,841 | | | | 196,329 | | |
Facebook, Inc., Class A (a) | | | 541,236 | | | | 111,089 | | |
Snap, Inc., Class A (a) | | | 7,176,688 | | | | 117,195 | | |
Twitter, Inc. (a) | | | 9,105,568 | | | | 291,834 | | |
Zillow Group, Inc., Class C (a) | | | 2,496,232 | | | | 114,677 | | |
| | | | 831,124 | | |
Internet & Direct Marketing Retail (12.6%) | |
Amazon.com, Inc. (a) | | | 244,713 | | | | 452,191 | | |
Chewy, Inc., Class A (a) | | | 3,734,428 | | | | 108,298 | | |
Farfetch Ltd., Class A (a) | | | 6,252,498 | | | | 64,713 | | |
MercadoLibre, Inc. (a) | | | 301,150 | | | | 172,240 | | |
Wayfair, Inc., Class A (a)(d) | | | 822,404 | | | | 74,321 | | |
| | | | 871,763 | | |
Life Sciences Tools & Services (5.1%) | |
Illumina, Inc. (a) | | | 1,059,233 | | | | 351,390 | | |
| | | Shares | | Value
(000) | |
Road & Rail (5.0%) | |
Uber Technologies, Inc. (a) | | | 11,666,306 | | | $ | 346,956 | | |
Software (19.8%) | |
Atlassian Corp. PLC, Class A
(United Kingdom) (a) | | | 853,976 | | | | 102,767 | | |
Coupa Software, Inc. (a) | | | 1,326,617 | | | | 194,018 | | |
ServiceNow, Inc. (a) | | | 981,293 | | | | 277,039 | | |
Slack Technologies, Inc., Class A (a) | | | 11,199,124 | | | | 251,756 | | |
Trade Desk, Inc. (The), Class A (a) | | | 832,204 | | | | 216,190 | | |
Workday, Inc., Class A (a) | | | 1,385,376 | | | | 227,825 | | |
Zoom Video Communications, Inc., Class A (a) | | | 1,503,441 | | | | 102,294 | | |
| | | | 1,371,889 | | |
Specialty Retail (1.0%) | |
Carvana Co. (a) | | | 755,533 | | | | 69,547 | | |
Total Common Stocks (Cost $5,009,739) | | | 6,695,585 | | |
Preferred Stocks (1.3%) | |
Electronic Equipment, Instruments & Components (0.3%) | |
Magic Leap Series C (a)(b)(c)
(acquisition cost — $18,812;
acquired 12/22/15) | | | 816,725 | | | | 19,904 | | |
Internet & Direct Marketing Retail (1.0%) | |
Airbnb, Inc. Series D (a)(b)(c)
(acquisition cost — $20,638;
acquired 4/16/14) | | | 506,928 | | | | 66,595 | | |
Total Preferred Stocks (Cost $39,450) | | | 86,499 | | |
Short-Term Investments (1.2%) | |
Securities held as Collateral on Loaned Securities (0.0%) | |
Investment Company (0.0%) | |
Morgan Stanley Institutional Liquidity
Funds — Treasury Securities Portfolio —
Institutional Class (See Note G) | | | 915,774 | | | | 916 | | |
| | | Face
Amount
(000) | | | |
Repurchase Agreements (0.0%) | |
HSBC Securities USA, Inc., (1.55%, dated
12/31/19, due 01/02/20; proceeds $32;
fully collateralized by a U.S. Government
obligation; 2.88% due 08/15/28;
valued at $32) | | $ | 31 | | | | 31 | | |
Merrill Lynch & Co., Inc., (1.55%, dated
12/31/19, due 01/02/20; proceeds $95;
fully collateralized by a U.S. Government
obligation; 1.63% due 11/30/26;
valued at $97) | | | 95 | | | | 95 | | |
| | | | 126 | | |
Total Securities held as Collateral on Loaned
Securities (Cost $1,042) | | | 1,042 | | |
The accompanying notes are an integral part of the financial statements.
6
Morgan Stanley Institutional Fund, Inc.
Annual Report — December 31, 2019
Portfolio of Investments (cont'd)
Growth Portfolio
| | | Shares | | Value
(000) | |
Investment Company (1.2%) | |
Morgan Stanley Institutional Liquidity
Funds — Treasury Securities Portfolio —
Institutional Class (See Note G)
(Cost $81,063) | | | 81,063,492 | | | $ | 81,063 | | |
Total Short-Term Investments (Cost $82,105) | | | 82,105 | | |
Total Investments Excluding Purchased
Options (99.1%) (Cost $5,131,294) | | | 6,864,189 | | |
Total Purchased Options Outstanding (0.0%)
(Cost $20,463) | | | 2,435 | | |
Total Investments (99.1%) (Cost $5,151,757)
Including $1,046 of Securities Loaned (e) | | | 6,866,624 | | |
Other Assets in Excess of Liabilities (0.9%) | | | 62,211 | | |
Net Assets (100.0%) | | $ | 6,928,835 | | |
(a) Non-income producing security.
(b) At December 31, 2019, the Fund held fair valued securities valued at approximately $116,248,000, representing 1.7% of net assets. These securities have been fair valued as determined in good faith under procedures established by and under the general supervision of the Company's (as defined herein) Directors.
(c) Security cannot be offered for public resale without first being registered under the Securities Act of 1933 and related rules ("restricted security"). Acquisition date represents the day on which an enforceable right to acquire such security is obtained and is presented along with related cost in the security description. The Fund has registration rights for certain restricted securities. Any costs related to such registration are borne by the issuer. The aggregate value of restricted securities (excluding 144A holdings) at December 31, 2019 amounts to approximately $116,248,000 and represents 1.7% of net assets.
(d) All or a portion of this security was on loan at December 31, 2019.
(e) At December 31, 2019, the aggregate cost for federal income tax purposes is approximately $5,158,839,000. The aggregate gross unrealized appreciation is approximately $2,154,041,000 and the aggregate gross unrealized depreciation is approximately $446,256,000, resulting in net unrealized appreciation of approximately $1,707,785,000.
Call Options Purchased:
The Fund had the following call options purchased open at December 31, 2019:
Counterparty | | Description | | Strike
Price | | Expiration
Date | | Number of
Contracts | | Notional
Amount
(000) | | Value
(000) | | Premiums
Paid
(000) | | Unrealized
Depreciation
(000) | |
BNP Paribas | | USD/CNH | | CNH | 7.58 | | | Jan-20 | | | 1,126,276,241 | | | | 1,126,276 | | | $ | 4 | | | $ | 5,766 | | | $ | (5,762 | ) | |
Royal Bank of Scotland | | USD/CNH | | CNH | 7.85 | | | Jun-20 | | | 1,458,816,594 | | | | 1,458,817 | | | | 956 | | | | 7,527 | | | | (6,571 | ) | |
Royal Bank of Scotland | | USD/CNH | | CNH | 8.09 | | | Sep-20 | | | 1,328,514,158 | | | | 1,328,514 | | | | 1,475 | | | | 7,170 | | | | (5,695 | ) | |
| | | | | | | | | | | | | $ | 2,435 | | | $ | 20,463 | | | $ | (18,028 | ) | |
CNH — Chinese Yuan Renminbi Offshore
USD — United States Dollar
Portfolio Composition*
Classification | | Percentage of
Total Investments | |
Software | | | 20.0 | % | |
Information Technology Services | | | 17.2 | | |
Internet & Direct Marketing Retail | | | 13.7 | | |
Interactive Media & Services | | | 12.1 | | |
Other** | | | 10.0 | | |
Health Care Equipment & Supplies | | | 9.4 | | |
Entertainment | | | 7.4 | | |
Life Sciences Tools & Services | | | 5.1 | | |
Road & Rail | | | 5.1 | | |
Total Investments | | | 100.0 | % | |
* Percentages indicated are based upon total investments (excluding Securities held as Collateral on Loaned Securities) as of December 31, 2019.
** Industries and/or investment types representing less than 5% of total investments.
The accompanying notes are an integral part of the financial statements.
7
Morgan Stanley Institutional Fund, Inc.
Annual Report — December 31, 2019
Statement of Assets and Liabilities | | December 31, 2019
(000) | |
Assets: | |
Investments in Securities of Unaffiliated Issuers, at Value(1) (Cost $5,069,778) | | $ | 6,784,645 | | |
Investment in Security of Affiliated Issuer, at Value (Cost $81,979) | | | 81,979 | | |
Total Investments in Securities, at Value (Cost $5,151,757) | | | 6,866,624 | | |
Foreign Currency, at Value (Cost $1) | | | 1 | | |
Cash from Securities Lending | | | 17 | | |
Receivable for Investments Sold | | | 93,445 | | |
Receivable for Fund Shares Sold | | | 12,815 | | |
Dividends Receivable | | | 1,012 | | |
Receivable from Affiliate | | | 186 | | |
Receivable from Securities Lending Income | | | 6 | | |
Other Assets | | | 381 | | |
Total Assets | | | 6,974,487 | | |
Liabilities: | |
Payable for Investments Purchased | | | 18,608 | | |
Payable for Fund Shares Redeemed | | | 14,213 | | |
Payable for Advisory Fees | | | 6,724 | | |
Due to Broker | | | 2,820 | | |
Collateral on Securities Loaned, at Value | | | 1,059 | | |
Payable for Shareholder Services Fees — Class A | | | 511 | | |
Payable for Distribution and Shareholder Services Fees — Class L | | | 59 | | |
Payable for Distribution and Shareholder Services Fees — Class C | | | 143 | | |
Payable for Sub Transfer Agency Fees — Class I | | | 170 | | |
Payable for Sub Transfer Agency Fees — Class A | | | 383 | | |
Payable for Sub Transfer Agency Fees — Class L | | | 12 | | |
Payable for Sub Transfer Agency Fees — Class C | | | 19 | | |
Payable for Administration Fees | | | 472 | | |
Payable for Transfer Agency Fees — Class I | | | 15 | | |
Payable for Transfer Agency Fees — Class A | | | 39 | | |
Payable for Transfer Agency Fees — Class L | | | 4 | | |
Payable for Transfer Agency Fees — Class C | | | 3 | | |
Payable for Transfer Agency Fees — Class IS | | | 1 | | |
Payable for Transfer Agency Fees — Class IR | | | — | @ | |
Payable for Professional Fees | | | 48 | | |
Payable for Directors' Fees and Expenses | | | 44 | | |
Payable for Custodian Fees | | | 38 | | |
Other Liabilities | | | 267 | | |
Total Liabilities | | | 45,652 | | |
Net Assets | | $ | 6,928,835 | | |
Net Assets Consist of: | |
Paid-in-Capital | | $ | 5,143,705 | | |
Total Distributable Earnings | | | 1,785,130 | | |
Net Assets | | $ | 6,928,835 | | |
The accompanying notes are an integral part of the financial statements.
8
Morgan Stanley Institutional Fund, Inc.
Annual Report — December 31, 2019
Statement of Assets and Liabilities (cont'd) | | December 31, 2019
(000) | |
CLASS I: | |
Net Assets | | $ | 2,440,640 | | |
| Shares Outstanding $0.001 par value shares of beneficial interest (unlimited shares authorized) (not in 000's) | | | 52,683,315 | | |
Net Asset Value, Offering and Redemption Price Per Share | | $ | 46.33 | | |
CLASS A: | |
Net Assets | | $ | 2,399,450 | | |
| Shares Outstanding $0.001 par value shares of beneficial interest (unlimited shares authorized) (not in 000's) | | | 55,065,767 | | |
Net Asset Value, Redemption Price Per Share | | $ | 43.57 | | |
Maximum Sales Load | | | 5.25 | % | |
Maximum Sales Charge | | $ | 2.41 | | |
Maximum Offering Price Per Share | | $ | 45.98 | | |
CLASS L: | |
Net Assets | | $ | 93,053 | | |
| Shares Outstanding $0.001 par value shares of beneficial interest (unlimited shares authorized) (not in 000's) | | | 2,282,291 | | |
Net Asset Value, Offering and Redemption Price Per Share | | $ | 40.77 | | |
CLASS C: | |
Net Assets | | $ | 166,303 | | |
| Shares Outstanding $0.001 par value shares of beneficial interest (unlimited shares authorized) (not in 000's) | | | 4,133,733 | | |
Net Asset Value, Offering and Redemption Price Per Share | | $ | 40.23 | | |
CLASS IS: | |
Net Assets | | $ | 1,560,148 | | |
| Shares Outstanding $0.001 par value shares of beneficial interest (unlimited shares authorized) (not in 000's) | | | 33,388,457 | | |
Net Asset Value, Offering and Redemption Price Per Share | | $ | 46.73 | | |
CLASS IR: | |
Net Assets | | $ | 269,241 | | |
| Shares Outstanding $0.001 par value shares of beneficial interest (unlimited shares authorized) (not in 000's) | | | 5,762,213 | | |
Net Asset Value, Offering and Redemption Price Per Share | | $ | 46.73 | | |
(1) Including:
Securities on Loan, at Value: | | $ | 1,046 | | |
@ Amount is less than $500.
The accompanying notes are an integral part of the financial statements.
9
Morgan Stanley Institutional Fund, Inc.
Annual Report — December 31, 2019
Statement of Operations | | Year Ended
December 31, 2019
(000) | |
Investment Income: | |
Dividends from Security of Affiliated Issuer (Note G) | | $ | 5,271 | | |
Dividends from Securities of Unaffiliated Issuers | | | 4,663 | | |
Income from Securities Loaned — Net | | | 3,711 | | |
Total Investment Income | | | 13,645 | | |
Expenses: | |
Advisory Fees (Note B) | | | 27,284 | | |
Shareholder Services Fees — Class A (Note D) | | | 6,228 | | |
Distribution and Shareholder Services Fees — Class L (Note D) | | | 722 | | |
Distribution and Shareholder Services Fees — Class C (Note D) | | | 1,509 | | |
Administration Fees (Note C) | | | 5,536 | | |
Sub Transfer Agency Fees — Class I | | | 2,221 | | |
Sub Transfer Agency Fees — Class A | | | 2,233 | | |
Sub Transfer Agency Fees — Class L | | | 64 | | |
Sub Transfer Agency Fees — Class C | | | 129 | | |
Shareholder Reporting Fees | | | 431 | | |
Registration Fees | | | 328 | | |
Transfer Agency Fees — Class I (Note E) | | | 72 | | |
Transfer Agency Fees — Class A (Note E) | | | 174 | | |
Transfer Agency Fees — Class L (Note E) | | | 16 | | |
Transfer Agency Fees — Class C (Note E) | | | 19 | | |
Transfer Agency Fees — Class IS (Note E) | | | 6 | | |
Transfer Agency Fees — Class IR (Note E) | | | 2 | | |
Directors' Fees and Expenses | | | 158 | | |
Custodian Fees (Note F) | | | 150 | | |
Professional Fees | | | 149 | | |
Pricing Fees | | | 3 | | |
Other Expenses | | | 192 | | |
Expenses Before Non Operating Expenses | | | 47,626 | | |
Bank Overdraft Expense | | | 1 | | |
Total Expenses | | | 47,627 | | |
Rebate from Morgan Stanley Affiliate (Note G) | | | (552 | ) | |
Net Expenses | | | 47,075 | | |
Net Investment Loss | | | (33,430 | ) | |
Realized Gain (Loss): | |
Investments Sold | | | 905,273 | | |
Foreign Currency Translation | | | (26 | ) | |
Net Realized Gain | | | 905,247 | | |
Change in Unrealized Appreciation (Depreciation): | |
Investments | | | 374,656 | | |
Foreign Currency Translation | | | (11 | ) | |
Net Change in Unrealized Appreciation (Depreciation) | | | 374,645 | | |
Net Realized Gain and Change in Unrealized Appreciation (Depreciation) | | | 1,279,892 | | |
Net Increase in Net Assets Resulting from Operations | | $ | 1,246,462 | | |
The accompanying notes are an integral part of the financial statements.
10
Morgan Stanley Institutional Fund, Inc.
Annual Report — December 31, 2019
Statements of Changes in Net Assets | | Year Ended
December 31, 2019
(000) | | Year Ended
December 31, 2018
(000) | |
Increase (Decrease) in Net Assets: | |
Operations: | |
Net Investment Loss | | $ | (33,430 | ) | | $ | (15,450 | ) | |
Net Realized Gain | | | 905,247 | | | | 297,650 | | |
Net Change in Unrealized Appreciation (Depreciation) | | | 374,645 | | | | (58,520 | ) | |
Net Increase in Net Assets Resulting from Operations | | | 1,246,462 | | | | 223,680 | | |
Dividends and Distributions to Shareholders: | |
Class I | | | (250,375 | ) | | | (128,911 | ) | |
Class A | | | (249,460 | ) | | | (164,975 | ) | |
Class L | | | (10,223 | ) | | | (7,134 | ) | |
Class C | | | (18,689 | ) | | | (6,987 | ) | |
Class IS | | | (141,597 | ) | | | (91,589 | ) | |
Class IR | | | (25,723 | ) | | | (8,886 | ) | |
Total Dividends and Distributions to Shareholders | | | (696,067 | ) | | | (408,482 | ) | |
Capital Share Transactions:(1) | |
Class I: | |
Subscribed | | | 1,270,157 | | | | 1,385,099 | | |
Distributions Reinvested | | | 224,217 | | | | 117,991 | | |
Redeemed | | | (1,016,032 | ) | | | (608,627 | ) | |
Class A: | |
Subscribed | | | 531,381 | | | | 640,192 | | |
Distributions Reinvested | | | 241,503 | | | | 160,500 | | |
Redeemed | | | (629,164 | ) | | | (546,860 | ) | |
Class L: | |
Exchanged | | | 74 | | | | 315 | | |
Distributions Reinvested | | | 10,041 | | | | 7,014 | | |
Redeemed | | | (9,094 | ) | | | (13,831 | ) | |
Class C: | |
Subscribed | | | 91,888 | | | | 76,038 | | |
Distributions Reinvested | | | 16,680 | | | | 6,370 | | |
Redeemed | | | (36,785 | ) | | | (17,708 | ) | |
Class IS: | |
Subscribed | | | 304,283 | | | | 229,920 | | |
Distributions Reinvested | | | 140,426 | | | | 90,879 | | |
Redeemed | | | (226,568 | ) | | | (241,666 | ) | |
Class IR: | |
Subscribed | | | 93,649 | | | | 169,937 | (a) | |
Distributions Reinvested | | | 25,723 | | | | 8,885 | (a) | |
Redeemed | | | (12,024 | ) | | | — | | |
Net Increase in Net Assets Resulting from Capital Share Transactions | | | 1,020,355 | | | | 1,464,448 | | |
Total Increase in Net Assets | | | 1,570,750 | | | | 1,279,646 | | |
Net Assets: | |
Beginning of Period | | | 5,358,085 | | | | 4,078,439 | | |
End of Period | | $ | 6,928,835 | | | $ | 5,358,085 | | |
The accompanying notes are an integral part of the financial statements.
11
Morgan Stanley Institutional Fund, Inc.
Annual Report — December 31, 2019
Statements of Changes in Net Assets (cont'd) | | Year Ended
December 31, 2019
(000) | | Year Ended
December 31, 2018
(000) | |
(1) Capital Share Transactions: | |
Class I: | |
Shares Subscribed | | | 25,589 | | | | 29,271 | | |
Shares Issued on Distributions Reinvested | | | 4,970 | | | | 2,601 | | |
Shares Redeemed | | | (20,652 | ) | | | (12,899 | ) | |
Net Increase in Class I Shares Outstanding | | | 9,907 | | | | 18,973 | | |
Class A: | |
Shares Subscribed | | | 11,250 | | | | 14,015 | | |
Shares Issued on Distributions Reinvested | | | 5,690 | | | | 3,714 | | |
Shares Redeemed | | | (13,463 | ) | | | (12,098 | ) | |
Net Increase in Class A Shares Outstanding | | | 3,477 | | | | 5,631 | | |
Class L: | |
Shares Exchanged | | | 2 | | | | 9 | | |
Shares Issued on Distributions Reinvested | | | 253 | | | | 171 | | |
Shares Redeemed | | | (207 | ) | | | (319 | ) | |
Net Increase (Decrease) in Class L Shares Outstanding | | | 48 | | | | (139 | ) | |
Class C: | |
Shares Subscribed | | | 2,072 | | | | 1,767 | | |
Shares Issued on Distributions Reinvested | | | 426 | | | | 158 | | |
Shares Redeemed | | | (851 | ) | | | (432 | ) | |
Net Increase in Class C Shares Outstanding | | | 1,647 | | | | 1,493 | | |
Class IS: | |
Shares Subscribed | | | 6,239 | | | | 4,734 | | |
Shares Issued on Distributions Reinvested | | | 3,086 | | | | 1,984 | | |
Shares Redeemed | | | (4,547 | ) | | | (5,123 | ) | |
Net Increase in Class IS Shares Outstanding | | | 4,778 | | | | 1,595 | | |
Class IR: | |
Shares Subscribed | | | 1,883 | | | | 3,360 | (a) | |
Shares Issued on Distributions Reinvested | | | 565 | | | | 198 | (a) | |
Shares Redeemed | | | (244 | ) | | | — | | |
Net Increase in Class IR Shares Outstanding | | | 2,204 | | | | 3,558 | (a) | |
(a) For the period June 15, 2018 through December 31, 2018.
The accompanying notes are an integral part of the financial statements.
12
Morgan Stanley Institutional Fund, Inc.
Annual Report — December 31, 2019
Financial Highlights
Growth Portfolio
| | | Class I | |
| | | Year Ended December 31, | |
Selected Per Share Data and Ratios | | 2019 | | 2018 | | 2017 | | 2016(1) | | 2015 | |
Net Asset Value, Beginning of Period | | $ | 41.75 | | | $ | 41.65 | | | $ | 35.19 | | | $ | 40.44 | | | $ | 38.86 | | |
Income (Loss) from Investment Operations: | |
Net Investment Income (Loss)(2) | | | (0.19 | ) | | | (0.08 | ) | | | (0.11 | ) | | | 0.01 | | | | (0.07 | ) | |
Net Realized and Unrealized Gain (Loss) | | | 9.73 | | | | 3.50 | | | | 15.39 | | | | (0.79 | ) | | | 4.70 | | |
Total from Investment Operations | | | 9.54 | | | | 3.42 | | | | 15.28 | | | | (0.78 | ) | | | 4.63 | | |
Distributions from and/or in Excess of: | |
Net Realized Gain | | | (4.96 | ) | | | (3.32 | ) | | | (8.82 | ) | | | (4.47 | ) | | | (3.05 | ) | |
Net Asset Value, End of Period | | $ | 46.33 | | | $ | 41.75 | | | $ | 41.65 | | | $ | 35.19 | | | $ | 40.44 | | |
Total Return(3) | | | 23.16 | % | | | 7.66 | % | | | 43.83 | % | | | (1.91 | )% | | | 11.91 | % | |
Ratios to Average Net Assets and Supplemental Data: | |
Net Assets, End of Period (Thousands) | | $ | 2,440,640 | | | $ | 1,785,893 | | | $ | 991,362 | | | $ | 726,787 | | | $ | 876,660 | | |
Ratio of Expenses Before Expense Limitation | | | 0.59 | % | | | N/A | | | | N/A | | | | 0.63 | % | | | N/A | | |
Ratio of Expenses After Expense Limitation | | | 0.58 | %(4) | | | 0.58 | %(4) | | | 0.61 | %(4) | | | 0.63 | %(4)(5) | | | 0.61 | %(4) | |
Ratio of Expenses After Expense Limitation Excluding Non Operating Expenses | | | 0.58 | %(4) | | | N/A | | | | 0.61 | %(4) | | | N/A | | | | N/A | | |
Ratio of Net Investment Income (Loss) | | | (0.38 | )%(4) | | | (0.17 | )%(4) | | | (0.25 | )%(4) | | | 0.02 | %(4) | | | (0.18 | )%(4) | |
Ratio of Rebate from Morgan Stanley Affiliates | | | 0.01 | % | | | 0.01 | % | | | 0.01 | % | | | 0.00 | %(6) | | | 0.00 | %(6) | |
Portfolio Turnover Rate | | | 87 | % | | | 41 | % | | | 55 | % | | | 39 | % | | | 34 | % | |
(1) Reflects prior period custodian out-of-pocket expenses that were reimbursed in September 2016. The amount of the reimbursement was immaterial on a per share basis and did not impact the total return of Class I shares. The Ratio of Expenses After Expense Limitation would have been less than 0.005% higher and the Ratio of Net Investment Income would have been less than 0.005% lower had the custodian not reimbursed the Fund.
(2) Per share amount is based on average shares outstanding.
(3) Calculated based on the net asset value as of the last business day of the period.
(4) The Ratio of Expenses After Expenses Limitation and Ratio of Net Investment Income (Loss) reflect the rebate of certain Fund expenses in connection with the investments in Morgan Stanley affiliates during the period. The effect of the rebate on the ratios is disclosed in the above table as "Ratio of Rebate from Morgan Stanley Affiliates."
(5) Effective April 7, 2016, the Adviser has agreed to limit the ratio of expenses to average net assets to the maximum ratio of 0.80% for Class I shares. Prior to April 7, 2016, the maximum ratio was 0.70% for Class I shares.
(6) Amount is less than 0.005%.
The accompanying notes are an integral part of the financial statements.
13
Morgan Stanley Institutional Fund, Inc.
Annual Report — December 31, 2019
Financial Highlights
Growth Portfolio
| | | Class A | |
| | | Year Ended December 31, | |
Selected Per Share Data and Ratios | | 2019 | | 2018 | | 2017 | | 2016(1) | | 2015 | |
Net Asset Value, Beginning of Period | | $ | 39.61 | | | $ | 39.77 | | | $ | 33.97 | | | $ | 39.31 | | | $ | 37.98 | | |
Income (Loss) from Investment Operations: | |
Net Investment Loss(2) | | | (0.30 | ) | | | (0.19 | ) | | | (0.22 | ) | | | (0.10 | ) | | | (0.21 | ) | |
Net Realized and Unrealized Gain (Loss) | | | 9.22 | | | | 3.35 | | | | 14.84 | | | | (0.77 | ) | | | 4.59 | | |
Total from Investment Operations | | | 8.92 | | | | 3.16 | | | | 14.62 | | | | (0.87 | ) | | | 4.38 | | |
Distributions from and/or in Excess of: | |
Net Realized Gain | | | (4.96 | ) | | | (3.32 | ) | | | (8.82 | ) | | | (4.47 | ) | | | (3.05 | ) | |
Net Asset Value, End of Period | | $ | 43.57 | | | $ | 39.61 | | | $ | 39.77 | | | $ | 33.97 | | | $ | 39.31 | | |
Total Return(3) | | | 22.81 | % | | | 7.39 | % | | | 43.45 | % | | | (2.21 | )% | | | 11.53 | % | |
Ratios to Average Net Assets and Supplemental Data: | |
Net Assets, End of Period (Thousands) | | $ | 2,399,450 | | | $ | 2,043,706 | | | $ | 1,827,833 | | | $ | 1,376,836 | | | $ | 1,630,538 | | |
Ratio of Expenses Before Expense Limitation | | | 0.84 | % | | | N/A | | | | N/A | | | | 0.92 | % | | | 0.96 | % | |
Ratio of Expenses After Expense Limitation | | | 0.83 | %(4) | | | 0.84 | %(4) | | | 0.88 | %(4) | | | 0.92 | %(4)(5) | | | 0.96 | %(4) | |
Ratio of Expenses After Expense Limitation Excluding Non Operating Expenses | | | 0.83 | %(4) | | | N/A | | | | 0.88 | %(4) | | | N/A | | | | N/A | | |
Ratio of Net Investment Loss | | | (0.64 | )%(4) | | | (0.43 | )%(4) | | | (0.52 | )%(4) | | | (0.26 | )%(4) | | | (0.52 | )%(4) | |
Ratio of Rebate from Morgan Stanley Affiliates | | | 0.01 | % | | | 0.01 | % | | | 0.01 | % | | | 0.00 | %(6) | | | 0.00 | %(6) | |
Portfolio Turnover Rate | | | 87 | % | | | 41 | % | | | 55 | % | | | 39 | % | | | 34 | % | |
(1) Reflects prior period custodian out-of-pocket expenses that were reimbursed in September 2016. The amount of the reimbursement was immaterial on a per share basis and did not impact the total return of Class A shares. The Ratio of Expenses After Expense Limitation would have been 0.005% higher and the Ratio of Net Investment Loss would have been 0.005% lower had the custodian not reimbursed the Fund.
(2) Per share amount is based on average shares outstanding.
(3) Calculated based on the net asset value which does not reflect sales charges, if applicable, as of the last business day of the period.
(4) The Ratio of Expenses After Expenses Limitation and Ratio of Net Investment Loss reflect the rebate of certain Fund expenses in connection with the investments in Morgan Stanley affiliates during the period. The effect of the rebate on the ratios is disclosed in the above table as "Ratio of Rebate from Morgan Stanley Affiliates."
(5) Effective April 7, 2016, the Adviser has agreed to limit the ratio of expenses to average net assets to the maximum ratio of 1.15% for Class A shares. Prior to April 7, 2016, the maximum ratio was 1.05% for Class A shares.
(6) Amount is less than 0.005%.
The accompanying notes are an integral part of the financial statements.
14
Morgan Stanley Institutional Fund, Inc.
Annual Report — December 31, 2019
Financial Highlights
Growth Portfolio
| | | Class L | |
| | | Year Ended December 31, | |
Selected Per Share Data and Ratios | | 2019 | | 2018 | | 2017 | | 2016(1) | | 2015 | |
Net Asset Value, Beginning of Period | | $ | 37.51 | | | $ | 37.99 | | | $ | 32.90 | | | $ | 38.41 | | | $ | 37.40 | | |
Income (Loss) from Investment Operations: | |
Net Investment Loss(2) | | | (0.50 | ) | | | (0.39 | ) | | | (0.43 | ) | | | (0.29 | ) | | | (0.44 | ) | |
Net Realized and Unrealized Gain (Loss) | | | 8.72 | | | | 3.23 | | | | 14.34 | | | | (0.75 | ) | | | 4.50 | | |
Total from Investment Operations | | | 8.22 | | | | 2.84 | | | | 13.91 | | | | (1.04 | ) | | | 4.06 | | |
Distributions from and/or in Excess of: | |
Net Realized Gain | | | (4.96 | ) | | | (3.32 | ) | | | (8.82 | ) | | | (4.47 | ) | | | (3.05 | ) | |
Net Asset Value, End of Period | | $ | 40.77 | | | $ | 37.51 | | | $ | 37.99 | | | $ | 32.90 | | | $ | 38.41 | | |
Total Return(3) | | | 22.22 | % | | | 6.89 | % | | | 42.69 | % | | | (2.72 | )% | | | 10.85 | % | |
Ratios to Average Net Assets and Supplemental Data: | |
Net Assets, End of Period (Thousands) | | $ | 93,053 | | | $ | 83,818 | | | $ | 90,177 | | | $ | 74,324 | | | $ | 89,277 | | |
Ratio of Expenses Before Expense Limitation | | | 1.33 | % | | | N/A | | | | N/A | | | | 1.45 | % | | | 1.57 | % | |
Ratio of Expenses After Expense Limitation | | | 1.32 | %(4) | | | 1.31 | %(4) | | | 1.42 | %(4) | | | 1.45 | %(4)(5) | | | 1.55 | %(4) | |
Ratio of Expenses After Expense Limitation Excluding Non Operating Expenses | | | 1.32 | %(4) | | | N/A | | | | 1.42 | %(4) | | | N/A | | | | N/A | | |
Ratio of Net Investment Loss | | | (1.12 | )%(4) | | | (0.90 | )%(4) | | | (1.05 | )%(4) | | | (0.79 | )%(4) | | | (1.11 | )%(4) | |
Ratio of Rebate from Morgan Stanley Affiliates | | | 0.01 | % | | | 0.01 | % | | | 0.01 | % | | | 0.00 | %(6) | | | 0.00 | %(6) | |
Portfolio Turnover Rate | | | 87 | % | | | 41 | % | | | 55 | % | | | 39 | % | | | 34 | % | |
(1) Reflects prior period custodian out-of-pocket expenses that were reimbursed in September 2016. The amount of the reimbursement was immaterial on a per share basis and did not impact the total return of Class L shares. The Ratio of Expenses After Expense Limitation would have been less than 0.005% higher and the Ratio of Net Investment Loss would have been less than 0.005% lower had the custodian not reimbursed the Fund.
(2) Per share amount is based on average shares outstanding.
(3) Calculated based on the net asset value as of the last business day of the period.
(4) The Ratio of Expenses After Expenses Limitation and Ratio of Net Investment Loss reflect the rebate of certain Fund expenses in connection with the investments in Morgan Stanley affiliates during the period. The effect of the rebate on the ratios is disclosed in the above table as "Ratio of Rebate from Morgan Stanley Affiliates."
(5) Effective April 7, 2016, the Adviser has agreed to limit the ratio of expenses to average net assets to the maximum ratio of 1.65% for Class L shares. Prior to April 7, 2016, the maximum ratio was 1.55% for Class L shares.
(6) Amount is less than 0.005%.
The accompanying notes are an integral part of the financial statements.
15
Morgan Stanley Institutional Fund, Inc.
Annual Report — December 31, 2019
Financial Highlights
Growth Portfolio
| | | Class C | |
| | | Year Ended December 31, | | Period from
April 30, 2015(2) to | |
Selected Per Share Data and Ratios | | 2019 | | 2018 | | 2017 | | 2016(1) | | December 31, 2015 | |
Net Asset Value, Beginning of Period | | $ | 37.17 | | | $ | 37.76 | | | $ | 32.81 | | | $ | 38.40 | | | $ | 40.33 | | |
Income (Loss) from Investment Operations: | |
Net Investment Loss(3) | | | (0.61 | ) | | | (0.51 | ) | | | (0.51 | ) | | | (0.38 | ) | | | (0.35 | ) | |
Net Realized and Unrealized Gain (Loss) | | | 8.63 | | | | 3.24 | | | | 14.28 | | | | (0.74 | ) | | | 1.47 | | |
Total from Investment Operations | | | 8.02 | | | | 2.73 | | | | 13.77 | | | | (1.12 | ) | | | 1.12 | | |
Distributions from and/or in Excess of: | |
Net Realized Gain | | | (4.96 | ) | | | (3.32 | ) | | | (8.82 | ) | | | (4.47 | ) | | | (3.05 | ) | |
Net Asset Value, End of Period | | $ | 40.23 | | | $ | 37.17 | | | $ | 37.76 | | | $ | 32.81 | | | $ | 38.40 | | |
Total Return(4) | | | 21.91 | % | | | 6.61 | % | | | 42.37 | % | | | (2.93 | )% | | | 2.71 | %(8) | |
Ratios to Average Net Assets and Supplemental Data: | |
Net Assets, End of Period (Thousands) | | $ | 166,303 | | | $ | 92,431 | | | $ | 37,524 | | | $ | 16,613 | | | $ | 13,544 | | |
Ratio of Expenses Before Expense Limitation | | | 1.59 | % | | | N/A | | | | N/A | | | | 1.70 | % | | | N/A | | |
Ratio of Expenses After Expense Limitation | | | 1.58 | %(5) | | | 1.57 | %(5) | | | 1.63 | %(5) | | | 1.70 | %(5)(6) | | | 1.62 | %(5)(9) | |
Ratio of Expenses After Expense Limitation Excluding Non Operating Expenses | | | 1.58 | %(5) | | | N/A | | | | 1.63 | % | | | N/A | | | | N/A | | |
Ratio of Net Investment Loss | | | (1.38 | )%(5) | | | (1.17 | )%(5) | | | (1.26 | )%(5) | | | (1.04 | )%(5) | | | (1.29 | )%(5)(9) | |
Ratio of Rebate from Morgan Stanley Affiliates | | | 0.01 | % | | | 0.01 | % | | | 0.01 | % | | | 0.00 | %(7) | | | 0.00 | %(7)(9) | |
Portfolio Turnover Rate | | | 87 | % | | | 41 | % | | | 55 | % | | | 39 | % | | | 34 | % | |
(1) Reflects prior period custodian out-of-pocket expenses that were reimbursed in September 2016. The amount of the reimbursement was immaterial on a per share basis and did not impact the total return of Class C shares. The Ratio of Expenses After Expense Limitation would have been less than 0.005% higher and the Ratio of Net Investment Loss would have been less than 0.005% lower had the custodian not reimbursed the Fund.
(2) Commencement of Offering.
(3) Per share amount is based on average shares outstanding.
(4) Calculated based on the net asset value which does not reflect sales charges, if applicable, as of the last business day of the period.
(5) The Ratio of Expenses After Expenses Limitation and Ratio of Net Investment Loss reflect the rebate of certain Fund expenses in connection with the investments in Morgan Stanley affiliates during the period. The effect of the rebate on the ratios is disclosed in the above table as "Ratio of Rebate from Morgan Stanley Affiliates."
(6) Effective April 7, 2016, the Adviser has agreed to limit the ratio of expenses to average net assets to the maximum ratio of 1.90% for Class C shares. Prior to April 7, 2016, the maximum ratio was 1.80% for Class C shares.
(7) Amount is less than 0.005%.
(8) Not annualized.
(9) Annualized.
The accompanying notes are an integral part of the financial statements.
16
Morgan Stanley Institutional Fund, Inc.
Annual Report — December 31, 2019
Financial Highlights
Growth Portfolio
| | | Class IS | |
| | | Year Ended December 31, | |
Selected Per Share Data and Ratios | | 2019 | | 2018 | | 2017 | | 2016(1) | | 2015 | |
Net Asset Value, Beginning of Period | | $ | 42.04 | | | $ | 41.89 | | | $ | 35.32 | | | $ | 40.54 | | | $ | 38.92 | | |
Income (Loss) from Investment Operations: | |
Net Investment Income (Loss)(2) | | | (0.15 | ) | | | (0.04 | ) | | | (0.07 | ) | | | 0.05 | | | | (0.04 | ) | |
Net Realized and Unrealized Gain (Loss) | | | 9.80 | | | | 3.51 | | | | 15.46 | | | | (0.80 | ) | | | 4.71 | | |
Total from Investment Operations | | | 9.65 | | | | 3.47 | | | | 15.39 | | | | (0.75 | ) | | | 4.67 | | |
Distributions from and/or in Excess of: | |
Net Realized Gain | | | (4.96 | ) | | | (3.32 | ) | | | (8.82 | ) | | | (4.47 | ) | | | (3.05 | ) | |
Net Asset Value, End of Period | | $ | 46.73 | | | $ | 42.04 | | | $ | 41.89 | | | $ | 35.32 | | | $ | 40.54 | | |
Total Return(3) | | | 23.26 | % | | | 7.74 | % | | | 43.98 | % | | | (1.83 | )% | | | 11.97 | % | |
Ratios to Average Net Assets and Supplemental Data: | |
Net Assets, End of Period (Thousands) | | $ | 1,560,148 | | | $ | 1,202,659 | | | $ | 1,131,543 | | | $ | 875,021 | | | $ | 1,019,889 | | |
Ratio of Expenses Before Expense Limitation | | | 0.50 | % | | | N/A | | | | N/A | | | | 0.54 | % | | | N/A | | |
Ratio of Expenses After Expense Limitation | | | 0.49 | %(4) | | | 0.50 | %(4) | | | 0.53 | %(4) | | | 0.54 | %(4)(5) | | | 0.54 | %(4) | |
Ratio of Expenses After Expense Limitation Excluding Non Operating Expenses | | | 0.49 | %(4) | | | N/A | | | | 0.53 | %(4) | | | N/A | | | | N/A | | |
Ratio of Net Investment Income (Loss) | | | (0.29 | )%(4) | | | (0.09 | )%(4) | | | (0.16 | )%(4) | | | 0.12 | %(4) | | | (0.10 | )%(4) | |
Ratio of Rebate from Morgan Stanley Affiliates | | | 0.01 | % | | | 0.01 | % | | | 0.01 | % | | | 0.00 | %(6) | | | 0.00 | %(6) | |
Portfolio Turnover Rate | | | 87 | % | | | 41 | % | | | 55 | % | | | 39 | % | | | 34 | % | |
(1) Reflects prior period custodian out-of-pocket expenses that were reimbursed in September 2016. The amount of the reimbursement was immaterial on a per share basis and did not impact the total return of Class IS shares. The Ratio of Expenses After Expense Limitation would have been less than 0.005% higher and the Ratio of Net Investment Income would have been less than 0.005% lower had the custodian not reimbursed the Fund.
(2) Per share amount is based on average shares outstanding.
(3) Calculated based on the net asset value as of the last business day of the period.
(4) The Ratio of Expenses After Expenses Limitation and Ratio of Net Investment Income (Loss) reflect the rebate of certain Fund expenses in connection with the investments in Morgan Stanley affiliates during the period. The effect of the rebate on the ratios is disclosed in the above table as "Ratio of Rebate from Morgan Stanley Affiliates."
(5) Effective April 7, 2016, the Adviser has agreed to limit the ratio of expenses to average net assets to the maximum ratio of 0.73% for Class IS shares. Prior to April 7, 2016, the maximum ratio was 0.67% for Class IS shares.
(6) Amount is less than 0.005%.
The accompanying notes are an integral part of the financial statements.
17
Morgan Stanley Institutional Fund, Inc.
Annual Report — December 31, 2019
Financial Highlights
Growth Portfolio
| | | Class IR | |
Selected Per Share Data and Ratios | | Year Ended
December 31,2019 | | Period from
June 15, 2018(1) to
December 31, 2018 | |
Net Asset Value, Beginning of Period | | $ | 42.04 | | | $ | 52.16 | | |
Income (Loss) from Investment Operations: | |
Net Investment Loss(2) | | | (0.15 | ) | | | (0.04 | ) | |
Net Realized and Unrealized Gain (Loss) | | | 9.80 | | | | (6.76 | ) | |
Total from Investment Operations | | | 9.65 | | | | (6.80 | ) | |
Distributions from and/or in Excess of: | |
Net Realized Gain | | | (4.96 | ) | | | (3.32 | ) | |
Net Asset Value, End of Period | | $ | 46.73 | | | $ | 42.04 | | |
Total Return(3) | | | 23.26 | % | | | (13.48 | )%(5) | |
Ratios to Average Net Assets and Supplemental Data: | |
Net Assets, End of Period, (Thousands) | | $ | 269,241 | | | $ | 149,578 | | |
Ratio of Expenses Before Expense Limitation | | | 0.50 | % | | | N/A | | |
Ratio of Expenses After Expense Limitation | | | 0.49 | %(4) | | | 0.49 | %(4)(6) | |
Ratios of Expenses After Expense Limitation Excluding Non Operating Expenses | | | 0.49 | %(4) | | | N/A | | |
Ratio of Net Investment Loss | | | (0.30 | )%(4) | | | (0.14 | )%(4)(6) | |
Ratio of Rebate from Morgan Stanley Affiliates | | | 0.01 | % | | | 0.01 | %(6) | |
Portfolio Turnover Rate | | | 87 | % | | | 41 | % | |
(1) Commencement of Offering.
(2) Per share amount is based on average shares outstanding.
(3) Calculated based on the net asset value as of the last business day of the period.
(4) The Ratio of Expenses After Expenses Limitation and Ratio of Net Investment Loss reflect the rebate of certain Fund expenses in connection with the investments in Morgan Stanley affiliates during the period. The effect of the rebate on the ratios is disclosed in the above table as "Ratio of Rebate from Morgan Stanley Affiliates."
(5) Not annualized.
(6) Annualized.
The accompanying notes are an integral part of the financial statements.
18
Morgan Stanley Institutional Fund, Inc.
Annual Report — December 31, 2019
Notes to Financial Statements
Morgan Stanley Institutional Fund, Inc. (the "Company") is registered under the Investment Company Act of 1940, as amended (the "Act"), as an open-end management investment company. The Company is comprised of thirty-two separate, active, diversified and non-diversified funds (individually referred to as a "Fund," collectively as the "Funds"). The Company applies investment company accounting and reporting guidance.
The accompanying financial statements relate to the Growth Portfolio. The Fund seeks long-term capital appreciation by investing primarily in growth-oriented equity securities of large capitalization companies.
The Fund offers six classes of shares — Class I, Class A, Class L, Class C, Class IS and Class IR. On April 30, 2015, the Fund suspended offering of Class L shares. Existing Class L shareholders may invest through reinvestment of dividends and distributions.
A. Significant Accounting Policies: The following significant accounting policies are in conformity with U.S. generally accepted accounting principles ("GAAP"). Such policies are consistently followed by the Company in the preparation of its financial statements. GAAP may require management to make estimates and assumptions that affect the reported amounts and disclosures in the financial statements. Actual results may differ from those estimates.
In August 2018, the Financial Accounting Standards Board ("FASB") issued Accounting Standards Update ("ASU") 2018-13, Fair Value Measurement (Topic 820) — Disclosures Framework — Changes to Disclosure Requirements of Fair Value Measurement ("ASU 2018-13") which introduces new fair value disclosure requirements as well as eliminates and modifies certain existing fair value disclosure requirements. ASU 2018-13 would be effective for fiscal years beginning after December 15, 2019 and for interim periods within those fiscal years; however, management has elected to early adopt ASU 2018-13 as permitted by the standard. The impact of the Fund's adoption was limited to changes in the Fund's financial statement disclosures regarding fair value, primarily those disclosures related to transfers between levels of the fair value hierarchy and disclosure of the range and weighted average used to develop significant unobservable inputs for Level 3 fair value measurements, when applicable.
1. Security Valuation: (1) An equity portfolio security listed or traded on an exchange is valued at its latest
reported sales price (or at the exchange official closing price if such exchange reports an official closing price), and if there were no sales on a given day and if there is no official exchange closing price for that day, the security is valued at the mean between the last reported bid and asked prices if such bid and asked prices are available on the relevant exchanges. If only bid prices are available then the latest bid price may be used. Listed equity securities not traded on the valuation date with no reported bid and asked prices available on the exchange are valued at the mean between the current bid and asked prices obtained from one or more reputable brokers or dealers. In cases where a security is traded on more than one exchange, the security is valued on the exchange designated as the primary market; (2) all other equity portfolio securities for which over-the-counter ("OTC") market quotations are readily available are valued at the latest reported sales price (or at the market official closing price if such market reports an official closing price), and if there was no trading in the security on a given day and if there is no official closing price from relevant markets for that day, the security is valued at the mean between the last reported bid and asked prices if such bid and asked prices are available on the relevant markets. An unlisted equity security that does not trade on the valuation date and for which bid and asked prices from the relevant markets are unavailable is valued at the mean between the current bid and asked prices obtained from one or more reputable brokers or dealers; (3) certain portfolio securities may be valued by an outside pricing service/vendor approved by the Company's Board of Directors (the "Directors"). The pricing service/vendor may employ a pricing model that takes into account, among other things, bids, yield spreads and/or other market data and specific security characteristics. Alternatively, if a valuation is not available from an outside pricing service/vendor, and the security trades on an exchange, the security may be valued at its latest reported sale price (or at the exchange official closing price if such exchange reports an official closing price), prior to the time when assets are valued. If there are no sales on a given day and if there is no official exchange closing price for that day, the security is valued at the mean between the last reported bid and asked prices if such bid and asked prices are available in the relevant exchanges. If Morgan Stanley Investment Management Inc. (the "Adviser"), a wholly-owned subsidiary of Morgan Stanley, determines
19
Morgan Stanley Institutional Fund, Inc.
Annual Report — December 31, 2019
Notes to Financial Statements (cont'd)
that the price provided by the outside pricing service/vendor or exchange does not reflect the security's fair value or is unable to provide a price, prices from brokers or dealers may also be utilized. In these circumstances, the value of the security will be the mean of bid and asked prices obtained from brokers or dealers; (4) listed options are valued at the last reported sales price on the exchange on which they are listed (or at the exchange official closing price if such exchange reports an official closing price). If an official closing price or last reported sales price is unavailable, the listed option should be fair valued at the mean between its latest bid and ask prices. Unlisted options are valued at the mean between their latest bid and ask prices from a broker/dealer or valued by a pricing service/vendor; (5) when market quotations are not readily available, including circumstances under which the Adviser determines that the closing price, last sale price or the mean between the last reported bid and asked prices are not reflective of a security's market value, portfolio securities are valued at their fair value as determined in good faith under procedures established by and under the general supervision of the Directors. Occasionally, developments affecting the closing prices of securities and other assets may occur between the times at which valuations of such securities are determined (that is, close of the foreign market on which the securities trade) and the close of business of the New York Stock Exchange ("NYSE"). If developments occur during such periods that are expected to materially affect the value of such securities, such valuations may be adjusted to reflect the estimated fair value of such securities as of the close of the NYSE, as determined in good faith by the Directors or by the Adviser using a pricing service and/or procedures approved by the Directors; (6) quotations of foreign portfolio securities, other assets and liabilities and forward contracts stated in foreign currency are translated into U.S. dollar equivalents at the prevailing market rates prior to the close of the NYSE; and (7) investments in mutual funds, including the Morgan Stanley Institutional Liquidity Funds, are valued at the net asset value ("NAV") as of the close of each business day.
The Directors have responsibility for determining in good faith the fair value of the investments, and the Directors may appoint others, such as the Company's Adviser or a valuation committee, to assist the Directors in determining fair value and to make the actual calculations pursuant
to the fair valuation methodologies previously approved by the Directors. Under procedures approved by the Directors, the Company's Adviser has formed a Valuation Committee whose members are approved by the Directors. The Valuation Committee provides administration and oversight of the Company's valuation policies and procedures, which are reviewed at least annually by the Directors. These procedures allow the Company to utilize independent pricing services, quotations from securities and financial instrument dealers and other market sources to determine fair value.
2. Fair Value Measurement: FASB Accounting Standards CodificationTM ("ASC") 820, "Fair Value Measurement" ("ASC 820"), defines fair value as the value that the Fund would receive to sell an investment or pay to transfer a liability in a timely transaction with an independent buyer in the principal market, or in the absence of a principal market, the most advantageous market for the investment or liability. ASC 820 establishes a three-tier hierarchy to distinguish between (1) inputs that reflect the assumptions market participants would use in valuing an asset or liability developed based on market data obtained from sources independent of the reporting entity (observable inputs) and (2) inputs that reflect the reporting entity's own assumptions about the assumptions market participants would use in valuing an asset or liability developed based on the best information available in the circumstances (unobservable inputs) and to establish classification of fair value measurements for disclosure purposes. Various inputs are used in determining the value of the Fund's investments. The inputs are summarized in the three broad levels listed below:
• Level 1 – unadjusted quoted prices in active markets for identical investments
• Level 2 – other significant observable inputs (including quoted prices for similar investments, interest rates, prepayment speeds, credit risk, etc.)
• Level 3 – significant unobservable inputs including the Fund's own assumptions in determining the fair value of investments. Factors considered in making this determination may include, but are not limited to, information obtained by contacting the issuer, analysts, or the appropriate stock exchange (for
20
Morgan Stanley Institutional Fund, Inc.
Annual Report — December 31, 2019
Notes to Financial Statements (cont'd)
exchange-traded securities), analysis of the issuer's financial statements or other available documents and, if necessary, available information concerning other securities in similar circumstances.
The inputs or methodology used for valuing securities are not necessarily an indication of the risk associated with investing in those securities and the determination of the significance of a particular input to the fair value measurement in its entirety requires judgment and considers factors specific to each security.
The following is a summary of the inputs used to value the Fund's investments as of December 31, 2019:
Investment Type | | Level 1
Unadjusted
quoted
prices
(000) | | Level 2
Other
significant
observable
inputs
(000) | | Level 3
Significant
unobservable
inputs
(000) | | Total
(000) | |
Assets: | |
Common Stocks | |
Biotechnology | | $ | 72,168 | | | $ | — | | | $ | — | | | $ | 72,168 | | |
Entertainment | | | 506,148 | | | | — | | | | — | | | | 506,148 | | |
Health Care
Equipment &
Supplies | | �� | 648,907 | | | | — | | | | — | | | | 648,907 | | |
Health Care
Providers &
Services | | | 169,289 | | | | — | | | | — | | | | 169,289 | | |
Health Care
Technology | | | 246,398 | | | | — | | | | 29,749 | | | | 276,147 | | |
Information
Technology
Services | | | 1,180,257 | | | | — | | | | — | | | | 1,180,257 | | |
Interactive Media &
Services | | | 831,124 | | | | — | | | | — | | | | 831,124 | | |
Internet & Direct
Marketing Retail | | | 871,763 | | | | — | | | | — | | | | 871,763 | | |
Life Sciences Tools &
Services | | | 351,390 | | | | — | | | | — | | | | 351,390 | | |
Road & Rail | | | 346,956 | | | | — | | | | — | | | | 346,956 | | |
Software | | | 1,371,889 | | | | — | | | | — | | | | 1,371,889 | | |
Specialty Retail | | | 69,547 | | | | — | | | | — | | | | 69,547 | | |
Total Common Stocks | | | 6,665,836 | | | | — | | | | 29,749 | | | | 6,695,585 | | |
Preferred Stocks | |
Electronic Equipment,
Instruments &
Components | | | — | | | | — | | | | 19,904 | | | | 19,904 | | |
Internet & Direct
Marketing Retail | | | — | | | | — | | | | 66,595 | | | | 66,595 | | |
Total Preferred Stocks | | | — | | | | — | | | | 86,499 | | | | 86,499 | | |
Investment Type | | Level 2
Level 1
Unadjusted
quoted
prices
(000) | | Other
significant
observable
inputs
(000) | | Level 3
Significant
unobservable
inputs
(000) | | Total
(000) | |
Call Options
Purchased | | $ | — | | | $ | 2,435 | | | $ | — | | | $ | 2,435 | | |
Short-Term
Investments | |
Investment Company | | | 81,979 | | | | — | | | | — | | | | 81,979 | | |
Repurchase
Agreements | | | — | | | | 126 | | | | — | | | | 126 | | |
Total Short-Term
Investments | | | 81,979 | | | | 126 | | | | — | | | | 82,105 | | |
Total Assets | | $ | 6,747,815 | | | $ | 2,561 | | | $ | 116,248 | | | $ | 6,866,624 | | |
Transfers between investment levels may occur as the markets fluctuate and/or the availability of data used in an investment's valuation changes.
Following is a reconciliation of investments in which significant unobservable inputs (Level 3) were used in determining fair value:
| | | Common
Stock
(000) | | Preferred
Stocks
(000) | |
Beginning Balance | | $ | — | | | $ | 134,501 | | |
Purchases | | | 25,069 | | | | — | | |
Sales | | | — | | | | — | | |
Amortization of discount | | | — | | | | — | | |
Transfers in | | | — | | | | — | | |
Transfers out | | | — | | | | — | | |
Corporate actions | | | — | | | | (51,238 | ) | |
Change in unrealized appreciation (depreciation) | | | 4,680 | | | | 3,236 | | |
Realized gains (losses) | | | — | | | | — | | |
Ending Balance | | $ | 29,749 | | | $ | 86,499 | | |
Net change in unrealized appreciation (depreciation)
from investments still held as of December 31, 2019 | | $ | 4,680 | | | $ | 3,236 | | |
21
Morgan Stanley Institutional Fund, Inc.
Annual Report — December 31, 2019
Notes to Financial Statements (cont'd)
The following table presents additional information about valuation techniques and inputs used for investments that are measured at fair value and categorized within Level 3 as of December 31, 2019. Various valuation techniques were used in the valuation of certain investments and weighted based on the level of significance. The Fund calculated the weighted averages of the unobservable inputs relative to each investment's fair value as of December 31, 2019.
| | | Fair Value at
December 31, 2019
(000) | | Valuation
Technique | | Unobservable
Input | | Amount or Range/
Weighted Average* | | Impact to
Valuation from an
Increase in Input** | |
Common Stock | | $ | 29,749 | | | Market Transaction
Method | | Precedent Transaction | | $ | 449.46 | | | Increase | |
Preferred Stocks | | $ | 86,499 | | | Market Transaction
Method | | Precedent Transaction | | $ | 27.00 | | | Increase | |
| | | | | Discounted Cash Flow | | Weighted Average
Cost of Capital | | 12.5%–24.5%/15.8% | | Decrease | |
| | | | | | | Perpetual Growth Rate | | 3.0%–4.0%/3.5% | | Increase | |
| | | | | Market Comparable
Companies | | Enterprise
Value/Revenue | | 0.6x–15.1x/5.8x | | Increase | |
| | | | | | | Discount for Lack of
Marketability | | 8.5%–17.0%/10.5% | | Decrease | |
* Amount is indicative of the weighted average.
** Represents the expected directional change in the fair value of the Level 3 investments that would result from an increase in the corresponding input. A decrease to the unobservable input would have the opposite effect. Significant changes in these inputs could result in significantly higher or lower fair value measurements.
3. Repurchase Agreements: The Fund may enter into repurchase agreements under which the Fund lends cash and takes possession of securities with an agreement that the counterparty will repurchase such securities. In connection with transactions in repurchase agreements, a bank as custodian for the Fund takes possession of the underlying securities which are held as collateral, with a market value at least equal to the amount of the repurchase transaction, including principal and accrued interest. To the extent that any repurchase transaction exceeds one business day, the value of the collateral is marked-to-market on a daily basis to determine that the value of the collateral does not decrease below the repurchase price plus accrued interest as earned. If such a decrease occurs, additional collateral will be requested and, when received, will be added to the account to maintain full collateralization. In the event of default on the obligation to repurchase, the Fund has the right to liquidate the collateral and apply the proceeds in satisfaction of the obligation. In the event of default or bankruptcy by the counterparty to the agreement, realization of the collateral proceeds may be subject to cost and delays. The Fund, along with other affiliated investment companies, may utilize a joint trading account for the purpose of entering into repurchase agreements.
4. Foreign Currency Translation and Foreign Investments: The books and records of the Fund are
maintained in U.S. dollars. Foreign currency amounts are translated into U.S. dollars as follows:
– investments, other assets and liabilities at the prevailing rate of exchange on the valuation date;
– investment transactions and investment income at the prevailing rates of exchange on the dates of such transactions.
Although the net assets of the Fund are presented at the foreign exchange rates and market values at the close of the period, the Fund does not isolate that portion of the results of operations arising as a result of changes in the foreign exchange rates from the fluctuations arising from changes in the market prices of securities held at period end. Similarly, the Fund does not isolate the effect of changes in foreign exchange rates from the fluctuations arising from changes in the market prices of securities sold during the period. Accordingly, realized and unrealized foreign currency gains (losses) on investments in securities are included in the reported net realized and unrealized gains (losses) on investment transactions and balances. However, pursuant to U.S. federal income tax regulations, gains and losses from certain foreign currency transactions and the foreign currency portion of gains and losses realized on sales and maturities of foreign denominated debt securities are
22
Morgan Stanley Institutional Fund, Inc.
Annual Report — December 31, 2019
Notes to Financial Statements (cont'd)
treated as ordinary income for U.S. federal income tax purposes.
Net realized gains (losses) on foreign currency transactions represent net foreign exchange gains (losses) from foreign currency forward exchange contracts, disposition of foreign currencies, currency gains (losses) realized between the trade and settlement dates on securities transactions, and the difference between the amount of investment income and foreign withholding taxes recorded on the Fund's books and the U.S. dollar equivalent amounts actually received or paid. The change in unrealized currency gains (losses) on foreign currency transactions for the period is reflected in the Statement of Operations.
Foreign security and currency transactions may involve certain considerations and risks not typically associated with those of U.S. dollar denominated transactions as a result of, among other factors, fluctuations of exchange rates in relation to the U.S. dollar, the possibility of lower levels of governmental supervision and regulation of foreign securities markets and the possibility of political or economic instability.
Governmental approval for foreign investments may be required in advance of making an investment under certain circumstances in some countries, and the extent of foreign investments in domestic companies may be subject to limitation in other countries. Foreign ownership limitations also may be imposed by the charters of individual companies to prevent, among other concerns, violations of foreign investment limitations. As a result, an additional class of shares (identified as "Foreign" in the Portfolio of Investments) may be created and offered for investment. The "local" and "foreign shares" market values may differ. In the absence of trading of the foreign shares in such markets, the Fund values the foreign shares at the closing exchange price of the local shares.
5. Derivatives: The Fund may, but is not required to, use derivative instruments for a variety of purposes, including hedging, risk management, portfolio management or to earn income. Derivatives are financial instruments whose value is based, in part, on the value of an underlying asset, interest rate, index or financial instrument. Prevailing interest rates and volatility levels, among other things, also affect the value of derivative instruments. A derivative instrument often has risks similar to its underlying asset and
may have additional risks, including imperfect correlation between the value of the derivative and the underlying asset, risks of default by the counterparty to certain transactions, magnification of losses incurred due to changes in the market value of the securities, instruments, indices or interest rates to which the derivative instrument relates, risks that the transactions may not be liquid and risks arising from margin requirements. The use of derivatives involves risks that are different from, and possibly greater than, the risks associated with other portfolio investments. Derivatives may involve the use of highly specialized instruments that require investment techniques and risk analyses different from those associated with other portfolio investments. All of the Fund's holdings, including derivative instruments, are marked-to-market each day with the change in value reflected in unrealized appreciation (depreciation). Upon disposition, a realized gain or loss is recognized.
Certain derivative transactions may give rise to a form of leverage. Leverage magnifies the potential for gain and the risk of loss. Leverage associated with derivative transactions may cause the Fund to liquidate portfolio positions when it may not be advantageous to do so to satisfy its obligations or to meet earmarking or segregation requirements, pursuant to applicable Securities and Exchange Commission ("SEC") rules and regulations, or may cause the Fund to be more volatile than if the Fund had not been leveraged. Although the Adviser seeks to use derivatives to further the Fund's investment objectives, there is no assurance that the use of derivatives will achieve this result.
Following is a description of the derivative instruments and techniques that the Fund used during the period and their associated risks:
Options: With respect to options, the Fund is subject to equity risk, interest rate risk and foreign currency exchange risk in the normal course of pursuing its investment objectives. If the Fund buys an option, it buys a legal contract giving it the right to buy or sell a specific amount of the underlying instrument or foreign currency, or futures contract on the underlying instrument or foreign currency, at an agreed-upon price during a period of time or on a specified date typically in exchange for a premium paid by the Fund. The Fund may purchase and/or sell put and call options. Purchasing
23
Morgan Stanley Institutional Fund, Inc.
Annual Report — December 31, 2019
Notes to Financial Statements (cont'd)
call options tends to increase the Fund's exposure to the underlying (or similar) instrument. Purchasing put options tends to decrease the Fund's exposure to the underlying (or similar) instrument. When entering into purchased option contracts, the Fund bears the risk of interest or exchange rates or securities prices moving unexpectedly, in which case, the Fund may not achieve the anticipated benefits of the purchased option contracts; however the risk of loss is limited to the premium paid. Purchased options are reported as part of "Total Investments in Securities" in the Statement of Assets and Liabilities. Premiums paid for purchasing options which expired are treated as realized losses. If the Fund sells an option, it sells to another party the right to buy from or sell to the Fund a specific amount of the underlying instrument or foreign currency, or futures contract on the underlying instrument or foreign currency, at an agreed-upon price during a period of time or on a specified date typically in exchange for a premium received by the Fund. When options are purchased OTC, the Fund bears the risk that the counterparty that wrote the option will be unable or unwilling to perform its obligations under the option contract. Options may also be illiquid and the Fund may have difficulty closing out its position. A decision as to whether, when and how to use options involves the exercise of skill and judgment and even a well-conceived option transaction may be unsuccessful because of market behavior or unexpected events. The prices of options can be highly volatile and the use of options can lower total returns.
FASB ASC 815, "Derivatives and Hedging" ("ASC 815"), is intended to improve financial reporting about derivative instruments by requiring enhanced disclosures to enable investors to better understand how and why the Fund uses derivative instruments, how these derivative instruments are accounted for and their effects on the Fund's financial position and results of operations.
The following table sets forth the fair value of the Fund's derivative contracts by primary risk exposure as of December 31, 2019:
| | | Asset Derivatives
Statement of Assets and
Liabilities Location | | Primary Risk
Exposure | | Value
(000) | |
Purchased Options
| | Investments, at Value
(Purchased Options) | | Currency Risk | | $ | 2,435 | (a) | |
(a) Amounts are included in Investments in Securities in the Statement of Assets and Liabilities.
The following tables set forth by primary risk exposure the Fund's realized gains (losses) and change in unrealized appreciation (depreciation) by type of derivative contract for the year ended December 31, 2019 in accordance with ASC 815:
Realized Gain (Loss) | |
Primary Risk Exposure | | Derivative Type | | Value
(000) | |
Currency Risk | | Investments
(Purchased Options) | | $ | (15,994 | )(b) | |
(b) Amounts are included in Investments Sold in the Statement of Operations.
Change in Unrealized Appreciation (Depreciation) | |
Primary Risk Exposure | | Derivative Type | | Value
(000) | |
Currency Risk | | Investments
(Purchased Options) | | $ | (5,251 | )(c) | |
(c) Amounts are included in Investments in the Statement of Operations.
At December 31, 2019, the Fund's derivative assets and liabilities are as follows:
Gross Amounts of Assets and Liabilities
Presented in the Statement of Assets and Liabilities | |
Derivatives | | Assets(d)
(000) | | Liabilities(d)
(000) | |
Purchased Options | | $ | 2,435 | (a) | | $ | — | | |
(a) Amounts are included in Investments in Securities in the Statement of Assets and Liabilities.
(d) Absent an event of default or early termination, OTC derivative assets and liabilities are presented gross and not offset in the Statement of Assets and Liabilities.
The Fund typically enters into International Swaps and Derivatives Association, Inc. Master Agreements ("ISDA Master Agreements") or similar master agreements (collectively, "Master Agreements") with its contract counterparties for certain OTC derivatives in order to, among other things, reduce its credit risk to counterparties. ISDA Master Agreements include provisions for general obligations, representations, collateral and events of default or termination. Under an ISDA Master Agreement, the Fund typically may offset with the counterparty certain OTC derivative financial instruments' payables and/or receivables with collateral held and/or posted and create one single net payment (close-out netting) in the event of default, termination and/or potential deterioration in the credit quality of the counterparty. Various Master Agreements govern the terms of certain transactions with counterparties, including transactions such as swap, forward, repurchase and reverse repurchase agreements. These Master Agreements typically attempt to reduce the counterparty risk associated with such transactions by specifying credit
24
Morgan Stanley Institutional Fund, Inc.
Annual Report — December 31, 2019
Notes to Financial Statements (cont'd)
protection mechanisms and providing standardization that improves legal certainty. Cross-termination provisions under Master Agreements typically provide that a default in connection with one transaction between the Fund and a counterparty gives the non-defaulting party the right to terminate any other transactions in place with the defaulting party to create one single net payment due to/due from the defaulting party and may be a feature in certain Master Agreements. In the event the Fund exercises its right to terminate a Master Agreement after a counterparty experiences a termination event as defined in the Master Agreement, the return of collateral with market value in excess of the Fund's net liability may be delayed or denied.
The following table presents derivative financial instruments that are subject to enforceable netting arrangements as of December 31, 2019:
Gross Amounts Not Offset in the Statement of Assets and Liabilities | |
Counterparty | | Gross Asset
Derivatives
Presented in the
Statement of
Assets and
Liabilities
(000) | | Financial
Instrument
(000) | | Collateral
Received(e)
(000) | | Net Amount
(not less
than $0)
(000) | |
BNP Paribas | | $ | 4 | | | $ | — | | | $ | (4 | ) | | $ | 0 | | |
Royal Bank of Scotland | | | 2,431 | | | | — | | | | (2,431 | ) | | | 0 | | |
Total | | $ | 2,435 | (a) | | $ | — | | | $ | (2,435 | ) | | $ | 0 | | |
(a) Amounts are included in Investments in Securities in the Statement of Assets and Liabilities.
(e) In some instances, the actual collateral received may be more than the amount shown here due to overcollateralization.
For the year ended December 31, 2019, the approximate average monthly amount outstanding for each derivative type is as follows:
Purchased Options: | |
Average monthly notional amount | | | 3,759,345,000 | | |
6. Securities Lending: The Fund lends securities to qualified financial institutions, such as broker-dealers, to earn additional income. Any increase or decrease in the fair value of the securities loaned that might occur and any interest earned or dividends declared on those securities during the term of the loan would remain in the Fund. The Fund would receive cash or securities as collateral in an amount equal to or exceeding 100% of the current fair value of the loaned securities. The collateral is marked-to-market daily by State Street Bank and Trust Company
("State Street"), the securities lending agent, to ensure that a minimum of 100% collateral coverage is maintained.
Based on pre-established guidelines, the securities lending agent invests any cash collateral that is received in an affiliated money market portfolio and repurchase agreements. Securities lending income is generated from the earnings on the invested collateral and borrowing fees, less any rebates owed to the borrowers and compensation to the lending agent, and is recorded as "Income from Securities Loaned — Net" in the Fund's Statement of Operations. Risks in securities lending transactions are that a borrower may not provide additional collateral when required or return the securities when due, and that the value of the short-term investments will be less than the amount of cash collateral plus any rebate that is required to be returned to the borrower.
The Fund has the right under the securities lending agreement to recover the securities from the borrower on demand.
The following table presents financial instruments that are subject to enforceable netting arrangements as of December 31, 2019:
Gross Amounts Not Offset in the Statement of Assets and Liabilities | |
Gross Asset
Amounts
Presented in
the Statement
of Assets and
Liabilities
(000) | | Financial
Instrument
(000) | | Collateral
Received
(000) | | Net Amount
(not less
than $0)
(000) | |
| $ | 1,046 | (f) | | $ | — | | | $ | (1,046 | )(g)(h) | | $ | 0 | | |
(f) Represents market value of loaned securities at year end.
(g) The Fund received cash collateral of approximately $1,059,000, of which approximately $1,042,000 was subsequently invested in Repurchase Agreements and Morgan Stanley Institutional Liquidity Funds as reported in the Portfolio of Investments. As of December 31, 2019, there was uninvested cash of approximately $17,000, which is not reflected in the Portfolio of Investments.
(h) The actual collateral received is greater than the amount shown here due to overcollateralization.
FASB ASC 860, "Transfers & Servicing: Repurchase-to-Maturity Transactions, Repurchase Financings, and Disclosures", is intended to provide increased transparency about the types of collateral pledged in securities lending transactions and other similar transactions that are accounted for as secured borrowing.
The following table displays a breakdown of transactions accounted for as secured borrowings, the gross obligations by class of collateral pledged and the
25
Morgan Stanley Institutional Fund, Inc.
Annual Report — December 31, 2019
Notes to Financial Statements (cont'd)
remaining contractual maturity of those transactions as of December 31, 2019:
Remaining Contractual Maturity of the Agreements | |
| | | Overnight and
Continuous
(000) | | <30 days
(000) | | Between
30 &
90 days
(000) | | >90 days
(000) | | Total
(000) | |
Securities Lending
Transactions | |
Common Stocks | | $ | 1,059 | | | $ | — | | | $ | — | | | $ | — | | | $ | 1,059 | | |
Total Borrowings | | $ | 1,059 | | | $ | — | | | $ | — | | | $ | — | | | $ | 1,059 | | |
Gross amount of
recognized liabilities
for securities lending
transactions | | | | | | | | | | $ | 1,059 | | |
7. Restricted Securities: The Fund invests in unregistered or otherwise restricted securities. The term "restricted securities" refers to securities that are unregistered or are held by control persons of the issuer and securities that are subject to contractual restrictions on their resale. As a result, restricted securities may be more difficult to value and the Fund may have difficulty disposing of such assets either in a timely manner or for a reasonable price. In order to dispose of an unregistered security, the Fund, where it has contractual rights to do so, may have to cause such security to be registered. A considerable period may elapse between the time the decision is made to sell the security and the time the security is registered so that the Fund can sell it. Contractual restrictions on the resale of securities vary in length and scope and are generally the result of a negotiation between the issuer and the acquirer of the securities. The Fund would, in either case, bear market risks during that period. Restricted securities are identified in the Portfolio of Investments.
8. Indemnifications: The Company enters into contracts that contain a variety of indemnifications. The Company's maximum exposure under these arrangements is unknown. However, the Company has not had prior claims or losses pursuant to these contracts and expects the risk of loss to be remote.
9. Dividends and Distributions to Shareholders: Dividends and distributions to shareholders are recorded on the ex-dividend date. Dividends from net investment income, if any, are declared and paid annually. Net realized capital gains, if any, are distributed at least annually.
10. Security Transactions, Income and Expenses: Security transactions are accounted for on the trade date (date the order to buy or sell is executed). Realized gains and losses on the sale of investment securities are determined on
the specific identified cost method. Dividend income and other distributions are recorded on the ex-dividend date (except for certain foreign dividends which may be recorded as soon as the Fund is informed of such dividends) net of applicable withholding taxes. Interest income is recognized on the accrual basis except where collection is in doubt. Discounts are accreted and premiums are amortized over the life of the respective securities. Most expenses of the Company can be directly attributed to a particular Fund. Expenses which cannot be directly attributed are apportioned among the Funds based upon relative net assets or other appropriate methods. Income, expenses (other than class specific expenses — distribution and shareholder services, transfer agency and sub transfer agency fees) and realized and unrealized gains or losses are allocated to each class of shares based upon their relative net assets.
B. Advisory Fees: The Adviser, a wholly-owned subsidiary of Morgan Stanley, provides the Fund with advisory services under the terms of an Investment Advisory Agreement, paid quarterly, at the annual rate based on the daily net assets as follows:
First $1
billion | | Next $1
billion | | Next $1
billion | | Over $3
billion | |
| | 0.50 | % | | | 0.45 | % | | | 0.40 | % | | | 0.35 | % | |
For the year ended December 31, 2019, the advisory fee rate (net of rebate) was equivalent to an annual effective rate of 0.39% of the Fund's average daily net assets.
The Adviser has agreed to reduce its advisory fee and/or reimburse the Fund so that total annual Fund operating expenses, excluding certain investment related expenses, taxes, interest and other extraordinary expenses (including litigation), will not exceed 0.80% for Class I shares, 1.15% for Class A shares, 1.65% for Class L shares, 1.90% for Class C shares, 0.73% for Class IS shares and 0.73% for Class IR shares. The fee waivers and/or expense reimbursements will continue for at least one year from the date of the Fund's prospectus or until such time as the Directors act to discontinue all or a portion of such waivers and/or reimbursements when they deem such action is appropriate.
This arrangement had no effect for the year ended December 31, 2019.
C. Administration Fees: The Adviser also serves as Administrator to the Company and provides administrative services pursuant to an Administration Agreement for an annual fee, accrued daily and paid monthly, of 0.08% of the Fund's average daily net assets.
26
Morgan Stanley Institutional Fund, Inc.
Annual Report — December 31, 2019
Notes to Financial Statements (cont'd)
Under a Sub-Administration Agreement between the Administrator and State Street, State Street provides certain administrative services to the Company. For such services, the Administrator pays State Street a portion of the fee the Administrator receives from the Fund.
D. Distribution and Shareholder Services Fees: Morgan Stanley Distribution, Inc. ("MSDI" or the "Distributor"), a wholly-owned subsidiary of the Adviser and an indirect subsidiary of Morgan Stanley, serves as the Company's Distributor of Fund shares pursuant to a Distribution Agreement. The Company has adopted a Shareholder Services Plan with respect to Class A shares pursuant to Rule 12b-1 under the Act. Under the Shareholder Services Plan, the Fund pays the Distributor a shareholder services fee, accrued daily and paid monthly, at an annual rate of 0.25% of the Fund's average daily net assets attributable to Class A shares.
The Company has adopted a Distribution and Shareholder Services Plan with respect to Class L shares pursuant to Rule 12b-1 under the Act. Under the Distribution and Shareholder Services Plan, the Fund pays the Distributor a distribution fee, accrued daily and paid monthly, at an annual rate of 0.50% and a shareholder services fee, accrued daily and paid monthly, at an annual rate of 0.25% of the Fund's average daily net assets attributable to Class L shares.
The Company has adopted a Distribution and Shareholder Services Plan with respect to Class C shares pursuant to Rule 12b-1 under the Act. Under the Distribution and Shareholder Services Plan, the Fund pays the Distributor a distribution fee, accrued daily and paid monthly, at an annual rate of 0.75% and a shareholder services fee, accrued daily and paid monthly, at an annual rate of 0.25% of the Fund's average daily net assets attributable to Class C shares.
The distribution and shareholder services fees are used to support the expenses associated with servicing and maintaining accounts. The Distributor may compensate other parties for providing shareholder support services to investors who purchase Class A, Class L and Class C shares.
E. Dividend Disbursing and Transfer Agent: The Company's dividend disbursing and transfer agent is DST Asset Manager Solutions, Inc. ("DST"). Pursuant to a Transfer Agency Agreement, the Company pays DST a fee based on the number of classes, accounts and transactions relating to the Funds of the Company.
F. Custodian Fees: State Street (the "Custodian") also serves as Custodian for the Company in accordance with a Custodian
Agreement. The Custodian holds cash, securities and other assets of the Company as required by the Act. Custody fees are payable monthly based on assets held in custody, investment purchases and sales activity and account maintenance fees, plus reimbursement for certain out-of-pocket expenses.
G. Security Transactions and Transactions with Affiliates: For the year ended December 31, 2019, purchases and sales of investment securities for the Fund, other than long-term U.S. Government securities and short-term investments were approximately $5,817,727,000 and $5,746,226,000, respectively. There were no purchases and sales of long-term U.S. Government securities for the year ended December 31, 2019.
The Fund invests in the Institutional Class of the Morgan Stanley Institutional Liquidity Funds — Treasury Securities Portfolio (the "Liquidity Funds"), an open-end management investment company managed by the Adviser, both directly and as a portion of the securities held as collateral on loaned securities. Advisory fees paid by the Fund are reduced by an amount equal to its pro-rata share of the advisory and administration fees paid by the Fund due to its investment in the Liquidity Funds. For the year ended December 31, 2019, advisory fees paid were reduced by approximately $552,000 relating to the Fund's investment in the Liquidity Funds.
A summary of the Fund's transactions in shares of affiliated investments during the year ended December 31, 2019 is as follows:
Affiliated
Investment
Company | | Value
December 31,
2018
(000) | | Purchases
at Cost
(000) | | Proceeds
from Sales
(000) | | Dividend
Income
(000) | |
Liquidity Funds | | $ | 61,442 | | | $ | 2,994,777 | | | $ | 2,974,240 | | | $ | 5,271 | | |
Affiliated
Investment
Company (cont'd) | | Realized
Gain (Loss)
(000) | | Change in
Unrealized
Appreciation
(Depreciation)
(000) | | Value
December 31,
2019
(000) | |
Liquidity Funds | | $ | — | | | $ | — | | | $ | 81,979 | | |
The Fund is permitted to purchase and sell securities ("cross-trade") from and to other Morgan Stanley funds as well as other funds and client accounts for which the Adviser or an affiliate of the Adviser serves as investment adviser, pursuant to procedures approved by the Directors in compliance with Rule 17a-7 under the Act (the "Rule"). Each cross-trade is executed at the current market price in compliance with provisions of the Rule. For the year ended December 31, 2019, the Fund did not engage in any cross-trade transactions.
The Fund has an unfunded Deferred Compensation Plan (the "Compensation Plan"), which allows each independent Director
27
Morgan Stanley Institutional Fund, Inc.
Annual Report — December 31, 2019
Notes to Financial Statements (cont'd)
to defer payment of all, or a portion, of the fees he or she receives for serving on the Board of Directors. Each eligible Director generally may elect to have the deferred amounts credited with a return equal to the total return on one or more of the Morgan Stanley funds that are offered as investment options under the Compensation Plan. Appreciation/depreciation and distributions received from these investments are recorded with an offsetting increase/decrease in the deferred compensation obligation and do not affect the NAV of the Fund.
H. Federal Income Taxes: It is the Fund's intention to continue to qualify as a regulated investment company and distribute all of its taxable and tax-exempt income. Accordingly, no provision for federal income taxes is required in the financial statements.
The Fund may be subject to taxes imposed by countries in which it invests. Such taxes are generally based on income and/or capital gains earned or repatriated. Taxes are accrued based on net investment income, net realized gains and net unrealized appreciation as such income and/or gains are earned. Taxes may also be based on transactions in foreign currency and are accrued based on the value of investments denominated in such currency.
FASB ASC 740-10, "Income Taxes — Overall", sets forth a minimum threshold for financial statement recognition of the benefit of a tax position taken or expected to be taken in a tax return. Management has concluded there are no significant uncertain tax positions that would require recognition in the financial statements. If applicable, the Fund recognizes interest accrued related to unrecognized tax benefits in "Interest Expense" and penalties in "Other Expenses" in the Statement of Operations. The Fund files tax returns with the U.S. Internal Revenue Service, New York and various states. Generally, each of the tax years in the four-year period ended December 31, 2019 remains subject to examination by taxing authorities.
The tax character of distributions paid may differ from the character of distributions shown for GAAP purposes due to short-term capital gains being treated as ordinary income for tax purposes. The tax character of distributions paid during fiscal years 2019 and 2018 was as follows:
2019
Distributions
Paid From: | | 2018
Distributions
Paid From: | |
Ordinary
Income
(000) | | Long-Term
Capital Gain
(000) | | Ordinary
Income
(000) | | Long-Term
Capital Gain
(000) | |
| $ | 32,348 | | | $ | 663,719 | | | $ | 21,258 | | | $ | 387,224 | | |
The amount and character of income and gains to be distributed are determined in accordance with income tax regulations which may differ from GAAP. These book/tax differences are either considered temporary or permanent in nature.
Temporary differences are attributable to differing book and tax treatments for the timing of the recognition of gains (losses) on certain investment transactions and the timing of the deductibility of certain expenses.
Permanent differences, primarily due to equalization debits, resulted in the following reclassifications among the components of net assets at December 31, 2019:
Total
Distributable
Earnings
(000) | | Paid-in
Capital
(000) | |
| $ | (91,874 | ) | | $ | 91,874 | | |
At December 31, 2019, the components of distributable earnings for the Fund on a tax basis were as follows:
Undistributed
Ordinary
Income
(000) | | Undistributed
Long-Term
Capital Gain
(000) | |
| $ | 72,193 | | | $ | 5,391 | | |
I. Credit Facility: The Company and other Morgan Stanley funds participated in a $150,000,000 committed, unsecured revolving line of credit facility (the "Facility") with State Street. Effective April 22, 2019, the committed line amount increased to $300,000,000. This Facility is to be used for temporary emergency purposes or funding of shareholder redemption requests. The interest rate on borrowings is based on the federal funds rate or 1 month LIBOR rate plus a spread. The Facility also has a commitment fee of 0.25% per annum based on the unused portion of the Facility. During the year ended December 31, 2019, the Fund did not have any borrowings under the Facility.
J. Other: At December 31, 2019, the Fund had record owners of 10% or greater. Investment activities of these shareholders could have a material impact on the Fund. The aggregate percentage of such owners was 32.9%.
28
Morgan Stanley Institutional Fund, Inc.
Annual Report — December 31, 2019
Report of Independent Registered Public Accounting Firm
To the Shareholders and Board of Directors of
Morgan Stanley Institutional Fund, Inc. —
Growth Portfolio
Opinion on the Financial Statements
We have audited the accompanying statement of assets and liabilities of Growth Portfolio (the "Fund") (one of the funds constituting Morgan Stanley Institutional Fund, Inc. (the "Company")), including the portfolio of investments, as of December 31, 2019, and the related statement of operations for the year then ended, the statements of changes in net assets for each of the two years in the period then ended, the financial highlights for each of the five years in the period then ended and the related notes (collectively referred to as the "financial statements"). In our opinion, the financial statements present fairly, in all material respects, the financial position of Growth Portfolio (one of the funds constituting Morgan Stanley Institutional Fund, Inc.) at December 31, 2019, the results of its operations for the year then ended, the changes in its net assets for each of the two years in the period then ended and its financial highlights for each of the five years in the period then ended, in conformity with U.S. generally accepted accounting principles.
Basis for Opinion
These financial statements are the responsibility of the Company's management. Our responsibility is to express an opinion on the Fund's financial statements based on our audits. We are a public accounting firm registered with the Public Company Accounting Oversight Board (United States) ("PCAOB") and are required to be independent with respect to the Company in accordance with the U.S. federal securities law and the applicable rules and regulations of the Securities and Exchange Commission and the PCAOB.
We conducted our audits in accordance with the standards of the PCAOB. Those standards require that we plan and perform the audit to obtain reasonable assurance about whether the financial statements are free of material misstatement, whether due to error or fraud. The Company is not required to have, nor were we engaged to perform, an audit of the Company's internal control over financial reporting. As part of our audits, we are required to obtain an understanding of internal control over financial reporting, but not for the purpose of expressing an opinion on the effectiveness of the Company's internal control over financial reporting. Accordingly, we express no such opinion.
Our audits included performing procedures to assess the risks of material misstatement of the financial statements, whether due to error or fraud, and performing procedures that respond to those risks. Such procedures included examining, on a test basis, evidence regarding the amounts and disclosures in the financial statements. Our procedures included confirmation of securities owned as of December 31, 2019 by correspondence with the custodian and others or by other appropriate auditing procedures where replies from others were not received. Our audits also included evaluating the accounting principles used and significant estimates made by management, as well as evaluating the overall presentation of the financial statements. We believe that our audits provide a reasonable basis for our opinion.

We have served as the auditor of one or more Morgan Stanley investment companies since 2000.
Boston, Massachusetts
February 27, 2020
29
Morgan Stanley Institutional Fund, Inc.
Annual Report — December 31, 2019
Federal Tax Notice (unaudited)
For federal income tax purposes, the following information is furnished with respect to the distributions paid by the Fund during its taxable year ended December 31, 2019. For corporate shareholders 4.18% of the dividends qualified for the dividends received deduction.
The Fund designated and paid approximately $755,594,000 as a long-term capital gain distribution.
For federal income tax purposes, the following information is furnished with respect to the Fund's earnings for its taxable year ended December 31, 2019. When distributed, certain earnings may be subject to a maximum tax rate of 15% as provided for by the Jobs and Growth Tax Relief Reconciliation Act of 2003. The Fund designated up to a maximum of approximately $3,368,000 as taxable at this lower rate.
In January, the Fund provides tax information to shareholders for the preceding calendar year.
30
Privacy Notice (unaudited) April 2019
FACTS | | WHAT DOES MSIM DO WITH YOUR PERSONAL INFORMATION? | |
Why? | | Financial companies choose how they share your personal information. Federal law gives consumers the right to limit some but not all sharing. Federal law also requires us to tell you how we collect, share, and protect your personal information. Please read this notice carefully to understand what we do. | |
What? | | The types of personal information we collect and share depend on the product or service you have with us. This information can include:
n Social Security number and income
n investment experience and risk tolerance
n checking account number and wire transfer instructions | |
How? | | All financial companies need to share customers' personal information to run their everyday business. In the section below, we list the reasons financial companies can share their customers' personal information; the reasons MSIM chooses to share; and whether you can limit this sharing. | |
Reasons we can share your personal information | | Does MSIM share? | | Can you limit this sharing? | |
For our everyday business purposes —
such as to process your transactions, maintain your account(s), respond to court orders and legal investigations, or report to credit bureaus | | Yes | | No | |
For our marketing purposes —
to offer our products and services to you | | Yes | | No | |
For joint marketing with other financial companies | | No | | We don't share | |
For our affiliates' everyday business purposes —
information about your transactions and experiences | | Yes | | No | |
For our affiliates' everyday business purposes —
information about your creditworthiness | | No | | We don't share | |
For our affiliates to market to you | | No | | We don't share | |
For non-affiliates to market to you | | No | | We don't share | |
Questions? Call toll-free (844) 312-6327 or email: imprivacyinquiries@morganstanley.com
31
Privacy Notice (unaudited) (cont'd) April 2019
Who we are
Who is providing this notice? | | Morgan Stanley Investment Management, Inc. and its affiliated registered investment advisers, registered broker-dealers, and registered and unregistered funds ("MSIM") | |
What we do
How does MSIM protect my personal information? | | To protect your personal information from unauthorized access and use, we use security measures that comply with federal law. These measures include computer safeguards and secured files and buildings. We have policies governing the proper handling of customer information by personnel and requiring third parties that provide support to adhere to appropriate security standards with respect to such information. | |
How does MSIM collect my personal information? | | We collect your personal information, for example, when you
n open an account or make deposits or withdrawals from your account
n buy securities from us or make a wire transfer
n give us your contact information
We also collect your personal information from others, such as credit bureaus, affiliates, or other companies. | |
Why can't I limit all sharing? | | Federal law gives you the right to limit only
n sharing for affiliates' everyday business purposes — information about your creditworthiness
n affiliates from using your information to market to you
n sharing for non-affiliates to market to you
State laws and individual companies may give you additional rights to limit sharing. See below for more on your rights under state law. | |
Definitions
Affiliates | | Companies related by common ownership or control. They can be financial and non-financial companies.
n Our affiliates include companies with a Morgan Stanley name and financial companies such as Morgan Stanley Smith Barney LLC and Morgan Stanley & Co. | |
Non-affiliates | | Companies not related by common ownership or control. They can be financial and non-financial companies.
n MSIM does not share with non-affiliates so they can market to you. | |
Joint marketing | | A formal agreement between non-affiliated financial companies that together market financial products or services to you.
n MSIM doesn't jointly market | |
Other Important Information
Vermont: Except as permitted by law, we will not share personal information we collect about Vermont residents with Non-affiliates unless you provide us with your written consent to share such information.
California: Except as permitted by law, we will not share personal information we collect about California residents with Non-affiliates and we will limit sharing such personal information with our Affiliates to comply with California privacy laws that apply to us.
32
Morgan Stanley Institutional Fund, Inc.
Annual Report — December 31, 2019
Director and Officer Information (unaudited)
Independent Directors:
Name, Birth Year
and Address of
Independent Director | | Position(s)
Held with
Registrant | | Length of Time
Served* | | Principal Occupation(s) During Past 5 Years
and Other Relevant Professional Experience | | Number of
Funds in
Fund Complex
Overseen by
Independent
Director** | | Other Directorships
Held by Independent
Director*** | |
Frank L. Bowman
c/o Perkins Coie LLP
Counsel to the Independent Directors
1155 Avenue of the Americas
New York, NY 10036
Birth Year 1944 | | Director | | Since August 2006 | | President, Strategic Decisions, LLC (consulting) (since February 2009); Director or Trustee of various Morgan Stanley Funds (since August 2006); Chairperson of the Compliance and Insurance Committee (since October 2015); formerly, Chairperson of the Insurance Sub-Committee of the Compliance and Insurance Committee (2007-2015); served as President and Chief Executive Officer of the Nuclear Energy Institute (policy organization) (February 2005-November 2008); retired as Admiral, U.S. Navy after serving over 38 years on active duty including 8 years as Director of the Naval Nuclear Propulsion Program in the Department of the Navy and the U.S. Department of Energy (1996-2004); served as Chief of Naval Personnel (July 1994-September 1996) and on the Joint Staff as Director of Political Military Affairs (June 1992-July 1994); knighted as Honorary Knight Commander of the Most Excellent Order of the British Empire; awarded the Officier de l'Orde National du Mérite by the French Government; elected to the National Academy of Engineering (2009). | | | 86 | | | Director of Naval and Nuclear Technologies LLP; Director Emeritus of the Armed Services YMCA; Member of the National Security Advisory Council of the Center for U.S. Global Engagement and a member of the CNA Military Advisory Board; Trustee of Fairhaven United Methodist Church; Member of the Board of Advisors of the Dolphin Scholarship Foundation; Director of other various non-profit organizations; formerly, Director of BP p.l.c. (November 2010-May 2019). | |
Kathleen A. Dennis
c/o Perkins Coie LLP
Counsel to the Independent Directors
1155 Avenue of the Americas
New York, NY 10036
Birth Year 1953 | | Director | | Since August 2006 | | President, Cedarwood Associates (mutual fund and investment management consulting) (since July 2006); Chairperson of the Liquidity and Alternatives Sub-Committee of the Investment Committee (since October 2006) and Director or Trustee of various Morgan Stanley Funds (since August 2006); formerly, Senior Managing Director of Victory Capital Management (1993-2006). | | | 86 | | | Director of various non-profit organizations. | |
Nancy C. Everett
c/o Perkins Coie LLP
Counsel to the Independent Directors
1155 Avenue of the Americas
New York, NY 10036
Birth Year 1955 | | Director | | Since January 2015 | | Chief Executive Officer, Virginia Commonwealth University Investment Company (since November 2015); Owner, OBIR, LLC (institutional investment management consulting) (since June 2014); formerly, Managing Director, BlackRock, Inc. (February 2011-December 2013); and Chief Executive Officer, General Motors Asset Management (a/k/a Promark Global Advisors, Inc.) (June 2005-May 2010). | | | 87 | | | Formerly, Member of Virginia Commonwealth University School of Business Foundation (2005-2016); Member of Virginia Commonwealth University Board of Visitors (2013-2015); Member of Committee on Directors for Emerging Markets Growth Fund, Inc. (2007-2010); Chairperson of Performance Equity Management, LLC (2006-2010); and Chairperson, GMAM Absolute Return Strategies Fund, LLC (2006-2010). | |
33
Morgan Stanley Institutional Fund, Inc.
Annual Report — December 31, 2019
Director and Officer Information (unaudited) (cont'd)
Independent Directors: (cont'd)
Name, Birth Year
and Address of
Independent Director | | Position(s)
Held with
Registrant | | Length of Time
Served* | | Principal Occupation(s) During Past 5 Years
and Other Relevant Professional Experience | | Number of
Funds in
Fund Complex
Overseen by
Independent
Director** | | Other Directorships
Held by Independent
Director*** | |
Jakki L. Haussler
c/o Perkins Coie LLP
Counsel to the Independent Directors
1155 Avenue of the Americas
New York, NY 10036
Birth Year 1957 | | Director | | Since January 2015 | | Chairman, Opus Capital Group (since 1996); formerly, Chief Executive Officer, Opus Capital Group (1996-2019); Director, Capvest Venture Fund, LP (May 2000-December 2011); Partner, Adena Ventures, LP (July 1999-December 2010); Director, The Victory Funds (February 2005-July 2008). | | | 87 | | | Director of Service Corporation International and Member, Audit Committee and Investment Committee; Director of Cincinnati Bell Inc. and Member, Audit Committee and Governance and Nominating Committee; Chairman of Northern Kentucky University Member Investment Committee; Member of Chase College of Law Transactional Law Practice Center Board of Advisors; Director of Best Transport; Director of Chase College of Law Board of Visitors; formerly, Member, University of Cincinnati Foundation Investment Committee; Member, Miami University Board of Visitors (2008-2011); Trustee of Victory Funds (2005-2008) and Chairman, Investment Committee (2007-2008) and Member, Service Provider Committee (2005-2008). | |
Dr. Manuel H. Johnson
c/o Johnson Smick International, Inc.
220 I Street, NE — Suite 200
Washington, D.C. 20002
Birth Year 1949 | | Director | | Since July 1991 | | Senior Partner, Johnson Smick International, Inc. (consulting firm); Chairperson of the Investment Committee (since October 2006) and Director or Trustee of various Morgan Stanley Funds (since July 1991); Co-Chairman and a founder of the Group of Seven Council (G7C) (international economic commission); formerly, Chairperson of the Audit Committee (July 1991-September 2006), Vice Chairman of the Board of Governors of the Federal Reserve System and Assistant Secretary of the U.S. Treasury. | | | 86 | | | Director of NVR, Inc. (home construction). | |
Joseph J. Kearns
c/o Perkins Coie LLP
Counsel to the Independent Directors
1155 Avenue of the Americas
New York, NY 10036
Birth Year 1942 | | Director | | Since August 1994 | | Senior Adviser, Kearns & Associates LLC (investment consulting); Chairperson of the Audit Committee (since October 2006) and Director or Trustee of various Morgan Stanley Funds (since August 1994); formerly, Deputy Chairperson of the Audit Committee (July 2003-September 2006) and Chairperson of the Audit Committee of various Morgan Stanley Funds (since August 1994); CFO of the J. Paul Getty Trust. | | | 87 | | | Prior to August 10, 2016, Director of Electro Rent Corporation (equipment leasing); Prior to December 31, 2013, Director of The Ford Family Foundation. | |
34
Morgan Stanley Institutional Fund, Inc.
Annual Report — December 31, 2019
Director and Officer Information (unaudited) (cont'd)
Independent Directors: (cont'd)
Name, Birth Year
and Address of
Independent Director | | Position(s)
Held with
Registrant | | Length of Time
Served* | | Principal Occupation(s) During Past 5 Years
and Other Relevant Professional Experience | | Number of
Funds in
Fund Complex
Overseen by
Independent
Director** | | Other Directorships
Held by Independent
Director*** | |
Michael F. Klein
c/o Perkins Coie LLP
Counsel to the Independent Directors
1155 Avenue of the Americas
New York, NY 10036
Birth Year 1958 | | Director | | Since August 2006 | | Managing Director, Aetos Alternatives Management, LP (since March 2000); Co-President, Aetos Alternatives Management, LP (since January 2004) and Co-Chief Executive Officer of Aetos Alternatives Management, LP (since August 2013); Chairperson of the Fixed Income Sub-Committee of the Investment Committee (since October 2006) and Director or Trustee of various Morgan Stanley Funds (since August 2006); formerly, Managing Director, Morgan Stanley & Co. Inc. and Morgan Stanley Dean Witter Investment Management and President, various Morgan Stanley Funds (June 1998-March 2000); Principal, Morgan Stanley & Co. Inc. and Morgan Stanley Dean Witter Investment Management (August 1997-December 1999). | | | 86 | | | Director of certain investment funds managed or sponsored by Aetos Alternatives Management, LP; Director of Sanitized AG and Sanitized Marketing AG (specialty chemicals). | |
Patricia Maleski
c/o Perkins Coie LLP
Counsel to the Independent Directors
1155 Avenue of the Americas
New York, NY 10036
Birth Year 1960 | | Director | | Since January 2017 | | Managing Director, JPMorgan Asset Management (2004-2016); Oversight and Control Head of Fiduciary and Conflicts of Interest Program (2015-2016); Chief Control Officer-Global Asset Management (2013-2015); President, JPMorgan Funds (2010-2013); Chief Administrative Officer (2004-2013); various other positions including Treasurer and Board Liaison (since 2001). | | | 87 | | | None. | |
Michael E. Nugent
522 Fifth Avenue
New York, NY 10036
Birth Year 1936 | | Chair of the Board and Director | | Chair of the Boards since July 2006 and Director since July 1991 | | Chair of the Boards of various Morgan Stanley Funds (since July 2006); Chairperson of the Governance Committee (since January 2019) and Director or Trustee of various Morgan Stanley Funds (since July 1991); formerly, Chairperson of each of the Closed-End Fund committee (until December 2019) and the Insurance Committee (until July 2006); General Partner, Triumph Capital, L.P. (private investment partnership) (1988-2013). | | | 86 | | | None. | |
W. Allen Reed
c/o Perkins Coie LLP
Counsel to the Independent Directors
1155 Avenue of the Americas
New York, NY 10036
Birth Year 1947 | | Vice Chair of the Board and Director | | Vice Chair of the Boards since January 2020 and Director since August 2006 | | Chairperson of the Equity Sub-Committee of the Investment Committee (since October 2006) and Director or Trustee of various Morgan Stanley Funds (since August 2006); formerly, President and CEO of General Motors Asset Management; Chairman and Chief Executive Officer of the GM Trust Bank and Corporate Vice President of General Motors Corporation (August 1994-December 2005). | | | 86 | | | Formerly, Director of Legg Mason, Inc.; formerly, Director of the Auburn University Foundation (2010-2015). | |
* This is the earliest date the Director began serving the Morgan Stanley Funds. Each Director serves an indefinite term, until his or her successor is elected.
** The Fund Complex includes (as of December 31, 2019) all open-end and closed-end funds (including all of their portfolios) advised by Morgan Stanley Investment Management Inc. (the "Adviser") and any funds that have an adviser that is an affiliated person of the Adviser (including, but not limited to, Morgan Stanley AIP GP LP).
*** This includes any directorships at public companies and registered investment companies held by the Director at any time during the past five years.
35
Morgan Stanley Institutional Fund, Inc.
Annual Report — December 31, 2019
Director and Officer Information (unaudited) (cont'd)
Executive Officers:
Name, Birth Year and Address of
Executive Officer | | Position(s)
Held with
Registrant | | Length of Time
Served* | | Principal Occupation(s) During Past 5 Years | |
John H. Gernon
522 Fifth Avenue
New York, NY 10036
Birth Year 1963 | | President and Principal Executive Officer | | Since September 2013 | | President and Principal Executive Officer of the Equity and Fixed Income Funds and the Morgan Stanley AIP Funds (since September 2013) and the Liquidity Funds and various money market funds (since May 2014) in the Fund Complex; Managing Director of the Adviser; Head of Product (since 2006). | |
Timothy J. Knierim
522 Fifth Avenue
New York, NY 10036
Birth Year 1959 | | Chief Compliance Officer | | Since December 2016 | | Managing Director of the Adviser and various entities affiliated with the Adviser; Chief Compliance Officer of various Morgan Stanley Funds and the Adviser (since December 2016) and Chief Compliance Officer of Morgan Stanley AIP GP LP (since 2014). Formerly, Managing Director and Deputy Chief Compliance Officer of the Adviser (2014-2016); and formerly, Chief Compliance Officer of Prudential Investment Management, Inc. (2007-2014). | |
Francis J. Smith
522 Fifth Avenue
New York, NY 10036
Birth Year 1965 | | Treasurer and Principal Financial Officer | | Treasurer since July 2003 and Principal Financial Officer since September 2002 | | Managing Director of the Adviser and various entities affiliated with the Adviser; Treasurer (since July 2003) and Principal Financial Officer of various Morgan Stanley Funds (since September 2002). | |
Mary E. Mullin
522 Fifth Avenue
New York, NY 10036
Birth Year 1967 | | Secretary | | Since June 1999 | | Managing Director of the Adviser; Secretary of various Morgan Stanley Funds (since June 1999). | |
Michael J. Key
522 Fifth Avenue
New York, NY 10036
Birth Year 1979 | | Vice President | | Since June 2017 | | Vice President of the Equity and Fixed Income Funds, Liquidity Funds, various money market funds and the Morgan Stanley AIP Funds in the Fund Complex (since June 2017); Executive Director of the Adviser; Head of Product Development for Equity and Fixed Income Funds (since August 2013). | |
* This is the earliest date the officer began serving the Morgan Stanley Funds. Each officer serves a one-year term, until his or her successor is elected and qualifies.
36
Morgan Stanley Institutional Fund, Inc.
Annual Report — December 31, 2019
Adviser and Administrator
Morgan Stanley Investment Management Inc.
522 Fifth Avenue
New York, New York 10036
Distributor
Morgan Stanley Distribution, Inc.
522 Fifth Avenue
New York, New York 10036
Dividend Disbursing and Transfer Agent
DST Asset Manager Solutions, Inc.
2000 Crown Colony Drive
Quincy, Massachusetts 02169
Custodian
State Street Bank and Trust Company
One Lincoln Street
Boston, Massachusetts 02111
Legal Counsel
Dechert LLP
1095 Avenue of the Americas
New York, New York 10036
Counsel to the Independent Directors
Perkins Coie LLP
1155 Avenue of the Americas
New York, New York 10036
Independent Registered Public Accounting Firm
Ernst & Young LLP
200 Clarendon Street
Boston, Massachusetts 02116
Reporting to Shareholders
Each Morgan Stanley fund provides a complete schedule of portfolio holdings in its Semi-Annual and the Annual Reports within 60 days of the end of the fund's second and fourth fiscal quarters. The Semi-Annual and Annual Reports are filed electronically with the Securities and Exchange Commission ("SEC") on Form N-CSRS and Form N-CSR, respectively. Morgan Stanley also delivers the Semi-Annual and Annual Reports to fund shareholders and makes these reports available on its public website, www.morganstanley.com/im/shareholderreports. Each Morgan Stanley non-money market fund also files a complete schedule of portfolio holdings with the SEC for the fund's first and third fiscal quarters as an attachment to Form N-PORT. Morgan Stanley does not deliver the reports for the first and third fiscal quarters to shareholders, nor are the reports posted to the Morgan Stanley public website. However, the holdings for each money market fund are posted to the Morgan Stanley public website. You may obtain the Form N-PORT filings (as well as the Form N-CSR and N-CSRS filings) by accessing the SEC's website, www.sec.gov. You can also request copies of these materials, upon payment of a duplicating fee, by electronic request at the SEC's email address (publicinfo@sec.gov).
Proxy Voting Policies and Procedures and Proxy Voting Record
You may obtain a copy of the Company's Proxy Voting Policy and Procedures and information regarding how the Company voted proxies relating to portfolio securities during the most recent twelve-month period ended June 30, without charge, upon request, by calling toll free 1 (800) 548-7786 or by visiting our website at www.morganstanley.com/im/shareholderreports. This information is also available on the SEC's website at www.sec.gov.
This report is authorized for distribution only when preceded or accompanied by a prospectus or summary prospectus of the applicable fund of Morgan Stanley Institutional Fund, Inc., which describes in detail the fund's investment policies, risks, fees and expenses. Please read the prospectus carefully before you invest or send money. For additional information, including information regarding the investments comprising the Fund, please visit our website at www.morganstanley.com/im/shareholderreports or call toll free 1 (800) 548-7786.
37
Printed in U.S.A.
This Report has been prepared for shareholders and may be distributed to others only if preceded or accompanied by a current prospectus.
Morgan Stanley Investment Management Inc.
522 Fifth Avenue
New York, New York 10036
© 2020 Morgan Stanley. Morgan Stanley Distribution, Inc.

IFIGRWANN
2922363 EXP. 02.28.21

Morgan Stanley Institutional Fund, Inc.
International Advantage Portfolio
Annual Report
December 31, 2019
Beginning on January 1, 2021, as permitted by regulations adopted by the Securities and Exchange Commission ("SEC"), paper copies of the Fund's Annual and Semi-Annual Reports to Shareholders ("Shareholder Reports") will no longer be sent by mail, unless you specifically request paper copies of the Shareholder Reports from the Fund or from your financial intermediary, such as a broker-dealer or a bank. Instead, the Shareholder Reports will be made available on the Fund's website, https://www.morganstanley.com/im/shareholderreports and you will be notified by mail each time a Shareholder Report is posted and provided with a website link to access the Shareholder Report. If you already elected to receive Shareholder Reports electronically, you will not be affected by this change and you need not take any action. You may elect to receive Shareholder Reports and other communications from the Fund electronically anytime by contacting your financial intermediary or, if you are a direct investor, please follow the instructions on the envelope.
Beginning on January 1, 2019, you may elect to receive all future Shareholder Reports in paper free of charge. If you invest through a financial intermediary, you can contact your financial intermediary to request that you continue to receive paper copies of your Shareholder Reports. If you invest directly with the Fund, please follow the instructions on the envelope to let the Fund know you wish to continue receiving paper copies of your Shareholder Reports. Your election to receive Shareholder Reports in paper will apply to all funds held in your account if you invest through your financial intermediary or all funds held with the fund complex if you invest directly with a fund.

Morgan Stanley Institutional Fund, Inc.
Annual Report — December 31, 2019
Shareholders' Letter | | | 2 | | |
Expense Example | | | 3 | | |
Investment Overview | | | 4 | | |
Portfolio of Investments | | | 7 | | |
Statement of Assets and Liabilities | | | 9 | | |
Statement of Operations | | | 11 | | |
Statements of Changes in Net Assets | | | 12 | | |
Financial Highlights | | | 14 | | |
Notes to Financial Statements | | | 19 | | |
Report of Independent Registered Public Accounting Firm | | | 28 | | |
Federal Tax Notice | | | 29 | | |
Privacy Notice | | | 30 | | |
Director and Officer Information | | | 32 | | |
This report is authorized for distribution only when preceded or accompanied by a prospectus or summary prospectus of the applicable Fund of Morgan Stanley Institutional Fund, Inc. To receive a prospectus and/or statement of additional information ("SAI"), which contains more complete information such as investment objectives, charges, expenses, policies for voting proxies, risk considerations and describes in detail each of the Fund's investment policies to the prospective investor, please call toll free 1 (800) 548-7786. Please read the prospectuses carefully before you invest or send money.
Additionally, you can access information about the Fund, including performance, characteristics and investment team commentary, through Morgan Stanley Investment Management's website: www.morganstanley.com/im/shareholderreports.
Market forecasts provided in this report may not necessarily come to pass. There is no guarantee that any sectors mentioned will continue to perform as discussed herein or that securities in such sectors will be held by the Fund in the future. There is no assurance that a fund will achieve its investment objective. Funds are subject to market risk, which is the possibility that market values of securities owned by the Fund will decline and, therefore, the value of the Fund's shares may be less than what you paid for them. Accordingly, you can lose money investing in this Fund. Please see the prospectus for more complete information on investment risks.
1
Morgan Stanley Institutional Fund, Inc.
Annual Report — December 31, 2019
Shareholders' Letter (unaudited)
Dear Shareholders,
We are pleased to provide this Annual Report, in which you will learn how your investment in International Advantage Portfolio (the "Fund") performed during the latest twelve-month period.
Morgan Stanley Investment Management is a client-centric, investor-led organization. Our global presence, intellectual capital, and breadth of products and services enable us to partner with investors to meet the evolving challenges of today's financial markets. We aim to deliver superior investment service and to empower our clients to make the informed decisions that help them reach their investment goals.
As always, we thank you for selecting Morgan Stanley Investment Management, and look forward to working with you in the months and years ahead.
Sincerely,

John H. Gernon
President and Principal Executive Officer
January 2020
2
Morgan Stanley Institutional Fund, Inc.
Annual Report — December 31, 2019
Expense Example (unaudited)
International Advantage Portfolio
As a shareholder of the Fund, you incur two types of costs: (1) transactional costs, including redemption fees; and (2) ongoing costs, which may include advisory fees, administration fees, distribution and shareholder services fees and other Fund expenses. This example is intended to help you understand your ongoing costs (in dollars) of investing in the Fund and to compare these costs with the ongoing costs of investing in other mutual funds.
This example is based on an investment of $1,000 invested at the beginning of the six-month period ended December 31, 2019 and held for the entire six-month period.
Actual Expenses
The table below provides information about actual account values and actual expenses. You may use the information in this table, together with the amount you invested, to estimate the expenses that you paid over the period. Simply divide your account value by $1,000 (for example, an $8,600 account value divided by $1,000 = 8.6), then multiply the result by the number in the table under the heading entitled "Actual Expenses Paid During Period" to estimate the expenses you paid on your account during this period.
Hypothetical Example for Comparison Purposes
The table below provides information about hypothetical account values and hypothetical expenses based on the Fund's actual expense ratio and an assumed rate of return of 5% per year before expenses, which is not the Fund's actual return. The hypothetical account values and expenses may not be used to estimate the actual ending account balance or expenses you paid for the period. You may use this information to compare the ongoing costs of investing in the Fund and other funds. To do so, compare this 5% hypothetical example with the 5% hypothetical examples that appear in the shareholder reports of the other funds.
Please note that the expenses shown in the table are meant to highlight your ongoing costs only and do not reflect any transactional costs, such as sales charges (loads) and redemption fees. Therefore, the information for each class in the table is useful in comparing ongoing costs only, and will not help you determine the relative total costs of owning different funds. In addition, if these transactional costs were included, your costs would have been higher.
| | | Beginning
Account
Value
7/1/19 | | Actual Ending
Account
Value
12/31/19 | | Hypothetical
Ending Account
Value | | Actual
Expenses
Paid
During
Period* | | Hypothetical
Expenses Paid
During Period* | | Net
Expense
Ratio
During
Period** | |
International Advantage Portfolio Class I | | $ | 1,000.00 | | | $ | 1,076.60 | | | $ | 1,020.27 | | | $ | 5.13 | | | $ | 4.99 | | | | 0.98 | % | |
International Advantage Portfolio Class A | | | 1,000.00 | | | | 1,075.30 | | | | 1,018.75 | | | | 6.70 | | | | 6.51 | | | | 1.28 | | |
International Advantage Portfolio Class L | | | 1,000.00 | | | | 1,072.50 | | | | 1,015.98 | | | | 9.56 | | | | 9.30 | | | | 1.83 | | |
International Advantage Portfolio Class C | | | 1,000.00 | | | | 1,071.10 | | | | 1,015.12 | | | | 10.44 | | | | 10.16 | | | | 2.00 | | |
International Advantage Portfolio Class IS | | | 1,000.00 | | | | 1,077.10 | | | | 1,020.52 | | | | 4.87 | | | | 4.74 | | | | 0.93 | | |
* Expenses are calculated using each Fund Class' annualized net expense ratio (as disclosed), multiplied by the average account value over the period and multiplied by 184/365 (to reflect the most recent one-half year period).
** Annualized.
3
Morgan Stanley Institutional Fund, Inc.
Annual Report — December 31, 2019
Investment Overview (unaudited)
International Advantage Portfolio
The Fund seeks long-term capital appreciation.
Performance
For the fiscal year ended December 31, 2019, the Fund's Class I shares had a total return based on net asset value and reinvestment of distributions per share of 30.09%, net of fees. The Fund's Class I shares outperformed the Fund's benchmark, the MSCI All Country World ex USA Net Index (the "Index"), which returned 21.51%.
Please keep in mind that double-digit returns are highly unusual and cannot be sustained. Investors should also be aware that these returns were primarily achieved during favorable market conditions.
Factors Affecting Performance
• Easing geopolitical tensions, reduced recession fears and central bank support drove global equities sharply higher over 2019. Although the U.S.-China trade relations dampened global manufacturing and export activity, many economies remained supported by relatively stronger consumer sectors that had remained mostly unaffected by the manufacturing slowdown. To further extend the economic cycle, global central banks resumed cutting policy interest rates and enacting other stimulus measures. Volatility increased in 2019, but stock prices continued to rally higher, notably at year end when the U.S. and China announced a partial trade deal, Brexit uncertainty eased with the Conservative Party winning a large majority in the U.K. general election, and some economic indicators appeared to be stabilizing.
• International equity markets advanced by 21.51% for the 12-month period ended December 31, 2019, as measured by the Index. Our team remained focused on assessing company prospects over a longer-term period of three to five years, and owning a portfolio of high quality companies with diverse business drivers not tied to a particular market environment.
• The team manages concentrated portfolios that are highly differentiated from the benchmark, with securities weighted on our assessment of the quality of the company and our conviction. The value added or detracted in any period of time will typically result from stock selection, given our philosophy and process. For the 12-month period,
the Fund outperformed the Index due to favorable stock selection and sector allocation.
• The Fund's relative performance was primarily driven by our strong stock selection in the information technology, industrials and consumer discretionary sectors.
• Detracting from relative gains were our stock selection and sector overweight in consumer staples, along with stock selection in the materials sector.
Management Strategies
• There were no changes to our bottom-up investment process during the period. The Fund seeks long-term capital appreciation by investing internationally in high quality established companies that the investment team believes are undervalued at the time of purchase. To achieve its objective, we seek companies with sustainable competitive advantages and long-term growth that creates value, rather than focusing on short-term events, with stock selection informed by rigorous fundamental analysis.
• At the close of the period ended December 31, 2019, information technology represented the largest sector weight in the Fund, followed by consumer discretionary and consumer staples. Our bottom-up investment process resulted in sector overweight positions in information technology, consumer staples, consumer discretionary and utilities, and underweight positions in financials, materials, energy, communication services, industrials, real estate, health care. The Fund had no energy and real estate holdings at the end of the reporting period.
4
Morgan Stanley Institutional Fund, Inc.
Annual Report — December 31, 2019
Investment Overview (unaudited) (cont'd)
International Advantage Portfolio

* Minimum Investment for Class I shares
** Commenced Operations on December 28, 2010.
In accordance with SEC regulations, the Fund's performance shown assumes that all recurring fees (including management fees) were deducted and all dividends and distributions were reinvested. The performance of Class A, L, C and IS shares will vary from the performance of Class I shares based upon their different inception dates and will be negatively impacted by additional fees assessed to those classes (if applicable).
Performance Compared to the MSCI All Country World ex USA Net Index(1) and the Lipper International Multi-Cap Growth Funds Index(2)
| | | Period Ended December 31, 2019
Total Returns(3) | |
| | | | | Average Annual | |
| | | One
Year | | Five
Years | | Ten
Years | | Since
Inception(7) | |
Fund — Class I Shares w/o sales
charges(4) | | | 30.09 | % | | | 15.06 | % | | | — | | | | 12.05 | % | |
Fund — Class A Shares w/o sales
charges(4) | | | 29.72 | | | | 14.69 | | | | — | | | | 11.72 | | |
Fund — Class A Shares with
maximum 5.25% sales charges(4) | | | 22.92 | | | | 13.45 | | | | — | | | | 11.06 | | |
Fund — Class L Shares w/o sales
charges(4) | | | 29.01 | | | | 14.10 | | | | — | | | | 11.15 | | |
Fund — Class C Shares w/o sales
charges(5) | | | 28.72 | | | | — | | | | — | | | | 12.12 | | |
Fund — Class C Shares with
maximum 1.00% deferred sales
charges(5) | | | 27.72 | | | | — | | | | — | | | | 12.12 | | |
Fund — Class IS Shares w/o sales
charges(6) | | | 30.14 | | | | — | | | | — | | | | 6.57 | | |
MSCI All Country World ex USA
Net Index | | | 21.51 | | | | 5.51 | | | | — | | | | 4.42 | | |
Lipper International Multi-Cap
Growth Funds Index | | | 25.06 | | | | 6.30 | | | | — | | | | 5.27 | | |
Performance data quoted represents past performance, which is no guarantee of future results, and current performance may be lower or higher than the figures shown. Performance assumes that all dividends and distributions, if any, were reinvested. For the most recent month-end performance figures, please visit www.morganstanley.com/im/shareholderreports. Investment return and principal value will fluctuate so that Fund shares, when redeemed, may be worth more or less than their original cost. Total returns do not reflect the deduction of taxes that a shareholder would pay on Fund distributions or the redemption of Fund shares. Performance of share classes will vary due to difference in sales charges and expenses.
(1) The MSCI All Country World ex USA Net Index is a free float-adjusted market capitalization weighted index designed to measure the equity market performance of developed and emerging markets, excluding the United States. The term "free float" represents the portion of shares outstanding that are deemed to be available for purchase in the public equity markets by investors. The performance of the Index is listed in U.S. dollars and assumes reinvestment of net dividends. Net total return indices reinvest dividends after the deduction of withholding taxes, using (for international indices) a tax rate applicable to non-resident institutional investors who do not benefit from double taxation treaties. The Index is unmanaged and its returns do not include any sales charges or fees. Such costs would lower performance. It is not possible to invest directly in an index.
5
Morgan Stanley Institutional Fund, Inc.
Annual Report — December 31, 2019
Investment Overview (unaudited) (cont'd)
International Advantage Portfolio
(2) The Lipper International Multi-Cap Growth Funds Index is an equally weighted performance index of the largest qualifying funds (based on net assets) in the Lipper International Multi-Cap Growth Funds classification. The Index, which is adjusted for capital gains distributions and income dividends, is unmanaged and should not be considered an investment. There are currently 30 funds represented in this Index. As of the date of this report, the Fund was in the Lipper International Multi-Cap Growth Funds classification.
(3) Total returns for the Fund reflect fees waived and expenses reimbursed, if applicable, by the Adviser (as defined herein). Without such waivers and reimbursements, total returns would have been lower.
(4) Commenced operations on December 28, 2010.
(5) Commenced offering on April 30, 2015.
(6) Commenced offering on June 15, 2018.
(7) For comparative purposes, average annual since inception returns listed for the Indexes refer to the inception date of Class I of the Fund, not the inception of the Index.
6
Morgan Stanley Institutional Fund, Inc.
Annual Report — December 31, 2019
Portfolio of Investments
International Advantage Portfolio
| | | Shares | | Value
(000) | |
Common Stocks (92.1%) | |
Australia (3.7%) | |
Brookfield Infrastructure Partners LP | | | 1,695,432 | | | $ | 84,755 | | |
Canada (5.6%) | |
Brookfield Asset Management, Inc., Class A | | | 1,175,777 | | | | 67,960 | | |
Constellation Software, Inc. | | | 62,683 | | | | 60,878 | | |
| | | | 128,838 | | |
China (6.2%) | |
Foshan Haitian Flavouring & Food Co., Ltd.,
Class A | | | 3,443,512 | | | | 53,148 | | |
Haidilao International Holding Ltd. (a)(b)(c) | | | 3,842,000 | | | | 15,432 | | |
TAL Education Group ADR (d) | | | 1,542,190 | | | | 74,334 | | |
| | | | 142,914 | | |
Denmark (10.9%) | |
Chr Hansen Holding A/S | | | 776,243 | | | | 61,707 | | |
DSV A/S | | | 1,643,081 | | | | 189,408 | | |
| | | | 251,115 | | |
France (9.5%) | |
Hermes International | | | 189,089 | | | | 141,302 | | |
Pernod Ricard SA | | | 240,247 | | | | 42,956 | | |
Remy Cointreau SA | | | 273,038 | | | | 33,536 | | |
| | | | 217,794 | | |
Germany (0.9%) | |
Rational AG | | | 25,209 | | | | 20,195 | | |
Hong Kong (3.1%) | |
AIA Group Ltd. | | | 6,833,100 | | | | 71,731 | | |
India (6.4%) | |
HDFC Bank Ltd. | | | 5,807,337 | | | | 103,498 | | |
Kotak Mahindra Bank Ltd. | | | 1,808,054 | | | | 42,666 | | |
| | | | 146,164 | | |
Italy (4.9%) | |
Moncler SpA | | | 2,494,637 | | | | 112,277 | | |
Japan (10.6%) | |
Calbee, Inc. | | | 1,117,900 | | | | 36,422 | | |
Keyence Corp. | | | 368,700 | | | | 129,465 | | |
Pigeon Corp. | | | 2,155,300 | | | | 78,919 | | |
| | | | 244,806 | | |
Netherlands (4.6%) | |
ASML Holding N.V. | | | 358,738 | | | | 106,112 | | |
Sweden (2.2%) | |
Vitrolife AB | | | 2,338,681 | | | | 49,440 | | |
Switzerland (6.3%) | |
Chocoladefabriken Lindt & Spruengli AG
(Registered) | | | 1,038 | | | | 91,663 | | |
Kuehne & Nagel International AG (Registered) | | | 315,510 | | | | 53,216 | | |
| | | | 144,879 | | |
Taiwan (2.4%) | |
Taiwan Semiconductor Manufacturing
Co., Ltd. ADR | | | 941,272 | | | | 54,688 | | |
| | | Shares | | Value
(000) | |
United Kingdom (6.8%) | |
Diageo PLC | | | 834,746 | | | $ | 35,388 | | |
Reckitt Benckiser Group PLC | | | 493,066 | | | | 40,030 | | |
Rightmove PLC | | | 9,615,296 | | | | 80,698 | | |
| | | | 156,116 | | |
United States (8.0%) | |
Booking Holdings, Inc. (d) | | | 40,443 | | | | 83,059 | | |
EPAM Systems, Inc. (d) | | | 475,348 | | | | 100,850 | | |
| | | | 183,909 | | |
Total Common Stocks (Cost $1,776,814) | | | 2,115,733 | | |
Short-Term Investment (9.4%) | |
Investment Company (9.4%) | |
Morgan Stanley Institutional Liquidity
Funds — Treasury Securities Portfolio —
Institutional Class (See Note G)
(Cost $215,987) | | | 215,987,174 | | | | 215,987 | | |
Total Investments Excluding Purchased
Options (101.4%) (Cost $1,992,801) | | | | | 2,331,720 | | |
Total Purchased Options Outstanding (0.1%)
(Cost $4,209) | | | 576 | | |
Total Investments (101.5%) (Cost $1,997,010)
Including $11,810 of Securities Loaned (e)(f) | | | 2,332,296 | | |
Liabilities in Excess of Other Assets (–1.5%) | | | (33,660 | ) | |
Net Assets (100.0%) | | $ | 2,298,636 | | |
Country assignments and aggregations are based generally on third party vendor classifications and information, and may be different from the assignments and aggregations under the policies set forth in the Fund's prospectus and/or statement of additional information relating to geographic classifications.
(a) 144A security — Certain conditions for public sale may exist. Unless otherwise noted, these securities are deemed to be liquid.
(b) Security trades on the Hong Kong exchange.
(c) All or a portion of this security was on loan at December 31, 2019.
(d) Non-income producing security.
(e) The approximate fair value and percentage of net assets, $822,712,000 and 35.8%, respectively, represent the securities that have been fair valued under the fair valuation policy for international investments as described in Note A-1 within the Notes to the Financial Statements.
(f) At December 31, 2019, the aggregate cost for federal income tax purposes is approximately $2,001,314,000. The aggregate gross unrealized appreciation is approximately $360,878,000 and the aggregate gross unrealized depreciation is approximately $29,896,000, resulting in net unrealized appreciation of approximately $330,982,000.
ADR American Depositary Receipt.
The accompanying notes are an integral part of the financial statements.
7
Morgan Stanley Institutional Fund, Inc.
Annual Report — December 31, 2019
Portfolio of Investments (cont'd)
International Advantage Portfolio
Call Options Purchased:
The Fund had the following call options purchased open at December 31, 2019:
Counterparty | | Description | | Strike
Price | | Expiration
Date | | Number of
Contracts | | Notional
Amount
(000) | | Value
(000) | | Premiums
Paid
(000) | | Unrealized
Depreciation
(000) | |
BNP Paribas | | USD/CNH | | CNH | 7.58 | | | Jan-20 | | | 161,527,226 | | | | 161,527 | | | $ | 1 | | | $ | 827 | | | $ | (826 | ) | |
Royal Bank of Scotland | | USD/CNH | | CNH | 7.85 | | | Jun-20 | | | 295,471,355 | | | | 295,471 | | | | 193 | | | | 1,524 | | | | (1,331 | ) | |
Royal Bank of Scotland | | USD/CNH | | CNH | 8.09 | | | Sep-20 | | | 344,233,201 | | | | 344,233 | | | | 382 | | | | 1,858 | | | | (1,476 | ) | |
| | | | | | | | | | | | | $ | 576 | | | $ | 4,209 | | | $ | (3,633 | ) | |
CNH — Chinese Yuan Renminbi Offshore.
USD — United States Dollar.
Portfolio Composition*
Classification | | Percentage of
Total Investments | |
Other** | | | 40.1 | % | |
Textiles, Apparel & Luxury Goods | | | 10.9 | | |
Short-Term Investments | | | 9.3 | | |
Air Freight & Logistics | | | 8.1 | | |
Food Products | | | 7.8 | | |
Semiconductors & Semiconductor Equipment | | | 6.9 | | |
Banks | | | 6.3 | | |
Electronic Equipment, Instruments & Components | | | 5.5 | | |
Household Products | | | 5.1 | | |
Total Investments | | | 100.0 | % | |
* Percentages indicated are based upon total investments (excluding Securities held as Collateral on Loaned Securities) as of December 31, 2019.
** Industries and/or investment types representing less than 5% of total investments.
The accompanying notes are an integral part of the financial statements.
8
Morgan Stanley Institutional Fund, Inc.
Annual Report — December 31, 2019
International Advantage Portfolio
Statement of Assets and Liabilities | | December 31, 2019
(000) | |
Assets: | |
Investments in Securities of Unaffiliated Issuers, at Value(1) (Cost $1,781,023) | | $ | 2,116,309 | | |
Investment in Security of Affiliated Issuer, at Value (Cost $215,987) | | | 215,987 | | |
Total Investments in Securities, at Value (Cost $1,997,010) | | | 2,332,296 | | |
Foreign Currency, at Value (Cost $5,418) | | | 5,405 | | |
Cash | | | 776 | | |
Receivable for Fund Shares Sold | | | 9,390 | | |
Dividends Receivable | | | 940 | | |
Tax Reclaim Receivable | | | 897 | | |
Receivable for Investments Sold | | | 320 | | |
Receivable from Affiliate | | | 282 | | |
Receivable from Securities Lending Income | | | 9 | | |
Other Assets | | | 173 | | |
Total Assets | | | 2,350,488 | | |
Liabilities: | |
Payable for Investments Purchased | | | 43,626 | | |
Payable for Advisory Fees | | | 3,583 | | |
Deferred Capital Gain Country Tax | | | 2,326 | | |
Due to Broker | | | 840 | | |
Payable for Fund Shares Redeemed | | | 798 | | |
Payable for Sub Transfer Agency Fees — Class I | | | 216 | | |
Payable for Sub Transfer Agency Fees — Class A | | | 29 | | |
Payable for Sub Transfer Agency Fees — Class L | | | — | @ | |
Payable for Sub Transfer Agency Fees — Class C | | | 2 | | |
Payable for Administration Fees | | | 151 | | |
Payable for Shareholder Services Fees — Class A | | | 78 | | |
Payable for Distribution and Shareholder Services Fees — Class L | | | — | @ | |
Payable for Distribution and Shareholder Services Fees — Class C | | | 15 | | |
Payable for Custodian Fees | | | 63 | | |
Payable for Professional Fees | | | 48 | | |
Payable for Transfer Agency Fees | | | — | @ | |
Payable for Transfer Agency Fees — Class I | | | 15 | | |
Payable for Transfer Agency Fees — Class A | | | 3 | | |
Payable for Transfer Agency Fees — Class L | | | — | @ | |
Payable for Transfer Agency Fees — Class C | | | 1 | | |
Payable for Transfer Agency Fees — Class IS | | | — | @ | |
Other Liabilities | | | 58 | | |
Total Liabilities | | | 51,852 | | |
Net Assets | | $ | 2,298,636 | | |
Net Assets Consist of: | |
Paid-in-Capital | | $ | 1,973,843 | | |
Total Distributable Earnings | | | 324,793 | | |
Net Assets | | $ | 2,298,636 | | |
The accompanying notes are an integral part of the financial statements.
9
Morgan Stanley Institutional Fund, Inc.
Annual Report — December 31, 2019
International Advantage Portfolio
Statement of Assets and Liabilities (cont'd) | | December 31, 2019
(000) | |
CLASS I: | |
Net Assets | | $ | 1,900,219 | | |
| Shares Outstanding $0.001 par value shares of beneficial interest (unlimited shares authorized) (not in 000's) | | | 92,918,781 | | |
Net Asset Value, Offering and Redemption Price Per Share | | $ | 20.45 | | |
CLASS A: | |
Net Assets | | $ | 379,237 | | |
| Shares Outstanding $0.001 par value shares of beneficial interest (unlimited shares authorized) (not in 000's) | | | 18,815,033 | | |
Net Asset Value, Redemption Price Per Share | | $ | 20.16 | | |
Maximum Sales Load | | | 5.25 | % | |
Maximum Sales Charge | | $ | 1.12 | | |
Maximum Offering Price Per Share | | $ | 21.28 | | |
CLASS L: | |
Net Assets | | $ | 226 | | |
| Shares Outstanding $0.001 par value shares of beneficial interest (unlimited shares authorized) (not in 000's) | | | 11,562 | | |
Net Asset Value, Offering and Redemption Price Per Share | | $ | 19.56 | | |
CLASS C: | |
Net Assets | | $ | 18,180 | | |
| Shares Outstanding $0.001 par value shares of beneficial interest (unlimited shares authorized) (not in 000's) | | | 941,444 | | |
Net Asset Value, Offering and Redemption Price Per Share | | $ | 19.31 | | |
CLASS IS: | |
Net Assets | | $ | 774 | | |
| Shares Outstanding $0.001 par value shares of beneficial interest (unlimited shares authorized) (not in 000's) | | | 37,837 | | |
Net Asset Value, Offering and Redemption Price Per Share | | $ | 20.46 | | |
(1) Including:
Securities on Loan, at Value: | | $ | 11,810 | | |
@ Amount is less than $500.
The accompanying notes are an integral part of the financial statements.
10
Morgan Stanley Institutional Fund, Inc.
Annual Report — December 31, 2019
International Advantage Portfolio
Statement of Operations | | Year Ended
December 31, 2019
(000) | |
Investment Income: | |
Dividends from Securities of Unaffiliated Issuers (Net of $1,784 of Foreign Taxes Withheld) | | $ | 15,937 | | |
Non-Cash Dividends from Securities of Unaffiliated Issuers | | | 1,051 | | |
Dividends from Security of Affiliated Issuer (Note G) | | | 3,052 | | |
Income from Securities Loaned — Net | | | 203 | | |
Total Investment Income | | | 20,243 | | |
Expenses: | |
Advisory Fees (Note B) | | | 12,161 | | |
Sub Transfer Agency Fees — Class I | | | 1,374 | | |
Sub Transfer Agency Fees — Class A | | | 379 | | |
Sub Transfer Agency Fees — Class L | | | — | @ | |
Sub Transfer Agency Fees — Class C | | | 12 | | |
Administration Fees (Note C) | | | 1,245 | | |
Shareholder Services Fees — Class A (Note D) | | | 710 | | |
Distribution and Shareholder Services Fees — Class L (Note D) | | | 2 | | |
Distribution and Shareholder Services Fees — Class C (Note D) | | | 144 | | |
Custodian Fees (Note F) | | | 256 | | |
Registration Fees | | | 224 | | |
Shareholder Reporting Fees | | | 139 | | |
Professional Fees | | | 116 | | |
Transfer Agency Fees — Class I (Note E) | | | 65 | | |
Transfer Agency Fees — Class A (Note E) | | | 9 | | |
Transfer Agency Fees — Class L (Note E) | | | 2 | | |
Transfer Agency Fees — Class C (Note E) | | | 4 | | |
Transfer Agency Fees — Class IS (Note E) | | | 2 | | |
Directors' Fees and Expenses | | | 34 | | |
Pricing Fees | | | 3 | | |
Other Expenses | | | 57 | | |
Total Expenses | | | 16,938 | | |
Reimbursement of Class Specific Expenses — Class I (Note B) | | | (370 | ) | |
Reimbursement of Class Specific Expenses — Class L (Note B) | | | (2 | ) | |
Reimbursement of Class Specific Expenses — Class IS (Note B) | | | (2 | ) | |
Rebate from Morgan Stanley Affiliate (Note G) | | | (297 | ) | |
Net Expenses | | | 16,267 | | |
Net Investment Income | | | 3,976 | | |
Realized Loss: | |
Investments Sold | | | (6,409 | ) | |
Foreign Currency Translation | | | (39 | ) | |
Net Realized Loss | | | (6,448 | ) | |
Change in Unrealized Appreciation (Depreciation): | |
Investments (Net of Increase in Deferred Capital Gain Country Tax of $2,185) | | | 360,930 | | |
Foreign Currency Translation | | | 6 | | |
Net Change in Unrealized Appreciation (Depreciation) | | | 360,936 | | |
Net Realized Loss and Change in Unrealized Appreciation (Depreciation) | | | 354,488 | | |
Net Increase in Net Assets Resulting from Operations | | $ | 358,464 | | |
@ Amount is less than $500.
The accompanying notes are an integral part of the financial statements.
11
Morgan Stanley Institutional Fund, Inc.
Annual Report — December 31, 2019
International Advantage Portfolio
Statements of Changes in Net Assets | | Year Ended
December 31, 2019
(000) | | Year Ended
December 31, 2018
(000) | |
Increase (Decrease) in Net Assets: | |
Operations: | |
Net Investment Income | | $ | 3,976 | | | $ | 352 | | |
Net Realized Gain (Loss) | | | (6,448 | ) | | | 10,167 | | |
Net Change in Unrealized Appreciation (Depreciation) | | | 360,936 | | | | (65,723 | ) | |
Net Increase (Decrease) in Net Assets Resulting from Operations | | | 358,464 | | | | (55,204 | ) | |
Dividends and Distributions to Shareholders: | |
Class I | | | (2,413 | ) | | | (7,460 | ) | |
Class A | | | (439 | ) | | | (3,589 | ) | |
Class L | | | (— | @) | | | (3 | ) | |
Class C | | | (23 | ) | | | (193 | ) | |
Class IS | | | (2 | ) | | | (— | @) | |
Total Dividends and Distributions to Shareholders | | | (2,877 | ) | | | (11,245 | ) | |
Capital Share Transactions:(1) | |
Class I: | |
Subscribed | | | 1,253,603 | | | | 540,991 | | |
Distributions Reinvested | | | 2,396 | | | | 7,436 | | |
Redeemed | | | (210,412 | ) | | | (101,820 | ) | |
Class A: | |
Subscribed | | | 233,415 | | | | 225,567 | | |
Distributions Reinvested | | | 439 | | | | 3,589 | | |
Redeemed | | | (124,341 | ) | | | (148,854 | ) | |
Class L: | |
Exchanged | | | 53 | | | | 75 | | |
Distributions Reinvested | | | — | @ | | | 3 | | |
Redeemed | | | (42 | ) | | | (33 | ) | |
Class C: | |
Subscribed | | | 9,422 | | | | 8,414 | | |
Distributions Reinvested | | | 23 | | | | 193 | | |
Redeemed | | | (5,722 | ) | | | (2,953 | ) | |
Class IS: | |
Subscribed | | | 750 | | | | 10 | (a) | |
Distributions Reinvested | | | 1 | | | | — | | |
Redeemed | | | (— | @) | | | — | | |
Net Increase in Net Assets Resulting from Capital Share Transactions | | | 1,159,585 | | | | 532,618 | | |
Redemption Fees | | | 68 | | | | 31 | | |
Total Increase in Net Assets | | | 1,515,240 | | | | 466,200 | | |
Net Assets: | |
Beginning of Period | | | 783,396 | | | | 317,196 | | |
End of Period | | $ | 2,298,636 | | | $ | 783,396 | | |
The accompanying notes are an integral part of the financial statements.
12
Morgan Stanley Institutional Fund, Inc.
Annual Report — December 31, 2019
International Advantage Portfolio
Statements of Changes in Net Assets (cont'd) | | Year Ended
December 31, 2019
(000) | | Year Ended
December 31, 2018
(000) | |
(1) Capital Share Transactions: | |
Class I: | |
Shares Subscribed | | | 67,897 | | | | 31,862 | | |
Shares Issued on Distributions Reinvested | | | 117 | | | | 468 | | |
Shares Redeemed | | | (11,270 | ) | | | (5,996 | ) | |
Net Increase in Class I Shares Outstanding | | | 56,744 | | | | 26,334 | | |
Class A: | |
Shares Subscribed | | | 12,831 | | | | 12,985 | | |
Shares Issued on Distributions Reinvested | | | 22 | | | | 228 | | |
Shares Redeemed | | | (7,067 | ) | | | (8,785 | ) | |
Net Increase in Class A Shares Outstanding | | | 5,786 | | | | 4,428 | | |
Class L: | |
Shares Exchanged | | | 3 | | | | 4 | | |
Shares Issued on Distributions Reinvested | | | — | @@ | | | — | @@ | |
Shares Redeemed | | | (2 | ) | | | (2 | ) | |
Net Increase in Class L Shares Outstanding | | | 1 | | | | 2 | | |
Class C: | |
Shares Subscribed | | | 530 | | | | 494 | | |
Shares Issued on Distributions Reinvested | | | 1 | | | | 13 | | |
Shares Redeemed | | | (328 | ) | | | (183 | ) | |
Net Increase in Class C Shares Outstanding | | | 203 | | | | 324 | | |
Class IS: | |
Shares Subscribed | | | 37 | | | | 1 | (a) | |
Shares Issued on Distributions Reinvested | | | — | @@ | | | — | | |
Shares Redeemed | | | (— | @@) | | | — | | |
Net Increase in Class IS Shares Outstanding | | | 37 | | | | 1 | (a) | |
@ Amount is less than $500.
@@ Amount is less than 500 shares.
(a) For the period June 15, 2018 through December 31, 2018.
The accompanying notes are an integral part of the financial statements.
13
Morgan Stanley Institutional Fund, Inc.
Annual Report — December 31, 2019
Financial Highlights
International Advantage Portfolio
| | | Class I | |
| | | Year Ended December 31, | |
Selected Per Share Data and Ratios | | 2019 | | 2018 | | 2017 | | 2016(1) | | 2015 | |
Net Asset Value, Beginning of Period | | $ | 15.74 | | | $ | 16.89 | | | $ | 11.91 | | | $ | 11.80 | | | $ | 12.36 | | |
Income (Loss) from Investment Operations: | |
Net Investment Income(2) | | | 0.06 | | | | 0.04 | | | | 0.00 | (3) | | | 0.02 | | | | 0.10 | | |
Net Realized and Unrealized Gain (Loss) | | | 4.67 | | | | (0.91 | ) | | | 5.32 | | | | 0.29 | | | | 1.18 | | |
Total from Investment Operations | | | 4.73 | | | | (0.87 | ) | | | 5.32 | | | | 0.31 | | | | 1.28 | | |
Distributions from and/or in Excess of: | |
Net Investment Income | | | (0.00 | )(3) | | | — | | | | — | | | | — | | | | (0.10 | ) | |
Net Realized Gain | | | (0.02 | ) | | | (0.28 | ) | | | (0.34 | ) | | | (0.20 | ) | | | (1.74 | ) | |
Total Distributions | | | (0.02 | ) | | | (0.28 | ) | | | (0.34 | ) | | | (0.20 | ) | | | (1.84 | ) | |
Redemption Fees | | | 0.00 | (3) | | | 0.00 | (3) | | | 0.00 | (3) | | | 0.00 | (3) | | | — | | |
Net Asset Value, End of Period | | $ | 20.45 | | | $ | 15.74 | | | $ | 16.89 | | | $ | 11.91 | | | $ | 11.80 | | |
Total Return(4) | | | 30.09 | % | | | (5.19 | )% | | | 44.75 | % | | | 2.47 | % | | | 10.23 | % | |
Ratios to Average Net Assets and Supplemental Data: | |
Net Assets, End of Period (Thousands) | | $ | 1,900,219 | | | $ | 569,408 | | | $ | 166,189 | | | $ | 29,781 | | | $ | 2,361 | | |
Ratio of Expenses Before Expense Limitation | | | 1.03 | % | | | 1.11 | % | | | 1.21 | % | | | 2.26 | % | | | 4.82 | % | |
Ratio of Expenses After Expense Limitation | | | 0.98 | %(5) | | | 0.98 | %(5) | | | 0.98 | %(5) | | | 0.99 | %(5) | | | 1.16 | %(5)(6) | |
Ratio of Net Investment Income | | | 0.32 | %(5) | | | 0.21 | %(5) | | | 0.02 | %(5) | | | 0.20 | %(5) | | | 0.76 | %(5) | |
Ratio of Rebate from Morgan Stanley Affiliates | | | 0.02 | % | | | 0.02 | % | | | 0.02 | % | | | 0.01 | % | | | 0.00 | %(7) | |
Portfolio Turnover Rate | | | 15 | % | | | 29 | % | | | 30 | % | | | 23 | % | | | 96 | % | |
(1) Reflects prior period custodian out-of-pocket expenses that were reimbursed in September 2016. The amount of the reimbursement was immaterial on a per share basis and did not impact the total return of Class I shares. The Ratio of Expenses After Expense Limitation and the Ratio of Net Investment Income would be unchanged as the reimbursement of custodian fees was offset against expense waivers/reimbursements with no impact to net expenses or net investment income.
(2) Per share amount is based on average shares outstanding.
(3) Amount is less than $0.005 per share.
(4) Calculated based on the net asset value as of the last business day of the period.
(5) The Ratio of Expenses After Expense Limitation and Ratio of Net Investment Income reflect the rebate of certain Fund expenses in connection with the investments in Morgan Stanley affiliates during the period. The effect of the rebate on the ratios is disclosed in the above table as "Ratio of Rebate from Morgan Stanley Affiliates."
(6) Effective July 1, 2015, the Adviser has agreed to limit the ratio of expenses to average net assets to the maximum ratio of 1.00% for Class I shares. Prior to July 1, 2015, the maximum ratio was 1.25% for Class I shares.
(7) Amount is less than 0.005%.
The accompanying notes are an integral part of the financial statements.
14
Morgan Stanley Institutional Fund, Inc.
Annual Report — December 31, 2019
Financial Highlights
International Advantage Portfolio
| | | Class A | |
| | | Year Ended December 31, | |
Selected Per Share Data and Ratios | | 2019 | | 2018 | | 2017 | | 2016(1) | | 2015 | |
Net Asset Value, Beginning of Period | | $ | 15.56 | | | $ | 16.75 | | | $ | 11.86 | | | $ | 11.79 | | | $ | 12.37 | | |
Income (Loss) from Investment Operations: | |
Net Investment Income (Loss)(2) | | | 0.01 | | | | (0.02 | ) | | | (0.07 | ) | | | (0.00 | )(3) | | | 0.01 | | |
Net Realized and Unrealized Gain (Loss) | | | 4.61 | | | | (0.89 | ) | | | 5.30 | | | | 0.27 | | | | 1.23 | | |
Total from Investment Operations | | | 4.62 | | | | (0.91 | ) | | | 5.23 | | | | 0.27 | | | | 1.24 | | |
Distributions from and/or in Excess of: | |
Net Investment Income | | | — | | | | — | | | | — | | | | — | | | | (0.08 | ) | |
Net Realized Gain | | | (0.02 | ) | | | (0.28 | ) | | | (0.34 | ) | | | (0.20 | ) | | | (1.74 | ) | |
Total Distributions | | | (0.02 | ) | | | (0.28 | ) | | | (0.34 | ) | | | (0.20 | ) | | | (1.82 | ) | |
Redemption Fees | | | 0.00 | (3) | | | 0.00 | (3) | | | 0.00 | (3) | | | 0.00 | (3) | | | — | | |
Net Asset Value, End of Period | | $ | 20.16 | | | $ | 15.56 | | | $ | 16.75 | | | $ | 11.86 | | | $ | 11.79 | | |
Total Return(4) | | | 29.72 | % | | | (5.48 | )% | | | 44.18 | % | | | 2.13 | % | | | 9.92 | % | |
Ratios to Average Net Assets and Supplemental Data: | |
Net Assets, End of Period (Thousands) | | $ | 379,237 | | | $ | 202,732 | | | $ | 144,112 | | | $ | 10,822 | | | $ | 2,966 | | |
Ratio of Expenses Before Expense Limitation | | | 1.30 | % | | | 1.37 | % | | | 1.42 | % | | | 2.55 | % | | | 5.77 | % | |
Ratio of Expenses After Expense Limitation | | | 1.28 | %(5) | | | 1.33 | %(5) | | | 1.31 | %(5) | | | 1.34 | %(5) | | | 1.46 | %(5)(6) | |
Ratio of Net Investment Income (Loss) | | | 0.04 | %(5) | | | (0.10 | )%(5) | | | (0.46 | )%(5) | | | (0.04 | )%(5) | | | 0.09 | %(5) | |
Ratio of Rebate from Morgan Stanley Affiliates | | | 0.02 | % | | | 0.02 | % | | | 0.02 | % | | | 0.01 | % | | | 0.00 | %(7) | |
Portfolio Turnover Rate | | | 15 | % | | | 29 | % | | | 30 | % | | | 23 | % | | | 96 | % | |
(1) Reflects prior period custodian out-of-pocket expenses that were reimbursed in September 2016. The amount of the reimbursement was immaterial on a per share basis and did not impact the total return of Class A shares. The Ratio of Expenses After Expense Limitation and the Ratio of Net Investment Loss would be unchanged as the reimbursement of custodian fees was offset against expense waivers/reimbursements with no impact to net expenses or net investment loss.
(2) Per share amount is based on average shares outstanding.
(3) Amount is less than $0.005 per share.
(4) Calculated based on the net asset value which does not reflect sales charges, if applicable, as of the last business day of the period.
(5) The Ratio of Expenses After Expense Limitation and Ratio of Net Investment Income (Loss) reflect the rebate of certain Fund expenses in connection with the investments in Morgan Stanley affiliates during the period. The effect of the rebate on the ratios is disclosed in the above table as "Ratio of Rebate from Morgan Stanley Affiliates."
(6) Effective July 1, 2015, the Adviser has agreed to limit the ratio of expenses to average net assets to the maximum ratio of 1.35% for Class A shares. Prior to July 1, 2015, the maximum ratio was 1.60% for Class A shares.
(7) Amount is less than 0.005%.
The accompanying notes are an integral part of the financial statements.
15
Morgan Stanley Institutional Fund, Inc.
Annual Report — December 31, 2019
Financial Highlights
International Advantage Portfolio
| | | Class L | |
| | | Year Ended December 31, | |
Selected Per Share Data and Ratios | | 2019 | | 2018 | | 2017 | | 2016(1) | | 2015 | |
Net Asset Value, Beginning of Period | | $ | 15.18 | | | $ | 16.43 | | | $ | 11.70 | | | $ | 11.69 | | | $ | 12.31 | | |
Income (Loss) from Investment Operations: | |
Net Investment Loss(2) | | | (0.09 | ) | | | (0.09 | ) | | | (0.11 | ) | | | (0.06 | ) | | | (0.04 | ) | |
Net Realized and Unrealized Gain (Loss) | | | 4.49 | | | | (0.88 | ) | | | 5.18 | | | | 0.27 | | | | 1.20 | | |
Total from Investment Operations | | | 4.40 | | | | (0.97 | ) | | | 5.07 | | | | 0.21 | | | | 1.16 | | |
Distributions from and/or in Excess of: | |
Net Investment Income | | | — | | | | — | | | | — | | | | — | | | | (0.04 | ) | |
Net Realized Gain | | | (0.02 | ) | | | (0.28 | ) | | | (0.34 | ) | | | (0.20 | ) | | | (1.74 | ) | |
Total Distributions | | | (0.02 | ) | | | (0.28 | ) | | | (0.34 | ) | | | (0.20 | ) | | | (1.78 | ) | |
Redemption Fees | | | 0.00 | (3) | | | 0.00 | (3) | | | 0.00 | (3) | | | 0.00 | (3) | | | — | | |
Net Asset Value, End of Period | | $ | 19.56 | | | $ | 15.18 | | | $ | 16.43 | | | $ | 11.70 | | | $ | 11.69 | | |
Total Return(4) | | | 29.01 | % | | | (5.95 | )% | | | 43.41 | % | | | 1.64 | % | | | 9.34 | % | |
Ratios to Average Net Assets and Supplemental Data: | |
Net Assets, End of Period (Thousands) | | $ | 226 | | | $ | 161 | | | $ | 135 | | | $ | 75 | | | $ | 211 | | |
Ratio of Expenses Before Expense Limitation | | | 2.59 | % | | | 2.82 | % | | | 3.82 | % | | | 3.96 | % | | | 6.87 | % | |
Ratio of Expenses After Expense Limitation | | | 1.83 | %(5) | | | 1.83 | %(5) | | | 1.84 | %(5) | | | 1.84 | %(5) | | | 1.97 | %(5)(6) | |
Ratio of Net Investment Loss | | | (0.48 | )%(5) | | | (0.55 | )%(5) | | | (0.77 | )%(5) | | | (0.52 | )%(5) | | | (0.31 | )%(5) | |
Ratio of Rebate from Morgan Stanley Affiliates | | | 0.02 | % | | | 0.02 | % | | | 0.01 | % | | | 0.01 | % | | | 0.00 | %(7) | |
Portfolio Turnover Rate | | | 15 | % | | | 29 | % | | | 30 | % | | | 23 | % | | | 96 | % | |
(1) Reflects prior period custodian out-of-pocket expenses that were reimbursed in September 2016. The amount of the reimbursement was immaterial on a per share basis and did not impact the total return of Class L shares. The Ratio of Expenses After Expense Limitation and the Ratio of Net Investment Loss would be unchanged as the reimbursement of custodian fees was offset against expense waivers/reimbursements with no impact to net expenses or net investment loss.
(2) Per share amount is based on average shares outstanding.
(3) Amount is less than $0.005 per share.
(4) Calculated based on the net asset value as of the last business day of the period.
(5) The Ratio of Expenses After Expense Limitation and Ratio of Net Investment Loss reflect the rebate of certain Fund expenses in connection with the investments in Morgan Stanley affiliates during the period. The effect of the rebate on the ratios is disclosed in the above table as "Ratio of Rebate from Morgan Stanley Affiliates."
(6) Effective July 1, 2015, the Adviser has agreed to limit the ratio of expenses to average net assets to the maximum ratio of 1.85% for Class L shares. Prior to July 1, 2015, the maximum ratio was 2.10% for Class L shares.
(7) Amount is less than 0.005%.
The accompanying notes are an integral part of the financial statements.
16
Morgan Stanley Institutional Fund, Inc.
Annual Report — December 31, 2019
Financial Highlights
International Advantage Portfolio
| | | Class C | |
| | | Year Ended December 31, | | Period from
April 30, 2015(2) to | |
Selected Per Share Data and Ratios | | 2019 | | 2018 | | 2017 | | 2016(1) | | December 31, 2015 | |
Net Asset Value, Beginning of Period | | $ | 15.02 | | | $ | 16.30 | | | $ | 11.63 | | | $ | 11.66 | | | $ | 13.80 | | |
Income (Loss) from Investment Operations: | |
Net Investment Loss(3) | | | (0.12 | ) | | | (0.15 | ) | | | (0.17 | ) | | | (0.11 | ) | | | (0.08 | ) | |
Net Realized and Unrealized Gain (Loss) | | | 4.43 | | | | (0.85 | ) | | | 5.18 | | | | 0.28 | | | | (0.26 | ) | |
Total from Investment Operations | | | 4.31 | | | | (1.00 | ) | | | 5.01 | | | | 0.17 | | | | (0.34 | ) | |
Distributions from and/or in Excess of: | |
Net Investment Income | | | — | | | | — | | | | — | | | | — | | | | (0.06 | ) | |
Net Realized Gain | | | (0.02 | ) | | | (0.28 | ) | | | (0.34 | ) | | | (0.20 | ) | | | (1.74 | ) | |
Total Distributions | | | (0.02 | ) | | | (0.28 | ) | | | (0.34 | ) | | | (0.20 | ) | | | (1.80 | ) | |
Redemption Fees | | | 0.00 | (4) | | | 0.00 | (4) | | | 0.00 | (4) | | | 0.00 | (4) | | | — | | |
Net Asset Value, End of Period | | $ | 19.31 | | | $ | 15.02 | | | $ | 16.30 | | | $ | 11.63 | | | $ | 11.66 | | |
Total Return(5) | | | 28.72 | % | | | (6.18 | )% | | | 43.16 | % | | | 1.38 | % | | | (2.63 | )%(9) | |
Ratios to Average Net Assets and Supplemental Data: | |
Net Assets, End of Period (Thousands) | | $ | 18,180 | | | $ | 11,087 | | | $ | 6,760 | | | $ | 1,067 | | | $ | 247 | | |
Ratio of Expenses Before Expense Limitation | | | 2.03 | % | | | 2.10 | % | | | 2.25 | % | | | 3.60 | % | | | 9.11 | %(10) | |
Ratio of Expenses After Expense Limitation | | | 2.01 | %(6) | | | 2.07 | %(6) | | | 2.08 | %(6) | | | 2.09 | %(6) | | | 2.11 | %(6)(7)(10) | |
Ratio of Net Investment Loss | | | (0.69 | )%(6) | | | (0.88 | )%(6) | | | (1.12 | )%(6) | | | (0.91 | )%(6) | | | (0.94 | )%(6)(10) | |
Ratio of Rebate from Morgan Stanley Affiliates | | | 0.02 | % | | | 0.02 | % | | | 0.02 | % | | | 0.01 | % | | | 0.00 | %(10)(8) | |
Portfolio Turnover Rate | | | 15 | % | | | 29 | % | | | 30 | % | | | 23 | % | | | 96 | % | |
(1) Reflects prior period custodian out-of-pocket expenses that were reimbursed in September 2016. The amount of the reimbursement was immaterial on a per share basis and did not impact the total return of Class C shares. The Ratio of Expenses After Expense Limitation and the Ratio of Net Investment Loss would be unchanged as the reimbursement of custodian fees was offset against expense waivers/reimbursements with no impact to net expenses or net investment loss.
(2) Commencement of Offering.
(3) Per share amount is based on average shares outstanding.
(4) Amount is less than $0.005 per share.
(5) Calculated based on the net asset value which does not reflect sales charges, if applicable, as of the last business day of the period.
(6) The Ratio of Expenses After Expense Limitation and Ratio of Net Investment Loss reflect the rebate of certain Fund expenses in connection with the investments in Morgan Stanley affiliates during the period. The effect of the rebate on the ratios is disclosed in the above table as "Ratio of Rebate from Morgan Stanley Affiliates."
(7) Effective July 1, 2015, the Adviser has agreed to limit the ratio of expenses to average net assets to the maximum ratio of 2.10% for Class C shares. Prior to July 1, 2015, the maximum ratio was 2.35% for Class C shares.
(8) Amount is less than 0.005%.
(9) Not annualized.
(10) Annualized.
The accompanying notes are an integral part of the financial statements.
17
Morgan Stanley Institutional Fund, Inc.
Annual Report — December 31, 2019
Financial Highlights
International Advantage Portfolio
| | | Class IS | |
Selected Per Share Data and Ratios | | Year Ended
December 31, 2019 | | Period from
June 15, 2018(1) to
December 31, 2018 | |
Net Asset Value, Beginning of Period | | $ | 15.75 | | | $ | 18.90 | | |
Income (Loss) from Investment Operations: | |
Net Investment Income (Loss)(2) | | | 0.05 | | | | (0.00 | )(3) | |
Net Realized and Unrealized Gain (Loss) | | | 4.69 | | | | (2.87 | ) | |
Total from Investment Operations | | | 4.74 | | | | (2.87 | ) | |
Distributions from and/or in Excess of: | |
Net Investment Income | | | (0.01 | ) | | | — | | |
Net Realized Gain | | | (0.02 | ) | | | (0.28 | ) | |
Total Distributions | | | (0.03 | ) | | | (0.28 | ) | |
Redemption Fees | | | 0.00 | (3) | | | 0.00 | (3) | |
Net Asset Value, End of Period | | $ | 20.46 | | | $ | 15.75 | | |
Total Return(4) | | | 30.14 | % | | | (15.22 | )%(6) | |
Ratios to Average Net Assets and Supplemental Data: | |
Net Assets, End of Period (Thousands) | | $ | 774 | | | $ | 8 | | |
Ratio of Expenses Before Expense Limitation | | | 3.28 | % | | | 19.51 | %(7) | |
Ratio of Expenses After Expense Limitation | | | 0.93 | %(5) | | | 0.93 | %(5)(7) | |
Ratio of Net Investment Income (Loss) | | | 0.24 | %(5) | | | (0.04 | )%(5)(7) | |
Ratio of Rebate from Morgan Stanley Affiliates | | | 0.02 | % | | | 0.02 | %(7) | |
Portfolio Turnover Rate | | | 15 | % | | | 29 | % | |
(1) Commencement of Offering.
(2) Per share amount is based on average shares outstanding.
(3) Amount is less than $0.005 per share.
(4) Calculated based on the net asset value as of the last business day of the period.
(5) The Ratio of Expenses After Expense Limitation and Ratio of Net Investment Income (Loss) reflect the rebate of certain Fund expenses in connection with the investments in Morgan Stanley affiliates during the period. The effect of the rebate on the ratios is disclosed in the above table as "Ratio of Rebate from Morgan Stanley Affiliates."
(6) Not annualized.
(7) Annualized.
The accompanying notes are an integral part of the financial statements.
18
Morgan Stanley Institutional Fund, Inc.
Annual Report — December 31, 2019
Notes to Financial Statements
Morgan Stanley Institutional Fund, Inc. (the "Company") is registered under the Investment Company Act of 1940, as amended (the "Act"), as an open-end management investment company. The Company is comprised of thirty-two separate, active, diversified and non-diversified funds (individually referred to as a "Fund," collectively as the "Funds"). The Company applies investment company accounting and reporting guidance.
The accompanying financial statements relate to the International Advantage Portfolio. The Fund seeks long-term capital appreciation.
The Fund offers five classes of shares — Class I, Class A, Class L, Class C and Class IS. On April 30, 2015, the Fund suspended offering of Class L shares. Existing Class L shareholders may invest through reinvestment of dividends and distributions.
A. Significant Accounting Policies: The following significant accounting policies are in conformity with U.S. generally accepted accounting principles ("GAAP"). Such policies are consistently followed by the Company in the preparation of its financial statements. GAAP may require management to make estimates and assumptions that affect the reported amounts and disclosures in the financial statements. Actual results may differ from those estimates.
In August 2018, the Financial Accounting Standards Board ("FASB") issued Accounting Standards Update ("ASU") 2018-13, Fair Value Measurement (Topic 820) — Disclosures Framework — Changes to Disclosure Requirements of Fair Value Measurement ("ASU 2018-13") which introduces new fair value disclosure requirements as well as eliminates and modifies certain existing fair value disclosure requirements. ASU 2018-13 would be effective for fiscal years beginning after December 15, 2019 and for interim periods within those fiscal years; however, management has elected to early adopt ASU 2018-13 as permitted by the standard. The impact of the Fund's adoption was limited to changes in the Fund's financial statement disclosures regarding fair value, primarily those disclosures related to transfers between levels of the fair value hierarchy and disclosure of the range and weighted average used to develop significant unobservable inputs for Level 3 fair value measurements, when applicable.
1. Security Valuation: (1) An equity portfolio security listed or traded on an exchange is valued at its latest reported sales price (or at the exchange official closing price if such exchange reports an official closing price), and if there were no sales on a given day and if there is no
official exchange closing price for that day, the security is valued at the mean between the last reported bid and asked prices if such bid and asked prices are available on the relevant exchanges. If only bid prices are available then the latest bid price may be used. Listed equity securities not traded on the valuation date with no reported bid and asked prices available on the exchange are valued at the mean between the current bid and asked prices obtained from one or more reputable brokers or dealers. In cases where a security is traded on more than one exchange, the security is valued on the exchange designated as the primary market; (2) all other equity portfolio securities for which over-the-counter ("OTC") market quotations are readily available are valued at the latest reported sales price (or at the market official closing price if such market reports an official closing price), and if there was no trading in the security on a given day and if there is no official closing price from relevant markets for that day, the security is valued at the mean between the last reported bid and asked prices if such bid and asked prices are available on the relevant markets. An unlisted equity security that does not trade on the valuation date and for which bid and asked prices from the relevant markets are unavailable is valued at the mean between the current bid and asked prices obtained from one or more reputable brokers or dealers; (3) certain portfolio securities may be valued by an outside pricing service/vendor approved by the Company's Board of Directors (the "Directors"). The pricing service/vendor may employ a pricing model that takes into account, among other things, bids, yield spreads and/or other market data and specific security characteristics. Alternatively, if a valuation is not available from an outside pricing service/vendor, and the security trades on an exchange, the security may be valued at its latest reported sale price (or at the exchange official closing price if such exchange reports an official closing price), prior to the time when assets are valued. If there are no sales on a given day and if there is no official exchange closing price for that day, the security is valued at the mean between the last reported bid and asked prices if such bid and asked prices are available in the relevant exchanges. If Morgan Stanley Investment Management Inc. (the "Adviser"), a wholly-owned subsidiary of Morgan Stanley, determines that the price provided by the outside pricing service/vendor or exchange does not reflect the security's fair value or is unable to provide a price, prices from brokers or dealers may also be utilized. In these circumstances, the value of the security will be the mean of bid and asked prices
19
Morgan Stanley Institutional Fund, Inc.
Annual Report — December 31, 2019
Notes to Financial Statements (cont'd)
obtained from brokers or dealers; (4) listed options are valued at the last reported sales price on the exchange on which they are listed (or at the exchange official closing price if such exchange reports an official closing price). If an official closing price or last reported sales price is unavailable, the listed option should be fair valued at the mean between its latest bid and ask prices. Unlisted options are valued at the mean between their latest bid and ask prices from a broker/dealer or valued by a pricing service/vendor; (5) when market quotations are not readily available, including circumstances under which the Adviser determines that the closing price, last sale price or the mean between the last reported bid and asked prices are not reflective of a security's market value, portfolio securities are valued at their fair value as determined in good faith under procedures established by and under the general supervision of the Directors. Occasionally, developments affecting the closing prices of securities and other assets may occur between the times at which valuations of such securities are determined (that is, close of the foreign market on which the securities trade) and the close of business of the New York Stock Exchange ("NYSE"). If developments occur during such periods that are expected to materially affect the value of such securities, such valuations may be adjusted to reflect the estimated fair value of such securities as of the close of the NYSE, as determined in good faith by the Directors or by the Adviser using a pricing service and/or procedures approved by the Directors; (6) quotations of foreign portfolio securities, other assets and liabilities and forward contracts stated in foreign currency are translated into U.S. dollar equivalents at the prevailing market rates prior to the close of the NYSE; and (7) investments in mutual funds, including the Morgan Stanley Institutional Liquidity Funds, are valued at the net asset value ("NAV") as of the close of each business day.
The Directors have responsibility for determining in good faith the fair value of the investments, and the Directors may appoint others, such as the Company's Adviser or a valuation committee, to assist the Directors in determining fair value and to make the actual calculations pursuant to the fair valuation methodologies previously approved by the Directors. Under procedures approved by the Directors, the Company's Adviser has formed a Valuation Committee whose members are approved by the Directors. The Valuation Committee provides administration and oversight of the Company's valuation policies and procedures, which are reviewed at
least annually by the Directors. These procedures allow the Company to utilize independent pricing services, quotations from securities and financial instrument dealers and other market sources to determine fair value.
2. Fair Value Measurement: FASB Accounting Standards CodificationTM ("ASC") 820, "Fair Value Measurement" ("ASC 820"), defines fair value as the value that the Fund would receive to sell an investment or pay to transfer a liability in a timely transaction with an independent buyer in the principal market, or in the absence of a principal market, the most advantageous market for the investment or liability. ASC 820 establishes a three-tier hierarchy to distinguish between (1) inputs that reflect the assumptions market participants would use in valuing an asset or liability developed based on market data obtained from sources independent of the reporting entity (observable inputs) and (2) inputs that reflect the reporting entity's own assumptions about the assumptions market participants would use in valuing an asset or liability developed based on the best information available in the circumstances (unobservable inputs) and to establish classification of fair value measurements for disclosure purposes. Various inputs are used in determining the value of the Fund's investments. The inputs are summarized in the three broad levels listed below:
• Level 1 – unadjusted quoted prices in active markets for identical investments
• Level 2 – other significant observable inputs (including quoted prices for similar investments, interest rates, prepayment speeds, credit risk, etc.)
• Level 3 – significant unobservable inputs including the Fund's own assumptions in determining the fair value of investments. Factors considered in making this determination may include, but are not limited to, information obtained by contacting the issuer, analysts, or the appropriate stock exchange (for exchange-traded securities), analysis of the issuer's financial statements or other available documents and, if necessary, available information concerning other securities in similar circumstances.
The inputs or methodology used for valuing securities are not necessarily an indication of the risk associated with investing in those securities and the determination
20
Morgan Stanley Institutional Fund, Inc.
Annual Report — December 31, 2019
Notes to Financial Statements (cont'd)
of the significance of a particular input to the fair value measurement in its entirety requires judgment and considers factors specific to each security.
The following is a summary of the inputs used to value the Fund's investments as of December 31, 2019:
Investment Type | | Level 1
Unadjusted
quoted
prices
(000) | | Level 2
Other
significant
observable
inputs
(000) | | Level 3
Significant
unobservable
inputs
(000) | | Total
(000) | |
Assets: | |
Common Stocks | |
Air Freight &
Logistics | | $ | — | | | $ | 189,408 | | | $ | — | | | $ | 189,408 | | |
Banks | | | 146,164 | | | | — | | | | — | | | | 146,164 | | |
Beverages | | | 111,880 | | | | — | | | | — | | | | 111,880 | | |
Biotechnology | | | — | | | | 49,440 | | | | — | | | | 49,440 | | |
Capital Markets | | | 67,960 | | | | — | | | | — | | | | 67,960 | | |
Chemicals | | | — | | | | 61,707 | | | | — | | | | 61,707 | | |
Diversified Consumer
Services | | | 74,334 | | | | — | | | | — | | | | 74,334 | | |
Electronic
Equipment,
Instruments &
Components | | | — | | | | 129,465 | | | | — | | | | 129,465 | | |
Food Products | | | 53,148 | | | | 128,085 | | | | — | | | | 181,233 | | |
Hotels,
Restaurants &
Leisure | | | 15,432 | | | | — | | | | — | | | | 15,432 | | |
Household Products | | | 40,030 | | | | 78,919 | | | | — | | | | 118,949 | | |
Information
Technology
Services | | | 100,850 | | | | — | | | | — | | | | 100,850 | | |
Insurance | | | 71,731 | | | | — | | | | — | | | | 71,731 | | |
Interactive Media &
Services | | | 80,698 | | | | — | | | | — | | | | 80,698 | | |
Internet & Direct
Marketing Retail | | | 83,059 | | | | — | | | | — | | | | 83,059 | | |
Machinery | | | — | | | | 20,195 | | | | — | | | | 20,195 | | |
Marine | | | — | | | | 53,216 | | | | — | | | | 53,216 | | |
Multi-Utilities | | | 84,755 | | | | — | | | | — | | | | 84,755 | | |
Semiconductors &
Semiconductor
Equipment | | | 160,800 | | | | — | | | | — | | | | 160,800 | | |
Software | | | 60,878 | | | | — | | | | — | | | | 60,878 | | |
Textiles, Apparel &
Luxury Goods | | | 141,302 | | | | 112,277 | | | | — | | | | 253,579 | | |
Total Common
Stocks | | | 1,293,021 | | | | 822,712 | | | | — | | | | 2,115,733 | | |
Call Options
Purchased | | | — | | | | 576 | | | | — | | | | 576 | | |
Short-Term
Investment | |
Investment Company | | | 215,987 | | | | — | | | | — | | | | 215,987 | | |
Total Assets | | $ | 1,509,008 | | | $ | 823,288 | | | $ | — | | | $ | 2,332,296 | | |
Transfers between investment levels may occur as the markets fluctuate and/or the availability of data used in an investment's valuation changes.
3. Foreign Currency Translation and Foreign Investments: The books and records of the Fund are maintained in U.S. dollars. Foreign currency amounts are translated into U.S. dollars as follows:
– investments, other assets and liabilities at the prevailing rate of exchange on the valuation date;
– investment transactions and investment income at the prevailing rates of exchange on the dates of such transactions.
Although the net assets of the Fund are presented at the foreign exchange rates and market values at the close of the period, the Fund does not isolate that portion of the results of operations arising as a result of changes in the foreign exchange rates from the fluctuations arising from changes in the market prices of securities held at period end. Similarly, the Fund does not isolate the effect of changes in foreign exchange rates from the fluctuations arising from changes in the market prices of securities sold during the period. Accordingly, realized and unrealized foreign currency gains (losses) on investments in securities are included in the reported net realized and unrealized gains (losses) on investment transactions and balances. However, pursuant to U.S. federal income tax regulations, gains and losses from certain foreign currency transactions and the foreign currency portion of gains and losses realized on sales and maturities of foreign denominated debt securities are treated as ordinary income for U.S. federal income tax purposes.
Net realized gains (losses) on foreign currency transactions represent net foreign exchange gains (losses) from foreign currency forward exchange contracts, disposition of foreign currencies, currency gains (losses) realized between the trade and settlement dates on securities transactions, and the difference between the amount of investment income and foreign withholding taxes recorded on the Fund's books and the U.S. dollar equivalent amounts actually received or paid. The change in unrealized currency gains (losses) on foreign currency transactions for the period is reflected in the Statement of Operations.
Foreign security and currency transactions may involve certain considerations and risks not typically associated with those of U.S. dollar denominated transactions as a result of, among other factors, fluctuations of exchange
21
Morgan Stanley Institutional Fund, Inc.
Annual Report — December 31, 2019
Notes to Financial Statements (cont'd)
rates in relation to the U.S. dollar, the possibility of lower levels of governmental supervision and regulation of foreign securities markets and the possibility of political or economic instability.
Governmental approval for foreign investments may be required in advance of making an investment under certain circumstances in some countries, and the extent of foreign investments in domestic companies may be subject to limitation in other countries. Foreign ownership limitations also may be imposed by the charters of individual companies to prevent, among other concerns, violations of foreign investment limitations. As a result, an additional class of shares (identified as "Foreign" in the Portfolio of Investments) may be created and offered for investment. The "local" and "foreign shares" market values may differ. In the absence of trading of the foreign shares in such markets, the Fund values the foreign shares at the closing exchange price of the local shares.
4. Derivatives: The Fund may, but is not required to, use derivative instruments for a variety of purposes, including hedging, risk management, portfolio management or to earn income. Derivatives are financial instruments whose value is based, in part, on the value of an underlying asset, interest rate, index or financial instrument. Prevailing interest rates and volatility levels, among other things, also affect the value of derivative instruments. A derivative instrument often has risks similar to its underlying asset and may have additional risks, including imperfect correlation between the value of the derivative and the underlying asset, risks of default by the counterparty to certain transactions, magnification of losses incurred due to changes in the market value of the securities, instruments, indices or interest rates to which the derivative instrument relates, risks that the transactions may not be liquid and risks arising from margin requirements. The use of derivatives involves risks that are different from, and possibly greater than, the risks associated with other portfolio investments. Derivatives may involve the use of highly specialized instruments that require investment techniques and risk analyses different from those associated with other portfolio investments. All of the Fund's holdings, including derivative instruments, are marked-to-market each day with the change in value reflected in unrealized appreciation (depreciation). Upon disposition, a realized gain or loss is recognized.
Certain derivative transactions may give rise to a form of leverage. Leverage magnifies the potential for gain and the risk of loss. Leverage associated with derivative transactions may cause the Fund to liquidate portfolio positions when it may not be advantageous to do so to satisfy its obligations or to meet earmarking or segregation requirements, pursuant to applicable Securities and Exchange Commission ("SEC") rules and regulations, or may cause the Fund to be more volatile than if the Fund had not been leveraged. Although the Adviser seeks to use derivatives to further the Fund's investment objectives, there is no assurance that the use of derivatives will achieve this result.
Following is a description of the derivative instruments and techniques that the Fund used during the period and their associated risks:
Options: With respect to options, the Fund is subject to equity risk, interest rate risk and foreign currency exchange risk in the normal course of pursuing its investment objectives. If the Fund buys an option, it buys a legal contract giving it the right to buy or sell a specific amount of the underlying instrument or foreign currency, or futures contract on the underlying instrument or foreign currency, at an agreed-upon price during a period of time or on a specified date typically in exchange for a premium paid by the Fund. The Fund may purchase and/or sell put and call options. Purchasing call options tends to increase the Fund's exposure to the underlying (or similar) instrument. Purchasing put options tends to decrease the Fund's exposure to the underlying (or similar) instrument. When entering into purchased option contracts, the Fund bears the risk of interest or exchange rates or securities prices moving unexpectedly, in which case, the Fund may not achieve the anticipated benefits of the purchased option contracts; however the risk of loss is limited to the premium paid. Purchased options are reported as part of "Total Investments in Securities" in the Statement of Assets and Liabilities. Premiums paid for purchasing options which expired are treated as realized losses. If the Fund sells an option, it sells to another party the right to buy from or sell to the Fund a specific amount of the underlying instrument or foreign currency, or futures contract on the underlying instrument or foreign currency, at an agreed-upon price during a period of time or on a specified date typically in exchange for a premium received by the
22
Morgan Stanley Institutional Fund, Inc.
Annual Report — December 31, 2019
Notes to Financial Statements (cont'd)
Fund. When options are purchased OTC, the Fund bears the risk that the counterparty that wrote the option will be unable or unwilling to perform its obligations under the option contract. Options may also be illiquid and the Fund may have difficulty closing out its position. A decision as to whether, when and how to use options involves the exercise of skill and judgment and even a well-conceived option transaction may be unsuccessful because of market behavior or unexpected events. The prices of options can be highly volatile and the use of options can lower total returns.
FASB ASC 815, "Derivatives and Hedging" ("ASC 815"), is intended to improve financial reporting about derivative instruments by requiring enhanced disclosures to enable investors to better understand how and why the Fund uses derivative instruments, how these derivative instruments are accounted for and their effects on the Fund's financial position and results of operations.
The following table sets forth the fair value of the Fund's derivative contracts by primary risk exposure as of December 31, 2019:
| | | Asset Derivatives
Statement of Assets and
Liabilities Location | | Primary Risk
Exposure | | Value
(000) | |
Purchased Options
| | Investments, at Value
(Purchased Options) | | Currency Risk | | $ | 576 | (a) | |
(a) Amounts are included in Investments in Securities in the Statement of Assets and Liabilities.
The following tables set forth by primary risk exposure the Fund's realized gain (losses) and change in unrealized appreciation (depreciation) by type of derivative contract for the year ended December 31, 2019 in accordance with ASC 815:
Realized Gain (Loss) | |
Primary Risk Exposure | | Derivative Type | | Value
(000) | |
Currency Risk | | Investments
(Purchased Options) | | $ | (1,388 | )(b) | |
(b) Amounts are included in Investments Sold in the Statement of Operations.
Change in Unrealized Appreciation (Depreciation) | |
Primary Risk Exposure | | Derivative Type | | Value
(000) | |
Currency Risk | | Investments
(Purchased Options) | | $ | (2,542 | )(c) | |
(c) Amounts are included in Investments in the Statement of Operations.
At December 31, 2019, the Fund's derivative assets and liabilities are as follows:
Gross Amounts of Assets and Liabilities
Presented in the Statement of Assets and Liabilities | |
Derivatives | | Assets(d)
(000) | | Liabilities(d)
(000) | |
Purchased Options | | $ | 576 | (a) | | $ | — | | |
(a) Amounts are included in Investments in Securities in the Statement of Assets and Liabilities.
(d) Absent an event of default or early termination, OTC derivative assets and liabilities are presented gross and not offset in the Statement of Assets and Liabilities.
The Fund typically enters into International Swaps and Derivatives Association, Inc. Master Agreements ("ISDA Master Agreements") or similar master agreements (collectively, "Master Agreements") with its contract counterparties for certain OTC derivatives in order to, among other things, reduce its credit risk to counterparties. ISDA Master Agreements include provisions for general obligations, representations, collateral and events of default or termination. Under an ISDA Master Agreement, the Fund typically may offset with the counterparty certain OTC derivative financial instruments' payables and/or receivables with collateral held and/or posted and create one single net payment (close-out netting) in the event of default, termination and/or potential deterioration in the credit quality of the counterparty. Various Master Agreements govern the terms of certain transactions with counterparties, including transactions such as swap, forward, repurchase and reverse repurchase agreements. These Master Agreements typically attempt to reduce the counterparty risk associated with such transactions by specifying credit protection mechanisms and providing standardization that improves legal certainty. Cross-termination provisions under Master Agreements typically provide that a default in connection with one transaction between the Fund and a counterparty gives the non-defaulting party the right to terminate any other transactions in place with the defaulting party to create one single net payment due to/due from the defaulting party and may be a feature in certain Master Agreements. In the event the Fund exercises its right to terminate a Master Agreement after a counterparty experiences a termination event as defined in the Master Agreement, the return of collateral with market value in excess of the Fund's net liability may be delayed or denied.
23
Morgan Stanley Institutional Fund, Inc.
Annual Report — December 31, 2019
Notes to Financial Statements (cont'd)
The following table presents derivative financial instruments that are subject to enforceable netting arrangements as of December 31, 2019:
Gross Amounts Not Offset in the Statement of Assets and Liabilities | |
Counterparty | | Gross Asset
Derivatives
Presented in
the Statement
of Assets and
Liabilities
(000) | | Financial
Instrument
(000) | | Collateral
Received(e)
(000) | | Net Amount
(not less
than $0)
(000) | |
BNP Paribas | | $ | 1 | | | $ | — | | | $ | (1 | ) | | $ | 0 | | |
Royal Bank of Scotland | | | 575 | | | | — | | | | (575 | ) | | | 0 | | |
Total | | $ | 576 | (a) | | $ | — | | | $ | (576 | ) | | $ | 0 | | |
(a) Amounts are included in Investments in Securities in the Statement of Assets and Liabilities.
(e) In some instances, the actual collateral received may be more than the amount shown here due to overcollateralization.
For the year ended December 31, 2019, the approximate average monthly amount outstanding for each derivative type is as follows:
Purchased Options: | |
Average monthly notional amount | | | 572,161,000 | | |
5. Securities Lending: The Fund lends securities to qualified financial institutions, such as broker-dealers, to earn additional income. Any increase or decrease in the fair value of the securities loaned that might occur and any interest earned or dividends declared on those securities during the term of the loan would remain in the Fund. The Fund would receive cash or securities as collateral in an amount equal to or exceeding 100% of the current fair value of the loaned securities. The collateral is marked-to-market daily by State Street Bank and Trust Company ("State Street"), the securities lending agent, to ensure that a minimum of 100% collateral coverage is maintained.
Based on pre-established guidelines, the securities lending agent invests any cash collateral that is received in an affiliated money market portfolio and repurchase agreements. Securities lending income is generated from the earnings on the invested collateral and borrowing fees, less any rebates owed to the borrowers and compensation to the lending agent, and is recorded as "Income from Securities Loaned — Net" in the Fund's Statement of Operations. Risks in securities lending transactions are that a borrower may not provide additional collateral when required or return the securities when due, and that the value of the short-term investments will be less than the amount of cash collateral plus any rebate that is required to be returned to the borrower.
The Fund has the right under the securities lending agreement to recover the securities from the borrower on demand.
The following table presents financial instruments that are subject to enforceable netting arrangements as of December 31, 2019:
Gross Amounts Not Offset in the Statement of Assets and Liabilities | |
Gross Asset
Amounts
Presented
in the
Statement of
Assets and
Liabilities
(000) | | Financial
Instrument
(000) | | Collateral
Received
(000) | | Net Amount
(not less
than $0)
(000) | |
| $ | 11,810 | (f) | | $ | — | | | $ | (11,810 | )(g)(h) | | $ | 0 | | |
(f) Represents market value of loaned securities at year end.
(g) The Fund received non-cash collateral of approximately $12,785,000 in the form of U.S. Government obligations, which the Fund cannot sell or repledge, and accordingly are not reflected in the Portfolio of Investments.
(h) The actual collateral received is greater than the amount shown here due to overcollateralization.
6. Redemption Fees: The Fund will assess a 2% redemption fee on Class I shares, Class A shares, Class L shares, Class C shares and Class IS shares, which is paid directly to the Fund, for shares redeemed or exchanged within thirty days of purchase, subject to certain exceptions. The redemption fee is designed to protect the Fund and its remaining shareholders from the effects of short-term trading. These fees, if any, are included in the Statements of Changes in Net Assets.
7. Indemnifications: The Company enters into contracts that contain a variety of indemnifications. The Company's maximum exposure under these arrangements is unknown. However, the Company has not had prior claims or losses pursuant to these contracts and expects the risk of loss to be remote.
8. Dividends and Distributions to Shareholders: Dividends and distributions to shareholders are recorded on the ex-dividend date. Dividends from net investment income, if any, are declared and paid annually. Net realized capital gains, if any, are distributed at least annually.
9. Security Transactions, Income and Expenses: Security transactions are accounted for on the trade date (date the order to buy or sell is executed). Realized gains and losses on the sale of investment securities are determined on the specific identified cost method. Dividend income and other distributions are recorded on the
24
Morgan Stanley Institutional Fund, Inc.
Annual Report — December 31, 2019
Notes to Financial Statements (cont'd)
ex-dividend date (except for certain foreign dividends which may be recorded as soon as the Fund is informed of such dividends) net of applicable withholding taxes. Non-cash dividends received in the form of stock, if any, are recognized on the ex-dividend date and recorded as non-cash dividend income at fair value. Interest income is recognized on the accrual basis except where collection is in doubt. Discounts are accreted and premiums are amortized over the life of the respective securities. Most expenses of the Company can be directly attributed to a particular Fund. Expenses which cannot be directly attributed are apportioned among the Funds based upon relative net assets or other appropriate methods. Income, expenses (other than class specific expenses — distribution and shareholder services, transfer agency and sub transfer agency fees) and realized and unrealized gains or losses are allocated to each class of shares based upon their relative net assets.
B. Advisory Fees: The Adviser, a wholly-owned subsidiary of Morgan Stanley, provides the Fund with advisory services under the terms of an Investment Advisory Agreement, paid quarterly, at the annual rate based on the daily net assets as follows:
First $1
billion | | Over $1
billion | |
| | 0.80 | % | | | 0.75 | % | |
For the year ended December 31, 2019, the advisory fee rate (net of rebate) was equivalent to an annual effective rate of 0.76% of the Fund's average daily net assets.
The Adviser has agreed to reduce its advisory fee and/or reimburse the Fund so that total annual Fund operating expenses, excluding certain investment related expenses, taxes, interest and other extraordinary expenses (including litigation), will not exceed 1.00% for Class I shares, 1.35% for Class A shares, 1.85% for Class L shares, 2.10% for Class C shares and 0.95% for Class IS shares. The fee waivers and/or expense reimbursements will continue for at least one year from the date of the Fund's prospectus or until such time as the Directors act to discontinue all or a portion of such waivers and/or reimbursements when they deem such action is appropriate. For the year ended December 31, 2019, approximately $374,000 of other expenses were reimbursed by the Adviser pursuant to this arrangement.
C. Administration Fees: The Adviser also serves as Administrator to the Company and provides administrative services pursuant to an Administration Agreement for an annual fee,
accrued daily and paid monthly, of 0.08% of the Fund's average daily net assets.
Under a Sub-Administration Agreement between the Administrator and State Street, State Street provides certain administrative services to the Company. For such services, the Administrator pays State Street a portion of the fee the Administrator receives from the Fund.
D. Distribution and Shareholder Services Fees: Morgan Stanley Distribution, Inc. ("MSDI" or the "Distributor"), a wholly-owned subsidiary of the Adviser and an indirect subsidiary of Morgan Stanley, serves as the Company's Distributor of Fund shares pursuant to a Distribution Agreement. The Company has adopted a Shareholder Services Plan with respect to Class A shares pursuant to Rule 12b-1 under the Act. Under the Shareholder Services Plan, the Fund pays the Distributor a shareholder services fee, accrued daily and paid monthly, at an annual rate of 0.25% of the Fund's average daily net assets attributable to Class A shares.
The Company has adopted a Distribution and Shareholder Services Plan with respect to Class L shares pursuant to Rule 12b-1 under the Act. Under the Distribution and Shareholder Services Plan, the Fund pays the Distributor a distribution fee, accrued daily and paid monthly, at an annual rate of 0.50% and a shareholder services fee, accrued daily and paid monthly, at an annual rate of 0.25% of the Fund's average daily net assets attributable to Class L shares.
The Company has adopted a Distribution and Shareholder Services Plan with respect to Class C shares pursuant to Rule 12b-1 under the Act. Under the Distribution and Shareholder Services Plan, the Fund pays the Distributor a distribution fee, accrued daily and paid monthly, at an annual rate of 0.75% and a shareholder services fee, accrued daily and paid monthly, at an annual rate of 0.25% of the Fund's average daily net assets attributable to Class C shares.
The distribution and shareholder services fees are used to support the expenses associated with servicing and maintaining accounts. The Distributor may compensate other parties for providing shareholder support services to investors who purchase Class A, Class L and Class C shares.
E. Dividend Disbursing and Transfer Agent: The Company's dividend disbursing and transfer agent is DST Asset Manager Solutions, Inc. ("DST"). Pursuant to a Transfer Agency Agreement, the Company pays DST a fee based on the number of classes, accounts and transactions relating to the Funds of the Company.
25
Morgan Stanley Institutional Fund, Inc.
Annual Report — December 31, 2019
Notes to Financial Statements (cont'd)
F. Custodian Fees: State Street (the "Custodian") also serves as Custodian for the Company in accordance with a Custodian Agreement. The Custodian holds cash, securities and other assets of the Company as required by the Act. Custody fees are payable monthly based on assets held in custody, investment purchases and sales activity and account maintenance fees, plus reimbursement for certain out-of-pocket expenses.
G. Security Transactions and Transactions with Affiliates: For the year ended December 31, 2019, purchases and sales of investment securities for the Fund, other than long-term U.S. Government securities and short-term investments were approximately $1,285,875,000 and $215,668,000, respectively. There were no purchases and sales of long-term U.S. Government securities for the year ended December 31, 2019.
The Fund invests in the Institutional Class of the Morgan Stanley Institutional Liquidity Funds — Treasury Securities Portfolio (the "Liquidity Funds"), an open-end management investment company managed by the Adviser, both directly and as a portion of the securities held as collateral on loaned securities. Advisory fees paid by the Fund are reduced by an amount equal to its pro-rata share of the advisory and administration fees paid by the Fund due to its investment in the Liquidity Funds. For the year ended December 31, 2019, advisory fees paid were reduced by approximately $297,000 relating to the Fund's investment in the Liquidity Funds.
A summary of the Fund's transactions in shares of affiliated investments during the year ended December 31, 2019 is as follows:
Affiliated
Investment
Company | | Value
December 31,
2018
(000) | | Purchases
at Cost
(000) | | Proceeds
from Sales
(000) | | Dividend
Income
(000) | |
Liquidity Funds | | $ | 109,356 | | | $ | 655,402 | | | $ | 548,771 | | | $ | 3,052 | | |
Affiliated
Investment
Company (cont'd) | | Realized
Gain (Loss)
(000) | | Change in
Unrealized
Appreciation
(Depreciation)
(000) | | Value
December 31,
2019
(000) | |
Liquidity Funds | | $ | — | | | $ | — | | | $ | 215,987 | | |
The Fund is permitted to purchase and sell securities ("cross-trade") from and to other Morgan Stanley funds as well as other funds and client accounts for which the Adviser or an affiliate of the Adviser serves as investment adviser, pursuant to procedures approved by the Directors in compliance with Rule 17a-7 under the Act (the "Rule"). Each cross-trade is
executed at the current market price in compliance with provisions of the Rule. For the year ended December 31, 2019, the Fund did not engage in any cross-trade transactions.
The Fund has an unfunded Deferred Compensation Plan (the "Compensation Plan"), which allows each independent Director to defer payment of all, or a portion, of the fees he or she receives for serving on the Board of Directors. Each eligible Director generally may elect to have the deferred amounts credited with a return equal to the total return on one or more of the Morgan Stanley funds that are offered as investment options under the Compensation Plan. Appreciation/depreciation and distributions received from these investments are recorded with an offsetting increase/decrease in the deferred compensation obligation and do not affect the NAV of the Fund.
H. Federal Income Taxes: It is the Fund's intention to continue to qualify as a regulated investment company and distribute all of its taxable and tax-exempt income. Accordingly, no provision for federal income taxes is required in the financial statements.
The Fund may be subject to taxes imposed by countries in which it invests. Such taxes are generally based on income and/or capital gains earned or repatriated. Taxes are accrued based on net investment income, net realized gains and net unrealized appreciation as such income and/or gains are earned. Taxes may also be based on transactions in foreign currency and are accrued based on the value of investments denominated in such currency.
FASB ASC 740-10, "Income Taxes — Overall", sets forth a minimum threshold for financial statement recognition of the benefit of a tax position taken or expected to be taken in a tax return. Management has concluded there are no significant uncertain tax positions that would require recognition in the financial statements. If applicable, the Fund recognizes interest accrued related to unrecognized tax benefits in "Interest Expense" and penalties in "Other Expenses" in the Statement of Operations. The Fund files tax returns with the U.S. Internal Revenue Service, New York and various states. Generally, each of the tax years in the four-year period ended December 31, 2019 remains subject to examination by taxing authorities.
The tax character of distributions paid may differ from the character of distributions shown for GAAP purposes due to short-term capital gains being treated as ordinary income for
26
Morgan Stanley Institutional Fund, Inc.
Annual Report — December 31, 2019
Notes to Financial Statements (cont'd)
tax purposes. The tax character of distributions paid during fiscal years 2019 and 2018 was as follows:
2019
Distributions
Paid From: | | 2018
Distributions
Paid From: | |
Ordinary
Income
(000) | | Long-Term
Capital Gain
(000) | | Ordinary
Income
(000) | | Long-Term
Capital Gain
(000) | |
| $ | 258 | | | $ | 2,619 | | | $ | 44 | | | $ | 11,201 | | |
The amount and character of income and gains to be distributed are determined in accordance with income tax regulations which may differ from GAAP. These book/tax differences are either considered temporary or permanent in nature.
Temporary differences are attributable to differing book and tax treatments for the timing of the recognition of gains (losses) on certain investment transactions and the timing of the deductibility of certain expenses.
Permanent differences, primarily due to equalization debits, resulted in the following reclassifications among the components of net assets at December 31, 2019:
Total
Distributable
Earnings
(000) | | Paid-in
Capital
(000) | |
| $ | (2,217 | ) | | $ | 2,217 | | |
At December 31, 2019, the components of distributable earnings for the Fund on a tax basis were as follows:
Undistributed
Ordinary
Income
(000) | | Undistributed
Long-Term
Capital Gain
(000) | |
| $ | 2,506 | | | | — | | |
Qualified late year losses are capital losses and specified ordinary losses, including currency losses, incurred after October 31 but within the taxable year that, if elected, are deemed to arise on the first day of the Fund's next taxable year. For the year ended December 31, 2019, the Fund intends to defer to January 1, 2020 for U.S. federal income tax purposes the following losses:
Qualified
Late Year
Ordinary
Losses
(000) | | Post-October
Capital
Losses
(000) | |
| | — | | | $ | 6,330 | | |
I. Credit Facility: The Company and other Morgan Stanley funds participated in a $150,000,000 committed, unsecured revolving line of credit facility (the "Facility") with State
Street. Effective April 22, 2019, the committed line amount increased to $300,000,000. This Facility is to be used for temporary emergency purposes or funding of shareholder redemption requests. The interest rate on borrowings is based on the federal funds rate or 1 month LIBOR rate plus a spread. The Facility also has a commitment fee of 0.25% per annum based on the unused portion of the Facility. During the year ended December 31, 2019, the Fund did not have any borrowings under the Facility.
J. Other: At December 31, 2019, the Fund had record owners of 10% or greater. Investment activities of these shareholders could have a material impact on the Fund. The aggregate percentage of such owners was 51.7%.
27
Morgan Stanley Institutional Fund, Inc.
Annual Report — December 31, 2019
Report of Independent Registered Public Accounting Firm
To the Shareholders and Board of Directors of
Morgan Stanley Institutional Fund, Inc. —
International Advantage Portfolio
Opinion on the Financial Statements
We have audited the accompanying statement of assets and liabilities of International Advantage Portfolio (the "Fund") (one of the funds constituting Morgan Stanley Institutional Fund, Inc. (the "Company")), including the portfolio of investments, as of December 31, 2019, and the related statement of operations for the year then ended, the statements of changes in net assets for each of the two years in the period then ended, the financial highlights for each of the five years in the period then ended and the related notes (collectively referred to as the "financial statements"). In our opinion, the financial statements present fairly, in all material respects, the financial position of International Advantage Portfolio (one of the funds constituting Morgan Stanley Institutional Fund, Inc.) at December 31, 2019, the results of its operations for the year then ended, the changes in its net assets for each of the two years in the period then ended and its financial highlights for each of the five years in the period then ended, in conformity with U.S. generally accepted accounting principles.
Basis for Opinion
These financial statements are the responsibility of the Company's management. Our responsibility is to express an opinion on the Fund's financial statements based on our audits. We are a public accounting firm registered with the Public Company Accounting Oversight Board (United States) ("PCAOB") and are required to be independent with respect to the Company in accordance with the U.S. federal securities law and the applicable rules and regulations of the Securities and Exchange Commission and the PCAOB.
We conducted our audits in accordance with the standards of the PCAOB. Those standards require that we plan and perform the audit to obtain reasonable assurance about whether the financial statements are free of material misstatement, whether due to error or fraud. The Company is not required to have, nor were we engaged to perform, an audit of the Company's internal control over financial reporting. As part of our audits, we are required to obtain an understanding of internal control over financial reporting, but not for the purpose of expressing an opinion on the effectiveness of the Company's internal control over financial reporting. Accordingly, we express no such opinion.
Our audits included performing procedures to assess the risks of material misstatement of the financial statements, whether due to error or fraud, and performing procedures that respond to those risks. Such procedures included examining, on a test basis, evidence regarding the amounts and disclosures in the financial statements. Our procedures included confirmation of securities owned as of December 31, 2019 by correspondence with the custodian and others or by other appropriate auditing procedures where replies from others were not received. Our audits also included evaluating the accounting principles used and significant estimates made by management, as well as evaluating the overall presentation of the financial statements. We believe that our audits provide a reasonable basis for our opinion.

We have served as the auditor of one or more Morgan Stanley investment companies since 2000.
Boston, Massachusetts
February 27, 2020
28
Morgan Stanley Institutional Fund, Inc.
Annual Report — December 31, 2019
Federal Tax Notice (unaudited)
For federal income tax purposes, the following information is furnished with respect to the distributions paid by the Fund during its taxable year ended December 31, 2019.
The Fund designated and paid approximately $2,619,000 as a long-term capital gain distribution.
For federal income tax purposes, the following information is furnished with respect to the Fund's earnings for its taxable year ended December 31, 2019. When distributed, certain earnings may be subject to a maximum tax rate of 15% as provided for by the Jobs and Growth Tax Relief Reconciliation Act of 2003. The Fund designated up to a maximum of approximately $1,902,000 as taxable at this lower rate.
The Fund intends to pass through foreign tax credits of approximately $1,645,000 and has derived net income from sources within foreign countries amounting to approximately $18,802,000.
In January, the Fund provides tax information to shareholders for the preceding calendar year.
29
Privacy Notice (unaudited) April 2019
FACTS | | WHAT DOES MSIM DO WITH YOUR PERSONAL INFORMATION? | |
Why? | | Financial companies choose how they share your personal information. Federal law gives consumers the right to limit some but not all sharing. Federal law also requires us to tell you how we collect, share, and protect your personal information. Please read this notice carefully to understand what we do. | |
What? | | The types of personal information we collect and share depend on the product or service you have with us. This information can include:
n Social Security number and income
n investment experience and risk tolerance
n checking account number and wire transfer instructions | |
How? | | All financial companies need to share customers' personal information to run their everyday business. In the section below, we list the reasons financial companies can share their customers' personal information; the reasons MSIM chooses to share; and whether you can limit this sharing. | |
Reasons we can share your personal information | | Does MSIM share? | | Can you limit this sharing? | |
For our everyday business purposes —
such as to process your transactions, maintain your account(s), respond to court orders and legal investigations, or report to credit bureaus | | Yes | | No | |
For our marketing purposes —
to offer our products and services to you | | Yes | | No | |
For joint marketing with other financial companies | | No | | We don't share | |
For our affiliates' everyday business purposes —
information about your transactions and experiences | | Yes | | No | |
For our affiliates' everyday business purposes —
information about your creditworthiness | | No | | We don't share | |
For our affiliates to market to you | | No | | We don't share | |
For non-affiliates to market to you | | No | | We don't share | |
Questions? Call toll-free (844) 312-6327 or email: imprivacyinquiries@morganstanley.com
30
Privacy Notice (unaudited) (cont'd) April 2019
Who we are
Who is providing this notice? | | Morgan Stanley Investment Management, Inc. and its affiliated registered investment advisers, registered broker-dealers, and registered and unregistered funds ("MSIM") | |
What we do
How does MSIM protect my personal information? | | To protect your personal information from unauthorized access and use, we use security measures that comply with federal law. These measures include computer safeguards and secured files and buildings. We have policies governing the proper handling of customer information by personnel and requiring third parties that provide support to adhere to appropriate security standards with respect to such information. | |
How does MSIM collect my personal information? | | We collect your personal information, for example, when you
n open an account or make deposits or withdrawals from your account
n buy securities from us or make a wire transfer
n give us your contact information
We also collect your personal information from others, such as credit bureaus, affiliates, or other companies. | |
Why can't I limit all sharing? | | Federal law gives you the right to limit only
n sharing for affiliates' everyday business purposes — information about your creditworthiness
n affiliates from using your information to market to you
n sharing for non-affiliates to market to you
State laws and individual companies may give you additional rights to limit sharing. See below for more on your rights under state law. | |
Definitions
Affiliates | | Companies related by common ownership or control. They can be financial and non-financial companies.
n Our affiliates include companies with a Morgan Stanley name and financial companies such as Morgan Stanley Smith Barney LLC and Morgan Stanley & Co. | |
Non-affiliates | | Companies not related by common ownership or control. They can be financial and non-financial companies.
n MSIM does not share with non-affiliates so they can market to you. | |
Joint marketing | | A formal agreement between non-affiliated financial companies that together market financial products or services to you.
n MSIM doesn't jointly market | |
Other Important Information
Vermont: Except as permitted by law, we will not share personal information we collect about Vermont residents with Non-affiliates unless you provide us with your written consent to share such information.
California: Except as permitted by law, we will not share personal information we collect about California residents with Non-affiliates and we will limit sharing such personal information with our Affiliates to comply with California privacy laws that apply to us.
31
Morgan Stanley Institutional Fund, Inc.
Annual Report — December 31, 2019
Director and Officer Information (unaudited)
Independent Directors:
Name, Birth Year
and Address of
Independent Director | | Position(s)
Held with
Registrant | | Length of Time
Served* | | Principal Occupation(s) During Past 5 Years
and Other Relevant Professional Experience | | Number of
Funds in
Fund Complex
Overseen by
Independent
Director** | | Other Directorships
Held by Independent
Director*** | |
Frank L. Bowman
c/o Perkins Coie LLP
Counsel to the Independent Directors
1155 Avenue of the Americas
New York, NY 10036
Birth Year 1944 | | Director | | Since August 2006 | | President, Strategic Decisions, LLC (consulting) (since February 2009); Director or Trustee of various Morgan Stanley Funds (since August 2006); Chairperson of the Compliance and Insurance Committee (since October 2015); formerly, Chairperson of the Insurance Sub-Committee of the Compliance and Insurance Committee (2007-2015); served as President and Chief Executive Officer of the Nuclear Energy Institute (policy organization) (February 2005-November 2008); retired as Admiral, U.S. Navy after serving over 38 years on active duty including 8 years as Director of the Naval Nuclear Propulsion Program in the Department of the Navy and the U.S. Department of Energy (1996-2004); served as Chief of Naval Personnel (July 1994-September 1996) and on the Joint Staff as Director of Political Military Affairs (June 1992-July 1994); knighted as Honorary Knight Commander of the Most Excellent Order of the British Empire; awarded the Officier de l'Orde National du Mérite by the French Government; elected to the National Academy of Engineering (2009). | | | 86 | | | Director of Naval and Nuclear Technologies LLP; Director Emeritus of the Armed Services YMCA; Member of the National Security Advisory Council of the Center for U.S. Global Engagement and a member of the CNA Military Advisory Board; Trustee of Fairhaven United Methodist Church; Member of the Board of Advisors of the Dolphin Scholarship Foundation; Director of other various non-profit organizations; formerly, Director of BP p.l.c. (November 2010-May 2019). | |
Kathleen A. Dennis
c/o Perkins Coie LLP
Counsel to the Independent Directors
1155 Avenue of the Americas
New York, NY 10036
Birth Year 1953 | | Director | | Since August 2006 | | President, Cedarwood Associates (mutual fund and investment management consulting) (since July 2006); Chairperson of the Liquidity and Alternatives Sub-Committee of the Investment Committee (since October 2006) and Director or Trustee of various Morgan Stanley Funds (since August 2006); formerly, Senior Managing Director of Victory Capital Management (1993-2006). | | | 86 | | | Director of various non-profit organizations. | |
Nancy C. Everett
c/o Perkins Coie LLP
Counsel to the Independent Directors
1155 Avenue of the Americas
New York, NY 10036
Birth Year 1955 | | Director | | Since January 2015 | | Chief Executive Officer, Virginia Commonwealth University Investment Company (since November 2015); Owner, OBIR, LLC (institutional investment management consulting) (since June 2014); formerly, Managing Director, BlackRock, Inc. (February 2011-December 2013); and Chief Executive Officer, General Motors Asset Management (a/k/a Promark Global Advisors, Inc.) (June 2005-May 2010). | | | 87 | | | Formerly, Member of Virginia Commonwealth University School of Business Foundation (2005-2016); Member of Virginia Commonwealth University Board of Visitors (2013-2015); Member of Committee on Directors for Emerging Markets Growth Fund, Inc. (2007-2010); Chairperson of Performance Equity Management, LLC (2006-2010); and Chairperson, GMAM Absolute Return Strategies Fund, LLC (2006-2010). | |
32
Morgan Stanley Institutional Fund, Inc.
Annual Report — December 31, 2019
Director and Officer Information (unaudited) (cont'd)
Independent Directors: (cont'd)
Name, Birth Year
and Address of
Independent Director | | Position(s)
Held with
Registrant | | Length of Time
Served* | | Principal Occupation(s) During Past 5 Years
and Other Relevant Professional Experience | | Number of
Funds in
Fund Complex
Overseen by
Independent
Director** | | Other Directorships
Held by Independent
Director*** | |
Jakki L. Haussler
c/o Perkins Coie LLP
Counsel to the Independent Directors
1155 Avenue of the Americas
New York, NY 10036
Birth Year 1957 | | Director | | Since January 2015 | | Chairman, Opus Capital Group (since 1996); formerly, Chief Executive Officer, Opus Capital Group (1996-2019); Director, Capvest Venture Fund, LP (May 2000-December 2011); Partner, Adena Ventures, LP (July 1999-December 2010); Director, The Victory Funds (February 2005-July 2008). | | | 87 | | | Director of Service Corporation International and Member, Audit Committee and Investment Committee; Director of Cincinnati Bell Inc. and Member, Audit Committee and Governance and Nominating Committee; Chairman of Northern Kentucky University Member Investment Committee; Member of Chase College of Law Transactional Law Practice Center Board of Advisors; Director of Best Transport; Director of Chase College of Law Board of Visitors; formerly, Member, University of Cincinnati Foundation Investment Committee; Member, Miami University Board of Visitors (2008-2011); Trustee of Victory Funds (2005-2008) and Chairman, Investment Committee (2007-2008) and Member, Service Provider Committee (2005-2008). | |
Dr. Manuel H. Johnson
c/o Johnson Smick International, Inc.
220 I Street, NE — Suite 200
Washington, D.C. 20002
Birth Year 1949 | | Director | | Since July
1991 | | Senior Partner, Johnson Smick International, Inc. (consulting firm); Chairperson of the Investment Committee (since October 2006) and Director or Trustee of various Morgan Stanley Funds (since July 1991); Co-Chairman and a founder of the Group of Seven Council (G7C) (international economic commission); formerly, Chairperson of the Audit Committee (July 1991-September 2006), Vice Chairman of the Board of Governors of the Federal Reserve System and Assistant Secretary of the U.S. Treasury. | | | 86 | | | Director of NVR, Inc. (home construction). | |
Joseph J. Kearns
c/o Perkins Coie LLP
Counsel to the Independent Directors
1155 Avenue of the Americas
New York, NY 10036
Birth Year 1942 | | Director | | Since August 1994 | | Senior Adviser, Kearns & Associates LLC (investment consulting); Chairperson of the Audit Committee (since October 2006) and Director or Trustee of various Morgan Stanley Funds (since August 1994); formerly, Deputy Chairperson of the Audit Committee (July 2003-September 2006) and Chairperson of the Audit Committee of various Morgan Stanley Funds (since August 1994); CFO of the J. Paul Getty Trust. | | | 87 | | | Prior to August 10, 2016, Director of Electro Rent Corporation (equipment leasing); Prior to December 31, 2013, Director of The Ford Family Foundation. | |
33
Morgan Stanley Institutional Fund, Inc.
Annual Report — December 31, 2019
Director and Officer Information (unaudited) (cont'd)
Independent Directors: (cont'd)
Name, Birth Year
and Address of
Independent Director | | Position(s)
Held with
Registrant | | Length of Time
Served* | | Principal Occupation(s) During Past 5 Years
and Other Relevant Professional Experience | | Number of
Funds in
Fund Complex
Overseen by
Independent
Director** | | Other Directorships
Held by Independent
Director*** | |
Michael F. Klein
c/o Perkins Coie LLP
Counsel to the Independent Directors
1155 Avenue of the Americas
New York, NY 10036
Birth Year 1958 | | Director | | Since August 2006 | | Managing Director, Aetos Alternatives Management, LP (since March 2000); Co-President, Aetos Alternatives Management, LP (since January 2004) and Co-Chief Executive Officer of Aetos Alternatives Management, LP (since August 2013); Chairperson of the Fixed Income Sub-Committee of the Investment Committee (since October 2006) and Director or Trustee of various Morgan Stanley Funds (since August 2006); formerly, Managing Director, Morgan Stanley & Co. Inc. and Morgan Stanley Dean Witter Investment Management and President, various Morgan Stanley Funds (June 1998-March 2000); Principal, Morgan Stanley & Co. Inc. and Morgan Stanley Dean Witter Investment Management (August 1997-December 1999). | | | 86 | | | Director of certain investment funds managed or sponsored by Aetos Alternatives Management, LP; Director of Sanitized AG and Sanitized Marketing AG (specialty chemicals). | |
Patricia Maleski
c/o Perkins Coie LLP
Counsel to the Independent Directors
1155 Avenue of the Americas
New York, NY 10036
Birth Year 1960 | | Director | | Since January 2017 | | Managing Director, JPMorgan Asset Management (2004-2016); Oversight and Control Head of Fiduciary and Conflicts of Interest Program (2015-2016); Chief Control Officer-Global Asset Management (2013-2015); President, JPMorgan Funds (2010-2013); Chief Administrative Officer (2004-2013); various other positions including Treasurer and Board Liaison (since 2001). | | | 87 | | | None. | |
Michael E. Nugent
522 Fifth Avenue
New York, NY 10036
Birth Year 1936 | | Chair of the Board and Director | | Chair of the Boards since July 2006 and Director since July 1991 | | Chair of the Boards of various Morgan Stanley Funds (since July 2006); Chairperson of the Governance Committee (since January 2019) and Director or Trustee of various Morgan Stanley Funds (since July 1991); formerly, Chairperson of each of the Closed-End Fund committee (until December 2019) and the Insurance Committee (until July 2006); General Partner, Triumph Capital, L.P. (private investment partnership) (1988-2013). | | | 86 | | | None. | |
W. Allen Reed
c/o Perkins Coie LLP
Counsel to the Independent Directors
1155 Avenue of the Americas
New York, NY 10036
Birth Year 1947 | | Vice Chair of the Board and Director | | Vice Chair of the Boards since January 2020 and Director since August 2006 | | Chairperson of the Equity Sub-Committee of the Investment Committee (since October 2006) and Director or Trustee of various Morgan Stanley Funds (since August 2006); formerly, President and CEO of General Motors Asset Management; Chairman and Chief Executive Officer of the GM Trust Bank and Corporate Vice President of General Motors Corporation (August 1994-December 2005). | | | 86 | | | Formerly, Director of Legg Mason, Inc.; formerly, Director of the Auburn University Foundation (2010-2015). | |
* This is the earliest date the Director began serving the Morgan Stanley Funds. Each Director serves an indefinite term, until his or her successor is elected.
** The Fund Complex includes (as of December 31, 2019) all open-end and closed-end funds (including all of their portfolios) advised by Morgan Stanley Investment Management Inc. (the "Adviser") and any funds that have an adviser that is an affiliated person of the Adviser (including, but not limited to, Morgan Stanley AIP GP LP).
*** This includes any directorships at public companies and registered investment companies held by the Director at any time during the past five years.
34
Morgan Stanley Institutional Fund, Inc.
Annual Report — December 31, 2019
Director and Officer Information (unaudited) (cont'd)
Executive Officers:
Name, Birth Year and Address of
Executive Officer | | Position(s)
Held with
Registrant | | Length of Time
Served* | | Principal Occupation(s) During Past 5 Years | |
John H. Gernon
522 Fifth Avenue
New York, NY 10036
Birth Year 1963 | | President and Principal Executive Officer | | Since September 2013 | | President and Principal Executive Officer of the Equity and Fixed Income Funds and the Morgan Stanley AIP Funds (since September 2013) and the Liquidity Funds and various money market funds (since May 2014) in the Fund Complex; Managing Director of the Adviser; Head of Product (since 2006). | |
Timothy J. Knierim
522 Fifth Avenue
New York, NY 10036
Birth Year 1959 | | Chief Compliance Officer | | Since December 2016 | | Managing Director of the Adviser and various entities affiliated with the Adviser; Chief Compliance Officer of various Morgan Stanley Funds and the Adviser (since December 2016) and Chief Compliance Officer of Morgan Stanley AIP GP LP (since 2014). Formerly, Managing Director and Deputy Chief Compliance Officer of the Adviser (2014-2016); and formerly, Chief Compliance Officer of Prudential Investment Management, Inc. (2007-2014). | |
Francis J. Smith
522 Fifth Avenue
New York, NY 10036
Birth Year 1965 | | Treasurer and Principal Financial Officer | | Treasurer since July 2003 and Principal Financial Officer since September 2002 | | Managing Director of the Adviser and various entities affiliated with the Adviser; Treasurer (since July 2003) and Principal Financial Officer of various Morgan Stanley Funds (since September 2002). | |
Mary E. Mullin
522 Fifth Avenue
New York, NY 10036
Birth Year 1967 | | Secretary | | Since June 1999 | | Managing Director of the Adviser; Secretary of various Morgan Stanley Funds (since June 1999). | |
Michael J. Key
522 Fifth Avenue
New York, NY 10036
Birth Year 1979 | | Vice President | | Since June 2017 | | Vice President of the Equity and Fixed Income Funds, Liquidity Funds, various money market funds and the Morgan Stanley AIP Funds in the Fund Complex (since June 2017); Executive Director of the Adviser; Head of Product Development for Equity and Fixed Income Funds (since August 2013). | |
* This is the earliest date the officer began serving the Morgan Stanley Funds. Each officer serves a one-year term, until his or her successor is elected and qualifies.
35
Morgan Stanley Institutional Fund, Inc.
Annual Report — December 31, 2019
Adviser and Administrator
Morgan Stanley Investment Management Inc.
522 Fifth Avenue
New York, New York 10036
Distributor
Morgan Stanley Distribution, Inc.
522 Fifth Avenue
New York, New York 10036
Dividend Disbursing and Transfer Agent
DST Asset Manager Solutions, Inc.
2000 Crown Colony Drive
Quincy, Massachusetts 02169
Custodian
State Street Bank and Trust Company
One Lincoln Street
Boston, Massachusetts 02111
Legal Counsel
Dechert LLP
1095 Avenue of the Americas
New York, New York 10036
Counsel to the Independent Directors
Perkins Coie LLP
1155 Avenue of the Americas
New York, New York 10036
Independent Registered Public Accounting Firm
Ernst & Young LLP
200 Clarendon Street
Boston, Massachusetts 02116
Reporting to Shareholders
Each Morgan Stanley fund provides a complete schedule of portfolio holdings in its Semi-Annual and the Annual Reports within 60 days of the end of the fund's second and fourth fiscal quarters. The Semi-Annual and Annual Reports are filed electronically with the Securities and Exchange Commission ("SEC") on Form N-CSRS and Form N-CSR, respectively. Morgan Stanley also delivers the Semi-Annual and Annual Reports to fund shareholders and makes these reports available on its public website, www.morganstanley.com/im/shareholderreports. Each Morgan Stanley non-money market fund also files a complete schedule of portfolio holdings with the SEC for the fund's first and third fiscal quarters as an attachment to Form N-PORT. Morgan Stanley does not deliver the reports for the first and third fiscal quarters to shareholders, nor are the reports posted to the Morgan Stanley public website. However, the holdings for each money market fund are posted to the Morgan Stanley public website. You may obtain the Form N-PORT filings (as well as the Form N-CSR and N-CSRS filings) by accessing the SEC's website, www.sec.gov. You can also request copies of these materials, upon payment of a duplicating fee, by electronic request at the SEC's email address (publicinfo@sec.gov).
Proxy Voting Policies and Procedures and Proxy Voting Record
You may obtain a copy of the Company's Proxy Voting Policy and Procedures and information regarding how the Company voted proxies relating to portfolio securities during the most recent twelve-month period ended June 30, without charge, upon request, by calling toll free 1 (800) 548-7786 or by visiting our website at www.morganstanley.com/im/shareholderreports. This information is also available on the SEC's website at www.sec.gov.
This report is authorized for distribution only when preceded or accompanied by a prospectus or summary prospectus of the applicable fund of Morgan Stanley Institutional Fund, Inc., which describes in detail the fund's investment policies, risks, fees and expenses. Please read the prospectus carefully before you invest or send money. For additional information, including information regarding the investments comprising the Fund, please visit our website at www.morganstanley.com/im/shareholderreports or call toll free 1 (800) 548-7786.
36
Printed in U.S.A.
This Report has been prepared for shareholders and may be distributed to others only if preceded or accompanied by a current prospectus.
Morgan Stanley Investment Management Inc.
522 Fifth Avenue
New York, New York 10036
© 2020 Morgan Stanley. Morgan Stanley Distribution, Inc.

IFIIAANN
2920394 EXP. 02.28.21

Morgan Stanley Institutional Fund, Inc.
International Equity Portfolio
Annual Report
December 31, 2019
Beginning on January 1, 2021, as permitted by regulations adopted by the Securities and Exchange Commission ("SEC"), paper copies of the Fund's Annual and Semi-Annual Reports to Shareholders ("Shareholder Reports") will no longer be sent by mail, unless you specifically request paper copies of the Shareholder Reports from the Fund or from your financial intermediary, such as a broker-dealer or a bank. Instead, the Shareholder Reports will be made available on the Fund's website, https://www.morganstanley.com/im/shareholderreports and you will be notified by mail each time a Shareholder Report is posted and provided with a website link to access the Shareholder Report. If you already elected to receive Shareholder Reports electronically, you will not be affected by this change and you need not take any action. You may elect to receive Shareholder Reports and other communications from the Fund electronically anytime by contacting your financial intermediary or, if you are a direct investor, please follow the instructions on the envelope.
Beginning on January 1, 2019, you may elect to receive all future Shareholder Reports in paper free of charge. If you invest through a financial intermediary, you can contact your financial intermediary to request that you continue to receive paper copies of your Shareholder Reports. If you invest directly with the Fund, please follow the instructions on the envelope to let the Fund know you wish to continue receiving paper copies of your Shareholder Reports. Your election to receive Shareholder Reports in paper will apply to all funds held in your account if you invest through your financial intermediary or all funds held with the fund complex if you invest directly with a fund.

Morgan Stanley Institutional Fund, Inc.
Annual Report — December 31, 2019
Shareholders' Letter | | | 2 | | |
Expense Example | | | 3 | | |
Investment Overview | | | 4 | | |
Portfolio of Investments | | | 8 | | |
Statement of Assets and Liabilities | | | 10 | | |
Statement of Operations | | | 12 | | |
Statements of Changes in Net Assets | | | 13 | | |
Financial Highlights | | | 15 | | |
Notes to Financial Statements | | | 20 | | |
Report of Independent Registered Public Accounting Firm | | | 27 | | |
Federal Tax Notice | | | 28 | | |
Privacy Notice | | | 29 | | |
Director and Officer Information | | | 31 | | |
This report is authorized for distribution only when preceded or accompanied by a prospectus or summary prospectus of the applicable Fund of Morgan Stanley Institutional Fund, Inc. To receive a prospectus and/or statement of additional information ("SAI"), which contains more complete information such as investment objectives, charges, expenses, policies for voting proxies, risk considerations and describes in detail each of the Fund's investment policies to the prospective investor, please call toll free 1 (800) 548-7786. Please read the prospectuses carefully before you invest or send money.
Additionally, you can access information about the Fund, including performance, characteristics and investment team commentary, through Morgan Stanley Investment Management's website: www.morganstanley.com/im/shareholderreports.
Market forecasts provided in this report may not necessarily come to pass. There is no guarantee that any sectors mentioned will continue to perform as discussed herein or that securities in such sectors will be held by the Fund in the future. There is no assurance that a fund will achieve its investment objective. Funds are subject to market risk, which is the possibility that market values of securities owned by the Fund will decline and, therefore, the value of the Fund's shares may be less than what you paid for them. Accordingly, you can lose money investing in this Fund. Please see the prospectus for more complete information on investment risks.
1
Morgan Stanley Institutional Fund, Inc.
Annual Report — December 31, 2019
Shareholders' Letter (unaudited)
Dear Shareholders,
We are pleased to provide this Annual Report, in which you will learn how your investment in International Equity Portfolio (the "Fund") performed during the latest twelve-month period.
Morgan Stanley Investment Management is a client-centric, investor-led organization. Our global presence, intellectual capital, and breadth of products and services enable us to partner with investors to meet the evolving challenges of today's financial markets. We aim to deliver superior investment service and to empower our clients to make the informed decisions that help them reach their investment goals.
As always, we thank you for selecting Morgan Stanley Investment Management, and look forward to working with you in the months and years ahead.
Sincerely,

John H. Gernon
President and Principal Executive Officer
January 2020
2
Morgan Stanley Institutional Fund, Inc.
Annual Report — December 31, 2019
Expense Example (unaudited)
International Equity Portfolio
As a shareholder of the Fund, you incur two types of costs: (1) transactional costs, including redemption fees; and (2) ongoing costs, which may include advisory fees, administration fees, distribution and shareholder services fees and other Fund expenses. This example is intended to help you understand your ongoing costs (in dollars) of investing in the Fund and to compare these costs with the ongoing costs of investing in other mutual funds.
This example is based on an investment of $1,000 invested at the beginning of the six-month period ended December 31, 2019 and held for the entire six-month period.
Actual Expenses
The table below provides information about actual account values and actual expenses. You may use the information in this table, together with the amount you invested, to estimate the expenses that you paid over the period. Simply divide your account value by $1,000 (for example, an $8,600 account value divided by $1,000 = 8.6), then multiply the result by the number in the table under the heading entitled "Actual Expenses Paid During Period" to estimate the expenses you paid on your account during this period.
Hypothetical Example for Comparison Purposes
The table below provides information about hypothetical account values and hypothetical expenses based on the Fund's actual expense ratio and an assumed rate of return of 5% per year before expenses, which is not the Fund's actual return. The hypothetical account values and expenses may not be used to estimate the actual ending account balance or expenses you paid for the period. You may use this information to compare the ongoing costs of investing in the Fund and other funds. To do so, compare this 5% hypothetical example with the 5% hypothetical examples that appear in the shareholder reports of the other funds.
Please note that the expenses shown in the table are meant to highlight your ongoing costs only and do not reflect any transactional costs, such as sales charges (loads) and redemption fees. Therefore, the information for each class in the table is useful in comparing ongoing costs only, and will not help you determine the relative total costs of owning different funds. In addition, if these transactional costs were included, your costs would have been higher.
| | | Beginning
Account
Value
7/1/19 | | Actual Ending
Account
Value
12/31/19 | | Hypothetical
Ending Account
Value | | Actual
Expenses
Paid
During
Period* | | Hypothetical
Expenses Paid
During Period* | | Net
Expense
Ratio
During
Period** | |
International Equity Portfolio Class I | | $ | 1,000.00 | | | $ | 1,055.80 | | | $ | 1,020.42 | | | $ | 4.92 | | | $ | 4.84 | | | | 0.95 | % | |
International Equity Portfolio Class A | | | 1,000.00 | | | | 1,054.90 | | | | 1,019.21 | | | | 6.16 | | | | 6.06 | | | | 1.19 | | |
International Equity Portfolio Class L | | | 1,000.00 | | | | 1,052.20 | | | | 1,016.23 | | | | 9.21 | | | | 9.05 | | | | 1.78 | | |
International Equity Portfolio Class C | | | 1,000.00 | | | | 1,050.50 | | | | 1,014.87 | | | | 10.60 | | | | 10.41 | | | | 2.05 | | |
International Equity Portfolio Class IS | | | 1,000.00 | | | | 1,056.20 | | | | 1,020.62 | | | | 4.72 | | | | 4.63 | | | | 0.91 | | |
* Expenses are calculated using each Fund Class' annualized net expense ratio (as disclosed), multiplied by the average account value over the period and multiplied by 184/365 (to reflect the most recent one-half year period).
** Annualized.
3
Morgan Stanley Institutional Fund, Inc.
Annual Report — December 31, 2019
Investment Overview (unaudited)
International Equity Portfolio
The Fund seeks long-term capital appreciation by investing primarily in equity securities of non-U.S. issuers.
Performance
For the fiscal year ended December 31, 2019, the Fund's Class I shares had a total return based on net asset value and reinvestment of distributions per share of 20.37%, net of fees. The Fund's Class I shares underperformed the Fund's benchmark, the MSCI EAFE Index (the "Index"), which returned 22.01%.
Please keep in mind that double-digit returns are highly unusual and cannot be sustained. Investors should also be aware that these returns were primarily achieved during favorable market conditions.
Factors Affecting Performance
• The strong fourth quarter rounded off a strong year, with the Index finishing up 22.0% in U.S. dollars (USD). The strongest sectors were generally cyclical, with information technology up 38%, while industrials (+26%) and consumer discretionary (+25%) also beat the index. Health care (+31%) benefited from an easing of U.S. political fears. At the other end of the spectrum, energy (+8%) clearly struggled, while defensives such as communication services (+13%), consumer staples and utilities (both +19%) were also behind the index, along with financials (+18%), which had to deal with the low interest rate environment. In geographic terms, the laggards were often affected by political uncertainty, noticeably Hong Kong (+10%) and Spain (+12%), while the increased clarity at the end of the year helped the U.K. (+21%) recover. Leading markets included the Netherlands (+32%) and Switzerland (+32%), while Italy (+27%) and Canada (+27%) also performed well. The U.S. (+31%) again outperformed EAFE. Country returns are represented by the respective MSCI country indexes in U.S. dollars.
• For the year, the Fund's stock selection was negative, as the underperformance in consumer staples and health care outweighed the outperformance in information technology and financials. Sector allocation was roughly neutral, thanks to the overweights in health care and
information technology, despite the drag from the small cash allocation in a strong year for markets and the overweight in consumer staples.
Management Strategies
• As simple souls we attempt to disaggregate investing into earnings and multiples. Concerned as we are with the preservation of capital, we maintain that there are only two ways to lose money in equities; if the earnings go away, or the multiple goes away. While our daily business is at the stock level, we also attempt to apply this logic to markets as a whole. At the end of 2017, our concern was multiples, with the MSCI World Index on 17.0x forward consensus estimates.(i) This fear proved well founded, as 2018 was a down year despite double-digit earnings growth as the market de-rated to 13.4x.(i) Given this de-rating, our concern for 2019 switched to earnings and... we were a quarter right! We say a quarter, as we were half right on earnings, which mildly disappointed being down a fraction for the year rather than the expected 7% rise, but did not foresee that the multiple would bounce back to 17.0x.(i) If we disaggregate the 2019 return of 28% for the MSCI World Index, a massive 26% came from the re-rating, –1% from earnings, with the remainder from dividends.(i) This is an extreme example of the pattern since 2012, where more of the market return has come from multiple expansion than earnings growth, with only 2017 offering a strong return year driven by earnings.
• This significant re-rating implies a large increase in optimism during 2019. This was clearly not driven by the actual earnings, which disappointed in 2019 and have yet to revive, but rather by hopes for the future. Monetary policy was one clear shift. The U.S. Federal Reserve's (the Fed) raising cycle, which saw four rises in 2018 amidst talk of "normalization," ended in December of that year, and 2019 saw three cuts, along with more dovish noises, and a return to a growing balance sheet as it battled the crisis in the repo market. The European Central Bank (ECB) and the People's Bank of China have followed suit in easing monetary conditions in an attempt to boost growth. Markets were also helped by a reduction in fears about a trade war between the U.S. and China, with talk of
i Source: FactSet, December 2019.
4
Morgan Stanley Institutional Fund, Inc.
Annual Report — December 31, 2019
Investment Overview (unaudited) (cont'd)
International Equity Portfolio
an imminent "Phase 1" deal, which would at least imply a truce.
• So where does this revival of market morale leave us for 2020? Frankly, we are now nervous about both multiples and earnings. The fears about multiples is natural enough, with the MSCI World Index back up to 17.0x, and this time without the benefit of the imminent earnings boost from the Trump tax cuts that it had in early 2018. Even putting the risk of multiple compression to one side, it is tough to see how there can be much mileage for the markets from expanding multiples; a 10% boost would require the MSCI World Index to be on close to 19x!
• This leaves earnings as the main potential driver of any significant upside for markets, and here we are skeptical for the broad market in the medium term. It may well be that an industrial recovery can drive progress in 2020, but our structural concerns remain. Our anxiety is based on the fact that most of the levers for earnings growth have been pulled hard already, particularly in the U.S., leaving limited opportunity for them to help further, and skewing the risk to the downside. Margins are high, as corporates have been advantaged relative to labor, given globalization and the political move to the right over the last few decades, and also relative to consumers, given the falling role of anti-trust. Profits have also been boosted by low interest rates and increased leverage, decreasing interest payments and allowing earnings-per-share-boosting buybacks. On top of all this, the gap between the "adjusted" numbers, used for consensus and paying management, and the actual profit at the bottom of the income statement has ballooned, reaching $600 billion over(ii) the last three years in the U.S. alone. These are all tailwinds for earnings over the last few years that are unlikely to be repeated, and may turn into headwinds if they go into reverse.
• This may not matter in 2020. It is quite possible that the U.S. can continue to steer between the Scylla of recession and the Charybdis of inflation, delivering economic and earnings growth without the Fed having to tighten and end the party. With the MSCI U.S.A. Index earnings multiple now at 18.7x, and double-digit earnings growth forecast for
2020 after the slight fall in 2019(4), success seems to be what the market is expecting.
• Arguably EAFE looks better placed than the U.S., not least due to valuation, given its record 20% discount.(i) Europe looks more reasonably priced, at a "mere" 14.6x,(i) as there is far less optimism about growth. Part of this is down to the relative shortage of fast growing technology companies, but it is also down to the continent as a whole being mired in very slow growth. Here, there could be a positive story if there is a move towards fiscal reflation in 2020. The block, as ever, is Germany, given its balanced budget requirement, but if this is eased, perhaps using the need for infrastructure to deal with the climate emergency as an excuse to issue green bonds, then this could drive faster growth, or at the very least the hope of faster growth, which may be all that is needed to drive a rally. The ECB under Christine Lagarde is likely to remain helpful. By contrast, it is probably fruitless to expect structural change in Japan, which at 14.3x(i) is marginally cheaper than Europe. However, having suffered a double-digit earnings fall in 2019, as industrial production struggled, it may well be a beneficiary of any industrial bounce-back.
• Alongside the U.S. premium to the rest of the developed world, growth is thriving relative to value, trading at a relative multiple not seen since the tech-media-telecom (TMT) bubble at the start of the millennium. We are relatively agnostic on the growth versus value debate, since we are less than fully convinced by either of them! Over the last couple of years we have reduced some of the faster growing stocks in the portfolio. As for value, it is the companies' prospects that often look relatively dim, with several of the struggling sectors facing genuine threats, be it trapped assets for energy or the rise of electric vehicles for autos. One "value" area where we have added is in European banks, where we have reduced the underweight versus the Index. Their net interest margins are indeed threatened by the chronic low interest rates, but valuations seem to assume a permanent Japanification of the system. Our view is that this is unduly pessimistic, as Europe is seeing both loan growth and much more appetite to protect lending margins.
i Source: FactSet, December 2019.
ii Source: FactSet, Morgan Stanley Investment Management, December 2019.
5
Morgan Stanley Institutional Fund, Inc.
Annual Report — December 31, 2019
Investment Overview (unaudited) (cont'd)
International Equity Portfolio
• The real skew in the portfolio is towards quality rather than either growth or value. We like companies with the intangible assets to give them the combination of recurring revenue and pricing power, along with the ability to sustain high returns on capital. One of the pluses they offer is resilience in tough times: the recurring revenue protects sales and the pricing power protects margins. In a time of heightened multiples and high uncertainty (uncertainty that is arguably not properly reflected in the markets), we would argue that it makes sense to go with the relative safety and durability of high-quality compounders. While it is an imperfect proxy, we would point to the significant overweights in both consumer staples and health care as evidence of the quality and defensive bias of the portfolio.

* Minimum Investment for Class I shares
In accordance with SEC regulations, the Fund's performance shown assumes that all recurring fees (including management fees) were deducted and all dividends and distributions were reinvested. The performance of Class A, L, C and IS shares will vary from the performance of Class I shares based upon their different inception dates and will be negatively impacted by additional fees assessed to those classes (if applicable).
6
Morgan Stanley Institutional Fund, Inc.
Annual Report — December 31, 2019
Investment Overview (unaudited) (cont'd)
International Equity Portfolio
Performance Compared to the MSCI EAFE Index(1) and the Lipper International Large-Cap Growth Funds Index(2)
| | | Period Ended December 31, 2019 | |
| | | Total Returns(3) | |
| | | | | Average Annual | |
| | | One
Year | | Five
Years | | Ten
Years | | Since
Inception(9) | |
Fund — Class I Shares w/o
sales charges(4) | | | 20.37 | % | | | 5.02 | % | | | 5.40 | % | | | 8.15 | % | |
Fund — Class A Shares w/o
sales charges(5) | | | 20.11 | | | | 4.68 | | | | 5.09 | | | | 7.14 | | |
Fund — Class A Shares with
maximum 5.25%
sales charges(5) | | | 13.84 | | | | 3.55 | | | | 4.53 | | | | 6.90 | | |
Fund — Class L Shares w/o
sales charges(6) | | | 19.48 | | | | 4.16 | | | | — | | | | 6.33 | | |
Fund — Class C Shares w/o
sales charges(8) | | | 19.18 | | | | — | | | | — | | | | 2.14 | | |
Fund — Class C Shares with
maximum 1.00% deferred
sales charges(8) | | | 18.18 | | | | — | | | | — | | | | 2.14 | | |
Fund — Class IS Shares w/o
sales charges(7) | | | 20.42 | | | | 5.06 | | | | — | | | | 4.15 | | |
MSCI EAFE Index | | | 22.01 | | | | 5.67 | | | | 5.50 | | | | 4.68 | | |
Lipper International
Large-Cap Growth
Funds Index | | | 27.56 | | | | 6.70 | | | | 6.55 | | | | N/A | | |
Performance data quoted represents past performance, which is no guarantee of future results, and current performance may be lower or higher than the figures shown. Performance assumes that all dividends and distributions, if any, were reinvested. For the most recent month-end performance figures, please visit www.morganstanley.com/im/shareholderreports. Investment return and principal value will fluctuate so that Fund shares, when redeemed, may be worth more or less than their original cost. Total returns do not reflect the deduction of taxes that a shareholder would pay on Fund distributions or the redemption of Fund shares. Performance of share classes will vary due to difference in sales charges and expenses.
(1) The MSCI EAFE Index (Europe, Australasia, Far East) is a free float-adjusted market capitalization index that is designed to measure the international equity market performance of developed markets, excluding the U.S. & Canada. The term "free float" represents the portion of shares outstanding that are deemed to be available for purchase in the public equity markets by investors. The MSCI EAFE Index currently consists of 21 developed market country indices. The performance of the Index is listed in U.S. dollars and assumes reinvestment of net dividends. Net total return indices reinvest dividends after the deduction of withholding taxes, using (for international indices) a tax rate applicable to non-resident institutional investors who do not benefit from double taxation treaties. The Index is unmanaged and its returns do not include any sales charges or fees. Such costs would lower performance. It is not possible to invest directly in an index.
(2) The Lipper International Large-Cap Growth Funds Index is an equally weighted performance index of the largest qualifying funds (based on net assets) in the Lipper International Large-Cap Growth Funds classification. The Index, which is adjusted for capital gains distributions and income dividends, is unmanaged and should not be considered an investment. There are currently 30 funds represented in this Index. As of the date of this report, the Fund was in the Lipper International Large-Cap Growth Funds classification.
(3) Total returns for the Fund reflect fees waived and expenses reimbursed, if applicable, by the Adviser (as defined herein). Without such waivers and reimbursements, total returns would have been lower.
(4) Commenced operations on August 4, 1989.
(5) Commenced offering on January 2, 1996.
(6) Commenced offering on June 14, 2012.
(7) Commenced offering on September 13, 2013.
(8) Commenced offering on April 30, 2015.
(9) For comparative purposes, average annual since inception returns listed for the Indexes refer to the inception date of Class I of the Fund, not the inception of the Index.
7
Morgan Stanley Institutional Fund, Inc.
Annual Report — December 31, 2019
Portfolio of Investments
International Equity Portfolio
| | | Shares | | Value
(000) | |
Common Stocks (98.1%) | |
Canada (6.1%) | |
Barrick Gold Corp. | | | 3,120,088 | | | $ | 57,954 | | |
Cameco Corp. (a) | | | 1,983,784 | | | | 17,629 | | |
Constellation Software, Inc. | | | 62,073 | | | | 60,286 | | |
| | | | 135,869 | | |
China (3.3%) | |
China Petroleum & Chemical Corp. H Shares (b) | | | 44,496,000 | | | | 26,781 | | |
Tencent Holdings Ltd. (b) | | | 960,300 | | | | 46,288 | | |
| | | | 73,069 | | |
Finland (1.0%) | |
Neste Oyj | | | 641,003 | | | | 22,307 | | |
France (14.9%) | |
AXA SA | | | 1,407,808 | | | | 39,652 | | |
L'Oreal SA | | | 75,693 | | | | 22,415 | | |
Pernod Ricard SA | | | 347,512 | | | | 62,135 | | |
Safran SA | | | 418,556 | | | | 64,626 | | |
Sanofi | | | 704,656 | | | | 70,837 | | |
Thales SA | | | 328,896 | | | | 34,132 | | |
TOTAL SA | | | 664,439 | | | | 36,669 | | |
| | | | 330,466 | | |
Germany (15.5%) | |
Bayer AG (Registered) | | | 642,866 | | | | 52,263 | | |
Deutsche Post AG (Registered) | | | 1,224,098 | | | | 46,545 | | |
Fresenius SE & Co., KGaA | | | 1,316,619 | | | | 74,091 | | |
HeidelbergCement AG | | | 272,229 | | | | 19,781 | | |
Henkel AG & Co., KGaA (Preference) | | | 729,500 | | | | 75,358 | | |
SAP SE | | | 560,456 | | | | 75,436 | | |
| | | | 343,474 | | |
Hong Kong (3.5%) | |
AIA Group Ltd. | | | 5,925,600 | | | | 62,204 | | |
Minth Group Ltd. | | | 4,254,000 | | | | 15,013 | | |
| | | | 77,217 | | |
Italy (0.8%) | |
Intesa Sanpaolo SpA | | | 7,038,839 | | | | 18,542 | | |
Japan (11.2%) | |
FANUC Corp. | | | 142,300 | | | | 26,278 | | |
Hoya Corp. | | | 354,000 | | | | 33,794 | | |
Keyence Corp. | | | 81,200 | | | | 28,513 | | |
Kirin Holdings Co., Ltd. | | | 2,858,500 | | | | 62,391 | | |
Lion Corp. | | | 1,107,500 | | | | 21,528 | | |
Shiseido Co., Ltd. | | | 344,900 | | | | 24,491 | | |
Sumitomo Mitsui Financial Group, Inc. | | | 780,851 | | | | 28,841 | | |
Toyota Motor Corp. | | | 116,700 | | | | 8,223 | | |
USS Co., Ltd. | | | 723,900 | | | | 13,684 | | |
| | | | 247,743 | | |
Korea, Republic of (3.0%) | |
LG Household & Health Care Ltd. | | | 31,921 | | | | 34,674 | | |
Samsung Electronics Co., Ltd. | | | 650,854 | | | | 31,363 | | |
| | | | 66,037 | | |
| | | Shares | | Value
(000) | |
Netherlands (5.7%) | |
Heineken N.V. | | | 549,645 | | | $ | 58,522 | | |
ING Groep N.V. | | | 2,769,523 | | | | 33,203 | | |
Unilever N.V. CVA | | | 585,477 | | | | 33,644 | | |
| | | | 125,369 | | |
Norway (0.7%) | |
Mowi ASA | | | 632,021 | | | | 16,433 | | |
Portugal (0.4%) | |
Banco Comercial Portugues SA | | | 36,014,662 | | | | 8,193 | | |
Singapore (1.3%) | |
United Overseas Bank Ltd. | | | 1,529,300 | | | | 30,030 | | |
Spain (1.3%) | |
Banco Bilbao Vizcaya Argentaria SA | | | 706,347 | | | | 3,948 | | |
Bankinter SA | | | 3,313,918 | | | | 24,281 | | |
| | | | 28,229 | | |
Sweden (1.2%) | |
Hexagon AB, Class B | | | 475,170 | | | | 26,634 | | |
Switzerland (4.9%) | |
Alcon, Inc. (c) | | | 151,102 | | | | 8,559 | | |
Novartis AG (Registered) | | | 637,499 | | | | 60,365 | | |
Roche Holding AG (Genusschein) | | | 119,474 | | | | 38,829 | | |
| | | | 107,753 | | |
Taiwan (1.4%) | |
Taiwan Semiconductor Manufacturing
Co., Ltd. ADR | | | 535,119 | | | | 31,090 | | |
United Kingdom (21.9%) | |
Ashtead Group PLC | | | 752,965 | | | | 24,077 | | |
Aviva PLC | | | 1,672,889 | | | | 9,278 | | |
British American Tobacco PLC | | | 1,512,889 | | | | 64,759 | | |
Experian PLC | | | 473,149 | | | | 15,994 | | |
GlaxoSmithKline PLC | | | 3,259,249 | | | | 76,803 | | |
Imperial Brands PLC | | | 1,957,092 | | | | 48,451 | | |
M&G PLC (c) | | | 3,053,548 | | | | 9,594 | | |
Man Group PLC | | | 7,879,214 | | | | 16,490 | | |
Prudential PLC | | | 3,053,548 | | | | 58,608 | | |
Reckitt Benckiser Group PLC | | | 1,136,473 | | | | 92,264 | | |
RELX PLC (Euronext N.V.) | | | 1,490,035 | | | | 37,539 | | |
RELX PLC (LSE) | | | 1,244,326 | | | | 31,407 | | |
| | | | 485,264 | | |
Total Common Stocks (Cost $1,597,168) | | | 2,173,719 | | |
Short-Term Investment (1.5%) | |
Investment Company (1.5%) | |
Morgan Stanley Institutional Liquidity
Funds — Treasury Securities Portfolio —
Institutional Class (See Note G)
(Cost $33,370) | | | 33,370,029 | | | | 33,370 | | |
Total Investments (99.6%) (Cost $1,630,538)
Including $566 of Securities Loaned (d)(e) | | | 2,207,089 | | |
Other Assets in Excess of Liabilities (0.4%) | | | 8,378 | | |
Net Assets (100.0%) | | $ | 2,215,467 | | |
The accompanying notes are an integral part of the financial statements.
8
Morgan Stanley Institutional Fund, Inc.
Annual Report — December 31, 2019
Portfolio of Investments (cont'd)
International Equity Portfolio
Country assignments and aggregations are based generally on third party vendor classifications and information, and may be different from the assignments and aggregations under the policies set forth in the Fund's prospectus and/or statement of additional information relating to geographic classifications.
(a) All or a portion of this security was on loan at December 31, 2019.
(b) Security trades on the Hong Kong exchange.
(c) Non-income producing security.
(d) The approximate fair value and percentage of net assets, $848,923,000 and 38.3%, respectively, represent the securities that have been fair valued under the fair valuation policy for international investments as described in Note A-1 within the Notes to the Financial Statements.
(e) At December 31, 2019, the aggregate cost for federal income tax purposes is approximately $1,666,590,000. The aggregate gross unrealized appreciation is approximately $599,969,000 and the aggregate gross unrealized depreciation is approximately $59,470,000, resulting in net unrealized appreciation of approximately $540,499,000.
ADR American Depositary Receipt.
CVA Certificaten Van Aandelen.
Euronext
N.V. Euronext Amsterdam Stock Market.
LSE London Stock Exchange.
Portfolio Composition*
Classification | | Percentage of
Total Investments | |
Other** | | | 38.7 | % | |
Pharmaceuticals | | | 13.6 | | |
Household Products | | | 8.6 | | |
Beverages | | | 8.3 | | |
Insurance | | | 7.7 | | |
Banks | | | 6.7 | | |
Software | | | 6.1 | | |
Personal Products | | | 5.2 | | |
Tobacco | | | 5.1 | | |
Total Investments | | | 100.0 | % | |
* Percentages indicated are based upon total investments (excluding Securities held as Collateral on Loaned Securities) as of December 31, 2019.
** Industries and/or investment types representing less than 5% of total investments.
The accompanying notes are an integral part of the financial statements.
9
Morgan Stanley Institutional Fund, Inc.
Annual Report — December 31, 2019
International Equity Portfolio
Statement of Assets and Liabilities | | December 31, 2019
(000) | |
Assets: | |
Investments in Securities of Unaffiliated Issuers, at Value(1) (Cost $1,597,168) | | $ | 2,173,719 | | |
Investment in Security of Affiliated Issuer, at Value (Cost $33,370) | | | 33,370 | | |
Total Investments in Securities, at Value (Cost $1,630,538) | | | 2,207,089 | | |
Foreign Currency, at Value (Cost $2,116) | | | 2,139 | | |
Tax Reclaim Receivable | | | 8,136 | | |
Dividends Receivable | | | 3,042 | | |
Receivable for Fund Shares Sold | | | 729 | | |
Receivable from Affiliate | | | 43 | | |
Receivable from Securities Lending Income | | | 9 | | |
Other Assets | | | 237 | | |
Total Assets | | | 2,221,424 | | |
Liabilities: | |
Payable for Advisory Fees | | | 4,348 | | |
Payable for Fund Shares Redeemed | | | 852 | | |
Payable for Sub Transfer Agency Fees — Class I | | | 185 | | |
Payable for Sub Transfer Agency Fees — Class A | | | 30 | | |
Payable for Sub Transfer Agency Fees — Class L | | | — | @ | |
Payable for Sub Transfer Agency Fees — Class C | | | — | @ | |
Payable for Administration Fees | | | 150 | | |
Payable for Custodian Fees | | | 70 | | |
Payable for Shareholder Services Fees — Class A | | | 46 | | |
Payable for Distribution and Shareholder Services Fees — Class L | | | 4 | | |
Payable for Distribution and Shareholder Services Fees — Class C | | | 1 | | |
Payable for Professional Fees | | | 43 | | |
Payable for Transfer Agency Fees — Class I | | | 5 | | |
Payable for Transfer Agency Fees — Class A | | | 3 | | |
Payable for Transfer Agency Fees — Class L | | | 1 | | |
Payable for Transfer Agency Fees — Class C | | | — | @ | |
Payable for Transfer Agency Fees — Class IS | | | 1 | | |
Other Liabilities | | | 218 | | |
Total Liabilities | | | 5,957 | | |
Net Assets | | $ | 2,215,467 | | |
Net Assets Consist of: | |
Paid-in-Capital | | $ | 1,675,027 | | |
Total Distributable Earnings | | | 540,440 | | |
Net Assets | | $ | 2,215,467 | | |
The accompanying notes are an integral part of the financial statements.
10
Morgan Stanley Institutional Fund, Inc.
Annual Report — December 31, 2019
International Equity Portfolio
Statement of Assets and Liabilities (cont'd) | | December 31, 2019
(000) | |
CLASS I: | |
Net Assets | | $ | 1,539,709 | | |
| Shares Outstanding $0.001 par value shares of beneficial interest (unlimited shares authorized) (not in 000's) | | | 104,434,907 | | |
Net Asset Value, Offering and Redemption Price Per Share | | $ | 14.74 | | |
CLASS A: | |
Net Assets | | $ | 212,578 | | |
| Shares Outstanding $0.001 par value shares of beneficial interest (unlimited shares authorized) (not in 000's) | | | 14,494,140 | | |
Net Asset Value, Redemption Price Per Share | | $ | 14.67 | | |
Maximum Sales Load | | | 5.25 | % | |
Maximum Sales Charge | | $ | 0.81 | | |
Maximum Offering Price Per Share | | $ | 15.48 | | |
CLASS L: | |
Net Assets | | $ | 5,888 | | |
| Shares Outstanding $0.001 par value shares of beneficial interest (unlimited shares authorized) (not in 000's) | | | 406,180 | | |
Net Asset Value, Offering and Redemption Price Per Share | | $ | 14.50 | | |
CLASS C: | |
Net Assets | | $ | 674 | | |
| Shares Outstanding $0.001 par value shares of beneficial interest (unlimited shares authorized) (not in 000's) | | | 47,314 | | |
Net Asset Value, Offering and Redemption Price Per Share | | $ | 14.26 | | |
CLASS IS: | |
Net Assets | | $ | 456,618 | | |
| Shares Outstanding $0.001 par value shares of beneficial interest (unlimited shares authorized) (not in 000's) | | | 30,973,954 | | |
Net Asset Value, Offering and Redemption Price Per Share | | $ | 14.74 | | |
(1) Including:
Securities on Loan, at Value: | | $ | 566 | | |
@ Amount is less than $500.
The accompanying notes are an integral part of the financial statements.
11
Morgan Stanley Institutional Fund, Inc.
Annual Report — December 31, 2019
International Equity Portfolio
Statement of Operations | | Year Ended
December 31, 2019
(000) | |
Investment Income: | |
Dividends from Securities of Unaffiliated Issuers (Net of $5,930 of Foreign Taxes Withheld) | | $ | 65,074 | | |
Dividends from Security of Affiliated Issuer (Note G) | | | 707 | | |
Income from Securities Loaned — Net | | | 369 | | |
Total Investment Income | | | 66,150 | | |
Expenses: | |
Advisory Fees (Note B) | | | 18,739 | | |
Administration Fees (Note C) | | | 1,874 | | |
Sub Transfer Agency Fees — Class I | | | 1,450 | | |
Sub Transfer Agency Fees — Class A | | | 204 | | |
Sub Transfer Agency Fees — Class L | | | 4 | | |
Sub Transfer Agency Fees — Class C | | | 1 | | |
Shareholder Services Fees — Class A (Note D) | | | 593 | | |
Distribution and Shareholder Services Fees — Class L (Note D) | | | 45 | | |
Distribution and Shareholder Services Fees — Class C (Note D) | | | 7 | | |
Custodian Fees (Note F) | | | 270 | | |
Registration Fees | | | 120 | | |
Professional Fees | | | 107 | | |
Shareholder Reporting Fees | | | 84 | | |
Directors' Fees and Expenses | | | 63 | | |
Transfer Agency Fees — Class I (Note E) | | | 18 | | |
Transfer Agency Fees — Class A (Note E) | | | 12 | | |
Transfer Agency Fees — Class L (Note E) | | | 4 | | |
Transfer Agency Fees — Class C (Note E) | | | 2 | | |
Transfer Agency Fees — Class IS (Note E) | | | 2 | | |
Pricing Fees | | | 4 | | |
Other Expenses | | | 71 | | |
Expenses Before Non Operating Expenses | | | 23,674 | | |
Bank Overdraft Expense | | | 11 | | |
Total Expenses | | | 23,685 | | |
Reimbursement of Class Specific Expenses — Class I (Note B) | | | (823 | ) | |
Reimbursement of Class Specific Expenses — Class C (Note B) | | | (2 | ) | |
Reimbursement of Class Specific Expenses — Class IS (Note B) | | | (3 | ) | |
Rebate from Morgan Stanley Affiliate (Note G) | | | (67 | ) | |
Waiver of Advisory Fees (Note B) | | | (18 | ) | |
Net Expenses | | | 22,772 | | |
Net Investment Income | | | 43,378 | | |
Realized Gain (Loss): | |
Investments Sold | | | 159,311 | | |
Foreign Currency Translation | | | (317 | ) | |
Net Realized Gain | | | 158,994 | | |
Change in Unrealized Appreciation (Depreciation): | |
Investments | | | 245,518 | | |
Foreign Currency Translation | | | 87 | | |
Net Change in Unrealized Appreciation (Depreciation) | | | 245,605 | | |
Net Realized Gain and Change in Unrealized Appreciation (Depreciation) | | | 404,599 | | |
Net Increase in Net Assets Resulting from Operations | | $ | 447,977 | | |
The accompanying notes are an integral part of the financial statements.
12
Morgan Stanley Institutional Fund, Inc.
Annual Report — December 31, 2019
International Equity Portfolio
Statements of Changes in Net Assets | | Year Ended
December 31, 2019
(000) | | Year Ended
December 31, 2018
(000) | |
Increase (Decrease) in Net Assets: | |
Operations: | |
Net Investment Income | | $ | 43,378 | | | $ | 66,419 | | |
Net Realized Gain | | | 158,994 | | | | 397,017 | | |
Net Change in Unrealized Appreciation (Depreciation) | | | 245,605 | | | | (916,662 | ) | |
Net Increase (Decrease) in Net Assets Resulting from Operations | | | 447,977 | | | | (453,226 | ) | |
Dividends and Distributions to Shareholders: | |
Class I | | | (143,434 | ) | | | (239,211 | ) | |
Class A | | | (20,667 | ) | | | (35,769 | ) | |
Class L | | | (514 | ) | | | (631 | ) | |
Class C | | | (58 | ) | | | (98 | ) | |
Class IS | | | (43,082 | ) | | | (61,348 | ) | |
Total Dividends and Distributions to Shareholders | | | (207,755 | ) | | | (337,057 | ) | |
Capital Share Transactions:(1) | |
Class I: | |
Subscribed | | | 107,722 | | | | 851,975 | | |
Distributions Reinvested | | | 138,564 | | | | 226,885 | | |
Redeemed | | | (600,557 | ) | | | (503,337 | ) | |
Class A: | |
Subscribed | | | 15,796 | | | | 67,050 | | |
Distributions Reinvested | | | 20,480 | | | | 35,438 | | |
Redeemed | | | (92,281 | ) | | | (984,495 | ) | |
Class L: | |
Exchanged | | | 24 | | | | 1,371 | | |
Distributions Reinvested | | | 509 | | | | 624 | | |
Redeemed | | | (1,210 | ) | | | (1,549 | ) | |
Class C: | |
Subscribed | | | 41 | | | | 314 | | |
Distributions Reinvested | | | 58 | | | | 96 | | |
Redeemed | | | (280 | ) | | | (74 | ) | |
Class IS: | |
Subscribed | | | 15,435 | | | | 58,361 | | |
Distributions Reinvested | | | 37,186 | | | | 53,242 | | |
Redeemed | | | (105,825 | ) | | | (737,033 | ) | |
Net Decrease in Net Assets Resulting from Capital Share Transactions | | | (464,338 | ) | | | (931,132 | ) | |
Redemption Fees | | | 8 | | | | 24 | | |
Total Decrease in Net Assets | | | (224,108 | ) | | | (1,721,391 | ) | |
Net Assets: | |
Beginning of Period | | | 2,439,575 | | | | 4,160,966 | | |
End of Period | | $ | 2,215,467 | | | $ | 2,439,575 | | |
The accompanying notes are an integral part of the financial statements.
13
Morgan Stanley Institutional Fund, Inc.
Annual Report — December 31, 2019
International Equity Portfolio
Statements of Changes in Net Assets (cont'd) | | Year Ended
December 31, 2019
(000) | | Year Ended
December 31, 2018
(000) | |
(1) Capital Share Transactions: | |
Class I: | |
Shares Subscribed | | | 7,357 | | | | 48,024 | | |
Shares Issued on Distributions Reinvested | | | 9,420 | | | | 16,732 | | |
Shares Redeemed | | | (40,279 | ) | | | (30,945 | ) | |
Net Increase (Decrease) in Class I Shares Outstanding | | | (23,502 | ) | | | 33,811 | | |
Class A: | |
Shares Subscribed | | | 1,090 | | | | 4,034 | | |
Shares Issued on Distributions Reinvested | | | 1,400 | | | | 2,603 | | |
Shares Redeemed | | | (6,224 | ) | | | (57,785 | ) | |
Net Decrease in Class A Shares Outstanding | | | (3,734 | ) | | | (51,148 | ) | |
Class L: | |
Shares Exchanged | | | 2 | | | | 103 | | |
Shares Issued on Distributions Reinvested | | | 35 | | | | 47 | | |
Shares Redeemed | | | (84 | ) | | | (98 | ) | |
Net Increase (Decrease) in Class L Shares Outstanding | | | (47 | ) | | | 52 | | |
Class C: | |
Shares Subscribed | | | 3 | | | | 19 | | |
Shares Issued on Distributions Reinvested | | | 4 | | | | 7 | | |
Shares Redeemed | | | (20 | ) | | | (5 | ) | |
Net Increase (Decrease) in Class C Shares Outstanding | | | (13 | ) | | | 21 | | |
Class IS: | |
Shares Subscribed | | | 1,046 | | | | 3,302 | | |
Shares Issued on Distributions Reinvested | | | 2,528 | | | | 3,921 | | |
Shares Redeemed | | | (6,916 | ) | | | (41,355 | ) | |
Net Decrease in Class IS Shares Outstanding | | | (3,342 | ) | | | (34,132 | ) | |
The accompanying notes are an integral part of the financial statements.
14
Morgan Stanley Institutional Fund, Inc.
Annual Report — December 31, 2019
Financial Highlights
International Equity Portfolio
| | | Class I | |
| | | Year Ended December 31, | |
Selected Per Share Data and Ratios | | 2019 | | 2018 | | 2017 | | 2016(1) | | 2015 | |
Net Asset Value, Beginning of Period | | $ | 13.49 | | | $ | 17.97 | | | $ | 14.64 | | | $ | 15.10 | | | $ | 15.47 | | |
Income (Loss) from Investment Operations: | |
Net Investment Income(2) | | | 0.28 | | | | 0.31 | | | | 0.26 | | | | 0.27 | | | | 0.30 | | |
Net Realized and Unrealized Gain (Loss) | | | 2.47 | | | | (2.78 | ) | | | 3.41 | | | | (0.57 | ) | | | (0.23 | ) | |
Total from Investment Operations | | | 2.75 | | | | (2.47 | ) | | | 3.67 | | | | (0.30 | ) | | | 0.07 | | |
Distributions from and/or in Excess of: | |
Net Investment Income | | | (0.32 | ) | | | (0.39 | ) | | | (0.34 | ) | | | (0.16 | ) | | | (0.44 | ) | |
Net Realized Gain | | | (1.18 | ) | | | (1.62 | ) | | | — | | | | — | | | | — | | |
Total Distributions | | | (1.50 | ) | | | (2.01 | ) | | | (0.34 | ) | | | (0.16 | ) | | | (0.44 | ) | |
Redemption Fees | | | 0.00 | (3) | | | 0.00 | (3) | | | 0.00 | (3) | | | 0.00 | (3) | | | 0.00 | (3) | |
Net Asset Value, End of Period | | $ | 14.74 | | | $ | 13.49 | | | $ | 17.97 | | | $ | 14.64 | | | $ | 15.10 | | |
Total Return(4) | | | 20.37 | % | | | (13.80 | )% | | | 25.17 | % | | | (2.00 | )% | | | 0.36 | % | |
Ratios to Average Net Assets and Supplemental Data: | |
Net Assets, End of Period (Thousands) | | $ | 1,539,709 | | | $ | 1,725,392 | | | $ | 1,691,807 | | | $ | 1,719,699 | | | $ | 2,073,782 | | |
Ratio of Expenses Before Expense Limitation | | | 1.00 | % | | | 0.99 | % | | | 0.99 | % | | | 0.98 | % | | | 1.01 | % | |
Ratio of Expenses After Expense Limitation | | | 0.95 | %(5) | | | 0.95 | %(5) | | | 0.95 | %(5) | | | 0.95 | %(5) | | | 0.95 | %(5) | |
Ratio of Expenses After Expense Limitation Excluding Non Operating Expenses | | | 0.95 | %(5) | | | N/A | | | | N/A | | | | 0.95 | %(5) | | | 0.95 | %(5) | |
Ratio of Net Investment Income | | | 1.86 | %(5) | | | 1.82 | %(5) | | | 1.54 | %(5) | | | 1.86 | %(5) | | | 1.85 | %(5) | |
Ratio of Rebate from Morgan Stanley Affiliates | | | 0.00 | %(6) | | | 0.00 | %(6) | | | 0.00 | %(6) | | | 0.00 | %(6) | | | 0.00 | %(6) | |
Portfolio Turnover Rate | | | 20 | % | | | 34 | % | | | 18 | % | | | 33 | % | | | 29 | % | |
(1) Reflects prior period custodian out-of-pocket expenses that were reimbursed in September 2016. The amount of the reimbursement was immaterial on a per share basis and did not impact the total return of Class I shares. The Ratio of Expenses After Expense Limitation and the Ratio of Net Investment Income would be unchanged as the reimbursement of custodian fees was offset against expense waivers/reimbursements with no impact to net expenses or net investment income.
(2) Per share amount is based on average shares outstanding.
(3) Amount is less than $0.005 per share.
(4) Calculated based on the net asset value as of the last business day of the period.
(5) The Ratio of Expenses After Expense Limitation and Ratio of Net Investment Income reflect the rebate of certain Fund expenses in connection with the investments in Morgan Stanley affiliates during the period. The effect of the rebate on the ratios is disclosed in the above table as "Ratio of Rebate from Morgan Stanley Affiliates."
(6) Amount is less than 0.005%.
The accompanying notes are an integral part of the financial statements.
15
Morgan Stanley Institutional Fund, Inc.
Annual Report — December 31, 2019
Financial Highlights
International Equity Portfolio
| | | Class A | |
| | | Year Ended December 31, | |
Selected Per Share Data and Ratios | | 2019 | | 2018 | | 2017 | | 2016(1) | | 2015 | |
Net Asset Value, Beginning of Period | | $ | 13.42 | | | $ | 17.75 | | | $ | 14.46 | | | $ | 14.91 | | | $ | 15.28 | | |
Income (Loss) from Investment Operations: | |
Net Investment Income(2) | | | 0.24 | | | | 0.32 | | | | 0.19 | | | | 0.23 | | | | 0.24 | | |
Net Realized and Unrealized Gain (Loss) | | | 2.46 | | | | (2.82 | ) | | | 3.38 | | | | (0.58 | ) | | | (0.23 | ) | |
Total from Investment Operations | | | 2.70 | | | | (2.50 | ) | | | 3.57 | | | | (0.35 | ) | | | 0.01 | | |
Distributions from and/or in Excess of: | |
Net Investment Income | | | (0.27 | ) | | | (0.21 | ) | | | (0.28 | ) | | | (0.10 | ) | | | (0.38 | ) | |
Net Realized Gain | | | (1.18 | ) | | | (1.62 | ) | | | — | | | | — | | | | — | | |
Total Distributions | | | (1.45 | ) | | | (1.83 | ) | | | (0.28 | ) | | | (0.10 | ) | | | (0.38 | ) | |
Redemption Fees | | | 0.00 | (3) | | | 0.00 | (3) | | | 0.00 | (3) | | | 0.00 | (3) | | | 0.00 | (3) | |
Net Asset Value, End of Period | | $ | 14.67 | | | $ | 13.42 | | | $ | 17.75 | | | $ | 14.46 | | | $ | 14.91 | | |
Total Return(4) | | | 20.11 | % | | | (14.13 | )% | | | 24.77 | % | | | (2.33 | )% | | | (0.02 | )% | |
Ratios to Average Net Assets and Supplemental Data: | |
Net Assets, End of Period (Thousands) | | $ | 212,578 | | | $ | 244,622 | | | $ | 1,231,279 | | | $ | 1,176,835 | | | $ | 1,369,566 | | |
Ratio of Expenses Before Expense Limitation | | | 1.25 | % | | | 1.31 | % | | | 1.31 | % | | | 1.30 | % | | | 1.32 | % | |
Ratio of Expenses After Expense Limitation | | | 1.25 | %(5) | | | 1.30 | %(5) | | | 1.30 | %(5) | | | 1.29 | %(5) | | | 1.30 | %(5) | |
Ratio of Expenses After Expense Limitation Excluding Non Operating Expenses | | | 1.25 | %(5) | | | N/A | | | | N/A | | | | 1.29 | %(5) | | | 1.30 | %(5) | |
Ratio of Net Investment Income | | | 1.62 | %(5) | | | 1.83 | % | | | 1.16 | % | | | 1.60 | % | | | 1.48 | % | |
Ratio of Rebate from Morgan Stanley Affiliates | | | 0.00 | %(6) | | | 0.00 | %(6) | | | 0.00 | %(6) | | | 0.01 | % | | | 0.00 | %(6) | |
Portfolio Turnover Rate | | | 20 | % | | | 34 | % | | | 18 | % | | | 33 | % | | | 29 | % | |
(1) Reflects prior period custodian out-of-pocket expenses that were reimbursed in September 2016. The amount of the reimbursement was immaterial on a per share basis and did not impact the total return of Class A shares. The Ratio of Expenses After Expense Limitation would have been less than 0.005% higher and the Ratio of Net Investment Income would have been less than 0.005% lower had the custodian not reimbursed the Fund.
(2) Per share amount is based on average shares outstanding.
(3) Amount is less than $0.005 per share.
(4) Calculated based on the net asset value which does not reflect sales charges, if applicable, as of the last business day of the period.
(5) The Ratio of Expenses After Expense Limitation and Ratio of Net Investment Income reflect the rebate of certain Fund expenses in connection with the investments in Morgan Stanley affiliates during the period. The effect of the rebate on the ratios is disclosed in the above table as "Ratio of Rebate from Morgan Stanley Affiliates to Average Net Assets."
(6) Amount is less than 0.005%.
The accompanying notes are an integral part of the financial statements.
16
Morgan Stanley Institutional Fund, Inc.
Annual Report — December 31, 2019
Financial Highlights
International Equity Portfolio
| | | Class L | |
| | | Year Ended December 31, | |
Selected Per Share Data and Ratios | | 2019 | | 2018 | | 2017 | | 2016(1) | | 2015 | |
Net Asset Value, Beginning of Period | | $ | 13.28 | | | $ | 17.70 | | | $ | 14.43 | | | $ | 14.87 | | | $ | 15.23 | | |
Income (Loss) from Investment Operations: | |
Net Investment Income(2) | | | 0.15 | | | | 0.10 | | | | 0.11 | | | | 0.16 | | | | 0.15 | | |
Net Realized and Unrealized Gain (Loss) | | | 2.44 | | | | (2.66 | ) | | | 3.35 | | | | (0.58 | ) | | | (0.21 | ) | |
Total from Investment Operations | | | 2.59 | | | | (2.56 | ) | | | 3.46 | | | | (0.42 | ) | | | (0.06 | ) | |
Distributions from and/or in Excess of: | |
Net Investment Income | | | (0.19 | ) | | | (0.24 | ) | | | (0.19 | ) | | | (0.02 | ) | | | (0.30 | ) | |
Net Realized Gain | | | (1.18 | ) | | | (1.62 | ) | | | — | | | | — | | | | — | | |
Total Distributions | | | (1.37 | ) | | | (1.86 | ) | | | (0.19 | ) | | | (0.02 | ) | | | (0.30 | ) | |
Redemption Fees | | | 0.00 | (3) | | | 0.00 | (3) | | | 0.00 | (3) | | | 0.00 | (3) | | | 0.00 | (3) | |
Net Asset Value, End of Period | | $ | 14.50 | | | $ | 13.28 | | | $ | 17.70 | | | $ | 14.43 | | | $ | 14.87 | | |
Total Return(4) | | | 19.48 | % | | | (14.49 | )% | | | 24.06 | % | | | (2.82 | )% | | | (0.47 | )% | |
Ratios to Average Net Assets and Supplemental Data: | |
Net Assets, End of Period (Thousands) | | $ | 5,888 | | | $ | 6,022 | | | $ | 7,099 | | | $ | 7,008 | | | $ | 9,053 | | |
Ratio of Expenses Before Expense Limitation | | | 1.79 | % | | | N/A | | | | 1.90 | % | | | 1.93 | % | | | 1.89 | % | |
Ratio of Expenses After Expense Limitation | | | 1.78 | %(5) | | | 1.72 | %(5) | | | 1.80 | %(5) | | | 1.80 | %(5) | | | 1.80 | %(5) | |
Ratio of Expenses After Expense Limitation Excluding Non Operating Expenses | | | 1.78 | %(5) | | | N/A | | | | N/A | | | | 1.80 | %(5) | | | 1.80 | %(5) | |
Ratio of Net Investment Income | | | 1.06 | %(5) | | | 1.17 | %(5) | | | 0.69 | %(5) | | | 1.09 | %(5) | | | 0.97 | %(5) | |
Ratio of Rebate from Morgan Stanley Affiliates | | | 0.00 | %(6) | | | 0.00 | %(6) | | | 0.00 | %(6) | | | 0.00 | %(6) | | | 0.00 | %(6) | |
Portfolio Turnover Rate | | | 20 | % | | | 34 | % | | | 18 | % | | | 33 | % | | | 29 | % | |
(1) Reflects prior period custodian out-of-pocket expenses that were reimbursed in September 2016. The amount of the reimbursement was immaterial on a per share basis and did not impact the total return of Class L shares. The Ratio of Expenses After Expense Limitation and the Ratio of Net Investment Income would be unchanged as the reimbursement of custodian fees was offset against expense waivers/reimbursements with no impact to net expenses or net investment income.
(2) Per share amount is based on average shares outstanding.
(3) Amount is less than $0.005 per share.
(4) Calculated based on the net asset value as of the last business day of the period.
(5) The Ratio of Expenses After Expense Limitation and Ratio of Net Investment Income reflect the rebate of certain Fund expenses in connection with the investments in Morgan Stanley affiliates during the period. The effect of the rebate on the ratios is disclosed in the above table as "Ratio of Rebate from Morgan Stanley Affiliates."
(6) Amount is less than 0.005%.
The accompanying notes are an integral part of the financial statements.
17
Morgan Stanley Institutional Fund, Inc.
Annual Report — December 31, 2019
Financial Highlights
International Equity Portfolio
| | | Class C | |
| | | Year Ended December 31, | | Period from
April 30, 2015(2) to | |
Selected Per Share Data and Ratios | | 2019 | | 2018 | | 2017 | | 2016(1) | | December 31, 2015 | |
Net Asset Value, Beginning of Period | | $ | 13.08 | | | $ | 17.51 | | | $ | 14.31 | | | $ | 14.77 | | | $ | 16.70 | | |
Income (Loss) from Investment Operations: | |
Net Investment Income (Loss)(3) | | | 0.10 | | | | 0.05 | | | | 0.04 | | | | 0.14 | | | | (0.03 | ) | |
Net Realized and Unrealized Gain (Loss) | | | 2.41 | | | | (2.64 | ) | | | 3.35 | | | | (0.58 | ) | | | (1.53 | ) | |
Total from Investment Operations | | | 2.51 | | | | (2.59 | ) | | | 3.39 | | | | (0.44 | ) | | | (1.56 | ) | |
Distributions from and/or in Excess of: | |
Net Investment Income | | | (0.15 | ) | | | (0.22 | ) | | | (0.19 | ) | | | (0.02 | ) | | | (0.37 | ) | |
Net Realized Gain | | | (1.18 | ) | | | (1.62 | ) | | | — | | | | — | | | | — | | |
Total Distributions | | | (1.33 | ) | | | (1.84 | ) | | | (0.19 | ) | | | (0.02 | ) | | | (0.37 | ) | |
Redemption Fees | | | 0.00 | (4) | | | 0.00 | (4) | | | 0.00 | (4) | | | 0.00 | (4) | | | 0.00 | (4) | |
Net Asset Value, End of Period | | $ | 14.26 | | | $ | 13.08 | | | $ | 17.51 | | | $ | 14.31 | | | $ | 14.77 | | |
Total Return(5) | | | 19.18 | % | | | (14.82 | )% | | | 23.78 | % | | | (3.01 | )% | | | (9.41 | )%(8) | |
Ratios to Average Net Assets and Supplemental Data: | |
Net Assets, End of Period (Thousands) | | $ | 674 | | | $ | 787 | | | $ | 677 | | | $ | 476 | | | $ | 372 | | |
Ratio of Expenses Before Expense Limitation | | | 2.35 | % | | | 2.27 | % | | | 2.41 | % | | | 2.40 | % | | | 2.75 | %(9) | |
Ratio of Expenses After Expense Limitation | | | 2.05 | %(6) | | | 2.05 | %(6) | | | 2.05 | %(6) | | | 2.05 | %(6) | | | 2.05 | %(6)(9) | |
Ratio of Expenses After Expense Limitation Excluding Non Operating Expenses | | | 2.05 | %(6) | | | N/A | | | | N/A | | | | 2.05 | %(6) | | | 2.05 | %(6)(9) | |
Ratio of Net Investment Income (Loss) | | | 0.73 | %(6) | | | 0.83 | %(6) | | | 0.22 | %(6) | | | 0.95 | %(6) | | | (0.27 | )%(6)(9) | |
Ratio of Rebate from Morgan Stanley Affiliates | | | 0.00 | %(7) | | | 0.00 | %(7) | | | 0.00 | %(7) | | | 0.00 | %(7) | | | 0.00 | %(7)(9) | |
Portfolio Turnover Rate | | | 20 | % | | | 34 | % | | | 18 | % | | | 33 | % | | | 29 | % | |
(1) Reflects prior period custodian out-of-pocket expenses that were reimbursed in September 2016. The amount of the reimbursement was immaterial on a per share basis and did not impact the total return of Class C shares. The Ratio of Expenses After Expense Limitation and the Ratio of Net Investment Income would be unchanged as the reimbursement of custodian fees was offset against expense waivers/reimbursements with no impact to net expenses or net investment income.
(2) Commencement of Offering.
(3) Per share amount is based on average shares outstanding.
(4) Amount is less than $0.005 per share.
(5) Calculated based on the net asset value which does not reflect sales charges, if applicable, as of the last business day of the period.
(6) The Ratio of Expenses After Expense Limitation and Ratio of Net Investment Income (Loss) reflect the rebate of certain Fund expenses in connection with the investments in Morgan Stanley affiliates during the period. The effect of the rebate on the ratios is disclosed in the above table as "Ratio of Rebate from Morgan Stanley Affiliates."
(7) Amount is less than 0.005%.
(8) Not annualized.
(9) Annualized.
The accompanying notes are an integral part of the financial statements.
18
Morgan Stanley Institutional Fund, Inc.
Annual Report — December 31, 2019
Financial Highlights
International Equity Portfolio
| | | Class IS | |
| | | Year Ended December 31, | |
Selected Per Share Data and Ratios | | 2019 | | 2018 | | 2017 | | 2016(1) | | 2015 | |
Net Asset Value, Beginning of Period | | $ | 13.48 | | | $ | 17.97 | | | $ | 14.64 | | | $ | 15.10 | | | $ | 15.47 | | |
Income (Loss) from Investment Operations: | |
Net Investment Income(2) | | | 0.29 | | | | 0.38 | | | | 0.26 | | | | 0.29 | | | | 0.30 | | |
Net Realized and Unrealized Gain (Loss) | | | 2.48 | | | | (2.86 | ) | | | 3.42 | | | | (0.59 | ) | | | (0.23 | ) | |
Total from Investment Operations | | | 2.77 | | | | (2.48 | ) | | | 3.68 | | | | (0.30 | ) | | | 0.07 | | |
Distributions from and/or in Excess of: | |
Net Investment Income | | | (0.33 | ) | | | (0.39 | ) | | | (0.35 | ) | | | (0.16 | ) | | | (0.44 | ) | |
Net Realized Gain | | | (1.18 | ) | | | (1.62 | ) | | | — | | | | — | | | | — | | |
Total Distributions | | | (1.51 | ) | | | (2.01 | ) | | | (0.35 | ) | | | (0.16 | ) | | | (0.44 | ) | |
Redemption Fees | | | 0.00 | (3) | | | 0.00 | (3) | | | 0.00 | (3) | | | 0.00 | (3) | | | 0.00 | (3) | |
Net Asset Value, End of Period | | $ | 14.74 | | | $ | 13.48 | | | $ | 17.97 | | | $ | 14.64 | | | $ | 15.10 | | |
Total Return(4) | | | 20.42 | % | | | (13.76 | )% | | | 25.22 | % | | | (1.95 | )% | | | 0.40 | % | |
Ratios to Average Net Assets and Supplemental Data: | |
Net Assets, End of Period (Thousands) | | $ | 456,618 | | | $ | 462,752 | | | $ | 1,230,104 | | | $ | 1,058,165 | | | $ | 872,167 | | |
Ratio of Expenses Before Expense Limitation | | | 0.91 | % | | | N/A | | | | 0.91 | % | | | 0.91 | % | | | 0.91 | % | |
Ratio of Expenses After Expense Limitation | | | 0.91 | %(5) | | | 0.90 | %(5) | | | 0.91 | %(5) | | | 0.91 | %(5) | | | 0.91 | %(5) | |
Ratio of Expenses After Expense Limitation Excluding Non Operating Expenses | | | 0.91 | %(5) | | | N/A | | | | N/A | | | | 0.91 | %(5) | | | 0.91 | %(5) | |
Ratio of Net Investment Income | | | 1.94 | %(5) | | | 2.19 | %(5) | | | 1.52 | %(5) | | | 1.96 | %(5) | | | 1.84 | %(5) | |
Ratio of Rebate from Morgan Stanley Affiliates | | | 0.00 | %(6) | | | 0.00 | %(6) | | | 0.00 | %(6) | | | 0.00 | %(6) | | | 0.00 | %(6) | |
Portfolio Turnover Rate | | | 20 | % | | | 34 | % | | | 18 | % | | | 33 | % | | | 29 | % | |
(1) Reflects prior period custodian out-of-pocket expenses that were reimbursed in September 2016. The amount of the reimbursement was immaterial on a per share basis and did not impact the total return of Class IS shares. The Ratio of Expenses After Expense Limitation would have been less than 0.005% higher and the Ratio of Net Investment Income would have been less than 0.005% lower had the custodian not reimbursed the Fund.
(2) Per share amount is based on average shares outstanding.
(3) Amount is less than $0.005 per share.
(4) Calculated based on the net asset value as of the last business day of the period.
(5) The Ratio of Expenses After Expense Limitation and Ratio of Net Investment Income reflect the rebate of certain Fund expenses in connection with the investments in Morgan Stanley affiliates during the period. The effect of the rebate on the ratios is disclosed in the above table as "Ratio of Rebate from Morgan Stanley Affiliates."
(6) Amount is less than 0.005%.
The accompanying notes are an integral part of the financial statements.
19
Morgan Stanley Institutional Fund, Inc.
Annual Report — December 31, 2019
Notes to Financial Statements
Morgan Stanley Institutional Fund, Inc. (the "Company") is registered under the Investment Company Act of 1940, as amended (the "Act"), as an open-end management investment company. The Company is comprised of thirty-two separate, active, diversified and non-diversified funds (individually referred to as a "Fund," collectively as the "Funds"). The Company applies investment company accounting and reporting guidance.
The accompanying financial statements relate to the International Equity Portfolio. The Fund seeks long-term capital appreciation by investing primarily in equity securities of non-U.S. issuers.
The Fund offers five classes of shares — Class I, Class A, Class L, Class C and Class IS. On April 30, 2015, the Fund suspended offering of Class L shares. Existing Class L shareholders may invest through reinvestment of dividends and distributions.
A. Significant Accounting Policies: The following significant accounting policies are in conformity with U.S. generally accepted accounting principles ("GAAP"). Such policies are consistently followed by the Company in the preparation of its financial statements. GAAP may require management to make estimates and assumptions that affect the reported amounts and disclosures in the financial statements. Actual results may differ from those estimates.
In August 2018, the Financial Accounting Standards Board ("FASB") issued Accounting Standards Update ("ASU") 2018-13, Fair Value Measurement (Topic 820) — Disclosures Framework — Changes to Disclosure Requirements of Fair Value Measurement ("ASU 2018-13") which introduces new fair value disclosure requirements as well as eliminates and modifies certain existing fair value disclosure requirements. ASU 2018-13 would be effective for fiscal years beginning after December 15, 2019 and for interim periods within those fiscal years; however, management has elected to early adopt ASU 2018-13 as permitted by the standard. The impact of the Fund's adoption was limited to changes in the Fund's financial statement disclosures regarding fair value, primarily those disclosures related to transfers between levels of the fair value hierarchy and disclosure of the range and weighted average used to develop significant unobservable inputs for Level 3 fair value measurements, when applicable.
1. Security Valuation: (1) An equity portfolio security listed or traded on an exchange is valued at its latest reported sales price (or at the exchange official closing price if such exchange reports an official closing price), and if
there were no sales on a given day and if there is no official exchange closing price for that day, the security is valued at the mean between the last reported bid and asked prices if such bid and asked prices are available on the relevant exchanges. If only bid prices are available then the latest bid price may be used. Listed equity securities not traded on the valuation date with no reported bid and asked prices available on the exchange are valued at the mean between the current bid and asked prices obtained from one or more reputable brokers or dealers. In cases where a security is traded on more than one exchange, the security is valued on the exchange designated as the primary market; (2) all other equity portfolio securities for which over-the-counter ("OTC") market quotations are readily available are valued at the latest reported sales price (or at the market official closing price if such market reports an official closing price), and if there was no trading in the security on a given day and if there is no official closing price from relevant markets for that day, the security is valued at the mean between the last reported bid and asked prices if such bid and asked prices are available on the relevant markets. An unlisted equity security that does not trade on the valuation date and for which bid and asked prices from the relevant markets are unavailable is valued at the mean between the current bid and asked prices obtained from one or more reputable brokers or dealers; (3) certain portfolio securities may be valued by an outside pricing service/vendor approved by the Company's Board of Directors (the "Directors"). The pricing service/vendor may employ a pricing model that takes into account, among other things, bids, yield spreads and/or other market data and specific security characteristics. Alternatively, if a valuation is not available from an outside pricing service/vendor, and the security trades on an exchange, the security may be valued at its latest reported sale price (or at the exchange official closing price if such exchange reports an official closing price), prior to the time when assets are valued. If there are no sales on a given day and if there is no official exchange closing price for that day, the security is valued at the mean between the last reported bid and asked prices if such bid and asked prices are available in the relevant exchanges. If Morgan Stanley Investment Management Inc. (the "Adviser") or Morgan Stanley Investment Management Limited ("MSIM Limited") (the "Sub-Adviser"), each a wholly-owned subsidiary of Morgan Stanley, determines that the price provided by the outside pricing service/vendor or exchange does not reflect
20
Morgan Stanley Institutional Fund, Inc.
Annual Report — December 31, 2019
Notes to Financial Statements (cont'd)
the security's fair value or is unable to provide a price, prices from brokers or dealers may also be utilized. In these circumstances, the value of the security will be the mean of bid and asked prices obtained from brokers or dealers; (4) when market quotations are not readily available, including circumstances under which the Adviser or the Sub-Adviser determines that the closing price, last sale price or the mean between the last reported bid and asked prices are not reflective of a security's market value, portfolio securities are valued at their fair value as determined in good faith under procedures established by and under the general supervision of the Directors. Occasionally, developments affecting the closing prices of securities and other assets may occur between the times at which valuations of such securities are determined (that is, close of the foreign market on which the securities trade) and the close of business of the New York Stock Exchange ("NYSE"). If developments occur during such periods that are expected to materially affect the value of such securities, such valuations may be adjusted to reflect the estimated fair value of such securities as of the close of the NYSE, as determined in good faith by the Directors or by the Adviser using a pricing service and/or procedures approved by the Directors; (5) quotations of foreign portfolio securities, other assets and liabilities and forward contracts stated in foreign currency are translated into U.S. dollar equivalents at the prevailing market rates prior to the close of the NYSE; and (6) investments in mutual funds, including the Morgan Stanley Institutional Liquidity Funds, are valued at the net asset value ("NAV") as of the close of each business day.
The Directors have responsibility for determining in good faith the fair value of the investments, and the Directors may appoint others, such as the Company's Adviser or a valuation committee, to assist the Directors in determining fair value and to make the actual calculations pursuant to the fair valuation methodologies previously approved by the Directors. Under procedures approved by the Directors, the Company's Adviser has formed a Valuation Committee whose members are approved by the Directors. The Valuation Committee provides administration and oversight of the Company's valuation policies and procedures, which are reviewed at least annually by the Directors. These procedures allow the Company to utilize independent pricing services, quotations from securities and financial instrument dealers and other market sources to determine fair value.
2. Fair Value Measurement: FASB Accounting Standards CodificationTM ("ASC") 820, "Fair Value Measurement" ("ASC 820"), defines fair value as the value that the Fund would receive to sell an investment or pay to transfer a liability in a timely transaction with an independent buyer in the principal market, or in the absence of a principal market, the most advantageous market for the investment or liability. ASC 820 establishes a three-tier hierarchy to distinguish between (1) inputs that reflect the assumptions market participants would use in valuing an asset or liability developed based on market data obtained from sources independent of the reporting entity (observable inputs) and (2) inputs that reflect the reporting entity's own assumptions about the assumptions market participants would use in valuing an asset or liability developed based on the best information available in the circumstances (unobservable inputs) and to establish classification of fair value measurements for disclosure purposes. Various inputs are used in determining the value of the Fund's investments. The inputs are summarized in the three broad levels listed below:
• Level 1 – unadjusted quoted prices in active markets for identical investments
• Level 2 – other significant observable inputs (including quoted prices for similar investments, interest rates, prepayment speeds, credit risk, etc.)
• Level 3 – significant unobservable inputs including the Fund's own assumptions in determining the fair value of investments. Factors considered in making this determination may include, but are not limited to, information obtained by contacting the issuer, analysts, or the appropriate stock exchange (for exchange-traded securities), analysis of the issuer's financial statements or other available documents and, if necessary, available information concerning other securities in similar circumstances.
The inputs or methodology used for valuing securities are not necessarily an indication of the risk associated with investing in those securities and the determination of the significance of a particular input to the fair value measurement in its entirety requires judgment and considers factors specific to each security.
21
Morgan Stanley Institutional Fund, Inc.
Annual Report — December 31, 2019
Notes to Financial Statements (cont'd)
The following is a summary of the inputs used to value the Fund's investments as of December 31, 2019:
Investment Type | | Level 1
Unadjusted
quoted
prices
(000) | | Level 2
Other
significant
observable
inputs
(000) | | Level 3
Significant
unobservable
inputs
(000) | | Total
(000) | |
Assets: | |
Common Stocks | |
Aerospace & Defense | | $ | 98,758 | | | $ | — | | | $ | — | | | $ | 98,758 | | |
Air Freight & Logistics | | | — | | | | 46,545 | | | | — | | | | 46,545 | | |
Auto Components | | | 15,013 | | | | — | | | | — | | | | 15,013 | | |
Automobiles | | | — | | | | 8,223 | | | | — | | | | 8,223 | | |
Banks | | | 99,655 | | | | 47,383 | | | | — | | | | 147,038 | | |
Beverages | | | 120,657 | | | | 62,391 | | | | — | | | | 183,048 | | |
Capital Markets | | | 16,490 | | | | — | | | | — | | | | 16,490 | | |
Construction
Materials | | | — | | | | 19,781 | | | | — | | | | 19,781 | | |
Diversified Financial
Services | | | 9,594 | | | | — | | | | — | | | | 9,594 | | |
Electronic Equipment,
Instruments &
Components | | | — | | | | 55,147 | | | | — | | | | 55,147 | | |
Food Products | | | — | | | | 16,433 | | | | — | | | | 16,433 | | |
Health Care
Equipment &
Supplies | | | — | | | | 42,353 | | | | — | | | | 42,353 | | |
Health Care
Providers &
Services | | | — | | | | 74,091 | | | | — | | | | 74,091 | | |
Household Products | | | 92,264 | | | | 96,886 | | | | — | | | | 189,150 | | |
Insurance | | | 169,742 | | | | — | | | | — | | | | 169,742 | | |
Interactive Media &
Services | | | 46,288 | | | | — | | | | — | | | | 46,288 | | |
Machinery | | | — | | | | 26,278 | | | | — | | | | 26,278 | | |
Metals & Mining | | | 57,954 | | | | — | | | | — | | | | 57,954 | | |
Oil, Gas &
Consumable Fuels | | | 81,079 | | | | 22,307 | | | | — | | | | 103,386 | | |
Personal Products | | | 56,059 | | | | 59,165 | | | | — | | | | 115,224 | | |
Pharmaceuticals | | | 147,640 | | | | 151,457 | | | | — | | | | 299,097 | | |
Professional Services | | | 84,940 | | | | — | | | | — | | | | 84,940 | | |
Semiconductors &
Semiconductor
Equipment | | | 31,090 | | | | — | | | | — | | | | 31,090 | | |
Software | | | 60,286 | | | | 75,436 | | | | — | | | | 135,722 | | |
Specialty Retail | | | — | | | | 13,684 | | | | — | | | | 13,684 | | |
Tech Hardware,
Storage &
Peripherals | | | — | | | | 31,363 | | | | — | | | | 31,363 | | |
Tobacco | | | 113,210 | | | | — | | | | — | | | | 113,210 | | |
Trading Companies &
Distributors | | | 24,077 | | | | — | | | | — | | | | 24,077 | | |
Total Common Stocks | | | 1,324,796 | | | | 848,923 | | | | — | | | | 2,173,719 | | |
Short-Term Investment | |
Investment Company | | | 33,370 | | | | — | | | | — | | | | 33,370 | | |
Total Assets | | $ | 1,358,166 | | | $ | 848,923 | | | $ | — | | | $ | 2,207,089 | | |
Transfers between investment levels may occur as the markets fluctuate and/or the availability of data used in an investment's valuation changes.
3. Repurchase Agreements: The Fund may enter into repurchase agreements under which the Fund lends cash and takes possession of securities with an agreement that the counterparty will repurchase such securities. In connection with transactions in repurchase agreements, a bank as custodian for the Fund takes possession of the underlying securities which are held as collateral, with a market value at least equal to the amount of the repurchase transaction, including principal and accrued interest. To the extent that any repurchase transaction exceeds one business day, the value of the collateral is marked-to-market on a daily basis to determine that the value of the collateral does not decrease below the repurchase price plus accrued interest as earned. If such a decrease occurs, additional collateral will be requested and, when received, will be added to the account to maintain full collateralization. In the event of default on the obligation to repurchase, the Fund has the right to liquidate the collateral and apply the proceeds in satisfaction of the obligation. In the event of default or bankruptcy by the counterparty to the agreement, realization of the collateral proceeds may be subject to cost and delays. The Fund, along with other affiliated investment companies, may utilize a joint trading account for the purpose of entering into repurchase agreements.
At December 31, 2019, the Fund did not have any outstanding repurchase agreements.
4. Foreign Currency Translation and Foreign Investments: The books and records of the Fund are maintained in U.S. dollars. Foreign currency amounts are translated into U.S. dollars as follows:
– investments, other assets and liabilities at the prevailing rate of exchange on the valuation date;
– investment transactions and investment income at the prevailing rates of exchange on the dates of such transactions.
Although the net assets of the Fund are presented at the foreign exchange rates and market values at the close of the period, the Fund does not isolate that portion of the results of operations arising as a result of changes in the foreign exchange rates from the fluctuations arising from changes in the market prices of securities held at period end. Similarly, the Fund does not isolate the effect of changes in foreign exchange rates from the fluctuations
22
Morgan Stanley Institutional Fund, Inc.
Annual Report — December 31, 2019
Notes to Financial Statements (cont'd)
arising from changes in the market prices of securities sold during the period. Accordingly, realized and unrealized foreign currency gains (losses) on investments in securities are included in the reported net realized and unrealized gains (losses) on investment transactions and balances. However, pursuant to U.S. federal income tax regulations, gains and losses from certain foreign currency transactions and the foreign currency portion of gains and losses realized on sales and maturities of foreign denominated debt securities are treated as ordinary income for U.S. federal income tax purposes.
Net realized gains (losses) on foreign currency transactions represent net foreign exchange gains (losses) from foreign currency forward exchange contracts, disposition of foreign currencies, currency gains (losses) realized between the trade and settlement dates on securities transactions, and the difference between the amount of investment income and foreign withholding taxes recorded on the Fund's books and the U.S. dollar equivalent amounts actually received or paid. The change in unrealized currency gains (losses) on foreign currency transactions for the period is reflected in the Statement of Operations.
Foreign security and currency transactions may involve certain considerations and risks not typically associated with those of U.S. dollar denominated transactions as a result of, among other factors, fluctuations of exchange rates in relation to the U.S. dollar, the possibility of lower levels of governmental supervision and regulation of foreign securities markets and the possibility of political or economic instability.
Governmental approval for foreign investments may be required in advance of making an investment under certain circumstances in some countries, and the extent of foreign investments in domestic companies may be subject to limitation in other countries. Foreign ownership limitations also may be imposed by the charters of individual companies to prevent, among other concerns, violations of foreign investment limitations. As a result, an additional class of shares (identified as "Foreign" in the Portfolio of Investments) may be created and offered for investment. The "local" and "foreign shares" market values may differ. In the absence of trading of the foreign shares in such markets, the Fund values the foreign shares at the closing exchange price of the local shares.
5. Securities Lending: The Fund lends securities to qualified financial institutions, such as broker-dealers, to earn additional income. Any increase or decrease in the fair value of the securities loaned that might occur and any interest earned or dividends declared on those securities during the term of the loan would remain in the Fund. The Fund would receive cash or securities as collateral in an amount equal to or exceeding 100% of the current fair value of the loaned securities. The collateral is marked-to-market daily by State Street Bank and Trust Company ("State Street"), the securities lending agent, to ensure that a minimum of 100% collateral coverage is maintained.
Based on pre-established guidelines, the securities lending agent invests any cash collateral that is received in an affiliated money market portfolio and repurchase agreements. Securities lending income is generated from the earnings on the invested collateral and borrowing fees, less any rebates owed to the borrowers and compensation to the lending agent, and is recorded as "Income from Securities Loaned — Net" in the Fund's Statement of Operations. Risks in securities lending transactions are that a borrower may not provide additional collateral when required or return the securities when due, and that the value of the short-term investments will be less than the amount of cash collateral plus any rebate that is required to be returned to the borrower.
The Fund has the right under the securities lending agreement to recover the securities from the borrower on demand.
The following table presents financial instruments that are subject to enforceable netting arrangements as of December 31, 2019:
Gross Amounts Not Offset in the Statement of Assets and Liabilities | |
Gross Asset
Amounts
Presented in the
Statement of
Assets and
Liabilities
(000) | | Financial
Instrument
(000) | | Collateral
Received
(000) | | Net Amount
(not less
than $0)
(000) | |
| $ | 566 | (a) | | $ | — | | | $ | (566 | )(b)(c) | | $ | 0 | | |
(a) Represents market value of loaned securities at year end.
(b) The Fund received non-cash collateral of approximately $599,000 in the form of U.S. Government obligations, which the Fund cannot sell or repledge, and accordingly are not reflected in the Portfolio of Investments.
(c) The actual collateral received is greater than the amount shown here due to overcollateralization.
23
Morgan Stanley Institutional Fund, Inc.
Annual Report — December 31, 2019
Notes to Financial Statements (cont'd)
6. Redemption Fees: The Fund will assess a 2% redemption fee on Class I shares, Class A shares, Class L shares, Class C shares and Class IS shares, which is paid directly to the Fund, for shares redeemed or exchanged within thirty days of purchase, subject to certain exceptions. The redemption fee is designed to protect the Fund and its remaining shareholders from the effects of short-term trading. These fees, if any, are included in the Statements of Changes in Net Assets.
7. Indemnifications: The Company enters into contracts that contain a variety of indemnifications. The Company's maximum exposure under these arrangements is unknown. However, the Company has not had prior claims or losses pursuant to these contracts and expects the risk of loss to be remote.
8. Dividends and Distributions to Shareholders: Dividends and distributions to shareholders are recorded on the ex-dividend date. Dividends from net investment income, if any, are declared and paid annually. Net realized capital gains, if any, are distributed at least annually.
9. Security Transactions, Income and Expenses: Security transactions are accounted for on the trade date (date the order to buy or sell is executed). Realized gains and losses on the sale of investment securities are determined on the specific identified cost method. Dividend income and other distributions are recorded on the ex-dividend date (except for certain foreign dividends which may be recorded as soon as the Fund is informed of such dividends) net of applicable withholding taxes. Interest income is recognized on the accrual basis except where collection is in doubt. Discounts are accreted and premiums are amortized over the life of the respective securities. Most expenses of the Company can be directly attributed to a particular Fund. Expenses which cannot be directly attributed are apportioned among the Funds based upon relative net assets or other appropriate methods. Income, expenses (other than class specific expenses — distribution and shareholder services, transfer agency and sub transfer agency fees) and realized and unrealized gains or losses are allocated to each class of shares based upon their relative net assets.
B. Advisory/Sub-Advisory Fees: The Adviser, a wholly-owned subsidiary of Morgan Stanley, provides the Fund with advisory services under the terms of an Investment Advisory
Agreement, paid quarterly, at the annual rate based on the daily net assets as follows:
First $10
billion | | Over $10
billion | |
| | 0.80 | % | | | 0.75 | % | |
Effective July 1, 2019, the Adviser will provide the Fund with advisory services under the terms of an Investment Advisory Agreement, paid quarterly, at the annual rate based on the daily net assets as follows:
First $3
billion | | Over $3
billion | |
| | 0.80 | % | | | 0.75 | % | |
For the year ended December 31, 2019, the advisory fee rate (net of waiver/rebate) was equivalent to an annual effective rate of 0.80% of the Fund's average daily net assets.
The Adviser has agreed to reduce its advisory fee and/or reimburse the Fund so that total annual Fund operating expenses, excluding certain investment related expenses, taxes, interest and other extraordinary expenses (including litigation), will not exceed 0.95% for Class I shares, 1.30% for Class A shares, 1.80% for Class L shares, 2.05% for Class C shares and 0.91% for Class IS shares. The fee waivers and/or expense reimbursements will continue for at least one year from the date of the Fund's prospectus or until such time as the Directors act to discontinue all or a portion of such waivers and/or reimbursements when they deem such action is appropriate. For the year ended December 31, 2019, approximately $18,000 of advisory fees were waived and approximately $828,000 of other expenses were reimbursed by the Adviser pursuant to this arrangement.
The Adviser has entered into a Sub-Advisory Agreement with the Sub-Adviser, a wholly-owned subsidiary of Morgan Stanley. The Sub-Adviser provides the Fund with advisory services subject to the overall supervision of the Adviser and the Fund's Officers and Directors. The Adviser pays the Sub-Adviser on a monthly basis a portion of the net advisory fees the Adviser receives from the Fund.
C. Administration Fees: The Adviser also serves as Administrator to the Company and provides administrative services pursuant to an Administration Agreement for an annual fee, accrued daily and paid monthly, of 0.08% of the Fund's average daily net assets.
Under a Sub-Administration Agreement between the Administrator and State Street, State Street provides certain administrative
24
Morgan Stanley Institutional Fund, Inc.
Annual Report — December 31, 2019
Notes to Financial Statements (cont'd)
services to the Company. For such services, the Administrator pays State Street a portion of the fee the Administrator receives from the Fund.
D. Distribution and Shareholder Services Fees: Morgan Stanley Distribution, Inc. ("MSDI" or the "Distributor"), a wholly-owned subsidiary of the Adviser and an indirect subsidiary of Morgan Stanley, serves as the Company's Distributor of Fund shares pursuant to a Distribution Agreement. The Company has adopted a Shareholder Services Plan with respect to Class A shares pursuant to Rule 12b-1 under the Act. Under the Shareholder Services Plan, the Fund pays the Distributor a shareholder services fee, accrued daily and paid monthly, at an annual rate of 0.25% of the Fund's average daily net assets attributable to Class A shares.
The Company has adopted a Distribution and Shareholder Services Plan with respect to Class L shares pursuant to Rule 12b-1 under the Act. Under the Distribution and Shareholder Services Plan, the Fund pays the Distributor a distribution fee, accrued daily and paid monthly, at an annual rate of 0.50% and a shareholder services fee, accrued daily and paid monthly, at an annual rate of 0.25% of the Fund's average daily net assets attributable to Class L shares.
The Company has adopted a Distribution and Shareholder Services Plan with respect to Class C shares pursuant to Rule 12b-1 under the Act. Under the Distribution and Shareholder Services Plan, the Fund pays the Distributor a distribution fee, accrued daily and paid monthly, at an annual rate of 0.75% and a shareholder services fee, accrued daily and paid monthly, at an annual rate of 0.25% of the Fund's average daily net assets attributable to Class C shares.
The distribution and shareholder services fees are used to support the expenses associated with servicing and maintaining accounts. The Distributor may compensate other parties for providing shareholder support services to investors who purchase Class A, Class L and Class C shares.
E. Dividend Disbursing and Transfer Agent: The Company's dividend disbursing and transfer agent is DST Asset Manager Solutions, Inc. ("DST"). Pursuant to a Transfer Agency Agreement, the Company pays DST a fee based on the number of classes, accounts and transactions relating to the Funds of the Company.
F. Custodian Fees: State Street (the "Custodian") also serves as Custodian for the Company in accordance with a Custodian Agreement. The Custodian holds cash, securities and other as-
sets of the Company as required by the Act. Custody fees are payable monthly based on assets held in custody, investment purchases and sales activity and account maintenance fees, plus reimbursement for certain out-of-pocket expenses.
G. Security Transactions and Transactions with Affiliates: For the year ended December 31, 2019, purchases and sales of investment securities for the Fund, other than long-term U.S. Government securities and short-term investments were approximately $466,334,000 and $954,391,000, respectively. There were no purchases and sales of long-term U.S. Government securities for the year ended December 31, 2019.
The Fund invests in the Institutional Class of the Morgan Stanley Institutional Liquidity Funds — Treasury Securities Portfolio (the "Liquidity Funds"), an open-end management investment company managed by the Adviser, both directly and as a portion of the securities held as collateral on loaned securities. Advisory fees paid by the Fund are reduced by an amount equal to its pro-rata share of the advisory and administration fees paid by the Fund due to its investment in the Liquidity Funds. For the year ended December 31, 2019, advisory fees paid were reduced by approximately $67,000 relating to the Fund's investment in the Liquidity Funds.
A summary of the Fund's transactions in shares of affiliated investments during the year ended December 31, 2019 is as follows:
Affiliated
Investment
Company | | Value
December 31,
2018
(000) | | Purchases
at Cost
(000) | | Proceeds
from Sales
(000) | | Dividend
Income
(000) | |
Liquidity Funds | | $ | 50,406 | | | $ | 536,873 | | | $ | 553,909 | | | $ | 707 | | |
Affiliated
Investment
Company (cont'd) | | Realized
Gain (Loss)
(000) | | Change in
Unrealized
Appreciation
(Depreciation)
(000) | | Value
December 31,
2019
(000) | |
Liquidity Funds | | $ | — | | | $ | — | | | $ | 33,370 | | |
The Fund is permitted to purchase and sell securities ("cross-trade") from and to other Morgan Stanley funds as well as other funds and client accounts for which the Adviser or an affiliate of the Adviser serves as investment adviser, pursuant to procedures approved by the Directors in compliance with Rule 17a-7 under the Act (the "Rule"). Each cross-trade is executed at the current market price in compliance with provisions of the Rule. For the year ended December 31, 2019, the Fund did not engage in any cross-trade transactions.
The Fund has an unfunded Deferred Compensation Plan (the "Compensation Plan"), which allows each independent Direc-
25
Morgan Stanley Institutional Fund, Inc.
Annual Report — December 31, 2019
Notes to Financial Statements (cont'd)
tor to defer payment of all, or a portion, of the fees he or she receives for serving on the Board of Directors. Each eligible Director generally may elect to have the deferred amounts credited with a return equal to the total return on one or more of the Morgan Stanley funds that are offered as investment options under the Compensation Plan. Appreciation/depreciation and distributions received from these investments are recorded with an offsetting increase/decrease in the deferred compensation obligation and do not affect the NAV of the Fund.
H. Federal Income Taxes: It is the Fund's intention to continue to qualify as a regulated investment company and distribute all of its taxable and tax-exempt income. Accordingly, no provision for federal income taxes is required in the financial statements.
The Fund may be subject to taxes imposed by countries in which it invests. Such taxes are generally based on income and/or capital gains earned or repatriated. Taxes are accrued based on net investment income, net realized gains and net unrealized appreciation as such income and/or gains are earned. Taxes may also be based on transactions in foreign currency and are accrued based on the value of investments denominated in such currency.
FASB ASC 740-10, "Income Taxes — Overall", sets forth a minimum threshold for financial statement recognition of the benefit of a tax position taken or expected to be taken in a tax return. Management has concluded there are no significant uncertain tax positions that would require recognition in the financial statements. If applicable, the Fund recognizes interest accrued related to unrecognized tax benefits in "Interest Expense" and penalties in "Other Expenses" in the Statement of Operations. The Fund files tax returns with the U.S. Internal Revenue Service, New York and various states. Generally, each of the tax years in the four-year period ended December 31, 2019 remains subject to examination by taxing authorities.
The tax character of distributions paid may differ from the character of distributions shown for GAAP purposes due to short-term capital gains being treated as ordinary income for tax purposes. The tax character of distributions paid during fiscal years 2019 and 2018 was as follows:
2019
Distributions
Paid From: | | 2018
Distributions
Paid From: | |
Ordinary
Income
(000) | | Long-Term
Capital Gain
(000) | | Ordinary
Income
(000) | | Long-Term
Capital Gain
(000) | |
| $ | 43,718 | | | $ | 164,037 | | | $ | 62,556 | | | $ | 274,501 | | |
The amount and character of income and gains to be distributed are determined in accordance with income tax regulations which may differ from GAAP. These book/tax differences are either considered temporary or permanent in nature.
Temporary differences are attributable to differing book and tax treatments for the timing of the recognition of gains (losses) on certain investment transactions and the timing of the deductibility of certain expenses.
Permanent differences, primarily due to equalization debits and redemptions in kind, resulted in the following reclassifications among the components of net assets at December 31, 2019:
Total
Distributable
Earnings
(000) | | Paid-in
Capital
(000) | |
| $ | (18,012 | ) | | $ | 18,012 | | |
At December 31, 2019, the Fund had no distributable earnings on a tax basis.
For the year ended December 31, 2019, the Fund realized gains from in-kind redemptions of approximately $7,831,000. The gains are not taxable income to the Fund.
I. Credit Facility: The Company and other Morgan Stanley funds participated in a $150,000,000 committed, unsecured revolving line of credit facility (the "Facility") with State Street. Effective April 22, 2019, the committed line amount increased to $300,000,000. This Facility is to be used for temporary emergency purposes or funding of shareholder redemption requests. The interest rate on borrowings is based on the federal funds rate or 1 month LIBOR rate plus a spread. The Facility also has a commitment fee of 0.25% per annum based on the unused portion of the Facility. During the year ended December 31, 2019, the Fund did not have any borrowings under the Facility.
J. Other: At December 31, 2019, the Fund had record owners of 10% or greater. Investment activities of these shareholders could have a material impact on the Fund. The aggregate percentage of such owners was 42.3%.
26
Morgan Stanley Institutional Fund, Inc.
Annual Report — December 31, 2019
Report of Independent Registered Public Accounting Firm
To the Shareholders and Board of Directors of
Morgan Stanley Institutional Fund, Inc. —
International Equity Portfolio
Opinion on the Financial Statements
We have audited the accompanying statement of assets and liabilities of International Equity Portfolio (the "Fund") (one of the funds constituting Morgan Stanley Institutional Fund, Inc. (the "Company")), including the portfolio of investments, as of December 31, 2019, and the related statement of operations for the year then ended, the statements of changes in net assets for each of the two years in the period then ended, the financial highlights for each of the five years in the period then ended and the related notes (collectively referred to as the "financial statements"). In our opinion, the financial statements present fairly, in all material respects, the financial position of International Equity Portfolio (one of the funds constituting Morgan Stanley Institutional Fund, Inc.) at December 31, 2019, the results of its operations for the year then ended, the changes in its net assets for each of the two years in the period then ended and its financial highlights for each of the five years in the period then ended, in conformity with U.S. generally accepted accounting principles.
Basis for Opinion
These financial statements are the responsibility of the Company's management. Our responsibility is to express an opinion on the Fund's financial statements based on our audits. We are a public accounting firm registered with the Public Company Accounting Oversight Board (United States) ("PCAOB") and are required to be independent with respect to the Company in accordance with the U.S. federal securities law and the applicable rules and regulations of the Securities and Exchange Commission and the PCAOB.
We conducted our audits in accordance with the standards of the PCAOB. Those standards require that we plan and perform the audit to obtain reasonable assurance about whether the financial statements are free of material misstatement, whether due to error or fraud. The Company is not required to have, nor were we engaged to perform, an audit of the Company's internal control over financial reporting. As part of our audits, we are required to obtain an understanding of internal control over financial reporting, but not for the purpose of expressing an opinion on the effectiveness of the Company's internal control over financial reporting. Accordingly, we express no such opinion.
Our audits included performing procedures to assess the risks of material misstatement of the financial statements, whether due to error or fraud, and performing procedures that respond to those risks. Such procedures included examining, on a test basis, evidence regarding the amounts and disclosures in the financial statements. Our procedures included confirmation of securities owned as of December 31, 2019 by correspondence with the custodian. Our audits also included evaluating the accounting principles used and significant estimates made by management, as well as evaluating the overall presentation of the financial statements. We believe that our audits provide a reasonable basis for our opinion.

We have served as the auditor of one or more Morgan Stanley investment companies since 2000.
Boston, Massachusetts
February 27, 2020
27
Morgan Stanley Institutional Fund, Inc.
Annual Report — December 31, 2019
Federal Tax Notice (unaudited)
For federal income tax purposes, the following information is furnished with respect to the distributions paid by the Fund during its taxable year ended December 31, 2019.
The Fund designated and paid approximately $174,217,000 as a long-term capital gain distribution.
For federal income tax purposes, the following information is furnished with respect to the Fund's earnings for its taxable year ended December 31, 2019. When distributed, certain earnings may be subject to a maximum tax rate of 15% as provided for by the Jobs and Growth Tax Relief Reconciliation Act of 2003. The Fund designated up to a maximum of approximately $48,234,000 as taxable at this lower rate.
The Fund intends to pass through foreign tax credits of approximately $4,516,000 and has derived net income from sources within foreign countries amounting to approximately $70,997,000.
In January, the Fund provides tax information to shareholders for the preceding calendar year.
28
Privacy Notice (unaudited) April 2019
FACTS | | WHAT DOES MSIM DO WITH YOUR PERSONAL INFORMATION? | |
Why? | | Financial companies choose how they share your personal information. Federal law gives consumers the right to limit some but not all sharing. Federal law also requires us to tell you how we collect, share, and protect your personal information. Please read this notice carefully to understand what we do. | |
What? | | The types of personal information we collect and share depend on the product or service you have with us. This information can include:
n Social Security number and income
n investment experience and risk tolerance
n checking account number and wire transfer instructions | |
How? | | All financial companies need to share customers' personal information to run their everyday business. In the section below, we list the reasons financial companies can share their customers' personal information; the reasons MSIM chooses to share; and whether you can limit this sharing. | |
Reasons we can share your personal information | | Does MSIM share? | | Can you limit this sharing? | |
For our everyday business purposes —
such as to process your transactions, maintain your account(s), respond to court orders and legal investigations, or report to credit bureaus | | Yes | | No | |
For our marketing purposes —
to offer our products and services to you | | Yes | | No | |
For joint marketing with other financial companies | | No | | We don't share | |
For our affiliates' everyday business purposes —
information about your transactions and experiences | | Yes | | No | |
For our affiliates' everyday business purposes —
information about your creditworthiness | | No | | We don't share | |
For our affiliates to market to you | | No | | We don't share | |
For non-affiliates to market to you | | No | | We don't share | |
Questions? Call toll-free (844) 312-6327 or email: imprivacyinquiries@morganstanley.com
29
Privacy Notice (unaudited) (cont'd) April 2019
Who we are
Who is providing this notice? | | Morgan Stanley Investment Management, Inc. and its affiliated registered investment advisers, registered broker-dealers, and registered and unregistered funds ("MSIM") | |
What we do
How does MSIM protect my personal information? | | To protect your personal information from unauthorized access and use, we use security measures that comply with federal law. These measures include computer safeguards and secured files and buildings. We have policies governing the proper handling of customer information by personnel and requiring third parties that provide support to adhere to appropriate security standards with respect to such information. | |
How does MSIM collect my personal information? | | We collect your personal information, for example, when you
n open an account or make deposits or withdrawals from your account
n buy securities from us or make a wire transfer
n give us your contact information
We also collect your personal information from others, such as credit bureaus, affiliates, or other companies. | |
Why can't I limit all sharing? | | Federal law gives you the right to limit only
n sharing for affiliates' everyday business purposes — information about your creditworthiness
n affiliates from using your information to market to you
n sharing for non-affiliates to market to you
State laws and individual companies may give you additional rights to limit sharing. See below for more on your rights under state law. | |
Definitions
Affiliates | | Companies related by common ownership or control. They can be financial and non-financial companies.
n Our affiliates include companies with a Morgan Stanley name and financial companies such as Morgan Stanley Smith Barney LLC and Morgan Stanley & Co. | |
Non-affiliates | | Companies not related by common ownership or control. They can be financial and non-financial companies.
n MSIM does not share with non-affiliates so they can market to you. | |
Joint marketing | | A formal agreement between non-affiliated financial companies that together market financial products or services to you.
n MSIM doesn't jointly market | |
Other Important Information
Vermont: Except as permitted by law, we will not share personal information we collect about Vermont residents with Non-affiliates unless you provide us with your written consent to share such information.
California: Except as permitted by law, we will not share personal information we collect about California residents with Non-affiliates and we will limit sharing such personal information with our Affiliates to comply with California privacy laws that apply to us.
30
Morgan Stanley Institutional Fund, Inc.
Annual Report — December 31, 2019
Director and Officer Information (unaudited)
Independent Directors:
Name, Birth Year
and Address of
Independent Director | | Position(s)
Held with
Registrant | | Length of Time
Served* | | Principal Occupation(s) During Past 5 Years
and Other Relevant Professional Experience | | Number of
Funds in
Fund Complex
Overseen by
Independent
Director** | | Other Directorships
Held by Independent
Director*** | |
Frank L. Bowman
c/o Perkins Coie LLP
Counsel to the Independent Directors
1155 Avenue of the Americas
New York, NY 10036
Birth Year 1944 | | Director | | Since
August 2006 | | President, Strategic Decisions, LLC (consulting) (since February 2009); Director or Trustee of various Morgan Stanley Funds (since August 2006); Chairperson of the Compliance and Insurance Committee (since October 2015); formerly, Chairperson of the Insurance Sub-Committee of the Compliance and Insurance Committee (2007-2015); served as President and Chief Executive Officer of the Nuclear Energy Institute (policy organization) (February 2005-November 2008); retired as Admiral, U.S. Navy after serving over 38 years on active duty including 8 years as Director of the Naval Nuclear Propulsion Program in the Department of the Navy and the U.S. Department of Energy (1996-2004); served as Chief of Naval Personnel (July 1994-September 1996) and on the Joint Staff as Director of Political Military Affairs (June 1992-July 1994); knighted as Honorary Knight Commander of the Most Excellent Order of the British Empire; awarded the Officier de l'Orde National du Mérite by the French Government; elected to the National Academy of Engineering (2009). | | | 86 | | | Director of Naval and Nuclear Technologies LLP; Director Emeritus of the Armed Services YMCA; Member of the National Security Advisory Council of the Center for U.S. Global Engagement and a member of the CNA Military Advisory Board; Trustee of Fairhaven United Methodist Church; Member of the Board of Advisors of the Dolphin Scholarship Foundation; Director of other various non-profit organizations; formerly, Director of BP p.l.c. (November 2010-May 2019). | |
Kathleen A. Dennis
c/o Perkins Coie LLP
Counsel to the Independent Directors
1155 Avenue of the Americas
New York, NY 10036
Birth Year 1953 | | Director | | Since August 2006 | | President, Cedarwood Associates (mutual fund and investment management consulting) (since July 2006); Chairperson of the Liquidity and Alternatives Sub-Committee of the Investment Committee (since October 2006) and Director or Trustee of various Morgan Stanley Funds (since August 2006); formerly, Senior Managing Director of Victory Capital Management (1993-2006). | | | 86 | | | Director of various non-profit organizations. | |
Nancy C. Everett
c/o Perkins Coie LLP
Counsel to the Independent Directors
1155 Avenue of the Americas
New York, NY 10036
Birth Year 1955 | | Director | | Since January 2015 | | Chief Executive Officer, Virginia Commonwealth University Investment Company (since November 2015); Owner, OBIR, LLC (institutional investment management consulting) (since June 2014); formerly, Managing Director, BlackRock, Inc. (February 2011-December 2013); and Chief Executive Officer, General Motors Asset Management (a/k/a Promark Global Advisors, Inc.) (June 2005-May 2010). | | | 87 | | | Formerly, Member of Virginia Commonwealth University School of Business Foundation (2005-2016); Member of Virginia Commonwealth University Board of Visitors (2013-2015); Member of Committee on Directors for Emerging Markets Growth Fund, Inc. (2007-2010); Chairperson of Performance Equity Management, LLC (2006-2010); and Chairperson, GMAM Absolute Return Strategies Fund, LLC (2006-2010). | |
31
Morgan Stanley Institutional Fund, Inc.
Annual Report — December 31, 2019
Director and Officer Information (unaudited) (cont'd)
Independent Directors: (cont'd)
Name, Birth Year
and Address of
Independent Director | | Position(s)
Held with
Registrant | | Length of Time
Served* | | Principal Occupation(s) During Past 5 Years
and Other Relevant Professional Experience | | Number of
Funds in
Fund Complex
Overseen by
Independent
Director** | | Other Directorships
Held by Independent
Director*** | |
Jakki L. Haussler
c/o Perkins Coie LLP
Counsel to the Independent Directors
1155 Avenue of the Americas
New York, NY 10036
Birth Year 1957 | | Director | | Since January 2015 | | Chairman, Opus Capital Group (since 1996); formerly, Chief Executive Officer, Opus Capital Group (1996-2019); Director, Capvest Venture Fund, LP (May 2000-December 2011); Partner, Adena Ventures, LP (July 1999-December 2010); Director, The Victory Funds (February 2005-July 2008). | | | 87 | | | Director of Service Corporation International and Member, Audit Committee and Investment Committee; Director of Cincinnati Bell Inc. and Member, Audit Committee and Governance and Nominating Committee; Chairman of Northern Kentucky University Member Investment Committee; Member of Chase College of Law Transactional Law Practice Center Board of Advisors; Director of Best Transport; Director of Chase College of Law Board of Visitors; formerly, Member, University of Cincinnati Foundation Investment Committee; Member, Miami University Board of Visitors (2008-2011); Trustee of Victory Funds (2005-2008) and Chairman, Investment Committee (2007-2008) and Member, Service Provider Committee (2005-2008). | |
Dr. Manuel H. Johnson
c/o Johnson Smick International, Inc.
220 I Street, NE — Suite 200
Washington, D.C. 20002
Birth Year 1949 | | Director | | Since July 1991 | | Senior Partner, Johnson Smick International, Inc. (consulting firm); Chairperson of the Investment Committee (since October 2006) and Director or Trustee of various Morgan Stanley Funds (since July 1991); Co-Chairman and a founder of the Group of Seven Council (G7C) (international economic commission); formerly, Chairperson of the Audit Committee (July 1991-September 2006), Vice Chairman of the Board of Governors of the Federal Reserve System and Assistant Secretary of the U.S. Treasury. | | | 86 | | | Director of NVR, Inc. (home construction). | |
Joseph J. Kearns
c/o Perkins Coie LLP
Counsel to the Independent Directors
1155 Avenue of the Americas
New York, NY 10036
Birth Year 1942 | | Director | | Since August 1994 | | Senior Adviser, Kearns & Associates LLC (investment consulting); Chairperson of the Audit Committee (since October 2006) and Director or Trustee of various Morgan Stanley Funds (since August 1994); formerly, Deputy Chairperson of the Audit Committee (July 2003-September 2006) and Chairperson of the Audit Committee of various Morgan Stanley Funds (since August 1994); CFO of the J. Paul Getty Trust. | | | 87 | | | Prior to August 10, 2016, Director of Electro Rent Corporation (equipment leasing); Prior to December 31, 2013, Director of The Ford Family Foundation. | |
32
Morgan Stanley Institutional Fund, Inc.
Annual Report — December 31, 2019
Director and Officer Information (unaudited) (cont'd)
Independent Directors: (cont'd)
Name, Birth Year
and Address of
Independent Director | | Position(s)
Held with
Registrant | | Length of Time
Served* | | Principal Occupation(s) During Past 5 Years
and Other Relevant Professional Experience | | Number of
Funds in
Fund Complex
Overseen by
Independent
Director** | | Other Directorships
Held by Independent
Director*** | |
Michael F. Klein
c/o Perkins Coie LLP
Counsel to the Independent Directors
1155 Avenue of the Americas
New York, NY 10036
Birth Year 1958 | | Director | | Since August 2006 | | Managing Director, Aetos Alternatives Management, LP (since March 2000); Co-President, Aetos Alternatives Management, LP (since January 2004) and Co-Chief Executive Officer of Aetos Alternatives Management, LP (since August 2013); Chairperson of the Fixed Income Sub-Committee of the Investment Committee (since October 2006) and Director or Trustee of various Morgan Stanley Funds (since August 2006); formerly, Managing Director, Morgan Stanley & Co. Inc. and Morgan Stanley Dean Witter Investment Management and President, various Morgan Stanley Funds (June 1998-March 2000); Principal, Morgan Stanley & Co. Inc. and Morgan Stanley Dean Witter Investment Management (August 1997-December 1999). | | | 86 | | | Director of certain investment funds managed or sponsored by Aetos Alternatives Management, LP; Director of Sanitized AG and Sanitized Marketing AG (specialty chemicals). | |
Patricia Maleski
c/o Perkins Coie LLP
Counsel to the Independent Directors
1155 Avenue of the Americas
New York, NY 10036
Birth Year 1960 | | Director | | Since January 2017 | | Managing Director, JPMorgan Asset Management (2004-2016); Oversight and Control Head of Fiduciary and Conflicts of Interest Program (2015-2016); Chief Control Officer-Global Asset Management (2013-2015); President, JPMorgan Funds (2010-2013); Chief Administrative Officer (2004-2013); various other positions including Treasurer and Board Liaison (since 2001). | | | 87 | | | None. | |
Michael E. Nugent
522 Fifth Avenue
New York, NY 10036
Birth Year 1936 | | Chair of the Board and Director | | Chair of the Boards since July 2006 and Director since July 1991 | | Chair of the Boards of various Morgan Stanley Funds (since July 2006); Chairperson of the Governance Committee (since January 2019) and Director or Trustee of various Morgan Stanley Funds (since July 1991); formerly, Chairperson of each of the Closed-End Fund committee (until December 2019) and the Insurance Committee (until July 2006); General Partner, Triumph Capital, L.P. (private investment partnership) (1988-2013). | | | 86 | | | None. | |
W. Allen Reed
c/o Perkins Coie LLP
Counsel to the Independent Directors
1155 Avenue of the Americas
New York, NY 10036
Birth Year 1947 | | Vice Chair of the Board and Director | | Vice Chair of the Boards since January 2020 and Director since August 2006 | | Chairperson of the Equity Sub-Committee of the Investment Committee (since October 2006) and Director or Trustee of various Morgan Stanley Funds (since August 2006); formerly, President and CEO of General Motors Asset Management; Chairman and Chief Executive Officer of the GM Trust Bank and Corporate Vice President of General Motors Corporation (August 1994-December 2005). | | | 86 | | | Formerly, Director of Legg Mason, Inc.; formerly, Director of the Auburn University Foundation (2010-2015). | |
* This is the earliest date the Director began serving the Morgan Stanley Funds. Each Director serves an indefinite term, until his or her successor is elected.
** The Fund Complex includes (as of December 31, 2019) all open-end and closed-end funds (including all of their portfolios) advised by Morgan Stanley Investment Management Inc. (the "Adviser") and any funds that have an adviser that is an affiliated person of the Adviser (including, but not limited to, Morgan Stanley AIP GP LP).
*** This includes any directorships at public companies and registered investment companies held by the Director at any time during the past five years.
33
Morgan Stanley Institutional Fund, Inc.
Annual Report — December 31, 2019
Director and Officer Information (unaudited) (cont'd)
Executive Officers:
Name, Birth Year and Address of
Executive Officer | | Position(s) Held
with
Registrant | | Length of
Time Served* | | Principal Occupation(s) During Past 5 Years | |
John H. Gernon
522 Fifth Avenue
New York, NY 10036
Birth Year 1963 | | President and Principal Executive Officer | | Since September 2013 | | President and Principal Executive Officer of the Equity and Fixed Income Funds and the Morgan Stanley AIP Funds (since September 2013) and the Liquidity Funds and various money market funds (since May 2014) in the Fund Complex; Managing Director of the Adviser; Head of Product (since 2006). | |
Timothy J. Knierim
522 Fifth Avenue
New York, NY 10036
Birth Year 1959 | | Chief Compliance Officer | | Since December 2016 | | Managing Director of the Adviser and various entities affiliated with the Adviser; Chief Compliance Officer of various Morgan Stanley Funds and the Adviser (since December 2016) and Chief Compliance Officer of Morgan Stanley AIP GP LP (since 2014). Formerly, Managing Director and Deputy Chief Compliance Officer of the Adviser (2014-2016); and formerly, Chief Compliance Officer of Prudential Investment Management, Inc. (2007-2014). | |
Francis J. Smith
522 Fifth Avenue
New York, NY 10036
Birth Year 1965 | | Treasurer and Principal Financial Officer | | Treasurer since July 2003 and Principal Financial Officer since September 2002 | | Managing Director of the Adviser and various entities affiliated with the Adviser; Treasurer (since July 2003) and Principal Financial Officer of various Morgan Stanley Funds (since September 2002). | |
Mary E. Mullin
522 Fifth Avenue
New York, NY 10036
Birth Year 1967 | | Secretary | | Since June 1999 | | Managing Director of the Adviser; Secretary of various Morgan Stanley Funds (since June 1999). | |
Michael J. Key
522 Fifth Avenue
New York, NY 10036
Birth Year 1979 | | Vice President | | Since June 2017 | | Vice President of the Equity and Fixed Income Funds, Liquidity Funds, various money market funds and the Morgan Stanley AIP Funds in the Fund Complex (since June 2017); Executive Director of the Adviser; Head of Product Development for Equity and Fixed Income Funds (since August 2013). | |
* This is the earliest date the officer began serving the Morgan Stanley Funds. Each officer serves a one-year term, until his or her successor is elected and qualifies.
34
Morgan Stanley Institutional Fund, Inc.
Annual Report — December 31, 2019
Adviser and Administrator
Morgan Stanley Investment Management Inc.
522 Fifth Avenue
New York, New York 10036
Sub-Adviser
Morgan Stanley Investment Management Limited
25 Cabot Square, Canary Wharf
London, E14 4QA, England
Distributor
Morgan Stanley Distribution, Inc.
522 Fifth Avenue
New York, New York 10036
Dividend Disbursing and Transfer Agent
DST Asset Manager Solutions, Inc.
2000 Crown Colony Drive
Quincy, Massachusetts 02169
Custodian
State Street Bank and Trust Company
One Lincoln Street
Boston, Massachusetts 02111
Legal Counsel
Dechert LLP
1095 Avenue of the Americas
New York, New York 10036
Counsel to the Independent Directors
Perkins Coie LLP
1155 Avenue of the Americas
New York, New York 10036
Independent Registered Public Accounting Firm
Ernst & Young LLP
200 Clarendon Street
Boston, Massachusetts 02116
Reporting to Shareholders
Each Morgan Stanley fund provides a complete schedule of portfolio holdings in its Semi-Annual and the Annual Reports within 60 days of the end of the fund's second and fourth fiscal quarters. The Semi-Annual and Annual Reports are filed electronically with the Securities and Exchange Commission ("SEC") on Form N-CSRS and Form N-CSR, respectively. Morgan Stanley also delivers the Semi-Annual and Annual Reports to fund shareholders and makes these reports available on its public website, www.morganstanley.com/im/shareholderreports. Each Morgan Stanley non-money market fund also files a complete schedule of portfolio holdings with the SEC for the fund's first and third fiscal quarters as an attachment to Form N-PORT. Morgan Stanley does not deliver the reports for the first and third fiscal quarters to shareholders, nor are the reports posted to the Morgan Stanley public website. However, the holdings for each money market fund are posted to the Morgan Stanley public website. You may obtain the Form N-PORT filings (as well as the Form N-CSR and N-CSRS filings) by accessing the SEC's website, www.sec.gov. You can also request copies of these materials, upon payment of a duplicating fee, by electronic request at the SEC's email address (publicinfo@sec.gov).
Proxy Voting Policies and Procedures and Proxy Voting Record
You may obtain a copy of the Company's Proxy Voting Policy and Procedures and information regarding how the Company voted proxies relating to portfolio securities during the most recent twelve-month period ended June 30, without charge, upon request, by calling toll free 1 (800) 548-7786 or by visiting our website at www.morganstanley.com/im/shareholderreports. This information is also available on the SEC's website at www.sec.gov.
This report is authorized for distribution only when preceded or accompanied by a prospectus or summary prospectus of the applicable fund of Morgan Stanley Institutional Fund, Inc., which describes in detail the fund's investment policies, risks, fees and expenses. Please read the prospectus carefully before you invest or send money. For additional information, including information regarding the investments comprising the Fund, please visit our website at www.morganstanley.com/im/shareholderreports or call toll free 1 (800) 548-7786.
35
Printed in U.S.A.
This Report has been prepared for shareholders and may be distributed to others only if preceded or accompanied by a current prospectus.
Morgan Stanley Investment Management Inc.
522 Fifth Avenue
New York, New York 10036
© 2020 Morgan Stanley. Morgan Stanley Distribution, Inc.

IFIIEANN
2909111 EXP. 02.28.21

Morgan Stanley Institutional Fund, Inc.
International Opportunity Portfolio
Annual Report
December 31, 2019
Beginning on January 1, 2021, as permitted by regulations adopted by the Securities and Exchange Commission ("SEC"), paper copies of the Fund's Annual and Semi-Annual Reports to Shareholders ("Shareholder Reports") will no longer be sent by mail, unless you specifically request paper copies of the Shareholder Reports from the Fund or from your financial intermediary, such as a broker-dealer or a bank. Instead, the Shareholder Reports will be made available on the Fund's website, https://www.morganstanley.com/im/shareholderreports and you will be notified by mail each time a Shareholder Report is posted and provided with a website link to access the Shareholder Report. If you already elected to receive Shareholder Reports electronically, you will not be affected by this change and you need not take any action. You may elect to receive Shareholder Reports and other communications from the Fund electronically anytime by contacting your financial intermediary or, if you are a direct investor, please follow the instructions on the envelope.
Beginning on January 1, 2019, you may elect to receive all future Shareholder Reports in paper free of charge. If you invest through a financial intermediary, you can contact your financial intermediary to request that you continue to receive paper copies of your Shareholder Reports. If you invest directly with the Fund, please follow the instructions on the envelope to let the Fund know you wish to continue receiving paper copies of your Shareholder Reports. Your election to receive Shareholder Reports in paper will apply to all funds held in your account if you invest through your financial intermediary or all funds held with the fund complex if you invest directly with a fund.

Morgan Stanley Institutional Fund, Inc.
Annual Report — December 31, 2019
Shareholders' Letter | | | 2 | | |
Expense Example | | | 3 | | |
Investment Overview | | | 4 | | |
Portfolio of Investments | | | 7 | | |
Statement of Assets and Liabilities | | | 9 | | |
Statement of Operations | | | 11 | | |
Statements of Changes in Net Assets | | | 12 | | |
Financial Highlights | | | 14 | | |
Notes to Financial Statements | | | 20 | | |
Report of Independent Registered Public Accounting Firm | | | 30 | | |
Privacy Notice | | | 31 | | |
Director and Officer Information | | | 33 | | |
This report is authorized for distribution only when preceded or accompanied by a prospectus or summary prospectus of the applicable Fund of Morgan Stanley Institutional Fund, Inc. To receive a prospectus and/or statement of additional information ("SAI"), which contains more complete information such as investment objectives, charges, expenses, policies for voting proxies, risk considerations and describes in detail each of the Fund's investment policies to the prospective investor, please call toll free 1 (800) 548-7786. Please read the prospectuses carefully before you invest or send money.
Additionally, you can access information about the Fund, including performance, characteristics and investment team commentary, through Morgan Stanley Investment Management's website: www.morganstanley.com/im/shareholderreports.
Market forecasts provided in this report may not necessarily come to pass. There is no guarantee that any sectors mentioned will continue to perform as discussed herein or that securities in such sectors will be held by the Fund in the future. There is no assurance that a fund will achieve its investment objective. Funds are subject to market risk, which is the possibility that market values of securities owned by the Fund will decline and, therefore, the value of the Fund's shares may be less than what you paid for them. Accordingly, you can lose money investing in this Fund. Please see the prospectus for more complete information on investment risks.
1
Morgan Stanley Institutional Fund, Inc.
Annual Report — December 31, 2019
Shareholders' Letter (unaudited)
Dear Shareholders,
We are pleased to provide this Annual Report, in which you will learn how your investment in International Opportunity Portfolio (the "Fund") performed during the latest twelve-month period.
Morgan Stanley Investment Management is a client-centric, investor-led organization. Our global presence, intellectual capital, and breadth of products and services enable us to partner with investors to meet the evolving challenges of today's financial markets. We aim to deliver superior investment service and to empower our clients to make the informed decisions that help them reach their investment goals.
As always, we thank you for selecting Morgan Stanley Investment Management, and look forward to working with you in the months and years ahead.
Sincerely,

John H. Gernon
President and Principal Executive Officer
January 2020
2
Morgan Stanley Institutional Fund, Inc.
Annual Report — December 31, 2019
Expense Example (unaudited)
International Opportunity Portfolio
As a shareholder of the Fund, you incur two types of costs: (1) transactional costs, including redemption fees; and (2) ongoing costs, which may include advisory fees, administration fees, distribution and shareholder services fees and other Fund expenses. This example is intended to help you understand your ongoing costs (in dollars) of investing in the Fund and to compare these costs with the ongoing costs of investing in other mutual funds.
This example is based on an investment of $1,000 invested at the beginning of the six-month period ended December 31, 2019 and held for the entire six-month period.
Actual Expenses
The table below provides information about actual account values and actual expenses. You may use the information in this table, together with the amount you invested, to estimate the expenses that you paid over the period. Simply divide your account value by $1,000 (for example, an $8,600 account value divided by $1,000 = 8.6), then multiply the result by the number in the table under the heading entitled "Actual Expenses Paid During Period" to estimate the expenses you paid on your account during this period.
Hypothetical Example for Comparison Purposes
The table below provides information about hypothetical account values and hypothetical expenses based on the Fund's actual expense ratio and an assumed rate of return of 5% per year before expenses, which is not the Fund's actual return. The hypothetical account values and expenses may not be used to estimate the actual ending account balance or expenses you paid for the period. You may use this information to compare the ongoing costs of investing in the Fund and other funds. To do so, compare this 5% hypothetical example with the 5% hypothetical examples that appear in the shareholder reports of the other funds.
Please note that the expenses shown in the table are meant to highlight your ongoing costs only and do not reflect any transactional costs, such as sales charges (loads) and redemption fees. Therefore, the information for each class in the table is useful in comparing ongoing costs only, and will not help you determine the relative total costs of owning different funds. In addition, if these transactional costs were included, your costs would have been higher.
| | | Beginning
Account
Value
7/1/19 | | Actual Ending
Account
Value
12/31/19 | | Hypothetical
Ending Account
Value | | Actual
Expenses
Paid
During
Period* | | Hypothetical
Expenses Paid
During Period* | | Net
Expense
Ratio
During
Period** | |
International Opportunity Portfolio Class I | | $ | 1,000.00 | | | $ | 1,081.30 | | | $ | 1,020.21 | | | $ | 5.19 | | | $ | 5.04 | | | | 0.99 | % | |
International Opportunity Portfolio Class A | | | 1,000.00 | | | | 1,079.40 | | | | 1,018.65 | | | | 6.81 | | | | 6.61 | | | | 1.30 | | |
International Opportunity Portfolio Class L | | | 1,000.00 | | | | 1,076.40 | | | | 1,015.93 | | | | 9.63 | | | | 9.35 | | | | 1.84 | | |
International Opportunity Portfolio Class C | | | 1,000.00 | | | | 1,075.50 | | | | 1,014.97 | | | | 10.62 | | | | 10.31 | | | | 2.03 | | |
International Opportunity Portfolio Class IS | | | 1,000.00 | | | | 1,081.60 | | | | 1,020.67 | | | | 4.72 | | | | 4.58 | | | | 0.90 | | |
International Opportunity Portfolio Class IR | | | 1,000.00 | | | | 1,081.60 | | | | 1,020.57 | | | | 4.83 | | | | 4.69 | | | | 0.92 | | |
* Expenses are calculated using each Fund Class' annualized net expense ratio (as disclosed), multiplied by the average account value over the period and multiplied by 184/365 (to reflect the most recent one-half year period).
** Annualized.
3
Morgan Stanley Institutional Fund, Inc.
Annual Report — December 31, 2019
Investment Overview (unaudited)
International Opportunity Portfolio
The Fund seeks long-term capital appreciation.
Performance
For the fiscal year ended December 31, 2019, the Fund's Class I shares had a total return based on net asset value and reinvestment of distributions per share of 35.20%, net of fees. The Fund's Class I shares outperformed the Fund's benchmark, the MSCI All Country World ex USA Net Index (the "Index"), which returned 21.51%.
Please keep in mind that double-digit returns are highly unusual and cannot be sustained. Investors should also be aware that these returns were primarily achieved during favorable market conditions.
Factors Affecting Performance
• Easing geopolitical tensions, reduced recession fears and central bank support drove global equities sharply higher over 2019. Although the U.S.-China trade relations dampened global manufacturing and export activity, many economies remained supported by relatively stronger consumer sectors that had remained mostly unaffected by the manufacturing slowdown. To further extend the economic cycle, global central banks resumed cutting policy interest rates and enacting other stimulus measures. Volatility increased in 2019, but stock prices continued to rally higher, notably at year end when the U.S. and China announced a partial trade deal, Brexit uncertainty eased with the Conservative Party winning a large majority in the U.K. general election, and some economic indicators appeared to be stabilizing.
• International equity markets advanced by 21.51% for the 12-month period ended December 31, 2019, as measured by the Index. Our team remained focused on assessing company prospects over a longer-term period of three to five years, and owning a portfolio of high quality companies with diverse business drivers not tied to a particular market environment.
• The team manages concentrated portfolios that are highly differentiated from the benchmark, with securities weighted on our assessment of the quality of the company and our conviction. The value added or detracted in any period of time will typically result from stock selection, given our philosophy and process. For the 12-month period,
the Fund outperformed the Index due to favorable stock selection and sector allocation.
• The Fund's relative performance was primarily driven by strong stock selection in the consumer discretionary, industrials and information technology sectors.
• Detracting from relative gains were a sector underweight in health care, stock selection in financials and a sector overweight in consumer staples.
Management Strategies
• There were no changes to our bottom-up investment process during the period. The Fund seeks long-term capital appreciation by investing internationally in high quality established and emerging companies that the investment team believes are undervalued at the time of purchase. To achieve its objective, we seek companies with sustainable competitive advantages and long-term growth that creates value, rather than focusing on short-term events, with stock selection informed by rigorous fundamental analysis.
• At the close of the period ended December 31, 2019, consumer discretionary represented the largest sector weight in the Fund, followed by information technology and consumer staples. Our bottom-up investment process resulted in sector overweight positions in consumer discretionary, information technology, consumer staples and communication services, and underweight positions in financials, materials, energy, health care, industrials, real estate and utilities. The Fund had no energy, materials, real estate and utilities holdings at the end of the reporting period.
4
Morgan Stanley Institutional Fund, Inc.
Annual Report — December 31, 2019
Investment Overview (unaudited) (cont'd)
International Opportunity Portfolio

* Minimum Investment for Class I shares
** Commenced Operations on March 31, 2010.
In accordance with SEC regulations, the Fund's performance shown assumes that all recurring fees (including management fees) were deducted and all dividends and distributions were reinvested. The performance of Class A, L, C, IS and IR shares will vary from the performance of Class I shares based upon their different inception dates and will be negatively impacted by additional fees assessed to those classes (if applicable).
Performance Compared to the MSCI All Country World ex USA Net Index(1) and the Lipper International Multi-Cap Growth Funds Index(2)
| | | Period Ended December 31, 2019
Total Returns(3) | |
| | | | | Average Annual | |
| | | One
Year | | Five
Years | | Ten
Years | | Since
Inception(8) | |
Fund — Class I Shares
w/o sales charges(4) | | | 35.20 | % | | | 15.09 | % | | | — | | | | 12.43 | % | |
Fund — Class A Shares w/o
sales charges(4) | | | 34.79 | | | | 14.71 | | | | — | | | | 12.08 | | |
Fund — Class A Shares with
maximum 5.25% sales charges(4) | | | 27.70 | | | | 13.47 | | | | — | | | | 11.46 | | |
Fund — Class L Shares w/o
sales charges(4) | | | 34.06 | | | | 14.09 | | | | — | | | | 11.50 | | |
Fund — Class C Shares w/o
sales charges(6) | | | 33.87 | | | | — | | | | — | | | | 12.10 | | |
Fund — Class C Shares with
maximum 1.00% deferred
sales charges(6) | | | 32.87 | | | | — | | | | — | | | | 12.10 | | |
Fund — Class IS Shares w/o
sales charges(5) | | | 35.27 | | | | 15.11 | | | | — | | | | 14.25 | | |
Fund — Class IR Shares w/o
sales charges(7) | | | 35.32 | | | | — | | | | — | | | | 3.70 | | |
MSCI All Country World ex USA
Net Index | | | 21.51 | | | | 5.51 | | | | — | | | | 4.93 | | |
Lipper International Multi-Cap
Growth Funds Index | | | 25.06 | | | | 6.30 | | | | — | | | | 5.96 | | |
Performance data quoted represents past performance, which is no guarantee of future results, and current performance may be lower or higher than the figures shown. Performance assumes that all dividends and distributions, if any, were reinvested. For the most recent month-end performance figures, please visit www.morganstanley.com/im/shareholderreports. Investment return and principal value will fluctuate so that Fund shares, when redeemed, may be worth more or less than their original cost. Total returns do not reflect the deduction of taxes that a shareholder would pay on Fund distributions or the redemption of Fund shares. Performance of share classes will vary due to difference in sales charges and expenses.
(1) The MSCI All Country World ex USA Net Index is a free float-adjusted market capitalization weighted index designed to measure the equity market performance of developed and emerging markets, excluding the United States. The term "free float" represents the portion of shares outstanding that are deemed to be available for purchase in the public equity markets by investors. The performance of the Index is listed in U.S. dollars and assumes reinvestment of net dividends. Net total return indices reinvest dividends after the deduction of withholding taxes, using (for international indices) a tax rate applicable to nonresident institutional investors who do not benefit from double taxation treaties. The Index is unmanaged and its returns do not include any sales charges or fees. Such costs would lower performance. It is not possible to invest directly in an index.
5
Morgan Stanley Institutional Fund, Inc.
Annual Report — December 31, 2019
Investment Overview (unaudited) (cont'd)
International Opportunity Portfolio
(2) The Lipper International Multi-Cap Growth Funds Index is an equally weighted performance index of the largest qualifying funds (based on net assets) in the Lipper International Multi-Cap Growth Funds classification. The Index, which is adjusted for capital gains distributions and income dividends, is unmanaged and should not be considered an investment. There are currently 30 funds represented in this Index. As of the date of this report, the Fund was in the Lipper International Multi-Cap Growth Funds classification.
(3) Total returns for the Fund reflect fees waived and expenses reimbursed, if applicable, by the Adviser (as defined herein). Without such waivers and reimbursements, total returns would have been lower.
(4) Commenced operations on March 31, 2010.
(5) Commenced offering on September 13, 2013.
(6) Commenced offering on April 30, 2015.
(7) Commenced offering on June 15, 2018.
(8) For comparative purposes, average annual since inception returns listed for the Indexes refer to the inception date of Class I of the Fund, not the inception of the Index.
6
Morgan Stanley Institutional Fund, Inc.
Annual Report — December 31, 2019
Portfolio of Investments
International Opportunity Portfolio
| | | Shares | | Value
(000) | |
Common Stocks (92.0%) | |
Argentina (1.6%) | |
Globant SA (a) | | | 278,318 | | | $ | 29,516 | | |
China (25.1%) | |
China East Education Holdings Ltd. (a)(b)(c) | | | 17,735,000 | | | | 37,144 | | |
China Resources Beer Holdings Co., Ltd. (b) | | | 6,152,666 | | | | 34,031 | | |
Foshan Haitian Flavouring & Food Co., Ltd.,
Class A | | | 2,924,872 | | | | 45,143 | | |
Haidilao International Holding Ltd. (b)(d) | | | 4,921,000 | | | | 19,766 | | |
Huazhu Group Ltd. ADR | | | 1,032,984 | | | | 41,392 | | |
HUYA, Inc. ADR (a)(c) | | | 1,421,530 | | | | 25,516 | | |
Kweichow Moutai Co., Ltd., Class A | | | 141,514 | | | | 24,034 | | |
Meituan Dianping, Class B (a)(b) | | | 4,660,800 | | | | 60,949 | | |
Shenzhou International Group Holdings Ltd. (b) | | | 2,048,500 | | | | 29,943 | | |
TAL Education Group ADR (a) | | | 2,265,991 | | | | 109,221 | | |
Trip.com Group Ltd. ADR (a) | | | 1,004,556 | | | | 33,693 | | |
| | | | 460,832 | | |
Denmark (5.3%) | |
DSV A/S | | | 848,050 | | | | 97,760 | | |
France (3.9%) | |
Hermes International | | | 95,959 | | | | 71,708 | | |
Germany (4.2%) | |
Adidas AG | | | 116,987 | | | | 38,081 | | |
Nemetschek SE | | | 601,533 | | | | 39,628 | | |
| | | | 77,709 | | |
India (6.2%) | |
HDFC Bank Ltd. | | | 4,785,023 | | | | 85,279 | | |
Kotak Mahindra Bank Ltd. | | | 1,213,704 | | | | 28,640 | | |
| | | | 113,919 | | |
Italy (5.4%) | |
Moncler SpA | | | 2,183,972 | | | | 98,295 | | |
Japan (10.2%) | |
Calbee, Inc. | | | 699,100 | | | | 22,778 | | |
Demae-Can Co., Ltd. (c) | | | 1,484,600 | | | | 15,307 | | |
Keyence Corp. | | | 210,000 | | | | 73,739 | | |
Nihon M&A Center, Inc. | | | 1,515,900 | | | | 52,166 | | |
Pigeon Corp. (c) | | | 650,700 | | | | 23,826 | | |
| | | | 187,816 | | |
Korea, Republic of (2.4%) | |
NAVER Corp. | | | 271,378 | | | | 43,663 | | |
Netherlands (1.9%) | |
ASML Holding N.V. | | | 118,724 | | | | 35,118 | | |
Sweden (2.0%) | |
Vitrolife AB | | | 1,735,522 | | | | 36,689 | | |
Switzerland (1.9%) | |
Chocoladefabriken Lindt & Spruengli AG
(Registered) | | | 386 | | | | 34,087 | | |
Taiwan (3.4%) | |
Taiwan Semiconductor Manufacturing Co., Ltd. | | | 5,698,000 | | | | 62,916 | | |
| | | Shares | | Value
(000) | |
United Kingdom (5.0%) | |
Fevertree Drinks PLC | | | 1,318,577 | | | $ | 36,556 | | |
Reckitt Benckiser Group PLC | | | 249,790 | | | | 20,279 | | |
Rightmove PLC | | | 4,110,727 | | | | 34,500 | | |
| | | | 91,335 | | |
United States (13.5%) | |
Booking Holdings, Inc. (a) | | | 24,534 | | | | 50,386 | | |
EPAM Systems, Inc. (a) | | | 364,947 | | | | 77,427 | | |
Farfetch Ltd., Class A (a) | | | 2,887,221 | | | | 29,883 | | |
MercadoLibre, Inc. (a) | | | 44,253 | | | | 25,310 | | |
New Frontier Health Corp. (a) | | | 1,583,308 | | | | 15,538 | | |
Spotify Technology SA (a) | | | 323,125 | | | | 48,323 | | |
| | | | 246,867 | | |
Total Common Stocks (Cost $1,355,145) | | | 1,688,230 | | |
Short-Term Investments (8.8%) | |
Securities held as Collateral on Loaned Securities (0.1%) | |
Investment Company (0.1%) | |
Morgan Stanley Institutional Liquidity
Funds — Treasury Securities Portfolio —
Institutional Class (See Note G) | | | 2,403,960 | | | | 2,404 | | |
| | | Face
Amount
(000) | | | |
Repurchase Agreements (0.0%) | |
HSBC Securities USA, Inc., (1.55%, dated
12/31/19, due 1/2/20; proceeds $83;
fully collateralized by a U.S. Government
obligation; 2.88% due 8/15/28;
valued at $85) | | $ | 83 | | | | 83 | | |
Merrill Lynch & Co., Inc., (1.55%,
dated 12/31/19, due 1/2/20; proceeds
$249; fully collateralized by a
U.S. Government obligation;
1.63% due 11/30/26;
valued at $254) | | | 249 | | | | 249 | | |
| | | | 332 | | |
Total Securities held as Collateral on Loaned
Securities (Cost $2,736) | | | 2,736 | | |
| | | Shares | | | |
Investment Company (8.7%) | |
Morgan Stanley Institutional Liquidity
Funds — Treasury Securities Portfolio —
Institutional Class (See Note G)
(Cost $159,129) | | | 159,129,026 | | | | 159,129 | | |
Total Short-Term Investments (Cost $161,865) | | | 161,865 | | |
Total Investments Excluding Purchased Options
(100.8%) (Cost $1,517,010) | | | | | 1,850,095 | | |
Total Purchased Options Outstanding (0.0%)
(Cost $4,002) | | | 495 | | |
Total Investments (100.8%) (Cost $1,521,012)
Including $19,831 of Securities Loaned (e)(f) | | | 1,850,590 | | |
Liabilities in Excess of Other Assets (–0.8%) | | | (15,550 | ) | |
Net Assets (100.0%) | | $ | 1,835,040 | | |
The accompanying notes are an integral part of the financial statements.
7
Morgan Stanley Institutional Fund, Inc.
Annual Report — December 31, 2019
Portfolio of Investments (cont'd)
International Opportunity Portfolio
Country assignments and aggregations are based generally on third party vendor classifications and information, and may be different from the assignments and aggregations under the policies set forth in the Fund's prospectus and/or statement of additional information relating to geographic classifications.
(a) Non-income producing security.
(b) Security trades on the Hong Kong exchange.
(c) All or a portion of this security was on loan at December 31, 2019.
(d) 144A security — Certain conditions for public sale may exist. Unless otherwise noted, these securities are deemed to be liquid.
(e) The approximate fair value and percentage of net assets, $576,019,000 and 31.4%, respectively, represent the securities that have been fair valued under the fair valuation policy for international investments as described in Note A-1 within the Notes to the Financial Statements.
(f) At December 31, 2019, the aggregate cost for federal income tax purposes is approximately $1,523,676,000. The aggregate gross unrealized appreciation is approximately $388,551,000 and the aggregate gross unrealized depreciation is approximately $61,637,000, resulting in net unrealized appreciation of approximately $326,914,000.
ADR American Depositary Receipt.
Call Options Purchased:
The Fund had the following call options purchased open at December 31, 2019:
Counterparty | | Description | | Strike
Price | | Expiration
Date | | Number of
Contracts | | Notional
Amount
(000) | | Value
(000) | | Premiums
Paid
(000) | | Unrealized
Depreciation
(000) | |
BNP Paribas | | USD/CNH | | CNH | 7.58 | | | Jan-20 | | | 205,952,091 | | | | 205,952 | | | $ | 1 | | | $ | 1,054 | | | $ | (1,053 | ) | |
Royal Bank of Scotland | | USD/CNH | | CNH | 7.85 | | | Jun-20 | | | 276,248,817 | | | | 276,249 | | | | 181 | | | | 1,426 | | | | (1,245 | ) | |
Royal Bank of Scotland | | USD/CNH | | CNH | 8.09 | | | Sep-20 | | | 282,130,187 | | | | 282,130 | | | | 313 | | | | 1,522 | | | | (1,209 | ) | |
| | | | | | | | | | | | | $ | 495 | | | $ | 4,002 | | | $ | (3,507 | ) | |
CNH — Chinese Yuan Renminbi Offshore.
USD — United States Dollar.
Portfolio Composition*
Classification | | Percentage of
Total Investments | |
Other** | | | 31.5 | % | |
Textiles, Apparel & Luxury Goods | | | 12.9 | | |
Internet & Direct Marketing Retail | | | 11.7 | | |
Short-Term Investments | | | 8.6 | | |
Diversified Consumer Services | | | 7.9 | | |
Banks | | | 6.2 | | |
Food Products | | | 5.5 | | |
Semiconductors & Semiconductor Equipment | | | 5.3 | | |
Air Freight & Logistics | | | 5.3 | | |
Beverages | | | 5.1 | | |
Total Investments | | | 100.0 | % | |
* Percentages indicated are based upon total investments (excluding Securities held as Collateral on Loaned Securities) as of December 31, 2019.
** Industries and/or investment types representing less than 5% of total investments.
The accompanying notes are an integral part of the financial statements.
8
Morgan Stanley Institutional Fund, Inc.
Annual Report — December 31, 2019
International Opportunity Portfolio
Statement of Assets and Liabilities | | December 31, 2019
(000) | |
Assets: | |
Investments in Securities of Unaffiliated Issuers, at Value(1) (Cost $1,359,479) | | $ | 1,689,057 | | |
Investment in Security of Affiliated Issuer, at Value (Cost $161,533) | | | 161,533 | | |
Total Investments in Securities, at Value (Cost $1,521,012) | | | 1,850,590 | | |
Foreign Currency, at Value (Cost $5,300) | | | 5,293 | | |
Cash from Securities Lending | | | 44 | | |
Receivable for Fund Shares Sold | | | 11,037 | | |
Dividends Receivable | | | 547 | | |
Tax Reclaim Receivable | | | 239 | | |
Receivable from Affiliate | | | 213 | | |
Receivable for Investments Sold | | | 161 | | |
Receivable from Securities Lending Income | | | 9 | | |
Other Assets | | | 83 | | |
Total Assets | | | 1,868,216 | | |
Liabilities: | |
Payable for Investments Purchased | | | 23,395 | | |
Payable for Advisory Fees | | | 2,932 | | |
Collateral on Securities Loaned, at Value | | | 2,780 | | |
Deferred Capital Gain Country Tax | | | 1,431 | | |
Payable for Fund Shares Redeemed | | | 1,166 | | |
Due to Broker | | | 840 | | |
Payable for Sub Transfer Agency Fees — Class I | | | 137 | | |
Payable for Sub Transfer Agency Fees — Class A | | | 36 | | |
Payable for Sub Transfer Agency Fees — Class L | | | — | @ | |
Payable for Sub Transfer Agency Fees — Class C | | | 5 | | |
Payable for Administration Fees | | | 120 | | |
Payable for Shareholder Services Fees — Class A | | | 70 | | |
Payable for Distribution and Shareholder Services Fees — Class L | | | — | @ | |
Payable for Distribution and Shareholder Services Fees — Class C | | | 44 | | |
Payable for Professional Fees | | | 86 | | |
Payable for Custodian Fees | | | 46 | | |
Payable for Transfer Agency Fees — Class I | | | 16 | | |
Payable for Transfer Agency Fees — Class A | | | 3 | | |
Payable for Transfer Agency Fees — Class L | | | — | @ | |
Payable for Transfer Agency Fees — Class C | | | 3 | | |
Payable for Transfer Agency Fees — Class IS | | | 3 | | |
Payable for Transfer Agency Fees — Class IR | | | — | @ | |
Other Liabilities | | | 63 | | |
Total Liabilities | | | 33,176 | | |
Net Assets | | $ | 1,835,040 | | |
Net Assets Consist of: | |
Paid-in-Capital | | $ | 1,549,693 | | |
Total Distributable Earnings | | | 285,347 | | |
Net Assets | | $ | 1,835,040 | | |
The accompanying notes are an integral part of the financial statements.
9
Morgan Stanley Institutional Fund, Inc.
Annual Report — December 31, 2019
International Opportunity Portfolio
Statement of Assets and Liabilities (cont'd) | | December 31, 2019
(000) | |
CLASS I: | |
Net Assets | | $ | 1,284,678 | | |
| Shares Outstanding $0.001 par value shares of beneficial interest (unlimited shares authorized) (not in 000's) | | | 48,067,106 | | |
Net Asset Value, Offering and Redemption Price Per Share | | $ | 26.73 | | |
CLASS A: | |
Net Assets | | $ | 336,109 | | |
| Shares Outstanding $0.001 par value shares of beneficial interest (unlimited shares authorized) (not in 000's) | | | 12,813,335 | | |
Net Asset Value, Redemption Price Per Share | | $ | 26.23 | | |
Maximum Sales Load | | | 5.25 | % | |
Maximum Sales Charge | | $ | 1.45 | | |
Maximum Offering Price Per Share | | $ | 27.68 | | |
CLASS L: | |
Net Assets | | $ | 512 | | |
| Shares Outstanding $0.001 par value shares of beneficial interest (unlimited shares authorized) (not in 000's) | | | 20,278 | | |
Net Asset Value, Offering and Redemption Price Per Share | | $ | 25.23 | | |
CLASS C: | |
Net Assets | | $ | 53,257 | | |
| Shares Outstanding $0.001 par value shares of beneficial interest (unlimited shares authorized) (not in 000's) | | | 2,135,657 | | |
Net Asset Value, Offering and Redemption Price Per Share | | $ | 24.94 | | |
CLASS IS: | |
Net Assets | | $ | 50,083 | | |
| Shares Outstanding $0.001 par value shares of beneficial interest (unlimited shares authorized) (not in 000's) | | | 1,870,636 | | |
Net Asset Value, Offering and Redemption Price Per Share | | $ | 26.77 | | |
CLASS IR: | |
Net Assets | | $ | 110,401 | | |
| Shares Outstanding $0.001 par value shares of beneficial interest (unlimited shares authorized) (not in 000's) | | | 4,122,237 | | |
Net Asset Value, Offering and Redemption Price Per Share | | $ | 26.78 | | |
(1) Including:
Securities on Loan, at Value: | | $ | 19,831 | | |
@ Amount is less than $500.
The accompanying notes are an integral part of the financial statements.
10
Morgan Stanley Institutional Fund, Inc.
Annual Report — December 31, 2019
International Opportunity Portfolio
Statement of Operations | | Year Ended
December 31, 2019
(000) | |
Investment Income: | |
Dividends from Securities of Unaffiliated Issuers (Net of $1,104 of Foreign Taxes Withheld) | | $ | 9,271 | | |
Dividends from Security of Affiliated Issuer (Note G) | | | 1,864 | | |
Income from Securities Loaned — Net | | | 847 | | |
Total Investment Income | | | 11,982 | | |
Expenses: | |
Advisory Fees (Note B) | | | 11,229 | | |
Sub Transfer Agency Fees — Class I | | | 970 | | |
Sub Transfer Agency Fees — Class A | | | 352 | | |
Sub Transfer Agency Fees — Class L | | | — | @ | |
Sub Transfer Agency Fees — Class C | | | 35 | | |
Shareholder Services Fees — Class A (Note D) | | | 717 | | |
Distribution and Shareholder Services Fees — Class L (Note D) | | | 3 | | |
Distribution and Shareholder Services Fees — Class C (Note D) | | | 447 | | |
Administration Fees (Note C) | | | 1,144 | | |
Custodian Fees (Note F) | | | 283 | | |
Registration Fees | | | 183 | | |
Professional Fees | | | 149 | | |
Shareholder Reporting Fees | | | 122 | | |
Transfer Agency Fees — Class I (Note E) | | | 63 | | |
Transfer Agency Fees — Class A (Note E) | | | 9 | | |
Transfer Agency Fees — Class L (Note E) | | | 2 | | |
Transfer Agency Fees — Class C (Note E) | | | 12 | | |
Transfer Agency Fees — Class IS (Note E) | | | 10 | | |
Transfer Agency Fees — Class IR (Note E) | | | 2 | | |
Directors' Fees and Expenses | | | 73 | | |
Pricing Fees | | | 3 | | |
Other Expenses | | | 58 | | |
Total Expenses | | | 15,866 | | |
Reimbursement of Class Specific Expenses — Class I (Note B) | | | (305 | ) | |
Reimbursement of Class Specific Expenses — Class L (Note B) | | | (2 | ) | |
Reimbursement of Class Specific Expenses — Class IS (Note B) | | | (10 | ) | |
Rebate from Morgan Stanley Affiliate (Note G) | | | (183 | ) | |
Net Expenses | | | 15,366 | | |
Net Investment Loss | | | (3,384 | ) | |
Realized Loss: | |
Investments Sold | | | (17,182 | ) | |
Foreign Currency Translation | | | (186 | ) | |
Net Realized Loss | | | (17,368 | ) | |
Change in Unrealized Appreciation (Depreciation): | |
Investments (Net of Increase in Deferred Capital Gain Country Tax of $1,431) | | | 417,131 | | |
Foreign Currency Translation | | | (15 | ) | |
Net Change in Unrealized Appreciation (Depreciation) | | | 417,116 | | |
Net Realized Loss and Change in Unrealized Appreciation (Depreciation) | | | 399,748 | | |
Net Increase in Net Assets Resulting from Operations | | $ | 396,364 | | |
@ Amount is less than $500.
The accompanying notes are an integral part of the financial statements.
11
Morgan Stanley Institutional Fund, Inc.
Annual Report — December 31, 2019
International Opportunity Portfolio
Statements of Changes in Net Assets | | Year Ended
December 31, 2019
(000) | | Year Ended
December 31, 2018
(000) | |
Increase (Decrease) in Net Assets: | |
Operations: | |
Net Investment Loss | | $ | (3,384 | ) | | $ | (3,298 | ) | |
Net Realized Loss | | | (17,368 | ) | | | (27,142 | ) | |
Net Change in Unrealized Appreciation (Depreciation) | | | 417,116 | | | | (171,427 | ) | |
Net Increase (Decrease) in Net Assets Resulting from Operations | | | 396,364 | | | | (201,867 | ) | |
Dividends and Distributions to Shareholders: | |
Class I | | | — | | | | (1,559 | ) | |
Class A | | | — | | | | (642 | ) | |
Class L | | | — | | | | (1 | ) | |
Class C | | | — | | | | (92 | ) | |
Class IS | | | — | | | | (212 | ) | |
Class IR | | | — | | | | (8 | ) | |
Total Dividends and Distributions to Shareholders | | | — | | | | (2,514 | ) | |
Capital Share Transactions:(1) | |
Class I: | |
Subscribed | | | 585,257 | | | | 760,795 | | |
Distributions Reinvested | | | — | | | | 1,546 | | |
Redeemed | | | (219,531 | ) | | | (336,583 | ) | |
Class A: | |
Subscribed | | | 121,390 | | | | 289,203 | | |
Distributions Reinvested | | | — | | | | 642 | | |
Redeemed | | | (88,729 | ) | | | (208,727 | ) | |
Class L: | |
Exchanged | | | — | | | | 70 | | |
Distributions Reinvested | | | — | | | | 1 | | |
Class C: | |
Subscribed | | | 15,512 | | | | 32,690 | | |
Distributions Reinvested | | | — | | | | 92 | | |
Redeemed | | | (9,844 | ) | | | (13,408 | ) | |
Class IS: | |
Subscribed | | | 43,659 | | | | 59,381 | | |
Distributions Reinvested | | | — | | | | 212 | | |
Redeemed | | | (13,026 | ) | | | (105,874 | ) | |
Class IR: | |
Subscribed | | | — | | | | 101,727 | (a) | |
Distributions Reinvested | | | — | | | | 8 | (a) | |
Net Increase in Net Assets Resulting from Capital Share Transactions | | | 434,688 | | | | 581,775 | | |
Redemption Fees | | | 23 | | | | 115 | | |
Total Increase in Net Assets | | | 831,075 | | | | 377,509 | | |
Net Assets: | |
Beginning of Period | | | 1,003,965 | | | | 626,456 | | |
End of Period | | $ | 1,835,040 | | | $ | 1,003,965 | | |
The accompanying notes are an integral part of the financial statements.
12
Morgan Stanley Institutional Fund, Inc.
Annual Report — December 31, 2019
International Opportunity Portfolio
Statements of Changes in Net Assets (cont'd) | | Year Ended
December 31, 2019
(000) | | Year Ended
December 31, 2018
(000) | |
(1) Capital Share Transactions: | |
Class I: | |
Shares Subscribed | | | 24,447 | | | | 32,491 | | |
Shares Issued on Distributions Reinvested | | | — | | | | 64 | | |
Shares Redeemed | | | (9,242 | ) | | | (15,594 | ) | |
Net Increase in Class I Shares Outstanding | | | 15,205 | | | | 16,961 | | |
Class A: | |
Shares Subscribed | | | 5,170 | | | | 12,370 | | |
Shares Issued on Distributions Reinvested | | | — | | | | 27 | | |
Shares Redeemed | | | (3,822 | ) | | | (9,337 | ) | |
Net Increase in Class A Shares Outstanding | | | 1,348 | | | | 3,060 | | |
Class L: | |
Shares Exchanged | | | — | | | | 3 | | |
Shares Issued on Distributions Reinvested | | | — | | | | — | @@ | |
Shares Redeemed | | | — | | | | (— | @@) | |
Net Increase in Class L Shares Outstanding | | | — | | | | 3 | | |
Class C: | |
Shares Subscribed | | | 682 | | | | 1,444 | | |
Shares Issued on Distributions Reinvested | | | — | | | | 4 | | |
Shares Redeemed | | | (440 | ) | | | (641 | ) | |
Net Increase in Class C Shares Outstanding | | | 242 | | | | 807 | | |
Class IS: | |
Shares Subscribed | | | 1,703 | | | | 2,436 | | |
Shares Issued on Distributions Reinvested | | | — | | | | 9 | | |
Shares Redeemed | | | (540 | ) | | | (4,293 | ) | |
Net Increase (Decrease) in Class IS Shares Outstanding | | | 1,163 | | | | (1,848 | ) | |
Class IR: | |
Shares Subscribed | | | — | | | | 4,122 | (a) | |
Shares Issued on Distributions Reinvested | | | — | | | | — | @@ | |
Net Increase in Class IR Shares Outstanding | | | — | | | | 4,122 | (a) | |
(a) For the period June 15, 2018 through December 31, 2018.
@@ Amount is less than 500 shares.
The accompanying notes are an integral part of the financial statements.
13
Morgan Stanley Institutional Fund, Inc.
Annual Report — December 31, 2019
Financial Highlights
International Opportunity Portfolio
| | | Class I | |
| | | Year Ended December 31, | |
Selected Per Share Data and Ratios | | 2019 | | 2018 | | 2017 | | 2016(1) | | 2015 | |
Net Asset Value, Beginning of Period | | $ | 19.77 | | | $ | 22.52 | | | $ | 14.93 | | | $ | 15.03 | | | $ | 13.92 | | |
Income (Loss) from Investment Operations: | |
Net Investment Loss(2) | | | (0.04 | ) | | | (0.04 | ) | | | (0.08 | ) | | | (0.03 | ) | | | (0.00 | )(3) | |
Net Realized and Unrealized Gain (Loss) | | | 7.00 | | | | (2.66 | ) | | | 8.04 | | | | (0.07 | ) | | | 1.58 | | |
Total from Investment Operations | | | 6.96 | | | | (2.70 | ) | | | 7.96 | | | | (0.10 | ) | | | 1.58 | | |
Distributions from and/or in Excess of: | |
Net Investment Income | | | — | | | | — | | | | — | | | | (0.00 | )(3) | | | (0.03 | ) | |
Net Realized Gain | | | — | | | | (0.05 | ) | | | (0.37 | ) | | | — | | | | (0.44 | ) | |
Total Distributions | | | — | | | | (0.05 | ) | | | (0.37 | ) | | | (0.00 | )(3) | | | (0.47 | ) | |
Redemption Fees | | | 0.00 | (3) | | | 0.00 | (3) | | | 0.00 | (3) | | | 0.00 | (3) | | | 0.00 | (3) | |
Net Asset Value, End of Period | | $ | 26.73 | | | $ | 19.77 | | | $ | 22.52 | | | $ | 14.93 | | | $ | 15.03 | | |
Total Return(4) | | | 35.20 | % | | | (12.04 | )% | | | 53.38 | % | | | (0.65 | )% | | | 11.40 | % | |
Ratios to Average Net Assets and Supplemental Data: | |
Net Assets, End of Period (Thousands) | | $ | 1,284,678 | | | $ | 649,580 | | | $ | 358,141 | | | $ | 62,440 | | | $ | 52,128 | | |
Ratio of Expenses Before Expense Limitation | | | 1.03 | % | | | 1.04 | % | | | 1.10 | % | | | 1.34 | % | | | 1.95 | % | |
Ratio of Expenses After Expense Limitation | | | 0.99 | %(5) | | | 0.99 | %(5) | | | 0.98 | %(5) | | | 1.00 | %(5) | | | 1.01 | %(5)(6) | |
Ratio of Net Investment Loss | | | (0.15 | )%(5) | | | (0.19 | )%(5) | | | (0.42 | )%(5) | | | (0.22 | )%(5) | | | (0.01 | )%(5) | |
Ratio of Rebate from Morgan Stanley Affiliates | | | 0.01 | % | | | 0.01 | % | | | 0.02 | % | | | 0.00 | %(7) | | | 0.01 | % | |
Portfolio Turnover Rate | | | 20 | % | | | 36 | % | | | 30 | % | | | 42 | % | | | 51 | % | |
(1) Reflects prior period custodian out-of-pocket expenses that were reimbursed in September 2016. The amount of the reimbursement was immaterial on a per share basis and did not impact the total return of Class I shares. The Ratio of Expenses After Expense Limitation and the Ratio of Net Investment Loss would be unchanged as the reimbursement of custodian fees was offset against expense waivers/reimbursements with no impact to net expenses or net investment loss.
(2) Per share amount is based on average shares outstanding.
(3) Amount is less than $0.005 per share.
(4) Calculated based on the net asset value as of the last business day of the period.
(5) The Ratio of Expenses After Expense Limitation and Ratio of Net Investment Loss reflect the rebate of certain Fund expenses in connection with the investments in Morgan Stanley affiliates during the period. The effect of the rebate on the ratios is disclosed in the above table as "Ratio of Rebate from Morgan Stanley Affiliates."
(6) Effective July 1, 2015, the Adviser has agreed to limit the ratio of expenses to average net assets to the maximum ratio of 1.00% for Class I shares. Prior to July 1, 2015, the maximum ratio was 1.15% for Class I shares.
(7) Amount is less than 0.005%.
The accompanying notes are an integral part of the financial statements.
14
Morgan Stanley Institutional Fund, Inc.
Annual Report — December 31, 2019
Financial Highlights
International Opportunity Portfolio
| | | Class A | |
| | | Year Ended December 31, | |
Selected Per Share Data and Ratios | | 2019 | | 2018 | | 2017 | | 2016(1) | | 2015 | |
Net Asset Value, Beginning of Period | | $ | 19.46 | | | $ | 22.25 | | | $ | 14.79 | | | $ | 14.93 | | | $ | 13.87 | | |
Income (Loss) from Investment Operations: | |
Net Investment Loss(2) | | | (0.10 | ) | | | (0.11 | ) | | | (0.15 | ) | | | (0.08 | ) | | | (0.06 | ) | |
Net Realized and Unrealized Gain (Loss) | | | 6.87 | | | | (2.63 | ) | | | 7.98 | | | | (0.06 | ) | | | 1.57 | | |
Total from Investment Operations | | | 6.77 | | | | (2.74 | ) | | | 7.83 | | | | (0.14 | ) | | | 1.51 | | |
Distributions from and/or in Excess of: | |
Net Investment Income | | | — | | | | — | | | | — | | | | — | | | | (0.01 | ) | |
Net Realized Gain | | | — | | | | (0.05 | ) | | | (0.37 | ) | | | — | | | | (0.44 | ) | |
Total Distributions | | | — | | | | (0.05 | ) | | | (0.37 | ) | | | — | | | | (0.45 | ) | |
Redemption Fees | | | 0.00 | (3) | | | 0.00 | (3) | | | 0.00 | (3) | | | 0.00 | (3) | | | 0.00 | (3) | |
Net Asset Value, End of Period | | $ | 26.23 | | | $ | 19.46 | | | $ | 22.25 | | | $ | 14.79 | | | $ | 14.93 | | |
Total Return(4) | | | 34.79 | % | | | (12.36 | )% | | | 53.01 | % | | | (1.00 | )% | | | 10.99 | % | |
Ratios to Average Net Assets and Supplemental Data: | |
Net Assets, End of Period (Thousands) | | $ | 336,109 | | | $ | 223,098 | | | $ | 186,988 | | | $ | 11,727 | | | $ | 9,520 | | |
Ratio of Expenses Before Expense Limitation | | | 1.30 | % | | | 1.34 | % | | | 1.36 | % | | | 1.66 | % | | | 2.28 | % | |
Ratio of Expenses After Expense Limitation | | | 1.29 | %(5) | | | 1.33 | %(5) | | | 1.27 | %(5) | | | 1.35 | %(5) | | | 1.34 | %(5)(6) | |
Ratio of Net Investment Loss | | | (0.44 | )%(5) | | | (0.51 | )%(5) | | | (0.74 | )%(5) | | | (0.55 | )%(5) | | | (0.39 | )%(5) | |
Ratio of Rebate from Morgan Stanley Affiliates | | | 0.01 | % | | | 0.01 | % | | | 0.02 | % | | | 0.00 | %(7) | | | 0.01 | % | |
Portfolio Turnover Rate | | | 20 | % | | | 36 | % | | | 30 | % | | | 42 | % | | | 51 | % | |
(1) Reflects prior period custodian out-of-pocket expenses that were reimbursed in September 2016. The amount of the reimbursement was immaterial on a per share basis and did not impact the total return of Class A shares. The Ratio of Expenses After Expense Limitation and the Ratio of Net Investment Loss would be unchanged as the reimbursement of custodian fees was offset against expense waivers/reimbursements with no impact to net expenses or net investment loss.
(2) Per share amount is based on average shares outstanding.
(3) Amount is less than $0.005 per share.
(4) Calculated based on the net asset value which does not reflect sales charges, if applicable, as of the last business day of the period.
(5) The Ratio of Expenses After Expense Limitation and Ratio of Net Investment Loss reflect the rebate of certain Fund expenses in connection with the investments in Morgan Stanley affiliates during the period. The effect of the rebate on the ratios is disclosed in the above table as "Ratio of Rebate from Morgan Stanley Affiliates."
(6) Effective July 1, 2015, the Adviser has agreed to limit the ratio of expenses to average net assets to the maximum ratio of 1.35% for Class A shares. Prior to July 1, 2015, the maximum ratio was 1.50% for Class A shares.
(7) Amount is less than 0.005%.
The accompanying notes are an integral part of the financial statements.
15
Morgan Stanley Institutional Fund, Inc.
Annual Report — December 31, 2019
Financial Highlights
International Opportunity Portfolio
| | | Class L | |
| | | Year Ended December 31, | |
Selected Per Share Data and Ratios | | 2019 | | 2018 | | 2017 | | 2016(1) | | 2015 | |
Net Asset Value, Beginning of Period | | $ | 18.82 | | | $ | 21.63 | | | $ | 14.47 | | | $ | 14.69 | | | $ | 13.71 | | |
Income (Loss) from Investment Operations: | |
Net Investment Loss(2) | | | (0.23 | ) | | | (0.22 | ) | | | (0.22 | ) | | | (0.14 | ) | | | (0.12 | ) | |
Net Realized and Unrealized Gain (Loss) | | | 6.64 | | | | (2.54 | ) | | | 7.75 | | | | (0.08 | ) | | | 1.54 | | |
Total from Investment Operations | | | 6.41 | | | | (2.76 | ) | | | 7.53 | | | | (0.22 | ) | | | 1.42 | | |
Distributions from and/or in Excess of: | |
Net Realized Gain | | | — | | | | (0.05 | ) | | | (0.37 | ) | | | — | | | | (0.44 | ) | |
Redemption Fees | | | 0.00 | (3) | | | 0.00 | (3) | | | 0.00 | (3) | | | 0.00 | (3) | | | 0.00 | (3) | |
Net Asset Value, End of Period | | $ | 25.23 | | | $ | 18.82 | | | $ | 21.63 | | | $ | 14.47 | | | $ | 14.69 | | |
Total Return(4) | | | 34.06 | % | | | (12.81 | )% | | | 52.11 | % | | | (1.50 | )% | | | 10.38 | % | |
Ratios to Average Net Assets and Supplemental Data: | |
Net Assets, End of Period (Thousands) | | $ | 512 | | | $ | 382 | | | $ | 364 | | | $ | 221 | | | $ | 266 | | |
Ratio of Expenses Before Expense Limitation | | | 2.19 | % | | | 2.28 | % | | | 2.51 | % | | | 3.16 | % | | | 3.54 | % | |
Ratio of Expenses After Expense Limitation | | | 1.84 | %(5) | | | 1.84 | %(5) | | | 1.84 | %(5) | | | 1.85 | %(5) | | | 1.91 | %(5)(6) | |
Ratio of Net Investment Loss | | | (0.99 | )%(5) | | | (1.02 | )%(5) | | | (1.16 | )%(5) | | | (1.00 | )%(5) | | | (0.80 | )%(5) | |
Ratio of Rebate from Morgan Stanley Affiliates | | | 0.01 | % | | | 0.01 | % | | | 0.01 | % | | | 0.00 | %(7) | | | 0.01 | % | |
Portfolio Turnover Rate | | | 20 | % | | | 36 | % | | | 30 | % | | | 42 | % | | | 51 | % | |
(1) Reflects prior period custodian out-of-pocket expenses that were reimbursed in September 2016. The amount of the reimbursement was immaterial on a per share basis and did not impact the total return of Class L shares. The Ratio of Expenses After Expense Limitation and the Ratio of Net Investment Loss would be unchanged as the reimbursement of custodian fees was offset against expense waivers/reimbursements with no impact to net expenses or net investment loss.
(2) Per share amount is based on average shares outstanding.
(3) Amount is less than $0.005 per share.
(4) Calculated based on the net asset value as of the last business day of the period.
(5) The Ratio of Expenses After Expense Limitation and Ratio of Net Investment Loss reflect the rebate of certain Fund expenses in connection with the investments in Morgan Stanley affiliates during the period. The effect of the rebate on the ratios is disclosed in the above table as "Ratio of Rebate from Morgan Stanley Affiliates."
(6) Effective July 1, 2015, the Adviser has agreed to limit the ratio of expenses to average net assets to the maximum ratio of 1.85% for Class L shares. Prior to July 1, 2015, the maximum ratio was 2.00% for Class L shares.
(7) Amount is less than 0.005%.
The accompanying notes are an integral part of the financial statements.
16
Morgan Stanley Institutional Fund, Inc.
Annual Report — December 31, 2019
Financial Highlights
International Opportunity Portfolio
| | | Class C | |
| | | Year Ended December 31, | | Period from
April 30, 2015(2) to | |
Selected Per Share Data and Ratios | | 2019 | | 2018 | | 2017 | | 2016(1) | | December 31, 2015 | |
Net Asset Value, Beginning of Period | | $ | 18.63 | | | $ | 21.46 | | | $ | 14.39 | | | $ | 14.63 | | | $ | 15.39 | | |
Income (Loss) from Investment Operations: | |
Net Investment Loss(3) | | | (0.26 | ) | | | (0.27 | ) | | | (0.29 | ) | | | (0.19 | ) | | | (0.13 | ) | |
Net Realized and Unrealized Gain (Loss) | | | 6.57 | | | | (2.51 | ) | | | 7.73 | | | | (0.05 | ) | | | (0.16 | ) | |
Total from Investment Operations | | | 6.31 | | | | (2.78 | ) | | | 7.44 | | | | (0.24 | ) | | | (0.29 | ) | |
Distributions from and/or in Excess of: | |
Net Investment Income | | | — | | | | — | | | | — | | | | — | | | | (0.03 | ) | |
Net Realized Gain | | | — | | | | (0.05 | ) | | | (0.37 | ) | | | — | | | | (0.44 | ) | |
Total Distributions | | | — | | | | (0.05 | ) | | | (0.37 | ) | | | — | | | | (0.47 | ) | |
Redemption Fees | | | 0.00 | (4) | | | 0.00 | (4) | | | 0.00 | (4) | | | 0.00 | (4) | | | 0.00 | (4) | |
Net Asset Value, End of Period | | $ | 24.94 | | | $ | 18.63 | | | $ | 21.46 | | | $ | 14.39 | | | $ | 14.63 | | |
Total Return(5) | | | 33.87 | % | | | (13.00 | )% | | | 51.77 | % | | | (1.71 | )% | | | (1.85 | )%(9) | |
Ratios to Average Net Assets and Supplemental Data: | |
Net Assets, End of Period (Thousands) | | $ | 53,257 | | | $ | 35,297 | | | $ | 23,334 | | | $ | 1,862 | | | $ | 1,776 | | |
Ratio of Expenses Before Expense Limitation | | | 2.03 | % | | | 2.06 | % | | | 2.10 | % | | | 2.43 | % | | | 3.03 | %(10) | |
Ratio of Expenses After Expense Limitation | | | 2.02 | %(6) | | | 2.04 | %(6) | | | 2.01 | %(6) | | | 2.10 | %(6) | | | 2.10 | %(6)(7)(10) | |
Ratio of Net Investment Loss | | | (1.17 | )%(6) | | | (1.24 | )%(6) | | | (1.45 | )%(6) | | | (1.32 | )%(6) | | | (1.28 | )%(6)(10) | |
Ratio of Rebate from Morgan Stanley Affiliates | | | 0.01 | % | | | 0.01 | % | | | 0.02 | % | | | 0.00 | %(8) | | | 0.01 | %(10) | |
Portfolio Turnover Rate | | | 20 | % | | | 36 | % | | | 30 | % | | | 42 | % | | | 51 | % | |
(1) Reflects prior period custodian out-of-pocket expenses that were reimbursed in September 2016. The amount of the reimbursement was immaterial on a per share basis and did not impact the total return of Class C shares. The Ratio of Expenses After Expense Limitation and the Ratio of Net Investment Loss would be unchanged as the reimbursement of custodian fees was offset against expense waivers/reimbursements with no impact to net expenses or net investment loss.
(2) Commencement of Offering.
(3) Per share amount is based on average shares outstanding.
(4) Amount is less than $0.005 per share.
(5) Calculated based on the net asset value which does not reflect sales charges, if applicable, as of the last business day of the period.
(6) The Ratio of Expenses After Expense Limitation and Ratio of Net Investment Loss reflect the rebate of certain Fund expenses in connection with the investments in Morgan Stanley affiliates during the period. The effect of the rebate on the ratios is disclosed in the above table as "Ratio of Rebate from Morgan Stanley Affiliates."
(7) Effective July 1, 2015, the Adviser has agreed to limit the ratio of expenses to average net assets to the maximum ratio of 2.10% for Class C shares. Prior to July 1, 2015, the maximum ratio was 2.25% for Class C shares.
(8) Amount is less than 0.005%.
(9) Not annualized.
(10) Annualized.
The accompanying notes are an integral part of the financial statements.
17
Morgan Stanley Institutional Fund, Inc.
Annual Report — December 31, 2019
Financial Highlights
International Opportunity Portfolio
| | | Class IS | |
| | | Year Ended December 31, | |
Selected Per Share Data and Ratios | | 2019 | | 2018 | | 2017 | | 2016(1) | | 2015 | |
Net Asset Value, Beginning of Period | | $ | 19.79 | | | $ | 22.54 | | | $ | 14.94 | | | $ | 15.03 | | | $ | 13.92 | | |
Income (Loss) from Investment Operations: | |
Net Investment Income (Loss)(2) | | | (0.02 | ) | | | 0.02 | | | | (0.12 | ) | | | (0.03 | ) | | | 0.02 | | |
Net Realized and Unrealized Gain (Loss) | | | 7.00 | | | | (2.72 | ) | | | 8.09 | | | | (0.06 | ) | | | 1.56 | | |
Total from Investment Operations | | | 6.98 | | | | (2.70 | ) | | | 7.97 | | | | (0.09 | ) | | | 1.58 | | |
Distributions from and/or in Excess of: | |
Net Investment Income | | | — | | | | — | | | | — | | | | (0.00 | )(3) | | | (0.03 | ) | |
Net Realized Gain | | | — | | | | (0.05 | ) | | | (0.37 | ) | | | — | | | | (0.44 | ) | |
Total Distributions | | | — | | | | (0.05 | ) | | | (0.37 | ) | | | (0.00 | )(3) | | | (0.47 | ) | |
Redemption Fees | | | 0.00 | (3) | | | 0.00 | (3) | | | 0.00 | (3) | | | 0.00 | (3) | | | 0.00 | (3) | |
Net Asset Value, End of Period | | $ | 26.77 | | | $ | 19.79 | | | $ | 22.54 | | | $ | 14.94 | | | $ | 15.03 | | |
Total Return(4) | | | 35.27 | % | | | (12.03 | )% | | | 53.41 | % | | | (0.64 | )% | | | 11.40 | % | |
Ratios to Average Net Assets and Supplemental Data: | |
Net Assets, End of Period (Thousands) | | $ | 50,083 | | | $ | 14,016 | | | $ | 57,629 | | | $ | 1,030 | | | $ | 12 | | |
Ratio of Expenses Before Expense Limitation | | | 0.98 | % | | | 0.95 | % | | | 1.03 | % | | | 5.64 | % | | | 15.79 | % | |
Ratio of Expenses After Expense Limitation | | | 0.91 | %(5) | | | 0.92 | %(5) | | | 0.92 | %(5) | | | 0.93 | %(5) | | | 1.01 | %(5)(6) | |
Ratio of Net Investment Income (Loss) | | | (0.07 | )%(5) | | | 0.09 | %(5) | | | (0.56 | )%(5) | | | (0.20 | )%(5) | | | 0.12 | %(5) | |
Ratio of Rebate from Morgan Stanley Affiliates | | | 0.01 | % | | | 0.02 | % | | | 0.02 | % | | | 0.01 | % | | | 0.00 | %(7) | |
Portfolio Turnover Rate | | | 20 | % | | | 36 | % | | | 30 | % | | | 42 | % | | | 51 | % | |
(1) Reflects prior period custodian out-of-pocket expenses that were reimbursed in September 2016. The amount of the reimbursement was immaterial on a per share basis and did not impact the total return of Class IS shares. The Ratio of Expenses After Expense Limitation and the Ratio of Net Investment Loss would be unchanged as the reimbursement of custodian fees was offset against expense waivers/reimbursements with no impact to net expenses or net investment loss.
(2) Per share amount is based on average shares outstanding.
(3) Amount is less than $0.005 per share.
(4) Calculated based on the net asset value as of the last business day of the period.
(5) The Ratio of Expenses After Expense Limitation and Net Investment Income (Loss) reflect the rebate of certain Fund expenses in connection with the investments Morgan Stanley affiliates during the period. The effect of the rebate on the ratios is disclosed in the above table as "Ratio of Rebate from Morgan Stanley Affiliates."
(6) Effective July 1, 2015, the Adviser has agreed to limit the ratio of expenses to average net assets to the maximum ratio of 0.94% for Class IS shares. Prior to July 1, 2015, the maximum ratio was 1.09% for Class IS shares.
(7) Amount is less than 0.005%.
The accompanying notes are an integral part of the financial statements.
18
Morgan Stanley Institutional Fund, Inc.
Annual Report — December 31, 2019
Financial Highlights
International Opportunity Portfolio
| | | Class IR | |
Selected Per Share Data and Ratios | | Year Ended
December 31, 2019 | | Period from
June 15, 2018(1) to
December 31, 2018 | |
Net Asset Value, Beginning of Period | | $ | 19.79 | | | $ | 25.37 | | |
Income (Loss) from Investment Operations: | |
Net Investment Loss(2) | | | (0.02 | ) | | | (0.06 | ) | |
Net Realized and Unrealized Gain (Loss) | | | 7.01 | | | | (5.47 | ) | |
Total from Investment Operations | | | 6.99 | | | | (5.53 | ) | |
Distributions from and/or in Excess of: | |
Net Realized Gain | | | — | | | | (0.05 | ) | |
Redemption Fees | | | 0.00 | (3) | | | 0.00 | (3) | |
Net Asset Value, End of Period | | $ | 26.78 | | | $ | 19.79 | | |
Total Return(4) | | | 35.32 | % | | | (21.84 | )%(6) | |
Ratios to Average Net Assets and Supplemental Data: | |
Net Assets, End of Period, (Thousands) | | $ | 110,401 | | | $ | 81,592 | | |
Ratio of Expenses Before Expense Limitation | | | 0.93 | % | | | 0.95 | %(7) | |
Ratio of Expenses After Expense Limitation | | | 0.91 | %(5) | | | 0.93 | %(5)(7) | |
Ratio of Net Investment Loss | | | (0.07 | )%(5) | | | (0.46 | )%(5)(7) | |
Ratio of Rebate from Morgan Stanley Affiliates | | | 0.01 | % | | | 0.01 | %(7) | |
Portfolio Turnover Rate | | | 20 | % | | | 36 | % | |
(1) Commencement of Offering.
(2) Per share amount is based on average shares outstanding.
(3) Amount is less than $0.005 per share.
(4) Calculated based on the net asset value as of the last business day of the period.
(5) The Ratios of Expenses After Expense Limitation and Ratio of Net Investment Loss reflect the rebate of certain Fund expenses in connection with the investments in Morgan Stanley affiliates during the period. The effect of the rebate on the ratios is disclosed in the above table as "Ratio of Rebate from Morgan Stanley Affiliates."
(6) Not annualized.
(7) Annualized.
The accompanying notes are an integral part of the financial statements.
19
Morgan Stanley Institutional Fund, Inc.
Annual Report — December 31, 2019
Notes to Financial Statements
Morgan Stanley Institutional Fund, Inc. (the "Company") is registered under the Investment Company Act of 1940, as amended (the "Act"), as an open-end management investment company. The Company is comprised of thirty-two separate, active, diversified and non-diversified funds (individually referred to as a "Fund," collectively as the "Funds"). The Company applies investment company accounting and reporting guidance.
The accompanying financial statements relate to the International Opportunity Portfolio. The Fund seeks long-term capital appreciation.
The Fund offers six classes of shares — Class I, Class A, Class L, Class C, Class IS and Class IR. On April 30, 2015 the Fund suspended offering of Class L shares. Existing Class L shareholders may invest through reinvestment of dividends and distributions.
A. Significant Accounting Policies: The following significant accounting policies are in conformity with U.S. generally accepted accounting principles ("GAAP"). Such policies are consistently followed by the Company in the preparation of its financial statements. GAAP may require management to make estimates and assumptions that affect the reported amounts and disclosures in the financial statements. Actual results may differ from those estimates.
In August 2018, the Financial Accounting Standards Board ("FASB") issued Accounting Standards Update ("ASU") 2018-13, Fair Value Measurement (Topic 820) — Disclosures Framework — Changes to Disclosure Requirements of Fair Value Measurement ("ASU 2018-13") which introduces new fair value disclosure requirements as well as eliminates and modifies certain existing fair value disclosure requirements. ASU 2018-13 would be effective for fiscal years beginning after December 15, 2019 and for interim periods within those fiscal years; however, management has elected to early adopt ASU 2018-13 as permitted by the standard. The impact of the Fund's adoption was limited to changes in the Fund's financial statement disclosures regarding fair value, primarily those disclosures related to transfers between levels of the fair value hierarchy and disclosure of the range and weighted average used to develop significant unobservable inputs for Level 3 fair value measurements, when applicable.
1. Security Valuation: (1) An equity portfolio security listed or traded on an exchange is valued at its latest reported sales price (or at the exchange official closing price if such exchange reports an official closing price), and if
there were no sales on a given day and if there is no official exchange closing price for that day, the security is valued at the mean between the last reported bid and asked prices if such bid and asked prices are available on the relevant exchanges. If only bid prices are available then the latest bid price may be used. Listed equity securities not traded on the valuation date with no reported bid and asked prices available on the exchange are valued at the mean between the current bid and asked prices obtained from one or more reputable brokers or dealers. In cases where a security is traded on more than one exchange, the security is valued on the exchange designated as the primary market; (2) all other equity portfolio securities for which over-the-counter ("OTC") market quotations are readily available are valued at the latest reported sales price (or at the market official closing price if such market reports an official closing price), and if there was no trading in the security on a given day and if there is no official closing price from relevant markets for that day, the security is valued at the mean between the last reported bid and asked prices if such bid and asked prices are available on the relevant markets. An unlisted equity security that does not trade on the valuation date and for which bid and asked prices from the relevant markets are unavailable is valued at the mean between the current bid and asked prices obtained from one or more reputable brokers or dealers; (3) certain portfolio securities may be valued by an outside pricing service/vendor approved by the Company's Board of Directors (the "Directors"). The pricing service/vendor may employ a pricing model that takes into account, among other things, bids, yield spreads and/or other market data and specific security characteristics. Alternatively, if a valuation is not available from an outside pricing service/vendor, and the security trades on an exchange, the security may be valued at its latest reported sale price (or at the exchange official closing price if such exchange reports an official closing price), prior to the time when assets are valued. If there are no sales on a given day and if there is no official exchange closing price for that day, the security is valued at the mean between the last reported bid and asked prices if such bid and asked prices are available in the relevant exchanges. If Morgan Stanley Investment Management Inc. (the "Adviser"), a wholly-owned subsidiary of Morgan Stanley, determines that the price provided by the outside pricing service/vendor or exchange does not reflect the security's fair value or is unable to provide a price, prices from brokers or dealers may also be
20
Morgan Stanley Institutional Fund, Inc.
Annual Report — December 31, 2019
Notes to Financial Statements (cont'd)
utilized. In these circumstances, the value of the security will be the mean of bid and asked prices obtained from brokers or dealers; (4) listed options are valued at the last reported sales price on the exchange on which they are listed (or at the exchange official closing price if such exchange reports an official closing price). If an official closing price or last reported sales price is unavailable, the listed option should be fair valued at the mean between its latest bid and ask prices. Unlisted options are valued at the mean between their latest bid and ask prices from a broker/dealer or valued by a pricing service/vendor; (5) when market quotations are not readily available, including circumstances under which the Adviser determines that the closing price, last sale price or the mean between the last reported bid and asked prices are not reflective of a security's market value, portfolio securities are valued at their fair value as determined in good faith under procedures established by and under the general supervision of the Directors. Occasionally, developments affecting the closing prices of securities and other assets may occur between the times at which valuations of such securities are determined (that is, close of the foreign market on which the securities trade) and the close of business of the New York Stock Exchange ("NYSE"). If developments occur during such periods that are expected to materially affect the value of such securities, such valuations may be adjusted to reflect the estimated fair value of such securities as of the close of the NYSE, as determined in good faith by the Directors or by the Adviser using a pricing service and/or procedures approved by the Directors; (6) quotations of foreign portfolio securities, other assets and liabilities and forward contracts stated in foreign currency are translated into U.S. dollar equivalents at the prevailing market rates prior to the close of the NYSE; and (7) investments in mutual funds, including the Morgan Stanley Institutional Liquidity Funds, are valued at the net asset value ("NAV") as of the close of each business day.
The Directors have responsibility for determining in good faith the fair value of the investments, and the Directors may appoint others, such as the Company's Adviser or a valuation committee, to assist the Directors in determining fair value and to make the actual calculations pursuant to the fair valuation methodologies previously approved by the Directors. Under procedures approved by the Directors, the Company's Adviser has formed a Valuation Committee whose members are approved by the Directors. The Valuation Committee
provides administration and oversight of the Company's valuation policies and procedures, which are reviewed at least annually by the Directors. These procedures allow the Company to utilize independent pricing services, quotations from securities and financial instrument dealers and other market sources to determine fair value.
2. Fair Value Measurement: FASB Accounting Standards CodificationTM ("ASC") 820, "Fair Value Measurement" ("ASC 820"), defines fair value as the value that the Fund would receive to sell an investment or pay to transfer a liability in a timely transaction with an independent buyer in the principal market, or in the absence of a principal market, the most advantageous market for the investment or liability. ASC 820 establishes a three-tier hierarchy to distinguish between (1) inputs that reflect the assumptions market participants would use in valuing an asset or liability developed based on market data obtained from sources independent of the reporting entity (observable inputs) and (2) inputs that reflect the reporting entity's own assumptions about the assumptions market participants would use in valuing an asset or liability developed based on the best information available in the circumstances (unobservable inputs) and to establish classification of fair value measurements for disclosure purposes. Various inputs are used in determining the value of the Fund's investments. The inputs are summarized in the three broad levels listed below:
• Level 1 – unadjusted quoted prices in active markets for identical investments
• Level 2 – other significant observable inputs (including quoted prices for similar investments, interest rates, prepayment speeds, credit risk, etc.)
• Level 3 – significant unobservable inputs including the Fund's own assumptions in determining the fair value of investments. Factors considered in making this determination may include, but are not limited to, information obtained by contacting the issuer, analysts, or the appropriate stock exchange (for exchange-traded securities), analysis of the issuer's financial statements or other available documents and, if necessary, available information concerning other securities in similar circumstances.
21
Morgan Stanley Institutional Fund, Inc.
Annual Report — December 31, 2019
Notes to Financial Statements (cont'd)
The inputs or methodology used for valuing securities are not necessarily an indication of the risk associated with investing in those securities and the determination of the significance of a particular input to the fair value measurement in its entirety requires judgment and considers factors specific to each security.
The following is a summary of the inputs used to value the Fund's investments as of December 31, 2019:
Investment Type | | Level 1
Unadjusted
quoted
prices
(000) | | Level 2
Other
significant
observable
inputs
(000) | | Level 3
Significant
unobservable
inputs
(000) | | Total
(000) | |
Assets: | |
Common Stocks | |
Air Freight &
Logistics | | $ | — | | | $ | 97,760 | | | $ | — | | | $ | 97,760 | | |
Banks | | | 113,919 | | | | — | | | | — | | | | 113,919 | | |
Beverages | | | 94,621 | | | | — | | | | — | | | | 94,621 | | |
Biotechnology | | | — | | | | 36,689 | | | | — | | | | 36,689 | | |
Diversified Consumer
Services | | | 146,365 | | | | — | | | | — | | | | 146,365 | | |
Electronic Equipment,
Instruments &
Components | | | — | | | | 73,739 | | | | — | | | | 73,739 | | |
Entertainment | | | 73,839 | | | | — | | | | — | | | | 73,839 | | |
Food Products | | | 45,143 | | | | 56,865 | | | | — | | | | 102,008 | | |
Health Care
Providers &
Services | | | — | | | | 15,538 | | | | — | | | | 15,538 | | |
Hotels,
Restaurants &
Leisure | | | 61,158 | | | | — | | | | — | | | | 61,158 | | |
Household Products | | | 20,279 | | | | 23,826 | | | | — | | | | 44,105 | | |
Information
Technology
Services | | | 77,427 | | | | — | | | | — | | | | 77,427 | | |
Interactive
Media & Services | | | 34,500 | | | | 43,663 | | | | — | | | | 78,163 | | |
Internet & Direct
Marketing Retail | | | 200,221 | | | | 15,307 | | | | — | | | | 215,528 | | |
Professional Services | | | — | | | | 52,166 | | | | — | | | | 52,166 | | |
Semiconductors &
Semiconductor
Equipment | | | 98,034 | | | | — | | | | — | | | | 98,034 | | |
Software | | | 29,516 | | | | 39,628 | | | | — | | | | 69,144 | | |
Textiles,
Apparel & Luxury
Goods | | | 101,651 | | | | 136,376 | | | | — | | | | 238,027 | | |
Total Common Stocks | | | 1,096,673 | | | | 591,557 | | | | — | | | | 1,688,230 | | |
Call Options Purchased | | | — | | | | 495 | | | | — | | | | 495 | | |
Short-Term Investments | |
Investment Company | | | 161,533 | | | | — | | | | — | | | | 161,533 | | |
Repurchase
Agreements | | | — | | | | 332 | | | | — | | | | 332 | | |
Total Short-Term
Investments | | | 161,533 | | | | 332 | | | | — | | | | 161,865 | | |
Total Assets | | $ | 1,258,206 | | | $ | 592,384 | | | $ | — | | | $ | 1,850,590 | | |
Transfers between investment levels may occur as the markets fluctuate and/or the availability of data used in an investment's valuation changes.
3. Repurchase Agreements: The Fund may enter into repurchase agreements under which the Fund lends cash and takes possession of securities with an agreement that the counterparty will repurchase such securities. In connection with transactions in repurchase agreements, a bank as custodian for the Fund takes possession of the underlying securities which are held as collateral, with a market value at least equal to the amount of the repurchase transaction, including principal and accrued interest. To the extent that any repurchase transaction exceeds one business day, the value of the collateral is marked-to-market on a daily basis to determine that the value of the collateral does not decrease below the repurchase price plus accrued interest as earned. If such a decrease occurs, additional collateral will be requested and, when received, will be added to the account to maintain full collateralization. In the event of default on the obligation to repurchase, the Fund has the right to liquidate the collateral and apply the proceeds in satisfaction of the obligation. In the event of default or bankruptcy by the counterparty to the agreement, realization of the collateral proceeds may be subject to cost and delays. The Fund, along with other affiliated investment companies, may utilize a joint trading account for the purpose of entering into repurchase agreements.
4. Foreign Currency Translation and Foreign Investments: The books and records of the Fund are maintained in U.S. dollars. Foreign currency amounts are translated into U.S. dollars as follows:
– investments, other assets and liabilities at the prevailing rate of exchange on the valuation date;
– investment transactions and investment income at the prevailing rates of exchange on the dates of such transactions.
Although the net assets of the Fund are presented at the foreign exchange rates and market values at the close of the period, the Fund does not isolate that portion of the results of operations arising as a result of changes in the foreign exchange rates from the fluctuations arising from changes in the market prices of securities held at period end. Similarly, the Fund does not isolate the effect of
22
Morgan Stanley Institutional Fund, Inc.
Annual Report — December 31, 2019
Notes to Financial Statements (cont'd)
changes in foreign exchange rates from the fluctuations arising from changes in the market prices of securities sold during the period. Accordingly, realized and unrealized foreign currency gains (losses) on investments in securities are included in the reported net realized and unrealized gains (losses) on investment transactions and balances. However, pursuant to U.S. federal income tax regulations, gains and losses from certain foreign currency transactions and the foreign currency portion of gains and losses realized on sales and maturities of foreign denominated debt securities are treated as ordinary income for U.S. federal income tax purposes.
Net realized gains (losses) on foreign currency transactions represent net foreign exchange gains (losses) from foreign currency forward exchange contracts, disposition of foreign currencies, currency gains (losses) realized between the trade and settlement dates on securities transactions, and the difference between the amount of investment income and foreign withholding taxes recorded on the Fund's books and the U.S. dollar equivalent amounts actually received or paid. The change in unrealized currency gains (losses) on foreign currency transactions for the period is reflected in the Statement of Operations.
Foreign security and currency transactions may involve certain considerations and risks not typically associated with those of U.S. dollar denominated transactions as a result of, among other factors, fluctuations of exchange rates in relation to the U.S. dollar, the possibility of lower levels of governmental supervision and regulation of foreign securities markets and the possibility of political or economic instability.
Governmental approval for foreign investments may be required in advance of making an investment under certain circumstances in some countries, and the extent of foreign investments in domestic companies may be subject to limitation in other countries. Foreign ownership limitations also may be imposed by the charters of individual companies to prevent, among other concerns, violations of foreign investment limitations. As a result, an additional class of shares (identified as "Foreign" in the Portfolio of Investments) may be created and offered for investment. The "local" and "foreign shares" market values may differ. In the absence of trading of the
foreign shares in such markets, the Fund values the foreign shares at the closing exchange price of the local shares.
5. Derivatives: The Fund may, but is not required to, use derivative instruments for a variety of purposes, including hedging, risk management, portfolio management or to earn income. Derivatives are financial instruments whose value is based, in part, on the value of an underlying asset, interest rate, index or financial instrument. Prevailing interest rates and volatility levels, among other things, also affect the value of derivative instruments. A derivative instrument often has risks similar to its underlying asset and may have additional risks, including imperfect correlation between the value of the derivative and the underlying asset, risks of default by the counterparty to certain transactions, magnification of losses incurred due to changes in the market value of the securities, instruments, indices or interest rates to which the derivative instrument relates, risks that the transactions may not be liquid and risks arising from margin requirements. The use of derivatives involves risks that are different from, and possibly greater than, the risks associated with other portfolio investments. Derivatives may involve the use of highly specialized instruments that require investment techniques and risk analyses different from those associated with other portfolio investments. All of the Fund's holdings, including derivative instruments, are marked-to-market each day with the change in value reflected in unrealized appreciation (depreciation). Upon disposition, a realized gain or loss is recognized.
Certain derivative transactions may give rise to a form of leverage. Leverage magnifies the potential for gain and the risk of loss. Leverage associated with derivative transactions may cause the Fund to liquidate portfolio positions when it may not be advantageous to do so to satisfy its obligations or to meet earmarking or segregation requirements, pursuant to applicable Securities and Exchange Commission ("SEC") rules and regulations, or may cause the Fund to be more volatile than if the Fund had not been leveraged. Although the Adviser seeks to use derivatives to further the Fund's investment objectives, there is no assurance that the use of derivatives will achieve this result.
23
Morgan Stanley Institutional Fund, Inc.
Annual Report — December 31, 2019
Notes to Financial Statements (cont'd)
Following is a description of the derivative instruments and techniques that the Fund used during the period and their associated risks:
Options: With respect to options, the Fund is subject to equity risk, interest rate risk and foreign currency exchange risk in the normal course of pursuing its investment objectives. If the Fund buys an option, it buys a legal contract giving it the right to buy or sell a specific amount of the underlying instrument or foreign currency, or futures contract on the underlying instrument or foreign currency, at an agreed-upon price typically in exchange for a premium paid by the Fund. The Fund may purchase and/or sell put and call options. Purchasing call options tends to increase the Fund's exposure to the underlying (or similar) instrument. Purchasing put options tends to decrease the Fund's exposure to the underlying (or similar) instrument. When entering into purchased option contracts, the Fund bears the risk of interest or exchange rates or securities prices moving unexpectedly, in which case, the Fund may not achieve the anticipated benefits of the purchased option contracts; however the risk of loss is limited to the premium paid. Purchased options are reported as part of "Total Investments in Securities" in the Statement of Assets and Liabilities. Premiums paid for purchasing options which expired are treated as realized losses. If the Fund sells an option, it sells to another party the right to buy from or sell to the Fund a specific amount of the underlying instrument or foreign currency, or futures contract on the underlying instrument or foreign currency, at an agreed-upon price during a period of time or on a specified date typically in exchange for a premium received by the Fund. When options are purchased OTC, the Fund bears the risk that the counterparty that wrote the option will be unable or unwilling to perform its obligations under the option contract. Options may also be illiquid and the Fund may have difficulty closing out its position. A decision as to whether, when and how to use options involves the exercise of skill and judgment and even a well-conceived option transaction may be unsuccessful because of market behavior or unexpected events. The prices of options can be highly volatile and the use of options can lower total returns.
FASB ASC 815, "Derivatives and Hedging" ("ASC 815"), is intended to improve financial reporting
about derivative instruments by requiring enhanced disclosures to enable investors to better understand how and why the Fund uses derivative instruments, how these derivative instruments are accounted for and their effects on the Fund's financial position and results of operations.
The following table sets forth the fair value of the Fund's derivative contracts by primary risk exposure as of December 31, 2019:
| | | Asset Derivatives
Statement of Assets and
Liabilities Location | | Primary Risk
Exposure | | Value
(000) | |
Purchased Options | | Investments, at Value
(Purchased Options) | | |
Currency Risk | | | $ | 495 | (a) | |
(a) Amounts are included in Investments in Securities in the Statement of Assets and Liabilities.
The following tables set forth by primary risk exposure the Fund's realized gains (losses) and change in unrealized appreciation (depreciation) by type of derivative contract for the year ended December 31, 2019 in accordance with ASC 815:
Realized Gain (Loss) | |
Primary Risk Exposure | | Derivative Type | | Value
(000) | |
Currency Risk | | Investments
(Purchased Options) | | $ | (3,136 | )(b) | |
(b) Amounts are included in Investments Sold in the Statement of Operations.
Change in Unrealized Appreciation (Depreciation) | |
Primary Risk Exposure | | Derivative Type | | Value
(000) | |
Currency Risk | | Investments
(Purchased Options) | | $ | (1,039 | )(c) | |
(c) Amounts are included in Investments in the Statement of Operations.
At December 31, 2019, the Fund's derivative assets and liabilities are as follows:
Gross Amounts of Assets and Liabilities
Presented in the Statement of Assets and Liabilities | |
Derivatives | | Assets(d)
(000) | | Liabilities(d)
(000) | |
Purchased Options | | $ | 495 | (a) | | $ | — | | |
(a) Amounts are included in Investments in Securities in the Statement of Assets and Liabilities.
(d) Absent an event of default or early termination, OTC derivative assets and liabilities are presented gross and not offset in the Statement of Assets and Liabilities.
The Fund typically enters into International Swaps and Derivatives Association, Inc. Master Agreements ("ISDA Master Agreements") or similar master agreements (collectively, "Master Agreements") with its contract counterparties for certain OTC derivatives in order to,
24
Morgan Stanley Institutional Fund, Inc.
Annual Report — December 31, 2019
Notes to Financial Statements (cont'd)
among other things, reduce its credit risk to counterparties. ISDA Master Agreements include provisions for general obligations, representations, collateral and events of default or termination. Under an ISDA Master Agreement, the Fund typically may offset with the counterparty certain OTC derivative financial instruments' payables and/or receivables with collateral held and/or posted and create one single net payment (close-out netting) in the event of default, termination and/or potential deterioration in the credit quality of the counterparty. Various Master Agreements govern the terms of certain transactions with counterparties, including transactions such as swap, forward, repurchase and reverse repurchase agreements. These Master Agreements typically attempt to reduce the counterparty risk associated with such transactions by specifying credit protection mechanisms and providing standardization that improves legal certainty. Cross-termination provisions under Master Agreements typically provide that a default in connection with one transaction between the Fund and a counterparty gives the non-defaulting party the right to terminate any other transactions in place with the defaulting party to create one single net payment due to/due from the defaulting party and may be a feature in certain Master Agreements. In the event the Fund exercises its right to terminate a Master Agreement after a counterparty experiences a termination event as defined in the Master Agreement, the return of collateral with market value in excess of the Fund's net liability may be delayed or denied.
The following table presents derivative financial instruments that are subject to enforceable netting arrangements as of December 31, 2019:
Gross Amounts Not Offset in the Statement of Assets and Liabilities | |
Counterparty | | Gross Asset
Derivatives
Presented in the
Statement of
Assets and
Liabilities
(000) | | Financial
Instrument
(000) | | Collateral
Received(e)
(000) | | Net Amount
(not less
than $0)
(000) | |
BNP Paribas | | $ | 1 | | | $ | — | | | $ | (1 | ) | | $ | 0 | | |
Royal Bank of Scotland | | | 494 | | | | — | | | | (494 | ) | | | 0 | | |
Total | | $ | 495 | (a) | | $ | — | | | $ | (495 | ) | | $ | 0 | | |
(a) Amounts are included in Investments in Securities in the Statement of Assets and Liabilities.
(e) In some instances, the actual collateral received may be more than the amount shown here due to overcollateralization.
For the year ended December 31, 2019, the approximate average monthly amount outstanding for each derivative type is as follows:
Options Purchased: | |
Average monthly notional amount | | | 741,915,000 | | |
6. Securities Lending: The Fund lends securities to qualified financial institutions, such as broker-dealers, to earn additional income. Any increase or decrease in the fair value of the securities loaned that might occur and any interest earned or dividends declared on those securities during the term of the loan would remain in the Fund. The Fund would receive cash or securities as collateral in an amount equal to or exceeding 100% of the current fair value of the loaned securities. The collateral is marked-to-market daily by State Street Bank and Trust Company ("State Street"), the securities lending agent, to ensure that a minimum of 100% collateral coverage is maintained.
Based on pre-established guidelines, the securities lending agent invests any cash collateral that is received in an affiliated money market portfolio and repurchase agreements. Securities lending income is generated from the earnings on the invested collateral and borrowing fees, less any rebates owed to the borrowers and compensation to the lending agent, and is recorded as "Income from Securities Loaned — Net" in the Fund's Statement of Operations. Risks in securities lending transactions are that a borrower may not provide additional collateral when required or return the securities when due, and that the value of the short-term investments will be less than the amount of cash collateral plus any rebate that is required to be returned to the borrower.
The Fund has the right under the securities lending agreement to recover the securities from the borrower on demand.
The following table presents financial instruments that are subject to enforceable netting arrangements as of December 31, 2019:
Gross Amounts Not Offset in the Statement of Assets and Liabilities | |
Gross Asset
Amounts
Presented in the
Statement of
Assets and
Liabilities
(000) | | Financial
Instrument
(000) | | Collateral
Received
(000) | | Net Amount
(not less
than $0)
(000) | |
| $ | 19,831 | (f) | | $ | — | | | $ | (19,831 | )(g)(h) | | $ | 0 | | |
(f) Represents market value of loaned securities at year end.
25
Morgan Stanley Institutional Fund, Inc.
Annual Report — December 31, 2019
Notes to Financial Statements (cont'd)
(g) The Fund received cash collateral of approximately $2,780,000, of which approximately $2,736,000 was subsequently invested in Repurchase Agreements and Morgan Stanley Institutional Liquidity Funds as reported in the Portfolio of Investments. As of December 31, 2019, there was uninvested cash of approximately $44,000, which is not reflected in the Portfolio of Investments. In addition, the Fund received non-cash collateral of approximately $18,045,000 in the form of U.S. Government obligations, which the Fund cannot sell or repledge, and accordingly are not reflected in the Portfolio of Investments.
(h) The actual collateral received is greater than the amount shown here due to overcollateralization.
FASB ASC 860, "Transfers & Servicing: Repurchase-to-Maturity Transactions, Repurchase Financings, and Disclosures", is intended to provide increased transparency about the types of collateral pledged in securities lending transactions and other similar transactions that are accounted for as secured borrowing.
The following table displays a breakdown of transactions accounted for as secured borrowings, the gross obligations by class of collateral pledged and the remaining contractual maturity of those transactions as of December 31, 2019:
Remaining Contractual Maturity of the Agreements | |
| | | Overnight and
Continuous
(000) | | <30 days
(000) | | Between
30 &
90 days
(000) | | >90 days
(000) | | Total
(000) | |
Securities Lending
Transactions | |
Common Stocks | | $ | 2,780 | | | $ | — | | | $ | — | | | $ | — | | | $ | 2,780 | | |
Total Borrowings | | $ | 2,780 | | | $ | — | | | $ | — | | | $ | — | | | $ | 2,780 | | |
Gross amount of
recognized liabilities
for securities lending
transactions | | | | | | | | | | $ | 2,780 | | |
7. Redemption Fees: The Fund will assess a 2% redemption fee on Class I shares, Class A shares, Class L shares, Class C shares, Class IS shares and Class IR shares, which is paid directly to the Fund, for shares redeemed or exchanged within thirty days of purchase, subject to certain exceptions. The redemption fee is designed to protect the Fund and its remaining shareholders from the effects of short-term trading. These fees, if any, are included in the Statements of Changes in Net Assets.
8. Indemnifications: The Company enters into contracts that contain a variety of indemnifications. The Company's maximum exposure under these arrangements is unknown. However, the Company has not had prior claims or losses pursuant to these contracts and expects the risk of loss to be remote.
9. Dividends and Distributions to Shareholders: Dividends and distributions to shareholders are recorded on the ex-dividend date. Dividends from net investment income, if any, are declared and paid annually. Net realized capital gains, if any, are distributed at least annually.
10. Security Transactions, Income and Expenses: Security transactions are accounted for on the trade date (date the order to buy or sell is executed). Realized gains and losses on the sale of investment securities are determined on the specific identified cost method. Dividend income and other distributions are recorded on the ex-dividend date (except for certain foreign dividends which may be recorded as soon as the Fund is informed of such dividends) net of applicable withholding taxes. Interest income is recognized on the accrual basis except where collection is in doubt. Discounts are accreted and premiums are amortized over the life of the respective securities. Most expenses of the Company can be directly attributed to a particular Fund. Expenses which cannot be directly attributed are apportioned among the Funds based upon relative net assets or other appropriate methods. Income, expenses (other than class specific expenses — distribution and shareholder services, transfer agency and sub transfer agency fees) and realized and unrealized gains or losses are allocated to each class of shares based upon their relative net assets.
B. Advisory Fees: The Adviser, a wholly-owned subsidiary of Morgan Stanley, provides the Fund with advisory services under the terms of an Investment Advisory Agreement, paid quarterly, at the annual rate based on the daily net assets as follows:
First $1
billion | | Over $1
billion | |
| | 0.80 | % | | | 0.75 | % | |
For the year ended December 31, 2019, the advisory fee rate (net of rebate) was equivalent to an annual effective rate of 0.77% of the Fund's average daily net assets.
The Adviser has agreed to reduce its advisory fee and/or reimburse the Fund so that total annual Fund operating expenses, excluding certain investment related expenses, taxes, interest and other extraordinary expenses (including litigation), will not exceed 1.00% for Class I shares, 1.35% for Class A shares, 1.85% for Class L shares, 2.10% for Class C shares, 0.94% for Class IS shares and 0.94% for Class IR shares. The fee waivers and/or expense reimbursements will continue for at least one
26
Morgan Stanley Institutional Fund, Inc.
Annual Report — December 31, 2019
Notes to Financial Statements (cont'd)
year from the date of the Fund's prospectus or until such time as the Directors act to discontinue all or a portion of such waivers and/or reimbursements when they deem such action is appropriate. For the year ended December 31, 2019, approximately $317,000 of other expenses were reimbursed by the Adviser pursuant to this arrangement.
C. Administration Fees: The Adviser also serves as Administrator to the Company and provides administrative services pursuant to an Administration Agreement for an annual fee, accrued daily and paid monthly, of 0.08% of the Fund's average daily net assets.
Under a Sub-Administration Agreement between the Administrator and State Street, State Street provides certain administrative services to the Company. For such services, the Administrator pays State Street a portion of the fee the Administrator receives from the Fund.
D. Distribution and Shareholder Services Fees: Morgan Stanley Distribution, Inc. ("MSDI" or the "Distributor"), a wholly-owned subsidiary of the Adviser and an indirect subsidiary of Morgan Stanley, serves as the Company's Distributor of Fund shares pursuant to a Distribution Agreement. The Company has adopted a Shareholder Services Plan with respect to Class A shares pursuant to Rule 12b-1 under the Act. Under the Shareholder Services Plan, the Fund pays the Distributor a shareholder services fee, accrued daily and paid monthly, at an annual rate of 0.25% of the Fund's average daily net assets attributable to Class A shares.
The Company has adopted a Distribution and Shareholder Services Plan with respect to Class L shares pursuant to Rule 12b-1 under the Act. Under the Distribution and Shareholder Services Plan, the Fund pays the Distributor a distribution fee, accrued daily and paid monthly, at an annual rate of 0.50% and a shareholder services fee, accrued daily and paid monthly, at an annual rate of 0.25% of the Fund's average daily net assets attributable to Class L shares.
The Company has adopted a Distribution and Shareholder Services Plan with respect to Class C shares pursuant to Rule 12b-1 under the Act. Under the Distribution and Shareholder Services Plan, the Fund pays the Distributor a distribution fee, accrued daily and paid monthly, at an annual rate of 0.75% and a shareholder services fee, accrued daily and paid monthly, at an annual rate of 0.25% of the Fund's average daily net assets attributable to Class C shares.
The distribution and shareholder services fees are used to support the expenses associated with servicing and maintaining accounts. The Distributor may compensate other parties for providing shareholder support services to investors who purchase Class A, Class L and Class C shares.
E. Dividend Disbursing and Transfer Agent: The Company's dividend disbursing and transfer agent is DST Asset Manager Solutions, Inc. ("DST"). Pursuant to a Transfer Agency Agreement, the Company pays DST a fee based on the number of classes, accounts and transactions relating to the Funds of the Company.
F. Custodian Fees: State Street (the "Custodian") also serves as Custodian for the Company in accordance with a Custodian Agreement. The Custodian holds cash, securities and other assets of the Company as required by the Act. Custody fees are payable monthly based on assets held in custody, investment purchases and sales activity and account maintenance fees, plus reimbursement for certain out-of-pocket expenses.
G. Security Transactions and Transactions with Affiliates: For the year ended December 31, 2019, purchases and sales of investment securities for the Fund, other than long-term U.S. Government securities and short-term investments were approximately $582,091,000 and $274,588,000, respectively. There were no purchases and sales of long-term U.S. Government securities for the year ended December 31, 2019.
The Fund invests in the Institutional Class of the Morgan Stanley Institutional Liquidity Funds (the "Liquidity Funds"), an open-end management investment company managed by the Adviser, both directly and as a portion of the securities held as collateral on loaned securities. Advisory fees paid by the Fund are reduced by an amount equal to its pro-rata share of the advisory and administration fees paid by the Fund due to its investment in the Liquidity Funds. For the year ended December 31, 2019, advisory fees paid were reduced by approximately $183,000 relating to the Fund's investment in the Liquidity Funds.
A summary of the Fund's transactions in shares of affiliated investments during the year ended December 31, 2019 is as follows:
Affiliated
Investment
Company | | Value
December 31,
2018
(000) | | Purchases
at Cost
(000) | | Proceeds
from Sales
(000) | | Dividend
Income
(000) | |
Liquidity Funds | | $ | 25,200 | | | $ | 509,339 | | | $ | 373,006 | | | $ | 1,864 | | |
27
Morgan Stanley Institutional Fund, Inc.
Annual Report — December 31, 2019
Notes to Financial Statements (cont'd)
Affiliated
Investment
Company (cont'd) | | Realized
Gain (Loss)
(000) | | Change in
Unrealized
Appreciation
(Depreciation)
(000) | | Value
December 31,
2019
(000) | |
Liquidity Funds | | $ | — | | | $ | — | | | $ | 161,533 | | |
The Fund is permitted to purchase and sell securities ("cross-trade") from and to other Morgan Stanley funds as well as other funds and client accounts for which the Adviser or an affiliate of the Adviser serves as investment adviser, pursuant to procedures approved by the Directors in compliance with Rule 17a-7 under the Act (the "Rule"). Each cross-trade is executed at the current market price in compliance with provisions of the Rule. For the year ended December 31, 2019, the Fund did not engage in any cross-trade transactions.
The Fund has an unfunded Deferred Compensation Plan (the "Compensation Plan"), which allows each independent Director to defer payment of all, or a portion, of the fees he or she receives for serving on the Board of Directors. Each eligible Director generally may elect to have the deferred amounts credited with a return equal to the total return on one or more of the Morgan Stanley funds that are offered as investment options under the Compensation Plan. Appreciation/depreciation and distributions received from these investments are recorded with an offsetting increase/decrease in the deferred compensation obligation and do not affect the NAV of the Fund.
H. Federal Income Taxes: It is the Fund's intention to continue to qualify as a regulated investment company and distribute all of its taxable and tax-exempt income. Accordingly, no provision for federal income taxes is required in the financial statements.
The Fund may be subject to taxes imposed by countries in which it invests. Such taxes are generally based on income and/or capital gains earned or repatriated. Taxes are accrued based on net investment income, net realized gains and net unrealized appreciation as such income and/or gains are earned. Taxes may also be based on transactions in foreign currency and are accrued based on the value of investments denominated in such currency.
FASB ASC 740-10, "Income Taxes — Overall", sets forth a minimum threshold for financial statement recognition of the benefit of a tax position taken or expected to be taken in a tax return. Management has concluded there are no significant uncertain tax positions that would require recognition in the financial statements. If applicable, the Fund recognizes interest
accrued related to unrecognized tax benefits in "Interest Expense" and penalties in "Other Expenses" in the Statement of Operations. The Fund files tax returns with the U.S. Internal Revenue Service, New York and various states. Generally, each of the tax years in the four-year period ended December 31, 2019 remains subject to examination by taxing authorities.
The tax character of distributions paid may differ from the character of distributions shown for GAAP purposes due to short-term capital gains being treated as ordinary income for tax purposes. The tax character of distributions paid during fiscal years 2019 and 2018 was as follows:
2019
Distributions
Paid From: | | 2018
Distributions
Paid From: | |
Ordinary
Income
(000) | | Long-Term
Capital Gain
(000) | | Ordinary
Income
(000) | | Long-Term
Capital Gain
(000) | |
| $ | — | | | $ | — | | | $ | 608 | | | $ | 1,906 | | |
The amount and character of income and gains to be distributed are determined in accordance with income tax regulations which may differ from GAAP. These book/tax differences are either considered temporary or permanent in nature.
Temporary differences are attributable to differing book and tax treatments for the timing of the recognition of gains (losses) on certain investment transactions and the timing of the deductibility of certain expenses.
Permanent differences, primarily due to a net operating loss, resulted in the following reclassifications among the components of net assets at December 31, 2019:
Total
Distributable
Earnings
(000) | | Paid-in
Capital
(000) | |
| $ | 7,247 | | | $ | (7,247 | ) | |
At December 31, 2019, the Fund had no distributable earnings on a tax basis.
At December 31, 2019, the Fund had available for federal income tax purposes unused short-term and long-term capital losses of approximately $34,868,000 and $5,162,000, respectively, that do not have an expiration date.
To the extent that capital loss carryforwards are used to offset any future capital gains realized, no capital gains tax liability will be incurred by the Fund for gains realized and not distributed. To the extent that capital gains are offset, such gains will not be distributed to the shareholders.
28
Morgan Stanley Institutional Fund, Inc.
Annual Report — December 31, 2019
Notes to Financial Statements (cont'd)
Qualified late year losses are capital losses and specified ordinary losses, including currency losses, incurred after October 31 but within the taxable year that, if elected, are deemed to arise on the first day of the Fund's next taxable year. For the year ended December 31, 2019, the Fund intends to defer to January 1, 2020 for U.S. federal income tax purposes the following losses:
Qualified
Late Year
Ordinary
Losses
(000) | | Post-October
Capital
Losses
(000) | |
| $ | 66 | | | $ | — | | |
I. Credit Facility: The Company and other Morgan Stanley funds participated in a $150,000,000 committed, unsecured revolving line of credit facility (the "Facility") with State Street. Effective April 22, 2019, the committed line amount increased to $300,000,000. This Facility is to be used for temporary emergency purposes or funding of shareholder redemption requests. The interest rate on borrowings is based on the federal funds rate or 1 month LIBOR rate plus a spread. The Facility also has a commitment fee of 0.25% per annum based on the unused portion of the Facility. During the year ended December 31, 2019, the Fund did not have any borrowings under the Facility.
J. Other: At December 31, 2019, the Fund had record owners of 10% or greater. Investment activities of these shareholders could have a material impact on the Fund. The aggregate percentage of such owners was 23.8%.
29
Morgan Stanley Institutional Fund, Inc.
Annual Report — December 31, 2019
Report of Independent Registered Public Accounting Firm
To the Shareholders and Board of Directors of
Morgan Stanley Institutional Fund, Inc. —
International Opportunity Portfolio
Opinion on the Financial Statements
We have audited the accompanying statement of assets and liabilities of International Opportunity Portfolio (the "Fund") (one of the funds constituting Morgan Stanley Institutional Fund, Inc. (the "Company")), including the portfolio of investments, as of December 31, 2019, and the related statement of operations for the year then ended, the statements of changes in net assets for each of the two years in the period then ended, the financial highlights for each of the five years in the period then ended and the related notes (collectively referred to as the "financial statements"). In our opinion, the financial statements present fairly, in all material respects, the financial position of International Opportunity Portfolio (one of the funds constituting Morgan Stanley Institutional Fund, Inc.) at December 31, 2019, the results of its operations for the year then ended, the changes in its net assets for each of the two years in the period then ended and its financial highlights for each of the five years in the period then ended, in conformity with U.S. generally accepted accounting principles.
Basis for Opinion
These financial statements are the responsibility of the Company's management. Our responsibility is to express an opinion on the Fund's financial statements based on our audits. We are a public accounting firm registered with the Public Company Accounting Oversight Board (United States) ("PCAOB") and are required to be independent with respect to the Company in accordance with the U.S. federal securities law and the applicable rules and regulations of the Securities and Exchange Commission and the PCAOB.
We conducted our audits in accordance with the standards of the PCAOB. Those standards require that we plan and perform the audit to obtain reasonable assurance about whether the financial statements are free of material misstatement, whether due to error or fraud. The Company is not required to have, nor were we engaged to perform, an audit of the Company's internal control over financial reporting. As part of our audits, we are required to obtain an understanding of internal control over financial reporting, but not for the purpose of expressing an opinion on the effectiveness of the Company's internal control over financial reporting. Accordingly, we express no such opinion.
Our audits included performing procedures to assess the risks of material misstatement of the financial statements, whether due to error or fraud, and performing procedures that respond to those risks. Such procedures included examining, on a test basis, evidence regarding the amounts and disclosures in the financial statements. Our procedures included confirmation of securities owned as of December 31, 2019 by correspondence with the custodian and others or by other appropriate auditing procedures where replies from others were not received. Our audits also included evaluating the accounting principles used and significant estimates made by management, as well as evaluating the overall presentation of the financial statements. We believe that our audits provide a reasonable basis for our opinion.

We have served as the auditor of one or more Morgan Stanley investment companies since 2000.
Boston, Massachusetts
February 27, 2020
30
Privacy Notice (unaudited) April 2019
FACTS | | WHAT DOES MSIM DO WITH YOUR PERSONAL INFORMATION? | |
Why? | | Financial companies choose how they share your personal information. Federal law gives consumers the right to limit some but not all sharing. Federal law also requires us to tell you how we collect, share, and protect your personal information. Please read this notice carefully to understand what we do. | |
What? | | The types of personal information we collect and share depend on the product or service you have with us. This information can include:
n Social Security number and income
n investment experience and risk tolerance
n checking account number and wire transfer instructions | |
How? | | All financial companies need to share customers' personal information to run their everyday business. In the section below, we list the reasons financial companies can share their customers' personal information; the reasons MSIM chooses to share; and whether you can limit this sharing. | |
Reasons we can share your personal information | | Does MSIM share? | | Can you limit this sharing? | |
For our everyday business purposes —
such as to process your transactions, maintain your account(s), respond to court orders and legal investigations, or report to credit bureaus | | Yes | | No | |
For our marketing purposes —
to offer our products and services to you | | Yes | | No | |
For joint marketing with other financial companies | | No | | We don't share | |
For our affiliates' everyday business purposes —
information about your transactions and experiences | | Yes | | No | |
For our affiliates' everyday business purposes —
information about your creditworthiness | | No | | We don't share | |
For our affiliates to market to you | | No | | We don't share | |
For non-affiliates to market to you | | No | | We don't share | |
Questions? Call toll-free (844) 312-6327 or email: imprivacyinquiries@morganstanley.com
31
Privacy Notice (unaudited) (cont'd) April 2019
Who we are
Who is providing this notice? | | Morgan Stanley Investment Management, Inc. and its affiliated registered investment advisers, registered broker-dealers, and registered and unregistered funds ("MSIM") | |
What we do
How does MSIM protect my personal information? | | To protect your personal information from unauthorized access and use, we use security measures that comply with federal law. These measures include computer safeguards and secured files and buildings. We have policies governing the proper handling of customer information by personnel and requiring third parties that provide support to adhere to appropriate security standards with respect to such information. | |
How does MSIM collect my personal information? | | We collect your personal information, for example, when you
n open an account or make deposits or withdrawals from your account
n buy securities from us or make a wire transfer
n give us your contact information
We also collect your personal information from others, such as credit bureaus, affiliates, or other companies. | |
Why can't I limit all sharing? | | Federal law gives you the right to limit only
n sharing for affiliates' everyday business purposes — information about your creditworthiness
n affiliates from using your information to market to you
n sharing for non-affiliates to market to you
State laws and individual companies may give you additional rights to limit sharing. See below for more on your rights under state law. | |
Definitions
Affiliates | | Companies related by common ownership or control. They can be financial and non-financial companies.
n Our affiliates include companies with a Morgan Stanley name and financial companies such as Morgan Stanley Smith Barney LLC and Morgan Stanley & Co. | |
Non-affiliates | | Companies not related by common ownership or control. They can be financial and non-financial companies.
n MSIM does not share with non-affiliates so they can market to you. | |
Joint marketing | | A formal agreement between non-affiliated financial companies that together market financial products or services to you.
n MSIM doesn't jointly market | |
Other Important Information
Vermont: Except as permitted by law, we will not share personal information we collect about Vermont residents with Non-affiliates unless you provide us with your written consent to share such information.
California: Except as permitted by law, we will not share personal information we collect about California residents with Non-affiliates and we will limit sharing such personal information with our Affiliates to comply with California privacy laws that apply to us.
32
Morgan Stanley Institutional Fund, Inc.
Annual Report — December 31, 2019
Director and Officer Information (unaudited)
Independent Directors:
Name, Birth Year
and Address of
Independent Director | | Position(s)
Held with
Registrant | | Length of Time
Served* | | Principal Occupation(s) During Past 5 Years
and Other Relevant Professional Experience | | Number of
Funds in
Fund Complex
Overseen by
Independent
Director** | | Other Directorships
Held by Independent
Director*** | |
Frank L. Bowman
c/o Perkins Coie LLP
Counsel to the Independent Directors
1155 Avenue of the Americas
New York, NY 10036
Birth Year 1944 | | Director | | Since
August 2006 | | President, Strategic Decisions, LLC (consulting) (since February 2009); Director or Trustee of various Morgan Stanley Funds (since August 2006); Chairperson of the Compliance and Insurance Committee (since October 2015); formerly, Chairperson of the Insurance Sub-Committee of the Compliance and Insurance Committee (2007-2015); served as President and Chief Executive Officer of the Nuclear Energy Institute (policy organization) (February 2005-November 2008); retired as Admiral, U.S. Navy after serving over 38 years on active duty including 8 years as Director of the Naval Nuclear Propulsion Program in the Department of the Navy and the U.S. Department of Energy (1996-2004); served as Chief of Naval Personnel (July 1994-September 1996) and on the Joint Staff as Director of Political Military Affairs (June 1992-July 1994); knighted as Honorary Knight Commander of the Most Excellent Order of the British Empire; awarded the Officier de l'Orde National du Mérite by the French Government; elected to the National Academy of Engineering (2009). | | | 86 | | | Director of Naval and Nuclear Technologies LLP; Director Emeritus of the Armed Services YMCA; Member of the National Security Advisory Council of the Center for U.S. Global Engagement and a member of the CNA Military Advisory Board; Trustee of Fairhaven United Methodist Church; Member of the Board of Advisors of the Dolphin Scholarship Foundation; Director of other various non-profit organizations; formerly, Director of BP p.l.c. (November 2010-May 2019). | |
Kathleen A. Dennis
c/o Perkins Coie LLP
Counsel to the Independent Directors
1155 Avenue of the Americas
New York, NY 10036
Birth Year 1953 | | Director | | Since August 2006 | | President, Cedarwood Associates (mutual fund and investment management consulting) (since July 2006); Chairperson of the Liquidity and Alternatives Sub-Committee of the Investment Committee (since October 2006) and Director or Trustee of various Morgan Stanley Funds (since August 2006); formerly, Senior Managing Director of Victory Capital Management (1993-2006). | | | 86 | | | Director of various non-profit organizations. | |
Nancy C. Everett
c/o Perkins Coie LLP
Counsel to the Independent Directors
1155 Avenue of the Americas
New York, NY 10036
Birth Year 1955 | | Director | | Since January 2015 | | Chief Executive Officer, Virginia Commonwealth University Investment Company (since November 2015); Owner, OBIR, LLC (institutional investment management consulting) (since June 2014); formerly, Managing Director, BlackRock, Inc. (February 2011-December 2013); and Chief Executive Officer, General Motors Asset Management (a/k/a Promark Global Advisors, Inc.) (June 2005-May 2010). | | | 87 | | | Formerly, Member of Virginia Commonwealth University School of Business Foundation (2005-2016); Member of Virginia Commonwealth University Board of Visitors (2013-2015); Member of Committee on Directors for Emerging Markets Growth Fund, Inc. (2007-2010); Chairperson of Performance Equity Management, LLC (2006-2010); and Chairperson, GMAM Absolute Return Strategies Fund, LLC (2006-2010). | |
33
Morgan Stanley Institutional Fund, Inc.
Annual Report — December 31, 2019
Director and Officer Information (unaudited) (cont'd)
Independent Directors: (cont'd)
Name, Birth Year
and Address of
Independent Director | | Position(s)
Held with
Registrant | | Length of Time
Served* | | Principal Occupation(s) During Past 5 Years
and Other Relevant Professional Experience | | Number of
Funds in
Fund Complex
Overseen by
Independent
Director** | | Other Directorships
Held by Independent
Director*** | |
Jakki L. Haussler
c/o Perkins Coie LLP
Counsel to the Independent Directors
1155 Avenue of the Americas
New York, NY 10036
Birth Year 1957 | | Director | | Since January 2015 | | Chairman, Opus Capital Group (since 1996); formerly, Chief Executive Officer, Opus Capital Group (1996-2019); Director, Capvest Venture Fund, LP (May 2000-December 2011); Partner, Adena Ventures, LP (July 1999-December 2010); Director, The Victory Funds (February 2005-July 2008). | | | 87 | | | Director of Service Corporation International and Member, Audit Committee and Investment Committee; Director of Cincinnati Bell Inc. and Member, Audit Committee and Governance and Nominating Committee; Chairman of Northern Kentucky University Member Investment Committee; Member of Chase College of Law Transactional Law Practice Center Board of Advisors; Director of Best Transport; Director of Chase College of Law Board of Visitors; formerly, Member, University of Cincinnati Foundation Investment Committee; Member, Miami University Board of Visitors (2008-2011); Trustee of Victory Funds (2005-2008) and Chairman, Investment Committee (2007-2008) and Member, Service Provider Committee (2005-2008). | |
Dr. Manuel H. Johnson
c/o Johnson Smick International, Inc.
220 I Street, NE — Suite 200
Washington, D.C. 20002
Birth Year 1949 | | Director | | Since July 1991 | | Senior Partner, Johnson Smick International, Inc. (consulting firm); Chairperson of the Investment Committee (since October 2006) and Director or Trustee of various Morgan Stanley Funds (since July 1991); Co-Chairman and a founder of the Group of Seven Council (G7C) (international economic commission); formerly, Chairperson of the Audit Committee (July 1991-September 2006), Vice Chairman of the Board of Governors of the Federal Reserve System and Assistant Secretary of the U.S. Treasury. | | | 86 | | | Director of NVR, Inc. (home construction). | |
Joseph J. Kearns
c/o Perkins Coie LLP
Counsel to the Independent Directors
1155 Avenue of the Americas
New York, NY 10036
Birth Year 1942 | | Director | | Since August 1994 | | Senior Adviser, Kearns & Associates LLC (investment consulting); Chairperson of the Audit Committee (since October 2006) and Director or Trustee of various Morgan Stanley Funds (since August 1994); formerly, Deputy Chairperson of the Audit Committee (July 2003-September 2006) and Chairperson of the Audit Committee of various Morgan Stanley Funds (since August 1994); CFO of the J. Paul Getty Trust. | | | 87 | | | Prior to August 10, 2016, Director of Electro Rent Corporation (equipment leasing); Prior to December 31, 2013, Director of The Ford Family Foundation. | |
34
Morgan Stanley Institutional Fund, Inc.
Annual Report — December 31, 2019
Director and Officer Information (unaudited) (cont'd)
Independent Directors: (cont'd)
Name, Birth Year
and Address of
Independent Director | | Position(s)
Held with
Registrant | | Length of Time
Served* | | Principal Occupation(s) During Past 5 Years
and Other Relevant Professional Experience | | Number of
Funds in
Fund Complex
Overseen by
Independent
Director** | | Other Directorships
Held by Independent
Director*** | |
Michael F. Klein
c/o Perkins Coie LLP
Counsel to the Independent Directors
1155 Avenue of the Americas
New York, NY 10036
Birth Year 1958 | | Director | | Since August 2006 | | Managing Director, Aetos Alternatives Management, LP (since March 2000); Co-President, Aetos Alternatives Management, LP (since January 2004) and Co-Chief Executive Officer of Aetos Alternatives Management, LP (since August 2013); Chairperson of the Fixed Income Sub-Committee of the Investment Committee (since October 2006) and Director or Trustee of various Morgan Stanley Funds (since August 2006); formerly, Managing Director, Morgan Stanley & Co. Inc. and Morgan Stanley Dean Witter Investment Management and President, various Morgan Stanley Funds (June 1998-March 2000); Principal, Morgan Stanley & Co. Inc. and Morgan Stanley Dean Witter Investment Management (August 1997-December 1999). | | | 86 | | | Director of certain investment funds managed or sponsored by Aetos Alternatives Management, LP; Director of Sanitized AG and Sanitized Marketing AG (specialty chemicals). | |
Patricia Maleski
c/o Perkins Coie LLP
Counsel to the Independent Directors
1155 Avenue of the Americas
New York, NY 10036
Birth Year 1960 | | Director | | Since January 2017 | | Managing Director, JPMorgan Asset Management (2004-2016); Oversight and Control Head of Fiduciary and Conflicts of Interest Program (2015-2016); Chief Control Officer-Global Asset Management (2013-2015); President, JPMorgan Funds (2010-2013); Chief Administrative Officer (2004-2013); various other positions including Treasurer and Board Liaison (since 2001). | | | 87 | | | None. | |
Michael E. Nugent
522 Fifth Avenue
New York, NY 10036
Birth Year 1936 | | Chair of the Board and Director | | Chair of the Boards since July 2006 and Director since July 1991 | | Chair of the Boards of various Morgan Stanley Funds (since July 2006); Chairperson of the Governance Committee (since January 2019) and Director or Trustee of various Morgan Stanley Funds (since July 1991); formerly, Chairperson of each of the Closed-End Fund committee (until December 2019) and the Insurance Committee (until July 2006); General Partner, Triumph Capital, L.P. (private investment partnership) (1988-2013). | | | 86 | | | None. | |
W. Allen Reed
c/o Perkins Coie LLP
Counsel to the Independent Directors
1155 Avenue of the Americas
New York, NY 10036
Birth Year 1947 | | Vice Chair of the Board and Director | | Vice Chair of the Boards since January 2020 and Director since August 2006 | | Chairperson of the Equity Sub-Committee of the Investment Committee (since October 2006) and Director or Trustee of various Morgan Stanley Funds (since August 2006); formerly, President and CEO of General Motors Asset Management; Chairman and Chief Executive Officer of the GM Trust Bank and Corporate Vice President of General Motors Corporation (August 1994-December 2005). | | | 86 | | | Formerly, Director of Legg Mason, Inc.; formerly, Director of the Auburn University Foundation (2010-2015). | |
* This is the earliest date the Director began serving the Morgan Stanley Funds. Each Director serves an indefinite term, until his or her successor is elected.
** The Fund Complex includes (as of December 31, 2019) all open-end and closed-end funds (including all of their portfolios) advised by Morgan Stanley Investment Management Inc. (the "Adviser") and any funds that have an adviser that is an affiliated person of the Adviser (including, but not limited to, Morgan Stanley AIP GP LP).
*** This includes any directorships at public companies and registered investment companies held by the Director at any time during the past five years.
35
Morgan Stanley Institutional Fund, Inc.
Annual Report — December 31, 2019
Director and Officer Information (unaudited) (cont'd)
Executive Officers:
Name, Birth Year and Address of
Executive Officer | | Position(s) Held
with
Registrant | | Length of
Time Served* | | Principal Occupation(s) During Past 5 Years | |
John H. Gernon
522 Fifth Avenue
New York, NY 10036
Birth Year 1963 | | President and Principal Executive Officer | | Since September 2013 | | President and Principal Executive Officer of the Equity and Fixed Income Funds and the Morgan Stanley AIP Funds (since September 2013) and the Liquidity Funds and various money market funds (since May 2014) in the Fund Complex; Managing Director of the Adviser; Head of Product (since 2006). | |
Timothy J. Knierim
522 Fifth Avenue
New York, NY 10036
Birth Year 1959 | | Chief Compliance Officer | | Since December 2016 | | Managing Director of the Adviser and various entities affiliated with the Adviser; Chief Compliance Officer of various Morgan Stanley Funds and the Adviser (since December 2016) and Chief Compliance Officer of Morgan Stanley AIP GP LP (since 2014). Formerly, Managing Director and Deputy Chief Compliance Officer of the Adviser (2014-2016); and formerly, Chief Compliance Officer of Prudential Investment Management, Inc. (2007-2014). | |
Francis J. Smith
522 Fifth Avenue
New York, NY 10036
Birth Year 1965 | | Treasurer and Principal Financial Officer | | Treasurer since July 2003 and Principal Financial Officer since September 2002 | | Managing Director of the Adviser and various entities affiliated with the Adviser; Treasurer (since July 2003) and Principal Financial Officer of various Morgan Stanley Funds (since September 2002). | |
Mary E. Mullin
522 Fifth Avenue
New York, NY 10036
Birth Year 1967 | | Secretary | | Since June 1999 | | Managing Director of the Adviser; Secretary of various Morgan Stanley Funds (since June 1999). | |
Michael J. Key
522 Fifth Avenue
New York, NY 10036
Birth Year 1979 | | Vice President | | Since June 2017 | | Vice President of the Equity and Fixed Income Funds, Liquidity Funds, various money market funds and the Morgan Stanley AIP Funds in the Fund Complex (since June 2017); Executive Director of the Adviser; Head of Product Development for Equity and Fixed Income Funds (since August 2013). | |
* This is the earliest date the officer began serving the Morgan Stanley Funds. Each officer serves a one-year term, until his or her successor is elected and qualifies.
36
Morgan Stanley Institutional Fund, Inc.
Annual Report — December 31, 2019
Adviser and Administrator
Morgan Stanley Investment Management Inc.
522 Fifth Avenue
New York, New York 10036
Distributor
Morgan Stanley Distribution, Inc.
522 Fifth Avenue
New York, New York 10036
Dividend Disbursing and Transfer Agent
DST Asset Manager Solutions, Inc.
2000 Crown Colony Drive
Quincy, Massachusetts 02169
Custodian
State Street Bank and Trust Company
One Lincoln Street
Boston, Massachusetts 02111
Legal Counsel
Dechert LLP
1095 Avenue of the Americas
New York, New York 10036
Counsel to the Independent Directors
Perkins Coie LLP
1155 Avenue of the Americas
New York, New York 10036
Independent Registered Public Accounting Firm
Ernst & Young LLP
200 Clarendon Street
Boston, Massachusetts 02116
Reporting to Shareholders
Each Morgan Stanley fund provides a complete schedule of portfolio holdings in its Semi-Annual and the Annual Reports within 60 days of the end of the fund's second and fourth fiscal quarters. The Semi-Annual and Annual Reports are filed electronically with the Securities and Exchange Commission ("SEC") on Form N-CSRS and Form N-CSR, respectively. Morgan Stanley also delivers the Semi-Annual and Annual Reports to fund shareholders and makes these reports available on its public website, www.morganstanley.com/im/shareholderreports. Each Morgan Stanley non-money market fund also files a complete schedule of portfolio holdings with the SEC for the fund's first and third fiscal quarters as an attachment to Form N-PORT. Morgan Stanley does not deliver the reports for the first and third fiscal quarters to shareholders, nor are the reports posted to the Morgan Stanley public website. However, the holdings for each money market fund are posted to the Morgan Stanley public website. You may obtain the Form N-PORT filings (as well as the Form N-CSR and N-CSRS filings) by accessing the SEC's website, www.sec.gov. You can also request copies of these materials, upon payment of a duplicating fee, by electronic request at the SEC's email address (publicinfo@sec.gov).
Proxy Voting Policies and Procedures and Proxy Voting Record
You may obtain a copy of the Company's Proxy Voting Policy and Procedures and information regarding how the Company voted proxies relating to portfolio securities during the most recent twelve-month period ended June 30, without charge, upon request, by calling toll free 1 (800) 548-7786 or by visiting our website at www.morganstanley.com/im/shareholderreports. This information is also available on the SEC's website at www.sec.gov.
This report is authorized for distribution only when preceded or accompanied by a prospectus or summary prospectus of the applicable fund of Morgan Stanley Institutional Fund, Inc., which describes in detail the fund's investment policies, risks, fees and expenses. Please read the prospectus carefully before you invest or send money. For additional information, including information regarding the investments comprising the Fund, please visit our website at www.morganstanley.com/im/shareholderreports or call toll free 1 (800) 548-7786.
37
Printed in U.S.A.
This Report has been prepared for shareholders and may be distributed to others only if preceded or accompanied by a current prospectus.
Morgan Stanley Investment Management Inc.
522 Fifth Avenue
New York, New York 10036
© 2020 Morgan Stanley. Morgan Stanley Distribution, Inc.

IFIIIOANN
2920390 EXP. 02.28.21

Morgan Stanley Institutional Fund, Inc.
International Real Estate Portfolio
Annual Report
December 31, 2019
Beginning on January 1, 2021, as permitted by regulations adopted by the Securities and Exchange Commission ("SEC"), paper copies of the Fund's Annual and Semi-Annual Reports to Shareholders ("Shareholder Reports") will no longer be sent by mail, unless you specifically request paper copies of the Shareholder Reports from the Fund or from your financial intermediary, such as a broker-dealer or a bank. Instead, the Shareholder Reports will be made available on the Fund's website, https://www.morganstanley.com/im/shareholderreports and you will be notified by mail each time a Shareholder Report is posted and provided with a website link to access the Shareholder Report. If you already elected to receive Shareholder Reports electronically, you will not be affected by this change and you need not take any action. You may elect to receive Shareholder Reports and other communications from the Fund electronically anytime by contacting your financial intermediary or, if you are a direct investor, please follow the instructions on the envelope.
Beginning on January 1, 2019, you may elect to receive all future Shareholder Reports in paper free of charge. If you invest through a financial intermediary, you can contact your financial intermediary to request that you continue to receive paper copies of your Shareholder Reports. If you invest directly with the Fund, please follow the instructions on the envelope to let the Fund know you wish to continue receiving paper copies of your Shareholder Reports. Your election to receive Shareholder Reports in paper will apply to all funds held in your account if you invest through your financial intermediary or all funds held with the fund complex if you invest directly with a fund.

Morgan Stanley Institutional Fund, Inc.
Annual Report — December 31, 2019
Shareholders' Letter | | | 2 | | |
Expense Example | | | 3 | | |
Investment Overview | | | 4 | | |
Portfolio of Investments | | | 8 | | |
Statement of Assets and Liabilities | | | 10 | | |
Statement of Operations | | | 12 | | |
Statements of Changes in Net Assets | | | 13 | | |
Financial Highlights | | | 14 | | |
Notes to Financial Statements | | | 19 | | |
Report of Independent Registered Public Accounting Firm | | | 26 | | |
Federal Tax Notice | | | 27 | | |
Privacy Notice | | | 28 | | |
Director and Officer Information | | | 30 | | |
This report is authorized for distribution only when preceded or accompanied by a prospectus or summary prospectus of the applicable Fund of Morgan Stanley Institutional Fund, Inc. To receive a prospectus and/or statement of additional information ("SAI"), which contains more complete information such as investment objectives, charges, expenses, policies for voting proxies, risk considerations and describes in detail each of the Fund's investment policies to the prospective investor, please call toll free 1 (800) 548-7786. Please read the prospectuses carefully before you invest or send money.
Additionally, you can access information about the Fund, including performance, characteristics and investment team commentary, through Morgan Stanley Investment Management's website: www.morganstanley.com/im/shareholderreports.
Market forecasts provided in this report may not necessarily come to pass. There is no guarantee that any sectors mentioned will continue to perform as discussed herein or that securities in such sectors will be held by the Fund in the future. There is no assurance that a fund will achieve its investment objective. Funds are subject to market risk, which is the possibility that market values of securities owned by the Fund will decline and, therefore, the value of the Fund's shares may be less than what you paid for them. Accordingly, you can lose money investing in this Fund. Please see the prospectus for more complete information on investment risks.
1
Morgan Stanley Institutional Fund, Inc.
Annual Report — December 31, 2019
Shareholders' Letter (unaudited)
Dear Shareholders,
We are pleased to provide this Annual Report, in which you will learn how your investment in International Real Estate Portfolio (the "Fund") performed during the latest twelve-month period.
Morgan Stanley Investment Management is a client-centric, investor-led organization. Our global presence, intellectual capital, and breadth of products and services enable us to partner with investors to meet the evolving challenges of today's financial markets. We aim to deliver superior investment service and to empower our clients to make the informed decisions that help them reach their investment goals.
As always, we thank you for selecting Morgan Stanley Investment Management, and look forward to working with you in the months and years ahead.
Sincerely,

John H. Gernon
President and Principal Executive Officer
January 2020
2
Morgan Stanley Institutional Fund, Inc.
Annual Report — December 31, 2019
Expense Example (unaudited)
International Real Estate Portfolio
As a shareholder of the Fund, you incur two types of costs: (1) transactional costs, including redemption fees; and (2) ongoing costs, which may include advisory fees, administration fees, distribution and shareholder services fees and other Fund expenses. This example is intended to help you understand your ongoing costs (in dollars) of investing in the Fund and to compare these costs with the ongoing costs of investing in other mutual funds.
This example is based on an investment of $1,000 invested at the beginning of the six-month period ended December 31, 2019 and held for the entire six-month period.
Actual Expenses
The table below provides information about actual account values and actual expenses. You may use the information in this table, together with the amount you invested, to estimate the expenses that you paid over the period. Simply divide your account value by $1,000 (for example, an $8,600 account value divided by $1,000 = 8.6), then multiply the result by the number in the table under the heading entitled "Actual Expenses Paid During Period" to estimate the expenses you paid on your account during this period.
Hypothetical Example for Comparison Purposes
The table below provides information about hypothetical account values and hypothetical expenses based on the Fund's actual expense ratio and an assumed rate of return of 5% per year before expenses, which is not the Fund's actual return. The hypothetical account values and expenses may not be used to estimate the actual ending account balance or expenses you paid for the period. You may use this information to compare the ongoing costs of investing in the Fund and other funds. To do so, compare this 5% hypothetical example with the 5% hypothetical examples that appear in the shareholder reports of the other funds.
Please note that the expenses shown in the table are meant to highlight your ongoing costs only and do not reflect any transactional costs, such as sales charges (loads) and redemption fees. Therefore, the information for each class in the table is useful in comparing ongoing costs only, and will not help you determine the relative total costs of owning different funds. In addition, if these transactional costs were included, your costs would have been higher.
| | | Beginning
Account
Value
7/1/19 | | Actual Ending
Account
Value
12/31/19 | | Hypothetical
Ending Account
Value | | Actual
Expenses
Paid
During
Period* | | Hypothetical
Expenses Paid
During Period* | | Net
Expense
Ratio
During
Period** | |
International Real Estate Portfolio Class I | | $ | 1,000.00 | | | $ | 1,048.00 | | | $ | 1,020.16 | | | $ | 5.16 | | | $ | 5.09 | | | | 1.00 | % | |
International Real Estate Portfolio Class A | | | 1,000.00 | | | | 1,046.70 | | | | 1,018.40 | | | | 6.96 | | | | 6.87 | | | | 1.35 | | |
International Real Estate Portfolio Class L | | | 1,000.00 | | | | 1,043.60 | | | | 1,015.88 | | | | 9.53 | | | | 9.40 | | | | 1.85 | | |
International Real Estate Portfolio Class C | | | 1,000.00 | | | | 1,042.30 | | | | 1,014.62 | | | | 10.81 | | | | 10.66 | | | | 2.10 | | |
International Real Estate Portfolio Class IS | | | 1,000.00 | | | | 1,048.50 | | | | 1,020.32 | | | | 5.01 | | | | 4.94 | | | | 0.97 | | |
* Expenses are calculated using each Fund Class' annualized net expense ratio (as disclosed), multiplied by the average account value over the period and multiplied by 184/365 (to reflect the most recent one-half year period).
** Annualized.
3
Morgan Stanley Institutional Fund, Inc.
Annual Report — December 31, 2019
Investment Overview (unaudited)
International Real Estate Portfolio
The Fund seeks to provide current income and long-term capital appreciation.
Performance
For the fiscal year ended December 31, 2019, the Fund's Class I shares had a total return based on net asset value and reinvestment of distributions per share of 17.94%, net of fees. The Fund's Class I shares underperformed the Fund's benchmark, the FTSE EPRA Nareit Developed ex-North America Real Estate — Net Total Return Index (the "Index"), which returned 20.65%, and underperformed the MSCI EAFE Index, which returned 22.01%.
Factors Affecting Performance
• Overall returns have been strong in the real estate investment trust (REIT) market for full year 2019, but there was a wide disparity in share price performance; sectors viewed as defensive generally outperformed as the lower-for-longer investment theme strengthened and segments of the equity market appeared to be pricing in an economic slowdown/recession scenario. Bond yields continued to decline, achieving all-time lows in late August 2019; a phase that began in the fourth quarter of 2018, resulting in negative sovereign bond yields in certain markets (Germany, Japan) and significant bond yield declines in the U.S. and Australia. Given this combination of thematic investing and all-time low bond yields, we have witnessed a continued willingness among investors to pay premium valuations for segments of the market that are viewed as having greater predictability in cash flows. We suspect that underlying private market property valuation has become a less relevant metric as generalist investors and passive funds have become the marginal buyer of real estate securities. Generalist investors appear to place a greater focus on secular themes and are untethered to private market valuations.
• With share prices generally appearing untethered to private real estate values, there are sectors trading at relative valuations previously witnessed during the 2008-09 global financial crisis and some sectors trading in excess of 50% premiums to net asset values (NAVs). There has been a continued willingness to pay premium valuations for segments of the REIT market that are viewed as having greater predictability in cash flows (e.g. Japan REITs, commonly known as J-REITs) or benefiting
from a secular investment theme. In addition, the concerns with regard to economic growth have generally placed downward pressure on segments that are viewed as more vulnerable — office, retail and hotels. Many of these stocks are trading at large discounts to NAVs, despite significant transactional evidence in the private markets in the office and hotel sectors. This has resulted in a further widening of the disparity in share price valuations among market segments. The Fund continues to be underweight to segments that have benefited from this theme due to premium share price valuations, and overweight to market segments which trade at very attractive discounted valuations.
• The international real estate securities market gained 20.7% during the 12-month period ending December 31, 2019, as measured by the Index.
o In Asia, property stocks gained 17.1%, as measured by the FTSE EPRA Nareit Developed Asia Index.(i) There have been three important macro events impacting Asia: the protests in Hong Kong, the ongoing U.S.-China trade war and the overall view of the market from lower-for-longer (this sentiment peaked in August 2019) to a more recent shift towards modestly higher sovereign bond yields. Following declines due to the continuation of anti-government protests, Hong Kong stocks traded at a wide discount to NAV and continue to trade at the widest discounts on a global basis. In Japan, REITs posted gains due to investors' search for yield, the Bank of Japan's commitment to monetary easing and the asset purchase program, and the segment's defensive characteristics.
o In Europe, property stocks gained 27.3%, as measured by the FTSE EPRA Nareit Developed Europe Index.(i) The U.K. posted the largest gains on a global basis due to currency strength and less uncertainty over Brexit.
• The top contributors to performance were the underweight to German residential and overweight to the U.K. Majors and London office specialists.
o German residential underweight — the Fund's underweight to this sector was a key contributor as the sector experienced steep
4
Morgan Stanley Institutional Fund, Inc.
Annual Report — December 31, 2019
Investment Overview (unaudited) (cont'd)
International Real Estate Portfolio
declines and volatility, particularly after the second quarter of 2019 when the City of Berlin proposed to freeze rents and have rental reductions in some cases, in response to a surge in housing costs.
o U.K. Majors and London office specialists overweight — the U.K. Majors and London office specialists traded at attractive discounted valuations throughout the year, and experienced a strong recovery in share prices in the fourth quarter of 2019 on reduced concerns over Brexit.
• The key detractors from performance were the Fund's overweight to and stock selection within the Hong Kong real estate operating companies (REOCs), underweight to J-REITs, the overweight to Continental European retail and underweight to Singapore.
o Hong Kong REOCs — the overweight to Hong Kong REOCs detracted for the period due to escalation of anti-government protests and market sentiment on the economic uncertainties related to the U.S.-Sino trade war. The stocks experienced a recovery in the fourth quarter of 2019, but still ended the year trading at a significant 47% discount to NAVs.
o J-REITs underweight — this sector significantly outperformed for the period and traded at a +22% premium to NAVs as investors continued to favor J-REITs due to being viewed as defensive and attractive in a lower-for-longer Japanese government bond yield environment.
o Continental European retail overweight — there is a wide disparity in valuations with Continental retail stocks trading at a 29% discount to NAVs despite stable operating results.
Management Strategies
• We believe listed real estate security returns should mirror private real estate performance. This strategy may result in periods of underperformance, particularly when the market is driven more by thematic/momentum investing and macro factors, as opposed to fundamentals and intrinsic value. The current prolonged period in which underlying
private market valuation is not a relevant determinant of share prices has been surprising. The private market is more than six times larger than the public markets and has, up until this period, always served as a key determinant of share prices and our key metric. It is logical to us that persistent discounts cannot exist when there is so much capital on the sidelines needing to invest, and we believe we will be rewarded as these stocks provide favorable risk-adjusted return opportunities based on our analysis.
• We would note the lack of focus on valuations/fundamentals has been, in our opinion, prolonged due to the following factors:
o Institutional investors have demonstrated a significant preference for private real estate (as opposed to public real estate); as a result, generalist and passive investors have become the marginal buyers.
o Generalist investors tend to focus less on valuations and more on traditional stock market metrics (such as earnings growth and dividend yields) and secular themes.
o Growth of passive investing in the REIT space has contributed to exacerbating the dislocation due to a lack of focus on differentiating among stocks based on fundamentals, and instead adding to overvalued stocks that have grown in market capitalization and reducing exposure to undervalued stocks that have decreased in size.
o Untethered to private real estate valuations, earnings multiples have expanded to record levels in sectors viewed as more defensive or benefiting from favorable secular themes. This has resulted in a willingness to ignore the distinction in multiples used to value assets in the private real estate sector and therefore indifference about the quality of the real estate cash flow when buying stocks based on fund from operations (FFO) multiples.
• Regional bets are currently relatively muted due to a lack of large valuation disparities among the regions and due to macro uncertainties which may impact regional share prices far more than underlying fundamentals and valuations, and we have instead focused more on the significant disparity in
5
Morgan Stanley Institutional Fund, Inc.
Annual Report — December 31, 2019
Investment Overview (unaudited) (cont'd)
International Real Estate Portfolio
valuations within each of the regions. While the overall global real estate securities market ended the period trading at a 5% premium to NAVs, we see significant disparities in valuations among market segments within each of the major regions, with the most attractive expected return prospects from companies concentrated in Continental European high quality retail, the Hong Kong commercial property companies, the U.K. Majors, and select opportunities to invest in other core assets at attractive discounted valuations in a number of other global markets.
(i) The FTSE EPRA Nareit Developed Asia Index is a subset of the FTSE EPRA Nareit Developed Index and is a free float-adjusted market capitalization weighted index composed of listed real estate securities in the Asia real estate markets. The FTSE EPRA Nareit Developed Europe Index is a subset of the FTSE EPRA Nareit Developed Index and is a free float-adjusted market capitalization weighted index composed of listed real estate securities in the European real estate markets. The performance of the indexes are listed in U.S. dollars and assume reinvestment of dividends. The indexes are unmanaged and their returns do not include any sales charges or fees. Such costs would lower performance. It is not possible to invest directly in an index.

* Minimum Investment for Class I shares
In accordance with SEC regulations, the Fund's performance shown assumes that all recurring fees (including management fees) were deducted and all dividends and distributions were reinvested. The performance of Class A, L, C and IS shares will vary from the performance of Class I shares based upon their different inception dates and will be negatively impacted by additional fees assessed to those classes (if applicable).
6
Morgan Stanley Institutional Fund, Inc.
Annual Report — December 31, 2019
Investment Overview (unaudited) (cont'd)
International Real Estate Portfolio
Performance Compared to the FTSE EPRA Nareit Developed ex-North America Real Estate — Net Total Return Index(1) and the MSCI EAFE Index(2)
| | | Period Ended December 31, 2019
Total Returns(3) | |
| | | | | Average Annual | |
| | | One
Year | | Five
Years | | Ten
Years | | Since
Inception(8) | |
Fund — Class I Shares
w/o sales charges(4) | | | 17.94 | % | | | 4.24 | % | | | 5.25 | % | | | 7.41 | % | |
Fund — Class A Shares
w/o sales charges(4) | | | 17.53 | | | | 3.89 | | | | 4.92 | | | | 7.11 | | |
Fund — Class A Shares with
maximum 5.25% sales charges(4) | | | 11.38 | | | | 2.77 | | | | 4.36 | | | | 6.86 | | |
Fund — Class L Shares
w/o sales charges(5) | | | 16.93 | | | | 3.37 | | | | — | | | | 5.51 | | |
Fund — Class C Shares
w/o sales charges(7) | | | 16.62 | | | | — | | | | — | | | | 1.62 | | |
Fund — Class C Shares with
maximum 1.00% deferred
sales charges(7) | | | 15.62 | | | | — | | | | — | | | | 1.62 | | |
Fund — Class IS Shares
w/o sales charges(6) | | | 18.00 | | | | 4.29 | | | | — | | | | 3.93 | | |
FTSE EPRA Nareit Developed
ex-North America Real Estate —
Net Total Return Index | | | 20.65 | | | | 5.80 | | | | 6.86 | | | | 6.23 | | |
MSCI EAFE Index | | | 22.01 | | | | 5.67 | | | | 5.50 | | | | 4.54 | | |
Performance data quoted represents past performance, which is no guarantee of future results, and current performance may be lower or higher than the figures shown. Performance assumes that all dividends and distributions, if any, were reinvested. For the most recent month-end performance figures, please visit www.morganstanley.com/im/shareholderreports. Investment return and principal value will fluctuate so that Fund shares, when redeemed, may be worth more or less than their original cost. Total returns do not reflect the deduction of taxes that a shareholder would pay on Fund distributions or the redemption of Fund shares. Performance of share classes will vary due to difference in sales charges and expenses.
(1) The FTSE EPRA Nareit Developed ex-North America Real Estate — Net Total Return Index is a free float-adjusted market capitalization weighted index designed to reflect the stock performance of companies engaged in the European and Asian real estate markets. The performance of the Index is listed in U.S. dollars and assumes reinvestment of dividends. "Net Total Return" reflects a reduction in total returns after taking into account the withholding tax on dividends by certain foreign countries represented in the Index for periods after 2/18/05 (gross returns used prior to 2/18/05). The Index is unmanaged and its returns do not include any sales charges or fees. Such costs would lower performance. It is not possible to invest directly in an index.
(2) The MSCI EAFE Index (Europe, Australasia, Far East) is a free float-adjusted market capitalization index that is designed to measure the international equity market performance of developed markets, excluding the U.S. & Canada. The term "free float" represents the portion of shares outstanding that are deemed to be available for purchase in the public equity markets by investors. The MSCI EAFE Index currently consists of 21 developed market country indices. The performance of the Index is listed in U.S. dollars and assumes reinvestment of net dividends. Net total return indices reinvest dividends after the deduction of withholding taxes, using (for international indices) a tax rate applicable to non-resident institutional investors who do not benefit from double taxation treaties. The Index is unmanaged and its returns do not include any sales charges or fees. Such costs would lower performance. It is not possible to invest directly in an index.
(3) Total returns for the Fund reflect fees waived and expenses reimbursed, if applicable, by the Adviser (as defined herein). Without such waivers and reimbursements, total returns would have been lower.
(4) Commenced operations on October 1, 1997.
(5) Commenced offering on April 27, 2012.
(6) Commenced offering on September 13, 2013.
(7) Commenced offering on April 30, 2015.
(8) For comparative purposes, average annual since inception returns listed for the Indexes refer to the inception date of Class I of the Fund, not the inception of the Index.
7
Morgan Stanley Institutional Fund, Inc.
Annual Report — December 31, 2019
Portfolio of Investments
International Real Estate Portfolio
| | | Shares | | Value
(000) | |
Common Stocks (207.3%) | |
Australia (14.1%) | |
Dexus REIT | | | 37,426 | | | $ | 307 | | |
GPT Group (The) REIT | | | 35,920 | | | | 141 | | |
Mirvac Group REIT | | | 68,224 | | | | 152 | | |
Scentre Group REIT | | | 160,218 | | | | 431 | | |
Stockland REIT | | | 1,486 | | | | 5 | | |
Vicinity Centres REIT | | | 63,641 | | | | 111 | | |
| | | | 1,147 | | |
Austria (0.4%) | |
Atrium European Real Estate Ltd. (a) | | | 8,036 | | | | 31 | | |
China (6.2%) | |
China Overseas Land & Investment Ltd. (b) | | | 46,000 | | | | 179 | | |
China Resources Land Ltd. (b) | | | 34,000 | | | | 169 | | |
Longfor Group Holdings Ltd. (b) | | | 32,500 | | | | 152 | | |
Poly Property Development Co., Ltd. (a)(b) | | | 600 | | | | 4 | | |
| | | | 504 | | |
Finland (1.5%) | |
Kojamo Oyj | | | 6,832 | | | | 124 | | |
France (24.7%) | |
Carmila SA REIT | | | 3,360 | | | | 75 | | |
Covivio REIT | | | 1,178 | | | | 134 | | |
Gecina SA REIT | | | 2,630 | | | | 471 | | |
ICADE REIT | | | 902 | | | | 98 | | |
Klepierre SA REIT | | | 10,169 | | | | 386 | | |
Mercialys SA REIT | | | 12,580 | | | | 174 | | |
Unibail-Rodamco-Westfield REIT | | | 4,214 | | | | 665 | | |
| | | | 2,003 | | |
Germany (17.8%) | |
ADO Properties SA | | | 1,530 | | | | 55 | | |
Alstria Office AG REIT | | | 7,433 | | | | 140 | | |
Deutsche Wohnen SE | | | 11,162 | | | | 454 | | |
LEG Immobilien AG | | | 1,403 | | | | 166 | | |
Vonovia SE | | | 11,696 | | | | 628 | | |
| | | | 1,443 | | |
Hong Kong (42.7%) | |
China Merchants Commercial Real
Estate Investment Trust REIT (a) | | | 68,394 | | | | 29 | | |
CK Asset Holdings Ltd. | | | 32,000 | | | | 231 | | |
Hang Lung Properties Ltd. | | | 49,000 | | | | 108 | | |
Hongkong Land Holdings Ltd. | | | 89,100 | | | | 512 | | |
Hysan Development Co., Ltd. | | | 15,836 | | | | 62 | | |
Link REIT | | | 77,895 | | | | 825 | | |
Midea Real Estate Holding Ltd. | | | 9,200 | | | | 28 | | |
New World Development Co., Ltd. | | | 106,788 | | | | 146 | | |
Sino Land Co., Ltd. | | | 28,795 | | | | 42 | | |
Sun Hung Kai Properties Ltd. | | | 50,456 | | | | 773 | | |
Swire Properties Ltd. | | | 131,100 | | | | 435 | | |
Wharf Real Estate Investment Co., Ltd. | | | 45,370 | | | | 277 | | |
| | | | 3,468 | | |
| | | Shares | | Value
(000) | |
Ireland (2.6%) | |
Hibernia REIT PLC | | | 135,337 | | | $ | 214 | | |
Japan (48.7%) | |
Activia Properties, Inc. REIT | | | 14 | | | | 70 | | |
Advance Residence Investment Corp. REIT | | | 43 | | | | 136 | | |
Daiwa Office Investment Corp. REIT | | | 6 | | | | 46 | | |
Frontier Real Estate Investment Corp. REIT | | | 3 | | | | 13 | | |
GLP J-REIT | | | 104 | | | | 129 | | |
Hulic Co., Ltd. | | | 5,700 | | | | 69 | | |
Hulic REIT, Inc. | | | 23 | | | | 42 | | |
Industrial & Infrastructure Fund Investment
Corp. REIT | | | 4 | | | | 6 | | |
Invincible Investment Corp. REIT | | | 38 | | | | 22 | | |
Japan Excellent, Inc. REIT | | | 23 | | | | 37 | | |
Japan Hotel REIT Investment Corp. | | | 166 | | | | 124 | | |
Japan Real Estate Investment Corp. REIT | | | 51 | | | | 338 | | |
Japan Retail Fund Investment Corp. REIT | | | 55 | | | | 118 | | |
Kenedix Office Investment Corp. REIT | | | 8 | | | | 62 | | |
Mitsubishi Estate Co., Ltd. | | | 34,100 | | | | 653 | | |
Mitsui Fudosan Co., Ltd. | | | 25,300 | | | | 618 | | |
Mori Trust Sogo Reit, Inc. | | | 29 | | | | 52 | | |
Nippon Building Fund, Inc. REIT | | | 60 | | | | 440 | | |
Nippon Prologis, Inc. REIT | | | 29 | | | | 74 | | |
Nomura Real Estate Master Fund, Inc. REIT | | | 114 | | | | 195 | | |
Orix, Inc. J-REIT | | | 24 | | | | 52 | | |
Premier Investment Corp. REIT | | | 23 | | | | 33 | | |
Sumitomo Realty & Development Co., Ltd. | | | 12,600 | | | | 440 | | |
Tokyo Tatemono Co., Ltd. | | | 600 | | | | 9 | | |
United Urban Investment Corp. REIT | | | 95 | | | | 178 | | |
| | | | 3,956 | | |
Malta (0.1%) | |
BGP Holdings PLC (a)(c) | | | 4,769,371 | | | | 7 | | |
Netherlands (3.7%) | |
Eurocommercial Properties N.V. CVA REIT | | | 6,369 | | | | 179 | | |
NSI N.V. REIT | | | 1,976 | | | | 96 | | |
Wereldhave N.V. REIT | | | 1,175 | | | | 26 | | |
| | | | 301 | | |
Norway (2.3%) | |
Entra ASA | | | 9,861 | | | | 163 | | |
Norwegian Property ASA | | | 16,770 | | | | 26 | | |
| | | | 189 | | |
Singapore (8.2%) | |
Ascendas Real Estate Investment Trust REIT | | | 84,604 | | | | 187 | | |
CapitaLand Commercial Trust REIT | | | 81,760 | | | | 121 | | |
CapitaLand Ltd. | | | 5,800 | | | | 16 | | |
CapitaLand Mall Trust REIT | | | 48,100 | | | | 88 | | |
Frasers Logistics & Industrial Trust REIT | | | 65,900 | | | | 61 | | |
Mapletree Commercial Trust REIT | | | 43,092 | | | | 77 | | |
Mapletree Logistics Trust REIT | | | 35,700 | | | | 46 | | |
UOL Group Ltd. | | | 10,913 | | | | 67 | | |
| | | | 663 | | |
The accompanying notes are an integral part of the financial statements.
8
Morgan Stanley Institutional Fund, Inc.
Annual Report — December 31, 2019
Portfolio of Investments (cont'd)
International Real Estate Portfolio
| | | Shares | | Value
(000) | |
Spain (6.3%) | |
Inmobiliaria Colonial Socimi SA REIT | | | 14,077 | | | $ | 180 | | |
Merlin Properties Socimi SA REIT | | | 23,302 | | | | 334 | | |
| | | | 514 | | |
Sweden (4.7%) | |
Atrium Ljungberg AB, Class B | | | 3,174 | | | | 77 | | |
Castellum AB | | | 2,600 | | | | 61 | | |
Fabege AB | | | 2,463 | | | | 41 | | |
Hufvudstaden AB, Class A | | | 8,114 | | | | 160 | | |
Kungsleden AB | | | 3,604 | | | | 38 | | |
| | | | 377 | | |
Switzerland (1.4%) | |
PSP Swiss Property AG (Registered) | | | 795 | | | | 110 | | |
United Kingdom (21.9%) | |
British Land Co., PLC (The) REIT | | | 40,878 | | | | 346 | | |
Capital & Counties Properties PLC | | | 24,897 | | | | 86 | | |
Derwent London PLC REIT | | | 3,112 | | | | 165 | | |
Grainger PLC | | | 11,558 | | | | 48 | | |
Great Portland Estates PLC REIT | | | 12,124 | | | | 138 | | |
Hammerson PLC REIT | | | 55,258 | | | | 226 | | |
Intu Properties PLC REIT (a) | | | 21,908 | | | | 10 | | |
Land Securities Group PLC REIT | | | 27,290 | | | | 358 | | |
Segro PLC REIT | | | 8,591 | | | | 102 | | |
Shaftesbury PLC REIT | | | 3,542 | | | | 44 | | |
St. Modwen Properties PLC | | | 14,107 | | | | 93 | | |
Urban & Civic PLC | | | 35,981 | | | | 165 | | |
| | | | 1,781 | | |
Total Common Stocks (Cost $13,211) | | | 16,832 | | |
Short-Term Investment (2.0%) | |
Investment Company (2.0%) | |
Morgan Stanley Institutional Liquidity
Funds — Treasury Portfolio —
Institutional Class (See Note G)
(Cost $163) | | | 162,578 | | | | 163 | | |
Total Investments (209.3%) (Cost $13,374) (d)(e) | | | 16,995 | | |
Liabilities in Excess of Other Assets (–109.3%) | | | (8,876 | ) | |
Net Assets (100.0%) | | $ | 8,119 | | |
Country assignments and aggregations are based generally on third party vendor classifications and information, and may be different from the assignments and aggregations under the policies set forth in the Fund's prospectus and/or statement of additional information relating to geographic classifications.
(a) Non-income producing security.
(b) Security trades on the Hong Kong exchange.
(c) At December 31, 2019, the Fund held a fair valued security valued at approximately $7,000, representing 0.1% of net assets. This security has been fair valued as determined in good faith under procedures established by and under the general supervision of the Company's (as defined herein) Directors.
(d) The approximate fair value and percentage of net assets, $6,230,000 and 76.7%, respectively, represent the securities that have been fair valued under the fair valuation policy for international investments as described in Note A-1 within the Notes to the Financial Statements.
(e) At December 31, 2019, the aggregate cost for federal income tax purposes is approximately $16,014,000. The aggregate gross unrealized appreciation is approximately $1,330,000 and the aggregate gross unrealized depreciation is approximately $349,000, resulting in net unrealized appreciation of approximately $981,000.
CVA Certificaten Van Aandelen.
REIT Real Estate Investment Trust.
Portfolio Composition
Classification | | Percentage of
Total Investments | |
Diversified | | | 43.7 | % | |
Office | | | 20.0 | | |
Retail | | | 19.7 | | |
Residential | | | 10.6 | | |
Other* | | | 6.0 | | |
Total Investments | | | 100.0 | % | |
* Industries and/or investment types representing less than 5% of total investments.
The accompanying notes are an integral part of the financial statements.
9
Morgan Stanley Institutional Fund, Inc.
Annual Report — December 31, 2019
International Real Estate Portfolio
Statement of Assets and Liabilities | | December 31, 2019
(000) | |
Assets: | |
Investments in Securities of Unaffiliated Issuers, at Value (Cost $13,211) | | $ | 16,832 | | |
Investment in Security of Affiliated Issuer, at Value (Cost $163) | | | 163 | | |
Total Investments in Securities, at Value (Cost $13,374) | | | 16,995 | | |
Foreign Currency, at Value (Cost —@) | | | 1 | | |
Due from Adviser | | | 50 | | |
Dividends Receivable | | | 37 | | |
Tax Reclaim Receivable | | | 14 | | |
Receivable for Investments Sold | | | — | @ | |
Receivable from Affiliate | | | — | @ | |
Other Assets | | | 35 | | |
Total Assets | | | 17,132 | | |
Liabilities: | |
Payable for Fund Shares Redeemed | | | 8,934 | | |
Payable for Professional Fees | | | 44 | | |
Payable for Custodian Fees | | | 13 | | |
Deferred Capital Gain Country Tax | | | 7 | | |
Payable for Transfer Agency Fees — Class I | | | 1 | | |
Payable for Transfer Agency Fees — Class A | | | 1 | | |
Payable for Transfer Agency Fees — Class L | | | — | @ | |
Payable for Transfer Agency Fees — Class C | | | — | @ | |
Payable for Transfer Agency Fees — Class IS | | | — | @ | |
Payable for Administration Fees | | | 1 | | |
Payable for Sub Transfer Agency Fees — Class I | | | 1 | | |
Payable for Sub Transfer Agency Fees — Class A | | | — | @ | |
Payable for Sub Transfer Agency Fees — Class C | | | — | @ | |
Payable for Shareholder Services Fees — Class A | | | — | @ | |
Payable for Distribution and Shareholder Services Fees — Class L | | | — | @ | |
Payable for Distribution and Shareholder Services Fees — Class C | | | — | @ | |
Other Liabilities | | | 11 | | |
Total Liabilities | | | 9,013 | | |
Net Assets | | $ | 8,119 | | |
Net Assets Consist of: | |
Paid-in-Capital | | $ | 230,855 | | |
Total Accumulated Loss | | | (222,736 | ) | |
Net Assets | | $ | 8,119 | | |
The accompanying notes are an integral part of the financial statements.
10
Morgan Stanley Institutional Fund, Inc.
Annual Report — December 31, 2019
International Real Estate Portfolio
Statement of Assets and Liabilities (cont'd) | | December 31, 2019
(000) | |
CLASS I: | |
Net Assets | | $ | 7,076 | | |
| Shares Outstanding $0.001 par value shares of beneficial interest (unlimited shares authorized) (not in 000's) | | | 357,132 | | |
Net Asset Value, Offering and Redemption Price Per Share | | $ | 19.81 | | |
CLASS A: | |
Net Assets | | $ | 1,013 | | |
| Shares Outstanding $0.001 par value shares of beneficial interest (unlimited shares authorized) (not in 000's) | | | 51,008 | | |
Net Asset Value, Redemption Price Per Share | | $ | 19.85 | | |
Maximum Sales Load | | | 5.25 | % | |
Maximum Sales Charge | | $ | 1.10 | | |
Maximum Offering Price Per Share | | $ | 20.95 | | |
CLASS L: | |
Net Assets | | $ | 11 | | |
| Shares Outstanding $0.001 par value shares of beneficial interest (unlimited shares authorized) (not in 000's) | | | 580 | | |
Net Asset Value, Offering and Redemption Price Per Share | | $ | 19.74 | | |
CLASS C: | |
Net Assets | | $ | 9 | | |
| Shares Outstanding $0.001 par value shares of beneficial interest (unlimited shares authorized) (not in 000's) | | | 470 | | |
Net Asset Value, Offering and Redemption Price Per Share | | $ | 19.70 | | |
CLASS IS: | |
Net Assets | | $ | 10 | | |
| Shares Outstanding $0.001 par value shares of beneficial interest (unlimited shares authorized) (not in 000's) | | | 507 | | |
Net Asset Value, Offering and Redemption Price Per Share | | $ | 19.80 | | |
@ Amount is less than $500.
The accompanying notes are an integral part of the financial statements.
11
Morgan Stanley Institutional Fund, Inc.
Annual Report — December 31, 2019
International Real Estate Portfolio
Statement of Operations | | Year Ended
December 31, 2019
(000) | |
Investment Income: | |
Dividends from Securities of Unaffiliated Issuers (Net of $59 of Foreign Taxes Withheld) | | $ | 642 | | |
Non-Cash Dividends from Securities of Unaffiliated Issuers | | | 42 | | |
Dividends from Security of Affiliated Issuer (Note G) | | | 5 | | |
Total Investment Income | | | 689 | | |
Expenses: | |
Advisory Fees (Note B) | | | 158 | | |
Professional Fees | | | 102 | | |
Custodian Fees (Note F) | | | 69 | | |
Registration Fees | | | 67 | | |
Shareholder Reporting Fees | | | 18 | | |
Administration Fees (Note C) | | | 16 | | |
Transfer Agency Fees — Class I (Note E) | | | 4 | | |
Transfer Agency Fees — Class A (Note E) | | | 2 | | |
Transfer Agency Fees — Class L (Note E) | | | 2 | | |
Transfer Agency Fees — Class C (Note E) | | | 2 | | |
Transfer Agency Fees — Class IS (Note E) | | | 2 | | |
Sub Transfer Agency Fees — Class I | | | 8 | | |
Sub Transfer Agency Fees — Class A | | | 1 | | |
Sub Transfer Agency Fees — Class L | | | — | @ | |
Directors' Fees and Expenses | | | 7 | | |
Pricing Fees | | | 7 | | |
Shareholder Services Fees — Class A (Note D) | | | 3 | | |
Distribution and Shareholder Services Fees — Class L (Note D) | | | — | @ | |
Distribution and Shareholder Services Fees — Class C (Note D) | | | — | @ | |
Other Expenses | | | 17 | | |
Expenses Before Non Operating Expenses | | | 485 | | |
Bank Overdraft Expense | | | 4 | | |
Total Expenses | | | 489 | | |
Waiver of Advisory Fees (Note B) | | | (158 | ) | |
Expenses Reimbursed by Adviser (Note B) | | | (109 | ) | |
Reimbursement of Class Specific Expenses — Class I (Note B) | | | (9 | ) | |
Reimbursement of Class Specific Expenses — Class A (Note B) | | | (2 | ) | |
Reimbursement of Class Specific Expenses — Class L (Note B) | | | (2 | ) | |
Reimbursement of Class Specific Expenses — Class C (Note B) | | | (2 | ) | |
Reimbursement of Class Specific Expenses — Class IS (Note B) | | | (2 | ) | |
Rebate from Morgan Stanley Affiliate (Note G) | | | (— | @) | |
Net Expenses | | | 205 | | |
Net Investment Income | | | 484 | | |
Realized Gain (Loss): | |
Investments Sold | | | 868 | | |
Foreign Currency Translation | | | (5 | ) | |
Net Realized Gain | | | 863 | | |
Change in Unrealized Appreciation (Depreciation): | |
Investments (Net of Increase in Deferred Capital Gain Country Tax of $7) | | | 2,103 | | |
Foreign Currency Translation | | | — | @ | |
Net Change in Unrealized Appreciation (Depreciation) | | | 2,103 | | |
Net Realized Gain and Change in Unrealized Appreciation (Depreciation) | | | 2,966 | | |
Net Increase in Net Assets Resulting from Operations | | $ | 3,450 | | |
@ Amount is less than $500.
The accompanying notes are an integral part of the financial statements.
12
Morgan Stanley Institutional Fund, Inc.
Annual Report — December 31, 2019
International Real Estate Portfolio
Statements of Changes in Net Assets | | Year Ended
December 31, 2019
(000) | | Year Ended
December 31, 2018
(000) | |
Increase (Decrease) in Net Assets: | |
Operations: | |
Net Investment Income | | $ | 484 | | | $ | 807 | | |
Net Realized Gain | | | 863 | | | | 1,074 | | |
Net Change in Unrealized Appreciation (Depreciation) | | | 2,103 | | | | (4,143 | ) | |
Net Increase (Decrease) in Net Assets Resulting from Operations | | | 3,450 | | | | (2,262 | ) | |
Dividends and Distributions to Shareholders: | |
Class I | | | (81 | ) | | | (702 | ) | |
Class A | | | (7 | ) | | | (67 | ) | |
Class L | | | (— | @) | | | (— | @) | |
Class C | | | (— | @) | | | (2 | ) | |
Class IS | | | (104 | ) | | | (452 | ) | |
Total Dividends and Distributions to Shareholders | | | (192 | ) | | | (1,223 | ) | |
Capital Share Transactions:(1) | |
Class I: | |
Subscribed | | | 403 | | | | 322 | | |
Distributions Reinvested | | | 77 | | | | 699 | | |
Redeemed | | | (8,390 | ) | | | (5,620 | ) | |
Class A: | |
Subscribed | | | 6 | | | | 9 | | |
Distributions Reinvested | | | 6 | | | | 59 | | |
Redeemed | | | (634 | ) | | | (359 | ) | |
Class L: | |
Distributions Reinvested | | | — | @ | | | — | | |
Class C: | |
Distributions Reinvested | | | — | @ | | | 2 | | |
Redeemed | | | — | | | | (117 | ) | |
Class IS: | |
Distributions Reinvested | | | 104 | | | | 452 | | |
Redeemed | | | (9,934 | ) | | | (2,000 | ) | |
Net Decrease in Net Assets Resulting from Capital Share Transactions | | | (18,362 | ) | | | (6,553 | ) | |
Total Decrease in Net Assets | | | (15,104 | ) | | | (10,038 | ) | |
Net Assets: | |
Beginning of Period | | | 23,223 | | | | 33,261 | | |
End of Period | | $ | 8,119 | | | $ | 23,223 | | |
(1) Capital Share Transactions: | |
Class I: | |
Shares Subscribed | | | 21 | | | | 17 | | |
Shares Issued on Distributions Reinvested | | | 4 | | | | 38 | | |
Shares Redeemed | | | (449 | ) | | | (299 | ) | |
Net Decrease in Class I Shares Outstanding | | | (424 | ) | | | (244 | ) | |
Class A: | |
Shares Subscribed | | | — | @@ | | | 1 | | |
Shares Issued on Distributions Reinvested | | | — | @@ | | | 3 | | |
Shares Redeemed | | | (33 | ) | | | (19 | ) | |
Net Decrease in Class A Shares Outstanding | | | (33 | ) | | | (15 | ) | |
Class L: | |
Shares Issued on Distributions Reinvested | | | — | @@ | | | — | | |
Class C: | |
Shares Issued on Distributions Reinvested | | | — | @@ | | | — | @@ | |
Shares Redeemed | | | — | | | | (6 | ) | |
Net Increase (Decrease) in Class C Shares Outstanding | | | — | @@ | | | (6 | ) | |
Class IS: | |
Shares Issued on Distributions Reinvested | | | 5 | | | | 25 | | |
Shares Redeemed | | | (505 | ) | | | (111 | ) | |
Net Decrease in Class IS Shares Outstanding | | | (500 | ) | | | (86 | ) | |
@ Amount is less than $500.
@@ Amount is less than 500 shares.
The accompanying notes are an integral part of the financial statements.
13
Morgan Stanley Institutional Fund, Inc.
Annual Report — December 31, 2019
Financial Highlights
International Real Estate Portfolio
| | | Class I | |
| | | Year Ended December 31, | |
Selected Per Share Data and Ratios | | 2019 | | 2018 | | 2017 | | 2016(1) | | 2015 | |
Net Asset Value, Beginning of Period | | $ | 16.99 | | | $ | 19.36 | | | $ | 17.53 | | | $ | 18.72 | | | $ | 19.84 | | |
Income (Loss) from Investment Operations: | |
Net Investment Income(2) | | | 0.46 | | | | 0.52 | | | | 0.59 | | | | 0.46 | | | | 0.37 | | |
Net Realized and Unrealized Gain (Loss) | | | 2.58 | | | | (2.05 | ) | | | 2.69 | | | | (0.73 | ) | | | (1.00 | ) | |
Total from Investment Operations | | | 3.04 | | | | (1.53 | ) | | | 3.28 | | | | (0.27 | ) | | | (0.63 | ) | |
Distributions from and/or in Excess of: | |
Net Investment Income | | | (0.22 | ) | | | (0.84 | ) | | | (1.45 | ) | | | (0.92 | ) | | | (0.49 | ) | |
Redemption Fees | | | — | | | | — | | | | 0.00 | (3) | | | 0.00 | (3) | | | 0.00 | (3) | |
Net Asset Value, End of Period | | $ | 19.81 | | | $ | 16.99 | | | $ | 19.36 | | | $ | 17.53 | | | $ | 18.72 | | |
Total Return(4) | | | 17.94 | % | | | (8.14 | )% | | | 19.13 | % | | | (1.38 | )% | | | (3.29 | )% | |
Ratios to Average Net Assets and Supplemental Data: | |
Net Assets, End of Period (Thousands) | | $ | 7,076 | | | $ | 13,276 | | | $ | 19,846 | | | $ | 26,213 | | | $ | 67,459 | | |
Ratio of Expenses Before Expense Limitation | | | 2.44 | % | | | 1.90 | % | | | 1.76 | % | | | 1.37 | % | | | 1.29 | % | |
Ratio of Expenses After Expense Limitation | | | 1.02 | %(5)(7) | | | 1.00 | %(5) | | | 1.00 | %(5) | | | 1.00 | %(5) | | | 1.00 | %(5) | |
Ratio of Expenses After Expense Limitation Excluding
Non-Operating Expenses | | | 1.00 | %(5) | | | N/A | | | | 1.00 | %(5) | | | N/A | | | | N/A | | |
Ratio of Net Investment Income | | | 2.44 | %(5) | | | 2.74 | %(5) | | | 3.13 | %(5) | | | 2.47 | %(5) | | | 1.84 | %(5) | |
Ratio of Rebate from Morgan Stanley Affiliates | | | 0.00 | %(6) | | | 0.00 | %(6) | | | 0.00 | %(6) | | | 0.00 | %(6) | | | 0.00 | %(6) | |
Portfolio Turnover Rate | | | 31 | % | | | 28 | % | | | 23 | % | | | 21 | % | | | 37 | % | |
(1) Reflects prior period custodian out-of-pocket expenses that were reimbursed in September 2016. The amount of the reimbursement was immaterial on a per share basis and did not impact the total return of Class I shares. The Ratio of Expenses After Expense Limitation and the Ratio of Net Investment Income would be unchanged as the reimbursement of custodian fees was offset against expense waivers/reimbursements with no impact to net expenses or net investment income.
(2) Per share amount is based on average shares outstanding.
(3) Amount is less than $0.005 per share.
(4) Calculated based on the net asset value as of the last business day of the period.
(5) The Ratio of Expenses After Expense Limitation and Ratio of Net Investment Income reflect the rebate of certain Fund expenses in connection with the investments in Morgan Stanley affiliates during the period. The effect of the rebate on the ratios is disclosed in the above table as "Ratio of Rebate from Morgan Stanley Affiliates."
(6) Amount is less than 0.005%.
(7) Ratio is above the expense limitation due to non-operating expenses, which are not included in the determination of the expense limitation. Refer to Footnote B in the Notes to the Financial Statements.
The accompanying notes are an integral part of the financial statements.
14
Morgan Stanley Institutional Fund, Inc.
Annual Report — December 31, 2019
Financial Highlights
International Real Estate Portfolio
| | | Class A | |
| | | Year Ended December 31, | |
Selected Per Share Data and Ratios | | 2019 | | 2018 | | 2017 | | 2016(1) | | 2015 | |
Net Asset Value, Beginning of Period | | $ | 17.01 | | | $ | 19.37 | | | $ | 17.54 | | | $ | 18.73 | | | $ | 19.84 | | |
Income (Loss) from Investment Operations: | |
Net Investment Income(2) | | | 0.40 | | | | 0.45 | | | | 0.51 | | | | 0.39 | | | | 0.30 | | |
Net Realized and Unrealized Gain (Loss) | | | 2.58 | | | | (2.04 | ) | | | 2.71 | | | | (0.73 | ) | | | (1.00 | ) | |
Total from Investment Operations | | | 2.98 | | | | (1.59 | ) | | | 3.22 | | | | (0.34 | ) | | | (0.70 | ) | |
Distributions from and/or in Excess of: | |
Net Investment Income | | | (0.14 | ) | | | (0.77 | ) | | | (1.39 | ) | | | (0.85 | ) | | | (0.41 | ) | |
Redemption Fees | | | — | | | | — | | | | 0.00 | (3) | | | 0.00 | (3) | | | 0.00 | (3) | |
Net Asset Value, End of Period | | $ | 19.85 | | | $ | 17.01 | | | $ | 19.37 | | | $ | 17.54 | | | $ | 18.73 | | |
Total Return(4) | | | 17.53 | % | | | (8.45 | )% | | | 18.78 | % | | | (1.78 | )% | | | (3.61 | )% | |
Ratios to Average Net Assets and Supplemental Data: | |
Net Assets, End of Period (Thousands) | | $ | 1,013 | | | $ | 1,422 | | | $ | 1,917 | | | $ | 1,512 | | | $ | 2,308 | | |
Ratio of Expenses Before Expense Limitation | | | 2.85 | % | | | 2.22 | % | | | 2.23 | % | | | 1.85 | % | | | 1.70 | % | |
Ratio of Expenses After Expense Limitation | | | 1.37 | %(5)(7) | | | 1.35 | %(5) | | | 1.35 | %(5) | | | 1.35 | %(5) | | | 1.35 | %(5) | |
Ratio of Expenses After Expense Limitation Excluding
Non-Operating Expenses | | | 1.35 | %(5) | | | N/A | | | | 1.35 | %(5) | | | N/A | | | | N/A | | |
Ratio of Net Investment Income | | | 2.11 | %(5) | | | 2.40 | %(5) | | | 2.71 | %(5) | | | 2.10 | %(5) | | | 1.48 | %(5) | |
Ratio of Rebate from Morgan Stanley Affiliates | | | 0.00 | %(6) | | | 0.00 | %(6) | | | 0.00 | %(6) | | | 0.00 | %(6) | | | 0.00 | %(6) | |
Portfolio Turnover Rate | | | 31 | % | | | 28 | % | | | 23 | % | | | 21 | % | | | 37 | % | |
(1) Reflects prior period custodian out-of-pocket expenses that were reimbursed in September 2016. The amount of the reimbursement was immaterial on a per share basis and did not impact the total return of Class A shares. The Ratio of Expenses After Expense Limitation and the Ratio of Net Investment Income would be unchanged as the reimbursement of custodian fees was offset against expense waivers/reimbursements with no impact to net expenses or net investment income.
(2) Per share amount is based on average shares outstanding.
(3) Amount is less than $0.005 per share.
(4) Calculated based on the net asset value which does not reflect sales charges, if applicable, as of the last business day of the period.
(5) The Ratio of Expenses After Expense Limitation and Ratio of Net Investment Income reflect the rebate of certain Fund expenses in connection with the investments in Morgan Stanley affiliates during the period. The effect of the rebate on the ratios is disclosed in the above table as "Ratio of Rebate from Morgan Stanley Affiliates."
(6) Amount is less than 0.005%.
(7) Ratio is above the expense limitation due to non-operating expenses, which are not included in the determination of the expense limitation. Refer to Footnote B in the Notes to the Financial Statements.
The accompanying notes are an integral part of the financial statements.
15
Morgan Stanley Institutional Fund, Inc.
Annual Report — December 31, 2019
Financial Highlights
International Real Estate Portfolio
| | | Class L | |
| | | Year Ended December 31, | |
Selected Per Share Data and Ratios | | 2019 | | 2018 | | 2017 | | 2016(1) | | 2015 | |
Net Asset Value, Beginning of Period | | $ | 16.94 | | | $ | 19.29 | | | $ | 17.42 | | | $ | 18.61 | | | $ | 19.69 | | |
Income (Loss) from Investment Operations: | |
Net Investment Income(2) | | | 0.30 | | | | 0.36 | | | | 0.50 | | | | 0.29 | | | | 0.18 | | |
Net Realized and Unrealized Gain (Loss) | | | 2.57 | | | | (2.03 | ) | | | 2.59 | | | | (0.71 | ) | | | (0.97 | ) | |
Total from Investment Operations | | | 2.87 | | | | (1.67 | ) | | | 3.09 | | | | (0.42 | ) | | | (0.79 | ) | |
Distributions from and/or in Excess of: | |
Net Investment Income | | | (0.07 | ) | | | (0.68 | ) | | | (1.22 | ) | | | (0.77 | ) | | | (0.29 | ) | |
Redemption Fees | | | — | | | | — | | | | 0.00 | (3) | | | 0.00 | (3) | | | 0.00 | (3) | |
Net Asset Value, End of Period | | $ | 19.74 | | | $ | 16.94 | | | $ | 19.29 | | | $ | 17.42 | | | $ | 18.61 | | |
Total Return(4) | | | 16.93 | % | | | (8.88 | )% | | | 18.14 | % | | | (2.23 | )% | | | (4.11 | )% | |
Ratios to Average Net Assets and Supplemental Data: | |
Net Assets, End of Period (Thousands) | | $ | 11 | | | $ | 10 | | | $ | 11 | | | $ | 53 | | | $ | 55 | | |
Ratio of Expenses Before Expense Limitation | | | 20.03 | % | | | 20.23 | % | | | 14.81 | % | | | 5.51 | % | | | 4.58 | % | |
Ratio of Expenses After Expense Limitation | | | 1.87 | %(5)(7) | | | 1.85 | %(5) | | | 1.85 | %(5) | | | 1.85 | %(5) | | | 1.85 | %(5) | |
Ratio of Expenses After Expense Limitation Excluding
Non-Operating Expenses | | | 1.85 | %(5) | | | N/A | | | | 1.85 | %(5) | | | N/A | | | | N/A | | |
Ratio of Net Investment Income | | | 1.61 | %(5) | | | 1.90 | %(5) | | | 2.70 | %(5) | | | 1.58 | %(5) | | | 0.90 | %(5) | |
Ratio of Rebate from Morgan Stanley Affiliates | | | 0.00 | %(6) | | | 0.00 | %(6) | | | 0.00 | %(6) | | | 0.00 | %(6) | | | 0.00 | %(6) | |
Portfolio Turnover Rate | | | 31 | % | | | 28 | % | | | 23 | % | | | 21 | % | | | 37 | % | |
(1) Reflects prior period custodian out-of-pocket expenses that were reimbursed in September 2016. The amount of the reimbursement was immaterial on a per share basis and did not impact the total return of Class L shares. The Ratio of Expenses After Expense Limitation and the Ratio of Net Investment Income would be unchanged as the reimbursement of custodian fees was offset against expense waivers/reimbursements with no impact to net expenses or net investment income.
(2) Per share amount is based on average shares outstanding.
(3) Amount is less than $0.005 per share.
(4) Calculated based on the net asset value as of the last business day of the period.
(5) The Ratio of Expenses After Expense Limitation and Ratio of Net Investment Income reflect the rebate of certain Fund expenses in connection with the investments in Morgan Stanley affiliates during the period. The effect of the rebate on the ratios is disclosed in the above table as "Ratio of Rebate from Morgan Stanley Affiliates."
(6) Amount is less than 0.005%.
(7) Ratio is above the expense limitation due to non-operating expenses, which are not included in the determination of the expense limitation. Refer to Footnote B in the Notes to the Financial Statements.
The accompanying notes are an integral part of the financial statements.
16
Morgan Stanley Institutional Fund, Inc.
Annual Report — December 31, 2019
Financial Highlights
International Real Estate Portfolio
| | | Class C | |
| | | Year Ended December 31, | | Period from
April 30, 2015(2) to | |
Selected Per Share Data and Ratios | | 2019 | | 2018 | | 2017 | | 2016(1) | | December 31, 2015 | |
Net Asset Value, Beginning of Period | | $ | 16.91 | | | $ | 19.00 | | | $ | 17.32 | | | $ | 18.50 | | | $ | 21.28 | | |
Income (Loss) from Investment Operations: | |
Net Investment Income(3) | | | 0.25 | | | | 0.35 | | | | 0.30 | | | | 0.25 | | | | 0.06 | | |
Net Realized and Unrealized Gain (Loss) | | | 2.56 | | | | (2.04 | ) | | | 2.71 | | | | (0.71 | ) | | | (2.48 | ) | |
Total from Investment Operations | | | 2.81 | | | | (1.69 | ) | | | 3.01 | | | | (0.46 | ) | | | (2.42 | ) | |
Distributions from and/or in Excess of: | |
Net Investment Income | | | (0.02 | ) | | | (0.40 | ) | | | (1.33 | ) | | | (0.72 | ) | | | (0.36 | ) | |
Redemption Fees | | | — | | | | — | | | | 0.00 | (4) | | | 0.00 | (4) | | | 0.00 | (4) | |
Net Asset Value, End of Period | | $ | 19.70 | | | $ | 16.91 | | | $ | 19.00 | | | $ | 17.32 | | | $ | 18.50 | | |
Total Return(5) | | | 16.62 | % | | | (9.11 | )% | | | 17.78 | % | | | (2.44 | )% | | | (11.47 | )%(9) | |
Ratios to Average Net Assets and Supplemental Data: | |
Net Assets, End of Period (Thousands) | | $ | 9 | | | $ | 8 | | | $ | 128 | | | $ | 21 | | | $ | 22 | | |
Ratio of Expenses Before Expense Limitation | | | 25.57 | % | | | 5.51 | % | | | 5.62 | % | | | 12.39 | % | | | 10.98 | %(10) | |
Ratio of Expenses After Expense Limitation | | | 2.12 | %(6)(8) | | | 2.10 | %(6) | | | 2.10 | %(6) | | | 2.10 | %(6) | | | 2.10 | %(6)(10) | |
Ratio of Expenses After Expense Limitation Excluding
Non-Operating Expenses | | | 2.10 | %(6) | | | N/A | | | | 2.10 | %(6) | | | N/A | | | | N/A | | |
Ratio of Net Investment Income | | | 1.36 | %(6) | | | 1.84 | %(6) | | | 1.58 | %(6) | | | 1.33 | %(6) | | | 0.45 | %(6)(10) | |
Ratio of Rebate from Morgan Stanley Affiliates | | | 0.00 | %(7) | | | 0.00 | %(7) | | | 0.00 | %(7) | | | 0.00 | %(7) | | | 0.00 | %(7)(10) | |
Portfolio Turnover Rate | | | 31 | % | | | 28 | % | | | 23 | % | | | 21 | % | | | 37 | % | |
(1) Reflects prior period custodian out-of-pocket expenses that were reimbursed in September 2016. The amount of the reimbursement was immaterial on a per share basis and did not impact the total return of Class C shares. The Ratio of Expenses After Expense Limitation and the Ratio of Net Investment Income would be unchanged as the reimbursement of custodian fees was offset against expense waivers/reimbursements with no impact to net expenses or net investment income.
(2) Commencement of Offering.
(3) Per share amount is based on average shares outstanding.
(4) Amount is less than $0.005 per share.
(5) Calculated based on the net asset value which does not reflect sales charges, if applicable, as of the last business day of the period.
(6) The Ratio of Expenses After Expense Limitation and Ratio of Net Investment Income reflect the rebate of certain Fund expenses in connection with the investments in Morgan Stanley affiliates during the period. The effect of the rebate on the ratios is disclosed in the above table as "Ratio of Rebate from Morgan Stanley Affiliates."
(7) Amount is less than 0.005%.
(8) Ratio is above the expense limitation due to non-operating expenses, which are not included in the determination of the expense limitation. Refer to Footnote B in the Notes to the Financial Statements.
(9) Not annualized.
(10) Annualized.
The accompanying notes are an integral part of the financial statements.
17
Morgan Stanley Institutional Fund, Inc.
Annual Report — December 31, 2019
Financial Highlights
International Real Estate Portfolio
| | | Class IS | |
| | | Year Ended December 31, | |
Selected Per Share Data and Ratios | | 2019 | | 2018 | | 2017 | | 2016(1) | | 2015 | |
Net Asset Value, Beginning of Period | | $ | 16.98 | | | $ | 19.35 | | | $ | 17.52 | | | $ | 18.71 | | | $ | 19.83 | | |
Income (Loss) from Investment Operations: | |
Net Investment Income(2) | | | 0.47 | | | | 0.52 | | | | 0.59 | | | | 0.47 | | | | 0.37 | | |
Net Realized and Unrealized Gain (Loss) | | | 2.58 | | | | (2.04 | ) | | | 2.70 | | | | (0.73 | ) | | | (1.00 | ) | |
Total from Investment Operations | | | 3.05 | | | | (1.52 | ) | | | 3.29 | | | | (0.26 | ) | | | (0.63 | ) | |
Distributions from and/or in Excess of: | |
Net Investment Income | | | (0.23 | ) | | | (0.85 | ) | | | (1.46 | ) | | | (0.93 | ) | | | (0.49 | ) | |
Redemption Fees | | | — | | | | — | | | | 0.00 | (3) | | | 0.00 | (3) | | | 0.00 | (3) | |
Net Asset Value, End of Period | | $ | 19.80 | | | $ | 16.98 | | | $ | 19.35 | | | $ | 17.52 | | | $ | 18.71 | | |
Total Return(4) | | | 18.00 | % | | | (8.11 | )% | | | 19.19 | % | | | (1.33 | )% | | | (3.26 | )% | |
Ratios to Average Net Assets and Supplemental Data: | |
Net Assets, End of Period (Thousands) | | $ | 10 | | | $ | 8,507 | | | $ | 11,359 | | | $ | 11,573 | | | $ | 20,944 | | |
Ratio of Expenses Before Expense Limitation | | | 2.34 | % | | | 1.81 | % | | | 1.70 | % | | | 1.33 | % | | | 1.30 | % | |
Ratio of Expenses After Expense Limitation | | | 0.99 | %(5)(6) | | | 0.97 | %(5) | | | 0.97 | %(5) | | | 0.97 | %(5) | | | 0.97 | %(5) | |
Ratio of Expenses After Expense Limitation Excluding
Non-Operating Expenses | | | 0.97 | %(5) | | | N/A | | | | 0.97 | %(5) | | | N/A | | | | N/A | | |
Ratio of Net Investment Income | | | 2.51 | %(5) | | | 2.76 | %(5) | | | 3.11 | %(5) | | | 2.52 | %(5) | | | 1.86 | %(5) | |
Ratio of Rebate from Morgan Stanley Affiliates | | | 0.00 | %(6) | | | 0.00 | %(6) | | | 0.00 | %(6) | | | 0.00 | %(6) | | | 0.00 | %(6) | |
Portfolio Turnover Rate | | | 31 | % | | | 28 | % | | | 23 | % | | | 21 | % | | | 37 | % | |
(1) Reflects prior period custodian out-of-pocket expenses that were reimbursed in September 2016. The amount of the reimbursement was immaterial on a per share basis and did not impact the total return of Class IS shares. The Ratio of Expenses After Expense Limitation and the Ratio of Net Investment Income would be unchanged as the reimbursement of custodian fees was offset against expense waivers/reimbursements with no impact to net expenses or net investment income.
(2) Per share amount is based on average shares outstanding.
(3) Amount is less than $0.005 per share.
(4) Calculated based on the net asset value as of the last business day of the period.
(5) The Ratio of Expenses After Expense Limitation and Ratio of Net Investment Income reflect the rebate of certain Fund expenses in connection with the investments in Morgan Stanley affiliates during the period. The effect of the rebate on the ratios is disclosed in the above table as "Ratio of Rebate from Morgan Stanley Affiliates."
(6) Amount is less than 0.005%.
(7) Ratio is above the expense limitation due to non-operating expenses, which are not included in the determination of the expense limitation. Refer to Footnote B in the Notes to the Financial Statements.
The accompanying notes are an integral part of the financial statements.
18
Morgan Stanley Institutional Fund, Inc.
Annual Report — December 31, 2019
Notes to Financial Statements
Morgan Stanley Institutional Fund, Inc. (the "Company") is registered under the Investment Company Act of 1940, as amended (the "Act"), as an open-end management investment company. The Company is comprised of thirty-two separate, active, diversified and non-diversified funds (individually referred to as a "Fund," collectively as the "Funds"). The Company applies investment company accounting and reporting guidance.
The accompanying financial statements relate to the International Real Estate Portfolio. The Fund seeks to provide current income and long-term capital appreciation.
The Fund offers five classes of shares — Class I, Class A, Class L, Class C and Class IS. On April 30, 2015, the Fund suspended offering of Class L shares. Existing Class L shareholders may invest through reinvestment of dividends and distributions.
A. Significant Accounting Policies: The following significant accounting policies are in conformity with U.S. generally accepted accounting principles ("GAAP"). Such policies are consistently followed by the Company in the preparation of its financial statements. GAAP may require management to make estimates and assumptions that affect the reported amounts and disclosures in the financial statements. Actual results may differ from those estimates.
In August 2018, the Financial Accounting Standards Board ("FASB") issued Accounting Standards Update ("ASU") 2018-13, Fair Value Measurement (Topic 820) — Disclosures Framework — Changes to Disclosure Requirements of Fair Value Measurement ("ASU 2018-13") which introduces new fair value disclosure requirements as well as eliminates and modifies certain existing fair value disclosure requirements. ASU 2018-13 would be effective for fiscal years beginning after December 15, 2019 and for interim periods within those fiscal years; however, management has elected to early adopt ASU 2018-13 as permitted by the standard. The impact of the Fund's adoption was limited to changes in the Fund's financial statement disclosures regarding fair value, primarily those disclosures related to transfers between levels of the fair value hierarchy and disclosure of the range and weighted average used to develop significant unobservable inputs for Level 3 fair value measurements, when applicable.
1. Security Valuation: (1) An equity portfolio security listed or traded on an exchange is valued at its latest reported sales price (or at the exchange official closing price if such exchange reports an official closing price), and if there were no sales on a given day and if there is no official
exchange closing price for that day, the security is valued at the mean between the last reported bid and asked prices if such bid and asked prices are available on the relevant exchanges. If only bid prices are available then the latest bid price may be used. Listed equity securities not traded on the valuation date with no reported bid and asked prices available on the exchange are valued at the mean between the current bid and asked prices obtained from one or more reputable brokers or dealers. In cases where a security is traded on more than one exchange, the security is valued on the exchange designated as the primary market; (2) all other equity portfolio securities for which over-the-counter ("OTC") market quotations are readily available are valued at the latest reported sales price (or at the market official closing price if such market reports an official closing price), and if there was no trading in the security on a given day and if there is no official closing price from relevant markets for that day, the security is valued at the mean between the last reported bid and asked prices if such bid and asked prices are available on the relevant markets. An unlisted equity security that does not trade on the valuation date and for which bid and asked prices from the relevant markets are unavailable is valued at the mean between the current bid and asked prices obtained from one or more reputable brokers or dealers; (3) certain portfolio securities may be valued by an outside pricing service/vendor approved by the Company's Board of Directors (the "Directors"). The pricing service/vendor may employ a pricing model that takes into account, among other things, bids, yield spreads and/or other market data and specific security characteristics. Alternatively, if a valuation is not available from an outside pricing service/vendor, and the security trades on an exchange, the security may be valued at its latest reported sale price (or at the exchange official closing price if such exchange reports an official closing price), prior to the time when assets are valued. If there are no sales on a given day and if there is no official exchange closing price for that day, the security is valued at the mean between the last reported bid and asked prices if such bid and asked prices are available in the relevant exchanges. If Morgan Stanley Investment Management Inc. (the "Adviser") or Morgan Stanley Investment Management Limited ("MSIM Limited") and Morgan Stanley Investment Management Company ("MSIM Company") (together, the "Sub-Advisers"), each a wholly-owned subsidiary of Morgan Stanley, determines that the price provided by the outside pricing service/vendor or exchange does not reflect the security's fair value or
19
Morgan Stanley Institutional Fund, Inc.
Annual Report — December 31, 2019
Notes to Financial Statements (cont'd)
is unable to provide a price, prices from brokers or dealers may also be utilized. In these circumstances, the value of the security will be the mean of bid and asked prices obtained from brokers or dealers; (4) when market quotations are not readily available, including circumstances under which the Adviser or Sub-Advisers determine that the closing price, last sale price or the mean between the last reported bid and asked prices are not reflective of a security's market value, portfolio securities are valued at their fair value as determined in good faith under procedures established by and under the general supervision of the Directors. Occasionally, developments affecting the closing prices of securities and other assets may occur between the times at which valuations of such securities are determined (that is, close of the foreign market on which the securities trade) and the close of business of the New York Stock Exchange ("NYSE"). If developments occur during such periods that are expected to materially affect the value of such securities, such valuations may be adjusted to reflect the estimated fair value of such securities as of the close of the NYSE, as determined in good faith by the Directors or by the Adviser using a pricing service and/or procedures approved by the Directors; (5) quotations of foreign portfolio securities, other assets and liabilities and forward contracts stated in foreign currency are translated into U.S. dollar equivalents at the prevailing market rates prior to the close of the NYSE; and (6) investments in mutual funds, including the Morgan Stanley Institutional Liquidity Funds, are valued at the net asset value ("NAV") as of the close of each business day.
The Directors have responsibility for determining in good faith the fair value of the investments, and the Directors may appoint others, such as the Company's Adviser or a valuation committee, to assist the Directors in determining fair value and to make the actual calculations pursuant to the fair valuation methodologies previously approved by the Directors. Under procedures approved by the Directors, the Company's Adviser has formed a Valuation Committee whose members are approved by the Directors. The Valuation Committee provides administration and oversight of the Company's valuation policies and procedures, which are reviewed at least annually by the Directors. These procedures allow the Company to utilize independent pricing services, quotations from securities and financial instrument dealers and other market sources to determine fair value.
The Fund invests a significant portion of its assets in securities of real estate investment trusts ("REITs"). The market's perception of prospective declines in private real estate values and other financial assets may result in increased volatility of market prices that can negatively impact the valuation of certain issuers held by the Fund.
2. Fair Value Measurement: FASB Accounting Standards CodificationTM ("ASC") 820, "Fair Value Measurement" ("ASC 820"), defines fair value as the value that the Fund would receive to sell an investment or pay to transfer a liability in a timely transaction with an independent buyer in the principal market, or in the absence of a principal market, the most advantageous market for the investment or liability. ASC 820 establishes a three-tier hierarchy to distinguish between (1) inputs that reflect the assumptions market participants would use in valuing an asset or liability developed based on market data obtained from sources independent of the reporting entity (observable inputs) and (2) inputs that reflect the reporting entity's own assumptions about the assumptions market participants would use in valuing an asset or liability developed based on the best information available in the circumstances (unobservable inputs) and to establish classification of fair value measurements for disclosure purposes. Various inputs are used in determining the value of the Fund's investments. The inputs are summarized in the three broad levels listed below:
• Level 1 – unadjusted quoted prices in active markets for identical investments
• Level 2 – other significant observable inputs (including quoted prices for similar investments, interest rates, prepayment speeds, credit risk, etc.)
• Level 3 – significant unobservable inputs including the Fund's own assumptions in determining the fair value of investments. Factors considered in making this determination may include, but are not limited to, information obtained by contacting the issuer, analysts, or the appropriate stock exchange (for exchange-traded securities), analysis of the issuer's financial statements or other available documents and, if necessary, available information concerning other securities in similar circumstances.
20
Morgan Stanley Institutional Fund, Inc.
Annual Report — December 31, 2019
Notes to Financial Statements (cont'd)
The inputs or methodology used for valuing securities are not necessarily an indication of the risk associated with investing in those securities and the determination of the significance of a particular input to the fair value measurement in its entirety requires judgment and considers factors specific to each security.
The following is a summary of the inputs used to value the Fund's investments as of December 31, 2019:
Investment Type | | Level 1
Unadjusted
quoted
prices
(000) | | Level 2
Other
significant
observable
inputs
(000) | | Level 3
Significant
unobservable
inputs
(000) | | Total
(000) | |
Assets: | |
Common Stocks | |
Diversified | | $ | 4,677 | | | $ | 2,749 | | | $ | — | | | $ | 7,426 | | |
Industrial | | | 209 | | | | 209 | | | | — | | | | 418 | | |
Industrial/Office Mixed | | | 187 | | | | 99 | | | | — | | | | 286 | | |
Lodging/Resorts | | | — | | | | 146 | | | | — | | | | 146 | | |
Office | | | 2,095 | | | | 1,302 | | | | — | | | | 3,397 | | |
Residential | | | 231 | | | | 1,563 | | | | 7 | | | | 1,801 | | |
Retail | | | 3,196 | | | | 162 | | | | — | | | | 3,358 | | |
Total Common Stocks | | | 10,595 | | | | 6,230 | | | | 7 | | | | 16,832 | | |
Short-Term Investment | |
Investment Company | | | 163 | | | | — | | | | — | | | | 163 | | |
Total Assets | | $ | 10,758 | | | $ | 6,230 | | | $ | 7 | | | $ | 16,995 | | |
Transfers between investment levels may occur as the markets fluctuate and/or the availability of data used in an investment's valuation changes.
Following is a reconciliation of investments in which significant unobservable inputs (Level 3) were used in determining fair value:
| | | Common
Stock
(000) | |
Beginning Balance | | $ | 5 | | |
Purchases | | | — | | |
Sales | | | — | | |
Amortization of discount | | | — | | |
Transfers in | | | — | | |
Transfers out | | | — | | |
Corporate actions | | | — | | |
Change in unrealized appreciation (depreciation) | | | 2 | | |
Realized gains (losses) | | | — | | |
Ending Balance | | $ | 7 | | |
Net change in unrealized appreciation (depreciation) from
investments still held as of December 31, 2019 | | $ | 2 | | |
The following table presents additional information about valuation techniques and inputs used for investments that are measured at fair value and categorized within Level 3 as of December 31, 2019. Various valuation techniques were used in the valuation of certain investments and weighted based on the level of significance.
| | | Fair Value at
December 31, 2019
(000) | | Valuation
Technique | | Unobservable
Input | | Amount* | | Impact to
Valuation from an
Increase in Input** | |
Common Stock | | $ | 7 | | | Market Transaction
Method | | Transaction
Valuation | | $ | 0.001 | | | Increase | |
| | | | | | | Discount for Lack of
Marketability | | | 50.0 | % | | Decrease | |
* Amount is indicative of the weighted average.
** Represents the expected directional change in the fair value of the Level 3 investments that would result from an increase in the corresponding input. A decrease to the unobservable input would have the opposite effect. Significant changes in these inputs could result in significantly higher or lower fair value measurements.
3. Foreign Currency Translation and Foreign Investments: The books and records of the Fund are maintained in U.S. dollars. Foreign currency amounts are translated into U.S. dollars as follows:
– investments, other assets and liabilities at the prevailing rate of exchange on the valuation date;
– investment transactions and investment income at the prevailing rates of exchange on the dates of such transactions.
Although the net assets of the Fund are presented at the foreign exchange rates and market values at the close of the period, the Fund does not isolate that portion of the results of operations arising as a result of changes in the foreign exchange rates from the fluctuations arising
21
Morgan Stanley Institutional Fund, Inc.
Annual Report — December 31, 2019
Notes to Financial Statements (cont'd)
from changes in the market prices of securities held at period end. Similarly, the Fund does not isolate the effect of changes in foreign exchange rates from the fluctuations arising from changes in the market prices of securities sold during the period. Accordingly, realized and unrealized foreign currency gains (losses) on investments in securities are included in the reported net realized and unrealized gains (losses) on investment transactions and balances. However, pursuant to U.S. federal income tax regulations, gains and losses from certain foreign currency transactions and the foreign currency portion of gains and losses realized on sales and maturities of foreign denominated debt securities are treated as ordinary income for U.S. federal income tax purposes.
Net realized gains (losses) on foreign currency transactions represent net foreign exchange gains (losses) from foreign currency forward exchange contracts, disposition of foreign currencies, currency gains (losses) realized between the trade and settlement dates on securities transactions, and the difference between the amount of investment income and foreign withholding taxes recorded on the Fund's books and the U.S. dollar equivalent amounts actually received or paid. The change in unrealized currency gains (losses) on foreign currency transactions for the period is reflected in the Statement of Operations.
Foreign security and currency transactions may involve certain considerations and risks not typically associated with those of U.S. dollar denominated transactions as a result of, among other factors, fluctuations of exchange rates in relation to the U.S. dollar, the possibility of lower levels of governmental supervision and regulation of foreign securities markets and the possibility of political or economic instability.
Governmental approval for foreign investments may be required in advance of making an investment under certain circumstances in some countries, and the extent of foreign investments in domestic companies may be subject to limitation in other countries. Foreign ownership limitations also may be imposed by the charters of individual companies to prevent, among other concerns, violations of foreign investment limitations. As a result, an additional class of shares (identified as "Foreign" in the Portfolio of Investments) may be created and offered for investment. The "local" and "foreign shares" market
values may differ. In the absence of trading of the foreign shares in such markets, the Fund values the foreign shares at the closing exchange price of the local shares.
4. Redemption Fees: The Fund will assess a 2% redemption fee on Class I shares, Class A shares, Class L shares, Class C shares and Class IS shares, which is paid directly to the Fund, for shares redeemed or exchanged within thirty days of purchase, subject to certain exceptions. The redemption fee is designed to protect the Fund and its remaining shareholders from the effects of short-term trading. These fees, if any, are included in the Statements of Changes in Net Assets.
5. Indemnifications: The Company enters into contracts that contain a variety of indemnifications. The Company's maximum exposure under these arrangements is unknown. However, the Company has not had prior claims or losses pursuant to these contracts and expects the risk of loss to be remote.
6. Dividends and Distributions to Shareholders: Dividend income and distributions to shareholders are recorded on the ex-dividend date. Dividends from net investment income, if any, are declared and paid annually. Net realized capital gains, if any, are distributed at least annually.
7. Security Transactions, Income and Expenses: Security transactions are accounted for on the trade date (date the order to buy or sell is executed). Realized gains and losses on the sale of investment securities are determined on the specific identified cost method. Dividend income and other distributions are recorded on the ex-dividend date (except for certain foreign dividends which may be recorded as soon as the Fund is informed of such dividends) net of applicable withholding taxes. Non-cash dividends received in the form of stock, if any, are recognized on the ex-dividend date and recorded as non-cash dividend income at fair value. Interest income is recognized on the accrual basis except where collection is in doubt. Discounts are accreted and premiums are amortized over the life of the respective securities. Most expenses of the Company can be directly attributed to a particular Fund. Expenses which cannot be directly attributed are apportioned among the Funds based upon relative net assets or other appropriate methods. Income, expenses (other than class specific expenses — distribution and shareholder services, transfer agency and sub transfer
22
Morgan Stanley Institutional Fund, Inc.
Annual Report — December 31, 2019
Notes to Financial Statements (cont'd)
agency fees) and realized and unrealized gains or losses are allocated to each class of shares based upon their relative net assets.
The Fund owns shares of REITs which report information on the source of their distributions annually in the following calendar year. A portion of distributions received from REITs during the year is estimated to be a return of capital and is recorded as a reduction of their cost.
B. Advisory/Sub-Advisory Fees: The Adviser, a wholly-owned subsidiary of Morgan Stanley, provides the Fund with advisory services under the terms of an Investment Advisory Agreement, paid quarterly, at an annual rate of 0.80% of the daily net assets of the Fund.
The Adviser has agreed to reduce its advisory fee and/or reimburse the Fund so that total annual Fund operating expenses, excluding certain investment related expenses, taxes, interest and other extraordinary expenses (including litigation), will not exceed 1.00% for Class I shares, 1.35% for Class A shares, 1.85% for Class L shares, 2.10% for Class C shares and 0.97% for Class IS shares. The fee waivers and/or expense reimbursements will continue for at least one year from the date of the Fund's prospectus or until such time as the Directors act to discontinue all or a portion of such waivers and/or reimbursements when they deem such action is appropriate. For the year ended December 31, 2019, approximately $158,000 of advisory fees were waived and approximately $126,000 of other expenses were reimbursed by the Adviser pursuant to this arrangement.
The Adviser has entered into Sub-Advisory Agreements with the Sub-Advisers, each a wholly-owned subsidiary of Morgan Stanley. The Sub-Advisers provide the Fund with advisory services subject to the overall supervision of the Adviser and the Company's Officers and Directors. The Adviser pays the Sub-Advisers on a monthly basis a portion of the net advisory fees the Adviser receives from the Fund.
C. Administration Fees: The Adviser also serves as Administrator to the Company and provides administrative services pursuant to an Administration Agreement for an annual fee, accrued daily and paid monthly, of 0.08% of the Fund's average daily net assets.
Under a Sub-Administration Agreement between the Administrator and State Street Bank and Trust Company ("State
Street"), State Street provides certain administrative services to the Company. For such services, the Administrator pays State Street a portion of the fee the Administrator receives from the Fund.
D. Distribution and Shareholder Services Fees: Morgan Stanley Distribution, Inc. ("MSDI" or the "Distributor"), a wholly-owned subsidiary of the Adviser and an indirect subsidiary of Morgan Stanley, serves as the Company's Distributor of Fund shares pursuant to a Distribution Agreement. The Fund has adopted a Shareholder Services Plan with respect to Class A shares pursuant to Rule 12b-1 under the Act. Under the Shareholder Services Plan, the Fund pays the Distributor a shareholder services fee, accrued daily and paid monthly, at an annual rate of 0.25% of the Fund's average daily net assets attributable to Class A shares.
The Company has adopted a Distribution and Shareholder Services Plan with respect to Class L shares pursuant to Rule 12b-1 under the Act. Under the Distribution and Shareholder Services Plan, the Fund pays the Distributor a distribution fee, accrued daily and paid monthly, at an annual rate of 0.50% and a shareholder services fee, accrued daily and paid monthly, at an annual rate of 0.25% of the Fund's average daily net assets attributable to Class L shares.
The Company has adopted a Distribution and Shareholder Services Plan with respect to Class C shares pursuant to Rule 12b-1 under the Act. Under the Distribution and Shareholder Services Plan, the Fund pays the Distributor a distribution fee, accrued daily and paid monthly, at an annual rate of 0.75% and a shareholder services fee, accrued daily and paid monthly, at an annual rate of 0.25% of the Fund's average daily net assets attributable to Class C shares.
The distribution and shareholder services fees are used to support the expenses associated with servicing and maintaining accounts. The Distributor may compensate other parties for providing shareholder support services to investors who purchase Class A, Class L and Class C shares.
E. Dividend Disbursing and Transfer Agent: The Company's dividend disbursing and transfer agent is DST Asset Manager Solutions, Inc. ("DST"). Pursuant to a Transfer Agency Agreement, the Company pays DST a fee based on the number of classes, accounts and transactions relating to the Funds of the Company.
23
Morgan Stanley Institutional Fund, Inc.
Annual Report — December 31, 2019
Notes to Financial Statements (cont'd)
F. Custodian Fees: State Street (the "Custodian") also serves as Custodian for the Company in accordance with a Custodian Agreement. The Custodian holds cash, securities and other assets of the Company as required by the Act. Custody fees are payable monthly based on assets held in custody, investment purchases and sales activity and account maintenance fees, plus reimbursement for certain out-of-pocket expenses.
G. Security Transactions and Transactions with Affiliates: For the year ended December 31, 2019, purchases and sales of investment securities for the Fund, other than long-term U.S. Government securities and short-term investments were approximately $6,148,000 and $15,418,000, respectively. There were no purchases and sales of long-term U.S. Government securities for the year ended December 31, 2019.
The Fund invests in the Institutional Class of the Morgan Stanley Institutional Liquidity Funds — Treasury Portfolio (the "Liquidity Funds"), an open-end management investment company managed by the Adviser. Advisory fees paid by the Fund are reduced by an amount equal to its pro-rata share of the advisory and administration fees paid by the Fund due to its investment in the Liquidity Funds. For the year ended December 31, 2019, advisory fees paid were reduced by less than $500 relating to the Fund's investment in the Liquidity Funds.
A summary of the Fund's transactions in shares of affiliated investments during the year ended December 31, 2019 is as follows:
Affiliated
Investment
Company | | Value
December 31,
2018
(000) | | Purchases
at Cost
(000) | | Proceeds
from Sales
(000) | | Dividend
Income
(000) | |
Liquidity Funds | | $ | 36 | | | $ | 3,820 | | | $ | 3,693 | | | $ | 5 | | |
Affiliated
Investment
Company (cont'd) | | Realized
Gain
(Loss)
(000) | | Change in
Unrealized
Appreciation
(Depreciation)
(000) | | Value
December 30,
2019
(000) | |
Liquidity Funds | | $ | — | | | $ | — | | | $ | 163 | | |
The Fund is permitted to purchase and sell securities ("cross-trade") from and to other Morgan Stanley funds as well as other funds and client accounts for which the Adviser or an affiliate of the Adviser serves as investment adviser, pursuant to procedures approved by the Directors in compliance with Rule 17a-7 under the Act (the "Rule"). Each cross-trade is
executed at the current market price in compliance with provisions of the Rule. For the year ended December 31, 2019, the Fund did not engage in any cross-trade transactions.
The Fund has an unfunded Deferred Compensation Plan (the "Compensation Plan"), which allows each independent Director to defer payment of all, or a portion, of the fees he or she receives for serving on the Board of Directors. Each eligible Director generally may elect to have the deferred amounts credited with a return equal to the total return on one or more of the Morgan Stanley funds that are offered as investment options under the Compensation Plan. Appreciation/depreciation and distributions received from these investments are recorded with an offsetting increase/decrease in the deferred compensation obligation and do not affect the NAV of the Fund.
H. Federal Income Taxes: It is the Fund's intention to continue to qualify as a regulated investment company and distribute all of its taxable and tax-exempt income. Accordingly, no provision for federal income taxes is required in the financial statements.
The Fund may be subject to taxes imposed by countries in which it invests. Such taxes are generally based on income and/or capital gains earned or repatriated. Taxes are accrued based on net investment income, net realized gains and net unrealized appreciation as such income and/or gains are earned. Taxes may also be based on transactions in foreign currency and are accrued based on the value of investments denominated in such currency.
FASB ASC 740-10, "Income Taxes — Overall", sets forth a minimum threshold for financial statement recognition of the benefit of a tax position taken or expected to be taken in a tax return. Management has concluded there are no significant uncertain tax positions that would require recognition in the financial statements. If applicable, the Fund recognizes interest accrued related to unrecognized tax benefits in "Interest Expense" and penalties in "Other Expenses" in the Statement of Operations. The Fund files tax returns with the U.S. Internal Revenue Service, New York and various states. Generally, each of the tax years in the four-year period ended December 31, 2019 remains subject to examination by taxing authorities.
24
Morgan Stanley Institutional Fund, Inc.
Annual Report — December 31, 2019
Notes to Financial Statements (cont'd)
The tax character of distributions paid may differ from the character of distributions shown for GAAP purposes due to short-term capital gains being treated as ordinary income for tax purposes. The tax character of distributions paid during fiscal years 2019 and 2018 was as follows:
2019 Distributions
Paid From:
Ordinary Income
(000) | | 2018 Distributions
Paid From:
Ordinary Income
(000) | |
| $ | 192 | | | $ | 1,223 | | |
The amount and character of income and gains to be distributed are determined in accordance with income tax regulations which may differ from GAAP. These book/tax differences are either considered temporary or permanent in nature.
Temporary differences are attributable to differing book and tax treatments for the timing of the recognition of gains (losses) on certain investment transactions and the timing of the deductibility of certain expenses.
The Fund had no permanent differences causing reclassifications among the components of net assets for the year ended December 31, 2019.
At December 31, 2019, the components of distributable earnings for the Fund on a tax basis were as follows:
Undistributed
Ordinary
Income
(000) | | Undistributed
Long-Term
Capital Gain
(000) | |
| $ | 1,039 | | | | — | | |
At December 31, 2019, the Fund had available for federal income tax purposes unused short-term and long-term capital losses of approximately $3,108,000 and $221,640,000, respectively, that do not have an expiration date.
To the extent that capital loss carryforwards are used to offset any future capital gains realized, no capital gains tax liability will be incurred by the Fund for gains realized and not distributed. To the extent that capital gains are offset, such gains will not be distributed to the shareholders.
I. Credit Facility: The Company and other Morgan Stanley funds participated in a $150,000,000 committed, unsecured revolving line of credit facility (the "Facility") with State Street. Effective April 22, 2019, the committed line amount increased to $300,000,000. This Facility is to be used for temporary emergency purposes or funding of shareholder redemption requests. The interest rate on borrowings is based on the federal funds rate or 1 month LIBOR rate plus a spread. The Facility also has a commitment fee of 0.25% per annum
based on the unused portion of the Facility. During the year ended December 31, 2019, the Fund did not have any borrowings under the Facility.
J. Other: At December 31, 2019, the Fund had record owners of 10% or greater. Investment activities of these shareholders could have a material impact on the Fund. The aggregate percentage of such owners was 18.4%.
25
Morgan Stanley Institutional Fund, Inc.
Annual Report — December 31, 2019
Report of Independent Registered Public Accounting Firm
To the Shareholders and Board of Directors of
Morgan Stanley Institutional Fund, Inc. —
International Real Estate Portfolio
Opinion on the Financial Statements
We have audited the accompanying statement of assets and liabilities of International Real Estate Portfolio (the "Fund") (one of the funds constituting Morgan Stanley Institutional Fund, Inc. (the "Company")), including the portfolio of investments, as of December 31, 2019, and the related statement of operations for the year then ended, the statements of changes in net assets for each of the two years in the period then ended, the financial highlights for each of the five years in the period then ended and the related notes (collectively referred to as the "financial statements"). In our opinion, the financial statements present fairly, in all material respects, the financial position of International Real Estate Portfolio (one of the funds constituting Morgan Stanley Institutional Fund, Inc.) at December 31, 2019, the results of its operations for the year then ended, the changes in its net assets for each of the two years in the period then ended and its financial highlights for each of the five years in the period then ended, in conformity with U.S. generally accepted accounting principles.
Basis for Opinion
These financial statements are the responsibility of the Company's management. Our responsibility is to express an opinion on the Fund's financial statements based on our audits. We are a public accounting firm registered with the Public Company Accounting Oversight Board (United States) ("PCAOB") and are required to be independent with respect to the Company in accordance with the U.S. federal securities law and the applicable rules and regulations of the Securities and Exchange Commission and the PCAOB.
We conducted our audits in accordance with the standards of the PCAOB. Those standards require that we plan and perform the audit to obtain reasonable assurance about whether the financial statements are free of material misstatement, whether due to error or fraud. The Company is not required to have, nor were we engaged to perform, an audit of the Company's internal control over financial reporting. As part of our audits, we are required to obtain an understanding of internal control over financial reporting, but not for the purpose of expressing an opinion on the effectiveness of the Company's internal control over financial reporting. Accordingly, we express no such opinion.
Our audits included performing procedures to assess the risks of material misstatement of the financial statements, whether due to error or fraud, and performing procedures that respond to those risks. Such procedures included examining, on a test basis, evidence regarding the amounts and disclosures in the financial statements. Our procedures included confirmation of securities owned as of December 31, 2019 by correspondence with the custodian and others or by other appropriate auditing procedures where replies from others were not received. Our audits also included evaluating the accounting principles used and significant estimates made by management, as well as evaluating the overall presentation of the financial statements. We believe that our audits provide a reasonable basis for our opinion.

We have served as the auditor of one or more Morgan Stanley investment companies since 2000.
Boston, Massachusetts
February 27, 2020
26
Morgan Stanley Institutional Fund, Inc.
Annual Report — December 31, 2019
Federal Tax Notice (unaudited)
For federal income tax purposes, the following information is furnished with respect to the Fund's earnings for its taxable year ended December 31, 2019. When distributed, certain earnings may be subject to a maximum tax rate of 15% as provided for by the Jobs and Growth Tax Relief Reconciliation Act of 2003. The Fund designated up to a maximum of approximately $52,000 as taxable at this lower rate.
The Fund intends to pass through foreign tax credits of approximately $49,000 and has derived net income from sources within foreign countries amounting to approximately $743,000.
In January, the Fund provides tax information to shareholders for the preceding calendar year.
27
Privacy Notice (unaudited) April 2019
FACTS | | WHAT DOES MSIM DO WITH YOUR PERSONAL INFORMATION? | |
Why? | | Financial companies choose how they share your personal information. Federal law gives consumers the right to limit some but not all sharing. Federal law also requires us to tell you how we collect, share, and protect your personal information. Please read this notice carefully to understand what we do. | |
What? | | The types of personal information we collect and share depend on the product or service you have with us. This information can include:
n Social Security number and income
n investment experience and risk tolerance
n checking account number and wire transfer instructions | |
How? | | All financial companies need to share customers' personal information to run their everyday business. In the section below, we list the reasons financial companies can share their customers' personal information; the reasons MSIM chooses to share; and whether you can limit this sharing. | |
Reasons we can share your personal information | | Does MSIM share? | | Can you limit this sharing? | |
For our everyday business purposes —
such as to process your transactions, maintain your account(s), respond to court orders and legal investigations, or report to credit bureaus | | Yes | | No | |
For our marketing purposes —
to offer our products and services to you | | Yes | | No | |
For joint marketing with other financial companies | | No | | We don't share | |
For our affiliates' everyday business purposes —
information about your transactions and experiences | | Yes | | No | |
For our affiliates' everyday business purposes —
information about your creditworthiness | | No | | We don't share | |
For our affiliates to market to you | | No | | We don't share | |
For non-affiliates to market to you | | No | | We don't share | |
Questions? Call toll-free (844) 312-6327 or email: imprivacyinquiries@morganstanley.com
28
Privacy Notice (unaudited) (cont'd) April 2019
Who we are
Who is providing this notice? | | Morgan Stanley Investment Management, Inc. and its affiliated registered investment advisers, registered broker-dealers, and registered and unregistered funds ("MSIM") | |
What we do
How does MSIM protect my personal information? | | To protect your personal information from unauthorized access and use, we use security measures that comply with federal law. These measures include computer safeguards and secured files and buildings. We have policies governing the proper handling of customer information by personnel and requiring third parties that provide support to adhere to appropriate security standards with respect to such information. | |
How does MSIM collect my personal information? | | We collect your personal information, for example, when you
n open an account or make deposits or withdrawals from your account
n buy securities from us or make a wire transfer
n give us your contact information
We also collect your personal information from others, such as credit bureaus, affiliates, or other companies. | |
Why can't I limit all sharing? | | Federal law gives you the right to limit only
n sharing for affiliates' everyday business purposes — information about your creditworthiness
n affiliates from using your information to market to you
n sharing for non-affiliates to market to you
State laws and individual companies may give you additional rights to limit sharing. See below for more on your rights under state law. | |
Definitions
Affiliates | | Companies related by common ownership or control. They can be financial and non-financial companies.
n Our affiliates include companies with a Morgan Stanley name and financial companies such as Morgan Stanley Smith Barney LLC and Morgan Stanley & Co. | |
Non-affiliates | | Companies not related by common ownership or control. They can be financial and non-financial companies.
n MSIM does not share with non-affiliates so they can market to you. | |
Joint marketing | | A formal agreement between non-affiliated financial companies that together market financial products or services to you.
n MSIM doesn't jointly market | |
Other Important Information
Vermont: Except as permitted by law, we will not share personal information we collect about Vermont residents with Non-affiliates unless you provide us with your written consent to share such information.
California: Except as permitted by law, we will not share personal information we collect about California residents with Non-affiliates and we will limit sharing such personal information with our Affiliates to comply with California privacy laws that apply to us.
29
Morgan Stanley Institutional Fund, Inc.
Annual Report — December 31, 2019
Director and Officer Information (unaudited)
Independent Directors:
Name, Birth Year
and Address of
Independent Director | | Position(s)
Held with
Registrant | | Length of Time
Served* | | Principal Occupation(s) During Past 5 Years
and Other Relevant Professional Experience | | Number of
Funds in
Fund Complex
Overseen by
Independent
Director** | | Other Directorships
Held by Independent
Director*** | |
Frank L. Bowman
c/o Perkins Coie LLP
Counsel to the Independent Directors
1155 Avenue of the Americas
New York, NY 10036
Birth Year 1944 | | Director | | Since
August 2006 | | President, Strategic Decisions, LLC (consulting) (since February 2009); Director or Trustee of various Morgan Stanley Funds (since August 2006); Chairperson of the Compliance and Insurance Committee (since October 2015); formerly, Chairperson of the Insurance Sub-Committee of the Compliance and Insurance Committee (2007-2015); served as President and Chief Executive Officer of the Nuclear Energy Institute (policy organization) (February 2005-November 2008); retired as Admiral, U.S. Navy after serving over 38 years on active duty including 8 years as Director of the Naval Nuclear Propulsion Program in the Department of the Navy and the U.S. Department of Energy (1996-2004); served as Chief of Naval Personnel (July 1994-September 1996) and on the Joint Staff as Director of Political Military Affairs (June 1992-July 1994); knighted as Honorary Knight Commander of the Most Excellent Order of the British Empire; awarded the Officier de l'Orde National du Mérite by the French Government; elected to the National Academy of Engineering (2009). | | | 86 | | | Director of Naval and Nuclear Technologies LLP; Director Emeritus of the Armed Services YMCA; Member of the National Security Advisory Council of the Center for U.S. Global Engagement and a member of the CNA Military Advisory Board; Trustee of Fairhaven United Methodist Church; Member of the Board of Advisors of the Dolphin Scholarship Foundation; Director of other various non-profit organizations; formerly, Director of BP p.l.c. (November 2010-May 2019). | |
Kathleen A. Dennis
c/o Perkins Coie LLP
Counsel to the Independent Directors
1155 Avenue of the Americas
New York, NY 10036
Birth Year 1953 | | Director | | Since August 2006 | | President, Cedarwood Associates (mutual fund and investment management consulting) (since July 2006); Chairperson of the Liquidity and Alternatives Sub-Committee of the Investment Committee (since October 2006) and Director or Trustee of various Morgan Stanley Funds (since August 2006); formerly, Senior Managing Director of Victory Capital Management (1993-2006). | | | 86 | | | Director of various non-profit organizations. | |
Nancy C. Everett
c/o Perkins Coie LLP
Counsel to the Independent Directors
1155 Avenue of the Americas
New York, NY 10036
Birth Year 1955 | | Director | | Since January 2015 | | Chief Executive Officer, Virginia Commonwealth University Investment Company (since November 2015); Owner, OBIR, LLC (institutional investment management consulting) (since June 2014); formerly, Managing Director, BlackRock, Inc. (February 2011-December 2013); and Chief Executive Officer, General Motors Asset Management (a/k/a Promark Global Advisors, Inc.) (June 2005-May 2010). | | | 87 | | | Formerly, Member of Virginia Commonwealth University School of Business Foundation (2005-2016); Member of Virginia Commonwealth University Board of Visitors (2013-2015); Member of Committee on Directors for Emerging Markets Growth Fund, Inc. (2007-2010); Chairperson of Performance Equity Management, LLC (2006-2010); and Chairperson, GMAM Absolute Return Strategies Fund, LLC (2006-2010). | |
30
Morgan Stanley Institutional Fund, Inc.
Annual Report — December 31, 2019
Director and Officer Information (unaudited) (cont'd)
Independent Directors: (cont'd)
Name, Birth Year
and Address of
Independent Director | | Position(s)
Held with
Registrant | | Length of Time
Served* | | Principal Occupation(s) During Past 5 Years
and Other Relevant Professional Experience | | Number of
Funds in
Fund Complex
Overseen by
Independent
Director** | | Other Directorships
Held by Independent
Director*** | |
Jakki L. Haussler
c/o Perkins Coie LLP
Counsel to the Independent Directors
1155 Avenue of the Americas
New York, NY 10036
Birth Year 1957 | | Director | | Since January 2015 | | Chairman, Opus Capital Group (since 1996); formerly, Chief Executive Officer, Opus Capital Group (1996-2019); Director, Capvest Venture Fund, LP (May 2000-December 2011); Partner, Adena Ventures, LP (July 1999-December 2010); Director, The Victory Funds (February 2005-July 2008). | | | 87 | | | Director of Service Corporation International and Member, Audit Committee and Investment Committee; Director of Cincinnati Bell Inc. and Member, Audit Committee and Governance and Nominating Committee; Chairman of Northern Kentucky University Member Investment Committee; Member of Chase College of Law Transactional Law Practice Center Board of Advisors; Director of Best Transport; Director of Chase College of Law Board of Visitors; formerly, Member, University of Cincinnati Foundation Investment Committee; Member, Miami University Board of Visitors (2008-2011); Trustee of Victory Funds (2005-2008) and Chairman, Investment Committee (2007-2008) and Member, Service Provider Committee (2005-2008). | |
Dr. Manuel H. Johnson
c/o Johnson Smick International, Inc.
220 I Street, NE — Suite 200
Washington, D.C. 20002
Birth Year 1949 | | Director | | Since July 1991 | | Senior Partner, Johnson Smick International, Inc. (consulting firm); Chairperson of the Investment Committee (since October 2006) and Director or Trustee of various Morgan Stanley Funds (since July 1991); Co-Chairman and a founder of the Group of Seven Council (G7C) (international economic commission); formerly, Chairperson of the Audit Committee (July 1991-September 2006), Vice Chairman of the Board of Governors of the Federal Reserve System and Assistant Secretary of the U.S. Treasury. | | | 86 | | | Director of NVR, Inc. (home construction). | |
Joseph J. Kearns
c/o Perkins Coie LLP
Counsel to the Independent Directors
1155 Avenue of the Americas
New York, NY 10036
Birth Year 1942 | | Director | | Since August 1994 | | Senior Adviser, Kearns & Associates LLC (investment consulting); Chairperson of the Audit Committee (since October 2006) and Director or Trustee of various Morgan Stanley Funds (since August 1994); formerly, Deputy Chairperson of the Audit Committee (July 2003-September 2006) and Chairperson of the Audit Committee of various Morgan Stanley Funds (since August 1994); CFO of the J. Paul Getty Trust. | | | 87 | | | Prior to August 10, 2016, Director of Electro Rent Corporation (equipment leasing); Prior to December 31, 2013, Director of The Ford Family Foundation. | |
31
Morgan Stanley Institutional Fund, Inc.
Annual Report — December 31, 2019
Director and Officer Information (unaudited) (cont'd)
Independent Directors: (cont'd)
Name, Birth Year
and Address of
Independent Director | | Position(s)
Held with
Registrant | | Length of Time
Served* | | Principal Occupation(s) During Past 5 Years
and Other Relevant Professional Experience | | Number of
Funds in
Fund Complex
Overseen by
Independent
Director** | | Other Directorships
Held by Independent
Director*** | |
Michael F. Klein
c/o Perkins Coie LLP
Counsel to the Independent Directors
1155 Avenue of the Americas
New York, NY 10036
Birth Year 1958 | | Director | | Since August 2006 | | Managing Director, Aetos Alternatives Management, LP (since March 2000); Co-President, Aetos Alternatives Management, LP (since January 2004) and Co-Chief Executive Officer of Aetos Alternatives Management, LP (since August 2013); Chairperson of the Fixed Income Sub-Committee of the Investment Committee (since October 2006) and Director or Trustee of various Morgan Stanley Funds (since August 2006); formerly, Managing Director, Morgan Stanley & Co. Inc. and Morgan Stanley Dean Witter Investment Management and President, various Morgan Stanley Funds (June 1998-March 2000); Principal, Morgan Stanley & Co. Inc. and Morgan Stanley Dean Witter Investment Management (August 1997-December 1999). | | | 86 | | | Director of certain investment funds managed or sponsored by Aetos Alternatives Management, LP; Director of Sanitized AG and Sanitized Marketing AG (specialty chemicals). | |
Patricia Maleski
c/o Perkins Coie LLP
Counsel to the Independent Directors
1155 Avenue of the Americas
New York, NY 10036
Birth Year 1960 | | Director | | Since January 2017 | | Managing Director, JPMorgan Asset Management (2004-2016); Oversight and Control Head of Fiduciary and Conflicts of Interest Program (2015-2016); Chief Control Officer-Global Asset Management (2013-2015); President, JPMorgan Funds (2010-2013); Chief Administrative Officer (2004-2013); various other positions including Treasurer and Board Liaison (since 2001). | | | 87 | | | None. | |
Michael E. Nugent
522 Fifth Avenue
New York, NY 10036
Birth Year 1936 | | Chair of the Board and Director | | Chair of the Boards since July 2006 and Director since July 1991 | | Chair of the Boards of various Morgan Stanley Funds (since July 2006); Chairperson of the Governance Committee (since January 2019) and Director or Trustee of various Morgan Stanley Funds (since July 1991); formerly, Chairperson of each of the Closed-End Fund committee (until December 2019) and the Insurance Committee (until July 2006); General Partner, Triumph Capital, L.P. (private investment partnership) (1988-2013). | | | 86 | | | None. | |
W. Allen Reed
c/o Perkins Coie LLP
Counsel to the Independent Directors
1155 Avenue of the Americas
New York, NY 10036
Birth Year 1947 | | Vice Chair of the Board and Director | | Vice Chair of the Boards since January 2020 and Director since August 2006 | | Chairperson of the Equity Sub-Committee of the Investment Committee (since October 2006) and Director or Trustee of various Morgan Stanley Funds (since August 2006); formerly, President and CEO of General Motors Asset Management; Chairman and Chief Executive Officer of the GM Trust Bank and Corporate Vice President of General Motors Corporation (August 1994-December 2005). | | | 86 | | | Formerly, Director of Legg Mason, Inc.; formerly, Director of the Auburn University Foundation (2010-2015). | |
* This is the earliest date the Director began serving the Morgan Stanley Funds. Each Director serves an indefinite term, until his or her successor is elected.
** The Fund Complex includes (as of December 31, 2019) all open-end and closed-end funds (including all of their portfolios) advised by Morgan Stanley Investment Management Inc. (the "Adviser") and any funds that have an adviser that is an affiliated person of the Adviser (including, but not limited to, Morgan Stanley AIP GP LP).
*** This includes any directorships at public companies and registered investment companies held by the Director at any time during the past five years.
32
Morgan Stanley Institutional Fund, Inc.
Annual Report — December 31, 2019
Director and Officer Information (unaudited) (cont'd)
Executive Officers:
Name, Birth Year and Address of
Executive Officer | | Position(s) Held
with
Registrant | | Length of
Time Served* | | Principal Occupation(s) During Past 5 Years | |
John H. Gernon
522 Fifth Avenue
New York, NY 10036
Birth Year 1963 | | President and Principal Executive Officer | | Since September 2013 | | President and Principal Executive Officer of the Equity and Fixed Income Funds and the Morgan Stanley AIP Funds (since September 2013) and the Liquidity Funds and various money market funds (since May 2014) in the Fund Complex; Managing Director of the Adviser; Head of Product (since 2006). | |
Timothy J. Knierim
522 Fifth Avenue
New York, NY 10036
Birth Year 1959 | | Chief Compliance Officer | | Since December 2016 | | Managing Director of the Adviser and various entities affiliated with the Adviser; Chief Compliance Officer of various Morgan Stanley Funds and the Adviser (since December 2016) and Chief Compliance Officer of Morgan Stanley AIP GP LP (since 2014). Formerly, Managing Director and Deputy Chief Compliance Officer of the Adviser (2014-2016); and formerly, Chief Compliance Officer of Prudential Investment Management, Inc. (2007-2014). | |
Francis J. Smith
522 Fifth Avenue
New York, NY 10036
Birth Year 1965 | | Treasurer and Principal Financial Officer | | Treasurer since July 2003 and Principal Financial Officer since September 2002 | | Managing Director of the Adviser and various entities affiliated with the Adviser; Treasurer (since July 2003) and Principal Financial Officer of various Morgan Stanley Funds (since September 2002). | |
Mary E. Mullin
522 Fifth Avenue
New York, NY 10036
Birth Year 1967 | | Secretary | | Since June 1999 | | Managing Director of the Adviser; Secretary of various Morgan Stanley Funds (since June 1999). | |
Michael J. Key
522 Fifth Avenue
New York, NY 10036
Birth Year 1979 | | Vice President | | Since June 2017 | | Vice President of the Equity and Fixed Income Funds, Liquidity Funds, various money market funds and the Morgan Stanley AIP Funds in the Fund Complex (since June 2017); Executive Director of the Adviser; Head of Product Development for Equity and Fixed Income Funds (since August 2013). | |
* This is the earliest date the officer began serving the Morgan Stanley Funds. Each officer serves a one-year term, until his or her successor is elected and qualifies.
33
Morgan Stanley Institutional Fund, Inc.
Annual Report — December 31, 2019
Adviser and Administrator
Morgan Stanley Investment Management Inc.
522 Fifth Avenue
New York, New York 10036
Sub-Advisers
Morgan Stanley Investment Management Limited
25 Cabot Square, Canary Wharf
London, E14 4QA, England
Morgan Stanley Investment Management Company
23 Church Street
16-01 Capital Square, Singapore 049481
Distributor
Morgan Stanley Distribution, Inc.
522 Fifth Avenue
New York, New York 10036
Dividend Disbursing and Transfer Agent
DST Asset Manager Solutions, Inc.
2000 Crown Colony Drive
Quincy, Massachusetts 02169
Custodian
State Street Bank and Trust Company
One Lincoln Street
Boston, Massachusetts 02111
Legal Counsel
Dechert LLP
1095 Avenue of the Americas
New York, New York 10036
Counsel to the Independent Directors
Perkins Coie LLP
1155 Avenue of the Americas
New York, New York 10036
Independent Registered Public Accounting Firm
Ernst & Young LLP
200 Clarendon Street
Boston, Massachusetts 02116
Reporting to Shareholders
Each Morgan Stanley fund provides a complete schedule of portfolio holdings in its Semi-Annual and the Annual Reports within 60 days of the end of the fund's second and fourth fiscal quarters. The Semi-Annual and Annual Reports are filed electronically with the Securities and Exchange Commission ("SEC") on Form N-CSRS and Form N-CSR, respectively. Morgan Stanley also delivers the Semi-Annual and Annual Reports to fund shareholders and makes these reports available on its public website, www.morganstanley.com/im/shareholderreports. Each Morgan Stanley non-money market fund also files a complete schedule of portfolio holdings with the SEC for the fund's first and third fiscal quarters as an attachment to Form N-PORT. Morgan Stanley does not deliver the reports for the first and third fiscal quarters to shareholders, nor are the reports posted to the Morgan Stanley public website. However, the holdings for each money market fund are posted to the Morgan Stanley public website. You may obtain the Form N-PORT filings (as well as the Form N-CSR and N-CSRS filings) by accessing the SEC's website, www.sec.gov. You can also request copies of these materials, upon payment of a duplicating fee, by electronic request at the SEC's email address (publicinfo@sec.gov).
Proxy Voting Policies and Procedures and Proxy Voting Record
You may obtain a copy of the Company's Proxy Voting Policy and Procedures and information regarding how the Company voted proxies relating to portfolio securities during the most recent twelve-month period ended June 30, without charge, upon request, by calling toll free 1 (800) 548-7786 or by visiting our website at www.morganstanley.com/im/shareholderreports. This information is also available on the SEC's website at www.sec.gov.
This report is authorized for distribution only when preceded or accompanied by a prospectus or summary prospectus of the applicable fund of Morgan Stanley Institutional Fund, Inc., which describes in detail the fund's investment policies, risks, fees and expenses. Please read the prospectus carefully before you invest or send money. For additional information, including information regarding the investments comprising the Fund, please visit our website at www.morganstanley.com/im/shareholderreports or call toll free 1 (800) 548-7786.
34
Printed in U.S.A.
This Report has been prepared for shareholders and may be distributed to others only if preceded or accompanied by a current prospectus.
Morgan Stanley Investment Management Inc.
522 Fifth Avenue
New York, New York 10036
© 2020 Morgan Stanley. Morgan Stanley Distribution, Inc.

IFIIREANN
2922357 EXP. 02.28.21

Morgan Stanley Institutional Fund, Inc.
Multi-Asset
Portfolio
Annual Report
December 31, 2019
Beginning on January 1, 2021, as permitted by regulations adopted by the Securities and Exchange Commission ("SEC"), paper copies of the Fund's Annual and Semi-Annual Reports to Shareholders ("Shareholder Reports") will no longer be sent by mail, unless you specifically request paper copies of the Shareholder Reports from the Fund or from your financial intermediary, such as a broker-dealer or a bank. Instead, the Shareholder Reports will be made available on the Fund's website, https://www.morganstanley.com/im/shareholderreports and you will be notified by mail each time a Shareholder Report is posted and provided with a website link to access the Shareholder Report. If you already elected to receive Shareholder Reports electronically, you will not be affected by this change and you need not take any action. You may elect to receive Shareholder Reports and other communications from the Fund electronically anytime by contacting your financial intermediary or, if you are a direct investor, please follow the instructions on the envelope.
Beginning on January 1, 2019, you may elect to receive all future Shareholder Reports in paper free of charge. If you invest through a financial intermediary, you can contact your financial intermediary to request that you continue to receive paper copies of your Shareholder Reports. If you invest directly with the Fund, please follow the instructions on the envelope to let the Fund know you wish to continue receiving paper copies of your Shareholder Reports. Your election to receive Shareholder Reports in paper will apply to all funds held in your account if you invest through your financial intermediary or all funds held with the fund complex if you invest directly with a fund.

Morgan Stanley Institutional Fund, Inc.
Annual Report — December 31, 2019
Shareholders' Letter | | | 2 | | |
Consolidated Expense Example | | | 3 | | |
Investment Overview | | | 4 | | |
Consolidated Portfolio of Investments | | | 9 | | |
Consolidated Statement of Assets and Liabilities | | | 31 | | |
Consolidated Statement of Operations | | | 33 | | |
Consolidated Statements of Changes in Net Assets | | | 34 | | |
Consolidated Financial Highlights | | | 36 | | |
Notes to Consolidated Financial Statements | | | 41 | | |
Report of Independent Registered Public Accounting Firm | | | 52 | | |
Federal Tax Notice | | | 53 | | |
Privacy Notice | | | 54 | | |
Director and Officer Information | | | 56 | | |
This report is authorized for distribution only when preceded or accompanied by a prospectus or summary prospectus of the applicable Fund of Morgan Stanley Institutional Fund, Inc. To receive a prospectus and/or statement of additional information ("SAI"), which contains more complete information such as investment objectives, charges, expenses, policies for voting proxies, risk considerations and describes in detail each of the Fund's investment policies to the prospective investor, please call toll free 1 (800) 548-7786. Please read the prospectuses carefully before you invest or send money.
Additionally, you can access information about the Fund, including performance, characteristics and investment team commentary, through Morgan Stanley Investment Management's website: www.morganstanley.com/im/shareholderreports.
Market forecasts provided in this report may not necessarily come to pass. There is no guarantee that any sectors mentioned will continue to perform as discussed herein or that securities in such sectors will be held by the Fund in the future. There is no assurance that a fund will achieve its investment objective. Funds are subject to market risk, which is the possibility that market values of securities owned by the Fund will decline and, therefore, the value of the Fund's shares may be less than what you paid for them. Accordingly, you can lose money investing in this Fund. Please see the prospectus for more complete information on investment risks.
1
Morgan Stanley Institutional Fund, Inc.
Annual Report — December 31, 2019
Shareholders' Letter (unaudited)
Dear Shareholders,
We are pleased to provide this Annual Report, in which you will learn how your investment in Multi-Asset Portfolio (the "Fund") performed during the latest twelve-month period.
Morgan Stanley Investment Management is a client-centric, investor-led organization. Our global presence, intellectual capital, and breadth of products and services enable us to partner with investors to meet the evolving challenges of today's financial markets. We aim to deliver superior investment service and to empower our clients to make the informed decisions that help them reach their investment goals.
As always, we thank you for selecting Morgan Stanley Investment Management, and look forward to working with you in the months and years ahead.
Sincerely,

John H. Gernon
President and Principal Executive Officer
January 2020
2
Morgan Stanley Institutional Fund, Inc.
Annual Report — December 31, 2019
Consolidated Expense Example (unaudited)
Multi-Asset Portfolio
As a shareholder of the Fund, you incur two types of costs: (1) transactional costs; and (2) ongoing costs, which may include advisory fees, administration fees, distribution and shareholder services fees and other Fund expenses. This example is intended to help you understand your ongoing costs (in dollars) of investing in the Fund and to compare these costs with the ongoing costs of investing in other mutual funds.
This example is based on an investment of $1,000 invested at the beginning of the six-month period ended December 31, 2019 and held for the entire six-month period.
Actual Expenses
The table below provides information about actual account values and actual expenses. You may use the information in this table, together with the amount you invested, to estimate the expenses that you paid over the period. Simply divide your account value by $1,000 (for example, an $8,600 account value divided by $1,000 = 8.6), then multiply the result by the number in the table under the heading entitled "Actual Expenses Paid During Period" to estimate the expenses you paid on your account during this period.
Hypothetical Example for Comparison Purposes
The table below provides information about hypothetical account values and hypothetical expenses based on the Fund's actual expense ratio and an assumed rate of return of 5% per year before expenses, which is not the Fund's actual return. The hypothetical account values and expenses may not be used to estimate the actual ending account balance or expenses you paid for the period. You may use this information to compare the ongoing costs of investing in the Fund and other funds. To do so, compare this 5% hypothetical example with the 5% hypothetical examples that appear in the shareholder reports of the other funds.
Please note that the expenses shown in the table are meant to highlight your ongoing costs only and do not reflect any transactional costs, such as sales charges (loads). Therefore, the information for each class in the table is useful in comparing ongoing costs only, and will not help you determine the relative total costs of owning different funds. In addition, if these transactional costs were included, your costs would have been higher.
| | | Beginning
Account
Value
7/1/19 | | Actual Ending
Account
Value
12/31/19 | | Hypothetical
Ending Account
Value | | Actual
Expenses
Paid
During
Period* | | Hypothetical
Expenses Paid
During Period* | | Net
Expense
Ratio
During
Period** | |
Multi-Asset Portfolio Class I | | $ | 1,000.00 | | | $ | 1,005.10 | | | $ | 1,019.86 | | | $ | 5.36 | | | $ | 5.40 | | | | 1.06 | % | |
Multi-Asset Portfolio Class A | | | 1,000.00 | | | | 1,002.90 | | | | 1,018.10 | | | | 7.12 | | | | 7.17 | | | | 1.41 | | |
Multi-Asset Portfolio Class L | | | 1,000.00 | | | | 999.50 | | | | 1,015.48 | | | | 9.73 | | | | 9.80 | | | | 1.93 | | |
Multi-Asset Portfolio Class C | | | 1,000.00 | | | | 999.30 | | | | 1,014.32 | | | | 10.89 | | | | 10.97 | | | | 2.16 | | |
Multi-Asset Portfolio Class IS | | | 1,000.00 | | | | 1,005.40 | | | | 1,020.01 | | | | 5.21 | | | | 5.24 | | | | 1.03 | | |
* Expenses are calculated using each Fund Class' annualized net expense ratio (as disclosed), multiplied by the average account value over the period and multiplied by 184/365 (to reflect the most recent one-half year period).
** Annualized.
3
Morgan Stanley Institutional Fund, Inc.
Annual Report — December 31, 2019
Investment Overview (unaudited)
Multi-Asset Portfolio
The Fund seeks total return. The Fund's "Adviser," Morgan Stanley Investment Management Inc., seeks to achieve this objective with an emphasis on positive absolute return and controlling downside portfolio risk.
Performance
For the fiscal year ended December 31, 2019, the Fund's Class I shares had a total return based on net asset value and reinvestment of distributions per share of 1.05%, net of fees. The Fund's Class I shares underperformed the Fund's primary benchmark, the ICE BofA U.S. Dollar 1-Month LIBID Average Index (the "Index"), which returned 2.18%, and underperformed the secondary benchmark, the Customized MSIM Global Allocation Index (the "Customized Index"), which returned 18.55%. The Fund and benchmark index performance is in U.S. dollar ("USD") terms.
Factors Affecting Performance*i
• Global equities returned +26.2% during 2019, in the best year since 2009 (measured by the MSCI All Country World Index net total returns in local currency). Over the course of the year, equities climbed steadily higher with the exception of intermittent sell-offs in May and August. Following a sharp fourth quarter 2019 sell-off, 2019 returns were initially propelled by a relief rally, as global central bank policy took a dovish turn, economic data appeared to be stabilizing amid muted inflation, and several issues that had been worrying markets (such as the U.S.-China trade dispute, Brexit, and slowing global growth) appeared to show signs of improvement. Then in early May, a trade agreement between the U.S. and China unraveled, and the U.S. announced an increase in existing tariffs on Chinese imports and threatened new tariffs on both Chinese and Mexican imports. Global equities sold off –5.8% during the month of May. In June, markets found relief in a trade deal with Mexico which averted those tariffs, in optimism that the U.S. and China would make progress at the G-20 Summit in Osaka, and — most importantly — from indications from the U.S. Federal Reserve (Fed) that it was considering rate cuts in 2019. The dovish shift of major central banks helped support markets in the third quarter; however, slowing economic data, new tariff announcements, and a brief inversion of the U.S. Treasury yield curve between 2- and 10-year maturities (known as the 2s-10s yield curve) contributed to recession fears and caused another
sell-off in August. Markets resumed their upward trajectory in September through the remainder of the year, as global central banks appeared to engineer a soft landing and geopolitical risks (U.S.-China trade, Brexit) subsided.
• Regionally, U.S. equities led in 2019, with the S&P 500 Index up 31.5%, boosted by a supportive Fed, relatively stronger growth compared with other regions, and muted inflation. Tech was the leader among sectors, driving one third of the total index returns, with the S&P 500 Information Technology Index up +49.5%. Eurozone equities were the second strongest performing region, up +28.2% (Euro Stoxx 50 Index in euros). European Monetary Union (EMU) equities were supported by stabilization in economic data, past currency weakness (the euro was down more than 10% in USD since January 2018), reduced uncertainty around Italy and Brexit, and European Central Bank (ECB) easing and dovish signaling. Emerging market (EM) equities lagged, rising +18.4% in USD and +18.0% in local currency (MSCI Emerging Markets Index), despite a fourth quarter rally of nearly 12% in USD, as economic data there disappointed expectations and the market feared U.S.-China trade tensions would disproportionately affect the region. Japanese equities returned 17.7% (TOPIX Index in yen), lagging other markets, as economic data there slowed, in part from falling trade flows and from domestic demand absorbing the impacts of the value added tax hike from 8% to 10% in the third quarter of 2019 and a typhoon in October.
• The J.P. Morgan Global Government Bond Index rose +8.0% in local currencies and +6.6% in USD terms, as global yields fell. Investors priced in the dovish turn from global central banks in response to weakening data and concerns over the impact to global growth from higher tariffs and uncertainty. Over the course of the year, the Fed went from indicating (via the "dot plot") three hikes in 2019 and one in 2020 (as of November of 2018), to
* Certain of the Fund's investment themes may, in whole or part, be implemented through the use of derivatives, including the purchase and sale of futures, options, swaps, structured investments (including commodity-linked notes) and other related instruments and techniques. The Fund may also invest in foreign currency forward exchange contracts, which are also derivatives, in connection with its investments in foreign securities. The Fund may use derivative instruments for a variety of purposes, including hedging, risk management, portfolio management or to earn income. As a result, the use of derivatives had a material effect on the Fund's performance during the period.
i Source: Morgan Stanley Investment Management (MSIM) Global Multi-Asset Team analysis; market data sourced from Bloomberg.
4
Morgan Stanley Institutional Fund, Inc.
Annual Report — December 31, 2019
Investment Overview (unaudited) (cont'd)
Multi-Asset Portfolio
actually cutting rates three times in July, September, and October of 2019. The U.S. 10-year Treasury yield fell –77 basis points (bps) to 1.92%, and the 2-year Treasury fell –92 bps to 1.57% with the 2s-10s yield curve inverting briefly in August. A number of other U.S. yield curves have inverted this year starting in March, triggering recession concerns. The ECB cut rates in September by –10 bps to –0.5% while re-starting quantitative easing (QE, buying €20 billion worth of bonds per month, starting November 1, 2019) and vowed to maintain QE and low rates until inflation picks up. German 10-year bund yields fell –43 bps to –0.19%. Periphery eurozone bond yields fell considerably in 2019, as Italy and the European Union (EU) agreed to a fiscal compromise and a coalition agreement between Italy's Five Star and center-left Democratic parties further allayed fears of an EU confrontation. Greek 10-year bond yields dropped –292 bps to 1.43%, Spanish 10-year bond yields fell –95 bps to 0.47%, and Italian yields declined –133 bps to 1.41%, considerably below U.S. Treasury yields. Corporate bond spreads tightened, with U.S. high yield spreads down –190 bps in 2019 to 3.36%.
• The U.S. dollar was flat (+0.2%) in 2019. The British pound rose +3.9% in a volatile year: the pound initially rose 2.2% in the first quarter of 2019 when the U.K. avoided a no-deal Brexit on March 31, 2019, then sold off –5.6% in the second and third quarters after U.K. Prime Minister Theresa May announced she would step down and was replaced by Brexit hardliner Boris Johnson, rendering the path to Brexit increasingly risky. The pound then rose nearly 8% in the fourth quarter as Boris Johnson's electoral win helped clear a path towards Brexit and reduced uncertainty. The euro was slightly weaker, down –2.2% vs. the U.S. dollar. The Chinese renminbi fell –1.2% during the year, having recovered most of the –6% sell-off this summer when the currency broke through the 7.0 level (which at the time caused the U.S. to label China a currency manipulator). Oil-sensitive currencies were some of the strongest gainers vs. USD in 2019. The Russian ruble rose +11.6% and the Canadian dollar rose +5.0%, as the price of Brent rose +24.9%. The Argentine peso was the weakest currency, depreciating –37.2% vs. USD. Argentina's primary election results in
August dealt a major blow to hopes for a continuation of the market-friendly government. In anticipation of a Peronist government favoring a weak currency, Argentine assets sold off sharply.
• Commodities rose +17.6% in 2019 (S&P GSCI Total Return Index in USD), driven by oil which was up nearly +25% (Brent, spot price) on production cuts by the Organization of the Petroleum Exporting Countries and its allies (OPEC+), U.S. sanctions against Iran and Venezuela, and expectations for better demand given firming growth. Gold rose +18.3% to the highest levels since 2013, as investors flocked to safe-haven assets and real interest rates declined.
• Positions within equities detracted from performance. Contributors during the period included positions in our Value Recovery theme, such as long value stocks vs. momentum and quality stocks in the U.S. and Europe, and long in U.S. banks vs. U.S. equities. A long position in U.S. housing stocks and a short position in U.S. initial public offering (IPO) stocks, both relative to U.S. equities, and a short position in Australian banks relative to developed market banks and developed market equities also contributed to performance. These gains were offset by losses from long positions in North American midstream energy companies and U.S. health care stocks, both relative to U.S. equites, and a long position in Japanese real estate relative to Japanese equities. In addition, our short position in Canadian banks relative to global equities also detracted from performance.
• Positions within fixed income contributed to performance. Contributors included long positions in Greek bonds relative to French, Italian, and Spanish bonds. A long position in U.S. 10-year TIPS (Treasury inflation-protected securities) and a long position in Australian bonds, directional as well as relative to U.S. Treasuries, also contributed to performance. Detractors during the period included a long position in Argentine 10-year bonds.
• Positions within commodities (implemented via commodity futures) had a positive impact on performance, as a long position in gold contributed.
5
Morgan Stanley Institutional Fund, Inc.
Annual Report — December 31, 2019
Investment Overview (unaudited) (cont'd)
Multi-Asset Portfolio
• Currency positions (implemented via currency forwards and futures) negatively impacted performance. Long positions in the Argentine peso vs. a basket of emerging market currencies and in the Brazilian real vs. the U.S. dollar and a basket of Latin American currencies detracted. In addition, short positions in the Chinese renminbi, both relative to the U.S. dollar and G-10 currencies, and a short position in the U.S. dollar (DXY index) also detracted from performance. These losses were partially offset by gains from long positions in the British pound relative to the U.S. dollar and the euro.
Management Strategiesii
• As of December 31, 2019, the Fund's net equity exposure was 2.8%, net fixed income exposure was –7.6% (–8.0% in U.S. 10-year Treasury duration-equivalent exposure), and net commodities exposure was 7.7%.iii
• We enter 2020 with a small long to global equities and a short to bonds. We expect global growth to reaccelerate on easier monetary policy despite late-cycle vulnerabilities (e.g. U.S. corporate debt, U.S. profit margins, China debt). The GMA team estimates that global growth could rebound to trend of 2.7% by the fourth quarter of 2020, from 2.2% expected in the fourth quarter of 2019 (and vs. 2.5% current trend implied by the latest purchasing managers index, or PMI). Global PMIs appear to have bottomed in September-October 2019. A phase one trade agreement between the U.S. and China appears to be on track, reducing near-term risk and bringing the impact of the tariffs on global growth from –55 bps to –30 bps, in our estimation, although we continue to expect that the U.S. and China will be in a trade cold war for the next decade or more, with periods of tension and periods of détente. We expect a very mild acceleration in inflation, with U.S. inflation reaching the Fed's target in 6-12 months. In contrast, Europe and Japan remain far from inflation targets, and their ability to achieve these targets is in question. We believe monetary policy is at the end of the line, while fiscal policy will remain expansionary, particularly in the U.S. and China. Overall, this is likely a positive environment for equities generally and for cyclical and value stocks in particular. Risks to our view include slower than expected growth in China, the election of a progressive Democrat in the
U.S., or a resumption of the U.S.-China economic cold war.
• Global equities are slightly cheap relative to bonds based on the equity risk premium (at 4.55% as of December 31, 2019 vs. 4.28% implied by our growth forecast), although in absolute terms they remain expensive. We expect global earnings to rebound to 8% in 2020, a –2% miss compared to analyst expectations; however, subdued inflation and rates are still supportive of valuations. Sentiment for global equities is neutral both in absolute terms and relative to bonds.
• We hold a modest short to global bonds. U.S. 10-year Treasury yields, at 1.90%, are close to our target of 2.05%-2.30% under a trade truce. Real yields remain near record lows, and the global yield curve is close to flat. Bond sentiment is neutral. Market pricing implies a greater than 50% chance of a rate cut in 2020. In contrast, we expect the Fed to remain on hold as inflation in the U.S. rebounds to the 2% target. We hold a long in U.S. 10-year inflation swaps, as 10-year breakevens at 1.8% remain 50 bps below the core consumer price index (CPI) of 2.3%.
• We hold a short position in U.S. equities relative to eurozone domestic stocks, which are trading 12% cheap relative to the historical relative median forward price-earnings (P/E) ratio. EMU fundamentals such as PMIs and earnings per share (EPS) have improved relative to the U.S.; however, EMU domestic stocks have not reflected this and have in fact de-rated. We expect U.S. growth to decelerate from 2.1% quarter-over-quarter (QoQ) seasonally adjusted annual rate (SAAR) in the third quarter of 2019 to 1.7% QoQ SAAR by mid-2020, while EMU growth rises gradually from 1.2% in the third quarter of 2019 to 1.4% by the fourth quarter of 2020. We are also long EMU banks vs. EMU equities, which are near the cheapest levels ever on relative forward P/E, trading at a 24%
ii Source: Morgan Stanley Investment Management (MSIM) Global Multi-Asset Team analysis; market data sourced from Bloomberg; consensus estimates sourced from Thomson Reuters I/B/E/S.
iii The Fund seeks to achieve a consistent level of positive absolute returns while controlling downside portfolio risk. The Fund seeks to achieve this objective by taking long and short positions (often in the form of paired or hedged trades) in a range of equity and equity related securities of any market capitalization, bonds, currencies and commodities, which can result in negative net exposures. As the Fund's primary benchmark (the Bank of America Merrill Lynch U.S. Dollar 1-Month LIBID Average Index) represents cash, the Fund will maintain, from time to time, significant exposure to a risk-free asset class.
6
Morgan Stanley Institutional Fund, Inc.
Annual Report — December 31, 2019
Investment Overview (unaudited) (cont'd)
Multi-Asset Portfolio
discount. We expect that rebounding loan growth will help drive bank profitability higher.
• We are long gold. We forecast 10-20% price appreciation over the next 12-24 months as the U.S. TIPS yield declines a further 20-30 bps and the U.S. dollar depreciates 5-10%. The U.S. dollar is approx. 0.6 standard deviations expensive on real effective exchange rate (REER) and sentiment is moderately overbought; real rate differentials suggest downside risk.
• We are long value stocks in both the U.S. and Europe, vs. momentum, low volatility, and expensively-valued stocks, given rebounding growth and a steepening yield curve. Our models indicate that, in a trade truce scenario, the global economy could rebound to close to trend in 2020, U.S. yields could reach 2.05-2.30% and the 2s10s curve could steepen back to 30-40 bps. EMU value stocks are currently trading at a 60-65% discount to low volatility and expensively valued stocks on forward P/E vs. an average discount of roughly 37% since 1994. From this level of discount, historically value stocks have outperformed low volatility and expensively valued stocks by 15-18% over the next 12 months. In the U.S., value stocks are trading at a 56% discount to expensively-valued and momentum stocks, compared to a 46% discount historically. Historically, value stocks have outperformed expensively-valued and momentum stocks by nearly 20% from these levels of valuation. We are also long U.S. banks vs. U.S. equities, which are 11% cheap on forward P/E, while relative EPS should trend higher as a result of share buybacks.
• In emerging markets, EM ex-China stocks look slightly cheap, trading at a 5% discount to their historical average valuation relative to developed markets ex-Japan. Relative sentiment is neutral. We do expect a mild recovery in both absolute gross domestic product (GDP) growth and in EM ex-China vs. developed market GDP growth differentials, from 1.0% to 1.4%, which should drive modest earnings outperformance.
• Japanese equities appear cheap and unloved, with valuations at a 17% discount to developed market equities ex-Japan, near all-time lows, and foreign investors having unwound nearly all of the "Abenomics" inflows. However, Japanese stocks
tend to be cyclical and to be driven by yen weakness, and it appears that the Bank of Japan has limited room or desire to cut interest rates and/or orchestrate another round of yen depreciation.
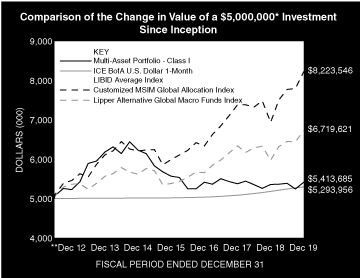
* Minimum Investment for Class I shares
** Commenced Operations on June 22, 2012.
In accordance with SEC regulations, the Fund's performance shown assumes that all recurring fees (including management fees) were deducted and all dividends and distributions were reinvested. The performance of Class A, L, C and IS shares will vary from the performance of Class I shares based upon their different inception dates and will be negatively impacted by additional fees assessed to those classes (if applicable).
7
Morgan Stanley Institutional Fund, Inc.
Annual Report — December 31, 2019
Investment Overview (unaudited) (cont'd)
Multi-Asset Portfolio
Performance Compared to the ICE BofA U.S. Dollar 1-Month LIBID Average Index(1) the Customized MSIM Global Allocation Index(2) and the Lipper Alternative Global Macro Funds Index(3)
| | | Period Ended December 31, 2019
Total Returns(4) | |
| | | | | Averge Annual | |
| | | One
Year | | Five
Years | | Ten
Years | | Since
Inception(8) | |
Fund — Class I Shares
w/o sales charges(5) | | | 1.05 | % | | | –2.76 | % | | | — | | | | 1.06 | % | |
Fund — Class A Shares
w/o sales charges(5) | | | 0.62 | | | | –3.12 | | | | — | | | | 0.73 | | |
Fund — Class A Shares with
maximum 5.25% sales charges(5) | | | –4.63 | | | | –4.17 | | | | — | | | | 0.01 | | |
Fund — Class L Shares
w/o sales charges(5) | | | 0.06 | | | | –3.58 | | | | — | | | | 0.23 | | |
Fund — Class C Shares
w/o sales charges(6) | | | –0.07 | | | | — | | | | — | | | | –3.52 | | |
Fund — Class C Shares with
maximum 1.00% deferred
sales charges(6) | | | –1.06 | | | | — | | | | — | | | | –3.52 | | |
Fund — Class IS Shares
w/o sales charges(7) | | | 1.08 | | | | — | | | | — | | | | –2.13 | | |
ICE BofA U.S. Dollar 1-Month
LIBID Average Index | | | 2.18 | | | | 1.10 | | | | — | | | | 0.76 | | |
Customized MSIM
Global Allocation Index | | | 18.55 | | | | 5.79 | | | | — | | | | 6.83 | | |
Lipper Alternative Global
Macro Funds Index | | | 12.59 | | | | 3.66 | | | | — | | | | 4.02 | | |
Performance data quoted represents past performance, which is no guarantee of future results, and current performance may be lower or higher than the figures shown. Performance assumes that all dividends and distributions, if any, were reinvested. For the most recent month-end performance figures, please visit www.morganstanley.com/im/shareholderreports. Investment return and principal value will fluctuate so that Fund shares, when redeemed, may be worth more or less than their original cost. Total returns do not reflect the deduction of taxes that a shareholder would pay on Fund distributions or the redemption of Fund shares. Performance of share classes will vary due to difference in sales charges and expenses.
(1) The ICE BofA(Intercontinental Exchange Bank of America) U.S. Dollar 1-Month LIBID Average Index tracks the performance of a basket of synthetic assets paying LIBID to a stated maturity. The index purchases a new instrument each day, priced at par, having exactly its stated maturity and with a coupon equal to that day's fixing rate. All issues are held to maturity. Therefore, each day the index is comprised of a basket of securities. The index is not marked to market. The returns of the index represent the accrued income generated by the equally weighted average of all the coupons in the basket for a given day. The Index is unmanaged and its returns do not include any sales charges or fees. Such costs would lower performance. It is not possible to invest directly in an index.
(2) The Customized MSIM Global Allocation Index is a performance linked benchmark comprised of 60% MSCI All Country World Index and 40% Bloomberg Barclays Global Aggregate Index for periods after May 31, 2017. Prior to May 31, 2017, the Customized MSIM Global Allocation Index consisted of 60% MSCI All Country World Index (benchmark that measures the equity market performance of developed and emerging markets), 30% Bloomberg Barclays Global Aggregate Bond Index (benchmark that provides a broadbased measure of the global investment grade fixed-rate debt markets), 5% S&P GSCI Light Energy Index (benchmark for investment performance in the energy commodity market), and 5% ICE BofA U.S. Dollar 1-Month LIBID Average Index (benchmark that tracks the performance of a basket of synthetic assets paying LIBID to a stated maturity). The Index is unmanaged and its returns do not include any sales charges or fees. Such costs would lower performance. It is not possible to invest directly in an index.
(3) The Lipper Alternative Global Macro Funds Index is an equally weighted performance index of the largest qualifying funds (based on net assets) in the Lipper Alternative Global Macro Funds classification. The Index, which is adjusted for capital gains distributions and income dividends, is unmanaged and should not be considered an investment. There are currently 30 funds represented in this Index. As of the date of this report, the Fund was in the Lipper Alternative Global Macro Funds classification.
(4) Total returns for the Fund reflect fees waived and expenses reimbursed, if applicable, by the Adviser (as defined herein). Without such waivers and reimbursements, total returns would have been lower.
(5) Commenced operations on June 22, 2012.
(6) Commenced offering on April 30, 2015.
(7) Commenced offering on May 29, 2015.
(8) For comparative purposes, average annual since inception returns listed for the Indexes refer to the inception date of Class I of the Fund, not the inception of the Index.
8
Morgan Stanley Institutional Fund, Inc.
Annual Report — December 31, 2019
Consolidated Portfolio of Investments
Multi-Asset Portfolio
| | | Shares | | Value
(000) | |
Common Stocks (32.8%) | |
Australia (0.0%) | |
AGL Energy Ltd. | | | 58 | | | $ | 1 | | |
APA Group | | | 106 | | | | 1 | | |
Bendigo & Adelaide Bank Ltd. | | | 3 | | | | — | @ | |
Coles Group Ltd. | | | 36 | | | | — | @ | |
CSL Ltd. | | | 9 | | | | 2 | | |
Goodman Group REIT | | | 33 | | | | — | @ | |
Stockland REIT | | | 70 | | | | — | @ | |
Telstra Corp., Ltd. | | | 369 | | | | 1 | | |
Woolworths Group Ltd. | | | 38 | | | | 1 | | |
| | | | 6 | | |
Austria (0.2%) | |
Erste Group Bank AG (a) | | | 718 | | | | 27 | | |
Raiffeisen Bank International AG | | | 358 | | | | 9 | | |
| | | | 36 | | |
Belgium (0.7%) | |
Anheuser-Busch InBev SA N.V. | | | 22 | | | | 2 | | |
bpost SA | | | 6,502 | | | | 75 | | |
Cie d'Entreprises CFE | | | 90 | | | | 10 | | |
D'ieteren SA | | | 227 | | | | 16 | | |
Econocom Group SA | | | 3,825 | | | | 10 | | |
KBC Group N.V. | | | 593 | | | | 44 | | |
Proximus SADP | | | 19 | | | | 1 | | |
| | | | 158 | | |
Canada (0.2%) | |
Bank of Montreal | | | 50 | | | | 4 | | |
Bank of Nova Scotia (The) | | | 149 | | | | 8 | | |
Canadian Imperial Bank of Commerce | | | 50 | | | | 4 | | |
Fortis, Inc. | | | 50 | | | | 2 | | |
Hydro One Ltd. | | | 50 | | | | 1 | | |
National Bank of Canada | | | 50 | | | | 3 | | |
Rogers Communications, Inc., Class B | | | 50 | | | | 3 | | |
Royal Bank of Canada | | | 199 | | | | 16 | | |
Toronto-Dominion Bank (The) | | | 199 | | | | 11 | | |
| | | | 52 | | |
China (0.0%) | |
China Common Rich Renewable Energy
Investments Ltd. (a) | | | 178,000 | | | | 1 | | |
Denmark (0.0%) | |
Carlsberg A/S Series B | | | 5 | | | | 1 | | |
Danske Bank A/S | | | 89 | | | | 1 | | |
Novo Nordisk A/S Series B | | | 33 | | | | 2 | | |
Orsted A/S | | | 13 | | | | 1 | | |
| | | | 5 | | |
Finland (0.0%) | |
Elisa Oyj | | | 17 | | | | 1 | | |
Fortum Oyj | | | 35 | | | | 1 | | |
| | | | 2 | | |
| | | Shares | | Value
(000) | |
France (8.0%) | |
Aeroports de Paris (ADP) | | | 687 | | | $ | 136 | | |
Akka Technologies | | | 238 | | | | 17 | | |
ALD SA | | | 1,132 | | | | 18 | | |
Alten SA | | | 591 | | | | 75 | | |
Altran Technologies SA | | | 4,754 | | | | 75 | | |
BNP Paribas SA | | | 2,676 | | | | 159 | | |
Carrefour SA | | | 19 | | | | — | @ | |
Credit Agricole SA | | | 2,747 | | | | 40 | | |
Danone SA | | | 18 | | | | 1 | | |
Derichebourg SA | | | 5,302 | | | | 22 | | |
Eiffage SA | | | 1,331 | | | | 152 | | |
Electricite de France SA | | | 61 | | | | 1 | | |
Elior Group SA | | | 3,822 | | | | 56 | | |
Engie SA | | | 131 | | | | 2 | | |
Fnac Darty SA (a) | | | 627 | | | | 37 | | |
Iliad SA | | | 3 | | | | — | @ | |
Jacquet Metal Service SA | | | 393 | | | | 7 | | |
Kaufman & Broad SA | | | 363 | | | | 15 | | |
L'Oreal SA | | | 7 | | | | 2 | | |
Orange SA | | | 177 | | | | 3 | | |
Pernod Ricard SA | | | 7 | | | | 1 | | |
Peugeot SA | | | 10,248 | | | | 245 | | |
Sanofi | | | 20 | | | | 2 | | |
Societe Generale SA | | | 1,829 | | | | 64 | | |
Suez | | | 37 | | | | 1 | | |
Veolia Environnement SA | | | 39 | | | | 1 | | |
Vinci SA | | | 5,921 | | | | 657 | | |
Worldline SA (a) | | | 1,689 | | | | 120 | | |
| | | | 1,909 | | |
Germany (3.2%) | |
Amadeus Fire AG | | | 69 | | | | 11 | | |
Aumann AG | | | 619 | | | | 11 | | |
Bayer AG (Registered) | | | 17 | | | | 1 | | |
Bechtle AG | | | 773 | | | | 108 | | |
Befesa SA | | | 365 | | | | 15 | | |
Beiersdorf AG | | | 3 | | | | — | @ | |
Bilfinger SE | | | 1,517 | | | | 59 | | |
CANCOM SE | | | 1,068 | | | | 63 | | |
Commerzbank AG | | | 2,433 | | | | 15 | | |
Deutsche Telekom AG (Registered) | | | 296 | | | | 5 | | |
E.ON SE | | | 158 | | | | 2 | | |
Fraport AG Frankfurt Airport Services Worldwide | | | 1,268 | | | | 108 | | |
Fresenius Medical Care AG & Co., KGaA | | | 4 | | | | — | @ | |
Fresenius SE & Co., KGaA | | | 12 | | | | 1 | | |
Hamburger Hafen und Logistik AG | | | 618 | | | | 17 | | |
Henkel AG & Co., KGaA | | | 4 | | | | — | @ | |
Henkel AG & Co., KGaA (Preference) | | | 7 | | | | 1 | | |
Hornbach Holding AG & Co., KGaA | | | 152 | | | | 11 | | |
Indus Holding AG | | | 254 | | | | 11 | | |
Innogy SE | | | 15 | | | | 1 | | |
Jungheinrich AG (Preference) | | | 860 | | | | 21 | | |
The accompanying notes are an integral part of the consolidated financial statements.
9
Morgan Stanley Institutional Fund, Inc.
Annual Report — December 31, 2019
Consolidated Portfolio of Investments (cont'd)
Multi-Asset Portfolio
| | | Shares | | Value
(000) | |
Germany (cont'd) | |
Merck KGaA | | | 5 | | | $ | 1 | | |
RWE AG | | | 38 | | | | 1 | | |
Salzgitter AG | | | 1,949 | | | | 43 | | |
Sixt SE | | | 481 | | | | 48 | | |
Uniper SE | | | 20 | | | | 1 | | |
United Internet AG (Registered) | | | 15 | | | | — | @ | |
Wacker Neuson SE | | | 834 | | | | 16 | | |
Washtec AG | | | 80 | | | | 5 | | |
Zalando SE (a) | | | 3,558 | | | | 179 | | |
| | | | 755 | | |
Greece (0.3%) | |
Mytilineos Holdings SA | | | 1,677 | | | | 18 | | |
OPAP SA | | | 3,611 | | | | 47 | | |
| | | | 65 | | |
Hong Kong (0.1%) | |
Bank of East Asia Ltd. (The) | | | 208 | | | | — | @ | |
BOC Hong Kong Holdings Ltd. | | | 746 | | | | 3 | | |
CLP Holdings Ltd. | | | 252 | | | | 3 | | |
Hang Seng Bank Ltd. | | | 99 | | | | 2 | | |
HKT Trust & HKT Ltd. | | | 503 | | | | 1 | | |
Hong Kong & China Gas Co., Ltd. | | | 1,762 | | | | 3 | | |
| | | | 12 | | |
Ireland (0.1%) | |
AIB Group PLC | | | 2,028 | | | | 7 | | |
Bank of Ireland Group PLC | | | 2,377 | | | | 13 | | |
Kerry Group PLC, Class A | | | 7 | | | | 1 | | |
| | | | 21 | | |
Israel (0.0%) | |
Bank Hapoalim BM | | | 217 | | | | 2 | | |
Bank Leumi Le-Israel BM | | | 311 | | | | 2 | | |
Mizrahi Tefahot Bank Ltd. | | | 22 | | | | 1 | | |
| | | | 5 | | |
Italy (2.0%) | |
Atlantia SpA | | | 7,696 | | | | 180 | | |
CIR-Compagnie Industriali Riunite SpA | | | 5,053 | | | | 6 | | |
Enav SpA | | | 6,010 | | | | 36 | | |
Enel SpA | | | 585 | | | | 5 | | |
Fiera Milano SpA | | | 1,906 | | | | 12 | | |
FinecoBank Banca Fineco SpA | | | 1,389 | | | | 17 | | |
Geox SpA | | | 6,985 | | | | 9 | | |
Intesa Sanpaolo SpA | | | 37,084 | | | | 98 | | |
Mediobanca Banca di Credito Finanziario SpA | | | 1,491 | | | | 16 | | |
Societa Iniziative Autostradali e Servizi SpA | | | 1,209 | | | | 20 | | |
Telecom Italia SpA | | | 617 | | | | — | @ | |
Telecom Italia SpA (a) | | | 1,411 | | | | 1 | | |
Terna Rete Elettrica Nazionale SpA | | | 127 | | | | 1 | | |
UniCredit SpA | | | 4,812 | | | | 70 | | |
| | | | 471 | | |
| | | Shares | | Value
(000) | |
Japan (4.5%) | |
Astellas Pharma, Inc. | | | 50 | | | $ | 1 | | |
Chiba Bank Ltd. (The) | | | 99 | | | | 1 | | |
Chubu Electric Power Co., Inc. | | | 50 | | | | 1 | | |
Chugoku Electric Power Co., Inc. (The) | | | 50 | | | | 1 | | |
Concordia Financial Group Ltd. | | | 199 | | | | 1 | | |
Japan Post Bank Co., Ltd. | | | 50 | | | | — | @ | |
Japan Tobacco, Inc. | | | 50 | | | | 1 | | |
Kansai Electric Power Co., Inc. (The) | | | 50 | | | | 1 | | |
KDDI Corp. | | | 252 | | | | 8 | | |
Kirin Holdings Co., Ltd. | | | 50 | | | | 1 | | |
Kyushu Electric Power Co., Inc. | | | 50 | | | | — | @ | |
Mebuki Financial Group, Inc. | | | 249 | | | | 1 | | |
Mitsubishi Estate Co., Ltd. | | | 13,400 | | | | 256 | | |
Mitsui Fudosan Co., Ltd. | | | 12,000 | | | | 293 | | |
Mizuho Financial Group, Inc. | | | 6,764 | | | | 10 | | |
Nippon Telegraph & Telephone Corp. | | | 302 | | | | 8 | | |
Nomura Real Estate Holdings, Inc. | | | 2,300 | | | | 55 | | |
NTT DOCOMO, Inc. | | | 201 | | | | 6 | | |
Osaka Gas Co., Ltd. | | | 50 | | | | 1 | | |
Resona Holdings, Inc. | | | 448 | | | | 2 | | |
Seven Bank Ltd. | | | 149 | | | | — | @ | |
Shizuoka Bank Ltd. (The) | | | 50 | | | | — | @ | |
Softbank Corp. | | | 252 | | | | 3 | | |
SoftBank Group Corp. | | | 302 | | | | 13 | | |
Sumitomo Mitsui Financial Group, Inc. | | | 149 | | | | 6 | | |
Sumitomo Mitsui Trust Holdings, Inc. | | | 50 | | | | 2 | | |
Sumitomo Realty & Development Co., Ltd. | | | 6,500 | | | | 227 | | |
Takeda Pharmaceutical Co., Ltd. | | | 50 | | | | 2 | | |
Tohoku Electric Power Co., Inc. | | | 50 | | | | — | @ | |
Tokyo Electric Power Co., Holdings, Inc. (a) | | | 151 | | | | 1 | | |
Tokyo Gas Co., Ltd. | | | 50 | | | | 1 | | |
Tokyo Tatemono Co., Ltd. | | | 5,700 | | | | 89 | | |
Tokyu Fudosan Holdings Corp. | | | 11,800 | | | | 81 | | |
| | | | 1,073 | | |
Netherlands (1.7%) | |
ABN Amro Bank N.V. CVA | | | 1,014 | | | | 18 | | |
Accell Group N.V. | | | 272 | | | | 8 | | |
Basic-Fit N.V. (a) | | | 592 | | | | 23 | | |
Heineken Holding N.V. | | | 4 | | | | — | @ | |
Heineken N.V. | | | 8 | | | | 1 | | |
ING Groep N.V. | | | 9,330 | | | | 112 | | |
InterXion Holding N.V. (a) | | | 1,200 | | | | 101 | | |
Koninklijke Ahold Delhaize N.V. | | | 35 | | | | 1 | | |
Koninklijke KPN N.V. | | | 299 | | | | 1 | | |
Koninklijke Philips N.V. | | | 20 | | | | 1 | | |
PostNL N.V. | | | 17,280 | | | | 39 | | |
Takeaway.com N.V. (a) | | | 839 | | | | 77 | | |
TomTom N.V. (a) | | | 2,883 | | | | 30 | | |
Unilever N.V. | | | 43 | | | | 2 | | |
| | | | 414 | | |
The accompanying notes are an integral part of the consolidated financial statements.
10
Morgan Stanley Institutional Fund, Inc.
Annual Report — December 31, 2019
Consolidated Portfolio of Investments (cont'd)
Multi-Asset Portfolio
| | | Shares | | Value
(000) | |
New Zealand (0.0%) | |
Spark New Zealand Ltd. | | | 227 | | | $ | 1 | | |
Norway (0.0%) | |
DNB ASA | | | 105 | | | | 2 | | |
Mowi ASA | | | 14 | | | | — | @ | |
Telenor ASA | | | 65 | | | | 1 | | |
| | | | 3 | | |
Portugal (0.2%) | |
CTT-Correios de Portugal SA | | | 3,573 | | | | 13 | | |
EDP — Energias de Portugal SA | | | 206 | | | | 1 | | |
Navigator Co. SA (The) | | | 7,311 | | | | 29 | | |
Semapa-Sociedade de Investimento e Gestao | | | 409 | | | | 6 | | |
| | | | 49 | | |
Singapore (0.1%) | |
DBS Group Holdings Ltd. | | | 298 | | | | 6 | | |
Oversea-Chinese Banking Corp., Ltd. | | | 448 | | | | 3 | | |
Singapore Telecommunications Ltd. | | | 755 | | | | 2 | | |
United Overseas Bank Ltd. | | | 149 | | | | 3 | | |
| | | | 14 | | |
Spain (2.9%) | |
Aena SME SA | | | 1,490 | | | | 285 | | |
Banco Bilbao Vizcaya Argentaria SA | | | 16,139 | | | | 90 | | |
Banco de Sabadell SA | | | 15,659 | | | | 18 | | |
Banco Santander SA | | | 40,808 | | | | 171 | | |
Bankia SA | | | 3,068 | | | | 6 | | |
Bankinter SA | | | 1,638 | | | | 12 | | |
CaixaBank SA | | | 8,814 | | | | 28 | | |
Cia de Distribucion Integral Logista Holdings SA | | | 1,374 | | | | 31 | | |
Ence Energia y Celulosa SA | | | 6,736 | | | | 28 | | |
Endesa SA | | | 29 | | | | 1 | | |
Iberdrola SA | | | 447 | | | | 4 | | |
Naturgy Energy Group SA | | | 28 | | | | 1 | | |
NH Hotel Group SA | | | 1,138 | | | | 6 | | |
Red Electrica Corp., SA | | | 39 | | | | 1 | | |
Telefonica SA | | | 415 | | | | 3 | | |
| | | | 685 | | |
Sweden (0.0%) | |
Essity AB, Class B | | | 24 | | | | 1 | | |
Millicom International Cellular SA SDR | | | 7 | | | | — | @ | |
Nordea Bank Abp | | | 383 | | | | 3 | | |
Skandinaviska Enskilda Banken AB, Class A | | | 196 | | | | 2 | | |
Svenska Handelsbanken AB, Class A | | | 181 | | | | 2 | | |
Swedbank AB, Class A | | | 99 | | | | 1 | | |
Tele2 AB, Class B | | | 55 | | | | 1 | | |
Telia Co., AB | | | 247 | | | | 1 | | |
| | | | 11 | | |
Switzerland (0.1%) | |
Alcon, Inc. (a) | | | 10 | | | | 1 | | |
Lonza Group AG (Registered) (a) | | | 3 | | | | 1 | | |
Nestle SA (Registered) | | | 87 | | | | 9 | | |
Novartis AG (Registered) | | | 40 | | | | 4 | | |
| | | Shares | | Value
(000) | |
Roche Holding AG (Genusschein) | | | 13 | | | $ | 4 | | |
Swisscom AG (Registered) | | | 3 | | | | 2 | | |
| | | | 21 | | |
United Kingdom (0.4%) | |
Associated British Foods PLC | | | 12 | | | | — | @ | |
AstraZeneca PLC | | | 24 | | | | 2 | | |
Barclays PLC | | | 3,934 | | | | 9 | | |
British American Tobacco PLC | | | 65 | | | | 3 | | |
BT Group PLC | | | 748 | | | | 2 | | |
Centrica PLC | | | 565 | | | | 1 | | |
Diageo PLC | | | 69 | | | | 3 | | |
GlaxoSmithKline PLC | | | 91 | | | | 2 | | |
HSBC Holdings PLC | | | 2,586 | | | | 20 | | |
Imperial Brands PLC | | | 30 | | | | 1 | | |
Lloyds Banking Group PLC | | | 31,694 | | | | 26 | | |
National Grid PLC | | | 244 | | | | 3 | | |
Reckitt Benckiser Group PLC | | | 19 | | | | 2 | | |
Royal Bank of Scotland Group PLC | | | 857 | | | | 3 | | |
Severn Trent PLC | | | 24 | | | | 1 | | |
Smith & Nephew PLC | | | 18 | | | | — | @ | |
SSE PLC | | | 72 | | | | 1 | | |
Standard Chartered PLC | | | 365 | | | | 4 | | |
Tesco PLC | | | 309 | | | | 1 | | |
Unilever PLC | | | 32 | | | | 2 | | |
United Utilities Group PLC | | | 68 | | | | 1 | | |
Vodafone Group PLC | | | 2,373 | | | | 5 | | |
| | | | 92 | | |
United States (8.1%) | |
Abbott Laboratories | | | 50 | | | | 4 | | |
AbbVie, Inc. | | | 50 | | | | 4 | | |
AES Corp. | | | 50 | | | | 1 | | |
Altria Group, Inc. | | | 50 | | | | 3 | | |
American Electric Power Co., Inc. | | | 50 | | | | 5 | | |
AT&T, Inc. | | | 654 | | | | 26 | | |
Bank of America Corp. | | | 9,545 | | | | 336 | | |
Boston Scientific Corp. (a) | | | 50 | | | | 2 | | |
Bristol-Myers Squibb Co. | | | 50 | | | | 3 | | |
CenterPoint Energy, Inc. | | | 50 | | | | 1 | | |
CenturyLink, Inc. | | | 151 | | | | 2 | | |
CIT Group, Inc. | | | 104 | | | | 5 | | |
Citigroup, Inc. | | | 2,488 | | | | 199 | | |
Citizens Financial Group, Inc. | | | 484 | | | | 20 | | |
Coca-Cola Co. (The) | | | 151 | | | | 8 | | |
Comerica, Inc. | | | 146 | | | | 11 | | |
CVS Health Corp. | | | 50 | | | | 4 | | |
Dominion Energy, Inc. | | | 50 | | | | 4 | | |
Duke Energy Corp. | | | 50 | | | | 5 | | |
East West Bancorp, Inc. | | | 147 | | | | 7 | | |
Edison International | | | 50 | | | | 4 | | |
Exelon Corp. | | | 151 | | | | 7 | | |
Fifth Third Bancorp | | | 747 | | | | 23 | | |
First Republic Bank | | | 157 | | | | 18 | | |
The accompanying notes are an integral part of the consolidated financial statements.
11
Morgan Stanley Institutional Fund, Inc.
Annual Report — December 31, 2019
Consolidated Portfolio of Investments (cont'd)
Multi-Asset Portfolio
| | | Shares | | Value
(000) | |
United States (cont'd) | |
FirstEnergy Corp. | | | 50 | | | $ | 2 | | |
Gilead Sciences, Inc. | | | 50 | | | | 3 | | |
Huntington Bancshares, Inc. | | | 1,141 | | | | 17 | | |
Johnson & Johnson | | | 50 | | | | 7 | | |
JPMorgan Chase & Co. | | | 3,519 | | | | 491 | | |
KeyCorp | | | 1,050 | | | | 21 | | |
Kroger Co. (The) | | | 50 | | | | 1 | | |
M&T Bank Corp. | | | 120 | | | | 20 | | |
Medtronic PLC | | | 50 | | | | 6 | | |
Merck & Co., Inc. | | | 50 | | | | 5 | | |
Mondelez International, Inc., Class A | | | 50 | | | | 3 | | |
NextEra Energy, Inc. | | | 50 | | | | 12 | | |
NiSource, Inc. | | | 50 | | | | 1 | | |
People's United Financial, Inc. | | | 465 | | | | 8 | | |
PepsiCo, Inc. | | | 50 | | | | 7 | | |
Pfizer, Inc. | | | 201 | | | | 8 | | |
Philip Morris International, Inc. | | | 50 | | | | 4 | | |
PNC Financial Services Group, Inc. (The) | | | 479 | | | | 76 | | |
PPL Corp. | | | 50 | | | | 2 | | |
Procter & Gamble Co. (The) | | | 151 | | | | 19 | | |
Public Service Enterprise Group, Inc. | | | 50 | | | | 3 | | |
Regions Financial Corp. | | | 1,054 | | | | 18 | | |
Signature Bank | | | 58 | | | | 8 | | |
Southern Co. (The) | | | 151 | | | | 10 | | |
Sprint Corp. (a) | | | 151 | | | | 1 | | |
SVB Financial Group (a) | | | 56 | | | | 14 | | |
T-Mobile US, Inc. (a) | | | 50 | | | | 4 | | |
Truist Financial Corp. | | | 1,417 | | | | 80 | | |
US Bancorp | | | 1,574 | | | | 93 | | |
Verizon Communications, Inc. | | | 403 | | | | 25 | | |
Vistra Energy Corp. | | | 50 | | | | 1 | | |
Walgreens Boots Alliance, Inc. | | | 50 | | | | 3 | | |
Walmart, Inc. | | | 50 | | | | 6 | | |
Wells Fargo & Co. | | | 4,416 | | | | 238 | | |
Xcel Energy, Inc. | | | 50 | | | | 3 | | |
Zions Bancorp NA | | | 177 | | | | 9 | | |
| | | | 1,931 | | |
Total Common Stocks (Cost $7,040) | | | 7,792 | | |
| | | Face
Amount
(000) | | | |
Fixed Income Securities (8.3%) | |
Sovereign (8.3%) | |
Argentina (1.1%) | |
Argentine Republic Government
International Bond, | |
5.88%, 1/11/28 | | $ | 554 | | | | 262 | | |
| | | Face
Amount
(000) | | Value
(000) | |
Greece (7.2%) | |
Hellenic Republic Government Bond, | |
3.75%, 1/30/28 | | EUR | 1,288 | | | $ | 1,711 | | |
Total Sovereign (Cost $1,899) | | | 1,973 | | |
Total Fixed Income Securities (Cost $1,899) | | | 1,973 | | |
| | | Shares | | | |
Short-Term Investments (55.5%) | |
Investment Company (40.1%) | |
Morgan Stanley Institutional Liquidity
Funds — Government Portfolio —
Institutional Class (See Note G)
(Cost $9,542) | | | 9,542,178 | | | | 9,542 | | |
| | | Face
Amount
(000) | | | |
U.S. Treasury Security (15.4%) | |
U.S. Treasury Bill, | |
| 1.50%, 2/27/20 (Cost $3,674) (b)(c) | | $ | 3,683 | | | | 3,674 | | |
Total Short-Term Investments (Cost $13,216) | | | 13,216 | | |
Total Investments (96.6%) (Cost $22,155) (d)(e)(f) | | | 22,981 | | |
Other Assets in Excess of Liabilities (3.4%) | | | 818 | | |
Net Assets (100.0%) | | $ | 23,799 | | |
Country assignments and aggregations are based generally on third party vendor classifications and information, and may be different from the assignments and aggregations under the policies set forth in the Fund's prospectus and/or statement of additional information relating to geographic classifications.
(a) Non-income producing security.
(b) Rate shown is the yield to maturity at December 31, 2019.
(c) All or a portion of the security was pledged to cover margin requirements for swap agreements.
(d) Securities are available for collateral in connection with open foreign currency forward exchange contracts, futures contracts and swap agreements.
(e) The approximate fair value and percentage of net assets, $2,378,000 and 10.0%, respectively, represent the securities that have been fair valued under the fair valuation policy for international investments as described in Note A-1 within the Notes to the Consolidated Financial Statements.
(f) At December 31, 2019, the aggregate cost for federal income tax purposes is approximately $22,663,000. The aggregate gross unrealized appreciation is approximately $838,000 and the aggregate gross unrealized depreciation is approximately $352,000, resulting in net unrealized appreciation of approximately $486,000.
@ Value is less than $500.
CVA Certificaten Van Aandelen.
REIT Real Estate Investment Trust.
SDR Swedish Depositary Receipt.
The accompanying notes are an integral part of the consolidated financial statements.
12
Morgan Stanley Institutional Fund, Inc.
Annual Report — December 31, 2019
Consolidated Portfolio of Investments (cont'd)
Multi-Asset Portfolio
Foreign Currency Forward Exchange Contracts:
The Fund had the following foreign currency forward exchange contracts open at December 31, 2019:
Counterparty | | Contracts to
Deliver
(000) | | In Exchange
For
(000) | | Delivery
Date | | Unrealized
Appreciation
(Depreciation)
(000) | |
Bank of America NA | | CNH | 17 | | | $ | 2 | | | 3/19/20 | | $ | (— | @) | |
Bank of America NA | | ILS | 24 | | | $ | 7 | | | 3/19/20 | | | (— | @) | |
Bank of America NA | | PLN | 25 | | | $ | 7 | | | 3/19/20 | | | (— | @) | |
Bank of America NA | | $ | 51 | | | EUR | 45 | | | 3/19/20 | | | — | @ | |
Barclays Bank PLC | | COP | 321,344 | | | $ | 95 | | | 3/19/20 | | | (3 | ) | |
Barclays Bank PLC | | PEN | 309 | | | $ | 91 | | | 3/19/20 | | | (2 | ) | |
Barclays Bank PLC | | SGD | 26 | | | $ | 19 | | | 3/19/20 | | | (— | @) | |
BNP Paribas SA | | AUD | 17 | | | $ | 12 | | | 3/19/20 | | | (— | @) | |
BNP Paribas SA | | CAD | 33 | | | $ | 25 | | | 3/19/20 | | | (— | @) | |
BNP Paribas SA | | DKK | 70 | | | $ | 11 | | | 3/19/20 | | | (— | @) | |
BNP Paribas SA | | INR | 966 | | | $ | 14 | | | 3/19/20 | | | — | @ | |
BNP Paribas SA | | RUB | 399 | | | $ | 6 | | | 3/19/20 | | | (— | @) | |
BNP Paribas SA | | TRY | 35 | | | $ | 6 | | | 3/19/20 | | | — | @ | |
BNP Paribas SA | | TWD | 502 | | | $ | 17 | | | 3/19/20 | | | (— | @) | |
BNP Paribas SA | | $ | 19 | | | CHF | 19 | | | 3/19/20 | | | — | @ | |
BNP Paribas SA | | $ | 48 | | | EUR | 43 | | | 3/19/20 | | | — | @ | |
BNP Paribas SA | | $ | 87 | | | GBP | 66 | | | 3/19/20 | | | 1 | | |
BNP Paribas SA | | $ | 16 | | | INR | 1,118 | | | 3/19/20 | | | (— | @) | |
BNP Paribas SA | | $ | 7 | | | RUB | 420 | | | 3/19/20 | | | (— | @) | |
BNP Paribas SA | | $ | 20 | | | TWD | 590 | | | 3/19/20 | | | (— | @) | |
Citibank NA | | CLP | 69,196 | | | $ | 90 | | | 3/19/20 | | | (2 | ) | |
Citibank NA | | HUF | 214 | | | $ | 1 | | | 3/19/20 | | | (— | @) | |
Citibank NA | | KRW | 20,044 | | | $ | 17 | | | 3/19/20 | | | (— | @) | |
Citibank NA | | THB | 161 | | | $ | 5 | | | 3/19/20 | | | (— | @) | |
Citibank NA | | $ | 1 | | | CZK | 31 | | | 3/19/20 | | | — | @ | |
Citibank NA | | $ | 326 | | | EUR | 291 | | | 3/19/20 | | | 1 | | |
Citibank NA | | $ | 18 | | | KRW | 20,640 | | | 3/19/20 | | | — | @ | |
Citibank NA | | $ | 6 | | | THB | 188 | | | 3/19/20 | | | — | @ | |
Commonwealth Bank of Australia | | $ | 7 | | | NZD | 11 | | | 3/19/20 | | | — | @ | |
Goldman Sachs International | | BRL | 83 | | | $ | 21 | | | 3/19/20 | | | — | @ | |
Goldman Sachs International | | HKD | 343 | | | $ | 44 | | | 3/19/20 | | | (— | @) | |
Goldman Sachs International | | IDR | 96,537 | | | $ | 7 | | | 3/19/20 | | | (— | @) | |
Goldman Sachs International | | JPY | 5,267 | | | $ | 48 | | | 3/19/20 | | | (— | @) | |
Goldman Sachs International | | JPY | 6,909 | | | $ | 63 | | | 3/19/20 | | | (— | @) | |
Goldman Sachs International | | $ | 932 | | | BRL | 3,835 | | | 3/19/20 | | | 18 | | |
Goldman Sachs International | | $ | 696 | | | EUR | 620 | | | 3/19/20 | | | 3 | | |
Goldman Sachs International | | $ | 53 | | | EUR | 47 | | | 3/19/20 | | | 1 | | |
Goldman Sachs International | | $ | 28 | | | HKD | 217 | | | 3/19/20 | | | (— | @) | |
Goldman Sachs International | | $ | 8 | | | IDR | 113,562 | | | 3/19/20 | | | — | @ | |
JPMorgan Chase Bank NA | | $ | 214 | | | EUR | 191 | | | 3/19/20 | | | 1 | | |
State Street Bank and Trust Co. | | CAD | 44 | | | $ | 33 | | | 3/19/20 | | | (1 | ) | |
UBS AG | | AUD | 48 | | | $ | 33 | | | 3/19/20 | | | (1 | ) | |
UBS AG | | CAD | 19 | | | $ | 14 | | | 3/19/20 | | | (— | @) | |
UBS AG | | DKK | 68 | | | $ | 10 | | | 3/19/20 | | | (— | @) | |
UBS AG | | EUR | 9 | | | $ | 10 | | | 3/19/20 | | | (— | @) | |
UBS AG | | EUR | 51 | | | $ | 58 | | | 3/19/20 | | | (— | @) | |
UBS AG | | GBP | 14 | | | $ | 19 | | | 3/19/20 | | | (— | @) | |
UBS AG | | HKD | 191 | | | $ | 25 | | | 3/19/20 | | | (— | @) | |
UBS AG | | HUF | 1,698 | | | $ | 6 | | | 3/19/20 | | | (— | @) | |
UBS AG | | JPY | 46,230 | | | $ | 425 | | | 3/19/20 | | | (3 | ) | |
UBS AG | | NOK | 35 | | | $ | 4 | | | 3/19/20 | | | (— | @) | |
UBS AG | | SEK | 101 | | | $ | 11 | | | 3/19/20 | | | — | @ | |
UBS AG | | $ | 410 | | | CHF | 399 | | | 3/19/20 | | | 4 | | |
UBS AG | | $ | 1,439 | | | EUR | 1,282 | | | 3/19/20 | | | 6 | | |
UBS AG | | $ | 2,068 | | | GBP | 1,570 | | | 3/19/20 | | | 16 | | |
The accompanying notes are an integral part of the consolidated financial statements.
13
Morgan Stanley Institutional Fund, Inc.
Annual Report — December 31, 2019
Consolidated Portfolio of Investments (cont'd)
Multi-Asset Portfolio
Foreign Currency Forward Exchange Contracts (cont'd):
Counterparty | | Contracts to
Deliver
(000) | | In Exchange
For
(000) | | Delivery
Date | | Unrealized
Appreciation
(Depreciation)
(000) | |
UBS AG | | $ | 6 | | | HUF | 1,866 | | | 3/19/20 | | | (— | @) | |
UBS AG | | $ | 16 | | | JPY | 1,785 | | | 3/19/20 | | | — | @ | |
UBS AG | | $ | 1,016 | | | MXN | 19,452 | | | 3/19/20 | | | 1 | | |
UBS AG | | $ | 10 | | | ZAR | 139 | | | 3/19/20 | | | — | @ | |
UBS AG | | ZAR | 145 | | | $ | 10 | | | 3/19/20 | | | (— | @) | |
| | | | | | | | | $ | 40 | | |
Futures Contracts:
The Fund had the following futures contracts open at December 31, 2019: | |
| | | Number
of
Contracts | | Expiration
Date | | Notional
Amount
(000) | | Value
(000) | | Unrealized
Appreciation
(Depreciation)
(000) | |
Long: | |
100 oz Gold Future (United States) | | | 12 | | | Feb-20 | | $ | 1 | | | $ | 1,828 | | | $ | 54 | | |
MSCI Emerging Market E Mini (United States) | | | 1 | | | Mar-20 | | | — | @ | | | 56 | | | | 2 | | |
NASDAQ 100 E Mini (United States) | | | 2 | | | Mar-20 | | | — | @ | | | 350 | | | | 10 | | |
NIKKEI 225 Index (Japan) | | | 1 | | | Mar-20 | | JPY | 1 | | | | 108 | | | | 1 | | |
Short: | |
Euro FX Currency (United States) | | | 63 | | | Mar-20 | | $ | (7,875 | ) | | | (8,885 | ) | | | (103 | ) | |
Euro Stoxx 50 (Germany) | | | 19 | | | Mar-20 | | EUR | (— | @) | | | (795 | ) | | | 4 | | |
German Euro BONO (Germany) | | | 1 | | | Mar-20 | | | (100 | ) | | | (178 | ) | | | — | @ | |
German Euro BTP (Germany) | | | 7 | | | Mar-20 | | | (700 | ) | | | (1,118 | ) | | | (2 | ) | |
German Euro OAT (Germany) | | | 2 | | | Mar-20 | | | (200 | ) | | | (365 | ) | | | 5 | | |
S&P 500 E MINI Index (United States) | | | 25 | | | Mar-20 | | $ | (1 | ) | | | (4,039 | ) | | | (41 | ) | |
TOPIX Index (Japan) | | | 7 | | | Mar-20 | | JPY | (70 | ) | | | (1,109 | ) | | | (2 | ) | |
U.S. Treasury 10 yr. Ultra Long Bond (United States) | | | 14 | | | Mar-20 | | $ | (1,400 | ) | | | (1,970 | ) | | | 22 | | |
| | | | | | | | | | | $ | (50 | ) | |
Credit Default Swap Agreement:
The Fund had the following credit default swap agreement open at December 31, 2019: | |
Swap Counterparty and
Reference Obligation | | Credit
Rating of
Reference
Obligation†
(Unaudited) | | Buy/Sell
Protection | | Pay/Receive
Fixed Rate | | Payment
Frequency | | Maturity
Date | | Notional
Amount
(000) | | Value
(000) | | Upfront
Payment
Paid
(000) | | Unrealized
Depreciation
(000) | |
Morgan Stanley & Co. LLC*
CDX.EM.32 | | NR | | Buy | | | 1.00 | % | | Quarterly | | 12/20/24 | | $ | 261 | | | $ | 9 | | | $ | 14 | | | $ | (5 | ) | |
Interest Rate Swap Agreements:
The Fund had the following interest rate swap agreements open at December 31, 2019: | |
Swap Counterparty | | Floating Rate
Index | | Pay/Receive
Floating Rate | | Fixed
Rate | | Payment
Frequency
Paid/
Received | | Maturity
Date | | Notional
Amount
(000) | | Value
(000) | | Upfront
Payment
Paid
(000) | | Unrealized
Appreciation
(000) | |
Morgan Stanley & Co. LLC*
| | US CPI All Urban
Consumers Index | | Receive | | | 1.85 | % | | Semi-Annual/
Quarterly | | 9/16/29 | | $ | 697 | | | $ | 9 | | | $ | — | | | $ | 9 | | |
Morgan Stanley & Co. LLC*
| | US CPI All Urban
Consumers Index | | Receive | | | 1.85 | | | Semi-Annual/
Quarterly | | 9/17/29 | | | 289 | | | | 4 | | | | — | | | | 4 | | |
Morgan Stanley & Co. LLC*
| | US CPI All Urban
Consumers Index | | Receive | | | 1.87 | | | Semi-Annual/
Quarterly | | 9/17/29 | | | 680 | | | | 7 | | | | — | | | | 7 | | |
Morgan Stanley & Co. LLC*
| | US CPI All Urban
Consumers Index | | Receive | | | 1.87 | | | Semi-Annual/
Quarterly | | 9/17/29 | | | 680 | | | | 7 | | | | — | | | | 7 | | |
Morgan Stanley & Co. LLC*
| | US CPI All Urban
Consumers Index | | Receive | | | 1.90 | | | Semi-Annual/
Quarterly | | 9/17/29 | | | 1,183 | | | | 9 | | | | — | | | | 9 | | |
| | | | | | | | | | | | | | | $ | 36 | | | $ | — | | | $ | 36 | | |
The accompanying notes are an integral part of the consolidated financial statements.
14
Morgan Stanley Institutional Fund, Inc.
Annual Report — December 31, 2019
Consolidated Portfolio of Investments (cont'd)
Multi-Asset Portfolio
Total Return Swap Agreements:
The Fund had the following total return swap agreements open at December 31, 2019:
Swap Counterparty | | Index | | Pay/Receive
Total Return
of Referenced
Index | | Floating
Rate | | Payment
Frequency | | Maturity
Date | | Notional
Amount
(000) | | Value
(000) | | Upfront
Payment
Paid
(000) | | Unrealized
Appreciation
(Depreciation)
(000) | |
BNP Paribas SA | | MSCI AU
Banks Index | | Pay | | 3 Month AUD
BBSW plus 0.33% | | Quarterly | | 2/10/20 | | AUD | 426 | | | $ | 16 | | | $ | — | | | $ | 16 | | |
BNP Paribas SA | | MSCI AU
Banks Index | | Pay | | 3 Month AUD
BBSW plus 0.35% | | Quarterly | | 2/10/20 | | | 466 | | | | 18 | | | | — | | | | 18 | | |
BNP Paribas SA | | MSCI AU
Banks Index | | Pay | | 3 Month AUD
BBSW plus 0.35% | | Quarterly | | 2/10/20 | | | 59 | | | | 2 | | | | — | | | | 2 | | |
BNP Paribas SA | | MSCI AU
Banks Index | | Pay | | 3 Month AUD
BBSW plus 0.35% | | Quarterly | | 2/10/20 | | | 59 | | | | 2 | | | | — | | | | 2 | | |
BNP Paribas SA | | MSCI AU
Banks Index | | Pay | | 3 Month AUD
BBSW plus 0.35% | | Quarterly | | 2/10/20 | | | 144 | | | | 1 | | | | — | | | | 1 | | |
BNP Paribas SA | | BNP IPO
Index†† | | Pay | | 3 Month USD
LIBOR plus 1.50% | | Quarterly | | 10/15/20 | | $ | 185 | | | | (8 | ) | | | — | | | | (8 | ) | |
JPMorgan Chase
Bank NA | | JPM Custom U.S.
IPO Index†† | | Pay | | 3 Month USD
LIBOR plus 3.10% | | Quarterly | | 9/28/20 | | | 177 | | | | 1 | | | | — | | | | 1 | | |
JPMorgan Chase
Bank NA | | JPM EU Anti
Value Index†† | | Pay | | 3 Month EUR
EURIBOR plus 0.05% | | Quarterly | | 7/27/20 | | EUR | 597 | | | | (20 | ) | | | — | | | | (20 | ) | |
JPMorgan Chase
Bank NA | | JPM EU Anti
Value Index†† | | Pay | | 3 Month EUR
EURIBOR plus 0.05% | | Quarterly | | 7/27/20 | | | 595 | | | | (19 | ) | | | — | | | | (19 | ) | |
JPMorgan Chase
Bank NA | | JPM EU Anti
Value Index†† | | Pay | | 3 Month EUR
EURIBOR plus 0.05% | | Quarterly | | 7/27/20 | | | 593 | | | | (22 | ) | | | — | | | | (22 | ) | |
JPMorgan Chase
Bank NA | | JPM EU Low
Volatility Index†† | | Pay | | 3 Month EUR
EURIBOR plus 0.05% | | Quarterly | | 7/27/20 | | | 294 | | | | (5 | ) | | | — | | | | (5 | ) | |
JPMorgan Chase
Bank NA | | JPM EU Low
Volatility Index†† | | Pay | | 3 Month EUR
EURIBOR plus 0.05% | | Quarterly | | 7/27/20 | | | 293 | | | | (5 | ) | | | — | | | | (5 | ) | |
JPMorgan Chase
Bank NA | | JPM EU Low
Volatility Index†† | | Pay | | 3 Month EUR
EURIBOR plus 0.05% | | Quarterly | | 7/27/20 | | | 292 | | | | (6 | ) | | | — | | | | (6 | ) | |
JPMorgan Chase
Bank NA | | JPM EU
Value Index†† | | Receive | | 3 Month EUR
EURIBOR plus 0.14% | | Quarterly | | 7/27/20 | | | 894 | | | | 11 | | | | — | | | | 11 | | |
JPMorgan Chase
Bank NA | | JPM EU
Value Index†† | | Receive | | 3 Month EUR
EURIBOR plus 0.14% | | Quarterly | | 7/27/20 | | | 886 | | | | 7 | | | | — | | | | 7 | | |
JPMorgan Chase
Bank NA | | JPM EU
Value Index†† | | Receive | | 3 Month EUR
EURIBOR plus 0.14% | | Quarterly | | 7/27/20 | | | 885 | | | | 13 | | | | — | | | | 13 | | |
JPMorgan Chase
Bank NA | | JPM U.S.
Momentum Index†† | | Pay | | 3 Month USD
LIBOR plus 0.05% | | Quarterly | | 7/23/20 | | $ | 669 | | | | (6 | ) | | | — | | | | (6 | ) | |
JPMorgan Chase
Bank NA | | JPM U.S.
Momentum Index†† | | Pay | | 3 Month USD
LIBOR plus 0.05% | | Quarterly | | 7/27/20 | | | 660 | | | | (9 | ) | | | — | | | | (9 | ) | |
JPMorgan Chase
Bank NA | | JPM U.S.
Momentum Index†† | | Pay | | 3 Month USD
LIBOR plus 0.05% | | Quarterly | | 7/27/20 | | | 663 | | | | (11 | ) | | | — | | | | (11 | ) | |
JPMorgan Chase
Bank NA | | JPM U.S.
Momentum Index†† | | Pay | | 3 Month USD
LIBOR plus 0.05% | | Quarterly | | 7/27/20 | | | 652 | | | | (11 | ) | | | — | | | | (11 | ) | |
JPMorgan Chase
Bank NA | | JPM U.S.
Momentum Index†† | | Pay | | 3 Month USD
LIBOR plus 0.05% | | Quarterly | | 7/27/20 | | | 615 | | | | (8 | ) | | | — | | | | (8 | ) | |
JPMorgan Chase
Bank NA | | JPM U.S.
Value Index†† | | Receive | | 3 Month USD
LIBOR plus 0.05% | | Quarterly | | 7/23/20 | | | 1,396 | | | | 40 | | | | — | | | | 40 | | |
JPMorgan Chase
Bank NA | | JPM U.S.
Value Index†† | | Receive | | 3 Month USD
LIBOR plus 0.05% | | Quarterly | | 7/27/20 | | | 1,363 | | | | 39 | | | | — | | | | 39 | | |
JPMorgan Chase
Bank NA | | JPM U.S.
Value Index†† | | Receive | | 3 Month USD
LIBOR plus 0.05% | | Quarterly | | 7/27/20 | | | 1,358 | | | | 44 | | | | — | | | | 44 | | |
JPMorgan Chase
Bank NA | | JPM U.S.
Value Index†† | | Receive | | 3 Month USD
LIBOR plus 0.05% | | Quarterly | | 7/27/20 | | | 1,350 | | | | 39 | | | | — | | | | 39 | | |
JPMorgan Chase
Bank NA | | JPM U.S.
Value Index†† | | Receive | | 3 Month USD
LIBOR plus 0.05% | | Quarterly | | 7/27/20 | | | 1,280 | | | | 18 | | | | — | | | | 18 | | |
The accompanying notes are an integral part of the consolidated financial statements.
15
Morgan Stanley Institutional Fund, Inc.
Annual Report — December 31, 2019
Consolidated Portfolio of Investments (cont'd)
Multi-Asset Portfolio
Total Return Swap Agreements (cont'd):
Swap Counterparty | | Index | | Pay/Receive
Total Return
of Referenced
Index | | Floating
Rate | | Payment
Frequency | | Maturity
Date | | Notional
Amount
(000) | | Value
(000) | | Upfront
Payment
Paid
(000) | | Unrealized
Appreciation
(Depreciation)
(000) | |
JPMorgan Chase
Bank NA | | JPM U.S.
Growth Index†† | | Pay | | 3 Month USD
LIBOR plus 0.05% | | Quarterly | | 9/9/20 | | $ | 713 | | | $ | (22 | ) | | $ | — | | | $ | (22 | ) | |
JPMorgan Chase
Bank NA | | JPM U.S.
Growth Index†† | | Pay | | 3 Month USD
LIBOR plus 0.05% | | Quarterly | | 9/11/20 | | | 708 | | | | (20 | ) | | | — | | | | (20 | ) | |
JPMorgan Chase
Bank NA | | JPM U.S.
Growth Index†† | | Pay | | 3 Month USD
LIBOR plus 0.05% | | Quarterly | | 9/11/20 | | | 710 | | | | (23 | ) | | | — | | | | (23 | ) | |
JPMorgan Chase
Bank NA | | JPM U.S.
Growth Index†† | | Pay | | 3 Month USD
LIBOR plus 0.05% | | Quarterly | | 9/11/20 | | | 699 | | | | (21 | ) | | | — | | | | (21 | ) | |
JPMorgan Chase
Bank NA | | JPM U.S.
Growth Index†† | | Pay | | 3 Month USD
LIBOR plus 0.05% | | Quarterly | | 9/11/20 | | | 651 | | | | (15 | ) | | | — | | | | (15 | ) | |
JPMorgan Chase
Bank NA | | S&P 500 Utility Sector
Total Return Index | | Pay | | 3 Month USD
LIBOR plus 0.05% | | Quarterly | | 9/10/20 | | | 363 | | | | (11 | ) | | | — | | | | (11 | ) | |
JPMorgan Chase
Bank NA | | S&P 500 Utility Sector
Total Return Index | | Pay | | 3 Month USD
LIBOR plus 0.05% | | Quarterly | | 9/10/20 | | | 172 | | | | (5 | ) | | | — | | | | (5 | ) | |
| | | | | | | | | | | | | | | $ | 4 | | | $ | — | | | $ | 4 | | |
†† See tables below for details of the equity basket holdings underlying the swap.
The following table represents the equity basket holdings underlying the total return swap with BNP IPO Index as of December 31, 2019:
Security Description | | Shares | | Value
(000) | | Index Weight | |
BNP IPO Index | |
Cloudflare, Inc. | | | 14,418 | | | $ | 246 | | | | 24.65 | % | |
Datadog, Inc. | | | 6,803 | | | | 257 | | | | 25.75 | | |
Peloton Interactive, Inc. | | | 10,417 | | | | 296 | | | | 29.64 | | |
SmileDirectClub, Inc. | | | 22,789 | | | | 199 | | | | 19.96 | | |
Total | | | | $ | 998 | | | | 100.00 | % | |
The following table represents the equity basket holdings underlying the total return swap with JPM Custom U.S. IPO Index as of December 31, 2019:
Security Description | | Shares | | Value
(000) | | Index Weight | |
JPM Custom U.S. IPO Index | |
Dynatrace, Inc. | | | 112,359 | | | $ | 2,843 | | | | 27.46 | % | |
Livongo Health, Inc. | | | 108,712 | | | | 2,724 | | | | 26.32 | | |
Medallia, Inc. | | | 80,664 | | | | 2,509 | | | | 24.24 | | |
Slack Technologies, Inc. | | | 101,197 | | | | 2,275 | | | | 21.98 | | |
Total | | | | $ | 10,351 | | | | 100.00 | % | |
The following table represents the equity basket holdings underlying the total return swap with JPM EU Anti Value Index as of December 31, 2019:
Security Description | | Shares | | Value
(000) | | Index Weight | |
JPM EU Anti Value Index | |
Adyen NV | | | 277 | | | $ | 227 | | | | 2.17 | % | |
Aeroports de Paris | | | 1,110 | | | | 219 | | | | 2.10 | | |
Air Liquide SA | | | 1,608 | | | | 228 | | | | 2.18 | | |
Akzo Nobel N.V. | | | 2,213 | | | | 225 | | | | 2.16 | | |
Amundi SA | | | 2,841 | | | | 223 | | | | 2.14 | | |
ASML Holding N.V. | | | 799 | | | | 237 | | | | 2.27 | | |
Bureau Veritas SA | | | 8,299 | | | | 217 | | | | 2.08 | | |
Carl Zeiss Meditec AG | | | 1,773 | | | | 226 | | | | 2.17 | | |
The accompanying notes are an integral part of the consolidated financial statements.
16
Morgan Stanley Institutional Fund, Inc.
Annual Report — December 31, 2019
Consolidated Portfolio of Investments (cont'd)
Multi-Asset Portfolio
Security Description | | Shares | | Value
(000) | | Index Weight | |
JPM EU Anti Value Index (cont'd) | |
Cellnex Telecom SA | | | 5,036 | | | $ | 217 | | | | 2.08 | % | |
Dassault Systemes SE | | | 1,386 | | | | 228 | | | | 2.19 | | |
Davide Campari-Milano SpA | | | 23,891 | | | | 218 | | | | 2.09 | | |
Delivery Hero SE | | | 4,007 | | | | 317 | | | | 3.04 | | |
Deutsche Bank AG | | | 30,275 | | | | 235 | | | | 2.25 | | |
Deutsche Boerse AG | | | 1,421 | | | | 224 | | | | 2.14 | | |
Deutsche Wohnen SE | | | 5,601 | | | | 229 | | | | 2.19 | | |
E.ON SE | | | 21,246 | | | | 227 | | | | 2.18 | | |
Edenred | | | 4,428 | | | | 229 | | | | 2.20 | | |
Elisa Oyj | | | 4,054 | | | | 224 | | | | 2.15 | | |
Ferrari N.V. | | | 1,294 | | | | 215 | | | | 2.06 | | |
Ferrovial SA | | | 7,343 | | | | 222 | | | | 2.13 | | |
FinecoBank Banca Fineco SpA | | | 17,311 | | | | 208 | | | | 1.99 | | |
Fuchs Petrolub SE | | | 4,926 | | | | 244 | | | | 2.34 | | |
Galapagos N.V. | | | 1,034 | | | | 217 | | | | 2.08 | | |
Getlink SE | | | 12,867 | | | | 224 | | | | 2.15 | | |
Groupe Bruxelles Lambert SA | | | 2,117 | | | | 223 | | | | 2.14 | | |
Hannover Rueck SE | | | 1,170 | | | | 226 | | | | 2.17 | | |
Hermes International | | | 296 | | | | 221 | | | | 2.12 | | |
ICADE | | | 2,115 | | | | 230 | | | | 2.21 | | |
Kerry Group PLC | | | 1,664 | | | | 208 | | | | 1.99 | | |
Kone Oyj | | | 3,432 | | | | 225 | | | | 2.15 | | |
Koninklijke Vopak N.V. | | | 4,055 | | | | 220 | | | | 2.11 | | |
L'Oreal SA | | | 777 | | | | 230 | | | | 2.21 | | |
Moncler SpA | | | 4,719 | | | | 212 | | | | 2.03 | | |
MTU Aero Engines AG | | | 753 | | | | 215 | | | | 2.06 | | |
Neste Oyj | | | 6,614 | | | | 230 | | | | 2.21 | | |
Puma SE | | | 2,885 | | | | 221 | | | | 2.12 | | |
RWE AG | | | 7,601 | | | | 233 | | | | 2.24 | | |
Sampo Oyj | | | 5,314 | | | | 232 | | | | 2.22 | | |
Sartorius Stedim Biotech | | | 1,344 | | | | 223 | | | | 2.14 | | |
Symrise AG | | | 2,264 | | | | 238 | | | | 2.28 | | |
Teleperformance | | | 922 | | | | 225 | | | | 2.16 | | |
Terna Rete Elettrica Nazionale SpA | | | 34,793 | | | | 233 | | | | 2.23 | | |
Ubisoft Entertainment SA | | | 3,343 | | | | 231 | | | | 2.22 | | |
Wendel SA | | | 1,608 | | | | 214 | | | | 2.05 | | |
Wolters Kluwer N.V. | | | 3,070 | | | | 224 | | | | 2.15 | | |
Zalando SE | | | 4,655 | | | | 236 | | | | 2.26 | | |
Total | | | | $ | 10,430 | | | | 100.00 | % | |
The following table represents the equity basket holdings underlying the total return swap with JPM EU Low Volatility Index as of December 31, 2019:
Security Description | | Shares | | Value
(000) | | Index Weight | |
JPM EU Low Volatility Index | |
Accor SA | | | 5,512 | | | $ | 258 | | | | 2.52 | % | |
Adyen N.V. | | | 302 | | | | 248 | | | | 2.42 | | |
Aena SME SA | | | 1,302 | | | | 249 | | | | 2.44 | | |
Ageas | | | 3,952 | | | | 234 | | | | 2.28 | | |
Air Liquide SA | | | 1,755 | | | | 249 | | | | 2.43 | | |
Allianz SE | | | 994 | | | | 244 | | | | 2.38 | | |
Amadeus IT Group SA | | | 2,951 | | | | 241 | | | | 2.36 | | |
Bollore SA | | | 55,852 | | | | 244 | | | | 2.38 | | |
Cellnex Telecom SA | | | 5,493 | | | | 237 | | | | 2.31 | | |
Covivio | | | 2,125 | | | | 241 | | | | 2.36 | | |
The accompanying notes are an integral part of the consolidated financial statements.
17
Morgan Stanley Institutional Fund, Inc.
Annual Report — December 31, 2019
Consolidated Portfolio of Investments (cont'd)
Multi-Asset Portfolio
Security Description | | Shares | | Value
(000) | | Index Weight | |
JPM EU Low Volatility Index (cont'd) | |
CRH PLC | | | 6,182 | | | $ | 248 | | | | 2.42 | % | |
Danone SA | | | 2,905 | | | | 241 | | | | 2.35 | | |
Deutsche Boerse AG | | | 1,550 | | | | 244 | | | | 2.38 | | |
Deutsche Telekom AG | | | 14,185 | | | | 232 | | | | 2.27 | | |
Elisa Oyj | | | 4,422 | | | | 245 | | | | 2.39 | | |
Endesa SA | | | 8,809 | | | | 235 | | | | 2.30 | | |
Ferrovial SA | | | 8,010 | | | | 243 | | | | 2.37 | | |
Galp Energia SGPS SA | | | 14,694 | | | | 246 | | | | 2.40 | | |
Groupe Bruxelles Lambert SA | | | 2,309 | | | | 244 | | | | 2.38 | | |
Hannover Rueck SE | | | 1,276 | | | | 247 | | | | 2.41 | | |
Henkel AG & Co. KGaA | | | 2,487 | | | | 235 | | | | 2.29 | | |
Hermes International | | | 323 | | | | 241 | | | | 2.36 | | |
Knorr-Bremse AG | | | 2,475 | | | | 252 | | | | 2.46 | | |
Kone Oyj | | | 3,743 | | | | 245 | | | | 2.39 | | |
Legrand SA | | | 2,939 | | | | 240 | | | | 2.34 | | |
L'Oreal SA | | | 848 | | | | 251 | | | | 2.45 | | |
Merck KGaA | | | 2,047 | | | | 242 | | | | 2.37 | | |
Munich Re | | | 827 | | | | 244 | | | | 2.39 | | |
Naturgy Energy Group SA | | | 9,326 | | | | 235 | | | | 2.29 | | |
Pernod Ricard SA | | | 1,320 | | | | 236 | | | | 2.31 | | |
Red Electrica Corp. SA | | | 12,205 | | | | 246 | | | | 2.40 | | |
Sampo Oyj | | | 5,797 | | | | 253 | | | | 2.47 | | |
SAP SE | | | 1,756 | | | | 237 | | | | 2.32 | | |
SCOR SE | | | 5,672 | | | | 238 | | | | 2.33 | | |
Siemens Healthineers AG | | | 4,863 | | | | 234 | | | | 2.28 | | |
Sodexo SA | | | 2,044 | | | | 243 | | | | 2.37 | | |
Symrise AG | | | 2,469 | | | | 260 | | | | 2.54 | | |
Teleperformance | | | 1,006 | | | | 246 | | | | 2.40 | | |
Terna Rete Elettrica Nazionale SpA | | | 37,952 | | | | 254 | | | | 2.48 | | |
TOTAL SA | | | 4,517 | | | | 250 | | | | 2.44 | | |
Vinci SA | | | 2,191 | | | | 244 | | | | 2.38 | | |
Wolters Kluwer N.V. | | | 3,349 | | | | 244 | | | | 2.39 | | |
Total | | | | $ | 10,240 | | | | 100.00 | % | |
The following table represents the equity basket holdings underlying the total return swap with JPM EU Value Index as of December 31, 2019:
Security Description | | Shares | | Value
(000) | | Index Weight | |
JPM EU Value Index | |
ACS, Actividades de Construccion y Servicious SA | | | 7,247 | | | $ | 290 | | | | 2.81 | % | |
Aegon N.V. | | | 61,937 | | | | 283 | | | | 2.74 | | |
AerCap Holdings N.V. | | | 4,580 | | | | 282 | | | | 2.73 | | |
ArcelorMittal SA | | | 15,912 | | | | 279 | | | | 2.71 | | |
Arkema SA | | | 2,643 | | | | 281 | | | | 2.72 | | |
Atlantia SpA | | | 12,422 | | | | 290 | | | | 2.81 | | |
Atos SE | | | 3,264 | | | | 272 | | | | 2.64 | | |
Banco Bilbao Vizcaya Argentaria SA | | | 52,392 | | | | 293 | | | | 2.84 | | |
Banco Santander SA | | | 69,975 | | | | 293 | | | | 2.84 | | |
Bayer AG | | | 3,588 | | | | 293 | | | | 2.84 | | |
Bayerische Motoren Werke AG | | | 1,877 | | | | 116 | | | | 1.12 | | |
BNP Paribas SA | | | 4,924 | | | | 292 | | | | 2.83 | | |
Bouygues SA | | | 6,659 | | | | 283 | | | | 2.74 | | |
Carrefour SA | | | 16,929 | | | | 284 | | | | 2.75 | | |
Casino Guichard Perrachon SA | | | 6,029 | | | | 282 | | | | 2.74 | | |
CNH Industrial N.V. | | | 26,075 | | | | 287 | | | | 2.78 | | |
The accompanying notes are an integral part of the consolidated financial statements.
18
Morgan Stanley Institutional Fund, Inc.
Annual Report — December 31, 2019
Consolidated Portfolio of Investments (cont'd)
Multi-Asset Portfolio
Security Description | | Shares | | Value
(000) | | Index Weight | |
JPM EU Value Index (cont'd) | |
Deutsche Lufthansa AG | | | 14,754 | | | $ | 272 | | | | 2.63 | % | |
Eiffage SA | | | 2,513 | | | | 288 | | | | 2.79 | | |
Electricite de France SA | | | 26,392 | | | | 294 | | | | 2.85 | | |
Enel SpA | | | 36,814 | | | | 292 | | | | 2.83 | | |
Fresenius Medical Care AG & Co. KGaA | | | 3,764 | | | | 279 | | | | 2.70 | | |
Fresenius SE & Co. KGaA | | | 4,965 | | | | 280 | | | | 2.71 | | |
Koninklijke Ahold Delhaize N.V. | | | 10,627 | | | | 266 | | | | 2.58 | | |
Leonardo SpA | | | 23,527 | | | | 276 | | | | 2.67 | | |
METRO AG | | | 17,679 | | | | 285 | | | | 2.76 | | |
Nokia Oyj | | | 78,559 | | | | 291 | | | | 2.82 | | |
OMV AG | | | 4,874 | | | | 274 | | | | 2.66 | | |
Peugeot SA | | | 11,653 | | | | 279 | | | | 2.70 | | |
Publicis Groupe SA | | | 6,269 | | | | 284 | | | | 2.75 | | |
Raiffeisen Bank International AG | | | 11,571 | | | | 291 | | | | 2.82 | | |
Repsol SA | | | 17,259 | | | | 270 | | | | 2.62 | | |
Societe Generale SA | | | 8,507 | | | | 296 | | | | 2.88 | | |
Unibail-Rodamco-Westfield | | | 1,762 | | | | 278 | | | | 2.70 | | |
Uniper SE | | | 8,517 | | | | 282 | | | | 2.73 | | |
Voestalpine AG | | | 10,278 | | | | 287 | | | | 2.78 | | |
Volkswagen AG | | | 1,415 | | | | 280 | | | | 2.71 | | |
Volkswagen AG | | | 1,419 | | | | 276 | | | | 2.67 | | |
Total | | | | $ | 10,320 | | | | 100.00 | % | |
The following table represents the equity basket holdings underlying the total return swap with JPM U.S. Momentum Index as of December 31, 2019:
Security Description | | Shares | | Value
(000) | | Index Weight | |
JPM U.S. Momentum Index | |
Advanced Micro Devices, Inc. | | | 1,404 | | | $ | 64 | | | | 0.62 | % | |
Agilysys, Inc. | | | 2,132 | | | | 54 | | | | 0.53 | | |
Air Products & Chemicals, Inc. | | | 241 | | | | 57 | | | | 0.56 | | |
Alamo Group, Inc. | | | 482 | | | | 61 | | | | 0.59 | | |
Allegiant Travel Co. | | | 328 | | | | 57 | | | | 0.56 | | |
American Woodmark Corp. | | | 539 | | | | 56 | | | | 0.55 | | |
Anika Therapeutics, Inc. | | | 975 | | | | 51 | | | | 0.50 | | |
ANSYS, Inc. | | | 220 | | | | 57 | | | | 0.56 | | |
Aptiv PLC | | | 596 | | | | 57 | | | | 0.55 | | |
Arcosa, Inc. | | | 1,415 | | | | 63 | | | | 0.62 | | |
Arrowhead Pharmaceuticals, Inc. | | | 849 | | | | 54 | | | | 0.53 | | |
Assurant, Inc. | | | 427 | | | | 56 | | | | 0.55 | | |
Atmos Energy Corp. | | | 521 | | | | 58 | | | | 0.57 | | |
Avery Dennison Corp. | | | 428 | | | | 56 | | | | 0.55 | | |
Axon Enterprise, Inc. | | | 764 | | | | 56 | | | | 0.55 | | |
Ball Corp. | | | 841 | | | | 54 | | | | 0.53 | | |
Bank of America Corp. | | | 1,681 | | | | 59 | | | | 0.58 | | |
Bank of Hawaii Corp. | | | 617 | | | | 59 | | | | 0.58 | | |
Benchmark Electronics, Inc. | | | 1,599 | | | | 55 | | | | 0.54 | | |
Boot Barn Holdings, Inc. | | | 1,352 | | | | 60 | | | | 0.59 | | |
Brixmor Property Group, Inc. | | | 2,557 | | | | 55 | | | | 0.54 | | |
Brown-Forman Corp. | | | 875 | | | | 59 | | | | 0.58 | | |
Buckle, Inc. (The) | | | 2,040 | | | | 55 | | | | 0.54 | | |
Cable One, Inc. | | | 36 | | | | 54 | | | | 0.53 | | |
Cadence Design Systems, Inc. | | | 845 | | | | 59 | | | | 0.58 | | |
Callaway Golf Co. | | | 2,652 | | | | 56 | | | | 0.55 | | |
Cardiovascular Systems, Inc. | | | 1,268 | | | | 62 | | | | 0.60 | | |
The accompanying notes are an integral part of the consolidated financial statements.
19
Morgan Stanley Institutional Fund, Inc.
Annual Report — December 31, 2019
Consolidated Portfolio of Investments (cont'd)
Multi-Asset Portfolio
Security Description | | Shares | | Value
(000) | | Index Weight | |
JPM U.S. Momentum Index (cont'd) | |
Carpenter Technology Corp. | | | 1,053 | | | $ | 52 | | | | 0.51 | % | |
Casey's General Stores, Inc. | | | 320 | | | | 51 | | | | 0.50 | | |
Catalent, Inc. | | | 1,078 | | | | 61 | | | | 0.60 | | |
Cerner Corp. | | | 786 | | | | 58 | | | | 0.57 | | |
Charter Communications, Inc. | | | 119 | | | | 58 | | | | 0.57 | | |
Chemed Corp. | | | 129 | | | | 56 | | | | 0.55 | | |
Chipotle Mexican Grill, Inc. | | | 68 | | | | 57 | | | | 0.56 | | |
Churchill Downs, Inc. | | | 429 | | | | 59 | | | | 0.58 | | |
Cincinnati Financial Corp. | | | 531 | | | | 56 | | | | 0.55 | | |
Cintas Corp. | | | 218 | | | | 59 | | | | 0.58 | | |
Cirrus Logic, Inc. | | | 772 | | | | 64 | | | | 0.62 | | |
Cogent Communications Holdings, Inc. | | | 897 | | | | 59 | | | | 0.58 | | |
Colfax Corp. | | | 1,607 | | | | 58 | | | | 0.57 | | |
Community Healthcare Trust, Inc. | | | 1,172 | | | | 50 | | | | 0.49 | | |
Comtech Telecommunications Corp. | | | 1,548 | | | | 55 | | | | 0.54 | | |
CONMED Corp. | | | 488 | | | | 55 | | | | 0.54 | | |
Copart, Inc. | | | 630 | | | | 57 | | | | 0.56 | | |
Costco Wholesale Corp. | | | 190 | | | | 56 | | | | 0.55 | | |
Cross Country Healthcare, Inc. | | | 4,392 | | | | 51 | | | | 0.50 | | |
CSG Systems International, Inc. | | | 975 | | | | 50 | | | | 0.50 | | |
Cutera, Inc. | | | 1,500 | | | | 54 | | | | 0.53 | | |
Deckers Outdoor Corp. | | | 338 | | | | 57 | | | | 0.56 | | |
Dentsply Sirona, Inc. | | | 954 | | | | 54 | | | | 0.53 | | |
Diebold Nixdorf, Inc. | | | 7,488 | | | | 79 | | | | 0.77 | | |
Digi International, Inc. | | | 3,174 | | | | 56 | | | | 0.55 | | |
Dime Community Bancshares, Inc. | | | 2,773 | | | | 58 | | | | 0.57 | | |
DMC Global, Inc. | | | 1,174 | | | | 53 | | | | 0.52 | | |
Dril-Quip, Inc. | | | 1,283 | | | | 60 | | | | 0.59 | | |
Easterly Government Properties, Inc. | | | 2,405 | | | | 57 | | | | 0.56 | | |
EastGroup Properties, Inc. | | | 412 | | | | 55 | | | | 0.54 | | |
Edwards Lifesciences Corp. | | | 229 | | | | 53 | | | | 0.52 | | |
eHealth, Inc. | | | 618 | | | | 59 | | | | 0.58 | | |
Entergy Corp. | | | 470 | | | | 56 | | | | 0.55 | | |
Equifax, Inc. | | | 403 | | | | 57 | | | | 0.55 | | |
Equinix, Inc. | | | 99 | | | | 58 | | | | 0.57 | | |
Essential Properties Realty Trust, Inc. | | | 2,132 | | | | 53 | | | | 0.52 | | |
Facebook, Inc. | | | 279 | | | | 57 | | | | 0.56 | | |
Fair Isaac Corp. | | | 154 | | | | 58 | | | | 0.57 | | |
Federal Signal Corp. | | | 1,694 | | | | 55 | | | | 0.54 | | |
First American Financial Corp. | | | 871 | | | | 51 | | | | 0.50 | | |
First BanCorp./Puerto Rico | | | 5,375 | | | | 57 | | | | 0.56 | | |
First Industrial Realty Trust, Inc. | | | 1,313 | | | | 54 | | | | 0.53 | | |
FMC Corp. | | | 568 | | | | 57 | | | | 0.56 | | |
FTI Consulting, Inc. | | | 499 | | | | 55 | | | | 0.54 | | |
Gentex Corp. | | | 1,972 | | | | 57 | | | | 0.56 | | |
Global Payments, Inc. | | | 314 | | | | 57 | | | | 0.56 | | |
Griffon Corp. | | | 2,640 | | | | 54 | | | | 0.53 | | |
Hanger, Inc. | | | 2,090 | | | | 58 | | | | 0.57 | | |
Hartford Financial Services Group, Inc. | | | 919 | | | | 56 | | | | 0.55 | | |
Herman Miller, Inc. | | | 1,180 | | | | 49 | | | | 0.48 | | |
Hibbett Sports, Inc. | | | 2,047 | | | | 57 | | | | 0.56 | | |
Hilton Worldwide Holdings, Inc. | | | 530 | | | | 59 | | | | 0.58 | | |
Hub Group, Inc. | | | 1,116 | | | | 57 | | | | 0.56 | | |
Hubbell, Inc. | | | 379 | | | | 56 | | | | 0.55 | | |
Incyte Corp. | | | 592 | | | | 52 | | | | 0.51 | | |
The accompanying notes are an integral part of the consolidated financial statements.
20
Morgan Stanley Institutional Fund, Inc.
Annual Report — December 31, 2019
Consolidated Portfolio of Investments (cont'd)
Multi-Asset Portfolio
Security Description | | Shares | | Value
(000) | | Index Weight | |
JPM U.S. Momentum Index (cont'd) | |
Independence Realty Trust, Inc. | | | 3,767 | | | $ | 53 | | | | 0.52 | % | |
Innospec, Inc. | | | 556 | | | | 58 | | | | 0.56 | | |
Installed Building Products, Inc. | | | 775 | | | | 53 | | | | 0.52 | | |
Itron, Inc. | | | 683 | | | | 57 | | | | 0.56 | | |
Jabil, Inc. | | | 1,421 | | | | 59 | | | | 0.58 | | |
John B Sanfilippo & Son, Inc. | | | 568 | | | | 52 | | | | 0.51 | | |
JPMorgan Chase & Co. | | | 418 | | | | 58 | | | | 0.57 | | |
Kansas City Southern | | | 370 | | | | 57 | | | | 0.56 | | |
KBR, Inc. | | | 1,876 | | | | 57 | | | | 0.56 | | |
Keysight Technologies, Inc. | | | 552 | | | | 57 | | | | 0.56 | | |
Kimco Realty Corp. | | | 2,626 | | | | 54 | | | | 0.53 | | |
Kinder Morgan, Inc. | | | 2,827 | | | | 60 | | | | 0.59 | | |
Kinsale Capital Group, Inc. | | | 571 | | | | 58 | | | | 0.57 | | |
Koppers Holdings, Inc. | | | 1,493 | | | | 57 | | | | 0.56 | | |
Lam Research Corp. | | | 210 | | | | 61 | | | | 0.60 | | |
LCI Industries | | | 539 | | | | 58 | | | | 0.57 | | |
Legg Mason, Inc. | | | 1,434 | | | | 52 | | | | 0.51 | | |
LHC Group, Inc. | | | 419 | | | | 58 | | | | 0.57 | | |
Lithia Motors, Inc. | | | 355 | | | | 52 | | | | 0.51 | | |
Live Nation Entertainment, Inc. | | | 793 | | | | 57 | | | | 0.56 | | |
LivePerson, Inc. | | | 1,448 | | | | 54 | | | | 0.53 | | |
Lumentum Holdings, Inc. | | | 772 | | | | 61 | | | | 0.60 | | |
Magellan Health, Inc. | | | 724 | | | | 57 | | | | 0.56 | | |
Manhattan Associates, Inc. | | | 688 | | | | 55 | | | | 0.54 | | |
MarketAxess Holdings, Inc. | | | 146 | | | | 55 | | | | 0.54 | | |
Marriott Vacations Worldwide Corp. | | | 450 | | | | 58 | | | | 0.57 | | |
Masimo Corp. | | | 358 | | | | 57 | | | | 0.55 | | |
MasTec, Inc. | | | 885 | | | | 57 | | | | 0.56 | | |
Meritage Homes Corp. | | | 830 | | | | 51 | | | | 0.50 | | |
Meta Financial Group, Inc. | | | 1,572 | | | | 57 | | | | 0.56 | | |
Moody's Corp. | | | 243 | | | | 58 | | | | 0.56 | | |
MSCI, Inc. | | | 214 | | | | 55 | | | | 0.54 | | |
NeoGenomics, Inc. | | | 2,134 | | | | 62 | | | | 0.61 | | |
Netflix, Inc. | | | 184 | | | | 59 | | | | 0.58 | | |
NextEra Energy, Inc. | | | 237 | | | | 57 | | | | 0.56 | | |
NIC, Inc. | | | 2,465 | | | | 55 | | | | 0.54 | | |
NMI Holdings, Inc. | | | 1,689 | | | | 56 | | | | 0.55 | | |
Nordson Corp. | | | 335 | | | | 55 | | | | 0.54 | | |
OFG BanCorp. | | | 2,642 | | | | 62 | | | | 0.61 | | |
ONEOK, Inc. | | | 784 | | | | 59 | | | | 0.58 | | |
Opus Bank | | | 2,218 | | | | 57 | | | | 0.56 | | |
Par Pacific Holdings, Inc. | | | 2,290 | | | | 53 | | | | 0.52 | | |
Perdoceo Education Corp. | | | 3,360 | | | | 62 | | | | 0.61 | | |
Perficient, Inc. | | | 1,321 | | | | 61 | | | | 0.60 | | |
Phillips 66 | | | 494 | | | | 55 | | | | 0.54 | | |
Pilgrim's Pride Corp. | | | 1,723 | | | | 56 | | | | 0.55 | | |
PNC Financial Services Group, Inc. (The) | | | 366 | | | | 58 | | | | 0.57 | | |
Powell Industries, Inc. | | | 1,109 | | | | 54 | | | | 0.53 | | |
Procter & Gamble Co. (The) | | | 446 | | | | 56 | | | | 0.55 | | |
Prologis, Inc. | | | 609 | | | | 54 | | | | 0.53 | | |
RadNet, Inc. | | | 2,837 | | | | 58 | | | | 0.56 | | |
Reliance Steel & Aluminum Co. | | | 469 | | | | 56 | | | | 0.55 | | |
RenaissanceRe Holdings Ltd. | | | 296 | | | | 58 | | | | 0.57 | | |
Rent-A-Center, Inc. | | | 2,138 | | | | 62 | | | | 0.60 | | |
Repligen Corp. | | | 629 | | | | 58 | | | | 0.57 | | |
The accompanying notes are an integral part of the consolidated financial statements.
21
Morgan Stanley Institutional Fund, Inc.
Annual Report — December 31, 2019
Consolidated Portfolio of Investments (cont'd)
Multi-Asset Portfolio
Security Description | | Shares | | Value
(000) | | Index Weight | |
JPM U.S. Momentum Index (cont'd) | |
ResMed, Inc. | | | 370 | | | $ | 57 | | | | 0.56 | % | |
REX American Resources Corp. | | | 637 | | | | 52 | | | | 0.51 | | |
RH | | | 239 | | | | 51 | | | | 0.50 | | |
Royal Gold, Inc. | | | 472 | | | | 58 | | | | 0.57 | | |
S&P Global, Inc. | | | 205 | | | | 56 | | | | 0.55 | | |
Saia, Inc. | | | 626 | | | | 58 | | | | 0.57 | | |
Sanderson Farms, Inc. | | | 332 | | | | 59 | | | | 0.57 | | |
SBA Communications Corp. | | | 236 | | | | 57 | | | | 0.56 | | |
Schweitzer-Mauduit International, Inc. | | | 1,252 | | | | 53 | | | | 0.52 | | |
Scientific Games Corp. | | | 2,084 | | | | 56 | | | | 0.55 | | |
Scotts Miracle-Gro Co. (The) | | | 553 | | | | 59 | | | | 0.58 | | |
SEACOR Holdings, Inc. | | | 1,338 | | | | 58 | | | | 0.57 | | |
Sempra Energy | | | 377 | | | | 57 | | | | 0.56 | | |
Sherwin-Williams Co. (The) | | | 97 | | | | 57 | | | | 0.56 | | |
Skechers U.S.A., Inc. | | | 1,376 | | | | 59 | | | | 0.58 | | |
SolarEdge Technologies, Inc. | | | 671 | | | | 64 | | | | 0.62 | | |
Southern Co. (The) | | | 886 | | | | 56 | | | | 0.55 | | |
Spirit Realty Capital, Inc. | | | 1,058 | | | | 52 | | | | 0.51 | | |
SPX Corp. | | | 1,147 | | | | 58 | | | | 0.57 | | |
Steven Madden Ltd. | | | 1,316 | | | | 57 | | | | 0.55 | | |
Synchrony Financial | | | 1,484 | | | | 53 | | | | 0.52 | | |
Talos Energy, Inc. | | | 2,318 | | | | 70 | | | | 0.68 | | |
Target Corp. | | | 446 | | | | 57 | | | | 0.56 | | |
Teradyne, Inc. | | | 888 | | | | 61 | | | | 0.59 | | |
Tetra Tech, Inc. | | | 647 | | | | 56 | | | | 0.55 | | |
TopBuild Corp. | | | 504 | | | | 52 | | | | 0.51 | | |
TransDigm Group, Inc. | | | 98 | | | | 55 | | | | 0.54 | | |
Triumph Group, Inc. | | | 1,976 | | | | 50 | | | | 0.49 | | |
TTEC Holdings, Inc. | | | 1,300 | | | | 51 | | | | 0.51 | | |
Tyson Foods, Inc. | | | 622 | | | | 57 | | | | 0.56 | | |
Ultra Clean Holdings, Inc. | | | 2,512 | | | | 59 | | | | 0.58 | | |
United Community Banks, Inc. | | | 1,797 | | | | 55 | | | | 0.54 | | |
Universal Display Corp. | | | 292 | | | | 60 | | | | 0.59 | | |
Universal Forest Products, Inc. | | | 1,140 | | | | 54 | | | | 0.53 | | |
Universal Health Realty Income Trust | | | 457 | | | | 54 | | | | 0.53 | | |
US BanCorp. | | | 933 | | | | 55 | | | | 0.54 | | |
Valero Energy Corp. | | | 598 | | | | 56 | | | | 0.55 | | |
Walt Disney Co. (The) | | | 377 | | | | 55 | | | | 0.54 | | |
WEC Energy Group, Inc. | | | 622 | | | | 57 | | | | 0.56 | | |
Woodward, Inc. | | | 465 | | | | 55 | | | | 0.54 | | |
World Fuel Services Corp. | | | 1,288 | | | | 56 | | | | 0.55 | | |
WR Berkley Corp. | | | 798 | | | | 55 | | | | 0.54 | | |
Zoetis, Inc. | | | 463 | | | | 61 | | | | 0.60 | | |
Total | | | | $ | 10,195 | | | | 100.00 | % | |
The following table represents the equity basket holdings underlying the total return swap with JPM U.S. Value Index as of December 31, 2019:
Security Description | | Shares | | Value
(000) | | Index Weight | |
JPM U.S. Value Index | |
AAR Corp. | | | 1,087 | | | $ | 49 | | | | 0.47 | % | |
AdvanSix, Inc. | | | 1,300 | | | | 26 | | | | 0.25 | | |
Allegheny Technologies, Inc. | | | 2,346 | | | | 48 | | | | 0.46 | | |
Alliance Data Systems Corp. | | | 520 | | | | 58 | | | | 0.56 | | |
AMC Networks, Inc. | | | 1,422 | | | | 56 | | | | 0.53 | | |
The accompanying notes are an integral part of the consolidated financial statements.
22
Morgan Stanley Institutional Fund, Inc.
Annual Report — December 31, 2019
Consolidated Portfolio of Investments (cont'd)
Multi-Asset Portfolio
Security Description | | Shares | | Value
(000) | | Index Weight | |
JPM U.S. Value Index (cont'd) | |
Andersons, Inc. (The) | | | 1,944 | | | $ | 49 | | | | 0.47 | % | |
AngioDynamics, Inc. | | | 2,280 | | | | 36 | | | | 0.35 | | |
ArcBest Corp. | | | 1,134 | | | | 31 | | | | 0.30 | | |
Archer-Daniels-Midland Co. | | | 1,248 | | | | 58 | | | | 0.55 | | |
Archrock, Inc. | | | 6,337 | | | | 64 | | | | 0.61 | | |
Associated Banc-Corp. | | | 2,514 | | | | 55 | | | | 0.53 | | |
AT&T, Inc. | | | 1,410 | | | | 55 | | | | 0.52 | | |
Atlas Air Worldwide Holdings, Inc. | | | 2,185 | | | | 60 | | | | 0.57 | | |
AutoNation, Inc. | | | 1,064 | | | | 52 | | | | 0.49 | | |
Avis Budget Group, Inc. | | | 1,808 | | | | 58 | | | | 0.55 | | |
Axos Financial, Inc. | | | 1,870 | | | | 57 | | | | 0.54 | | |
AZZ, Inc. | | | 936 | | | | 43 | | | | 0.41 | | |
B&G Foods, Inc. | | | 3,204 | | | | 57 | | | | 0.55 | | |
Baker Hughes Co. | | | 2,433 | | | | 62 | | | | 0.59 | | |
Bank OZK | | | 1,775 | | | | 54 | | | | 0.52 | | |
Biogen, Inc. | | | 180 | | | | 53 | | | | 0.51 | | |
Brighthouse Financial, Inc. | | | 1,397 | | | | 55 | | | | 0.52 | | |
Brinker International, Inc. | | | 1,262 | | | | 53 | | | | 0.50 | | |
Cadence BanCorp. | | | 3,289 | | | | 60 | | | | 0.57 | | |
Carnival Corp. | | | 1,219 | | | | 62 | | | | 0.59 | | |
Cedar Realty Trust, Inc. | | | 2,060 | | | | 6 | | | | 0.06 | | |
CenterPoint Energy, Inc. | | | 2,173 | | | | 59 | | | | 0.56 | | |
Central Garden & Pet Co. | | | 2,058 | | | | 60 | | | | 0.57 | | |
Century Communities, Inc. | | | 1,904 | | | | 52 | | | | 0.50 | | |
Charles River Laboratories International | | | 372 | | | | 57 | | | | 0.54 | | |
Chemours Co. (The) | | | 3,577 | | | | 65 | | | | 0.62 | | |
Cigna Corp. | | | 275 | | | | 56 | | | | 0.54 | | |
Citigroup, Inc. | | | 721 | | | | 58 | | | | 0.55 | | |
Citizens Financial Group, Inc. | | | 1,397 | | | | 57 | | | | 0.54 | | |
CNO Financial Group, Inc. | | | 3,075 | | | | 56 | | | | 0.53 | | |
Comerica, Inc. | | | 763 | | | | 55 | | | | 0.52 | | |
Commercial Metals Co. | | | 2,481 | | | | 55 | | | | 0.53 | | |
Computer Programs & Systems, Inc. | | | 966 | | | | 26 | | | | 0.24 | | |
Conn's, Inc. | | | 2,804 | | | | 35 | | | | 0.33 | | |
CONSOL Energy, Inc. | | | 3,004 | | | | 44 | | | | 0.41 | | |
Cooper-Standard Holdings, Inc. | | | 1,934 | | | | 64 | | | | 0.61 | | |
CoreCivic, Inc. | | | 3,625 | | | | 63 | | | | 0.60 | | |
Customers BanCorp., Inc. | | | 1,243 | | | | 30 | | | | 0.28 | | |
CVS Health Corp. | | | 723 | | | | 54 | | | | 0.51 | | |
Dana, Inc. | | | 3,187 | | | | 58 | | | | 0.55 | | |
Denbury Resources, Inc. | | | 53,333 | | | | 75 | | | | 0.71 | | |
Diodes, Inc. | | | 1,148 | | | | 65 | | | | 0.62 | | |
Discovery, Inc. | | | 1,803 | | | | 55 | | | | 0.52 | | |
Diversified Healthcare Trust | | | 7,135 | | | | 60 | | | | 0.57 | | |
Domtar Corp. | | | 1,422 | | | | 54 | | | | 0.52 | | |
Donnelley Financial Solutions, Inc. | | | 1,639 | | | | 17 | | | | 0.16 | | |
Duke Energy Corp. | | | 603 | | | | 55 | | | | 0.52 | | |
DXC Technology Co. | | | 1,484 | | | | 56 | | | | 0.53 | | |
Eastman Chemical Co. | | | 712 | | | | 56 | | | | 0.54 | | |
Ebix, Inc. | | | 1,611 | | | | 54 | | | | 0.51 | | |
Encore Capital Group, Inc. | | | 1,483 | | | | 52 | | | | 0.50 | | |
Exelixis, Inc. | | | 3,141 | | | | 55 | | | | 0.53 | | |
Exelon Corp. | | | 1,201 | | | | 55 | | | | 0.52 | | |
Expedia Group, Inc. | | | 510 | | | | 55 | | | | 0.52 | | |
Fifth Third BanCorp., Inc. | | | 1,803 | | | | 55 | | | | 0.53 | | |
The accompanying notes are an integral part of the consolidated financial statements.
23
Morgan Stanley Institutional Fund, Inc.
Annual Report — December 31, 2019
Consolidated Portfolio of Investments (cont'd)
Multi-Asset Portfolio
Security Description | | Shares | | Value
(000) | | Index Weight | |
JPM U.S. Value Index (cont'd) | |
FNB Corp. | | | 4,444 | | | $ | 56 | | | | 0.54 | % | |
Foot Locker, Inc. | | | 1,352 | | | | 53 | | | | 0.50 | | |
FormFactor, Inc. | | | 2,364 | | | | 61 | | | | 0.58 | | |
Fresh Del Monte Produce, Inc. | | | 1,318 | | | | 46 | | | | 0.44 | | |
Gap, Inc. (The) | | | 3,305 | | | | 58 | | | | 0.56 | | |
Genesco, Inc. | | | 1,459 | | | | 70 | | | | 0.66 | | |
Genworth Financial, Inc. | | | 13,706 | | | | 60 | | | | 0.57 | | |
GEO Group, Inc. (The) | | | 4,047 | | | | 67 | | | | 0.64 | | |
G-III Apparel Group Ltd. | | | 1,888 | | | | 63 | | | | 0.60 | | |
GMS, Inc. | | | 1,855 | | | | 50 | | | | 0.48 | | |
Goldman Sachs Group, Inc. (The) | | | 248 | | | | 57 | | | | 0.54 | | |
Goodyear Tire & Rubber Co. (The) | | | 3,390 | | | | 53 | | | | 0.50 | | |
Graham Holdings Co. | | | 86 | | | | 55 | | | | 0.52 | | |
Greenbrier Cos, Inc. (The) | | | 1,945 | | | | 63 | | | | 0.60 | | |
Greif, Inc. | | | 1,249 | | | | 55 | | | | 0.53 | | |
Group 1 Automotive, Inc. | | | 539 | | | | 54 | | | | 0.51 | | |
Gulfport Energy Corp. | | | 21,720 | | | | 66 | | | | 0.63 | | |
Halliburton Co. | | | 2,515 | | | | 62 | | | | 0.59 | | |
Hancock Whitney Corp. | | | 1,316 | | | | 58 | | | | 0.55 | | |
Hawaiian Holdings, Inc. | | | 1,829 | | | | 54 | | | | 0.51 | | |
Hersha Hospitality Trust | | | 3,402 | | | | 49 | | | | 0.47 | | |
HNI Corp. | | | 992 | | | | 37 | | | | 0.35 | | |
Host Hotels & Resorts, Inc. | | | 3,040 | | | | 56 | | | | 0.54 | | |
Ingredion, Inc. | | | 636 | | | | 59 | | | | 0.56 | | |
Integer Holdings Corp. | | | 699 | | | | 56 | | | | 0.53 | | |
Intel Corp. | | | 961 | | | | 57 | | | | 0.55 | | |
Interface, Inc. | | | 1,886 | | | | 31 | | | | 0.30 | | |
International Business Machines Corp. | | | 408 | | | | 55 | | | | 0.52 | | |
INTL. FCStone, Inc. | | | 393 | | | | 19 | | | | 0.18 | | |
Invacare Corp. | | | 4,092 | | | | 37 | | | | 0.35 | | |
iStar, Inc. | | | 4,065 | | | | 59 | | | | 0.56 | | |
j2 Global, Inc. | | | 555 | | | | 52 | | | | 0.49 | | |
Juniper Networks, Inc. | | | 2,240 | | | | 55 | | | | 0.52 | | |
KAR Auction Services, Inc. | | | 2,566 | | | | 56 | | | | 0.53 | | |
Kelly Services, Inc. | | | 1,423 | | | | 32 | | | | 0.31 | | |
Kraton Corp. | | | 1,533 | | | | 39 | | | | 0.37 | | |
Kroger Co. (The) | | | 2,010 | | | | 58 | | | | 0.55 | | |
Lannett Co, Inc. | | | 6,345 | | | | 56 | | | | 0.53 | | |
Lantheus Holdings, Inc. | | | 2,626 | | | | 54 | | | | 0.51 | | |
Laredo Petroleum, Inc. | | | 23,625 | | | | 68 | | | | 0.64 | | |
Lincoln National Corp. | | | 949 | | | | 56 | | | | 0.53 | | |
LogMeIn, Inc. | | | 731 | | | | 63 | | | | 0.60 | | |
Lydall, Inc. | | | 1,159 | | | | 24 | | | | 0.23 | | |
M/I Homes, Inc. | | | 1,193 | | | | 47 | | | | 0.45 | | |
Mack-Cali Realty Corp. | | | 2,503 | | | | 58 | | | | 0.55 | | |
Macy's, Inc. | | | 3,565 | | | | 61 | | | | 0.58 | | |
Marcus Corp. (The) | | | 1,705 | | | | 54 | | | | 0.52 | | |
MarineMax, Inc. | | | 1,421 | | | | 24 | | | | 0.23 | | |
Matrix Service Co. | | | 1,512 | | | | 35 | | | | 0.33 | | |
MDU Resources Group, Inc. | | | 1,838 | | | | 55 | | | | 0.52 | | |
Meridian Bioscience, Inc. | | | 3,056 | | | | 30 | | | | 0.28 | | |
Merit Medical Systems, Inc. | | | 1,893 | | | | 59 | | | | 0.56 | | |
MetLife, Inc. | | | 1,101 | | | | 56 | | | | 0.53 | | |
Micron Technology,, Inc. | | | 1,155 | | | | 62 | | | | 0.59 | | |
Minerals Technologies, Inc. | | | 994 | | | | 57 | | | | 0.55 | | |
The accompanying notes are an integral part of the consolidated financial statements.
24
Morgan Stanley Institutional Fund, Inc.
Annual Report — December 31, 2019
Consolidated Portfolio of Investments (cont'd)
Multi-Asset Portfolio
Security Description | | Shares | | Value
(000) | | Index Weight | |
JPM U.S. Value Index (cont'd) | |
Molina Healthcare, Inc. | | | 407 | | | $ | 55 | | | | 0.52 | % | |
Molson Coors Beverage Co. | | | 1,070 | | | | 58 | | | | 0.55 | | |
Moog, Inc. | | | 622 | | | | 53 | | | | 0.50 | | |
Movado Group, Inc. | | | 2,829 | | | | 62 | | | | 0.59 | | |
Mylan N.V. | | | 2,850 | | | | 57 | | | | 0.55 | | |
MYR Group, Inc. | | | 532 | | | | 17 | | | | 0.16 | | |
National Fuel Gas Co. | | | 1,199 | | | | 56 | | | | 0.53 | | |
Navient Corp. | | | 3,884 | | | | 53 | | | | 0.51 | | |
NETGEAR, Inc. | | | 2,209 | | | | 54 | | | | 0.52 | | |
Norwegian Cruise Line Holdings Ltd. | | | 993 | | | | 58 | | | | 0.55 | | |
Nu Skin Enterprises, Inc. | | | 1,429 | | | | 59 | | | | 0.56 | | |
Office Properties, Inc.ome Trust | | | 1,425 | | | | 46 | | | | 0.44 | | |
Oracle Corp. | | | 985 | | | | 52 | | | | 0.50 | | |
OraSure Technologies, Inc. | | | 4,553 | | | | 37 | | | | 0.35 | | |
Oshkosh Corp. | | | 601 | | | | 57 | | | | 0.54 | | |
Owens & Minor, Inc. | | | 7,619 | | | | 39 | | | | 0.37 | | |
Owens Corning | | | 815 | | | | 53 | | | | 0.50 | | |
PACCAR, Inc. | | | 672 | | | | 53 | | | | 0.51 | | |
PacWest BanCorp. | | | 1,449 | | | | 55 | | | | 0.53 | | |
Park Hotels & Resorts, Inc. | | | 2,275 | | | | 59 | | | | 0.56 | | |
Patrick Industries, Inc. | | | 1,054 | | | | 55 | | | | 0.53 | | |
Patterson Cos, Inc. | | | 2,332 | | | | 48 | | | | 0.45 | | |
Penn National Gaming, Inc. | | | 2,422 | | | | 62 | | | | 0.59 | | |
Penn Virginia Corp. | | | 1,444 | | | | 44 | | | | 0.42 | | |
PennyMac Mortgage Investment Trust | | | 2,369 | | | | 53 | | | | 0.50 | | |
Perrigo Co., PLC | | | 1,040 | | | | 54 | | | | 0.51 | | |
Perspecta, Inc. | | | 1,988 | | | | 53 | | | | 0.50 | | |
Photronics, Inc. | | | 4,090 | | | | 64 | | | | 0.61 | | |
Pitney Bowes, Inc. | | | 11,106 | | | | 45 | | | | 0.43 | | |
Plantronics, Inc. | | | 2,282 | | | | 62 | | | | 0.59 | | |
Polaris, Inc. | | | 571 | | | | 58 | | | | 0.55 | | |
PPL Corp. | | | 1,570 | | | | 56 | | | | 0.54 | | |
Principal Financial Group, Inc. | | | 1,020 | | | | 56 | | | | 0.53 | | |
ProPetro Holding Corp. | | | 6,107 | | | | 69 | | | | 0.65 | | |
PVH Corp. | | | 535 | | | | 56 | | | | 0.53 | | |
Quanta Services, Inc. | | | 1,333 | | | | 54 | | | | 0.52 | | |
QuinStreet, Inc. | | | 3,455 | | | | 53 | | | | 0.50 | | |
Regal Beloit Corp. | | | 657 | | | | 56 | | | | 0.54 | | |
Resideo Technologies, Inc. | | | 4,965 | | | | 59 | | | | 0.56 | | |
Ring Energy, Inc. | | | 5,870 | | | | 15 | | | | 0.15 | | |
Royal Caribbean Cruises Ltd. | | | 445 | | | | 59 | | | | 0.57 | | |
Sanmina Corp. | | | 1,699 | | | | 58 | | | | 0.55 | | |
ScanSource, Inc. | | | 1,062 | | | | 39 | | | | 0.37 | | |
Service Properties Trust | | | 2,312 | | | | 56 | | | | 0.54 | | |
SMART Global Holdings, Inc. | | | 1,597 | | | | 61 | | | | 0.58 | | |
Sonic Automotive, Inc. | | | 1,727 | | | | 54 | | | | 0.51 | | |
Southwestern Energy Co. | | | 27,483 | | | | 67 | | | | 0.63 | | |
Sterling BanCorp. | | | 2,637 | | | | 56 | | | | 0.53 | | |
Summit Hotel Properties, Inc. | | | 4,459 | | | | 55 | | | | 0.52 | | |
Sykes Enterprises, Inc. | | | 1,104 | | | | 41 | | | | 0.39 | | |
Syneos Health, Inc. | | | 994 | | | | 59 | | | | 0.56 | | |
SYNNEX Corp. | | | 431 | | | | 55 | | | | 0.53 | | |
Tanger Factory Outlet Centers, Inc. | | | 3,502 | | | | 52 | | | | 0.49 | | |
Terex Corp. | | | 1,905 | | | | 57 | | | | 0.54 | | |
Texas Capital Bancshares, Inc. | | | 943 | | | | 54 | | | | 0.51 | | |
The accompanying notes are an integral part of the consolidated financial statements.
25
Morgan Stanley Institutional Fund, Inc.
Annual Report — December 31, 2019
Consolidated Portfolio of Investments (cont'd)
Multi-Asset Portfolio
Security Description | | Shares | | Value
(000) | | Index Weight | |
JPM U.S. Value Index (cont'd) | |
Textron, Inc. | | | 1,198 | | | $ | 53 | | | | 0.51 | % | |
Timken Co. (The) | | | 1,023 | | | | 58 | | | | 0.55 | | |
Tivity Health, Inc. | | | 2,413 | | | | 49 | | | | 0.47 | | |
TiVo Corp. | | | 6,569 | | | | 56 | | | | 0.53 | | |
Toll Brothers, Inc. | | | 1,317 | | | | 52 | | | | 0.49 | | |
Tredegar Corp. | | | 627 | | | | 14 | | | | 0.13 | | |
TRI Pointe Group, Inc. | | | 3,475 | | | | 54 | | | | 0.52 | | |
Trinity Industries, Inc. | | | 2,620 | | | | 58 | | | | 0.55 | | |
Trinseo SA | | | 1,509 | | | | 56 | | | | 0.53 | | |
TrueBlue, Inc. | | | 1,724 | | | | 41 | | | | 0.39 | | |
TTM Technologies, Inc. | | | 3,978 | | | | 60 | | | | 0.57 | | |
Unisys Corp. | | | 4,965 | | | | 59 | | | | 0.56 | | |
United Rentals, Inc. | | | 352 | | | | 59 | | | | 0.56 | | |
United Therapeutics Corp. | | | 597 | | | | 53 | | | | 0.50 | | |
Universal Insurance Holdings, Inc. | | | 1,911 | | | | 54 | | | | 0.51 | | |
Unum Group | | | 1,865 | | | | 54 | | | | 0.52 | | |
Vanda Pharmaceuticals, Inc. | | | 3,148 | | | | 52 | | | | 0.49 | | |
Varex Imaging Corp. | | | 1,201 | | | | 36 | | | | 0.34 | | |
ViacomCBS, Inc. | | | 1,318 | | | | 55 | | | | 0.53 | | |
Virtus Investment Partners, Inc. | | | 353 | | | | 43 | | | | 0.41 | | |
Wabash National Corp. | | | 3,473 | | | | 51 | | | | 0.49 | | |
Waddell & Reed Financial, Inc. | | | 3,325 | | | | 56 | | | | 0.53 | | |
Walker & Dunlop, Inc. | | | 830 | | | | 54 | | | | 0.51 | | |
Warrior Met Coal, Inc. | | | 2,628 | | | | 56 | | | | 0.53 | | |
Washington Prime Group, Inc. | | | 15,004 | | | | 55 | | | | 0.52 | | |
WestRock Co. | | | 1,347 | | | | 58 | | | | 0.55 | | |
Wyndham Destinations, Inc. | | | 1,112 | | | | 57 | | | | 0.55 | | |
Xenia Hotels & Resorts, Inc. | | | 2,582 | | | | 56 | | | | 0.53 | | |
Xerox Holdings Corp. | | | 1,424 | | | | 53 | | | | 0.50 | | |
Xperi Corp. | | | 2,317 | | | | 43 | | | | 0.41 | | |
Total | | | | $ | 10,510 | | | | 100.00 | % | |
The following table represents the equity basket holdings underlying the total return swap with JPM U.S. Growth Index as of December 31, 2019:
Security Description | | Shares | | Value
(000) | | Index Weight | |
JPM U.S. Growth Index | |
3D Systems Corp. | | | 6,029 | | | $ | 53 | | | | 0.51 | % | |
8x8, Inc. | | | 2,794 | | | | 51 | | | | 0.49 | | |
AAON, Inc. | | | 1,033 | | | | 51 | | | | 0.49 | | |
Actuant Corp. | | | 2,104 | | | | 55 | | | | 0.53 | | |
Addus HomeCare Corp. | | | 541 | | | | 53 | | | | 0.51 | | |
Advanced Micro Devices, Inc. | | | 1,281 | | | | 59 | | | | 0.57 | | |
Air Products & Chemicals, Inc. | | | 220 | | | | 52 | | | | 0.50 | | |
Alexandria Real Estate Equities, Inc. | | | 315 | | | | 51 | | | | 0.49 | | |
Align Technology, Inc. | | | 185 | | | | 52 | | | | 0.50 | | |
Allegion PLC | | | 415 | | | | 52 | | | | 0.50 | | |
Amedisys, Inc. | | | 307 | | | | 51 | | | | 0.49 | | |
American Tower Corp. | | | 238 | | | | 55 | | | | 0.53 | | |
Amphenol Corp. | | | 493 | | | | 53 | | | | 0.51 | | |
Aon PLC | | | 249 | | | | 52 | | | | 0.50 | | |
Apache Corp. | | | 2,732 | | | | 70 | | | | 0.66 | | |
AptarGroup, Inc. | | | 453 | | | | 52 | | | | 0.51 | | |
Aptiv PLC | | | 544 | | | | 52 | | | | 0.50 | | |
Autodesk, Inc. | | | 287 | | | | 53 | | | | 0.51 | | |
The accompanying notes are an integral part of the consolidated financial statements.
26
Morgan Stanley Institutional Fund, Inc.
Annual Report — December 31, 2019
Consolidated Portfolio of Investments (cont'd)
Multi-Asset Portfolio
Security Description | | Shares | | Value
(000) | | Index Weight | |
JPM U.S. Growth Index (cont'd) | |
Axon Enterprise, Inc. | | | 697 | | | $ | 51 | | | | 0.49 | % | |
Badger Meter, Inc. | | | 831 | | | | 54 | | | | 0.52 | | |
Balchem Corp. | | | 501 | | | | 51 | | | | 0.49 | | |
Ball Corp. | | | 767 | | | | 50 | | | | 0.48 | | |
Banc of California, Inc. | | | 3,190 | | | | 55 | | | | 0.53 | | |
Bank of Hawaii Corp. | | | 563 | | | | 54 | | | | 0.52 | | |
Brown & Brown, Inc. | | | 1,331 | | | | 53 | | | | 0.51 | | |
Brown-Forman Corp. | | | 798 | | | | 54 | | | | 0.52 | | |
Cable One, Inc. | | | 33 | | | | 49 | | | | 0.47 | | |
Camden Property Trust | | | 459 | | | | 49 | | | | 0.47 | | |
Capstead Mortgage Corp. | | | 6,499 | | | | 51 | | | | 0.50 | | |
Cardiovascular Systems, Inc. | | | 1,157 | | | | 56 | | | | 0.54 | | |
Care.com, Inc. | | | 4,071 | | | | 61 | | | | 0.58 | | |
Cavco Industries, Inc. | | | 249 | | | | 49 | | | | 0.47 | | |
Century Aluminum Co. | | | 7,410 | | | | 56 | | | | 0.54 | | |
CEVA, Inc. | | | 1,516 | | | | 41 | | | | 0.39 | | |
Chefs' Warehouse, Inc. (The) | | | 1,408 | | | | 54 | | | | 0.52 | | |
Chemed Corp. | | | 117 | | | | 52 | | | | 0.50 | | |
Chipotle Mexican Grill, Inc. | | | 62 | | | | 52 | | | | 0.50 | | |
Churchill Downs, Inc. | | | 391 | | | | 54 | | | | 0.52 | | |
Cintas Corp. | | | 199 | | | | 54 | | | | 0.52 | | |
City Holding Co. | | | 642 | | | | 53 | | | | 0.51 | | |
Cogent Communications Holdings, Inc. | | | 819 | | | | 54 | | | | 0.52 | | |
Cognex Corp. | | | 1,018 | | | | 57 | | | | 0.55 | | |
Columbia Banking System, Inc. | | | 1,316 | | | | 54 | | | | 0.52 | | |
Commerce Bancshares, Inc. | | | 792 | | | | 54 | | | | 0.52 | | |
Community Bank System, Inc. | | | 753 | | | | 53 | | | | 0.52 | | |
Community Healthcare Trust, Inc. | | | 1,069 | | | | 46 | | | | 0.44 | | |
Copart, Inc. | | | 575 | | | | 52 | | | | 0.50 | | |
Core Laboratories N.V. | | | 1,148 | | | | 43 | | | | 0.42 | | |
CoreSite Realty Corp. | | | 449 | | | | 50 | | | | 0.49 | | |
Costco Wholesale Corp. | | | 173 | | | | 51 | | | | 0.49 | | |
Crocs, Inc. | | | 1,385 | | | | 58 | | | | 0.56 | | |
Crown Castle International Corp. | | | 376 | | | | 53 | | | | 0.52 | | |
Cutera, Inc. | | | 1,369 | | | | 49 | | | | 0.47 | | |
CVB Financial Corp. | | | 2,402 | | | | 52 | | | | 0.50 | | |
CyrusOne, Inc. | | | 793 | | | | 52 | | | | 0.50 | | |
Cytokinetics, Inc. | | | 5,169 | | | | 55 | | | | 0.53 | | |
Dominion Energy, Inc. | | | 625 | | | | 52 | | | | 0.50 | | |
Domino's Pizza, Inc. | | | 177 | | | | 52 | | | | 0.50 | | |
Dorman Products, Inc. | | | 684 | | | | 52 | | | | 0.50 | | |
Dril-Quip, Inc. | | | 1,170 | | | | 55 | | | | 0.53 | | |
EastGroup Properties, Inc. | | | 376 | | | | 50 | | | | 0.48 | | |
Ecolab, Inc. | | | 274 | | | | 53 | | | | 0.51 | | |
Edwards Lifesciences Corp. | | | 209 | | | | 49 | | | | 0.47 | | |
eHealth, Inc. | | | 564 | | | | 54 | | | | 0.52 | | |
Equinix, Inc. | | | 91 | | | | 53 | | | | 0.51 | | |
Equity Residential | | | 600 | | | | 49 | | | | 0.47 | | |
Estee Lauder Cos, Inc. (The) | | | 259 | | | | 53 | | | | 0.52 | | |
Etsy, Inc. | | | 1,236 | | | | 55 | | | | 0.53 | | |
Expeditors International of Washington I | | | 694 | | | | 54 | | | | 0.52 | | |
Exponent, Inc. | | | 782 | | | | 54 | | | | 0.52 | | |
FactSet Research Systems, Inc. | | | 192 | | | | 52 | | | | 0.50 | | |
FARO Technologies, Inc. | | | 1,026 | | | | 52 | | | | 0.50 | | |
Fastenal Co. | | | 1,439 | | | | 53 | | | | 0.51 | | |
The accompanying notes are an integral part of the consolidated financial statements.
27
Morgan Stanley Institutional Fund, Inc.
Annual Report — December 31, 2019
Consolidated Portfolio of Investments (cont'd)
Multi-Asset Portfolio
Security Description | | Shares | | Value
(000) | | Index Weight | |
JPM U.S. Growth Index (cont'd) | |
First Financial Bankshares, Inc. | | | 1,472 | | | $ | 52 | | | | 0.50 | % | |
First Republic Bank | | | 457 | | | | 54 | | | | 0.52 | | |
FirstCash, Inc. | | | 629 | | | | 51 | | | | 0.49 | | |
Five Below, Inc. | | | 410 | | | | 52 | | | | 0.51 | | |
Fluor Corp. | | | 3,116 | | | | 59 | | | | 0.57 | | |
Fox Factory Holding Corp. | | | 782 | | | | 54 | | | | 0.52 | | |
Garmin Ltd. | | | 531 | | | | 52 | | | | 0.50 | | |
Gartner, Inc. | | | 320 | | | | 49 | | | | 0.48 | | |
Glacier BanCorp., Inc. | | | 1,176 | | | | 54 | | | | 0.52 | | |
Graco, Inc. | | | 1,049 | | | | 55 | | | | 0.53 | | |
Green Plains, Inc. | | | 3,613 | | | | 56 | | | | 0.54 | | |
Harmonic, Inc. | | | 6,337 | | | | 49 | | | | 0.48 | | |
HealthEquity, Inc. | | | 774 | | | | 57 | | | | 0.55 | | |
Hershey Co. (The) | | | 338 | | | | 50 | | | | 0.48 | | |
Hess Corp. | | | 833 | | | | 56 | | | | 0.54 | | |
Home Depot, Inc. (The) | | | 238 | | | | 52 | | | | 0.50 | | |
IDACorp., Inc. | | | 485 | | | | 52 | | | | 0.50 | | |
IDEX Corp. | | | 317 | | | | 54 | | | | 0.53 | | |
IDEXX Laboratories, Inc. | | | 202 | | | | 53 | | | | 0.51 | | |
Illinois Tool Works, Inc. | | | 294 | | | | 53 | | | | 0.51 | | |
Independent Bank Corp. | | | 612 | | | | 51 | | | | 0.49 | | |
Installed Building Products, Inc. | | | 707 | | | | 49 | | | | 0.47 | | |
InterDigital, Inc. | | | 912 | | | | 50 | | | | 0.48 | | |
International Flavors & Fragrances, Inc. | | | 358 | | | | 46 | | | | 0.45 | | |
Intuitive Surgical, Inc. | | | 87 | | | | 52 | | | | 0.50 | | |
J&J Snack Foods Corp. | | | 270 | | | | 50 | | | | 0.48 | | |
Jacobs Engineering Group, Inc. | | | 593 | | | | 53 | | | | 0.51 | | |
Kansas City Southern | | | 338 | | | | 52 | | | | 0.50 | | |
Keysight Technologies, Inc. | | | 504 | | | | 52 | | | | 0.50 | | |
Kinsale Capital Group, Inc. | | | 521 | | | | 53 | | | | 0.51 | | |
Lancaster Colony Corp. | | | 321 | | | | 51 | | | | 0.50 | | |
LendingTree, Inc. | | | 143 | | | | 43 | | | | 0.42 | | |
Linde PLC | | | 249 | | | | 53 | | | | 0.51 | | |
Lindsay Corp. | | | 560 | | | | 54 | | | | 0.52 | | |
LivePerson, Inc. | | | 1,321 | | | | 49 | | | | 0.47 | | |
LiveRamp Holdings, Inc. | | | 1,036 | | | | 50 | | | | 0.48 | | |
Louisiana-Pacific Corp. | | | 1,736 | | | | 52 | | | | 0.50 | | |
Lowe's Cos, Inc. | | | 439 | | | | 53 | | | | 0.51 | | |
Manhattan Associates, Inc. | | | 627 | | | | 50 | | | | 0.48 | | |
MarketAxess Holdings, Inc. | | | 133 | | | | 50 | | | | 0.49 | | |
Marsh & McLennan Cos., Inc. | | | 473 | | | | 53 | | | | 0.51 | | |
Mastercard, Inc. | | | 175 | | | | 52 | | | | 0.50 | | |
Materion Corp. | | | 873 | | | | 52 | | | | 0.50 | | |
Mattel, Inc. | | | 4,324 | | | | 59 | | | | 0.57 | | |
McCormick & Co, Inc. | | | 295 | | | | 50 | | | | 0.48 | | |
Mercury Systems, Inc. | | | 741 | | | | 51 | | | | 0.49 | | |
Momenta Pharmaceuticals, Inc. | | | 3,012 | | | | 59 | | | | 0.56 | | |
Monolithic Power Systems, Inc. | | | 313 | | | | 56 | | | | 0.54 | | |
Monro, Inc. | | | 690 | | | | 54 | | | | 0.52 | | |
Moody's Corp. | | | 221 | | | | 53 | | | | 0.51 | | |
MSA Safety, Inc. | | | 405 | | | | 51 | | | | 0.49 | | |
MSCI, Inc. | | | 195 | | | | 50 | | | | 0.49 | | |
National Instruments Corp. | | | 1,233 | | | | 52 | | | | 0.50 | | |
National Oilwell Varco, Inc. | | | 2,249 | | | | 56 | | | | 0.54 | | |
National Storage Affiliates Trust | | | 1,474 | | | | 50 | | | | 0.48 | | |
The accompanying notes are an integral part of the consolidated financial statements.
28
Morgan Stanley Institutional Fund, Inc.
Annual Report — December 31, 2019
Consolidated Portfolio of Investments (cont'd)
Multi-Asset Portfolio
Security Description | | Shares | | Value
(000) | | Index Weight | |
JPM U.S. Growth Index (cont'd) | |
Nektar Therapeutics | | | 2,556 | | | $ | 55 | | | | 0.53 | % | |
NeoGenomics, Inc. | | | 1,947 | | | | 57 | | | | 0.55 | | |
Netflix, Inc. | | | 168 | | | | 54 | | | | 0.52 | | |
New York Times Co. (The) | | | 1,594 | | | | 51 | | | | 0.49 | | |
NextEra Energy, Inc. | | | 216 | | | | 52 | | | | 0.51 | | |
NIKE, Inc. | | | 530 | | | | 54 | | | | 0.52 | | |
Nordson Corp. | | | 306 | | | | 50 | | | | 0.48 | | |
Northfield BanCorp., Inc. | | | 1,977 | | | | 34 | | | | 0.32 | | |
Northwest Natural Holding Co. | | | 738 | | | | 54 | | | | 0.53 | | |
NVIDIA Corp. | | | 243 | | | | 57 | | | | 0.55 | | |
Old Dominion Freight Line, Inc. | | | 276 | | | | 52 | | | | 0.51 | | |
Ollie's Bargain Outlet Holdings, Inc. | | | 853 | | | | 56 | | | | 0.54 | | |
ONEOK, Inc. | | | 715 | | | | 54 | | | | 0.52 | | |
O'Reilly Automotive, Inc. | | | 115 | | | | 50 | | | | 0.49 | | |
Pacira BioSciences, Inc. | | | 1,119 | | | | 51 | | | | 0.49 | | |
Papa John's International, Inc. | | | 850 | | | | 54 | | | | 0.52 | | |
PayPal Holdings, Inc. | | | 485 | | | | 52 | | | | 0.51 | | |
PDF Solutions, Inc. | | | 1,857 | | | | 31 | | | | 0.30 | | |
Pennant Group, Inc. (The) | | | 2,030 | | | | 67 | | | | 0.64 | | |
Penumbra, Inc. | | | 299 | | | | 49 | | | | 0.47 | | |
PNM Resources, Inc. | | | 1,040 | | | | 53 | | | | 0.51 | | |
PRA Group, Inc. | | | 1,415 | | | | 51 | | | | 0.50 | | |
ProAssurance Corp. | | | 1,359 | | | | 49 | | | | 0.47 | | |
Proto Labs, Inc. | | | 535 | | | | 54 | | | | 0.52 | | |
PS Business Parks, Inc. | | | 289 | | | | 48 | | | | 0.46 | | |
Quaker Chemical Corp. | | | 334 | | | | 55 | | | | 0.53 | | |
Repligen Corp. | | | 574 | | | | 53 | | | | 0.51 | | |
REX American Resources Corp. | | | 581 | | | | 48 | | | | 0.46 | | |
RLI Corp. | | | 556 | | | | 50 | | | | 0.48 | | |
Rockwell Automation, Inc. | | | 258 | | | | 52 | | | | 0.51 | | |
Rollins, Inc. | | | 1,474 | | | | 49 | | | | 0.47 | | |
Ross Stores, Inc. | | | 447 | | | | 52 | | | | 0.50 | | |
Royal Gold, Inc. | | | 430 | | | | 53 | | | | 0.51 | | |
S&P Global, Inc. | | | 187 | | | | 51 | | | | 0.49 | | |
SBA Communications Corp. | | | 215 | | | | 52 | | | | 0.50 | | |
Seacoast Banking Corp. of Florida | | | 1,706 | | | | 52 | | | | 0.50 | | |
ServiceNow, Inc. | | | 186 | | | | 52 | | | | 0.51 | | |
Shake Shack, Inc. | | | 864 | | | | 51 | | | | 0.50 | | |
Sherwin-Williams Co. (The) | | | 89 | | | | 52 | | | | 0.50 | | |
Silicon Laboratories, Inc. | | | 472 | | | | 55 | | | | 0.53 | | |
Southwest Airlines Co. | | | 914 | | | | 49 | | | | 0.48 | | |
Tabula Rasa HealthCare, Inc. | | | 1,219 | | | | 59 | | | | 0.57 | | |
Tactile Systems Technology, Inc. | | | 809 | | | | 55 | | | | 0.53 | | |
TechTarget, Inc. | | | 2,046 | | | | 53 | | | | 0.52 | | |
TJX Cos, Inc. (The) | | | 852 | | | | 52 | | | | 0.50 | | |
Toro Co. (The) | | | 649 | | | | 52 | | | | 0.50 | | |
TransDigm Group, Inc. | | | 90 | | | | 50 | | | | 0.49 | | |
Transocean Ltd. | | | 9,541 | | | | 66 | | | | 0.62 | | |
Trex Co, Inc. | | | 592 | | | | 53 | | | | 0.51 | | |
UDR, Inc. | | | 1,062 | | | | 50 | | | | 0.48 | | |
Under Armour, Inc. | | | 2,703 | | | | 58 | | | | 0.56 | | |
United Fire Group, Inc. | | | 1,168 | | | | 51 | | | | 0.49 | | |
Universal Display Corp. | | | 266 | | | | 55 | | | | 0.53 | | |
Universal Electronics, Inc. | | | 905 | | | | 47 | | | | 0.46 | | |
Universal Health Realty Income Trust | | | 417 | | | | 49 | | | | 0.47 | | |
The accompanying notes are an integral part of the consolidated financial statements.
29
Morgan Stanley Institutional Fund, Inc.
Annual Report — December 31, 2019
Consolidated Portfolio of Investments (cont'd)
Multi-Asset Portfolio
Security Description | | Shares | | Value
(000) | | Index Weight | |
JPM U.S. Growth Index (cont'd) | |
US Physical Therapy, Inc. | | | 442 | | | $ | 51 | | | | 0.49 | % | |
VeriSign, Inc. | | | 274 | | | | 53 | | | | 0.51 | | |
Verisk Analytics, Inc. | | | 348 | | | | 52 | | | | 0.50 | | |
Viavi Solutions, Inc. | | | 3,441 | | | | 52 | | | | 0.50 | | |
Vicor Corp. | | | 1,208 | | | | 56 | | | | 0.54 | | |
Visa, Inc. | | | 279 | | | | 52 | | | | 0.51 | | |
Watsco, Inc. | | | 282 | | | | 51 | | | | 0.49 | | |
WD-40 Co. | | | 262 | | | | 51 | | | | 0.49 | | |
WEC Energy Group, Inc. | | | 567 | | | | 52 | | | | 0.51 | | |
Westamerica BanCorporation | | | 775 | | | | 53 | | | | 0.51 | | |
Williams Cos, Inc. (The) | | | 2,288 | | | | 54 | | | | 0.52 | | |
Wingstop, Inc. | | | 633 | | | | 55 | | | | 0.53 | | |
World Wrestling Entertainment, Inc. | | | 815 | | | | 53 | | | | 0.51 | | |
WW International, Inc. | | | 1,176 | | | | 45 | | | | 0.43 | | |
Zoetis, Inc. | | | 423 | | | | 56 | | | | 0.54 | | |
Total | | | | $ | 10,371 | | | | 100.00 | % | |
@ Value is less than $500.
† Credit rating as issued by Standard & Poor's.
* Cleared swap agreement, the broker is Morgan Stanley & Co. LLC.
NR Not rated.
BBSW Australia's Bank Bill Swap.
CPI Consumer Price Index.
EURIBOR Euro Interbank Offered Rate.
LIBOR London Interbank Offered Rate.
OAT Obligations Assimilables du Trésor (French Treasury Obligation).
AUD — Australian Dollar
BRL — Brazilian Real
CAD — Canadian Dollar
CHF — Swiss Franc
CLP — Chilean Peso
CNH — Chinese Yuan Renminbi Offshore
COP — Colombian Peso
CZK — Czech Koruna
DKK — Danish Krone
EUR — Euro
GBP — British Pound
HKD — Hong Kong Dollar
HUF — Hungarian Forint
IDR — Indonesian Rupiah
ILS — Israeli Shekel
INR — Indian Rupee
JPY — Japanese Yen
KRW — South Korean Won
MXN — Mexican Peso
NOK — Norwegian Krone
NZD — New Zealand Dollar
PEN — Peruvian Nuevo Sol
PLN — Polish Zloty
RUB — Russian Ruble
SEK — Swedish Krona
SGD — Singapore Dollar
THB — Thai Baht
TRY — Turkish Lira
TWD — Taiwan Dollar
USD — United States Dollar
ZAR — South African Rand
Portfolio Composition
Classification | | Percentage of
Total Investments | |
Short-Term Investments | | | 57.5 | % | |
Other** | | | 21.3 | | |
Banks | | | 12.6 | | |
Sovereign | | | 8.6 | | |
Total Investments | | | 100.0 | %*** | |
** Industries and/or investment types representing less than 5% of total investments.
*** Does not include open long/short futures contracts with a value of approximately $20,801,000 and net unrealized depreciation of approximately $50,000. Does not include open foreign currency forward exchange contracts with net unrealized appreciation of approximately $40,000. Also does not include open swap agreements with net unrealized appreciation of approximately $35,000.
The accompanying notes are an integral part of the consolidated financial statements.
30
Morgan Stanley Institutional Fund, Inc.
Annual Report — December 31, 2019
Consolidated Statement of Assets and Liabilities | | December 31, 2019
(000) | |
Assets: | |
Investments in Securities of Unaffiliated Issuers, at Value (Cost $12,613) | | $ | 13,439 | | |
Investment in Security of Affiliated Issuer, at Value (Cost $9,542) | | | 9,542 | | |
Total Investments in Securities, at Value (Cost $22,155) | | | 22,981 | | |
Foreign Currency, at Value (Cost $115) | | | 117 | | |
Receivable for Variation Margin on Futures Contracts | | | 540 | | |
Unrealized Appreciation on Swap Agreements | | | 251 | | |
Due from Adviser | | | 106 | | |
Interest Receivable | | | 66 | | |
Unrealized Appreciation on Foreign Currency Forward Exchange Contracts | | | 52 | | |
Tax Reclaim Receivable | | | 30 | | |
Receivable from Affiliate | | | 12 | | |
Receivable for Variation Margin on Swap Agreements | | | 9 | | |
Dividends Receivable | | | 3 | | |
Other Assets | | | 35 | | |
Total Assets | | | 24,202 | | |
Liabilities: | |
Unrealized Depreciation on Swap Agreements | | | 247 | | |
Payable for Professional Fees | | | 65 | | |
Payable for Custodian Fees | | | 33 | | |
Payable for Transfer Agency Fees | | | — | @ | |
Payable for Transfer Agency Fees — Class I | | | 18 | | |
Payable for Transfer Agency Fees — Class A | | | 1 | | |
Payable for Transfer Agency Fees — Class L | | | — | @ | |
Payable for Transfer Agency Fees — Class IS | | | — | @ | |
Unrealized Depreciation on Foreign Currency Forward Exchange Contracts | | | 12 | | |
Payable for Sub Transfer Agency Fees — Class I | | | 3 | | |
Payable for Sub Transfer Agency Fees — Class A | | | — | @ | |
Payable for Sub Transfer Agency Fees — Class L | | | 1 | | |
Payable for Sub Transfer Agency Fees — Class C | | | — | @ | |
Payable for Fund Shares Redeemed | | | 3 | | |
Bank Overdraft | | | 2 | | |
Payable for Administration Fees | | | 2 | | |
Payable for Shareholder Services Fees — Class A | | | — | @ | |
Payable for Distribution and Shareholder Services Fees — Class L | | | 1 | | |
Payable for Distribution and Shareholder Services Fees — Class C | | | —- | @ | |
Other Liabilities | | | 15 | | |
Total Liabilities | | | 403 | | |
Net Assets | | $ | 23,799 | | |
Net Assets Consist of: | |
Paid-in-Capital | | $ | 109,534 | | |
Total Accumulated Loss | | | (85,735 | ) | |
Net Assets | | $ | 23,799 | | |
The accompanying notes are an integral part of the consolidated financial statements.
31
Morgan Stanley Institutional Fund, Inc.
Annual Report — December 31, 2019
Consolidated Statement of Assets and Liabilities (cont'd) | | December 31, 2019
(000) | |
CLASS I: | |
Net Assets | | $ | 19,805 | | |
| Shares Outstanding $0.001 par value shares of beneficial interest (unlimited shares authorized) (not in 000's) | | | 2,172,020 | | |
Net Asset Value, Offering and Redemption Price Per Share | | $ | 9.12 | | |
CLASS A: | |
Net Assets | | $ | 2,210 | | |
| Shares Outstanding $0.001 par value shares of beneficial interest (unlimited shares authorized) (not in 000's) | | | 244,386 | | |
Net Asset Value, Redemption Price Per Share | | $ | 9.04 | | |
Maximum Sales Load | | | 5.25 | % | |
Maximum Sales Charge | | $ | 0.50 | | |
Maximum Offering Price Per Share | | $ | 9.54 | | |
CLASS L: | |
Net Assets | | $ | 1,724 | | |
| Shares Outstanding $0.001 par value shares of beneficial interest (unlimited shares authorized) (not in 000's) | | | 193,186 | | |
Net Asset Value, Offering and Redemption Price Per Share | | $ | 8.92 | | |
CLASS C: | |
Net Assets | | $ | 51 | | |
| Shares Outstanding $0.001 par value shares of beneficial interest (unlimited shares authorized) (not in 000's) | | | 5,749 | | |
Net Asset Value, Offering and Redemption Price Per Share | | $ | 8.83 | | |
CLASS IS: | |
Net Assets | | $ | 9 | | |
| Shares Outstanding $0.001 par value shares of beneficial interest (unlimited shares authorized) (not in 000's) | | | 934 | | |
Net Asset Value, Offering and Redemption Price Per Share | | $ | 9.11 | | |
@ Amount is less than $500.
The accompanying notes are an integral part of the consolidated financial statements.
32
Morgan Stanley Institutional Fund, Inc.
Annual Report — December 31, 2019
Consolidated Statement of Operations | | Year Ended
December 31, 2019
(000) | |
Investment Income: | |
Interest from Securities of Unaffiliated Issuers | | $ | 297 | | |
Dividends from Securities of Unaffiliated Issuers (Net of $26 of Foreign Taxes Withheld) | | | 261 | | |
Dividends from Security of Affiliated Issuer (Note G) | | | 127 | | |
Total Investment Income | | | 685 | | |
Expenses: | |
Advisory Fees (Note B) | | | 236 | | |
Custodian Fees (Note F) | | | 184 | | |
Professional Fees | | | 132 | | |
Registration Fees | | | 70 | | |
Pricing Fees | | | 27 | | |
Sub Transfer Agency Fees — Class I | | | 21 | | |
Sub Transfer Agency Fees — Class A | | | 1 | | |
Sub Transfer Agency Fees — Class L | | | 1 | | |
Sub Transfer Agency Fees — Class C | | | — | @ | |
Administration Fees (Note C) | | | 22 | | |
Shareholder Services Fees — Class A (Note D) | | | 7 | | |
Distribution and Shareholder Services Fees — Class L (Note D) | | | 14 | | |
Distribution and Shareholder Services Fees — Class C (Note D) | | | 1 | | |
Shareholder Reporting Fees | | | 19 | | |
Transfer Agency Fees — Class I (Note E) | | | 4 | | |
Transfer Agency Fees — Class A (Note E) | | | 5 | | |
Transfer Agency Fees — Class L (Note E) | | | 2 | | |
Transfer Agency Fees — Class C (Note E) | | | 1 | | |
Transfer Agency Fees — Class IS (Note E) | | | 2 | | |
Directors' Fees and Expenses | | | 7 | | |
Other Expenses | | | 16 | | |
Total Expenses | | | 772 | | |
Waiver of Advisory Fees (Note B) | | | (236 | ) | |
Expenses Reimbursed by Adviser (Note B) | | | (180 | ) | |
Reimbursement of Class Specific Expenses — Class I (Note B) | | | (18 | ) | |
Reimbursement of Class Specific Expenses — Class A (Note B) | | | (2 | ) | |
Reimbursement of Class Specific Expenses — Class L (Note B) | | | (1 | ) | |
Reimbursement of Class Specific Expenses — Class C (Note B) | | | (1 | ) | |
Reimbursement of Class Specific Expenses — Class IS (Note B) | | | (2 | ) | |
Rebate from Morgan Stanley Affiliate (Note G) | | | (11 | ) | |
Net Expenses | | | 321 | | |
Net Investment Income | | | 364 | | |
Realized Gain (Loss): | |
Investments Sold | | | 247 | | |
Foreign Currency Forward Exchange Contracts | | | (267 | ) | |
Foreign Currency Translation | | | (30 | ) | |
Futures Contracts | | | (551 | ) | |
Swap Agreements | | | (452 | ) | |
Net Realized Loss | | | (1,053 | ) | |
Change in Unrealized Appreciation (Depreciation): | |
Investments | | | 1,290 | | |
Foreign Currency Forward Exchange Contracts | | | (233 | ) | |
Foreign Currency Translation | | | 16 | | |
Futures Contracts | | | 174 | | |
Swap Agreements | | | (201 | ) | |
Net Change in Unrealized Appreciation (Depreciation) | | | 1,046 | | |
Net Realized Loss and Change in Unrealized Appreciation (Depreciation) | | | (7 | ) | |
Net Increase in Net Assets Resulting from Operations | | $ | 357 | | |
@ Amount is less than $500.
The accompanying notes are an integral part of the consolidated financial statements.
33
Morgan Stanley Institutional Fund, Inc.
Annual Report — December 31, 2019
Consolidated Statements of Changes in Net Assets | | Year Ended
December 31, 2019
(000) | | Year Ended
December 31, 2018
(000) | |
Increase (Decrease) in Net Assets: | |
Operations: | |
Net Investment Income | | $ | 364 | | | $ | 668 | | |
Net Realized Gain (Loss) | | | (1,053 | ) | | | 3,369 | | |
Net Change in Unrealized Appreciation (Depreciation) | | | 1,046 | | | | (4,414 | ) | |
Net Increase (Decrease) in Net Assets Resulting from Operations | | | 357 | | | | (377 | ) | |
Dividends and Distributions to Shareholders: | |
Class I | | | (688 | ) | | | (1,067 | ) | |
Class A | | | (69 | ) | | | (84 | ) | |
Class L | | | (48 | ) | | | (46 | ) | |
Class C | | | (1 | ) | | | (2 | ) | �� |
Class IS | | | (— | @) | | | (— | @) | |
Total Dividends and Distributions to Shareholders | | | (806 | ) | | | (1,199 | ) | |
Capital Share Transactions:(1) | |
Class I: | |
Subscribed | | | 126 | | | | 2,079 | | |
Distributions Reinvested | | | 687 | | | | 1,067 | | |
Redeemed | | | (18,919 | ) | | | (28,660 | ) | |
Class A: | |
Subscribed | | | 108 | | | | 326 | | |
Distributions Reinvested | | | 58 | | | | 71 | | |
Redeemed | | | (1,288 | ) | | | (694 | ) | |
Class L: | |
Distributions Reinvested | | | 48 | | | | 46 | | |
Redeemed | | | (569 | ) | | | (916 | ) | |
Class C: | |
Subscribed | | | 13 | | | | 48 | | |
Distributions Reinvested | | | 1 | | | | 2 | | |
Redeemed | | | (90 | ) | | | (44 | ) | |
Class IS: | |
Distributions Reinvested | | | — | @ | | | — | | |
Net Decrease in Net Assets Resulting from Capital Share Transactions | | | (19,825 | ) | | | (26,675 | ) | |
Total Decrease in Net Assets | | | (20,274 | ) | | | (28,251 | ) | |
Net Assets: | |
Beginning of Period | | | 44,073 | | | | 72,324 | | |
End of Period | | $ | 23,799 | | | $ | 44,073 | | |
The accompanying notes are an integral part of the consolidated financial statements.
34
Morgan Stanley Institutional Fund, Inc.
Annual Report — December 31, 2019
Consolidated Statements of Changes in Net Assets (cont'd) | | Year Ended
December 31, 2019
(000) | | Year Ended
December 31, 2018
(000) | |
(1) Capital Share Transactions: | |
Class I: | |
Shares Subscribed | | | 14 | | | | 214 | | |
Shares Issued on Distributions Reinvested | | | 75 | | | | 114 | | |
Shares Redeemed | | | (2,008 | ) | | | (2,991 | ) | |
Net Decrease in Class I Shares Outstanding | | | (1,919 | ) | | | (2,663 | ) | |
Class A: | |
Shares Subscribed | | | 12 | | | | 34 | | |
Shares Issued on Distributions Reinvested | | | 6 | | | | 8 | | |
Shares Redeemed | | | (140 | ) | | | (73 | ) | |
Net Decrease in Class A Shares Outstanding | | | (122 | ) | | | (31 | ) | |
Class L: | |
Shares Issued on Distributions Reinvested | | | 5 | | | | 5 | | |
Shares Redeemed | | | (62 | ) | | | (99 | ) | |
Net Decrease in Class L Shares Outstanding | | | (57 | ) | | | (94 | ) | |
Class C: | |
Shares Subscribed | | | 2 | | | | 5 | | |
Shares Issued on Distributions Reinvested | | | — | @@ | | | — | @@ | |
Shares Redeemed | | | (10 | ) | | | (5 | ) | |
Net Increase (Decrease) in Class C Shares Outstanding | | | (8 | ) | | | — | @@ | |
Class IS: | |
Shares Issued on Distributions Reinvested | | | — | @@ | | | — | | |
@ Amount is less than $500.
@@ Amount is less than 500 shares.
The accompanying notes are an integral part of the consolidated financial statements.
35
Morgan Stanley Institutional Fund, Inc.
Annual Report — December 31, 2019
Consolidated Financial Highlights
Multi-Asset Portfolio
| | | Class I | |
| | | Year Ended December 31, | |
Selected Per Share Data and Ratios | | 2019 | | 2018 | | 2017 | | 2016(1) | | 2015(2) | |
Net Asset Value, Beginning of Period | | $ | 9.35 | | | $ | 9.65 | | | $ | 9.72 | | | $ | 10.17 | | | $ | 11.55 | | |
Income (Loss) from Investment Operations: | |
Net Investment Income(3) | | | 0.13 | | | | 0.11 | | | | 0.19 | | | | 0.03 | | | | 0.07 | | |
Net Realized and Unrealized Loss | | | (0.03 | ) | | | (0.14 | ) | | | (0.26 | ) | | | (0.31 | ) | | | (1.29 | ) | |
Total from Investment Operations | | | 0.10 | | | | (0.03 | ) | | | (0.07 | ) | | | (0.28 | ) | | | (1.22 | ) | |
Distributions from and/or in Excess of: | |
Net Investment Income | | | (0.33 | ) | | | (0.27 | ) | | | — | | | | (0.17 | ) | | | (0.16 | ) | |
Net Asset Value, End of Period | | $ | 9.12 | | | $ | 9.35 | | | $ | 9.65 | | | $ | 9.72 | | | $ | 10.17 | | |
Total Return(4) | | | 1.05 | % | | | (0.32 | )% | | | (0.72 | )% | | | (2.75 | )% | | | (10.60 | )% | |
Ratios to Average Net Assets and Supplemental Data: | |
Net Assets, End of Period (Thousands) | | $ | 19,805 | | | $ | 38,254 | | | $ | 65,156 | | | $ | 109,692 | | | $ | 280,423 | | |
Ratio of Expenses Before Expense Limitation | | | 2.68 | % | | | 1.78 | % | | | 1.44 | % | | | 1.25 | % | | | 1.14 | % | |
Ratio of Expenses After Expense Limitation | | | 1.06 | %(5) | | | 1.06 | %(5) | | | 1.03 | %(5) | | | 1.04 | %(5) | | | 1.05 | %(5) | |
Ratio of Net Investment Income | | | 1.39 | %(5) | | | 1.17 | %(5) | | | 1.91 | %(5) | | | 0.35 | %(5) | | | 0.60 | %(5) | |
Ratio of Rebate from Morgan Stanley Affiliates | | | 0.04 | % | | | 0.04 | % | | | 0.07 | % | | | 0.06 | % | | | 0.04 | % | |
Portfolio Turnover Rate | | | 178 | % | | | 187 | % | | | 386 | % | | | 353 | % | | | 355 | % | |
(1) Reflects prior period custodian out-of-pocket expenses that were reimbursed in September 2016. The amount of the reimbursement was immaterial on a per share basis and did not impact the total return of Class I shares. The Ratio of Expenses After Expense Limitation and the Ratio of Net Investment Income would be unchanged as the reimbursement of custodian fees was offset against expense waivers/reimbursements with no impact to net expenses or net investment income.
(2) Not consolidated.
(3) Per share amount is based on average shares outstanding.
(4) Calculated based on the net asset value as of the last business day of the period.
(5) The Ratio of Expenses After Expense Limitation and Ratio of Net Investment Income reflect the rebate of certain Fund expenses in connection with the investments in Morgan Stanley affiliates during the period. The effect of the rebate on the ratios is disclosed in the above table as "Ratio of Rebate from Morgan Stanley Affiliates."
The accompanying notes are an integral part of the consolidated financial statements.
36
Morgan Stanley Institutional Fund, Inc.
Annual Report — December 31, 2019
Consolidated Financial Highlights
Multi-Asset Portfolio
| | | Class A | |
| | | Year Ended December 31, | |
Selected Per Share Data and Ratios | | 2019 | | 2018 | | 2017 | | 2016(1) | | 2015(2) | |
Net Asset Value, Beginning of Period | | $ | 9.27 | | | $ | 9.54 | | | $ | 9.68 | | | $ | 10.09 | | | $ | 11.50 | | |
Income (Loss) from Investment Operations: | |
Net Investment Income (Loss)(3) | | | 0.11 | | | | 0.15 | | | | 0.14 | | | | (0.00 | )(4) | | | 0.03 | | |
Net Realized and Unrealized Loss | | | (0.05 | ) | | | (0.19 | ) | | | (0.28 | ) | | | (0.31 | ) | | | (1.28 | ) | |
Total from Investment Operations | | | 0.06 | | | | (0.04 | ) | | | (0.14 | ) | | | (0.31 | ) | | | (1.25 | ) | |
Distributions from and/or in Excess of: | |
Net Investment Income | | | (0.29 | ) | | | (0.23 | ) | | | — | | | | (0.10 | ) | | | (0.16 | ) | |
Net Asset Value, End of Period | | $ | 9.04 | | | $ | 9.27 | | | $ | 9.54 | | | $ | 9.68 | | | $ | 10.09 | | |
Total Return(5) | | | 0.62 | % | | | (0.59 | )% | | | (1.24 | )% | | | (2.94 | )% | | | (11.00 | )% | |
Ratios to Average Net Assets and Supplemental Data: | |
Net Assets, End of Period (Thousands) | | $ | 2,210 | | | $ | 3,392 | | | $ | 3,791 | | | $ | 12,914 | | | $ | 29,123 | | |
Ratio of Expenses Before Expense Limitation | | | 3.04 | % | | | 2.21 | % | | | 1.76 | % | | | 1.59 | % | | | 1.47 | % | |
Ratio of Expenses After Expense Limitation | | | 1.41 | %(6) | | | 1.41 | %(6) | | | 1.38 | %(6) | | | 1.39 | %(6) | | | 1.37 | %(6) | |
Ratio of Net Investment Income (Loss) | | | 1.19 | %(6) | | | 1.64 | %(6) | | | 1.46 | %(6) | | | (0.01 | )%(6) | | | 0.27 | %(6) | |
Ratio of Rebate from Morgan Stanley Affiliates | | | 0.04 | % | | | 0.04 | % | | | 0.07 | % | | | 0.06 | % | | | 0.04 | % | |
Portfolio Turnover Rate | | | 178 | % | | | 187 | % | | | 386 | % | | | 353 | % | | | 355 | % | |
(1) Reflects prior period custodian out-of-pocket expenses that were reimbursed in September 2016. The amount of the reimbursement was immaterial on a per share basis and did not impact the total return of Class A shares. The Ratio of Expenses After Expense Limitation and the Ratio of Net Investment Loss would be unchanged as the reimbursement of custodian fees was offset against expense waivers/reimbursements with no impact to net expenses or net investment loss.
(2) Not consolidated.
(3) Per share amount is based on average shares outstanding.
(4) Amount is less than $0.005 per share.
(5) Calculated based on the net asset value which does not reflect sales charges, if applicable, as of the last business day of the period.
(6) The Ratio of Expenses After Expense Limitation and Ratio of Net Investment Income (Loss) reflect the rebate of certain Fund expenses in connection with the investments in Morgan Stanley affiliates during the period. The effect of the rebate on the ratios is disclosed in the above table as "Ratio of Rebate from Morgan Stanley Affiliates."
The accompanying notes are an integral part of the consolidated financial statements.
37
Morgan Stanley Institutional Fund, Inc.
Annual Report — December 31, 2019
Consolidated Financial Highlights
Multi-Asset Portfolio
| | | Class L | |
| | | Year Ended December 31, | |
Selected Per Share Data and Ratios | | 2019 | | 2018 | | 2017 | | 2016(1) | | 2015(2) | |
Net Asset Value, Beginning of Period | | $ | 9.16 | | | $ | 9.44 | | | $ | 9.60 | | | $ | 9.94 | | | $ | 11.39 | | |
Income (Loss) from Investment Operations: | |
Net Investment Income (Loss)(3) | | | 0.06 | | | | 0.08 | | | | 0.10 | | | | (0.04 | ) | | | (0.02 | ) | |
Net Realized and Unrealized Loss | | | (0.05 | ) | | | (0.18 | ) | | | (0.26 | ) | | | (0.30 | ) | | | (1.27 | ) | |
Total from Investment Operations | | | 0.01 | | | | (0.10 | ) | | | (0.16 | ) | | | (0.34 | ) | | | (1.29 | ) | |
Distributions from and/or in Excess of: | |
Net Investment Income | | | (0.25 | ) | | | (0.18 | ) | | | — | | | | — | | | | (0.16 | ) | |
Net Asset Value, End of Period | | $ | 8.92 | | | $ | 9.16 | | | $ | 9.44 | | | $ | 9.60 | | | $ | 9.94 | | |
Total Return(4) | | | 0.06 | % | | | (1.04 | )% | | | (1.67 | )% | | | (3.42 | )% | | | (11.37 | )% | |
Ratios to Average Net Assets and Supplemental Data: | |
Net Assets, End of Period (Thousands) | | $ | 1,724 | | | $ | 2,291 | | | $ | 3,242 | | | $ | 6,357 | | | $ | 14,443 | | |
Ratio of Expenses Before Expense Limitation | | | 3.49 | % | | | 2.57 | % | | | 2.24 | % | | | 2.02 | % | | | 1.92 | % | |
Ratio of Expenses After Expense Limitation | | | 1.91 | %(5) | | | 1.88 | %(5) | | | 1.86 | %(5) | | | 1.85 | %(5) | | | 1.85 | %(5) | |
Ratio of Net Investment Income (Loss) | | | 0.63 | %(5) | | | 0.83 | %(5) | | | 1.09 | %(5) | | | (0.43 | )%(5) | | | (0.18 | )%(5) | |
Ratio of Rebate from Morgan Stanley Affiliates | | | 0.04 | % | | | 0.04 | % | | | 0.07 | % | | | 0.06 | % | | | 0.04 | % | |
Portfolio Turnover Rate | | | 178 | % | | | 187 | % | | | 386 | % | | | 353 | % | | | 355 | % | |
(1) Reflects prior period custodian out-of-pocket expenses that were reimbursed in September 2016. The amount of the reimbursement was immaterial on a per share basis and did not impact the total return of Class L shares. The Ratio of Expenses After Expense Limitation and the Ratio of Net Investment Loss would be unchanged as the reimbursement of custodian fees was offset against expense waivers/reimbursements with no impact to net expenses or net investment loss.
(2) Not consolidated.
(3) Per share amount is based on average shares outstanding.
(4) Calculated based on the net asset value as of the last business day of the period.
(5) The Ratio of Expenses After Expense Limitation and Ratio of Net Investment Income (Loss) reflect the rebate of certain Fund expenses in connection with the investments in Morgan Stanley affiliates during the period. The effect of the rebate on the ratios is disclosed in the above table as "Ratio of Rebate from Morgan Stanley Affiliates."
The accompanying notes are an integral part of the consolidated financial statements.
38
Morgan Stanley Institutional Fund, Inc.
Annual Report — December 31, 2019
Consolidated Financial Highlights
Multi-Asset Portfolio
| | | Class C | |
| | | Year Ended December 31, | | Period from
April 30, 2015(2) to | |
Selected Per Share Data and Ratios | | 2019 | | 2018 | | 2017 | | 2016(1) | | December 31, 2015(3) | |
Net Asset Value, Beginning of Period | | $ | 8.99 | | | $ | 9.28 | | | $ | 9.47 | | | $ | 9.93 | | | $ | 11.09 | | |
Income (Loss) from Investment Operations: | |
Net Investment Income (Loss)(4) | | | 0.03 | | | | 0.13 | | | | 0.07 | | | | (0.09 | ) | | | (0.07 | ) | |
Net Realized and Unrealized Loss | | | (0.05 | ) | | | (0.25 | ) | | | (0.26 | ) | | | (0.28 | ) | | | (0.93 | ) | |
Total from Investment Operations | | | (0.02 | ) | | | (0.12 | ) | | | (0.19 | ) | | | (0.37 | ) | | | (1.00 | ) | |
Distributions from and/or in Excess of: | |
Net Investment Income | | | (0.14 | ) | | | (0.17 | ) | | | — | | | | (0.09 | ) | | | (0.16 | ) | |
Net Asset Value, End of Period | | $ | 8.83 | | | $ | 8.99 | | | $ | 9.28 | | | $ | 9.47 | | | $ | 9.93 | | |
Total Return(5) | | | (0.07 | )% | | | (1.48 | )% | | | (1.90 | )% | | | (3.70 | )% | | | (9.07 | )%(7) | |
Ratios to Average Net Assets and Supplemental Data: | |
Net Assets, End of Period (Thousands) | | $ | 51 | | | $ | 128 | | | $ | 126 | | | $ | 272 | | | $ | 420 | | |
Ratio of Expenses Before Expense Limitation | | | 5.22 | % | | | 4.57 | % | | | 3.67 | % | | | 2.88 | % | | | 2.59 | %(8) | |
Ratio of Expenses After Expense Limitation | | | 2.16 | %(6) | | | 2.16 | %(6) | | | 2.13 | %(6) | | | 2.14 | %(6) | | | 2.17 | %(6)(8) | |
Ratio of Net Investment Income (Loss) | | | 0.37 | %(6) | | | 1.39 | %(6) | | | 0.70 | %(6) | | | (0.95 | )%(6) | | | (1.07 | )%(6)(8) | |
Ratio of Rebate from Morgan Stanley Affiliates | | | 0.04 | % | | | 0.04 | % | | | 0.07 | % | | | 0.06 | % | | | 0.03 | %(8) | |
Portfolio Turnover Rate | | | 178 | % | | | 187 | % | | | 386 | % | | | 353 | % | | | 355 | % | |
(1) Reflects prior period custodian out-of-pocket expenses that were reimbursed in September 2016. The amount of the reimbursement was immaterial on a per share basis and did not impact the total return of Class C shares. The Ratio of Expenses After Expense Limitation and the Ratio of Net Investment Loss would be unchanged as the reimbursement of custodian fees was offset against expense waivers/reimbursements with no impact to net expenses or net investment loss.
(2) Commencement of Offering.
(3) Not consolidated.
(4) Per share amount is based on average shares outstanding.
(5) Calculated based on the net asset value which does not reflect sales charges, if applicable, as of the last business day of the period.
(6) The Ratio of Expenses After Expense Limitation and Ratio of Net Investment Income (Loss) reflect the rebate of certain Fund expenses in connection with the investments in Morgan Stanley affiliates during the period. The effect of the rebate on the ratios is disclosed in the above table as "Ratio of Rebate from Morgan Stanley Affiliates."
(7) Not annualized.
(8) Annualized.
The accompanying notes are an integral part of the consolidated financial statements.
39
Morgan Stanley Institutional Fund, Inc.
Annual Report — December 31, 2019
Consolidated Financial Highlights
Multi-Asset Portfolio
| | | Class IS | |
| | | Year Ended December 31, | | Period from
May 29, 2015(2) to | |
Selected Per Share Data and Ratios | | 2019 | | 2018 | | 2017 | | 2016(1) | | December 31, 2015(3) | |
Net Asset Value, Beginning of Period | | $ | 9.34 | | | $ | 9.65 | | | $ | 9.72 | | | $ | 10.17 | | | $ | 11.09 | | |
Income (Loss) from Investment Operations: | |
Net Investment Income(4) | | | 0.14 | | | | 0.22 | | | | 0.25 | | | | 0.13 | | | | 0.01 | | |
Net Realized and Unrealized Loss | | | (0.04 | ) | | | (0.26 | ) | | | (0.32 | ) | | | (0.41 | ) | | | (0.77 | ) | |
Total from Investment Operations | | | 0.10 | | | | (0.04 | ) | | | (0.07 | ) | | | (0.28 | ) | | | (0.76 | ) | |
Distributions from and/or in Excess of: | |
Net Investment Income | | | (0.33 | ) | | | (0.27 | ) | | | — | | | | (0.17 | ) | | | (0.16 | ) | |
Net Asset Value, End of Period | | $ | 9.11 | | | $ | 9.34 | | | $ | 9.65 | | | $ | 9.72 | | | $ | 10.17 | | |
Total Return(5) | | | 1.08 | % | | | (0.28 | )% | | | (0.82 | )% | | | (2.65 | )% | | | (6.89 | )%(7) | |
Ratios to Average Net Assets and Supplemental Data: | |
Net Assets, End of Period (Thousands) | | $ | 9 | | | $ | 8 | | | $ | 9 | | | $ | 9 | | | $ | 9 | | |
Ratio of Expenses Before Expense Limitation | | | 24.55 | % | | | 24.87 | % | | | 22.88 | % | | | 22.77 | % | | | 17.31 | %(8) | |
Ratio of Expenses After Expense Limitation | | | 1.03 | %(6) | | | 1.03 | %(6) | | | 1.01 | %(6) | | | 1.01 | %(6) | | | 1.04 | %(6)(8) | |
Ratio of Net Investment Income | | | 1.51 | %(6) | | | 2.31 | %(6) | | | 2.53 | %(6) | | | 1.36 | %(6) | | | 0.23 | %(6)(8) | |
Ratio of Rebate from Morgan Stanley Affiliates | | | 0.04 | % | | | 0.04 | % | | | 0.06 | % | | | 0.06 | % | | | 0.03 | %(8) | |
Portfolio Turnover Rate | | | 178 | % | | | 187 | % | | | 386 | % | | | 353 | % | | | 355 | % | |
(1) Reflects prior period custodian out-of-pocket expenses that were reimbursed in September 2016. The amount of the reimbursement was immaterial on a per share basis and did not impact the total return of Class IS shares. The Ratio of Expenses After Expense Limitation and the Ratio of Net Investment Income would be unchanged as the reimbursement of custodian fees was offset against expense waivers/reimbursements with no impact to net expenses or net investment income.
(2) Commencement of Offering.
(3) Not consolidated.
(4) Per share amount is based on average shares outstanding.
(5) Calculated based on the net asset value as of the last business day of the period.
(6) The Ratio of Expenses After Expense Limitation and Ratio of Net Investment Income reflect the rebate of certain Fund expenses in connection with the investments in Morgan Stanley affiliates during the period. The effect of the rebate on the ratios is disclosed in the above table as "Ratio of Rebate from Morgan Stanley Affiliates."
(7) Not annualized.
(8) Annualized.
The accompanying notes are an integral part of the consolidated financial statements.
40
Morgan Stanley Institutional Fund, Inc.
Annual Report — December 31, 2019
Notes to Consolidated Financial Statements
Morgan Stanley Institutional Fund, Inc. (the "Company") is registered under the Investment Company Act of 1940, as amended (the "Act"), as an open-end management investment company. The Company is comprised of thirty-two separate, active, diversified and non-diversified funds (individually referred to as a "Fund," collectively as the "Funds"). The Company applies investment company accounting and reporting guidance.
The accompanying consolidated financial statements relate to the Multi- Asset Portfolio. The Fund seeks total return. The Fund's "Adviser", Morgan Stanley Investment Management Inc., seeks to achieve this objective with an emphasis on positive absolute return and controlling downside portfolio risk.
The Fund offers five classes of shares — Class I, Class A, Class L, Class C and Class IS. On April 30, 2015, the Fund suspended offering of Class L shares. Existing Class L shareholders may invest through reinvestment of dividends and distributions.
A. Significant Accounting Policies: The following significant accounting policies are in conformity with U.S. generally accepted accounting principles ("GAAP"). Such policies are consistently followed by the Company in the preparation of its consolidated financial statements. GAAP may require management to make estimates and assumptions that affect the reported amounts and disclosures in the consolidated financial statements. Actual results may differ from those estimates.
The Fund may, consistent with its principal investment strategies, invest up to 25% of its total assets in a wholly-owned subsidiary of the Fund organized as a company under the laws of the Cayman Islands, Multi-Asset Cayman Portfolio, Ltd. (the "Subsidiary"). The Subsidiary may invest, directly or indirectly through the use of derivatives, in securities, commodities, commodity-related instruments and other investments, primarily futures, swaps and notes. The Fund is the sole shareholder of the Subsidiary, and it is not currently expected that shares of the Subsidiary will be sold or offered to other investors. The consolidated portfolio of investments and consolidated financial statements include the positions and accounts of the Fund and the Subsidiary. All intercompany accounts and transactions of the Fund and the Subsidiary have been eliminated in consolidation. As of December 31, 2019, the Subsidiary represented approximately $5,926,000 or approximately 24.9% of the total net assets of the Fund.
Investments in the Subsidiary are expected to provide the Fund with exposure to the commodity markets within the
limitations of Subchapter M of the Code and recent Internal Revenue Service ("IRS") revenue rulings, which require that a mutual fund receive no more than ten percent of its gross income from such investments in order to receive favorable tax treatment as a regulated investment company ("RIC"). Tax treatment of the income received from the Subsidiary may potentially be affected by changes in legislation, regulations or other legally binding authority, which could affect the character, timing and amount of the Fund's taxable income and distributions. If such changes occur, the Fund may need to significantly change its investment strategy and recognize unrealized gains in order to remain qualified for taxation as a RIC, which could adversely affect the Fund.
In August 2018, the Financial Accounting Standards Board ("FASB") issued Accounting Standards Update ("ASU") 2018-13, Fair Value Measurement (Topic 820) — Disclosures Framework — Changes to Disclosure Requirements of Fair Value Measurement ("ASU 2018-13") which introduces new fair value disclosure requirements as well as eliminates and modifies certain existing fair value disclosure requirements. ASU 2018-13 would be effective for fiscal years beginning after December 15, 2019 and for interim periods within those fiscal years; however, management has elected to early adopt ASU 2018-13 as permitted by the standard. The impact of the Fund's adoption was limited to changes in the Fund's consolidated financial statement disclosures regarding fair value, primarily those disclosures related to transfers between levels of the fair value hierarchy and disclosure of the range and weighted average used to develop significant unobservable inputs for Level 3 fair value measurements, when applicable.
1. Security Valuation: (1) An equity portfolio security listed or traded on an exchange is valued at its latest reported sales price (or at the exchange official closing price if such exchange reports an official closing price), and if there were no sales on a given day and if there is no official exchange closing price for that day, the security is valued at the mean between the last reported bid and asked prices if such bid and asked prices are available on the relevant exchanges. If only bid prices are available then the latest bid price may be used. Listed equity securities not traded on the valuation date with no reported bid and asked prices available on the exchange are valued at the mean between the current bid and asked prices obtained from one or more reputable brokers or dealers. In cases where a security is traded on more than one exchange, the security is valued on the exchange designated as the primary market;
41
Morgan Stanley Institutional Fund, Inc.
Annual Report — December 31, 2019
Notes to Consolidated Financial Statements (cont'd)
(2) all other equity portfolio securities for which over-the-counter ("OTC") market quotations are readily available are valued at the latest reported sales price (or at the market official closing price if such market reports an official closing price), and if there was no trading in the security on a given day and if there is no official closing price from relevant markets for that day, the security is valued at the mean between the last reported bid and asked prices if such bid and asked prices are available on the relevant markets. An unlisted equity security that does not trade on the valuation date and for which bid and asked prices from the relevant markets are unavailable is valued at the mean between the current bid and asked prices obtained from one or more reputable brokers or dealers; (3) certain portfolio securities may be valued by an outside pricing service/vendor approved by the Company's Board of Directors (the "Directors"). The pricing service/vendor may employ a pricing model that takes into account, among other things, bids, yield spreads and/or other market data and specific security characteristics. Alternatively, if a valuation is not available from an outside pricing service/vendor, and the security trades on an exchange, the security may be valued at its latest reported sale price (or at the exchange official closing price if such exchange reports an official closing price), prior to the time when assets are valued. If there are no sales on a given day and if there is no official exchange closing price for that day, the security is valued at the mean between the last reported bid and asked prices if such bid and asked prices are available in the relevant exchanges. If the Adviser, a wholly-owned subsidiary of Morgan Stanley, determines that the price provided by the outside pricing service/vendor or exchange does not reflect the security's fair value or is unable to provide a price, prices from brokers or dealers may also be utilized. In these circumstances, the value of the security will be the mean of bid and asked prices obtained from brokers or dealers; (4) futures are valued at the settlement price on the exchange on which they trade or, if a settlement price is unavailable, at the last sale price on the exchange; (5) OTC swaps may be valued by an outside pricing service approved by the Directors or quotes from a broker or dealer. Swaps cleared on a clearinghouse or exchange may be valued using the closing price provided by the clearinghouse or exchange; (6) when market quotations are not readily available, including circumstances under which the Adviser determines that the closing price, last sale price or the mean between the last reported bid
and asked prices are not reflective of a security's market value, portfolio securities are valued at their fair value as determined in good faith under procedures established by and under the general supervision of the Directors. Occasionally, developments affecting the closing prices of securities and other assets may occur between the times at which valuations of such securities are determined (that is, close of the foreign market on which the securities trade) and the close of business of the New York Stock Exchange ("NYSE"). If developments occur during such periods that are expected to materially affect the value of such securities, such valuations may be adjusted to reflect the estimated fair value of such securities as of the close of the NYSE, as determined in good faith by the Directors or by the Adviser using a pricing service and/or procedures approved by the Directors; (7) quotations of foreign portfolio securities, other assets and liabilities and forward contracts stated in foreign currency are translated into U.S. dollar equivalents at the prevailing market rates prior to the close of the NYSE; and (8) investments in mutual funds, including the Morgan Stanley Institutional Liquidity Funds, are valued at the net asset value ("NAV") as of the close of each business day.
The Directors have responsibility for determining in good faith the fair value of the investments, and the Directors may appoint others, such as the Company's Adviser or a valuation committee, to assist the Directors in determining fair value and to make the actual calculations pursuant to the fair valuation methodologies previously approved by the Directors. Under procedures approved by the Directors, the Company's Adviser has formed a Valuation Committee whose members are approved by the Directors. The Valuation Committee provides administration and oversight of the Company's valuation policies and procedures, which are reviewed at least annually by the Directors. These procedures allow the Company to utilize independent pricing services, quotations from securities and financial instrument dealers and other market sources to determine fair value.
2. Fair Value Measurement: FASB Accounting Standards CodificationTM ("ASC") 820, "Fair Value Measurement" ("ASC 820"), defines fair value as the value that the Fund would receive to sell an investment or pay to transfer a liability in a timely transaction with an independent buyer in the principal market, or in the absence of a principal market, the most advantageous market for
42
Morgan Stanley Institutional Fund, Inc.
Annual Report — December 31, 2019
Notes to Consolidated Financial Statements (cont'd)
the investment or liability. ASC 820 establishes a three-tier hierarchy to distinguish between (1) inputs that reflect the assumptions market participants would use in valuing an asset or liability developed based on market data obtained from sources independent of the reporting entity (observable inputs) and (2) inputs that reflect the reporting entity's own assumptions about the assumptions market participants would use in valuing an asset or liability developed based on the best information available in the circumstances (unobservable inputs) and to establish classification of fair value measurements for disclosure purposes. Various inputs are used in determining the value of the Fund's investments. The inputs are summarized in the three broad levels listed below:
• Level 1 – unadjusted quoted prices in active markets for identical investments
• Level 2 – other significant observable inputs (including quoted prices for similar investments, interest rates, prepayment speeds, credit risk, etc.)
• Level 3 – significant unobservable inputs including the Fund's own assumptions in determining the fair value of investments. Factors considered in making this determination may include, but are not limited to, information obtained by contacting the issuer, analysts, or the appropriate stock exchange (for exchange-traded securities), analysis of the issuer's financial statements or other available documents and, if necessary, available information concerning other securities in similar circumstances.
The inputs or methodology used for valuing securities are not necessarily an indication of the risk associated with investing in those securities and the determination of the significance of a particular input to the fair value measurement in its entirety requires judgment and considers factors specific to each security.
The following is a summary of the inputs used to value the Fund's investments as of December 31, 2019:
Investment Type | | Level 1
Unadjusted
quoted
prices
(000) | | Level 2
Other
significant
observable
inputs
(000) | | Level 3
Significant
unobservable
inputs
(000) | | Total
(000) | |
Assets: | |
Common Stocks | |
Air Freight & Logistics | | $ | 158 | | | $ | — | | | $ | — | | | $ | 158 | | |
Auto Components | | | — | | | | 6 | | | | — | | | | 6 | | |
Automobiles | | | 245 | | | | — | | | | — | | | | 245 | | |
Banks | | | 2,624 | | | | 269 | | | | — | | | | 2,893 | | |
Beverages | | | 22 | | | | 2 | | | | — | | | | 24 | | |
Biotechnology | | | 9 | | | | — | | | | — | | | | 9 | | |
Commercial Banks | | | — | | | | 17 | | | | — | | | | 17 | | |
Commercial
Services &
Supplies | | | 22 | | | | 86 | | | | — | | | | 108 | | |
Construction &
Engineering | | | 819 | | | | — | | | | — | | | | 819 | | |
Distributors | | | 16 | | | | — | | | | — | | | | 16 | | |
Diversified
Telecommunication
Services | | | 68 | | | | 19 | | | | — | | | | 87 | | |
Electric Utilities | | | 65 | | | | 12 | | | | — | | | | 77 | | |
Equity Real Estate
Investment
Trusts (REITs) | | | — | @ | | | — | | | | — | | | | — | @ | |
Food & Staples Retailing | | | 13 | | | | — | | | | — | | | | 13 | | |
Food Products | | | 5 | | | | 9 | | | | — | | | | 14 | | |
Gas Utilities | | | 5 | | | | 2 | | | | — | | | | 7 | | |
Health Care
Equipment &
Supplies | | | 13 | | | | 1 | | | | — | | | | 14 | | |
Health Care
Providers &
Services | | | 4 | | | | 1 | | | | — | | | | 5 | | |
Hotels, Restaurants &
Leisure | | | 132 | | | | — | | | | — | | | | 132 | | |
Household Durables | | | 45 | | | | — | | | | — | | | | 45 | | |
Household Products | | | 21 | | | | 2 | | | | — | | | | 23 | | |
Independent Power &
Renewable
Electricity Producers | | | 2 | | | | 1 | | | | — | | | | 3 | | |
Industrial Conglomerates | | | 18 | | | | 11 | | | | — | | | | 29 | | |
Information
Technology Services | | | 381 | | | | 171 | | | | — | | | | 552 | | |
Internet & Direct
Marketing Retail | | | 77 | | | | 179 | | | | — | | | | 256 | | |
Investment Companies | | | — | | | | 1 | | | | — | | | | 1 | | |
Leisure Products | | | 8 | | | | — | | | | — | | | | 8 | | |
Life Sciences
Tools & Services | | | — | | | | 1 | | | | — | | | | 1 | | |
Machinery | | | — | | | | 53 | | | | — | | | | 53 | | |
Metals & Mining | | | — | | | | 43 | | | | — | | | | 43 | | |
Multi-Utilities | | | 18 | | | | 4 | | | | — | | | | 22 | | |
Paper & Forest
Products | | | 63 | | | | — | | | | — | | | | 63 | | |
Personal Products | | | 6 | | | | — | @ | | | — | | | | 6 | | |
Pharmaceuticals | | | 29 | | | | 15 | | | | — | | | | 44 | | |
43
Morgan Stanley Institutional Fund, Inc.
Annual Report — December 31, 2019
Notes to Consolidated Financial Statements (cont'd)
Investment Type | | Level 1
Unadjusted
quoted
prices
(000) | | Level 2
Other
significant
observable
inputs
(000) | | Level 3
Significant
unobservable
inputs
(000) | | Total
(000) | |
Common Stocks (cont'd) | |
Professional Services | | $ | 17 | | | $ | 11 | | | $ | — | | | $ | 28 | | |
Real Estate
Management &
Development | | | — | | | | 1,001 | | | | — | | | | 1,001 | | |
Road & Rail | | | 18 | | | | 48 | | | | — | | | | 66 | | |
Specialty Retail | | | 37 | | | | 11 | | | | — | | | | 48 | | |
Textiles, Apparel &
Luxury Goods | | | — | | | | 9 | | | | — | | | | 9 | | |
Tobacco | | | 11 | | | | 1 | | | | — | | | | 12 | | |
Trading Companies &
Distributors | | | 7 | | | | — | | | | — | | | | 7 | | |
Transportation
Infrastructure | | | 421 | | | | 361 | | | | — | | | | 782 | | |
Water Utilities | | | 2 | | | | — | | | | — | | | | 2 | | |
Wireless
Telecommunication
Services | | | 13 | | | | 31 | | | | — | | | | 44 | | |
Total Common Stocks | | | 5,414 | | | | 2,378 | | | | — | | | | 7,792 | | |
Fixed Income Securities | | | — | | | | 1,973 | | | | — | | | | 1,973 | | |
Short-Term Investments | |
Investment Company | | | 9,542 | | | | — | | | | — | | | | 9,542 | | |
U.S. Treasury Security | | | — | | | | 3,674 | | | | — | | | | 3,674 | | |
Total Short-Term
Investments | | | 9,542 | | | | 3,674 | | | | — | | | | 13,216 | | |
Foreign Currency
Forward Exchange
Contracts | | | — | | | | 52 | | | | — | | | | 52 | | |
Futures Contracts | | | 98 | | | | — | | | | — | | | | 98 | | |
Interest Rate
Swap Agreements | | | — | | | | 36 | | | | — | | | | 36 | | |
Total Return
Swap Agreements | | | — | | | | 251 | | | | — | | | | 251 | | |
Total Assets | | | 15,054 | | | | 8,364 | | | | — | | | | 23,418 | | |
Liabilities: | |
Foreign Currency
Forward Exchange
Contracts | | | — | | | | (12 | ) | | | — | | | | (12 | ) | |
Futures Contracts | | | (148 | ) | | | — | | | | — | | | | (148 | ) | |
Credit Default
Swap Agreement | | | — | | | | (5 | ) | | | — | | | | (5 | ) | |
Total Return
Swap Agreements | | | — | | | | (247 | ) | | | — | | | | (247 | ) | |
Total Liabilities | | | (148 | ) | | | (264 | ) | | | — | | | | (412 | ) | |
Total | | $ | 14,906 | | | $ | 8,100 | | | $ | — | | | $ | 23,006 | | |
@ Value is less than $500.
Transfers between investment levels may occur as the markets fluctuate and/or the availability of data used in an investment's valuation changes.
Following is a reconciliation of investments in which significant unobservable inputs (Level 3) were used in determining fair value:
| | | Common
Stock
(000) | |
Beginning Balance | | $ | 8 | | |
Purchases | | | — | | |
Sales | | | (159 | ) | |
Amortization of discount | | | — | | |
Transfers in | | | — | | |
Transfers out | | | — | | |
Corporate actions | | | — | | |
Change in unrealized appreciation | | | 151 | | |
Realized (losses) | | | — | | |
Ending Balance | | $ | — | | |
Net change in unrealized (depreciation) from investments
still held as of December 31, 2019 | | $ | 151 | | |
3. Foreign Currency Translation and Foreign Investments: The books and records of the Fund are maintained in U.S. dollars. Foreign currency amounts are translated into U.S. dollars as follows:
– investments, other assets and liabilities at the prevailing rate of exchange on the valuation date;
– investment transactions and investment income at the prevailing rates of exchange on the dates of such transactions.
Although the net assets of the Fund are presented at the foreign exchange rates and market values at the close of the period, the Fund does not isolate that portion of the results of operations arising as a result of changes in the foreign exchange rates from the fluctuations arising from changes in the market prices of securities held at period end. Similarly, the Fund does not isolate the effect of changes in foreign exchange rates from the fluctuations arising from changes in the market prices of securities sold during the period. Accordingly, realized and unrealized foreign currency gains (losses) on investments in securities are included in the reported net realized and unrealized gains (losses) on investment transactions and balances. However, pursuant to U.S. federal income tax regulations, gains and losses from certain foreign currency transactions and the foreign currency portion of gains and losses realized on sales and maturities of foreign denominated debt securities are treated as ordinary income for U.S. federal income tax purposes.
44
Morgan Stanley Institutional Fund, Inc.
Annual Report — December 31, 2019
Notes to Consolidated Financial Statements (cont'd)
Net realized gains (losses) on foreign currency transactions represent net foreign exchange gains (losses) from foreign currency forward exchange contracts, disposition of foreign currencies, currency gains (losses) realized between the trade and settlement dates on securities transactions, and the difference between the amount of investment income and foreign withholding taxes recorded on the Fund's books and the U.S. dollar equivalent amounts actually received or paid. The change in unrealized currency gains (losses) on foreign currency transactions for the period is reflected in the Consolidated Statement of Operations.
Foreign security and currency transactions may involve certain considerations and risks not typically associated with those of U.S. dollar denominated transactions as a result of, among other factors, fluctuations of exchange rates in relation to the U.S. dollar, the possibility of lower levels of governmental supervision and regulation of foreign securities markets and the possibility of political or economic instability.
Governmental approval for foreign investments may be required in advance of making an investment under certain circumstances in some countries, and the extent of foreign investments in domestic companies may be subject to limitation in other countries. Foreign ownership limitations also may be imposed by the charters of individual companies to prevent, among other concerns, violations of foreign investment limitations. As a result, an additional class of shares (identified as "Foreign" in the Consolidated Portfolio of Investments) may be created and offered for investment. The "local" and "foreign shares" market values may differ. In the absence of trading of the foreign shares in such markets, the Fund values the foreign shares at the closing exchange price of the local shares.
4. Derivatives: The Fund may, but is not required to, use derivative instruments for a variety of purposes, including hedging, risk management, portfolio management or to earn income. Derivatives are financial instruments whose value is based, in part, on the value of an underlying asset, interest rate, index or financial instrument. Prevailing interest rates and volatility levels, among other things, also affect the value of derivative instruments. A derivative instrument often has risks similar to its underlying asset and may have additional risks, including imperfect correlation between the value of the derivative and the underlying asset,
risks of default by the counterparty to certain transactions, magnification of losses incurred due to changes in the market value of the securities, instruments, indices or interest rates to which the derivative instrument relates, risks that the transactions may not be liquid and risks arising from margin requirements. The use of derivatives involves risks that are different from, and possibly greater than, the risks associated with other portfolio investments. Derivatives may involve the use of highly specialized instruments that require investment techniques and risk analyses different from those associated with other portfolio investments. All of the Fund's holdings, including derivative instruments, are marked-to-market each day with the change in value reflected in unrealized appreciation (depreciation). Upon disposition, a realized gain or loss is recognized.
Certain derivative transactions may give rise to a form of leverage. Leverage magnifies the potential for gain and the risk of loss. Leverage associated with derivative transactions may cause the Fund to liquidate portfolio positions when it may not be advantageous to do so to satisfy its obligations or to meet earmarking or segregation requirements, pursuant to applicable Securities and Exchange Commission ("SEC") rules and regulations, or may cause the Fund to be more volatile than if the Fund had not been leveraged. Although the Adviser seeks to use derivatives to further the Fund's investment objectives, there is no assurance that the use of derivatives will achieve this result.
Following is a description of the derivative instruments and techniques that the Fund used during the period and their associated risks:
Foreign Currency Forward Exchange Contracts: In connection with its investments in foreign securities, the Fund also entered into contracts with banks, brokers or dealers to purchase or sell securities or foreign currencies at a future date. A foreign currency forward exchange contract ("currency contract") is a negotiated agreement between the contracting parties to exchange a specified amount of currency at a specified future time at a specified rate. The rate can be higher or lower than the spot rate between the currencies that are the subject of the contract. Currency contracts may be used to protect against uncertainty in the level of future foreign currency exchange rates or to gain or modify exposure to a particular currency. To the extent hedged by the use of currency contracts, the precise matching of the currency
45
Morgan Stanley Institutional Fund, Inc.
Annual Report — December 31, 2019
Notes to Consolidated Financial Statements (cont'd)
contract amounts and the value of the securities involved will not generally be possible because the future value of such securities in foreign currencies will change as a consequence of market movements in the value of those securities between the date on which the contract is entered into and the date it matures. Furthermore, such transactions may reduce or preclude the opportunity for gain if the value of the currency should move in the direction opposite to the position taken. There is additional risk to the extent that currency contracts create exposure to currencies in which the Fund's securities are not denominated. Unanticipated changes in currency prices may result in poorer overall performance for the Fund than if it had not entered into such contracts. The use of currency contracts involves the risk of loss from the insolvency or bankruptcy of the counterparty to the contract or the failure of the counterparty to make payments or otherwise comply with the terms of the contract. A currency contract is marked-to-market daily and the change in market value is recorded by the Fund as unrealized gain or loss. The Fund records realized gains (losses) when the currency contract is closed equal to the difference between the value of the currency contract at the time it was opened and the value at the time it was closed.
Futures: A futures contract is a standardized, exchange-traded agreement to buy or sell a specific quantity of an underlying asset, reference rate or index at a specific price at a specific future time. The value of a futures contract tends to increase and decrease in tandem with the value of the underlying instrument. Depending on the terms of the particular contract, futures contracts are settled through either physical delivery of the underlying instrument on the settlement date or by payment of a cash settlement amount on the settlement date. During the period the futures contract is open, payments are received from or made to the broker based upon changes in the value of the contract (the variation margin). A decision as to whether, when and how to use futures contracts involves the exercise of skill and judgment and even a well-conceived futures transaction may be unsuccessful because of market behavior or unexpected events. In addition to the derivatives risks discussed above, the prices of futures contracts can be highly volatile, using futures contracts can lower total return and the potential loss from futures contracts can exceed the Fund's initial investment in such contracts. No assurance can be given
that a liquid market will exist for any particular futures contract at any particular time. There is also the risk of loss by the Fund of margin deposits in the event of bankruptcy of a broker with which the Fund has open positions in the futures contract.
Swaps: The Fund may enter into OTC swap contracts or cleared swap transactions. A swap contract is an agreement between two parties pursuant to which the parties exchange payments at specified dates on the basis of a specified notional amount, with the payments calculated by reference to specified securities, indices, reference rates, currencies or other instruments. Typically swap agreements provide that when the period payment dates for both parties are the same, the payments are made on a net basis (i.e., the two payment streams are netted out, with only the net amount paid by one party to the other). The Fund's obligations or rights under a swap contract entered into on a net basis will generally be equal only to the net amount to be paid or received under the agreement, based on the relative values of the positions held by each party. Cleared swap transactions may help reduce counterparty credit risk. In a cleared swap, the Fund's ultimate counterparty is a clearinghouse rather than a swap dealer, bank or other financial institution. OTC swap agreements are not entered into or traded on exchanges and often there is no central clearing or guaranty function for OTC swaps. These OTC swaps are often subject to credit risk or the risk of default or non-performance by the counterparty. Both OTC and cleared swaps could result in losses if interest rates, foreign currency exchange rates or other factors are not correctly anticipated by the Fund or if the reference index, security or investments do not perform as expected. During the period swap agreements are open, payments are received from or made to the clearinghouse or counterparty based upon changes in the value of the contract (variation margin). The Dodd-Frank Wall Street Reform and Consumer Protection Act and related regulatory developments require the clearing and exchange-trading of certain standardized swap transactions. Mandatory exchange-trading and clearing is occurring on a phased-in basis.
When the Fund has an unrealized loss on a swap agreement, the Fund has instructed the custodian to pledge cash or liquid securities as collateral with a value approximately equal to the amount of the unrealized loss. Collateral pledges are monitored and subsequently adjusted
46
Morgan Stanley Institutional Fund, Inc.
Annual Report — December 31, 2019
Notes to Consolidated Financial Statements (cont'd)
if and when the swap valuations fluctuate. If applicable, cash collateral is included with "Due from (to) Broker" in the Consolidated Statement of Assets and Liabilities.
Upfront payments paid or received by the Fund will be reflected as an asset or liability, respectively, in the Consolidated Statement of Assets and Liabilities.
FASB ASC 815, "Derivatives and Hedging" ("ASC 815"), is intended to improve financial reporting about derivative instruments by requiring enhanced disclosures to enable investors to better understand how and why the Fund uses derivative instruments, how these derivative instruments are accounted for and their effects on the Fund's financial position and results of operations.
The following tables set forth the fair value of the Fund's derivative contracts by primary risk exposure as of December 31, 2019:
| | | Asset Derivatives
Consolidated Statement
of Assets and
Liabilities Location | | Primary Risk
Exposure | | Value
(000) | |
Foreign Currency Forward
Exchange Contracts | | Unrealized Appreciation on
Foreign Currency Forward
Exchange Contracts | |
Currency Risk | | $ | 52 | | |
Futures Contracts | | Variation Margin on
Futures Contracts | |
Commodity Risk | | | 54 | (a) | |
Futures Contracts | | Variation Margin on
Futures Contracts | |
Equity Risk | | | 17 | (a) | |
Futures Contracts | | Variation Margin on
Futures Contracts | |
Interest Rate Risk | | | 27 | (a) | |
Swap Agreements | | Variation Margin on
Swap Agreements | |
Interest Rate Risk | | | 36 | (a) | |
Swap Agreements | | Unrealized Appreciation on
Swap Agreements | |
Equity Risk | | | 251 | | |
Total | | | | | | $ | 437 | | |
| | | Liability Derivatives
Consolidated Statement
of Assets and
Liabilities Location | | Primary Risk
Exposure | | Value
(000) | |
Foreign Currency Forward
Exchange Contracts | | Unrealized Depreciation on
Foreign Currency Forward
Exchange Contracts | |
Currency Risk | | $ | (12 | ) | |
Futures Contracts | | Variation Margin on
Futures Contract | |
Currency Risk | | | (103 | )(a) | |
Futures Contract | | Variation Margin on
Futures Contracts | |
Equity Risk | | | (43 | )(a) | |
Futures Contracts | | Variation Margin on
Futures Contracts | |
Interest Rate Risk | | | (2 | )(a) | |
Swap Agreements | | Variation Margin on
Swap Agreements | |
Credit Risk | | | (5 | )(a) | |
Swap Agreements | | Unrealized Depreciation on
Swap Agreements | |
Equity Risk | | | (247 | ) | |
Total | | | | | | $ | (412 | ) | |
(a) This amount represents the cumulative appreciation (depreciation) as reported in the Consolidated Portfolio of Investments. The Consolidated Statement of Assets and Liabilities only reflects the current day's net variation margin.
The following tables set forth by primary risk exposure the Fund's realized gains (losses) and change in unrealized appreciation (depreciation) by type of derivative contract for the year ended December 31, 2019 in accordance with ASC 815:
Realized Gain (Loss) | |
Primary Risk Exposure | | Derivative Type | | Value
(000) | |
Currency Risk | | Foreign Currency Forward
Exchange Contracts | | $ | (267 | ) | |
Commodity Risk | | Futures Contracts | | | 213 | | |
Currency Risk | | Futures Contracts | | | 456 | | |
Equity Risk | | Futures Contracts | | | (1,134 | ) | |
Interest Rate Risk | | Futures Contracts | | | (86 | ) | |
Credit Risk | | Swap Agreements | | | 27 | | |
Equity Risk | | Swap Agreements | | | (454 | ) | |
Interest Rate Risk | | Swap Agreements | | | (25 | ) | |
Total | | | | $ | (1,270 | ) | |
Change in Unrealized Appreciation (Depreciation) | |
Primary Risk Exposure | | Derivative Type | | Value
(000) | |
Currency Risk | | Foreign Currency Forward
Exchange Contracts | | $ | (233 | ) | |
Commodity Risk | | Futures Contracts | | | (19 | ) | |
Currency Risk | | Futures Contracts | | | (16 | ) | |
Equity Risk | | Futures Contracts | | | 284 | | |
Interest Rate Risk | | Futures Contracts | | | (75 | ) | |
Equity Risk | | Swap Agreements | | | (283 | ) | |
Credit Risk | | Swap Agreements | | | (5 | ) | |
Interest Rate Risk | | Swap Agreements | | | 87 | | |
Total | | | | $ | (260 | ) | |
At December 31, 2019, the Fund's derivative assets and liabilities are as follows:
Gross Amounts of Assets and Liabilities Presented in the
Consolidated Statement of Assets and Liabilities | |
Derivatives(b) | | Assets(c)
(000) | | Liabilities(c)
(000) | |
Foreign Currency Forward Exchange Contracts | | $ | 52 | | | $ | (12 | ) | |
Swap Agreements | | | 251 | | | | (247 | ) | |
Total | | $ | 303 | | | $ | (259 | ) | |
(b) Excludes exchange-traded derivatives.
(c) Absent an event of default or early termination, OTC derivative assets and liabilities are presented gross and not offset in the Consolidated Statement of Assets and Liabilities.
The Fund typically enters into International Swaps and Derivatives Association, Inc. Master Agreements ("ISDA Master Agreements") or similar master agreements (collectively, "Master Agreements") with its contract counterparties for certain OTC derivatives in order to, among other things, reduce its credit risk to counterparties. ISDA Master Agreements include provisions for general obligations, representations, collateral and events of default or termination. Under an ISDA Master Agreement, the Fund typically may offset with the
47
Morgan Stanley Institutional Fund, Inc.
Annual Report — December 31, 2019
Notes to Consolidated Financial Statements (cont'd)
counterparty certain OTC derivative financial instruments' payables and/or receivables with collateral held and/or posted and create one single net payment (close-out netting) in the event of default, termination and/or potential deterioration in the credit quality of the counterparty. Various Master Agreements govern the terms of certain transactions with counterparties, including transactions such as swap, forward, repurchase and reverse repurchase agreements. These Master Agreements typically attempt to reduce the counterparty risk associated with such transactions by specifying credit protection mechanisms and providing standardization that improves legal certainty. Cross-termination provisions under Master Agreements typically provide that a default in connection with one transaction between the Fund and a counterparty gives the non-defaulting party the right to terminate any other transactions in place with the defaulting party to create one single net payment due to/due from the defaulting party and may be a feature in certain Master Agreements. In the event the Fund exercises its right to terminate a Master Agreement after a counterparty experiences a termination event as defined in the Master Agreement, the return of collateral with market value in excess of the Fund's net liability may be delayed or denied.
The following table presents derivative financial instruments that are subject to enforceable netting arrangements as of December 31, 2019:
Gross Amounts Not Offset in the Consolidated Statement of Assets and Liabilities | |
Counterparty | | Gross Asset
Derivatives
Presented in the
Consolidated
Statement of
Assets and
Liabilities
(000) | | Financial
Instrument
(000) | | Collateral
Received
(000) | | Net Amount
(not less
than $0)
(000) | |
Bank of America NA | | $ | — | @ | | $ | (— | @) | | $ | — | | | $ | 0 | | |
BNP Paribas SA | | | 40 | | | | (8 | ) | | | — | | | | 32 | | |
Citibank NA | | | 1 | | | | (1 | ) | | | — | | | | 0 | | |
Commonwealth Bank
of Australia | | | — | @ | | | — | | | | — | | | | — | @ | |
Goldman Sachs
International | | | 22 | | | | (— | @) | | | — | | | | 22 | | |
JPMorgan Chase
Bank NA | | | 213 | | | | (212 | ) | | | — | | | | 1 | | |
UBS AG | | | 27 | | | | (4 | ) | | | — | | | | 23 | | |
Total | | $ | 303 | | | $ | (225 | ) | | $ | — | | | $ | 78 | | |
Gross Amounts Not Offset in the Consolidated Statement of Assets and Liabilities | |
Counterparty | | Gross Liability
Derivatives
Presented in the
Consolidated
Statement of
Assets and
Liabilities
(000) | | Financial
Instrument
(000) | | Collateral
Pledged
(000) | | Net Amount
(not less
than $0)
(000) | |
Bank of America NA | | $ | — | @ | | $ | (— | @) | | $ | — | | | $ | 0 | | |
Barclays Bank PLC | | | 5 | | | | — | | | | — | | | | 5 | | |
BNP Paribas SA | | | 8 | | | | (8 | ) | | | — | | | | 0 | | |
Citibank NA | | | 2 | | | | (1 | ) | | | — | | | | 1 | | |
Goldman Sachs
International | | | — | @ | | | (— | @) | | | — | | | | 0 | | |
JPMorgan Chase
Bank NA | | | 239 | | | | (212 | ) | | | — | | | | 27 | | |
State Street Bank
and Trust Co. | | | 1 | | | | — | | | | — | | | | 1 | | |
UBS AG | | | 4 | | | | (4 | ) | | | — | | | | 0 | | |
Total | | $ | 259 | | | $ | (225 | ) | | $ | — | | | $ | 34 | | |
@ Value is less than $500.
For the year ended December 31, 2019, the approximate average monthly amount outstanding for each derivative type is as follows:
Foreign Currency Forward Exchange Contracts: | |
Average monthly principal amount | | $ | 68,428,000 | | |
Futures Contracts: | |
Average monthly notional value | | $ | 38,253,000 | | |
Swap Agreements: | |
Average monthly notional amount | | $ | 9,193,000 | | |
5. Indemnifications: The Company enters into contracts that contain a variety of indemnifications. The Company's maximum exposure under these arrangements is unknown. However, the Company has not had prior claims or losses pursuant to these contracts and expects the risk of loss to be remote.
6. Dividends and Distributions to Shareholders: Dividends and distributions to shareholders are recorded on the ex-dividend date. Dividends from net investment income, if any, are declared and paid annually. Net realized capital gains, if any, are distributed at least annually.
7. Security Transactions, Income and Expenses: Security transactions are accounted for on the trade date (date the order to buy or sell is executed). Realized gains and losses on the sale of investment securities are determined on the specific identified cost method. Dividend income and other distributions are recorded on the ex-dividend date (except for certain foreign dividends
48
Morgan Stanley Institutional Fund, Inc.
Annual Report — December 31, 2019
Notes to Consolidated Financial Statements (cont'd)
which may be recorded as soon as the Fund is informed of such dividends) net of applicable withholding taxes. Interest income is recognized on the accrual basis except where collection is in doubt. Discounts are accreted and premiums are amortized over the life of the respective securities. Most expenses of the Company can be directly attributed to a particular Fund. Expenses which cannot be directly attributed are apportioned among the Funds based upon relative net assets or other appropriate methods. Income, expenses (other than class specific expenses — distribution and shareholder services, transfer agency and sub transfer agency fees) and realized and unrealized gains or losses are allocated to each class of shares based upon their relative net assets.
B. Advisory Fees: The Adviser, a wholly-owned subsidiary of Morgan Stanley, provides the Fund with advisory services under the terms of an Investment Advisory Agreement, paid quarterly, at the annual rate based on the daily net assets as follows:
First $750
million | | Next $750
million | | Over $1.5
billion | |
| | 0.85 | % | | | 0.80 | % | | | 0.75 | % | |
For the year ended December 31, 2019, the advisory fee rate (net of waiver/rebate) was equivalent to an annual effective rate of 0.00% of the Fund's average daily net assets.
The Adviser has agreed to reduce its advisory fee and/or reimburse the Fund so that total annual Fund operating expenses, excluding certain investment related expenses, taxes, interest and other extraordinary expenses (including litigation), will not exceed 1.10% for Class I shares, 1.45% for Class A shares, 1.95% for Class L shares, 2.20% for Class C shares and 1.07% for Class IS shares. The fee waivers and/or expense reimbursements will continue for at least one year from the date of the Fund's prospectus or until such time as the Directors act to discontinue all or a portion of such waivers and/or reimbursements when they deem such action is appropriate. For the year ended December 31, 2019, approximately $236,000 of advisory fees were waived and approximately $204,000 of other expenses were reimbursed by the Adviser pursuant to this arrangement.
The Adviser provides investment advisory services to the Subsidiary pursuant to the Subsidiary Investment Management Agreement (the "Agreement"). Under the Agreement, the Subsidiary will pay the Adviser at the end of each fiscal quarter, calculated by applying a quarterly rate, based on the annual rate of 0.05%, to the average daily net assets of the Subsidiary.
The Adviser has agreed to waive its advisory fees by the amount of advisory fees it receives from the Subsidiary.
C. Administration Fees: The Adviser also serves as Administrator to the Company and provides administrative services pursuant to an Administration Agreement for an annual fee, accrued daily and paid monthly, of 0.08% of the Fund's average daily net assets.
Under a Sub-Administration Agreement between the Administrator and State Street Bank and Trust Company ("State Street"), State Street provides certain administrative services to the Company. For such services, the Administrator pays State Street a portion of the fee the Administrator receives from the Fund.
D. Distribution and Shareholder Services Fees: Morgan Stanley Distribution, Inc. ("MSDI" or the "Distributor"), a wholly-owned subsidiary of the Adviser and an indirect subsidiary of Morgan Stanley, serves as the Company's Distributor of Fund shares pursuant to a Distribution Agreement. The Company has adopted a Shareholder Services Plan with respect to Class A shares pursuant to Rule 12b-1 under the Act. Under the Shareholder Services Plan, the Fund pays the Distributor a shareholder services fee, accrued daily and paid monthly, at an annual rate of 0.25% of the Fund's average daily net assets attributable to Class A shares.
The Company has adopted a Distribution and Shareholder Services Plan with respect to Class L shares pursuant to Rule 12b-1 under the Act. Under the Distribution and Shareholder Services Plan, the Fund pays the Distributor a distribution fee, accrued daily and paid monthly, at an annual rate of 0.50% and a shareholder services fee, accrued daily and paid monthly, at an annual rate of 0.25% of the Fund's average daily net assets attributable to Class L shares.
The Company has adopted a Distribution and Shareholder Services Plan with respect to Class C shares pursuant to Rule 12b-1 under the Act. Under the Distribution and Shareholder Services Plan, the Fund pays the Distributor a distribution fee, accrued daily and paid monthly, at an annual rate of 0.75% and a shareholder services fee, accrued daily and paid monthly, at an annual rate of 0.25% of the Fund's average daily net assets attributable to Class C shares.
The distribution and shareholder services fees are used to support the expenses associated with servicing and maintaining accounts. The Distributor may compensate other parties for providing shareholder support services to investors who purchase Class A, Class L and Class C shares.
49
Morgan Stanley Institutional Fund, Inc.
Annual Report — December 31, 2019
Notes to Consolidated Financial Statements (cont'd)
E. Dividend Disbursing and Transfer Agent: The Company's dividend disbursing and transfer agent is DST Asset Manager Solutions, Inc. ("DST"). Pursuant to a Transfer Agency Agreement, the Company pays DST a fee based on the number of classes, accounts and transactions relating to the Funds of the Company.
F. Custodian Fees: State Street (the "Custodian") also serves as Custodian for the Company in accordance with a Custodian Agreement. The Custodian holds cash, securities and other assets of the Company as required by the Act. Custody fees are payable monthly based on assets held in custody, investment purchases and sales activity and account maintenance fees, plus reimbursement for certain out-of-pocket expenses.
G. Security Transactions and Transactions with Affiliates: For the year ended December 31, 2019, purchases and sales of investment securities for the Fund, other than long-term U.S. Government securities and short-term investments were approximately $30,495,000 and $33,953,000, respectively. For the year ended December 31, 2019, purchases and sales of long-term U.S. Government securities were approximately $2,675,000 and $11,377,000, respectively.
The Fund invests in the Institutional Class of the Morgan Stanley Institutional Liquidity Funds — Government Portfolio (the "Liquidity Funds"), an open-end management investment company managed by the Adviser. Advisory fees paid by the Fund are reduced by an amount equal to its pro-rata share of the advisory and administration fees paid by the Fund due to its investment in the Liquidity Funds. For the year ended December 31, 2019, advisory fees paid were reduced by approximately $11,000 relating to the Fund's investment in the Liquidity Funds.
A summary of the Fund's transactions in shares of affiliated investments during the year ended December 31, 2019 is as follows:
Affiliated
Investment
Company | | Value
December 31,
2018
(000) | | Purchases
at Cost
(000) | | Proceeds
from Sales
(000) | | Dividend
Income
(000) | |
Liquidity Funds | | $ | 10,467 | | | $ | 49,120 | | | $ | 50,045 | | | $ | 127 | | |
Affiliated
Investment
Company (cont'd) | | Realized
Gain
(Loss)
(000) | | Change in
Unrealized
Appreciation
(Depreciation)
(000) | | Value
December 31,
2019
(000) | |
Liquidity Funds | | $ | — | | | $ | — | | | $ | 9,542 | | |
The Fund is permitted to purchase and sell securities ("cross-trade") from and to other Morgan Stanley funds as well as
other funds and client accounts for which the Adviser or an affiliate of the Adviser serves as investment adviser, pursuant to procedures approved by the Directors in compliance with Rule 17a-7 under the Act (the "Rule"). Each cross-trade is executed at the current market price in compliance with provisions of the Rule. For the year ended December 31, 2019, the Fund did not engage in any cross-trade transactions.
The Fund has an unfunded Deferred Compensation Plan (the "Compensation Plan"), which allows each independent Director to defer payment of all, or a portion, of the fees he or she receives for serving on the Board of Directors. Each eligible Director generally may elect to have the deferred amounts credited with a return equal to the total return on one or more of the Morgan Stanley funds that are offered as investment options under the Compensation Plan. Appreciation/depreciation and distributions received from these investments are recorded with an offsetting increase/decrease in the deferred compensation obligation and do not affect the NAV of the Fund.
H. Federal Income Taxes: It is the Fund's intention to continue to qualify as a regulated investment company and distribute all of its taxable and tax-exempt income. Accordingly, no provision for federal income taxes is required in the consolidated financial statements.
The Fund may be subject to taxes imposed by countries in which it invests. Such taxes are generally based on income and/or capital gains earned or repatriated. Taxes are accrued based on net investment income, net realized gains and net unrealized appreciation as such income and/or gains are earned. Taxes may also be based on transactions in foreign currency and are accrued based on the value of investments denominated in such currency.
FASB ASC 740-10, "Income Taxes — Overall", sets forth a minimum threshold for consolidated financial statement recognition of the benefit of a tax position taken or expected to be taken in a tax return. Management has concluded there are no significant uncertain tax positions that would require recognition in the consolidated financial statements. If applicable, the Fund recognizes interest accrued related to unrecognized tax benefits in "Interest Expense" and penalties in "Other Expenses" in the Consolidated Statement of Operations. The Fund files tax returns with the U.S. Internal Revenue Service, New York and various states. Generally, each of the tax years in the four-year period ended December 31, 2019 remains subject to examination by taxing authorities.
50
Morgan Stanley Institutional Fund, Inc.
Annual Report — December 31, 2019
Notes to Consolidated Financial Statements (cont'd)
The tax character of distributions paid may differ from the character of distributions shown for GAAP purposes due to short-term capital gains being treated as ordinary income for tax purposes. The tax character of distributions paid during fiscal years 2019 and 2018 was as follows:
2019 Distributions
Paid From:
Ordinary Income
(000) | | 2018 Distributions
Paid From:
Ordinary Income
(000) | |
| $ | 806 | | | $ | 1,199 | | |
The amount and character of income and gains to be distributed are determined in accordance with income tax regulations which may differ from GAAP. These book/tax differences are either considered temporary or permanent in nature.
Temporary differences are attributable to differing book and tax treatments for the timing of the recognition of gains (losses) on certain investment transactions and the timing of the deductibility of certain expenses.
Permanent differences, primarily due to a net operating loss, resulted in the following reclassifications among the components of net assets at December 31, 2019:
Total
Accumulated
Loss
(000) | | Paid-in
Capital
(000) | |
| $ | 236 | | | $ | (236 | ) | |
At December 31, 2019, the Fund had no distributable earnings on a tax basis.
At December 31, 2019, the Fund had available for federal income tax purposes unused short-term and long-term capital losses of approximately $85,178,000 and $1,180,000, respectively, that do not have an expiration date.
To the extent that capital loss carryforwards are used to offset any future capital gains realized, no capital gains tax liability will be incurred by the Fund for gains realized and not distributed. To the extent that capital gains are offset, such gains will not be distributed to the shareholders.
I. Credit Facility: The Company and other Morgan Stanley funds participated in a $150,000,000 committed, unsecured revolving line of credit facility (the "Facility") with State Street. Effective April 22, 2019, the committed line amount increased to $300,000,000. This Facility is to be used for temporary emergency purposes or funding of shareholder redemption requests. The interest rate on borrowings is based on the federal funds rate or 1 month LIBOR rate plus a spread. The Facility also has a commitment fee of 0.25% per annum based on the unused portion of the Facility. During the year ended
December 31, 2019, the Fund did not have any borrowings under the Facility.
J. Other: At December 31, 2019, the Fund had record owners of 10% or greater. Investment activities of these shareholders could have a material impact on the Fund. The aggregate percentage of such owners was 82.6%.
K. Accounting Pronouncement: In March 2017, FASB issued an Accounting Standard Update, ASU 2017-08, Receivables-Nonrefundable Fees and Other Costs (Subtopic 310-20), Premium Amortization on Purchased Callable Debt Securities ("ASU 2017-08") which amends the amortization period for certain purchased callable debt securities held at a premium, shortening such period to the earliest call date. ASU 2017-08 does not require any accounting change for debt securities held at a discount; the discount continues to be accreted to maturity. ASU 2017-08 is effective for fiscal years, and interim periods within those fiscal years, beginning after December 15, 2018. The Fund has adopted ASU 2017-08 as of December 31, 2019 and it did not have an impact on the Fund's consolidated financial statements.
51
Morgan Stanley Institutional Fund, Inc.
Annual Report — December 31, 2019
Report of Independent Registered Public Accounting Firm
To the Shareholders and Board of Directors of
Morgan Stanley Institutional Fund, Inc. —
Multi-Asset Portfolio
Opinion on the Financial Statements
We have audited the accompanying consolidated statement of assets and liabilities of Multi-Asset Portfolio (the "Fund") (one of the funds constituting Morgan Stanley Institutional Fund, Inc. (the "Company")), including the consolidated portfolio of investments, as of December 31, 2019, and the related consolidated statement of operations for the year then ended, the consolidated statements of changes in net assets for each of the two years in the period then ended, the consolidated financial highlights for each of the five years in the period then ended and the related notes (collectively referred to as the "consolidated financial statements"). In our opinion, the consolidated financial statements present fairly, in all material respects, the financial position of Multi-Asset Portfolio (one of the funds constituting Morgan Stanley Institutional Fund, Inc.) at December 31, 2019, the consolidated results of its operations for the year then ended, the consolidated changes in its net assets for each of the two years in the period then ended and its consolidated financial highlights for each of the five years in the period then ended, in conformity with U.S. generally accepted accounting principles.
Basis for Opinion
These consolidated financial statements are the responsibility of the Company's management. Our responsibility is to express an opinion on the Fund's consolidated financial statements based on our audits. We are a public accounting firm registered with the Public Company Accounting Oversight Board (United States) ("PCAOB") and are required to be independent with respect to the Company in accordance with the U.S. federal securities law and the applicable rules and regulations of the Securities and Exchange Commission and the PCAOB.
We conducted our audits in accordance with the standards of the PCAOB. Those standards require that we plan and perform the audit to obtain reasonable assurance about whether the financial statements are free of material misstatement, whether due to error or fraud. The Company is not required to have, nor were we engaged to perform, an audit of the Company's internal control over financial reporting. As part of our audits, we are required to obtain an understanding of internal control over financial reporting, but not for the purpose of expressing an opinion on the effectiveness of the Company's internal control over financial reporting. Accordingly, we express no such opinion.
Our audits included performing procedures to assess the risks of material misstatement of the financial statements, whether due to error or fraud, and performing procedures that respond to those risks. Such procedures included examining, on a test basis, evidence regarding the amounts and disclosures in the financial statements. Our procedures included confirmation of securities owned as of December 31, 2019 by correspondence with the custodian and others or by other appropriate auditing procedures where replies from others were not received. Our audits also included evaluating the accounting principles used and significant estimates made by management, as well as evaluating the overall presentation of the financial statements. We believe that our audits provide a reasonable basis for our opinion.

We have served as the auditor of one or more Morgan Stanley investment companies since 2000.
Boston, Massachusetts
February 27, 2020
52
Morgan Stanley Institutional Fund, Inc.
Annual Report — December 31, 2019
Federal Tax Notice (unaudited)
For federal income tax purposes, the following information is furnished with respect to the distributions paid by the Fund during its taxable year ended December 31, 2019. For corporate shareholders 2.58% of the dividends qualified for the dividends received deduction.
For federal income tax purposes, the following information is furnished with respect to the Fund's earnings for its taxable year ended December 31, 2019. When distributed, certain earnings may be subject to a maximum tax rate of 15% as provided for by the Jobs and Growth Tax Relief Reconciliation Act of 2003. The Fund designated up to a maximum of approximately $303,000 as taxable at this lower rate.
In January, the Fund provides tax information to shareholders for the preceding calendar year.
53
Privacy Notice (unaudited) April 2019
FACTS | | WHAT DOES MSIM DO WITH YOUR PERSONAL INFORMATION? | |
Why? | | Financial companies choose how they share your personal information. Federal law gives consumers the right to limit some but not all sharing. Federal law also requires us to tell you how we collect, share, and protect your personal information. Please read this notice carefully to understand what we do. | |
What? | | The types of personal information we collect and share depend on the product or service you have with us. This information can include:
n Social Security number and income
n investment experience and risk tolerance
n checking account number and wire transfer instructions | |
How? | | All financial companies need to share customers' personal information to run their everyday business. In the section below, we list the reasons financial companies can share their customers' personal information; the reasons MSIM chooses to share; and whether you can limit this sharing. | |
Reasons we can share your personal information | | Does MSIM share? | | Can you limit this sharing? | |
For our everyday business purposes —
such as to process your transactions, maintain your account(s), respond to court orders and legal investigations, or report to credit bureaus | | Yes | | No | |
For our marketing purposes —
to offer our products and services to you | | Yes | | No | |
For joint marketing with other financial companies | | No | | We don't share | |
For our affiliates' everyday business purposes —
information about your transactions and experiences | | Yes | | No | |
For our affiliates' everyday business purposes —
information about your creditworthiness | | No | | We don't share | |
For our affiliates to market to you | | No | | We don't share | |
For non-affiliates to market to you | | No | | We don't share | |
Questions? Call toll-free (844) 312-6327 or email: imprivacyinquiries@morganstanley.com
54
Privacy Notice (unaudited) (cont'd) April 2019
Who we are
Who is providing this notice? | | Morgan Stanley Investment Management, Inc. and its affiliated registered investment advisers, registered broker-dealers, and registered and unregistered funds ("MSIM") | |
What we do
How does MSIM protect my personal information? | | To protect your personal information from unauthorized access and use, we use security measures that comply with federal law. These measures include computer safeguards and secured files and buildings. We have policies governing the proper handling of customer information by personnel and requiring third parties that provide support to adhere to appropriate security standards with respect to such information. | |
How does MSIM collect my personal information? | | We collect your personal information, for example, when you
n open an account or make deposits or withdrawals from your account
n buy securities from us or make a wire transfer
n give us your contact information
We also collect your personal information from others, such as credit bureaus, affiliates, or other companies. | |
Why can't I limit all sharing? | | Federal law gives you the right to limit only
n sharing for affiliates' everyday business purposes — information about your creditworthiness
n affiliates from using your information to market to you
n sharing for non-affiliates to market to you
State laws and individual companies may give you additional rights to limit sharing. See below for more on your rights under state law. | |
Definitions
Affiliates | | Companies related by common ownership or control. They can be financial and non-financial companies.
n Our affiliates include companies with a Morgan Stanley name and financial companies such as Morgan Stanley Smith Barney LLC and Morgan Stanley & Co. | |
Non-affiliates | | Companies not related by common ownership or control. They can be financial and non-financial companies.
n MSIM does not share with non-affiliates so they can market to you. | |
Joint marketing | | A formal agreement between non-affiliated financial companies that together market financial products or services to you.
n MSIM doesn't jointly market | |
Other Important Information
Vermont: Except as permitted by law, we will not share personal information we collect about Vermont residents with Non-affiliates unless you provide us with your written consent to share such information.
California: Except as permitted by law, we will not share personal information we collect about California residents with Non-affiliates and we will limit sharing such personal information with our Affiliates to comply with California privacy laws that apply to us.
55
Morgan Stanley Institutional Fund, Inc.
Annual Report — December 31, 2019
Director and Officer Information (unaudited)
Independent Directors:
Name, Birth Year
and Address of
Independent Director | | Position(s)
Held with
Registrant | | Length of Time
Served* | | Principal Occupation(s) During Past 5 Years
and Other Relevant Professional Experience | | Number of
Funds in
Fund Complex
Overseen by
Independent
Director** | | Other Directorships
Held by Independent
Director*** | |
Frank L. Bowman
c/o Perkins Coie LLP
Counsel to the Independent Directors
1155 Avenue of the Americas
New York, NY 10036
Birth Year 1944 | | Director | | Since
August 2006 | | President, Strategic Decisions, LLC (consulting) (since February 2009); Director or Trustee of various Morgan Stanley Funds (since August 2006); Chairperson of the Compliance and Insurance Committee (since October 2015); formerly, Chairperson of the Insurance Sub-Committee of the Compliance and Insurance Committee (2007-2015); served as President and Chief Executive Officer of the Nuclear Energy Institute (policy organization) (February 2005-November 2008); retired as Admiral, U.S. Navy after serving over 38 years on active duty including 8 years as Director of the Naval Nuclear Propulsion Program in the Department of the Navy and the U.S. Department of Energy (1996-2004); served as Chief of Naval Personnel (July 1994-September 1996) and on the Joint Staff as Director of Political Military Affairs (June 1992-July 1994); knighted as Honorary Knight Commander of the Most Excellent Order of the British Empire; awarded the Officier de l'Orde National du Mérite by the French Government; elected to the National Academy of Engineering (2009). | | | 86 | | | Director of Naval and Nuclear Technologies LLP; Director Emeritus of the Armed Services YMCA; Member of the National Security Advisory Council of the Center for U.S. Global Engagement and a member of the CNA Military Advisory Board; Trustee of Fairhaven United Methodist Church; Member of the Board of Advisors of the Dolphin Scholarship Foundation; Director of other various non-profit organizations; formerly, Director of BP p.l.c. (November 2010-May 2019). | |
Kathleen A. Dennis
c/o Perkins Coie LLP
Counsel to the Independent Directors
1155 Avenue of the Americas
New York, NY 10036
Birth Year 1953 | | Director | | Since August 2006 | | President, Cedarwood Associates (mutual fund and investment management consulting) (since July 2006); Chairperson of the Liquidity and Alternatives Sub-Committee of the Investment Committee (since October 2006) and Director or Trustee of various Morgan Stanley Funds (since August 2006); formerly, Senior Managing Director of Victory Capital Management (1993-2006). | | | 86 | | | Director of various non-profit organizations. | |
Nancy C. Everett
c/o Perkins Coie LLP
Counsel to the Independent Directors
1155 Avenue of the Americas
New York, NY 10036
Birth Year 1955 | | Director | | Since January 2015 | | Chief Executive Officer, Virginia Commonwealth University Investment Company (since November 2015); Owner, OBIR, LLC (institutional investment management consulting) (since June 2014); formerly, Managing Director, BlackRock, Inc. (February 2011-December 2013); and Chief Executive Officer, General Motors Asset Management (a/k/a Promark Global Advisors, Inc.) (June 2005-May 2010). | | | 87 | | | Formerly, Member of Virginia Commonwealth University School of Business Foundation (2005-2016); Member of Virginia Commonwealth University Board of Visitors (2013-2015); Member of Committee on Directors for Emerging Markets Growth Fund, Inc. (2007-2010); Chairperson of Performance Equity Management, LLC (2006-2010); and Chairperson, GMAM Absolute Return Strategies Fund, LLC (2006-2010). | |
56
Morgan Stanley Institutional Fund, Inc.
Annual Report — December 31, 2019
Director and Officer Information (unaudited) (cont'd)
Independent Directors: (cont'd)
Name, Birth Year
and Address of
Independent Director | | Position(s)
Held with
Registrant | | Length of Time
Served* | | Principal Occupation(s) During Past 5 Years
and Other Relevant Professional Experience | | Number of
Funds in
Fund Complex
Overseen by
Independent
Director** | | Other Directorships
Held by Independent
Director*** | |
Jakki L. Haussler
c/o Perkins Coie LLP
Counsel to the Independent Directors
1155 Avenue of the Americas
New York, NY 10036
Birth Year 1957 | | Director | | Since January 2015 | | Chairman, Opus Capital Group (since 1996); formerly, Chief Executive Officer, Opus Capital Group (1996-2019); Director, Capvest Venture Fund, LP (May 2000-December 2011); Partner, Adena Ventures, LP (July 1999-December 2010); Director, The Victory Funds (February 2005-July 2008). | | | 87 | | | Director of Service Corporation International and Member, Audit Committee and Investment Committee; Director of Cincinnati Bell Inc. and Member, Audit Committee and Governance and Nominating Committee; Chairman of Northern Kentucky University Member Investment Committee; Member of Chase College of Law Transactional Law Practice Center Board of Advisors; Director of Best Transport; Director of Chase College of Law Board of Visitors; formerly, Member, University of Cincinnati Foundation Investment Committee; Member, Miami University Board of Visitors (2008-2011); Trustee of Victory Funds (2005-2008) and Chairman, Investment Committee (2007-2008) and Member, Service Provider Committee (2005-2008). | |
Dr. Manuel H. Johnson
c/o Johnson Smick International, Inc.
220 I Street, NE — Suite 200
Washington, D.C. 20002
Birth Year 1949 | | Director | | Since July 1991 | | Senior Partner, Johnson Smick International, Inc. (consulting firm); Chairperson of the Investment Committee (since October 2006) and Director or Trustee of various Morgan Stanley Funds (since July 1991); Co-Chairman and a founder of the Group of Seven Council (G7C) (international economic commission); formerly, Chairperson of the Audit Committee (July 1991-September 2006), Vice Chairman of the Board of Governors of the Federal Reserve System and Assistant Secretary of the U.S. Treasury. | | | 86 | | | Director of NVR, Inc. (home construction). | |
Joseph J. Kearns
c/o Perkins Coie LLP
Counsel to the Independent Directors
1155 Avenue of the Americas
New York, NY 10036
Birth Year 1942 | | Director | | Since August 1994 | | Senior Adviser, Kearns & Associates LLC (investment consulting); Chairperson of the Audit Committee (since October 2006) and Director or Trustee of various Morgan Stanley Funds (since August 1994); formerly, Deputy Chairperson of the Audit Committee (July 2003-September 2006) and Chairperson of the Audit Committee of various Morgan Stanley Funds (since August 1994); CFO of the J. Paul Getty Trust. | | | 87 | | | Prior to August 10, 2016, Director of Electro Rent Corporation (equipment leasing); Prior to December 31, 2013, Director of The Ford Family Foundation. | |
57
Morgan Stanley Institutional Fund, Inc.
Annual Report — December 31, 2019
Director and Officer Information (unaudited) (cont'd)
Independent Directors: (cont'd)
Name, Birth Year
and Address of
Independent Director | | Position(s)
Held with
Registrant | | Length of Time
Served* | | Principal Occupation(s) During Past 5 Years
and Other Relevant Professional Experience | | Number of
Funds in
Fund Complex
Overseen by
Independent
Director** | | Other Directorships
Held by Independent
Director*** | |
Michael F. Klein
c/o Perkins Coie LLP
Counsel to the Independent Directors
1155 Avenue of the Americas
New York, NY 10036
Birth Year 1958 | | Director | | Since August 2006 | | Managing Director, Aetos Alternatives Management, LP (since March 2000); Co-President, Aetos Alternatives Management, LP (since January 2004) and Co-Chief Executive Officer of Aetos Alternatives Management, LP (since August 2013); Chairperson of the Fixed Income Sub-Committee of the Investment Committee (since October 2006) and Director or Trustee of various Morgan Stanley Funds (since August 2006); formerly, Managing Director, Morgan Stanley & Co. Inc. and Morgan Stanley Dean Witter Investment Management and President, various Morgan Stanley Funds (June 1998-March 2000); Principal, Morgan Stanley & Co. Inc. and Morgan Stanley Dean Witter Investment Management (August 1997-December 1999). | | | 86 | | | Director of certain investment funds managed or sponsored by Aetos Alternatives Management, LP; Director of Sanitized AG and Sanitized Marketing AG (specialty chemicals). | |
Patricia Maleski
c/o Perkins Coie LLP
Counsel to the Independent Directors
1155 Avenue of the Americas
New York, NY 10036
Birth Year 1960 | | Director | | Since January 2017 | | Managing Director, JPMorgan Asset Management (2004-2016); Oversight and Control Head of Fiduciary and Conflicts of Interest Program (2015-2016); Chief Control Officer-Global Asset Management (2013-2015); President, JPMorgan Funds (2010-2013); Chief Administrative Officer (2004-2013); various other positions including Treasurer and Board Liaison (since 2001). | | | 87 | | | None. | |
Michael E. Nugent
522 Fifth Avenue
New York, NY 10036
Birth Year 1936 | | Chair of the Board and Director | | Chair of the Boards since July 2006 and Director since July 1991 | | Chair of the Boards of various Morgan Stanley Funds (since July 2006); Chairperson of the Governance Committee (since January 2019) and Director or Trustee of various Morgan Stanley Funds (since July 1991); formerly, Chairperson of each of the Closed-End Fund committee (until December 2019) and the Insurance Committee (until July 2006); General Partner, Triumph Capital, L.P. (private investment partnership) (1988-2013). | | | 86 | | | None. | |
W. Allen Reed
c/o Perkins Coie LLP
Counsel to the Independent Directors
1155 Avenue of the Americas
New York, NY 10036
Birth Year 1947 | | Vice Chair of the Board and Director | | Vice Chair of the Boards since January 2020 and Director since August 2006 | | Chairperson of the Equity Sub-Committee of the Investment Committee (since October 2006) and Director or Trustee of various Morgan Stanley Funds (since August 2006); formerly, President and CEO of General Motors Asset Management; Chairman and Chief Executive Officer of the GM Trust Bank and Corporate Vice President of General Motors Corporation (August 1994-December 2005). | | | 86 | | | Formerly, Director of Legg Mason, Inc.; formerly, Director of the Auburn University Foundation (2010-2015). | |
* This is the earliest date the Director began serving the Morgan Stanley Funds. Each Director serves an indefinite term, until his or her successor is elected.
** The Fund Complex includes (as of December 31, 2019) all open-end and closed-end funds (including all of their portfolios) advised by Morgan Stanley Investment Management Inc. (the "Adviser") and any funds that have an adviser that is an affiliated person of the Adviser (including, but not limited to, Morgan Stanley AIP GP LP).
*** This includes any directorships at public companies and registered investment companies held by the Director at any time during the past five years.
58
Morgan Stanley Institutional Fund, Inc.
Annual Report — December 31, 2019
Director and Officer Information (unaudited) (cont'd)
Executive Officers:
Name, Birth Year and Address of
Executive Officer | | Position(s) Held
with
Registrant | | Length of
Time Served* | | Principal Occupation(s) During Past 5 Years | |
John H. Gernon
522 Fifth Avenue
New York, NY 10036
Birth Year 1963 | | President and Principal Executive Officer | | Since September 2013 | | President and Principal Executive Officer of the Equity and Fixed Income Funds and the Morgan Stanley AIP Funds (since September 2013) and the Liquidity Funds and various money market funds (since May 2014) in the Fund Complex; Managing Director of the Adviser; Head of Product (since 2006). | |
Timothy J. Knierim
522 Fifth Avenue
New York, NY 10036
Birth Year 1959 | | Chief Compliance Officer | | Since December 2016 | | Managing Director of the Adviser and various entities affiliated with the Adviser; Chief Compliance Officer of various Morgan Stanley Funds and the Adviser (since December 2016) and Chief Compliance Officer of Morgan Stanley AIP GP LP (since 2014). Formerly, Managing Director and Deputy Chief Compliance Officer of the Adviser (2014-2016); and formerly, Chief Compliance Officer of Prudential Investment Management, Inc. (2007-2014). | |
Francis J. Smith
522 Fifth Avenue
New York, NY 10036
Birth Year 1965 | | Treasurer and Principal Financial Officer | | Treasurer since July 2003 and Principal Financial Officer since September 2002 | | Managing Director of the Adviser and various entities affiliated with the Adviser; Treasurer (since July 2003) and Principal Financial Officer of various Morgan Stanley Funds (since September 2002). | |
Mary E. Mullin
522 Fifth Avenue
New York, NY 10036
Birth Year 1967 | | Secretary | | Since June 1999 | | Managing Director of the Adviser; Secretary of various Morgan Stanley Funds (since June 1999). | |
Michael J. Key
522 Fifth Avenue
New York, NY 10036
Birth Year 1979 | | Vice President | | Since June 2017 | | Vice President of the Equity and Fixed Income Funds, Liquidity Funds, various money market funds and the Morgan Stanley AIP Funds in the Fund Complex (since June 2017); Executive Director of the Adviser; Head of Product Development for Equity and Fixed Income Funds (since August 2013). | |
* This is the earliest date the officer began serving the Morgan Stanley Funds. Each officer serves a one-year term, until his or her successor is elected and qualifies.
59
Morgan Stanley Institutional Fund, Inc.
Annual Report — December 31, 2019
Adviser and Administrator
Morgan Stanley Investment Management Inc.
522 Fifth Avenue
New York, New York 10036
Distributor
Morgan Stanley Distribution, Inc.
522 Fifth Avenue
New York, New York 10036
Dividend Disbursing and Transfer Agent
DST Asset Manager Solutions, Inc.
2000 Crown Colony Drive
Quincy, Massachusetts 02169
Custodian
State Street Bank and Trust Company
One Lincoln Street
Boston, Massachusetts 02111
Legal Counsel
Dechert LLP
1095 Avenue of the Americas
New York, New York 10036
Counsel to the Independent Directors
Perkins Coie LLP
1155 Avenue of the Americas
New York, New York 10036
Independent Registered Public Accounting Firm
Ernst & Young LLP
200 Clarendon Street
Boston, Massachusetts 02116
Reporting to Shareholders
Each Morgan Stanley fund provides a complete schedule of portfolio holdings in its Semi-Annual and the Annual Reports within 60 days of the end of the fund's second and fourth fiscal quarters. The Semi-Annual and Annual Reports are filed electronically with the Securities and Exchange Commission ("SEC") on Form N-CSRS and Form N-CSR, respectively. Morgan Stanley also delivers the Semi-Annual and Annual Reports to fund shareholders and makes these reports available on its public website, www.morganstanley.com/im/shareholderreports. Each Morgan Stanley non-money market fund also files a complete schedule of portfolio holdings with the SEC for the fund's first and third fiscal quarters as an attachment to Form N-PORT. Morgan Stanley does not deliver the reports for the first and third fiscal quarters to shareholders, nor are the reports posted to the Morgan Stanley public website. However, the holdings for each money market fund are posted to the Morgan Stanley public website. You may obtain the Form N-PORT filings (as well as the Form N-CSR and N-CSRS filings) by accessing the SEC's website, www.sec.gov. You can also request copies of these materials, upon payment of a duplicating fee, by electronic request at the SEC's email address (publicinfo@sec.gov).
Proxy Voting Policies and Procedures and Proxy Voting Record
You may obtain a copy of the Company's Proxy Voting Policy and Procedures and information regarding how the Company voted proxies relating to portfolio securities during the most recent twelve-month period ended June 30, without charge, upon request, by calling toll free 1 (800) 548-7786 or by visiting our website at www.morganstanley.com/im/shareholderreports. This information is also available on the SEC's website at www.sec.gov.
This report is authorized for distribution only when preceded or accompanied by a prospectus or summary prospectus of the applicable fund of Morgan Stanley Institutional Fund, Inc., which describes in detail the fund's investment policies, risks, fees and expenses. Please read the prospectus carefully before you invest or send money. For additional information, including information regarding the investments comprising the Fund, please visit our website at www.morganstanley.com/im/shareholderreports or call toll free 1 (800) 548-7786.
60
Printed in U.S.A.
This Report has been prepared for shareholders and may be distributed to others only if preceded or accompanied by a current prospectus.
Morgan Stanley Investment Management Inc.
522 Fifth Avenue
New York, New York 10036
© 2020 Morgan Stanley. Morgan Stanley Distribution, Inc.

IFIMAANN
2918228 EXP. 02.28.21

Morgan Stanley Institutional Fund, Inc.
Global
Infrastructure Portfolio
Annual Report
December 31, 2019
Beginning on January 1, 2021, as permitted by regulations adopted by the Securities and Exchange Commission ("SEC"), paper copies of the Fund's Annual and Semi-Annual Reports to Shareholders ("Shareholder Reports") will no longer be sent by mail, unless you specifically request paper copies of the Shareholder Reports from the Fund or from your financial intermediary, such as a broker-dealer or a bank. Instead, the Shareholder Reports will be made available on the Fund's website, https://www.morganstanley.com/im/shareholderreports and you will be notified by mail each time a Shareholder Report is posted and provided with a website link to access the Shareholder Report. If you already elected to receive Shareholder Reports electronically, you will not be affected by this change and you need not take any action. You may elect to receive Shareholder Reports and other communications from the Fund electronically anytime by contacting your financial intermediary or, if you are a direct investor, please follow the instructions on the envelope.
Beginning on January 1, 2019, you may elect to receive all future Shareholder Reports in paper free of charge. If you invest through a financial intermediary, you can contact your financial intermediary to request that you continue to receive paper copies of your Shareholder Reports. If you invest directly with the Fund, please follow the instructions on the envelope to let the Fund know you wish to continue receiving paper copies of your Shareholder Reports. Your election to receive Shareholder Reports in paper will apply to all funds held in your account if you invest through your financial intermediary or all funds held with the fund complex if you invest directly with a fund.

Morgan Stanley Institutional Fund, Inc.
Annual Report — December 31, 2019
Shareholders' Letter | | | 2 | | |
Expense Example | | | 3 | | |
Investment Overview | | | 4 | | |
Portfolio of Investments | | | 7 | | |
Statement of Assets and Liabilities | | | 9 | | |
Statement of Operations | | | 11 | | |
Statements of Changes in Net Assets | | | 12 | | |
Financial Highlights | | | 14 | | |
Notes to Financial Statements | | | 20 | | |
Report of Independent Registered Public Accounting Firm | | | 27 | | |
Federal Tax Notice | | | 28 | | |
Privacy Notice | | | 29 | | |
Director and Officer Information | | | 31 | | |
This report is authorized for distribution only when preceded or accompanied by a prospectus or summary prospectus of the applicable Fund of Morgan Stanley Institutional Fund, Inc. To receive a prospectus and/or statement of additional information ("SAI"), which contains more complete information such as investment objectives, charges, expenses, policies for voting proxies, risk considerations and describes in detail each of the Fund's investment policies to the prospective investor, please call toll free 1 (800) 548-7786. Please read the prospectuses carefully before you invest or send money.
Additionally, you can access information about the Fund, including performance, characteristics and investment team commentary, through Morgan Stanley Investment Management's website: www.morganstanley.com/im/shareholderreports.
Market forecasts provided in this report may not necessarily come to pass. There is no guarantee that any sectors mentioned will continue to perform as discussed herein or that securities in such sectors will be held by the Fund in the future. There is no assurance that a fund will achieve its investment objective. Funds are subject to market risk, which is the possibility that market values of securities owned by the Fund will decline and, therefore, the value of the Fund's shares may be less than what you paid for them. Accordingly, you can lose money investing in this Fund. Please see the prospectus for more complete information on investment risks.
1
Morgan Stanley Institutional Fund, Inc.
Annual Report — December 31, 2019
Shareholders' Letter (unaudited)
Dear Shareholders,
We are pleased to provide this Annual Report, in which you will learn how your investment in Global Infrastructure Portfolio (the "Fund") performed during the latest twelve-month period.
Morgan Stanley Investment Management is a client-centric, investor-led organization. Our global presence, intellectual capital, and breadth of products and services enable us to partner with investors to meet the evolving challenges of today's financial markets. We aim to deliver superior investment service and to empower our clients to make the informed decisions that help them reach their investment goals.
As always, we thank you for selecting Morgan Stanley Investment Management, and look forward to working with you in the months and years ahead.
Sincerely,

John H. Gernon
President and Principal Executive Officer
January 2020
2
Morgan Stanley Institutional Fund, Inc.
Annual Report — December 31, 2019
Expense Example (unaudited)
Global Infrastructure Portfolio
As a shareholder of the Fund, you incur two types of costs: (1) transactional costs; and (2) ongoing costs, which may include advisory fees, administration fees, distribution and shareholder services fees and other Fund expenses. This example is intended to help you understand your ongoing costs (in dollars) of investing in the Fund and to compare these costs with the ongoing costs of investing in other mutual funds.
This example is based on an investment of $1,000 invested at the beginning of the six-month period ended December 31, 2019 and held for the entire six-month period.
Actual Expenses
The table below provides information about actual account values and actual expenses. You may use the information in this table, together with the amount you invested, to estimate the expenses that you paid over the period. Simply divide your account value by $1,000 (for example, an $8,600 account value divided by $1,000 = 8.6), then multiply the result by the number in the table under the heading entitled "Actual Expenses Paid During Period" to estimate the expenses you paid on your account during this period.
Hypothetical Example for Comparison Purposes
The table below provides information about hypothetical account values and hypothetical expenses based on the Fund's actual expense ratio and an assumed rate of return of 5% per year before expenses, which is not the Fund's actual return. The hypothetical account values and expenses may not be used to estimate the actual ending account balance or expenses you paid for the period. You may use this information to compare the ongoing costs of investing in the Fund and other funds. To do so, compare this 5% hypothetical example with the 5% hypothetical examples that appear in the shareholder reports of the other funds.
Please note that the expenses shown in the table are meant to highlight your ongoing costs only and do not reflect any transactional costs, such as sales charges (loads). Therefore, the information for each class in the table is useful in comparing ongoing costs only, and will not help you determine the relative total costs of owning different funds. In addition, if these transactional costs were included, your costs would have been higher.
| | | Beginning
Account
Value
7/1/19 | | Actual Ending
Account
Value
12/31/19 | | Hypothetical
Ending Account
Value | | Actual
Expenses
Paid
During
Period* | | Hypothetical
Expenses Paid
During Period* | | Net
Expense
Ratio
During
Period** | |
Global Infrastructure Portfolio Class I | | $ | 1,000.00 | | | $ | 1,068.90 | | | $ | 1,020.32 | | | $ | 5.06 | | | $ | 4.94 | | | | 0.97 | % | |
Global Infrastructure Portfolio Class A | | | 1,000.00 | | | | 1,067.30 | | | | 1,019.11 | | | | 6.30 | | | | 6.16 | | | | 1.21 | | |
Global Infrastructure Portfolio Class L | | | 1,000.00 | | | | 1,064.10 | | | | 1,016.23 | | | | 9.26 | | | | 9.05 | | | | 1.78 | | |
Global Infrastructure Portfolio Class C | | | 1,000.00 | | | | 1,062.80 | | | | 1,014.77 | | | | 10.76 | | | | 10.51 | | | | 2.07 | | |
Global Infrastructure Portfolio Class IS | | | 1,000.00 | | | | 1,063.60 | | | | 1,020.52 | | | | 4.84 | | | | 4.74 | | | | 0.93 | | |
Global Infrastructure Portfolio Class IR | | | 1,000.00 | | | | 1,068.50 | | | | 1,020.52 | | | | 4.85 | | | | 4.74 | | | | 0.93 | | |
* Expenses are calculated using each Fund Class' annualized net expense ratio (as disclosed), multiplied by the average account value over the period and multiplied by 184/365 (to reflect the most recent one-half year period).
** Annualized.
3
Morgan Stanley Institutional Fund, Inc.
Annual Report — December 31, 2019
Investment Overview (unaudited)
Global Infrastructure Portfolio
The Fund seeks to provide both capital appreciation and income.
Performance
For the fiscal year ended December 31, 2019, the Fund's Class I shares had a total return based on net asset value and reinvestment of distributions per share of 27.94%, net of fees. The Fund's Class I shares underperformed the Fund's benchmark, the Dow Jones Brookfield Global Infrastructure IndexSM (the "Index"), which returned 28.69%, but outperformed the S&P Global BMI Index, a proxy for global equities, which returned 26.76%.
Please keep in mind that double-digit returns are highly unusual and cannot be sustained. Investors should also be aware that these returns were primarily achieved during favorable market conditions.
Factors Affecting Performance
• Infrastructure shares increased 28.69% in the year ending December 31, 2019, as measured by the Index. From a sector perspective, pipeline companies, communications, water and diversified outperformed the Index, while ports, electricity transmission & distribution, gas distribution utilities, gas midstream, toll roads, airports and European regulated utilities underperformed the Index. Outside of ports, which posted modest declines, all sectors posted double-digit positive absolute gains on the year.
• Global listed infrastructure's favorable performance was driven by a confluence of factors in 2019: (1) a healthy fundamental outlook across most infrastructure sectors, supported by modest global economic growth, (2) declines in cost of capital concurrent with a return to record low interest rates in a number of developed economies, (3) demand for "defensive" equities largely agnostic to political risk in a world of heightened geopolitical uncertainty, and (4) the need for infrastructure network augmentation due to structural shifts in network architecture (most notably in the utilities and communications sectors — e.g., decentralization of the electricity grid through increasing renewable power load and 5G/internet-of-things buildout for communications infrastructure). Outside of these factors, we would also note a significant focus on capital discipline and balance sheet health benefited several companies in 2019, most notably in the
energy infrastructure sectors. Overall, we view 2019 as a strong year for infrastructure securities and the infrastructure markets in general.
• For the full-year 2019, the Fund underperformed the Index. From a bottom-up perspective, the Fund benefited from favorable stock selection in the electricity transmission & distribution, gas distribution utilities, European regulated utilities, pipeline companies, communications and diversified sectors, partially offset by adverse stock selection in the toll roads, airports and gas midstream sectors. From a top-down perspective, the Fund benefited from underweights to gas distribution utilities and ports, as well as an out-of-benchmark positon in renewables, which was more than offset by underweights to communications, pipeline companies and European regulated utilities, as well as an overweight to electricity transmission & distribution.
Management Strategies
• We remain committed to our core investment philosophy as an infrastructure value investor. As value-oriented, bottom-up driven investors, our investment perspective is that over the medium and long term, the key factor in determining the performance of infrastructure securities will be underlying infrastructure asset values. Given the large and growing private infrastructure market, we believe that there are limits as to the level of premium or discount at which the public sector should trade relative to its underlying private infrastructure value. These limits can be viewed as the point at which the arbitrage opportunity between owning infrastructure in the private versus public markets becomes compelling. In aiming to achieve core infrastructure exposure in a cost effective manner, we invest in equity securities of publicly listed infrastructure companies we believe offer the best value relative to their underlying infrastructure value and Net Asset Value (NAV) growth prospects.
• Our research currently leads us to an overweighting in the Fund to a group of companies in the toll roads sector, a market-neutral weighting to companies in the water and ports sectors, and an underweighting to companies in the communications, pipeline companies, gas midstream, electricity
4
Morgan Stanley Institutional Fund, Inc.
Annual Report — December 31, 2019
Investment Overview (unaudited) (cont'd)
Global Infrastructure Portfolio
transmission & distribution, European regulated utilities, diversified, airports and gas distribution utilities sectors. Finally, we continue to retain an out-of-benchmark position in renewables, as well as a weighting in certain other utilities that are not contained in the Index.
• In terms of outlook, while we do expect a moderation in some fundamental trends going forward, specifically in transportation infrastructure where volume/traffic dynamics have generally been running above trend until recently, our outlook for infrastructure securities in 2020 is constructive on a fundamental basis. Furthermore, because there is considerable debate as to whether we are "mid-cycle" or "late-cycle" from an economic perspective, and questions remain about the timing and comprehensiveness of a "full" or "Phase Two" U.S.-China trade agreement, as well as the outcome of a 2020 U.S. presidential election, we believe infrastructure securities could continue to serve as a safe-haven for many investors looking for companies with resilient and predictable cash flow profiles. Valuation and regulatory changes are primary risk factors, but we view the former as a risk borne by all long-duration assets, including fixed income and non-infrastructure equities. Encouragingly, value remains at the company level, which is supportive of positive potential returns for the asset class going forward. In particular, we view selected areas of energy infrastructure and emerging markets infrastructure more broadly as areas of opportunity, as are companies currently involved in regulatory processes (with near-term uncertainty but long-term value). Finally, given the considerable amount of private capital raised for infrastructure and the dislocation between public and private valuations, we view public-to-private transactions as a considerable opportunity for listed infrastructure over the short to medium term.
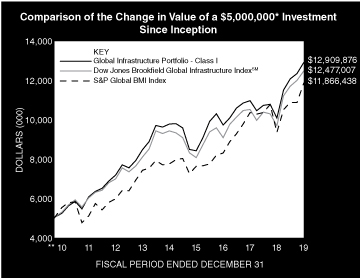
* Minimum Investment for Class I shares
** Commenced Operations on September 20, 2010.
In accordance with SEC regulations, the Fund's performance shown assumes that all recurring fees (including management fees) were deducted and all dividends and distributions were reinvested. The performance of Class A, L, C, IS and IR shares will vary from the performance of Class I shares based upon their different inception dates and will be negatively impacted by additional fees assessed to those classes (if applicable).
5
Morgan Stanley Institutional Fund, Inc.
Annual Report — December 31, 2019
Investment Overview (unaudited) (cont'd)
Global Infrastructure Portfolio
Performance Compared to the Dow Jones Brookfield Global Infrastructure IndexSM(1), the S&P Global BMI Index(2) and the Lipper Global Infrastructure Funds Index(3)
| | | Period Ended December 31, 2019
Total Returns(4) | |
| | | | | Average Annual | |
| | | One
Year | | Five
Years | | Ten
Years | | Since
Inception(9) | |
Fund — Class I Shares
w/o sales charges(5) | | | 27.94 | % | | | 5.70 | % | | | — | | | | 10.76 | % | |
Fund — Class A Shares
w/o sales charges(5) | | | 27.62 | | | | 5.45 | | | | — | | | | 10.48 | | |
Fund — Class A Shares with
maximum 5.25% sales charges(5) | | | 20.97 | | | | 4.32 | | | | — | | | | 9.84 | | |
Fund — Class L Shares
w/o sales charges(5) | | | 26.87 | | | | 4.83 | | | | — | | | | 9.87 | | |
Fund — Class C Shares
w/o sales charges(7) | | | 26.55 | | | | — | | | | — | | | | 4.13 | | |
Fund — Class C Shares with
maximum 1.00% deferred
sales charges(7) | | | 25.55 | | | | — | | | | — | | | | 4.13 | | |
Fund — Class IS Shares
w/o sales charges(6) | | | 27.31 | | | | 5.62 | | | | — | | | | 8.40 | | |
Fund — Class IR Shares
w/o sales charges(8) | | | 27.99 | | | | — | | | | — | | | | 13.85 | | |
Dow Jones Brookfield Global
Infrastructure IndexSM | | | 28.69 | | | | 5.75 | | | | — | | | | 10.36 | | |
S&P Global BMI Index | | | 26.76 | | | | 8.87 | | | | — | | | | 9.76 | | |
Lipper Global Infrastructure
Funds Index | | | 25.30 | | | | 6.84 | | | | — | | | | N/A | | |
Performance data quoted represents past performance, which is no guarantee of future results, and current performance may be lower or higher than the figures shown. Performance assumes that all dividends and distributions, if any, were reinvested. For the most recent month-end performance figures, please visit www.morganstanley.com/im/shareholderreports. Investment return and principal value will fluctuate so that Fund shares, when redeemed, may be worth more or less than their original cost. Total returns do not reflect the deduction of taxes that a shareholder would pay on Fund distributions or the redemption of Fund shares. Performance of share classes will vary due to difference in sales charges and expenses.
(1) The Dow Jones Brookfield Global Infrastructure IndexSM is a float-adjusted market capitalization weighted index that measures the stock performance of companies that exhibit strong infrastructure characteristics. The Index intends to measure all sectors of the infrastructure market. The Index is unmanaged and its returns do not include any sales charges or fees. Such costs would lower performance. It is not possible to invest directly in an index.
(2) The Standard & Poor's Global BMI Index (S&P Global BMI Index) is a broad market index designed to capture exposure to equities in all countries in the world that meet minimum size and liquidity requirements. The index members represents developed and emerging market countries. The Index is unmanaged and its returns do not include any sales charges or fees. Such costs would lower performance. It is not possible to invest directly in an index.
(3) The Lipper Global Infrastructure Funds Index is an equally weighted performance index of the largest qualifying funds (based on net assets) in the Lipper Global Infrastructure Funds classification. The Index, which is adjusted for capital gains distributions and income dividends, is unmanaged and should not be considered an investment. There are currently 10 funds represented in this Index. As of the date of this report, the Fund was in the Lipper Global Infrastructure Funds classification. The history of this Index began in October 2011. Therefore, there is no "Since Inception" return data available and the Index is not shown on the graph.
(4) Total returns for the Fund reflect fees waived and expenses reimbursed, if applicable, by the Adviser (as defined herein). Without such waivers and reimbursements, total returns would have been lower.
(5) Commenced operations on September 20, 2010.
(6) Commenced offering on September 13, 2013.
(7) Commenced offering on April 30, 2015.
(8) Commenced offering on June 15. 2018.
(9) For comparative purposes, average annual since inception returns listed for the Indexes refer to the inception date of Class I of the Fund, not the inception of the Index.
6
Morgan Stanley Institutional Fund, Inc.
Annual Report — December 31, 2019
Portfolio of Investments
Global Infrastructure Portfolio
| | | Shares | | Value
(000) | |
Common Stocks (98.2%) | |
Australia (4.7%) | |
APA Group (Units) (a) | | | 319,035 | | | $ | 2,485 | | |
Atlas Arteria Ltd. (Units) (a) | | | 431,945 | | | | 2,373 | | |
Sydney Airport (Units) (a) | | | 461,427 | | | | 2,804 | | |
Transurban Group (Units) (a) | | | 777,552 | | | | 8,136 | | |
| | | | 15,798 | | |
Brazil (0.4%) | |
Energisa SA (Units) (a) | | | 102,700 | | | | 1,370 | | |
Canada (13.1%) | |
Enbridge, Inc. | | | 411,395 | | | | 16,357 | | |
Hydro One Ltd. (b) | | | 319,976 | | | | 6,180 | | |
Pembina Pipeline Corp. (b) | | | 176,608 | | | | 6,546 | | |
TC Energy Corp. | | | 280,682 | | | | 14,949 | | |
| | | | 44,032 | | |
China (4.8%) | |
China Everbright International Ltd. | | | 3,340,000 | | | | 2,679 | | |
China Gas Holdings Ltd. (c) | | | 1,759,000 | | | | 6,592 | | |
China Merchants Port Holdings Co., Ltd. (c) | | | 704,000 | | | | 1,191 | | |
China Tower Corp. Ltd. H Shares (c) | | | 8,210,000 | | | | 1,812 | | |
ENN Energy Holdings Ltd. (c) | | | 337,700 | | | | 3,690 | | |
| | | 15,964 | | |
France (5.6%) | |
Aeroports de Paris | | | 19,210 | | | | 3,795 | | |
Getlink SE | | | 186,140 | | | | 3,238 | | |
Vinci SA | | | 107,270 | | | | 11,912 | | |
| | | | 18,945 | | |
Hong Kong (1.0%) | |
Hong Kong & China Gas Co., Ltd. | | | 1,734,000 | | | | 3,387 | | |
India (1.7%) | |
Azure Power Global Ltd. (d) | | | 455,292 | | | | 5,727 | | |
Italy (2.9%) | |
Atlantia SpA | | | 154,342 | | | | 3,602 | | |
Infrastrutture Wireless Italiane SpA | | | 167,120 | | | | 1,636 | | |
Snam SpA | | | 304,410 | | | | 1,600 | | |
Terna Rete Elettrica Nazionale SpA | | | 443,060 | | | | 2,963 | | |
| | | | 9,801 | | |
Japan (1.4%) | |
Tokyo Gas Co., Ltd. | | | 192,700 | | | | 4,682 | | |
Mexico (7.2%) | |
Promotora y Operadora de Infraestructura
SAB de CV | | | 2,360,774 | | | | 24,163 | | |
New Zealand (0.5%) | |
Auckland International Airport Ltd. | | | 289,131 | | | | 1,703 | | |
Spain (5.1%) | |
Aena SME SA | | | 14,430 | | | | 2,760 | | |
Atlantica Yield PLC | | | 352,102 | | | | 9,292 | | |
Cellnex Telecom SA (d) | | | 21,961 | | | | 945 | | |
Ferrovial SA | | | 135,022 | | | | 4,085 | | |
| | | | 17,082 | | |
| | | Shares | | Value
(000) | |
Switzerland (0.7%) | |
Flughafen Zurich AG (Registered) | | | 12,820 | | | $ | 2,340 | | |
United Kingdom (8.1%) | |
John Laing Group PLC | | | 654,621 | | | | 3,295 | | |
National Grid PLC | | | 1,258,448 | | | | 15,741 | | |
Pennon Group PLC | | | 314,811 | | | | 4,274 | | |
Severn Trent PLC | | | 65,416 | | | | 2,179 | | |
United Utilities Group PLC | | | 153,748 | | | | 1,922 | | |
| | | | 27,411 | | |
United States (41.0%) | |
American Electric Power Co., Inc. | | | 16,770 | | | | 1,585 | | |
American Tower Corp. REIT | | | 109,400 | | | | 25,142 | | |
American Water Works Co., Inc. | | | 50,770 | | | | 6,237 | | |
Aqua America, Inc. | | | 99,809 | | | | 4,685 | | |
Atmos Energy Corp. | | | 74,566 | | | | 8,341 | | |
CenterPoint Energy, Inc. | | | 203,000 | | | | 5,536 | | |
Cheniere Energy, Inc. (d) | | | 91,143 | | | | 5,566 | | |
Consolidated Edison, Inc. | | | 58,840 | | | | 5,323 | | |
Crown Castle International Corp. REIT | | | 96,852 | | | | 13,768 | | |
Edison International | | | 99,257 | | | | 7,485 | | |
Eversource Energy | | | 108,221 | | | | 9,206 | | |
Kinder Morgan, Inc. | | | 395,340 | | | | 8,369 | | |
NiSource, Inc. | | | 218,318 | | | | 6,078 | | |
ONEOK, Inc. | | | 101,040 | | | | 7,646 | | |
SBA Communications Corp. REIT | | | 15,600 | | | | 3,760 | | |
Sempra Energy | | | 60,346 | | | | 9,141 | | |
Targa Resources Corp. (b) | | | 54,920 | | | | 2,243 | | |
Williams Cos., Inc. (The) | | | 329,103 | | | | 7,806 | | |
| | | | 137,917 | | |
Total Common Stocks (Cost $249,969) | | | 330,322 | | |
Short-Term Investment (2.7%) | |
Investment Company (2.7%) | |
Morgan Stanley Institutional Liquidity
Funds — Treasury Portfolio —
Institutional Class (See Note G)
(Cost $9,217) | | | 9,216,735 | | | | 9,217 | | |
Total Investments (100.9%) (Cost $259,186)
Including $14,680 of Securities Loaned (e)(f) | | | 339,539 | | |
Liabilities in Excess of Other Assets (–0.9%) | | | (3,177 | ) | |
Net Assets (100.0%) | | $ | 336,362 | | |
Country assignments and aggregations are based generally on third party vendor classifications and information, and may be different from the assignments and aggregations under the policies set forth in the Fund's prospectus and/or statement of additional information relating to geographic classifications.
(a) Consists of one or more classes of securities traded together as a unit; stocks with attached warrants.
(b) All or a portion of this security was on loan at December 31, 2019.
(c) Security trades on the Hong Kong exchange.
(d) Non-income producing security.
The accompanying notes are an integral part of the financial statements.
7
Morgan Stanley Institutional Fund, Inc.
Annual Report — December 31, 2019
Portfolio of Investments (cont'd)
Global Infrastructure Portfolio
(e) The approximate fair value and percentage of net assets, $18,193,000 and 5.4%, respectively, represent the securities that have been fair valued under the fair valuation policy for international investments as described in Note A-1 within the Notes to the Financial Statements.
(f) At December 31, 2019, the aggregate cost for federal income tax purposes is approximately $265,717,000. The aggregate gross unrealized appreciation is approximately $76,833,000 and the aggregate gross unrealized depreciation is approximately $3,012,000, resulting in net unrealized appreciation of approximately $73,821,000.
REIT Real Estate Investment Trust.
Portfolio Composition*
Classification | | Percentage of
Total Investments | |
Oil & Gas Storage & Transportation | | | 34.0 | % | |
Electricity Transmission & Distribution | | | 14.7 | | |
Communications | | | 13.9 | | |
Toll Roads | | | 12.2 | | |
Other** | | | 11.4 | | |
Diversified | | | 7.3 | | |
Water | | | 6.5 | | |
Total Investments | | | 100.0 | % | |
* Percentages indicated are based upon total investments (excluding Securities held as Collateral on Loaned Securities) as of December 31, 2019.
** Industries and/or investment types representing less than 5% of total investments.
The accompanying notes are an integral part of the financial statements.
8
Morgan Stanley Institutional Fund, Inc.
Annual Report — December 31, 2019
Global Infrastructure Portfolio
Statement of Assets and Liabilities | | December 31, 2019
(000) | |
Assets: | |
Investments in Securities of Unaffiliated Issuers, at Value(1) (Cost $249,969) | | $ | 330,322 | | |
Investment in Security of Affiliated Issuer, at Value (Cost $9,217) | | | 9,217 | | |
Total Investments in Securities, at Value (Cost $259,186) | | | 339,539 | | |
Foreign Currency, at Value (Cost $100) | | | 101 | | |
Dividends Receivable | | | 857 | | |
Tax Reclaim Receivable | | | 35 | | |
Receivable for Fund Shares Sold | | | 25 | | |
Receivable from Affiliate | | | 8 | | |
Receivable from Securities Lending Income | | | 2 | | |
Receivable for Investments Sold | | | 1 | | |
Other Assets | | | 62 | | |
Total Assets | | | 340,630 | | |
Liabilities: | |
Payable for Investments Purchased | | | 2,943 | | |
Payable for Advisory Fees | | | 525 | | |
Payable for Fund Shares Redeemed | | | 522 | | |
Payable for Shareholder Services Fees — Class A | | | 50 | | |
Payable for Distribution and Shareholder Services Fees — Class L | | | 2 | | |
Payable for Distribution and Shareholder Services Fees — Class C | | | 2 | | |
Payable for Professional Fees | | | 45 | | |
Payable for Sub Transfer Agency Fees — Class I | | | 14 | | |
Payable for Sub Transfer Agency Fees — Class A | | | 30 | | |
Payable for Sub Transfer Agency Fees — Class L | | | 1 | | |
Payable for Sub Transfer Agency Fees — Class C | | | — | @ | |
Payable for Directors' Fees and Expenses | | | 44 | | |
Payable for Administration Fees | | | 22 | | |
Payable for Custodian Fees | | | 17 | | |
Payable for Transfer Agency Fees — Class I | | | 1 | | |
Payable for Transfer Agency Fees — Class A | | | 12 | | |
Payable for Transfer Agency Fees — Class L | | | 1 | | |
Payable for Transfer Agency Fees — Class C | | | 1 | | |
Payable for Transfer Agency Fees — Class IS | | | 1 | | |
Payable for Transfer Agency Fees — Class IR | | | — | @ | |
Other Liabilities | | | 35 | | |
Total Liabilities | | | 4,268 | | |
Net Assets | | $ | 336,362 | | |
Net Assets Consist of: | |
Paid-in-Capital | | $ | 258,646 | | |
Total Distributable Earnings | | | 77,716 | | |
Net Assets | | $ | 336,362 | | |
The accompanying notes are an integral part of the financial statements.
9
Morgan Stanley Institutional Fund, Inc.
Annual Report — December 31, 2019
Global Infrastructure Portfolio
Statement of Assets and Liabilities (cont'd) | | December 31, 2019
(000) | |
CLASS I: | |
Net Assets | | $ | 89,371 | | |
| Shares Outstanding $0.001 par value shares of beneficial interest (unlimited shares authorized) (not in 000's) | | | 5,816,377 | | |
Net Asset Value, Offering and Redemption Price Per Share | | $ | 15.37 | | |
CLASS A: | |
Net Assets | | $ | 240,350 | | |
| Shares Outstanding $0.001 par value shares of beneficial interest (unlimited shares authorized) (not in 000's) | | | 15,680,782 | | |
Net Asset Value, Redemption Price Per Share | | $ | 15.33 | | |
Maximum Sales Load | | | 5.25 | % | |
Maximum Sales Charge | | $ | 0.85 | | |
Maximum Offering Price Per Share | | $ | 16.18 | | |
CLASS L: | |
Net Assets | | $ | 3,718 | | |
| Shares Outstanding $0.001 par value shares of beneficial interest (unlimited shares authorized) (not in 000's) | | | 243,246 | | |
Net Asset Value, Offering and Redemption Price Per Share | | $ | 15.29 | | |
CLASS C: | |
Net Assets | | $ | 2,901 | | |
| Shares Outstanding $0.001 par value shares of beneficial interest (unlimited shares authorized) (not in 000's) | | | 192,396 | | |
Net Asset Value, Offering and Redemption Price Per Share | | $ | 15.08 | | |
CLASS IS: | |
Net Assets | | $ | 11 | | |
| Shares Outstanding $0.001 par value shares of beneficial interest (unlimited shares authorized) (not in 000's) | | | 751 | | |
Net Asset Value, Offering and Redemption Price Per Share | | $ | 15.29 | | |
CLASS IR: | |
Net Assets | | $ | 11 | | |
| Shares Outstanding $0.001 par value shares of beneficial interest (unlimited shares authorized) (not in 000's) | | | 732 | | |
Net Asset Value, Offering and Redemption Price Per Share | | $ | 15.36 | | |
(1) Including:
Securities on Loan, at Value: | | $ | 14,680 | | |
@ Amount is less than $500.
The accompanying notes are an integral part of the financial statements.
10
Morgan Stanley Institutional Fund, Inc.
Annual Report — December 31, 2019
Global Infrastructure Portfolio
Statement of Operations | | Year Ended
December 31, 2019
(000) | |
Investment Income: | |
Dividends from Securities of Unaffiliated Issuers (Net of $587 of Foreign Taxes Withheld) | | $ | 11,127 | | |
Dividends from Security of Affiliated Issuer (Note G) | | | 179 | | |
Income from Securities Loaned — Net | | | 43 | | |
Total Investment Income | | | 11,349 | | |
Expenses: | |
Advisory Fees (Note B) | | | 2,853 | | |
Shareholder Services Fees — Class A (Note D) | | | 582 | | |
Distribution and Shareholder Services Fees — Class L (Note D) | | | 28 | | |
Distribution and Shareholder Services Fees — Class C (Note D) | | | 27 | | |
Administration Fees (Note C) | | | 268 | | |
Sub Transfer Agency Fees — Class I | | | 100 | | |
Sub Transfer Agency Fees — Class A | | | 161 | | |
Sub Transfer Agency Fees — Class L | | | 2 | | |
Sub Transfer Agency Fees — Class C | | | 2 | | |
Professional Fees | | | 102 | | |
Registration Fees | | | 90 | | |
Custodian Fees (Note F) | | | 67 | | |
Transfer Agency Fees — Class I (Note E) | | | 4 | | |
Transfer Agency Fees — Class A (Note E) | | | 42 | | |
Transfer Agency Fees — Class L (Note E) | | | 3 | | |
Transfer Agency Fees — Class C (Note E) | | | 3 | | |
Transfer Agency Fees — Class IS (Note E) | | | 3 | | |
Transfer Agency Fees — Class IR (Note E) | | | 2 | | |
Shareholder Reporting Fees | | | 53 | | |
Directors' Fees and Expenses | | | 16 | | |
Pricing Fees | | | 4 | | |
Other Expenses | | | 23 | | |
Expenses Before Non Operating Expenses | | | 4,435 | | |
Bank Overdraft Expense | | | 6 | | |
Total Expenses | | | 4,441 | | |
Waiver of Advisory Fees (Note B) | | | (322 | ) | |
Reimbursement of Class Specific Expenses — Class I (Note B) | | | (80 | ) | |
Reimbursement of Class Specific Expenses — Class A (Note B) | | | (157 | ) | |
Reimbursement of Class Specific Expenses — Class L (Note B) | | | (2 | ) | |
Reimbursement of Class Specific Expenses — Class C (Note B) | | | (1 | ) | |
Reimbursement of Class Specific Expenses — Class IS (Note B) | | | (3 | ) | |
Reimbursement of Class Specific Expenses — Class IR (Note B) | | | (2 | ) | |
Rebate from Morgan Stanley Affiliate (Note G) | | | (15 | ) | |
Net Expenses | | | 3,859 | | |
Net Investment Income | | | 7,490 | | |
Realized Gain (Loss): | |
Investments Sold | | | 8,352 | | |
Foreign Currency Translation | | | (50 | ) | |
Net Realized Gain | | | 8,302 | | |
Change in Unrealized Appreciation (Depreciation): | |
Investments | | | 65,179 | | |
Foreign Currency Translation | | | 12 | | |
Net Change in Unrealized Appreciation (Depreciation) | | | 65,191 | | |
Net Realized Gain and Change in Unrealized Appreciation (Depreciation) | | | 73,493 | | |
Net Increase in Net Assets Resulting from Operations | | $ | 80,983 | | |
The accompanying notes are an integral part of the financial statements.
11
Morgan Stanley Institutional Fund, Inc.
Annual Report — December 31, 2019
Global Infrastructure Portfolio
Statements of Changes in Net Assets | | Year Ended
December 31, 2019
(000) | | Year Ended
December 31, 2018
(000) | |
Increase (Decrease) in Net Assets: | |
Operations: | |
Net Investment Income | | $ | 7,490 | | | $ | 7,315 | | |
Net Realized Gain | | | 8,302 | | | | 12,249 | | |
Net Change in Unrealized Appreciation (Depreciation) | | | 65,191 | | | | (49,202 | ) | |
Net Increase (Decrease) in Net Assets Resulting from Operations | | | 80,983 | | | | (29,638 | ) | |
Dividends and Distributions to Shareholders: | |
Class I | | | (2,674 | ) | | | (5,882 | ) | |
Class A | | | (6,686 | ) | | | (17,909 | ) | |
Class L | | | (83 | ) | | | (302 | ) | |
Class C | | | (60 | ) | | | (197 | ) | |
Class IS | | | (— | @) | | | (2,024 | ) | |
Class IR | | | (— | @) | | | (1 | ) | |
Total Dividends and Distributions to Shareholders | | | (9,503 | ) | | | (26,315 | ) | |
Capital Share Transactions:(1) | |
Class I: | |
Subscribed | | | 16,736 | | | | 19,564 | | |
Distributions Reinvested | | | 2,669 | | | | 5,871 | | |
Redeemed | | | (11,724 | ) | | | (42,709 | ) | |
Class A: | |
Subscribed | | | 4,129 | | | | 5,187 | | |
Distributions Reinvested | | | 6,562 | | | | 17,545 | | |
Redeemed | | | (32,462 | ) | | | (49,956 | ) | |
Class L: | |
Exchanged | | | 2 | | | | 11 | | |
Distributions Reinvested | | | 81 | | | | 295 | | |
Redeemed | | | (985 | ) | | | (1,420 | ) | |
Class C: | |
Subscribed | | | 146 | | | | 692 | | |
Distributions Reinvested | | | 60 | | | | 197 | | |
Redeemed | | | (465 | ) | | | (1,417 | ) | |
Class IS: | |
Subscribed | | | 3,143 | | | | 19,545 | | |
Distributions Reinvested | | | — | @ | | | 2,023 | | |
Redeemed | | | (32,096 | ) | | | (3,149 | ) | |
Class IR: | |
Subscribed | | | — | | | | 10 | (a) | |
Distributions Reinvested | | | — | @ | | | — | | |
Net Decrease in Net Assets Resulting from Capital Share Transactions | | | (44,204 | ) | | | (27,711 | ) | |
Total Increase (Decrease) in Net Assets | | | 27,276 | | | | (83,664 | ) | |
Net Assets: | |
Beginning of Period | | | 309,086 | | | | 392,750 | | |
End of Period | | $ | 336,362 | | | $ | 309,086 | | |
The accompanying notes are an integral part of the financial statements.
12
Morgan Stanley Institutional Fund, Inc.
Annual Report — December 31, 2019
Global Infrastructure Portfolio
Statements of Changes in Net Assets (cont'd) | | Year Ended
December 31, 2019
(000) | | Year Ended
December 31, 2018
(000) | |
(1) Capital Share Transactions: | |
Class I: | |
Shares Subscribed | | | 1,194 | | | | 1,382 | | |
Shares Issued on Distributions Reinvested | | | 177 | | | | 453 | | |
Shares Redeemed | | | (826 | ) | | | (3,068 | ) | |
Net Increase (Decrease) in Class I Shares Outstanding | | | 545 | | | | (1,233 | ) | |
Class A: | |
Shares Subscribed | | | 280 | | | | 382 | | |
Shares Issued on Distributions Reinvested | | | 435 | | | | 1,357 | | |
Shares Redeemed | | | (2,261 | ) | | | (3,604 | ) | |
Net Decrease in Class A Shares Outstanding | | | (1,546 | ) | | | (1,865 | ) | |
Class L: | |
Shares Exchanged | | | — | @@ | | | 1 | | |
Shares Issued on Distributions Reinvested | | | 5 | | | | 23 | | |
Shares Redeemed | | | (70 | ) | | | (103 | ) | |
Net Decrease in Class L Shares Outstanding | | | (65 | ) | | | (79 | ) | |
Class C: | |
Shares Subscribed | | | 10 | | | | 49 | | |
Shares Issued on Distributions Reinvested | | | 4 | | | | 15 | | |
Shares Redeemed | | | (34 | ) | | | (103 | ) | |
Net Decrease in Class C Shares Outstanding | | | (20 | ) | | | (39 | ) | |
Class IS: | |
Shares Subscribed | | | 224 | | | | 1,391 | | |
Shares Issued on Distributions Reinvested | | | — | @@ | | | 157 | | |
Shares Redeemed | | | (2,198 | ) | | | (223 | ) | |
Net Increase (Decrease) in Class IS Shares Outstanding | | | (1,974 | ) | | | 1,325 | | |
Class IR: | |
Shares Subscribed | | | — | | | | 1 | (a) | |
Shares Issued on Distributions Reinvested | | | — | @@ | | | — | | |
Net Increase in Class IR Shares Outstanding | | | — | @@ | | | 1 | (a) | |
(a) For the period June 15, 2018 through December 31, 2018.
@ Amount is less than $500.
@@ Amount is less than 500 shares.
The accompanying notes are an integral part of the financial statements.
13
Morgan Stanley Institutional Fund, Inc.
Annual Report — December 31, 2019
Financial Highlights
Global Infrastructure Portfolio
| | | Class I | |
| | | Year Ended December 31, | |
Selected Per Share Data and Ratios | | 2019 | | 2018 | | 2017 | | 2016(1) | | 2015 | |
Net Asset Value, Beginning of Period | | $ | 12.39 | | | $ | 14.64 | | | $ | 14.02 | | | $ | 12.59 | | | $ | 15.41 | | |
Income (Loss) from Investment Operations: | |
Net Investment Income(2) | | | 0.35 | | | | 0.31 | | | | 0.44 | | | | 0.40 | | | | 0.40 | | |
Net Realized and Unrealized Gain (Loss) | | | 3.11 | | | | (1.45 | ) | | | 1.33 | | | | 1.55 | | | | (2.54 | ) | |
Total from Investment Operations | | | 3.46 | | | | (1.14 | ) | | | 1.77 | | | | 1.95 | | | | (2.14 | ) | |
Distributions from and/or in Excess of: | |
Net Investment Income | | | (0.36 | ) | | | (0.37 | ) | | | (0.42 | ) | | | (0.37 | ) | | | (0.35 | ) | |
Net Realized Gain | | | (0.12 | ) | | | (0.74 | ) | | | (0.73 | ) | | | (0.15 | ) | | | (0.32 | ) | |
Paid-in-Capital | | | — | | | | — | | | | — | | | | — | | | | (0.01 | ) | |
Total Distributions | | | (0.48 | ) | | | (1.11 | ) | | | (1.15 | ) | | | (0.52 | ) | | | (0.68 | ) | |
Net Asset Value, End of Period | | $ | 15.37 | | | $ | 12.39 | | | $ | 14.64 | | | $ | 14.02 | | | $ | 12.59 | | |
Total Return(3) | | | 27.94 | % | | | (8.02 | )% | | | 12.70 | % | | | 15.55 | % | | | (13.90 | )% | |
Ratios to Average Net Assets and Supplemental Data: | |
Net Assets, End of Period (Thousands) | | $ | 89,371 | | | $ | 65,311 | | | $ | 95,219 | | | $ | 58,794 | | | $ | 47,878 | | |
Ratio of Expenses Before Expense Limitation | | | 1.16 | % | | | 1.16 | % | | | 1.08 | % | | | 1.04 | % | | | 1.10 | % | |
Ratio of Expenses After Expense Limitation | | | 0.97 | %(4) | | | 0.97 | %(4) | | | 0.91 | %(4)(5) | | | 0.85 | %(4) | | | 0.88 | %(4)(6) | |
Ratio of Expenses After Expense Limitation Excluding Non-Operating Expenses | | | 0.97 | %(4) | | | N/A | | | | N/A | | | | N/A | | | | N/A | | |
Ratio of Net Investment Income | | | 2.40 | %(4) | | | 2.21 | %(4) | | | 2.93 | %(4) | | | 2.85 | %(4) | | | 2.70 | %(4) | |
Ratio of Rebate from Morgan Stanley Affiliates | | | 0.00 | %(7) | | | 0.00 | %(7) | | | 0.01 | % | | | 0.01 | % | | | 0.00 | %(7) | |
Portfolio Turnover Rate | | | 30 | % | | | 43 | % | | | 45 | % | | | 48 | % | | | 48 | % | |
(1) Reflects prior period custodian out-of-pocket expenses that were reimbursed in September 2016. The amount of the reimbursement was immaterial on a per share basis and did not impact the total return of Class I shares. The Ratio of Expenses After Expense Limitation and the Ratio of Net Investment Income would be unchanged as the reimbursement of custodian fees was offset against expense waivers/reimbursements with no impact to net expenses or net investment income.
(2) Per share amount is based on average shares outstanding.
(3) Calculated based on the net asset value as of the last business day of the period.
(4) The Ratio of Expenses After Expense Limitation and Ratio of Net Investment Income reflect the rebate of certain Fund expenses in connection with the investments in Morgan Stanley affiliates during the period. The effect of the rebate on the ratios is disclosed in the above table as "Ratio of Rebate from Morgan Stanley Affiliates."
(5) Effective July 1, 2017, the Adviser has agreed to limit the ratio of expenses to average net assets to the maximum ratio of 0.97% for Class I shares. Prior to July 1, 2017, the maximum ratio was 0.87% for Class I shares.
(6) Effective March 30, 2015, the Adviser has agreed to limit the ratio of expenses to average net assets to the maximum ratio of 0.87% for Class I shares. Prior to March 30, 2015, the maximum ratio was 1.15% for Class I shares.
(7) Amount is less than 0.005%.
The accompanying notes are an integral part of the financial statements.
14
Morgan Stanley Institutional Fund, Inc.
Annual Report — December 31, 2019
Financial Highlights
Global Infrastructure Portfolio
| | | Class A | |
| | | Year Ended December 31, | |
Selected Per Share Data and Ratios | | 2019 | | 2018 | | 2017 | | 2016(1) | | 2015 | |
Net Asset Value, Beginning of Period | | $ | 12.36 | | | $ | 14.60 | | | $ | 13.99 | | | $ | 12.56 | | | $ | 15.38 | | |
Income (Loss) from Investment Operations: | |
Net Investment Income(2) | | | 0.31 | | | | 0.28 | | | | 0.39 | | | | 0.36 | | | | 0.39 | | |
Net Realized and Unrealized Gain (Loss) | | | 3.10 | | | | (1.45 | ) | | | 1.33 | | | | 1.55 | | | | (2.56 | ) | |
Total from Investment Operations | | | 3.41 | | | | (1.17 | ) | | | 1.72 | | | | 1.91 | | | | (2.17 | ) | |
Distributions from and/or in Excess of: | |
Net Investment Income | | | (0.32 | ) | | | (0.33 | ) | | | (0.38 | ) | | | (0.33 | ) | | | (0.32 | ) | |
Net Realized Gain | | | (0.12 | ) | | | (0.74 | ) | | | (0.73 | ) | | | (0.15 | ) | | | (0.32 | ) | |
Paid-in-Capital | | | — | | | | — | | | | — | | | | — | | | | (0.01 | ) | |
Total Distributions | | | (0.44 | ) | | | (1.07 | ) | | | (1.11 | ) | | | (0.48 | ) | | | (0.65 | ) | |
Net Asset Value, End of Period | | $ | 15.33 | | | $ | 12.36 | | | $ | 14.60 | | | $ | 13.99 | | | $ | 12.56 | | |
Total Return(3) | | | 27.62 | % | | | (8.22 | )% | | | 12.37 | % | | | 15.29 | % | | | (14.08 | )% | |
Ratios to Average Net Assets and Supplemental Data: | |
Net Assets, End of Period (Thousands) | | $ | 240,350 | | | $ | 212,919 | | | $ | 278,780 | | | $ | 275,481 | | | $ | 263,702 | | |
Ratio of Expenses Before Expense Limitation | | | 1.37 | % | | | 1.37 | % | | | 1.38 | % | | | 1.37 | % | | | 1.35 | % | |
Ratio of Expenses After Expense Limitation | | | 1.21 | %(4) | | | 1.21 | %(4) | | | 1.15 | %(4)(5) | | | 1.10 | %(4) | | | 1.12 | %(4)(6) | |
Ratio of Expenses After Expense Limitation Excluding Non-Operating Expenses | | | 1.21 | %(4) | | | N/A | | | | N/A | | | | N/A | | | | N/A | | |
Ratio of Net Investment Income | | | 2.16 | %(4) | | | 2.00 | %(4) | | | 2.63 | %(4) | | | 2.60 | %(4) | | | 2.67 | %(4) | |
Ratio of Rebate from Morgan Stanley Affiliates | | | 0.00 | %(7) | | | 0.00 | %(7) | | | 0.01 | % | | | 0.01 | % | | | 0.00 | %(7) | |
Portfolio Turnover Rate | | | 30 | % | | | 43 | % | | | 45 | % | | | 48 | % | | | 48 | % | |
(1) Reflects prior period custodian out-of-pocket expenses that were reimbursed in September 2016. The amount of the reimbursement was immaterial on a per share basis and did not impact the total return of Class A shares. The Ratio of Expenses After Expense Limitation and the Ratio of Net Investment Income would be unchanged as the reimbursement of custodian fees was offset against expense waivers/reimbursements with no impact to net expenses or net investment income.
(2) Per share amount is based on average shares outstanding.
(3) Calculated based on the net asset value which does not reflect sales charges, if applicable, as of the last business day of the period.
(4) The Ratio of Expenses After Expense Limitation and Ratio of Net Investment Income reflect the rebate of certain Fund expenses in connection with the investments in Morgan Stanley affiliates during the period. The effect of the rebate on the ratios is disclosed in the above table as "Ratio of Rebate from Morgan Stanley Affiliates."
(5) Effective July 1, 2017, the Adviser has agreed to limit the ratio of expenses to average net assets to the maximum ratio of 1.21% for Class A shares. Prior to July 1, 2017, the maximum ratio was 1.11% for Class A shares.
(6) Effective March 30, 2015, the Adviser has agreed to limit the ratio of expenses to average net assets to the maximum ratio of 1.11% for Class A shares. Prior to March 30, 2015, the maximum ratio was 1.50% for Class A shares.
(7) Amount is less than 0.005%.
The accompanying notes are an integral part of the financial statements.
15
Morgan Stanley Institutional Fund, Inc.
Annual Report — December 31, 2019
Financial Highlights
Global Infrastructure Portfolio
| | | Class L | |
| | | Year Ended December 31, | |
Selected Per Share Data and Ratios | | 2019 | | 2018 | | 2017 | | 2016(1) | | 2015 | |
Net Asset Value, Beginning of Period | | $ | 12.33 | | | $ | 14.55 | | | $ | 13.94 | | | $ | 12.52 | | | $ | 15.34 | | |
Income (Loss) from Investment Operations: | |
Net Investment Income(2) | | | 0.23 | | | | 0.20 | | | | 0.31 | | | | 0.28 | | | | 0.30 | | |
Net Realized and Unrealized Gain (Loss) | | | 3.08 | | | | (1.44 | ) | | | 1.33 | | | | 1.54 | | | | (2.55 | ) | |
Total from Investment Operations | | | 3.31 | | | | (1.24 | ) | | | 1.64 | | | | 1.82 | | | | (2.25 | ) | |
Distributions from and/or in Excess of: | |
Net Investment Income | | | (0.23 | ) | | | (0.24 | ) | | | (0.30 | ) | | | (0.25 | ) | | | (0.24 | ) | |
Net Realized Gain | | | (0.12 | ) | | | (0.74 | ) | | | (0.73 | ) | | | (0.15 | ) | | | (0.32 | ) | |
Paid-in-Capital | | | — | | | | — | | | | — | | | | — | | | | (0.01 | ) | |
Total Distributions | | | (0.35 | ) | | | (0.98 | ) | | | (1.03 | ) | | | (0.40 | ) | | | (0.57 | ) | |
Net Asset Value, End of Period | | $ | 15.29 | | | $ | 12.33 | | | $ | 14.55 | | | $ | 13.94 | | | $ | 12.52 | | |
Total Return(3) | | | 26.87 | % | | | (8.73 | )% | | | 11.80 | % | | | 14.57 | % | | | (14.64 | )% | |
Ratios to Average Net Assets and Supplemental Data: | |
Net Assets, End of Period (Thousands) | | $ | 3,718 | | | $ | 3,805 | | | $ | 5,634 | | | $ | 5,534 | | | $ | 5,529 | | |
Ratio of Expenses Before Expense Limitation | | | 1.93 | % | | | 1.87 | % | | | 1.95 | % | | | 1.95 | % | | | 1.95 | % | |
Ratio of Expenses After Expense Limitation | | | 1.78 | %(4) | | | 1.78 | %(4) | | | 1.72 | %(4)(5) | | | 1.67 | %(4) | | | 1.69 | %(4)(6) | |
Ratio of Expenses After Expense Limitation Excluding Non-Operating Expenses | | | 1.78 | %(4) | | | N/A | | | | N/A | | | | N/A | | | | N/A | | |
Ratio of Net Investment Income | | | 1.58 | %(4) | | | 1.41 | %(4) | | | 2.06 | %(4) | | | 2.03 | %(4) | | | 2.06 | %(4) | |
Ratio of Rebate from Morgan Stanley Affiliates | | | 0.00 | %(7) | | | 0.00 | %(7) | | | 0.01 | % | | | 0.01 | % | | | 0.00 | %(7) | |
Portfolio Turnover Rate | | | 30 | % | | | 43 | % | | | 45 | % | | | 48 | % | | | 48 | % | |
(1) Reflects prior period custodian out-of-pocket expenses that were reimbursed in September 2016. The amount of the reimbursement was immaterial on a per share basis and did not impact the total return of Class L shares. The Ratio of Expenses After Expense Limitation and the Ratio of Net Investment Income would be unchanged as the reimbursement of custodian fees was offset against expense waivers/reimbursements with no impact to net expenses or net investment income.
(2) Per share amount is based on average shares outstanding.
(3) Calculated based on the net asset value as of the last business day of the period.
(4) The Ratio of Expenses After Expense Limitation and Ratio of Net Investment Income reflect the rebate of certain Fund expenses in connection with the investments in Morgan Stanley affiliates during the period. The effect of the rebate on the ratios is disclosed in the above table as "Ratio of Rebate from Morgan Stanley Affiliates."
(5) Effective July 1, 2017, the Adviser has agreed to limit the ratio of expenses to average net assets to the maximum ratio of 1.78% for Class L shares. Prior to July 1, 2017, the maximum ratio was 1.68% for Class L shares.
(6) Effective March 30, 2015, the Adviser has agreed to limit the ratio of expenses to average net assets to the maximum ratio of 1.68% for Class L shares. Prior to March 30, 2015, the maximum ratio was 2.00% for Class L shares.
(7) Amount is less than 0.005%.
The accompanying notes are an integral part of the financial statements.
16
Morgan Stanley Institutional Fund, Inc.
Annual Report — December 31, 2019
Financial Highlights
Global Infrastructure Portfolio
| | | Class C | |
| | | Year Ended December 31, | | Period from
April 30, 2015(2) to | |
Selected Per Share Data and Ratios | | 2019 | | 2018 | | 2017 | | 2016(1) | | December 31, 2015 | |
Net Asset Value, Beginning of Period | | $ | 12.17 | | | $ | 14.36 | | | $ | 13.81 | | | $ | 12.47 | | | $ | 15.87 | | |
Income (Loss) from Investment Operations: | |
Net Investment Income(3) | | | 0.18 | | | | 0.16 | | | | 0.29 | | | | 0.26 | | | | 0.17 | | |
Net Realized and Unrealized Gain (Loss) | | | 3.05 | | | | (1.42 | ) | | | 1.28 | | | | 1.52 | | | | (2.97 | ) | |
Total from Investment Operations | | | 3.23 | | | | (1.26 | ) | | | 1.57 | | | | 1.78 | | | | (2.80 | ) | |
Distributions from and/or in Excess of: | |
Net Investment Income | | | (0.20 | ) | | | (0.19 | ) | | | (0.29 | ) | | | (0.29 | ) | | | (0.27 | ) | |
Net Realized Gain | | | (0.12 | ) | | | (0.74 | ) | | | (0.73 | ) | | | (0.15 | ) | | | (0.32 | ) | |
Paid-in-Capital | | | — | | | | — | | | | — | | | | — | | | | (0.01 | ) | |
Total Distributions | | | (0.32 | ) | | | (0.93 | ) | | | (1.02 | ) | | | (0.44 | ) | | | (0.60 | ) | |
Net Asset Value, End of Period | | $ | 15.08 | | | $ | 12.17 | | | $ | 14.36 | | | $ | 13.81 | | | $ | 12.47 | | |
Total Return(4) | | | 26.55 | % | | | (9.02 | )% | | | 11.42 | % | | | 14.35 | % | | | (17.62 | )%(8) | |
Ratios to Average Net Assets and Supplemental Data: | |
Net Assets, End of Period (Thousands) | | $ | 2,901 | | | $ | 2,580 | | | $ | 3,601 | | | $ | 784 | | | $ | 516 | | |
Ratio of Expenses Before Expense Limitation | | | 2.20 | % | | | 2.20 | % | | | 2.23 | % | | | 2.69 | % | | | 2.34 | %(9) | |
Ratio of Expenses After Expense Limitation | | | 2.07 | %(5) | | | 2.07 | %(5) | | | 2.02 | %(5)(6) | | | 1.96 | %(5) | | | 1.97 | %(5)(9) | |
Ratio of Expenses After Expense Limitation Excluding Non-Operating Expenses | | | 2.07 | %(5) | | | N/A | | | | N/A | | | | N/A | | | | N/A | | |
Ratio of Net Investment Income | | | 1.30 | %(5) | | | 1.14 | %(5) | | | 1.96 | %(5) | | | 1.90 | %(5) | | | 1.81 | %(5)(9) | |
Ratio of Rebate from Morgan Stanley Affiliates | | | 0.00 | %(7) | | | 0.00 | %(7) | | | 0.01 | % | | | 0.01 | % | | | 0.00 | %(7)(9) | |
Portfolio Turnover Rate | | | 30 | % | | | 43 | % | | | 45 | % | | | 48 | % | | | 48 | % | |
(1) Reflects prior period custodian out-of-pocket expenses that were reimbursed in September 2016. The amount of the reimbursement was immaterial on a per share basis and did not impact the total return of Class C shares. The Ratio of Expenses After Expense Limitation and the Ratio of Net Investment Income would be unchanged as the reimbursement of custodian fees was offset against expense waivers/reimbursements with no impact to net expenses or net investment income.
(2) Commencement of Offering.
(3) Per share amount is based on average shares outstanding.
(4) Calculated based on the net asset value which does not reflect sales charges, if applicable, as of the last business day of the period.
(5) The Ratio of Expenses After Expense Limitation and Ratio of Net Investment Income reflect the rebate of certain Fund expenses in connection with the investments in Morgan Stanley affiliates during the period. The effect of the rebate on the ratios is disclosed in the above table as "Ratio of Rebate from Morgan Stanley Affiliates."
(6) Effective July 1, 2017, the Adviser has agreed to limit the ratio of expenses to average net assets to the maximum ratio of 2.07% for Class C shares. Prior to July 1, 2017, the maximum ratio was 1.97% for Class C shares.
(7) Amount is less than 0.005%.
(8) Not annualized.
(9) Annualized.
The accompanying notes are an integral part of the financial statements.
17
Morgan Stanley Institutional Fund, Inc.
Annual Report — December 31, 2019
Financial Highlights
Global Infrastructure Portfolio
| | | Class IS | |
| | | Year Ended December 31, | |
Selected Per Share Data and Ratios | | 2019 | | 2018 | | 2017 | | 2016(1) | | 2015 | |
Net Asset Value, Beginning of Period | | $ | 12.38 | | | $ | 14.63 | | | $ | 14.02 | | | $ | 12.58 | | | $ | 15.41 | | |
Income (Loss) from Investment Operations: | |
Net Investment Income(2) | | | 0.38 | | | | 0.32 | | | | 0.45 | | | | 0.43 | | | | 0.53 | | |
Net Realized and Unrealized Gain (Loss) | | | 3.01 | | | | (1.46 | ) | | | 1.32 | | | | 1.53 | | | | (2.68 | ) | |
Total from Investment Operations | | | 3.39 | | | | (1.14 | ) | | | 1.77 | | | | 1.96 | | | | (2.15 | ) | |
Distributions from and/or in Excess of: | |
Net Investment Income | | | (0.36 | ) | | | (0.37 | ) | | | (0.43 | ) | | | (0.37 | ) | | | (0.35 | ) | |
Net Realized Gain | | | (0.12 | ) | | | (0.74 | ) | | | (0.73 | ) | | | (0.15 | ) | | | (0.32 | ) | |
Paid-in-Capital | | | — | | | | — | | | | — | | | | — | | | | (0.01 | ) | |
Total Distributions | | | (0.48 | ) | | | (1.11 | ) | | | (1.16 | ) | | | (0.52 | ) | | | (0.68 | ) | |
Net Asset Value, End of Period | | $ | 15.29 | | | $ | 12.38 | | | $ | 14.63 | | | $ | 14.02 | | | $ | 12.58 | | |
Total Return(3) | | | 27.31 | % | | | (7.92 | )% | | | 12.65 | % | | | 15.66 | % | | | (13.96 | )% | |
Ratios to Average Net Assets and Supplemental Data: | |
Net Assets, End of Period (Thousands) | | $ | 11 | | | $ | 24,462 | | | $ | 9,516 | | | $ | 5,921 | | | $ | 2,167 | | |
Ratio of Expenses Before Expense Limitation | | | 1.05 | % | | | 1.05 | % | | | 1.06 | % | | | 1.08 | % | | | 1.41 | % | |
Ratio of Expenses After Expense Limitation | | | 0.94 | %(4) | | | 0.94 | %(4) | | | 0.89 | %(4)(5) | | | 0.83 | %(4) | | | 0.84 | %(4)(6) | |
Ratio of Expenses After Expense Limitation Excluding Non-Operating Expenses | | | 0.94 | %(4) | | | N/A | | | | N/A | | | | N/A | | | | N/A | | |
Ratio of Net Investment Income | | | 2.71 | %(4) | | | 2.26 | %(4) | | | 2.95 | %(4) | | | 3.02 | %(4) | | | 3.91 | %(4) | |
Ratio of Rebate from Morgan Stanley Affiliates | | | 0.00 | %(7) | | | 0.00 | %(7) | | | 0.01 | % | | | 0.01 | % | | | 0.00 | %(7) | |
Portfolio Turnover Rate | | | 30 | % | | | 43 | % | | | 45 | % | | | 48 | % | | | 48 | % | |
(1) Reflects prior period custodian out-of-pocket expenses that were reimbursed in September 2016. The amount of the reimbursement was immaterial on a per share basis and did not impact the total return of Class IS shares. The Ratio of Expenses After Expense Limitation and the Ratio of Net Investment Income would be unchanged as the reimbursement of custodian fees was offset against expense waivers/reimbursements with no impact to net expenses or net investment income.
(2) Per share amount is based on average shares outstanding.
(3) Calculated based on the net asset value as of the last business day of the period.
(4) The Ratio of Expenses After Expense Limitation and Ratio of Net Investment Income reflect the rebate of certain Fund expenses in connection with the investments in Morgan Stanley affiliates during the period. The effect of the rebate on the ratios is disclosed in the above table as "Ratio of Rebate from Morgan Stanley Affiliates."
(5) Effective July 1, 2017, the Adviser has agreed to limit the ratio of expenses to average net assets to the maximum ratio of 0.94% for Class IS shares. Prior to July 1, 2017, the maximum ratio was 0.84% for Class IS shares.
(6) Effective March 30, 2015, the Adviser has agreed to limit the ratio of expenses to average net assets to the maximum ratio of 0.84% for Class IS shares. Prior to March 30, 2015, the maximum ratio was 1.08% for Class IS shares.
(7) Amount is less than 0.005%.
The accompanying notes are an integral part of the financial statements.
18
Morgan Stanley Institutional Fund, Inc.
Annual Report — December 31, 2019
Financial Highlights
Global Infrastructure Portfolio
| | | Class IR | |
Selected Per Share Data and Ratios | |
Year Ended
December 31, 2019 | | Period from
June 15, 2018(1) to
December 31, 2018 | |
Net Asset Value, Beginning of Period | | $ | 12.38 | | | $ | 14.10 | | |
Income (Loss) from Investment Operations: | |
Net Investment Income(2) | | | 0.35 | | | | 0.20 | | |
Net Realized and Unrealized Gain (Loss) | | | 3.11 | | | | (0.81 | ) | |
Total from Investment Operations | | | 3.46 | | | | (0.61 | ) | |
Distributions from and/or in Excess of: | |
Net Investment Income | | | (0.36 | ) | | | (0.37 | ) | |
Net Realized Gain | | | (0.12 | ) | | | (0.74 | ) | |
Total Distributions | | | (0.48 | ) | | | (1.11 | ) | |
Net Asset Value, End of Period | | $ | 15.36 | | | $ | 12.38 | | |
Total Return(3) | | | 27.99 | % | | | (4.54 | )%(6) | |
Ratios to Average Net Assets and Supplemental Data: | |
Net Assets, End of Period, (Thousands) | | $ | 11 | | | $ | 9 | | |
Ratio of Expenses Before Expense Limitation | | | 19.62 | % | | | 18.47 | %(7) | |
Ratio of Expenses After Expense Limitation | | | 0.94 | %(4) | | | 0.94 | %(4)(7) | |
Ratios of Expenses After Expense Limitation Excluding Non-Operating Expenses | | | 0.94 | %(4) | | | N/A | | |
Ratio of Net Investment Income | | | 2.65 | %(4) | | | 2.67 | %(4)(7) | |
Ratio of Rebate from Morgan Stanley Affiliates | | | 0.00 | %(5) | | | 0.00 | %(5)(7) | |
Portfolio Turnover Rate | | | 30 | % | | | 43 | % | |
(1) Commencement of Offering.
(2) Per share amount is based on average shares outstanding.
(3) Calculated based on the net asset value as of the last business day of the period.
(4) The Ratio of Expenses After Expense Limitation and Ratio of Net Investment Income reflect the rebate of certain Fund expenses in connection with the investments in Morgan Stanley affiliates during the period. The effect of the rebate on the ratios is disclosed in the above table as "Ratio of Rebate from Morgan Stanley Affiliates."
(5) Amount is less than 0.005%.
(6) Not annualized.
(7) Annualized.
The accompanying notes are an integral part of the financial statements.
19
Morgan Stanley Institutional Fund, Inc.
Annual Report — December 31, 2019
Notes to Financial Statements
Morgan Stanley Institutional Fund, Inc. (the "Company") is registered under the Investment Company Act of 1940, as amended (the "Act"), as an open-end management investment company. The Company is comprised of thirty-two separate, active, diversified and non-diversified funds (individually referred to as a "Fund," collectively as the "Funds"). The Company applies investment company accounting and reporting guidance.
The accompanying financial statements relate to the Global Infrastructure Portfolio. The Fund seeks to provide both capital appreciation and income.
The Fund offers six classes of shares — Class I, Class A, Class L, Class C, Class IS and Class IR. On April 30, 2015, the Fund suspended offering of Class L shares. Existing Class L shareholders may invest through reinvestment of dividends and distributions.
A. Significant Accounting Policies: The following significant accounting policies are in conformity with U.S. generally accepted accounting principles ("GAAP"). Such policies are consistently followed by the Company in the preparation of its financial statements. GAAP may require management to make estimates and assumptions that affect the reported amounts and disclosures in the financial statements. Actual results may differ from those estimates.
In August 2018, the Financial Accounting Standards Board ("FASB") issued Accounting Standards Update ("ASU") 2018-13, Fair Value Measurement (Topic 820) — Disclosures Framework — Changes to Disclosure Requirements of Fair Value Measurement ("ASU 2018-13") which introduces new fair value disclosure requirements as well as eliminates and modifies certain existing fair value disclosure requirements. ASU 2018-13 would be effective for fiscal years beginning after December 15, 2019 and for interim periods within those fiscal years; however, management has elected to early adopt ASU 2018-13 as permitted by the standard. The impact of the Fund's adoption was limited to changes in the Fund's financial statement disclosures regarding fair value, primarily those disclosures related to transfers between levels of the fair value hierarchy and disclosure of the range and weighted average used to develop significant unobservable inputs for Level 3 fair value measurements, when applicable.
1. Security Valuation: (1) An equity portfolio security listed or traded on an exchange is valued at its latest reported sales price (or at the exchange official closing price if such exchange reports an official closing price), and if
there were no sales on a given day and if there is no official exchange closing price for that day, the security is valued at the mean between the last reported bid and asked prices if such bid and asked prices are available on the relevant exchanges. If only bid prices are available then the latest bid price may be used. Listed equity securities not traded on the valuation date with no reported bid and asked prices available on the exchange are valued at the mean between the current bid and asked prices obtained from one or more reputable brokers or dealers. In cases where a security is traded on more than one exchange, the security is valued on the exchange designated as the primary market; (2) all other equity portfolio securities for which over-the-counter ("OTC") market quotations are readily available are valued at the latest reported sales price (or at the market official closing price if such market reports an official closing price), and if there was no trading in the security on a given day and if there is no official closing price from relevant markets for that day, the security is valued at the mean between the last reported bid and asked prices if such bid and asked prices are available on the relevant markets. An unlisted equity security that does not trade on the valuation date and for which bid and asked prices from the relevant markets are unavailable is valued at the mean between the current bid and asked prices obtained from one or more reputable brokers or dealers; (3) certain portfolio securities may be valued by an outside pricing service/vendor approved by the Company's Board of Directors (the "Directors"). The pricing service/vendor may employ a pricing model that takes into account, among other things, bids, yield spreads and/or other market data and specific security characteristics. Alternatively, if a valuation is not available from an outside pricing service/vendor, and the security trades on an exchange, the security may be valued at its latest reported sale price (or at the exchange official closing price if such exchange reports an official closing price), prior to the time when assets are valued. If there are no sales on a given day and if there is no official exchange closing price for that day, the security is valued at the mean between the last reported bid and asked prices if such bid and asked prices are available in the relevant exchanges. If Morgan Stanley Investment Management Inc. (the "Adviser") or Morgan Stanley Investment Management Limited ("MSIM Limited") and Morgan Stanley Investment Management Company ("MSIM Company") (together, the "Sub-Advisers"), (effective April 30, 2019, MSIM Company and MSIM
20
Morgan Stanley Institutional Fund, Inc.
Annual Report — December 31, 2019
Notes to Financial Statements (cont'd)
Limited are no longer Sub-Advisers to the Fund), each a wholly-owned subsidiary of Morgan Stanley, determines that the price provided by the outside pricing service/vendor or exchange does not reflect the security's fair value or is unable to provide a price, prices from brokers or dealers may also be utilized. In these circumstances, the value of the security will be the mean of bid and asked prices obtained from brokers or dealers; (4) when market quotations are not readily available, including circumstances under which the Adviser or Sub-Advisers determine that the closing price, last sale price or the mean between the last reported bid and asked prices are not reflective of a security's market value, portfolio securities are valued at their fair value as determined in good faith under procedures established by and under the general supervision of the Directors. Occasionally, developments affecting the closing prices of securities and other assets may occur between the times at which valuations of such securities are determined (that is, close of the foreign market on which the securities trade) and the close of business of the New York Stock Exchange ("NYSE"). If developments occur during such periods that are expected to materially affect the value of such securities, such valuations may be adjusted to reflect the estimated fair value of such securities as of the close of the NYSE, as determined in good faith by the Directors or by the Adviser using a pricing service and/or procedures approved by the Directors; (5) quotations of foreign portfolio securities, other assets and liabilities and forward contracts stated in foreign currency are translated into U.S. dollar equivalents at the prevailing market rates prior to the close of the NYSE; and (6) investments in mutual funds, including the Morgan Stanley Institutional Liquidity Funds, are valued at the net asset value ("NAV") as of the close of each business day.
The Directors have responsibility for determining in good faith the fair value of the investments, and the Directors may appoint others, such as the Company's Adviser or a valuation committee, to assist the Directors in determining fair value and to make the actual calculations pursuant to the fair valuation methodologies previously approved by the Directors. Under procedures approved by the Directors, the Company's Adviser has formed a Valuation Committee whose members are approved by the Directors. The Valuation Committee provides administration and oversight of the Company's valuation policies and procedures, which are reviewed at
least annually by the Directors. These procedures allow the Company to utilize independent pricing services, quotations from securities and financial instrument dealers and other market sources to determine fair value.
2. Fair Value Measurement: FASB Accounting Standards CodificationTM ("ASC") 820, "Fair Value Measurement" ("ASC 820"), defines fair value as the value that the Fund would receive to sell an investment or pay to transfer a liability in a timely transaction with an independent buyer in the principal market, or in the absence of a principal market, the most advantageous market for the investment or liability. ASC 820 establishes a three-tier hierarchy to distinguish between (1) inputs that reflect the assumptions market participants would use in valuing an asset or liability developed based on market data obtained from sources independent of the reporting entity (observable inputs) and (2) inputs that reflect the reporting entity's own assumptions about the assumptions market participants would use in valuing an asset or liability developed based on the best information available in the circumstances (unobservable inputs) and to establish classification of fair value measurements for disclosure purposes. Various inputs are used in determining the value of the Fund's investments. The inputs are summarized in the three broad levels listed below:
• Level 1 – unadjusted quoted prices in active markets for identical investments
• Level 2 – other significant observable inputs (including quoted prices for similar investments, interest rates, prepayment speeds, credit risk, etc.)
• Level 3 – significant unobservable inputs including the Fund's own assumptions in determining the fair value of investments. Factors considered in making this determination may include, but are not limited to, information obtained by contacting the issuer, analysts, or the appropriate stock exchange (for exchange-traded securities), analysis of the issuer's financial statements or other available documents and, if necessary, available information concerning other securities in similar circumstances.
21
Morgan Stanley Institutional Fund, Inc.
Annual Report — December 31, 2019
Notes to Financial Statements (cont'd)
The inputs or methodology used for valuing securities are not necessarily an indication of the risk associated with investing in those securities and the determination of the significance of a particular input to the fair value measurement in its entirety requires judgment and considers factors specific to each security.
The following is a summary of the inputs used to value the Fund's investments as of December 31, 2019:
Investment Type | | Level 1
Unadjusted
quoted
prices
(000) | | Level 2
Other
significant
observable
inputs
(000) | | Level 3
Significant
unobservable
inputs
(000) | | Total
(000) | |
Assets: | |
Common Stocks | |
Airports | | $ | 11,062 | | | $ | 2,340 | | | $ | — | | | $ | 13,402 | | |
Communications | | | 45,427 | | | | 1,636 | | | | — | | | | 47,063 | | |
Diversified | | | 24,828 | | | | — | | | | — | | | | 24,828 | | |
Electricity
Transmission &
Distribution | | | 45,520 | | | | 4,333 | | | | — | | | | 49,853 | | |
Oil & Gas Storage &
Transportation | | | 109,196 | | | | 6,282 | | | | — | | | | 115,478 | | |
Ports | | | 1,191 | | | | — | | | | — | | | | 1,191 | | |
Renewables | | | 15,019 | | | | — | | | | — | | | | 15,019 | | |
Toll Roads | | | 37,910 | | | | 3,602 | | | | — | | | | 41,512 | | |
Water | | | 21,976 | | | | — | | | | — | | | | 21,976 | | |
Total Common Stocks | | | 312,129 | | | | 18,193 | | | | — | | | | 330,322 | | |
Short-Term Investment | |
Investment Company | | | 9,217 | | | | — | | | | — | | | | 9,217 | | |
Total Assets | | $ | 321,346 | | | $ | 18,193 | | | $ | — | | | $ | 339,539 | | |
Transfers between investment levels may occur as the markets fluctuate and/or the availability of data used in an investment's valuation changes.
3. Repurchase Agreements: The Fund may enter into repurchase agreements under which the Fund lends cash and takes possession of securities with an agreement that the counterparty will repurchase such securities. In connection with transactions in repurchase agreements, a bank as custodian for the Fund takes possession of the underlying securities which are held as collateral, with a market value at least equal to the amount of the repurchase transaction, including principal and accrued interest. To the extent that any repurchase transaction exceeds one business day, the value of the collateral is marked-to-market on a daily basis to determine that the value of the collateral does not decrease below the repurchase price plus accrued interest as earned. If such a decrease occurs, additional collateral will be requested and, when received, will be added to the account to maintain full collateralization. In the event of default on the obligation to
repurchase, the Fund has the right to liquidate the collateral and apply the proceeds in satisfaction of the obligation. In the event of default or bankruptcy by the counterparty to the agreement, realization of the collateral proceeds may be subject to cost and delays. The Fund, along with other affiliated investment companies, may utilize a joint trading account for the purpose of entering into repurchase agreements.
At December 31, 2019, the Fund did not have any outstanding repurchase agreements.
4. Foreign Currency Translation and Foreign Investments: The books and records of the Fund are maintained in U.S. dollars. Foreign currency amounts are translated into U.S. dollars as follows:
– investments, other assets and liabilities at the prevailing rate of exchange on the valuation date;
– investment transactions and investment income at the prevailing rates of exchange on the dates of such transactions.
Although the net assets of the Fund are presented at the foreign exchange rates and market values at the close of the period, the Fund does not isolate that portion of the results of operations arising as a result of changes in the foreign exchange rates from the fluctuations arising from changes in the market prices of securities held at period end. Similarly, the Fund does not isolate the effect of changes in foreign exchange rates from the fluctuations arising from changes in the market prices of securities sold during the period. Accordingly, realized and unrealized foreign currency gains (losses) on investments in securities are included in the reported net realized and unrealized gains (losses) on investment transactions and balances. However, pursuant to U.S. federal income tax regulations, gains and losses from certain foreign currency transactions and the foreign currency portion of gains and losses realized on sales and maturities of foreign denominated debt securities are treated as ordinary income for U.S. federal income tax purposes.
Net realized gains (losses) on foreign currency transactions represent net foreign exchange gains (losses) from foreign currency forward exchange contracts, disposition of foreign currencies, currency gains (losses) realized between the trade and settlement dates on securities transactions, and the difference between the amount of
22
Morgan Stanley Institutional Fund, Inc.
Annual Report — December 31, 2019
Notes to Financial Statements (cont'd)
investment income and foreign withholding taxes recorded on the Fund's books and the U.S. dollar equivalent amounts actually received or paid. The change in unrealized currency gains (losses) on foreign currency transactions for the period is reflected in the Statement of Operations.
Foreign security and currency transactions may involve certain considerations and risks not typically associated with those of U.S. dollar denominated transactions as a result of, among other factors, fluctuations of exchange rates in relation to the U.S. dollar, the possibility of lower levels of governmental supervision and regulation of foreign securities markets and the possibility of political or economic instability.
Governmental approval for foreign investments may be required in advance of making an investment under certain circumstances in some countries, and the extent of foreign investments in domestic companies may be subject to limitation in other countries. Foreign ownership limitations also may be imposed by the charters of individual companies to prevent, among other concerns, violations of foreign investment limitations. As a result, an additional class of shares (identified as "Foreign" in the Portfolio of Investments) may be created and offered for investment. The "local" and "foreign shares" market values may differ. In the absence of trading of the foreign shares in such markets, the Fund values the foreign shares at the closing exchange price of the local shares.
5. Securities Lending: The Fund lends securities to qualified financial institutions, such as broker-dealers, to earn additional income. Any increase or decrease in the fair value of the securities loaned that might occur and any interest earned or dividends declared on those securities during the term of the loan would remain in the Fund. The Fund would receive cash or securities as collateral in an amount equal to or exceeding 100% of the current fair value of the loaned securities. The collateral is marked-to-market daily by State Street Bank and Trust Company ("State Street"), the securities lending agent, to ensure that a minimum of 100% collateral coverage is maintained.
Based on pre-established guidelines, the securities lending agent invests any cash collateral that is received in an affiliated money market portfolio and repurchase agreements. Securities lending income is generated from the earnings on the invested collateral and borrowing fees,
less any rebates owed to the borrowers and compensation to the lending agent, and is recorded as "Income from Securities Loaned — Net" in the Fund's Statement of Operations. Risks in securities lending transactions are that a borrower may not provide additional collateral when required or return the securities when due, and that the value of the short-term investments will be less than the amount of cash collateral plus any rebate that is required to be returned to the borrower.
The Fund has the right under the securities lending agreement to recover the securities from the borrower on demand.
The following table presents financial instruments that are subject to enforceable netting arrangements as of December 31, 2019:
Gross Amounts Not Offset in the Statement of Assets and Liabilities | |
Gross Asset
Amounts
Presented in the
Statement of
Assets and
Liabilities
(000) | | Financial
Instrument
(000) | | Collateral
Received
(000) | | Net Amount
(not less
than $0)
(000) | |
| $ | 14,680 | (a) | | $ | — | | | $ | (14,680 | )(b)(c) | | $ | 0 | | |
(a) Represents market value of loaned securities at year end.
(b) The Fund received non-cash collateral of approximately $15,289,000 in the form of U.S. Government obligations, which the Fund cannot sell or repledge, and accordingly are not reflected in the Portfolio of Investments.
(c) The actual collateral received is greater than the amount shown here due to overcollateralization.
6. Indemnifications: The Company enters into contracts that contain a variety of indemnifications. The Company's maximum exposure under these arrangements is unknown. However, the Company has not had prior claims or losses pursuant to these contracts and expects the risk of loss to be remote.
7. Dividends and Distributions to Shareholders: Dividends and distributions to shareholders are recorded on the ex-dividend date. Dividends from net investment income, if any, are declared and paid annually. Net realized capital gains, if any, are distributed at least annually.
8. Security Transactions, Income and Expenses: Security transactions are accounted for on the trade date (date the order to buy or sell is executed). Realized gains and losses on the sale of investment securities are determined on the specific identified cost method. Dividend income and other distributions are recorded on the ex-dividend date (except for certain foreign dividends
23
Morgan Stanley Institutional Fund, Inc.
Annual Report — December 31, 2019
Notes to Financial Statements (cont'd)
which may be recorded as soon as the Fund is informed of such dividends) net of applicable withholding taxes. Interest income is recognized on the accrual basis except where collection is in doubt. Discounts are accreted and premiums are amortized over the life of the respective securities. Most expenses of the Company can be directly attributed to a particular Fund. Expenses which cannot be directly attributed are apportioned among the Funds based upon relative net assets or other appropriate methods. Income, expenses (other than class specific expenses — distribution and shareholder services, transfer agency and sub transfer agency fees) and realized and unrealized gains or losses are allocated to each class of shares based upon their relative net assets.
B. Advisory/Sub-Advisory Fees: The Adviser, a wholly-owned subsidiary of Morgan Stanley, provides the Fund with advisory services under the terms of an Investment Advisory Agreement, paid quarterly, at an annual rate of 0.85% of the average daily net assets of the Fund.
The Adviser has agreed to reduce its advisory fee and/or reimburse the Fund so that total annual Fund operating expenses, excluding certain investment related expenses, taxes, interest and other extraordinary expenses (including litigation), will not exceed 0.97% for Class I shares, 1.21% for Class A shares, 1.78% for Class L shares, 2.07% for Class C shares, 0.94% for Class IS shares and 0.94% for Class IR shares. The fee waivers and/or expense reimbursements will continue for at least one year from the date of the Fund's prospectus or until such time as the Directors act to discontinue all or a portion of such waivers and/or reimbursements when they deem such action is appropriate. For the year ended December 31, 2019, approximately $322,000 of advisory fees were waived and approximately $245,000 of other expenses were reimbursed by the Adviser pursuant to this arrangement.
The Adviser has entered into Sub-Advisory Agreements with the Sub-Advisers, each a wholly-owned subsidiary of Morgan Stanley. The Sub-Advisers provide the Fund with advisory services subject to the overall supervision of the Adviser and the Company's Officers and Directors. The Adviser pays the Sub-Advisers on a monthly basis a portion of the net advisory fees the Adviser receives from the Fund.
Effective April 30, 2019, MSIM Company and MSIM Limited are no longer Sub-Advisers to the Fund.
C. Administration Fees: The Adviser also serves as Administrator to the Company and provides administrative services pursuant to an Administration Agreement for an annual fee, accrued daily and paid monthly, of 0.08% of the Fund's average daily net assets.
Under a Sub-Administration Agreement between the Administrator and State Street, State Street provides certain administrative services to the Company. For such services, the Administrator pays State Street a portion of the fee the Administrator receives from the Fund.
D. Distribution and Shareholder Services Fees: Morgan Stanley Distribution, Inc. ("MSDI" or the "Distributor"), a wholly-owned subsidiary of the Adviser and an indirect subsidiary of Morgan Stanley, serves as the Company's Distributor of Fund shares pursuant to a Distribution Agreement. The Company has adopted a Shareholder Services Plan with respect to Class A shares pursuant to Rule 12b-1 under the Act. Under the Shareholder Services Plan, the Fund pays the Distributor a shareholder services fee, accrued daily and paid monthly, at an annual rate of 0.25% of the Fund's average daily net assets attributable to Class A shares.
The Company has adopted a Distribution and Shareholder Services Plan with respect to Class L shares pursuant to Rule 12b-1 under the Act. Under the Distribution and Shareholder Services Plan, the Fund pays the Distributor a distribution fee, accrued daily and paid monthly, at an annual rate of 0.50% and a shareholder services fee, accrued daily and paid monthly, at an annual rate of 0.25% of the Fund's average daily net assets attributable to Class L shares.
The Company has adopted a Distribution and Shareholder Services Plan with respect to Class C shares pursuant to Rule 12b-1 under the Act. Under the Distribution and Shareholder Services Plan, the Fund pays the Distributor a distribution fee, accrued daily and paid monthly, at an annual rate of 0.75% and a shareholder services fee, accrued daily and paid monthly, at an annual rate of 0.25% of the Fund's average daily net assets attributable to Class C shares.
The distribution and shareholder services fees are used to support the expenses associated with servicing and maintaining accounts. The Distributor may compensate other parties for providing shareholder support services to investors who purchase Class A, Class L and Class C shares.
24
Morgan Stanley Institutional Fund, Inc.
Annual Report — December 31, 2019
Notes to Financial Statements (cont'd)
E. Dividend Disbursing and Transfer Agent: The Company's dividend disbursing and transfer agent is DST Asset Manager Solutions, Inc. ("DST"). Pursuant to a Transfer Agency Agreement, the Company pays DST a fee based on the number of classes, accounts and transactions relating to the Funds of the Company.
F. Custodian Fees: State Street (the "Custodian") also serves as Custodian for the Company in accordance with a Custodian Agreement. The Custodian holds cash, securities and other assets of the Company as required by the Act. Custody fees are payable monthly based on assets held in custody, investment purchases and sales activity and account maintenance fees, plus reimbursement for certain out-of-pocket expenses.
G. Security Transactions and Transactions with Affiliates: For the year ended December 31, 2019, purchases and sales of investment securities for the Fund, other than long-term U.S. Government securities and short-term investments were approximately $98,391,000 and $150,450,000, respectively. There were no purchases and sales of long-term U.S. Government securities for the year ended December 31, 2019.
The Fund invests in the Institutional Class of the Morgan Stanley Institutional Liquidity Funds (the "Liquidity Funds"), an open-end management investment company managed by the Adviser, both directly and as a portion of the securities held as collateral on loaned securities. Advisory fees paid by the Fund are reduced by an amount equal to its pro-rata share of the advisory and administration fees paid by the Fund due to its investment in the Liquidity Funds. For the year ended December 31, 2019, advisory fees paid were reduced by approximately $15,000 relating to the Fund's investment in the Liquidity Funds.
A summary of the Fund's transactions in shares of affiliated investments during the year ended December 31, 2019 is as follows:
Affiliated
Investment
Company | | Value
December 31,
2018
(000) | | Purchases
at Cost
(000) | | Proceeds
from Sales
(000) | | Dividend
Income
(000) | |
Liquidity Funds | | $ | 6,045 | | | $ | 84,157 | | | $ | 80,985 | | | $ | 179 | | |
Affiliated
Investment
Company (cont'd) | | Realized
Gain
(Loss)
(000) | | Change in
Unrealized
Appreciation
(Depreciation)
(000) | | Value
December 31,
2019
(000) | |
Liquidity Funds | | $ | — | | | $ | — | | | $ | 9,217 | | |
The Fund is permitted to purchase and sell securities ("cross-trade") from and to other Morgan Stanley funds as well as
other funds and client accounts for which the Adviser or an affiliate of the Adviser serves as investment adviser, pursuant to procedures approved by the Directors in compliance with Rule 17a-7 under the Act (the "Rule"). Each cross-trade is executed at the current market price in compliance with provisions of the Rule. For the year ended December 31, 2019, the Fund did not engage in any cross-trade transactions.
The Fund has an unfunded Deferred Compensation Plan (the "Compensation Plan"), which allows each independent Director to defer payment of all, or a portion, of the fees he or she receives for serving on the Board of Directors. Each eligible Director generally may elect to have the deferred amounts credited with a return equal to the total return on one or more of the Morgan Stanley funds that are offered as investment options under the Compensation Plan. Appreciation/depreciation and distributions received from these investments are recorded with an offsetting increase/decrease in the deferred compensation obligation and do not affect the NAV of the Fund.
H. Federal Income Taxes: It is the Fund's intention to continue to qualify as a regulated investment company and distribute all of its taxable and tax-exempt income. Accordingly, no provision for federal income taxes is required in the financial statements.
The Fund may be subject to taxes imposed by countries in which it invests. Such taxes are generally based on income and/or capital gains earned or repatriated. Taxes are accrued based on net investment income, net realized gains and net unrealized appreciation as such income and/or gains are earned. Taxes may also be based on transactions in foreign currency and are accrued based on the value of investments denominated in such currency.
FASB ASC 740-10, "Income Taxes — Overall", sets forth a minimum threshold for financial statement recognition of the benefit of a tax position taken or expected to be taken in a tax return. Management has concluded there are no significant uncertain tax positions that would require recognition in the financial statements. If applicable, the Fund recognizes interest accrued related to unrecognized tax benefits in "Interest Expense" and penalties in "Other Expenses" in the Statement of Operations. The Fund files tax returns with the U.S. Internal Revenue Service, New York and various states. Generally, each of the tax years in the four-year period ended December 31, 2019 remains subject to examination by taxing authorities.
The tax character of distributions paid may differ from the character of distributions shown for GAAP purposes due to
25
Morgan Stanley Institutional Fund, Inc.
Annual Report — December 31, 2019
Notes to Financial Statements (cont'd)
short-term capital gains being treated as ordinary income for tax purposes. The tax character of distributions paid during fiscal years 2019 and 2018 was as follows:
2019
Distributions
Paid From: | | 2018
Distributions
Paid From: | |
Ordinary
Income
(000) | | Long-Term
Capital Gain
(000) | | Ordinary
Income
(000) | | Long-Term
Capital Gain
(000) | |
| $ | 7,000 | | | $ | 2,503 | | | $ | 7,366 | | | $ | 18,949 | | |
The amount and character of income and gains to be distributed are determined in accordance with income tax regulations which may differ from GAAP. These book/tax differences are either considered temporary or permanent in nature.
Temporary differences are attributable to differing book and tax treatments for the timing of the recognition of gains (losses) on certain investment transactions and the timing of the deductibility of certain expenses.
Permanent differences, primarily due to equalization debits, resulted in the following reclassifications among the components of net assets at December 31, 2019:
Total
Distributable
Earnings
(000) | | Paid-in
Capital
(000) | |
| $ | 112 | | | $ | (112 | ) | |
At December 31, 2019, the components of distributable earnings for the Fund on a tax basis were as follows:
Undistributed
Ordinary
Income
(000) | | Undistributed
Long-Term
Capital Gain
(000) | |
| $ | 655 | | | $ | 3,290 | | |
I. Credit Facility: The Company and other Morgan Stanley funds participated in a $150,000,000 committed, unsecured revolving line of credit facility (the "Facility") with State Street. Effective April 22, 2019, the committed line amount increased to $300,000,000. This Facility is to be used for temporary emergency purposes or funding of shareholder redemption requests. The interest rate on borrowings is based on the federal funds rate or 1 month LIBOR rate plus a spread. The Facility also has a commitment fee of 0.25% per annum based on the unused portion of the Facility. During the year ended December 31, 2019, the Fund did not have any borrowings under the Facility.
J. Other: At December 31, 2019, the Fund had record owners of 10% or greater. Investment activities of these shareholders could have a material impact on the Fund. The aggregate percentage of such owners was 50.1%.
26
Morgan Stanley Institutional Fund, Inc.
Annual Report — December 31, 2019
Report of Independent Registered Public Accounting Firm
To the Shareholders and Board of Directors of
Morgan Stanley Institutional Fund, Inc. —
Global Infrastructure Portfolio
Opinion on the Financial Statements
We have audited the accompanying statement of assets and liabilities of Global Infrastructure Portfolio (the "Fund") (one of the funds constituting Morgan Stanley Institutional Fund, Inc. (the "Company")), including the portfolio of investments, as of December 31, 2019, and the related statement of operations for the year then ended, the statements of changes in net assets for each of the two years in the period then ended, the financial highlights for each of the five years in the period then ended and the related notes (collectively referred to as the "financial statements"). In our opinion, the financial statements present fairly, in all material respects, the financial position of Global Infrastructure Portfolio (one of the funds constituting Morgan Stanley Institutional Fund, Inc.) at December 31, 2019, the results of its operations for the year then ended, the changes in its net assets for each of the two years in the period then ended and its financial highlights for each of the five years in the period then ended, in conformity with U.S. generally accepted accounting principles.
Basis for Opinion
These financial statements are the responsibility of the Company's management. Our responsibility is to express an opinion on the Fund's financial statements based on our audits. We are a public accounting firm registered with the Public Company Accounting Oversight Board (United States) ("PCAOB") and are required to be independent with respect to the Company in accordance with the U.S. federal securities law and the applicable rules and regulations of the Securities and Exchange Commission and the PCAOB.
We conducted our audits in accordance with the standards of the PCAOB. Those standards require that we plan and perform the audit to obtain reasonable assurance about whether the financial statements are free of material misstatement, whether due to error or fraud. The Company is not required to have, nor were we engaged to perform, an audit of the Company's internal control over financial reporting. As part of our audits, we are required to obtain an understanding of internal control over financial reporting, but not for the purpose of expressing an opinion on the effectiveness of the Company's internal control over financial reporting. Accordingly, we express no such opinion.
Our audits included performing procedures to assess the risks of material misstatement of the financial statements, whether due to error or fraud, and performing procedures that respond to those risks. Such procedures included examining, on a test basis, evidence regarding the amounts and disclosures in the financial statements. Our procedures included confirmation of securities owned as of December 31, 2019 by correspondence with the custodian and others or by other appropriate auditing procedures where replies from others were not received. Our audits also included evaluating the accounting principles used and significant estimates made by management, as well as evaluating the overall presentation of the financial statements. We believe that our audits provide a reasonable basis for our opinion.

We have served as the auditor of one or more Morgan Stanley investment companies since 2000.
Boston, Massachusetts
February 27, 2020
27
Morgan Stanley Institutional Fund, Inc.
Annual Report — December 31, 2019
Federal Tax Notice (unaudited)
For federal income tax purposes, the following information is furnished with respect to the distributions paid by the Fund during its taxable year ended December 31, 2019. For corporate shareholders 38.42% of the dividends qualified for the dividends received deduction.
The Fund designated and paid approximately $2,504,000 as a long-term capital gain distribution.
For federal income tax purposes, the following information is furnished with respect to the Fund's earnings for its taxable year ended December 31, 2019. When distributed, certain earnings may be subject to a maximum tax rate of 15% as provided for by the Jobs and Growth Tax Relief Reconciliation Act of 2003. The Fund designated up to a maximum of approximately $7,358,000 as taxable at this lower rate.
The Fund intends to pass through foreign tax credits of approximately $358,000 and has derived net income from sources within foreign countries amounting to approximately $8,075,000.
In January, the Fund provides tax information to shareholders for the preceding calendar year.
28
Privacy Notice (unaudited) April 2019
FACTS | | WHAT DOES MSIM DO WITH YOUR PERSONAL INFORMATION? | |
Why? | | Financial companies choose how they share your personal information. Federal law gives consumers the right to limit some but not all sharing. Federal law also requires us to tell you how we collect, share, and protect your personal information. Please read this notice carefully to understand what we do. | |
What? | | The types of personal information we collect and share depend on the product or service you have with us. This information can include:
n Social Security number and income
n investment experience and risk tolerance
n checking account number and wire transfer instructions | |
How? | | All financial companies need to share customers' personal information to run their everyday business. In the section below, we list the reasons financial companies can share their customers' personal information; the reasons MSIM chooses to share; and whether you can limit this sharing. | |
Reasons we can share your personal information | | Does MSIM share? | | Can you limit this sharing? | |
For our everyday business purposes —
such as to process your transactions, maintain your account(s), respond to court orders and legal investigations, or report to credit bureaus | | Yes | | No | |
For our marketing purposes —
to offer our products and services to you | | Yes | | No | |
For joint marketing with other financial companies | | No | | We don't share | |
For our affiliates' everyday business purposes —
information about your transactions and experiences | | Yes | | No | |
For our affiliates' everyday business purposes —
information about your creditworthiness | | No | | We don't share | |
For our affiliates to market to you | | No | | We don't share | |
For non-affiliates to market to you | | No | | We don't share | |
Questions? Call toll-free (844) 312-6327 or email: imprivacyinquiries@morganstanley.com
29
Privacy Notice (unaudited) (cont'd) April 2019
Who we are
Who is providing this notice? | | Morgan Stanley Investment Management, Inc. and its affiliated registered investment advisers, registered broker-dealers, and registered and unregistered funds ("MSIM") | |
What we do
How does MSIM protect my personal information? | | To protect your personal information from unauthorized access and use, we use security measures that comply with federal law. These measures include computer safeguards and secured files and buildings. We have policies governing the proper handling of customer information by personnel and requiring third parties that provide support to adhere to appropriate security standards with respect to such information. | |
How does MSIM collect my personal information? | | We collect your personal information, for example, when you
n open an account or make deposits or withdrawals from your account
n buy securities from us or make a wire transfer
n give us your contact information
We also collect your personal information from others, such as credit bureaus, affiliates, or other companies. | |
Why can't I limit all sharing? | | Federal law gives you the right to limit only
n sharing for affiliates' everyday business purposes — information about your creditworthiness
n affiliates from using your information to market to you
n sharing for non-affiliates to market to you
State laws and individual companies may give you additional rights to limit sharing. See below for more on your rights under state law. | |
Definitions
Affiliates | | Companies related by common ownership or control. They can be financial and non-financial companies.
n Our affiliates include companies with a Morgan Stanley name and financial companies such as Morgan Stanley Smith Barney LLC and Morgan Stanley & Co. | |
Non-affiliates | | Companies not related by common ownership or control. They can be financial and non-financial companies.
n MSIM does not share with non-affiliates so they can market to you. | |
Joint marketing | | A formal agreement between non-affiliated financial companies that together market financial products or services to you.
n MSIM doesn't jointly market | |
Other Important Information
Vermont: Except as permitted by law, we will not share personal information we collect about Vermont residents with Non-affiliates unless you provide us with your written consent to share such information.
California: Except as permitted by law, we will not share personal information we collect about California residents with Non-affiliates and we will limit sharing such personal information with our Affiliates to comply with California privacy laws that apply to us.
30
Morgan Stanley Institutional Fund, Inc.
Annual Report — December 31, 2019
Director and Officer Information (unaudited)
Independent Directors:
Name, Birth Year
and Address of
Independent Director | | Position(s)
Held with
Registrant | | Length of Time
Served* | | Principal Occupation(s) During Past 5 Years
and Other Relevant Professional Experience | | Number of
Funds in
Fund Complex
Overseen by
Independent
Director** | | Other Directorships
Held by Independent
Director*** | |
Frank L. Bowman
c/o Perkins Coie LLP
Counsel to the Independent Directors
1155 Avenue of the Americas
New York, NY 10036
Birth Year 1944 | | Director | | Since
August 2006 | | President, Strategic Decisions, LLC (consulting) (since February 2009); Director or Trustee of various Morgan Stanley Funds (since August 2006); Chairperson of the Compliance and Insurance Committee (since October 2015); formerly, Chairperson of the Insurance Sub-Committee of the Compliance and Insurance Committee (2007-2015); served as President and Chief Executive Officer of the Nuclear Energy Institute (policy organization) (February 2005-November 2008); retired as Admiral, U.S. Navy after serving over 38 years on active duty including 8 years as Director of the Naval Nuclear Propulsion Program in the Department of the Navy and the U.S. Department of Energy (1996-2004); served as Chief of Naval Personnel (July 1994-September 1996) and on the Joint Staff as Director of Political Military Affairs (June 1992-July 1994); knighted as Honorary Knight Commander of the Most Excellent Order of the British Empire; awarded the Officier de l'Orde National du Mérite by the French Government; elected to the National Academy of Engineering (2009). | | | 86 | | | Director of Naval and Nuclear Technologies LLP; Director Emeritus of the Armed Services YMCA; Member of the National Security Advisory Council of the Center for U.S. Global Engagement and a member of the CNA Military Advisory Board; Trustee of Fairhaven United Methodist Church; Member of the Board of Advisors of the Dolphin Scholarship Foundation; Director of other various non-profit organizations; formerly, Director of BP p.l.c. (November 2010-May 2019). | |
Kathleen A. Dennis
c/o Perkins Coie LLP
Counsel to the Independent Directors
1155 Avenue of the Americas
New York, NY 10036
Birth Year 1953 | | Director | | Since August 2006 | | President, Cedarwood Associates (mutual fund and investment management consulting) (since July 2006); Chairperson of the Liquidity and Alternatives Sub-Committee of the Investment Committee (since October 2006) and Director or Trustee of various Morgan Stanley Funds (since August 2006); formerly, Senior Managing Director of Victory Capital Management (1993-2006). | | | 86 | | | Director of various non-profit organizations. | |
Nancy C. Everett
c/o Perkins Coie LLP
Counsel to the Independent Directors
1155 Avenue of the Americas
New York, NY 10036
Birth Year 1955 | | Director | | Since January 2015 | | Chief Executive Officer, Virginia Commonwealth University Investment Company (since November 2015); Owner, OBIR, LLC (institutional investment management consulting) (since June 2014); formerly, Managing Director, BlackRock, Inc. (February 2011-December 2013); and Chief Executive Officer, General Motors Asset Management (a/k/a Promark Global Advisors, Inc.) (June 2005-May 2010). | | | 87 | | | Formerly, Member of Virginia Commonwealth University School of Business Foundation (2005-2016); Member of Virginia Commonwealth University Board of Visitors (2013-2015); Member of Committee on Directors for Emerging Markets Growth Fund, Inc. (2007-2010); Chairperson of Performance Equity Management, LLC (2006-2010); and Chairperson, GMAM Absolute Return Strategies Fund, LLC (2006-2010). | |
31
Morgan Stanley Institutional Fund, Inc.
Annual Report — December 31, 2019
Director and Officer Information (unaudited) (cont'd)
Independent Directors: (cont'd)
Name, Birth Year
and Address of
Independent Director | | Position(s)
Held with
Registrant | | Length of Time
Served* | | Principal Occupation(s) During Past 5 Years
and Other Relevant Professional Experience | | Number of
Funds in
Fund Complex
Overseen by
Independent
Director** | | Other Directorships
Held by Independent
Director*** | |
Jakki L. Haussler
c/o Perkins Coie LLP
Counsel to the Independent Directors
1155 Avenue of the Americas
New York, NY 10036
Birth Year 1957 | | Director | | Since January 2015 | | Chairman, Opus Capital Group (since 1996); formerly, Chief Executive Officer, Opus Capital Group (1996-2019); Director, Capvest Venture Fund, LP (May 2000-December 2011); Partner, Adena Ventures, LP (July 1999-December 2010); Director, The Victory Funds (February 2005-July 2008). | | | 87 | | | Director of Service Corporation International and Member, Audit Committee and Investment Committee; Director of Cincinnati Bell Inc. and Member, Audit Committee and Governance and Nominating Committee; Chairman of Northern Kentucky University Member Investment Committee; Member of Chase College of Law Transactional Law Practice Center Board of Advisors; Director of Best Transport; Director of Chase College of Law Board of Visitors; formerly, Member, University of Cincinnati Foundation Investment Committee; Member, Miami University Board of Visitors (2008-2011); Trustee of Victory Funds (2005-2008) and Chairman, Investment Committee (2007-2008) and Member, Service Provider Committee (2005-2008). | |
Dr. Manuel H. Johnson
c/o Johnson Smick International, Inc.
220 I Street, NE — Suite 200
Washington, D.C. 20002
Birth Year 1949 | | Director | | Since July 1991 | | Senior Partner, Johnson Smick International, Inc. (consulting firm); Chairperson of the Investment Committee (since October 2006) and Director or Trustee of various Morgan Stanley Funds (since July 1991); Co-Chairman and a founder of the Group of Seven Council (G7C) (international economic commission); formerly, Chairperson of the Audit Committee (July 1991-September 2006), Vice Chairman of the Board of Governors of the Federal Reserve System and Assistant Secretary of the U.S. Treasury. | | | 86 | | | Director of NVR, Inc. (home construction). | |
Joseph J. Kearns
c/o Perkins Coie LLP
Counsel to the Independent Directors
1155 Avenue of the Americas
New York, NY 10036
Birth Year 1942 | | Director | | Since August 1994 | | Senior Adviser, Kearns & Associates LLC (investment consulting); Chairperson of the Audit Committee (since October 2006) and Director or Trustee of various Morgan Stanley Funds (since August 1994); formerly, Deputy Chairperson of the Audit Committee (July 2003-September 2006) and Chairperson of the Audit Committee of various Morgan Stanley Funds (since August 1994); CFO of the J. Paul Getty Trust. | | | 87 | | | Prior to August 10, 2016, Director of Electro Rent Corporation (equipment leasing); Prior to December 31, 2013, Director of The Ford Family Foundation. | |
32
Morgan Stanley Institutional Fund, Inc.
Annual Report — December 31, 2019
Director and Officer Information (unaudited) (cont'd)
Independent Directors: (cont'd)
Name, Birth Year
and Address of
Independent Director | | Position(s)
Held with
Registrant | | Length of Time
Served* | | Principal Occupation(s) During Past 5 Years
and Other Relevant Professional Experience | | Number of
Funds in
Fund Complex
Overseen by
Independent
Director** | | Other Directorships
Held by Independent
Director*** | |
Michael F. Klein
c/o Perkins Coie LLP
Counsel to the Independent Directors
1155 Avenue of the Americas
New York, NY 10036
Birth Year 1958 | | Director | | Since August 2006 | | Managing Director, Aetos Alternatives Management, LP (since March 2000); Co-President, Aetos Alternatives Management, LP (since January 2004) and Co-Chief Executive Officer of Aetos Alternatives Management, LP (since August 2013); Chairperson of the Fixed Income Sub-Committee of the Investment Committee (since October 2006) and Director or Trustee of various Morgan Stanley Funds (since August 2006); formerly, Managing Director, Morgan Stanley & Co. Inc. and Morgan Stanley Dean Witter Investment Management and President, various Morgan Stanley Funds (June 1998-March 2000); Principal, Morgan Stanley & Co. Inc. and Morgan Stanley Dean Witter Investment Management (August 1997-December 1999). | | | 86 | | | Director of certain investment funds managed or sponsored by Aetos Alternatives Management, LP; Director of Sanitized AG and Sanitized Marketing AG (specialty chemicals). | |
Patricia Maleski
c/o Perkins Coie LLP
Counsel to the Independent Directors
1155 Avenue of the Americas
New York, NY 10036
Birth Year 1960 | | Director | | Since January 2017 | | Managing Director, JPMorgan Asset Management (2004-2016); Oversight and Control Head of Fiduciary and Conflicts of Interest Program (2015-2016); Chief Control Officer-Global Asset Management (2013-2015); President, JPMorgan Funds (2010-2013); Chief Administrative Officer (2004-2013); various other positions including Treasurer and Board Liaison (since 2001). | | | 87 | | | None. | |
Michael E. Nugent
522 Fifth Avenue
New York, NY 10036
Birth Year 1936 | | Chair of the Board and Director | | Chair of the Boards since July 2006 and Director since July 1991 | | Chair of the Boards of various Morgan Stanley Funds (since July 2006); Chairperson of the Governance Committee (since January 2019) and Director or Trustee of various Morgan Stanley Funds (since July 1991); formerly, Chairperson of each of the Closed-End Fund committee (until December 2019) and the Insurance Committee (until July 2006); General Partner, Triumph Capital, L.P. (private investment partnership) (1988-2013). | | | 86 | | | None. | |
W. Allen Reed
c/o Perkins Coie LLP
Counsel to the Independent Directors
1155 Avenue of the Americas
New York, NY 10036
Birth Year 1947 | | Vice Chair of the Board and Director | | Vice Chair of the Boards since January 2020 and Director Since August 2006 | | Chairperson of the Equity Sub-Committee of the Investment Committee (since October 2006) and Director or Trustee of various Morgan Stanley Funds (since August 2006); formerly, President and CEO of General Motors Asset Management; Chairman and Chief Executive Officer of the GM Trust Bank and Corporate Vice President of General Motors Corporation (August 1994-December 2005). | | | 86 | | | Formerly, Director of Legg Mason, Inc.; formerly, Director of the Auburn University Foundation (2010-2015). | |
* This is the earliest date the Director began serving the Morgan Stanley Funds. Each Director serves an indefinite term, until his or her successor is elected.
** The Fund Complex includes (as of December 31, 2019) all open-end and closed-end funds (including all of their portfolios) advised by Morgan Stanley Investment Management Inc. (the "Adviser") and any funds that have an adviser that is an affiliated person of the Adviser (including, but not limited to, Morgan Stanley AIP GP LP).
*** This includes any directorships at public companies and registered investment companies held by the Director at any time during the past five years.
33
Morgan Stanley Institutional Fund, Inc.
Annual Report — December 31, 2019
Director and Officer Information (unaudited) (cont'd)
Executive Officers:
Name, Birth Year and Address of
Executive Officer | | Position(s) Held
with
Registrant | | Length of
Time Served* | | Principal Occupation(s) During Past 5 Years | |
John H. Gernon
522 Fifth Avenue
New York, NY 10036
Birth Year 1963 | | President and Principal Executive Officer | | Since September 2013 | | President and Principal Executive Officer of the Equity and Fixed Income Funds and the Morgan Stanley AIP Funds (since September 2013) and the Liquidity Funds and various money market funds (since May 2014) in the Fund Complex; Managing Director of the Adviser; Head of Product (since 2006). | |
Timothy J. Knierim
522 Fifth Avenue
New York, NY 10036
Birth Year 1959 | | Chief Compliance Officer | | Since December 2016 | | Managing Director of the Adviser and various entities affiliated with the Adviser; Chief Compliance Officer of various Morgan Stanley Funds and the Adviser (since December 2016) and Chief Compliance Officer of Morgan Stanley AIP GP LP (since 2014). Formerly, Managing Director and Deputy Chief Compliance Officer of the Adviser (2014-2016); and formerly, Chief Compliance Officer of Prudential Investment Management, Inc. (2007-2014). | |
Francis J. Smith
522 Fifth Avenue
New York, NY 10036
Birth Year 1965 | | Treasurer and Principal Financial Officer | | Treasurer since July 2003 and Principal Financial Officer since September 2002 | | Managing Director of the Adviser and various entities affiliated with the Adviser; Treasurer (since July 2003) and Principal Financial Officer of various Morgan Stanley Funds (since September 2002). | |
Mary E. Mullin
522 Fifth Avenue
New York, NY 10036
Birth Year 1967 | | Secretary | | Since June 1999 | | Managing Director of the Adviser; Secretary of various Morgan Stanley Funds (since June 1999). | |
Michael J. Key
522 Fifth Avenue
New York, NY 10036
Birth Year 1979 | | Vice President | | Since June 2017 | | Vice President of the Equity and Fixed Income Funds, Liquidity Funds, various money market funds and the Morgan Stanley AIP Funds in the Fund Complex (since June 2017); Executive Director of the Adviser; Head of Product Development for Equity and Fixed Income Funds (since August 2013). | |
* This is the earliest date the officer began serving the Morgan Stanley Funds. Each officer serves a one-year term, until his or her successor is elected and qualifies.
34
Morgan Stanley Institutional Fund, Inc.
Annual Report — December 31, 2019
Adviser and Administrator
Morgan Stanley Investment Management Inc.
522 Fifth Avenue
New York, New York 10036
Distributor
Morgan Stanley Distribution, Inc.
522 Fifth Avenue
New York, New York 10036
Dividend Disbursing and Transfer Agent
DST Asset Manager Solutions, Inc.
2000 Crown Colony Drive
Quincy, Massachusetts 02169
Custodian
State Street Bank and Trust Company
One Lincoln Street
Boston, Massachusetts 02111
Legal Counsel
Dechert LLP
1095 Avenue of the Americas
New York, New York 10036
Counsel to the Independent Directors
Perkins Coie LLP
1155 Avenue of the Americas
New York, New York 10036
Independent Registered Public Accounting Firm
Ernst & Young LLP
200 Clarendon Street
Boston, Massachusetts 02116
Reporting to Shareholders
Each Morgan Stanley fund provides a complete schedule of portfolio holdings in its Semi-Annual and the Annual Reports within 60 days of the end of the fund's second and fourth fiscal quarters. The Semi-Annual and Annual Reports are filed electronically with the Securities and Exchange Commission ("SEC") on Form N-CSRS and Form N-CSR, respectively. Morgan Stanley also delivers the Semi-Annual and Annual Reports to fund shareholders and makes these reports available on its public website, www.morganstanley.com/im/shareholderreports. Each Morgan Stanley non-money market fund also files a complete schedule of portfolio holdings with the SEC for the fund's first and third fiscal quarters as an attachment to Form N-PORT. Morgan Stanley does not deliver the reports for the first and third fiscal quarters to shareholders, nor are the reports posted to the Morgan Stanley public website. However, the holdings for each money market fund are posted to the Morgan Stanley public website. You may obtain the Form N-PORT filings (as well as the Form N-CSR and N-CSRS filings) by accessing the SEC's website, www.sec.gov. You can also request copies of these materials, upon payment of a duplicating fee, by electronic request at the SEC's email address (publicinfo@sec.gov).
Proxy Voting Policies and Procedures and Proxy Voting Record
You may obtain a copy of the Company's Proxy Voting Policy and Procedures and information regarding how the Company voted proxies relating to portfolio securities during the most recent twelve-month period ended June 30, without charge, upon request, by calling toll free 1 (800) 548-7786 or by visiting our website at www.morganstanley.com/im/shareholderreports. This information is also available on the SEC's website at www.sec.gov.
This report is authorized for distribution only when preceded or accompanied by a prospectus or summary prospectus of the applicable fund of Morgan Stanley Institutional Fund, Inc., which describes in detail the fund's investment policies, risks, fees and expenses. Please read the prospectus carefully before you invest or send money. For additional information, including information regarding the investments comprising the Fund, please visit our website at www.morganstanley.com/im/shareholderreports or call toll free 1 (800) 548-7786.
35
Printed in U.S.A.
This Report has been prepared for shareholders and may be distributed to others only if preceded or accompanied by a current prospectus.
Morgan Stanley Investment Management Inc.
522 Fifth Avenue
New York, New York 10036
© 2020 Morgan Stanley. Morgan Stanley Distribution, Inc.

IFISGIANN
2909093 EXP. 02.28.21

Morgan Stanley Institutional Fund, Inc.
Inception Portfolio
(formerly Small Company Growth Portfolio)
Annual Report
December 31, 2019
Beginning on January 1, 2021, as permitted by regulations adopted by the Securities and Exchange Commission ("SEC"), paper copies of the Fund's Annual and Semi-Annual Reports to Shareholders ("Shareholder Reports") will no longer be sent by mail, unless you specifically request paper copies of the Shareholder Reports from the Fund or from your financial intermediary, such as a broker-dealer or a bank. Instead, the Shareholder Reports will be made available on the Fund's website, https://www.morganstanley.com/im/shareholderreports and you will be notified by mail each time a Shareholder Report is posted and provided with a website link to access the Shareholder Report. If you already elected to receive Shareholder Reports electronically, you will not be affected by this change and you need not take any action. You may elect to receive Shareholder Reports and other communications from the Fund electronically anytime by contacting your financial intermediary or, if you are a direct investor, please follow the instructions on the envelope.
Beginning on January 1, 2019, you may elect to receive all future Shareholder Reports in paper free of charge. If you invest through a financial intermediary, you can contact your financial intermediary to request that you continue to receive paper copies of your Shareholder Reports. If you invest directly with the Fund, please follow the instructions on the envelope to let the Fund know you wish to continue receiving paper copies of your Shareholder Reports. Your election to receive Shareholder Reports in paper will apply to all funds held in your account if you invest through your financial intermediary or all funds held with the fund complex if you invest directly with a fund.

Morgan Stanley Institutional Fund, Inc.
Annual Report — December 31, 2019
Shareholders' Letter | | | 2 | | |
Expense Example | | | 3 | | |
Investment Overview | | | 4 | | |
Portfolio of Investments | | | 6 | | |
Statement of Assets and Liabilities | | | 9 | | |
Statement of Operations | | | 11 | | |
Statements of Changes in Net Assets | | | 12 | | |
Financial Highlights | | | 14 | | |
Notes to Financial Statements | | | 19 | | |
Report of Independent Registered Public Accounting Firm | | | 29 | | |
Federal Tax Notice | | | 30 | | |
Privacy Notice | | | 31 | | |
Director and Officer Information | | | 33 | | |
This report is authorized for distribution only when preceded or accompanied by a prospectus or summary prospectus of the applicable Fund of Morgan Stanley Institutional Fund, Inc. To receive a prospectus and/or statement of additional information ("SAI"), which contains more complete information such as investment objectives, charges, expenses, policies for voting proxies, risk considerations and describes in detail each of the Fund's investment policies to the prospective investor, please call toll free 1 (800) 548-7786. Please read the prospectuses carefully before you invest or send money.
Additionally, you can access information about the Fund, including performance, characteristics and investment team commentary, through Morgan Stanley Investment Management's website: www.morganstanley.com/im/shareholderreports.
Market forecasts provided in this report may not necessarily come to pass. There is no guarantee that any sectors mentioned will continue to perform as discussed herein or that securities in such sectors will be held by the Fund in the future. There is no assurance that a fund will achieve its investment objective. Funds are subject to market risk, which is the possibility that market values of securities owned by the Fund will decline and, therefore, the value of the Fund's shares may be less than what you paid for them. Accordingly, you can lose money investing in this Fund. Please see the prospectus for more complete information on investment risks.
1
Morgan Stanley Institutional Fund, Inc.
Annual Report — December 31, 2019
Shareholders' Letter (unaudited)
Dear Shareholders,
We are pleased to provide this Annual Report, in which you will learn how your investment in Inception Portfolio (the "Fund") (formerly Small Company Growth Portfolio) performed during the latest twelve-month period.
Morgan Stanley Investment Management is a client-centric, investor-led organization. Our global presence, intellectual capital, and breadth of products and services enable us to partner with investors to meet the evolving challenges of today's financial markets. We aim to deliver superior investment service and to empower our clients to make the informed decisions that help them reach their investment goals.
As always, we thank you for selecting Morgan Stanley Investment Management, and look forward to working with you in the months and years ahead.
Sincerely,

John H. Gernon
President and Principal Executive Officer
January 2020
2
Morgan Stanley Institutional Fund, Inc.
Annual Report — December 31, 2019
Expense Example (unaudited)
Inception Portfolio
As a shareholder of the Fund, you incur two types of costs: (1) transactional costs, including redemption fees; and (2) ongoing costs, which may include advisory fees, administration fees, distribution and shareholder services fees and other Fund expenses. This example is intended to help you understand your ongoing costs (in dollars) of investing in the Fund and to compare these costs with the ongoing costs of investing in other mutual funds.
This example is based on an investment of $1,000 invested at the beginning of the six-month period ended December 31, 2019 and held for the entire six-month period.
Actual Expenses
The table below provides information about actual account values and actual expenses. You may use the information in this table, together with the amount you invested, to estimate the expenses that you paid over the period. Simply divide your account value by $1,000 (for example, an $8,600 account value divided by $1,000 = 8.6), then multiply the result by the number in the table under the heading entitled "Actual Expenses Paid During Period" to estimate the expenses you paid on your account during this period.
Hypothetical Example for Comparison Purposes
The table below provides information about hypothetical account values and hypothetical expenses based on the Fund's actual expense ratio and an assumed rate of return of 5% per year before expenses, which is not the Fund's actual return. The hypothetical account values and expenses may not be used to estimate the actual ending account balance or expenses you paid for the period. You may use this information to compare the ongoing costs of investing in the Fund and other funds. To do so, compare this 5% hypothetical example with the 5% hypothetical examples that appear in the shareholder reports of the other funds.
Please note that the expenses shown in the table are meant to highlight your ongoing costs only and do not reflect any transactional costs, such as sales charges (loads) and redemption fees. Therefore, the information for each class in the table is useful in comparing ongoing costs only, and will not help you determine the relative total costs of owning different funds. In addition, if these transactional costs were included, your costs would have been higher.
| | | Beginning
Account
Value
7/1/19 | | Actual Ending
Account
Value
12/31/19 | | Hypothetical
Ending Account
Value | | Actual
Expenses
Paid
During
Period* | | Hypothetical
Expenses Paid
During Period* | | Net
Expense
Ratio
During
Period** | |
Inception Portfolio Class I | | $ | 1,000.00 | | | $ | 989.50 | | | $ | 1,020.21 | | | $ | 4.96 | | | $ | 5.04 | | | | 0.99 | % | |
Inception Portfolio Class A | | | 1,000.00 | | | | 987.70 | | | | 1,018.55 | | | | 6.61 | | | | 6.72 | | | | 1.32 | | |
Inception Portfolio Class L | | | 1,000.00 | | | | 985.70 | | | | 1,015.88 | | | | 9.26 | | | | 9.40 | | | | 1.85 | | |
Inception Portfolio Class C | | | 1,000.00 | | | | 983.50 | | | | 1,014.62 | | | | 10.50 | | | | 10.66 | | | | 2.10 | | |
Inception Portfolio Class IS | | | 1,000.00 | | | | 988.80 | | | | 1,020.52 | | | | 4.66 | | | | 4.74 | | | | 0.93 | | |
* Expenses are calculated using each Fund Class' annualized net expense ratio (as disclosed), multiplied by the average account value over the period and multiplied by 184/365 (to reflect the most recent one-half year period).
** Annualized.
3
Morgan Stanley Institutional Fund, Inc.
Annual Report — December 31, 2019
Investment Overview (unaudited)
Inception Portfolio
The Fund seeks long-term capital appreciation by investing primarily in growth-oriented equity securities of small capitalization companies.
Performance
For the fiscal year ended December 31, 2019, the Fund's Class I shares had a total return based on net asset value and reinvestment of distributions per share of 37.11%, net of fees. The Fund's Class I shares outperformed the Fund's benchmark, the Russell 2000® Growth Index (the "Index"), which returned 28.48%.
Please keep in mind that double-digit returns are highly unusual and cannot be sustained. Investors should also be aware that these returns were primarily achieved during favorable market conditions.
Factors Affecting Performance
• Easing geopolitical tensions, reduced recession fears and central bank support drove U.S. equities sharply higher over 2019. The U.S.-China trade war dampened the U.S. manufacturing sector and weighed on business confidence. However, consumers' resilience helped the U.S. economy maintain slow but steady growth. Acknowledging the downside risks to the economy, the U.S. Federal Reserve stopped raising its benchmark interest rate in the first half of the year, then cut rates three times to try to prolong the economic cycle. Volatility increased in 2019, but stock prices continued to rally higher, notably at year end when the U.S. and China announced a partial trade deal.
• Small-cap growth stocks, as measured by the Index, performed well in 2019. The information technology, industrials and health care sectors led the Index's performance over the annual period. Energy, which was the only sector with a negative return, communication services and consumer staples were the Index's largest underperformers in the year.
• Counterpoint Global seeks high quality companies, which we define primarily as those with sustainable competitive advantages. We manage concentrated portfolios that are highly differentiated from the benchmark, with securities weighted on our assessment of the quality of the company and our conviction. The value added or detracted in any period of time will result from stock selection, given
our philosophy and process. For the year, the Fund outperformed the Index.
• The long-term investment horizon and conviction-weighted investment approach embraced by the team since 1998 can result in periods of performance deviation from the benchmark and peers. The Fund outperformed the Index in this reporting period primarily due to favorable stock selection. Sector allocations modestly contributed to performance.
• The information technology (IT) sector contributed nearly all of the Fund's relative gains, due to both strong selection and a beneficial overweight in the sector. Many of the Fund's top contributors in the sector were software and IT services companies. Stock selection and underweight allocations in both the financials and consumer staples sectors also aided relative performance, although to a lesser extent.
• The industrials and consumer discretionary sectors were the main detractors from performance. Industrials lagged due to adverse stock selection and an underweight allocation in the sector, while the underperformance in consumer discretionary was driven by unfavorable stock selection.
Management Strategies
• As a team, we believe having a market outlook can be an anchor. Our focus is on assessing company prospects over a five-year horizon, and owning a portfolio of unique companies whose market value we believe can increase significantly for underlying fundamental reasons.
4
Morgan Stanley Institutional Fund, Inc.
Annual Report — December 31, 2019
Investment Overview (unaudited) (cont'd)
Inception Portfolio
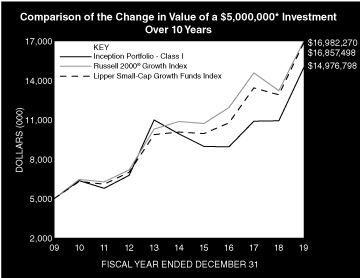
* Minimum Investment for Class I shares
In accordance with SEC regulations, the Fund's performance shown assumes that all recurring fees (including management fees) were deducted and all dividends and distributions were reinvested. The performance of Class A, L, C and IS shares will vary from the performance of Class I shares based upon their different inception dates and will be negatively impacted by additional fees assessed to those classes (if applicable).
Performance Compared to the Russell 2000® Growth Index(1) and the Lipper Small-Cap Growth Funds Index(2)
| | | Period Ended December 31, 2019
Total Returns(3) | |
| | | | | Average Annual | |
| | | One
Year | | Five
Years | | Ten
Years | | Since
Inception(9) | |
Fund — Class I Shares
w/o sales charges(4) | | | 37.11 | % | | | 8.59 | % | | | 11.60 | % | | | 10.98 | % | |
Fund — Class A Shares
w/o sales charges(5) | | | 36.71 | | | | 8.26 | | | | 11.28 | | | | 10.08 | | |
Fund — Class A Shares with
maximum 5.25% sales charges(5) | | | 29.46 | | | | 7.09 | | | | 10.68 | | | | 9.83 | | |
Fund — Class L Shares
w/o sales charges(6) | | | 35.91 | | | | 7.68 | | | | — | | | | 11.01 | | |
Fund — Class C Shares
w/o sales charges(8) | | | 35.48 | | | | — | | | | — | | | | 13.98 | | |
Fund — Class C Shares with
maximum 1.00% deferred
sales charges(8) | | | 34.48 | | | | — | | | | — | | | | 13.98 | | |
Fund — Class IS Shares
w/o sales charges(7) | | | 37.04 | | | | 8.67 | | | | — | | | | 7.70 | | |
Russell 2000® Growth Index | | | 28.48 | | | | 9.34 | | | | 13.01 | | | | 8.18 | | |
Lipper Small-Cap Growth
Funds Index | | | 30.31 | | | | 10.81 | | | | 12.89 | | | | 9.67 | | |
Performance data quoted represents past performance, which is no guarantee of future results, and current performance may be lower or higher than the figures shown. Performance assumes that all dividends and distributions, if any, were reinvested. For the most recent month-end performance figures, please visit www.morganstanley.com/im/shareholderreports. Investment return and principal value will fluctuate so that Fund shares, when redeemed, may be worth more or less than their original cost. Total returns do not reflect the deduction of taxes that a shareholder would pay on Fund distributions or the redemption of Fund shares. Performance of share classes will vary due to difference in sales charges and expenses.
(1) The Russell 2000® Growth Index measures the performance of the small-cap growth segment of the U.S. equity universe. It includes those Russell 2000® Index companies with higher price-to-book ratios and higher forecasted growth values. The Russell 2000® Index is a subset of the Russell 3000® Index representing approximately 10% of the total market capitalization of that index. It includes approximately 2,000 of the smallest securities based on a combination of their market capitalization and current index membership. The Index is unmanaged and its returns do not include any sales charges or fees. Such costs would lower performance. It is not possible to invest directly in an index.
(2) The Lipper Small-Cap Growth Funds Index is an equally weighted performance index of the largest qualifying funds (based on net assets) in the Lipper Small-Cap Growth Funds classification. The Index, which is adjusted for capital gains distributions and income dividends, is unmanaged and should not be considered an investment. There are currently 30 funds represented in this Index. As of the date of this report, the Fund was in the Lipper Small-Cap Growth Funds classification.
(3) Total returns for the Fund reflect fees waived and expenses reimbursed, if applicable, by the Adviser (as defined herein). Without such waivers and reimbursements, total returns would have been lower.
(4) Commenced operations on November 1, 1989.
(5) Commenced offering on January 2, 1996.
(6) Commenced offering on November 11, 2011.
(7) Commenced offering on September 13, 2013.
(8) Commenced offering on May 31, 2017.
(9) For comparative purposes, average annual since inception returns listed for the Indexes refer to the inception date of Class I of the Fund, not the inception of the Index.
5
Morgan Stanley Institutional Fund, Inc.
Annual Report — December 31, 2019
Portfolio of Investments
Inception Portfolio
| | | Shares | | Value
(000) | |
Common Stocks (92.4%) | |
Biotechnology (1.9%) | |
Alnylam Pharmaceuticals, Inc. (a) | | | 9,197 | | | $ | 1,059 | | |
Editas Medicine, Inc. (a) | | | 30,515 | | | | 904 | | |
Intellia Therapeutics, Inc. (a) | | | 46,209 | | | | 678 | | |
Moderna, Inc. (a) | | | 29,665 | | | | 580 | | |
| | | | 3,221 | | |
Diversified Consumer Services (1.4%) | |
Chegg, Inc. (a) | | | 63,820 | | | | 2,419 | | |
Diversified Holding Companies (0.2%) | |
Healthcare Merger Corp. (a) | | | 39,241 | | | | 406 | | |
Diversified Telecommunication Services (2.5%) | |
Anterix, Inc. (a) | | | 100,502 | | | | 4,343 | | |
Electronic Equipment, Instruments & Components (1.5%) | |
Cognex Corp. | | | 44,154 | | | | 2,474 | | |
Health Care Equipment & Supplies (6.5%) | |
Penumbra, Inc. (a) | | | 26,648 | | | | 4,377 | | |
Quotient Ltd. (a)(b) | | | 511,437 | | | | 4,864 | | |
Shockwave Medical, Inc. (a) | | | 40,738 | | | | 1,789 | | |
| | | | 11,030 | | |
Health Care Providers & Services (6.3%) | |
Covetrus, Inc. (a) | | | 97,672 | | | | 1,289 | | |
Guardant Health, Inc. (a) | | | 60,669 | | | | 4,741 | | |
HealthEquity, Inc. (a) | | | 63,621 | | | | 4,712 | | |
| | | | 10,742 | | |
Health Care Technology (7.7%) | |
Inspire Medical Systems, Inc. (a) | | | 140,680 | | | | 10,440 | | |
Phreesia, Inc. (a) | | | 102,770 | | | | 2,738 | | |
| | | | 13,178 | | |
Hotels, Restaurants & Leisure (1.4%) | |
Shake Shack, Inc., Class A (a) | | | 40,934 | | | | 2,438 | | |
Household Durables (0.1%) | |
Mohawk Group Holdings, Inc. (a) | | | 42,552 | | | | 251 | | |
Information Technology Services (8.9%) | |
Fastly, Inc., Class A (a) | | | 121,633 | | | | 2,441 | | |
LiveRamp Holdings, Inc. (a) | | | 49,015 | | | | 2,356 | | |
MongoDB, Inc. (a) | | | 60,378 | | | | 7,946 | | |
Wix.com Ltd. (Israel) (a) | | | 20,489 | | | | 2,508 | | |
| | | | 15,251 | | |
Insurance (1.6%) | |
Trupanion, Inc. (a)(b) | | | 71,316 | | | | 2,671 | | |
Interactive Media & Services (1.5%) | |
Zillow Group, Inc., Class C (a) | | | 55,105 | | | | 2,532 | | |
Internet & Direct Marketing Retail (7.8%) | |
Farfetch Ltd., Class A (a) | | | 135,829 | | | | 1,406 | | |
MakeMyTrip Ltd. (a) | | | 101,767 | | | | 2,330 | | |
Overstock.com, Inc. (a) | | | 144,084 | | | | 1,016 | | |
RealReal, Inc. (The) (a)(b) | | | 90,696 | | | | 1,709 | | |
Stitch Fix, Inc., Class A (a)(b) | | | 164,647 | | | | 4,225 | | |
Wayfair, Inc., Class A (a)(b) | | | 29,133 | | | | 2,633 | | |
| | | | 13,319 | | |
| | | Shares | | Value
(000) | |
Life Sciences Tools & Services (8.7%) | |
10X Genomics, Inc., Class A (a) | | | 66,009 | | | $ | 5,033 | | |
Adaptive Biotechnologies Corp. (a) | | | 25,908 | | | | 775 | | |
NanoString Technologies, Inc. (a) | | | 323,169 | | | | 8,991 | | |
| | | | 14,799 | | |
Media (2.3%) | |
Cardlytics, Inc. (a) | | | 62,853 | | | | 3,951 | | |
Pharmaceuticals (0.6%) | |
Intersect ENT, Inc. (a) | | | 42,191 | | | | 1,051 | | |
Real Estate Management & Development (4.8%) | |
FirstService Corp. (Canada) | | | 61,718 | | | | 5,746 | | |
Redfin Corp. (a)(b) | | | 114,426 | | | | 2,419 | | |
| | | | 8,165 | | |
Software (23.8%) | |
Alteryx, Inc., Class A (a) | | | 40,598 | | | | 4,063 | | |
Appfolio, Inc., Class A (a) | | | 22,457 | | | | 2,469 | | |
Appian Corp. (a) | | | 106,495 | | | | 4,069 | | |
Avalara, Inc. (a) | | | 107,879 | | | | 7,902 | | |
Bill.Com Holdings, Inc. (a) | | | 48,005 | | | | 1,827 | | |
Coupa Software, Inc. (a) | | | 39,661 | | | | 5,800 | | |
Everbridge, Inc. (a) | | | 30,443 | | | | 2,377 | | |
Smartsheet, Inc., Class A (a) | | | 181,785 | | | | 8,166 | | |
Xero Ltd. (New Zealand) (a) | | | 71,606 | | | | 4,020 | | |
| | | | 40,693 | | |
Textiles, Apparel & Luxury Goods (1.8%) | |
Brunello Cucinelli SpA (Italy) | | | 85,853 | | | | 3,042 | | |
Trading Companies & Distributors (1.1%) | |
EVI Industries, Inc. (b) | | | 68,072 | | | | 1,841 | | |
Total Common Stocks (Cost $130,334) | | | 157,817 | | |
Preferred Stocks (5.5%) | |
Health Care Technology (3.7%) | |
Grand Rounds, Inc. Series B (a)(c)(d)
(acquisition cost — $3,362;
acquired 7/3/14) | | | 3,269,139 | | | | 6,408 | | |
Software (1.8%) | |
Lookout, Inc. Series F (a)(c)(d)
(acquisition cost — $13,476;
acquired 6/17/14) | | | 1,179,743 | | | | 3,032 | | |
Total Preferred Stocks (Cost $16,838) | | | 9,440 | | |
Short-Term Investments (7.8%) | |
Securities held as Collateral on Loaned Securities (5.9%) | |
Investment Company (5.2%) | |
Morgan Stanley Institutional Liquidity
Funds — Treasury Securities Portfolio —
Institutional Class (See Note G) | | | 8,812,703 | | | | 8,813 | | |
The accompanying notes are an integral part of the financial statements.
6
Morgan Stanley Institutional Fund, Inc.
Annual Report — December 31, 2019
Portfolio of Investments (cont'd)
Inception Portfolio
| | | Face
Amount
(000) | | Value
(000) | |
Repurchase Agreements (0.7%) | |
HSBC Securities USA, Inc., (1.55%,
dated 12/31/19, due 01/02/20;
proceeds $304; fully collateralized
by a U.S. Government obligation;
2.88% due 08/15/28; valued at $310) | | $ | 304 | | | $ | 304 | | |
Merrill Lynch & Co., Inc., (1.55%,
dated 12/31/19, due 01/02/20;
proceeds $911; fully collateralized by
a U.S. Government obligation; 1.63%
due 11/30/26; valued at $930) | | | 911 | | | | 911 | | |
| | | | 1,215 | | |
Total Securities held as Collateral on Loaned
Securities (Cost $10,028) | | | 10,028 | | |
| | | Shares | | | |
Investment Company (1.9%) | |
Morgan Stanley Institutional Liquidity
Funds — Treasury Securities Portfolio —
Institutional Class (See Note G)
(Cost $3,231) | | | 3,231,203 | | | | 3,231 | | |
Total Short-Term Investments (Cost $13,259) | | | 13,259 | | |
Total Investments Excluding Purchased Options
(105.7%) (Cost $160,431) | | | | | 180,516 | | |
Total Purchased Options Outstanding (0.0%)
(Cost $664) | | | 73 | | |
Total Investments (105.7%) (Cost $161,095)
Including $10,012 of Securities Loaned (e)(f) | | | 180,589 | | |
Liabilities in Excess of Other Assets (–5.7%) | | | (9,782 | ) | |
Net Assets (100.0%) | | $ | 170,807 | | |
(a) Non-income producing security.
(b) All or a portion of this security was on loan at December 31, 2019.
(c) At December 31, 2019, the Fund held fair valued securities valued at approximately $9,440,000, representing 5.5% of net assets. These securities have been fair valued as determined in good faith under procedures established by and under the general supervision of the Company's (as defined herein) Directors.
(d) Security cannot be offered for public resale without first being registered under the Securities Act of 1933 and related rules ("restricted security"). Acquisition date represents the day on which an enforceable right to acquire such security is obtained and is presented along with related cost in the security description. The Fund has registration rights for certain restricted securities. Any costs related to such registration are borne by the issuer. The aggregate value of restricted securities (excluding 144A holdings) at December 31, 2019 amounts to approximately $9,440,000 and represents 5.5% of net assets.
(e) The approximate fair value and percentage of net assets, $3,042,000 and 1.8%, respectively, represent the securities that have been fair valued under the fair valuation policy for international investments as described in Note A-1 within the Notes to the Financial Statements.
(f) At December 31, 2019, the aggregate cost for federal income tax purposes is approximately $164,124,000. The aggregate gross unrealized appreciation is approximately $35,899,000 and the aggregate gross unrealized depreciation is approximately $19,434,000, resulting in net unrealized appreciation of approximately $16,465,000.
Call Options Purchased:
The Fund had the following call options purchased open at December 31, 2019:
Counterparty | | Description | | Strike
Price | | Expiration
Date | | Number of
Contracts | | Notional
Amount
(000) | | Value
(000) | | Premiums
Paid
(000) | | Unrealized
Depreciation
(000) | |
BNP Paribas | | USD/CNH | | CNH | 7.58 | | | Jan-20 | | | 42,271,883 | | | | 42,272 | | | $ | — | @ | | $ | 216 | | | $ | (216 | ) | |
Royal Bank of Scotland | | USD/CNH | | CNH | 7.85 | | | Jun-20 | | | 47,224,306 | | | | 47,224 | | | | 31 | | | | 244 | | | | (213 | ) | |
Royal Bank of Scotland | | USD/CNH | | CNH | 8.09 | | | Sep-20 | | | 37,829,268 | | | | 37,829 | | | | 42 | | | | 204 | | | | (162 | ) | |
| | | | | | | | | | | $ | 73 | | | $ | 664 | | | $ | (591 | ) | |
@ Value is less than $500.
CNH Chinese Yuan Renminbi Offshore
USD United States Dollar
The accompanying notes are an integral part of the financial statements.
7
Morgan Stanley Institutional Fund, Inc.
Annual Report — December 31, 2019
Portfolio of Investments (cont'd)
Inception Portfolio
Portfolio Composition*
Classification | | Percentage of
Total Investments | |
Software | | | 25.6 | % | |
Other** | | | 24.7 | | |
Health Care Technology | | | 11.5 | | |
Information Technology Services | | | 8.9 | | |
Life Sciences Tools & Services | | | 8.7 | | |
Internet & Direct Marketing Retail | | | 7.8 | | |
Health Care Equipment & Supplies | | | 6.5 | | |
Health Care Providers & Services | | | 6.3 | | |
Total Investments | | | 100.0 | % | |
* Percentages indicated are based upon total investments (excluding Securities held as Collateral on Loaned Securities) as of December 31, 2019.
** Industries and/or investment types representing less than 5% of total investments.
The accompanying notes are an integral part of the financial statements.
8
Morgan Stanley Institutional Fund, Inc.
Annual Report — December 31, 2019
Statement of Assets and Liabilities | | December 31, 2019
(000) | |
Assets: | |
Investments in Securities of Unaffiliated Issuers, at Value(1) (Cost $149,051) | | $ | 168,545 | | |
Investment in Security of Affiliated Issuer, at Value (Cost $12,044) | | | 12,044 | | |
Total Investments in Securities, at Value (Cost $161,095) | | | 180,589 | | |
Foreign Currency, at Value (Cost $1) | | | 1 | | |
Cash | | | 970 | | |
Receivable for Investments Sold | | | 15,749 | | |
Receivable for Fund Shares Sold | | | 475 | | |
Receivable from Securities Lending Income | | | 73 | | |
Dividends Receivable | | | 9 | | |
Receivable from Affiliate | | | 7 | | |
Other Assets | | | 91 | | |
Total Assets | | | 197,964 | | |
Liabilities: | |
Payable for Fund Shares Redeemed | | | 15,508 | | |
Collateral on Securities Loaned, at Value | | | 10,190 | | |
Payable for Investments Purchased | | | 744 | | |
Payable for Advisory Fees | | | 310 | | |
Due to Broker | | | 260 | | |
Payable for Professional Fees | | | 42 | | |
Payable for Sub Transfer Agency Fees — Class I | | | 9 | | |
Payable for Sub Transfer Agency Fees — Class A | | | 8 | | |
Payable for Sub Transfer Agency Fees — Class L | | | — | @ | |
Payable for Sub Transfer Agency Fees — Class C | | | — | @ | |
Payable for Administration Fees | | | 13 | | |
Payable for Shareholder Services Fees — Class A | | | 10 | | |
Payable for Distribution and Shareholder Services Fees — Class L | | | 1 | | |
Payable for Distribution and Shareholder Services Fees — Class C | | | 1 | | |
Payable for Transfer Agency Fees — Class I | | | 2 | | |
Payable for Transfer Agency Fees — Class A | | | 3 | | |
Payable for Transfer Agency Fees — Class L | | | 1 | | |
Payable for Transfer Agency Fees — Class C | | | — | @ | |
Payable for Transfer Agency Fees — Class IS | | | 1 | | |
Payable for Custodian Fees | | | 4 | | |
Other Liabilities | | | 50 | | |
Total Liabilities | | | 27,157 | | |
Net Assets | | $ | 170,807 | | |
Net Assets Consist of: | |
Paid-in-Capital | | $ | 153,727 | | |
Total Distributable Earnings | | | 17,080 | | |
Net Assets | | $ | 170,807 | | |
The accompanying notes are an integral part of the financial statements.
9
Morgan Stanley Institutional Fund, Inc.
Annual Report — December 31, 2019
Statement of Assets and Liabilities (cont'd) | | December 31, 2019
(000) | |
CLASS I: | |
Net Assets | | $ | 59,092 | | |
| Shares Outstanding $0.001 par value shares of beneficial interest (unlimited shares authorized) (not in 000's) | | | 5,278,749 | | |
Net Asset Value, Offering and Redemption Price Per Share | | $ | 11.19 | | |
CLASS A: | |
Net Assets | | $ | 45,097 | | |
| Shares Outstanding $0.001 par value shares of beneficial interest (unlimited shares authorized) (not in 000's) | | | 5,302,147 | | |
Net Asset Value, Redemption Price Per Share | | $ | 8.51 | | |
Maximum Sales Load | | | 5.25 | % | |
Maximum Sales Charge | | $ | 0.47 | | |
Maximum Offering Price Per Share | | $ | 8.98 | | |
CLASS L: | |
Net Assets | | $ | 1,218 | | |
| Shares Outstanding $0.001 par value shares of beneficial interest (unlimited shares authorized) (not in 000's) | | | 159,138 | | |
Net Asset Value, Offering and Redemption Price Per Share | | $ | 7.65 | | |
CLASS C: | |
Net Assets | | $ | 688 | | |
| Shares Outstanding $0.001 par value shares of beneficial interest (unlimited shares authorized) (not in 000's) | | | 83,459 | | |
Net Asset Value, Offering and Redemption Price Per Share | | $ | 8.24 | | |
CLASS IS: | |
Net Assets | | $ | 64,712 | | |
| Shares Outstanding $0.001 par value shares of beneficial interest (unlimited shares authorized) (not in 000's) | | | 5,733,923 | | |
Net Asset Value, Offering and Redemption Price Per Share | | $ | 11.29 | | |
(1) Including:
Securities on Loan, at Value: | | $ | 10,012 | | |
@ Amount is less than $500.
The accompanying notes are an integral part of the financial statements.
10
Morgan Stanley Institutional Fund, Inc.
Annual Report — December 31, 2019
Statement of Operations | | Year Ended
December 31, 2019
(000) | |
Investment Income: | |
Income from Securities Loaned — Net | | $ | 1,963 | | |
Dividends from Security of Affiliated Issuer (Note G) | | | 200 | | |
Dividends from Securities of Unaffiliated Issuers (Net of $7 of Foreign Taxes Withheld) | | | 193 | | |
Total Investment Income | | | 2,356 | | |
Expenses: | |
Advisory Fees (Note B) | | | 2,036 | | |
Administration Fees (Note C) | | | 177 | | |
Shareholder Services Fees — Class A (Note D) | | | 114 | | |
Distribution and Shareholder Services Fees — Class L (Note D) | | | 10 | | |
Distribution and Shareholder Services Fees — Class C (Note D) | | | 5 | | |
Professional Fees | | | 99 | | |
Sub Transfer Agency Fees — Class I | | | 48 | | |
Sub Transfer Agency Fees — Class A | | | 49 | | |
Sub Transfer Agency Fees — Class L | | | 1 | | |
Sub Transfer Agency Fees — Class C | | | 1 | | |
Registration Fees | | | 92 | | |
Shareholder Reporting Fees | | | 53 | | |
Transfer Agency Fees — Class I (Note E) | | | 7 | | |
Transfer Agency Fees — Class A (Note E) | | | 7 | | |
Transfer Agency Fees — Class L (Note E) | | | 3 | | |
Transfer Agency Fees — Class C (Note E) | | | 2 | | |
Transfer Agency Fees — Class IS (Note E) | | | 3 | | |
Custodian Fees (Note F) | | | 17 | | |
Directors' Fees and Expenses | | | 12 | | |
Pricing Fees | | | 4 | | |
Other Expenses | | | 49 | | |
Total Expenses | | | 2,789 | | |
Waiver of Advisory Fees (Note B) | | | (476 | ) | |
Rebate from Morgan Stanley Affiliate (Note G) | | | (18 | ) | |
Reimbursement of Class Specific Expenses — Class L (Note B) | | | (1 | ) | |
Reimbursement of Class Specific Expenses — Class C (Note B) | | | (2 | ) | |
Reimbursement of Class Specific Expenses — Class IS (Note B) | | | (3 | ) | |
Net Expenses | | | 2,289 | | |
Net Investment Income | | | 67 | | |
Realized Gain (Loss): | |
Investments Sold | | | 39,854 | | |
Foreign Currency Translation | | | (7 | ) | |
Net Realized Gain | | | 39,847 | | |
Change in Unrealized Appreciation (Depreciation): | |
Investments | | | 33,285 | | |
Foreign Currency Translation | | | — | @ | |
Net Change in Unrealized Appreciation (Depreciation) | | | 33,285 | | |
Net Realized Gain and Change in Unrealized Appreciation (Depreciation) | | | 73,132 | | |
Net Increase in Net Assets Resulting from Operations | | $ | 73,199 | | |
@ Amount is less than $500.
The accompanying notes are an integral part of the financial statements.
11
Morgan Stanley Institutional Fund, Inc.
Annual Report — December 31, 2019
Statements of Changes in Net Assets | | Year Ended
December 31, 2019
(000) | | Year Ended
December 31, 2018
(000) | |
Increase (Decrease) in Net Assets: | |
Operations: | |
Net Investment Income (Loss) | | $ | 67 | | | $ | (1,227 | ) | |
Net Realized Gain | | | 39,847 | | | | 49,960 | | |
Net Change in Unrealized Appreciation (Depreciation) | | | 33,285 | | | | (38,830 | ) | |
Net Increase in Net Assets Resulting from Operations | | | 73,199 | | | | 9,903 | | |
Dividends and Distributions to Shareholders: | |
Class I | | | (11,439 | ) | | | (7,933 | ) | |
Class A | | | (8,493 | ) | | | (5,688 | ) | |
Class L | | | (248 | ) | | | (196 | ) | |
Class C | | | (123 | ) | | | (18 | ) | |
Class IS | | | (10,309 | ) | | | (14,165 | ) | |
Total Dividends and Distributions to Shareholders | | | (30,612 | ) | | | (28,000 | ) | |
Capital Share Transactions:(1) | |
Class I: | |
Subscribed | | | 32,246 | | | | 32,971 | | |
Distributions Reinvested | | | 11,410 | | | | 7,923 | | |
Redeemed | | | (55,438 | ) | | | (124,369 | ) | |
Class A: | |
Subscribed | | | 16,436 | | | | 6,959 | | |
Distributions Reinvested | | | 8,337 | | | | 5,498 | | |
Redeemed | | | (17,154 | ) | | | (13,251 | ) | |
Class L: | |
Distributions Reinvested | | | 248 | | | | 195 | | |
Redeemed | | | (355 | ) | | | (164 | ) | |
Class C: | |
Subscribed | | | 528 | | | | 145 | | |
Distributions Reinvested | | | 123 | | | | 17 | | |
Redeemed | | | (6 | ) | | | (37 | ) | |
Class IS: | |
Subscribed | | | 27,521 | | | | 31,218 | | |
Distributions Reinvested | | | 10,309 | | | | 14,160 | | |
Redeemed | | | (113,142 | ) | | | (48,990 | ) | |
Net Decrease in Net Assets Resulting from Capital Share Transactions | | | (78,937 | ) | | | (87,725 | ) | |
Redemption Fees | | | 22 | | | | 6 | | |
Total Decrease in Net Assets | | | (36,328 | ) | | | (105,816 | ) | |
Net Assets: | |
Beginning of Period | | | 207,135 | | | | 312,951 | | |
End of Period | | $ | 170,807 | | | $ | 207,135 | | |
The accompanying notes are an integral part of the financial statements.
12
Morgan Stanley Institutional Fund, Inc.
Annual Report — December 31, 2019
Statements of Changes in Net Assets (cont'd) | | Year Ended
December 31, 2019
(000) | | Year Ended
December 31, 2018
(000) | |
(1) Capital Share Transactions: | |
Class I: | |
Shares Subscribed | | | 2,532 | | | | 2,843 | | |
Shares Issued on Distributions Reinvested | | | 1,045 | | | | 780 | | |
Shares Redeemed | | | (4,613 | ) | | | (10,329 | ) | |
Net Decrease in Class I Shares Outstanding | | | (1,036 | ) | | | (6,706 | ) | |
Class A: | |
Shares Subscribed | | | 1,626 | | | | 695 | | |
Shares Issued on Distributions Reinvested | | | 1,005 | | | | 678 | | |
Shares Redeemed | | | (1,777 | ) | | | (1,434 | ) | |
Net Increase (Decrease) in Class A Shares Outstanding | | | 854 | | | | (61 | ) | |
Class L: | |
Shares Issued on Distributions Reinvested | | | 33 | | | | 26 | | |
Shares Redeemed | | | (37 | ) | | | (18 | ) | |
Net Increase (Decrease) in Class L Shares Outstanding | | | (4 | ) | | | 8 | | |
Class C: | |
Shares Subscribed | | | 54 | | | | 14 | | |
Shares Issued on Distributions Reinvested | | | 15 | | | | 2 | | |
Shares Redeemed | | | (1 | ) | | | (4 | ) | |
Net Increase in Class C Shares Outstanding | | | 68 | | | | 12 | | |
Class IS: | |
Shares Subscribed | | | 2,199 | | | | 2,514 | | |
Shares Issued on Distributions Reinvested | | | 936 | | | | 1,384 | | |
Shares Redeemed | | | (8,850 | ) | | | (4,233 | ) | |
Net Decrease in Class IS Shares Outstanding | | | (5,715 | ) | | | (335 | ) | |
The accompanying notes are an integral part of the financial statements.
13
Morgan Stanley Institutional Fund, Inc.
Annual Report — December 31, 2019
Financial Highlights
Inception Portfolio
| | | Class I | |
| | | Year Ended December 31, | |
Selected Per Share Data and Ratios | | 2019 | | 2018 | | 2017 | | 2016(1) | | 2015 | |
Net Asset Value, Beginning of Period | | $ | 9.62 | | | $ | 10.90 | | | $ | 13.26 | | | $ | 13.75 | | | $ | 16.50 | | |
Income (Loss) from Investment Operations: | |
Net Investment Income (Loss)(2) | | | 0.01 | | | | (0.05 | ) | | | (0.11 | ) | | | 0.00 | (3) | | | (0.05 | ) | |
Net Realized and Unrealized Gain (Loss) | | | 3.50 | | | | 0.16 | | | | 2.91 | | | | (0.05 | ) | | | (1.51 | ) | |
Total from Investment Operations | | | 3.51 | | | | 0.11 | | | | 2.80 | | | | (0.05 | ) | | | (1.56 | ) | |
Distributions from and/or in Excess of: | |
Net Realized Gain | | | (1.94 | ) | | | (1.39 | ) | | | (5.16 | ) | | | (0.44 | ) | | | (1.19 | ) | |
Redemption Fees | | | 0.00 | (3) | | | 0.00 | (3) | | | 0.00 | (3) | | | 0.00 | (3) | | | 0.00 | (3) | |
Net Asset Value, End of Period | | $ | 11.19 | | | $ | 9.62 | | | $ | 10.90 | | | $ | 13.26 | | | $ | 13.75 | | |
Total Return(4) | | | 37.11 | % | | | 0.29 | % | | | 21.87 | % | | | (0.35 | )% | | | (9.58 | )% | |
Ratios to Average Net Assets and Supplemental Data: | |
Net Assets, End of Period (Thousands) | | $ | 59,092 | | | $ | 60,777 | | | $ | 141,954 | | | $ | 305,945 | | | $ | 718,386 | | |
Ratio of Expenses Before Expense Limitation | | | 1.21 | % | | | 1.17 | % | | | 1.20 | % | | | 1.17 | % | | | 1.11 | % | |
Ratio of Expenses After Expense Limitation | | | 0.99 | %(5) | | | 0.98 | %(5) | | | 0.99 | %(5) | | | 1.02 | %(5)(6) | | | 1.05 | %(5) | |
Ratio of Expenses After Expense Limitation Excluding Non Operating Expenses | | | N/A | | | | 0.98 | %(5) | | | 0.99 | %(5) | | | N/A | | | | N/A | | |
Ratio of Net Investment Income (Loss) | | | 0.09 | %(5) | | | (0.41 | )%(5) | | | (0.77 | )%(5) | | | 0.02 | %(5) | | | (0.29 | )%(5) | |
Ratio of Rebate from Morgan Stanley Affiliates | | | 0.01 | % | | | 0.01 | % | | | 0.01 | % | | | 0.00 | %(7) | | | 0.00 | %(7) | |
Portfolio Turnover Rate | | | 99 | % | | | 79 | % | | | 97 | % | | | 51 | % | | | 42 | % | |
(1) Reflects prior period custodian out-of-pocket expenses that were reimbursed in September 2016. The amount of the reimbursement was immaterial on a per share basis and did not impact the total return of Class I shares. The The Ratio of Expenses After Expense Limitation and the Ratio of Net Investment Income would be unchanged as the reimbursement of custodian fees was offset against expense waivers/reimbursements with no impact to net expenses or net investment income.
(2) Per share amount is based on average shares outstanding.
(3) Amount is less than $0.005 per share.
(4) Calculated based on the net asset value as of the last business day of the period.
(5) The Ratio of Expenses After Expense Limitation and Ratio of Net Investment Income (Loss) reflect the rebate of certain Fund expenses in connection with the investments in Morgan Stanley affiliates during the period. The effect of the rebate on the ratios is disclosed in the above table as "Ratio of Rebate from Morgan Stanley Affiliates."
(6) Effective July 1, 2016, the Adviser has agreed to limit the ratio of expenses to average net assets to the maximum ratio of 1.00% for Class I shares. Prior to July 1, 2016, the maximum ratio was 1.05% for Class I shares.
(7) Amount is less than 0.005%.
The accompanying notes are an integral part of the financial statements.
14
Morgan Stanley Institutional Fund, Inc.
Annual Report — December 31, 2019
Financial Highlights
Inception Portfolio
| | | Class A | |
| | | Year Ended December 31, | |
Selected Per Share Data and Ratios | | 2019 | | 2018 | | 2017 | | 2016(1) | | 2015 | |
Net Asset Value, Beginning of Period | | $ | 7.68 | | | $ | 8.99 | | | $ | 11.72 | | | $ | 12.25 | | | $ | 14.89 | | |
Income (Loss) from Investment Operations: | |
Net Investment Loss(2) | | | (0.02 | ) | | | (0.07 | ) | | | (0.14 | ) | | | (0.04 | ) | | | (0.09 | ) | |
Net Realized and Unrealized Gain (Loss) | | | 2.79 | | | | 0.15 | | | | 2.57 | | | | (0.05 | ) | | | (1.36 | ) | |
Total from Investment Operations | | | 2.77 | | | | 0.08 | | | | 2.43 | | | | (0.09 | ) | | | (1.45 | ) | |
Distributions from and/or in Excess of: | |
Net Realized Gain | | | (1.94 | ) | | | (1.39 | ) | | | (5.16 | ) | | | (0.44 | ) | | | (1.19 | ) | |
Redemption Fees | | | 0.00 | (3) | | | 0.00 | (3) | | | 0.00 | (3) | | | 0.00 | (3) | | | 0.00 | (3) | |
Net Asset Value, End of Period | | $ | 8.51 | | | $ | 7.68 | | | $ | 8.99 | | | $ | 11.72 | | | $ | 12.25 | | |
Total Return(4) | | | 36.71 | % | | | 0.02 | % | | | 21.57 | % | | | (0.73 | )% | | | (9.88 | )% | |
Ratios to Average Net Assets and Supplemental Data: | |
Net Assets, End of Period (Thousands) | | $ | 45,097 | | | $ | 34,166 | | | $ | 40,531 | | | $ | 87,864 | | | $ | 136,621 | | |
Ratio of Expenses Before Expense Limitation | | | 1.52 | % | | | 1.44 | % | | | 1.51 | % | | | 1.45 | % | | | 1.38 | % | |
Ratio of Expenses After Expense Limitation | | | 1.29 | %(5) | | | 1.25 | %(5) | | | 1.34 | %(5) | | | 1.37 | %(5)(6) | | | 1.37 | %(5) | |
Ratio of Expenses After Expense Limitation Excluding Non Operating Expenses | | | N/A | | | | 1.25 | %(5) | | | 1.34 | %(5) | | | N/A | | | | N/A | | |
Ratio of Net Investment Loss | | | (0.23 | )%(5) | | | (0.69 | )%(5) | | | (1.12 | )%(5) | | | (0.35 | )%(5) | | | (0.61 | )%(5) | |
Ratio of Rebate from Morgan Stanley Affiliates | | | 0.01 | % | | | 0.01 | % | | | 0.01 | % | | | 0.00 | %(7) | | | 0.00 | %(7) | |
Portfolio Turnover Rate | | | 99 | % | | | 79 | % | | | 97 | % | | | 51 | % | | | 42 | % | |
(1) Reflects prior period custodian out-of-pocket expenses that were reimbursed in September 2016. The amount of the reimbursement was immaterial on a per share basis and did not impact the total return of Class A shares. The Ratio of Expenses After Expense Limitation and the Ratio of Net Investment Loss would be unchanged as the reimbursement of custodian fees was offset against expense waivers/reimbursements with no impact to net expenses or net investment loss.
(2) Per share amount is based on average shares outstanding.
(3) Amount is less than $0.005 per share.
(4) Calculated based on the net asset value which does not reflect sales charges, if applicable, as of the last business day of the period.
(5) The Ratio of Expenses After Expense Limitation and Ratio of Net Investment Loss reflect the rebate of certain Fund expenses in connection with the investments in Morgan Stanley affiliates during the period. The effect of the rebate on the ratios is disclosed in the above table as "Ratio of Rebate from Morgan Stanley Affiliates."
(6) Effective July 1, 2016, the Adviser has agreed to limit the ratio of expenses to average net assets to the maximum ratio of 1.35% for Class A shares. Prior to July 1, 2016, the maximum ratio was 1.40% for Class A shares.
(7) Amount is less than 0.005%.
The accompanying notes are an integral part of the financial statements.
15
Morgan Stanley Institutional Fund, Inc.
Annual Report — December 31, 2019
Financial Highlights
Inception Portfolio
| | | Class L | |
| | | Year Ended December 31, | |
Selected Per Share Data and Ratios | | 2019 | | 2018 | | 2017 | | 2016(1) | | 2015 | |
Net Asset Value, Beginning of Period | | $ | 7.10 | | | $ | 8.46 | | | $ | 11.34 | | | $ | 11.92 | | | $ | 14.60 | | |
Income (Loss) from Investment Operations: | |
Net Investment Loss(2) | | | (0.07 | ) | | | (0.11 | ) | | | (0.19 | ) | | | (0.10 | ) | | | (0.16 | ) | |
Net Realized and Unrealized Gain (Loss) | | | 2.56 | | | | 0.14 | | | | 2.47 | | | | (0.04 | ) | | | (1.33 | ) | |
Total from Investment Operations | | | 2.49 | | | | 0.03 | | | | 2.28 | | | | (0.14 | ) | | | (1.49 | ) | |
Distributions from and/or in Excess of: | |
Net Realized Gain | | | (1.94 | ) | | | (1.39 | ) | | | (5.16 | ) | | | (0.44 | ) | | | (1.19 | ) | |
Redemption Fees | | | 0.00 | (3) | | | 0.00 | (3) | | | 0.00 | (3) | | | 0.00 | (3) | | | 0.00 | (3) | |
Net Asset Value, End of Period | | $ | 7.65 | | | $ | 7.10 | | | $ | 8.46 | | | $ | 11.34 | | | $ | 11.92 | | |
Total Return(4) | | | 35.91 | % | | | (0.58 | )% | | | 20.95 | % | | | (1.17 | )% | | | (10.36 | )% | |
Ratios to Average Net Assets and Supplemental Data: | |
Net Assets, End of Period (Thousands) | | $ | 1,218 | | | $ | 1,157 | | | $ | 1,310 | | | $ | 1,524 | | | $ | 1,874 | | |
Ratio of Expenses Before Expense Limitation | | | 2.15 | % | | | 2.07 | % | | | 2.27 | % | | | 2.21 | % | | | 2.10 | % | |
Ratio of Expenses After Expense Limitation | | | 1.84 | %(5) | | | 1.84 | %(5) | | | 1.84 | %(5) | | | 1.87 | %(5)(6) | | | 1.90 | %(5) | |
Ratio of Expenses After Expense Limitation Excluding Non Operating Expenses | | | N/A | | | | 1.84 | %(5) | | | 1.84 | %(5) | | | N/A | | | | N/A | | |
Ratio of Net Investment Loss | | | (0.78 | )%(5) | | | (1.28 | )%(5) | | | (1.61 | )%(5) | | | (0.88 | )%(5) | | | (1.33 | )%(5) | |
Ratio of Rebate from Morgan Stanley Affiliates | | | 0.01 | % | | | 0.01 | % | | | 0.01 | % | | | 0.00 | %(7) | | | 0.00 | %(7) | |
Portfolio Turnover Rate | | | 99 | % | | | 79 | % | | | 97 | % | | | 51 | % | | | 42 | % | |
(1) Reflects prior period custodian out-of-pocket expenses that were reimbursed in September 2016. The amount of the reimbursement was immaterial on a per share basis and did not impact the total return of Class L shares. The Ratio of Expenses After Expense Limitation and the Ratio of Net Investment Loss would be unchanged as the reimbursement of custodian fees was offset against expense waivers/reimbursements with no impact to net expenses or net investment loss.
(2) Per share amount is based on average shares outstanding.
(3) Amount is less than $0.005 per share.
(4) Calculated based on the net asset value as of the last business day of the period.
(5) The Ratio of Expenses After Expense Limitation and Ratio of Net Investment Loss reflect the rebate of certain Fund expenses in connection with the investments in Morgan Stanley affiliates during the period. The effect of the rebate on the ratios is disclosed in the above table as "Ratio of Rebate from Morgan Stanley Affiliates."
(6) Effective July 1, 2016, the Adviser has agreed to limit the ratio of expenses to average net assets to the maximum ratio of 1.85% for Class L shares. Prior to July 1, 2016, the maximum ratio was 1.90% for Class L shares.
(7) Amount is less than 0.005%.
The accompanying notes are an integral part of the financial statements.
16
Morgan Stanley Institutional Fund, Inc.
Annual Report — December 31, 2019
Financial Highlights
Inception Portfolio
| | | Class C | |
| | | Year Ended December 31, | | Period from
May 31, 2017(1) to | |
Selected Per Share Data and Ratios | | 2019 | | 2018 | | December 31, 2017 | |
Net Asset Value, Beginning of Period | | $ | 7.55 | | | $ | 8.93 | | | $ | 13.59 | | |
Income (Loss) from Investment Operations: | |
Net Investment Loss(2) | | | (0.10 | ) | | | (0.03 | ) | | | (0.13 | ) | |
Net Realized and Unrealized Gain | | | 2.73 | | | | 0.04 | | | | 0.63 | | |
Total from Investment Operations | | | 2.63 | | | | 0.01 | | | | 0.50 | | |
Distributions from and/or in Excess of: | |
Net Realized Gain | | | (1.94 | ) | | | (1.39 | ) | | | (5.16 | ) | |
Redemption Fees | | | 0.00 | (3) | | | 0.00 | (3) | | | 0.00 | (3) | |
Net Asset Value, End of Period | | $ | 8.24 | | | $ | 7.55 | | | $ | 8.93 | | |
Total Return(4) | | | 35.48 | % | | | (0.78 | )% | | | 4.36 | %(7) | |
Ratios to Average Net Assets and Supplemental Data: | |
Net Assets, End of Period (Thousands) | | $ | 688 | | | $ | 116 | | | $ | 30 | | |
Ratio of Expenses Before Expense Limitation | | | 2.75 | % | | | 4.73 | % | | | 21.29 | %(8) | |
Ratio of Expenses After Expense Limitation | | | 2.09 | %(5) | | | 2.09 | %(5) | | | 2.10 | %(5)(8) | |
Ratio of Expenses After Expense Limitation Excluding Non Operating Expenses | | | N/A | | | | 2.09 | %(5) | | | 2.10 | %(5)(8) | |
Ratio of Net Investment Loss | | | (0.99 | )%(5) | | | (1.50 | )%(5) | | | (1.82 | )%(5)(8) | |
Ratio of Rebate from Morgan Stanley Affiliates | | | 0.01 | % | | | 0.01 | % | | | 0.00 | %(6)(8) | |
Portfolio Turnover Rate | | | 99 | % | | | 79 | % | | | 97 | % | |
(1) Commencement of Offering.
(2) Per share amount is based on average shares outstanding.
(3) Amount is less than $0.005 per share.
(4) Calculated based on the net asset value which does not reflect sales charges, if applicable, as of the last business day of the period.
(5) The Ratio of Expenses After Expense Limitation and Ratio of Net Investment Loss reflect the rebate of certain Fund expenses in connection with the investments in Morgan Stanley affiliates during the period. The effect of the rebate on the ratios is disclosed in the above table as "Ratio of Rebate from Morgan Stanley Affiliates."
(6) Amount is less than 0.005%.
(7) Not annualized.
(8) Annualized.
The accompanying notes are an integral part of the financial statements.
17
Morgan Stanley Institutional Fund, Inc.
Annual Report — December 31, 2019
Financial Highlights
Inception Portfolio
| | | Class IS | |
| | | Year Ended December 31, | |
Selected Per Share Data and Ratios | | 2019 | | 2018 | | 2017 | | 2016(1) | | 2015 | |
Net Asset Value, Beginning of Period | | $ | 9.69 | | | $ | 10.96 | | | $ | 13.29 | | | $ | 13.77 | | | $ | 16.51 | | |
Income (Loss) from Investment Operations: | |
Net Investment Income (Loss)(2) | | | 0.01 | | | | (0.04 | ) | | | (0.10 | ) | | | 0.01 | | | | (0.03 | ) | |
Net Realized and Unrealized Gain (Loss) | | | 3.53 | | | | 0.16 | | | | 2.93 | | | | (0.05 | ) | | | (1.52 | ) | |
Total from Investment Operations | | | 3.54 | | | | 0.12 | | | | 2.83 | | | | (0.04 | ) | | | (1.55 | ) | |
Distributions from and/or in Excess of: | |
Net Realized Gain | | | (1.94 | ) | | | (1.39 | ) | | | (5.16 | ) | | | (0.44 | ) | | | (1.19 | ) | |
Redemption Fees | | | 0.00 | (3) | | | 0.00 | (3) | | | 0.00 | (3) | | | 0.00 | (3) | | | 0.00 | (3) | |
Net Asset Value, End of Period | | $ | 11.29 | | | $ | 9.69 | | | $ | 10.96 | | | $ | 13.29 | | | $ | 13.77 | | |
Total Return(4) | | | 37.04 | % | | | 0.38 | % | | | 22.08 | % | | | (0.28 | )% | | | (9.52 | )% | |
Ratios to Average Net Assets and Supplemental Data: | |
Net Assets, End of Period (Thousands) | | $ | 64,712 | | | $ | 110,919 | | | $ | 129,126 | | | $ | 361,586 | | | $ | 660,134 | | |
Ratio of Expenses Before Expense Limitation | | | 1.15 | % | | | 1.11 | % | | | 1.09 | % | | | 1.03 | % | | | 0.99 | % | |
Ratio of Expenses After Expense Limitation | | | 0.92 | %(5) | | | 0.92 | %(5) | | | 0.92 | %(5) | | | 0.95 | %(5)(6) | | | 0.98 | %(5) | |
Ratio of Expenses After Expense Limitation Excluding Non Operating Expenses | | | N/A | | | | 0.92 | %(5) | | | 0.92 | %(5) | | | N/A | | | | N/A | | |
Ratio of Net Investment Income (Loss) | | | 0.12 | %(5) | | | (0.36 | )%(5) | | | (0.71 | )%(5) | | | 0.08 | %(5) | | | (0.21 | )%(5) | |
Ratio of Rebate from Morgan Stanley Affiliates | | | 0.01 | % | | | 0.01 | % | | | 0.01 | % | | | 0.00 | %(7) | | | 0.00 | %(7) | |
Portfolio Turnover Rate | | | 99 | % | | | 79 | % | | | 97 | % | | | 51 | % | | | 42 | % | |
(1) Reflects prior period custodian out-of-pocket expenses that were reimbursed in September 2016. The amount of the reimbursement was immaterial on a per share basis and did not impact the total return of Class IS shares. The Ratio of Expenses After Expense Limitation and the Ratio of Net Investment Income would be unchanged as the reimbursement of custodian fees was offset against expense waivers/reimbursements with no impact to net expenses or net investment income.
(2) Per share amount is based on average shares outstanding.
(3) Amount is less than $0.005 per share.
(4) Calculated based on the net asset value as of the last business day of the period.
(5) The Ratio of Expenses After Expense Limitation and Ratio of Net Investment Income (Loss) reflect the rebate of certain Fund expenses in connection with the investments in Morgan Stanley affiliates during the period. The effect of the rebate on the ratios is disclosed in the above table as "Ratio of Rebate from Morgan Stanley Affiliates."
(6) Effective July 1, 2016, the Adviser has agreed to limit the ratio of expenses to average net assets to the maximum ratio of 0.93% for Class IS shares. Prior to July 1, 2016, the maximum ratio was 0.98% for Class IS shares.
(7) Amount is less than 0.005%.
The accompanying notes are an integral part of the financial statements.
18
Morgan Stanley Institutional Fund, Inc.
Annual Report — December 31, 2019
Notes to Financial Statements
Morgan Stanley Institutional Fund, Inc. (the "Company") is registered under the Investment Company Act of 1940, as amended (the "Act"), as an open-end management investment company. The Company is comprised of thirty-two separate, active, diversified and non-diversified funds (individually referred to as a "Fund," collectively as the "Funds"). The Company applies investment company accounting and reporting guidance.
The accompanying financial statements relate to the Inception Portfolio (name changed on February 11, 2019, formerly Small Company Growth Portfolio). The Fund seeks long-term capital appreciation by investing primarily in growth-oriented equity securities of small capitalization companies.
The Fund offers five classes of shares — Class I, Class A, Class L, Class C and Class IS. On April 30, 2015, the Fund suspended offering of Class L shares. Existing Class L shareholders may invest through reinvestment of dividends and distributions.
A. Significant Accounting Policies: The following significant accounting policies are in conformity with U.S. generally accepted accounting principles ("GAAP"). Such policies are consistently followed by the Company in the preparation of its financial statements. GAAP may require management to make estimates and assumptions that affect the reported amounts and disclosures in the financial statements. Actual results may differ from those estimates.
In August 2018, the Financial Accounting Standards Board ("FASB") issued Accounting Standards Update ("ASU") 2018-13, Fair Value Measurement (Topic 820) — Disclosures Framework — Changes to Disclosure Requirements of Fair Value Measurement ("ASU 2018-13") which introduces new fair value disclosure requirements as well as eliminates and modifies certain existing fair value disclosure requirements. ASU 2018-13 would be effective for fiscal years beginning after December 15, 2019 and for interim periods within those fiscal years; however, management has elected to early adopt ASU 2018-13 as permitted by the standard. The impact of the Fund's adoption was limited to changes in the Fund's financial statement disclosures regarding fair value, primarily those disclosures related to transfers between levels of the fair value hierarchy and disclosure of the range and weighted average used to develop significant unobservable inputs for Level 3 fair value measurements, when applicable.
1. Security Valuation: (1) An equity portfolio security listed or traded on an exchange is valued at its latest
reported sales price (or at the exchange official closing price if such exchange reports an official closing price), and if there were no sales on a given day and if there is no official exchange closing price for that day, the security is valued at the mean between the last reported bid and asked prices if such bid and asked prices are available on the relevant exchanges. If only bid prices are available then the latest bid price may be used. Listed equity securities not traded on the valuation date with no reported bid and asked prices available on the exchange are valued at the mean between the current bid and asked prices obtained from one or more reputable brokers or dealers. In cases where a security is traded on more than one exchange, the security is valued on the exchange designated as the primary market; (2) all other equity portfolio securities for which over-the-counter ("OTC") market quotations are readily available are valued at the latest reported sales price (or at the market official closing price if such market reports an official closing price), and if there was no trading in the security on a given day and if there is no official closing price from relevant markets for that day, the security is valued at the mean between the last reported bid and asked prices if such bid and asked prices are available on the relevant markets. An unlisted equity security that does not trade on the valuation date and for which bid and asked prices from the relevant markets are unavailable is valued at the mean between the current bid and asked prices obtained from one or more reputable brokers or dealers; (3) certain portfolio securities may be valued by an outside pricing service/vendor approved by the Company's Board of Directors (the "Directors"). The pricing service/vendor may employ a pricing model that takes into account, among other things, bids, yield spreads and/or other market data and specific security characteristics. Alternatively, if a valuation is not available from an outside pricing service/vendor, and the security trades on an exchange, the security may be valued at its latest reported sale price (or at the exchange official closing price if such exchange reports an official closing price), prior to the time when assets are valued. If there are no sales on a given day and if there is no official exchange closing price for that day, the security is valued at the mean between the last reported bid and asked prices if such bid and asked prices are available in the relevant exchanges. If Morgan Stanley Investment Management Inc. (the "Adviser"), a wholly-owned subsidiary of Morgan Stanley, determines that the price provided by the outside pricing service/vendor
19
Morgan Stanley Institutional Fund, Inc.
Annual Report — December 31, 2019
Notes to Financial Statements (cont'd)
or exchange does not reflect the security's fair value or is unable to provide a price, prices from brokers or dealers may also be utilized. In these circumstances, the value of the security will be the mean of bid and asked prices obtained from brokers or dealers; (4) listed options are valued at the last reported sales price on the exchange on which they are listed (or at the exchange official closing price if such exchange reports an official closing price). If an official closing price or last reported sales price is unavailable, the listed option should be fair valued at the mean between its latest bid and ask prices. Unlisted options are valued at the mean between their latest bid and ask prices from a broker/dealer or valued by a pricing service/vendor; (5) when market quotations are not readily available, including circumstances under which the Adviser determines that the closing price, last sale price or the mean between the last reported bid and asked prices are not reflective of a security's market value, portfolio securities are valued at their fair value as determined in good faith under procedures established by and under the general supervision of the Directors. Occasionally, developments affecting the closing prices of securities and other assets may occur between the times at which valuations of such securities are determined (that is, close of the foreign market on which the securities trade) and the close of business of the New York Stock Exchange ("NYSE"). If developments occur during such periods that are expected to materially affect the value of such securities, such valuations may be adjusted to reflect the estimated fair value of such securities as of the close of the NYSE, as determined in good faith by the Directors or by the Adviser using a pricing service and/or procedures approved by the Directors; (6) quotations of foreign portfolio securities, other assets and liabilities and forward contracts stated in foreign currency are translated into U.S. dollar equivalents at the prevailing market rates prior to the close of the NYSE; and (7) investments in mutual funds, including the Morgan Stanley Institutional Liquidity Funds, are valued at the net asset value ("NAV") as of the close of each business day.
The Directors have responsibility for determining in good faith the fair value of the investments, and the Directors may appoint others, such as the Company's Adviser or a valuation committee, to assist the Directors in determining fair value and to make the actual calculations pursuant to the fair valuation methodologies previously approved by the Directors. Under procedures approved by the Directors, the Company's Adviser has
formed a Valuation Committee whose members are approved by the Directors. The Valuation Committee provides administration and oversight of the Company's valuation policies and procedures, which are reviewed at least annually by the Directors. These procedures allow the Company to utilize independent pricing services, quotations from securities and financial instrument dealers and other market sources to determine fair value.
2. Fair Value Measurement: FASB Accounting Standards CodificationTM ("ASC") 820, "Fair Value Measurement" ("ASC 820"), defines fair value as the value that the Fund would receive to sell an investment or pay to transfer a liability in a timely transaction with an independent buyer in the principal market, or in the absence of a principal market, the most advantageous market for the investment or liability. ASC 820 establishes a three-tier hierarchy to distinguish between (1) inputs that reflect the assumptions market participants would use in valuing an asset or liability developed based on market data obtained from sources independent of the reporting entity (observable inputs) and (2) inputs that reflect the reporting entity's own assumptions about the assumptions market participants would use in valuing an asset or liability developed based on the best information available in the circumstances (unobservable inputs) and to establish classification of fair value measurements for disclosure purposes. Various inputs are used in determining the value of the Fund's investments. The inputs are summarized in the three broad levels listed below:
• Level 1 – unadjusted quoted prices in active markets for identical investments
• Level 2 – other significant observable inputs (including quoted prices for similar investments, interest rates, prepayment speeds, credit risk, etc.)
• Level 3 – significant unobservable inputs including the Fund's own assumptions in determining the fair value of investments. Factors considered in making this determination may include, but are not limited to, information obtained by contacting the issuer, analysts, or the appropriate stock exchange (for exchange-traded securities), analysis of the issuer's financial statements or other available documents and, if necessary, available information concerning other securities in similar circumstances.
20
Morgan Stanley Institutional Fund, Inc.
Annual Report — December 31, 2019
Notes to Financial Statements (cont'd)
The inputs or methodology used for valuing securities are not necessarily an indication of the risk associated with investing in those securities and the determination of the significance of a particular input to the fair value measurement in its entirety requires judgment and considers factors specific to each security.
The following is a summary of the inputs used to value the Fund's investments as of December 31, 2019:
Investment Type | | Level 1
Unadjusted
quoted
prices
(000) | | Level 2
Other
significant
observable
inputs
(000) | | Level 3
Significant
unobservable
inputs
(000) | | Total
(000) | |
Assets: | |
Common Stocks | |
Biotechnology | | $ | 3,221 | | | $ | — | | | $ | — | | | $ | 3,221 | | |
Diversified Consumer
Services | | | 2,419 | | | | — | | | | — | | | | 2,419 | | |
Diversified Holding
Companies | | | 406 | | | | — | | | | — | | | | 406 | | |
Diversified
Telecommunication
Services | | | 4,343 | | | | — | | | | — | | | | 4,343 | | |
Electronic Equipment,
Instruments &
Components | | | 2,474 | | | | — | | | | — | | | | 2,474 | | |
Health Care
Equipment &
Supplies | | | 11,030 | | | | — | | | | — | | | | 11,030 | | |
Health Care Providers &
Services | | | 10,742 | | | | — | | | | — | | | | 10,742 | | |
Health Care Technology | | | 13,178 | | | | — | | | | — | | | | 13,178 | | |
Hotels, Restaurants &
Leisure | | | 2,438 | | | | — | | | | — | | | | 2,438 | | |
Household Durables | | | 251 | | | | — | | | | — | | | | 251 | | |
Information Technology
Services | | | 15,251 | | | | — | | | | — | | | | 15,251 | | |
Insurance | | | 2,671 | | | | — | | | | — | | | | 2,671 | | |
Interactive Media &
Services | | | 2,532 | | | | — | | | | — | | | | 2,532 | | |
Internet & Direct
Marketing Retail | | | 13,319 | | | | — | | | | — | | | | 13,319 | | |
Life Sciences Tools &
Services | | | 14,799 | | | | — | | | | — | | | | 14,799 | | |
Media | | | 3,951 | | | | — | | | | — | | | | 3,951 | | |
Pharmaceuticals | | | 1,051 | | | | — | | | | — | | | | 1,051 | | |
Real Estate
Management &
Development | | | 8,165 | | | | — | | | | — | | | | 8,165 | | |
Software | | | 40,693 | | | | — | | | | — | | | | 40,693 | | |
Textiles, Apparel &
Luxury Goods | | | — | | | | 3,042 | | | | — | | | | 3,042 | | |
Trading Companies &
Distributors | | | 1,841 | | | | — | | | | — | | | | 1,841 | | |
Total Common Stocks | | | 154,775 | | | | 3,042 | | | | — | | | | 157,817 | | |
Investment Type | | Level 1
Unadjusted
quoted
prices
(000) | | Level 2
Other
significant
observable
inputs
(000) | | Level 3
Significant
unobservable
inputs
(000) | | Total
(000) | |
Preferred Stocks | |
Health Care Technology | | $ | — | | | $ | — | | | $ | 6,408 | | | $ | 6,408 | | |
Software | | | — | | | | — | | | | 3,032 | | | | 3,032 | | |
Total Preferred Stocks | | | — | | | | — | | | | 9,440 | | | | 9,440 | | |
Call Option Purchased | | | — | | | | 73 | | | | — | | | | 73 | | |
Short-Term Investments | |
Investment Company | | | 12,044 | | | | — | | | | — | | | | 12,044 | | |
Repurchase Agreements | | | — | | | | 1,215 | | | | — | | | | 1,215 | | |
Total Short-Term
Investments | | | 12,044 | | | | 1,215 | | | | — | | | | 13,259 | | |
Total Assets | | $ | 166,819 | | | $ | 4,330 | | | $ | 9,440 | | | $ | 180,589 | | |
Transfers between investment levels may occur as the markets fluctuate and/or the availability of data used in an investment's valuation changes.
Following is a reconciliation of investments in which significant unobservable inputs (Level 3) were used in determining fair value:
| | | Preferred
Stocks
(000) | |
Beginning Balance | | $ | 11,150 | | |
Purchases | | | — | | |
Sales | | | — | | |
Amortization of discount | | | — | | |
Transfers in | | | — | | |
Transfers out | | | — | | |
Corporate actions | | | — | | |
Change in unrealized appreciation (depreciation) | | | (1,710 | ) | |
Realized gains (losses) | | | — | | |
Ending Balance | | $ | 9,440 | | |
Net change in unrealized appreciation (depreciation) from
investments still held as of December 31, 2019 | | $ | (1,710 | ) | |
21
Morgan Stanley Institutional Fund, Inc.
Annual Report — December 31, 2019
Notes to Financial Statements (cont'd)
The following table presents additional information about valuation techniques and inputs used for investments that are measured at fair value and categorized within Level 3 as of December 31, 2019. Various valuation techniques were used in the valuation of certain investments and weighted based on the level of significance. The Fund calculated the weighted averages of the unobservable inputs relative to each investment's fair value as of December 31, 2019.
| | | Fair Value at
December 31, 2019
(000) | | Valuation
Technique | | Unobservable
Input | | Amount or Range/
Weighted Average* | | Impact to
Valuation from an
Increase in Input** | |
Preferred Stocks | | $ | 9,440 | | | Discounted Cash Flow | | Weighted Average Cost
of Capital | | 15.5%–19.0%/17.5% | | Decrease | |
| | | | | | | Perpetual Growth Rate | | 3.0%–4.0%/3.5% | | Increase | |
| | | | | Market Comparable
Companies | | Enterprise
Value/Revenue | | 1.1x–8.2x/5.2x | | Increase | |
| | | | | | | Discount for Lack of
Marketability | | 13.0%–18.0%/16.4% | | Decrease | |
| | | | | Comparable
Transactions | | Enterprise
Value/Revenue | | 2.3x–7.9x/3.6x | | Increase | |
* Amount is indicative of the weighted average.
** Represents the expected directional change in the fair value of the Level 3 investments that would result from an increase in the corresponding input. A decrease to the unobservable input would have the opposite effect. Significant changes in these inputs could result in significantly higher or lower fair value measurements.
3. Repurchase Agreements: The Fund may enter into repurchase agreements under which the Fund lends cash and takes possession of securities with an agreement that the counterparty will repurchase such securities. In connection with transactions in repurchase agreements, a bank as custodian for the Fund takes possession of the underlying securities which are held as collateral, with a market value at least equal to the amount of the repurchase transaction, including principal and accrued interest. To the extent that any repurchase transaction exceeds one business day, the value of the collateral is marked-to-market on a daily basis to determine that the value of the collateral does not decrease below the repurchase price plus accrued interest as earned. If such a decrease occurs, additional collateral will be requested and, when received, will be added to the account to maintain full collateralization. In the event of default on the obligation to repurchase, the Fund has the right to liquidate the collateral and apply the proceeds in satisfaction of the obligation. In the event of default or bankruptcy by the counterparty to the agreement, realization of the collateral proceeds may be subject to cost and delays. The Fund, along with other affiliated investment companies, may utilize a joint trading account for the purpose of entering into repurchase agreements.
4. Foreign Currency Translation and Foreign Investments: The books and records of the Fund are
maintained in U.S. dollars. Foreign currency amounts are translated into U.S. dollars as follows:
– investments, other assets and liabilities at the prevailing rate of exchange on the valuation date;
– investment transactions and investment income at the prevailing rates of exchange on the dates of such transactions.
Although the net assets of the Fund are presented at the foreign exchange rates and market values at the close of the period, the Fund does not isolate that portion of the results of operations arising as a result of changes in the foreign exchange rates from the fluctuations arising from changes in the market prices of securities held at period end. Similarly, the Fund does not isolate the effect of changes in foreign exchange rates from the fluctuations arising from changes in the market prices of securities sold during the period. Accordingly, realized and unrealized foreign currency gains (losses) on investments in securities are included in the reported net realized and unrealized gains (losses) on investment transactions and balances. However, pursuant to U.S. federal income tax regulations, gains and losses from certain foreign currency transactions and the foreign currency portion of gains and losses realized on sales and maturities of foreign denominated debt securities are treated as ordinary income for U.S. federal income tax purposes.
22
Morgan Stanley Institutional Fund, Inc.
Annual Report — December 31, 2019
Notes to Financial Statements (cont'd)
Net realized gains (losses) on foreign currency transactions represent net foreign exchange gains (losses) from foreign currency forward exchange contracts, disposition of foreign currencies, currency gains (losses) realized between the trade and settlement dates on securities transactions, and the difference between the amount of investment income and foreign withholding taxes recorded on the Fund's books and the U.S. dollar equivalent amounts actually received or paid. The change in unrealized currency gains (losses) on foreign currency transactions for the period is reflected in the Statement of Operations.
Foreign security and currency transactions may involve certain considerations and risks not typically associated with those of U.S. dollar denominated transactions as a result of, among other factors, fluctuations of exchange rates in relation to the U.S. dollar, the possibility of lower levels of governmental supervision and regulation of foreign securities markets and the possibility of political or economic instability.
Governmental approval for foreign investments may be required in advance of making an investment under certain circumstances in some countries, and the extent of foreign investments in domestic companies may be subject to limitation in other countries. Foreign ownership limitations also may be imposed by the charters of individual companies to prevent, among other concerns, violations of foreign investment limitations. As a result, an additional class of shares (identified as "Foreign" in the Portfolio of Investments) may be created and offered for investment. The "local" and "foreign shares" market values may differ. In the absence of trading of the foreign shares in such markets, the Fund values the foreign shares at the closing exchange price of the local shares.
5. Derivatives: The Fund may, but is not required to, use derivative instruments for a variety of purposes, including hedging, risk management, portfolio management or to earn income. Derivatives are financial instruments whose value is based, in part, on the value of an underlying asset, interest rate, index or financial instrument. Prevailing interest rates and volatility levels, among other things, also affect the value of derivative instruments. A derivative instrument often has risks similar to its underlying asset and may have additional risks, including imperfect correlation between the value of the derivative and the underlying
asset, risks of default by the counterparty to certain transactions, magnification of losses incurred due to changes in the market value of the securities, instruments, indices or interest rates to which the derivative instrument relates, risks that the transactions may not be liquid and risks arising from margin requirements. The use of derivatives involves risks that are different from, and possibly greater than, the risks associated with other portfolio investments. Derivatives may involve the use of highly specialized instruments that require investment techniques and risk analyses different from those associated with other portfolio investments. All of the Fund's holdings, including derivative instruments, are marked-to-market each day with the change in value reflected in unrealized appreciation (depreciation). Upon disposition, a realized gain or loss is recognized.
Certain derivative transactions may give rise to a form of leverage. Leverage magnifies the potential for gain and the risk of loss. Leverage associated with derivative transactions may cause the Fund to liquidate portfolio positions when it may not be advantageous to do so to satisfy its obligations or to meet earmarking or segregation requirements, pursuant to applicable Securities and Exchange Commission ("SEC") rules and regulations, or may cause the Fund to be more volatile than if the Fund had not been leveraged. Although the Adviser seeks to use derivatives to further the Fund's investment objectives, there is no assurance that the use of derivatives will achieve this result.
Following is a description of the derivative instruments and techniques that the Fund used during the period and their associated risks:
Options: With respect to options, the Fund is subject to equity risk, interest rate risk and foreign currency exchange risk in the normal course of pursuing its investment objectives. If the Fund buys an option, it buys a legal contract giving it the right to buy or sell a specific amount of the underlying instrument or foreign currency, or futures contract on the underlying instrument or foreign currency, at an agreed-upon price during a period of time or on a specified date typically in exchange for a premium paid by the Fund. The Fund may purchase and/or sell put and call options. Purchasing call options tends to increase the Fund's exposure to the underlying (or similar) instrument. Purchasing put options
23
Morgan Stanley Institutional Fund, Inc.
Annual Report — December 31, 2019
Notes to Financial Statements (cont'd)
tends to decrease the Fund's exposure to the underlying (or similar) instrument. When entering into purchased option contracts, the Fund bears the risk of interest or exchange rates or securities prices moving unexpectedly, in which case, the Fund may not achieve the anticipated benefits of the purchased option contracts; however the risk of loss is limited to the premium paid. Purchased options are reported as part of "Total Investments in Securities" in the Statement of Assets and Liabilities. Premiums paid for purchasing options which expired are treated as realized losses. If the Fund sells an option, it sells to another party the right to buy from or sell to the Fund a specific amount of the underlying instrument or foreign currency, or futures contract on the underlying instrument or foreign currency, at an agreed-upon price during a period of time or on a specified date typically in exchange for a premium received by the Fund. When options are purchased OTC, the Fund bears the risk that the counterparty that wrote the option will be unable or unwilling to perform its obligations under the option contract. Options may also be illiquid and the Fund may have difficulty closing out its position. A decision as to whether, when and how to use options involves the exercise of skill and judgment and even a well-conceived option transaction may be unsuccessful because of market behavior or unexpected events. The prices of options can be highly volatile and the use of options can lower total returns.
FASB ASC 815, "Derivatives and Hedging" ("ASC 815"), is intended to improve financial reporting about derivative instruments by requiring enhanced disclosures to enable investors to better understand how and why the Fund uses derivative instruments, how these derivative instruments are accounted for and their effects on the Fund's financial position and results of operations.
The following table sets forth the fair value of the Fund's derivative contracts by primary risk exposure as of December 31, 2019:
| | | Asset Derivatives
Statement of Assets and
Liabilities Location | | Primary Risk
Exposure | | Value
(000) | |
Purchased Options
| | Investments, at Value
(Purchased Options) | | Currency Risk | | $ | 73 | (a) | |
(a) Amounts are included in Investments in Securities in the Statement of Assets and Liabilities.
The following tables set forth by primary risk exposure the Fund's realized gains (losses) and change in unrealized appreciation (depreciation) by type of derivative contract for the year ended December 31, 2019 in accordance with ASC 815:
Realized Gain (Loss) | |
Primary Risk Exposure | | Derivative Type | | Value
(000) | |
Currency Risk | | Investments
(Purchased Options) | | $ | (870 | )(b) | |
(b) Amounts are included in Investments Sold in the Statement of Operations.
Change in Unrealized Appreciation (Depreciation) | |
Primary Risk Exposure | | Derivative Type | | Value
(000) | |
Currency Risk | | Investments
(Purchased Options) | | $ | 119 | (c) | |
(c) Amounts are included in Investments in the Statement of Operations.
At December 31, 2019, the Fund's derivative assets and liabilities are as follows:
Gross Amounts of Assets and Liabilities
Presented in the Statement of Assets and Liabilities | |
Derivatives | | Assets(d)
(000) | | Liabilities(d)
(000) | |
Purchased Options | | $ | 73 | (a) | | $ | — | | |
(a) Amounts are included in Investments in Securities in the Statement of Assets and Liabilities.
(d) Absent an event of default or early termination, OTC derivative assets and liabilities are presented gross and not offset in the Statement of Assets and Liabilities.
The Fund typically enters into International Swaps and Derivatives Association, Inc. Master Agreements ("ISDA Master Agreements") or similar master agreements (collectively, "Master Agreements") with its contract counterparties for certain OTC derivatives in order to, among other things, reduce its credit risk to counterparties. ISDA Master Agreements include provisions for general obligations, representations, collateral and events of default or termination. Under an ISDA Master Agreement, the Fund typically may offset with the counterparty certain OTC derivative financial instruments' payables and/or receivables with collateral held and/or posted and create one single net payment (close-out netting) in the event of default, termination and/or potential deterioration in the credit quality of the counterparty. Various Master Agreements govern the terms of certain transactions with counterparties, including transactions such as swap, forward, repurchase and reverse repurchase agreements. These Master Agreements typically attempt to reduce the counterparty risk associated with such transactions by specifying credit protection mechanisms and providing standardization that improves legal certainty. Cross-termination provisions
24
Morgan Stanley Institutional Fund, Inc.
Annual Report — December 31, 2019
Notes to Financial Statements (cont'd)
under Master Agreements typically provide that a default in connection with one transaction between the Fund and a counterparty gives the non-defaulting party the right to terminate any other transactions in place with the defaulting party to create one single net payment due to/due from the defaulting party and may be a feature in certain Master Agreements. In the event the Fund exercises its right to terminate a Master Agreement after a counterparty experiences a termination event as defined in the Master Agreement, the return of collateral with market value in excess of the Fund's net liability may be delayed or denied.
The following table presents derivative financial instruments that are subject to enforceable netting arrangements as of December 31, 2019:
Gross Amounts Not Offset in the Statement of Assets and Liabilities | |
Counterparty | | Gross Asset
Derivatives
Presented in the
Statement of
Assets and
Liabilities(a)
(000) | | Financial
Instrument
(000) | | Collateral
Received(e)
(000) | | Net Amount
(not less
than $0)
(000) | |
BNP Paribas | | $ | — | @ | | $ | — | | | $ | (— | @) | | $ | 0 | | |
Royal Bank of Scotland | | | 73 | | | | — | | | | (73 | ) | | | 0 | | |
Total | | $ | 73 | | | $ | — | | | $ | (73 | ) | | $ | 0 | | |
@ Amount is less than $500.
(a) Amounts are included in Investments in Securities in the Statement of Assets and Liabilities.
(e) In some instances, the actual collateral received may be more than the amount shown here due to overcollateralization.
For the year ended December 31, 2019, the approximate average monthly amount outstanding for each derivative type is as follows:
Purchased Options: | |
Average monthly notional amount | | | 148,469,000 | | |
6. Securities Lending: The Fund lends securities to qualified financial institutions, such as broker-dealers, to earn additional income. Any increase or decrease in the fair value of the securities loaned that might occur and any interest earned or dividends declared on those securities during the term of the loan would remain in the Fund. The Fund would receive cash or securities as collateral in an amount equal to or exceeding 100% of the current fair value of the loaned securities. The collateral is marked-to-market daily by State Street Bank and Trust Company
("State Street"), the securities lending agent, to ensure that a minimum of 100% collateral coverage is maintained.
Based on pre-established guidelines, the securities lending agent invests any cash collateral that is received in an affiliated money market portfolio and repurchase agreements. Securities lending income is generated from the earnings on the invested collateral and borrowing fees, less any rebates owed to the borrowers and compensation to the lending agent, and is recorded as "Income from Securities Loaned — Net" in the Fund's Statement of Operations. Risks in securities lending transactions are that a borrower may not provide additional collateral when required or return the securities when due, and that the value of the short-term investments will be less than the amount of cash collateral plus any rebate that is required to be returned to the borrower.
The Fund has the right under the securities lending agreement to recover the securities from the borrower on demand.
The following table presents financial instruments that are subject to enforceable netting arrangements as of December 31, 2019:
Gross Amounts Not Offset in the Statement of Assets and Liabilities | |
Gross Asset
Amounts
Presented in the
Statement of
Assets and
Liabilities
(000) | | Financial
Instrument
(000) | | Collateral
Received
(000) | | Net Amount
(not less
than $0)
(000) | |
| $ | 10,012 | (f) | | $ | — | | | $ | (10,012 | )(g)(h) | | $ | 0 | | |
(f) Represents market value of loaned securities at year end.
(g) The Fund received cash collateral of approximately $10,190,000, of which approximately $10,028,000 was subsequently invested in Repurchase Agreements and Morgan Stanley Institutional Liquidity Funds as reported in the Portfolio of Investments. As of December 31, 2019, there was uninvested cash of approximately $162,000, which is not reflected in the Portfolio of Investments.
(h) The actual collateral received is greater than the amount shown here due to overcollateralization.
FASB ASC 860, "Transfers & Servicing: Repurchase-to-Maturity Transactions, Repurchase Financings, and Disclosures", is intended to provide increased transparency about the types of collateral pledged in securities lending transactions and other similar transactions that are accounted for as secured borrowing.
The following table displays a breakdown of transactions accounted for as secured borrowings, the gross obligations
25
Morgan Stanley Institutional Fund, Inc.
Annual Report — December 31, 2019
Notes to Financial Statements (cont'd)
by class of collateral pledged and the remaining contractual maturity of those transactions as of December 31, 2019:
Remaining Contractual Maturity of the Agreements | |
| | | Overnight and
Continuous
(000) | | <30 days
(000) | | Between
30 &
90 days
(000) | | >90 days
(000) | | Total
(000) | |
Securities Lending
Transactions | |
Common Stocks | | $ | 10,190 | | | $ | — | | | $ | — | | | $ | — | | | $ | 10,190 | | |
Total Borrowings | | $ | 10,190 | | | $ | — | | | $ | — | | | $ | — | | | $ | 10,190 | | |
Gross amount of
recognized liabilities
for securities lending
transactions | | | | | | | | | | | | | | | | $ | 10,190 | | |
7. Restricted Securities: The Fund invests in unregistered or otherwise restricted securities. The term "restricted securities" refers to securities that are unregistered or are held by control persons of the issuer and securities that are subject to contractual restrictions on their resale. As a result, restricted securities may be more difficult to value and the Fund may have difficulty disposing of such assets either in a timely manner or for a reasonable price. In order to dispose of an unregistered security, the Fund, where it has contractual rights to do so, may have to cause such security to be registered. A considerable period may elapse between the time the decision is made to sell the security and the time the security is registered so that the Fund can sell it. Contractual restrictions on the resale of securities vary in length and scope and are generally the result of a negotiation between the issuer and the acquirer of the securities. The Fund would, in either case, bear market risks during that period. Restricted securities are identified in the Portfolio of Investments.
8. Redemption Fees: The Fund will assess a 2% redemption fee on Class I shares, Class A shares, Class L shares, Class C shares and Class IS shares, which is paid directly to the Fund, for shares redeemed or exchanged within thirty days of purchase, subject to certain exceptions. The redemption fee is designed to protect the Fund and its remaining shareholders from the effects of short-term trading. These fees, if any, are included in the Statements of Changes in Net Assets.
9. Indemnifications: The Company enters into contracts that contain a variety of indemnifications. The Company's maximum exposure under these arrangements is unknown. However, the Company has not had prior claims or losses pursuant to these contracts and expects the risk of loss to be remote.
10. Dividends and Distributions to Shareholders: Dividends and distributions to shareholders are recorded on the ex-dividend date. Dividends from net investment income, if any, are declared and paid annually. Net realized capital gains, if any, are distributed at least annually.
11. Security Transactions, Income and Expenses: Security transactions are accounted for on the trade date (date the order to buy or sell is executed). Realized gains and losses on the sale of investment securities are determined on the specific identified cost method. Dividend income and other distributions are recorded on the ex-dividend date (except for certain foreign dividends which may be recorded as soon as the Fund is informed of such dividends) net of applicable withholding taxes. Interest income is recognized on the accrual basis except where collection is in doubt. Discounts are accreted and premiums are amortized over the life of the respective securities. Most expenses of the Company can be directly attributed to a particular Fund. Expenses which cannot be directly attributed are apportioned among the Funds based upon relative net assets or other appropriate methods. Income, expenses (other than class specific expenses — distribution and shareholder services, transfer agency and sub transfer agency fees) and realized and unrealized gains or losses are allocated to each class of shares based upon their relative net assets.
B. Advisory Fees: The Adviser, a wholly-owned subsidiary of Morgan Stanley, provides the Fund with advisory services under the terms of an Investment Advisory Agreement, paid quarterly, at the annual rate based on the daily net assets as follows:
First $1
billion | | Next $500
million | | Next $500
million | | Over $2
billion | |
| | 0.92 | % | | | 0.85 | % | | | 0.80 | % | | | 0.75 | % | |
For the year ended December 31, 2019, the advisory fee rate (net of waiver/rebate) was equivalent to an annual effective rate of 0.70% of the Fund's average daily net assets.
The Adviser has agreed to reduce its advisory fee and/or reimburse the Fund so that total annual Fund operating expenses, excluding certain investment related expenses, taxes, interest and other extraordinary expenses (including litigation), will not exceed 1.00% for Class I shares, 1.35% for Class A shares, 1.85% for Class L shares, 2.10% for Class C shares and 0.93% for Class IS shares. The fee waivers and/or expense reimbursements will continue for at least one year from the date of the Fund's prospectus or until such time as the Directors act to discontinue all or a portion of such waivers and/or reimbursements when they deem such action is appropriate. For the year
26
Morgan Stanley Institutional Fund, Inc.
Annual Report — December 31, 2019
Notes to Financial Statements (cont'd)
ended December 31, 2019, approximately $476,000 of advisory fees were waived and approximately $6,000 of other expenses were reimbursed by the Adviser pursuant to this arrangement.
C. Administration Fees: The Adviser also serves as Administrator to the Company and provides administrative services pursuant to an Administration Agreement for an annual fee, accrued daily and paid monthly, of 0.08% of the Fund's average daily net assets.
Under a Sub-Administration Agreement between the Administrator and State Street, State Street provides certain administrative services to the Company. For such services, the Administrator pays State Street a portion of the fee the Administrator receives from the Fund.
D. Distribution and Shareholder Services Fees: Morgan Stanley Distribution, Inc. ("MSDI" or the "Distributor"), a wholly-owned subsidiary of the Adviser and an indirect subsidiary of Morgan Stanley, serves as the Company's Distributor of Fund shares pursuant to a Distribution Agreement. The Company has adopted a Shareholder Services Plan with respect to Class A shares pursuant to Rule 12b-1 under the Act. Under the Shareholder Services Plan, the Fund pays the Distributor a shareholder services fee, accrued daily and paid monthly, at an annual rate of 0.25% of the Fund's average daily net assets attributable to Class A shares.
The Company has adopted a Distribution and Shareholder Services Plan with respect to Class L shares pursuant to Rule 12b-1 under the Act. Under the Distribution and Shareholder Services Plan, the Fund pays the Distributor a distribution fee, accrued daily and paid monthly, at an annual rate of 0.50% and a shareholder services fee, accrued daily and paid monthly, at an annual rate of 0.25% of the Fund's average daily net assets attributable to Class L shares.
The Company has adopted a Distribution and Shareholder Services Plan with respect to Class C shares pursuant to Rule 12b-1 under the Act. Under the Distribution and Shareholder Services Plan, the Fund pays the Distributor a distribution fee, accrued daily and paid monthly, at an annual rate of 0.75% and a shareholder services fee, accrued daily and paid monthly, at an annual rate of 0.25% of the Fund's average daily net assets attributable to Class C shares.
The distribution and shareholder services fees are used to support the expenses associated with servicing and maintaining accounts. The Distributor may compensate other parties for
providing shareholder support services to investors who purchase Class A, Class L and Class C shares.
E. Dividend Disbursing and Transfer Agent: The Company's dividend disbursing and transfer agent is DST Asset Manager Solutions, Inc. ("DST"). Pursuant to a Transfer Agency Agreement, the Company pays DST a fee based on the number of classes, accounts and transactions relating to the Funds of the Company.
F. Custodian Fees: State Street (the "Custodian") also serves as Custodian for the Company in accordance with a Custodian Agreement. The Custodian holds cash, securities and other assets of the Company as required by the Act. Custody fees are payable monthly based on assets held in custody, investment purchases and sales activity and account maintenance fees, plus reimbursement for certain out-of-pocket expenses.
G. Security Transactions and Transactions with Affiliates: For the year ended December 31, 2019, purchases and sales of investment securities for the Fund, other than long-term U.S. Government securities and short-term investments were approximately $205,766,000 and $318,728,000, respectively. There were no purchases and sales of long-term U.S. Government securities for the year ended December 31, 2019.
The Fund invests in the Institutional Class of the Morgan Stanley Institutional Liquidity Funds — Treasury Securities Portfolio (the "Liquidity Funds"), an open-end management investment company managed by the Adviser, both directly and as a portion of the securities held as collateral on loaned securities. Advisory fees paid by the Fund are reduced by an amount equal to its pro-rata share of the advisory and administration fees paid by the Fund due to its investment in the Liquidity Funds. For the year ended December 31, 2019, advisory fees paid were reduced by approximately $18,000 relating to the Fund's investment in the Liquidity Funds.
A summary of the Fund's transactions in shares of affiliated investments during the year ended December 31, 2019 is as follows:
Affiliated
Investment
Company | | Value
December 31,
2018
(000) | | Purchases
at Cost
(000) | | Proceeds
from Sales
(000) | | Dividend
Income
(000) | |
Liquidity Funds | | $ | 26,481 | | | $ | 187,465 | | | $ | 201,902 | | | $ | 200 | | |
Affiliated
Investment
Company (cont'd) | | Realized
Gain
(Loss)
(000) | | Change in
Unrealized
Appreciation
(Depreciation)
(000) | | Value
December 31,
2019
(000) | |
Liquidity Funds | | $ | — | | | $ | — | | | $ | 12,044 | | |
27
Morgan Stanley Institutional Fund, Inc.
Annual Report — December 31, 2019
Notes to Financial Statements (cont'd)
The Fund is permitted to purchase and sell securities ("cross-trade") from and to other Morgan Stanley funds as well as other funds and client accounts for which the Adviser or an affiliate of the Adviser serves as investment adviser, pursuant to procedures approved by the Directors in compliance with Rule 17a-7 under the Act (the "Rule"). Each cross-trade is executed at the current market price in compliance with provisions of the Rule. For the year ended December 31, 2019, the Fund did not engage in any cross-trade transactions.
The Fund has an unfunded Deferred Compensation Plan (the "Compensation Plan"), which allows each independent Director to defer payment of all, or a portion, of the fees he or she receives for serving on the Board of Directors. Each eligible Director generally may elect to have the deferred amounts credited with a return equal to the total return on one or more of the Morgan Stanley funds that are offered as investment options under the Compensation Plan. Appreciation/depreciation and distributions received from these investments are recorded with an offsetting increase/decrease in the deferred compensation obligation and do not affect the NAV of the Fund.
H. Federal Income Taxes: It is the Fund's intention to continue to qualify as a regulated investment company and distribute all of its taxable and tax-exempt income. Accordingly, no provision for federal income taxes is required in the financial statements.
The Fund may be subject to taxes imposed by countries in which it invests. Such taxes are generally based on income and/or capital gains earned or repatriated. Taxes are accrued based on net investment income, net realized gains and net unrealized appreciation as such income and/or gains are earned. Taxes may also be based on transactions in foreign currency and are accrued based on the value of investments denominated in such currency.
FASB ASC 740-10, "Income Taxes — Overall", sets forth a minimum threshold for financial statement recognition of the benefit of a tax position taken or expected to be taken in a tax return. Management has concluded there are no significant uncertain tax positions that would require recognition in the financial statements. If applicable, the Fund recognizes interest accrued related to unrecognized tax benefits in "Interest Expense" and penalties in "Other Expenses" in the Statement of Operations. The Fund files tax returns with the U.S. Internal Revenue Service, New York and various states. Generally, each of the tax years in the four-year period ended December 31, 2019 remains subject to examination by taxing authorities.
The tax character of distributions paid may differ from the character of distributions shown for GAAP purposes due to
short-term capital gains being treated as ordinary income for tax purposes. The tax character of distributions paid during fiscal years 2019 and 2018 was as follows:
2019
Distributions
Paid From: | | 2018
Distributions
Paid From: | |
Ordinary
Income
(000) | | Long-Term
Capital Gain
(000) | | Ordinary
Income
(000) | | Long-Term
Capital Gain
(000) | |
| $ | 4,250 | | | $ | 26,362 | | | $ | 9,040 | | | $ | 18,960 | | |
The amount and character of income and gains to be distributed are determined in accordance with income tax regulations which may differ from GAAP. These book/tax differences are either considered temporary or permanent in nature.
Temporary differences are attributable to differing book and tax treatments for the timing of the recognition of gains (losses) on certain investment transactions and the timing of the deductibility of certain expenses.
Permanent differences, primarily due to equalization debits and a nondeductible expense, resulted in the following reclassifications among the components of net assets at December 31, 2019:
Total
Distributable
Earnings
(000) | | Paid-in
Capital
(000) | |
| $ | (8,021 | ) | | $ | 8,021 | | |
At December 31, 2019, the components of distributable earnings for the Fund on a tax basis were as follows:
Undistributed
Ordinary
Income
(000) | | Undistributed
Long-Term
Capital Gain
(000) | |
| $ | 642 | | | $ | — | | |
I. Credit Facility: The Company and other Morgan Stanley funds participated in a $150,000,000 committed, unsecured revolving line of credit facility (the "Facility") with State Street. Effective April 22, 2019, the committed line amount increased to $300,000,000. This Facility is to be used for temporary emergency purposes or funding of shareholder redemption requests. The interest rate on borrowings is based on the federal funds rate or 1 month LIBOR rate plus a spread. The Facility also has a commitment fee of 0.25% per annum based on the unused portion of the Facility. During the year ended December 31, 2019, the Fund did not have any borrowings under the Facility.
J. Other: At December 31, 2019, the Fund had record owners of 10% or greater. Investment activities of these shareholders could have a material impact on the Fund. The aggregate percentage of such owners was 57.0%.
28
Morgan Stanley Institutional Fund, Inc.
Annual Report — December 31, 2019
Report of Independent Registered Public Accounting Firm
To the Shareholders and Board of Directors of
Morgan Stanley Institutional Fund, Inc. —
Inception Portfolio
Opinion on the Financial Statements
We have audited the accompanying statement of assets and liabilities of Inception Portfolio (formerly Small Company Growth Portfolio) (the "Fund") (one of the funds constituting Morgan Stanley Institutional Fund, Inc. (the "Company")), including the portfolio of investments, as of December 31, 2019, and the related statement of operations for the year then ended, the statements of changes in net assets for each of the two years in the period then ended, the financial highlights for each of the five years in the period then ended and the related notes (collectively referred to as the "financial statements"). In our opinion, the financial statements present fairly, in all material respects, the financial position of Inception Portfolio (formerly Small Company Growth Portfolio) (one of the funds constituting Morgan Stanley Institutional Fund, Inc.) at December 31, 2019, the results of its operations for the year then ended, the changes in its net assets for each of the two years in the period then ended and its financial highlights for each of the five years in the period then ended, in conformity with U.S. generally accepted accounting principles.
Basis for Opinion
These financial statements are the responsibility of the Company's management. Our responsibility is to express an opinion on the Fund's financial statements based on our audits. We are a public accounting firm registered with the Public Company Accounting Oversight Board (United States) ("PCAOB") and are required to be independent with respect to the Company in accordance with the U.S. federal securities law and the applicable rules and regulations of the Securities and Exchange Commission and the PCAOB.
We conducted our audits in accordance with the standards of the PCAOB. Those standards require that we plan and perform the audit to obtain reasonable assurance about whether the financial statements are free of material misstatement, whether due to error or fraud. The Company is not required to have, nor were we engaged to perform, an audit of the Company's internal control over financial reporting. As part of our audits, we are required to obtain an understanding of internal control over financial reporting, but not for the purpose of expressing an opinion on the effectiveness of the Company's internal control over financial reporting. Accordingly, we express no such opinion.
Our audits included performing procedures to assess the risks of material misstatement of the financial statements, whether due to error or fraud, and performing procedures that respond to those risks. Such procedures included examining, on a test basis, evidence regarding the amounts and disclosures in the financial statements. Our procedures included confirmation of securities owned as of December 31, 2019 by correspondence with the custodian and others or by other appropriate auditing procedures where replies from others were not received. Our audits also included evaluating the accounting principles used and significant estimates made by management, as well as evaluating the overall presentation of the financial statements. We believe that our audits provide a reasonable basis for our opinion.

We have served as the auditor of one or more Morgan Stanley investment companies since 2000.
Boston, Massachusetts
February 27, 2020
29
Morgan Stanley Institutional Fund, Inc.
Annual Report — December 31, 2019
Federal Tax Notice (unaudited)
For federal income tax purposes, the following information is furnished with respect to the distributions paid by the Fund during its taxable year ended December 31, 2019. For corporate shareholders 1.64% of the dividends qualified for the dividends received deduction.
The Fund designated and paid approximately $30,216,000 as a long-term capital gain distribution.
For federal income tax purposes, the following information is furnished with respect to the Fund's earnings for its taxable year ended December 31, 2019. When distributed, certain earnings may be subject to a maximum tax rate of 15% as provided for by the Jobs and Growth Tax Relief Reconciliation Act of 2003. The Fund designated up to a maximum of approximately $176,000 as taxable at this lower rate.
In January, the Fund provides tax information to shareholders for the preceding calendar year.
30
Privacy Notice (unaudited) April 2019
FACTS | | WHAT DOES MSIM DO WITH YOUR PERSONAL INFORMATION? | |
Why? | | Financial companies choose how they share your personal information. Federal law gives consumers the right to limit some but not all sharing. Federal law also requires us to tell you how we collect, share, and protect your personal information. Please read this notice carefully to understand what we do. | |
What? | | The types of personal information we collect and share depend on the product or service you have with us. This information can include:
n Social Security number and income
n investment experience and risk tolerance
n checking account number and wire transfer instructions | |
How? | | All financial companies need to share customers' personal information to run their everyday business. In the section below, we list the reasons financial companies can share their customers' personal information; the reasons MSIM chooses to share; and whether you can limit this sharing. | |
Reasons we can share your personal information | | Does MSIM share? | | Can you limit this sharing? | |
For our everyday business purposes —
such as to process your transactions, maintain your account(s), respond to court orders and legal investigations, or report to credit bureaus | | Yes | | No | |
For our marketing purposes —
to offer our products and services to you | | Yes | | No | |
For joint marketing with other financial companies | | No | | We don't share | |
For our affiliates' everyday business purposes —
information about your transactions and experiences | | Yes | | No | |
For our affiliates' everyday business purposes —
information about your creditworthiness | | No | | We don't share | |
For our affiliates to market to you | | No | | We don't share | |
For non-affiliates to market to you | | No | | We don't share | |
Questions? Call toll-free (844) 312-6327 or email: imprivacyinquiries@morganstanley.com
31
Privacy Notice (unaudited) (cont'd) April 2019
Who we are
Who is providing this notice? | | Morgan Stanley Investment Management, Inc. and its affiliated registered investment advisers, registered broker-dealers, and registered and unregistered funds ("MSIM") | |
What we do
How does MSIM protect my personal information? | | To protect your personal information from unauthorized access and use, we use security measures that comply with federal law. These measures include computer safeguards and secured files and buildings. We have policies governing the proper handling of customer information by personnel and requiring third parties that provide support to adhere to appropriate security standards with respect to such information. | |
How does MSIM collect my personal information? | | We collect your personal information, for example, when you
n open an account or make deposits or withdrawals from your account
n buy securities from us or make a wire transfer
n give us your contact information
We also collect your personal information from others, such as credit bureaus, affiliates, or other companies. | |
Why can't I limit all sharing? | | Federal law gives you the right to limit only
n sharing for affiliates' everyday business purposes — information about your creditworthiness
n affiliates from using your information to market to you
n sharing for non-affiliates to market to you
State laws and individual companies may give you additional rights to limit sharing. See below for more on your rights under state law. | |
Definitions
Affiliates | | Companies related by common ownership or control. They can be financial and non-financial companies.
n Our affiliates include companies with a Morgan Stanley name and financial companies such as Morgan Stanley Smith Barney LLC and Morgan Stanley & Co. | |
Non-affiliates | | Companies not related by common ownership or control. They can be financial and non-financial companies.
n MSIM does not share with non-affiliates so they can market to you. | |
Joint marketing | | A formal agreement between non-affiliated financial companies that together market financial products or services to you.
n MSIM doesn't jointly market | |
Other Important Information
Vermont: Except as permitted by law, we will not share personal information we collect about Vermont residents with Non-affiliates unless you provide us with your written consent to share such information.
California: Except as permitted by law, we will not share personal information we collect about California residents with Non-affiliates and we will limit sharing such personal information with our Affiliates to comply with California privacy laws that apply to us.
32
Morgan Stanley Institutional Fund, Inc.
Annual Report — December 31, 2019
Director and Officer Information (unaudited)
Independent Directors:
Name, Birth Year
and Address of
Independent Director | | Position(s)
Held with
Registrant | | Length of
Time Served* | | Principal Occupation(s) During Past 5 Years
and Other Relevant Professional Experience | | Number of
Funds in
Fund Complex
Overseen by
Independent
Director** | | Other Directorships
Held by Independent
Director*** | |
Frank L. Bowman
c/o Perkins Coie LLP
Counsel to the Independent Directors
1155 Avenue of the Americas
New York, NY 10036
Birth Year 1944 | | Director | | Since
August
2006 | | President, Strategic Decisions, LLC (consulting) (since February 2009); Director or Trustee of various Morgan Stanley Funds (since August 2006); Chairperson of the Compliance and Insurance Committee (since October 2015); formerly, Chairperson of the Insurance Sub-Committee of the Compliance and Insurance Committee (2007-2015); served as President and Chief Executive Officer of the Nuclear Energy Institute (policy organization) (February 2005-November 2008); retired as Admiral, U.S. Navy after serving over 38 years on active duty including 8 years as Director of the Naval Nuclear Propulsion Program in the Department of the Navy and the U.S. Department of Energy (1996-2004); served as Chief of Naval Personnel (July 1994-September 1996) and on the Joint Staff as Director of Political Military Affairs (June 1992-July 1994); knighted as Honorary Knight Commander of the Most Excellent Order of the British Empire; awarded the Officier de l'Orde National du Mérite by the French Government; elected to the National Academy of Engineering (2009). | | | 86 | | | Director of Naval and Nuclear Technologies LLP; Director Emeritus of the Armed Services YMCA; Member of the National Security Advisory Council of the Center for U.S. Global Engagement and a member of the CNA Military Advisory Board; Trustee of Fairhaven United Methodist Church; Member of the Board of Advisors of the Dolphin Scholarship Foundation; Director of other various non-profit organizations; formerly, Director of BP p.l.c. (November 2010-May 2019). | |
Kathleen A. Dennis
c/o Perkins Coie LLP
Counsel to the Independent Directors
1155 Avenue of the Americas
New York, NY 10036
Birth Year 1953 | | Director | | Since
August
2006 | | President, Cedarwood Associates (mutual fund and investment management consulting) (since July 2006); Chairperson of the Liquidity and Alternatives Sub-Committee of the Investment Committee (since October 2006) and Director or Trustee of various Morgan Stanley Funds (since August 2006); formerly, Senior Managing Director of Victory Capital Management (1993-2006). | | | 86 | | | Director of various non-profit organizations. | |
Nancy C. Everett
c/o Perkins Coie LLP
Counsel to the Independent Directors
1155 Avenue of the Americas
New York, NY 10036
Birth Year 1955 | | Director | | Since
January
2015 | | Chief Executive Officer, Virginia Commonwealth University Investment Company (since November 2015); Owner, OBIR, LLC (institutional investment management consulting) (since June 2014); formerly, Managing Director, BlackRock, Inc. (February 2011-December 2013); and Chief Executive Officer, General Motors Asset Management (a/k/a Promark Global Advisors, Inc.) (June 2005-May 2010). | | | 87 | | | Formerly, Member of Virginia Commonwealth University School of Business Foundation (2005-2016); Member of Virginia Commonwealth University Board of Visitors (2013-2015); Member of Committee on Directors for Emerging Markets Growth Fund, Inc. (2007-2010); Chairperson of Performance Equity Management, LLC (2006-2010); and Chairperson, GMAM Absolute Return Strategies Fund, LLC (2006-2010). | |
33
Morgan Stanley Institutional Fund, Inc.
Annual Report — December 31, 2019
Director and Officer Information (unaudited) (cont'd)
Independent Directors: (cont'd)
Name, Birth Year
and Address of
Independent Director | | Position(s)
Held with
Registrant | | Length of
Time Served* | | Principal Occupation(s) During Past 5 Years
and Other Relevant Professional Experience | | Number of
Funds in
Fund Complex
Overseen by
Independent
Director** | | Other Directorships
Held by Independent
Director*** | |
Jakki L. Haussler
c/o Perkins Coie LLP
Counsel to the Independent Directors
1155 Avenue of the Americas
New York, NY 10036
Birth Year 1957 | | Director | | Since
January
2015 | | Chairman, Opus Capital Group (since 1996); formerly, Chief Executive Officer, Opus Capital Group (1996-2019); Director, Capvest Venture Fund, LP (May 2000-December 2011); Partner, Adena Ventures, LP (July 1999-December 2010); Director, The Victory Funds (February 2005-July 2008). | | | 87 | | | Director of Service Corporation International and Member, Audit Committee and Investment Committee; Director of Cincinnati Bell Inc. and Member, Audit Committee and Governance and Nominating Committee; Chairman of Northern Kentucky University Member Investment Committee; Member of Chase College of Law Transactional Law Practice Center Board of Advisors; Director of Best Transport; Director of Chase College of Law Board of Visitors; formerly, Member, University of Cincinnati Foundation Investment Committee; Member, Miami University Board of Visitors (2008-2011); Trustee of Victory Funds (2005-2008) and Chairman, Investment Committee (2007-2008) and Member, Service Provider Committee (2005-2008). | |
Dr. Manuel H. Johnson
c/o Johnson Smick International, Inc.
220 I Street, NE — Suite 200
Washington, D.C. 20002
Birth Year 1949 | | Director | | Since
July
1991 | | Senior Partner, Johnson Smick International, Inc. (consulting firm); Chairperson of the Investment Committee (since October 2006) and Director or Trustee of various Morgan Stanley Funds (since July 1991); Co-Chairman and a founder of the Group of Seven Council (G7C) (international economic commission); formerly, Chairperson of the Audit Committee (July 1991-September 2006), Vice Chairman of the Board of Governors of the Federal Reserve System and Assistant Secretary of the U.S. Treasury. | | | 86 | | | Director of NVR, Inc. (home construction). | |
Joseph J. Kearns
c/o Perkins Coie LLP
Counsel to the Independent Directors
1155 Avenue of the Americas
New York, NY 10036
Birth Year 1942 | | Director | | Since
August
1994 | | Senior Adviser, Kearns & Associates LLC (investment consulting); Chairperson of the Audit Committee (since October 2006) and Director or Trustee of various Morgan Stanley Funds (since August 1994); formerly, Deputy Chairperson of the Audit Committee (July 2003-September 2006) and Chairperson of the Audit Committee of various Morgan Stanley Funds (since August 1994); CFO of the
J. Paul Getty Trust. | | | 87 | | | Prior to August 10, 2016, Director of Electro Rent Corporation (equipment leasing); Prior to December 31, 2013, Director of The Ford Family Foundation. | |
34
Morgan Stanley Institutional Fund, Inc.
Annual Report — December 31, 2019
Director and Officer Information (unaudited) (cont'd)
Independent Directors: (cont'd)
Name, Birth Year
and Address of
Independent Director | | Position(s)
Held with
Registrant | | Length of
Time Served* | | Principal Occupation(s) During Past 5 Years
and Other Relevant Professional Experience | | Number of
Funds in
Fund Complex
Overseen by
Independent
Director** | | Other Directorships
Held by Independent
Director*** | |
Michael F. Klein
c/o Perkins Coie LLP
Counsel to the Independent Directors
1155 Avenue of the Americas
New York, NY 10036
Birth Year 1958 | | Director | | Since
August
2006 | | Managing Director, Aetos Alternatives Management, LP (since March 2000); Co-President, Aetos Alternatives Management, LP (since January 2004) and Co-Chief Executive Officer of Aetos Alternatives Management, LP (since August 2013); Chairperson of the Fixed Income Sub-Committee of the Investment Committee (since October 2006) and Director or Trustee of various Morgan Stanley Funds (since August 2006); formerly, Managing Director, Morgan Stanley & Co. Inc. and Morgan Stanley Dean Witter Investment Management and President, various Morgan Stanley Funds (June 1998-March 2000); Principal, Morgan Stanley & Co. Inc. and Morgan Stanley Dean Witter Investment Management (August 1997-December 1999). | | | 86 | | | Director of certain investment funds managed or sponsored by Aetos Alternatives Management, LP; Director of Sanitized AG and Sanitized Marketing AG (specialty chemicals). | |
Patricia Maleski
c/o Perkins Coie LLP
Counsel to the Independent Directors
1155 Avenue of the Americas
New York, NY 10036
Birth Year 1960 | | Director | | Since
January
2017 | | Managing Director, JPMorgan Asset Management (2004-2016); Oversight and Control Head of Fiduciary and Conflicts of Interest Program (2015-2016); Chief Control Officer-Global Asset Management (2013-2015); President, JPMorgan Funds (2010-2013); Chief Administrative Officer (2004-2013); various other positions including Treasurer and Board Liaison (since 2001). | | | 87 | | | None. | |
Michael E. Nugent
522 Fifth Avenue
New York, NY 10036
Birth Year 1936 | | Chair of the Board and Director | | Chair of the Boards since July 2006 and Director since July 1991 | | Chair of the Boards of various Morgan Stanley Funds (since July 2006); Chairperson of the Governance Committee (since January 2019) and Director or Trustee of various Morgan Stanley Funds (since July 1991); formerly, Chairperson of each of the Closed-End Fund committee (until December 2019) and the Insurance Committee (until July 2006); General Partner, Triumph Capital, L.P. (private investment partnership) (1988-2013). | | | 86 | | | None. | |
W. Allen Reed
c/o Perkins Coie LLP
Counsel to the Independent Directors
1155 Avenue of the Americas
New York, NY 10036
Birth Year 1947 | | Vice Chair of the Board and Director | | Vice Chair of the Boards since January 2020 and Director since August 2006 | | Chairperson of the Equity Sub-Committee of the Investment Committee (since October 2006) and Director or Trustee of various Morgan Stanley Funds (since August 2006); formerly, President and CEO of General Motors Asset Management; Chairman and Chief Executive Officer of the GM Trust Bank and Corporate Vice President of General Motors Corporation (August 1994-December 2005). | | | 86 | | | Formerly, Director of Legg Mason, Inc.; formerly, Director of the Auburn University Foundation (2010-2015). | |
* This is the earliest date the Director began serving the Morgan Stanley Funds. Each Director serves an indefinite term, until his or her successor is elected.
** The Fund Complex includes (as of December 31, 2019) all open-end and closed-end funds (including all of their portfolios) advised by Morgan Stanley Investment Management Inc. (the "Adviser") and any funds that have an adviser that is an affiliated person of the Adviser (including, but not limited to, Morgan Stanley AIP GP LP).
*** This includes any directorships at public companies and registered investment companies held by the Director at any time during the past five years.
35
Morgan Stanley Institutional Fund, Inc.
Annual Report — December 31, 2019
Director and Officer Information (unaudited) (cont'd)
Executive Officers:
Name, Birth Year and Address of
Executive Officer | | Position(s) Held
with
Registrant | | Length of
Time Served* | | Principal Occupation(s) During Past 5 Years | |
John H. Gernon
522 Fifth Avenue
New York, NY 10036
Birth Year 1963 | | President and Principal Executive Officer | | Since September 2013 | | President and Principal Executive Officer of the Equity and Fixed Income Funds and the Morgan Stanley AIP Funds (since September 2013) and the Liquidity Funds and various money market funds (since May 2014) in the Fund Complex; Managing Director of the Adviser; Head of Product (since 2006). | |
Timothy J. Knierim
522 Fifth Avenue
New York, NY 10036
Birth Year 1959 | | Chief Compliance Officer | | Since December 2016 | | Managing Director of the Adviser and various entities affiliated with the Adviser; Chief Compliance Officer of various Morgan Stanley Funds and the Adviser (since December 2016) and Chief Compliance Officer of Morgan Stanley AIP GP LP (since 2014). Formerly, Managing Director and Deputy Chief Compliance Officer of the Adviser (2014-2016); and formerly, Chief Compliance Officer of Prudential Investment Management, Inc. (2007-2014). | |
Francis J. Smith
522 Fifth Avenue
New York, NY 10036
Birth Year 1965 | | Treasurer and Principal Financial Officer | | Treasurer since July 2003 and Principal Financial Officer since September 2002 | | Managing Director of the Adviser and various entities affiliated with the Adviser; Treasurer (since July 2003) and Principal Financial Officer of various Morgan Stanley Funds (since September 2002). | |
Mary E. Mullin
522 Fifth Avenue
New York, NY 10036
Birth Year 1967 | | Secretary | | Since June 1999 | | Managing Director of the Adviser; Secretary of various Morgan Stanley Funds (since June 1999). | |
Michael J. Key
522 Fifth Avenue
New York, NY 10036
Birth Year 1979 | | Vice President | | Since June 2017 | | Vice President of the Equity and Fixed Income Funds, Liquidity Funds, various money market funds and the Morgan Stanley AIP Funds in the Fund Complex (since June 2017); Executive Director of the Adviser; Head of Product Development for Equity and Fixed Income Funds (since August 2013). | |
* This is the earliest date the officer began serving the Morgan Stanley Funds. Each officer serves a one-year term, until his or her successor is elected and qualifies.
36
Morgan Stanley Institutional Fund, Inc.
Annual Report — December 31, 2019
Adviser and Administrator
Morgan Stanley Investment Management Inc.
522 Fifth Avenue
New York, New York 10036
Distributor
Morgan Stanley Distribution, Inc.
522 Fifth Avenue
New York, New York 10036
Dividend Disbursing and Transfer Agent
DST Asset Manager Solutions, Inc.
2000 Crown Colony Drive
Quincy, Massachusetts 02169
Custodian
State Street Bank and Trust Company
One Lincoln Street
Boston, Massachusetts 02111
Legal Counsel
Dechert LLP
1095 Avenue of the Americas
New York, New York 10036
Counsel to the Independent Directors
Perkins Coie LLP
1155 Avenue of the Americas
New York, New York 10036
Independent Registered Public Accounting Firm
Ernst & Young LLP
200 Clarendon Street
Boston, Massachusetts 02116
Reporting to Shareholders
Each Morgan Stanley fund provides a complete schedule of portfolio holdings in its Semi-Annual and the Annual Reports within 60 days of the end of the fund's second and fourth fiscal quarters. The Semi-Annual and Annual Reports are filed electronically with the Securities and Exchange Commission ("SEC") on Form N-CSRS and Form N-CSR, respectively. Morgan Stanley also delivers the Semi-Annual and Annual Reports to fund shareholders and makes these reports available on its public website, www.morganstanley.com/im/shareholderreports. Each Morgan Stanley non-money market fund also files a complete schedule of portfolio holdings with the SEC for the fund's first and third fiscal quarters as an attachment to Form N-PORT. Morgan Stanley does not deliver the reports for the first and third fiscal quarters to shareholders, nor are the reports posted to the Morgan Stanley public website. However, the holdings for each money market fund are posted to the Morgan Stanley public website. You may obtain the Form N-PORT filings (as well as the Form N-CSR and N-CSRS filings) by accessing the SEC's website, www.sec.gov. You can also request copies of these materials, upon payment of a duplicating fee, by electronic request at the SEC's email address (publicinfo@sec.gov).
Proxy Voting Policies and Procedures and Proxy Voting Record
You may obtain a copy of the Company's Proxy Voting Policy and Procedures and information regarding how the Company voted proxies relating to portfolio securities during the most recent twelve-month period ended June 30, without charge, upon request, by calling toll free 1 (800) 548-7786 or by visiting our website at www.morganstanley.com/im/shareholderreports. This information is also available on the SEC's website at www.sec.gov.
This report is authorized for distribution only when preceded or accompanied by a prospectus or summary prospectus of the applicable fund of Morgan Stanley Institutional Fund, Inc., which describes in detail the fund's investment policies, risks, fees and expenses. Please read the prospectus carefully before you invest or send money. For additional information, including information regarding the investments comprising the Fund, please visit our website at www.morganstanley.com/im/shareholderreports or call toll free 1 (800) 548-7786.
37
Printed in U.S.A.
This Report has been prepared for shareholders and may be distributed to others only if preceded or accompanied by a current prospectus.
Morgan Stanley Investment Management Inc.
522 Fifth Avenue
New York, New York 10036
© 2020 Morgan Stanley. Morgan Stanley Distribution, Inc.

IFISCGANN
2920368 EXP. 02.28.21

Morgan Stanley Institutional Fund, Inc.
U.S. Real Estate Portfolio
Annual Report
December 31, 2019
Beginning on January 1, 2021, as permitted by regulations adopted by the Securities and Exchange Commission ("SEC"), paper copies of the Fund's Annual and Semi-Annual Reports to Shareholders ("Shareholder Reports") will no longer be sent by mail, unless you specifically request paper copies of the Shareholder Reports from the Fund or from your financial intermediary, such as a broker-dealer or a bank. Instead, the Shareholder Reports will be made available on the Fund's website, https://www.morganstanley.com/im/shareholderreports and you will be notified by mail each time a Shareholder Report is posted and provided with a website link to access the Shareholder Report. If you already elected to receive Shareholder Reports electronically, you will not be affected by this change and you need not take any action. You may elect to receive Shareholder Reports and other communications from the Fund electronically anytime by contacting your financial intermediary or, if you are a direct investor, please follow the instructions on the envelope.
Beginning on January 1, 2019, you may elect to receive all future Shareholder Reports in paper free of charge. If you invest through a financial intermediary, you can contact your financial intermediary to request that you continue to receive paper copies of your Shareholder Reports. If you invest directly with the Fund, please follow the instructions on the envelope to let the Fund know you wish to continue receiving paper copies of your Shareholder Reports. Your election to receive Shareholder Reports in paper will apply to all funds held in your account if you invest through your financial intermediary or all funds held with the fund complex if you invest directly with a fund.

Morgan Stanley Institutional Fund, Inc.
Annual Report — December 31, 2019
Shareholders' Letter | | | 2 | | |
Expense Example | | | 3 | | |
Investment Overview | | | 4 | | |
Portfolio of Investments | | | 8 | | |
Statement of Assets and Liabilities | | | 10 | | |
Statement of Operations | | | 12 | | |
Statements of Changes in Net Assets | | | 13 | | |
Financial Highlights | | | 15 | | |
Notes to Financial Statements | | | 21 | | |
Report of Independent Registered Public Accounting Firm | | | 28 | | |
Federal Tax Notice | | | 29 | | |
Privacy Notice | | | 30 | | |
Director and Officer Information | | | 32 | | |
This report is authorized for distribution only when preceded or accompanied by a prospectus or summary prospectus of the applicable Fund of Morgan Stanley Institutional Fund, Inc. To receive a prospectus and/or statement of additional information ("SAI"), which contains more complete information such as investment objectives, charges, expenses, policies for voting proxies, risk considerations and describes in detail each of the Fund's investment policies to the prospective investor, please call toll free 1 (800) 548-7786. Please read the prospectuses carefully before you invest or send money.
Additionally, you can access information about the Fund, including performance, characteristics and investment team commentary, through Morgan Stanley Investment Management's website: www.morganstanley.com/im/shareholderreports.
Market forecasts provided in this report may not necessarily come to pass. There is no guarantee that any sectors mentioned will continue to perform as discussed herein or that securities in such sectors will be held by the Fund in the future. There is no assurance that a fund will achieve its investment objective. Funds are subject to market risk, which is the possibility that market values of securities owned by the Fund will decline and, therefore, the value of the Fund's shares may be less than what you paid for them. Accordingly, you can lose money investing in this Fund. Please see the prospectus for more complete information on investment risks.
1
Morgan Stanley Institutional Fund, Inc.
Annual Report — December 31, 2019
Shareholders' Letter (unaudited)
Dear Shareholders,
We are pleased to provide this Annual Report, in which you will learn how your investment in U.S. Real Estate Portfolio (the "Fund") performed during the latest twelve-month period.
Morgan Stanley Investment Management is a client-centric, investor-led organization. Our global presence, intellectual capital, and breadth of products and services enable us to partner with investors to meet the evolving challenges of today's financial markets. We aim to deliver superior investment service and to empower our clients to make the informed decisions that help them reach their investment goals.
As always, we thank you for selecting Morgan Stanley Investment Management, and look forward to working with you in the months and years ahead.
Sincerely,

John H. Gernon
President and Principal Executive Officer
January 2020
2
Morgan Stanley Institutional Fund, Inc.
Annual Report — December 31, 2019
Expense Example (unaudited)
U.S. Real Estate Portfolio
As a shareholder of the Fund, you incur two types of costs: (1) transactional costs; and (2) ongoing costs, which may include advisory fees, administration fees, distribution and shareholder services fees and other Fund expenses. This example is intended to help you understand your ongoing costs (in dollars) of investing in the Fund and to compare these costs with the ongoing costs of investing in other mutual funds.
This example is based on an investment of $1,000 invested at the beginning of the six-month period ended December 31, 2019 and held for the entire six-month period.
Actual Expenses
The table below provides information about actual account values and actual expenses. You may use the information in this table, together with the amount you invested, to estimate the expenses that you paid over the period. Simply divide your account value by $1,000 (for example, an $8,600 account value divided by $1,000 = 8.6), then multiply the result by the number in the table under the heading entitled "Actual Expenses Paid During Period" to estimate the expenses you paid on your account during this period.
Hypothetical Example for Comparison Purposes
The table below provides information about hypothetical account values and hypothetical expenses based on the Fund's actual expense ratio and an assumed rate of return of 5% per year before expenses, which is not the Fund's actual return. The hypothetical account values and expenses may not be used to estimate the actual ending account balance or expenses you paid for the period. You may use this information to compare the ongoing costs of investing in the Fund and other funds. To do so, compare this 5% hypothetical example with the 5% hypothetical examples that appear in the shareholder reports of the other funds.
Please note that the expenses shown in the table are meant to highlight your ongoing costs only and do not reflect any transactional costs, such as sales charges (loads). Therefore, the information for each class in the table is useful in comparing ongoing costs only, and will not help you determine the relative total costs of owning different funds. In addition, if these transactional costs were included, your costs would have been higher.
| | | Beginning
Account
Value
7/1/19 | | Actual Ending
Account
Value
12/31/19 | | Hypothetical
Ending Account
Value | | Actual
Expenses
Paid
During
Period* | | Hypothetical
Expenses Paid
During Period* | | Net
Expense
Ratio
During
Period** | |
U.S. Real Estate Portfolio Class I | | $ | 1,000.00 | | | $ | 1,052.70 | | | $ | 1,020.67 | | | $ | 4.66 | | | $ | 4.58 | | | | 0.90 | % | |
U.S. Real Estate Portfolio Class A | | | 1,000.00 | | | | 1,051.60 | | | | 1,019.06 | | | | 6.31 | | | | 6.21 | | | | 1.22 | | |
U.S. Real Estate Portfolio Class L | | | 1,000.00 | | | | 1,048.40 | | | | 1,016.38 | | | | 9.04 | | | | 8.89 | | | | 1.75 | | |
U.S. Real Estate Portfolio Class C | | | 1,000.00 | | | | 1,046.10 | | | | 1,015.12 | | | | 10.31 | | | | 10.16 | | | | 2.00 | | |
U.S. Real Estate Portfolio Class IS | | | 1,000.00 | | | | 1,052.40 | | | | 1,021.02 | | | | 4.29 | | | | 4.23 | | | | 0.83 | | |
U.S. Real Estate Portfolio Class IR | | | 1,000.00 | | | | 1,053.30 | | | | 1,021.02 | | | | 4.30 | | | | 4.23 | | | | 0.83 | | |
* Expenses are calculated using each Fund Class' annualized net expense ratio (as disclosed), multiplied by the average account value over the period and multiplied by 184/365 (to reflect the most recent one-half year period).
** Annualized.
3
Morgan Stanley Institutional Fund, Inc.
Annual Report — December 31, 2019
Investment Overview (unaudited)
U.S. Real Estate Portfolio
The Fund seeks to provide above average current income and long-term capital appreciation by investing primarily in equity securities of companies in the U.S. real estate industry, including real estate investment trusts ("REITs").
Performance
For the fiscal year ended December 31, 2019, the Fund's Class I shares had a total return based on net asset value and reinvestment of distributions per share of 18.40%, net of fees. The Fund's Class I shares underperformed the Fund's benchmark, the FTSE Nareit Equity REITs Index (the "Index"), which returned 26.00%, and underperformed the S&P 500® Index, which returned 31.49%.
Factors Affecting Performance
• Overall returns in the REIT market have been strong for full year 2019, but there was a wide disparity in share price performance; sectors viewed as defensive generally outperformed as the lower-for-longer investment theme strengthened and segments of the equity market appeared to be pricing in an economic slowdown/recession scenario. Bond yields continued to decline, achieving all-time lows in late August 2019. Given this combination of thematic investing and all-time low bond yields, we have witnessed a continued willingness among investors to pay premium valuations for segments of the market that are viewed as having greater predictability in cash flows. We suspect that underlying private market property valuation has become a less relevant metric as generalist investors and passive funds have become the marginal buyer of real estate securities. Generalist investors appear to place a greater focus on secular themes and are untethered to private market valuations.
• With share prices generally appearing untethered to private real estate values, there are sectors trading at relative valuations previously witnessed during the 2008-09 global financial crisis and some sectors trading in excess of 50% premiums to net asset values (NAVs). There has been a continued willingness to pay premium valuations for segments of the REIT market that are viewed as having greater predictability in cash flows (e.g., net lease and health care REITs) or benefiting from a secular investment theme (e.g., industrial and data centers). In addition, the concerns with regard to economic
growth have generally placed downward pressure on segments that are viewed as more vulnerable — office, retail and hotels. Many of these stocks are trading at large discounts to NAVs, despite significant transactional evidence in the private markets in the office and hotel sectors. This has resulted in a further widening of the disparity in share price valuations among market segments. The Fund continues to be underweight to segments that have benefited from this theme due to premium share price valuations, and overweight to market segments which trade at very attractive discounted valuations.
• There was significant disparity in returns among the REIT sectors in 2019 as investors rotated away from defensive and momentum sectors and into value sectors. In the fourth quarter of 2019, there was a reversal as the sectors that outperformed and showed favorable returns in the quarter had been the year-to-date laggards, and the sectors that underperformed and experienced share price declines has been the year-to-date winners.
• Among the major sectors, the office sector outperformed, the apartment sector performed in line with, and retail sector underperformed the Index. The office sector outperformed as both the primary central business district (CBD) and secondary CBD/suburban REITs outperformed the Index. Notably, the NYC office stocks remained a significant laggard for the full year, with gains of only 15.3% despite posting the strongest performance in the fourth quarter of 2019. The apartment sector performed in line with the Index. The retail sector underperformed as malls declined nearly 10% for the full year, while shopping centers performed in line with the Index. Among the smaller sectors, the industrial and net lease sectors outperformed, while the health care, storage, data centers and hotel REITs underperformed the Index.
• The top contributor to performance was the underweight to the health care sector. This sector had been a key beneficiary of the momentum trade, but it underperformed significantly in the fourth quarter of 2019 on a reversal of momentum and on company-specific issues/disappointments that revealed the sector may not be as defensive as perceived.
4
Morgan Stanley Institutional Fund, Inc.
Annual Report — December 31, 2019
Investment Overview (unaudited) (cont'd)
U.S. Real Estate Portfolio
• The key detractors from performance were the overweight to and stock selection within the mall sector, stock selection in the primary CBD office sector, and underweights to net lease, industrial and data center sectors.
o Malls — the Fund remained overweight to selected owners of Class A malls, as tenant sales in the "A mall" portfolios continue to experience growth despite retailer challenges, but the sector underperformed in the period as sentiment towards retail remained negative.
o Primary CBD office — despite transactional evidence continuing to demonstrate strength in asset values, there continues to be significant negative investor sentiment to CBD office, specifically NYC office, which traded at a 25% discount to NAVs at the end of December 2019.
o Net lease sector — the sector traded at one of the most significant premiums to NAV, but the companies experienced share price gains on investor preference for stocks viewed as more defensive, given that net lease companies generally feature more bond-like cash flows.
o Industrial and data center assets — both sectors outperformed as they continued to benefit from a secular investment theme despite trading at significant premiums to NAVs at the end of December 2019.
Management Strategies
• We believe listed real estate security returns should mirror private real estate performance. This strategy may result in periods of underperformance, particularly when the market is driven more by thematic/momentum investing and macro factors, as opposed to fundamentals and intrinsic value. The current prolonged period in which underlying private market valuation is not a relevant determinant of share prices has been surprising. The private market is more than six times larger than the public markets and has, up until this period, always served as a key determinant of share prices and our key metric. It is logical to us that persistent discounts cannot exist when there is so much capital on the sidelines needing to invest, and we believe we will be rewarded as these stocks provide
favorable risk-adjusted return opportunities based on our analysis.
• We would note the lack of focus on valuations/fundamentals has been, in our opinion, prolonged due to the following factors:
o Institutional investors have demonstrated a significant preference for private real estate (as opposed to public real estate); as a result, generalist and passive investors have become the marginal buyers.
o Generalist investors tend to focus less on valuations and more on traditional stock market metrics (such as earnings growth and dividend yields) and secular themes.
o Growth of passive investing in the REIT space has contributed to exacerbating the dislocation due to a lack of focus on differentiating among stocks based on fundamentals, and instead adding to overvalued stocks that have grown in market capitalization and reducing exposure to undervalued stocks that have decreased in size.
• Untethered to private real estate valuations, earnings multiples have expanded to record levels in sectors viewed as more defensive or benefiting from favorable secular themes. This has resulted in a willingness to ignore the distinction in multiples used to value assets in the private real estate sector and therefore indifference about the quality of the real estate cash flow when buying stocks based on fund from operations (FFO) multiples, as shown by net lease and health care REITs trading at higher multiples than NYC office REITs.
• Our outlook for the REIT market is based on two key factors: private market pricing for underlying real estate assets and public market pricing for the securities. Private market asset values for high quality assets have generally been flattish since 2016, and appear well supported by a record level of capital committed to invest in real estate. The overall REIT market ended the period trading at an approximate 11% premium to NAVs, although there is an enormous disparity in relative valuations among the REIT sectors, with various segments trading at meaningful discounts. Generally, we see share prices untethered to private real estate values. We see the most attractive value in the owners of
5
Morgan Stanley Institutional Fund, Inc.
Annual Report — December 31, 2019
Investment Overview (unaudited) (cont'd)
U.S. Real Estate Portfolio
NYC office assets. We also see attractive value in select owners of high quality retail, CBD office and hotel assets. These companies provide exposure to high quality core assets at significant discounted valuations.
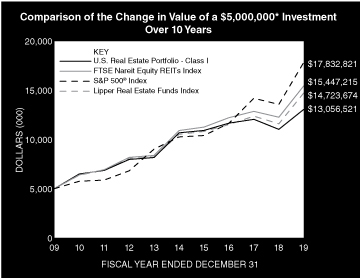
* Minimum Investment for Class I shares
In accordance with SEC regulations, the Fund's performance shown assumes that all recurring fees (including management fees) were deducted and all dividends and distributions were reinvested. The performance of Class A, L, C, IS and IR shares will vary from the performance of Class I shares based upon their different inception dates and will be negatively impacted by additional fees assessed to those classes (if applicable).
6
Morgan Stanley Institutional Fund, Inc.
Annual Report — December 31, 2019
Investment Overview (unaudited) (cont'd)
U.S. Real Estate Portfolio
Performance Compared to the FTSE Nareit Equity REITs Index(1), the S&P 500® Index(2), and the Lipper Real Estate Funds Index(3)
| | | Period Ended December 31, 2019
Total Returns(4) | |
| | | | | Average Annual | |
| | | One
Year | | Five
Years | | Ten
Years | | Since
Inception(11) | |
Fund — Class I Shares
w/o sales charges(5) | | | 18.40 | % | | | 4.11 | % | | | 10.07 | % | | | 11.29 | % | |
Fund — Class A Shares
w/o sales charges(6) | | | 18.02 | | | | 3.80 | | | | 9.75 | | | | 10.48 | | |
Fund — Class A Shares with
maximum 5.25% sales charges(6) | | | 11.78 | | | | 2.69 | | | | 9.16 | | | | 10.23 | | |
Fund — Class L Shares
w/o sales charges(7) | | | 17.43 | | | | 3.25 | | | | — | | | | 7.53 | | |
Fund — Class C Shares
w/o sales charges(9) | | | 17.07 | | | | — | | | | — | | | | 3.52 | | |
Fund — Class C Shares with
maximum 1.00% deferred
sales charges(9) | | | 16.07 | | | | — | | | | — | | | | 3.52 | | |
Fund — Class IS Shares
w/o sales charges(8) | | | 18.48 | | | | 4.19 | | | | — | | | | 7.87 | | |
Fund — Class IR Shares
w/o sales charges(10) | | | 18.48 | | | | — | | | | — | | | | 7.42 | | |
FTSE Nareit Equity REITs Index | | | 26.00 | | | | 7.21 | | | | 11.94 | | | | 10.69 | | |
S&P 500® Index | | | 31.49 | | | | 11.70 | | | | 13.56 | | | | 9.99 | | |
Lipper Real Estate Funds Index | | | 27.04 | | | | 6.96 | | | | 11.40 | | | | N/A | | |
Performance data quoted represents past performance, which is no guarantee of future results, and current performance may be lower or higher than the figures shown. Performance assumes that all dividends and distributions, if any, were reinvested. For the most recent month-end performance figures, please visit www.morganstanley.com/im/shareholderreports. Investment return and principal value will fluctuate so that Fund shares, when redeemed, may be worth more or less than their original cost. Total returns do not reflect the deduction of taxes that a shareholder would pay on Fund distributions or the redemption of Fund shares. Performance of share classes will vary due to difference in sales charges and expenses.
(1) The FTSE Nareit (National Association of Real Estate Investment Trusts) Equity REITs Index is free float-adjusted market capitalization weighted index of tax-qualified REITs listed on the New York Stock Exchange, NYSE Amex and the NASDAQ National Market Systems. Effective December 20, 2010, the FTSE Nareit Equity REITs Index will not include "Timber REITs" The Index is unmanaged and its returns do not include any sales charges or fees. Such costs would lower performance. It is not possible to invest directly in an index.
(2) The Standard & Poor's 500® Index (S&P 500® Index) measures the performance of the large cap segment of the U.S. equities market, covering approximately 80% of the U.S. equities market. The Index includes 500 leading companies in leading industries of the U.S. economy. The Index is unmanaged and its returns do not include any sales charges or fees. Such costs would lower performance. It is not possible to invest directly in an index.
(3) The Lipper Real Estate Funds Index is an equally weighted performance index of the largest qualifying funds (based on net assets) in the Lipper Real Estate Funds classification. The Index, which is adjusted for capital gains distributions and income dividends, is unmanaged and should not be considered an investment. There are currently 30 funds represented in this Index. As of the date of this report, the Fund was in the Lipper Real Estate Funds classification.
(4) Total returns for the Fund reflect fees waived and expenses reimbursed, if applicable, by the Adviser (as defined herein). Without such waivers and reimbursements, total returns would have been lower.
(5) Commenced operations on February 24, 1995.
(6) Commenced offering on January 2, 1996.
(7) Commenced offering on November 11, 2011.
(8) Commenced offering on September 13, 2013.
(9) Commenced offering on April 30, 2015.
(10) Commenced offering on June 15, 2018.
(11) For comparative purposes, average annual since inception returns listed for the Indexes refer to the inception date of Class I of the Fund, not the inception of the Index.
7
Morgan Stanley Institutional Fund, Inc.
Annual Report — December 31, 2019
Portfolio of Investments
U.S. Real Estate Portfolio
| | | Shares | | Value
(000) | |
Common Stocks (99.1%) | |
Apartments (16.6%) | |
American Campus Communities, Inc. REIT | | | 32,250 | | | $ | 1,517 | | |
Apartment Investment & Management Co.,
Class A REIT | | | 29,216 | | | | 1,509 | | |
AvalonBay Communities, Inc. REIT | | | 53,136 | | | | 11,142 | | |
Camden Property Trust REIT | | | 38,261 | | | | 4,059 | | |
Equity Residential REIT | | | 77,851 | | | | 6,300 | | |
Essex Property Trust, Inc. REIT | | | 8,014 | | | | 2,411 | | |
Mid-America Apartment Communities, Inc. REIT | | | 14,045 | | | | 1,852 | | |
UDR, Inc. REIT | | | 31,301 | | | | 1,462 | | |
| | | | 30,252 | | |
Data Centers (2.7%) | |
Digital Realty Trust, Inc. REIT | | | 34,370 | | | | 4,116 | | |
QTS Realty Trust, Inc., Class A REIT | | | 15,818 | | | | 858 | | |
| | | | 4,974 | | |
Diversified (5.1%) | |
JBG SMITH Properties REIT | | | 46,844 | | | | 1,869 | | |
Mack-Cali Realty Corp. REIT | | | 61,919 | | | | 1,432 | | |
Vornado Realty Trust REIT | | | 88,954 | | | | 5,915 | | |
| | | | 9,216 | | |
Health Care (5.8%) | |
Healthcare Realty Trust, Inc. REIT | | | 138,794 | | | | 4,632 | | |
Healthcare Trust of America, Inc., Class A REIT | | | 46,244 | | | | 1,400 | | |
Healthpeak Properties, Inc. REIT | | | 30,837 | | | | 1,063 | | |
Senior Housing Properties Trust REIT | | | 43,170 | | | | 364 | | |
Ventas, Inc. REIT | | | 10,969 | | | | 633 | | |
Welltower, Inc. REIT | | | 31,139 | | | | 2,547 | | |
| | | | 10,639 | | |
Industrial (7.0%) | |
Duke Realty Corp. REIT | | | 15,215 | | | | 527 | | |
Exeter Industrial Value Fund, LP (a)(b)(c) | | | 7,905,000 | | | | 546 | | |
Lexington Realty Trust REIT | | | 60,530 | | | | 643 | | |
Liberty Property Trust REIT | | | 24,155 | | | | 1,451 | | |
ProLogis, Inc. REIT | | | 107,439 | | | | 9,577 | | |
| | | | 12,744 | | |
Lodging/Resorts (9.5%) | |
DiamondRock Hospitality Co. REIT | | | 413,491 | | | | 4,581 | | |
Host Hotels & Resorts, Inc. REIT | | | 498,648 | | | | 9,250 | | |
Sunstone Hotel Investors, Inc. REIT | | | 250,628 | | | | 3,489 | | |
| | | | 17,320 | | |
Office (26.1%) | |
Alexandria Real Estate Equities, Inc. REIT | | | 14,277 | | | | 2,307 | | |
Boston Properties, Inc. REIT | | | 90,029 | | | | 12,412 | | |
Cousins Properties, Inc. REIT | | | 68,440 | | | | 2,820 | | |
Highwoods Properties, Inc. REIT | | | 14,080 | | | | 689 | | |
Hudson Pacific Properties, Inc. REIT | | | 132,064 | | | | 4,972 | | |
Kilroy Realty Corp. REIT | | | 19,097 | | | | 1,602 | | |
Paramount Group, Inc. REIT | | | 214,604 | | | | 2,987 | | |
SL Green Realty Corp. REIT | | | 214,584 | | | | 19,716 | | |
| | | | 47,505 | | |
| | | Shares | | Value
(000) | |
Regional Malls (14.3%) | |
Macerich Co. (The) REIT | | | 250,064 | | | $ | 6,732 | | |
Simon Property Group, Inc. REIT | | | 129,425 | | | | 19,279 | | |
| | | | 26,011 | | |
Self Storage (4.8%) | |
CubeSmart REIT | | | 85,091 | | | | 2,679 | | |
Extra Space Storage, Inc. REIT | | | 16,340 | | | | 1,726 | | |
Life Storage, Inc. REIT | | | 8,049 | | | | 871 | | |
Public Storage REIT | | | 15,909 | | | | 3,388 | | |
| | | | 8,664 | | |
Shopping Centers (3.4%) | |
Regency Centers Corp. REIT | | | 61,646 | | | | 3,889 | | |
Weingarten Realty Investors REIT | | | 76,260 | | | | 2,383 | | |
| | | | 6,272 | | |
Single Family Homes (2.6%) | |
American Homes 4 Rent, Class A REIT | | | 77,656 | | | | 2,035 | | |
Invitation Homes, Inc. REIT | | | 89,523 | | | | 2,683 | | |
| | | | 4,718 | | |
Specialty (1.2%) | |
Gaming and Leisure Properties, Inc. REIT | | | 52,495 | | | | 2,260 | | |
Total Common Stocks (Cost $133,369) | | | 180,575 | | |
Short-Term Investment (0.7%) | |
Investment Company (0.7%) | |
Morgan Stanley Institutional Liquidity
Funds — Treasury Portfolio —
Institutional Class (See Note G)
(Cost $1,251) | | | 1,251,373 | | | | 1,251 | | |
Total Investments (99.8%) (Cost $134,620) (d) | | | 181,826 | | |
Other Assets in Excess of Liabilities (0.2%) | | | 338 | | |
Net Assets (100.0%) | | $ | 182,164 | | |
(a) Non-income producing security.
(b) Restricted security valued at fair value and not registered under the Securities Act of 1933. Exeter Industrial Value Fund, LP was acquired between 11/07 — 4/11 and has a current cost basis of approximately $0. At December 31, 2019, this security had an aggregate market value of approximately $546,000, representing 0.3% of net assets.
(c) At December 31, 2019, the Fund held a fair valued security valued at approximately $546,000, representing 0.3% of net assets. This security has been fair valued as determined in good faith under procedures established by and under the general supervision of the Company's (as defined herein) Directors.
(d) At December 31, 2019, the aggregate cost for federal income tax purposes is approximately $139,020,000. The aggregate gross unrealized appreciation is approximately $47,372,000 and the aggregate gross unrealized depreciation is approximately $4,566,000, resulting in net unrealized appreciation of approximately $42,806,000.
REIT Real Estate Investment Trust.
The accompanying notes are an integral part of the financial statements.
8
Morgan Stanley Institutional Fund, Inc.
Annual Report — December 31, 2019
Portfolio of Investments (cont'd)
U.S. Real Estate Portfolio
Portfolio Composition
Classification | | Percentage of
Total Investments | |
Office | | | 26.1 | % | |
Apartments | | | 16.6 | | |
Regional Malls | | | 14.3 | | |
Lodging/Resorts | | | 9.5 | | |
Industrial | | | 7.0 | | |
Health Care | | | 5.9 | | |
Diversified | | | 5.1 | | |
Other* | | | 15.5 | | |
Total Investments | | | 100.0 | % | |
* Industries and/or investment types representing less than 5% of total investments.
The accompanying notes are an integral part of the financial statements.
9
Morgan Stanley Institutional Fund, Inc.
Annual Report — December 31, 2019
U.S. Real Estate Portfolio
Statement of Assets and Liabilities | | December 31, 2019
(000) | |
Assets: | |
Investments in Securities of Unaffiliated Issuers, at Value (Cost $133,369) | | $ | 180,575 | | |
Investment in Security of Affiliated Issuer, at Value (Cost $1,251) | | | 1,251 | | |
Total Investments in Securities, at Value (Cost $134,620) | | | 181,826 | | |
Dividends Receivable | | | 1,130 | | |
Receivable for Fund Shares Sold | | | 263 | | |
Receivable from Affiliate | | | 1 | | |
Other Assets | | | 72 | | |
Total Assets | | | 183,292 | | |
Liabilities: | |
Payable for Fund Shares Redeemed | | | 683 | | |
Payable for Advisory Fees | | | 256 | | |
Payable for Professional Fees | | | 52 | | |
Payable for Sub Transfer Agency Fees — Class I | | | 41 | | |
Payable for Sub Transfer Agency Fees — Class A | | | 5 | | |
Payable for Sub Transfer Agency Fees — Class L | | | — | @ | |
Payable for Sub Transfer Agency Fees — Class C | | | — | @ | |
Payable for Transfer Agency Fees — Class I | | | 5 | | |
Payable for Transfer Agency Fees — Class A | | | 2 | | |
Payable for Transfer Agency Fees — Class L | | | 1 | | |
Payable for Transfer Agency Fees — Class C | | | — | @ | |
Payable for Transfer Agency Fees — Class IS | | | 8 | | |
Payable for Transfer Agency Fees — Class IR | | | — | @ | |
Payable for Administration Fees | | | 13 | | |
Payable for Shareholder Services Fees — Class A | | | 7 | | |
Payable for Distribution and Shareholder Services Fees — Class L | | | 1 | | |
Payable for Distribution and Shareholder Services Fees — Class C | | | — | @ | |
Payable for Custodian Fees | | | 5 | | |
Other Liabilities | | | 49 | | |
Total Liabilities | | | 1,128 | | |
Net Assets | | $ | 182,164 | | |
Net Assets Consist of: | |
Paid-in-Capital | | $ | 139,368 | | |
Total Distributable Earnings | | | 42,796 | | |
Net Assets | | $ | 182,164 | | |
The accompanying notes are an integral part of the financial statements.
10
Morgan Stanley Institutional Fund, Inc.
Annual Report — December 31, 2019
U.S. Real Estate Portfolio
Statement of Assets and Liabilities (cont'd) | | December 31, 2019
(000) | |
CLASS I: | |
Net Assets | | $ | 134,856 | | |
| Shares Outstanding $0.001 par value shares of beneficial interest (unlimited shares authorized) (not in 000's) | | | 12,171,640 | | |
Net Asset Value, Offering and Redemption Price Per Share | | $ | 11.08 | | |
CLASS A: | |
Net Assets | | $ | 32,596 | | |
| Shares Outstanding $0.001 par value shares of beneficial interest (unlimited shares authorized) (not in 000's) | | | 3,088,051 | | |
Net Asset Value, Redemption Price Per Share | | $ | 10.56 | | |
Maximum Sales Load | | | 5.25 | % | |
Maximum Sales Charge | | $ | 0.59 | | |
Maximum Offering Price Per Share | | $ | 11.15 | | |
CLASS L: | |
Net Assets | | $ | 2,164 | | |
| Shares Outstanding $0.001 par value shares of beneficial interest (unlimited shares authorized) (not in 000's) | | | 205,181 | | |
Net Asset Value, Offering and Redemption Price Per Share | | $ | 10.55 | | |
CLASS C: | |
Net Assets | | $ | 232 | | |
| Shares Outstanding $0.001 par value shares of beneficial interest (unlimited shares authorized) (not in 000's) | | | 22,121 | | |
Net Asset Value, Offering and Redemption Price Per Share | | $ | 10.48 | | |
CLASS IS: | |
Net Assets | | $ | 12,307 | | |
| Shares Outstanding $0.001 par value shares of beneficial interest (unlimited shares authorized) (not in 000's) | | | 1,110,613 | | |
Net Asset Value, Offering and Redemption Price Per Share | | $ | 11.08 | | |
CLASS IR: | |
Net Assets | | $ | 9 | | |
| Shares Outstanding $0.001 par value shares of beneficial interest (unlimited shares authorized) (not in 000's) | | | 785 | | |
Net Asset Value, Offering and Redemption Price Per Share | | $ | 11.08 | | |
@ Amount is less than $500.
The accompanying notes are an integral part of the financial statements.
11
Morgan Stanley Institutional Fund, Inc.
Annual Report — December 31, 2019
U.S. Real Estate Portfolio
Statement of Operations | | Year Ended
December 31, 2019
(000) | |
Investment Income: | |
Dividends from Securities of Unaffiliated Issuers | | $ | 7,149 | | |
Dividends from Security of Affiliated Issuer (Note G) | | | 30 | | |
Total Investment Income | | | 7,179 | | |
Expenses: | |
Advisory Fees (Note B) | | | 1,634 | | |
Sub Transfer Agency Fees — Class I | | | 171 | | |
Sub Transfer Agency Fees — Class A | | | 44 | | |
Sub Transfer Agency Fees — Class L | | | 2 | | |
Sub Transfer Agency Fees — Class C | | | 1 | | |
Administration Fees (Note C) | | | 187 | | |
Professional Fees | | | 109 | | |
Shareholder Services Fees — Class A (Note D) | | | 90 | | |
Distribution and Shareholder Services Fees — Class L (Note D) | | | 16 | | |
Distribution and Shareholder Services Fees — Class C (Note D) | | | 3 | | |
Registration Fees | | | 103 | | |
Shareholder Reporting Fees | | | 54 | | |
Transfer Agency Fees — Class I (Note E) | | | 16 | | |
Transfer Agency Fees — Class A (Note E) | | | 7 | | |
Transfer Agency Fees — Class L (Note E) | | | 3 | | |
Transfer Agency Fees — Class C (Note E) | | | 2 | | |
Transfer Agency Fees — Class IS (Note E) | | | 24 | | |
Transfer Agency Fees — Class IR (Note E) | | | 2 | | |
Custodian Fees (Note F) | | | 20 | | |
Directors' Fees and Expenses | | | 14 | | |
Pricing Fees | | | 3 | | |
Other Expenses | | | 18 | | |
Total Expenses | | | 2,523 | | |
Waiver of Advisory Fees (Note B) | | | (204 | ) | |
Reimbursement of Class Specific Expenses — Class I (Note B) | | | (63 | ) | |
Reimbursement of Class Specific Expenses — Class L (Note B) | | | (1 | ) | |
Reimbursement of Class Specific Expenses — Class C (Note B) | | | (2 | ) | |
Reimbursement of Class Specific Expenses — Class IS (Note B) | | | (24 | ) | |
Reimbursement of Class Specific Expenses — Class IR (Note B) | | | (2 | ) | |
Rebate from Morgan Stanley Affiliate (Note G) | | | (3 | ) | |
Net Expenses | | | 2,224 | | |
Net Investment Income | | | 4,955 | | |
Realized Gain: | |
Investments Sold | | | 19,067 | | |
Change in Unrealized Appreciation (Depreciation): | |
Investments | | | 17,154 | | |
Net Realized Gain and Change in Unrealized Appreciation (Depreciation) | | | 36,221 | | |
Net Increase in Net Assets Resulting from Operations | | $ | 41,176 | | |
The accompanying notes are an integral part of the financial statements.
12
Morgan Stanley Institutional Fund, Inc.
Annual Report — December 31, 2019
U.S. Real Estate Portfolio
Statements of Changes in Net Assets | | Year Ended
December 31, 2019
(000) | | Year Ended
December 31, 2018
(000) | |
Increase (Decrease) in Net Assets: | |
Operations: | |
Net Investment Income | | $ | 4,955 | | | $ | 8,659 | | |
Net Realized Gain | | | 19,067 | | | | 69,053 | | |
Net Change in Unrealized Appreciation (Depreciation) | | | 17,154 | | | | (115,506 | ) | |
Net Increase (Decrease) in Net Assets Resulting from Operations | | | 41,176 | | | | (37,794 | ) | |
Dividends and Distributions to Shareholders: | |
Class I | | | (21,074 | ) | | | (53,011 | ) | |
Class A | | | (4,680 | ) | | | (9,885 | ) | |
Class L | | | (293 | ) | | | (588 | ) | |
Class C | | | (31 | ) | | | (65 | ) | |
Class IS | | | (1,835 | ) | | | (9,183 | ) | |
Class IR | | | (1 | ) | | | (2 | ) | |
Total Dividends and Distributions to Shareholders | | | (27,914 | ) | | | (72,734 | ) | |
Capital Share Transactions:(1) | |
Class I: | |
Subscribed | | | 19,431 | | | | 35,741 | | |
Distributions Reinvested | | | 20,897 | | | | 52,679 | | |
Redeemed | | | (92,286 | ) | | | (167,839 | ) | |
Class A: | |
Subscribed | | | 5,250 | | | | 3,936 | | |
Distributions Reinvested | | | 4,645 | | | | 9,810 | | |
Redeemed | | | (13,017 | ) | | | (21,113 | ) | |
Class L: | |
Exchanged | | | — | | | | — | @ | |
Distributions Reinvested | | | 290 | | | | 582 | | |
Redeemed | | | (239 | ) | | | (487 | ) | |
Class C: | |
Subscribed | | | 56 | | | | 146 | | |
Distributions Reinvested | | | 31 | | | | 63 | | |
Redeemed | | | (205 | ) | | | (258 | ) | |
Class IS: | |
Subscribed | | | 1,331 | | | | 24,616 | | |
Distributions Reinvested | | | 1,835 | | | | 8,461 | | |
Redeemed | | | (23,192 | ) | | | (178,831 | ) | |
Class IR: | |
Subscribed | | | — | | | | 10 | (a) | |
Distributions Reinvested | | | 1 | | | | — | | |
Net Decrease in Net Assets Resulting from Capital Share Transactions | | | (75,172 | ) | | | (232,484 | ) | |
Total Decrease in Net Assets | | | (61,910 | ) | | | (343,012 | ) | |
Net Assets: | |
Beginning of Period | | | 244,074 | | | | 587,086 | | |
End of Period | | $ | 182,164 | | | $ | 244,074 | | |
The accompanying notes are an integral part of the financial statements.
13
Morgan Stanley Institutional Fund, Inc.
Annual Report — December 31, 2019
U.S. Real Estate Portfolio
Statements of Changes in Net Assets (cont'd) | | Year Ended
December 31, 2019
(000) | | Year Ended
December 31, 2018
(000) | |
(1) Capital Share Transactions: | |
Class I: | |
Shares Subscribed | | | 1,610 | | | | 2,593 | | |
Shares Issued on Distributions Reinvested | | | 1,882 | | | | 4,178 | | |
Shares Redeemed | | | (7,745 | ) | | | (12,108 | ) | |
Net Decrease in Class I Shares Outstanding | | | (4,253 | ) | | | (5,337 | ) | |
Class A: | |
Shares Subscribed | | | 454 | | | | 289 | | |
Shares Issued on Distributions Reinvested | | | 440 | | | | 810 | | |
Shares Redeemed | | | (1,127 | ) | | | (1,549 | ) | |
Net Decrease in Class A Shares Outstanding | | | (233 | ) | | | (450 | ) | |
Class L: | |
Shares Exchanged | | | — | | | | — | @@ | |
Shares Issued on Distributions Reinvested | | | 28 | | | | 48 | | |
Shares Redeemed | | | (21 | ) | | | (39 | ) | |
Net Increase in Class L Shares Outstanding | | | 7 | | | | 9 | | |
Class C: | |
Shares Subscribed | | | 4 | | | | 13 | | |
Shares Issued on Distributions Reinvested | | | 3 | | | | 5 | | |
Shares Redeemed | | | (18 | ) | | | (18 | ) | |
Net Decrease in Class C Shares Outstanding | | | (11 | ) | | | (— | @@) | |
Class IS: | |
Shares Subscribed | | | 110 | | | | 1,731 | | |
Shares Issued on Distributions Reinvested | | | 164 | | | | 668 | | |
Shares Redeemed | | | (1,893 | ) | | | (12,564 | ) | |
Net Decrease in Class IS Shares Outstanding | | | (1,619 | ) | | | (10,165 | ) | |
Class IR: | |
Shares Subscribed | | | — | | | | 1 | (a) | |
Shares Issued on Distributions Reinvested | | | — | @@ | | | — | | |
Net Increase in Class IR Shares Outstanding | | | — | @@ | | | 1 | (a) | |
(a) For the period June 15, 2018 through December 31, 2018.
@ Amount is less than $500.
@@ Amount is less than 500 shares.
The accompanying notes are an integral part of the financial statements.
14
Morgan Stanley Institutional Fund, Inc.
Annual Report — December 31, 2019
Financial Highlights
U.S. Real Estate Portfolio
| | | Class I | |
| | | Year Ended December 31, | |
Selected Per Share Data and Ratios | | 2019 | | 2018 | | 2017 | | 2016(1) | | 2015 | |
Net Asset Value, Beginning of Period | | $ | 10.82 | | | $ | 15.24 | | | $ | 17.21 | | | $ | 17.86 | | | $ | 20.48 | | |
Income (Loss) from Investment Operations: | |
Net Investment Income(2) | | | 0.26 | | | | 0.34 | | | | 0.37 | | | | 0.31 | | | | 0.32 | | |
Net Realized and Unrealized Gain (Loss) | | | 1.69 | | | | (1.33 | ) | | | 0.16 | | | | 0.91 | | | | 0.10 | | |
Total from Investment Operations | | | 1.95 | | | | (0.99 | ) | | | 0.53 | | | | 1.22 | | | | 0.42 | | |
Distributions from and/or in Excess of: | |
Net Investment Income | | | (0.40 | ) | | | (0.34 | ) | | | (0.26 | ) | | | (0.38 | ) | | | (0.26 | ) | |
Net Realized Gain | | | (1.29 | ) | | | (3.09 | ) | | | (2.24 | ) | | | (1.49 | ) | | | (2.78 | ) | |
Total Distributions | | | (1.69 | ) | | | (3.43 | ) | | | (2.50 | ) | | | (1.87 | ) | | | (3.04 | ) | |
Net Asset Value, End of Period | | $ | 11.08 | | | $ | 10.82 | | | $ | 15.24 | | | $ | 17.21 | | | $ | 17.86 | | |
Total Return(3) | | | 18.40 | % | | | (8.44 | )% | | | 3.31 | % | | | 6.79 | % | | | 2.27 | % | |
Ratios to Average Net Assets and Supplemental Data: | |
Net Assets, End of Period (Thousands) | | $ | 134,856 | | | $ | 177,690 | | | $ | 331,637 | | | $ | 494,967 | | | $ | 625,999 | | |
Ratio of Expenses Before Expense Limitation | | | 1.02 | % | | | 1.02 | % | | | 1.02 | % | | | 1.02 | % | | | N/A | | |
Ratio of Expenses After Expense Limitation | | | 0.90 | %(4) | | | 0.95 | %(4)(5) | | | 1.00 | %(4) | | | 1.00 | %(4) | | | 0.98 | %(4) | |
Ratio of Expenses After Expense Limitation Excluding Non Operating Expenses | | | N/A | | | | 0.95 | %(4) | | | 1.00 | %(4) | | | N/A | | | | 0.98 | %(4) | |
Ratio of Net Investment Income | | | 2.18 | %(4) | | | 2.44 | %(4) | | | 2.19 | %(4) | | | 1.73 | %(4) | | | 1.61 | %(4) | |
Ratio of Rebate from Morgan Stanley Affiliates | | | 0.00 | %(6) | | | 0.00 | %(6) | | | 0.00 | %(6) | | | 0.00 | %(6) | | | 0.00 | %(6) | |
Portfolio Turnover Rate | | | 21 | % | | | 39 | % | | | 43 | % | | | 24 | % | | | 24 | % | |
(1) Reflects prior period custodian out-of-pocket expenses that were reimbursed in September 2016. The amount of the reimbursement was immaterial on a per share basis and did not impact the total return of Class I shares. The Ratio of Expenses After Expense Limitation and the Ratio of Net Investment Income would be unchanged as the reimbursement of custodian fees was offset against expense waivers/reimbursements with no impact to net expenses or net investment income.
(2) Per share amount is based on average shares outstanding.
(3) Calculated based on the net asset value as of the last business day of the period.
(4) The Ratio of Expenses After Expense Limitation and Ratio of Net Investment Income reflect the rebate of certain Fund expenses in connection with the investments in Morgan Stanley affiliates during the period. The effect of the rebate on the ratios is disclosed in the above table as "Ratio of Rebate from Morgan Stanley Affiliates."
(5) Effective July 1, 2018, the Adviser has agreed to limit the ratio of expenses to average net assets to the maximum ratio of 0.90% for Class I shares. Prior to July 1, 2018, the maximum ratio was 1.00% for Class I shares.
(6) Amount is less than 0.005%.
The accompanying notes are an integral part of the financial statements.
15
Morgan Stanley Institutional Fund, Inc.
Annual Report — December 31, 2019
Financial Highlights
U.S. Real Estate Portfolio
| | | Class A | |
| | | Year Ended December 31, | |
Selected Per Share Data and Ratios | | 2019 | | 2018 | | 2017 | | 2016(1) | | 2015 | |
Net Asset Value, Beginning of Period | | $ | 10.38 | | | $ | 14.76 | | | $ | 16.74 | | | $ | 17.42 | | | $ | 20.04 | | |
Income (Loss) from Investment Operations: | |
Net Investment Income(2) | | | 0.22 | | | | 0.29 | | | | 0.31 | | | | 0.24 | | | | 0.28 | | |
Net Realized and Unrealized Gain (Loss) | | | 1.61 | | | | (1.28 | ) | | | 0.15 | | | | 0.89 | | | | 0.08 | | |
Total from Investment Operations | | | 1.83 | | | | (0.99 | ) | | | 0.46 | | | | 1.13 | | | | 0.36 | | |
Distributions from and/or in Excess of: | |
Net Investment Income | | | (0.36 | ) | | | (0.30 | ) | | | (0.20 | ) | | | (0.32 | ) | | | (0.20 | ) | |
Net Realized Gain | | | (1.29 | ) | | | (3.09 | ) | | | (2.24 | ) | | | (1.49 | ) | | | (2.78 | ) | |
Total Distributions | | | (1.65 | ) | | | (3.39 | ) | | | (2.44 | ) | | | (1.81 | ) | | | (2.98 | ) | |
Net Asset Value, End of Period | | $ | 10.56 | | | $ | 10.38 | | | $ | 14.76 | | | $ | 16.74 | | | $ | 17.42 | | |
Total Return(3) | | | 18.02 | % | | | (8.71 | )% | | | 2.98 | % | | | 6.47 | % | | | 2.01 | % | |
Ratios to Average Net Assets and Supplemental Data: | |
Net Assets, End of Period (Thousands) | | $ | 32,596 | | | $ | 34,459 | | | $ | 55,640 | | | $ | 76,082 | | | $ | 87,462 | | |
Ratio of Expenses Before Expense Limitation | | | 1.31 | % | | | 1.30 | % | | | N/A | | | | 1.30 | % | | | N/A | | |
Ratio of Expenses After Expense Limitation | | | 1.22 | %(4) | | | 1.26 | %(4)(5) | | | 1.34 | %(4) | | | 1.29 | %(4) | | | 1.28 | %(4) | |
Ratio of Expenses After Expense Limitation Excluding Non Operating Expenses | | | N/A | | | | 1.26 | %(4) | | | 1.34 | %(4) | | | N/A | | | | 1.28 | %(4) | |
Ratio of Net Investment Income | | | 1.91 | %(4) | | | 2.14 | %(4) | | | 1.87 | %(4) | | | 1.37 | %(4) | | | 1.43 | %(4) | |
Ratio of Rebate from Morgan Stanley Affiliates | | | 0.00 | %(6) | | | 0.00 | %(6) | | | 0.00 | %(6) | | | 0.00 | %(6) | | | 0.00 | %(6) | |
Portfolio Turnover Rate | | | 21 | % | | | 39 | % | | | 43 | % | | | 24 | % | | | 24 | % | |
(1) Reflects prior period custodian out-of-pocket expenses that were reimbursed in September 2016. The amount of the reimbursement was immaterial on a per share basis and did not impact the total return of Class A shares. The Ratio of Expenses After Expense Limitation would have been less than 0.005% higher and the Ratio of Net Investment Income would have been less than 0.005% lower had the custodian not reimbursed the Fund.
(2) Per share amount is based on average shares outstanding.
(3) Calculated based on the net asset value which does not reflect sales charges, if applicable, as of the last business day of the period.
(4) The Ratio of Expenses After Expense Limitation and Ratio of Net Investment Income reflect the rebate of certain Fund expenses in connection with the investments in Morgan Stanley affiliates during the period. The effect of the rebate on the ratios is disclosed in the above table as "Ratio of Rebate from Morgan Stanley Affiliates."
(5) Effective July 1, 2018, the Adviser has agreed to limit the ratio of expenses to average net assets to the maximum ratio of 1.25% for Class A shares. Prior to July 1, 2018, the maximum ratio was 1.35% for Class A shares.
(6) Amount is less than 0.005%.
The accompanying notes are an integral part of the financial statements.
16
Morgan Stanley Institutional Fund, Inc.
Annual Report — December 31, 2019
Financial Highlights
U.S. Real Estate Portfolio
| | | Class L | |
| | | Year Ended December 31, | |
Selected Per Share Data and Ratios | | 2019 | | 2018 | | 2017 | | 2016(1) | | 2015 | |
Net Asset Value, Beginning of Period | | $ | 10.37 | | | $ | 14.74 | | | $ | 16.73 | | | $ | 17.41 | | | $ | 20.03 | | |
Income (Loss) from Investment Operations: | |
Net Investment Income(2) | | | 0.16 | | | | 0.23 | | | | 0.22 | | | | 0.15 | | | | 0.21 | | |
Net Realized and Unrealized Gain (Loss) | | | 1.61 | | | | (1.28 | ) | | | 0.15 | | | | 0.89 | | | | 0.04 | | |
Total from Investment Operations | | | 1.77 | | | | (1.05 | ) | | | 0.37 | | | | 1.04 | | | | 0.25 | | |
Distributions from and/or in Excess of: | |
Net Investment Income | | | (0.30 | ) | | | (0.23 | ) | | | (0.12 | ) | | | (0.23 | ) | | | (0.09 | ) | |
Net Realized Gain | | | (1.29 | ) | | | (3.09 | ) | | | (2.24 | ) | | | (1.49 | ) | | | (2.78 | ) | |
Total Distributions | | | (1.59 | ) | | | (3.32 | ) | | | (2.36 | ) | | | (1.72 | ) | | | (2.87 | ) | |
Net Asset Value, End of Period | | $ | 10.55 | | | $ | 10.37 | | | $ | 14.74 | | | $ | 16.73 | | | $ | 17.41 | | |
Total Return(3) | | | 17.43 | % | | | (9.16 | )% | | | 2.37 | % | | | 5.91 | % | | | 1.44 | % | |
Ratios to Average Net Assets and Supplemental Data: | |
Net Assets, End of Period (Thousands) | | $ | 2,164 | | | $ | 2,057 | | | $ | 2,787 | | | $ | 3,471 | | | $ | 3,993 | | |
Ratio of Expenses Before Expense Limitation | | | 1.88 | % | | | 1.84 | % | | | 1.89 | % | | | 1.84 | % | | | N/A | | |
Ratio of Expenses After Expense Limitation | | | 1.75 | %(4) | | | 1.79 | %(4)(5) | | | 1.85 | %(4) | | | 1.84 | %(4) | | | 1.82 | %(4) | |
Ratio of Expenses After Expense Limitation Excluding Non Operating Expenses | | | N/A | | | | 1.79 | %(4) | | | 1.85 | %(4) | | | N/A | | | | 1.81 | %(4) | |
Ratio of Net Investment Income | | | 1.42 | %(4) | | | 1.71 | %(4) | | | 1.37 | %(4) | | | 0.84 | %(4) | | | 1.08 | %(4) | |
Ratio of Rebate from Morgan Stanley Affiliates | | | 0.00 | %(6) | | | 0.00 | %(6) | | | 0.00 | %(6) | | | 0.00 | %(6) | | | 0.00 | %(6) | |
Portfolio Turnover Rate | | | 21 | % | | | 39 | % | | | 43 | % | | | 24 | % | | | 24 | % | |
(1) Reflects prior period custodian out-of-pocket expenses that were reimbursed in September 2016. The amount of the reimbursement was immaterial on a per share basis and did not impact the total return of Class L shares. The Ratio of Expenses After Expense Limitation would have been less than 0.005% higher and the Ratio of Net Investment Income would have been less than 0.005% lower had the custodian not reimbursed the Fund.
(2) Per share amount is based on average shares outstanding.
(3) Calculated based on the net asset value as of the last business day of the period.
(4) The Ratio of Expenses After Expense Limitation and Ratio of Net Investment Income reflect the rebate of certain Fund expenses in connection with the investments in Morgan Stanley affiliates during the period. The effect of the rebate on the ratios is disclosed in the above table as "Ratio of Rebate from Morgan Stanley Affiliates."
(5) Effective July 1, 2018, the Adviser has agreed to limit the ratio of expenses to average net assets to the maximum ratio of 1.75% for Class L shares. Prior to July 1, 2018, the maximum ratio was 1.85% for Class L shares.
(6) Amount is less than 0.005%.
The accompanying notes are an integral part of the financial statements.
17
Morgan Stanley Institutional Fund, Inc.
Annual Report — December 31, 2019
Financial Highlights
U.S. Real Estate Portfolio
| | | Class C | |
| | | Year Ended December 31, | | Period from
April 30, 2015(2) to | |
Selected Per Share Data and Ratios | | 2019 | | 2018 | | 2017 | | 2016(1) | | December 31, 2015 | |
Net Asset Value, Beginning of Period | | $ | 10.31 | | | $ | 14.68 | | | $ | 16.67 | | | $ | 17.36 | | | $ | 19.73 | | |
Income (Loss) from Investment Operations: | |
Net Investment Income(3) | | | 0.14 | | | | 0.19 | | | | 0.20 | | | | 0.13 | | | | 0.18 | | |
Net Realized and Unrealized Gain (Loss) | | | 1.59 | | | | (1.29 | ) | | | 0.13 | | | | 0.87 | | | | 0.31 | | |
Total from Investment Operations | | | 1.73 | | | | (1.10 | ) | | | 0.33 | | | | 1.00 | | | | 0.49 | | |
Distributions from and/or in Excess of: | |
Net Investment Income | | | (0.27 | ) | | | (0.18 | ) | | | (0.08 | ) | | | (0.20 | ) | | | (0.08 | ) | |
Net Realized Gain | | | (1.29 | ) | | | (3.09 | ) | | | (2.24 | ) | | | (1.49 | ) | | | (2.78 | ) | |
Total Distributions | | | (1.56 | ) | | | (3.27 | ) | | | (2.32 | ) | | | (1.69 | ) | | | (2.86 | ) | |
Net Asset Value, End of Period | | $ | 10.48 | | | $ | 10.31 | | | $ | 14.68 | | | $ | 16.67 | | | $ | 17.36 | | |
Total Return(4) | | | 17.07 | % | | | (9.47 | )% | | | 2.14 | % | | | 5.72 | % | | | 2.70 | %(8) | |
Ratios to Average Net Assets and Supplemental Data: | |
Net Assets, End of Period (Thousands) | | $ | 232 | | | $ | 338 | | | $ | 486 | | | $ | 427 | | | $ | 91 | | |
Ratio of Expenses Before Expense Limitation | | | 2.92 | % | | | 2.75 | % | | | 2.46 | % | | | 3.13 | % | | | 5.89 | %(9) | |
Ratio of Expenses After Expense Limitation | | | 2.00 | %(5) | | | 2.05 | %(5)(6) | | | 2.10 | %(5) | | | 2.10 | %(5) | | | 2.10 | %(5)(9) | |
Ratio of Expenses After Expense Limitation Excluding Non Operating Expenses | | | N/A | | | | 2.05 | %(5) | | | 2.10 | %(5) | | | N/A | | | | 2.10 | %(5)(9) | |
Ratio of Net Investment Income | | | 1.18 | %(5) | | | 1.39 | %(5) | | | 1.21 | %(5) | | | 0.73 | %(5) | | | 1.44 | %(5)(9) | |
Ratio of Rebate from Morgan Stanley Affiliates | | | 0.00 | %(7) | | | 0.00 | %(7) | | | 0.00 | %(7) | | | 0.00 | %(7) | | | 0.00 | %(7)(9) | |
Portfolio Turnover Rate | | | 21 | % | | | 39 | % | | | 43 | % | | | 24 | % | | | 24 | % | |
(1) Reflects prior period custodian out-of-pocket expenses that were reimbursed in September 2016. The amount of the reimbursement was immaterial on a per share basis and did not impact the total return of Class C shares. The Ratio of Expenses After Expense Limitation and the Ratio of Net Investment Income would be unchanged as the reimbursement of custodian fees was offset against expense waivers/reimbursements with no impact to net expenses or net investment income.
(2) Commencement of Offering.
(3) Per share amount is based on average shares outstanding.
(4) Calculated based on the net asset value which does not reflect sales charges, if applicable, as of the last business day of the period.
(5) The Ratio of Expenses After Expense Limitation and Ratio of Net Investment Income reflect the rebate of certain Fund expenses in connection with the investments in Morgan Stanley affiliates during the period. The effect of the rebate on the ratios is disclosed in the above table as "Ratio of Rebate from Morgan Stanley Affiliates."
(6) Effective July 1, 2018, the Adviser has agreed to limit the ratio of expenses to average net assets to the maximum ratio of 2.00% for Class C shares. Prior to July 1, 2018, the maximum ratio was 2.10% for Class C shares.
(7) Amount is less than 0.005%.
(8) Not annualized.
(9) Annualized.
The accompanying notes are an integral part of the financial statements.
18
Morgan Stanley Institutional Fund, Inc.
Annual Report — December 31, 2019
Financial Highlights
U.S. Real Estate Portfolio
| | | Class IS | |
| | | Year Ended December 31, | |
Selected Per Share Data and Ratios | | 2019 | | 2018 | | 2017 | | 2016(1) | | 2015 | |
Net Asset Value, Beginning of Period | | $ | 10.82 | | | $ | 15.24 | | | $ | 17.22 | | | $ | 17.86 | | | $ | 20.48 | | |
Income (Loss) from Investment Operations: | |
Net Investment Income(2) | | | 0.25 | | | | 0.28 | | | | 0.39 | | | | 0.33 | | | | 0.36 | | |
Net Realized and Unrealized Gain (Loss) | | | 1.71 | | | | (1.26 | ) | | | 0.14 | | | | 0.92 | | | | 0.08 | | |
Total from Investment Operations | | | 1.96 | | | | (0.98 | ) | | | 0.53 | | | | 1.25 | | | | 0.44 | | |
Distributions from and/or in Excess of: | |
Net Investment Income | | | (0.41 | ) | | | (0.35 | ) | | | (0.27 | ) | | | (0.40 | ) | | | (0.28 | ) | |
Net Realized Gain | | | (1.29 | ) | | | (3.09 | ) | | | (2.24 | ) | | | (1.49 | ) | | | (2.78 | ) | |
Total Distributions | | | (1.70 | ) | | | (3.44 | ) | | | (2.51 | ) | | | (1.89 | ) | | | (3.06 | ) | |
Net Asset Value, End of Period | | $ | 11.08 | | | $ | 10.82 | | | $ | 15.24 | | | $ | 17.22 | | | $ | 17.86 | | |
Total Return(3) | | | 18.48 | % | | | (8.36 | )% | | | 3.32 | % | | | 6.96 | % | | | 2.36 | % | |
Ratios to Average Net Assets and Supplemental Data: | |
Net Assets, End of Period (Thousands) | | $ | 12,307 | | | $ | 29,523 | | | $ | 196,536 | | | $ | 195,490 | | | $ | 141,670 | | |
Ratio of Expenses Before Expense Limitation | | | 1.04 | % | | | 0.97 | % | | | N/A | | | | 0.90 | % | | | 0.90 | % | |
Ratio of Expenses After Expense Limitation | | | 0.83 | %(4) | | | 0.91 | %(4)(5) | | | 0.93 | %(4) | | | 0.89 | %(4) | | | 0.90 | %(4) | |
Ratio of Expenses After Expense Limitation Excluding Non Operating Expenses | | | N/A | | | | 0.91 | %(4) | | | 0.93 | %(4) | | | N/A | | | | 0.90 | %(4) | |
Ratio of Net Investment Income | | | 2.09 | %(4) | | | 1.98 | %(4) | | | 2.33 | %(4) | | | 1.79 | %(4) | | | 1.81 | %(4) | |
Ratio of Rebate from Morgan Stanley Affiliates | | | 0.00 | %(6) | | | 0.00 | %(6) | | | 0.00 | %(6) | | | 0.00 | %(6) | | | 0.00 | %(6) | |
Portfolio Turnover Rate | | | 21 | % | | | 39 | % | | | 43 | % | | | 24 | % | | | 24 | % | |
(1) Reflects prior period custodian out-of-pocket expenses that were reimbursed in September 2016. The amount of the reimbursement was immaterial on a per share basis and did not impact the total return of Class IS shares. The Ratio of Expenses After Expense Limitation would have been less than 0.005% higher and the Ratio of Net Investment would have been less than 0.005% lower had the custodian not reimbursed the Fund.
(2) Per share amount is based on average shares outstanding.
(3) Calculated based on the net asset value as of the last business day of the period.
(4) The Ratio of Expenses After Expense Limitation and Ratio of Net Investment Income reflect the rebate of certain Fund expenses in connection with the investments in Morgan Stanley affiliates during the period. The effect of the rebate on the ratios is disclosed in the above table as "Ratio of Rebate from Morgan Stanley Affiliates."
(5) Effective July 1, 2018, the Adviser has agreed to limit the ratio of expenses to average net assets to the maximum ratio of 0.83% for Class IS shares. Prior to July 1, 2018, the maximum ratio was 0.93% for Class IS shares.
(6) Amount is less than 0.005%.
The accompanying notes are an integral part of the financial statements.
19
Morgan Stanley Institutional Fund, Inc.
Annual Report — December 31, 2019
Financial Highlights
U.S. Real Estate Portfolio
| | | Class IR | |
Selected Per Share Data and Ratios | | Year Ended
December 31, 2019 | | Period from
June 15, 2018(1) to
December 31, 2018 | |
Net Asset Value, Beginning of Period | | $ | 10.82 | | | $ | 14.74 | | |
Income (Loss) from Investment Operations: | |
Net Investment Income(2) | | | 0.33 | | | | 0.43 | | |
Net Realized and Unrealized Gain (Loss) | | | 1.63 | | | | (0.98 | ) | |
Total from Investment Operations | | | 1.96 | | | | (0.55 | ) | |
Distributions from and/or in Excess of: | |
Net Investment Income | | | (0.41 | ) | | | (0.28 | ) | |
Net Realized Gain | | | (1.29 | ) | | | (3.09 | ) | |
Total Distributions | | | (1.70 | ) | | | (3.37 | ) | |
Net Asset Value, End of Period | | $ | 11.08 | | | $ | 10.82 | | |
Total Return(3) | | | 18.48 | % | | | (5.73 | )%(7) | |
Ratios to Average Net Assets and Supplemental Data: | |
Net Assets, End of Period, (Thousands) | | $ | 9 | | | $ | 7 | | |
Ratio of Expenses Before Expense Limitation | | | 23.80 | % | | | 19.12 | %(8) | |
Ratio of Expenses After Expense Limitation | | | 0.83 | %(4) | | | 0.84 | %(4)(5)(8) | |
Ratios of Expenses After Expense Limitation Excluding Non Operating Expenses | | | N/A | | | | 0.84 | %(4)(8) | |
Ratio of Net Investment Income | | | 2.70 | %(4) | | | 4.23 | %(4)(8) | |
Ratio of Rebate from Morgan Stanley Affiliates | | | 0.00 | %(6) | | | 0.00 | %(6)(8) | |
Portfolio Turnover Rate | | | 21 | % | | | 39 | % | |
(1) Commencement of Offering.
(2) Per share amount is based on average shares outstanding.
(3) Calculated based on the net asset value as of the last business day of the period.
(4) The Ratio of Expenses After Expense Limitation and Ratio of Net Investment Income reflect the rebate of certain Fund expenses in connection with the investments in Morgan Stanley affiliates during the period. The effect of the rebate on the ratios is disclosed in the above table as "Ratio of Rebate from Morgan Stanley Affiliates."
(5) Effective July 1, 2018, the Adviser has agreed to limit the ratio of expenses to average net assets to the maximum ratio of 0.83% for Class IR shares. Prior to July 1, 2018, the maximum ratio was 0.93% for Class IR shares.
(6) Amount is less than 0.005%.
(7) Not annualized.
(8) Annualized.
The accompanying notes are an integral part of the financial statements.
20
Morgan Stanley Institutional Fund, Inc.
Annual Report — December 31, 2019
Notes to Financial Statements
Morgan Stanley Institutional Fund, Inc. (the "Company") is registered under the Investment Company Act of 1940, as amended (the "Act"), as an open-end management investment company. The Company is comprised of thirty-two separate, active, diversified and non-diversified funds (individually referred to as a "Fund," collectively as the "Funds"). The Company applies investment company accounting and reporting guidance.
The accompanying financial statements relate to the U.S. Real Estate Portfolio. The Fund seeks to provide above average current income and long-term capital appreciation by investing primarily in equity securities of companies in the U.S. real estate industry, including real estate investment trusts ("REITs"). The Fund has a capital subscription commitment to an investee company for this same purpose, the details of which are disclosed in the Unfunded Commitments note.
The Fund offers six classes of shares — Class I, Class A, Class L, Class C, Class IS and Class IR. On April 30, 2015, the Fund suspended offering of Class L shares. Existing Class L shareholders may invest through reinvestment of dividends and distributions.
A. Significant Accounting Policies: The following significant accounting policies are in conformity with U.S. generally accepted accounting principles ("GAAP"). Such policies are consistently followed by the Company in the preparation of its financial statements. GAAP may require management to make estimates and assumptions that affect the reported amounts and disclosures in the financial statements. Actual results may differ from those estimates.
In August 2018, the Financial Accounting Standards Board ("FASB") issued Accounting Standards Update ("ASU") 2018-13, Fair Value Measurement (Topic 820) — Disclosures Framework — Changes to Disclosure Requirements of Fair Value Measurement ("ASU 2018-13") which introduces new fair value disclosure requirements as well as eliminates and modifies certain existing fair value disclosure requirements. ASU 2018-13 would be effective for fiscal years beginning after December 15, 2019 and for interim periods within those fiscal years; however, management has elected to early adopt ASU 2018-13 as permitted by the standard. The impact of the Fund's adoption was limited to changes in the Fund's financial statement disclosures regarding fair value, primarily those disclosures related to transfers between levels of the fair value hierarchy and disclosure of the range and weighted average used to develop significant unobservable inputs for Level 3 fair value measurements, when applicable.
1. Security Valuation: (1) An equity portfolio security listed or traded on an exchange is valued at its latest reported sales price (or at the exchange official closing price if such exchange reports an official closing price), and if there were no sales on a given day and if there is no official exchange closing price for that day, the security is valued at the mean between the last reported bid and asked prices if such bid and asked prices are available on the relevant exchanges. If only bid prices are available then the latest bid price may be used. Listed equity securities not traded on the valuation date with no reported bid and asked prices available on the exchange are valued at the mean between the current bid and asked prices obtained from one or more reputable brokers or dealers. In cases where a security is traded on more than one exchange, the security is valued on the exchange designated as the primary market; (2) all other equity portfolio securities for which over-the-counter ("OTC") market quotations are readily available are valued at the latest reported sales price (or at the market official closing price if such market reports an official closing price), and if there was no trading in the security on a given day and if there is no official closing price from relevant markets for that day, the security is valued at the mean between the last reported bid and asked prices if such bid and asked prices are available on the relevant markets. An unlisted equity security that does not trade on the valuation date and for which bid and asked prices from the relevant markets are unavailable is valued at the mean between the current bid and asked prices obtained from one or more reputable brokers or dealers; (3) certain portfolio securities may be valued by an outside pricing service/vendor approved by the Company's Board of Directors (the "Directors"). The pricing service/vendor may employ a pricing model that takes into account, among other things, bids, yield spreads and/or other market data and specific security characteristics. Alternatively, if a valuation is not available from an outside pricing service/vendor, and the security trades on an exchange, the security may be valued at its latest reported sale price (or at the exchange official closing price if such exchange reports an official closing price), prior to the time when assets are valued. If there are no sales on a given day and if there is no official exchange closing price for that day, the security is valued at the mean between the last reported bid and asked prices if such bid and asked prices are available in the relevant exchanges. If Morgan Stanley Investment Management Inc. (the "Adviser"), a
21
Morgan Stanley Institutional Fund, Inc.
Annual Report — December 31, 2019
Notes to Financial Statements (cont'd)
wholly-owned subsidiary of Morgan Stanley, determines that the price provided by the outside pricing service/vendor or exchange does not reflect the security's fair value or is unable to provide a price, prices from brokers or dealers may also be utilized. In these circumstances, the value of the security will be the mean of bid and asked prices obtained from brokers or dealers; (4) when market quotations are not readily available, including circumstances under which the Adviser determines that the closing price, last sale price or the mean between the last reported bid and asked prices are not reflective of a security's market value, portfolio securities are valued at their fair value as determined in good faith under procedures established by and under the general supervision of the Directors. Occasionally, developments affecting the closing prices of securities and other assets may occur between the times at which valuations of such securities are determined (that is, close of the foreign market on which the securities trade) and the close of business of the New York Stock Exchange ("NYSE"). If developments occur during such periods that are expected to materially affect the value of such securities, such valuations may be adjusted to reflect the estimated fair value of such securities as of the close of the NYSE, as determined in good faith by the Directors or by the Adviser using a pricing service and/or procedures approved by the Directors; (5) quotations of foreign portfolio securities, other assets and liabilities and forward contracts stated in foreign currency are translated into U.S. dollar equivalents at the prevailing market rates prior to the close of the NYSE; and (6) investments in mutual funds, including the Morgan Stanley Institutional Liquidity Funds, are valued at the net asset value ("NAV") as of the close of each business day.
The Directors have responsibility for determining in good faith the fair value of the investments, and the Directors may appoint others, such as the Company's Adviser or a valuation committee, to assist the Directors in determining fair value and to make the actual calculations pursuant to the fair valuation methodologies previously approved by the Directors. Under procedures approved by the Directors, the Company's Adviser has formed a Valuation Committee whose members are approved by the Directors. The Valuation Committee provides administration and oversight of the Company's valuation policies and procedures, which are reviewed at least annually by the Directors. These procedures allow the Company to utilize independent pricing services,
quotations from securities and financial instrument dealers and other market sources to determine fair value.
The Fund invests a significant portion of its assets in securities of REITs. The market's perception of prospective declines in private real estate values and other financial assets may result in increased volatility of market prices that can negatively impact the valuation of certain issuers held by the Fund.
2. Fair Value Measurement: FASB Accounting Standards CodificationTM ("ASC") 820, "Fair Value Measurement" ("ASC 820"), defines fair value as the value that the Fund would receive to sell an investment or pay to transfer a liability in a timely transaction with an independent buyer in the principal market, or in the absence of a principal market, the most advantageous market for the investment or liability. ASC 820 establishes a three-tier hierarchy to distinguish between (1) inputs that reflect the assumptions market participants would use in valuing an asset or liability developed based on market data obtained from sources independent of the reporting entity (observable inputs) and (2) inputs that reflect the reporting entity's own assumptions about the assumptions market participants would use in valuing an asset or liability developed based on the best information available in the circumstances (unobservable inputs) and to establish classification of fair value measurements for disclosure purposes. Various inputs are used in determining the value of the Fund's investments. The inputs are summarized in the three broad levels listed below:
• Level 1 – unadjusted quoted prices in active markets for identical investments
• Level 2 – other significant observable inputs (including quoted prices for similar investments, interest rates, prepayment speeds, credit risk, etc.)
• Level 3 – significant unobservable inputs including the Fund's own assumptions in determining the fair value of investments. Factors considered in making this determination may include, but are not limited to, information obtained by contacting the issuer, analysts, or the appropriate stock exchange (for exchange-traded securities), analysis of the issuer's financial statements or other available documents and, if necessary, available information concerning other securities in similar circumstances.
22
Morgan Stanley Institutional Fund, Inc.
Annual Report — December 31, 2019
Notes to Financial Statements (cont'd)
The inputs or methodology used for valuing securities are not necessarily an indication of the risk associated with investing in those securities and the determination of the significance of a particular input to the fair value measurement in its entirety requires judgment and considers factors specific to each security.
The following is a summary of the inputs used to value the Fund's investments as of December 31, 2019:
Investment Type | | Level 1
Unadjusted
quoted
prices
(000) | | Level 2
Other
significant
observable
inputs
(000) | | Level 3
Significant
unobservable
inputs
(000) | | Total
(000) | |
Assets: | |
Common Stocks | |
Apartments | | $ | 30,252 | | | $ | — | | | $ | — | | | $ | 30,252 | | |
Data Centers | | | 4,974 | | | | — | | | | — | | | | 4,974 | | |
Diversified | | | 9,216 | | | | — | | | | — | | | | 9,216 | | |
Health Care | | | 10,639 | | | | — | | | | — | | | | 10,639 | | |
Industrial | | | 12,198 | | | | — | | | | 546 | | | | 12,744 | | |
Lodging/Resorts | | | 17,320 | | | | — | | | | — | | | | 17,320 | | |
Office | | | 47,505 | | | | — | | | | — | | | | 47,505 | | |
Regional Malls | | | 26,011 | | | | — | | | | — | | | | 26,011 | | |
Self Storage | | | 8,664 | | | | — | | | | — | | | | 8,664 | | |
Shopping Centers | | | 6,272 | | | | — | | | | — | | | | 6,272 | | |
Single Family Homes | | | 4,718 | | | | — | | | | — | | | | 4,718 | | |
Specialty | | | 2,260 | | | | — | | | | — | | | | 2,260 | | |
Total Common Stocks | | | 180,029 | | | | — | | | | 546 | | | | 180,575 | | |
Short-Term Investment | |
Investment Company | | | 1,251 | | | | — | | | | — | | | | 1,251 | | |
Total Assets | | $ | 181,280 | | | $ | — | | | $ | 546 | | | $ | 181,826 | | |
Transfers between investment levels may occur as the markets fluctuate and/or the availability of data used in an investment's valuation changes.
Following is a reconciliation of investments in which significant unobservable inputs (Level 3) were used in determining fair value:
| | | Common
Stock
(000) | |
Beginning Balance | | $ | 552 | | |
Purchases | | | — | | |
Sales | | | — | | |
Amortization of discount | | | — | | |
Transfers in | | | — | | |
Transfers out | | | — | | |
Corporate actions | | | — | | |
Change in unrealized appreciation (depreciation) | | | (6 | ) | |
Realized gains (losses) | | | — | | |
Ending Balance | | $ | 546 | | |
Net change in unrealized depreciation from investments still held
as of December 31, 2019 | | $ | (6 | ) | |
The following table presents additional information about valuation techniques and inputs used for investments that are measured at fair value and categorized within Level 3 as of December 31, 2019:
| | | Fair Value at
December 31,
2019
(000) | | Valuation
Technique | | Unobservable
Input | |
Common
Stock
| | $ | 546
| | | Reported Capital balance,
adjustments for NAV
practical expedient; including
adjustments for subsequent
Capital Calls, Return of
Capital and Significant Market
Changes between last Capital
Statement and Valuation Date | | Adjusted Capital
Balance
| |
3. Foreign Currency Translation and Foreign Investments: The books and records of the Fund are maintained in U.S. dollars. Foreign currency amounts are translated into U.S. dollars as follows:
– investments, other assets and liabilities at the prevailing rate of exchange on the valuation date;
– investment transactions and investment income at the prevailing rates of exchange on the dates of such transactions.
Although the net assets of the Fund are presented at the foreign exchange rates and market values at the close of the period, the Fund does not isolate that portion of the results of operations arising as a result of changes in the foreign exchange rates from the fluctuations arising from changes in the market prices of securities held at period end. Similarly, the Fund does not isolate the effect of changes in foreign exchange rates from the fluctuations arising from changes in the market prices of securities sold during the period. Accordingly, realized and unrealized foreign currency gains (losses) on investments in securities are included in the reported net realized and unrealized gains (losses) on investment transactions and balances. However, pursuant to U.S. federal income tax regulations, gains and losses from certain foreign currency transactions and the foreign currency portion of gains and losses realized on sales and maturities of foreign denominated debt securities are treated as ordinary income for U.S. federal income tax purposes.
Net realized gains (losses) on foreign currency transactions represent net foreign exchange gains (losses) from
23
Morgan Stanley Institutional Fund, Inc.
Annual Report — December 31, 2019
Notes to Financial Statements (cont'd)
foreign currency forward exchange contracts, disposition of foreign currencies, currency gains (losses) realized between the trade and settlement dates on securities transactions, and the difference between the amount of investment income and foreign withholding taxes recorded on the Fund's books and the U.S. dollar equivalent amounts actually received or paid. The change in unrealized currency gains (losses) on foreign currency transactions for the period is reflected in the Statement of Operations.
Foreign security and currency transactions may involve certain considerations and risks not typically associated with those of U.S. dollar denominated transactions as a result of, among other factors, fluctuations of exchange rates in relation to the U.S. dollar, the possibility of lower levels of governmental supervision and regulation of foreign securities markets and the possibility of political or economic instability.
Governmental approval for foreign investments may be required in advance of making an investment under certain circumstances in some countries, and the extent of foreign investments in domestic companies may be subject to limitation in other countries. Foreign ownership limitations also may be imposed by the charters of individual companies to prevent, among other concerns, violations of foreign investment limitations. As a result, an additional class of shares (identified as "Foreign" in the Portfolio of Investments) may be created and offered for investment. The "local" and "foreign shares" market values may differ. In the absence of trading of the foreign shares in such markets, the Fund values the foreign shares at the closing exchange price of the local shares.
4. Unfunded Commitments: Subject to the terms of a Subscription Agreement between the Fund and Exeter Industrial Value Fund LP, the Fund has made a subscription commitment of $8,500,000 for which it will receive 8,500,000 shares of common stock. As of December 31, 2019, Exeter Industrial Value Fund LP has drawn down approximately $7,905,000, which represents 93.0% of the commitment.
5. Restricted Securities: The Fund invests in unregistered or otherwise restricted securities. The term "restricted securities" refers to securities that are unregistered or are held by control persons of the issuer and securities that are subject to contractual restrictions on their resale. As a
result, restricted securities may be more difficult to value and the Fund may have difficulty disposing of such assets either in a timely manner or for a reasonable price. In order to dispose of an unregistered security, the Fund, where it has contractual rights to do so, may have to cause such security to be registered. A considerable period may elapse between the time the decision is made to sell the security and the time the security is registered so that the Fund can sell it. Contractual restrictions on the resale of securities vary in length and scope and are generally the result of a negotiation between the issuer and the acquirer of the securities. The Fund would, in either case, bear market risks during that period. Restricted securities are identified in the Portfolio of Investments.
6. Indemnifications: The Company enters into contracts that contain a variety of indemnifications. The Company's maximum exposure under these arrangements is unknown. However, the Company has not had prior claims or losses pursuant to these contracts and expects the risk of loss to be remote.
7. Dividends and Distributions to Shareholders: Dividends and distributions to shareholders are recorded on the ex-dividend date. Dividends from net investment income, if any, are declared and paid quarterly. Net realized capital gains, if any, are distributed at least annually.
8. Security Transactions, Income and Expenses: Security transactions are accounted for on the trade date (date the order to buy or sell is executed). Realized gains and losses on the sale of investment securities are determined on the specific identified cost method. Dividend income and other distributions are recorded on the ex-dividend date (except for certain foreign dividends which may be recorded as soon as the Fund is informed of such dividends) net of applicable withholding taxes. Interest income is recognized on the accrual basis except where collection is in doubt. Discounts are accreted and premiums are amortized over the life of the respective securities. Most expenses of the Company can be directly attributed to a particular Fund. Expenses which cannot be directly attributed are apportioned among the Funds based upon relative net assets or other appropriate methods. Income, expenses (other than class specific expenses — distribution and shareholder services, transfer agency and sub transfer agency fees) and realized and unrealized gains or losses are allocated to each class of shares based upon their relative net assets.
24
Morgan Stanley Institutional Fund, Inc.
Annual Report — December 31, 2019
Notes to Financial Statements (cont'd)
The Fund owns shares of REITs which report information on the source of their distributions annually in the following calendar year. A portion of distributions received from REITs during the year is estimated to be a return of capital and is recorded as a reduction of their cost.
B. Advisory Fees: The Adviser, a wholly-owned subsidiary of Morgan Stanley, provides the Fund with advisory services under the terms of an Investment Advisory Agreement, paid quarterly, at the annual rate based on the daily net assets as follows:
First $500
million | | Next $500
million | | Over $1
billion | |
| | 0.70 | % | | | 0.65 | % | | | 0.60 | % | |
For the year ended December 31, 2019, the advisory fee rate (net of waiver/rebate) was equivalent to an annual effective rate of 0.61% of the Fund's average daily net assets.
The Adviser has agreed to reduce its advisory fee and/or reimburse the Fund so that total annual Fund operating expenses, excluding certain investment related expenses, taxes, interest and other extraordinary expenses (including litigation), will not exceed 0.90% Class I shares, 1.25% for Class A shares, 1.75% for Class L shares, 2.00% for Class C shares, 0.83% for Class IS shares and 0.83% for Class IR shares. The fee waivers and/or expense reimbursements will continue for at least one year from the date of the Fund's prospectus or until such time as the Directors act to discontinue all or a portion of such waivers and/or reimbursements when they deem such action is appropriate. For the year ended December 31, 2019, approximately $204,000 of advisory fees were waived and approximately $92,000 of other expenses were reimbursed by the Adviser pursuant to this arrangement.
C. Administration Fees: The Adviser also serves as Administrator to the Company and provides administrative services pursuant to an Administration Agreement for an annual fee, accrued daily and paid monthly, of 0.08% of the Fund's average daily net assets.
Under a Sub-Administration Agreement between the Administrator and State Street Bank and Trust Company ("State Street"), State Street provides certain administrative services to the Company. For such services, the Administrator pays State Street a portion of the fee the Administrator receives from the Fund.
D. Distribution and Shareholder Services Fees: Morgan Stanley Distribution, Inc. ("MSDI" or the "Distributor"), a wholly-owned subsidiary of the Adviser and an indirect
subsidiary of Morgan Stanley, serves as the Company's Distributor of Fund shares pursuant to a Distribution Agreement. The Company has adopted a Shareholder Services Plan with respect to Class A shares pursuant to Rule 12b-1 under the Act. Under the Shareholder Services Plan, the Fund pays the Distributor a shareholder services fee, accrued daily and paid monthly, at an annual rate of 0.25% of the Fund's average daily net assets attributable to Class A shares.
The Company has adopted a Distribution and Shareholder Services Plan with respect to Class L shares pursuant to Rule 12b-1 under the Act. Under the Distribution and Shareholder Services Plan, the Fund pays the Distributor a distribution fee, accrued daily and paid monthly, at an annual rate of 0.50% and a shareholder services fee, accrued daily and paid monthly, at an annual rate of 0.25% of the Fund's average daily net assets attributable to Class L shares.
The Company has adopted a Distribution and Shareholder Services Plan with respect to Class C shares pursuant to Rule 12b-1 under the Act. Under the Distribution and Shareholder Services Plan, the Fund pays the Distributor a distribution fee, accrued daily and paid monthly, at an annual rate of 0.75% and a shareholder services fee, accrued daily and paid monthly, at an annual rate of 0.25% of the Fund's average daily net assets attributable to Class C shares.
The distribution and shareholder services fees are used to support the expenses associated with servicing and maintaining accounts. The Distributor may compensate other parties for providing shareholder support services to investors who purchase Class A, Class L and Class C shares.
E. Dividend Disbursing and Transfer Agent: The Company's dividend disbursing and transfer agent is DST Asset Manager Solutions, Inc. ("DST"). Pursuant to a Transfer Agency Agreement, the Company pays DST a fee based on the number of classes, accounts and transactions relating to the Funds of the Company.
F. Custodian Fees: State Street (the "Custodian") also serves as Custodian for the Company in accordance with a Custodian Agreement. The Custodian holds cash, securities and other assets of the Company as required by the Act. Custody fees are payable monthly based on assets held in custody, investment purchases and sales activity and account maintenance fees, plus reimbursement for certain out-of-pocket expenses.
G. Security Transactions and Transactions with Affiliates: For the year ended December 31, 2019, purchases and sales of investment securities for the Fund, other than
25
Morgan Stanley Institutional Fund, Inc.
Annual Report — December 31, 2019
Notes to Financial Statements (cont'd)
long-term U.S. Government securities and short-term investments were approximately $47,449,000 and $143,849,000, respectively. There were no purchases and sales of long-term U.S. Government securities for the year ended December 31, 2019.
The Fund invests in the Institutional Class of the Morgan Stanley Institutional Liquidity Funds — Treasury Portfolio (the "Liquidity Funds"), an open-end management investment company managed by the Adviser. Advisory fees paid by the Fund are reduced by an amount equal to its pro-rata share of the advisory and administration fees paid by the Fund due to its investment in the Liquidity Funds. For the year ended December 31, 2019, advisory fees paid were reduced by approximately $3,000 relating to the Fund's investment in the Liquidity Funds.
A summary of the Fund's transactions in shares of affiliated investments during the year ended December 31, 2019 is as follows:
Affiliated
Investment
Company | | Value
December 31,
2018
(000) | | Purchases
at Cost
(000) | | Proceeds
from Sales
(000) | | Dividend
Income
(000) | |
Liquidity Funds | | $ | — | | | $ | 48,150 | | | $ | 46,899 | | | $ | 30 | | |
Affiliated
Investment
Company (cont'd) | | Realized
Gain (Loss)
(000) | | Change in
Unrealized
Appreciation
(Depreciation)
(000) | | Value
December 31,
2019
(000) | |
Liquidity Funds | | $ | — | | | $ | — | | | $ | 1,251 | | |
The Fund is permitted to purchase and sell securities ("cross-trade") from and to other Morgan Stanley funds as well as other funds and client accounts for which the Adviser or an affiliate of the Adviser serves as investment adviser, pursuant to procedures approved by the Directors in compliance with Rule 17a-7 under the Act (the "Rule"). Each cross-trade is executed at the current market price in compliance with provisions of the Rule. For the year ended December 31, 2019, the Fund did not engage in any cross-trade transactions.
The Fund has an unfunded Deferred Compensation Plan (the "Compensation Plan"), which allows each independent Director to defer payment of all, or a portion, of the fees he or she receives for serving on the Board of Directors. Each eligible Director generally may elect to have the deferred amounts credited with a return equal to the total return on one or more of the Morgan Stanley funds that are offered as investment options under the Compensation Plan. Appreciation/depreciation and distributions received from these investments are recorded
with an offsetting increase/decrease in the deferred compensation obligation and do not affect the NAV of the Fund.
H. Federal Income Taxes: It is the Fund's intention to continue to qualify as a regulated investment company and distribute all of its taxable and tax-exempt income. Accordingly, no provision for federal income taxes is required in the financial statements.
The Fund may be subject to taxes imposed by countries in which it invests. Such taxes are generally based on income and/or capital gains earned or repatriated. Taxes are accrued based on net investment income, net realized gains and net unrealized appreciation as such income and/or gains are earned. Taxes may also be based on transactions in foreign currency and are accrued based on the value of investments denominated in such currency.
FASB ASC 740-10, "Income Taxes — Overall", sets forth a minimum threshold for financial statement recognition of the benefit of a tax position taken or expected to be taken in a tax return. Management has concluded there are no significant uncertain tax positions that would require recognition in the financial statements. If applicable, the Fund recognizes interest accrued related to unrecognized tax benefits in "Interest Expense" and penalties in "Other Expenses" in the Statement of Operations. The Fund files tax returns with the U.S. Internal Revenue Service, New York and various states. Generally, each of the tax years in the four-year period ended December 31, 2019 remains subject to examination by taxing authorities.
The tax character of distributions paid may differ from the character of distributions shown for GAAP purposes due to short-term capital gains being treated as ordinary income for tax purposes. The tax character of distributions paid during fiscal years 2019 and 2018 was as follows:
2019
Distributions
Paid From: | | 2018
Distributions
Paid From: | |
Ordinary
Income
(000) | | Long-Term
Capital Gain
(000) | | Ordinary
Income
(000) | | Long-Term
Capital Gain
(000) | |
| $ | 6,211 | | | $ | 21,703 | | | $ | 9,631 | | | $ | 63,103 | | |
The amount and character of income and gains to be distributed are determined in accordance with income tax regulations which may differ from GAAP. These book/tax differences are either considered temporary or permanent in nature.
26
Morgan Stanley Institutional Fund, Inc.
Annual Report — December 31, 2019
Notes to Financial Statements (cont'd)
Temporary differences are attributable to differing book and tax treatments for the timing of the recognition of gains (losses) on certain investment transactions and the timing of the deductibility of certain expenses.
Permanent differences, primarily due to equalization debits, resulted in the following reclassifications among the components of net assets at December 31, 2019:
Total
Distributable
Earnings
(000) | | Paid-in-
Capital
(000) | |
| $ | (4,546 | ) | | $ | 4,546 | | |
At December 31, 2019, the components of distributable earnings for the Fund on a tax basis were as follows:
Undistributed
Ordinary
Income
(000) | | Undistributed
Long-Term
Capital Gain
(000) | |
| | — | | | $ | 19 | | |
I. Credit Facility: The Company and other Morgan Stanley funds participated in a $150,000,000 committed, unsecured revolving line of credit facility (the "Facility") with State Street. Effective April 22, 2019, the committed line amount increased to $300,000,000. This Facility is to be used for temporary emergency purposes or funding of shareholder redemption requests. The interest rate on borrowings is based on the federal funds rate or 1 month LIBOR rate plus a spread. The Facility also has a commitment fee of 0.25% per annum based on the unused portion of the Facility. During the year ended December 31, 2019, the Fund did not have any borrowings under the Facility.
J. Other: At December 31, 2019, the Fund had record owners of 10% or greater. Investment activities of these shareholders could have a material impact on the Fund. The aggregate percentage of such owners was 37.0%.
27
Morgan Stanley Institutional Fund, Inc.
Annual Report — December 31, 2019
Report of Independent Registered Public Accounting Firm
To the Shareholders and Board of Directors of
Morgan Stanley Institutional Fund, Inc. —
U.S. Real Estate Portfolio
Opinion on the Financial Statements
We have audited the accompanying statement of assets and liabilities of U.S. Real Estate Portfolio (the "Fund") (one of the funds constituting Morgan Stanley Institutional Fund, Inc. (the "Company")), including the portfolio of investments, as of December 31, 2019, and the related statement of operations for the year then ended, the statements of changes in net assets for each of the two years in the period then ended, the financial highlights for each of the five years in the period then ended and the related notes (collectively referred to as the "financial statements"). In our opinion, the financial statements present fairly, in all material respects, the financial position of U.S. Real Estate Portfolio (one of the funds constituting Morgan Stanley Institutional Fund, Inc.) at December 31, 2019, the results of its operations for the year then ended, the changes in its net assets for each of the two years in the period then ended and its financial highlights for each of the five years in the period then ended, in conformity with U.S. generally accepted accounting principles.
Basis for Opinion
These financial statements are the responsibility of the Company's management. Our responsibility is to express an opinion on the Fund's financial statements based on our audits. We are a public accounting firm registered with the Public Company Accounting Oversight Board (United States) ("PCAOB") and are required to be independent with respect to the Company in accordance with the U.S. federal securities law and the applicable rules and regulations of the Securities and Exchange Commission and the PCAOB.
We conducted our audits in accordance with the standards of the PCAOB. Those standards require that we plan and perform the audit to obtain reasonable assurance about whether the financial statements are free of material misstatement, whether due to error or fraud. The Company is not required to have, nor were we engaged to perform, an audit of the Company's internal control over financial reporting. As part of our audits, we are required to obtain an understanding of internal control over financial reporting, but not for the purpose of expressing an opinion on the effectiveness of the Company's internal control over financial reporting. Accordingly, we express no such opinion.
Our audits included performing procedures to assess the risks of material misstatement of the financial statements, whether due to error or fraud, and performing procedures that respond to those risks. Such procedures included examining, on a test basis, evidence regarding the amounts and disclosures in the financial statements. Our procedures included confirmation of securities owned as of December 31, 2019 by correspondence with the custodian. Our audits also included evaluating the accounting principles used and significant estimates made by management, as well as evaluating the overall presentation of the financial statements. We believe that our audits provide a reasonable basis for our opinion.

We have served as the auditor of one or more Morgan Stanley investment companies since 2000.
Boston, Massachusetts
February 27, 2020
28
Morgan Stanley Institutional Fund, Inc.
Annual Report — December 31, 2019
Federal Tax Notice (unaudited)
For federal income tax purposes, the following information is furnished with respect to the distributions paid by the Fund during its taxable year ended December 31, 2019.
The Fund designated and paid approximately $26,249,000 as a long-term capital gain distribution.
In January, the Fund provides tax information to shareholders for the preceding calendar year.
29
Privacy Notice (unaudited) April 2019
FACTS | | WHAT DOES MSIM DO WITH YOUR PERSONAL INFORMATION? | |
Why? | | Financial companies choose how they share your personal information. Federal law gives consumers the right to limit some but not all sharing. Federal law also requires us to tell you how we collect, share, and protect your personal information. Please read this notice carefully to understand what we do. | |
What? | | The types of personal information we collect and share depend on the product or service you have with us. This information can include:
n Social Security number and income
n investment experience and risk tolerance
n checking account number and wire transfer instructions | |
How? | | All financial companies need to share customers' personal information to run their everyday business. In the section below, we list the reasons financial companies can share their customers' personal information; the reasons MSIM chooses to share; and whether you can limit this sharing. | |
Reasons we can share your personal information | | Does MSIM share? | | Can you limit this sharing? | |
For our everyday business purposes —
such as to process your transactions, maintain your account(s), respond to court orders and legal investigations, or report to credit bureaus | | Yes | | No | |
For our marketing purposes —
to offer our products and services to you | | Yes | | No | |
For joint marketing with other financial companies | | No | | We don't share | |
For our affiliates' everyday business purposes —
information about your transactions and experiences | | Yes | | No | |
For our affiliates' everyday business purposes —
information about your creditworthiness | | No | | We don't share | |
For our affiliates to market to you | | No | | We don't share | |
For non-affiliates to market to you | | No | | We don't share | |
Questions? Call toll-free (844) 312-6327 or email: imprivacyinquiries@morganstanley.com
30
Privacy Notice (unaudited) (cont'd) April 2019
Who we are
Who is providing this notice? | | Morgan Stanley Investment Management, Inc. and its affiliated registered investment advisers, registered broker-dealers, and registered and unregistered funds ("MSIM") | |
What we do
How does MSIM protect my personal information? | | To protect your personal information from unauthorized access and use, we use security measures that comply with federal law. These measures include computer safeguards and secured files and buildings. We have policies governing the proper handling of customer information by personnel and requiring third parties that provide support to adhere to appropriate security standards with respect to such information. | |
How does MSIM collect my personal information? | | We collect your personal information, for example, when you
n open an account or make deposits or withdrawals from your account
n buy securities from us or make a wire transfer
n give us your contact information
We also collect your personal information from others, such as credit bureaus, affiliates, or other companies. | |
Why can't I limit all sharing? | | Federal law gives you the right to limit only
n sharing for affiliates' everyday business purposes — information about your creditworthiness
n affiliates from using your information to market to you
n sharing for non-affiliates to market to you
State laws and individual companies may give you additional rights to limit sharing. See below for more on your rights under state law. | |
Definitions
Affiliates | | Companies related by common ownership or control. They can be financial and non-financial companies.
n Our affiliates include companies with a Morgan Stanley name and financial companies such as Morgan Stanley Smith Barney LLC and Morgan Stanley & Co. | |
Non-affiliates | | Companies not related by common ownership or control. They can be financial and non-financial companies.
n MSIM does not share with non-affiliates so they can market to you. | |
Joint marketing | | A formal agreement between non-affiliated financial companies that together market financial products or services to you.
n MSIM doesn't jointly market | |
Other important information
Vermont: Except as permitted by law, we will not share personal information we collect about Vermont residents with Non-affiliates unless you provide us with your written consent to share such information.
California: Except as permitted by law, we will not share personal information we collect about California residents with Non-affiliates and we will limit sharing such personal information with our Affiliates to comply with California privacy laws that apply to us.
31
Morgan Stanley Institutional Fund, Inc.
Annual Report — December 31, 2019
Director and Officer Information (unaudited)
Independent Directors:
Name, Birth Year
and Address of
Independent Director | | Position(s)
Held with
Registrant | | Length of Time
Served* | | Principal Occupation(s) During Past 5 Years
and Other Relevant Professional Experience | | Number of
Funds in Fund
Complex
Overseen by
Independent
Director** | | Other Directorships
Held by Independent
Director*** | |
Frank L. Bowman
c/o Perkins Coie LLP
Counsel to the Independent Directors
1155 Avenue of the Americas
New York, NY 10036
Birth Year 1944 | | Director | | Since August 2006 | | President, Strategic Decisions, LLC (consulting) (since February 2009); Director or Trustee of various Morgan Stanley Funds (since August 2006); Chairperson of the Compliance and Insurance Committee (since October 2015); formerly, Chairperson of the Insurance Sub-Committee of the Compliance and Insurance Committee (2007-2015); served as President and Chief Executive Officer of the Nuclear Energy Institute (policy organization) (February 2005-November 2008); retired as Admiral, U.S. Navy after serving over 38 years on active duty including 8 years as Director of the Naval Nuclear Propulsion Program in the Department of the Navy and the U.S. Department of Energy (1996-2004); served as Chief of Naval Personnel (July 1994-September 1996) and on the Joint Staff as Director of Political Military Affairs (June 1992-July 1994); knighted as Honorary Knight Commander of the Most Excellent Order of the British Empire; awarded the Officier de l'Orde National du Mérite by the French Government; elected to the National Academy of Engineering (2009). | | | 86 | | | Director of Naval and Nuclear Technologies LLP; Director Emeritus of the Armed Services YMCA; Member of the National Security Advisory Council of the Center for U.S. Global Engagement and a member of the CNA Military Advisory Board; Trustee of Fairhaven United Methodist Church; Member of the Board of Advisors of the Dolphin Scholarship Foundation; Director of other various non-profit organizations; formerly, Director of BP p.l.c. (November 2010-May 2019). | |
Kathleen A. Dennis
c/o Perkins Coie LLP
Counsel to the Independent Directors
1155 Avenue of the Americas
New York, NY 10036
Birth Year 1953 | | Director | | Since August 2006 | | President, Cedarwood Associates (mutual fund and investment management consulting) (since July 2006); Chairperson of the Liquidity and Alternatives Sub-Committee of the Investment Committee (since October 2006) and Director or Trustee of various Morgan Stanley Funds (since August 2006); formerly, Senior Managing Director of Victory Capital Management (1993-2006). | | | 86 | | | Director of various non-profit organizations. | |
Nancy C. Everett
c/o Perkins Coie LLP
Counsel to the Independent Directors
1155 Avenue of the Americas
New York, NY 10036
Birth Year 1955 | | Director | | Since January 2015 | | Chief Executive Officer, Virginia Commonwealth University Investment Company (since November 2015); Owner, OBIR, LLC (institutional investment management consulting) (since June 2014); formerly, Managing Director, BlackRock, Inc. (February 2011-December 2013); and Chief Executive Officer, General Motors Asset Management (a/k/a Promark Global Advisors, Inc.) (June 2005-May 2010). | | | 87 | | | Formerly, Member of Virginia Commonwealth University School of Business Foundation (2005-2016); Member of Virginia Commonwealth University Board of Visitors (2013-2015); Member of Committee on Directors for Emerging Markets Growth Fund, Inc. (2007-2010); Chairperson of Performance Equity Management, LLC (2006-2010); and Chairperson, GMAM Absolute Return Strategies Fund, LLC (2006-2010). | |
32
Morgan Stanley Institutional Fund, Inc.
Annual Report — December 31, 2019
Director and Officer Information (unaudited) (cont'd)
Independent Directors: (cont'd)
Name, Birth Year
and Address of
Independent Director | | Position(s)
Held with
Registrant | | Length of Time
Served* | | Principal Occupation(s) During Past 5 Years
and Other Relevant Professional Experience | | Number of
Funds in Fund
Complex
Overseen by
Independent
Director** | | Other Directorships
Held by Independent
Director*** | |
Jakki L. Haussler
c/o Perkins Coie LLP
Counsel to the Independent Directors
1155 Avenue of the Americas
New York, NY 10036
Birth Year 1957 | | Director | | Since January 2015 | | Chairman, Opus Capital Group (since 1996); formerly, Chief Executive Officer, Opus Capital Group (1996-2019); Director, Capvest Venture Fund, LP (May 2000-December 2011); Partner, Adena Ventures, LP (July 1999-December 2010); Director, The Victory Funds (February 2005-July 2008). | | | 87 | | | Director of Service Corporation International and Member, Audit Committee and Investment Committee; Director of Cincinnati Bell Inc. and Member, Audit Committee and Governance and Nominating Committee; Chairman of Northern Kentucky University Member Investment Committee; Member of Chase College of Law Transactional Law Practice Center Board of Advisors; Director of Best Transport; Director of Chase College of Law Board of Visitors; formerly, Member, University of Cincinnati Foundation Investment Committee; Member, Miami University Board of Visitors (2008-2011); Trustee of Victory Funds (2005-2008) and Chairman, Investment Committee (2007-2008) and Member, Service Provider Committee (2005-2008). | |
Dr. Manuel H. Johnson
c/o Johnson Smick International, Inc.
220 I Street, NE — Suite 200
Washington, D.C. 20002
Birth Year 1949 | | Director | | Since July 1991 | | Senior Partner, Johnson Smick International, Inc. (consulting firm); Chairperson of the Investment Committee (since October 2006) and Director or Trustee of various Morgan Stanley Funds (since July 1991); Co-Chairman and a founder of the Group of Seven Council (G7C) (international economic commission); formerly, Chairperson of the Audit Committee (July 1991-September 2006), Vice Chairman of the Board of Governors of the Federal Reserve System and Assistant Secretary of the U.S. Treasury. | | | 86 | | | Director of NVR, Inc. (home construction). | |
Joseph J. Kearns
c/o Perkins Coie LLP
Counsel to the Independent Directors
1155 Avenue of the Americas
New York, NY 10036
Birth Year 1942 | | Director | | Since August 1994 | | Senior Adviser, Kearns & Associates LLC (investment consulting); Chairperson of the Audit Committee (since October 2006) and Director or Trustee of various Morgan Stanley Funds (since August 1994); formerly, Deputy Chairperson of the Audit Committee (July 2003-September 2006) and Chairperson of the Audit Committee of various Morgan Stanley Funds (since August 1994); CFO of the J. Paul Getty Trust. | | | 87 | | | Prior to August 10, 2016, Director of Electro Rent Corporation (equipment leasing); Prior to December 31, 2013, Director of The Ford Family Foundation. | |
33
Morgan Stanley Institutional Fund, Inc.
Annual Report — December 31, 2019
Director and Officer Information (unaudited) (cont'd)
Independent Directors: (cont'd)
Name, Birth Year
and Address of
Independent Director | | Position(s)
Held with
Registrant | | Length of Time
Served* | | Principal Occupation(s) During Past 5 Years
and Other Relevant Professional Experience | | Number of
Funds in Fund
Complex
Overseen by
Independent
Director** | | Other Directorships
Held by Independent
Director*** | |
Michael F. Klein
c/o Perkins Coie LLP
Counsel to the Independent Directors
1155 Avenue of the Americas
New York, NY 10036
Birth Year 1958 | | Director | | Since August 2006 | | Managing Director, Aetos Alternatives Management, LP (since March 2000); Co-President, Aetos Alternatives Management, LP (since January 2004) and Co-Chief Executive Officer of Aetos Alternatives Management, LP (since August 2013); Chairperson of the Fixed Income Sub-Committee of the Investment Committee (since October 2006) and Director or Trustee of various Morgan Stanley Funds (since August 2006); formerly, Managing Director, Morgan Stanley & Co. Inc. and Morgan Stanley Dean Witter Investment Management and President, various Morgan Stanley Funds (June 1998-March 2000); Principal, Morgan Stanley & Co. Inc. and Morgan Stanley Dean Witter Investment Management (August 1997-December 1999). | | | 86 | | | Director of certain investment funds managed or sponsored by Aetos Alternatives Management, LP; Director of Sanitized AG and Sanitized Marketing AG (specialty chemicals). | |
Patricia Maleski
c/o Perkins Coie LLP
Counsel to the Independent Directors
1155 Avenue of the Americas
New York, NY 10036
Birth Year 1960 | | Director | | Since January 2017 | | Managing Director, JPMorgan Asset Management (2004-2016); Oversight and Control Head of Fiduciary and Conflicts of Interest Program (2015-2016); Chief Control Officer-Global Asset Management (2013-2015); President, JPMorgan Funds (2010-2013); Chief Administrative Officer (2004-2013); various other positions including Treasurer and Board Liaison (since 2001). | | | 87 | | | None. | |
Michael E. Nugent
522 Fifth Avenue
New York, NY 10036
Birth Year 1936 | | Chair of the Board and Director | | Chair of the Boards since July 2006 and Director since July 1991 | | Chair of the Boards of various Morgan Stanley Funds (since July 2006); Chairperson of the Governance Committee (since January 2019) and Director or Trustee of various Morgan Stanley Funds (since July 1991); formerly, Chairperson of each of the Closed-End Fund committee (until December 2019) and the Insurance Committee (until July 2006); General Partner, Triumph Capital, L.P. (private investment partnership) (1988-2013). | | | 86 | | | None. | |
W. Allen Reed
c/o Perkins Coie LLP
Counsel to the Independent Directors
1155 Avenue of the Americas
New York, NY 10036
Birth Year 1947 | | Vice Chair of the Board and Director | | Vice Chair of the Boards since January 2020 and Director since August 2006 | | Chairperson of the Equity Sub-Committee of the Investment Committee (since October 2006) and Director or Trustee of various Morgan Stanley Funds (since August 2006); formerly, President and CEO of General Motors Asset Management; Chairman and Chief Executive Officer of the GM Trust Bank and Corporate Vice President of General Motors Corporation (August 1994-December 2005). | | | 86 | | | Formerly, Director of Legg Mason, Inc.; formerly, Director of the Auburn University Foundation (2010-2015). | |
* This is the earliest date the Director began serving the Morgan Stanley Funds. Each Director serves an indefinite term, until his or her successor is elected.
** The Fund Complex includes (as of December 31, 2019) all open-end and closed-end funds (including all of their portfolios) advised by Morgan Stanley Investment Management Inc. (the "Adviser") and any funds that have an adviser that is an affiliated person of the Adviser (including, but not limited to, Morgan Stanley AIP GP LP).
*** This includes any directorships at public companies and registered investment companies held by the Director at any time during the past five years.
34
Morgan Stanley Institutional Fund, Inc.
Annual Report — December 31, 2019
Director and Officer Information (unaudited) (cont'd)
Executive Officers:
Name, Birth Year and Address of
Executive Officer | | Position(s)
Held with
Registrant | | Length of Time
Served* | | Principal Occupation(s) During Past 5 Years | |
John H. Gernon
522 Fifth Avenue
New York, NY 10036
Birth Year 1963 | | President and Principal Executive Officer | | Since September 2013 | | President and Principal Executive Officer of the Equity and Fixed Income Funds and the Morgan Stanley AIP Funds (since September 2013) and the Liquidity Funds and various money market funds (since May 2014) in the Fund Complex; Managing Director of the Adviser; Head of Product (since 2006). | |
Timothy J. Knierim
522 Fifth Avenue
New York, NY 10036
Birth Year 1959 | | Chief Compliance Officer | | Since December 2016 | | Managing Director of the Adviser and various entities affiliated with the Adviser; Chief Compliance Officer of various Morgan Stanley Funds and the Adviser (since December 2016) and Chief Compliance Officer of Morgan Stanley AIP GP LP (since 2014). Formerly, Managing Director and Deputy Chief Compliance Officer of the Adviser (2014-2016); and formerly, Chief Compliance Officer of Prudential Investment Management, Inc. (2007-2014). | |
Francis J. Smith
522 Fifth Avenue
New York, NY 10036
Birth Year 1965 | | Treasurer and Principal Financial Officer | | Treasurer since July 2003 and Principal Financial Officer since September 2002 | | Managing Director of the Adviser and various entities affiliated with the Adviser; Treasurer (since July 2003) and Principal Financial Officer of various Morgan Stanley Funds (since September 2002). | |
Mary E. Mullin
522 Fifth Avenue
New York, NY 10036
Birth Year 1967 | | Secretary | | Since June 1999 | | Managing Director of the Adviser; Secretary of various Morgan Stanley Funds (since June 1999). | |
Michael J. Key
522 Fifth Avenue
New York, NY 10036
Birth Year 1979 | | Vice President | | Since June 2017 | | Vice President of the Equity and Fixed Income Funds, Liquidity Funds, various money market funds and the Morgan Stanley AIP Funds in the Fund Complex (since June 2017); Executive Director of the Adviser; Head of Product Development for Equity and Fixed Income Funds (since August 2013). | |
* This is the earliest date the officer began serving the Morgan Stanley Funds. Each officer serves a one-year term, until his or her successor is elected and qualifies.
35
Morgan Stanley Institutional Fund, Inc.
Annual Report — December 31, 2019
Adviser and Administrator
Morgan Stanley Investment Management Inc.
522 Fifth Avenue
New York, New York 10036
Distributor
Morgan Stanley Distribution, Inc.
522 Fifth Avenue
New York, New York 10036
Dividend Disbursing and Transfer Agent
DST Asset Manager Solutions, Inc.
2000 Crown Colony Drive
Quincy, Massachusetts 02169
Custodian
State Street Bank and Trust Company
One Lincoln Street
Boston, Massachusetts 02111
Legal Counsel
Dechert LLP
1095 Avenue of the Americas
New York, New York 10036
Counsel to the Independent Directors
Perkins Coie LLP
1155 Avenue of the Americas
New York, New York 10036
Independent Registered Public Accounting Firm
Ernst & Young LLP
200 Clarendon Street
Boston, Massachusetts 02116
Reporting to Shareholders
Each Morgan Stanley fund provides a complete schedule of portfolio holdings in its Semi-Annual and the Annual Reports within 60 days of the end of the fund's second and fourth fiscal quarters. The Semi-Annual and Annual Reports are filed electronically with the Securities and Exchange Commission ("SEC") on Form N-CSRS and Form N-CSR, respectively. Morgan Stanley also delivers the Semi-Annual and Annual Reports to fund shareholders and makes these reports available on its public website, www.morganstanley.com/im/shareholderreports. Each Morgan Stanley non-money market fund also files a complete schedule of portfolio holdings with the SEC for the fund's first and third fiscal quarters as an attachment to Form N-PORT. Morgan Stanley does not deliver the reports for the first and third fiscal quarters to shareholders, nor are the reports posted to the Morgan Stanley public website. However, the holdings for each money market fund are posted to the Morgan Stanley public website. You may obtain the Form N-PORT filings (as well as the Form N-CSR and N-CSRS filings) by accessing the SEC's website, www.sec.gov. You can also request copies of these materials, upon payment of a duplicating fee, by electronic request at the SEC's email address (publicinfo@sec.gov).
Proxy Voting Policies and Procedures and Proxy Voting Record
You may obtain a copy of the Company's Proxy Voting Policy and Procedures and information regarding how the Company voted proxies relating to portfolio securities during the most recent twelve-month period ended June 30, without charge, upon request, by calling toll free 1 (800) 548-7786 or by visiting our website at www.morganstanley.com/im/shareholderreports. This information is also available on the SEC's website at www.sec.gov.
This report is authorized for distribution only when preceded or accompanied by a prospectus or summary prospectus of the applicable fund of Morgan Stanley Institutional Fund, Inc., which describes in detail the fund's investment policies, risks, fees and expenses. Please read the prospectus carefully before you invest or send money. For additional information, including information regarding the investments comprising the Fund, please visit our website at www.morganstanley.com/im/shareholderreports or call toll free 1 (800) 548-7786.
36
Printed in U.S.A.
This Report has been prepared for shareholders and may be distributed to others only if preceded or accompanied by a current prospectus.
Morgan Stanley Investment Management Inc.
522 Fifth Avenue
New York, New York 10036
© 2020 Morgan Stanley. Morgan Stanley Distribution, Inc.

IFIUSREAANN
2920683 EXP. 02.28.21

Morgan Stanley Institutional Fund, Inc.
Frontier Markets Portfolio
Annual Report
December 31, 2019
Beginning on January 1, 2021, as permitted by regulations adopted by the Securities and Exchange Commission ("SEC"), paper copies of the Fund's Annual and Semi-Annual Reports to Shareholders ("Shareholder Reports") will no longer be sent by mail, unless you specifically request paper copies of the Shareholder Reports from the Fund or from your financial intermediary, such as a broker-dealer or a bank. Instead, the Shareholder Reports will be made available on the Fund's website, https://www.morganstanley.com/im/shareholderreports and you will be notified by mail each time a Shareholder Report is posted and provided with a website link to access the Shareholder Report. If you already elected to receive Shareholder Reports electronically, you will not be affected by this change and you need not take any action. You may elect to receive Shareholder Reports and other communications from the Fund electronically anytime by contacting your financial intermediary or, if you are a direct investor, please follow the instructions on the envelope.
Beginning on January 1, 2019, you may elect to receive all future Shareholder Reports in paper free of charge. If you invest through a financial intermediary, you can contact your financial intermediary to request that you continue to receive paper copies of your Shareholder Reports. If you invest directly with the Fund, please follow the instructions on the envelope to let the Fund know you wish to continue receiving paper copies of your Shareholder Reports. Your election to receive Shareholder Reports in paper will apply to all funds held in your account if you invest through your financial intermediary or all funds held with the fund complex if you invest directly with a fund.

Morgan Stanley Institutional Fund, Inc.
Annual Report — December 31, 2019
Shareholders' Letter | | | 2 | | |
Expense Example | | | 3 | | |
Investment Overview | | | 4 | | |
Portfolio of Investments | | | 7 | | |
Statement of Assets and Liabilities | | | 9 | | |
Statement of Operations | | | 11 | | |
Statements of Changes in Net Assets | | | 12 | | |
Financial Highlights | | | 14 | | |
Notes to Financial Statements | | | 19 | | |
Report of Independent Registered Public Accounting Firm | | | 26 | | |
Federal Tax Notice | | | 27 | | |
Privacy Notice | | | 28 | | |
Director and Officer Information | | | 30 | | |
This report is authorized for distribution only when preceded or accompanied by a prospectus or summary prospectus of the applicable Fund of Morgan Stanley Institutional Fund, Inc. To receive a prospectus and/or statement of additional information ("SAI"), which contains more complete information such as investment objectives, charges, expenses, policies for voting proxies, risk considerations and describes in detail each of the Fund's investment policies to the prospective investor, please call toll free 1 (800) 548-7786. Please read the prospectuses carefully before you invest or send money.
Additionally, you can access information about the Fund, including performance, characteristics and investment team commentary, through Morgan Stanley Investment Management's website: www.morganstanley.com/im/shareholderreports.
Market forecasts provided in this report may not necessarily come to pass. There is no guarantee that any sectors mentioned will continue to perform as discussed herein or that securities in such sectors will be held by the Fund in the future. There is no assurance that a fund will achieve its investment objective. Funds are subject to market risk, which is the possibility that market values of securities owned by the Fund will decline and, therefore, the value of the Fund's shares may be less than what you paid for them. Accordingly, you can lose money investing in this Fund. Please see the prospectus for more complete information on investment risks.
1
Morgan Stanley Institutional Fund, Inc.
Annual Report — December 31, 2019
Shareholders' Letter (unaudited)
Dear Shareholders,
We are pleased to provide this Annual Report, in which you will learn how your investment in Frontier Markets Portfolio (the "Fund") performed during the latest twelve-month period.
Morgan Stanley Investment Management is a client-centric, investor-led organization. Our global presence, intellectual capital, and breadth of products and services enable us to partner with investors to meet the evolving challenges of today's financial markets. We aim to deliver superior investment service and to empower our clients to make the informed decisions that help them reach their investment goals.
As always, we thank you for selecting Morgan Stanley Investment Management, and look forward to working with you in the months and years ahead.
Sincerely,

John H. Gernon
President and Principal Executive Officer
January 2020
2
Morgan Stanley Institutional Fund, Inc.
Annual Report — December 31, 2019
Expense Example (unaudited)
Frontier Markets Portfolio
As a shareholder of the Fund, you incur two types of costs: (1) transactional costs, including redemption fees; and (2) ongoing costs, which may include advisory fees, administration fees, distribution and shareholder services fees and other Fund expenses. This example is intended to help you understand your ongoing costs (in dollars) of investing in the Fund and to compare these costs with the ongoing costs of investing in other mutual funds.
This example is based on an investment of $1,000 invested at the beginning of the six-month period ended December 31, 2019 and held for the entire six-month period.
Actual Expenses
The table below provides information about actual account values and actual expenses. You may use the information in this table, together with the amount you invested, to estimate the expenses that you paid over the period. Simply divide your account value by $1,000 (for example, an $8,600 account value divided by $1,000 = 8.6), then multiply the result by the number in the table under the heading entitled "Actual Expenses Paid During Period" to estimate the expenses you paid on your account during this period.
Hypothetical Example for Comparison Purposes
The table below provides information about hypothetical account values and hypothetical expenses based on the Fund's actual expense ratio and an assumed rate of return of 5% per year before expenses, which is not the Fund's actual return. The hypothetical account values and expenses may not be used to estimate the actual ending account balance or expenses you paid for the period. You may use this information to compare the ongoing costs of investing in the Fund and other funds. To do so, compare this 5% hypothetical example with the 5% hypothetical examples that appear in the shareholder reports of the other funds.
Please note that the expenses shown in the table are meant to highlight your ongoing costs only and do not reflect any transactional costs, such as sales charges (loads) and redemption fees. Therefore, the information for each class in the table is useful in comparing ongoing costs only, and will not help you determine the relative total costs of owning different funds. In addition, if these transactional costs were included, your costs would have been higher.
| | | Beginning
Account
Value
7/1/19 | | Actual Ending
Account
Value
12/31/19 | | Hypothetical
Ending Account
Value | | Actual
Expenses
Paid
During
Period* | | Hypothetical
Expenses Paid
During Period* | | Net
Expense
Ratio
During
Period** | |
Frontier Markets Portfolio Class I | | $ | 1,000.00 | | | $ | 1,000.50 | | | $ | 1,015.88 | | | $ | 9.33 | | | $ | 9.40 | | | | 1.85 | % | |
Frontier Markets Portfolio Class A | | | 1,000.00 | | | | 999.10 | | | | 1,014.12 | | | | 11.09 | | | | 11.17 | | | | 2.20 | | |
Frontier Markets Portfolio Class L | | | 1,000.00 | | | | 996.90 | | | | 1,011.59 | | | | 13.59 | | | | 13.69 | | | | 2.70 | | |
Frontier Markets Portfolio Class C | | | 1,000.00 | | | | 995.70 | | | | 1,010.33 | | | | 14.84 | | | | 14.95 | | | | 2.95 | | |
Frontier Markets Portfolio Class IS | | | 1,000.00 | | | | 1,001.20 | | | | 1,016.13 | | | | 9.08 | | | | 9.15 | | | | 1.80 | | |
* Expenses are calculated using each Fund Class' annualized net expense ratio (as disclosed), multiplied by the average account value over the period and multiplied by 184/365 (to reflect the most recent one-half year period).
** Annualized.
3
Morgan Stanley Institutional Fund, Inc.
Annual Report — December 31, 2019
Investment Overview (unaudited)
Frontier Markets Portfolio
The Fund seeks long-term capital appreciation.
Performance
For the fiscal year ended December 31, 2019, the Fund's Class I shares had a total return based on net asset value and reinvestment of distributions per share of 12.53%, net of fees. The Fund's Class I shares underperformed the Fund's benchmark, the MSCI Frontier Markets Net Index (the "Index"), which returned 17.99%.
Factors Affecting Performance
• The Index (+17.99%) slightly underperformed the MSCI Emerging Markets Index (+18.42%) in the 12-month period ended December 31, 2019, despite frontier markets outperforming emerging markets through the end of November 2019 (with the Index returning +13.08% through November 30, 2019, versus +10.20% for the MSCI Emerging Markets Index). Within the Index, Bahrain (+60.97%), Kenya (+48.73%), Romania (+44.02%), Egypt (+41.75%) and Kuwait (+35.80%) led market returns. Lebanon (–45.85%) was the worst-performing market as the country continues to suffer from political and financial instability. Argentina (–20.83%) also underperformed the region as markets reacted negatively in August to the surprise primary election victory of the Alberto Fernandez/Cristina Fernandez de Kirchner ticket over incumbent President Mauricio Macri.
• The Fund's zero allocation to Lebanon was the largest contributor to returns. Although the Index includes Lebanon, the Fund has not been invested there as it is an illiquid market and the country continues to be impacted by an economic crisis.
• The Fund's allocations to a U.A.E.-based payments processing firm and a Southeast Asian e-commerce and gaming company also contributed strongly. An allocation to a Latin American digital payments and e-commerce company also added to returns.
• The Fund's stock selection in and overweight allocation to Romania added to returns, driven by our overweight to a retail and commercial bank. We continue to believe the banking sector in Romania appears strong with low non-performing loans, strong capital ratios, low loan-to-deposit ratios and no credit cycle. The Fund's overweight allocation to Egypt also contributed as the economy is emerging from a difficult period of reforms. We believe
additional rate cuts by Egypt's central bank are likely to unlock greater investment potential.
• The Fund's stock selection in and underweight allocation to Kuwait was the biggest detractor from returns during the year, as the market and passive flows rallied leading up to the MSCI announcement in mid-December 2019 that Kuwait would be reclassified to emerging markets status. We believe solid, quality growth companies are in limited supply in Kuwait, and the market has grown to make up 38% of the Index.(i)
• The Fund's zero allocation to Bahrain also negatively impacted returns, driven by a rally of two banks after their merger was announced. The Fund has not been invested in Bahrain because it remains dependent on the Gulf Cooperation Council and suffers from weak macro fundamentals. The Fund's overweight allocation to Nigeria detracted as the market had been disappointed by the re-appointment of the central bank governor, the slow process of cabinet nominations and weak jumpstart of the economy by President Buhari.
Management Strategies
• With the turn of a new decade, we believe frontier markets are poised for a period of strong performance. The last decade was the worst for emerging markets equities since the 1930s, with the average annual gain for emerging stock market returns near zero compared to the outperformance of the U.S. equity market. Sentiment for emerging and frontier markets is at a low, and we believe there are significant investment opportunities in frontier markets as they are well positioned for a comeback.
• Frontier markets in aggregate are expected to see higher gross domestic product (GDP) growth than emerging and developed markets in the coming years. GDP growth in frontier countries is expected to be 3.5% in 2020, compared to 2.8% in emerging markets excluding China and 1.5% in developed markets, with similar numbers expected in 2021.(ii) Working-age population growth, which is a key input to productivity, and therefore growth, is also projected to be much stronger in frontier markets than in emerging and developed markets.
(i) Source: MSCI, as of December 31, 2019.
(ii) Source: International Monetary Fund, Bloomberg L.P., Haver Analytics, MSCI, as of December 2019.
4
Morgan Stanley Institutional Fund, Inc.
Annual Report — December 31, 2019
Investment Overview (unaudited) (cont'd)
Frontier Markets Portfolio
• As an asset class, frontier market equities continue to offer valuable diversification benefits with a strong risk-reward profile, partly due to their low correlation to emerging and developed markets. In a world marked by elevated correlations, frontier market equities have a low correlation to developed markets (0.18 versus a correlation coefficient of 0.69 between emerging and developed markets) and a similarly low correlation to emerging markets.(iii) Frontier markets are also less exposed to China — as measured by the level of exports — and thus should be relatively insulated from concerns of a China slowdown and trade war. In fact, select markets like Vietnam, Bangladesh and small emerging markets like the Philippines may benefit from trade tensions as manufacturers look to relocate.
• Despite the higher growth potential and lower correlation of frontier markets, their equities are currently trading at a 10% discount to emerging market equities.iii
• In the portfolio, we continue to invest in select structural growth themes, including local brands and aggregators, the shift from informal to formal segmentation, and companies benefiting from the "big waves" of innovation, particularly in the e-commerce and digital payments segments.
• We remain overweight Egypt as we believe it is one of the strongest reform stories in emerging and frontier markets. Key reforms have been on the fiscal front with the government cutting fuel subsidies, and both lower subsidies and improved tax collection have pushed the fiscal balance to a primary surplus. Investment into energy has helped drive growth while increased gas production has supported the trade balance. The consumer has been weaker than expected, though there are signs that this is beginning to turn. We continue to like the banking sector in Egypt. Additional central bank rate cuts are expected in 2020, which we believe could help guide stronger loan growth for the next two to three years.
• We continue to like Kenya. The interest rate cap was lifted in November 2019 as Kenya's parliament agreed to remove the limit originally put in place in 2016. We had increased our allocation to Kenya in 2019 with the view that the rate caps on the banking system were likely to be removed. Given private credit growth had slowed to low single digits when the rate cap was in place, our view remains that credit growth should not pick up as there is ample pent-up demand. Further, there should be room for more accommodative monetary policy given that the Monetary Policy Committee was reluctant to adjust rates due to the perverse effects of rate caps and the very low inflation levels.
(iii) Source: FactSet, MSCI, as of December 2019.

* Minimum Investment for Class I shares
** Performance shown for the Fund's Class I shares reflects the performance of the common shares of Morgan Stanley Frontier Emerging Markets Fund, Inc. (the "Predecessor Fund") for periods prior to September 17, 2012.
In accordance with SEC regulations, the Fund's performance shown assumes that all recurring fees (including management fees) were deducted and all dividends and distributions were reinvested. The performance of Class A, L, C and IS shares will vary from the performance of Class I shares based upon their different inception dates and will be negatively impacted by additional fees assessed to those classes (if applicable).
5
Morgan Stanley Institutional Fund, Inc.
Annual Report — December 31, 2019
Investment Overview (unaudited) (cont'd)
Frontier Markets Portfolio
Performance Compared to the MSCI Frontier Markets Net Index(1) and the Lipper Frontier Markets Funds Average(2)
| | | Period Ended December 31, 2019
Total Returns(3) | |
| | | | | Average Annual | |
| | | One
Year | | Five
Years | | Ten
Years | | Since
Inception(8) | |
Fund — Class I Shares
w/o sales charges(4) | | | 12.53 | % | | | –0.47 | % | | | 4.77 | % | | | 0.60 | % | |
Fund — Class A Shares
w/o sales charges(5) | | | 12.13 | | | | –0.79 | | | | — | | | | 4.47 | | |
Fund — Class A Shares with
maximum 5.25% sales charges(5) | | | 6.21 | | | | –1.86 | | | | — | | | | 3.70 | | |
Fund — Class L Shares
w/o sales charges(5) | | | 11.58 | | | | –1.39 | | | | — | | | | 3.85 | | |
Fund — Class C Shares
w/o sales charges(7) | | | 11.34 | | | | — | | | | — | | | | –2.27 | | |
Fund — Class C Shares with
maximum 1.00% deferred
sales charges(7) | | | 10.34 | | | | — | | | | — | | | | –2.27 | | |
Fund — Class IS Shares
w/o sales charges(6) | | | 12.60 | | | | — | | | | — | | | | –0.59 | | |
MSCI Frontier Markets
Net Index | | | 17.99 | | | | 2.69 | | | | 5.34 | | | | –0.34 | | |
Lipper Frontier Markets
Funds Average | | | 12.47 | | | | 0.36 | | | | 1.24 | | | | 0.24 | | |
Performance data quoted represents past performance, which is no guarantee of future results, and current performance may be lower or higher than the figures shown. Performance assumes that all dividends and distributions, if any, were reinvested. For the most recent month-end performance figures, please visit www.morganstanley.com/im/shareholderreports. Investment return and principal value will fluctuate so that Fund shares, when redeemed, may be worth more or less than their original cost. Total returns do not reflect the deduction of taxes that a shareholder would pay on Fund distributions or the redemption of Fund shares. Performance of share classes will vary due to difference in sales charges and expenses.
(1) The MSCI Frontier Markets Net Index is a free float-adjusted market capitalization index that is designed to measure equity market performance of frontier markets. The MSCI Frontier Markets Net Index currently consists of 28 frontier market country indices. The performance of the Index is calculated in U.S. dollars and assumes reinvestment of net dividends. Net total return indices reinvest dividends after the deduction of withholding taxes, using (for international indices) a tax rate applicable to non-resident institutional investors who do not benefit from double taxation treaties. The Index is unmanaged and its returns do not include any sales charges or fees. Such costs would lower performance. It is not possible to invest directly in an index.
(2) The Lipper Frontier Markets Funds Average tracks the performance of all funds in the Lipper Frontier Markets Funds classification. The Average, which is adjusted for capital gains distributions and income dividends, is unmanaged and should not be considered an investment. As of the date of this report, the Fund was in the Lipper Frontier Markets Funds classification.
(3) Total returns for the Fund reflect fees waived and expenses reimbursed, if applicable, by the Adviser (as defined herein). Without such waivers and reimbursements, total returns would have been lower.
(4) On September 17, 2012, all assets of Morgan Stanley Frontier Emerging Markets Fund, Inc. (the "Predecessor Fund") were reorganized into Class I shares of Morgan Stanley Institutional Fund, Inc. Frontier Markets Portfolio ("the Fund"). Performance shown for Class I shares reflects the performance of the shares of the Predecessor Fund for periods prior to September 17, 2012. The Predecessor Fund may have performed differently if it were an open-end fund since closed-end funds are generally not subject to the cash flow fluctuations of an open-end fund. In addition, Class I shares' returns of the Fund will differ from the Predecessor Fund as they have different expenses. The Predecessor Fund commenced operations on August 25, 2008.
(5) Commenced offering on September 14, 2012.
(6) Commenced offering on February 27, 2015.
(7) Commenced offering on April 30, 2015.
(8) For comparative purposes, average annual since inception returns listed for the Indexes refer to the inception date of Class I of the Fund, not the inception of the Index.
6
Morgan Stanley Institutional Fund, Inc.
Annual Report — December 31, 2019
Portfolio of Investments
Frontier Markets Portfolio
| | | Shares | | Value
(000) | |
Common Stocks (99.9%) | |
Argentina (1.0%) | |
Globant SA (a) | | | 12,934 | | | $ | 1,372 | | |
Bangladesh (1.6%) | |
Brac Bank Ltd. (a) | | | 422,364 | | | | 284 | | |
GrameenPhone Ltd. | | | 547,414 | | | | 1,842 | | |
Square Pharmaceuticals Ltd. | | | 70,331 | | | | 157 | | |
| | | | 2,283 | | |
Egypt (6.9%) | |
Cleopatra Hospital (a) | | | 5,113,215 | | | | 1,854 | | |
Commercial International Bank Egypt SAE | | | 992,794 | | | | 5,134 | | |
Egyptian Financial Group-Hermes Holding Co. | | | 2,563,871 | | | | 2,678 | | |
| | | | 9,666 | | |
Indonesia (1.4%) | |
Mitra Adiperkasa Tbk PT | | | 25,885,600 | | | | 1,967 | | |
Kazakhstan (1.9%) | |
NAC Kazatomprom JSC GDR (LSE) | | | 98,829 | | | | 1,285 | | |
NAC Kazatomprom JSC GDR (LSE) | | | 110,053 | | | | 1,430 | | |
| | | | 2,715 | | |
Kenya (9.1%) | |
KCB Group Ltd. | | | 9,412,049 | | | | 5,015 | | |
Safaricom PLC | | | 24,845,010 | | | | 7,746 | | |
| | | | 12,761 | | |
Kuwait (21.9%) | |
Boubyan Bank KSCP | | | 1,844,239 | | | | 3,899 | | |
Humansoft Holding Co. KSC | | | 295,428 | | | | 2,935 | | |
Mobile Telecommunications Co. KSC | | | 2,612,894 | | | | 5,171 | | |
National Bank of Kuwait | | | 5,337,821 | | | | 18,837 | | |
| | | | 30,842 | | |
Morocco (4.9%) | |
Attijariwafa Bank | | | 42,173 | | | | 2,200 | | |
Label Vie | | | 7,102 | | | | 1,992 | | |
Maroc Telecom | | | 32,107 | | | | 514 | | |
Societe d'Exploitation des Ports | | | 98,201 | | | | 2,125 | | |
| | | | 6,831 | | |
Nigeria (4.5%) | |
Guaranty Trust Bank PLC | | | 33,213,326 | | | | 2,658 | | |
MTN Nigeria Communications PLC | | | 2,108,022 | | | | 610 | | |
Nestle Nigeria PLC | | | 809,692 | | | | 3,119 | | |
| | | | 6,387 | | |
Oman (2.0%) | |
Bank Muscat SAOG | | | 2,549,386 | | | | 2,873 | | |
Pakistan (2.1%) | |
MCB Bank Ltd. | | | 2,151,769 | | | | 2,932 | | |
Philippines (2.5%) | |
Puregold Price Club, Inc. | | | 1,551,400 | | | | 1,216 | | |
Security Bank Corp. | | | 608,660 | | | | 2,342 | | |
| | | | 3,558 | | |
Poland (1.1%) | |
CD Projekt SA | | | 21,478 | | | | 1,584 | | |
| | | Shares | | Value
(000) | |
Romania (8.4%) | |
Banca Transilvania SA | | | 9,513,428 | | | $ | 5,785 | | |
BRD-Groupe Societe Generale SA | | | 872,064 | | | | 3,237 | | |
Societatea Nationala de Gaze Naturale
Romgaz SA | | | 315,930 | | | | 2,746 | | |
| | | | 11,768 | | |
Russia (2.0%) | |
HeadHunter Group PLC ADR | | | 132,784 | | | | 2,848 | | |
Saudi Arabia (4.5%) | |
Bupa Arabia for Cooperative Insurance Co. | | | 53,357 | | | | 1,456 | | |
Leejam Sports Co., JSC | | | 65,804 | | | | 1,423 | | |
Saudi British Bank (The) | | | 153,606 | | | | 1,421 | | |
United Electronics Co. | | | 101,850 | | | | 2,034 | | |
| | | | 6,334 | | |
Singapore (3.3%) | |
Sea Ltd. ADR (a) | | | 116,747 | | | | 4,696 | | |
Tanzania, United Republic of (0.7%) | |
NMB Bank PLC (a)(b) | | | 6,718,721 | | | | 920 | | |
United Arab Emirates (3.3%) | |
Network International Holdings PLC (a) | | | 555,631 | | | | 4,718 | | |
United Kingdom (1.3%) | |
Avast PLC | | | 306,075 | | | | 1,836 | | |
United States (3.3%) | |
MercadoLibre, Inc. (a) | | | 8,031 | | | | 4,593 | | |
Vietnam (12.2%) | |
Bank for Foreign Trade of Vietnam JSC | | | 1,130,720 | | | | 4,401 | | |
FPT Corp. | | | 404,820 | | | | 1,115 | | |
Mobile World Investment Corp. | | | 619,463 | | | | 3,371 | | |
PetroVietnam Power Corp (a) | | | 2,655,240 | | | | 1,312 | | |
Sai Gon Cargo Service Corp. | | | 287,020 | | | | 1,486 | | |
Saigon Beer Alcohol Beverage Corp. | | | 211,760 | | | | 2,084 | | |
Vincom Retail JSC | | | 2,346,253 | | | | 3,442 | | |
| | | | 17,211 | | |
Total Investments (99.9%) (Cost $114,567) (c)(d) | | | 140,695 | | |
Other Assets in Excess of Liabilities (0.1%) | | | 156 | | |
Net Assets (100.0%) | | $ | 140,851 | | |
Country assignments and aggregations are based generally on third party vendor classifications and information, and may be different from the assignments and aggregations under the policies set forth in the Fund's prospectus and/or statement of additional information relating to geographic classifications.
(a) Non-income producing security.
(b) At December 31, 2019, the Fund held a fair valued security valued at approximately $920,000, representing 0.7% of net assets. This security has been fair valued as determined in good faith under procedures established by and under the general supervision of the Company's (as defined herein) Directors.
(c) The approximate fair value and percentage of net assets, $21,160,000 and 15.0%, respectively, represent the securities that have been fair valued under the fair valuation policy for international investments as described in Note A-1 within the Notes to the Financial Statements.
The accompanying notes are an integral part of the financial statements.
7
Morgan Stanley Institutional Fund, Inc.
Annual Report — December 31, 2019
Portfolio of Investments (cont'd)
Frontier Markets Portfolio
(d) At December 31, 2019, the aggregate cost for federal income tax purposes is approximately $115,697,000. The aggregate gross unrealized appreciation is approximately $33,154,000 and the aggregate gross unrealized depreciation is approximately $8,156,000, resulting in net unrealized appreciation of approximately $24,998,000.
ADR American Depositary Receipt.
GDR Global Depositary Receipt.
LSE London Stock Exchange.
Portfolio Composition
Classification | | Percentage of
Total Investments | |
Other* | | | 45.1 | % | |
Banks | | | 44.0 | | |
Wireless Telecommunication Services | | | 10.9 | | |
Total Investments | | | 100.0 | % | |
* Industries and/or investment types representing less than 5% of total investments.
The accompanying notes are an integral part of the financial statements.
8
Morgan Stanley Institutional Fund, Inc.
Annual Report — December 31, 2019
Frontier Markets Portfolio
Statement of Assets and Liabilities | | December 31, 2019
(000) | |
Assets: | |
Investments in Securities of Unaffiliated Issuers, at Value (Cost $114,567) | | $ | 140,695 | | |
Foreign Currency, at Value (Cost $2,879) | | | 2,879 | | |
Receivable for Investments Sold | | | 4,780 | | |
Receivable for Fund Shares Sold | | | 193 | | |
Dividends Receivable | | | 85 | | |
Receivable from Affiliate | | | 1 | | |
Other Assets | | | 56 | | |
Total Assets | | | 148,689 | | |
Liabilities: | |
Payable for Investments Purchased | | | 4,081 | | |
Bank Overdraft | | | 2,217 | | |
Payable for Advisory Fees | | | 617 | | |
Payable for Fund Shares Redeemed | | | 602 | | |
Payable for Custodian Fees | | | 178 | | |
Payable for Professional Fees | | | 63 | | |
Payable for Sub Transfer Agency Fees — Class I | | | 17 | | |
Payable for Sub Transfer Agency Fees — Class A | | | 2 | | |
Payable for Sub Transfer Agency Fees — Class L | | | — | @ | |
Payable for Sub Transfer Agency Fees — Class C | | | — | @ | |
Payable for Administration Fees | | | 10 | | |
Payable for Transfer Agency Fees — Class I | | | 5 | | |
Payable for Transfer Agency Fees — Class A | | | 1 | | |
Payable for Transfer Agency Fees — Class L | | | — | @ | |
Payable for Transfer Agency Fees — Class C | | | 1 | | |
Payable for Transfer Agency Fees — Class IS | | | 1 | | |
Payable for Shareholder Services Fees — Class A | | | 3 | | |
Payable for Distribution and Shareholder Services Fees — Class L | | | — | @ | |
Payable for Distribution and Shareholder Services Fees — Class C | | | 1 | | |
Other Liabilities | | | 39 | | |
Total Liabilities | | | 7,838 | | |
Net Assets | | $ | 140,851 | | |
Net Assets Consist of: | |
Paid-in-Capital | | $ | 198,685 | | |
Total Accumulated Loss | | | (57,834 | ) | |
Net Assets | | $ | 140,851 | | |
The accompanying notes are an integral part of the financial statements.
9
Morgan Stanley Institutional Fund, Inc.
Annual Report — December 31, 2019
Frontier Markets Portfolio
Statement of Assets and Liabilities (cont'd) | | December 31, 2019
(000) | |
CLASS I: | |
Net Assets | | $ | 125,780 | | |
| Shares Outstanding $0.001 par value shares of beneficial interest (unlimited shares authorized) (not in 000's) | | | 7,355,802 | | |
Net Asset Value, Offering and Redemption Price Per Share | | $ | 17.10 | | |
CLASS A: | |
Net Assets | | $ | 12,044 | | |
| Shares Outstanding $0.001 par value shares of beneficial interest (unlimited shares authorized) (not in 000's) | | | 702,430 | | |
Net Asset Value, Redemption Price Per Share | | $ | 17.15 | | |
Maximum Sales Load | | | 5.25 | % | |
Maximum Sales Charge | | $ | 0.95 | | |
Maximum Offering Price Per Share | | $ | 18.10 | | |
CLASS L: | |
Net Assets | | $ | 570 | | |
| Shares Outstanding $0.001 par value shares of beneficial interest (unlimited shares authorized) (not in 000's) | | | 33,312 | | |
Net Asset Value, Offering and Redemption Price Per Share | | $ | 17.11 | | |
CLASS C: | |
Net Assets | | $ | 877 | | |
| Shares Outstanding $0.001 par value shares of beneficial interest (unlimited shares authorized) (not in 000's) | | | 52,054 | | |
Net Asset Value, Offering and Redemption Price Per Share | | $ | 16.85 | | |
CLASS IS: | |
Net Assets | | $ | 1,580 | | |
| Shares Outstanding $0.001 par value shares of beneficial interest (unlimited shares authorized) (not in 000's) | | | 92,402 | | |
Net Asset Value, Offering and Redemption Price Per Share | | $ | 17.09 | | |
@ Amount is less than $500.
The accompanying notes are an integral part of the financial statements.
10
Morgan Stanley Institutional Fund, Inc.
Annual Report — December 31, 2019
Frontier Markets Portfolio
Statement of Operations | | Year Ended
December 31, 2019
(000) | |
Investment Income: | |
Dividends from Securities of Unaffiliated Issuers (Net of $492 of Foreign Taxes Withheld) | | $ | 8,475 | | |
Dividends from Security of Affiliated Issuer (Note G) | | | 14 | | |
Interest from Securities of Unaffiliated Issuers | | | 2 | | |
Total Investment Income | | | 8,491 | | |
Expenses: | |
Advisory Fees (Note B) | | | 2,478 | | |
Custodian Fees (Note F) | | | 607 | | |
Sub Transfer Agency Fees — Class I | | | 149 | | |
Sub Transfer Agency Fees — Class A | | | 38 | | |
Sub Transfer Agency Fees — Class L | | | 1 | | |
Sub Transfer Agency Fees — Class C | | | 1 | | |
Professional Fees | | | 177 | | |
Administration Fees (Note C) | | | 159 | | |
Registration Fees | | | 87 | | |
Shareholder Services Fees — Class A (Note D) | | | 65 | | |
Distribution and Shareholder Services Fees — Class L (Note D) | | | 6 | | |
Distribution and Shareholder Services Fees — Class C (Note D) | | | 14 | | |
Shareholder Reporting Fees | | | 29 | | |
Transfer Agency Fees — Class I (Note E) | | | 17 | | |
Transfer Agency Fees — Class A (Note E) | | | 4 | | |
Transfer Agency Fees — Class L (Note E) | | | 2 | | |
Transfer Agency Fees — Class C (Note E) | | | 2 | | |
Transfer Agency Fees — Class IS (Note E) | | | 2 | | |
Directors' Fees and Expenses | | | 17 | | |
Pricing Fees | | | 4 | | |
Other Expenses | | | 43 | | |
Expenses Before Non Operating Expenses | | | 3,902 | | |
Bank Overdraft Expense | | | 91 | | |
Total Expenses | | | 3,993 | | |
Reimbursement of Class Specific Expenses — Class I (Note B) | | | (82 | ) | |
Reimbursement of Class Specific Expenses — Class A (Note B) | | | (2 | ) | |
Reimbursement of Class Specific Expenses — Class L (Note B) | | | (1 | ) | |
Reimbursement of Class Specific Expenses — Class C (Note B) | | | (1 | ) | |
Reimbursement of Class Specific Expenses — Class IS (Note B) | | | (2 | ) | |
Waiver of Advisory Fees (Note B) | | | (34 | ) | |
Rebate from Morgan Stanley Affiliate (Note G) | | | (1 | ) | |
Net Expenses | | | 3,870 | | |
Net Investment Income | | | 4,621 | | |
Realized Loss: | |
Investments Sold | | | (34 | ) | |
Foreign Currency Translation | | | (443 | ) | |
Net Realized Loss | | | (477 | ) | |
Change in Unrealized Appreciation (Depreciation): | |
Investments | | | 23,772 | | |
Foreign Currency Translation | | | (— | @) | |
Net Change in Unrealized Appreciation (Depreciation) | | | 23,772 | | |
Net Realized Loss and Change in Unrealized Appreciation (Depreciation) | | | 23,295 | | |
Net Increase in Net Assets Resulting from Operations | | $ | 27,916 | | |
@ Amount is less than $500.
The accompanying notes are an integral part of the financial statements.
11
Morgan Stanley Institutional Fund, Inc.
Annual Report — December 31, 2019
Frontier Markets Portfolio
Statements of Changes in Net Assets | | Year Ended
December 31, 2019
(000) | | Year Ended
December 31, 2018
(000) | |
Increase (Decrease) in Net Assets: | |
Operations: | |
Net Investment Income | | $ | 4,621 | | | $ | 9,740 | | |
Net Realized Loss | | | (477 | ) | | | (10,050 | ) | |
Net Change in Unrealized Appreciation (Depreciation) | | | 23,772 | | | | (135,947 | ) | |
Net Increase (Decrease) in Net Assets Resulting from Operations | | | 27,916 | | | | (136,257 | ) | |
Dividends and Distributions to Shareholders: | |
Class I | | | (3,717 | ) | | | (13,142 | ) | |
Class A | | | (261 | ) | | | (1,255 | ) | |
Class L | | | (10 | ) | | | (20 | ) | |
Class C | | | (21 | ) | | | (26 | ) | |
Class IS | | | (46 | ) | | | (190 | ) | |
Total Dividends and Distributions to Shareholders | | | (4,055 | ) | | | (14,633 | ) | |
Capital Share Transactions:(1) | |
Class I: | |
Subscribed | | | 18,572 | | | | 134,972 | | |
Distributions Reinvested | | | 3,144 | | | | 9,070 | | |
Redeemed | | | (145,539 | ) | | | (416,758 | ) | |
Class A: | |
Subscribed | | | 5,119 | | | | 21,353 | | |
Distributions Reinvested | | | 261 | | | | 1,253 | | |
Redeemed | | | (31,321 | ) | | | (59,351 | ) | |
Class L: | |
Exchanged | | | — | | | | 16 | | |
Distributions Reinvested | | | 10 | | | | 20 | | |
Redeemed | | | (780 | ) | | | (810 | ) | |
Class C: | |
Subscribed | | | 29 | | | | 207 | | |
Distributions Reinvested | | | 21 | | | | 25 | | |
Redeemed | | | (977 | ) | | | (818 | ) | |
Class IS: | |
Subscribed | | | 307 | | | | 21,329 | | |
Distributions Reinvested | | | 46 | | | | 190 | | |
Redeemed | | | (3,781 | ) | | | (28,473 | ) | |
Net Decrease in Net Assets Resulting from Capital Share Transactions | | | (154,889 | ) | | | (317,775 | ) | |
Redemption Fees | | | 6 | | | | 8 | | |
Total Decrease in Net Assets | | | (131,022 | ) | | | (468,657 | ) | |
Net Assets: | |
Beginning of Period | | | 271,873 | | | | 740,530 | | |
End of Period | | $ | 140,851 | | | $ | 271,873 | | |
The accompanying notes are an integral part of the financial statements.
12
Morgan Stanley Institutional Fund, Inc.
Annual Report — December 31, 2019
Frontier Markets Portfolio
Statements of Changes in Net Assets (cont'd) | | Year Ended
December 31, 2019
(000) | | Year Ended
December 31, 2018
(000) | |
(1) Capital Share Transactions: | |
Class I: | |
Shares Subscribed | | | 1,103 | | | | 6,991 | | |
Shares Issued on Distributions Reinvested | | | 184 | | | | 542 | | |
Shares Redeemed | | | (8,625 | ) | | | (22,923 | ) | |
Net Decrease in Class I Shares Outstanding | | | (7,338 | ) | | | (15,390 | ) | |
Class A: | |
Shares Subscribed | | | 299 | | | | 1,230 | | |
Shares Issued on Distributions Reinvested | | | 15 | | | | 75 | | |
Shares Redeemed | | | (1,832 | ) | | | (3,224 | ) | |
Net Decrease in Class A Shares Outstanding | | | (1,518 | ) | | | (1,919 | ) | |
Class L: | |
Shares Exchanged | | | — | | | | 1 | | |
Shares Issued on Distributions Reinvested | | | 1 | | | | 1 | | |
Shares Redeemed | | | (47 | ) | | | (47 | ) | |
Net Decrease in Class L Shares Outstanding | | | (46 | ) | | | (45 | ) | |
Class C: | |
Shares Subscribed | | | 2 | | | | 11 | | |
Shares Issued on Distributions Reinvested | | | 1 | | | | 2 | | |
Shares Redeemed | | | (59 | ) | | | (45 | ) | |
Net Decrease in Class C Shares Outstanding | | | (56 | ) | | | (32 | ) | |
Class IS: | |
Shares Subscribed | | | 18 | | | | 1,005 | | |
Shares Issued on Distributions Reinvested | | | 3 | | | | 11 | | |
Shares Redeemed | | | (225 | ) | | | (1,497 | ) | |
Net Decrease in Class IS Shares Outstanding | | | (204 | ) | | | (481 | ) | |
The accompanying notes are an integral part of the financial statements.
13
Morgan Stanley Institutional Fund, Inc.
Annual Report — December 31, 2019
Financial Highlights
Frontier Markets Portfolio
| | | Class I | |
| | | Year Ended December 31, | |
Selected Per Share Data and Ratios | | 2019 | | 2018 | | 2017 | | 2016(1) | | 2015 | |
Net Asset Value, Beginning of Period | | $ | 15.63 | | | $ | 21.02 | | | $ | 17.39 | | | $ | 16.98 | | | $ | 19.15 | | |
Income (Loss) from Investment Operations: | |
Net Investment Income(2) | | | 0.39 | | | | 0.33 | | | | 0.16 | | | | 0.31 | | | | 0.19 | | |
Net Realized and Unrealized Gain (Loss) | | | 1.58 | | | | (5.07 | ) | | | 3.47 | | | | 0.33 | | | | (2.21 | ) | |
Total from Investment Operations | | | 1.97 | | | | (4.74 | ) | | | 3.63 | | | | 0.64 | | | | (2.02 | ) | |
Distributions from and/or in Excess of: | |
Net Investment Income | | | (0.50 | ) | | | (0.65 | ) | | | — | | | | (0.23 | ) | | | (0.14 | ) | |
Paid-in-Capital | | | — | | | | — | | | | — | | | | (0.00 | )(3) | | | (0.01 | ) | |
Total Distributions | | | (0.50 | ) | | | (0.65 | ) | | | — | | | | (0.23 | ) | | | (0.15 | ) | |
Redemption Fees | | | 0.00 | (3) | | | 0.00 | (3) | | | 0.00 | (3) | | | 0.00 | (3) | | | 0.00 | (3) | |
Net Asset Value, End of Period | | $ | 17.10 | | | $ | 15.63 | | | $ | 21.02 | | | $ | 17.39 | | | $ | 16.98 | | |
Total Return(4) | | | 12.53 | % | | | (22.60 | )% | | | 20.82 | % | | | 3.83 | % | | | (10.58 | )% | |
Ratios to Average Net Assets and Supplemental Data: | |
Net Assets, End of Period (Thousands) | | $ | 125,780 | | | $ | 229,688 | | | $ | 632,435 | | | $ | 525,664 | | | $ | 531,927 | | |
Ratio of Expenses Before Expense Limitation | | | 1.92 | % | | | N/A | | | | N/A | | | | 1.69 | % | | | N/A | | |
Ratio of Expenses After Expense Limitation | | | 1.90 | %(5)(6) | | | 1.77 | %(5) | | | 1.73 | %(5) | | | 1.67 | %(5) | | | 1.72 | %(5) | |
Ratio of Expenses After Expense Limitation Excluding Non Operating Expenses | | | 1.85 | %(5) | | | 1.76 | %(5) | | | 1.73 | %(5) | | | N/A | | | | N/A | | |
Ratio of Net Investment Income | | | 2.33 | %(5) | | | 1.68 | %(5) | | | 0.82 | %(5) | | | 1.82 | %(5) | | | 1.02 | %(5) | |
Ratio of Rebate from Morgan Stanley Affiliates | | | 0.00 | %(7) | | | 0.00 | %(7) | | | 0.00 | %(7) | | | 0.00 | %(7) | | | 0.00 | %(7) | |
Portfolio Turnover Rate | | | 68 | % | | | 61 | % | | | 52 | % | | | 30 | % | | | 37 | % | |
(1) Reflects prior period custodian out-of-pocket expenses that were reimbursed in September 2016. The amount of the reimbursement was immaterial on a per share basis and did not impact the total return of Class I shares. The Ratio of Expenses After Expense Limitation would have been 0.01% higher and the Ratio of Net Investment Income would have been 0.01% lower had the custodian not reimbursed the Fund.
(2) Per share amount is based on average shares outstanding.
(3) Amount is less than $0.005 per share.
(4) Calculated based on the net asset value as of the last business day of the period.
(5) The Ratio of Expenses After Expense Limitation and Ratio of Net Investment Income reflect the rebate of certain Fund expenses in connection with the investments in Morgan Stanley affiliates during the period. The effect of the rebate on the ratios is disclosed in the above table as "Ratio of Rebate from Morgan Stanley Affiliates."
(6) Ratio is above the expense limitation due to non-operating expenses, which are not included in the determination of the expense limitation. Refer to Footnote B in the Notes to the Financial Statements.
(7) Amount is less than 0.005%.
The accompanying notes are an integral part of the financial statements.
14
Morgan Stanley Institutional Fund, Inc.
Annual Report — December 31, 2019
Financial Highlights
Frontier Markets Portfolio
| | | Class A | |
| | | Year Ended December 31, | |
Selected Per Share Data and Ratios | | 2019 | | 2018 | | 2017 | | 2016(1) | | 2015 | |
Net Asset Value, Beginning of Period | | $ | 15.61 | | | $ | 20.86 | | | $ | 17.31 | | | $ | 16.90 | | | $ | 19.06 | | |
Income (Loss) from Investment Operations: | |
Net Investment Income(2) | | | 0.42 | | | | 0.34 | | | | 0.11 | | | | 0.24 | | | | 0.11 | | |
Net Realized and Unrealized Gain (Loss) | | | 1.48 | | | | (5.10 | ) | | | 3.44 | | | | 0.35 | | | | (2.18 | ) | |
Total from Investment Operations | | | 1.90 | | | | (4.76 | ) | | | 3.55 | | | | 0.59 | | | | (2.07 | ) | |
Distributions from and/or in Excess of: | |
Net Investment Income | | | (0.36 | ) | | | (0.49 | ) | | | — | | | | (0.18 | ) | | | (0.08 | ) | |
Paid-in-Capital | | | — | | | | — | | | | — | | | | (0.00 | )(3) | | | (0.01 | ) | |
Total Distributions | | | (0.36 | ) | | | (0.49 | ) | | | — | | | | (0.18 | ) | | | (0.09 | ) | |
Redemption Fees | | | 0.00 | (3) | | | 0.00 | (3) | | | 0.00 | (3) | | | 0.00 | (3) | | | 0.00 | (3) | |
Net Asset Value, End of Period | | $ | 17.15 | | | $ | 15.61 | | | $ | 20.86 | | | $ | 17.31 | | | $ | 16.90 | | |
Total Return(4) | | | 12.13 | % | | | (22.80 | )% | | | 20.39 | % | | | 3.49 | % | | | (10.90 | )% | |
Ratios to Average Net Assets and Supplemental Data: | |
Net Assets, End of Period (Thousands) | | $ | 12,044 | | | $ | 34,654 | | | $ | 86,324 | | | $ | 90,817 | | | $ | 82,480 | | |
Ratio of Expenses Before Expense Limitation | | | 2.23 | % | | | N/A | | | | N/A | | | | 2.03 | % | | | N/A | | |
Ratio of Expenses After Expense Limitation | | | 2.25 | %(5)(6) | | | 2.07 | %(5) | | | 2.05 | %(5) | | | 2.01 | %(5) | | | 2.07 | %(5) | |
Ratio of Expenses After Expense Limitation Excluding Non Operating Expenses | | | 2.20 | %(5) | | | 2.06 | %(5) | | | 2.05 | %(5) | | | N/A | | | | N/A | | |
Ratio of Net Investment Income | | | 2.48 | %(5) | | | 1.71 | %(5) | | | 0.59 | %(5) | | | 1.40 | %(5) | | | 0.60 | %(5) | |
Ratio of Rebate from Morgan Stanley Affiliates | | | 0.00 | %(7) | | | 0.00 | %(7) | | | 0.00 | %(7) | | | 0.00 | %(7) | | | 0.00 | %(7) | |
Portfolio Turnover Rate | | | 68 | % | | | 61 | % | | | 52 | % | | | 30 | % | | | 37 | % | |
(1) Reflects prior period custodian out-of-pocket expenses that were reimbursed in September 2016. The amount of the reimbursement was immaterial on a per share basis and did not impact the total return of Class A shares. The Ratio of Expenses After Expense Limitation would have been 0.01% higher and the Ratio of Net Investment Income would have been 0.01% lower had the custodian not reimbursed the Fund.
(2) Per share amount is based on average shares outstanding.
(3) Amount is less than $0.005 per share.
(4) Calculated based on the net asset value which does not reflect sales charges, if applicable, as of the last business day of the period.
(5) The Ratio of Expenses After Expense Limitation and Ratio of Net Investment Income reflect the rebate of certain Fund expenses in connection with the investments in Morgan Stanley affiliates during the period. The effect of the rebate on the ratios is disclosed in the above table as "Ratio of Rebate from Morgan Stanley Affiliates."
(6) Ratio is above the expense limitation due to non-operating expenses, which are not included in the determination of the expense limitation. Refer to Footnote B in the Notes to the Financial Statements.
(7) Amount is less than 0.005%.
The accompanying notes are an integral part of the financial statements.
15
Morgan Stanley Institutional Fund, Inc.
Annual Report — December 31, 2019
Financial Highlights
Frontier Markets Portfolio
| | | Class L | |
| | | Year Ended December 31, | |
Selected Per Share Data and Ratios | | 2019 | | 2018 | | 2017 | | 2016(1) | | 2015 | |
Net Asset Value, Beginning of Period | | $ | 15.59 | | | $ | 20.65 | | | $ | 17.25 | | | $ | 16.79 | | | $ | 18.96 | | |
Income (Loss) from Investment Operations: | |
Net Investment Income (Loss)(2) | | | 0.25 | | | | 0.17 | | | | (0.02 | ) | | | 0.15 | | | | 0.05 | | |
Net Realized and Unrealized Gain (Loss) | | | 1.56 | | | | (4.98 | ) | | | 3.42 | | | | 0.32 | | | | (2.22 | ) | |
Total from Investment Operations | | | 1.81 | | | | (4.81 | ) | | | 3.40 | | | | 0.47 | | | | (2.17 | ) | |
Distributions from and/or in Excess of: | |
Net Investment Income | | | (0.29 | ) | | | (0.25 | ) | | | — | | | | (0.01 | ) | | | — | | |
Paid-in-Capital | | | — | | | | — | | | | — | | | | (0.00 | )(3) | | | — | | |
Total Distributions | | | (0.29 | ) | | | (0.25 | ) | | | — | | | | (0.01 | ) | | | — | | |
Redemption Fees | | | 0.00 | (3) | | | 0.00 | (3) | | | 0.00 | (3) | | | 0.00 | (3) | | | 0.00 | (3) | |
Net Asset Value, End of Period | | $ | 17.11 | | | $ | 15.59 | | | $ | 20.65 | | | $ | 17.25 | | | $ | 16.79 | | |
Total Return(4) | | | 11.58 | % | | | (23.19 | )% | | | 19.59 | % | | | 2.77 | % | | | (11.49 | )% | |
Ratios to Average Net Assets and Supplemental Data: | |
Net Assets, End of Period (Thousands) | | $ | 570 | | | $ | 1,241 | | | $ | 2,570 | | | $ | 2,630 | | | $ | 4,490 | | |
Ratio of Expenses Before Expense Limitation | | | 2.90 | % | | | N/A | | | | 2.76 | % | | | 2.80 | % | | | 2.73 | % | |
Ratio of Expenses After Expense Limitation | | | 2.75 | %(5)(6) | | | 2.57 | %(5) | | | 2.70 | %(5) | | | 2.70 | %(5) | | | 2.70 | %(5) | |
Ratio of Expenses After Expense Limitation Excluding Non Operating Expenses | | | 2.70 | %(5) | | | 2.56 | %(5) | | | 2.70 | %(5) | | | N/A | | | | N/A | | |
Ratio of Net Investment Income (Loss) | | | 1.47 | %(5) | | | 0.88 | %(5) | | | (0.13 | )%(5) | | | 0.88 | %(5) | | | 0.26 | %(5) | |
Ratio of Rebate from Morgan Stanley Affiliates | | | 0.00 | %(7) | | | 0.00 | %(7) | | | 0.00 | %(7) | | | 0.00 | %(7) | | | 0.00 | %(7) | |
Portfolio Turnover Rate | | | 68 | % | | | 61 | % | | | 52 | % | | | 30 | % | | | 37 | % | |
(1) Reflects prior period custodian out-of-pocket expenses that were reimbursed in September 2016. The amount of the reimbursement was immaterial on a per share basis and did not impact the total return of Class L shares. The Ratio of Expenses After Expense Limitation and the Ratio of Net Investment Income would be unchanged as the reimbursement of custodian fees was offset against expense waivers/reimbursements with no impact to net expenses or net investment income.
(2) Per share amount is based on average shares outstanding.
(3) Amount is less than $0.005 per share.
(4) Calculated based on the net asset value as of the last business day of the period.
(5) The Ratio of Expenses After Expense Limitation and Ratio of Net Investment Income (Loss) reflect the rebate of certain Fund expenses in connection with the investments in Morgan Stanley affiliates during the period. The effect of the rebate on the ratios is disclosed in the above table as "Ratio of Rebate from Morgan Stanley Affiliates."
(6) Ratio is above the expense limitation due to non-operating expenses, which are not included in the determination of the expense limitation. Refer to Footnote B in the Notes to the Financial Statements.
(7) Amount is less than 0.005%.
The accompanying notes are an integral part of the financial statements.
16
Morgan Stanley Institutional Fund, Inc.
Annual Report — December 31, 2019
Financial Highlights
Frontier Markets Portfolio
| | | Class C | |
| | | Year Ended December 31, | | Period from
April 30, 2015(2) to | |
Selected Per Share Data and Ratios | | 2019 | | 2018 | | 2017 | | 2016(1) | | December 31, 2015 | |
Net Asset Value, Beginning of Period | | $ | 15.38 | | | $ | 20.41 | | | $ | 17.07 | | | $ | 16.69 | | | $ | 19.53 | | |
Income (Loss) from Investment Operations: | |
Net Investment Income (Loss)(3) | | | 0.20 | | | | 0.11 | | | | (0.05 | ) | | | 0.10 | | | | (0.16 | ) | |
Net Realized and Unrealized Gain (Loss) | | | 1.56 | | | | (4.90 | ) | | | 3.39 | | | | 0.34 | | | | (2.60 | ) | |
Total from Investment Operations | | | 1.76 | | | | (4.79 | ) | | | 3.34 | | | | 0.44 | | | | (2.76 | ) | |
Distributions from and/or in Excess of: | |
Net Investment Income | | | (0.29 | ) | | | (0.24 | ) | | | — | | | | (0.06 | ) | | | (0.07 | ) | |
Paid-in-Capital | | | — | | | | — | | | | — | | | | (0.00 | )(4) | | | (0.01 | ) | |
Total Distributions | | | (0.29 | ) | | | (0.24 | ) | | | — | | | | (0.06 | ) | | | (0.08 | ) | |
Redemption Fees | | | 0.00 | (4) | | | 0.00 | (4) | | | 0.00 | (4) | | | 0.00 | (4) | | | 0.00 | (4) | |
Net Asset Value, End of Period | | $ | 16.85 | | | $ | 15.38 | | | $ | 20.41 | | | $ | 17.07 | | | $ | 16.69 | | |
Total Return(5) | | | 11.34 | % | | | (23.42 | )% | | | 19.51 | % | | | 2.63 | % | | | (14.10 | )%(9) | |
Ratios to Average Net Assets and Supplemental Data: | |
Net Assets, End of Period (Thousands) | | $ | 877 | | | $ | 1,657 | | | $ | 2,857 | | | $ | 1,925 | | | $ | 1,400 | | |
Ratio of Expenses Before Expense Limitation | | | 3.07 | % | | | N/A | | | | N/A | | | | 2.89 | % | | | 3.17 | %(10) | |
Ratio of Expenses After Expense Limitation | | | 2.99 | %(6)(7) | | | 2.83 | %(6) | | | 2.81 | %(6) | | | 2.88 | %(6) | | | 2.95 | %(6)(10) | |
Ratio of Expenses After Expense Limitation Excluding Non Operating Expenses | | | 2.95 | %(6) | | | 2.82 | %(6) | | | 2.81 | %(6) | | | N/A | | | | N/A | | |
Ratio of Net Investment Income (Loss) | | | 1.17 | %(6) | | | 0.56 | %(6) | | | (0.26 | )%(6) | | | 0.57 | %(6) | | | (1.38 | )%(6)(10) | |
Ratio of Rebate from Morgan Stanley Affiliates | | | 0.00 | %(8) | | | 0.00 | %(8) | | | 0.00 | %(8) | | | 0.00 | %(8) | | | 0.00 | %(8)(10) | |
Portfolio Turnover Rate | | | 68 | % | | | 61 | % | | | 52 | % | | | 30 | % | | | 37 | % | |
(1) Reflects prior period custodian out-of-pocket expenses that were reimbursed in September 2016. The amount of the reimbursement was immaterial on a per share basis and did not impact the total return of Class C shares. The Ratio of Expenses After Expense Limitation would have been 0.01% higher and the Ratio of Net Investment Income would have been 0.01% lower had the custodian not reimbursed the Fund.
(2) Commencement of Offering.
(3) Per share amount is based on average shares outstanding.
(4) Amount is less than $0.005 per share.
(5) Calculated based on the net asset value which does not reflect sales charges, if applicable, as of the last business day of the period.
(6) The Ratio of Expenses After Expense Limitation and Ratio of Net Investment Income (Loss) reflect the rebate of certain Fund expenses in connection with the investments in Morgan Stanley affiliates during the period. The effect of the rebate on the ratios is disclosed in the above table as "Ratio of Rebate from Morgan Stanley Affiliates."
(7) Ratio is above the expense limitation due to non-operating expenses, which are not included in the determination of the expense limitation. Refer to Footnote B in the Notes to the Financial Statements.
(8) Amount is less than 0.005%.
(9) Not annualized.
(10) Annualized.
The accompanying notes are an integral part of the financial statements.
17
Morgan Stanley Institutional Fund, Inc.
Annual Report — December 31, 2019
Financial Highlights
Frontier Markets Portfolio
| | | Class IS | |
| | | Year Ended December 31, | | Period from
February 27, 2015(2) to | |
Selected Per Share Data and Ratios | | 2019 | | 2018 | | 2017 | | 2016(1) | | December 31, 2015 | |
Net Asset Value, Beginning of Period | | $ | 15.63 | | | $ | 21.02 | | | $ | 17.39 | | | $ | 16.97 | | | $ | 19.28 | | |
Income (Loss) from Investment Operations: | |
Net Investment Income(3) | | | 0.33 | | | | 0.58 | | | | 0.13 | | | | 0.30 | | | | 0.26 | | |
Net Realized and Unrealized Gain (Loss) | | | 1.64 | | | | (5.33 | ) | | | 3.50 | | | | 0.36 | | | | (2.41 | ) | |
Total from Investment Operations | | | 1.97 | | | | (4.75 | ) | | | 3.63 | | | | 0.66 | | | | (2.15 | ) | |
Distributions from and/or in Excess of: | |
Net Investment Income | | | (0.51 | ) | | | (0.64 | ) | | | — | | | | (0.24 | ) | | | (0.15 | ) | |
Paid-in-Capital | | | — | | | | — | | | | — | | | | (0.00 | )(4) | | | (0.01 | ) | |
Total Distributions | | | (0.51 | ) | | | (0.64 | ) | | | — | | | | (0.24 | ) | | | (0.16 | ) | |
Redemption Fees | | | 0.00 | (4) | | | 0.00 | (4) | | | 0.00 | (4) | | | 0.00 | (4) | | | 0.00 | (4) | |
Net Asset Value, End of Period | | $ | 17.09 | | | $ | 15.63 | | | $ | 21.02 | | | $ | 17.39 | | | $ | 16.97 | | |
Total Return(5) | | | 12.60 | % | | | (22.61 | )% | | | 20.83 | % | | | 3.88 | % | | | (11.14 | )%(9) | |
Ratios to Average Net Assets and Supplemental Data: | |
Net Assets, End of Period (Thousands) | | $ | 1,580 | | | $ | 4,633 | | | $ | 16,344 | | | $ | 12,055 | | | $ | 7,732 | | |
Ratio of Expenses Before Expense Limitation | | | 1.91 | % | | | N/A | | | | N/A | | | | 1.64 | % | | | 1.68 | %(10) | |
Ratio of Expenses After Expense Limitation | | | 1.85 | %(6)(7) | | | 1.74 | %(6) | | | 1.69 | %(6) | | | 1.62 | %(6) | | | 1.68 | %(6)(10) | |
Ratio of Expenses After Expense Limitation Excluding Non Operating Expenses | | | 1.80 | %(6) | | | 1.73 | %(6) | | | 1.69 | %(6) | | | N/A | | | | N/A | | |
Ratio of Net Investment Income | | | 1.95 | %(6) | | | 2.85 | %(6) | | | 0.65 | %(6) | | | 1.75 | %(6) | | | 1.67 | %(6)(10) | |
Ratio of Rebate from Morgan Stanley Affiliates | | | 0.00 | %(8) | | | 0.00 | %(8) | | | 0.00 | %(8) | | | 0.00 | %(8) | | | 0.00 | %(8)(10) | |
Portfolio Turnover Rate | | | 68 | % | | | 61 | % | | | 52 | % | | | 30 | % | | | 37 | % | |
(1) Reflects prior period custodian out-of-pocket expenses that were reimbursed in September 2016. The amount of the reimbursement was immaterial on a per share basis and did not impact the total return of Class IS shares. The Ratio of Expenses After Expense Limitation would have been 0.01% higher and the Ratio of Net Investment Income would have been 0.01% lower had the custodian not reimbursed the Fund.
(2) Commencement of Offering.
(3) Per share amount is based on average shares outstanding.
(4) Amount is less than $0.005 per share.
(5) Calculated based on the net asset value as of the last business day of the period.
(6) The Ratio of Expenses After Expense Limitation and Ratio of Net Investment Income reflect the rebate of certain Fund expenses in connection with the investments in Morgan Stanley affiliates during the period. The effect of the rebate on the ratios is disclosed in the above table as "Ratio of Rebate from Morgan Stanley Affiliates."
(7) Ratio is above the expense limitation due to non-operating expenses, which are not included in the determination of the expense limitation. Refer to Footnote B in the Notes to the Financial Statements.
(8) Amount is less than 0.005%.
(9) Not annualized.
(10) Annualized.
The accompanying notes are an integral part of the financial statements.
18
Morgan Stanley Institutional Fund, Inc.
Annual Report — December 31, 2019
Notes to Financial Statements
Morgan Stanley Institutional Fund, Inc. (the "Company") is registered under the Investment Company Act of 1940, as amended (the "Act"), as an open-end management investment company. The Company is comprised of thirty-two separate, active, diversified and non-diversified funds (individually referred to as a "Fund," collectively as the "Funds"). The Company applies investment company accounting and reporting guidance.
The accompanying financial statements relate to the Frontier Markets Portfolio. The Fund seeks long-term capital appreciation.
The Fund offers five classes of shares — Class I, Class A, Class L, Class C and Class IS. On April 30, 2015, the Fund suspended offering of Class L shares. Existing Class L shareholders may invest through reinvestment of dividends and distributions.
A. Significant Accounting Policies: The following significant accounting policies are in conformity with U.S. generally accepted accounting principles ("GAAP"). Such policies are consistently followed by the Company in the preparation of its financial statements. GAAP may require management to make estimates and assumptions that affect the reported amounts and disclosures in the financial statements. Actual results may differ from those estimates.
In August 2018, the Financial Accounting Standards Board ("FASB") issued Accounting Standards Update ("ASU") 2018-13, Fair Value Measurement (Topic 820) — Disclosures Framework — Changes to Disclosure Requirements of Fair Value Measurement ("ASU 2018-13") which introduces new fair value disclosure requirements as well as eliminates and modifies certain existing fair value disclosure requirements. ASU 2018-13 would be effective for fiscal years beginning after December 15, 2019 and for interim periods within those fiscal years; however, management has elected to early adopt ASU 2018-13 as permitted by the standard. The impact of the Fund's adoption was limited to changes in the Fund's financial statement disclosures regarding fair value, primarily those disclosures related to transfers between levels of the fair value hierarchy and disclosure of the range and weighted average used to develop significant unobservable inputs for Level 3 fair value measurements, when applicable.
1. Security Valuation: (1) An equity portfolio security listed or traded on an exchange is valued at its latest reported sales price (or at the exchange official closing price if such exchange reports an official closing price), and if
there were no sales on a given day and if there is no official exchange closing price for that day, the security is valued at the mean between the last reported bid and asked prices if such bid and asked prices are available on the relevant exchanges. If only bid prices are available then the latest bid price may be used. Listed equity securities not traded on the valuation date with no reported bid and asked prices available on the exchange are valued at the mean between the current bid and asked prices obtained from one or more reputable brokers or dealers. In cases where a security is traded on more than one exchange, the security is valued on the exchange designated as the primary market; (2) all other equity portfolio securities for which over-the-counter ("OTC") market quotations are readily available are valued at the latest reported sales price (or at the market official closing price if such market reports an official closing price), and if there was no trading in the security on a given day and if there is no official closing price from relevant markets for that day, the security is valued at the mean between the last reported bid and asked prices if such bid and asked prices are available on the relevant markets. An unlisted equity security that does not trade on the valuation date and for which bid and asked prices from the relevant markets are unavailable is valued at the mean between the current bid and asked prices obtained from one or more reputable brokers or dealers; (3) certain portfolio securities may be valued by an outside pricing service/vendor approved by the Company's Board of Directors (the "Directors"). The pricing service/vendor may employ a pricing model that takes into account, among other things, bids, yield spreads and/or other market data and specific security characteristics. Alternatively, if a valuation is not available from an outside pricing service/vendor, and the security trades on an exchange, the security may be valued at its latest reported sale price (or at the exchange official closing price if such exchange reports an official closing price), prior to the time when assets are valued. If there are no sales on a given day and if there is no official exchange closing price for that day, the security is valued at the mean between the last reported bid and asked prices if such bid and asked prices are available in the relevant exchanges. If Morgan Stanley Investment Management Inc. (the "Adviser"), a wholly-owned subsidiary of Morgan Stanley, determines that the price provided by the outside pricing service/vendor or exchange does not reflect the security's fair value or is unable to provide a price, prices from brokers or dealers may also be
19
Morgan Stanley Institutional Fund, Inc.
Annual Report — December 31, 2019
Notes to Financial Statements (cont'd)
utilized. In these circumstances, the value of the security will be the mean of bid and asked prices obtained from brokers or dealers; (4) when market quotations are not readily available, including circumstances under which the Adviser determines that the closing price, last sale price or the mean between the last reported bid and asked prices are not reflective of a security's market value, portfolio securities are valued at their fair value as determined in good faith under procedures established by and under the general supervision of the Directors. Occasionally, developments affecting the closing prices of securities and other assets may occur between the times at which valuations of such securities are determined (that is, close of the foreign market on which the securities trade) and the close of business of the New York Stock Exchange ("NYSE"). If developments occur during such periods that are expected to materially affect the value of such securities, such valuations may be adjusted to reflect the estimated fair value of such securities as of the close of the NYSE, as determined in good faith by the Directors or by the Adviser using a pricing service and/or procedures approved by the Directors; (5) quotations of foreign portfolio securities, other assets and liabilities and forward contracts stated in foreign currency are translated into U.S. dollar equivalents at the prevailing market rates prior to the close of the NYSE; and (6) investments in mutual funds, including the Morgan Stanley Institutional Liquidity Funds, are valued at the net asset value ("NAV") as of the close of each business day.
The Directors have responsibility for determining in good faith the fair value of the investments, and the Directors may appoint others, such as the Company's Adviser or a valuation committee, to assist the Directors in determining fair value and to make the actual calculations pursuant to the fair valuation methodologies previously approved by the Directors. Under procedures approved by the Directors, the Company's Adviser has formed a Valuation Committee whose members are approved by the Directors. The Valuation Committee provides administration and oversight of the Company's valuation policies and procedures, which are reviewed at least annually by the Directors. These procedures allow the Company to utilize independent pricing services, quotations from securities and financial instrument dealers and other market sources to determine fair value.
2. Fair Value Measurement: FASB Accounting Standards CodificationTM ("ASC") 820, "Fair Value Measurement" ("ASC 820"), defines fair value as the value that the Fund would receive to sell an investment or pay to transfer a liability in a timely transaction with an independent buyer in the principal market, or in the absence of a principal market, the most advantageous market for the investment or liability. ASC 820 establishes a three-tier hierarchy to distinguish between (1) inputs that reflect the assumptions market participants would use in valuing an asset or liability developed based on market data obtained from sources independent of the reporting entity (observable inputs) and (2) inputs that reflect the reporting entity's own assumptions about the assumptions market participants would use in valuing an asset or liability developed based on the best information available in the circumstances (unobservable inputs) and to establish classification of fair value measurements for disclosure purposes. Various inputs are used in determining the value of the Fund's investments. The inputs are summarized in the three broad levels listed below:
• Level 1 – unadjusted quoted prices in active markets for identical investments
• Level 2 – other significant observable inputs (including quoted prices for similar investments, interest rates, prepayment speeds, credit risk, etc.)
• Level 3 – significant unobservable inputs including the Fund's own assumptions in determining the fair value of investments. Factors considered in making this determination may include, but are not limited to, information obtained by contacting the issuer, analysts, or the appropriate stock exchange (for exchange-traded securities), analysis of the issuer's financial statements or other available documents and, if necessary, available information concerning other securities in similar circumstances.
The inputs or methodology used for valuing securities are not necessarily an indication of the risk associated with investing in those securities and the determination of the significance of a particular input to the fair value measurement in its entirety requires judgment and considers factors specific to each security.
20
Morgan Stanley Institutional Fund, Inc.
Annual Report — December 31, 2019
Notes to Financial Statements (cont'd)
The following is a summary of the inputs used to value the Fund's investments as of December 31, 2019:
Investment Type | | Level 1
Unadjusted
quoted
prices
(000) | | Level 2
Other
significant
observable
inputs
(000) | | Level 3
Significant
unobservable
inputs
(000) | | Total
(000) | |
Assets: | |
Common Stocks | |
Air Freight & Logistics | | $ | 1,486 | | | $ | — | | | $ | — | | | $ | 1,486 | | |
Banks | | | 49,370 | | | | 11,648 | | | | 920 | | | | 61,938 | | |
Beverages | | | 2,084 | | | | — | | | | — | | | | 2,084 | | |
Capital Markets | | | 2,678 | | | | — | | | | — | | | | 2,678 | | |
Diversified Consumer
Services | | | 2,935 | | | | — | | | | — | | | | 2,935 | | |
Diversified
Telecommunication
Services | | | 514 | | | | — | | | | — | | | | 514 | | |
Electronic Equipment,
Instruments &
Components | | | — | | | | 1,115 | | | | — | | | | 1,115 | | |
Entertainment | | | 4,696 | | | | 1,584 | | | | — | | | | 6,280 | | |
Food & Staples Retailing | | | 1,992 | | | | 1,216 | | | | — | | | | 3,208 | | |
Food Products | | | 3,119 | | | | — | | | | — | | | | 3,119 | | |
Health Care Providers &
Services | | | 1,854 | | | | — | | | | — | | | | 1,854 | | |
Hotels, Restaurants &
Leisure | | | 1,423 | | | | — | | | | — | | | | 1,423 | | |
Independent Power &
Renewable Electricity
Producers | | | 1,312 | | | | — | | | | — | | | | 1,312 | | |
Information Technology
Services | | | 4,718 | | | | — | | | | — | | | | 4,718 | | |
Insurance | | | 1,456 | | | | — | | | | — | | | | 1,456 | | |
Internet & Direct
Marketing Retail | | | 4,593 | | | | — | | | | — | | | | 4,593 | | |
Multi-Line Retail | | | — | | | | 1,967 | | | | — | | | | 1,967 | | |
Oil, Gas & Consumable
Fuels | | | 1,285 | | | | 4,176 | | | | — | | | | 5,461 | | |
Pharmaceuticals | | | — | | | | 157 | | | | — | | | | 157 | | |
Professional Services | | | 2,848 | | | | — | | | | — | | | | 2,848 | | |
Real Estate
Management &
Development | | | 3,442 | | | | — | | | | — | | | | 3,442 | | |
Investment Type | | Level 1
Unadjusted
quoted
prices
(000) | | Level 2
Other
significant
observable
inputs
(000) | | Level 3
Significant
unobservable
inputs
(000) | | Total
(000) | |
Software | | $ | 3,208 | | | $ | — | | | $ | — | | | $ | 3,208 | | |
Specialty Retail | | | 2,034 | | | | 3,371 | | | | — | | | | 5,405 | | |
Transportation
Infrastructure | | | 2,125 | | | | — | | | | — | | | | 2,125 | | |
Wireless
Telecommunication
Services | | | 13,527 | | | | 1,842 | | | | — | | | | 15,369 | | |
Total Common Stocks | | | 112,699 | | | | 27,076 | | | | 920 | | | | 140,695 | | |
Total Assets | | $ | 112,699 | | | $ | 27,076 | | | $ | 920 | | | $ | 140,695 | | |
Transfers between investment levels may occur as the markets fluctuate and/or the availability of data used in an investment's valuation changes.
Following is a reconciliation of investments in which significant unobservable inputs (Level 3) were used in determining fair value:
| | | Common
Stock
(000) | |
Beginning Balance | | $ | — | | |
Purchases | | | — | | |
Sales | | | — | | |
Amortization of discount | | | — | | |
Transfers in | | | 920 | | |
Transfers out | | | — | | |
Corporate actions | | | — | | |
Change in unrealized appreciation (depreciation) | | | — | | |
Realized gains (losses) | | | — | | |
Ending Balance | | $ | 920 | | |
Net change in unrealized appreciation (depreciation) from
investments still held as of December 31, 2019 | | $ | — | | |
The following table presents additional information about valuation techniques and inputs used for investments that are measured at fair value and categorized within Level 3 as of December 31, 2019. Various valuation techniques were used in the valuation of certain investments and weighted based on the level of significance. The Fund calculated the weighted averages of the unobservable inputs relative to each investment's fair value as of December 31, 2019.
| | | Fair Value at
December 31, 2019
(000) | | Valuation
Technique | | Unobservable
Input | | Amount* | | Impact to
Valuation from an
Increase in Input** | |
Common Stock | | $ | 920 | | | Market Comparable
Companies | | Price/Book
Value of Equity | | | 0.3 | x | | Increase | |
| |
| | | | Discount for Lack
of Marketability | | | 40.0 | % | | Decrease | |
* Amount is indicative of the weighted average.
** Represents the expected directional change in the fair value of the Level 3 investments that would result from an increase in the corresponding input. A decrease to the unobservable input would have the opposite effect. Significant changes in these inputs could result in significantly higher or lower fair value measurements.
21
Morgan Stanley Institutional Fund, Inc.
Annual Report — December 31, 2019
Notes to Financial Statements (cont'd)
3. Foreign Currency Translation and Foreign Investments: The books and records of the Fund are maintained in U.S. dollars. Foreign currency amounts are translated into U.S. dollars as follows:
– investments, other assets and liabilities at the prevailing rate of exchange on the valuation date;
– investment transactions and investment income at the prevailing rates of exchange on the dates of such transactions.
Although the net assets of the Fund are presented at the foreign exchange rates and market values at the close of the period, the Fund does not isolate that portion of the results of operations arising as a result of changes in the foreign exchange rates from the fluctuations arising from changes in the market prices of securities held at period end. Similarly, the Fund does not isolate the effect of changes in foreign exchange rates from the fluctuations arising from changes in the market prices of securities sold during the period. Accordingly, realized and unrealized foreign currency gains (losses) on investments in securities are included in the reported net realized and unrealized gains (losses) on investment transactions and balances. However, pursuant to U.S. federal income tax regulations, gains and losses from certain foreign currency transactions and the foreign currency portion of gains and losses realized on sales and maturities of foreign denominated debt securities are treated as ordinary income for U.S. federal income tax purposes.
Net realized gains (losses) on foreign currency transactions represent net foreign exchange gains (losses) from foreign currency forward exchange contracts, disposition of foreign currencies, currency gains (losses) realized between the trade and settlement dates on securities transactions, and the difference between the amount of investment income and foreign withholding taxes recorded on the Fund's books and the U.S. dollar equivalent amounts actually received or paid. The change in unrealized currency gains (losses) on foreign currency transactions for the period is reflected in the Statement of Operations.
A significant portion of the Fund's net assets consist of securities of issuers located in emerging markets, which are denominated in foreign currencies. Such securities may be concentrated in a limited number of countries
and regions and may vary throughout the year. Changes in currency exchange rates will affect the value of securities and investment income from foreign currency denominated securities. Emerging market securities are often subject to greater price volatility, limited capitalization and liquidity, and higher rates of inflation than securities of companies based in the U.S. In addition, emerging market issuers may be subject to substantial governmental involvement in the economy and greater social, economic and political uncertainty.
Governmental approval for foreign investments may be required in advance of making an investment under certain circumstances in some countries, and the extent of foreign investments in domestic companies may be subject to limitation in other countries. Foreign ownership limitations also may be imposed by the charters of individual companies to prevent, among other concerns, violations of foreign investment limitations. As a result, an additional class of shares (identified as "Foreign" in the Portfolio of Investments) may be created and offered for investment. The "local" and "foreign shares" market values may differ. In the absence of trading of the foreign shares in such markets, the Fund values the foreign shares at the closing exchange price of the local shares.
4. Structured Investments: The Fund invested a portion of its assets in structured investments. A structured investment is a derivative security designed to offer a return linked to a particular underlying security, currency, commodity or market. Structured investments may come in various forms including notes (such as exchange-traded notes), warrants and options to purchase securities. The Fund will typically use structured investments to gain exposure to a permitted underlying security, currency, commodity or market when direct access to a market is limited or inefficient from a tax or cost standpoint. There can be no assurance that structured investments will trade at the same price or have the same value as the underlying security, currency, commodity or market. Investments in structured investments involve risks including issuer risk, counterparty risk and market risk. Holders of structured investments bear risks of the underlying investment and are subject to issuer or counterparty risk because the Fund is relying on the creditworthiness of such issuer or counterparty and has no rights with respect to the underlying investment. Certain structured investments may be thinly traded or have a limited trading market and may have the
22
Morgan Stanley Institutional Fund, Inc.
Annual Report — December 31, 2019
Notes to Financial Statements (cont'd)
effect of increasing the Fund's illiquidity to the extent that the Fund, at a particular time, may be unable to find qualified buyers for these securities.
5. Redemption Fees: The Fund will assess a 2% redemption fee on Class I shares, Class A shares, Class L shares, Class C shares and Class IS shares, which is paid directly to the Fund, for shares redeemed or exchanged within thirty days of purchase, subject to certain exceptions. The redemption fee is designed to protect the Fund and its remaining shareholders from the effects of short-term trading. These fees, if any, are included in the Statements of Changes in Net Assets.
6. Indemnifications: The Company enters into contracts that contain a variety of indemnifications. The Company's maximum exposure under these arrangements is unknown. However, the Company has not had prior claims or losses pursuant to these contracts and expects the risk of loss to be remote.
7. Dividends and Distributions to Shareholders: Dividend income and distributions to shareholders are recorded on the ex-dividend date. Dividends from net investment income, if any, are declared and paid annually. Net realized capital gains, if any, are distributed at least annually.
8. Security Transactions, Income and Expenses: Security transactions are accounted for on the trade date (date the order to buy or sell is executed). Realized gains and losses on the sale of investment securities are determined on the specific identified cost method. Dividend income and other distributions are recorded on the ex-dividend date (except for certain foreign dividends which may be recorded as soon as the Fund is informed of such dividends) net of applicable withholding taxes. Interest income is recognized on the accrual basis except where collection is in doubt. Discounts are accreted and premiums are amortized over the life of the respective securities. Most expenses of the Company can be directly attributed to a particular Fund. Expenses which cannot be directly attributed are apportioned among the Funds based upon relative net assets or other appropriate methods. Income, expenses (other than class specific expenses — distribution and shareholder services, transfer agency and sub transfer agency fees) and realized and unrealized gains or losses are allocated to each class of shares based upon their relative net assets.
B. Advisory Fees: The Adviser, a wholly-owned subsidiary of Morgan Stanley, provides the Fund with advisory services under the terms of an Investment Advisory Agreement, paid quarterly, at an annual rate of 1.25% of the daily net assets of the Fund.
The Adviser has agreed to reduce its advisory fee and/or reimburse the Fund so that total annual Fund operating expenses, excluding certain investment related expenses, taxes, interest and other extraordinary expenses (including litigation), will not exceed 1.85% for Class I shares, 2.20% for Class A shares, 2.70% for Class L shares, 2.95% for Class C shares and 1.80% for Class IS shares. The fee waivers and/or expense reimbursements will continue for at least one year from the date of the Fund's prospectus or until such time as the Directors act to discontinue all or a portion of such waivers and/or reimbursements when they deem such action is appropriate. For the year ended December 31, 2019, approximately $34,000 of advisory fees were waived and approximately $88,000 of other expenses were reimbursed by the Adviser pursuant to this arrangement.
C. Administration Fees: The Adviser also serves as Administrator to the Company and provides administrative services pursuant to an Administration Agreement for an annual fee, accrued daily and paid monthly, of 0.08% of the Fund's average daily net assets.
Under a Sub-Administration Agreement between the Administrator and State Street Bank and Trust Company ("State Street"), State Street provides certain administrative services to the Company. For such services, the Administrator pays State Street a portion of the fee the Administrator receives from the Fund.
D. Distribution and Shareholder Services Fees: Morgan Stanley Distribution, Inc. ("MSDI" or the "Distributor"), a wholly-owned subsidiary of the Adviser and an indirect subsidiary of Morgan Stanley, serves as the Company's Distributor of Fund shares pursuant to a Distribution Agreement. The Company has adopted a Shareholder Services Plan with respect to Class A shares pursuant to Rule 12b-1 under the Act. Under the Shareholder Services Plan, the Fund pays the Distributor a shareholder services fee, accrued daily and paid monthly, at an annual rate of 0.25% of the Fund's average daily net assets attributable to Class A shares.
The Company has adopted a Distribution and Shareholder Services Plan with respect to Class L shares pursuant to
23
Morgan Stanley Institutional Fund, Inc.
Annual Report — December 31, 2019
Notes to Financial Statements (cont'd)
Rule 12b-1 under the Act. Under the Distribution and Shareholder Services Plan, the Fund pays the Distributor a distribution fee, accrued daily and paid monthly, at an annual rate of 0.50% and a shareholder services fee, accrued daily and paid monthly, at an annual rate of 0.25% of the Fund's average daily net assets attributable to Class L shares.
The Company has adopted a Distribution and Shareholder Services Plan with respect to Class C shares pursuant to Rule 12b-1 under the Act. Under the Distribution and Shareholder Services Plan, the Fund pays the Distributor a distribution fee, accrued daily and paid monthly, at an annual rate of 0.75% and a shareholder services fee, accrued daily and paid monthly, at an annual rate of 0.25% of the Fund's average daily net assets attributable to Class C shares.
The distribution and shareholder services fees are used to support the expenses associated with servicing and maintaining accounts. The Distributor may compensate other parties for providing shareholder support services to investors who purchase Class A, Class L and Class C shares.
E. Dividend Disbursing and Transfer Agent: The Company's dividend disbursing and transfer agent is DST Asset Manager Solutions, Inc. ("DST"). Pursuant to a Transfer Agency Agreement, the Company pays DST a fee based on the number of classes, accounts and transactions relating to the Funds of the Company.
F. Custodian Fees: State Street (the "Custodian") also serves as Custodian for the Company in accordance with a Custodian Agreement. The Custodian holds cash, securities and other assets of the Company as required by the Act. Custody fees are payable monthly based on assets held in custody, investment purchases and sales activity and account maintenance fees, plus reimbursement for certain out-of-pocket expenses.
G. Security Transactions and Transactions with Affiliates: For the year ended December 31, 2019, purchases and sales of investment securities for the Fund, other than long-term U.S. Government securities and short-term investments were approximately $134,374,000 and $286,775,000, respectively. There were no purchases and sales of long-term U.S. Government securities for the year ended December 31, 2019.
The Fund invests in the Institutional Class of the Morgan Stanley Institutional Liquidity Funds — Government Portfolio (the "Liquidity Funds"), an open-end management investment company managed by the Adviser. Advisory fees paid by
the Fund are reduced by an amount equal to its pro-rata share of the advisory and administration fees paid by the Fund due to its investment in the Liquidity Funds. For the year ended December 31, 2019, advisory fees paid were reduced by approximately $1,000 relating to the Fund's investment in the Liquidity Funds.
A summary of the Fund's transactions in shares of affiliated investments during the year ended December 31, 2019 is as follows:
Affiliated
Investment
Company | | Value
December 31,
2018
(000) | | Purchases
at Cost
(000) | | Proceeds
from Sales
(000) | | Dividend
Income
(000) | |
Liquidity Funds | | $ | — | | | $ | 46,790 | | | $ | 46,790 | | | $ | 14 | | |
Affiliated
Investment
Company (cont'd) | | Realized
Gain (Loss)
(000) | | Change in
Unrealized
Appreciation
(Depreciation)
(000) | | Value
December 31,
2019
(000) | |
Liquidity Funds | | $ | — | | | $ | — | | | $ | — | | |
The Fund is permitted to purchase and sell securities ("cross-trade") from and to other Morgan Stanley funds as well as other funds and client accounts for which the Adviser or an affiliate of the Adviser serves as investment adviser, pursuant to procedures approved by the Directors in compliance with Rule 17a-7 under the Act (the "Rule"). Each cross-trade is executed at the current market price in compliance with provisions of the Rule. For the year ended December 31, 2019, the Fund did not engage in any cross-trade transactions.
The Fund has an unfunded Deferred Compensation Plan (the "Compensation Plan"), which allows each independent Director to defer payment of all, or a portion, of the fees he or she receives for serving on the Board of Directors. Each eligible Director generally may elect to have the deferred amounts credited with a return equal to the total return on one or more of the Morgan Stanley funds that are offered as investment options under the Compensation Plan. Appreciation/depreciation and distributions received from these investments are recorded with an offsetting increase/decrease in the deferred compensation obligation and do not affect the NAV of the Fund.
H. Federal Income Taxes: It is the Fund's intention to continue to qualify as a regulated investment company and distribute all of its taxable and tax-exempt income. Accordingly, no provision for federal income taxes is required in the financial statements.
The Fund may be subject to taxes imposed by countries in which it invests. Such taxes are generally based on income
24
Morgan Stanley Institutional Fund, Inc.
Annual Report — December 31, 2019
Notes to Financial Statements (cont'd)
and/or capital gains earned or repatriated. Taxes are accrued based on net investment income, net realized gains and net unrealized appreciation as such income and/or gains are earned. Taxes may also be based on transactions in foreign currency and are accrued based on the value of investments denominated in such currency.
FASB ASC 740-10, "Income Taxes — Overall", sets forth a minimum threshold for financial statement recognition of the benefit of a tax position taken or expected to be taken in a tax return. Management has concluded there are no significant uncertain tax positions that would require recognition in the financial statements. If applicable, the Fund recognizes interest accrued related to unrecognized tax benefits in "Interest Expense" and penalties in "Other Expenses" in the Statement of Operations. The Fund files tax returns with the U.S. Internal Revenue Service, New York and various states. Generally, each of the tax years in the four-year period ended December 31, 2019 remains subject to examination by taxing authorities.
The tax character of distributions paid may differ from the character of distributions shown for GAAP purposes due to short-term capital gains being treated as ordinary income for tax purposes. The tax character of distributions paid during fiscal years 2019 and 2018 was as follows:
2019 Distributions
Paid From:
Ordinary Income
(000) | | 2018 Distributions
Paid From:
Ordinary Income
(000) | |
| $ | 4,055 | | | $ | 14,633 | | |
The amount and character of income and gains to be distributed are determined in accordance with income tax regulations which may differ from GAAP. These book/tax differences are either considered temporary or permanent in nature.
Temporary differences are attributable to differing book and tax treatments for the timing of the recognition of gains (losses) on certain investment transactions and the timing of the deductibility of certain expenses.
The Fund had no permanent differences causing reclassifications among the components of net assets for the year ended December 31, 2019.
At December 31, 2019, the components of distributable earnings for the Fund on a tax basis were as follows:
Undistributed
Ordinary
Income
(000) | | Undistributed
Long-Term
Capital Gain
(000) | |
| $ | 24 | | | $ | — | | |
At December 31, 2019, the Fund had available for federal income tax purposes unused short-term capital losses of approximately $82,830,000 that do not have an expiration date.
To the extent that capital loss carryforwards are used to offset any future capital gains realized, no capital gains tax liability will be incurred by the Fund for gains realized and not distributed. To the extent that capital gains are offset, such gains will not be distributed to the shareholders.
I. Credit Facility: The Company and other Morgan Stanley funds participated in a $150,000,000 committed, unsecured revolving line of credit facility (the "Facility") with State Street. Effective April 22, 2019, the committed line amount increased to $300,000,000. This Facility is to be used for temporary emergency purposes or funding of shareholder redemption requests. The interest rate on borrowings is based on the federal funds rate or 1 month LIBOR rate plus a spread. The Facility also has a commitment fee of 0.25% per annum based on the unused portion of the Facility. During the year ended December 31, 2019, the Fund did not have any borrowings under the Facility.
J. Other: At December 31, 2019, the Fund had record owners of 10% or greater. Investment activities of these shareholders could have a material impact on the Fund. The aggregate percentage of such owners was 58.7%.
25
Morgan Stanley Institutional Fund, Inc.
Annual Report — December 31, 2019
Report of Independent Registered Public Accounting Firm
To the Shareholders and Board of Directors of
Morgan Stanley Institutional Fund, Inc. —
Frontier Markets Portfolio
Opinion on the Financial Statements
We have audited the accompanying statement of assets and liabilities of Frontier Markets Portfolio (the "Fund") (one of the funds constituting Morgan Stanley Institutional Fund, Inc. (the "Company")), including the portfolio of investments, as of December 31, 2019, and the related statement of operations for the year then ended, the statements of changes in net assets for each of the two years in the period then ended, the financial highlights for each of the five years in the period then ended and the related notes (collectively referred to as the "financial statements"). In our opinion, the financial statements present fairly, in all material respects, the financial position of Frontier Markets Portfolio (one of the funds constituting Morgan Stanley Institutional Fund, Inc.) at December 31, 2019, the results of its operations for the year then ended, the changes in its net assets for each of the two years in the period then ended and its financial highlights for each of the five years in the period then ended, in conformity with U.S. generally accepted accounting principles.
Basis for Opinion
These financial statements are the responsibility of the Company's management. Our responsibility is to express an opinion on the Fund's financial statements based on our audits. We are a public accounting firm registered with the Public Company Accounting Oversight Board (United States) ("PCAOB") and are required to be independent with respect to the Company in accordance with the U.S. federal securities law and the applicable rules and regulations of the Securities and Exchange Commission and the PCAOB.
We conducted our audits in accordance with the standards of the PCAOB. Those standards require that we plan and perform the audit to obtain reasonable assurance about whether the financial statements are free of material misstatement, whether due to error or fraud. The Company is not required to have, nor were we engaged to perform, an audit of the Company's internal control over financial reporting. As part of our audits, we are required to obtain an understanding of internal control over financial reporting, but not for the purpose of expressing an opinion on the effectiveness of the Company's internal control over financial reporting. Accordingly, we express no such opinion.
Our audits included performing procedures to assess the risks of material misstatement of the financial statements, whether due to error or fraud, and performing procedures that respond to those risks. Such procedures included examining, on a test basis, evidence regarding the amounts and disclosures in the financial statements. Our procedures included confirmation of securities owned as of December 31, 2019 by correspondence with the custodian and others or by other appropriate auditing procedures where replies from others were not received. Our audits also included evaluating the accounting principles used and significant estimates made by management, as well as evaluating the overall presentation of the financial statements. We believe that our audits provide a reasonable basis for our opinion.

We have served as the auditor of one or more Morgan Stanley investment companies since 2000.
Boston, Massachusetts
February 27, 2020
26
Morgan Stanley Institutional Fund, Inc.
Annual Report — December 31, 2019
Federal Tax Notice (unaudited)
For federal income tax purposes, the following information is furnished with respect to the distributions paid by the Fund during its taxable year ended December 31, 2019. For corporate shareholders 0.19% of the dividends qualified for the dividends received deduction.
For federal income tax purposes, the following information is furnished with respect to the Fund's earnings for its taxable year ended December 31, 2019. When distributed, certain earnings may be subject to a maximum tax rate of 15% as provided for by the Jobs and Growth Tax Relief Reconciliation Act of 2003. The Fund designated up to a maximum of approximately $2,987,000 as taxable at this lower rate.
The Fund intends to pass through foreign tax credits of approximately $477,000 and has derived net income from sources within foreign countries amounting to approximately $8,967,000.
In January, the Fund provides tax information to shareholders for the preceding calendar year.
27
Privacy Notice (unaudited) April 2019
FACTS | | WHAT DOES MSIM DO WITH YOUR PERSONAL INFORMATION? | |
Why? | | Financial companies choose how they share your personal information. Federal law gives consumers the right to limit some but not all sharing. Federal law also requires us to tell you how we collect, share, and protect your personal information. Please read this notice carefully to understand what we do. | |
What? | | The types of personal information we collect and share depend on the product or service you have with us. This information can include:
n Social Security number and income
n investment experience and risk tolerance
n checking account number and wire transfer instructions | |
How? | | All financial companies need to share customers' personal information to run their everyday business. In the section below, we list the reasons financial companies can share their customers' personal information; the reasons MSIM chooses to share; and whether you can limit this sharing. | |
Reasons we can share your personal information | | Does MSIM share? | | Can you limit this sharing? | |
For our everyday business purposes —
such as to process your transactions, maintain your account(s), respond to court orders and legal investigations, or report to credit bureaus | | Yes | | No | |
For our marketing purposes —
to offer our products and services to you | | Yes | | No | |
For joint marketing with other financial companies | | No | | We don't share | |
For our affiliates' everyday business purposes —
information about your transactions and experiences | | Yes | | No | |
For our affiliates' everyday business purposes —
information about your creditworthiness | | No | | We don't share | |
For our affiliates to market to you | | No | | We don't share | |
For non-affiliates to market to you | | No | | We don't share | |
Questions? Call toll-free (844) 312-6327 or email: imprivacyinquiries@morganstanley.com
28
Privacy Notice (unaudited) (cont'd) April 2019
Who we are
Who is providing this notice? | | Morgan Stanley Investment Management, Inc. and its affiliated registered investment advisers, registered broker-dealers, and registered and unregistered funds ("MSIM") | |
What we do
How does MSIM protect my personal information? | | To protect your personal information from unauthorized access and use, we use security measures that comply with federal law. These measures include computer safeguards and secured files and buildings. We have policies governing the proper handling of customer information by personnel and requiring third parties that provide support to adhere to appropriate security standards with respect to such information. | |
How does MSIM collect my personal information? | | We collect your personal information, for example, when you
n open an account or make deposits or withdrawals from your account
n buy securities from us or make a wire transfer
n give us your contact information
We also collect your personal information from others, such as credit bureaus, affiliates, or other companies. | |
Why can't I limit all sharing? | | Federal law gives you the right to limit only
n sharing for affiliates' everyday business purposes — information about your creditworthiness
n affiliates from using your information to market to you
n sharing for non-affiliates to market to you
State laws and individual companies may give you additional rights to limit sharing. See below for more on your rights under state law. | |
Definitions
Affiliates | | Companies related by common ownership or control. They can be financial and non-financial companies.
n Our affiliates include companies with a Morgan Stanley name and financial companies such as Morgan Stanley Smith Barney LLC and Morgan Stanley & Co. | |
Non-affiliates | | Companies not related by common ownership or control. They can be financial and non-financial companies.
n MSIM does not share with non-affiliates so they can market to you. | |
Joint marketing | | A formal agreement between non-affiliated financial companies that together market financial products or services to you.
n MSIM doesn't jointly market | |
Other Important Information
Vermont: Except as permitted by law, we will not share personal information we collect about Vermont residents with Non-affiliates unless you provide us with your written consent to share such information.
California: Except as permitted by law, we will not share personal information we collect about California residents with Non-affiliates and we will limit sharing such personal information with our Affiliates to comply with California privacy laws that apply to us.
29
Morgan Stanley Institutional Fund, Inc.
Annual Report — December 31, 2019
Director and Officer Information (unaudited)
Independent Directors:
Name, Birth Year
and Address of
Independent Director | | Position(s)
Held with
Registrant | | Length of Time
Served* | | Principal Occupation(s) During Past 5 Years
and Other Relevant Professional Experience | | Number of
Funds in
Fund Complex
Overseen by
Independent
Director** | | Other Directorships
Held by Independent
Director*** | |
Frank L. Bowman
c/o Perkins Coie LLP
Counsel to the Independent Directors
1155 Avenue of the Americas
New York, NY 10036
Birth Year 1944 | | Director | | Since August 2006 | | President, Strategic Decisions, LLC (consulting) (since February 2009); Director or Trustee of various Morgan Stanley Funds (since August 2006); Chairperson of the Compliance and Insurance Committee (since October 2015); formerly, Chairperson of the Insurance Sub-Committee of the Compliance and Insurance Committee (2007-2015); served as President and Chief Executive Officer of the Nuclear Energy Institute (policy organization) (February 2005-November 2008); retired as Admiral, U.S. Navy after serving over 38 years on active duty including 8 years as Director of the Naval Nuclear Propulsion Program in the Department of the Navy and the U.S. Department of Energy (1996-2004); served as Chief of Naval Personnel (July 1994-September 1996) and on the Joint Staff as Director of Political Military Affairs (June 1992-July 1994); knighted as Honorary Knight Commander of the Most Excellent Order of the British Empire; awarded the Officier de l'Orde National du Mérite by the French Government; elected to the National Academy of Engineering (2009). | | | 86 | | | Director of Naval and Nuclear Technologies LLP; Director Emeritus of the Armed Services YMCA; Member of the National Security Advisory Council of the Center for U.S. Global Engagement and a member of the CNA Military Advisory Board; Trustee of Fairhaven United Methodist Church; Member of the Board of Advisors of the Dolphin Scholarship Foundation; Director of other various non-profit organizations; formerly, Director of BP p.l.c. (November 2010-May 2019). | |
Kathleen A. Dennis
c/o Perkins Coie LLP
Counsel to the Independent Directors
1155 Avenue of the Americas
New York, NY 10036
Birth Year 1953 | | Director | | Since August 2006 | | President, Cedarwood Associates (mutual fund and investment management consulting) (since July 2006); Chairperson of the Liquidity and Alternatives Sub-Committee of the Investment Committee (since October 2006) and Director or Trustee of various Morgan Stanley Funds (since August 2006); formerly, Senior Managing Director of Victory Capital Management (1993-2006). | | | 86 | | | Director of various non-profit organizations. | |
Nancy C. Everett
c/o Perkins Coie LLP
Counsel to the Independent Directors
1155 Avenue of the Americas
New York, NY 10036
Birth Year 1955 | | Director | | Since January 2015 | | Chief Executive Officer, Virginia Commonwealth University Investment Company (since November 2015); Owner, OBIR, LLC (institutional investment management consulting) (since June 2014); formerly, Managing Director, BlackRock, Inc. (February 2011-December 2013); and Chief Executive Officer, General Motors Asset Management (a/k/a Promark Global Advisors, Inc.) (June 2005-May 2010). | | | 87 | | | Formerly, Member of Virginia Commonwealth University School of Business Foundation (2005-2016); Member of Virginia Commonwealth University Board of Visitors (2013-2015); Member of Committee on Directors for Emerging Markets Growth Fund, Inc. (2007-2010); Chairperson of Performance Equity Management, LLC (2006-2010); and Chairperson, GMAM Absolute Return Strategies Fund, LLC (2006-2010). | |
30
Morgan Stanley Institutional Fund, Inc.
Annual Report — December 31, 2019
Director and Officer Information (unaudited) (cont'd)
Independent Directors: (cont'd)
Name, Birth Year
and Address of
Independent Director | | Position(s)
Held with
Registrant | | Length of Time
Served* | | Principal Occupation(s) During Past 5 Years
and Other Relevant Professional Experience | | Number of
Funds in
Fund Complex
Overseen by
Independent
Director** | | Other Directorships
Held by Independent
Director*** | |
Jakki L. Haussler
c/o Perkins Coie LLP
Counsel to the Independent Directors
1155 Avenue of the Americas
New York, NY 10036
Birth Year 1957 | | Director | | Since January 2015 | | Chairman, Opus Capital Group (since 1996); formerly, Chief Executive Officer, Opus Capital Group (1996-2019); Director, Capvest Venture Fund, LP (May 2000-December 2011); Partner, Adena Ventures, LP (July 1999-December 2010); Director, The Victory Funds (February 2005-July 2008). | | | 87 | | | Director of Service Corporation International and Member, Audit Committee and Investment Committee; Director of Cincinnati Bell Inc. and Member, Audit Committee and Governance and Nominating Committee; Chairman of Northern Kentucky University Member Investment Committee; Member of Chase College of Law Transactional Law Practice Center Board of Advisors; Director of Best Transport; Director of Chase College of Law Board of Visitors; formerly, Member, University of Cincinnati Foundation Investment Committee; Member, Miami University Board of Visitors (2008-2011); Trustee of Victory Funds (2005-2008) and Chairman, Investment Committee (2007-2008) and Member, Service Provider Committee (2005-2008). | |
Dr. Manuel H. Johnson
c/o Johnson Smick International, Inc.
220 I Street, NE — Suite 200
Washington, D.C. 20002
Birth Year 1949 | | Director | | Since July 1991 | | Senior Partner, Johnson Smick International, Inc. (consulting firm); Chairperson of the Investment Committee (since October 2006) and Director or Trustee of various Morgan Stanley Funds (since July 1991); Co-Chairman and a founder of the Group of Seven Council (G7C) (international economic commission); formerly, Chairperson of the Audit Committee (July 1991-September 2006), Vice Chairman of the Board of Governors of the Federal Reserve System and Assistant Secretary of the U.S. Treasury. | | | 86 | | | Director of NVR, Inc. (home construction). | |
Joseph J. Kearns
c/o Perkins Coie LLP
Counsel to the Independent Directors
1155 Avenue of the Americas
New York, NY 10036
Birth Year 1942 | | Director | | Since August 1994 | | Senior Adviser, Kearns & Associates LLC (investment consulting); Chairperson of the Audit Committee (since October 2006) and Director or Trustee of various Morgan Stanley Funds (since August 1994); formerly, Deputy Chairperson of the Audit Committee (July 2003-September 2006) and Chairperson of the Audit Committee of various Morgan Stanley Funds (since August 1994); CFO of the J. Paul Getty Trust. | | | 87 | | | Prior to August 10, 2016, Director of Electro Rent Corporation (equipment leasing); Prior to December 31, 2013, Director of The Ford Family Foundation. | |
31
Morgan Stanley Institutional Fund, Inc.
Annual Report — December 31, 2019
Director and Officer Information (unaudited) (cont'd)
Independent Directors: (cont'd)
Name, Birth Year
and Address of
Independent Director | | Position(s)
Held with
Registrant | | Length of Time
Served* | | Principal Occupation(s) During Past 5 Years
and Other Relevant Professional Experience | | Number of
Funds in
Fund Complex
Overseen by
Independent
Director** | | Other Directorships
Held by Independent
Director*** | |
Michael F. Klein
c/o Perkins Coie LLP
Counsel to the Independent Directors
1155 Avenue of the Americas
New York, NY 10036
Birth Year 1958 | | Director | | Since August 2006 | | Managing Director, Aetos Alternatives Management, LP (since March 2000); Co-President, Aetos Alternatives Management, LP (since January 2004) and Co-Chief Executive Officer of Aetos Alternatives Management, LP (since August 2013); Chairperson of the Fixed Income Sub-Committee of the Investment Committee (since October 2006) and Director or Trustee of various Morgan Stanley Funds (since August 2006); formerly, Managing Director, Morgan Stanley & Co. Inc. and Morgan Stanley Dean Witter Investment Management and President, various Morgan Stanley Funds (June 1998-March 2000); Principal, Morgan Stanley & Co. Inc. and Morgan Stanley Dean Witter Investment Management (August 1997-December 1999). | | | 86 | | | Director of certain investment funds managed or sponsored by Aetos Alternatives Management, LP; Director of Sanitized AG and Sanitized Marketing AG (specialty chemicals). | |
Patricia Maleski
c/o Perkins Coie LLP
Counsel to the Independent Directors
1155 Avenue of the Americas
New York, NY 10036
Birth Year 1960 | | Director | | Since January 2017 | | Managing Director, JPMorgan Asset Management (2004-2016); Oversight and Control Head of Fiduciary and Conflicts of Interest Program (2015-2016); Chief Control Officer-Global Asset Management (2013-2015); President, JPMorgan Funds (2010-2013); Chief Administrative Officer (2004-2013); various other positions including Treasurer and Board Liaison (since 2001). | | | 87 | | | None. | |
Michael E. Nugent
522 Fifth Avenue
New York, NY 10036
Birth Year 1936 | | Chair of the Board and Director | | Chair of the Boards since July 2006 and Director since July 1991 | | Chair of the Boards of various Morgan Stanley Funds (since July 2006); Chairperson of the Governance Committee (since January 2019) and Director or Trustee of various Morgan Stanley Funds (since July 1991); formerly, Chairperson of each of the Closed-End Fund committee (until December 2019) and the Insurance Committee (until July 2006); General Partner, Triumph Capital, L.P. (private investment partnership) (1988-2013). | | | 86 | | | None. | |
W. Allen Reed
c/o Perkins Coie LLP
Counsel to the Independent Directors
1155 Avenue of the Americas
New York, NY 10036
Birth Year 1947 | | Vice Chair of the Board and Director | | Vice Chair of the Boards since January 2020 and Director since August 2006 | | Chairperson of the Equity Sub-Committee of the Investment Committee (since October 2006) and Director or Trustee of various Morgan Stanley Funds (since August 2006); formerly, President and CEO of General Motors Asset Management; Chairman and Chief Executive Officer of the GM Trust Bank and Corporate Vice President of General Motors Corporation (August 1994-December 2005). | | | 86 | | | Formerly, Director of Legg Mason, Inc.; formerly, Director of the Auburn University Foundation (2010-2015). | |
* This is the earliest date the Director began serving the Morgan Stanley Funds. Each Director serves an indefinite term, until his or her successor is elected.
** The Fund Complex includes (as of December 31, 2019) all open-end and closed-end funds (including all of their portfolios) advised by Morgan Stanley Investment Management Inc. (the "Adviser") and any funds that have an adviser that is an affiliated person of the Adviser (including, but not limited to, Morgan Stanley AIP GP LP).
*** This includes any directorships at public companies and registered investment companies held by the Director at any time during the past five years.
32
Morgan Stanley Institutional Fund, Inc.
Annual Report — December 31, 2019
Director and Officer Information (unaudited) (cont'd)
Executive Officers:
Name, Birth Year and Address of
Executive Officer | | Position(s) Held
with
Registrant | | Length of Time
Served* | | Principal Occupation(s) During Past 5 Years | |
John H. Gernon
522 Fifth Avenue
New York, NY 10036
Birth Year 1963 | | President and Principal Executive Officer | | Since September 2013 | | President and Principal Executive Officer of the Equity and Fixed Income Funds and the Morgan Stanley AIP Funds (since September 2013) and the Liquidity Funds and various money market funds (since May 2014) in the Fund Complex; Managing Director of the Adviser; Head of Product (since 2006). | |
Timothy J. Knierim
522 Fifth Avenue
New York, NY 10036
Birth Year 1959 | | Chief Compliance Officer | | Since December 2016 | | Managing Director of the Adviser and various entities affiliated with the Adviser; Chief Compliance Officer of various Morgan Stanley Funds and the Adviser (since December 2016) and Chief Compliance Officer of Morgan Stanley AIP GP LP (since 2014). Formerly, Managing Director and Deputy Chief Compliance Officer of the Adviser (2014-2016); and formerly, Chief Compliance Officer of Prudential Investment Management, Inc. (2007-2014). | |
Francis J. Smith
522 Fifth Avenue
New York, NY 10036
Birth Year 1965 | | Treasurer and Principal Financial Officer | | Treasurer since July 2003 and Principal Financial Officer since September 2002 | | Managing Director of the Adviser and various entities affiliated with the Adviser; Treasurer (since July 2003) and Principal Financial Officer of various Morgan Stanley Funds (since September 2002). | |
Mary E. Mullin
522 Fifth Avenue
New York, NY 10036
Birth Year 1967 | | Secretary | | Since
June
1999 | | Managing Director of the Adviser; Secretary of various Morgan Stanley Funds (since June 1999). | |
Michael J. Key
522 Fifth Avenue
New York, NY 10036
Birth Year 1979 | | Vice President | | Since
June
2017 | | Vice President of the Equity and Fixed Income Funds, Liquidity Funds, various money market funds and the Morgan Stanley AIP Funds in the Fund Complex (since June 2017); Executive Director of the Adviser; Head of Product Development for Equity and Fixed Income Funds (since August 2013). | |
* This is the earliest date the officer began serving the Morgan Stanley Funds. Each officer serves a one-year term, until his or her successor is elected and qualifies.
33
Morgan Stanley Institutional Fund, Inc.
Annual Report — December 31, 2019
Adviser and Administrator
Morgan Stanley Investment Management Inc.
522 Fifth Avenue
New York, New York 10036
Distributor
Morgan Stanley Distribution, Inc.
522 Fifth Avenue
New York, New York 10036
Dividend Disbursing and Transfer Agent
DST Asset Manager Solutions, Inc.
2000 Crown Colony Drive
Quincy, Massachusetts 02169
Custodian
State Street Bank and Trust Company
One Lincoln Street
Boston, Massachusetts 02111
Legal Counsel
Dechert LLP
1095 Avenue of the Americas
New York, New York 10036
Counsel to the Independent Directors
Perkins Coie LLP
1155 Avenue of the Americas
New York, New York 10036
Independent Registered Public Accounting Firm
Ernst & Young LLP
200 Clarendon Street
Boston, Massachusetts 02116
Reporting to Shareholders
Each Morgan Stanley fund provides a complete schedule of portfolio holdings in its Semi-Annual and the Annual Reports within 60 days of the end of the fund's second and fourth fiscal quarters. The Semi-Annual and Annual Reports are filed electronically with the Securities and Exchange Commission ("SEC") on Form N-CSRS and Form N-CSR, respectively. Morgan Stanley also delivers the Semi-Annual and Annual Reports to fund shareholders and makes these reports available on its public website, www.morganstanley.com/im/shareholderreports. Each Morgan Stanley non-money market fund also files a complete schedule of portfolio holdings with the SEC for the fund's first and third fiscal quarters as an attachment to Form N-PORT. Morgan Stanley does not deliver the reports for the first and third fiscal quarters to shareholders, nor are the reports posted to the Morgan Stanley public website. However, the holdings for each money market fund are posted to the Morgan Stanley public website. You may obtain the Form N-PORT filings (as well as the Form N-CSR and N-CSRS filings) by accessing the SEC's website, www.sec.gov. You can also request copies of these materials, upon payment of a duplicating fee, by electronic request at the SEC's email address (publicinfo@sec.gov).
Proxy Voting Policies and Procedures and Proxy Voting Record
You may obtain a copy of the Company's Proxy Voting Policy and Procedures and information regarding how the Company voted proxies relating to portfolio securities during the most recent twelve-month period ended June 30, without charge, upon request, by calling toll free 1 (800) 548-7786 or by visiting our website at www.morganstanley.com/im/shareholderreports. This information is also available on the SEC's website at www.sec.gov.
This report is authorized for distribution only when preceded or accompanied by a prospectus or summary prospectus of the applicable fund of Morgan Stanley Institutional Fund, Inc., which describes in detail the fund's investment policies, risks, fees and expenses. Please read the prospectus carefully before you invest or send money. For additional information, including information regarding the investments comprising the Fund, please visit our website at www.morganstanley.com/im/shareholderreports or call toll free 1 (800) 548-7786.
34
Printed in U.S.A.
This Report has been prepared for shareholders and may be distributed to others only if preceded or accompanied by a current prospectus.
Morgan Stanley Investment Management Inc.
522 Fifth Avenue
New York, New York 10036
© 2020 Morgan Stanley. Morgan Stanley Distribution, Inc.

IFIFEMANN
2909289 EXP. 02.28.21

Morgan Stanley Institutional Fund, Inc.
Global Sustain Portfolio
Annual Report
December 31, 2019
Beginning on January 1, 2021, as permitted by regulations adopted by the Securities and Exchange Commission ("SEC"), paper copies of the Fund's Annual and Semi-Annual Reports to Shareholders ("Shareholder Reports") will no longer be sent by mail, unless you specifically request paper copies of the Shareholder Reports from the Fund or from your financial intermediary, such as a broker-dealer or a bank. Instead, the Shareholder Reports will be made available on the Fund's website, https://www.morganstanley.com/im/shareholderreports and you will be notified by mail each time a Shareholder Report is posted and provided with a website link to access the Shareholder Report. If you already elected to receive Shareholder Reports electronically, you will not be affected by this change and you need not take any action. You may elect to receive Shareholder Reports and other communications from the Fund electronically anytime by contacting your financial intermediary or, if you are a direct investor, please follow the instructions on the envelope.
Beginning on January 1, 2019, you may elect to receive all future Shareholder Reports in paper free of charge. If you invest through a financial intermediary, you can contact your financial intermediary to request that you continue to receive paper copies of your Shareholder Reports. If you invest directly with the Fund, please follow the instructions on the envelope to let the Fund know you wish to continue receiving paper copies of your Shareholder Reports. Your election to receive Shareholder Reports in paper will apply to all funds held in your account if you invest through your financial intermediary or all funds held with the fund complex if you invest directly with a fund.

Morgan Stanley Institutional Fund, Inc.
Annual Report — December 31, 2019
Shareholders' Letter | | | 2 | | |
Expense Example | | | 3 | | |
Investment Overview | | | 4 | | |
Portfolio of Investments | | | 7 | | |
Statement of Assets and Liabilities | | | 8 | | |
Statement of Operations | | | 10 | | |
Statements of Changes in Net Assets | | | 11 | | |
Financial Highlights | | | 13 | | |
Notes to Financial Statements | | | 18 | | |
Report of Independent Registered Public Accounting Firm | | | 24 | | |
Federal Tax Notice | | | 25 | | |
Privacy Notice | | | 26 | | |
Director and Officer Information | | | 28 | | |
This report is authorized for distribution only when preceded or accompanied by a prospectus or summary prospectus of the applicable Fund of Morgan Stanley Institutional Fund, Inc. To receive a prospectus and/or statement of additional information ("SAI"), which contains more complete information such as investment objectives, charges, expenses, policies for voting proxies, risk considerations and describes in detail each of the Fund's investment policies to the prospective investor, please call toll free 1 (800) 548-7786. Please read the prospectuses carefully before you invest or send money.
Additionally, you can access information about the Fund, including performance, characteristics and investment team commentary, through Morgan Stanley Investment Management's website: www.morganstanley.com/im/shareholderreports.
Market forecasts provided in this report may not necessarily come to pass. There is no guarantee that any sectors mentioned will continue to perform as discussed herein or that securities in such sectors will be held by the Fund in the future. There is no assurance that a fund will achieve its investment objective. Funds are subject to market risk, which is the possibility that market values of securities owned by the Fund will decline and, therefore, the value of the Fund's shares may be less than what you paid for them. Accordingly, you can lose money investing in this Fund. Please see the prospectus for more complete information on investment risks.
1
Morgan Stanley Institutional Fund, Inc.
Annual Report — December 31, 2019
Shareholders' Letter (unaudited)
Dear Shareholders,
We are pleased to provide this Annual Report, in which you will learn how your investment in Global Sustain Portfolio (the "Fund") performed during the latest twelve-month period.
Morgan Stanley Investment Management is a client-centric, investor-led organization. Our global presence, intellectual capital, and breadth of products and services enable us to partner with investors to meet the evolving challenges of today's financial markets. We aim to deliver superior investment service and to empower our clients to make the informed decisions that help them reach their investment goals.
As always, we thank you for selecting Morgan Stanley Investment Management, and look forward to working with you in the months and years ahead.
Sincerely,

John H. Gernon
President and Principal Executive Officer
January 2020
2
Morgan Stanley Institutional Fund, Inc.
Annual Report — December 31, 2019
Expense Example (unaudited)
Global Sustain Portfolio
As a shareholder of the Fund, you incur two types of costs: (1) transactional costs; and (2) ongoing costs, which may include advisory fees, administration fees, distribution and shareholder services fees and other Fund expenses. This example is intended to help you understand your ongoing costs (in dollars) of investing in the Fund and to compare these costs with the ongoing costs of investing in other mutual funds.
This example is based on an investment of $1,000 invested at the beginning of the six-month period ended December 31, 2019 and held for the entire six-month period.
Actual Expenses
The table below provides information about actual account values and actual expenses. You may use the information in this table, together with the amount you invested, to estimate the expenses that you paid over the period. Simply divide your account value by $1,000 (for example, an $8,600 account value divided by $1,000 = 8.6), then multiply the result by the number in the table under the heading entitled "Actual Expenses Paid During Period" to estimate the expenses you paid on your account during this period.
Hypothetical Example for Comparison Purposes
The table below provides information about hypothetical account values and hypothetical expenses based on the Fund's actual expense ratio and an assumed rate of return of 5% per year before expenses, which is not the Fund's actual return. The hypothetical account values and expenses may not be used to estimate the actual ending account balance or expenses you paid for the period. You may use this information to compare the ongoing costs of investing in the Fund and other funds. To do so, compare this 5% hypothetical example with the 5% hypothetical examples that appear in the shareholder reports of the other funds.
Please note that the expenses shown in the table are meant to highlight your ongoing costs only and do not reflect any transactional costs, such as sales charges (loads). Therefore, the information for each class in the table is useful in comparing ongoing costs only, and will not help you determine the relative total costs of owning different funds. In addition, if these transactional costs were included, your costs would have been higher.
| | | Beginning
Account
Value
7/1/19 | | Actual Ending
Account
Value
12/31/19 | | Hypothetical
Ending Account
Value | | Actual
Expenses
Paid
During
Period* | | Hypothetical
Expenses Paid
During Period* | | Net
Expense
Ratio
During
Period** | |
Global Sustain Portfolio Class I | | $ | 1,000.00 | | | $ | 1,087.20 | | | $ | 1,020.67 | | | $ | 4.73 | | | $ | 4.58 | | | | 0.90 | % | |
Global Sustain Portfolio Class A | | | 1,000.00 | | | | 1,085.90 | | | | 1,018.90 | | | | 6.57 | | | | 6.36 | | | | 1.25 | | |
Global Sustain Portfolio Class L | | | 1,000.00 | | | | 1,083.10 | | | | 1,016.38 | | | | 9.19 | | | | 8.89 | | | | 1.75 | | |
Global Sustain Portfolio Class C | | | 1,000.00 | | | | 1,081.50 | | | | 1,015.22 | | | | 10.39 | | | | 10.06 | | | | 1.98 | | |
Global Sustain Portfolio Class IS | | | 1,000.00 | | | | 1,087.60 | | | | 1,020.92 | | | | 4.47 | | | | 4.33 | | | | 0.85 | | |
* Expenses are calculated using each Fund Class' annualized net expense ratio (as disclosed), multiplied by the average account value over the period and multiplied by 184/365 (to reflect the most recent one-half year period).
** Annualized.
3
Morgan Stanley Institutional Fund, Inc.
Annual Report — December 31, 2019
Investment Overview (unaudited)
Global Sustain Portfolio
The Fund seeks long-term capital appreciation.
Performance
For the fiscal year ended December 31, 2019, the Fund's Class I shares had a total return based on net asset value and reinvestment of distributions per share of 30.03%, net of fees. The Fund's Class I shares outperformed the Fund's benchmark, the MSCI World Net Index (the "Index"), which returned 27.67%.
Please keep in mind that double-digit returns are highly unusual and cannot be sustained. Investors should also be aware that these returns were primarily achieved during favorable market conditions.
Factors Affecting Performance
• The strong fourth quarter of 2019 rounded off a very strong year, with the Index finishing up 27.7% in U.S. dollars (USD). In sector terms, there were two major outliers, with information technology up a massive 48%, while energy by contrast only gained 11%. The other sectors were relatively tightly bunched, though the more defensive sectors such as consumer staples, health care and utilities (all +23%) were a little behind the index. The U.S. (+31%), once again outperformed the Index, along with the Netherlands (+32% USD) and Switzerland (+32%). At the other end of the spectrum, Hong Kong (+10%), Spain (+12%) and the U.K. (+21%) were affected by political uncertainties, while Singapore (+15%), Japan (+20%) and Germany (+21%) were hit by worries about trade and industrial production. Country returns are represented by the respective MSCI country indexes in U.S. dollars.
• For the year, the Fund's sector allocation and stock selection were both positive. The overweight in information technology and the lack of energy stocks were both helpful for sector allocation, more than making up for the overweights in consumer staples and health care along with the drag from the small cash allocation in the very strong year for the markets. The outperformance in the health care and financials sectors drove the positive stock selection, despite underperformance in communication services and consumer staples.
• Over the year, the largest absolute contributors were Microsoft, Visa and Accenture. The greatest absolute detractors were Henkel and Fox
Corporation. Johnson & Johnson was the smallest absolute contributor for the year.
Management Strategies
• As simple souls we attempt to disaggregate investing into earnings and multiples. Concerned as we are with the preservation of capital, we continue to maintain that there are only two ways to lose money in equities: if the earnings go away, or the multiple goes away. While our daily business is at the stock level, we also attempt to apply this logic to markets as a whole. At the end of 2017, our concern was multiples, with the MSCI World Index on 17.0x forward consensus estimates.i This fear proved well founded, as 2018 was a down year despite double-digit earnings growth, as the market de-rated to 13.4x.i Given this de-rating, our concern for 2019 switched to earnings... and we were a quarter right! We say a quarter, as we were half right on earnings, which mildly disappointed being down a fraction for the year rather than the expected 7% rise, but did not foresee that the multiple would bounce back to 17.0x.i If we disaggregate the 2019 return of 28% for the MSCI World Index, a massive 26% came from the re-rating, -1% from earnings, and the remainder from dividends.i This is an extreme example of the pattern we've been seeing since 2012, where more of the market return has come from multiple expansion than from earnings growth, with only 2017 offering a strong return year driven by earnings.
• This significant re-rating implies a large increase in optimism during 2019. This was clearly not driven by the actual earnings, which disappointed in 2019 and have yet to revive, but rather by hopes for the future. Monetary policy was one clear shift. The U.S. Federal Reserve's (the Fed) rate-raising cycle, which saw four rises in 2018 amidst talk of "normalization," ended in December of that year, and 2019 saw three cuts, along with more dovish noises, and a return to a growing balance sheet as it battled the crisis in the repo market. The European Central Bank (ECB) and the People's Bank of China have followed suit in easing monetary conditions in an attempt to boost growth. Markets were also helped by a reduction in fears about a trade war between the U.S. and China, with talk of an imminent "Phase 1" deal, which would at least imply a truce.
• So where does this revival of market morale leave us for 2020? Frankly, we are now nervous about both
i Source: FactSet, December 2019.
4
Morgan Stanley Institutional Fund, Inc.
Annual Report — December 31, 2019
Investment Overview (unaudited) (cont'd)
Global Sustain Portfolio
multiples and earnings. Our fear about multiples is natural enough, with the MSCI World Index back up to 17.0x, and this time without the benefit of the imminent earnings boost from the Trump tax cuts that it had in early 2018. Even putting the risk of multiple compression to one side, it is tough to see how there can be much mileage for the markets from expanding multiples; a 10% boost would require the MSCI World Index to be on close to 19x!
• This leaves earnings as the main potential driver of any significant upside for markets, and here we are skeptical for the broad market in the medium term. It may well be that an industrial recovery can drive progress in 2020, but our structural concerns remain. Our anxiety is based on the fact that most of the levers for earnings growth have been pulled hard already, particularly in the U.S., leaving limited opportunity for them to help further and skewing the risk to the downside. Margins are high, as corporates have been advantaged relative to labor, given globalization and the political move to the right over the last few decades, and also relative to consumers, given the falling role of anti-trust. Profits have also been boosted by low interest rates and increased leverage, decreasing interest payments and allowing earnings-per-share-boosting buybacks. On top of all this, the gap between the "adjusted" numbers, used for consensus and paying management, and the actual profit at the bottom of the income statement has ballooned, reaching $600 billion over the last three years in the U.S. alone.ii These were all tailwinds for earnings over the last few years that are unlikely to be repeated, and may turn into headwinds if they go into reverse.
• This may not matter in 2020. It is quite possible that the U.S. can continue to steer between the Scylla of recession and the Charybdis of inflation, delivering economic and earnings growth without the Fed having to tighten and end the party. With the MSCI U.S.A. Index earnings multiple now at 18.7x, and double-digit earnings growth forecast for 2020 after the slight fall in 2019,i success seems to be what the market is expecting. Europe looks distinctly cheaper, in relative terms at least, at a "mere" 14.6x,i as there is far less optimism about growth. Part of this is down to the relative shortage of fast growing technology companies, but it is also down to the continent as a whole being mired in very slow growth. Here, there could be a positive story if there is a move towards fiscal reflation in
2020. The block, as ever, is Germany, given its balanced budget requirement. But if this is eased, perhaps using the need for infrastructure to deal with the climate emergency as an excuse to issue green bonds, then this could drive faster growth, or at the very least the hope of faster growth, which may be all that is needed to drive a rally. The ECB under Christine Lagarde is likely to remain helpful. By contrast, it is probably fruitless to expect structural change in Japan, which at 14.3xi is marginally cheaper than Europe. However, having suffered a double-digit earnings fall in 2019, as industrial production struggled, it may well be a beneficiary of any industrial bounce-back.
• Alongside the U.S. premium to the rest of the developed world, growth is thriving relative to value, trading at a relative multiple not seen since the tech-media-telecom (TMT) bubble at the start of the millennium. We are agnostic on the growth versus value debate, since we are wary of both of them! The valuations for fast growing companies make us nervous, and we have moved around 500 basis points of the portfolio since the strategy's inception from the faster growing companies, with estimated sales growth of 6% or higher, to the "duller" side of the portfolio with 3% to 5% top-line growth,iii where valuations are more reasonable. As for value, it is the companies' prospects that often look relatively dim, with several of the struggling sectors facing genuine threats, be it trapped assets for energy, the rise of electric vehicles for autos and low interest rates for financials.
• As ever, we advocate the case for quality. We look for companies with the intangible assets to give them the combination of recurring revenue and pricing power, along with the ability to sustain high returns on operating capital. One of the pluses they offer is resilience in tough times: the recurring revenue protects sales and the pricing power protects margins. 2019 was yet another time that the portfolio's companies displayed this economic resilience, with the earnings continuing to compound steadily all year while the market as a whole failed to deliver any earnings growth at all. At a time of raised multiples and high uncertainty (uncertainty that is arguably not properly reflected in the markets), we would argue that it makes sense to go with the relative safety and durability of high-quality compounders.
i Source: FactSet, December 2019.
ii Source: FactSet, Morgan Stanley Investment Management, December 2019.
iii Source: Morgan Stanley Investment Management, December 2019.
5
Morgan Stanley Institutional Fund, Inc.
Annual Report — December 31, 2019
Investment Overview (unaudited) (cont'd)
Global Sustain Portfolio

* Minimum Investment for Class I shares
** Commenced Operations on August 30, 2013.
In accordance with SEC regulations, the Fund's performance shown assumes that all recurring fees (including management fees) were deducted and all dividends and distributions were reinvested. The performance of Class A, L, C and IS shares will vary from the performance of Class I shares based upon their different inception dates and will be negatively impacted by additional fees assessed to those classes (if applicable).
Performance Compared to the MSCI World Net Index(1) and the Lipper Global Large-Cap Growth Funds Index(2)
| | | Period Ended December 31, 2019
Total Returns(3) | |
| | | | | Average Annual | |
| | | One
Year | | Five
Years | | Ten
Years | | Since
Inception(7) | |
Fund — Class I Shares
w/o sales charges(4) | | | 30.03 | % | | | 12.00 | % | | | — | | | | 11.92 | % | |
Fund — Class A Shares
w/o sales charges(4) | | | 29.53 | | | | 11.61 | | | | — | | | | 11.54 | | |
Fund — Class A Shares with
maximum 5.25% sales charges(4) | | | 22.74 | | | | 10.41 | | | | — | | | | 10.60 | | |
Fund — Class L Shares
w/o sales charges(4) | | | 28.87 | | | | 11.07 | | | | — | | | | 10.97 | | |
Fund — Class C Shares
w/o sales charges(6) | | | 28.63 | | | | — | | | | — | | | | 10.59 | | |
Fund — Class C Shares with
maximum 1.00% deferred
sales charges(6) | | | 27.63 | | | | — | | | | — | | | | 10.59 | | |
Fund — Class IS Shares
w/o sales charges(5) | | | 30.08 | | | | 12.05 | | | | — | | | | 11.55 | | |
MSCI World Net Index | | | 27.67 | | | | 8.74 | | | | — | | | | 9.81 | | |
Lipper Global Large-Cap
Growth Funds Index | | | 30.20 | | | | 10.48 | | | | — | | | | 10.97 | | |
Performance data quoted represents past performance, which is no guarantee of future results, and current performance may be lower or higher than the figures shown. Performance assumes that all dividends and distributions, if any, were reinvested. For the most recent month-end performance figures, please visit www.morganstanley.com/im/shareholderreports. Investment return and principal value will fluctuate so that Fund shares, when redeemed, may be worth more or less than their original cost. Total returns do not reflect the deduction of taxes that a shareholder would pay on Fund distributions or the redemption of Fund shares. Performance of share classes will vary due to difference in sales charges and expenses.
(1) The MSCI World Net Index is a free float-adjusted market capitalization weighted index designed to measure the equity market performance of developed markets. The term "free float" represents the portion of shares outstanding that are deemed to be available for purchase in the public equity markets by investors. The MSCI World Net Index currently consists of 23 developed market country indices. The performance of the Index is listed in US dollars and assumes reinvestment of net dividends. Net total return indices reinvest dividends after the deduction of withholding taxes, using (for international indices) a tax rate applicable to non-resident institutional investors who do not benefit from double taxation treaties. The Index is unmanaged and its returns do not include any sales charges or fees. Such costs would lower performance. It is not possible to invest directly in an index.
(2) The Lipper Global Large-Cap Growth Funds Index is an equally weighted performance index of the largest qualifying funds (based on net assets) in the Lipper Global Large-Cap Growth Funds classification. The Index, which is adjusted for capital gains distributions and income dividends, is unmanaged and should not be considered an investment. There are currently 30 funds represented in this Index. As of the date of this report, the Fund was in the Lipper Global Large-Cap Growth Funds classification.
(3) Total returns for the Fund reflect fees waived and expenses reimbursed, if applicable, by the Adviser (as defined herein). Without such waivers and reimbursements, total returns would have been lower.
(4) Commenced operations on August 30, 2013.
(5) Commenced offering on September 13, 2013.
(6) Commenced offering on April 30, 2015.
(7) For comparative purposes, average annual since inception returns listed for the Indexes refer to the inception date of Class I of the Fund, not the inception of the Index.
6
Morgan Stanley Institutional Fund, Inc.
Annual Report — December 31, 2019
Portfolio of Investments
Global Sustain Portfolio
| | | Shares | | Value
(000) | |
Common Stocks (97.0%) | |
Canada (2.5%) | |
Constellation Software, Inc. | | | 765 | | | $ | 743 | | |
France (3.4%) | |
L'Oreal SA | | | 2,236 | | | | 662 | | |
Sanofi | | | 3,508 | | | | 353 | | |
| | | | 1,015 | | |
Germany (9.1%) | |
Henkel AG & Co., KGaA (Preference) | | | 9,272 | | | | 958 | | |
SAP SE | | | 12,860 | | | | 1,731 | | |
| | | | 2,689 | | |
Hong Kong (1.8%) | |
AIA Group Ltd. | | | 49,000 | | | | 514 | | |
Taiwan (1.5%) | |
Taiwan Semiconductor Manufacturing Co., Ltd. ADR | | | 7,772 | | | | 451 | | |
United Kingdom (15.5%) | |
Experian PLC | | | 8,059 | | | | 272 | | |
GlaxoSmithKline PLC | | | 33,994 | | | | 801 | | |
Prudential PLC | | | 26,546 | | | | 510 | | |
Reckitt Benckiser Group PLC | | | 22,211 | | | | 1,803 | | |
RELX PLC (LSE) | | | 7,895 | | | | 199 | | |
RELX PLC (Euronext N.V.) | | | 24,877 | | | | 628 | | |
Unilever PLC | | | 5,964 | | | | 344 | | |
| | | | 4,557 | | |
United States (63.2%) | |
Abbott Laboratories | | | 10,604 | | | | 921 | | |
Accenture PLC, Class A | | | 6,769 | | | | 1,425 | | |
Alphabet, Inc., Class A (a) | | | 1,165 | | | | 1,560 | | |
Amphenol Corp., Class A | | | 3,118 | | | | 337 | | |
Automatic Data Processing, Inc. | | | 6,162 | | | | 1,051 | | |
Baxter International, Inc. | | | 14,357 | | | | 1,200 | | |
Becton Dickinson & Co. | | | 4,374 | | | | 1,190 | | |
Cerner Corp. | | | 6,830 | | | | 501 | | |
Church & Dwight Co., Inc. | | | 2,973 | | | | 209 | | |
Coca-Cola Co. (The) | | | 12,141 | | | | 672 | | |
Danaher Corp. | | | 6,214 | | | | 954 | | |
Factset Research Systems, Inc. | | | 1,169 | | | | 314 | | |
Fidelity National Information Services, Inc. | | | 4,390 | | | | 611 | | |
Fox Corp., Class A | | | 5,313 | | | | 197 | | |
Fox Corp., Class B (a) | | | 5,968 | | | | 217 | | |
Medtronic PLC | | | 9,291 | | | | 1,054 | | |
Microsoft Corp. | | | 14,172 | | | | 2,235 | | |
Moody's Corp. | | | 1,088 | | | | 258 | | |
NIKE, Inc., Class B | | | 5,701 | | | | 578 | | |
Thermo Fisher Scientific, Inc. | | | 2,726 | | | | 886 | | |
Visa, Inc., Class A | | | 8,450 | | | | 1,588 | | |
Zoetis, Inc. | | | 4,903 | | | | 649 | | |
| | | | 18,607 | | |
Total Common Stocks (Cost $22,941) | | | 28,576 | | |
| | | Shares | | Value
(000) | |
Short-Term Investment (2.9%) | |
Investment Company (2.9%) | |
Morgan Stanley Institutional Liquidity
Funds — Treasury Securities Portfolio —
Institutional Class (See Note G)
(Cost $848) | | | 848,045 | | | $ | 848 | | |
Total Investments (99.9%) (Cost $23,789) (b)(c) | | | 29,424 | | |
Other Assets in Excess of Liabilities (0.1%) | | | 40 | | |
Net Assets (100.0%) | | $ | 29,464 | | |
Country assignments and aggregations are based generally on third party vendor classifications and information, and may be different from the assignments and aggregations under the policies set forth in the Fund's prospectus and/or statement of additional information relating to geographic classifications.
(a) Non-income producing security.
(b) The approximate fair value and percentage of net assets, $2,689,000 and 9.1%, respectively, represent the securities that have been fair valued under the fair valuation policy for international investments as described in Note A-1 within the Notes to the Financial Statements.
(c) At December 31, 2019, the aggregate cost for federal income tax purposes is approximately $23,901,000. The aggregate gross unrealized appreciation is approximately $5,599,000 and the aggregate gross unrealized depreciation is approximately $76,000, resulting in net unrealized appreciation of approximately $5,523,000.
ADR American Depositary Receipt.
Portfolio Composition
Classification | | Percentage of
Total Investments | |
Other* | | | 28.5 | % | |
Health Care Equipment & Supplies | | | 18.1 | | |
Software | | | 16.0 | | |
Information Technology Services | | | 15.9 | | |
Household Products | | | 10.1 | | |
Pharmaceuticals | | | 6.1 | | |
Interactive Media & Services | | | 5.3 | | |
Total Investments | | | 100.0 | % | |
* Industries and/or investment types representing less than 5% of total investments.
The accompanying notes are an integral part of the financial statements.
7
Morgan Stanley Institutional Fund, Inc.
Annual Report — December 31, 2019
Statement of Assets and Liabilities | | December 31, 2019
(000) | |
Assets: | |
Investments in Securities of Unaffiliated Issuers, at Value (Cost $22,941) | | $ | 28,576 | | |
Investment in Security of Affiliated Issuer, at Value (Cost $848) | | | 848 | | |
Total Investments in Securities, at Value (Cost $23,789) | | | 29,424 | | |
Dividends Receivable | | | 30 | | |
Tax Reclaim Receivable | | | 19 | | |
Due from Adviser | | | 16 | | |
Receivable for Fund Shares Sold | | | 12 | | |
Receivable from Affiliate | | | 1 | | |
Interest Receivable | | | — | @ | |
Other Assets | | | 34 | | |
Total Assets | | | 29,536 | | |
Liabilities: | |
Payable for Professional Fees | | | 49 | | |
Payable for Custodian Fees | | | 6 | | |
Payable for Shareholder Services Fees — Class A | | | 1 | | |
Payable for Distribution and Shareholder Services Fees — Class L | | | 1 | | |
Payable for Distribution and Shareholder Services Fees — Class C | | | 2 | | |
Payable for Transfer Agency Fees — Class I | | | 1 | | |
Payable for Transfer Agency Fees — Class A | | | 1 | | |
Payable for Transfer Agency Fees — Class L | | | — | @ | |
Payable for Transfer Agency Fees — Class C | | | — | @ | |
Payable for Transfer Agency Fees — Class IS | | | 1 | | |
Payable for Administration Fees | | | 2 | | |
Payable for Sub Transfer Agency Fees — Class I | | | 1 | | |
Payable for Sub Transfer Agency Fees — Class A | | | — | @ | |
Payable for Sub Transfer Agency Fees — Class L | | | — | @ | |
Other Liabilities | | | 7 | | |
Total Liabilities | | | 72 | | |
Net Assets | | $ | 29,464 | | |
Net Assets Consist of: | |
Paid-in-Capital | | $ | 23,924 | | |
Total Distributable Earnings | | | 5,540 | | |
Net Assets | | $ | 29,464 | | |
The accompanying notes are an integral part of the financial statements.
8
Morgan Stanley Institutional Fund, Inc.
Annual Report — December 31, 2019
Statement of Assets and Liabilities (cont'd) | | December 31, 2019
(000) | |
CLASS I: | |
Net Assets | | $ | 14,756 | | |
| Shares Outstanding $0.001 par value shares of beneficial interest (unlimited shares authorized) (not in 000's) | | | 1,006,494 | | |
Net Asset Value, Offering and Redemption Price Per Share | | $ | 14.66 | | |
CLASS A: | |
Net Assets | | $ | 2,949 | | |
| Shares Outstanding $0.001 par value shares of beneficial interest (unlimited shares authorized) (not in 000's) | | | 201,730 | | |
Net Asset Value, Redemption Price Per Share | | $ | 14.62 | | |
Maximum Sales Load | | | 5.25 | % | |
Maximum Sales Charge | | $ | 0.81 | | |
Maximum Offering Price Per Share | | $ | 15.43 | | |
CLASS L: | |
Net Assets | | $ | 1,437 | | |
| Shares Outstanding $0.001 par value shares of beneficial interest (unlimited shares authorized) (not in 000's) | | | 99,240 | | |
Net Asset Value, Offering and Redemption Price Per Share | | $ | 14.48 | | |
CLASS C: | |
Net Assets | | $ | 2,872 | | |
| Shares Outstanding $0.001 par value shares of beneficial interest (unlimited shares authorized) (not in 000's) | | | 202,028 | | |
Net Asset Value, Offering and Redemption Price Per Share | | $ | 14.22 | | |
CLASS IS: | |
Net Assets | | $ | 7,450 | | |
| Shares Outstanding $0.001 par value shares of beneficial interest (unlimited shares authorized) (not in 000's) | | | 508,261 | | |
Net Asset Value, Offering and Redemption Price Per Share | | $ | 14.66 | | |
@ Amount is less than $500.
The accompanying notes are an integral part of the financial statements.
9
Morgan Stanley Institutional Fund, Inc.
Annual Report — December 31, 2019
Statement of Operations | | Year Ended
December 31, 2019
(000) | |
Investment Income: | |
Dividends from Securities of Unaffiliated Issuers (Net of $12 of Foreign Taxes Withheld) | | $ | 354 | | |
Dividends from Security of Affiliated Issuer (Note G) | | | 11 | | |
Total Investment Income | | | 365 | | |
Expenses: | |
Advisory Fees (Note B) | | | 160 | | |
Professional Fees | | | 103 | | |
Registration Fees | | | 70 | | |
Shareholder Services Fees — Class A (Note D) | | | 6 | | |
Distribution and Shareholder Services Fees — Class L (Note D) | | | 11 | | |
Distribution and Shareholder Services Fees — Class C (Note D) | | | 24 | | |
Custodian Fees (Note F) | | | 26 | | |
Administration Fees (Note C) | | | 18 | | |
Shareholder Reporting Fees | | | 17 | | |
Transfer Agency Fees — Class I (Note E) | | | 2 | | |
Transfer Agency Fees — Class A (Note E) | | | 2 | | |
Transfer Agency Fees — Class L (Note E) | | | 2 | | |
Transfer Agency Fees — Class C (Note E) | | | 2 | | |
Transfer Agency Fees — Class IS (Note E) | | | 3 | | |
Sub Transfer Agency Fees — Class I | | | 6 | | |
Sub Transfer Agency Fees — Class A | | | 1 | | |
Sub Transfer Agency Fees — Class L | | | 1 | | |
Sub Transfer Agency Fees — Class C | | | 1 | | |
Directors' Fees and Expenses | | | 7 | | |
Pricing Fees | | | 3 | | |
Other Expenses | | | 15 | | |
Total Expenses | | | 480 | | |
Waiver of Advisory Fees (Note B) | | | (160 | ) | |
Expenses Reimbursed by Adviser (Note B) | | | (65 | ) | |
Reimbursement of Class Specific Expenses — Class I (Note B) | | | (3 | ) | |
Reimbursement of Class Specific Expenses — Class A (Note B) | | | (— | @) | |
Reimbursement of Class Specific Expenses — Class L (Note B) | | | (1 | ) | |
Reimbursement of Class Specific Expenses — Class IS (Note B) | | | (3 | ) | |
Rebate from Morgan Stanley Affiliate (Note G) | | | (1 | ) | |
Net Expenses | | | 247 | | |
Net Investment Income | | | 118 | | |
Realized Gain (Loss): | |
Investments Sold | | | 553 | | |
Foreign Currency Translation | | | (— | @) | |
Net Realized Gain | | | 553 | | |
Change in Unrealized Appreciation (Depreciation): | |
Investments | | | 4,945 | | |
Foreign Currency Translation | | | — | @ | |
Net Change in Unrealized Appreciation (Depreciation) | | | 4,945 | | |
Net Realized Gain and Change in Unrealized Appreciation (Depreciation) | | | 5,498 | | |
Net Increase in Net Assets Resulting from Operations | | $ | 5,616 | | |
@ Amount is less than $500.
The accompanying notes are an integral part of the financial statements.
10
Morgan Stanley Institutional Fund, Inc.
Annual Report — December 31, 2019
Statements of Changes in Net Assets | | Year Ended
December 31, 2019
(000) | | Year Ended
December 31, 2018
(000) | |
Increase (Decrease) in Net Assets: | |
Operations: | |
Net Investment Income | | $ | 118 | | | $ | 76 | | |
Net Realized Gain | | | 553 | | | | 1,325 | | |
Net Change in Unrealized Appreciation (Depreciation) | | | 4,945 | | | | (1,352 | ) | |
Net Increase in Net Assets Resulting from Operations | | | 5,616 | | | | 49 | | |
Dividends and Distributions to Shareholders: | |
Class I | | | (382 | ) | | | (465 | ) | |
Class A | | | (66 | ) | | | (128 | ) | |
Class L | | | (31 | ) | | | (105 | ) | |
Class C | | | (62 | ) | | | (136 | ) | |
Class IS | | | (198 | ) | | | (337 | ) | |
Total Dividends and Distributions to Shareholders | | | (739 | ) | | | (1,171 | ) | |
Capital Share Transactions:(1) | |
Class I: | |
Subscribed | | | 7,782 | | | | 4,256 | | |
Distributions Reinvested | | | 383 | | | | 290 | | |
Redeemed | | | (1,403 | ) | | | (3,702 | ) | |
Class A: | |
Subscribed | | | 1,369 | | | | 389 | | |
Distributions Reinvested | | | 66 | | | | 118 | | |
Redeemed | | | (871 | ) | | | (787 | ) | |
Class L: | |
Distributions Reinvested | | | 31 | | | | 96 | | |
Redeemed | | | (303 | ) | | | (239 | ) | |
Class C: | |
Subscribed | | | 715 | | | | 755 | | |
Distributions Reinvested | | | 62 | | | | 135 | | |
Redeemed | | | (264 | ) | | | (334 | ) | |
Class IS: | |
Subscribed | | | 1,000 | | | | 5,000 | | |
Distributions Reinvested | | | 199 | | | | 336 | | |
Redeemed | | | (— | @) | | | — | | |
Net Increase in Net Assets Resulting from Capital Share Transactions | | | 8,766 | | | | 6,313 | | |
Total Increase in Net Assets | | | 13,643 | | | | 5,191 | | |
Net Assets: | |
Beginning of Period | | | 15,821 | | | | 10,630 | | |
End of Period | | $ | 29,464 | | | $ | 15,821 | | |
The accompanying notes are an integral part of the financial statements.
11
Morgan Stanley Institutional Fund, Inc.
Annual Report — December 31, 2019
Statements of Changes in Net Assets (cont'd) | | Year Ended
December 31, 2019
(000) | | Year Ended
December 31, 2018
(000) | |
(1) Capital Share Transactions: | |
Class I: | |
Shares Subscribed | | | 573 | | | | 346 | | |
Shares Issued on Distributions Reinvested | | | 26 | | | | 24 | | |
Shares Redeemed | | | (102 | ) | | | (289 | ) | |
Net Increase in Class I Shares Outstanding | | | 497 | | | | 81 | | |
Class A: | |
Shares Subscribed | | | 101 | | | | 33 | | |
Shares Issued on Distributions Reinvested | | | 5 | | | | 10 | | |
Shares Redeemed | | | (65 | ) | | | (61 | ) | |
Net Increase (Decrease) in Class A Shares Outstanding | | | 41 | | | | (18 | ) | |
Class L: | |
Shares Issued on Distributions Reinvested | | | 2 | | | | 8 | | |
Shares Redeemed | | | (22 | ) | | | (19 | ) | |
Net Decrease in Class L Shares Outstanding | | | (20 | ) | | | (11 | ) | |
Class C: | |
Shares Subscribed | | | 55 | | | | 62 | | |
Shares Issued on Distributions Reinvested | | | 4 | | | | 12 | | |
Shares Redeemed | | | (20 | ) | | | (27 | ) | |
Net Increase in Class C Shares Outstanding | | | 39 | | | | 47 | | |
Class IS: | |
Shares Subscribed | | | 75 | | | | 389 | | |
Shares Issued on Distributions Reinvested | | | 14 | | | | 29 | | |
Shares Redeemed | | | (— | @@) | | | — | | |
Net Increase in Class IS Shares Outstanding | | | 89 | | | | 418 | | |
@ Amount is less than $500.
@@ Amount is less than 500 shares.
The accompanying notes are an integral part of the financial statements.
12
Morgan Stanley Institutional Fund, Inc.
Annual Report — December 31, 2019
Financial Highlights
Global Sustain Portfolio
| | | Class I | |
| | | Year Ended December 31, | |
Selected Per Share Data and Ratios | | 2019 | | 2018 | | 2017 | | 2016(1) | | 2015 | |
Net Asset Value, Beginning of Period | | $ | 11.58 | | | $ | 12.47 | | | $ | 10.81 | | | $ | 11.43 | | | $ | 11.34 | | |
Income (Loss) from Investment Operations: | |
Net Investment Income(2) | | | 0.09 | | | | 0.12 | | | | 0.13 | | | | 0.17 | | | | 0.15 | | |
Net Realized and Unrealized Gain (Loss) | | | 3.38 | | | | (0.04 | ) | | | 2.35 | | | | 0.29 | | | | 0.46 | | |
Total from Investment Operations | | | 3.47 | | | | 0.08 | | | | 2.48 | | | | 0.46 | | | | 0.61 | | |
Distributions from and/or in Excess of: | |
Net Investment Income | | | (0.08 | ) | | | (0.07 | ) | | | (0.13 | ) | | | (0.20 | ) | | | (0.18 | ) | |
Net Realized Gain | | | (0.31 | ) | | | (0.90 | ) | | | (0.69 | ) | | | (0.88 | ) | | | (0.34 | ) | |
Total Distributions | | | (0.39 | ) | | | (0.97 | ) | | | (0.82 | ) | | | (1.08 | ) | | | (0.52 | ) | |
Net Asset Value, End of Period | | $ | 14.66 | | | $ | 11.58 | | | $ | 12.47 | | | $ | 10.81 | | | $ | 11.43 | | |
Total Return(3) | | | 30.03 | % | | | 0.60 | % | | | 22.86 | % | | | 4.20 | % | | | 5.27 | % | |
Ratios to Average Net Assets and Supplemental Data: | |
Net Assets, End of Period (Thousands) | | $ | 14,756 | | | $ | 5,891 | | | $ | 5,334 | | | $ | 3,993 | | | $ | 8,531 | | |
Ratio of Expenses Before Expense Limitation | | | 1.92 | % | | | 2.86 | % | | | 3.54 | % | | | 2.45 | % | | | 2.21 | % | |
Ratio of Expenses After Expense Limitation | | | 0.90 | %(4) | | | 0.93 | %(4)(5) | | | 1.00 | %(4) | | | 0.99 | %(4) | | | 0.97 | %(4) | |
Ratio of Net Investment Income | | | 0.68 | %(4) | | | 0.97 | %(4) | | | 1.10 | %(4) | | | 1.46 | %(4) | | | 1.26 | %(4) | |
Ratio of Rebate from Morgan Stanley Affiliates | | | 0.00 | %(6) | | | 0.00 | %(6) | | | 0.00 | %(6) | | | 0.00 | %(6) | | | 0.00 | %(6) | |
Portfolio Turnover Rate | | | 14 | % | | | 76 | % | | | 39 | % | | | 35 | % | | | 61 | % | |
(1) Reflects prior period custodian out-of-pocket expenses that were reimbursed in September 2016. The amount of the reimbursement was immaterial on a per share basis and did not impact the total return of Class I shares. The Ratio of Expenses After Expense Limitation and the Ratio of Net Investment Income would be unchanged as the reimbursement of custodian fees was offset against expense waivers/reimbursements with no impact to net expenses or net investment income.
(2) Per share amount is based on average shares outstanding.
(3) Calculated based on the net asset value as of the last business day of the period.
(4) The Ratio of Expenses After Expenses Limitation and Ratio of Net Investment Income reflect the rebate of certain Fund expenses in connection with the investments in Morgan Stanley affiliates during the period. The effect of the rebate on the ratios is disclosed in the above table as "Ratio of Rebate from Morgan Stanley Affiliates."
(5) Effective April 30, 2018, the Adviser has agreed to limit the ratio of expenses to average net assets to the maximum ratio of 0.90% for Class I shares. Prior to April 30, 2018, the maximum ratio was 1.00% for Class I shares.
(6) Amount is less than 0.005%.
The accompanying notes are an integral part of the financial statements.
13
Morgan Stanley Institutional Fund, Inc.
Annual Report — December 31, 2019
Financial Highlights
Global Sustain Portfolio
| | | Class A | |
| | | Year Ended December 31, | |
Selected Per Share Data and Ratios | | 2019 | | 2018 | | 2017 | | 2016(1) | | 2015 | |
Net Asset Value, Beginning of Period | | $ | 11.56 | | | $ | 12.44 | | | $ | 10.79 | | | $ | 11.40 | | | $ | 11.32 | | |
Income (Loss) from Investment Operations: | |
Net Investment Income(2) | | | 0.05 | | | | 0.07 | | | | 0.08 | | | | 0.11 | | | | 0.11 | | |
Net Realized and Unrealized Gain (Loss) | | | 3.36 | | | | (0.03 | ) | | | 2.35 | | | | 0.32 | | | | 0.45 | | |
Total from Investment Operations | | | 3.41 | | | | 0.04 | | | | 2.43 | | | | 0.43 | | | | 0.56 | | |
Distributions from and/or in Excess of: | |
Net Investment Income | | | (0.04 | ) | | | (0.02 | ) | | | (0.09 | ) | | | (0.16 | ) | | | (0.14 | ) | |
Net Realized Gain | | | (0.31 | ) | | | (0.90 | ) | | | (0.69 | ) | | | (0.88 | ) | | | (0.34 | ) | |
Total Distributions | | | (0.35 | ) | | | (0.92 | ) | | | (0.78 | ) | | | (1.04 | ) | | | (0.48 | ) | |
Net Asset Value, End of Period | | $ | 14.62 | | | $ | 11.56 | | | $ | 12.44 | | | $ | 10.79 | | | $ | 11.40 | | |
Total Return(3) | | | 29.53 | % | | | 0.26 | % | | | 22.45 | % | | | 3.83 | % | | | 4.91 | % | |
Ratios to Average Net Assets and Supplemental Data: | |
Net Assets, End of Period (Thousands) | | $ | 2,949 | | | $ | 1,872 | | | $ | 2,243 | | | $ | 2,182 | | | $ | 3,246 | | |
Ratio of Expenses Before Expense Limitation | | | 2.25 | % | | | 3.21 | % | | | 3.90 | % | | | 2.85 | % | | | 2.52 | % | |
Ratio of Expenses After Expense Limitation | | | 1.25 | %(4) | | | 1.28 | %(4)(5) | | | 1.35 | %(4) | | | 1.33 | %(4) | | | 1.30 | %(4) | |
Ratio of Net Investment Income | | | 0.35 | %(4) | | | 0.57 | %(4) | | | 0.66 | %(4) | | | 0.98 | %(4) | | | 0.98 | %(4) | |
Ratio of Rebate from Morgan Stanley Affiliates | | | 0.00 | %(6) | | | 0.00 | %(6) | | | 0.00 | %(6) | | | 0.00 | %(6) | | | 0.00 | %(6) | |
Portfolio Turnover Rate | | | 14 | % | | | 76 | % | | | 39 | % | | | 35 | % | | | 61 | % | |
(1) Reflects prior period custodian out-of-pocket expenses that were reimbursed in September 2016. The amount of the reimbursement was immaterial on a per share basis and did not impact the total return of Class A shares. The Ratio of Expenses After Expense Limitation and the Ratio of Net Investment Income would be unchanged as the reimbursement of custodian fees was offset against expense waivers/reimbursements with no impact to net expenses or net investment income.
(2) Per share amount is based on average shares outstanding.
(3) Calculated based on the net asset value which does not reflect sales charges, if applicable, as of the last business day of the period.
(4) The Ratio of Expenses After Expenses Limitation and Ratio of Net Investment Income reflect the rebate of certain Fund expenses in connection with the investments in Morgan Stanley affiliates during the period. The effect of the rebate on the ratios is disclosed in the above table as "Ratio of Rebate from Morgan Stanley Affiliates."
(5) Effective April 30, 2018, the Adviser has agreed to limit the ratio of expenses to average net assets to the maximum ratio of 1.25% for Class A shares. Prior to April 30, 2018, the maximum ratio was 1.35% for Class A shares.
(6) Amount is less than 0.005%.
The accompanying notes are an integral part of the financial statements.
14
Morgan Stanley Institutional Fund, Inc.
Annual Report — December 31, 2019
Financial Highlights
Global Sustain Portfolio
| | | Class L | |
| | | Year Ended December 31, | |
Selected Per Share Data and Ratios | | 2019 | | 2018 | | 2017 | | 2016(1) | | 2015 | |
Net Asset Value, Beginning of Period | | $ | 11.47 | | | $ | 12.41 | | | $ | 10.76 | | | $ | 11.37 | | | $ | 11.29 | | |
Income (Loss) from Investment Operations: | |
Net Investment Income (Loss)(2) | | | (0.01 | ) | | | 0.01 | | | | 0.03 | | | | 0.06 | | | | 0.05 | | |
Net Realized and Unrealized Gain (Loss) | | | 3.33 | | | | (0.04 | ) | | | 2.32 | | | | 0.31 | | | | 0.45 | | |
Total from Investment Operations | | | 3.32 | | | | (0.03 | ) | | | 2.35 | | | | 0.37 | | | | 0.50 | | |
Distributions from and/or in Excess of: | |
Net Investment Income | | | — | | | | (0.01 | ) | | | (0.01 | ) | | | (0.10 | ) | | | (0.08 | ) | |
Net Realized Gain | | | (0.31 | ) | | | (0.90 | ) | | | (0.69 | ) | | | (0.88 | ) | | | (0.34 | ) | |
Total Distributions | | | (0.31 | ) | | | (0.91 | ) | | | (0.70 | ) | | | (0.98 | ) | | | (0.42 | ) | |
Net Asset Value, End of Period | | $ | 14.48 | | | $ | 11.47 | | | $ | 12.41 | | | $ | 10.76 | | | $ | 11.37 | | |
Total Return(3) | | | 28.87 | % | | | (0.25 | )% | | | 21.80 | % | | | 3.31 | % | | | 4.49 | % | |
Ratios to Average Net Assets and Supplemental Data: | |
Net Assets, End of Period (Thousands) | | $ | 1,437 | | | $ | 1,365 | | | $ | 1,611 | | | $ | 2,194 | | | $ | 2,848 | | |
Ratio of Expenses Before Expense Limitation | | | 2.77 | % | | | 3.73 | % | | | 4.39 | % | | | 3.35 | % | | | 3.06 | % | |
Ratio of Expenses After Expense Limitation | | | 1.75 | %(4) | | | 1.78 | %(4)(5) | | | 1.85 | %(4) | | | 1.81 | %(4) | | | 1.81 | %(4) | |
Ratio of Net Investment Income (Loss) | | | (0.09 | )%(4) | | | 0.04 | %(4) | | | 0.24 | %(4) | | | 0.52 | %(4) | | | 0.46 | %(4) | |
Ratio of Rebate from Morgan Stanley Affiliates | | | 0.00 | %(6) | | | 0.00 | %(6) | | | 0.00 | %(6) | | | 0.00 | %(6) | | | 0.00 | %(6) | |
Portfolio Turnover Rate | | | 14 | % | | | 76 | % | | | 39 | % | | | 35 | % | | | 61 | % | |
(1) Reflects prior period custodian out-of-pocket expenses that were reimbursed in September 2016. The amount of the reimbursement was immaterial on a per share basis and did not impact the total return of Class L shares. The Ratio of Expenses After Expense Limitation and the Ratio of Net Investment Income would be unchanged as the reimbursement of custodian fees was offset against expense waivers/reimbursements with no impact to net expenses or net investment income.
(2) Per share amount is based on average shares outstanding.
(3) Calculated based on the net asset value as of the last business day of the period.
(4) The Ratio of Expenses After Expenses Limitation and Ratio of Net Investment Income (Loss) reflect the rebate of certain Fund expenses in connection with the investments in Morgan Stanley affiliates during the period. The effect of the rebate on the ratios is disclosed in the above table as "Ratio of Rebate from Morgan Stanley Affiliates."
(5) Effective April 30, 2018, the Adviser has agreed to limit the ratio of expenses to average net assets to the maximum ratio of 1.75% for Class L shares. Prior to April 30, 2018, the maximum ratio was 1.85% for Class L shares.
(6) Amount is less than 0.005%.
The accompanying notes are an integral part of the financial statements.
15
Morgan Stanley Institutional Fund, Inc.
Annual Report — December 31, 2019
Financial Highlights
Global Sustain Portfolio
| | | Class C | |
| | | Year Ended December 31, | | Period from
April 30, 2015(2) to | |
Selected Per Share Data and Ratios | | 2019 | | 2018 | | 2017 | | 2016(1) | | December 31, 2015 | |
Net Asset Value, Beginning of Period | | $ | 11.30 | | | $ | 12.26 | | | $ | 10.67 | | | $ | 11.30 | | | $ | 11.77 | | |
Income (Loss) from Investment Operations: | |
Net Investment Income (Loss)(3) | | | (0.05 | ) | | | (0.03 | ) | | | (0.01 | ) | | | 0.02 | | | | (0.03 | ) | |
Net Realized and Unrealized Gain (Loss) | | | 3.28 | | | | (0.02 | ) | | | 2.30 | | | | 0.32 | | | | 0.02 | | |
Total from Investment Operations | | | 3.23 | | | | (0.05 | ) | | | 2.29 | | | | 0.34 | | | | (0.01 | ) | |
Distributions from and/or in Excess of: | |
Net Investment Income | | | — | | | | (0.01 | ) | | | (0.01 | ) | | | (0.09 | ) | | | (0.12 | ) | |
Net Realized Gain | | | (0.31 | ) | | | (0.90 | ) | | | (0.69 | ) | | | (0.88 | ) | | | (0.34 | ) | |
Total Distributions | | | (0.31 | ) | | | (0.91 | ) | | | (0.70 | ) | | | (0.97 | ) | | | (0.46 | ) | |
Net Asset Value, End of Period | | $ | 14.22 | | | $ | 11.30 | | | $ | 12.26 | | | $ | 10.67 | | | $ | 11.30 | | |
Total Return(4) | | | 28.63 | % | | | (0.50 | )% | | | 21.46 | % | | | 3.06 | % | | | (0.13 | )%(8) | |
Ratios to Average Net Assets and Supplemental Data: | |
Net Assets, End of Period (Thousands) | | $ | 2,872 | | | $ | 1,846 | | | $ | 1,430 | | | $ | 819 | | | $ | 648 | | |
Ratio of Expenses Before Expense Limitation | | | 2.97 | % | | | 4.00 | % | | | 4.71 | % | | | 3.83 | % | | | 3.80 | %(9) | |
Ratio of Expenses After Expense Limitation | | | 1.98 | %(5) | | | 2.02 | %(5)(6) | | | 2.10 | %(5) | | | 2.10 | %(5) | | | 2.10 | %(5)(9) | |
Ratio of Net Investment Income (Loss) | | | (0.38 | )%(5) | | | (0.24 | )%(5) | | | (0.06 | )%(5) | | | 0.17 | %(5) | | | (0.39 | )%(5)(9) | |
Ratio of Rebate from Morgan Stanley Affiliates | | | 0.00 | %(7) | | | 0.00 | %(7) | | | 0.00 | %(7) | | | 0.00 | %(7) | | | 0.00 | %(7)(9) | |
Portfolio Turnover Rate | | | 14 | % | | | 76 | % | | | 39 | % | | | 35 | % | | | 61 | % | |
(1) Reflects prior period custodian out-of-pocket expenses that were reimbursed in September 2016. The amount of the reimbursement was immaterial on a per share basis and did not impact the total return of Class C shares. The Ratio of Expenses After Expense Limitation and the Ratio of Net Investment Income would be unchanged as the reimbursement of custodian fees was offset against expense waivers/reimbursements with no impact to net expenses or net investment income.
(2) Commencement of Offering.
(3) Per share amount is based on average shares outstanding.
(4) Calculated based on the net asset value which does not reflect sales charges, if applicable, as of the last business day of the period.
(5) The Ratio of Expenses After Expenses Limitation and Ratio of Net Investment Income (Loss) reflect the rebate of certain Fund expenses in connection with the investments in Morgan Stanley affiliates during the period. The effect of the rebate on the ratios is disclosed in the above table as "Ratio of Rebate from Morgan Stanley Affiliates."
(6) Effective April 30, 2018, the Adviser has agreed to limit the ratio of expenses to average net assets to the maximum ratio of 2.00% for Class C shares. Prior to April 30, 2018, the maximum ratio was 2.10% for Class C shares.
(7) Amount is less than 0.005%.
(8) Not annualized.
(9) Annualized.
The accompanying notes are an integral part of the financial statements.
16
Morgan Stanley Institutional Fund, Inc.
Annual Report — December 31, 2019
Financial Highlights
Global Sustain Portfolio
| | | Class IS | |
| | | Year Ended December 31, | |
Selected Per Share Data and Ratios | | 2019 | | 2018 | | 2017 | | 2016(1) | | 2015 | |
Net Asset Value, Beginning of Period | | $ | 11.58 | | | $ | 12.47 | | | $ | 10.81 | | | $ | 11.43 | | | $ | 11.34 | | |
Income (Loss) from Investment Operations: | |
Net Investment Income(2) | | | 0.11 | | | | 0.05 | | | | 0.14 | | | | 0.16 | | | | 0.16 | | |
Net Realized and Unrealized Gain | | | 3.37 | | | | 0.04 | | | | 2.34 | | | | 0.31 | | | | 0.45 | | |
Total from Investment Operations | | | 3.48 | | | | 0.09 | | | | 2.48 | | | | 0.47 | | | | 0.61 | | |
Distributions from and/or in Excess of: | |
Net Investment Income | | | (0.09 | ) | | | (0.08 | ) | | | (0.13 | ) | | | (0.21 | ) | | | (0.18 | ) | |
Net Realized Gain | | | (0.31 | ) | | | (0.90 | ) | | | (0.69 | ) | | | (0.88 | ) | | | (0.34 | ) | |
Total Distributions | | | (0.40 | ) | | | (0.98 | ) | | | (0.82 | ) | | | (1.09 | ) | | | (0.52 | ) | |
Net Asset Value, End of Period | | $ | 14.66 | | | $ | 11.58 | | | $ | 12.47 | | | $ | 10.81 | | | $ | 11.43 | | |
Total Return(3) | | | 30.08 | % | | | 0.66 | % | | | 22.91 | % | | | 4.17 | % | | | 5.38 | % | |
Ratios to Average Net Assets and Supplemental Data: | |
Net Assets, End of Period (Thousands) | | $ | 7,450 | | | $ | 4,847 | | | $ | 12 | | | $ | 11 | | | $ | 11 | | |
Ratio of Expenses Before Expense Limitation | | | 1.88 | % | | | 3.12 | % | | | 19.10 | % | | | 19.36 | % | | | 16.35 | % | |
Ratio of Expenses After Expense Limitation | | | 0.85 | %(4) | | | 0.85 | %(4)(5) | | | 0.95 | %(4) | | | 0.95 | %(4) | | | 0.95 | %(4) | |
Ratio of Net Investment Income | | | 0.79 | %(4) | | | 0.41 | %(4) | | | 1.15 | %(4) | | | 1.35 | %(4) | | | 1.31 | %(4) | |
Ratio of Rebate from Morgan Stanley Affiliates | | | 0.00 | %(6) | | | 0.00 | %(6) | | | 0.00 | %(6) | | | 0.00 | %(6) | | | 0.00 | %(6) | |
Portfolio Turnover Rate | | | 14 | % | | | 76 | % | | | 39 | % | | | 35 | % | | | 61 | % | |
(1) Reflects prior period custodian out-of-pocket expenses that were reimbursed in September 2016. The amount of the reimbursement was immaterial on a per share basis and did not impact the total return of Class IS shares. The Ratio of Expenses After Expense Limitation and the Ratio of Net Investment Income would be unchanged as the reimbursement of custodian fees was offset against expense waivers/reimbursements with no impact to net expenses or net investment income.
(2) Per share amount is based on average shares outstanding.
(3) Calculated based on the net asset value as of the last business day of the period.
(4) The Ratio of Expenses After Expenses Limitation and Ratio of Net Investment Income reflect the rebate of certain Fund expenses in connection with the investments in Morgan Stanley affiliates during the period. The effect of the rebate on the ratios is disclosed in the above table as "Ratio of Rebate from Morgan Stanley Affiliates."
(5) Effective April 30, 2018, the Adviser has agreed to limit the ratio of expenses to average net assets to the maximum ratio of 0.85% for Class IS shares. Prior to April 30, 2018, the maximum ratio was 0.95% for Class IS shares.
(6) Amount is less than 0.005%.
The accompanying notes are an integral part of the financial statements.
17
Morgan Stanley Institutional Fund, Inc.
Annual Report — December 31, 2019
Notes to Financial Statements
Morgan Stanley Institutional Fund, Inc. (the "Company") is registered under the Investment Company Act of 1940, as amended (the "Act"), as an open-end management investment company. The Company is comprised of thirty-two separate, active, diversified and non-diversified funds (individually referred to as a "Fund," collectively as the "Funds"). The Company applies investment company accounting and reporting guidance.
The accompanying financial statements relate to the Global Sustain Portfolio. The Fund seeks long-term capital appreciation.
The Fund offers five classes of shares — Class I, Class A, Class L, Class C and Class IS. On April 30, 2015, the Fund suspended offering of Class L shares. Existing Class L shareholders may invest through reinvestment of dividends and distributions.
A. Significant Accounting Policies: The following significant accounting policies are in conformity with U.S. generally accepted accounting principles ("GAAP"). Such policies are consistently followed by the Company in the preparation of its financial statements. GAAP may require management to make estimates and assumptions that affect the reported amounts and disclosures in the financial statements. Actual results may differ from those estimates.
In August 2018, the Financial Accounting Standards Board ("FASB") issued Accounting Standards Update ("ASU") 2018-13, Fair Value Measurement (Topic 820) — Disclosures Framework — Changes to Disclosure Requirements of Fair Value Measurement ("ASU 2018-13") which introduces new fair value disclosure requirements as well as eliminates and modifies certain existing fair value disclosure requirements. ASU 2018-13 would be effective for fiscal years beginning after December 15, 2019 and for interim periods within those fiscal years; however, management has elected to early adopt ASU 2018-13 as permitted by the standard. The impact of the Fund's adoption was limited to changes in the Fund's financial statement disclosures regarding fair value, primarily those disclosures related to transfers between levels of the fair value hierarchy and disclosure of the range and weighted average used to develop significant unobservable inputs for Level 3 fair value measurements, when applicable.
1. Security Valuation: (1) An equity portfolio security listed or traded on an exchange is valued at its latest reported sales price (or at the exchange official closing price if such exchange reports an official closing price), and if
there were no sales on a given day and if there is no official exchange closing price for that day, the security is valued at the mean between the last reported bid and asked prices if such bid and asked prices are available on the relevant exchanges. If only bid prices are available then the latest bid price may be used. Listed equity securities not traded on the valuation date with no reported bid and asked prices available on the exchange are valued at the mean between the current bid and asked prices obtained from one or more reputable brokers or dealers. In cases where a security is traded on more than one exchange, the security is valued on the exchange designated as the primary market; (2) all other equity portfolio securities for which over-the-counter ("OTC") market quotations are readily available are valued at the latest reported sales price (or at the market official closing price if such market reports an official closing price), and if there was no trading in the security on a given day and if there is no official closing price from relevant markets for that day, the security is valued at the mean between the last reported bid and asked prices if such bid and asked prices are available on the relevant markets. An unlisted equity security that does not trade on the valuation date and for which bid and asked prices from the relevant markets are unavailable is valued at the mean between the current bid and asked prices obtained from one or more reputable brokers or dealers; (3) certain portfolio securities may be valued by an outside pricing service/vendor approved by the Company's Board of Directors (the "Directors"). The pricing service/vendor may employ a pricing model that takes into account, among other things, bids, yield spreads and/or other market data and specific security characteristics. Alternatively, if a valuation is not available from an outside pricing service/vendor, and the security trades on an exchange, the security may be valued at its latest reported sale price (or at the exchange official closing price if such exchange reports an official closing price), prior to the time when assets are valued. If there are no sales on a given day and if there is no official exchange closing price for that day, the security is valued at the mean between the last reported bid and asked prices if such bid and asked prices are available in the relevant exchanges. If Morgan Stanley Investment Management Inc. (the "Adviser") or Morgan Stanley Investment Management Limited ("MSIM Limited") (the "Sub-Adviser"), each a wholly-owned subsidiary of Morgan Stanley, determines that the price provided by the
18
Morgan Stanley Institutional Fund, Inc.
Annual Report — December 31, 2019
Notes to Financial Statements (cont'd)
outside pricing service/vendor or exchange does not reflect the security's fair value or is unable to provide a price, prices from brokers or dealers may also be utilized. In these circumstances, the value of the security will be the mean of bid and asked prices obtained from brokers or dealers; (4) when market quotations are not readily available, including circumstances under which the Adviser or the Sub-Adviser, each a wholly-owned subsidiary of Morgan Stanley determines that the closing price, last sale price or the mean between the last reported bid and asked prices are not reflective of a security's market value, portfolio securities are valued at their fair value as determined in good faith under procedures established by and under the general supervision of the Directors. Occasionally, developments affecting the closing prices of securities and other assets may occur between the times at which valuations of such securities are determined (that is, close of the foreign market on which the securities trade) and the close of business of the New York Stock Exchange ("NYSE"). If developments occur during such periods that are expected to materially affect the value of such securities, such valuations may be adjusted to reflect the estimated fair value of such securities as of the close of the NYSE, as determined in good faith by the Directors or by the Adviser using a pricing service and/or procedures approved by the Directors; (5) quotations of foreign portfolio securities, other assets and liabilities and forward contracts stated in foreign currency are translated into U.S. dollar equivalents at the prevailing market rates prior to the close of the NYSE; and (6) investments in mutual funds, including the Morgan Stanley Institutional Liquidity Funds, are valued at the net asset value ("NAV") as of the close of each business day.
The Directors have responsibility for determining in good faith the fair value of the investments, and the Directors may appoint others, such as the Company's Adviser or a valuation committee, to assist the Directors in determining fair value and to make the actual calculations pursuant to the fair valuation methodologies previously approved by the Directors. Under procedures approved by the Directors, the Company's Adviser has formed a Valuation Committee whose members are approved by the Directors. The Valuation Committee provides administration and oversight of the Company's valuation policies and procedures, which are reviewed at least annually by the Directors. These procedures allow the Company to utilize independent pricing services,
quotations from securities and financial instrument dealers and other market sources to determine fair value.
2. Fair Value Measurement: FASB Accounting Standards CodificationTM ("ASC") 820, "Fair Value Measurement" ("ASC 820"), defines fair value as the value that the Fund would receive to sell an investment or pay to transfer a liability in a timely transaction with an independent buyer in the principal market, or in the absence of a principal market, the most advantageous market for the investment or liability. ASC 820 establishes a three-tier hierarchy to distinguish between (1) inputs that reflect the assumptions market participants would use in valuing an asset or liability developed based on market data obtained from sources independent of the reporting entity (observable inputs) and (2) inputs that reflect the reporting entity's own assumptions about the assumptions market participants would use in valuing an asset or liability developed based on the best information available in the circumstances (unobservable inputs) and to establish classification of fair value measurements for disclosure purposes. Various inputs are used in determining the value of the Fund's investments. The inputs are summarized in the three broad levels listed below:
• Level 1 – unadjusted quoted prices in active markets for identical investments
• Level 2 – other significant observable inputs (including quoted prices for similar investments, interest rates, prepayment speeds, credit risk, etc.)
• Level 3 – significant unobservable inputs including the Fund's own assumptions in determining the fair value of investments. Factors considered in making this determination may include, but are not limited to, information obtained by contacting the issuer, analysts, or the appropriate stock exchange (for exchange-traded securities), analysis of the issuer's financial statements or other available documents and, if necessary, available information concerning other securities in similar circumstances.
The inputs or methodology used for valuing securities are not necessarily an indication of the risk associated with investing in those securities and the determination of the significance of a particular input to the fair value
19
Morgan Stanley Institutional Fund, Inc.
Annual Report — December 31, 2019
Notes to Financial Statements (cont'd)
measurement in its entirety requires judgment and considers factors specific to each security.
The following is a summary of the inputs used to value the Fund's investments as of December 31, 2019:
Investment Type | | Level 1
Unadjusted
quoted
prices
(000) | | Level 2
Other
significant
observable
inputs
(000) | | Level 3
Significant
unobservable
inputs
(000) | | Total
(000) | |
Assets: | |
Common Stocks | |
Beverages | | $ | 672 | | | $ | — | | | $ | — | | | $ | 672 | | |
Capital Markets | | | 572 | | | | — | | | | — | | | | 572 | | |
Electronic Equipment,
Instruments &
Components | | | 337 | | | | — | | | | — | | | | 337 | | |
Health Care Equipment &
Supplies | | | 5,319 | | | | — | | | | — | | | | 5,319 | | |
Health Care Technology | | | 501 | | | | — | | | | — | | | | 501 | | |
Household Products | | | 2,012 | | | | 958 | | | | — | | | | 2,970 | | |
Information Technology
Services | | | 4,675 | | | | — | | | | — | | | | 4,675 | | |
Insurance | | | 1,024 | | | | — | | | | — | | | | 1,024 | | |
Interactive Media &
Services | | | 1,560 | | | | — | | | | — | | | | 1,560 | | |
Life Sciences Tools &
Services | | | 886 | | | | — | | | | — | | | | 886 | | |
Media | | | 414 | | | | — | | | | — | | | | 414 | | |
Personal Products | | | 1,006 | | | | — | | | | — | | | | 1,006 | | |
Pharmaceuticals | | | 1,803 | | | | — | | | | — | | | | 1,803 | | |
Professional Services | | | 1,099 | | | | — | | | | — | | | | 1,099 | | |
Semiconductors &
Semiconductor
Equipment | | | 451 | | | | — | | | | — | | | | 451 | | |
Software | | | 2,978 | | | | 1,731 | | | | — | | | | 4,709 | | |
Textiles, Apparel &
Luxury Goods | | | 578 | | | | — | | | | — | | | | 578 | | |
Total Common Stocks | | | 25,887 | | | | 2,689 | | | | — | | | | 28,576 | | |
Short-Term Investment | |
Investment Company | | | 848 | | | | — | | | | — | | | | 848 | | |
Total Assets | | $ | 26,735 | | | $ | 2,689 | | | $ | — | | | $ | 29,424 | | |
Transfers between investment levels may occur as the markets fluctuate and/or the availability of data used in an investment's valuation changes.
3. Foreign Currency Translation and Foreign Investments: The books and records of the Fund are maintained in U.S. dollars. Foreign currency amounts are translated into U.S. dollars as follows:
– investments, other assets and liabilities at the prevailing rate of exchange on the valuation date;
– investment transactions and investment income at the prevailing rates of exchange on the dates of such transactions.
Although the net assets of the Fund are presented at the foreign exchange rates and market values at the close of the period, the Fund does not isolate that portion of the results of operations arising as a result of changes in the foreign exchange rates from the fluctuations arising from changes in the market prices of securities held at period end. Similarly, the Fund does not isolate the effect of changes in foreign exchange rates from the fluctuations arising from changes in the market prices of securities sold during the period. Accordingly, realized and unrealized foreign currency gains (losses) on investments in securities are included in the reported net realized and unrealized gains (losses) on investment transactions and balances. However, pursuant to U.S. federal income tax regulations, gains and losses from certain foreign currency transactions and the foreign currency portion of gains and losses realized on sales and maturities of foreign denominated debt securities are treated as ordinary income for U.S. federal income tax purposes.
Net realized gains (losses) on foreign currency transactions represent net foreign exchange gains (losses) from foreign currency forward exchange contracts, disposition of foreign currencies, currency gains (losses) realized between the trade and settlement dates on securities transactions, and the difference between the amount of investment income and foreign withholding taxes recorded on the Fund's books and the U.S. dollar equivalent amounts actually received or paid. The change in unrealized currency gains (losses) on foreign currency transactions for the period is reflected in the Statement of Operations.
Foreign security and currency transactions may involve certain considerations and risks not typically associated with those of U.S. dollar denominated transactions as a result of, among other factors, fluctuations of exchange rates in relation to the U.S. dollar, the possibility of lower levels of governmental supervision and regulation of foreign securities markets and the possibility of political or economic instability.
20
Morgan Stanley Institutional Fund, Inc.
Annual Report — December 31, 2019
Notes to Financial Statements (cont'd)
Governmental approval for foreign investments may be required in advance of making an investment under certain circumstances in some countries, and the extent of foreign investments in domestic companies may be subject to limitation in other countries. Foreign ownership limitations also may be imposed by the charters of individual companies to prevent, among other concerns, violations of foreign investment limitations. As a result, an additional class of shares (identified as "Foreign" in the Portfolio of Investments) may be created and offered for investment. The "local" and "foreign shares" market values may differ. In the absence of trading of the foreign shares in such markets, the Fund values the foreign shares at the closing exchange price of the local shares.
4. Indemnifications: The Company enters into contracts that contain a variety of indemnifications. The Company's maximum exposure under these arrangements is unknown. However, the Company has not had prior claims or losses pursuant to these contracts and expects the risk of loss to be remote.
5. Dividends and Distributions to Shareholders: Dividends and distributions to shareholders are recorded on the ex-dividend date. Dividends from net investment income, if any, are declared and paid annually. Net realized capital gains, if any, are distributed at least annually.
6. Security Transactions, Income and Expenses: Security transactions are accounted for on the trade date (date the order to buy or sell is executed). Realized gains and losses on the sale of investment securities are determined on the specific identified cost method. Dividend income and other distributions are recorded on the ex-dividend date (except for certain foreign dividends which may be recorded as soon as the Fund is informed of such dividends) net of applicable withholding taxes. Interest income is recognized on the accrual basis except where collection is in doubt. Discounts are accreted and premiums are amortized over the life of the respective securities. Most expenses of the Company can be directly attributed to a particular Fund. Expenses which cannot be directly attributed are apportioned among the Funds based upon relative net assets or other appropriate methods. Income, expenses (other than class specific expenses — distribution and shareholder services, transfer agency and sub transfer agency fees) and realized and unrealized gains or losses are allocated to each class of shares based upon their relative net assets.
B. Advisory/Sub-Advisory Fees: The Adviser, a wholly-owned subsidiary of Morgan Stanley, provides the Fund with advisory services under the terms of an Investment Advisory Agreement, paid quarterly, at the annual rate based on the daily net assets as follows:
First $500
million | | Over $500
million | |
| | 0.70 | % | | | 0.65 | % | |
For the year ended December 31, 2019, the advisory fee rate (net of waiver/rebate) was equivalent to an annual effective rate of 0.00% of the Fund's average daily net assets.
The Adviser has agreed to reduce its advisory fee and/or reimburse the Fund so that total annual Fund operating expenses, excluding certain investment related expenses, taxes, interest and other extraordinary expenses (including litigation), will not exceed 0.90% for Class I shares, 1.25% for Class A shares, 1.75% for Class L shares, 2.00% for Class C shares and 0.85% for Class IS shares. The fee waivers and/or expense reimbursements will continue for at least one year from the date of the Fund's prospectus or until such time as the Directors act to discontinue all or a portion of such waivers and/or reimbursements when they deem such action is appropriate. For the year ended December 31, 2019, approximately $160,000 of advisory fees were waived and approximately $72,000 of other expenses were reimbursed by the Adviser pursuant to this arrangement.
The Adviser has entered into a Sub-Advisory Agreement with the Sub-Adviser, a wholly-owned subsidiary of Morgan Stanley. The Sub-Adviser provides the Fund with advisory services subject to the overall supervision of the Adviser and the Fund's Officers and Directors. The Adviser pays the Sub-Adviser on a monthly basis a portion of the net advisory fees the Adviser receives from the Fund.
C. Administration Fees: The Adviser also serves as Administrator to the Company and provides administrative services pursuant to an Administration Agreement for an annual fee, accrued daily and paid monthly, of 0.08% of the Fund's average daily net assets.
Under a Sub-Administration Agreement between the Administrator and State Street Bank and Trust Company ("State Street"), State Street provides certain administrative services to the Company. For such services, the Administrator pays State Street a portion of the fee the Administrator receives from the Fund.
21
Morgan Stanley Institutional Fund, Inc.
Annual Report — December 31, 2019
Notes to Financial Statements (cont'd)
D. Distribution and Shareholder Services Fees: Morgan Stanley Distribution, Inc. ("MSDI" or the "Distributor"), a wholly-owned subsidiary of the Adviser and an indirect subsidiary of Morgan Stanley, serves as the Company's Distributor of Fund shares pursuant to a Distribution Agreement. The Company has adopted a Shareholder Services Plan with respect to Class A shares pursuant to Rule 12b-1 under the Act. Under the Shareholder Services Plan, the Fund pays the Distributor a shareholder services fee, accrued daily and paid monthly, at an annual rate of 0.25% of the Fund's average daily net assets attributable to Class A shares.
The Company has adopted a Distribution and Shareholder Services Plan with respect to Class L shares pursuant to Rule 12b-1 under the Act. Under the Distribution and Shareholder Services Plan, the Fund pays the Distributor a distribution fee, accrued daily and paid monthly, at an annual rate of 0.50% and a shareholder services fee, accrued daily and paid monthly, at an annual rate of 0.25% of the Fund's average daily net assets attributable to Class L shares.
The Company has adopted a Distribution and Shareholder Services Plan with respect to Class C shares pursuant to Rule 12b-1 under the Act. Under the Distribution and Shareholder Services Plan, the Fund pays the Distributor a distribution fee, accrued daily and paid monthly, at an annual rate of 0.75% and a shareholder services fee, accrued daily and paid monthly, at an annual rate of 0.25% of the Fund's average daily net assets attributable to Class C shares.
The distribution and shareholder services fees are used to support the expenses associated with servicing and maintaining accounts. The Distributor may compensate other parties for providing shareholder support services to investors who purchase Class A, Class L and Class C shares.
E. Dividend Disbursing and Transfer Agent: The Company's dividend disbursing and transfer agent is DST Asset Manager Solutions, Inc. ("DST"). Pursuant to a Transfer Agency Agreement, the Company pays DST a fee based on the number of classes, accounts and transactions relating to the Funds of the Company.
F. Custodian Fees: State Street (the "Custodian") also serves as Custodian for the Company in accordance with a Custodian Agreement. The Custodian holds cash, securities and other assets of the Company as required by the Act. Custody fees are payable monthly based on assets held in custody, investment purchases and sales activity and account maintenance fees, plus reimbursement for certain out-of-pocket expenses.
G. Security Transactions and Transactions with Affiliates: For the year ended December 31, 2019, purchases and sales of investment securities for the Fund, other than long-term U.S. Government securities and short-term investments were approximately $12,007,000 and $3,148,000, respectively. There were no purchases and sales of long-term U.S. Government securities for the year ended December 31, 2019.
The Fund invests in the Institutional Class of the Morgan Stanley Institutional Liquidity Funds — Treasury Securities Portfolio (the "Liquidity Funds"), an open-end management investment company managed by the Adviser. Advisory fees paid by the Fund are reduced by an amount equal to its pro-rata share of the advisory and administration fees paid by the Fund due to its investment in the Liquidity Funds. For the year ended December 31, 2019, advisory fees paid were reduced by approximately $1,000 relating to the Fund's investment in the Liquidity Funds.
A summary of the Fund's transactions in shares of affiliated investments during the year ended December 31, 2019 is as follows:
Affiliated
Investment
Company | | Value
December 31,
2018
(000) | | Purchases
at Cost
(000) | | Proceeds
from Sales
(000) | | Dividend
Income
(000) | |
Liquidity Funds | | $ | 606 | | | $ | 9,089 | | | $ | 8,847 | | | $ | 11 | | |
Affiliated
Investment
Company (cont'd) | | Realized
Gain
(Loss)
(000) | | Change in
Unrealized
Appreciation
(Depreciation)
(000) | | Value
December 31,
2019
(000) | |
Liquidity Funds | | $ | — | | | $ | — | | | $ | 848 | | |
The Fund is permitted to purchase and sell securities ("cross-trade") from and to other Morgan Stanley funds as well as other funds and client accounts for which the Adviser or an affiliate of the Adviser serves as investment adviser, pursuant to procedures approved by the Directors in compliance with Rule 17a-7 under the Act (the "Rule"). Each cross-trade is executed at the current market price in compliance with provisions of the Rule. For the year ended December 31, 2019, the Fund did not engage in any cross-trade transactions.
The Fund has an unfunded Deferred Compensation Plan (the "Compensation Plan"), which allows each independent Director to defer payment of all, or a portion, of the fees he or she receives for serving on the Board of Directors. Each eligible Director generally may elect to have the deferred amounts credited with a return equal to the total return on one or more of the Morgan Stanley funds that are offered as investment
22
Morgan Stanley Institutional Fund, Inc.
Annual Report — December 31, 2019
Notes to Financial Statements (cont'd)
options under the Compensation Plan. Appreciation/depreciation and distributions received from these investments are recorded with an offsetting increase/decrease in the deferred compensation obligation and do not affect the NAV of the Fund.
H. Federal Income Taxes: It is the Fund's intention to continue to qualify as a regulated investment company and distribute all of its taxable and tax-exempt income. Accordingly, no provision for federal income taxes is required in the financial statements.
The Fund may be subject to taxes imposed by countries in which it invests. Such taxes are generally based on income and/or capital gains earned or repatriated. Taxes are accrued based on net investment income, net realized gains and net unrealized appreciation as such income and/or gains are earned. Taxes may also be based on transactions in foreign currency and are accrued based on the value of investments denominated in such currency.
FASB ASC 740-10, "Income Taxes — Overall", sets forth a minimum threshold for financial statement recognition of the benefit of a tax position taken or expected to be taken in a tax return. Management has concluded there are no significant uncertain tax positions that would require recognition in the financial statements. If applicable, the Fund recognizes interest accrued related to unrecognized tax benefits in "Interest Expense" and penalties in "Other Expenses" in the Statement of Operations. The Fund files tax returns with the U.S. Internal Revenue Service, New York and various states. Generally, each of the tax years in the four-year period ended December 31, 2019 remains subject to examination by taxing authorities.
The tax character of distributions paid may differ from the character of distributions shown for GAAP purposes due to short-term capital gains being treated as ordinary income for tax purposes. The tax character of distributions paid during fiscal years 2019 and 2018 was as follows:
2019
Distributions
Paid From: | | 2018
Distributions
Paid From: | |
Ordinary
Income
(000) | | Long-Term
Capital Gain
(000) | | Ordinary
Income
(000) | | Long-Term
Capital Gain
(000) | |
| $ | 294 | | | $ | 445 | | | $ | 66 | | | $ | 1,105 | | |
The amount and character of income and gains to be distributed are determined in accordance with income tax regulations which may differ from GAAP. These book/tax differences are either considered temporary or permanent in nature.
Temporary differences are attributable to differing book and tax treatments for the timing of the recognition of gains (losses) on certain investment transactions and the timing of the deductibility of certain expenses.
The Fund had no permanent differences causing reclassifications among the components of net assets for the year ended December 31, 2019.
At December 31, 2019, the components of distributable earnings for the Fund on a tax basis were as follows:
Undistributed
Ordinary
Income
(000) | | Undistributed
Long-Term
Capital Gain
(000) | |
| $ | 8 | | | $ | 9 | | |
I. Credit Facility: The Company and other Morgan Stanley funds participated in a $150,000,000 committed, unsecured revolving line of credit facility (the "Facility") with State Street. Effective April 22, 2019, the committed line amount increased to $300,000,000. This Facility is to be used for temporary emergency purposes or funding of shareholder redemption requests. The interest rate on borrowings is based on the federal funds rate or 1 month LIBOR rate plus a spread. The Facility also has a commitment fee of 0.25% per annum based on the unused portion of the Facility. During the year ended December 31, 2019, the Fund did not have any borrowings under the Facility.
J. Other: At December 31, 2019, the Fund had record owners of 10% or greater. Investment activities of these shareholders could have a material impact on the Fund. The aggregate percentage of such owners was 47.0%.
23
Morgan Stanley Institutional Fund, Inc.
Annual Report — December 31, 2019
Report of Independent Registered Public Accounting Firm
To the Shareholders and Board of Directors of
Morgan Stanley Institutional Fund, Inc. —
Global Sustain Portfolio
Opinion on the Financial Statements
We have audited the accompanying statement of assets and liabilities of Global Sustain Portfolio (the "Fund") (one of the funds constituting Morgan Stanley Institutional Fund, Inc. (the "Company")), including the portfolio of investments, as of December 31, 2019, and the related statement of operations for the year then ended, the statements of changes in net assets for each of the two years in the period then ended, the financial highlights for each of the five years in the period then ended and the related notes (collectively referred to as the "financial statements"). In our opinion, the financial statements present fairly, in all material respects, the financial position of Global Sustain Portfolio (one of the funds constituting Morgan Stanley Institutional Fund, Inc.) at December 31, 2019, the results of its operations for the year then ended, the changes in its net assets for each of the two years in the period then ended and its financial highlights for each of the five years in the period then ended, in conformity with U.S. generally accepted accounting principles.
Basis for Opinion
These financial statements are the responsibility of the Company's management. Our responsibility is to express an opinion on the Fund's financial statements based on our audits. We are a public accounting firm registered with the Public Company Accounting Oversight Board (United States) ("PCAOB") and are required to be independent with respect to the Company in accordance with the U.S. federal securities law and the applicable rules and regulations of the Securities and Exchange Commission and the PCAOB.
We conducted our audits in accordance with the standards of the PCAOB. Those standards require that we plan and perform the audit to obtain reasonable assurance about whether the financial statements are free of material misstatement, whether due to error or fraud. The Company is not required to have, nor were we engaged to perform, an audit of the Company's internal control over financial reporting. As part of our audits, we are required to obtain an understanding of internal control over financial reporting, but not for the purpose of expressing an opinion on the effectiveness of the Company's internal control over financial reporting. Accordingly, we express no such opinion.
Our audits included performing procedures to assess the risks of material misstatement of the financial statements, whether due to error or fraud, and performing procedures that respond to those risks. Such procedures included examining, on a test basis, evidence regarding the amounts and disclosures in the financial statements. Our procedures included confirmation of securities owned as of December 31, 2019 by correspondence with the custodian and others or by other appropriate auditing procedures where replies from others were not received. Our audits also included evaluating the accounting principles used and significant estimates made by management, as well as evaluating the overall presentation of the financial statements. We believe that our audits provide a reasonable basis for our opinion.

We have served as the auditor of one or more Morgan Stanley investment companies since 2000.
Boston, Massachusetts
February 27, 2020
24
Morgan Stanley Institutional Fund, Inc.
Annual Report — December 31, 2019
Federal Tax Notice (unaudited)
For federal income tax purposes, the following information is furnished with respect to the distributions paid by the Fund during its taxable year ended December 31, 2019. For corporate shareholders 46.34% of the dividends qualified for the dividends received deduction.
The Fund designated and paid approximately $446,000 as a long-term capital gain distribution.
For federal income tax purposes, the following information is furnished with respect to the Fund's earnings for its taxable year ended December 31, 2019. When distributed, certain earnings may be subject to a maximum tax rate of 15% as provided for by the Jobs and Growth Tax Relief Reconciliation Act of 2003. The Fund designated up to a maximum of approximately $294,000 as taxable at this lower rate.
In January, the Fund provides tax information to shareholders for the preceding calendar year.
25
Privacy Notice (unaudited) April 2019
FACTS | | WHAT DOES MSIM DO WITH YOUR PERSONAL INFORMATION? | |
Why? | | Financial companies choose how they share your personal information. Federal law gives consumers the right to limit some but not all sharing. Federal law also requires us to tell you how we collect, share, and protect your personal information. Please read this notice carefully to understand what we do. | |
What? | | The types of personal information we collect and share depend on the product or service you have with us. This information can include:
n Social Security number and income
n investment experience and risk tolerance
n checking account number and wire transfer instructions | |
How? | | All financial companies need to share customers' personal information to run their everyday business. In the section below, we list the reasons financial companies can share their customers' personal information; the reasons MSIM chooses to share; and whether you can limit this sharing. | |
Reasons we can share your personal information | | Does MSIM share? | | Can you limit this sharing? | |
For our everyday business purposes —
such as to process your transactions, maintain your account(s), respond to court orders and legal investigations, or report to credit bureaus | | Yes | | No | |
For our marketing purposes —
to offer our products and services to you | | Yes | | No | |
For joint marketing with other financial companies | | No | | We don't share | |
For our affiliates' everyday business purposes —
information about your transactions and experiences | | Yes | | No | |
For our affiliates' everyday business purposes —
information about your creditworthiness | | No | | We don't share | |
For our affiliates to market to you | | No | | We don't share | |
For non-affiliates to market to you | | No | | We don't share | |
Questions? Call toll-free (844) 312-6327 or email: imprivacyinquiries@morganstanley.com
26
Privacy Notice (unaudited) (cont'd) April 2019
Who we are
Who is providing this notice? | | Morgan Stanley Investment Management, Inc. and its affiliated registered investment advisers, registered broker-dealers, and registered and unregistered funds ("MSIM") | |
What we do
How does MSIM protect my personal information? | | To protect your personal information from unauthorized access and use, we use security measures that comply with federal law. These measures include computer safeguards and secured files and buildings. We have policies governing the proper handling of customer information by personnel and requiring third parties that provide support to adhere to appropriate security standards with respect to such information. | |
How does MSIM collect my personal information? | | We collect your personal information, for example, when you
n open an account or make deposits or withdrawals from your account
n buy securities from us or make a wire transfer
n give us your contact information
We also collect your personal information from others, such as credit bureaus, affiliates, or other companies. | |
Why can't I limit all sharing? | | Federal law gives you the right to limit only
n sharing for affiliates' everyday business purposes — information about your creditworthiness
n affiliates from using your information to market to you
n sharing for non-affiliates to market to you
State laws and individual companies may give you additional rights to limit sharing. See below for more on your rights under state law. | |
Definitions
Affiliates | | Companies related by common ownership or control. They can be financial and non-financial companies.
n Our affiliates include companies with a Morgan Stanley name and financial companies such as Morgan Stanley Smith Barney LLC and Morgan Stanley & Co. | |
Non-affiliates | | Companies not related by common ownership or control. They can be financial and non-financial companies.
n MSIM does not share with non-affiliates so they can market to you. | |
Joint marketing | | A formal agreement between non-affiliated financial companies that together market financial products or services to you.
n MSIM doesn't jointly market | |
Other important information
Vermont: Except as permitted by law, we will not share personal information we collect about Vermont residents with Non-affiliates unless you provide us with your written consent to share such information.
California: Except as permitted by law, we will not share personal information we collect about California residents with Non-affiliates and we will limit sharing such personal information with our Affiliates to comply with California privacy laws that apply to us.
27
Morgan Stanley Institutional Fund, Inc.
Annual Report — December 31, 2019
Director and Officer Information (unaudited)
Independent Directors:
Name, Birth Year
and Address of
Independent Director | | Position(s)
Held with
Registrant | | Length of Time
Served* | | Principal Occupation(s) During Past 5 Years
and Other Relevant Professional Experience | | Number of
Funds in Fund
Complex
Overseen by
Independent
Director** | | Other Directorships
Held by Independent
Director*** | |
Frank L. Bowman
c/o Perkins Coie LLP
Counsel to the Independent Directors
1155 Avenue of the Americas
New York, NY 10036
Birth Year 1944 | | Director | | Since August 2006 | | President, Strategic Decisions, LLC (consulting) (since February 2009); Director or Trustee of various Morgan Stanley Funds (since August 2006); Chairperson of the Compliance and Insurance Committee (since October 2015); formerly, Chairperson of the Insurance Sub-Committee of the Compliance and Insurance Committee (2007-2015); served as President and Chief Executive Officer of the Nuclear Energy Institute (policy organization) (February 2005-November 2008); retired as Admiral, U.S. Navy after serving over 38 years on active duty including 8 years as Director of the Naval Nuclear Propulsion Program in the Department of the Navy and the U.S. Department of Energy (1996-2004); served as Chief of Naval Personnel (July 1994-September 1996) and on the Joint Staff as Director of Political Military Affairs (June 1992-July 1994); knighted as Honorary Knight Commander of the Most Excellent Order of the British Empire; awarded the Officier de l'Orde National du Mérite by the French Government; elected to the National Academy of Engineering (2009). | | | 86 | | | Director of Naval and Nuclear Technologies LLP; Director Emeritus of the Armed Services YMCA; Member of the National Security Advisory Council of the Center for U.S. Global Engagement and a member of the CNA Military Advisory Board; Trustee of Fairhaven United Methodist Church; Member of the Board of Advisors of the Dolphin Scholarship Foundation; Director of other various non-profit organizations; formerly, Director of BP p.l.c. (November 2010-May 2019). | |
Kathleen A. Dennis
c/o Perkins Coie LLP
Counsel to the Independent Directors
1155 Avenue of the Americas
New York, NY 10036
Birth Year 1953 | | Director | | Since August 2006 | | President, Cedarwood Associates (mutual fund and investment management consulting) (since July 2006); Chairperson of the Liquidity and Alternatives Sub-Committee of the Investment Committee (since October 2006) and Director or Trustee of various Morgan Stanley Funds (since August 2006); formerly, Senior Managing Director of Victory Capital Management (1993-2006). | | | 86 | | | Director of various non-profit organizations. | |
Nancy C. Everett
c/o Perkins Coie LLP
Counsel to the Independent Directors
1155 Avenue of the Americas
New York, NY 10036
Birth Year 1955 | | Director | | Since January 2015 | | Chief Executive Officer, Virginia Commonwealth University Investment Company (since November 2015); Owner, OBIR, LLC (institutional investment management consulting) (since June 2014); formerly, Managing Director, BlackRock, Inc. (February 2011-December 2013); and Chief Executive Officer, General Motors Asset Management (a/k/a Promark Global Advisors, Inc.) (June 2005-May 2010). | | | 87 | | | Formerly, Member of Virginia Commonwealth University School of Business Foundation (2005-2016); Member of Virginia Commonwealth University Board of Visitors (2013-2015); Member of Committee on Directors for Emerging Markets Growth Fund, Inc. (2007-2010); Chairperson of Performance Equity Management, LLC (2006-2010); and Chairperson, GMAM Absolute Return Strategies Fund, LLC (2006-2010). | |
28
Morgan Stanley Institutional Fund, Inc.
Annual Report — December 31, 2019
Director and Officer Information (unaudited) (cont'd)
Independent Directors: (cont'd)
Name, Birth Year
and Address of
Independent Director | | Position(s)
Held with
Registrant | | Length of Time
Served* | | Principal Occupation(s) During Past 5 Years
and Other Relevant Professional Experience | | Number of
Funds in Fund
Complex
Overseen by
Independent
Director** | | Other Directorships
Held by Independent
Director*** | |
Jakki L. Haussler
c/o Perkins Coie LLP
Counsel to the Independent Directors
1155 Avenue of the Americas
New York, NY 10036
Birth Year 1957 | | Director | | Since January 2015 | | Chairman, Opus Capital Group (since 1996); formerly, Chief Executive Officer, Opus Capital Group (1996-2019); Director, Capvest Venture Fund, LP (May 2000-December 2011); Partner, Adena Ventures, LP (July 1999-December 2010); Director, The Victory Funds (February 2005-July 2008). | | | 87 | | | Director of Service Corporation International and Member, Audit Committee and Investment Committee; Director of Cincinnati Bell Inc. and Member, Audit Committee and Governance and Nominating Committee; Chairman of Northern Kentucky University Member Investment Committee; Member of Chase College of Law Transactional Law Practice Center Board of Advisors; Director of Best Transport; Director of Chase College of Law Board of Visitors; formerly, Member, University of Cincinnati Foundation Investment Committee; Member, Miami University Board of Visitors (2008-2011); Trustee of Victory Funds (2005-2008) and Chairman, Investment Committee (2007-2008) and Member, Service Provider Committee (2005-2008). | |
Dr. Manuel H. Johnson
c/o Johnson Smick International, Inc.
220 I Street, NE — Suite 200
Washington, D.C. 20002
Birth Year 1949 | | Director | | Since July 1991 | | Senior Partner, Johnson Smick International, Inc. (consulting firm); Chairperson of the Investment Committee (since October 2006) and Director or Trustee of various Morgan Stanley Funds (since July 1991); Co-Chairman and a founder of the Group of Seven Council (G7C) (international economic commission); formerly, Chairperson of the Audit Committee (July 1991-September 2006), Vice Chairman of the Board of Governors of the Federal Reserve System and Assistant Secretary of the U.S. Treasury. | | | 86 | | | Director of NVR, Inc. (home construction). | |
Joseph J. Kearns
c/o Perkins Coie LLP
Counsel to the Independent Directors
1155 Avenue of the Americas
New York, NY 10036
Birth Year 1942 | | Director | | Since August 1994 | | Senior Adviser, Kearns & Associates LLC (investment consulting); Chairperson of the Audit Committee (since October 2006) and Director or Trustee of various Morgan Stanley Funds (since August 1994); formerly, Deputy Chairperson of the Audit Committee (July 2003-September 2006) and Chairperson of the Audit Committee of various Morgan Stanley Funds (since August 1994); CFO of the J. Paul Getty Trust. | | | 87 | | | Prior to August 10, 2016, Director of Electro Rent Corporation (equipment leasing); Prior to December 31, 2013, Director of The Ford Family Foundation. | |
29
Morgan Stanley Institutional Fund, Inc.
Annual Report — December 31, 2019
Director and Officer Information (unaudited) (cont'd)
Independent Directors: (cont'd)
Name, Birth Year
and Address of
Independent Director | | Position(s)
Held with
Registrant | | Length of Time
Served* | | Principal Occupation(s) During Past 5 Years
and Other Relevant Professional Experience | | Number of
Funds in Fund
Complex
Overseen by
Independent
Director** | | Other Directorships
Held by Independent
Director*** | |
Michael F. Klein
c/o Perkins Coie LLP
Counsel to the Independent Directors
1155 Avenue of the Americas
New York, NY 10036
Birth Year 1958 | | Director | | Since August 2006 | | Managing Director, Aetos Alternatives Management, LP (since March 2000); Co-President, Aetos Alternatives Management, LP (since January 2004) and Co-Chief Executive Officer of Aetos Alternatives Management, LP (since August 2013); Chairperson of the Fixed Income Sub-Committee of the Investment Committee (since October 2006) and Director or Trustee of various Morgan Stanley Funds (since August 2006); formerly, Managing Director, Morgan Stanley & Co. Inc. and Morgan Stanley Dean Witter Investment Management and President, various Morgan Stanley Funds (June 1998-March 2000); Principal, Morgan Stanley & Co. Inc. and Morgan Stanley Dean Witter Investment Management (August 1997-December 1999). | | | 86 | | | Director of certain investment funds managed or sponsored by Aetos Alternatives Management, LP; Director of Sanitized AG and Sanitized Marketing AG (specialty chemicals). | |
Patricia Maleski
c/o Perkins Coie LLP
Counsel to the Independent Directors
1155 Avenue of the Americas
New York, NY 10036
Birth Year 1960 | | Director | | Since January 2017 | | Managing Director, JPMorgan Asset Management (2004-2016); Oversight and Control Head of Fiduciary and Conflicts of Interest Program (2015-2016); Chief Control Officer-Global Asset Management (2013-2015); President, JPMorgan Funds (2010-2013); Chief Administrative Officer (2004-2013); various other positions including Treasurer and Board Liaison (since 2001). | | | 87 | | | None. | |
Michael E. Nugent
522 Fifth Avenue
New York, NY 10036
Birth Year 1936 | | Chair of the Board and Director | | Chair of the Boards since July 2006 and Director since July 1991 | | Chair of the Boards of various Morgan Stanley Funds (since July 2006); Chairperson of the Governance Committee (since January 2019) and Director or Trustee of various Morgan Stanley Funds (since July 1991); formerly, Chairperson of each of the Closed-End Fund committee (until December 2019) and the Insurance Committee (until July 2006); General Partner, Triumph Capital, L.P. (private investment partnership) (1988-2013). | | | 86 | | | None. | |
W. Allen Reed
c/o Perkins Coie LLP
Counsel to the Independent Directors
1155 Avenue of the Americas
New York, NY 10036
Birth Year 1947 | | Vice Chair of the Board and Director | | Vice Chair of the Boards since January 2020 and Director since August 2006 | | Chairperson of the Equity Sub-Committee of the Investment Committee (since October 2006) and Director or Trustee of various Morgan Stanley Funds (since August 2006); formerly, President and CEO of General Motors Asset Management; Chairman and Chief Executive Officer of the GM Trust Bank and Corporate Vice President of General Motors Corporation (August 1994- December 2005). | | | 86 | | | Formerly, Director of Legg Mason, Inc.; formerly, Director of the Auburn University Foundation (2010-2015). | |
* This is the earliest date the Director began serving the Morgan Stanley Funds. Each Director serves an indefinite term, until his or her successor is elected.
** The Fund Complex includes (as of December 31, 2019) all open-end and closed-end funds (including all of their portfolios) advised by Morgan Stanley Investment Management Inc. (the "Adviser") and any funds that have an adviser that is an affiliated person of the Adviser (including, but not limited to, Morgan Stanley AIP GP LP).
*** This includes any directorships at public companies and registered investment companies held by the Director at any time during the past five years.
30
Morgan Stanley Institutional Fund, Inc.
Annual Report — December 31, 2019
Director and Officer Information (unaudited) (cont'd)
Executive Officers:
Name, Birth Year and Address of
Executive Officer | | Position(s)
Held with
Registrant | | Length of Time
Served* | | Principal Occupation(s) During Past 5 Years | |
John H. Gernon
522 Fifth Avenue
New York, NY 10036
Birth Year 1963 | | President and Principal Executive Officer | | Since September 2013 | | President and Principal Executive Officer of the Equity and Fixed Income Funds and the Morgan Stanley AIP Funds (since September 2013) and the Liquidity Funds and various money market funds (since May 2014) in the Fund Complex; Managing Director of the Adviser; Head of Product (since 2006). | |
Timothy J. Knierim
522 Fifth Avenue
New York, NY 10036
Birth Year 1959 | | Chief Compliance Officer | | Since December 2016 | | Managing Director of the Adviser and various entities affiliated with the Adviser; Chief Compliance Officer of various Morgan Stanley Funds and the Adviser (since December 2016) and Chief Compliance Officer of Morgan Stanley AIP GP LP (since 2014). Formerly, Managing Director and Deputy Chief Compliance Officer of the Adviser (2014-2016); and formerly, Chief Compliance Officer of Prudential Investment Management, Inc. (2007-2014). | |
Francis J. Smith
522 Fifth Avenue
New York, NY 10036
Birth Year 1965 | | Treasurer and Principal Financial Officer | | Treasurer since July 2003 and Principal Financial Officer since September 2002 | | Managing Director of the Adviser and various entities affiliated with the Adviser; Treasurer (since July 2003) and Principal Financial Officer of various Morgan Stanley Funds (since September 2002). | |
Mary E. Mullin
522 Fifth Avenue
New York, NY 10036
Birth Year 1967 | | Secretary | | Since June 1999 | | Managing Director of the Adviser; Secretary of various Morgan Stanley Funds (since June 1999). | |
Michael J. Key
522 Fifth Avenue
New York, NY 10036
Birth Year 1979 | | Vice President | | Since June 2017 | | Vice President of the Equity and Fixed Income Funds, Liquidity Funds, various money market funds and the Morgan Stanley AIP Funds in the Fund Complex (since June 2017); Executive Director of the Adviser; Head of Product Development for Equity and Fixed Income Funds (since August 2013). | |
* This is the earliest date the officer began serving the Morgan Stanley Funds. Each officer serves a one-year term, until his or her successor is elected and qualifies.
31
Morgan Stanley Institutional Fund, Inc.
Annual Report — December 31, 2019
Adviser and Administrator
Morgan Stanley Investment Management Inc.
522 Fifth Avenue
New York, New York 10036
Sub-Adviser
Morgan Stanley Investment Management Limited
25 Cabot Square, Canary Wharf
London, E14 4QA, England
Distributor
Morgan Stanley Distribution, Inc.
522 Fifth Avenue
New York, New York 10036
Dividend Disbursing and Transfer Agent
DST Asset Manager Solutions, Inc.
2000 Crown Colony Drive
Quincy, Massachusetts 02169
Custodian
State Street Bank and Trust Company
One Lincoln Street
Boston, Massachusetts 02111
Legal Counsel
Dechert LLP
1095 Avenue of the Americas
New York, New York 10036
Counsel to the Independent Directors
Perkins Coie LLP
1155 Avenue of the Americas
New York, New York 10036
Independent Registered Public Accounting Firm
Ernst & Young LLP
200 Clarendon Street
Boston, Massachusetts 02116
Reporting to Shareholders
Each Morgan Stanley fund provides a complete schedule of portfolio holdings in its Semi-Annual and the Annual Reports within 60 days of the end of the fund's second and fourth fiscal quarters. The Semi-Annual and Annual Reports are filed electronically with the Securities and Exchange Commission ("SEC") on Form N-CSRS and Form N-CSR, respectively. Morgan Stanley also delivers the Semi-Annual and Annual Reports to fund shareholders and makes these reports available on its public website, www.morganstanley.com/im/shareholderreports. Each Morgan Stanley non-money market fund also files a complete schedule of portfolio holdings with the SEC for the fund's first and third fiscal quarters as an attachment to Form N-PORT. Morgan Stanley does not deliver the reports for the first and third fiscal quarters to shareholders, nor are the reports posted to the Morgan Stanley public website. However, the holdings for each money market fund are posted to the Morgan Stanley public website. You may obtain the Form N-PORT filings (as well as the Form N-CSR and N-CSRS filings) by accessing the SEC's website, www.sec.gov. You can also request copies of these materials, upon payment of a duplicating fee, by electronic request at the SEC's email address (publicinfo@sec.gov).
Proxy Voting Policies and Procedures and Proxy Voting Record
You may obtain a copy of the Company's Proxy Voting Policy and Procedures and information regarding how the Company voted proxies relating to portfolio securities during the most recent twelve-month period ended June 30, without charge, upon request, by calling toll free 1 (800) 548-7786 or by visiting our website at www.morganstanley.com/im/shareholderreports. This information is also available on the SEC's website at www.sec.gov.
This report is authorized for distribution only when preceded or accompanied by a prospectus or summary prospectus of the applicable fund of Morgan Stanley Institutional Fund, Inc., which describes in detail the fund's investment policies, risks, fees and expenses. Please read the prospectus carefully before you invest or send money. For additional information, including information regarding the investments comprising the Fund, please visit our website at www.morganstanley.com/im/shareholderreports or call toll free 1 (800) 548-7786.
32
Printed in U.S.A.
This Report has been prepared for shareholders and may be distributed to others only if preceded or accompanied by a current prospectus.
Morgan Stanley Investment Management Inc.
522 Fifth Avenue
New York, New York 10036
© 2020 Morgan Stanley. Morgan Stanley Distribution, Inc.

IFIGQANN
2909108 EXP. 02.28.21

Morgan Stanley Institutional Fund, Inc.
Emerging Markets Leaders Portfolio
Annual Report
December 31, 2019
Beginning on January 1, 2021, as permitted by regulations adopted by the Securities and Exchange Commission ("SEC"), paper copies of the Fund's Annual and Semi-Annual Reports to Shareholders ("Shareholder Reports") will no longer be sent by mail, unless you specifically request paper copies of the Shareholder Reports from the Fund or from your financial intermediary, such as a broker-dealer or a bank. Instead, the Shareholder Reports will be made available on the Fund's website, https://www.morganstanley.com/im/shareholderreports and you will be notified by mail each time a Shareholder Report is posted and provided with a website link to access the Shareholder Report. If you already elected to receive Shareholder Reports electronically, you will not be affected by this change and you need not take any action. You may elect to receive Shareholder Reports and other communications from the Fund electronically anytime by contacting your financial intermediary or, if you are a direct investor, please follow the instructions on the envelope.
Beginning on January 1, 2019, you may elect to receive all future Shareholder Reports in paper free of charge. If you invest through a financial intermediary, you can contact your financial intermediary to request that you continue to receive paper copies of your Shareholder Reports. If you invest directly with the Fund, please follow the instructions on the envelope to let the Fund know you wish to continue receiving paper copies of your Shareholder Reports. Your election to receive Shareholder Reports in paper will apply to all funds held in your account if you invest through your financial intermediary or all funds held with the fund complex if you invest directly with a fund.

Morgan Stanley Institutional Fund, Inc.
Annual Report — December 31, 2019
Shareholders' Letter | | | 2 | | |
Expense Example | | | 3 | | |
Investment Overview | | | 4 | | |
Portfolio of Investments | | | 8 | | |
Statement of Assets and Liabilities | | | 9 | | |
Statement of Operations | | | 10 | | |
Statements of Changes in Net Assets | | | 11 | | |
Financial Highlights | | | 12 | | |
Notes to Financial Statements | | | 16 | | |
Report of Independent Registered Public Accounting Firm | | | 22 | | |
Federal Tax Notice | | | 23 | | |
Privacy Notice | | | 24 | | |
Director and Officer Information | | | 26 | | |
This report is authorized for distribution only when preceded or accompanied by a prospectus or summary prospectus of the applicable Fund of Morgan Stanley Institutional Fund, Inc. To receive a prospectus and/or statement of additional information ("SAI"), which contains more complete information such as investment objectives, charges, expenses, policies for voting proxies, risk considerations and describes in detail each of the Fund's investment policies to the prospective investor, please call toll free 1 (800) 548-7786. Please read the prospectuses carefully before you invest or send money.
Additionally, you can access information about the Fund, including performance, characteristics and investment team commentary, through Morgan Stanley Investment Management's website: www.morganstanley.com/im/shareholderreports.
Market forecasts provided in this report may not necessarily come to pass. There is no guarantee that any sectors mentioned will continue to perform as discussed herein or that securities in such sectors will be held by the Fund in the future. There is no assurance that a fund will achieve its investment objective. Funds are subject to market risk, which is the possibility that market values of securities owned by the Fund will decline and, therefore, the value of the Fund's shares may be less than what you paid for them. Accordingly, you can lose money investing in this Fund. Please see the prospectus for more complete information on investment risks
1
Morgan Stanley Institutional Fund, Inc.
Annual Report — December 31, 2019
Shareholders' Letter (unaudited)
Dear Shareholders,
We are pleased to provide this Annual Report, in which you will learn how your investment in Emerging Markets Leaders Portfolio (the "Fund") performed during the latest twelve-month period.
Morgan Stanley Investment Management is a client-centric, investor-led organization. Our global presence, intellectual capital, and breadth of products and services enable us to partner with investors to meet the evolving challenges of today's financial markets. We aim to deliver superior investment service and to empower our clients to make the informed decisions that help them reach their investment goals.
As always, we thank you for selecting Morgan Stanley Investment Management, and look forward to working with you in the months and years ahead.
Sincerely,

John H. Gernon
President and Principal Executive Officer
January 2020
2
Morgan Stanley Institutional Fund, Inc.
Annual Report — December 31, 2019
Expense Example (unaudited)
Emerging Markets Leaders Portfolio
As a shareholder of the Fund, you incur two types of costs: (1) transactional costs, including redemption fees; and (2) ongoing costs, which may include advisory fees, administration fees, distribution and shareholder services fees and other Fund expenses. This example is intended to help you understand your ongoing costs (in dollars) of investing in the Fund and to compare these costs with the ongoing costs of investing in other mutual funds.
This example is based on an investment of $1,000 invested at the beginning of the six-month period ended December 31, 2019 and held for the entire six-month period.
Actual Expenses
The table below provides information about actual account values and actual expenses. You may use the information in this table, together with the amount you invested, to estimate the expenses that you paid over the period. Simply divide your account value by $1,000 (for example, an $8,600 account value divided by $1,000 = 8.6), then multiply the result by the number in the table under the heading entitled "Actual Expenses Paid During Period" to estimate the expenses you paid on your account during this period.
Hypothetical Example for Comparison Purposes
The table below provides information about hypothetical account values and hypothetical expenses based on the Fund's actual expense ratio and an assumed rate of return of 5% per year before expenses, which is not the Fund's actual return. The hypothetical account values and expenses may not be used to estimate the actual ending account balance or expenses you paid for the period. You may use this information to compare the ongoing costs of investing in the Fund and other funds. To do so, compare this 5% hypothetical example with the 5% hypothetical examples that appear in the shareholder reports of the other funds.
Please note that the expenses shown in the table are meant to highlight your ongoing costs only and do not reflect any transactional costs, such as sales charges (loads) and redemption fees. Therefore, the information for each class in the table is useful in comparing ongoing costs only, and will not help you determine the relative total costs of owning different funds. In addition, if these transactional costs were included, your costs would have been higher.
| | | Beginning
Account
Value
7/1/19 | | Actual Ending
Account
Value
12/31/19 | | Hypothetical
Ending Account
Value | | Actual
Expenses
Paid
During
Period* | | Hypothetical
Expenses Paid
During Period* | | Net
Expense
Ratio
During
Period** | |
Emerging Markets Leaders Portfolio Class I | | $ | 1,000.00 | | | $ | 1,096.20 | | | $ | 1,019.41 | | | $ | 6.08 | | | $ | 5.85 | | | | 1.15 | % | |
Emerging Markets Leaders Portfolio Class A | | | 1,000.00 | | | | 1,093.90 | | | | 1,017.44 | | | | 8.13 | | | | 7.83 | | | | 1.54 | | |
Emerging Markets Leaders Portfolio Class C | | | 1,000.00 | | | | 1,090.20 | | | | 1,013.66 | | | | 12.06 | | | | 11.62 | | | | 2.29 | | |
Emerging Markets Leaders Portfolio Class IS | | | 1,000.00 | | | | 1,097.10 | | | | 1,019.71 | | | | 5.76 | | | | 5.55 | | | | 1.09 | | |
* Expenses are calculated using each Fund Class' annualized net expense ratio (as disclosed), multiplied by the average account value over the period and multiplied by 184/365 (to reflect the most recent one-half year period).
** Annualized.
3
Morgan Stanley Institutional Fund, Inc.
Annual Report — December 31, 2019
Investment Overview (unaudited)
Emerging Markets Leaders Portfolio
The Fund seeks long-term capital appreciation.
Performance
For the fiscal year ended December 31, 2019, the Fund's Class I shares had a total return based on net asset value and reinvestment of distributions per share of 26.63%, net of fees. The Fund's Class I shares outperformed the Fund's benchmark, the MSCI Emerging Markets Net Index (the "Index"), which returned 18.42%.
Please keep in mind that double-digit returns are highly unusual and cannot be sustained. Investors should also be aware that these returns were primarily achieved during favorable market conditions.
Factors Affecting Performance
• After a challenging 2018, emerging markets bounced back in 2019 with strong first and fourth quarter performance and some significant monthly volatility in between. Emerging market equities returned 18.42%, as measured by the Index.
• The top contributors to the Fund's relative performance over the year were our holdings in a Germany-based global athletic apparel maker, a China-based semiconductor chip maker, a private bank in India and an e-commerce operator in Latin America. We believe there are structural tailwinds in the themes represented by these companies.
• The largest detractors from relative performance were our holdings in a South African quick-service restaurant franchisor and an Indian banking/financial services company (we exited both stocks during the reporting period). Additionally, not owning a South Korean multi-national electronics company that performed well and is among the Index's largest constituents detracted from the Fund's performance relative to the Index.
Management Strategies
• We remain an all-cap growth strategy investing in structural growth opportunities in emerging market equities. We believe that growth-oriented companies offer the best return prospects in the emerging markets and that these can be found at many different market caps; however, given the inherent volatility and liquidity constraints in these markets, the Emerging Market Leaders (EML) portfolio will generally look to invest into companies with market capitalization larger than $1 billion. We give
ourselves the maximum flexibility to invest by region, sector and size, preferring not to limit ourselves to a particular factor or market cap band. The investment universe for the EML strategy is not limited to only those companies listed in the emerging markets but can be listed anywhere, as long as a significant portion of revenue or growth is derived from emerging markets.
• We consolidated the Fund's portfolio throughout the year, exiting positions which had exceeded our price targets or where the thesis did not pan out as per expectations. We remain confident in the Fund's portfolio as we continue to focus on what we define as "high quality" businesses: those with a high predictability/near certainty of earnings, which are likely to compound at mid to high teens over the next five years, alongside sustainable or improving return on invested capital above the cost of capital. We have continued to focus on companies with management integrity, a proven track record of great capital allocation and lean balance sheets. The businesses that we own in the portfolio are either industry leaders or emerging leaders, with dominant market share, pricing power and sustainable competitive advantages. A focus on quality and avoiding volatile business models helps us avoid downside risks in the portfolio.
• Our focus is to avoid noise in the market and companies whose earnings have been volatile or where understanding the business model is outside our zone of competence. We are cognizant of global macro issues like trade wars, increasing tariffs, climate change, rising global debt, changing demographics and peak working-age population. We take these issues into account in understanding the impact it can have on the value of individual stocks and the portfolio as a whole. Avoiding the noise allows us to take a longer-term investment horizon of at least three years, where we can carry out in-depth fundamental research and analysis of the company's balance sheet and cash flow generation in addition to the earnings outlook. For all companies, we model out revenue growth expectations; profit margins (looking for stable or expanding) as well as earnings before interest, taxes, depreciation and amortization (EBITDA); profit; and free cash flow.
• We remain steadfast believers in our investment philosophy that repeatedly investing into high-quality, thematic growth leads to structural, scalable
4
Morgan Stanley Institutional Fund, Inc.
Annual Report — December 31, 2019
Investment Overview (unaudited) (cont'd)
Emerging Markets Leaders Portfolio
and predictable returns over the long term. A few common hallmarks of such investments include a strong track record of execution/delivery, high returns on invested capital and strong management.
• We further increased our exposure to the athleisure thematic during the year. We funded a part of this by booking some profits in another winner in this sector, which has been one of our long-standing positions. Another key reason behind increasing our positioning in athleisure is the sector's strong growth in China. This wave of growth is amplified in China due to country-specific factors, including: a) growth in sub-categories, such as running (20%+ revenue compound annual growth rate over two to three years);(i) b) supportive government policies (National Fitness Plan 2016-20, Healthy China Outline 2030); c) surge in demand stimulated by a government push ahead of international sporting events (Tokyo Olympics 2020, Beijing Winter Olympics 2022); and d) a population culturally passionate about sports, now upgrading in spending on athleisure. The revenue growth opportunity is a function of both size and penetration, with China's population four times that of the U.S.
• The nature of successful businesses has evolved significantly so far in this decade. Hence, today's investments need to reflect this change. While growth in pockets linked to the broader economic backdrop still exists, such growth can be unpredictable with uncertain macro factors, geopolitics and global social outlooks. In this regard, it is of utmost importance to look at disruptive business models, which have been capturing shares from existing "lazy" profit/revenue pools, leading to a collapse of sector level growth (and inflation) or the creation of new industries altogether. Identifying and investing in such businesses that also exhibit our cornerstone philosophy, as discussed in this report, is a logical step for us. These investments display solid, predictable growth that is driven by the strength and efficiency of their business models.
• With this in mind, we are examining a key thematic which is becoming increasingly relevant for us — Ecosystems. We think about (commercial) ecosystems as platforms that have a network of users
interacting with each other or with the service(s) offered by the platform, either online or a combination of online-offline. A common element of such an ecosystem is that it engages and draws in repeat users. A single use case ecosystem will typically have linear economics, unless it is considered to be disruptive in its service offering. Given that our core philosophy requires a track record of profitability, it is most likely that the first (or first few) use case(s) are matured to an extent and exhibit linear economics. However, with a large enough sticky user base, it becomes possible to create additional use cases. This in turn creates non-linear economic returns, with significant operating leverage, simply because the user acquisition and network creation costs are largely fixed and one-time in nature. The additional revenues lead to profitability translating directly from the gross profit level to the net profit level. Mobile data and smartphones proliferation further strengthens these ecosystems.
• While identifying an investible ecosystem, we look for four qualities: 1. Size of the existing user base, and its ultimate potential size (i.e., Scale and Scalability of the existing network), 2. User stickiness to the platform (i.e., Predictability of incremental engagement, which can translate into monetizable revenues), 3. Additional new use cases, and possible use cases being targeted (i.e., Scalability potential for growth and high-quality returns), and 4. Management capability and intent (i.e., Track record of successful execution while implementing first or first few use cases). The first three factors are essential ingredients for an investible ecosystem. For instance, if user stickiness is high for an existing user base and other use cases are being targeted, profitable growth will still be challenging if there is not enough scale (due to demographics, or population density, etc.). The fourth quality is the most paramount. Given our core investment philosophy, we will only invest if we see enough evidence of successful execution and visible profitability. Without those, we are likely to only monitor ongoing progress. We are steadfast believers in commercial success that can be repeated/replicated predictably, which is the only way to ensure downside protection for our investments.
(i) Source: MSIM company filings.
5
Morgan Stanley Institutional Fund, Inc.
Annual Report — December 31, 2019
Investment Overview (unaudited) (cont'd)
Emerging Markets Leaders Portfolio
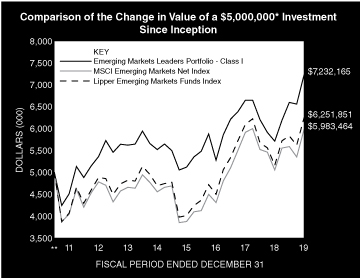
* Minimum Investment for Class I shares
** Commenced Operations on June 30, 2011. Performance shown for the Fund's Class I shares reflects the performance of the Morgan Stanley Emerging Markets Leaders Fund (Cayman) LP, a private fund managed by the Adviser for periods prior to close of business on January 5, 2015, when the Fund acquired substantially all of the assets and liabilities of the Private Fund in exchange for shares of the Fund (the "Emerging Markets Leaders Reorganization").
In accordance with SEC regulations, the Fund's performance shown assumes that all recurring fees (including management fees) were deducted and all dividends and distributions were reinvested. The performance of Class A, C and IS shares will vary from the performance of Class I shares based upon their different inception dates and will be negatively impacted by additional fees assessed to those classes (if applicable).
Performance Compared to the MSCI Emerging Markets Net Index(1) and the Lipper Emerging Markets Funds Index(2)
| | | Period Ended December 31, 2019
Total Returns(3) | |
| | | | | Average Annual | |
| | | One
Year | | Five
Years | | Ten
Years | | Since
Inception(6) | |
Fund — Class I Shares
w/o sales charges(4) | | | 26.63 | % | | | 5.56 | % | | | — | | | | 4.44 | % | |
Fund — Class A Shares
w/o sales charges(4) | | | 26.08 | | | | 5.13 | | | | — | | | | 4.19 | | |
Fund — Class A Shares with
maximum 5.25% sales charges(4) | | | 19.47 | | | | 4.01 | | | | — | | | | 3.53 | | |
Fund — Class C Shares
w/o sales charges(5) | | | 25.14 | | | | — | | | | — | | | | 4.09 | | |
Fund — Class C Shares with
maximum 1.00% deferred
sales charges(5) | | | 24.14 | | | | — | | | | — | | | | 4.09 | | |
Fund — Class IS Shares
w/o sales charges(4) | | | 26.73 | | | | 5.60 | | | | — | | | | 4.46 | | |
MSCI Emerging Markets Net Index | | | 18.42 | | | | 5.61 | | | | — | | | | 2.13 | | |
Lipper Emerging Market Funds Index | | | 21.13 | | | | 5.91 | | | | — | | | | 2.66 | | |
Performance data quoted represents past performance, which is no guarantee of future results, and current performance may be lower or higher than the figures shown. Performance assumes that all dividends and distributions, if any, were reinvested. For the most recent month-end performance figures, please visit www.morganstanley.com/im/shareholderreports. Investment return and principal value will fluctuate so that Fund shares, when redeemed, may be worth more or less than their original cost. Total returns do not reflect the deduction of taxes that a shareholder would pay on Fund distributions or the redemption of Fund shares. Performance of share classes will vary due to difference in sales charges and expenses.
(1) The MSCI Emerging Markets Net Index is a free float-adjusted market capitalization weighted index that is designed to measure equity market performance of emerging markets. The term "free float" represents the portion of shares outstanding that are deemed to be available for purchase in the public equity markets by investors. The MSCI Emerging Markets Net Index currently consists of 26 emerging market country indices. The performance of the Index is listed in U.S. dollars and assumes reinvestment of net dividends. Net total return indices reinvest dividends after the deduction of withholding taxes, using (for international indices) a tax rate applicable to non-resident institutional investors who do not benefit from double taxation treaties. The Index is unmanaged and its returns do not include any sales charges or fees. Such costs would lower performance. It is not possible to invest directly in an index.
(2) The Lipper Emerging Markets Funds Index is an equally weighted performance index of the largest qualifying funds (based on net assets) in the Lipper Emerging Markets Funds classification. The Index, which is adjusted for capital gains distributions and income dividends, is unmanaged and should not be considered an investment. There are currently 30 funds represented in this Index. As of the date of this report, the Fund was in the Lipper Emerging Markets Funds classification.
(3) Total returns for the Fund reflect fees waived and expenses reimbursed, if applicable, by the Adviser (as defined herein). Without such waivers and reimbursements, total returns would have been lower.
6
Morgan Stanley Institutional Fund, Inc.
Annual Report — December 31, 2019
Investment Overview (unaudited) (cont'd)
Emerging Markets Leaders Portfolio
(4) Pursuant to an agreement and plan of reorganization, between Morgan Stanley Institutional Fund, Inc., on behalf of the Fund, and Morgan Stanley Emerging Markets Leaders Fund (Cayman) LP, a private fund managed by the Adviser (the "Private Fund"), following close of business on January 5, 2015, the Fund acquired substantially all of the assets and liabilities of the Private Fund in exchange for shares of the Fund (the "Emerging Markets Leaders Reorganization"). The Private Fund commenced operations on June 30, 2011. The Fund adopted the performance history of the Private Fund. Performance shown for the Fund's Class I, Class A and Class IS shares reflects the performance of the limited partnership interests of the Private Fund, adjusted to reflect any applicable sales charge of the Class, but not adjusted for any other differences in expenses. If adjusted for other expenses, the historical returns would be different.
(5) Commenced offering on April 30, 2015.
(6) For comparative purposes, average annual since inception returns listed for the Indexes refer to the inception date of Class I of the Fund, not the inception of the Index.
7
Morgan Stanley Institutional Fund, Inc.
Annual Report — December 31, 2019
Portfolio of Investments
Emerging Markets Leaders Portfolio
| | | Shares | | Value
(000) | |
Common Stocks (95.3%) | |
Argentina (1.9%) | |
Despegar.com Corp. (a) | | | 75,244 | | | $ | 1,014 | | |
Brazil (4.8%) | |
Pagseguro Digital Ltd., Class A (a) | | | 25,807 | | | | 882 | | |
StoneCo Ltd., Class A (a) | | | 43,132 | | | | 1,720 | | |
| | | | 2,602 | | |
China (22.5%) | |
Alibaba Group Holding Ltd. ADR (a) | | | 22,857 | | | | 4,848 | | |
Huazhu Group Ltd. ADR | | | 3,700 | | | | 148 | | |
Li Ning Co., Ltd. (b) | | | 179,000 | | | | 536 | | |
Meituan Dianping, Class B (a)(b) | | | 160,100 | | | | 2,094 | | |
TAL Education Group ADR (a) | | | 18,125 | | | | 874 | | |
Tencent Holdings Ltd. (b) | | | 79,000 | | | | 3,808 | | |
| | | | 12,308 | | |
Germany (4.6%) | |
Adidas AG (c) | | | 7,797 | | | | 2,538 | | |
Hong Kong (9.0%) | |
AIA Group Ltd. | | | 281,000 | | | | 2,950 | | |
Budweiser Brewing Co. APAC Ltd. (a) | | | 583,200 | | | | 1,968 | | |
| | | | 4,918 | | |
India (25.1%) | |
Aarti Industries Ltd. | | | 131,250 | | | | 1,528 | | |
Aarti Surfactants Ltd. (a) | | | 4,458 | | | | 13 | | |
Apollo Hospitals Enterprise Ltd. | | | 201,066 | | | | 4,062 | | |
AU Small Finance Bank Ltd. | | | 176,807 | | | | 1,989 | | |
Bajaj Finance Ltd. | | | 28,066 | | | | 1,665 | | |
Crompton Greaves Consumer Electricals Ltd. | | | 160,093 | | | | 538 | | |
HDFC Life Insurance Co., Ltd. | | | 151,632 | | | | 1,330 | | |
Kotak Mahindra Bank Ltd. | | | 111,357 | | | | 2,628 | | |
| | | | 13,753 | | |
Taiwan (14.8%) | |
King Slide Works Co., Ltd. | | | 149,000 | | | | 1,799 | | |
Silergy Corp. | | | 34,000 | | | | 1,078 | | |
Taiwan Semiconductor Manufacturing Co., Ltd. | | | 332,000 | | | | 3,666 | | |
Voltronic Power Technology Corp. | | | 65,937 | | | | 1,573 | | |
| | | | 8,116 | | |
Thailand (3.0%) | |
Muangthai Capital PCL (Foreign Shares) | | | 760,400 | | | | 1,616 | | |
United States (9.6%) | |
MercadoLibre, Inc. (a) | | | 3,696 | | | | 2,114 | | |
NIKE, Inc., Class B | | | 19,693 | | | | 1,995 | | |
Visa, Inc., Class A | | | 6,069 | | | | 1,140 | | |
XP, Inc., Class A (a) | | | 713 | | | | 28 | | |
| | | | 5,277 | | |
Total Common Stocks (Cost $38,702) | | | 52,142 | | |
| | | Shares | | Value
(000) | |
Short-Term Investment (5.0%) | |
Investment Company (5.0%) | |
Morgan Stanley Institutional Liquidity
Funds — Government Portfolio —
Institutional Class (See Note G)
(Cost $2,729) | | | 2,728,885 | | | $ | 2,729 | | |
Total Investments (100.3%) (Cost $41,431) (c)(d) | | | 54,871 | | |
Liabilities in Excess of Other Assets (-0.3%) | | | (184 | ) | |
Net Assets (100.0%) | | $ | 54,687 | | |
Country assignments and aggregations are based generally on third party vendor classifications and information, and may be different from the assignments and aggregations under the policies set forth in the Fund's prospectus and/or statement of additional information relating to geographic classifications.
(a) Non-income producing security.
(b) Security trades on the Hong Kong exchange.
(c) The approximate fair value and percentage of net assets, $2,538,000 and 4.6%, respectively, represent the securities that have been fair valued under the fair valuation policy for international investments as described in Note A-1 within the Notes to the Financial Statements.
(d) At December 31, 2019, the aggregate cost for federal income tax purposes is approximately $41,980,000. The aggregate gross unrealized appreciation is approximately $13,128,000 and the aggregate gross unrealized depreciation is approximately $237,000, resulting in net unrealized appreciation of approximately $12,891,000.
ADR American Depositary Receipt.
Portfolio Composition
Classification | | Percentage of
Total Investments | |
Internet & Direct Marketing Retail | | | 18.4 | % | |
Other* | | | 15.4 | | |
Textiles, Apparel & Luxury Goods | | | 9.2 | | |
Semiconductors & Semiconductor Equipment | | | 8.7 | | |
Banks | | | 8.4 | | |
Insurance | | | 7.8 | | |
Health Care Providers & Services | | | 7.4 | | |
Interactive Media & Services | | | 6.9 | | |
Information Technology Services | | | 6.8 | | |
Consumer Finance | | | 6.0 | | |
Short-Term Investments | | | 5.0 | | |
Total Investments | | | 100.0 | % | |
* Industries and/or investment types representing less than 5% of total investments.
The accompanying notes are an integral part of the financial statements.
8
Morgan Stanley Institutional Fund, Inc.
Annual Report — December 31, 2019
Emerging Markets Leaders Portfolio
Statement of Assets and Liabilities | | December 31, 2019
(000) | |
Assets: | |
Investments in Securities of Unaffiliated Issuers, at Value (Cost $38,702) | | $ | 52,142 | | |
Investment in Security of Affiliated Issuer, at Value (Cost $2,729) | | | 2,729 | | |
Total Investments in Securities, at Value (Cost $41,431) | | | 54,871 | | |
Foreign Currency, at Value (Cost —@) | | | — | @ | |
Tax Reclaim Receivable | | | 114 | | |
Dividends Receivable | | | 25 | | |
Receivable from Affiliate | | | 4 | | |
Receivable for Fund Shares Sold | | | 1 | | |
Other Assets | | | 98 | | |
Total Assets | | | 55,113 | | |
Liabilities: | |
Deferred Capital Gain Country Tax | | | 189 | | |
Payable for Fund Shares Redeemed | | | 61 | | |
Payable for Professional Fees | | | 56 | | |
Payable for Investments Purchased | | | 45 | | |
Payable for Advisory Fees | | | 41 | | |
Payable for Custodian Fees | | | 12 | | |
Payable for Administration Fees | | | 4 | | |
Payable for Sub Transfer Agency Fees — Class I | | | 4 | | |
Payable for Sub Transfer Agency Fees — Class A | | | — | @ | |
Payable for Sub Transfer Agency Fees — Class C | | | — | @ | |
Payable for Transfer Agency Fees — Class I | | | 1 | | |
Payable for Transfer Agency Fees — Class A | | | 1 | | |
Payable for Transfer Agency Fees — Class C | | | 1 | | |
Payable for Transfer Agency Fees — Class IS | | | — | @ | |
Payable for Shareholder Services Fees — Class A | | | — | @ | |
Payable for Distribution and Shareholder Services Fees — Class C | | | 1 | | |
Payable to the Advisor (Note F) | | | 2 | | |
Other Liabilities | | | 8 | | |
Total Liabilities | | | 426 | | |
Net Assets | | $ | 54,687 | | |
Net Assets Consist of: | |
Paid-in-Capital | | $ | 41,581 | | |
Total Distributable Earnings | | | 13,106 | | |
Net Assets | | $ | 54,687 | | |
CLASS I: | |
Net Assets | | $ | 32,651 | | |
| Shares Outstanding $0.001 par value shares of beneficial interest (unlimited shares authorized) (not in 000's) | | | 2,570,477 | | |
Net Asset Value, Offering and Redemption Price Per Share | | $ | 12.70 | | |
CLASS A: | |
Net Assets | | $ | 1,191 | | |
| Shares Outstanding $0.001 par value shares of beneficial interest (unlimited shares authorized) (not in 000's) | | | 95,018 | | |
Net Asset Value, Redemption Price Per Share | | $ | 12.53 | | |
Maximum Sales Load | | | 5.25 | % | |
Maximum Sales Charge | | $ | 0.69 | | |
Maximum Offering Price Per Share | | $ | 13.22 | | |
CLASS C: | |
Net Assets | | $ | 1,007 | | |
| Shares Outstanding $0.001 par value shares of beneficial interest (unlimited shares authorized) (not in 000's) | | | 82,751 | | |
Net Asset Value, Offering and Redemption Price Per Share | | $ | 12.17 | | |
CLASS IS: | |
Net Assets | | $ | 19,838 | | |
| Shares Outstanding $0.001 par value shares of beneficial interest (unlimited shares authorized) (not in 000's) | | | 1,560,941 | | |
Net Asset Value, Offering and Redemption Price Per Share | | $ | 12.71 | | |
@ Amount is less than $500.
The accompanying notes are an integral part of the financial statements.
9
Morgan Stanley Institutional Fund, Inc.
Annual Report — December 31, 2019
Emerging Markets Leaders Portfolio
Statement of Operations | | Year Ended
December 31, 2019
(000) | |
Investment Income: | |
Dividends from Securities of Unaffiliated Issuers (Net of $75 of Foreign Taxes Withheld) | | $ | 486 | | |
Dividends from Security of Affiliated Issuer (Note G) | | | 37 | | |
Total Investment Income | | | 523 | | |
Expenses: | |
Advisory Fees (Note B) | | | 444 | | |
Professional Fees | | | 110 | | |
Registration Fees | | | 60 | | |
Custodian Fees (Note F) | | | 54 | | |
Administration Fees (Note C) | | | 39 | | |
Sub Transfer Agency Fees — Class I | | | 18 | | |
Sub Transfer Agency Fees — Class A | | | 1 | | |
Sub Transfer Agency Fees — Class C | | | 1 | | |
Shareholder Reporting Fees | | | 14 | | |
Shareholder Services Fees — Class A (Note D) | | | 3 | | |
Distribution and Shareholder Services Fees — Class C (Note D) | | | 9 | | |
Transfer Agency Fees — Class I (Note E) | | | 3 | | |
Transfer Agency Fees — Class A (Note E) | | | 2 | | |
Transfer Agency Fees — Class C (Note E) | | | 2 | | |
Transfer Agency Fees — Class IS (Note E) | | | 2 | | |
Directors' Fees and Expenses | | | 6 | | |
Pricing Fees | | | 2 | | |
Other Expenses | | | 16 | | |
Expenses Before Non Operating Expenses | | | 786 | | |
Bank Overdraft Expense | | | 5 | | |
Total Expenses | | | 791 | | |
Waiver of Advisory Fees (Note B) | | | (202 | ) | |
Reimbursement of Class Specific Expenses — Class A (Note B) | | | (1 | ) | |
Reimbursement of Class Specific Expenses — Class C (Note B) | | | (1 | ) | |
Reimbursement of Class Specific Expenses — Class IS (Note B) | | | (2 | ) | |
Rebate from Morgan Stanley Affiliate (Note G) | | | (3 | ) | |
Net Expenses | | | 582 | | |
Net Investment Loss | | | (59 | ) | |
Realized Gain (Loss): | |
Investments Sold | | | 2,255 | | |
Foreign Currency Translation | | | (41 | ) | |
Net Realized Gain | | | 2,214 | | |
Change in Unrealized Appreciation (Depreciation): | |
Investments (Net of Increase in Deferred Capital Gain Country Tax of $113) | | | 9,889 | | |
Net Realized Gain and Change in Unrealized Appreciation (Depreciation) | | | 12,103 | | |
Net Increase in Net Assets Resulting from Operations | | $ | 12,044 | | |
The accompanying notes are an integral part of the financial statements.
10
Morgan Stanley Institutional Fund, Inc.
Annual Report — December 31, 2019
Emerging Markets Leaders Portfolio
Statements of Changes in Net Assets | | Year Ended
December 31, 2019
(000) | | Year Ended
December 31, 2018
(000) | |
Increase (Decrease) in Net Assets: | |
Operations: | |
Net Investment Income (Loss) | | $ | (59 | ) | | $ | 195 | | |
Net Realized Gain | | | 2,214 | | | | 1,109 | | |
Net Change in Unrealized Appreciation (Depreciation) | | | 9,889 | | | | (10,902 | ) | |
Net Increase (Decrease) in Net Assets Resulting from Operations | | | 12,044 | | | | (9,598 | ) | |
Dividends and Distributions to Shareholders: | |
Class I | | | (1,093 | ) | | | (189 | ) | |
Class A | | | (40 | ) | | | (4 | ) | |
Class C | | | (33 | ) | | | (3 | ) | |
Class IS | | | (539 | ) | | | (72 | ) | |
Total Dividends and Distributions to Shareholders | | | (1,705 | ) | | | (268 | ) | |
Capital Share Transactions:(1) | |
Class I: | |
Subscribed | | | 9,014 | | | | 8,770 | | |
Distributions Reinvested | | | 1,089 | | | | 153 | | |
Redeemed | | | (23,753 | ) | | | (35,622 | ) | |
Class A: | |
Subscribed | | | 76 | | | | 387 | | |
Distributions Reinvested | | | 40 | | | | 4 | | |
Redeemed | | | (155 | ) | | | (270 | ) | |
Class C: | |
Subscribed | | | 150 | | | | 314 | | |
Distributions Reinvested | | | 33 | | | | 3 | | |
Redeemed | | | (123 | ) | | | (325 | ) | |
Class IS: | |
Subscribed | | | 3,649 | | | | — | | |
Distributions Reinvested | | | 539 | | | | 72 | | |
Net Decrease in Net Assets Resulting from Capital Share Transactions | | | (9,441 | ) | | | (26,514 | ) | |
Redemption Fees | | | — | @ | | | — | @ | |
Total Increase (Decrease) in Net Assets | | | 898 | | | | (36,380 | ) | |
Net Assets: | |
Beginning of Period | | | 53,789 | | | | 90,169 | | |
End of Period | | $ | 54,687 | | | $ | 53,789 | | |
(1) Capital Share Transactions: | |
Class I: | |
Shares Subscribed | | | 806 | | | | 757 | | |
Shares Issued on Distributions Reinvested | | | 87 | | | | 14 | | |
Shares Redeemed | | | (2,098 | ) | | | (3,029 | ) | |
Net Decrease in Class I Shares Outstanding | | | (1,205 | ) | | | (2,258 | ) | |
Class A: | |
Shares Subscribed | | | 7 | | | | 32 | | |
Shares Issued on Distributions Reinvested | | | 3 | | | | — | @@ | |
Shares Redeemed | | | (14 | ) | | | (24 | ) | |
Net Increase (Decrease) in Class A Shares Outstanding | | | (4 | ) | | | 8 | | |
Class C: | |
Shares Subscribed | | | 14 | | | | 29 | | |
Shares Issued on Distributions Reinvested | | | 3 | | | | — | @@ | |
Shares Redeemed | | | (12 | ) | | | (29 | ) | |
Net Increase in Class C Shares Outstanding | | | 5 | | | | — | @@ | |
Class IS: | |
Shares Subscribed | | | 287 | | | | — | | |
Shares Issued on Distributions Reinvested | | | 43 | | | | 7 | | |
Net Increase in Class IS Shares Outstanding | | | 330 | | | | 7 | | |
@ Amount is less than $500.
@@ Amount is less than 500 shares.
The accompanying notes are an integral part of the financial statements.
11
Morgan Stanley Institutional Fund, Inc.
Annual Report — December 31, 2019
Financial Highlights
Emerging Markets Leaders Portfolio
| | | Class I | |
| | | Year Ended December 31, | | Period from
January 5, 2015(2) to | |
Selected Per Share Data and Ratios | | 2019 | | 2018 | | 2017 | | 2016(1) | | December 31, 2015 | |
Net Asset Value, Beginning of Period | | $ | 10.38 | | | $ | 12.14 | | | $ | 9.73 | | | $ | 9.45 | | | $ | 10.00 | | |
Income (Loss) from Investment Operations: | |
Net Investment Income (Loss)(3) | | | (0.02 | ) | | | 0.03 | | | | 0.08 | | | | 0.04 | | | | 0.06 | | |
Net Realized and Unrealized Gain (Loss) | | | 2.78 | | | | (1.74 | ) | | | 2.45 | | | | 0.25 | | | | (0.49 | ) | |
Total from Investment Operations | | | 2.76 | | | | (1.71 | ) | | | 2.53 | | | | 0.29 | | | | (0.43 | ) | |
Distributions from and/or in Excess of: | |
Net Investment Income | | | — | | | | (0.01 | ) | | | (0.08 | ) | | | (0.01 | ) | | | (0.12 | ) | |
Net Realized Gain | | | (0.44 | ) | | | (0.04 | ) | | | (0.04 | ) | | | — | | | | — | | |
Paid-in-Capital | | | — | | | | — | | | | — | | | | (0.00 | )(4) | | | — | | |
Total Distributions | | | (0.44 | ) | | | (0.05 | ) | | | (0.12 | ) | | | (0.01 | ) | | | (0.12 | ) | |
Redemption Fees | | | 0.00 | (4) | | | 0.00 | (4) | | | 0.00 | (4) | | | 0.00 | (4) | | | — | | |
Net Asset Value, End of Period | | $ | 12.70 | | | $ | 10.38 | | | $ | 12.14 | | | $ | 9.73 | | | $ | 9.45 | | |
Total Return(5) | | | 26.63 | % | | | (14.12 | )% | | | 26.01 | % | | | 3.08 | % | | | (4.26 | )%(7) | |
Ratios to Average Net Assets and Supplemental Data: | |
Net Assets, End of Period (Thousands) | | $ | 32,651 | | | $ | 39,206 | | | $ | 73,273 | | | $ | 25,374 | | | $ | 13,379 | | |
Ratio of Expenses Before Expense Limitation | | | 1.57 | % | | | 1.48 | % | | | 1.43 | % | | | 1.32 | % | | | 2.80 | %(8) | |
Ratio of Expenses After Expense Limitation | | | 1.17 | %(6) | | | 1.17 | %(6) | | | 1.11 | %(6) | | | 1.10 | %(6) | | | 1.14 | %(6)(8) | |
Ratio of Expenses After Expense Limitation Excluding Non-Operating Expenses | | | 1.16 | %(6) | | | 1.16 | %(6) | | | N/A | | | | N/A | | | | N/A | | |
Ratio of Net Investment Income (Loss) | | | (0.14 | )%(6) | | | 0.29 | %(6) | | | 0.67 | %(6) | | | 0.37 | %(6) | | | 0.65 | %(6)(8) | |
Ratio of Rebate from Morgan Stanley Affiliates | | | 0.01 | % | | | 0.01 | % | | | 0.01 | % | | | 0.02 | % | | | 0.01 | %(8) | |
Portfolio Turnover Rate | | | 58 | % | | | 47 | % | | | 79 | % | | | 45 | % | | | 36 | % | |
(1) Reflects prior period custodian out-of-pocket expenses that were reimbursed in September 2016. The amount of the reimbursement was immaterial on a per share basis and did not impact the total return of Class I shares. The Ratio of Expenses After Expense Limitation and the Ratio of Net Investment Income would be unchanged as the reimbursement of custodian fees was offset against expense waivers/reimbursements with no impact to net expenses or net investment income.
(2) Date of Reorganization (close of business).
(3) Per share amount is based on average shares outstanding.
(4) Amount is less than $0.005 per share.
(5) Calculated based on the net asset value as of the last business day of the period.
(6) The Ratio of Expenses After Expense Limitation and Ratio of Net Investment Income (Loss) reflect the rebate of certain Fund expenses in connection with the investments in Morgan Stanley affiliates during the period. The effect of the rebate on the ratios is disclosed in the above table as "Ratio of Rebate from Morgan Stanley Affiliates."
(7) Not annualized.
(8) Annualized.
The accompanying notes are an integral part of the financial statements.
12
Morgan Stanley Institutional Fund, Inc.
Annual Report — December 31, 2019
Financial Highlights
Emerging Markets Leaders Portfolio
| | | Class A | |
| | | Year Ended December 31, | | Period from
January 5, 2015(2) to | |
Selected Per Share Data and Ratios | | 2019 | | 2018 | | 2017 | | 2016(1) | | December 31, 2015 | |
Net Asset Value, Beginning of Period | | $ | 10.29 | | | $ | 12.06 | | | $ | 9.67 | | | $ | 9.43 | | | $ | 10.00 | | |
Income (Loss) from Investment Operations: | |
Net Investment Income (Loss)(3) | | | (0.05 | ) | | | (0.00 | )(4) | | | 0.02 | | | | (0.03 | ) | | | 0.02 | | |
Net Realized and Unrealized Gain (Loss) | | | 2.73 | | | | (1.73 | ) | | | 2.44 | | | | 0.28 | | | | (0.48 | ) | |
Total from Investment Operations | | | 2.68 | | | | (1.73 | ) | | | 2.46 | | | | 0.25 | | | | (0.46 | ) | |
Distributions from and/or in Excess of: | |
Net Investment Income | | | — | | | | — | | | | (0.03 | ) | | | (0.01 | ) | | | (0.11 | ) | |
Net Realized Gain | | | (0.44 | ) | | | (0.04 | ) | | | (0.04 | ) | | | — | | | | — | | |
Paid-in-Capital | | | — | | | | — | | | | — | | | | (0.00 | )(4) | | | — | | |
Total Distributions | | | (0.44 | ) | | | (0.04 | ) | | | (0.07 | ) | | | (0.01 | ) | | | (0.11 | ) | |
Redemption Fees | | | 0.00 | (4) | | | 0.00 | (4) | | | 0.00 | (4) | | | 0.00 | (4) | | | — | | |
Net Asset Value, End of Period | | $ | 12.53 | | | $ | 10.29 | | | $ | 12.06 | | | $ | 9.67 | | | $ | 9.43 | | |
Total Return(5) | | | 26.08 | % | | | (14.41 | )% | | | 25.46 | % | | | 2.63 | % | | | (4.61 | )%(7) | |
Ratios to Average Net Assets and Supplemental Data: | |
Net Assets, End of Period (Thousands) | | $ | 1,191 | | | $ | 1,024 | | | $ | 1,102 | | | $ | 821 | | | $ | 182 | | |
Ratio of Expenses Before Expense Limitation | | | 2.04 | % | | | 1.93 | % | | | 2.01 | % | | | 1.96 | % | | | 5.89 | %(8) | |
Ratio of Expenses After Expense Limitation | | | 1.55 | %(6) | | | 1.55 | %(6) | | | 1.54 | %(6) | | | 1.53 | %(6) | | | 1.54 | %(6)(8) | |
Ratio of Expenses After Expense Limitation Excluding Non-Operating Expenses | | | 1.54 | %(6) | | | 1.54 | %(6) | | | N/A | | | | N/A | | | | N/A | | |
Ratio of Net Investment Income (Loss) | | | (0.45 | )%(6) | | | (0.04 | )%(6) | | | 0.18 | %(6) | | | (0.33 | )%(6) | | | 0.21 | %(6)(8) | |
Ratio of Rebate from Morgan Stanley Affiliates | | | 0.01 | % | | | 0.01 | % | | | 0.01 | % | | | 0.02 | % | | | 0.01 | %(8) | |
Portfolio Turnover Rate | | | 58 | % | | | 47 | % | | | 79 | % | | | 45 | % | | | 36 | % | |
(1) Reflects prior period custodian out-of-pocket expenses that were reimbursed in September 2016. The amount of the reimbursement was immaterial on a per share basis and did not impact the total return of Class A shares. The Ratio of Expenses After Expense Limitation and the Ratio of Net Investment Loss would be unchanged as the reimbursement of custodian fees was offset against expense waivers/reimbursements with no impact to net expenses or net investment loss.
(2) Date of Reorganization (close of business).
(3) Per share amount is based on average shares outstanding.
(4) Amount is less than $0.005 per share.
(5) Calculated based on the net asset value which does not reflect sales charges, if applicable, as of the last business day of the period.
(6) The Ratio of Expenses After Expense Limitation and Ratio of Net Investment Income (Loss) reflect the rebate of certain Fund expenses in connection with the investments in Morgan Stanley affiliates during the period. The effect of the rebate on the ratios is disclosed in the above table as "Ratio of Rebate from Morgan Stanley Affiliates."
(7) Not annualized.
(8) Annualized.
The accompanying notes are an integral part of the financial statements.
13
Morgan Stanley Institutional Fund, Inc.
Annual Report — December 31, 2019
Financial Highlights
Emerging Markets Leaders Portfolio
| | | Class C | |
| | | Year Ended December 31, | | Period from
April 30, 2015(2) to | |
Selected Per Share Data and Ratios | | 2019 | | 2018 | | 2017 | | 2016(1) | | December 31, 2015 | |
Net Asset Value, Beginning of Period | | $ | 10.08 | | | $ | 11.90 | | | $ | 9.59 | | | $ | 9.42 | | | $ | 10.61 | | |
Income (Loss) from Investment Operations: | |
Net Investment Loss(3) | | | (0.13 | ) | | | (0.09 | ) | | | (0.06 | ) | | | (0.10 | ) | | | (0.06 | ) | |
Net Realized and Unrealized Gain (Loss) | | | 2.66 | | | | (1.69 | ) | | | 2.41 | | | | 0.28 | | | | (1.07 | ) | |
Total from Investment Operations | | | 2.53 | | | | (1.78 | ) | | | 2.35 | | | | 0.18 | | | | (1.13 | ) | |
Distributions from and/or in Excess of: | |
Net Investment Income | | | — | | | | — | | | | — | | | | (0.01 | ) | | | (0.06 | ) | |
Net Realized Gain | | | (0.44 | ) | | | (0.04 | ) | | | (0.04 | ) | | | — | | | | — | | |
Paid-in-Capital | | | — | | | | — | | | | — | | | | (0.00 | )(4) | | | — | | |
Total Distributions | | | (0.44 | ) | | | (0.04 | ) | | | (0.04 | ) | | | (0.01 | ) | | | (0.06 | ) | |
Redemption Fees | | | 0.00 | (4) | | | 0.00 | (4) | | | 0.00 | (4) | | | 0.00 | (4) | | | — | | |
Net Asset Value, End of Period | | $ | 12.17 | | | $ | 10.08 | | | $ | 11.90 | | | $ | 9.59 | | | $ | 9.42 | | |
Total Return(5) | | | 25.14 | % | | | (15.02 | )% | | | 24.53 | % | | | 1.89 | % | | | (10.61 | )%(8) | |
Ratios to Average Net Assets and Supplemental Data: | |
Net Assets, End of Period (Thousands) | | $ | 1,007 | | | $ | 780 | | | $ | 926 | | | $ | 587 | | | $ | 100 | | |
Ratio of Expenses Before Expense Limitation | | | 2.82 | % | | | 2.75 | % | | | 2.80 | % | | | 3.08 | % | | | 5.73 | %(9) | |
Ratio of Expenses After Expense Limitation | | | 2.30 | %(6) | | | 2.30 | %(6) | | | 2.29 | %(6) | | | 2.28 | %(6) | | | 2.30 | %(6)(9) | |
Ratio of Expenses After Expense Limitation Excluding Non-Operating Expenses | | | 2.29 | %(6) | | | 2.29 | %(6) | | | N/A | | | | N/A | | | | N/A | | |
Ratio of Net Investment Loss | | | (1.18 | )%(6) | | | (0.83 | )%(6) | | | (0.49 | )%(6) | | | (0.99 | )%(6) | | | (0.85 | )%(6)(9) | |
Ratio of Rebate from Morgan Stanley Affiliates | | | 0.01 | % | | | 0.01 | % | | | 0.01 | % | | | 0.02 | % | | | 0.00 | %(7)(9) | |
Portfolio Turnover Rate | | | 58 | % | | | 47 | % | | | 79 | % | | | 45 | % | | | 36 | % | |
(1) Reflects prior period custodian out-of-pocket expenses that were reimbursed in September 2016. The amount of the reimbursement was immaterial on a per sharebasis and did not impact the total return of Class C shares. The Ratio of Expenses After Expense Limitation and the Ratio of Net Investment Loss would be unchanged as the reimbursement of custodian fees was offset against expense waivers/reimbursements with no impact to net expenses or net investment loss.
(2) Commencement of Offering.
(3) Per share amount is based on average shares outstanding.
(4) Amount is less than $0.005 per share.
(5) Calculated based on the net asset value which does not reflect sales charges, if applicable, as of the last business day of the period.
(6) The Ratio of Expenses After Expense Limitation and Ratio of Net Investment Loss reflect the rebate of certain Fund expenses in connection with the investments in Morgan Stanley affiliates during the period. The effect of the rebate on the ratios is disclosed in the above table as "Ratio of Rebate from Morgan Stanley Affiliates."
(7) Amount is less than 0.005%.
(8) Not annualized.
(9) Annualized.
The accompanying notes are an integral part of the financial statements.
14
Morgan Stanley Institutional Fund, Inc.
Annual Report — December 31, 2019
Financial Highlights
Emerging Markets Leaders Portfolio
| | | Class IS | |
| | | Year Ended December 31, | | Period from
January 5, 2015(2) to | |
Selected Per Share Data and Ratios | | 2019 | | 2018 | | 2017 | | 2016(1) | | December 31, 2015 | |
Net Asset Value, Beginning of Period | | $ | 10.38 | | | $ | 12.14 | | | $ | 9.73 | | | $ | 9.45 | | | $ | 10.00 | | |
Income (Loss) from Investment Operations: | |
Net Investment Income (Loss)(3) | | | 0.00 | (4) | | | 0.04 | | | | 0.08 | | | | (0.00 | )(4) | | | 0.07 | | |
Net Realized and Unrealized Gain (Loss) | | | 2.77 | | | | (1.74 | ) | | | 2.45 | | | | 0.29 | | | | (0.50 | ) | |
Total from Investment Operations | | | 2.77 | | | | (1.70 | ) | | | 2.53 | | | | 0.29 | | | | (0.43 | ) | |
Distributions from and/or in Excess of: | |
Net Investment Income | | | — | | | | (0.02 | ) | | | (0.08 | ) | | | (0.01 | ) | | | (0.12 | ) | |
Net Realized Gain | | | (0.44 | ) | | | (0.04 | ) | | | (0.04 | ) | | | — | | | | — | | |
Paid-in-Capital | | | — | | | | — | | | | — | | | | (0.00 | )(4) | | | — | | |
Total Distributions | | | (0.44 | ) | | | (0.06 | ) | | | (0.12 | ) | | | (0.01 | ) | | | (0.12 | ) | |
Redemption Fees | | | 0.00 | (4) | | | 0.00 | (4) | | | 0.00 | (4) | | | 0.00 | (4) | | | — | | |
Net Asset Value, End of Period | | $ | 12.71 | | | $ | 10.38 | | | $ | 12.14 | | | $ | 9.73 | | | $ | 9.45 | | |
Total Return(5) | | | 26.73 | % | | | (14.03 | )% | | | 26.02 | % | | | 3.09 | % | | | (4.25 | )%(9) | |
Ratios to Average Net Assets and Supplemental Data: | |
Net Assets, End of Period (Thousands) | | $ | 19,838 | | | $ | 12,779 | | | $ | 14,868 | | | $ | 88,880 | | | $ | 15,925 | | |
Ratio of Expenses Before Expense Limitation | | | 1.53 | % | | | 1.44 | % | | | 1.42 | % | | | 1.31 | % | | | 2.65 | %(10) | |
Ratio of Expenses After Expense Limitation | | | 1.10 | %(6) | | | 1.10 | %(6) | | | 1.09 | %(6) | | | 1.08 | %(6) | | | 1.12 | %(6)(7)(10) | |
Ratio of Expenses After Expense Limitation Excluding Non-Operating Expenses | | | 1.09 | %(6) | | | 1.09 | %(6) | | | N/A | | | | N/A | | | | N/A | | |
Ratio of Net Investment Income (Loss) | | | 0.00 | %(6)(8) | | | 0.38 | %(6) | | | 0.72 | %(6) | | | (0.00 | )%(6)(8) | | | 0.75 | %(6)(10) | |
Ratio of Rebate from Morgan Stanley Affiliates | | | 0.01 | % | | | 0.01 | % | | | 0.01 | % | | | 0.02 | % | | | 0.01 | %(10) | |
Portfolio Turnover Rate | | | 58 | % | | | 47 | % | | | 79 | % | | | 45 | % | | | 36 | % | |
(1) Reflects prior period custodian out-of-pocket expenses that were reimbursed in September 2016. The amount of the reimbursement was immaterial on a per share basis and did not impact the total return of Class IS shares. The Ratio of Expenses After Expense Limitation and the Ratio of Net Investment Loss would be unchanged as the reimbursement of custodian fees was offset against expense waivers/reimbursements with no impact to net expenses or net investment loss.
(2) Date of Reorganization (close of business).
(3) Per share amount is based on average shares outstanding.
(4) Amount is less than $0.005 per share.
(5) Calculated based on the net asset value as of the last business day of the period.
(6) The Ratio of Expenses After Expense Limitation and Ratio of Net Investment Income (Loss) reflect the rebate of certain Fund expenses in connection with the investments in Morgan Stanley affiliates during the period. The effect of the rebate on the ratios is disclosed in the above table as "Ratio of Rebate from Morgan Stanley Affiliates."
(7) Effective September 30, 2015, the Adviser has agreed to limit the ratio of expenses to average net assets to the maximum ratio of 1.10% for Class IS shares. Prior to September 30, 2015, the maximum ratio was 1.15% for Class IS shares.
(8) Amount is less than 0.005%.
(9) Not annualized.
(10) Annualized.
The accompanying notes are an integral part of the financial statements.
15
Morgan Stanley Institutional Fund, Inc.
Annual Report — December 31, 2019
Notes to Financial Statements
Morgan Stanley Institutional Fund, Inc. (the "Company") is registered under the Investment Company Act of 1940, as amended (the "Act"), as an open-end management investment company. The Company is comprised of thirty-two separate, active, diversified and non-diversified funds (individually referred to as a "Fund," collectively as the "Funds"). The Company applies investment company accounting and reporting guidance.
The accompanying financial statements relate to the Emerging Markets Leaders Portfolio. The Fund seeks long-term capital appreciation.
The Fund offers four classes of shares — Class I, Class A, Class C and Class IS.
A. Significant Accounting Policies: The following significant accounting policies are in conformity with U.S. generally accepted accounting principles ("GAAP"). Such policies are consistently followed by the Company in the preparation of its financial statements. GAAP may require management to make estimates and assumptions that affect the reported amounts and disclosures in the financial statements. Actual results may differ from those estimates.
In August 2018, the Financial Accounting Standards Board ("FASB") issued Accounting Standards Update ("ASU") 2018-13, Fair Value Measurement (Topic 820) — Disclosures Framework — Changes to Disclosure Requirements of Fair Value Measurement ("ASU 2018-13") which introduces new fair value disclosure requirements as well as eliminates and modifies certain existing fair value disclosure requirements. ASU 2018-13 would be effective for fiscal years beginning after December 15, 2019 and for interim periods within those fiscal years; however, management has elected to early adopt ASU 2018-13 as permitted by the standard. The impact of the Fund's adoption was limited to changes in the Fund's financial statement disclosures regarding fair value, primarily those disclosures related to transfers between levels of the fair value hierarchy and disclosure of the range and weighted average used to develop significant unobservable inputs for Level 3 fair value measurements, when applicable.
1. Security Valuation: (1) An equity portfolio security listed or traded on an exchange is valued at its latest reported sales price (or at the exchange official closing price if such exchange reports an official closing price), and if there were no sales on a given day and if there is no official exchange closing price for that day, the security is valued
at the mean between the last reported bid and asked prices if such bid and asked prices are available on the relevant exchanges. If only bid prices are available then the latest bid price may be used. Listed equity securities not traded on the valuation date with no reported bid and asked prices available on the exchange are valued at the mean between the current bid and asked prices obtained from one or more reputable brokers or dealers. In cases where a security is traded on more than one exchange, the security is valued on the exchange designated as the primary market; (2) all other equity portfolio securities for which over-the-counter ("OTC") market quotations are readily available are valued at the latest reported sales price (or at the market official closing price if such market reports an official closing price), and if there was no trading in the security on a given day and if there is no official closing price from relevant markets for that day, the security is valued at the mean between the last reported bid and asked prices if such bid and asked prices are available on the relevant markets. An unlisted equity security that does not trade on the valuation date and for which bid and asked prices from the relevant markets are unavailable is valued at the mean between the current bid and asked prices obtained from one or more reputable brokers or dealers; (3) certain portfolio securities may be valued by an outside pricing service/vendor approved by the Company's Board of Directors (the "Directors"). The pricing service/vendor may employ a pricing model that takes into account, among other things, bids, yield spreads and/or other market data and specific security characteristics. Alternatively, if a valuation is not available from an outside pricing service/vendor, and the security trades on an exchange, the security may be valued at its latest reported sale price (or at the exchange official closing price if such exchange reports an official closing price), prior to the time when assets are valued. If there are no sales on a given day and if there is no official exchange closing price for that day, the security is valued at the mean between the last reported bid and asked prices if such bid and asked prices are available in the relevant exchanges. If Morgan Stanley Investment Management Inc. (the "Adviser") or Morgan Stanley Investment Management Company ("MSIM Company") (the "Sub-Adviser"), each a wholly-owned subsidiary of Morgan Stanley, determines that the price provided by the outside pricing service/vendor or exchange does not reflect the security's fair value or is unable to provide a price,
16
Morgan Stanley Institutional Fund, Inc.
Annual Report — December 31, 2019
Notes to Financial Statements (cont'd)
prices from brokers or dealers may also be utilized. In these circumstances, the value of the security will be the mean of bid and asked prices obtained from brokers or dealers; (4) when market quotations are not readily available, including circumstances under which the Adviser or the Sub-Adviser determines that the closing price, last sale price or the mean between the last reported bid and asked prices are not reflective of a security's market value, portfolio securities are valued at their fair value as determined in good faith under procedures established by and under the general supervision of the Directors. Occasionally, developments affecting the closing prices of securities and other assets may occur between the times at which valuations of such securities are determined (that is, close of the foreign market on which the securities trade) and the close of business of the New York Stock Exchange ("NYSE"). If developments occur during such periods that are expected to materially affect the value of such securities, such valuations may be adjusted to reflect the estimated fair value of such securities as of the close of the NYSE, as determined in good faith by the Directors or by the Adviser using a pricing service and/or procedures approved by the Directors; (5) quotations of foreign portfolio securities, other assets and liabilities and forward contracts stated in foreign currency are translated into U.S. dollar equivalents at the prevailing market rates prior to the close of the NYSE; and (6) investments in mutual funds, including the Morgan Stanley Institutional Liquidity Funds, are valued at the net asset value ("NAV") as of the close of each business day.
The Directors have responsibility for determining in good faith the fair value of the investments, and the Directors may appoint others, such as the Company's Adviser or a valuation committee, to assist the Directors in determining fair value and to make the actual calculations pursuant to the fair valuation methodologies previously approved by the Directors. Under procedures approved by the Directors, the Company's Adviser has formed a Valuation Committee whose members are approved by the Directors. The Valuation Committee provides administration and oversight of the Company's valuation policies and procedures, which are reviewed at least annually by the Directors. These procedures allow the Company to utilize independent pricing services, quotations from securities and financial instrument dealers and other market sources to determine fair value.
2. Fair Value Measurement: FASB Accounting Standards CodificationTM ("ASC") 820, "Fair Value Measurement" ("ASC 820"), defines fair value as the value that the Fund would receive to sell an investment or pay to transfer a liability in a timely transaction with an independent buyer in the principal market, or in the absence of a principal market, the most advantageous market for the investment or liability. ASC 820 establishes a three-tier hierarchy to distinguish between (1) inputs that reflect the assumptions market participants would use in valuing an asset or liability developed based on market data obtained from sources independent of the reporting entity (observable inputs) and (2) inputs that reflect the reporting entity's own assumptions about the assumptions market participants would use in valuing an asset or liability developed based on the best information available in the circumstances (unobservable inputs) and to establish classification of fair value measurements for disclosure purposes. Various inputs are used in determining the value of the Fund's investments. The inputs are summarized in the three broad levels listed below:
• Level 1 – unadjusted quoted prices in active markets for identical investments
• Level 2 – other significant observable inputs (including quoted prices for similar investments, interest rates, prepayment speeds, credit risk, etc.)
• Level 3 – significant unobservable inputs including the Fund's own assumptions in determining the fair value of investments. Factors considered in making this determination may include, but are not limited to, information obtained by contacting the issuer, analysts, or the appropriate stock exchange (for exchange-traded securities), analysis of the issuer's financial statements or other available documents and, if necessary, available information concerning other securities in similar circumstances.
The inputs or methodology used for valuing securities are not necessarily an indication of the risk associated with investing in those securities and the determination of the significance of a particular input to the fair value measurement in its entirety requires judgment and considers factors specific to each security.
17
Morgan Stanley Institutional Fund, Inc.
Annual Report — December 31, 2019
Notes to Financial Statements (cont'd)
The following is a summary of the inputs used to value the Fund's investments as of December 31, 2019:
Investment Type | | Level 1
Unadjusted
quoted
prices
(000) | | Level 2
Other
significant
observable
inputs
(000) | | Level 3
Significant
unobservable
inputs
(000) | | Total
(000) | |
Assets: | |
Common Stocks | |
Banks | | $ | 4,617 | | | $ | — | | | $ | — | | | $ | 4,617 | | |
Beverages | | | 1,968 | | | | — | | | | — | | | | 1,968 | | |
Capital Markets | | | 28 | | | | — | | | | — | | | | 28 | | |
Chemicals | | | 1,528 | | | | 13 | | | | — | | | | 1,541 | | |
Consumer Finance | | | 1,665 | | | | 1,616 | | | | — | | | | 3,281 | | |
Diversified Consumer
Services | | | 874 | | | | — | | | | — | | | | 874 | | |
Electrical Equipment | | | 1,573 | | | | — | | | | — | | | | 1,573 | | |
Health Care Providers &
Services | | | 4,062 | | | | — | | | | — | | | | 4,062 | | |
Hotels, Restaurants &
Leisure | | | 148 | | | | — | | | | — | | | | 148 | | |
Household Durables | | | 538 | | | | — | | | | — | | | | 538 | | |
Information Technology
Services | | | 3,742 | | | | — | | | | — | | | | 3,742 | | |
Insurance | | | 4,280 | | | | — | | | | — | | | | 4,280 | | |
Interactive Media &
Services | | | 3,808 | | | | — | | | | — | | | | 3,808 | | |
Internet & Direct
Marketing Retail | | | 10,070 | | | | — | | | | — | | | | 10,070 | | |
Machinery | | | 1,799 | | | | — | | | | — | | | | 1,799 | | |
Semiconductors &
Semiconductor
Equipment | | | 4,744 | | | | — | | | | — | | | | 4,744 | | |
Textiles, Apparel &
Luxury Goods | | | 2,531 | | | | 2,538 | | | | — | | | | 5,069 | | |
Total Common Stocks | | | 47,975 | | | | 4,167 | | | | — | | | | 52,142 | | |
Short-Term Investment | |
Investment Company | | | 2,729 | | | | — | | | | — | | | | 2,729 | | |
Total Assets | | $ | 50,704 | | | $ | 4,167 | | | $ | — | | | $ | 54,871 | | |
Transfers between investment levels may occur as the markets fluctuate and/or the availability of data used in an investment's valuation changes.
3. Foreign Currency Translation and Foreign Investments: The books and records of the Fund are maintained in U.S. dollars. Foreign currency amounts are translated into U.S. dollars as follows:
– investments, other assets and liabilities at the prevailing rate of exchange on the valuation date;
– investment transactions and investment income at the prevailing rates of exchange on the dates of such transactions.
Although the net assets of the Fund are presented at the foreign exchange rates and market values at the close of
the period, the Fund does not isolate that portion of the results of operations arising as a result of changes in the foreign exchange rates from the fluctuations arising from changes in the market prices of securities held at period end. Similarly, the Fund does not isolate the effect of changes in foreign exchange rates from the fluctuations arising from changes in the market prices of securities sold during the period. Accordingly, realized and unrealized foreign currency gains (losses) on investments in securities are included in the reported net realized and unrealized gains (losses) on investment transactions and balances. However, pursuant to U.S. federal income tax regulations, gains and losses from certain foreign currency transactions and the foreign currency portion of gains and losses realized on sales and maturities of foreign denominated debt securities are treated as ordinary income for U.S. federal income tax purposes.
Net realized gains (losses) on foreign currency transactions represent net foreign exchange gains (losses) from foreign currency forward exchange contracts, disposition of foreign currencies, currency gains (losses) realized between the trade and settlement dates on securities transactions, and the difference between the amount of investment income and foreign withholding taxes recorded on the Fund's books and the U.S. dollar equivalent amounts actually received or paid. The change in unrealized currency gains (losses) on foreign currency transactions for the period is reflected in the Statement of Operations.
Foreign security and currency transactions may involve certain considerations and risks not typically associated with those of U.S. dollar denominated transactions as a result of, among other factors, fluctuations of exchange rates in relation to the U.S. dollar, the possibility of lower levels of governmental supervision and regulation of foreign securities markets and the possibility of political or economic instability.
Governmental approval for foreign investments may be required in advance of making an investment under certain circumstances in some countries, and the extent of foreign investments in domestic companies may be subject to limitation in other countries. Foreign ownership limitations also may be imposed by the charters of individual companies to prevent, among other concerns, violations of foreign investment limitations. As a result,
18
Morgan Stanley Institutional Fund, Inc.
Annual Report — December 31, 2019
Notes to Financial Statements (cont'd)
an additional class of shares (identified as "Foreign" in the Portfolio of Investments) may be created and offered for investment. The "local" and "foreign shares" market values may differ. In the absence of trading of the foreign shares in such markets, the Fund values the foreign shares at the closing exchange price of the local shares.
4. Redemption Fees: The Fund will assess a 2% redemption fee on Class I shares, Class A shares, Class C shares and Class IS shares, which is paid directly to the Fund, for shares redeemed or exchanged within thirty days of purchase, subject to certain exceptions. The redemption fee is designed to protect the Fund and its remaining shareholders from the effects of short-term trading. These fees, if any, are included in the Statements of Changes in Net Assets.
5. Indemnifications: The Company enters into contracts that contain a variety of indemnifications. The Company's maximum exposure under these arrangements is unknown. However, the Company has not had prior claims or losses pursuant to these contracts and expects the risk of loss to be remote.
6. Dividends and Distributions to Shareholders: Dividends and distributions to shareholders are recorded on the ex-dividend date. Dividends from net investment income, if any, are declared and paid annually. Net realized capital gains, if any, are distributed at least annually.
7. Security Transactions, Income and Expenses: Security transactions are accounted for on the trade date (date the order to buy or sell is executed). Realized gains and losses on the sale of investment securities are determined on the specific identified cost method. Dividend income and other distributions are recorded on the ex-dividend date (except for certain foreign dividends which may be recorded as soon as the Fund is informed of such dividends) net of applicable withholding taxes. Interest income is recognized on the accrual basis except where collection is in doubt. Discounts are accreted and premiums are amortized over the life of the respective securities. Most expenses of the Company can be directly attributed to a particular Fund. Expenses which cannot be directly attributed are apportioned among the Funds based upon relative net assets or other appropriate methods. Income, expenses (other than class specific expenses — distribution and shareholder services, transfer agency and sub transfer agency fees) and realized and unrealized gains or losses are
allocated to each class of shares based upon their relative net assets.
B. Advisory/Sub-Advisory Fees: The Adviser, a wholly-owned subsidiary of Morgan Stanley, provides the Fund with advisory services under the terms of an Investment Advisory Agreement, paid quarterly, at the annual rate based on the daily net assets as follows:
First $1
billion | | Over $1
billion | |
| | 0.90 | % | | | 0.85 | % | |
For the year ended December 31, 2019, the advisory fee rate (net of waiver/rebate) was equivalent to an annual effective rate of 0.48% of the Fund's average daily net assets.
The Adviser has agreed to reduce its advisory fee and/or reimburse the Fund so that total annual Fund operating expenses, excluding certain investment related expenses, taxes, interest and other extraordinary expenses (including litigation), will not exceed 1.20% for Class I shares, 1.55% for Class A shares, 2.30% for Class C shares and 1.10% for Class IS shares. The fee waivers and/or expense reimbursements will continue for at least one year from the date of the Fund's prospectus or until such time as the Directors act to discontinue all or a portion of such waivers and/or reimbursements when they deem such action is appropriate. For the year ended December 31, 2019, approximately $202,000 of advisory fees were waived and approximately $4,000 of other expenses were reimbursed by the Adviser pursuant to this arrangement.
The Adviser has entered into a Sub-Advisory Agreement with the Sub-Adviser, a wholly-owned subsidiary of Morgan Stanley. The Sub-Adviser provides the Fund with advisory services subject to the overall supervision of the Adviser and the Fund's Officers and Directors. The Adviser pays the Sub-Adviser on a monthly basis a portion of the net advisory fees the Adviser receives from the Fund.
C. Administration Fees: The Adviser also serves as Administrator to the Company and provides administrative services pursuant to an Administration Agreement for an annual fee, accrued daily and paid monthly, of 0.08% of the Fund's average daily net assets.
Under a Sub-Administration Agreement between the Administrator and State Street Bank and Trust Company ("State Street"), State Street provides certain administrative services to the Company. For such services, the Administrator pays State Street a portion of the fee the Administrator receives from the Fund.
19
Morgan Stanley Institutional Fund, Inc.
Annual Report — December 31, 2019
Notes to Financial Statements (cont'd)
D. Distribution and Shareholder Services Fees: Morgan Stanley Distribution, Inc. ("MSDI" or the "Distributor"), a wholly-owned subsidiary of the Adviser and an indirect subsidiary of Morgan Stanley, serves as the Company's Distributor of Fund shares pursuant to a Distribution Agreement. The Company has adopted a Shareholder Services Plan with respect to Class A shares pursuant to Rule 12b-1 under the Act. Under the Shareholder Services Plan, the Fund pays the Distributor a shareholder services fee, accrued daily and paid monthly, at an annual rate of 0.25% of the Fund's average daily net assets attributable to Class A shares.
The Company has adopted a Distribution and Shareholder Services Plan with respect to Class C shares pursuant to Rule 12b-1 under the Act. Under the Distribution and Shareholder Services Plan, the Fund pays the Distributor a distribution fee, accrued daily and paid monthly, at an annual rate of 0.75% and a shareholder services fee, accrued daily and paid monthly, at an annual rate of 0.25% of the Fund's average daily net assets attributable to Class C shares.
The distribution and shareholder services fees are used to support the expenses associated with servicing and maintaining accounts. The Distributor may compensate other parties for providing shareholder support services to investors who purchase Class A and Class C shares.
E. Dividend Disbursing and Transfer Agent: The Company's dividend disbursing and transfer agent is DST Asset Manager Solutions, Inc. ("DST"). Pursuant to a Transfer Agency Agreement, the Company pays DST a fee based on the number of classes, accounts and transactions relating to the Funds of the Company.
F. Custodian Fees: State Street (the "Custodian") also serves as Custodian for the Company in accordance with a Custodian Agreement. The Custodian holds cash, securities and other assets of the Company as required by the Act. Custody fees are payable monthly based on assets held in custody, investment purchases and sales activity and account maintenance fees, plus reimbursement for certain out-of-pocket expenses.
G. Security Transactions and Transactions with Affiliates: For the year ended December 31, 2019, purchases and sales of investment securities for the Fund, other than long-term U.S. Government securities and short-term investments were approximately $27,718,000 and $39,872,000, respectively. There were no purchases and sales of long-term
U.S. Government securities for the year ended December 31, 2019.
The Fund invests in the Institutional Class of the Morgan Stanley Institutional Liquidity Funds — Government Portfolio (the "Liquidity Funds"), an open-end management investment company managed by the Adviser. Advisory fees paid by the Fund are reduced by an amount equal to its pro-rata share of the advisory and administration fees paid by the Fund due to its investment in the Liquidity Funds. For the year ended December 31, 2019, advisory fees paid were reduced by approximately $3,000 relating to the Fund's investment in the Liquidity Funds.
A summary of the Fund's transactions in shares of affiliated investments during the year ended December 31, 2019 is as follows:
Affiliated
Investment
Company | | Value
December 31,
2018
(000) | | Purchases
at Cost
(000) | | Proceeds
from Sales
(000) | | Dividend
Income
(000) | |
Liquidity Funds | | $ | 1,782 | | | $ | 31,067 | | | $ | 30,120 | | | $ | 37 | | |
Affiliated
Investment
Company (cont'd) | | Realized
Gain (Loss)
(000) | | Change in
Unrealized
Appreciation
(Depreciation)
(000) | | Value
December 31,
2019
(000) | |
Liquidity Funds | | $ | — | | | $ | — | | | $ | 2,729 | | |
The Fund is permitted to purchase and sell securities ("cross-trade") from and to other Morgan Stanley funds as well as other funds and client accounts for which the Adviser or an affiliate of the Adviser serves as investment adviser, pursuant to procedures approved by the Directors in compliance with Rule 17a-7 under the Act (the "Rule"). Each cross-trade is executed at the current market price in compliance with provisions of the Rule. For the year ended December 31, 2019, the Fund did not engage in any cross-trade transactions.
The Fund has an unfunded Deferred Compensation Plan (the "Compensation Plan"), which allows each independent Director to defer payment of all, or a portion, of the fees he or she receives for serving on the Board of Directors. Each eligible Director generally may elect to have the deferred amounts credited with a return equal to the total return on one or more of the Morgan Stanley funds that are offered as investment options under the Compensation Plan. Appreciation/depreciation and distributions received from these investments are recorded with an offsetting increase/decrease in the deferred compensation obligation and do not affect the NAV of the Fund.
20
Morgan Stanley Institutional Fund, Inc.
Annual Report — December 31, 2019
Notes to Financial Statements (cont'd)
H. Federal Income Taxes: It is the Fund's intention to continue to qualify as a regulated investment company and distribute all of its taxable and tax-exempt income. Accordingly, no provision for federal income taxes is required in the financial statements.
The Fund may be subject to taxes imposed by countries in which it invests. Such taxes are generally based on income and/or capital gains earned or repatriated. Taxes are accrued based on net investment income, net realized gains and net unrealized appreciation as such income and/or gains are earned. Taxes may also be based on transactions in foreign currency and are accrued based on the value of investments denominated in such currency.
FASB ASC 740-10, "Income Taxes — Overall", sets forth a minimum threshold for financial statement recognition of the benefit of a tax position taken or expected to be taken in a tax return. Management has concluded there are no significant uncertain tax positions that would require recognition in the financial statements. If applicable, the Fund recognizes interest accrued related to unrecognized tax benefits in "Interest Expense" and penalties in "Other Expenses" in the Statement of Operations. The Fund files tax returns with the U.S. Internal Revenue Service, New York and various states. Generally, each of the tax years in the four-year period ended December 31, 2019 remains subject to examination by taxing authorities.
The tax character of distributions paid may differ from the character of distributions shown for GAAP purposes due to short-term capital gains being treated as ordinary income for tax purposes. The tax character of distributions paid during fiscal years 2019 and 2018 was as follows:
2019
Distributions
Paid From: | | 2018
Distributions
Paid From: | |
Ordinary
Income
(000) | | Long-Term
Capital Gain
(000) | | Ordinary
Income
(000) | | Long-Term
Capital Gain
(000) | |
| $ | — | | | $ | 1,705 | | | $ | 61 | | | $ | 207 | | |
The amount and character of income and gains to be distributed are determined in accordance with income tax regulations which may differ from GAAP. These book/tax differences are either considered temporary or permanent in nature.
Temporary differences are attributable to differing book and tax treatments for the timing of the recognition of gains (losses) on certain investment transactions and the timing of the deductibility of certain expenses.
Permanent differences, primarily due to equalization debits, resulted in the following reclassifications among the components of net assets at December 31, 2019:
Total
Distributable
Earnings
(000) | | Paid-in
Capital
(000) | |
| $ | (151 | ) | | $ | 151 | | |
At December 31, 2019, the components of distributable earnings for the Fund on a tax basis were as follows:
Undistributed
Ordinary
Income
(000) | | Undistributed
Long-Term
Capital Gain
(000) | |
| $ | 7 | | | $ | 565 | | |
I. Credit Facility: The Company and other Morgan Stanley funds participated in a $150,000,000 committed, unsecured revolving line of credit facility (the "Facility") with State Street. Effective April 22, 2019, the committed line amount increased to $300,000,000. This Facility is to be used for temporary emergency purposes or funding of shareholder redemption requests. The interest rate on borrowings is based on the federal funds rate or 1 month LIBOR rate plus a spread. The Facility also has a commitment fee of 0.25% per annum based on the unused portion of the Facility. During the year ended December 31, 2019, the Fund did not have any borrowings under the Facility.
J. Other: At December 31, 2019, the Fund had record owners of 10% or greater. Investment activities of these shareholders could have a material impact on the Fund. The aggregate percentage of such owners was 77.4%.
21
Morgan Stanley Institutional Fund, Inc.
Annual Report — December 31, 2019
Report of Independent Registered Public Accounting Firm
To the Stockholders and Board of Directors of
Morgan Stanley Institutional Fund, Inc. —
Emerging Markets Leaders Portfolio
Opinion on the Financial Statements
We have audited the accompanying statement of assets and liabilities of Emerging Markets Leaders Portfolio (the "Fund") (one of the funds constituting Morgan Stanley Institutional Fund, Inc. (the "Company")), including the portfolio of investments, as of December 31, 2019, and the related statement of operations for the year then ended, the statements of changes in net assets for each of the two years in the period then ended, the financial highlights for each of the four years in the period then ended and the period from January 5, 2015 (commencement of operations) through December 31, 2015 and the related notes (collectively referred to as the "financial statements"). In our opinion, the financial statements present fairly, in all material respects, the financial position of Emerging Markets Leaders Portfolio (one of the funds constituting Morgan Stanley Institutional Fund, Inc.) at December 31, 2019, the results of its operations for the year then ended, the changes in its net assets for each of the two years in the period then ended and its financial highlights for each of the four years in the period then ended and the period from January 5, 2015 (commencement of operations) through December 31, 2015, in conformity with U.S. generally accepted accounting principles.
Basis for Opinion
These financial statements are the responsibility of the Company's management. Our responsibility is to express an opinion on the Fund's financial statements based on our audits. We are a public accounting firm registered with the Public Company Accounting Oversight Board (United States) ("PCAOB") and are required to be independent with respect to the Company in accordance with the U.S. federal securities law and the applicable rules and regulations of the Securities and Exchange Commission and the PCAOB.
We conducted our audits in accordance with the standards of the PCAOB. Those standards require that we plan and perform the audit to obtain reasonable assurance about whether the financial statements are free of material misstatement, whether due to error or fraud. The Company is not required to have, nor were we engaged to perform, an audit of the Company's internal control over financial reporting. As part of our audits, we are required to obtain an understanding of internal control over financial reporting, but not for the purpose of expressing an opinion on the effectiveness of the Company's internal control over financial reporting. Accordingly, we express no such opinion.
Our audits included performing procedures to assess the risks of material misstatement of the financial statements, whether due to error or fraud, and performing procedures that respond to those risks. Such procedures included examining, on a test basis, evidence regarding the amounts and disclosures in the financial statements. Our procedures included confirmation of securities owned as of December 31, 2019 by correspondence with the custodian and others or by other appropriate auditing procedures where replies from others were not received. Our audits also included evaluating the accounting principles used and significant estimates made by management, as well as evaluating the overall presentation of the financial statements. We believe that our audits provide a reasonable basis for our opinion.

We have served as the auditor of one or more Morgan Stanley investment companies since 2000.
Boston, Massachusetts
February 27, 2020
22
Morgan Stanley Institutional Fund, Inc.
Annual Report — December 31, 2019
Federal Tax Notice (unaudited)
For federal income tax purposes, the following information is furnished with respect to the distributions paid by the Fund during its taxable year ended December 31, 2019.
The Fund designated and paid approximately $1,856,000 as a long-term capital gain distribution.
In January, the Fund provides tax information to shareholders for the preceding calendar year.
23
Privacy Notice (unaudited) April 2019
FACTS | | WHAT DOES MSIM DO WITH YOUR PERSONAL INFORMATION? | |
Why? | | Financial companies choose how they share your personal information. Federal law gives consumers the right to limit some but not all sharing. Federal law also requires us to tell you how we collect, share, and protect your personal information. Please read this notice carefully to understand what we do. | |
What? | | The types of personal information we collect and share depend on the product or service you have with us. This information can include:
n Social Security number and income
n investment experience and risk tolerance
n checking account number and wire transfer instructions | |
How? | | All financial companies need to share customers' personal information to run their everyday business. In the section below, we list the reasons financial companies can share their customers' personal information; the reasons MSIM chooses to share; and whether you can limit this sharing. | |
Reasons we can share your personal information | | Does MSIM share? | | Can you limit this sharing? | |
For our everyday business purposes —
such as to process your transactions, maintain your account(s), respond to court orders and legal investigations, or report to credit bureaus | | Yes | | No | |
For our marketing purposes —
to offer our products and services to you | | Yes | | No | |
For joint marketing with other financial companies | | No | | We don't share | |
For our affiliates' everyday business purposes —
information about your transactions and experiences | | Yes | | No | |
For our affiliates' everyday business purposes —
information about your creditworthiness | | No | | We don't share | |
For our affiliates to market to you | | No | | We don't share | |
For non-affiliates to market to you | | No | | We don't share | |
Questions? Call toll-free (844) 312-6327 or email: imprivacyinquiries@morganstanley.com
24
Privacy Notice (unaudited) (cont'd) April 2019
Who we are
Who is providing this notice? | | Morgan Stanley Investment Management, Inc. and its affiliated registered investment advisers, registered broker-dealers, and registered and unregistered funds ("MSIM") | |
What we do
How does MSIM protect my personal information? | | To protect your personal information from unauthorized access and use, we use security measures that comply with federal law. These measures include computer safeguards and secured files and buildings. We have policies governing the proper handling of customer information by personnel and requiring third parties that provide support to adhere to appropriate security standards with respect to such information. | |
How does MSIM collect my personal information? | | We collect your personal information, for example, when you
n open an account or make deposits or withdrawals from your account
n buy securities from us or make a wire transfer
n give us your contact information
We also collect your personal information from others, such as credit bureaus, affiliates, or other companies. | |
Why can't I limit all sharing? | | Federal law gives you the right to limit only
n sharing for affiliates' everyday business purposes — information about your creditworthiness
n affiliates from using your information to market to you
n sharing for non-affiliates to market to you
State laws and individual companies may give you additional rights to limit sharing. See below for more on your rights under state law. | |
Definitions
Affiliates | | Companies related by common ownership or control. They can be financial and non-financial companies.
n Our affiliates include companies with a Morgan Stanley name and financial companies such as Morgan Stanley Smith Barney LLC and Morgan Stanley & Co. | |
Non-affiliates | | Companies not related by common ownership or control. They can be financial and non-financial companies.
n MSIM does not share with non-affiliates so they can market to you. | |
Joint marketing | | A formal agreement between non-affiliated financial companies that together market financial products or services to you.
n MSIM doesn't jointly market | |
Other important information
Vermont: Except as permitted by law, we will not share personal information we collect about Vermont residents with Non-affiliates unless you provide us with your written consent to share such information.
California: Except as permitted by law, we will not share personal information we collect about California residents with Non-affiliates and we will limit sharing such personal information with our Affiliates to comply with California privacy laws that apply to us.
25
Morgan Stanley Institutional Fund, Inc.
Annual Report — December 31, 2019
Director and Officer Information (unaudited)
Independent Directors:
Name, Birth Year
and Address of
Independent Director | | Position(s)
Held with
Registrant | | Length of Time
Served* | | Principal Occupation(s) During Past 5 Years
and Other Relevant Professional Experience | | Number of
Funds in Fund
Complex
Overseen by
Independent
Director** | | Other Directorships
Held by Independent
Director*** | |
Frank L. Bowman
c/o Perkins Coie LLP
Counsel to the Independent Directors
1155 Avenue of the Americas
New York, NY 10036
Birth Year 1944 | | Director | | Since August 2006 | | President, Strategic Decisions, LLC (consulting) (since February 2009); Director or Trustee of various Morgan Stanley Funds (since August 2006); Chairperson of the Compliance and Insurance Committee (since October 2015); formerly, Chairperson of the Insurance Sub-Committee of the Compliance and Insurance Committee (2007-2015); served as President and Chief Executive Officer of the Nuclear Energy Institute (policy organization) (February 2005-November 2008); retired as Admiral, U.S. Navy after serving over 38 years on active duty including 8 years as Director of the Naval Nuclear Propulsion Program in the Department of the Navy and the U.S. Department of Energy (1996-2004); served as Chief of Naval Personnel (July 1994-September 1996) and on the Joint Staff as Director of Political Military Affairs (June 1992-July 1994); knighted as Honorary Knight Commander of the Most Excellent Order of the British Empire; awarded the Officier de l'Orde National du Mérite by the French Government; elected to the National Academy of Engineering (2009). | | | 86 | | | Director of Naval and Nuclear Technologies LLP; Director Emeritus of the Armed Services YMCA; Member of the National Security Advisory Council of the Center for U.S. Global Engagement and a member of the CNA Military Advisory Board; Trustee of Fairhaven United Methodist Church; Member of the Board of Advisors of the Dolphin Scholarship Foundation; Director of other various non-profit organizations; formerly, Director of BP p.l.c. (November 2010-May 2019). | |
Kathleen A. Dennis
c/o Perkins Coie LLP
Counsel to the Independent Directors
1155 Avenue of the Americas
New York, NY 10036
Birth Year 1953 | | Director | | Since August 2006 | | President, Cedarwood Associates (mutual fund and investment management consulting) (since July 2006); Chairperson of the Liquidity and Alternatives Sub-Committee of the Investment Committee (since October 2006) and Director or Trustee of various Morgan Stanley Funds (since August 2006); formerly, Senior Managing Director of Victory Capital Management (1993-2006). | | | 86 | | | Director of various non-profit organizations. | |
Nancy C. Everett
c/o Perkins Coie LLP
Counsel to the Independent Directors
1155 Avenue of the Americas
New York, NY 10036
Birth Year 1955 | | Director | | Since January 2015 | | Chief Executive Officer, Virginia Commonwealth University Investment Company (since November 2015); Owner, OBIR, LLC (institutional investment management consulting) (since June 2014); formerly, Managing Director, BlackRock, Inc. (February 2011-December 2013); and Chief Executive Officer, General Motors Asset Management (a/k/a Promark Global Advisors, Inc.) (June 2005-May 2010). | | | 87 | | | Formerly, Member of Virginia Commonwealth University School of Business Foundation (2005-2016); Member of Virginia Commonwealth University Board of Visitors (2013-2015); Member of Committee on Directors for Emerging Markets Growth Fund, Inc. (2007-2010); Chairperson of Performance Equity Management, LLC (2006-2010); and Chairperson, GMAM Absolute Return Strategies Fund, LLC (2006-2010). | |
26
Morgan Stanley Institutional Fund, Inc.
Annual Report — December 31, 2019
Director and Officer Information (unaudited) (cont'd)
Independent Directors: (cont'd)
Name, Birth Year
and Address of
Independent Director | | Position(s)
Held with
Registrant | | Length of Time
Served* | | Principal Occupation(s) During Past 5 Years
and Other Relevant Professional Experience | | Number of
Funds in Fund
Complex
Overseen by
Independent
Director** | | Other Directorships
Held by Independent
Director*** | |
Jakki L. Haussler
c/o Perkins Coie LLP
Counsel to the Independent Directors
1155 Avenue of the Americas
New York, NY 10036
Birth Year 1957 | | Director | | Since January 2015 | | Chairman, Opus Capital Group (since 1996); formerly, Chief Executive Officer, Opus Capital Group (1996-2019); Director, Capvest Venture Fund, LP (May 2000-December 2011); Partner, Adena Ventures, LP (July 1999-December 2010); Director, The Victory Funds (February 2005-July 2008). | | | 87 | | | Director of Service Corporation International and Member, Audit Committee and Investment Committee; Director of Cincinnati Bell Inc. and Member, Audit Committee and Governance and Nominating Committee; Chairman of Northern Kentucky University Member Investment Committee; Member of Chase College of Law Transactional Law Practice Center Board of Advisors; Director of Best Transport; Director of Chase College of Law Board of Visitors; formerly, Member, University of Cincinnati Foundation Investment Committee; Member, Miami University Board of Visitors (2008-2011); Trustee of Victory Funds (2005-2008) and Chairman, Investment Committee (2007-2008) and Member, Service Provider Committee (2005-2008). | |
Dr. Manuel H. Johnson
c/o Johnson Smick International, Inc.
220 I Street, NE — Suite 200
Washington, D.C. 20002
Birth Year 1949 | | Director | | Since July 1991 | | Senior Partner, Johnson Smick International, Inc. (consulting firm); Chairperson of the Investment Committee (since October 2006) and Director or Trustee of various Morgan Stanley Funds (since July 1991); Co-Chairman and a founder of the Group of Seven Council (G7C) (international economic commission); formerly, Chairperson of the Audit Committee (July 1991-September 2006), Vice Chairman of the Board of Governors of the Federal Reserve System and Assistant Secretary of the U.S. Treasury. | | | 86 | | | Director of NVR, Inc. (home construction). | |
Joseph J. Kearns
c/o Perkins Coie LLP
Counsel to the Independent Directors
1155 Avenue of the Americas
New York, NY 10036
Birth Year 1942 | | Director | | Since August 1994 | | Senior Adviser, Kearns & Associates LLC (investment consulting); Chairperson of the Audit Committee (since October 2006) and Director or Trustee of various Morgan Stanley Funds (since August 1994); formerly, Deputy Chairperson of the Audit Committee (July 2003-September 2006) and Chairperson of the Audit Committee of various Morgan Stanley Funds (since August 1994); CFO of the J. Paul Getty Trust. | | | 87 | | | Prior to August 10, 2016, Director of Electro Rent Corporation (equipment leasing); Prior to December 31, 2013, Director of The Ford Family Foundation. | |
27
Morgan Stanley Institutional Fund, Inc.
Annual Report — December 31, 2019
Director and Officer Information (unaudited) (cont'd)
Independent Directors: (cont'd)
Name, Birth Year
and Address of
Independent Director | | Position(s)
Held with
Registrant | | Length of Time
Served* | | Principal Occupation(s) During Past 5 Years
and Other Relevant Professional Experience | | Number of
Funds in Fund
Complex
Overseen by
Independent
Director** | | Other Directorships
Held by Independent
Director*** | |
Michael F. Klein
c/o Perkins Coie LLP
Counsel to the Independent Directors
1155 Avenue of the Americas
New York, NY 10036
Birth Year 1958 | | Director | | Since August 2006 | | Managing Director, Aetos Alternatives Management, LP (since March 2000); Co-President, Aetos Alternatives Management, LP (since January 2004) and Co-Chief Executive Officer of Aetos Alternatives Management, LP (since August 2013); Chairperson of the Fixed Income Sub-Committee of the Investment Committee (since October 2006) and Director or Trustee of various Morgan Stanley Funds (since August 2006); formerly, Managing Director, Morgan Stanley & Co. Inc. and Morgan Stanley Dean Witter Investment Management and President, various Morgan Stanley Funds (June 1998-March 2000); Principal, Morgan Stanley & Co. Inc. and Morgan Stanley Dean Witter Investment Management (August 1997-December 1999). | | | 86 | | | Director of certain investment funds managed or sponsored by Aetos Alternatives Management, LP; Director of Sanitized AG and Sanitized Marketing AG (specialty chemicals). | |
Patricia Maleski
c/o Perkins Coie LLP
Counsel to the Independent Directors
1155 Avenue of the Americas
New York, NY 10036
Birth Year 1960 | | Director | | Since January 2017 | | Managing Director, JPMorgan Asset Management (2004-2016); Oversight and Control Head of Fiduciary and Conflicts of Interest Program (2015-2016); Chief Control Officer-Global Asset Management (2013-2015); President, JPMorgan Funds (2010-2013); Chief Administrative Officer (2004-2013); various other positions including Treasurer and Board Liaison (since 2001). | | | 87 | | | None. | |
Michael E. Nugent
522 Fifth Avenue
New York, NY 10036
Birth Year 1936 | | Chair of the Board and Director | | Chair of the Boards since July 2006 and Director since July 1991 | | Chair of the Boards of various Morgan Stanley Funds (since July 2006); Chairperson of the Governance Committee (since January 2019) and Director or Trustee of various Morgan Stanley Funds (since July 1991); formerly, Chairperson of each of the Closed-End Fund committee (until December 2019) and the Insurance Committee (until July 2006); General Partner, Triumph Capital, L.P. (private investment partnership) (1988-2013). | | | 86 | | | None. | |
W. Allen Reed
c/o Perkins Coie LLP
Counsel to the Independent Directors
1155 Avenue of the Americas
New York, NY 10036
Birth Year 1947 | | Vice Chair of the Board and Director | | Vice Chair of the Boards since January 2020 and Director since August 2006 | | Chairperson of the Equity Sub-Committee of the Investment Committee (since October 2006) and Director or Trustee of various Morgan Stanley Funds (since August 2006); formerly, President and CEO of General Motors Asset Management; Chairman and Chief Executive Officer of the GM Trust Bank and Corporate Vice President of General Motors Corporation (August 1994- December 2005). | | | 86 | | | Formerly, Director of Legg Mason, Inc.; formerly, Director of the Auburn University Foundation (2010-2015). | |
* This is the earliest date the Director began serving the Morgan Stanley Funds. Each Director serves an indefinite term, until his or her successor is elected.
** The Fund Complex includes (as of December 31, 2019) all open-end and closed-end funds (including all of their portfolios) advised by Morgan Stanley Investment Management Inc. (the "Adviser") and any funds that have an adviser that is an affiliated person of the Adviser (including, but not limited to, Morgan Stanley AIP GP LP).
*** This includes any directorships at public companies and registered investment companies held by the Director at any time during the past five years.
28
Morgan Stanley Institutional Fund, Inc.
Annual Report — December 31, 2019
Director and Officer Information (unaudited) (cont'd)
Executive Officers:
Name, Birth Year and Address of
Executive Officer | | Position(s)
Held with
Registrant | | Length of Time
Served* | | Principal Occupation(s) During Past 5 Years | |
John H. Gernon
522 Fifth Avenue
New York, NY 10036
Birth Year 1963 | | President and Principal Executive Officer | | Since September 2013 | | President and Principal Executive Officer of the Equity and Fixed Income Funds and the Morgan Stanley AIP Funds (since September 2013) and the Liquidity Funds and various money market funds (since May 2014) in the Fund Complex; Managing Director of the Adviser; Head of Product (since 2006). | |
Timothy J. Knierim
522 Fifth Avenue
New York, NY 10036
Birth Year 1959 | | Chief Compliance Officer | | Since December 2016 | | Managing Director of the Adviser and various entities affiliated with the Adviser; Chief Compliance Officer of various Morgan Stanley Funds and the Adviser (since December 2016) and Chief Compliance Officer of Morgan Stanley AIP GP LP (since 2014). Formerly, Managing Director and Deputy Chief Compliance Officer of the Adviser (2014-2016); and formerly, Chief Compliance Officer of Prudential Investment Management, Inc. (2007-2014). | |
Francis J. Smith
522 Fifth Avenue
New York, NY 10036
Birth Year 1965 | | Treasurer and Principal Financial Officer | | Treasurer since July 2003 and Principal Financial Officer since September 2002 | | Managing Director of the Adviser and various entities affiliated with the Adviser; Treasurer (since July 2003) and Principal Financial Officer of various Morgan Stanley Funds (since September 2002). | |
Mary E. Mullin
522 Fifth Avenue
New York, NY 10036
Birth Year 1967 | | Secretary | | Since June 1999 | | Managing Director of the Adviser; Secretary of various Morgan Stanley Funds (since June 1999). | |
Michael J. Key
522 Fifth Avenue
New York, NY 10036
Birth Year 1979 | | Vice President | | Since June 2017 | | Vice President of the Equity and Fixed Income Funds, Liquidity Funds, various money market funds and the Morgan Stanley AIP Funds in the Fund Complex (since June 2017); Executive Director of the Adviser; Head of Product Development for Equity and Fixed Income Funds (since August 2013). | |
* This is the earliest date the officer began serving the Morgan Stanley Funds. Each officer serves a one-year term, until his or her successor is elected and qualifies.
29
Morgan Stanley Institutional Fund, Inc.
Annual Report — December 31, 2019
Adviser and Administrator
Morgan Stanley Investment Management Inc.
522 Fifth Avenue
New York, New York 10036
Sub-Adviser
Morgan Stanley Investment Management Company
23 Church Street
16-01 Capital Square, Singapore 049481
Distributor
Morgan Stanley Distribution, Inc.
522 Fifth Avenue
New York, New York 10036
Dividend Disbursing and Transfer Agent
DST Asset Manager Solutions, Inc.
2000 Crown Colony Drive
Quincy, Massachusetts 02169
Custodian
State Street Bank and Trust Company
One Lincoln Street
Boston, Massachusetts 02111
Legal Counsel
Dechert LLP
1095 Avenue of the Americas
New York, New York 10036
Counsel to the Independent Directors
Perkins Coie LLP
1155 Avenue of the Americas
New York, New York 10036
Independent Registered Public Accounting Firm
Ernst & Young LLP
200 Clarendon Street
Boston, Massachusetts 02116
Reporting to Shareholders
Each Morgan Stanley fund provides a complete schedule of portfolio holdings in its Semi-Annual and the Annual Reports within 60 days of the end of the fund's second and fourth fiscal quarters. The Semi-Annual and Annual Reports are filed electronically with the Securities and Exchange Commission ("SEC") on Form N-CSRS and Form N-CSR, respectively. Morgan Stanley also delivers the Semi-Annual and Annual Reports to fund shareholders and makes these reports available on its public website, www.morganstanley.com/im/shareholderreports. Each Morgan Stanley non-money market fund also files a complete schedule of portfolio holdings with the SEC for the fund's first and third fiscal quarters as an attachment to Form N-PORT. Morgan Stanley does not deliver the reports for the first and third fiscal quarters to shareholders, nor are the reports posted to the Morgan Stanley public website. However, the holdings for each money market fund are posted to the Morgan Stanley public website. You may obtain the Form N-PORT filings (as well as the Form N-CSR and N-CSRS filings) by accessing the SEC's website, www.sec.gov. You can also request copies of these materials, upon payment of a duplicating fee, by electronic request at the SEC's email address (publicinfo@sec.gov).
Proxy Voting Policies and Procedures and Proxy Voting Record
You may obtain a copy of the Company's Proxy Voting Policy and Procedures and information regarding how the Company voted proxies relating to portfolio securities during the most recent twelve-month period ended June 30, without charge, upon request, by calling toll free 1 (800) 548-7786 or by visiting our website at www.morganstanley.com/im/shareholderreports. This information is also available on the SEC's website at www.sec.gov.
This report is authorized for distribution only when preceded or accompanied by a prospectus or summary prospectus of the applicable Portfolio of Morgan Stanley Institutional Fund, Inc., which describes in detail the Portfolio's investment policies, risks, fees and expenses. Please read the prospectus carefully before you invest or send money. For additional information, including information regarding the investments comprising the Portfolio, please visit our website at www.morganstanley.com/im/shareholderreports or call toll free 1 (800) 548-7786.
30
Printed in U.S.A.
This Report has been prepared for shareholders and may be distributed to others only if preceded or accompanied by a current prospectus.
Morgan Stanley Investment Management Inc.
522 Fifth Avenue
New York, New York 10036
© 2020 Morgan Stanley. Morgan Stanley Distribution, Inc.

IFIEMLANN
2916001 EXP. 02.28.21

Morgan Stanley Institutional Fund, Inc.
Asia Opportunity Portfolio
Annual Report
December 31, 2019
Beginning on January 1, 2021, as permitted by regulations adopted by the Securities and Exchange Commission ("SEC"), paper copies of the Fund's Annual and Semi-Annual Reports to Shareholders ("Shareholder Reports") will no longer be sent by mail, unless you specifically request paper copies of the Shareholder Reports from the Fund or from your financial intermediary, such as a broker-dealer or a bank. Instead, the Shareholder Reports will be made available on the Fund's website, https://www.morganstanley.com/im/shareholderreports and you will be notified by mail each time a Shareholder Report is posted and provided with a website link to access the Shareholder Report. If you already elected to receive Shareholder Reports electronically, you will not be affected by this change and you need not take any action. You may elect to receive Shareholder Reports and other communications from the Fund electronically anytime by contacting your financial intermediary or, if you are a direct investor, please follow the instructions on the envelope.
Beginning on January 1, 2019, you may elect to receive all future Shareholder Reports in paper free of charge. If you invest through a financial intermediary, you can contact your financial intermediary to request that you continue to receive paper copies of your Shareholder Reports. If you invest directly with the Fund, please follow the instructions on the envelope to let the Fund know you wish to continue receiving paper copies of your Shareholder Reports. Your election to receive Shareholder Reports in paper will apply to all funds held in your account if you invest through your financial intermediary or all funds held with the fund complex if you invest directly with a fund.

Morgan Stanley Institutional Fund, Inc.
Annual Report — December 31, 2019
Shareholders' Letter | | | 2 | | |
Expense Example | | | 3 | | |
Investment Overview | | | 4 | | |
Portfolio of Investments | | | 6 | | |
Statement of Assets and Liabilities | | | 8 | | |
Statement of Operations | | | 9 | | |
Statements of Changes in Net Assets | | | 10 | | |
Financial Highlights | | | 11 | | |
Notes to Financial Statements | | | 15 | | |
Report of Independent Registered Public Accounting Firm | | | 24 | | |
Federal Tax Notice | | | 25 | | |
Privacy Notice | | | 26 | | |
Director and Officer Information | | | 28 | | |
This report is authorized for distribution only when preceded or accompanied by a prospectus or summary prospectus of the applicable Fund of Morgan Stanley Institutional Fund, Inc. To receive a prospectus and/or statement of additional information ("SAI"), which contains more complete information such as investment objectives, charges, expenses, policies for voting proxies, risk considerations and describes in detail each of the Fund's investment policies to the prospective investor, please call toll free 1 (800) 548-7786. Please read the prospectuses carefully before you invest or send money.
Additionally, you can access information about the Fund, including performance, characteristics and investment team commentary, through Morgan Stanley Investment Management's website: www.morganstanley.com/im/shareholderreports.
Market forecasts provided in this report may not necessarily come to pass. There is no guarantee that any sectors mentioned will continue to perform as discussed herein or that securities in such sectors will be held by the Fund in the future. There is no assurance that a fund will achieve its investment objective. Funds are subject to market risk, which is the possibility that market values of securities owned by the Fund will decline and, therefore, the value of the Fund's shares may be less than what you paid for them. Accordingly, you can lose money investing in this Fund. Please see the prospectus for more complete information on investment risks.
1
Morgan Stanley Institutional Fund, Inc.
Annual Report — December 31, 2019
Shareholders' Letter (unaudited)
Dear Shareholders,
We are pleased to provide this Annual Report, in which you will learn how your investment in Asia Opportunity Portfolio (the "Fund") performed during the latest twelve-month period.
Morgan Stanley Investment Management is a client-centric, investor-led organization. Our global presence, intellectual capital, and breadth of products and services enable us to partner with investors to meet the evolving challenges of today's financial markets. We aim to deliver superior investment service and to empower our clients to make the informed decisions that help them reach their investment goals.
As always, we thank you for selecting Morgan Stanley Investment Management, and look forward to working with you in the months and years ahead.
Sincerely,

John H. Gernon
President and Principal Executive Officer
January 2020
2
Morgan Stanley Institutional Fund, Inc.
Annual Report — December 31, 2019
Expense Example (unaudited)
Asia Opportunity Portfolio
As a shareholder of the Fund, you incur two types of costs: (1) transactional costs, including redemption fees; and (2) ongoing costs, which may include advisory fees, administration fees, distribution and shareholder services fees and other Fund expenses. This example is intended to help you understand your ongoing costs (in dollars) of investing in the Fund and to compare these costs with the ongoing costs of investing in other mutual funds.
This example is based on an investment of $1,000 invested at the beginning of the six-month period ended December 31, 2019 and held for the entire six-month period.
Actual Expenses
The table below provides information about actual account values and actual expenses. You may use the information in this table, together with the amount you invested, to estimate the expenses that you paid over the period. Simply divide your account value by $1,000 (for example, an $8,600 account value divided by $1,000 = 8.6), then multiply the result by the number in the table under the heading entitled "Actual Expenses Paid During Period" to estimate the expenses you paid on your account during this period.
Hypothetical Example for Comparison Purposes
The table below provides information about hypothetical account values and hypothetical expenses based on the Fund's actual expense ratio and an assumed rate of return of 5% per year before expenses, which is not the Fund's actual return. The hypothetical account values and expenses may not be used to estimate the actual ending account balance or expenses you paid for the period. You may use this information to compare the ongoing costs of investing in the Fund and other funds. To do so, compare this 5% hypothetical example with the 5% hypothetical examples that appear in the shareholder reports of the other funds.
Please note that the expenses shown in the table are meant to highlight your ongoing costs only and do not reflect any transactional costs, such as sales charges (loads) and redemption fees. Therefore, the information for each class in the table is useful in comparing ongoing costs only, and will not help you determine the relative total costs of owning different funds. In addition, if these transactional costs were included, your costs would have been higher.
| | | Beginning
Account
Value
7/1/19 | | Actual Ending
Account
Value
12/31/19 | | Hypothetical
Ending Account
Value | | Actual
Expenses
Paid
During
Period* | | Hypothetical
Expenses Paid
During Period* | | Net
Expense
Ratio
During
Period** | |
Asia Opportunity Portfolio Class I | | $ | 1,000.00 | | | $ | 1,119.80 | | | $ | 1,019.76 | | | $ | 5.77 | | | $ | 5.50 | | | | 1.08 | % | |
Asia Opportunity Portfolio Class A | | | 1,000.00 | | | | 1,117.70 | | | | 1,018.45 | | | | 7.15 | | | | 6.82 | | | | 1.34 | | |
Asia Opportunity Portfolio Class C | | | 1,000.00 | | | | 1,113.80 | | | | 1,014.37 | | | | 11.46 | | | | 10.92 | | | | 2.15 | | |
Asia Opportunity Portfolio Class IS | | | 1,000.00 | | | | 1,120.00 | | | | 1,020.01 | | | | 5.50 | | | | 5.24 | | | | 1.03 | | |
* Expenses are calculated using each Fund Class' annualized net expense ratio (as disclosed), multiplied by the average account value over the period and multiplied by 184/365 (to reflect the most recent one-half year period).
** Annualized.
3
Morgan Stanley Institutional Fund, Inc.
Annual Report — December 31, 2019
Investment Overview (unaudited)
Asia Opportunity Portfolio
The Fund seeks long-term capital appreciation.
Performance
For the fiscal year ended December 31, 2019, the Fund's Class I shares had a total return based on net asset value and reinvestment of distributions per share of 44.74%, net of fees. The Fund's Class I shares outperformed the Fund's benchmark, the MSCI All Country Asia ex Japan Net Index (the "Index"), which returned 18.17%.
Please keep in mind that double-digit returns are highly unusual and cannot be sustained. Investors should also be aware that these returns were primarily achieved during favorable market conditions.
Factors Affecting Performance
• Easing geopolitical tensions, reduced recession fears and central bank support drove global equities sharply higher over 2019. Asia ex Japan equities lagged the broader global market's advance, but nonetheless ended the year with a strong positive return (as measured by the Index). Asian markets remained sensitive to trade conflict headlines while economic growth across the region moderated in response to waning global demand and slowing manufacturing activity. However, monetary and fiscal stimulus measures, particularly in China; U.S. dollar weakness; and an easing in U.S.-China trade tensions later in the year helped buoy share prices.
• Asian equity markets advanced by 18.17% for the 12-month period ended December 31, 2019, as measured by the Index. Our team remained focused on assessing company prospects over a longer-term period of three to five years, and owning a portfolio of high quality companies with diverse business drivers not tied to a particular market environment.
• The team manages concentrated portfolios that are highly differentiated from the benchmark, with securities weighted on our assessment of the quality of the company and our conviction. The value added or detracted in any period of time will typically result from stock selection, given our philosophy and process. For the 12-month period, the Fund outperformed the Index due to favorable stock selection and sector allocation.
• Our stock selection in the consumes staples sector, along with stock selection and a sector overweight
in consumer discretionary, contributed the most to the Fund's relative performance.
• The main detractors from relative performance were a sector underweight in the information technology sector and sector overweights in the consumer staples and health care sectors.
Management Strategies
• There were no changes to our bottom-up investment process during the period. The Fund seeks long-term capital appreciation by investing in high quality established and emerging companies located in Asia (excluding Japan) that the investment team believes are undervalued at the time of purchase. To achieve its objective, we seek companies with sustainable competitive advantages and long-term growth that creates value, rather than focusing on short-term events, with stock selection informed by rigorous fundamental analysis.
• At the close of the period, consumer discretionary represented the largest sector weight in the portfolio, followed by financials, consumer staples and communication services. Our bottom-up investment process resulted in sector overweight positions in consumer discretionary, consumer staples, communication services and health care, and underweight positions in information technology, financials, industrials, real estate, materials, energy and utilities. The Fund had no holdings in energy, real estate, industrial and utilities at the end of the reporting period.
4
Morgan Stanley Institutional Fund, Inc.
Annual Report — December 31, 2019
Investment Overview (unaudited) (cont'd)
Asia Opportunity Portfolio
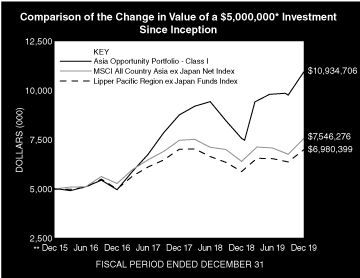
* Minimum Investment for Class I shares
** Commenced Operations on December 29, 2015.
In accordance with SEC regulations, the Fund's performance shown assumes that all recurring fees (including management fees) were deducted and all dividends and distributions were reinvested. The performance of Class A, C and IS shares will vary from the performance of Class I shares and will be negatively impacted by additional fees assessed to those classes (if applicable).
Performance Compared to the MSCI All Country Asia ex Japan Net Index(1) and the Lipper Pacific Region ex Japan Funds Index(2)
| | | Period Ended December 31, 2019
Total Returns(3) | |
| | | | | Average Annual | |
| | | One
Year | | Five
Years | | Ten
Years | | Since
Inception(5) | |
Fund — Class I Shares
w/o sales charges(4) | | | 44.74 | % | | | — | | | | — | | | | 21.57 | % | |
Fund — Class A Shares
w/o sales charges(4) | | | 44.17 | | | | — | | | | — | | | | 21.16 | | |
Fund — Class A Shares with
maximum 5.25% sales charges(4) | | | 36.60 | | | | — | | | | — | | | | 19.55 | | |
Fund — Class C Shares
w/o sales charges(4) | | | 43.21 | | | | — | | | | — | | | | 20.25 | | |
Fund — Class C Shares with
maximum 1.00% deferred
sales charges(4) | | | 42.21 | | | | — | | | | — | | | | 20.25 | | |
Fund — Class IS Shares
w/o sales charges(4) | | | 44.82 | | | | — | | | | — | | | | 21.63 | | |
MSCI All Country Asia ex Japan
Net Index | | | 18.17 | | | | — | | | | — | | | | 10.82 | | |
Lipper Pacific Region ex Japan
Funds Index | | | 18.91 | | | | — | | | | — | | | | 8.69 | | |
Performance data quoted represents past performance, which is no guarantee of future results, and current performance may be lower or higher than the figures shown. Performance assumes that all dividends and distributions, if any, were reinvested. For the most recent month-end performance figures, please visit www.morganstanley.com/im/shareholderreports. Investment return and principal value will fluctuate so that Fund shares, when redeemed, may be worth more or less than their original cost. Total returns do not reflect the deduction of taxes that a shareholder would pay on Fund distributions or the redemption of Fund shares. Performance of share classes will vary due to difference in sales charges and expenses.
(1) The MSCI All Country Asia ex Japan Net Index is a free float-adjusted market capitalization weighted index that is designed to measure the equity market performance of Asia, excluding Japan. The performance of the Index is listed in U.S. dollars and assumes reinvestment of net dividends. Net total return indices reinvest dividends after the deduction of withholding taxes, using (for international indices) a tax rate applicable to non-resident institutional investors who do not benefit from double taxation treaties. The Index is unmanaged and its returns do not include any sales charges or fees. Such costs would lower performance. It is not possible to invest directly in an index.
(2) The Lipper Pacific Region ex Japan Funds Index is an equally weighted performance index of the largest qualifying funds (based on net assets) in the Lipper Pacific Region ex Japan Funds classification. The Index, which is adjusted for capital gains distributions and income dividends, is unmanaged and should not be considered an investment. There are currently 10 funds represented in this Index. As of the date of this report, the Fund was in the Lipper Pacific Region ex Japan Funds classification.
(3) Total returns for the Fund reflect fees waived and expenses reimbursed, if applicable, by the Adviser (as defined herein). Without such waivers and reimbursements, total returns would have been lower.
(4) Commenced operations on December 29, 2015.
(5) For comparative purposes, average annual since inception returns listed for the Indexes refer to the inception date of the Fund, not the inception of the Index.
5
Morgan Stanley Institutional Fund, Inc.
Annual Report — December 31, 2019
Portfolio of Investments
Asia Opportunity Portfolio
| | | Shares | | Value
(000) | |
Common Stocks (89.5%) | |
China (61.2%) | |
Alibaba Group Holding Ltd. ADR (a) | | | 34,701 | | | $ | 7,360 | | |
China East Education Holdings Ltd. (a)(b) | | | 1,452,500 | | | | 3,042 | | |
China Resources Beer Holdings Co., Ltd. (b) | | | 1,158,300 | | | | 6,407 | | |
Foshan Haitian Flavouring & Food Co., Ltd.,
Class A | | | 227,928 | | | | 3,518 | | |
GSX Techedu, Inc. ADR (a) | | | 182,927 | | | | 3,999 | | |
Haidilao International Holding Ltd. (b)(c) | | | 460,000 | | | | 1,848 | | |
Hangzhou Tigermed Consulting Co., Ltd.,
Class A | | | 628,479 | | | | 5,698 | | |
Huazhu Group Ltd. ADR | | | 159,754 | | | | 6,401 | | |
HUYA, Inc. ADR (a)(d) | | | 284,653 | | | | 5,110 | | |
Inner Mongolia Yili Industrial Group Co., Ltd.,
Class A | | | 603,692 | | | | 2,681 | | |
Kweichow Moutai Co., Ltd., Class A | | | 31,394 | | | | 5,332 | | |
Meituan Dianping, Class B (a)(b)(d) | | | 596,700 | | | | 7,803 | | |
Poly Property Development Co., Ltd.,
Class H (a)(b) | | | 7,200 | | | | 43 | | |
Shenzhou International Group Holdings Ltd. (b) | | | 453,400 | | | | 6,627 | | |
TAL Education Group ADR (a) | | | 116,951 | | | | 5,637 | | |
Tencent Holdings Ltd. (b) | | | 131,100 | | | | 6,319 | | |
Trip.com Group Ltd. ADR (a) | | | 186,924 | | | | 6,269 | | |
| | | | 84,094 | | |
Hong Kong (4.8%) | |
AIA Group Ltd. | | | 621,700 | | | | 6,526 | | |
India (8.2%) | |
HDFC Bank Ltd. ADR | | | 178,710 | | | | 11,325 | | |
Korea, Republic of (4.8%) | |
NAVER Corp. | | | 40,915 | | | | 6,583 | | |
Taiwan (10.0%) | |
Nien Made Enterprise Co., Ltd. | | | 318,000 | | | | 2,938 | | |
Silergy Corp. | | | 137,000 | | | | 4,342 | | |
Taiwan Semiconductor Manufacturing Co., Ltd. | | | 586,000 | | | | 6,471 | | |
| | | | 13,751 | | |
United States (0.5%) | |
New Frontier Health Corp. (a) | | | 73,619 | | | | 723 | | |
Total Common Stocks (Cost $98,808) | | | 123,002 | | |
| | | Shares | | Value
(000) | |
Short-Term Investment (10.9%) | |
Investment Company (10.9%) | |
Morgan Stanley Institutional Liquidity
Funds — Treasury Securities Portfolio —
Institutional Class (See Note G)
(Cost $14,961) | | | 14,960,649 | | | $ | 14,961 | | |
Total Investments Excluding Purchased
Options (100.4%) (Cost $113,769) | | | 137,963 | | |
Total Purchased Options
Outstanding (0.0%) (Cost $179) | | | 24 | | |
Total Investments (100.4%) (Cost $113,948)
Including $12,526 of Securities Loaned (e)(f) | | | 137,987 | | |
Liabilities in Excess of Other Assets (–0.4%) | | | (605 | ) | |
Net Assets (100.0%) | | $ | 137,382 | | |
Country assignments and aggregations are based generally on third party vendor classifications and information, and may be different from the assignments and aggregations under the policies set forth in the Fund's prospectus and/or statement of additional information relating to geographic classifications.
(a) Non-income producing security.
(b) Security trades on the Hong Kong exchange.
(c) 144A security — Certain conditions for public sale may exist. Unless otherwise noted, these securities are deemed to be liquid.
(d) All or a portion of this security was on loan at December 31, 2019.
(e) The approximate fair value and percentage of net assets, $6,583,000 and 4.8%, respectively, represent the securities that have been fair valued under the fair valuation policy for international investments as described in Note A-1 within the Notes to the Financial Statements.
(f) At December 31, 2019, the aggregate cost for federal income tax purposes is approximately $114,771,000. The aggregate gross unrealized appreciation is approximately $24,705,000 and the aggregate gross unrealized depreciation is approximately $1,489,000, resulting in net unrealized appreciation of approximately $23,216,000.
ADR American Depositary Receipt.
The accompanying notes are an integral part of the financial statements.
6
Morgan Stanley Institutional Fund, Inc.
Annual Report — December 31, 2019
Portfolio of Investments (cont'd)
Asia Opportunity Portfolio
Call Options Purchased:
The Fund had the following call options purchased open at December 31, 2019:
Counterparty | | Description | | Strike
Price | | Expiration
Date | | Number of
Contracts | | Notional
Amount
(000) | | Value
(000) | | Premiums
Paid
(000) | | Unrealized
Depreciation
(000) | |
BNP Paribas | | USD/CNH | | CNH | 7.58 | | | Jan-20 | | | 7,220,087 | | | | 7,220 | | | $ | — | @ | | $ | 37 | | | $ | (37 | ) | |
Royal Bank of Scotland | | USD/CNH | | CNH | 7.85 | | | Jun-20 | | | 12,095,307 | | | | 12,095 | | | | 8 | | | | 62 | | | | (54 | ) | |
Royal Bank of Scotland | | USD/CNH | | CNH | 8.09 | | | Sep-20 | | | 14,875,913 | | | | 14,876 | | | | 16 | | | | 80 | | | | (64 | ) | |
| | | | | | | | | | | | | $ | 24 | | | $ | 179 | | | $ | (155 | ) | |
@ Value is less than $500.
CNH — Chinese Yuan Renminbi Offshore
USD — United States Dollar
Portfolio Composition*
Classification | | Percentage of
Total Investments | |
Other** | | | 24.6 | % | |
Internet & Direct Marketing Retail | | | 15.5 | | |
Short-Term Investments | | | 10.8 | | |
Interactive Media & Services | | | 9.4 | | |
Diversified Consumer Services | | | 9.2 | | |
Beverages | | | 8.5 | | |
Banks | | | 8.2 | | |
Semiconductors & Semiconductor Equipment | | | 7.8 | | |
Hotels, Restaurants & Leisure | | | 6.0 | | |
Total Investments | | | 100.0 | % | |
* Percentages indicated are based upon total investments (excluding Securities held as Collateral on Loaned Securities) as of December 31, 2019.
** Industries and/or investment types representing less than 5% of total investments.
The accompanying notes are an integral part of the financial statements.
7
Morgan Stanley Institutional Fund, Inc.
Annual Report — December 31, 2019
Asia Opportunity Portfolio
Statement of Assets and Liabilities | | December 31, 2019
(000) | |
Assets: | |
Investments in Securities of Unaffiliated Issuers, at Value(1) (Cost $98,987) | | $ | 123,026 | | |
Investment in Security of Affiliated Issuer, at Value (Cost $14,961) | | | 14,961 | | |
Total Investments in Securities, at Value (Cost $113,948) | | | 137,987 | | |
Foreign Currency, at Value (Cost —@) | | | — | @ | |
Receivable for Fund Shares Sold | | | 848 | | |
Dividends Receivable | | | 37 | | |
Receivable from Affiliate | | | 17 | | |
Receivable from Securities Lending Income | | | 2 | | |
Other Assets | | | 54 | | |
Total Assets | | | 138,945 | | |
Liabilities: | |
Payable for Investments Purchased | | | 1,032 | | |
Payable for Fund Shares Redeemed | | | 267 | | |
Payable for Advisory Fees | | | 175 | | |
Payable for Professional Fees | | | 37 | | |
Payable for Shareholder Services Fees — Class A | | | 9 | | |
Payable for Distribution and Shareholder Services Fees — Class C | | | 6 | | |
Payable for Custodian Fees | | | 11 | | |
Payable for Administration Fees | | | 9 | | |
Payable for Sub Transfer Agency Fees — Class I | | | 3 | | |
Payable for Sub Transfer Agency Fees — Class C | | | 1 | | |
Payable for Transfer Agency Fees — Class I | | | 1 | | |
Payable for Transfer Agency Fees — Class A | | | 1 | | |
Payable for Transfer Agency Fees — Class C | | | 1 | | |
Payable for Transfer Agency Fees — Class IS | | | — | @ | |
Other Liabilities | | | 10 | | |
Total Liabilities | | | 1,563 | | |
Net Assets | | $ | 137,382 | | |
Net Assets Consist of: | |
Paid-in-Capital | | $ | 116,761 | | |
Total Distributable Earnings | | | 20,621 | | |
Net Assets | | $ | 137,382 | | |
CLASS I: | |
Net Assets | | $ | 83,805 | | |
| Shares Outstanding $0.001 par value shares of beneficial interest (unlimited shares authorized) (not in 000's) | | | 3,986,591 | | |
Net Asset Value, Offering and Redemption Price Per Share | | $ | 21.02 | | |
CLASS A: | |
Net Assets | | $ | 45,111 | | |
| Shares Outstanding $0.001 par value shares of beneficial interest (unlimited shares authorized) (not in 000's) | | | 2,169,432 | | |
Net Asset Value, Redemption Price Per Share | | $ | 20.79 | | |
Maximum Sales Load | | | 5.25 | % | |
Maximum Sales Charge | | $ | 1.15 | | |
Maximum Offering Price Per Share | | $ | 21.94 | | |
CLASS C: | |
Net Assets | | $ | 8,445 | | |
| Shares Outstanding $0.001 par value shares of beneficial interest (unlimited shares authorized) (not in 000's) | | | 414,892 | | |
Net Asset Value, Offering and Redemption Price Per Share | | $ | 20.35 | | |
CLASS IS: | |
Net Assets | | $ | 21 | | |
| Shares Outstanding $0.001 par value shares of beneficial interest (unlimited shares authorized) (not in 000's) | | | 1,001 | | |
Net Asset Value, Offering and Redemption Price Per Share | | $ | 21.04 | | |
(1) Including:
Securities on Loan, at Value: | | $ | 12,526 | | |
@ Amount is less than $500.
The accompanying notes are an integral part of the financial statements.
8
Morgan Stanley Institutional Fund, Inc.
Annual Report — December 31, 2019
Asia Opportunity Portfolio
Statement of Operations | | Year Ended
December 31, 2019
(000) | |
Investment Income: | |
Dividends from Securities of Unaffiliated Issuers (Net of $81 of Foreign Taxes Withheld) | | $ | 649 | | |
Dividends from Security of Affiliated Issuer (Note G) | | | 125 | | |
Income from Securities Loaned — Net | | | 51 | | |
Total Investment Income | | | 825 | | |
Expenses: | |
Advisory Fees (Note B) | | | 570 | | |
Shareholder Services Fees — Class A (Note D) | | | 41 | | |
Distribution and Shareholder Services Fees — Class C (Note D) | | | 51 | | |
Professional Fees | | | 76 | | |
Registration Fees | | | 67 | | |
Administration Fees (Note C) | | | 57 | | |
Custodian Fees (Note F) | | | 50 | | |
Sub Transfer Agency Fees — Class I | | | 27 | | |
Sub Transfer Agency Fees — Class A | | | 11 | | |
Sub Transfer Agency Fees — Class C | | | 3 | | |
Shareholder Reporting Fees | | | 22 | | |
Transfer Agency Fees — Class I (Note E) | | | 3 | | |
Transfer Agency Fees — Class A (Note E) | | | 4 | | |
Transfer Agency Fees — Class C (Note E) | | | 2 | | |
Transfer Agency Fees — Class IS (Note E) | | | 2 | | |
Directors' Fees and Expenses | | | 6 | | |
Pricing Fees | | | 2 | | |
Other Expenses | | | 23 | | |
Total Expenses | | | 1,017 | | |
Waiver of Advisory Fees (Note B) | | | (124 | ) | |
Rebate from Morgan Stanley Affiliate (Note G) | | | (12 | ) | |
Reimbursement of Class Specific Expenses — Class I (Note B) | | | (5 | ) | |
Reimbursement of Class Specific Expenses — Class IS (Note B) | | | (2 | ) | |
Net Expenses | | | 874 | | |
Net Investment Loss | | | (49 | ) | |
Realized Loss: | |
Investments Sold | | | (1,039 | ) | |
Foreign Currency Translation | | | (31 | ) | |
Net Realized Loss | | | (1,070 | ) | |
Change in Unrealized Appreciation (Depreciation): | |
Investments | | | 24,040 | | |
Foreign Currency Translation | | | — | @ | |
Net Change in Unrealized Appreciation (Depreciation) | | | 24,040 | | |
Net Realized Loss and Change in Unrealized Appreciation (Depreciation) | | | 22,970 | | |
Net Increase in Net Assets Resulting from Operations | | $ | 22,921 | | |
@ Amount is less than $500.
The accompanying notes are an integral part of the financial statements.
9
Morgan Stanley Institutional Fund, Inc.
Annual Report — December 31, 2019
Asia Opportunity Portfolio
Statements of Changes in Net Assets | | Year Ended
December 31, 2019
(000) | | Year Ended
December 31, 2018
(000) | |
Increase (Decrease) in Net Assets: | |
Operations: | |
Net Investment Loss | | $ | (49 | ) | | $ | (26 | ) | |
Net Realized Loss | | | (1,070 | ) | | | (2,360 | ) | |
Net Change in Unrealized Appreciation (Depreciation) | | | 24,040 | | | | (5,626 | ) | |
Net Increase (Decrease) in Net Assets Resulting from Operations | | | 22,921 | | | | (8,012 | ) | |
Dividends and Distributions to Shareholders: | |
Class I | | | (37 | ) | | | (184 | ) | |
Class A | | | — | | | | (55 | ) | |
Class C | | | — | | | | (17 | ) | |
Class IS | | | (— | @) | | | (— | @) | |
Total Dividends and Distributions to Shareholders | | | (37 | ) | | | (256 | ) | |
Capital Share Transactions:(1) | |
Class I: | |
Subscribed | | | 49,930 | | | | 25,301 | | |
Distributions Reinvested | | | 37 | | | | 135 | | |
Redeemed | | | (7,719 | ) | | | (10,225 | ) | |
Class A: | |
Subscribed | | | 46,014 | | | | 14,058 | | |
Distributions Reinvested | | | — | | | | 55 | | |
Redeemed | | | (13,086 | ) | | | (8,094 | ) | |
Class C: | |
Subscribed | | | 4,940 | | | | 3,603 | | |
Distributions Reinvested | | | — | | | | 17 | | |
Redeemed | | | (653 | ) | | | (813 | ) | |
Class IS: | |
Distributions Reinvested | | | — | @ | | | — | | |
Net Increase in Net Assets Resulting from Capital Share Transactions | | | 79,463 | | | | 24,037 | | |
Redemption Fees | | | 29 | | | | 3 | | |
Total Increase in Net Assets | | | 102,376 | | | | 15,772 | | |
Net Assets: | |
Beginning of Period | | | 35,006 | | | | 19,234 | | |
End of Period | | $ | 137,382 | | | $ | 35,006 | | |
(1) Capital Share Transactions: | |
Class I: | |
Shares Subscribed | | | 2,659 | | | | 1,448 | | |
Shares Issued on Distributions Reinvested | | | 2 | | | | 8 | | |
Shares Redeemed | | | (428 | ) | | | (643 | ) | |
Net Increase in Class I Shares Outstanding | | | 2,233 | | | | 813 | | |
Class A: | |
Shares Subscribed | | | 2,421 | | | | 817 | | |
Shares Issued on Distributions Reinvested | | | — | | | | 3 | | |
Shares Redeemed | | | (732 | ) | | | (510 | ) | |
Net Increase in Class A Shares Outstanding | | | 1,689 | | | | 310 | | |
Class C: | |
Shares Subscribed | | | 269 | | | | 208 | | |
Shares Issued on Distributions Reinvested | | | — | | | | 1 | | |
Shares Redeemed | | | (36 | ) | | | (53 | ) | |
Net Increase in Class C Shares Outstanding | | | 233 | | | | 156 | | |
Class IS: | |
Shares Issued on Distributions Reinvested | | | — | @@ | | | — | | |
@ Amount is less than $500.
@@ Amount is less than 500 shares.
The accompanying notes are an integral part of the financial statements.
10
Morgan Stanley Institutional Fund, Inc.
Annual Report — December 31, 2019
Financial Highlights
Asia Opportunity Portfolio
| | | Class I | |
| | | Year Ended December 31, | | Period from
December 29, 2015(1) to | |
Selected Per Share Data and Ratios | | 2019 | | 2018 | | 2017 | | 2016 | | December 31, 2015 | |
Net Asset Value, Beginning of Period | | $ | 14.53 | | | $ | 16.92 | | | $ | 9.68 | | | $ | 10.03 | | | $ | 10.00 | | |
Income (Loss) from Investment Operations: | |
Net Investment Income (Loss)(2) | | | 0.02 | | | | 0.01 | | | | (0.04 | ) | | | (0.03 | ) | | | (0.00 | )(3) | |
Net Realized and Unrealized Gain (Loss) | | | 6.47 | | | | (2.30 | ) | | | 7.47 | | | | (0.10 | ) | | | 0.03 | | |
Total from Investment Operations | | | 6.49 | | | | (2.29 | ) | | | 7.43 | | | | (0.13 | ) | | | 0.03 | | |
Distributions from and/or in Excess of: | |
Net Investment Income | | | (0.01 | ) | | | — | | | | — | | | | (0.08 | ) | | | — | | |
Net Realized Gain | | | — | | | | (0.10 | ) | | | (0.19 | ) | | | — | | | | — | | |
Paid-in-Capital | | | — | | | | — | | | | — | | | | (0.14 | ) | | | — | | |
Total Distributions | | | (0.01 | ) | | | (0.10 | ) | | | (0.19 | ) | | | (0.22 | ) | | | — | | |
Redemption Fees | | | 0.01 | | | | 0.00 | (3) | | | 0.00 | (3) | | | — | | | | — | | |
Net Asset Value, End of Period | | $ | 21.02 | | | $ | 14.53 | | | $ | 16.92 | | | $ | 9.68 | | | $ | 10.03 | | |
Total Return(4) | | | 44.74 | % | | | (13.65 | )% | | | 76.82 | % | | | (1.34 | )% | | | 0.30 | %(6) | |
Ratios to Average Net Assets and Supplemental Data: | |
Net Assets, End of Period (Thousands) | | $ | 83,805 | | | $ | 25,479 | | | $ | 15,913 | | | $ | 5,405 | | | $ | 5,587 | | |
Ratio of Expenses Before Expense Limitation | | | 1.28 | % | | | 1.67 | % | | | 3.10 | % | | | 5.28 | % | | | 125.50 | %(7) | |
Ratio of Expenses After Expense Limitation | | | 1.08 | %(5) | | | 1.09 | %(5) | | | 1.06 | %(5) | | | 1.08 | %(5) | | | 1.03 | %(5)(7) | |
Ratio of Net Investment Income (Loss) | | | 0.11 | %(5) | | | 0.04 | %(5) | | | (0.27 | )%(5) | | | (0.31 | )%(5) | | | (0.71 | )%(5)(7) | |
Ratio of Rebate from Morgan Stanley Affiliates | | | 0.02 | % | | | 0.01 | % | | | 0.01 | % | | | 0.01 | % | | | 0.04 | %(7) | |
Portfolio Turnover Rate | | | 27 | % | | | 63 | % | | | 50 | % | | | 44 | % | | | 0 | %(6) | |
(1) Commencement of Operations.
(2) Per share amount is based on average shares outstanding.
(3) Amount is less than $0.005 per share.
(4) Calculated based on the net asset value as of the last business day of the period.
(5) The Ratio of Expenses After Expense Limitation and Ratio of Net Investment Income (Loss) reflect the rebate of certain Fund expenses in connection with the investments in Morgan Stanley affiliates during the period. The effect of the rebate on the ratios is disclosed in the above table as "Ratio of Rebate from Morgan Stanley Affiliates."
(6) Not annualized.
(7) Annualized.
The accompanying notes are an integral part of the financial statements.
11
Morgan Stanley Institutional Fund, Inc.
Annual Report — December 31, 2019
Financial Highlights
Asia Opportunity Portfolio
| | | Class A | |
| | | Year Ended December 31, | | Period from
December 29, 2015(1) to | |
Selected Per Share Data and Ratios | | 2019 | | 2018 | | 2017 | | 2016 | | December 31, 2015 | |
Net Asset Value, Beginning of Period | | $ | 14.42 | | | $ | 16.84 | | | $ | 9.67 | | | $ | 10.03 | | | $ | 10.00 | | |
Income (Loss) from Investment Operations: | |
Net Investment Loss(2) | | | (0.06 | ) | | | (0.04 | ) | | | (0.10 | ) | | | (0.08 | ) | | | (0.00 | )(3) | |
Net Realized and Unrealized Gain (Loss) | | | 6.42 | | | | (2.28 | ) | | | 7.46 | | | | (0.09 | ) | | | 0.03 | | |
Total from Investment Operations | | | 6.36 | | | | (2.32 | ) | | | 7.36 | | | | (0.17 | ) | | | 0.03 | | |
Distributions from and/or in Excess of: | |
Net Investment Income | | | — | | | | — | | | | — | | | | (0.05 | ) | | | — | | |
Net Realized Gain | | | — | | | | (0.10 | ) | | | (0.19 | ) | | | — | | | | — | | |
Paid-in-Capital | | | — | | | | — | | | | — | | | | (0.14 | ) | | | — | | |
Total Distributions | | | — | | | | (0.10 | ) | | | (0.19 | ) | | | (0.19 | ) | | | — | | |
Redemption Fees | | | 0.01 | | | | 0.00 | (3) | | | 0.00 | (3) | | | — | | | | — | | |
Net Asset Value, End of Period | | $ | 20.79 | | | $ | 14.42 | | | $ | 16.84 | | | $ | 9.67 | | | $ | 10.03 | | |
Total Return(4) | | | 44.17 | % | | | (13.89 | )% | | | 76.17 | % | | | (1.67 | )% | | | 0.30 | %(6) | |
Ratios to Average Net Assets and Supplemental Data: | |
Net Assets, End of Period (Thousands) | | $ | 45,111 | | | $ | 6,930 | | | $ | 2,873 | | | $ | 535 | | | $ | 10 | | |
Ratio of Expenses Before Expense Limitation | | | 1.56 | % | | | 2.05 | % | | | 3.50 | % | | | 6.36 | % | | | 139.50 | %(7) | |
Ratio of Expenses After Expense Limitation | | | 1.37 | %(5) | | | 1.44 | %(5) | | | 1.44 | %(5) | | | 1.44 | %(5) | | | 1.40 | %(5)(7) | |
Ratio of Net Investment Loss | | | (0.33 | )%(5) | | | (0.22 | )%(5) | | | (0.69 | )%(5) | | | (0.78 | )%(5) | | | (1.09 | )%(5)(7) | |
Ratio of Rebate from Morgan Stanley Affiliates | | | 0.02 | % | | | 0.01 | % | | | 0.01 | % | | | 0.01 | % | | | 0.05 | %(7) | |
Portfolio Turnover Rate | | | 27 | % | | | 63 | % | | | 50 | % | | | 44 | % | | | 0 | %(6) | |
(1) Commencement of Operations.
(2) Per share amount is based on average shares outstanding.
(3) Amount is less than $0.005 per share.
(4) Calculated based on the net asset value which does not reflect sales charges, if applicable, as of the last business day of the period.
(5) The Ratio of Expenses After Expense Limitation and Ratio of Net Investment Loss reflect the rebate of certain Fund expenses in connection with the investments in Morgan Stanley affiliates during the period. The effect of the rebate on the ratios is disclosed in the above table as "Ratio of Rebate from Morgan Stanley Affiliates."
(6) Not annualized.
(7) Annualized.
The accompanying notes are an integral part of the financial statements.
12
Morgan Stanley Institutional Fund, Inc.
Annual Report — December 31, 2019
Financial Highlights
Asia Opportunity Portfolio
| | | Class C | |
| | | Year Ended December 31, | | Period from
December 29, 2015(1) to | |
Selected Per Share Data and Ratios | | 2019 | | 2018 | | 2017 | | 2016 | | December 31, 2015 | |
Net Asset Value, Beginning of Period | | $ | 14.21 | | | $ | 16.73 | | | $ | 9.68 | | | $ | 10.03 | | | $ | 10.00 | | |
Income (Loss) from Investment Operations: | |
Net Investment Loss(2) | | | (0.17 | ) | | | (0.15 | ) | | | (0.22 | ) | | | (0.14 | ) | | | (0.00 | )(3) | |
Net Realized and Unrealized Gain (Loss) | | | 6.30 | | | | (2.27 | ) | | | 7.46 | | | | (0.10 | ) | | | 0.03 | | |
Total from Investment Operations | | | 6.13 | | | | (2.42 | ) | | | 7.24 | | | | (0.24 | ) | | | 0.03 | | |
Distributions from and/or in Excess of: | |
Net Realized Gain | | | — | | | | (0.10 | ) | | | (0.19 | ) | | | — | | | | — | | |
Paid-in-Capital | | | — | | | | — | | | | — | | | | (0.11 | ) | | | — | | |
Total Distributions | | | — | | | | (0.10 | ) | | | (0.19 | ) | | | (0.11 | ) | | | — | | |
Redemption Fees | | | 0.01 | | | | 0.00 | (3) | | | 0.00 | (3) | | | — | | | | — | | |
Net Asset Value, End of Period | | $ | 20.35 | | | $ | 14.21 | | | $ | 16.73 | | | $ | 9.68 | | | $ | 10.03 | | |
Total Return(4) | | | 43.21 | % | | | (14.58 | )% | | | 74.85 | % | | | (2.44 | )% | | | 0.30 | %(6) | |
Ratios to Average Net Assets and Supplemental Data: | |
Net Assets, End of Period (Thousands) | | $ | 8,445 | | | $ | 2,582 | | | $ | 431 | | | $ | 10 | | | $ | 10 | | |
Ratio of Expenses Before Expense Limitation | | | 2.33 | % | | | 2.80 | % | | | 5.26 | % | | | 27.34 | % | | | 140.25 | %(7) | |
Ratio of Expenses After Expense Limitation | | | 2.14 | %(5) | | | 2.19 | %(5) | | | 2.19 | %(5) | | | 2.19 | %(5) | | | 2.17 | %(5)(7) | |
Ratio of Net Investment Loss | | | (0.95 | )%(5) | | | (0.92 | )%(5) | | | (1.51 | )%(5) | | | (1.42 | )%(5) | | | (1.84 | )%(5)(7) | |
Ratio of Rebate from Morgan Stanley Affiliates | | | 0.02 | % | | | 0.01 | % | | | 0.01 | % | | | 0.01 | % | | | 0.03 | %(7) | |
Portfolio Turnover Rate | | | 27 | % | | | 63 | % | | | 50 | % | | | 44 | % | | | 0 | %(6) | |
(1) Commencement of Operations.
(2) Per share amount is based on average shares outstanding.
(3) Amount is less than $0.005 per share.
(4) Calculated based on the net asset value which does not reflect sales charges, if applicable, as of the last business day of the period.
(5) The Ratio of Expenses After Expense Limitation and Ratio of Net Investment Loss reflect the rebate of certain Fund expenses in connection with the investments in Morgan Stanley affiliates during the period. The effect of the rebate on the ratios is disclosed in the above table as "Ratio of Rebate from Morgan Stanley Affiliates."
(6) Not annualized.
(7) Annualized.
The accompanying notes are an integral part of the financial statements.
13
Morgan Stanley Institutional Fund, Inc.
Annual Report — December 31, 2019
Financial Highlights
Asia Opportunity Portfolio
| | | Class IS | |
| | | Year Ended December 31, | | Period from
December 29, 2015(1) to | |
Selected Per Share Data and Ratios | | 2019 | | 2018 | | 2017 | | 2016 | | December 31, 2015 | |
Net Asset Value, Beginning of Period | | $ | 14.54 | | | $ | 16.92 | | | $ | 9.68 | | | $ | 10.03 | | | $ | 10.00 | | |
Income (Loss) from Investment Operations: | |
Net Investment Income (Loss)(2) | | | 0.03 | | | | 0.01 | | | | (0.02 | ) | | | (0.03 | ) | | | (0.00 | )(3) | |
Net Realized and Unrealized Gain (Loss) | | | 6.48 | | | | (2.29 | ) | | | 7.45 | | | | (0.10 | ) | | | 0.03 | | |
Total from Investment Operations | | | 6.51 | | | | (2.28 | ) | | | 7.43 | | | | (0.13 | ) | | | 0.03 | | |
Distributions from and/or in Excess of: | |
Net Investment Income | | | (0.02 | ) | | | — | | | | — | | | | (0.08 | ) | | | — | | |
Net Realized Gain | | | — | | | | (0.10 | ) | | | (0.19 | ) | | | — | | | | — | | |
Paid-in-Capital | | | — | | | | — | | | | — | | | | (0.14 | ) | | | — | | |
Total Distributions | | | (0.02 | ) | | | (0.10 | ) | | | (0.19 | ) | | | (0.22 | ) | | | — | | |
Redemption Fees | | | 0.01 | | | | 0.00 | (3) | | | 0.00 | (3) | | | — | | | | — | | |
Net Asset Value, End of Period | | $ | 21.04 | | | $ | 14.54 | | | $ | 16.92 | | | $ | 9.68 | | | $ | 10.03 | | |
Total Return(4) | | | 44.82 | % | | | (13.59 | )% | | | 76.82 | % | | | (1.29 | )% | | | 0.30 | %(6) | |
Ratios to Average Net Assets and Supplemental Data: | |
Net Assets, End of Period (Thousands) | | $ | 21 | | | $ | 15 | | | $ | 17 | | | $ | 10 | | | $ | 10 | | |
Ratio of Expenses Before Expense Limitation | | | 11.85 | % | | | 13.31 | % | | | 17.65 | % | | | 25.20 | % | | | 139.25 | %(7) | |
Ratio of Expenses After Expense Limitation | | | 1.03 | %(5) | | | 1.04 | %(5) | | | 1.04 | %(5) | | | 1.04 | %(5) | | | 1.02 | %(5)(7) | |
Ratio of Net Investment Income (Loss) | | | 0.19 | %(5) | | | 0.05 | %(5) | | | (0.18 | )%(5) | | | (0.26 | )%(5) | | | (0.69 | )%(5)(7) | |
Ratio of Rebate from Morgan Stanley Affiliates | | | 0.02 | % | | | 0.01 | % | | | 0.01 | % | | | 0.01 | % | | | 0.03 | %(7) | |
Portfolio Turnover Rate | | | 27 | % | | | 63 | % | | | 50 | % | | | 44 | % | | | 0 | %(6) | |
(1) Commencement of Operations.
(2) Per share amount is based on average shares outstanding.
(3) Amount is less than $0.005 per share.
(4) Calculated based on the net asset value as of the last business day of the period.
(5) The Ratio of Expenses After Expense Limitation and Ratio of Net Investment Income (Loss) reflect the rebate of certain Fund expenses in connection with the investments in Morgan Stanley affiliates during the period. The effect of the rebate on the ratios is disclosed in the above table as "Ratio of Rebate from Morgan Stanley Affiliates."
(6) Not annualized.
(7) Annualized.
The accompanying notes are an integral part of the financial statements.
14
Morgan Stanley Institutional Fund, Inc.
Annual Report — December 31, 2019
Notes to Financial Statements
Morgan Stanley Institutional Fund, Inc. (the "Company") is registered under the Investment Company Act of 1940, as amended (the "Act"), as an open-end management investment company. The Company is comprised of thirty-two separate, active, diversified and non-diversified funds (individually referred to as a "Fund," collectively as the "Funds"). The Company applies investment company accounting and reporting guidance.
The accompanying financial statements relate to the Asia Opportunity Portfolio. The Fund seeks long-term capital appreciation.
The Fund offers four classes of shares — Class I, Class A, Class C and Class IS.
A. Significant Accounting Policies: The following significant accounting policies are in conformity with U.S. generally accepted accounting principles ("GAAP"). Such policies are consistently followed by the Company in the preparation of its financial statements. GAAP may require management to make estimates and assumptions that affect the reported amounts and disclosures in the financial statements. Actual results may differ from those estimates.
In August 2018, the Financial Accounting Standards Board ("FASB") issued Accounting Standards Update ("ASU") 2018-13, Fair Value Measurement (Topic 820) — Disclosures Framework — Changes to Disclosure Requirements of Fair Value Measurement ("ASU 2018-13") which introduces new fair value disclosure requirements as well as eliminates and modifies certain existing fair value disclosure requirements. ASU 2018-13 would be effective for fiscal years beginning after December 15, 2019 and for interim periods within those fiscal years; however, management has elected to early adopt ASU 2018-13 as permitted by the standard. The impact of the Fund's adoption was limited to changes in the Fund's financial statement disclosures regarding fair value, primarily those disclosures related to transfers between levels of the fair value hierarchy and disclosure of the range and weighted average used to develop significant unobservable inputs for Level 3 fair value measurements, when applicable.
1. Security Valuation: (1) An equity portfolio security listed or traded on an exchange is valued at its latest reported sales price (or at the exchange official closing price if such exchange reports an official closing price), and if there were no sales on a given day and if there is no official exchange closing price for that day, the security is valued at the mean between the last reported bid and asked prices if such bid and asked prices are available on the relevant
exchanges. If only bid prices are available then the latest bid price may be used. Listed equity securities not traded on the valuation date with no reported bid and asked prices available on the exchange are valued at the mean between the current bid and asked prices obtained from one or more reputable brokers or dealers. In cases where a security is traded on more than one exchange, the security is valued on the exchange designated as the primary market; (2) all other equity portfolio securities for which over-the-counter ("OTC") market quotations are readily available are valued at the latest reported sales price (or at the market official closing price if such market reports an official closing price), and if there was no trading in the security on a given day and if there is no official closing price from relevant markets for that day, the security is valued at the mean between the last reported bid and asked prices if such bid and asked prices are available on the relevant markets. An unlisted equity security that does not trade on the valuation date and for which bid and asked prices from the relevant markets are unavailable is valued at the mean between the current bid and asked prices obtained from one or more reputable brokers or dealers; (3) certain portfolio securities may be valued by an outside pricing service/vendor approved by the Company's Board of Directors (the "Directors"). The pricing service/vendor may employ a pricing model that takes into account, among other things, bids, yield spreads and/or other market data and specific security characteristics. Alternatively, if a valuation is not available from an outside pricing service/vendor, and the security trades on an exchange, the security may be valued at its latest reported sale price (or at the exchange official closing price if such exchange reports an official closing price), prior to the time when assets are valued. If there are no sales on a given day and if there is no official exchange closing price for that day, the security is valued at the mean between the last reported bid and asked prices if such bid and asked prices are available in the relevant exchanges. If Morgan Stanley Investment Management Inc. (the "Adviser"), a wholly-owned subsidiary of Morgan Stanley, determines that the price provided by the outside pricing service/vendor or exchange does not reflect the security's fair value or is unable to provide a price, prices from brokers or dealers may also be utilized. In these circumstances, the value of the security will be the mean of bid and asked prices obtained from brokers or dealers; (4) listed options are valued at the last reported sales price on the exchange on which they are listed (or at the exchange official closing price if such exchange reports
15
Morgan Stanley Institutional Fund, Inc.
Annual Report — December 31, 2019
Notes to Financial Statements (cont'd)
an official closing price). If an official closing price or last reported sales price is unavailable, the listed option should be fair valued at the mean between its latest bid and ask prices. Unlisted options are valued at the mean between their latest bid and ask prices from a broker/dealer or valued by a pricing service/vendor; (5) when market quotations are not readily available, including circumstances under which the Adviser determines that the closing price, last sale price or the mean between the last reported bid and asked prices are not reflective of a security's market value, portfolio securities are valued at their fair value as determined in good faith under procedures established by and under the general supervision of the Directors. Occasionally, developments affecting the closing prices of securities and other assets may occur between the times at which valuations of such securities are determined (that is, close of the foreign market on which the securities trade) and the close of business of the New York Stock Exchange ("NYSE"). If developments occur during such periods that are expected to materially affect the value of such securities, such valuations may be adjusted to reflect the estimated fair value of such securities as of the close of the NYSE, as determined in good faith by the Directors or by the Adviser using a pricing service and/or procedures approved by the Directors; (6) quotations of foreign portfolio securities, other assets and liabilities and forward contracts stated in foreign currency are translated into U.S. dollar equivalents at the prevailing market rates prior to the close of the NYSE; and (7) investments in mutual funds, including the Morgan Stanley Institutional Liquidity Funds, are valued at the net asset value ("NAV") as of the close of each business day.
The Directors have responsibility for determining in good faith the fair value of the investments, and the Directors may appoint others, such as the Company's Adviser or a valuation committee, to assist the Directors in determining fair value and to make the actual calculations pursuant to the fair valuation methodologies previously approved by the Directors. Under procedures approved by the Directors, the Company's Adviser has formed a Valuation Committee whose members are approved by the Directors. The Valuation Committee provides administration and oversight of the Company's valuation policies and procedures, which are reviewed at least annually by the Directors. These procedures allow the Company to utilize independent pricing services, quotations from securities and financial instrument dealers and other market sources to determine fair value.
2. Fair Value Measurement: FASB Accounting Standards CodificationTM ("ASC") 820, "Fair Value Measurement" ("ASC 820"), defines fair value as the value that the Fund would receive to sell an investment or pay to transfer a liability in a timely transaction with an independent buyer in the principal market, or in the absence of a principal market, the most advantageous market for the investment or liability. ASC 820 establishes a three-tier hierarchy to distinguish between (1) inputs that reflect the assumptions market participants would use in valuing an asset or liability developed based on market data obtained from sources independent of the reporting entity (observable inputs) and (2) inputs that reflect the reporting entity's own assumptions about the assumptions market participants would use in valuing an asset or liability developed based on the best information available in the circumstances (unobservable inputs) and to establish classification of fair value measurements for disclosure purposes. Various inputs are used in determining the value of the Fund's investments. The inputs are summarized in the three broad levels listed below:
• Level 1 – unadjusted quoted prices in active markets for identical investments
• Level 2 – other significant observable inputs (including quoted prices for similar investments, interest rates, prepayment speeds, credit risk, etc.)
• Level 3 – significant unobservable inputs including the Fund's own assumptions in determining the fair value of investments. Factors considered in making this determination may include, but are not limited to, information obtained by contacting the issuer, analysts, or the appropriate stock exchange (for exchange-traded securities), analysis of the issuer's financial statements or other available documents and, if necessary, available information concerning other securities in similar circumstances.
The inputs or methodology used for valuing securities are not necessarily an indication of the risk associated with investing in those securities and the determination of the significance of a particular input to the fair value measurement in its entirety requires judgment and considers factors specific to each security.
16
Morgan Stanley Institutional Fund, Inc.
Annual Report — December 31, 2019
Notes to Financial Statements (cont'd)
The following is a summary of the inputs used to value the Fund's investments as of December 31, 2019:
Investment Type | | Level 1
Unadjusted
quoted
prices
(000) | | Level 2
Other
significant
observable
inputs
(000) | | Level 3
Significant
unobservable
inputs
(000) | | Total
(000) | |
Assets: | |
Common Stocks | |
Banks | | $ | 11,325 | | | $ | — | | | $ | — | | | $ | 11,325 | | |
Beverages | | | 11,739 | | | | — | | | | — | | | | 11,739 | | |
Diversified Consumer
Services | | | 12,678 | | | | — | | | | — | | | | 12,678 | | |
Entertainment | | | 5,110 | | | | — | | | | — | | | | 5,110 | | |
Food Products | | | 6,199 | | | | — | | | | — | | | | 6,199 | | |
Health Care Providers &
Services | | | — | | | | 723 | | | | — | | | | 723 | | |
Hotels, Restaurants &
Leisure | | | 8,249 | | | | — | | | | — | | | | 8,249 | | |
Household Durables | | | 2,938 | | | | — | | | | — | | | | 2,938 | | |
Insurance | | | 6,526 | | | | — | | | | — | | | | 6,526 | | |
Interactive Media &
Services | | | 6,319 | | | | 6,583 | | | | — | | | | 12,902 | | |
Internet & Direct
Marketing Retail | | | 21,432 | | | | — | | | | — | | | | 21,432 | | |
Life Sciences Tools &
Services | | | 5,698 | | | | — | | | | — | | | | 5,698 | | |
Real Estate Management &
Development | | | 43 | | | | — | | | | — | | | | 43 | | |
Semiconductors &
Semiconductor
Equipment | | | 10,813 | | | | — | | | | — | | | | 10,813 | | |
Textiles, Apparel &
Luxury Goods | | | 6,627 | | | | — | | | | — | | | | 6,627 | | |
Total Common Stocks | | | 115,696 | | | | 7,306 | | | | — | | | | 123,002 | | |
Call Options Purchased | | | — | | | | 24 | | | | — | | | | 24 | | |
Short-Term Investment | |
Investment Company | | | 14,961 | | | | — | | | | — | | | | 14,961 | | |
Total Assets | | $ | 130,657 | | | $ | 7,330 | | | $ | — | | | $ | 137,987 | | |
Transfers between investment levels may occur as the markets fluctuate and/or the availability of data used in an investment's valuation changes.
3. Repurchase Agreements: The Fund may enter into repurchase agreements under which the Fund lends cash and takes possession of securities with an agreement that the counterparty will repurchase such securities. In connection with transactions in repurchase agreements, a bank as custodian for the Fund takes possession of the underlying securities which are held as collateral, with a market value at least equal to the amount of the repurchase transaction, including principal and accrued interest. To the extent that any repurchase transaction exceeds one business day, the value of the collateral is marked-to-market on a daily basis to determine that the value of the collateral does not decrease below the repurchase price plus
accrued interest as earned. If such a decrease occurs, additional collateral will be requested and, when received, will be added to the account to maintain full collateralization. In the event of default on the obligation to repurchase, the Fund has the right to liquidate the collateral and apply the proceeds in satisfaction of the obligation. In the event of default or bankruptcy by the counterparty to the agreement, realization of the collateral proceeds may be subject to cost and delays. The Fund, along with other affiliated investment companies, may utilize a joint trading account for the purpose of entering into repurchase agreements.
At December 31, 2019, the Fund did not have any outstanding repurchase agreements.
4. Foreign Currency Translation and Foreign Investments: The books and records of the Fund are maintained in U.S. dollars. Foreign currency amounts are translated into U.S. dollars as follows:
– investments, other assets and liabilities at the prevailing rate of exchange on the valuation date;
– investment transactions and investment income at the prevailing rates of exchange on the dates of such transactions.
Although the net assets of the Fund are presented at the foreign exchange rates and market values at the close of the period, the Fund does not isolate that portion of the results of operations arising as a result of changes in the foreign exchange rates from the fluctuations arising from changes in the market prices of securities held at period end. Similarly, the Fund does not isolate the effect of changes in foreign exchange rates from the fluctuations arising from changes in the market prices of securities sold during the period. Accordingly, realized and unrealized foreign currency gains (losses) on investments in securities are included in the reported net realized and unrealized gains (losses) on investment transactions and balances. However, pursuant to U.S. federal income tax regulations, gains and losses from certain foreign currency transactions and the foreign currency portion of gains and losses realized on sales and maturities of foreign denominated debt securities are treated as ordinary income for U.S. federal income tax purposes.
Net realized gains (losses) on foreign currency transactions represent net foreign exchange gains (losses) from
17
Morgan Stanley Institutional Fund, Inc.
Annual Report — December 31, 2019
Notes to Financial Statements (cont'd)
foreign currency forward exchange contracts, disposition of foreign currencies, currency gains (losses) realized between the trade and settlement dates on securities transactions, and the difference between the amount of investment income and foreign withholding taxes recorded on the Fund's books and the U.S. dollar equivalent amounts actually received or paid. The change in unrealized currency gains (losses) on foreign currency transactions for the period is reflected in the Statement of Operations.
Foreign security and currency transactions may involve certain considerations and risks not typically associated with those of U.S. dollar denominated transactions as a result of, among other factors, fluctuations of exchange rates in relation to the U.S. dollar, the possibility of lower levels of governmental supervision and regulation of foreign securities markets and the possibility of political or economic instability.
Governmental approval for foreign investments may be required in advance of making an investment under certain circumstances in some countries, and the extent of foreign investments in domestic companies may be subject to limitation in other countries. Foreign ownership limitations also may be imposed by the charters of individual companies to prevent, among other concerns, violations of foreign investment limitations. As a result, an additional class of shares (identified as "Foreign" in the Portfolio of Investments) may be created and offered for investment. The "local" and "foreign shares" market values may differ. In the absence of trading of the foreign shares in such markets, the Fund values the foreign shares at the closing exchange price of the local shares.
5. Derivatives: The Fund may, but is not required to, use derivative instruments for a variety of purposes, including hedging, risk management, portfolio management or to earn income. Derivatives are financial instruments whose value is based, in part, on the value of an underlying asset, interest rate, index or financial instrument. Prevailing interest rates and volatility levels, among other things, also affect the value of derivative instruments. A derivative instrument often has risks similar to its underlying asset and may have additional risks, including imperfect correlation between the value of the derivative and the underlying asset, risks of default by the counterparty to certain transactions, magnification of losses incurred due to changes in
the market value of the securities, instruments, indices or interest rates to which the derivative instrument relates, risks that the transactions may not be liquid and risks arising from margin requirements. The use of derivatives involves risks that are different from, and possibly greater than, the risks associated with other portfolio investments. Derivatives may involve the use of highly specialized instruments that require investment techniques and risk analyses different from those associated with other portfolio investments. All of the Fund's holdings, including derivative instruments, are marked-to-market each day with the change in value reflected in unrealized appreciation (depreciation). Upon disposition, a realized gain or loss is recognized.
Certain derivative transactions may give rise to a form of leverage. Leverage magnifies the potential for gain and the risk of loss. Leverage associated with derivative transactions may cause the Fund to liquidate portfolio positions when it may not be advantageous to do so to satisfy its obligations or to meet earmarking or segregation requirements, pursuant to applicable Securities and Exchange Commission ("SEC") rules and regulations, or may cause the Fund to be more volatile than if the Fund had not been leveraged. Although the Adviser seeks to use derivatives to further the Fund's investment objectives, there is no assurance that the use of derivatives will achieve this result.
Following is a description of the derivative instruments and techniques that the Fund used during the period and their associated risks:
Options: With respect to options, the Fund is subject to equity risk, interest rate risk and foreign currency exchange risk in the normal course of pursuing its investment objectives. If the Fund buys an option, it buys a legal contract giving it the right to buy or sell a specific amount of the underlying instrument or foreign currency, or futures contract on the underlying instrument or foreign currency, at an agreed-upon price during a period of time or on a specified date typically in exchange for a premium paid by the Fund. The Fund may purchase and/or sell put and call options. Purchasing call options tends to increase the Fund's exposure to the underlying (or similar) instrument. Purchasing put options tends to decrease the Fund's exposure to the underlying (or similar) instrument. When entering into
18
Morgan Stanley Institutional Fund, Inc.
Annual Report — December 31, 2019
Notes to Financial Statements (cont'd)
purchased option contracts, the Fund bears the risk of interest or exchange rates or securities prices moving unexpectedly, in which case, the Fund may not achieve the anticipated benefits of the purchased option contracts; however the risk of loss is limited to the premium paid. Purchased options are reported as part of "Total Investments in Securities" in the Statement of Assets and Liabilities. Premiums paid for purchasing options which expired are treated as realized losses. If the Fund sells an option, it sells to another party the right to buy from or sell to the Fund a specific amount of the underlying instrument or foreign currency, or futures contract on the underlying instrument or foreign currency, at an agreed-upon price during a period of time or on a specified date typically in exchange for a premium received by the Fund. When options are purchased OTC, the Fund bears the risk that the counterparty that wrote the option will be unable or unwilling to perform its obligations under the option contract. Options may also be illiquid and the Fund may have difficulty closing out its position. A decision as to whether, when and how to use options involves the exercise of skill and judgment and even a well-conceived option transaction may be unsuccessful because of market behavior or unexpected events. The prices of options can be highly volatile and the use of options can lower total returns.
FASB ASC 815, "Derivatives and Hedging" ("ASC 815"), is intended to improve financial reporting about derivative instruments by requiring enhanced disclosures to enable investors to better understand how and why the Fund uses derivative instruments, how these derivative instruments are accounted for and their effects on the Fund's financial position and results of operations.
The following table sets forth the fair value of the Fund's derivative contracts by primary risk exposure as of December 31, 2019:
| | | Asset Derivatives
Statement of Assets and
Liabilities Location | | Primary Risk
Exposure | | Value
(000) | |
Purchased Options | | Investments, at Value
(Purchased Options) | | Currency Risk | | $ | 24 | (a) | |
(a) Amounts are included in Investments in Securities in the Statement of Assets and Liabilities.
The following tables set forth by primary risk exposure the Fund's realized gains (losses) and change in unrealized ap-
preciation (depreciation) by type of derivative contract for the year ended December 31, 2019 in accordance with ASC 815:
Realized Gain (Loss) | |
Primary Risk Exposure | | Derivative Type | | Value
(000) | |
Currency Risk | | Investments
(Purchased Options) | | $ | (113 | )(b) | |
(b) Amounts are included in Investments Sold in the Statement of Operations.
Change in Unrealized Appreciation (Depreciation) | |
Primary Risk Exposure | | Derivative Type | | Value
(000) | |
Currency Risk | | Investments
(Purchased Options) | | $ | (64 | )(c) | |
(c) Amounts are included in Investments in the Statement of Operations.
At December 31, 2019, the Fund's derivative assets and liabilities are as follows:
Gross Amounts of Assets and Liabilities
Presented in the Statement of Assets and Liabilities | |
Derivatives | | Assets(d)
(000) | | Liabilities(d)
(000) | |
Purchased Options | | $ | 24 | (a) | | $ | — | | |
(a) Amounts are included in Investments in Securities in the Statement of Assets and Liabilities.
(d) Absent an event of default or early termination, OTC derivative assets and liabilities are presented gross and not offset in the Statement of Assets and Liabilities.
The Fund typically enters into International Swaps and Derivatives Association, Inc. Master Agreements ("ISDA Master Agreements") or similar master agreements (collectively, "Master Agreements") with its contract counterparties for certain OTC derivatives in order to, among other things, reduce its credit risk to counterparties. ISDA Master Agreements include provisions for general obligations, representations, collateral and events of default or termination. Under an ISDA Master Agreement, the Fund typically may offset with the counterparty certain OTC derivative financial instruments' payables and/or receivables with collateral held and/or posted and create one single net payment (close-out netting) in the event of default, termination and/or potential deterioration in the credit quality of the counterparty. Various Master Agreements govern the terms of certain transactions with counterparties, including transactions such as swap, forward, repurchase and reverse repurchase agreements. These Master Agreements typically attempt to reduce the counterparty risk associated with such transactions by specifying credit protection mechanisms and providing standardization that improves legal certainty. Cross-termination provisions un-
19
Morgan Stanley Institutional Fund, Inc.
Annual Report — December 31, 2019
Notes to Financial Statements (cont'd)
der Master Agreements typically provide that a default in connection with one transaction between the Fund and a counterparty gives the non-defaulting party the right to terminate any other transactions in place with the defaulting party to create one single net payment due to/due from the defaulting party and may be a feature in certain Master Agreements. In the event the Fund exercises its right to terminate a Master Agreement after a counterparty experiences a termination event as defined in the Master Agreement, the return of collateral with market value in excess of the Fund's net liability may be delayed or denied.
The following table presents derivative financial instruments that are subject to enforceable netting arrangements as of December 31, 2019:
Gross Amounts Not Offset in the Statement of Assets and Liabilities | |
Counterparty | | Gross Asset
Derivatives
Presented in
the Statement of
Assets and
Liabilities
(000) | | Financial
Instrument
(000) | | Collateral
Received
(000) | | Net Amount
(not less
than $0)
(000) | |
BNP Paribas | | $ | — | @ | | $ | — | | | $ | — | | | $ | — | @ | |
Royal Bank of Scotland | | | 24 | | | | — | | | | — | | | | 24 | | |
Total | | $ | 24 | (a) | | $ | — | | | $ | — | | | $ | 24 | | |
@ Value is less than $500.
(a) Amounts are included in Investments in Securities in the Statement of Assets and Liabilities.
For the year ended December 31, 2019, the approximate average monthly amount outstanding for each derivative type is as follows:
Purchased Options: | |
Average monthly notional amount | | | 28,812,000 | | |
6. Securities Lending: The Fund lends securities to qualified financial institutions, such as broker-dealers, to earn additional income. Any increase or decrease in the fair value of the securities loaned that might occur and any interest earned or dividends declared on those securities during the term of the loan would remain in the Fund. The Fund would receive cash or securities as collateral in an amount equal to or exceeding 100% of the current fair value of the loaned securities. The collateral is marked-to-market daily by State Street Bank and Trust Company ("State Street"), the securities lending agent, to ensure that a minimum of 100% collateral coverage is maintained.
Based on pre-established guidelines, the securities lending agent invests any cash collateral that is received in an affiliated money market portfolio and repurchase agreements. Securities lending income is generated from the
earnings on the invested collateral and borrowing fees, less any rebates owed to the borrowers and compensation to the lending agent, and is recorded as "Income from Securities Loaned — Net" in the Fund's Statement of Operations. Risks in securities lending transactions are that a borrower may not provide additional collateral when required or return the securities when due, and that the value of the short-term investments will be less than the amount of cash collateral plus any rebate that is required to be returned to the borrower.
The Fund has the right under the securities lending agreement to recover the securities from the borrower on demand.
The following table presents financial instruments that are subject to enforceable netting arrangements as of December 31, 2019:
Gross Amounts Not Offset in the Statement of Assets and Liabilities | |
Gross Asset
Amounts
Presented in the
Statement of
Assets and
Liabilities
(000) | | Financial
Instrument
(000) | | Collateral
Received
(000) | | Net Amount
(not less
than $0)
(000) | |
| $ | 12,526 | (e) | | $ | — | | | $ | (12,526 | )(f)(g) | | $ | 0 | | |
(e) Represents market value of loaned securities at year end.
(f) The Fund received non-cash collateral of approximately $13,188,000 in the form of U.S. Government obligations, which the Fund cannot sell or repledge, and accordingly are not reflected in the Portfolio of Investments.
(g) The actual collateral received is greater than the amount shown here due to overcollateralization.
7. Redemption Fees: The Fund will assess a 2% redemption fee on Class I shares, Class A shares, Class C shares and Class IS shares, which is paid directly to the Fund, for shares redeemed or exchanged within thirty days of purchase, subject to certain exceptions. The redemption fee is designed to protect the Fund and its remaining shareholders from the effects of short-term trading. These fees, if any, are included in the Statements of Changes in Net Assets.
8. Indemnifications: The Company enters into contracts that contain a variety of indemnifications. The Company's maximum exposure under these arrangements is unknown. However, the Company has not had prior claims or losses pursuant to these contracts and expects the risk of loss to be remote.
9. Dividends and Distributions to Shareholders: Dividends and distributions to shareholders are recorded on the ex-dividend date. Dividends from net investment
20
Morgan Stanley Institutional Fund, Inc.
Annual Report — December 31, 2019
Notes to Financial Statements (cont'd)
income, if any, are declared and paid annually. Net realized capital gains, if any, are distributed at least annually.
10. Security Transactions, Income and Expenses: Security transactions are accounted for on the trade date (date the order to buy or sell is executed). Realized gains and losses on the sale of investment securities are determined on the specific identified cost method. Dividend income and other distributions are recorded on the ex-dividend date (except for certain foreign dividends which may be recorded as soon as the Fund is informed of such dividends) net of applicable withholding taxes. Interest income is recognized on the accrual basis except where collection is in doubt. Discounts are accreted and premiums are amortized over the life of the respective securities. Most expenses of the Company can be directly attributed to a particular Fund. Expenses which cannot be directly attributed are apportioned among the Funds based upon relative net assets or other appropriate methods. Income, expenses (other than class specific expenses — distribution and shareholder services, transfer agency and sub transfer agency fees) and realized and unrealized gains or losses are allocated to each class of shares based upon their relative net assets.
B. Advisory Fees: The Adviser, a wholly-owned subsidiary of Morgan Stanley, provides the Fund with advisory services under the terms of an Investment Advisory Agreement, paid quarterly, at the annual rate based on the daily net assets as follows:
First $750
million | | Next $750
million | | Over $1.5
billion | |
| | 0.80 | % | | | 0.75 | % | | | 0.70 | % | |
For the year ended December 31, 2019, the advisory fee rate (net of waiver/rebate) was equivalent to an annual effective rate of 0.61% of the Fund's average daily net assets.
The Adviser has agreed to reduce its advisory fee and/or reimburse the Fund so that total annual Fund operating expenses, excluding certain investment related expenses, taxes, interest and other extraordinary expenses (including litigation), will not exceed 1.10% for Class I shares, 1.45% for Class A shares, 2.20% for Class C shares and 1.05% for Class IS shares. The fee waivers and/or expense reimbursements will continue for at least one year from the date of the Fund's prospectus or until such time as the Directors act to discontinue all or a portion of such waivers and/or reimbursements when they deem such action is appropriate. For the year ended December 31, 2019, approximately $124,000 of advisory fees were waived and ap-
proximately $7,000 of other expenses were reimbursed by the Adviser pursuant to this arrangement.
C. Administration Fees: The Adviser also serves as Administrator to the Company and provides administrative services pursuant to an Administration Agreement for an annual fee, accrued daily and paid monthly, of 0.08% of the Fund's average daily net assets.
Under a Sub-Administration Agreement between the Administrator and State Street, State Street provides certain administrative services to the Company. For such services, the Administrator pays State Street a portion of the fee the Administrator receives from the Fund.
D. Distribution and Shareholder Services Fees: Morgan Stanley Distribution, Inc. ("MSDI" or the "Distributor"), a wholly-owned subsidiary of the Adviser and an indirect subsidiary of Morgan Stanley, serves as the Company's Distributor of Fund shares pursuant to a Distribution Agreement. The Company has adopted a Shareholder Services Plan with respect to Class A shares pursuant to Rule 12b-1 under the Act. Under the Shareholder Services Plan, the Fund pays the Distributor a shareholder services fee, accrued daily and paid monthly, at an annual rate of 0.25% of the Fund's average daily net assets attributable to Class A shares.
The Company has adopted a Distribution and Shareholder Services Plan with respect to Class C shares pursuant to Rule 12b-1 under the Act. Under the Distribution and Shareholder Services Plan, the Fund pays the Distributor a distribution fee, accrued daily and paid monthly, at an annual rate of 0.75% and a shareholder services fee, accrued daily and paid monthly, at an annual rate of 0.25% of the Fund's average daily net assets attributable to Class C shares.
The distribution and shareholder services fees are used to support the expenses associated with servicing and maintaining accounts. The Distributor may compensate other parties for providing shareholder support services to investors who purchase Class A and Class C shares.
E. Dividend Disbursing and Transfer Agent: The Company's dividend disbursing and transfer agent is DST Asset Manager Solutions, Inc. ("DST"). Pursuant to a Transfer Agency Agreement, the Company pays DST a fee based on the number of classes, accounts and transactions relating to the Funds of the Company.
F. Custodian Fees: State Street (the "Custodian") also serves as Custodian for the Company in accordance with a
21
Morgan Stanley Institutional Fund, Inc.
Annual Report — December 31, 2019
Notes to Financial Statements (cont'd)
Custodian Agreement. The Custodian holds cash, securities and other assets of the Company as required by the Act. Custody fees are payable monthly based on assets held in custody, investment purchases and sales activity and account maintenance fees, plus reimbursement for certain out-of-pocket expenses.
G. Security Transactions and Transactions with Affiliates: For the year ended December 31, 2019, purchases and sales of investment securities for the Fund, other than long-term U.S. Government securities and short-term investments were approximately $83,336,000 and $17,725,000, respectively. There were no purchases and sales of long-term U.S. Government securities for the year ended December 31, 2019.
The Fund invests in the Institutional Class of the Morgan Stanley Institutional Liquidity Funds — Treasury Securities Portfolio (the "Liquidity Funds"), an open-end management investment company managed by the Adviser, both directly and as a portion of the securities held as collateral on loaned securities. Advisory fees paid by the Fund are reduced by an amount equal to its pro-rata share of the advisory and administration fees paid by the Fund due to its investment in the Liquidity Funds. For the year ended December 31, 2019, advisory fees paid were reduced by approximately $12,000 relating to the Fund's investment in the Liquidity Funds.
A summary of the Fund's transactions in shares of affiliated investments during the year ended December 31, 2019 is as follows:
Affiliated
Investment
Company | | Value
December 31,
2018
(000) | | Purchases
at Cost
(000) | | Proceeds
from Sales
(000) | | Dividend
Income
(000) | |
Liquidity Funds | | $ | 883 | | | $ | 60,449 | | | $ | 46,371 | | | $ | 125 | | |
Affiliated
Investment
Company (cont'd) | | Realized
Gain (Loss)
(000) | | Change in
Unrealized
Appreciation
(Depreciation)
(000) | | Value
December 31,
2019
(000) | |
Liquidity Funds | | $ | — | | | $ | — | | | $ | 14,961 | | |
The Fund is permitted to purchase and sell securities ("cross-trade") from and to other Morgan Stanley funds as well as other funds and client accounts for which the Adviser or an affiliate of the Adviser serves as investment adviser, pursuant to procedures approved by the Directors in compliance with Rule 17a-7 under the Act (the "Rule"). Each cross-trade is executed at the current market price in compliance with provisions of the Rule. For the year ended December 31, 2019, the Fund did not engage in any cross-trade transactions.
The Fund has an unfunded Deferred Compensation Plan (the "Compensation Plan"), which allows each independent Director to defer payment of all, or a portion, of the fees he or she receives for serving on the Board of Directors. Each eligible Director generally may elect to have the deferred amounts credited with a return equal to the total return on one or more of the Morgan Stanley funds that are offered as investment options under the Compensation Plan. Appreciation/depreciation and distributions received from these investments are recorded with an offsetting increase/decrease in the deferred compensation obligation and do not affect the NAV of the Fund.
H. Federal Income Taxes: It is the Fund's intention to continue to qualify as a regulated investment company and distribute all of its taxable and tax-exempt income. Accordingly, no provision for federal income taxes is required in the financial statements.
The Fund may be subject to taxes imposed by countries in which it invests. Such taxes are generally based on income and/or capital gains earned or repatriated. Taxes are accrued based on net investment income, net realized gains and net unrealized appreciation as such income and/or gains are earned. Taxes may also be based on transactions in foreign currency and are accrued based on the value of investments denominated in such currency.
FASB ASC 740-10, "Income Taxes — Overall", sets forth a minimum threshold for financial statement recognition of the benefit of a tax position taken or expected to be taken in a tax return. Management has concluded there are no significant uncertain tax positions that would require recognition in the financial statements. If applicable, the Fund recognizes interest accrued related to unrecognized tax benefits in "Interest Expense" and penalties in "Other Expenses" in the Statement of Operations. The Fund files tax returns with the U.S. Internal Revenue Service, New York and various states. Generally, each of the tax years in the four-year period ended December 31, 2019 remains subject to examination by taxing authorities.
The tax character of distributions paid may differ from the character of distributions shown for GAAP purposes due to short-term capital gains being treated as ordinary income for tax purposes. The tax character of distributions paid during fiscal years 2019 and 2018 was as follows:
2019
Distributions
Paid From: | | 2018
Distributions
Paid From: | |
Ordinary
Income
(000) | | Ordinary
Income
(000) | |
| $ | 37 | | | $ | 256 | | |
22
Morgan Stanley Institutional Fund, Inc.
Annual Report — December 31, 2019
Notes to Financial Statements (cont'd)
The amount and character of income and gains to be distributed are determined in accordance with income tax regulations which may differ from GAAP. These book/tax differences are either considered temporary or permanent in nature.
Temporary differences are attributable to differing book and tax treatments for the timing of the recognition of gains (losses) on certain investment transactions and the timing of the deductibility of certain expenses.
Permanent differences, primarily due to a net operating loss, resulted in the following reclassifications among the components of net assets at December 31, 2019:
Total
Distributable
Earnings
(000) | | Paid-in
Capital
(000) | |
| $ | 190 | | | $ | (190 | ) | |
At December 31, 2019, the Fund had no distributable earnings on a tax basis.
At December 31, 2019, the Fund had available for federal income tax purposes unused short-term capital losses of approximately $2,541,000 that do not have an expiration date.
To the extent that capital loss carryforwards are used to offset any future capital gains realized, no capital gains tax liability will be incurred by the Fund for gains realized and not distributed. To the extent that capital gains are offset, such gains will not be distributed to the shareholders.
Qualified late year losses are capital losses and specified ordinary losses, including currency losses, incurred after October 31 but within the taxable year that, if elected, are deemed to arise on the first day of the Fund's next taxable year. For the year ended December 31, 2019, the Fund intends to defer to January 1, 2020 for U.S. federal income tax purposes the following losses:
Qualified
Late Year
Ordinary
Losses
(000) | | Post-October
Capital
Losses
(000) | |
| $ | 7 | | | $ | — | | |
I. Credit Facility: The Company and other Morgan Stanley funds participated in a $150,000,000 committed, unsecured revolving line of credit facility (the "Facility") with State Street. Effective April 22, 2019, the committed line amount increased to $300,000,000. This Facility is to be used for temporary emergency purposes or funding of shareholder redemption requests. The interest rate on borrowings is based on the federal funds rate or 1 month LIBOR rate plus a spread. The
Facility also has a commitment fee of 0.25% per annum based on the unused portion of the Facility. During the year ended December 31, 2019, the Fund did not have any borrowings under the Facility.
J. Other: At December 31, 2019, the Fund had record owners of 10% or greater. Investment activities of these shareholders could have a material impact on the Fund. The aggregate percentage of such owners was 43.0%.
23
Morgan Stanley Institutional Fund, Inc.
Annual Report — December 31, 2019
Report of Independent Registered Public Accounting Firm
To the Shareholders and Board of Directors of
Morgan Stanley Institutional Fund, Inc. —
Asia Opportunity Portfolio
Opinion on the Financial Statements
We have audited the accompanying statement of assets and liabilities of Asia Opportunity Portfolio (the "Fund") (one of the funds constituting Morgan Stanley Institutional Fund, Inc. (the "Company")), including the portfolio of investments, as of December 31, 2019, and the related statement of operations for the year then ended, the statements of changes in net assets for each of the two years in the period then ended, the financial highlights for each of the four years in the period then ended and the period from December 29, 2015 (commencement of operations) through December 31, 2015 and the related notes (collectively referred to as the "financial statements"). In our opinion, the financial statements present fairly, in all material respects, the financial position of Asia Opportunity Portfolio (one of the funds constituting Morgan Stanley Institutional Fund, Inc.) at December 31, 2019, the results of its operations for the year then ended, the changes in its net assets for each of the two years in the period then ended and its financial highlights for each of the four years in the period then ended and the period from December 29, 2015 (commencement of operations) through December 31, 2015, in conformity with U.S. generally accepted accounting principles.
Basis for Opinion
These financial statements are the responsibility of the Company's management. Our responsibility is to express an opinion on the Fund's financial statements based on our audits. We are a public accounting firm registered with the Public Company Accounting Oversight Board (United States) ("PCAOB") and are required to be independent with respect to the Company in accordance with the U.S. federal securities law and the applicable rules and regulations of the Securities and Exchange Commission and the PCAOB.
We conducted our audits in accordance with the standards of the PCAOB. Those standards require that we plan and perform the audit to obtain reasonable assurance about whether the financial statements are free of material misstatement, whether due to error or fraud. The Company is not required to have, nor were we engaged to perform, an audit of the Company's internal control over financial reporting. As part of our audits, we are required to obtain an understanding of internal control over financial reporting, but not for the purpose of expressing an opinion on the effectiveness of the Company's internal control over financial reporting. Accordingly, we express no such opinion.
Our audits included performing procedures to assess the risks of material misstatement of the financial statements, whether due to error or fraud, and performing procedures that respond to those risks. Such procedures included examining, on a test basis, evidence regarding the amounts and disclosures in the financial statements. Our procedures included confirmation of securities owned as of December 31, 2019 by correspondence with the custodian and others or by other appropriate auditing procedures where replies from others were not received. Our audits also included evaluating the accounting principles used and significant estimates made by management, as well as evaluating the overall presentation of the financial statements. We believe that our audits provide a reasonable basis for our opinion.

We have served as the auditor of one or more Morgan Stanley investment companies since 2000.
Boston, Massachusetts
February 27, 2020
24
Morgan Stanley Institutional Fund, Inc.
Annual Report — December 31, 2019
Federal Tax Notice (unaudited)
For federal income tax purposes, the following information is furnished with respect to the Fund's earnings for its taxable year ended December 31, 2019. When distributed, certain earnings may be subject to a maximum tax rate of 15% as provided for by the Jobs and Growth Tax Relief Reconciliation Act of 2003. The Fund designated up to a maximum of approximately $118,000 as taxable at this lower rate.
In January, the Fund provides tax information to shareholders for the preceding calendar year.
25
Privacy Notice (unaudited) April 2019
FACTS | | WHAT DOES MSIM DO WITH YOUR PERSONAL INFORMATION? | |
Why? | | Financial companies choose how they share your personal information. Federal law gives consumers the right to limit some but not all sharing. Federal law also requires us to tell you how we collect, share, and protect your personal information. Please read this notice carefully to understand what we do. | |
What? | | The types of personal information we collect and share depend on the product or service you have with us. This information can include:
n Social Security number and income
n investment experience and risk tolerance
n checking account number and wire transfer instructions | |
How? | | All financial companies need to share customers' personal information to run their everyday business. In the section below, we list the reasons financial companies can share their customers' personal information; the reasons MSIM chooses to share; and whether you can limit this sharing. | |
Reasons we can share your personal information | | Does MSIM share? | | Can you limit this sharing? | |
For our everyday business purposes —
such as to process your transactions, maintain your account(s), respond to court orders and legal investigations, or report to credit bureaus | | Yes | | No | |
For our marketing purposes —
to offer our products and services to you | | Yes | | No | |
For joint marketing with other financial companies | | No | | We don't share | |
For our affiliates' everyday business purposes —
information about your transactions and experiences | | Yes | | No | |
For our affiliates' everyday business purposes —
information about your creditworthiness | | No | | We don't share | |
For our affiliates to market to you | | No | | We don't share | |
For non-affiliates to market to you | | No | | We don't share | |
Questions? Call toll-free (844) 312-6327 or email: imprivacyinquiries@morganstanley.com
26
Privacy Notice (unaudited) (cont'd) April 2019
Who we are
Who is providing this notice? | | Morgan Stanley Investment Management, Inc. and its affiliated registered investment advisers, registered broker-dealers, and registered and unregistered funds ("MSIM") | |
What we do
How does MSIM protect my personal information? | | To protect your personal information from unauthorized access and use, we use security measures that comply with federal law. These measures include computer safeguards and secured files and buildings. We have policies governing the proper handling of customer information by personnel and requiring third parties that provide support to adhere to appropriate security standards with respect to such information. | |
How does MSIM collect my personal information? | | We collect your personal information, for example, when you
n open an account or make deposits or withdrawals from your account
n buy securities from us or make a wire transfer
n give us your contact information
We also collect your personal information from others, such as credit bureaus, affiliates, or other companies. | |
Why can't I limit all sharing? | | Federal law gives you the right to limit only
n sharing for affiliates' everyday business purposes — information about your creditworthiness
n affiliates from using your information to market to you
n sharing for non-affiliates to market to you
State laws and individual companies may give you additional rights to limit sharing. See below for more on your rights under state law. | |
Definitions
Affiliates | | Companies related by common ownership or control. They can be financial and non-financial companies.
n Our affiliates include companies with a Morgan Stanley name and financial companies such as Morgan Stanley Smith Barney LLC and Morgan Stanley & Co. | |
Non-affiliates | | Companies not related by common ownership or control. They can be financial and non-financial companies.
n MSIM does not share with non-affiliates so they can market to you. | |
Joint marketing | | A formal agreement between non-affiliated financial companies that together market financial products or services to you.
n MSIM doesn't jointly market | |
Other Important Information
Vermont: Except as permitted by law, we will not share personal information we collect about Vermont residents with Non-affiliates unless you provide us with your written consent to share such information.
California: Except as permitted by law, we will not share personal information we collect about California residents with Non-affiliates and we will limit sharing such personal information with our Affiliates to comply with California privacy laws that apply to us.
27
Morgan Stanley Institutional Fund, Inc.
Annual Report — December 31, 2019
Director and Officer Information (unaudited)
Independent Directors:
Name, Birth Year
and Address of
Independent Director | | Position(s)
Held with
Registrant | | Length of Time
Served* | | Principal Occupation(s) During Past 5 Years
and Other Relevant Professional Experience | | Number of
Funds in Fund
Complex
Overseen by
Independent
Director** | | Other Directorships
Held by Independent
Director*** | |
Frank L. Bowman
c/o Perkins Coie LLP
Counsel to the Independent Directors
1155 Avenue of the Americas
New York, NY 10036
Birth Year 1944 | | Director | | Since August
2006 | | President, Strategic Decisions, LLC (consulting) (since February 2009); Director or Trustee of various Morgan Stanley Funds (since August 2006); Chairperson of the Compliance and Insurance Committee (since October 2015); formerly, Chairperson of the Insurance Sub-Committee of the Compliance and Insurance Committee (2007-2015); served as President and Chief Executive Officer of the Nuclear Energy Institute (policy organization) (February 2005-November 2008); retired as Admiral, U.S. Navy after serving over 38 years on active duty including 8 years as Director of the Naval Nuclear Propulsion Program in the Department of the Navy and the U.S. Department of Energy (1996-2004); served as Chief of Naval Personnel (July 1994-September 1996) and on the Joint Staff as Director of Political Military Affairs (June 1992-July 1994); knighted as Honorary Knight Commander of the Most Excellent Order of the British Empire; awarded the Officier de l'Orde National du Mérite by the French Government; elected to the National Academy of Engineering (2009). | | | 86 | | | Director of Naval and Nuclear Technologies LLP; Director Emeritus of the Armed Services YMCA; Member of the National Security Advisory Council of the Center for U.S. Global Engagement and a member of the CNA Military Advisory Board; Trustee of Fairhaven United Methodist Church; Member of the Board of Advisors of the Dolphin Scholarship Foundation; Director of other various non-profit organizations; formerly, Director of BP p.l.c. (November 2010-May 2019). | |
Kathleen A. Dennis
c/o Perkins Coie LLP
Counsel to the Independent Directors
1155 Avenue of the Americas
New York, NY 10036
Birth Year 1953 | | Director | | Since August
2006 | | President, Cedarwood Associates (mutual fund and investment management consulting) (since July 2006); Chairperson of the Liquidity and Alternatives Sub-Committee of the Investment Committee (since October 2006) and Director or Trustee of various Morgan Stanley Funds (since August 2006); formerly, Senior Managing Director of Victory Capital Management (1993-2006). | | | 86 | | | Director of various non-profit organizations. | |
Nancy C. Everett
c/o Perkins Coie LLP
Counsel to the Independent Directors
1155 Avenue of the Americas
New York, NY 10036
Birth Year 1955 | | Director | | Since January
2015 | | Chief Executive Officer, Virginia Commonwealth University Investment Company (since November 2015); Owner, OBIR, LLC (institutional investment management consulting) (since June 2014); formerly, Managing Director, BlackRock, Inc. (February 2011-December 2013); and Chief Executive Officer, General Motors Asset Management (a/k/a Promark Global Advisors, Inc.) (June 2005-May 2010). | | | 87 | | | Formerly, Member of Virginia Commonwealth University School of Business Foundation (2005-2016); Member of Virginia Commonwealth University Board of Visitors (2013-2015); Member of Committee on Directors for Emerging Markets Growth Fund, Inc. (2007-2010); Chairperson of Performance Equity Management, LLC (2006-2010); and Chairperson, GMAM Absolute Return Strategies Fund, LLC (2006-2010). | |
28
Morgan Stanley Institutional Fund, Inc.
Annual Report — December 31, 2019
Director and Officer Information (unaudited) (cont'd)
Independent Directors: (cont'd)
Name, Birth Year
and Address of
Independent Director | | Position(s)
Held with
Registrant | | Length of Time
Served* | | Principal Occupation(s) During Past 5 Years
and Other Relevant Professional Experience | | Number of
Funds in Fund
Complex
Overseen by
Independent
Director** | | Other Directorships
Held by Independent
Director*** | |
Jakki L. Haussler
c/o Perkins Coie LLP
Counsel to the Independent Directors
1155 Avenue of the Americas
New York, NY 10036
Birth Year 1957 | | Director | | Since January
2015 | | Chairman, Opus Capital Group (since 1996); formerly, Chief Executive Officer, Opus Capital Group (1996-2019); Director, Capvest Venture Fund, LP (May 2000-December 2011); Partner, Adena Ventures, LP (July 1999-December 2010); Director, The Victory Funds (February 2005-July 2008). | | | 87 | | | Director of Service Corporation International and Member, Audit Committee and Investment Committee; Director of Cincinnati Bell Inc. and Member, Audit Committee and Governance and Nominating Committee; Chairman of Northern Kentucky University Member Investment Committee; Member of Chase College of Law Transactional Law Practice Center Board of Advisors; Director of Best Transport; Director of Chase College of Law Board of Visitors; formerly, Member, University of Cincinnati Foundation Investment Committee; Member, Miami University Board of Visitors (2008-2011); Trustee of Victory Funds (2005-2008) and Chairman, Investment Committee (2007-2008) and Member, Service Provider Committee (2005-2008). | |
Dr. Manuel H. Johnson
c/o Johnson Smick International, Inc.
220 I Street, NE — Suite 200
Washington, D.C. 20002
Birth Year 1949 | | Director | | Since July
1991 | | Senior Partner, Johnson Smick International, Inc. (consulting firm); Chairperson of the Investment Committee (since October 2006) and Director or Trustee of various Morgan Stanley Funds (since July 1991); Co-Chairman and a founder of the Group of Seven Council (G7C) (international economic commission); formerly, Chairperson of the Audit Committee (July 1991-September 2006), Vice Chairman of the Board of Governors of the Federal Reserve System and Assistant Secretary of the U.S. Treasury. | | | 86 | | | Director of NVR, Inc. (home construction). | |
Joseph J. Kearns
c/o Perkins Coie LLP
Counsel to the Independent Directors
1155 Avenue of the Americas
New York, NY 10036
Birth Year 1942 | | Director | | Since August
1994 | | Senior Adviser, Kearns & Associates LLC (investment consulting); Chairperson of the Audit Committee (since October 2006) and Director or Trustee of various Morgan Stanley Funds (since August 1994); formerly, Deputy Chairperson of the Audit Committee (July 2003-September 2006) and Chairperson of the Audit Committee of various Morgan Stanley Funds (since August 1994); CFO of the J. Paul Getty Trust. | | | 87 | | | Prior to August 10, 2016, Director of Electro Rent Corporation (equipment leasing); Prior to December 31, 2013, Director of The Ford Family Foundation. | |
29
Morgan Stanley Institutional Fund, Inc.
Annual Report — December 31, 2019
Director and Officer Information (unaudited) (cont'd)
Independent Directors: (cont'd)
Name, Birth Year
and Address of
Independent Director | | Position(s)
Held with
Registrant | | Length of Time
Served* | | Principal Occupation(s) During Past 5 Years
and Other Relevant Professional Experience | | Number of
Funds in Fund
Complex
Overseen by
Independent
Director** | | Other Directorships
Held by Independent
Director*** | |
Michael F. Klein
c/o Perkins Coie LLP
Counsel to the Independent Directors
1155 Avenue of the Americas
New York, NY 10036
Birth Year 1958 | | Director | | Since August
2006 | | Managing Director, Aetos Alternatives Management, LP (since March 2000); Co-President, Aetos Alternatives Management, LP (since January 2004) and Co-Chief Executive Officer of Aetos Alternatives Management, LP (since August 2013); Chairperson of the Fixed Income Sub-Committee of the Investment Committee (since October 2006) and Director or Trustee of various Morgan Stanley Funds (since August 2006); formerly, Managing Director, Morgan Stanley & Co. Inc. and Morgan Stanley Dean Witter Investment Management and President, various Morgan Stanley Funds (June 1998-March 2000); Principal, Morgan Stanley & Co. Inc. and Morgan Stanley Dean Witter Investment Management (August 1997-December 1999). | | | 86 | | | Director of certain investment funds managed or sponsored by Aetos Alternatives Management, LP; Director of Sanitized AG and Sanitized Marketing AG (specialty chemicals). | |
Patricia Maleski
c/o Perkins Coie LLP
Counsel to the Independent Directors
1155 Avenue of the Americas
New York, NY 10036
Birth Year 1960 | | Director | | Since January
2017 | | Managing Director, JPMorgan Asset Management (2004-2016); Oversight and Control Head of Fiduciary and Conflicts of Interest Program (2015-2016); Chief Control Officer-Global Asset Management (2013-2015); President, JPMorgan Funds (2010-2013); Chief Administrative Officer (2004-2013); various other positions including Treasurer and Board Liaison (since 2001). | | | 87 | | | None. | |
Michael E. Nugent
522 Fifth Avenue
New York, NY 10036
Birth Year 1936 | | Chair of the Board and Director | | Chair of the Boards since July 2006 and Director since July 1991 | | Chair of the Boards of various Morgan Stanley Funds (since July 2006); Chairperson of the Governance Committee (since January 2019) and Director or Trustee of various Morgan Stanley Funds (since July 1991); formerly, Chairperson of each of the Closed-End Fund committee (until December 2019) and the Insurance Committee (until July 2006); General Partner, Triumph Capital, L.P. (private investment partnership) (1988-2013). | | | 86 | | | None. | |
W. Allen Reed
c/o Perkins Coie LLP
Counsel to the Independent Directors
1155 Avenue of the Americas
New York, NY 10036
Birth Year 1947 | | Vice Chair of the Board and Director | | Vice Chair of the Boards since January 2020 and Director Since August 2006 | | Chairperson of the Equity Sub-Committee of the Investment Committee (since October 2006) and Director or Trustee of various Morgan Stanley Funds (since August 2006); formerly, President and CEO of General Motors Asset Management; Chairman and Chief Executive Officer of the GM Trust Bank and Corporate Vice President of General Motors Corporation (August 1994-December 2005). | | | 86 | | | Formerly, Director of Legg Mason, Inc.; formerly, Director of the Auburn University Foundation (2010-2015). | |
* This is the earliest date the Director began serving the Morgan Stanley Funds. Each Director serves an indefinite term, until his or her successor is elected.
** The Fund Complex includes (as of December 31, 2019) all open-end and closed-end funds (including all of their portfolios) advised by Morgan Stanley Investment Management Inc. (the "Adviser") and any funds that have an adviser that is an affiliated person of the Adviser (including, but not limited to, Morgan Stanley AIP GP LP).
*** This includes any directorships at public companies and registered investment companies held by the Director at any time during the past five years.
30
Morgan Stanley Institutional Fund, Inc.
Annual Report — December 31, 2019
Director and Officer Information (unaudited) (cont'd)
Executive Officers:
Name, Birth Year and Address of
Executive Officer | | Position(s)
Held with
Registrant | | Length of Time
Served* | | Principal Occupation(s) During Past 5 Years | |
John H. Gernon
522 Fifth Avenue
New York, NY 10036
Birth Year 1963 | | President and Principal Executive Officer | | Since September 2013 | | President and Principal Executive Officer of the Equity and Fixed Income Funds and the Morgan Stanley AIP Funds (since September 2013) and the Liquidity Funds and various money market funds (since May 2014) in the Fund Complex; Managing Director of the Adviser; Head of Product (since 2006). | |
Timothy J. Knierim
522 Fifth Avenue
New York, NY 10036
Birth Year 1959 | | Chief Compliance Officer | | Since December 2016 | | Managing Director of the Adviser and various entities affiliated with the Adviser; Chief Compliance Officer of various Morgan Stanley Funds and the Adviser (since December 2016) and Chief Compliance Officer of Morgan Stanley AIP GP LP (since 2014). Formerly, Managing Director and Deputy Chief Compliance Officer of the Adviser (2014-2016); and formerly, Chief Compliance Officer of Prudential Investment Management, Inc. (2007-2014). | |
Francis J. Smith
522 Fifth Avenue
New York, NY 10036
Birth Year 1965 | | Treasurer and Principal Financial Officer | | Treasurer since July 2003 and Principal Financial Officer since September 2002 | | Managing Director of the Adviser and various entities affiliated with the Adviser; Treasurer (since July 2003) and Principal Financial Officer of various Morgan Stanley Funds (since September 2002). | |
Mary E. Mullin
522 Fifth Avenue
New York, NY 10036
Birth Year 1967 | | Secretary | | Since June 1999 | | Managing Director of the Adviser; Secretary of various Morgan Stanley Funds (since June 1999). | |
Michael J. Key
522 Fifth Avenue
New York, NY 10036
Birth Year 1979 | | Vice President | | Since June 2017 | | Vice President of the Equity and Fixed Income Funds, Liquidity Funds, various money market funds and the Morgan Stanley AIP Funds in the Fund Complex (since June 2017); Executive Director of the Adviser; Head of Product Development for Equity and Fixed Income Funds (since August 2013). | |
* This is the earliest date the officer began serving the Morgan Stanley Funds. Each officer serves a one-year term, until his or her successor is elected and qualifies.
31
Morgan Stanley Institutional Fund, Inc.
Annual Report — December 31, 2019
Adviser and Administrator
Morgan Stanley Investment Management Inc.
522 Fifth Avenue
New York, New York 10036
Distributor
Morgan Stanley Distribution, Inc.
522 Fifth Avenue
New York, New York 10036
Dividend Disbursing and Transfer Agent
DST Asset Manager Solutions, Inc.
2000 Crown Colony Drive
Quincy, Massachusetts 02169
Custodian
State Street Bank and Trust Company
One Lincoln Street
Boston, Massachusetts 02111
Legal Counsel
Dechert LLP
1095 Avenue of the Americas
New York, New York 10036
Counsel to the Independent Directors
Perkins Coie LLP
1155 Avenue of the Americas
New York, New York 10036
Independent Registered Public Accounting Firm
Ernst & Young LLP
200 Clarendon Street
Boston, Massachusetts 02116
Reporting to Shareholders
Each Morgan Stanley fund provides a complete schedule of portfolio holdings in its Semi-Annual and the Annual Reports within 60 days of the end of the fund's second and fourth fiscal quarters. The Semi-Annual and Annual Reports are filed electronically with the Securities and Exchange Commission ("SEC") on Form N-CSRS and Form N-CSR, respectively. Morgan Stanley also delivers the Semi-Annual and Annual Reports to fund shareholders and makes these reports available on its public website, www.morganstanley.com/im/shareholderreports. Each Morgan Stanley non-money market fund also files a complete schedule of portfolio holdings with the SEC for the fund's first and third fiscal quarters as an attachment to Form N-PORT. Morgan Stanley does not deliver the reports for the first and third fiscal quarters to shareholders, nor are the reports posted to the Morgan Stanley public website. However, the holdings for each money market fund are posted to the Morgan Stanley public website. You may obtain the Form N-PORT filings (as well as the Form N-CSR and N-CSRS filings) by accessing the SEC's website, www.sec.gov. You can also request copies of these materials, upon payment of a duplicating fee, by electronic request at the SEC's email address (publicinfo@sec.gov).
Proxy Voting Policies and Procedures and Proxy Voting Record
You may obtain a copy of the Company's Proxy Voting Policy and Procedures and information regarding how the Company voted proxies relating to portfolio securities during the most recent twelve-month period ended June 30, without charge, upon request, by calling toll free 1 (800) 548-7786 or by visiting our website at www.morganstanley.com/im/shareholderreports. This information is also available on the SEC's website at www.sec.gov.
This report is authorized for distribution only when preceded or accompanied by a prospectus or summary prospectus of the applicable fund of Morgan Stanley Institutional Fund, Inc., which describes in detail the fund's investment policies, risks, fees and expenses. Please read the prospectus carefully before you invest or send money. For additional information, including information regarding the investments comprising the Fund, please visit our website at www.morganstanley.com/im/shareholderreports or call toll free 1 (800) 548-7786.
32
Printed in U.S.A.
This Report has been prepared for shareholders and may be distributed to others only if preceded or accompanied by a current prospectus.
Morgan Stanley Investment Management Inc.
522 Fifth Avenue
New York, New York 10036
© 2020 Morgan Stanley. Morgan Stanley Distribution, Inc.

IFIASOPPANN
2920391 EXP. 02.28.21

Morgan Stanley Institutional Fund, Inc.
Emerging Markets Small Cap Portfolio
Annual Report
December 31, 2019
Beginning on January 1, 2021, as permitted by regulations adopted by the Securities and Exchange Commission ("SEC"), paper copies of the Fund's Annual and Semi-Annual Reports to Shareholders ("Shareholder Reports") will no longer be sent by mail, unless you specifically request paper copies of the Shareholder Reports from the Fund or from your financial intermediary, such as a broker-dealer or a bank. Instead, the Shareholder Reports will be made available on the Fund's website, https://www.morganstanley.com/im/shareholderreports and you will be notified by mail each time a Shareholder Report is posted and provided with a website link to access the Shareholder Report. If you already elected to receive Shareholder Reports electronically, you will not be affected by this change and you need not take any action. You may elect to receive Shareholder Reports and other communications from the Fund electronically anytime by contacting your financial intermediary or, if you are a direct investor, please follow the instructions on the envelope.
Beginning on January 1, 2019, you may elect to receive all future Shareholder Reports in paper free of charge. If you invest through a financial intermediary, you can contact your financial intermediary to request that you continue to receive paper copies of your Shareholder Reports. If you invest directly with the Fund, please follow the instructions on the envelope to let the Fund know you wish to continue receiving paper copies of your Shareholder Reports. Your election to receive Shareholder Reports in paper will apply to all funds held in your account if you invest through your financial intermediary or all funds held with the fund complex if you invest directly with a fund.

Morgan Stanley Institutional Fund, Inc.
Annual Report — December 31, 2019
Shareholders' Letter | | | 2 | | |
Expense Example | | | 3 | | |
Investment Overview | | | 4 | | |
Portfolio of Investments | | | 6 | | |
Statement of Assets and Liabilities | | | 8 | | |
Statement of Operations | | | 10 | | |
Statements of Changes in Net Assets | | | 11 | | |
Financial Highlights | | | 12 | | |
Notes to Financial Statements | | | 16 | | |
Report of Independent Registered Public Accounting Firm | | | 25 | | |
Federal Tax Notice | | | 26 | | |
Privacy Notice | | | 27 | | |
Director and Officer Information | | | 29 | | |
This report is authorized for distribution only when preceded or accompanied by a prospectus or summary prospectus of the applicable Fund of Morgan Stanley Institutional Fund, Inc. To receive a prospectus and/or statement of additional information ("SAI"), which contains more complete information such as investment objectives, charges, expenses, policies for voting proxies, risk considerations and describes in detail each of the Fund's investment policies to the prospective investor, please call toll free 1 (800) 548-7786. Please read the prospectuses carefully before you invest or send money.
Additionally, you can access information about the Fund, including performance, characteristics and investment team commentary, through Morgan Stanley Investment Management's website: www.morganstanley.com/im/shareholderreports.
Market forecasts provided in this report may not necessarily come to pass. There is no guarantee that any sectors mentioned will continue to perform as discussed herein or that securities in such sectors will be held by the Fund in the future. There is no assurance that a fund will achieve its investment objective. Funds are subject to market risk, which is the possibility that market values of securities owned by the Fund will decline and, therefore, the value of the Fund's shares may be less than what you paid for them. Accordingly, you can lose money investing in this Fund. Please see the prospectus for more complete information on investment risks.
1
Morgan Stanley Institutional Fund, Inc.
Annual Report — December 31, 2019
Shareholders' Letter (unaudited)
Dear Shareholders,
We are pleased to provide this Annual Report, in which you will learn how your investment in Emerging Markets Small Cap Portfolio (the "Fund") performed during the latest twelve-month period.
Morgan Stanley Investment Management is a client-centric, investor-led organization. Our global presence, intellectual capital, and breadth of products and services enable us to partner with investors to meet the evolving challenges of today's financial markets. We aim to deliver superior investment service and to empower our clients to make the informed decisions that help them reach their investment goals.
As always, we thank you for selecting Morgan Stanley Investment Management, and look forward to working with you in the months and years ahead.
Sincerely,

John H. Gernon
President and Principal Executive Officer
January 2020
2
Morgan Stanley Institutional Fund, Inc.
Annual Report — December 31, 2019
Expense Example (unaudited)
Emerging Markets Small Cap Portfolio
As a shareholder of the Fund, you incur two types of costs: (1) transactional costs, including redemption fees; and (2) ongoing costs, which may include advisory fees, administration fees, distribution and shareholder services fees and other Fund expenses. This example is intended to help you understand your ongoing costs (in dollars) of investing in the Fund and to compare these costs with the ongoing costs of investing in other mutual funds.
This example is based on an investment of $1,000 invested at the beginning of the six-month period ended December 31, 2019 and held for the entire six-month period.
Actual Expenses
The table below provides information about actual account values and actual expenses. You may use the information in this table, together with the amount you invested, to estimate the expenses that you paid over the period. Simply divide your account value by $1,000 (for example, an $8,600 account value divided by $1,000 = 8.6), then multiply the result by the number in the table under the heading entitled "Actual Expenses Paid During Period" to estimate the expenses you paid on your account during this period.
Hypothetical Example for Comparison Purposes
The table below provides information about hypothetical account values and hypothetical expenses based on the Fund's actual expense ratio and an assumed rate of return of 5% per year before expenses, which is not the Fund's actual return. The hypothetical account values and expenses may not be used to estimate the actual ending account balance or expenses you paid for the period. You may use this information to compare the ongoing costs of investing in the Fund and other funds. To do so, compare this 5% hypothetical example with the 5% hypothetical examples that appear in the shareholder reports of the other funds.
Please note that the expenses shown in the table are meant to highlight your ongoing costs only and do not reflect any transactional costs, such as sales charges (loads) and redemption fees. Therefore, the information for each class in the table is useful in comparing ongoing costs only, and will not help you determine the relative total costs of owning different funds. In addition, if these transactional costs were included, your costs would have been higher.
| | | Beginning
Account
Value
7/1/19 | | Actual Ending
Account
Value
12/31/19 | | Hypothetical
Ending Account
Value | | Actual
Expenses
Paid
During
Period* | | Hypothetical
Expenses Paid
During Period* | | Net
Expense
Ratio
During
Period** | |
Emerging Markets Small Cap Portfolio Class I | | $ | 1,000.00 | | | $ | 1,005.60 | | | $ | 1,018.65 | | | $ | 6.57 | | | $ | 6.61 | | | | 1.30 | % | |
Emerging Markets Small Cap Portfolio Class A | | | 1,000.00 | | | | 1,004.00 | | | | 1,016.89 | | | | 8.32 | | | | 8.39 | | | | 1.65 | | |
Emerging Markets Small Cap Portfolio Class C | | | 1,000.00 | | | | 1,000.00 | | | | 1,013.11 | | | | 12.10 | | | | 12.18 | | | | 2.40 | | |
Emerging Markets Small Cap Portfolio Class IS | | | 1,000.00 | | | | 1,005.30 | | | | 1,018.90 | | | | 6.32 | | | | 6.36 | | | | 1.25 | | |
* Expenses are calculated using each Fund Class' annualized net expense ratio (as disclosed), multiplied by the average account value over the period and multiplied by 184/365 (to reflect the most recent one-half year period).
** Annualized.
3
Morgan Stanley Institutional Fund, Inc.
Annual Report — December 31, 2019
Investment Overview (unaudited)
Emerging Markets Small Cap Portfolio
The Fund seeks long-term capital appreciation.
Performance
For the fiscal year ended December 31, 2019, the Fund's Class I shares had a total return based on net asset value and reinvestment of distributions per share of 12.98%, net of fees. The Fund's Class I shares outperformed the Fund's benchmark, the MSCI Emerging Markets Small Cap Net Index (the "Index"), which returned 11.50%.
Factors Affecting Performance
• Emerging markets (EM) small-cap equities underperformed the broad emerging markets equities universe during the one-year period ending December 31, 2019, with the Index returning 11.50% versus the MSCI Emerging Markets Net Index's return of 18.42%.
• Positive contributors to the Fund's performance during the period included our stock selection in India and Indonesia, and our stock selection in and underweight allocations to Korea and Thailand. Our zero allocation to Chile also contributed strongly.
• Key detractors from performance included the Fund's stock selection in Brazil and China. From a style perspective, value outperformed growth in both markets. In Brazil's small-cap market, value stocks increased 61.5% versus growth stocks at 43.7% for the year and in China's small-cap market, growth was down 0.3% versus value returning 14%.(i) We continue to believe a quality and growth approach to small caps offers attractive opportunities for investment discovery and exposure to growth and domestic demand in EM.
• Our stock selection in and underweight allocation to Taiwan also detracted. Taiwan represents 20% of the small-cap Index and was one of the best performing small-cap markets in 2019. The rally was largely driven by technology, in which we have been historically underweight given the volatility of the sector.
• From a sector perspective, our stock selection in financials and industrials contributed strongly to returns. Our stock selection in and underweight allocation to information technology detracted from returns.
Management Strategies
• In every decade since World War II, global investors have flocked to a hot new theme, which booms for
about 10 years only to underperform in the years that follow. The well-known surges of more recent times have included the spectacular surge in Japanese stocks during the 1980s, which gave way to the American-led tech boom in the 1990s, and then to emerging markets dominating in the 2000s. The 2010s saw outsized returns for U.S. mega caps.
• Today the world's five largest companies account for just under 10% of global stock market capitalization, a peak last reached at the height of the tech bubble in 2001.(ii) The top 10 largest companies account for close to 14%, and seven of the top 10 are American companies. But churn is the norm: top 10 companies of one decade have a less than one-in-five chance of staying top 10 for a second straight decade.(iii)
• The 2010s were a decade of mega caps: companies with a market cap over $200 billion. But smaller is likely to be beautiful for companies, too, in the 2020s. U.S. small caps are historically cheap relative to large caps; the last time they were this cheap was 2001, and before that it was the 1930s. In EM, smaller stocks (the bottom fifth by market cap) are trading lower relative to large caps than at any time since records began in the 1990s.(iv)
• There are a number of reasons to expect a comeback of smaller companies, including the fact that today's tech giants provide internet platforms on which start-ups thrive, as well as cloud computing services that help smaller firms scale up quickly. Thus, the tech mega caps of 2020 may be nurturing the mega caps of 2030.
• As the four Ds — de-globalization, debt accumulation, declining productivity and demographic pressures — keep global growth constrained, equity investors are increasingly rewarding those emerging markets countries and companies that can generate accelerating growth. We believe that shifting global economic forces could set the stage for a comeback by certain emerging markets, and particularly for domestic-oriented businesses within these markets, over the next decade.
(i) Source: FactSet, as of December 31, 2019. Based on MSCI country small-cap growth and value indexes.
(ii) Source: MSIM, Bloomberg L.P., Factset, Haver Analytics, as of January 2020.
(iii) Source: Bloomberg L.P. Size is measured by market capitalization.
(iv) Source: MSIM, Bloomberg L.P., Factset, Haver Analytics, as of January 2020. The analysis uses Fama-French cap-weighted largest and smallest size deciles.
4
Morgan Stanley Institutional Fund, Inc.
Annual Report — December 31, 2019
Investment Overview (unaudited) (cont'd)
Emerging Markets Small Cap Portfolio
• To invest in a world economy slowed by these factors, we think investors need to adjust downward their expectations of what is considered "fast" growth and focus on the most resilient and promising economies. For countries with average incomes under $5,000, we think that 5% is the new 7%; for those with income up to $15,000, 3% to 4% should be considered successful growth. With expectations thus recalibrated, we are focusing our portfolio on economies largely insulated against the "four Ds." This includes countries that still have growing populations (such as Vietnam, India and the Philippines) or strong domestic markets relatively immune to trade wars (India, Indonesia and Egypt).
• In our portfolio, we remain invested in good quality, growth-oriented companies capable of sustaining or expanding their earnings as a result of healthy or improving domestic demand and resistance to declines in global trade. Our aggregate sector overweights are in the consumer discretionary sector, including education, leisure and retail, as well as banks benefiting from increased digitization and media and entertainment companies — which we believe should benefit from the economic recovery and expansion phase that most EM countries only began to enter in the past couple years.

* Minimum Investment for Class I shares
** Commenced Operations on December 15, 2015.
In accordance with SEC regulations, the Fund's performance shown assumes that all recurring fees (including management fees) were deducted and all dividends and distributions were reinvested. The performance of Class A, C and IS shares will vary from the performance of Class I shares and will be negatively impacted by additional fees assessed to those classes (if applicable).
Performance Compared to the MSCI Emerging Markets Small Cap Net Index(1) and the Lipper Emerging Markets Funds Index(2)
| | | Period Ended December 31, 2019
Total Returns(3) | |
| | | | | Average Annual | |
| | | One
Year | | Five
Years | | Ten
Years | | Since
Inception(5) | |
Fund — Class I Shares
w/o sales charges(4) | | | 12.98 | % | | | — | | | | — | | | | 6.14 | % | |
Fund — Class A Shares
w/o sales charges(4) | | | 12.51 | | | | — | | | | — | | | | 5.73 | | |
Fund — Class A Shares with
maximum 5.25% sales charges(4) | | | 6.64 | | | | — | | | | — | | | | 4.34 | | |
Fund — Class C Shares
w/o sales charges(4) | | | 11.69 | | | | — | | | | — | | | | 4.94 | | |
Fund — Class C Shares with
maximum 1.00% deferred
sales charges(4) | | | 10.69 | | | | — | | | | — | | | | 4.94 | | |
Fund — Class IS Shares
w/o sales charges(4) | | | 12.93 | | | | — | | | | — | | | | 6.15 | | |
MSCI Emerging Markets
Small Cap Net Index | | | 11.50 | | | | — | | | | — | | | | 6.69 | | |
Lipper Emerging Markets
Funds Index | | | 21.13 | | | | — | | | | — | | | | 11.92 | | |
Performance data quoted represents past performance, which is no guarantee of future results, and current performance may be lower or higher than the figures shown. Performance assumes that all dividends and distributions, if any, were reinvested. For the most recent month-end performance figures, please visit www.morganstanley.com/im/shareholderreports. Investment return and principal value will fluctuate so that Fund shares, when redeemed, may be worth more or less than their original cost. Total returns do not reflect the deduction of taxes that a shareholder would pay on Fund distributions or the redemption of Fund shares. Performance of share classes will vary due to difference in sales charges and expenses.
(1) The MSCI Emerging Markets Small Cap Net Index is a free float-adjusted market capitalization weighted index that is designed to measure small cap equity market performance of emerging markets. The term "free float" represents the portion of shares outstanding that are deemed to be available for purchase in the public equity markets by investors. The performance of the Index is listed in U.S. dollars and assumes reinvestment of net dividends. Net total return indices reinvest dividends after the deduction of withholding taxes, using (for international indices) a tax rate applicable to non-resident institutional investors who do not benefit from double taxation treaties. The Index is unmanaged and its returns do not include any sales charges or fees. Such costs would lower performance. It is not possible to invest directly in an index.
(2) The Lipper Emerging Markets Funds Index is an equally weighted performance index of the largest qualifying funds (based on net assets) in the Lipper Emerging Markets Funds classification. The Index, which is adjusted for capital gains distributions and income dividends, is unmanaged and should not be considered an investment. There are currently 30 funds represented in this Index. As of the date of this report, the Fund was in the Lipper Emerging Markets Funds classification.
(3) Total returns for the Fund reflect fees waived and expenses reimbursed, if applicable, by the Adviser (as defined herein). Without such waivers and reimbursements, total returns would have been lower.
(4) Commenced operations on December 15, 2015.
(5) For comparative purposes, average annual since inception returns listed for the Indexes refer to the inception date of the Fund, not the inception of the Index.
5
Morgan Stanley Institutional Fund, Inc.
Annual Report — December 31, 2019
Portfolio of Investments
Emerging Markets Small Cap Portfolio
| | | Shares | | Value
(000) | |
Common Stocks (98.3%) | |
Brazil (8.7%) | |
Afya Ltd., Class A (a) | | | 38,165 | | | $ | 1,035 | | |
Banco ABC Brasil SA (Preference) | | | 203,893 | | | | 1,026 | | |
BK Brasil Operacao e Assessoria a
Restaurantes SA | | | 208,102 | | | | 923 | | |
Fleury SA | | | 108,903 | | | | 830 | | |
Odontoprev SA | | | 165,338 | | | | 695 | | |
TOTVS SA | | | 40,191 | | | | 646 | | |
YDUQS Part | | | 63,188 | | | | 750 | | |
| | | | 5,905 | | |
China (12.7%) | |
Baozun, Inc. ADR (a)(b) | | | 26,795 | | | | 888 | | |
Beijing Thunisoft Corp., Ltd., Class A | | | 184,254 | | | | 672 | | |
Chengdu Jiafaantai Education Technology Co., Ltd. | | | 23,700 | | | | 100 | | |
China CYTS Tours Holding Co., Ltd., Class A | | | 381,140 | | | | 689 | | |
China Education Group Holdings Ltd. (c) | | | 608,000 | | | | 796 | | |
China Foods Ltd. (c) | | | 774,000 | | | | 299 | | |
China New Higher Education Group Ltd. (c) | | | 2,299,000 | | | | 894 | | |
DouYu International Holdings Ltd. ADR (a)(b) | | | 97,508 | | | | 826 | | |
Focused Photonics Hangzhou, Inc., Class A | | | 227,200 | | | | 545 | | |
Grandblue Environment Co., Ltd. | | | 40,100 | | | | 101 | | |
JNBY Design Ltd. (c) | | | 518,500 | | | | 696 | | |
Laobaixing Pharmacy Chain JSC, Class A | | | 80,700 | | | | 742 | | |
LexinFintech Holdings Ltd. ADR (a) | | | 52,337 | | | | 727 | | |
OneSmart International Education Group
Ltd. ADR (a) | | | 71,263 | | | | 475 | | |
Shenzhen Airport Co., Ltd., Class A | | | 68,100 | | | | 96 | | |
Zhejiang New Century Hotel Management
Co., Ltd. | | | 22,200 | | | | 44 | | |
| | | | 8,590 | | |
Egypt (2.3%) | |
Cleopatra Hospital (a) | | | 1,870,198 | | | | 678 | | |
Egyptian Financial Group-Hermes Holding Co. | | | 571,251 | | | | 596 | | |
Juhayna Food Industries | | | 531,265 | | | | 285 | | |
| | | | 1,559 | | |
India (16.6%) | |
Aarti Industries Ltd. | | | 62,095 | | | | 723 | | |
Bharat Forge Ltd. | | | 96,427 | | | | 653 | | |
Blue Star Ltd. | | | 82,002 | | | | 966 | | |
Cholamandalam Investment and Finance Co., Ltd. | | | 198,697 | | | | 850 | | |
CreditAccess Grameen Ltd. (a) | | | 86,846 | | | | 934 | | |
Dilip Buildcon Ltd. | | | 142,831 | | | | 806 | | |
Gujarat Gas Ltd. | | | 301,653 | | | | 1,004 | | |
Gulf Oil Lubricants India Ltd. | | | 66,926 | | | | 755 | | |
Inox Leisure Ltd. | | | 135,967 | | | | 728 | | |
L&T Finance Holdings Ltd. | | | 473,682 | | | | 787 | | |
Phoenix Mills Ltd. | | | 15,387 | | | | 179 | | |
PVR Ltd. | | | 33,678 | | | | 896 | | |
Sterlite Technologies Ltd. | | | 580,841 | | | | 965 | | |
TCI Express Ltd. | | | 87,726 | | | | 912 | | |
Westlife Development Ltd. (a) | | | 26,650 | | | | 128 | | |
| | | | 11,286 | | |
| | | Shares | | Value
(000) | |
Indonesia (5.1%) | |
Ace Hardware Indonesia Tbk PT | | | 6,333,000 | | | $ | 682 | | |
Bank Tabungan Negara Persero Tbk PT | | | 435,900 | | | | 67 | | |
Bank Tabungan Pensiunan Nasional Syariah
Tbk PT (a) | | | 2,325,200 | | | | 711 | | |
Digital Mediatama Maxima Tbk PT (a) | | | 34,010,700 | | | | 603 | | |
Map Aktif Adiperkasa PT (a) | | | 233,800 | | | | 89 | | |
Mitra Adiperkasa Tbk PT | | | 8,764,000 | | | | 666 | | |
Nippon Indosari Corpindo Tbk PT | | | 6,582,000 | | | | 616 | | |
| | | | 3,434 | | |
Kenya (1.1%) | |
KCB Group Ltd. | | | 1,365,170 | | | | 728 | | |
Korea, Republic of (15.8%) | |
AfreecaTV Co., Ltd. | | | 14,503 | | | | 863 | | |
BGF retail Co., Ltd. | | | 4,894 | | | | 716 | | |
BusinessOn Communication Co., Ltd. | | | 32,590 | | | | 398 | | |
Classys, Inc. | | | 66,229 | | | | 807 | | |
Dentium Co., Ltd. | | | 18,623 | | | | 866 | | |
Douzone Bizon Co., Ltd. | | | 13,717 | | | | 959 | | |
Ecopro BM Co., Ltd. | | | 22,106 | | | | 1,009 | | |
F&F Co., Ltd. | | | 8,332 | | | | 804 | | |
Hotel Shilla Co., Ltd. | | | 8,995 | | | | 703 | | |
Innocean Worldwide, Inc. | | | 14,435 | | | | 886 | | |
JYP Entertainment Corp. | | | 38,450 | | | | 800 | | |
Koh Young Technology, Inc. | | | 7,760 | | | | 707 | | |
MegaStudyEdu Co., Ltd. | | | 21,380 | | | | 768 | | |
SaraminHR Co., Ltd. | | | 16,817 | | | | 450 | | |
| | | | 10,736 | | |
Kuwait (0.6%) | |
Humansoft Holding Co. KSC | | | 40,840 | | | | 406 | | |
Malaysia (1.9%) | |
AEON Credit Service M Bhd | | | 189,200 | | | | 654 | | |
Bermaz Auto Bhd | | | 1,305,400 | | | | 670 | | |
| | | | 1,324 | | |
Mexico (1.5%) | |
Gentera SAB de CV | | | 775,127 | | | | 795 | | |
Unifin Financiera SAB de CV SOFOM ENR | | | 134,354 | | | | 220 | | |
| | | | 1,015 | | |
Pakistan (1.1%) | |
MCB Bank Ltd. | | | 547,764 | | | | 746 | | |
Philippines (3.8%) | |
MacroAsia Corp. | | | 1,704,650 | | | | 555 | | |
Puregold Price Club, Inc. | | | 832,000 | | | | 652 | | |
Security Bank Corp. | | | 188,230 | | | | 724 | | |
Wilcon Depot, Inc. | | | 1,796,000 | | | | 639 | | |
| | | | 2,570 | | |
Poland (1.0%) | |
Dino Polska SA (a) | | | 17,671 | | | | 671 | | |
Russia (1.5%) | |
HeadHunter Group PLC ADR (b) | | | 47,872 | | | | 1,027 | | |
The accompanying notes are an integral part of the financial statements.
6
Morgan Stanley Institutional Fund, Inc.
Annual Report — December 31, 2019
Portfolio of Investments (cont'd)
Emerging Markets Small Cap Portfolio
| | | Shares | | Value
(000) | |
Saudi Arabia (2.3%) | |
Leejam Sports Co., JSC | | | 32,347 | | | $ | 699 | | |
United Electronics Co. | | | 41,602 | | | | 831 | | |
| | | | 1,530 | | |
South Africa (2.0%) | |
Advtech Ltd. | | | 860,460 | | | | 663 | | |
Transaction Capital Ltd. | | | 471,750 | | | | 711 | | |
| | | | 1,374 | | |
Taiwan (15.0%) | |
ASPEED Technology, Inc. | | | 31,000 | | | | 992 | | |
Bizlink Holding, Inc. | | | 116,560 | | | | 877 | | |
Cub Elecparts, Inc. | | | 92,556 | | | | 770 | | |
King Slide Works Co., Ltd. | | | 63,000 | | | | 761 | | |
Merida Industry Co., Ltd. | | | 155,000 | | | | 913 | | |
Power Wind Health Industry, Inc. | | | 102,000 | | | | 682 | | |
Poya International Co., Ltd. | | | 67,492 | | | | 949 | | |
Sunny Friend Environmental Technology Co., Ltd. | | | 112,000 | | | | 874 | | |
Taiwan Hon Chuan Enterprise Co., Ltd. | | | 363,000 | | | | 751 | | |
Taiwan Paiho Ltd. | | | 373,000 | | | | 1,049 | | |
TCI Co., Ltd. | | | 73,072 | | | | 695 | | |
Vanguard International Semiconductor Corp. | | | 340,000 | | | | 899 | | |
| | | | 10,212 | | |
Thailand (2.1%) | |
Muangthai Capital PCL (Foreign Shares) | | | 331,000 | | | | 703 | | |
Plan B Media Pcl | | | 2,836,700 | | | | 719 | | |
| | | | 1,422 | | |
United Arab Emirates (1.2%) | |
Network International Holdings PLC (a) | | | 97,453 | | | | 828 | | |
Vietnam (2.0%) | |
Sai Gon Cargo Service Corp. | | | 123,720 | | | | 641 | | |
Vincom Retail JSC | | | 469,360 | | | | 688 | | |
| | | | 1,329 | | |
Total Common Stocks (Cost $61,196) | | | 66,692 | | |
| | | Shares | | Value
(000) | |
Short-Term Investment (2.4%) | |
Securities held as Collateral on Loaned Securities (2.4%) | |
Investment Company (2.4%) | |
Morgan Stanley Institutional Liquidity
Funds — Government Portfolio —
Institutional Class (See Note G)
(Cost $1,586) | | | 1,586,130 | | | $ | 1,586 | | |
Total Investments (100.7%) (Cost $62,782)
Including $1,943 of Securities Loaned (d)(e)(f) | | | 68,278 | | |
Liabilities in Excess of Other Assets (–0.7%) | | | (448 | ) | |
Net Assets (100.0%) | | $ | 67,830 | | |
Country assignments and aggregations are based generally on third party vendor classifications and information, and may be different from the assignments and aggregations under the policies set forth in the Fund's prospectus and/or statement of additional information relating to geographic classifications.
(a) Non-income producing security.
(b) All or a portion of this security was on loan at December 31, 2019.
(c) Security trades on the Hong Kong exchange.
(d) The approximate fair value and percentage of net assets, $21,678,000 and 32.0%, respectively, represent the securities that have been fair valued under the fair valuation policy for international investments as described in Note A-1 within the Notes to the Financial Statements.
(e) Securities are available for collateral in connection with open foreign currency forward exchange contract.
(f) At December 31, 2019, the aggregate cost for federal income tax purposes is approximately $62,868,000. The aggregate gross unrealized appreciation is approximately $9,355,000 and the aggregate gross unrealized depreciation is approximately $3,966,000, resulting in net unrealized appreciation of approximately $5,389,000.
ADR American Depositary Receipt.
Foreign Currency Forward Exchange Contract:
The Fund had the following foreign currency forward exchange contract open at December 31, 2019:
Counterparty | | Contracts to
Deliver
(000) | | In Exchange
For
(000) | | Delivery
Date | | Unrealized
Depreciation
(000) | |
UBS AG | | HKD | 28,018 | | | $ | 3,573 | | | 1/16/20 | | $ | (22 | ) | |
HKD — Hong Kong Dollar
Portfolio Composition*
Classification | | Percentage of
Total Investments | |
Other** | | | 71.5 | % | |
Diversified Consumer Services | | | 8.7 | | |
Consumer Finance | | | 8.4 | | |
Banks | | | 6.0 | | |
Specialty Retail | | | 5.4 | | |
Total Investments | | | 100.0 | %*** | |
* Percentages indicated are based upon total investments (excluding Securities held as Collateral on Loaned Securities) as of December 31, 2019.
** Industries and/or investment types representing less than 5% of total investments.
*** Does not include an open foreign currency forward exchange contract with unrealized depreciation of $22,000.
The accompanying notes are an integral part of the financial statements.
7
Morgan Stanley Institutional Fund, Inc.
Annual Report — December 31, 2019
Emerging Markets Small Cap Portfolio
Statement of Assets and Liabilities | | December 31, 2019
(000) | |
Assets: | |
Investments in Securities of Unaffiliated Issuers, at Value(1) (Cost $61,196) | | $ | 66,692 | | |
Investment in Security of Affiliated Issuer, at Value (Cost $1,586) | | | 1,586 | | |
Total Investments in Securities, at Value (Cost $62,782) | | | 68,278 | | |
Foreign Currency, at Value (Cost $2,828) | | | 2,825 | | |
Receivable for Investments Sold | | | 2,880 | | |
Receivable for Fund Shares Sold | | | 97 | | |
Receivable from Securities Lending Income | | | 7 | | |
Dividends Receivable | | | 5 | | |
Receivable from Affiliate | | | 2 | | |
Tax Reclaim Receivable | | | — | @ | |
Other Assets | | | 43 | | |
Total Assets | | | 74,137 | | |
Liabilities: | |
Payable for Investments Purchased | | | 2,978 | | |
Collateral on Securities Loaned, at Value | | | 1,586 | | |
Bank Overdraft | | | 1,432 | | |
Deferred Capital Gain Country Tax | | | 105 | | |
Payable for Advisory Fees | | | 102 | | |
Payable for Professional Fees | | | 48 | | |
Unrealized Depreciation on Foreign Currency Forward Exchange Contract | | | 22 | | |
Payable for Custodian Fees | | | 11 | | |
Payable for Sub Transfer Agency Fees — Class I | | | 8 | | |
Payable for Sub Transfer Agency Fees — Class A | | | — | @ | |
Payable for Sub Transfer Agency Fees — Class C | | | — | @ | |
Payable for Administration Fees | | | 4 | | |
Payable for Transfer Agency Fees — Class I | | | 1 | | |
Payable for Transfer Agency Fees — Class A | | | — | @ | |
Payable for Transfer Agency Fees — Class C | | | — | @ | |
Payable for Transfer Agency Fees — Class IS | | | — | @ | |
Payable for Fund Shares Redeemed | | | 1 | | |
Payable for Shareholder Services Fees — Class A | | | — | @ | |
Payable for Distribution and Shareholder Services Fees — Class C | | | — | @ | |
Other Liabilities | | | 9 | | |
Total Liabilities | | | 6,307 | | |
Net Assets | | $ | 67,830 | | |
Net Assets Consist of: | |
Paid-in-Capital | | $ | 64,198 | | |
Total Distributable Earnings | | | 3,632 | | |
Net Assets | | $ | 67,830 | | |
The accompanying notes are an integral part of the financial statements.
8
Morgan Stanley Institutional Fund, Inc.
Annual Report — December 31, 2019
Emerging Markets Small Cap Portfolio
Statement of Assets and Liabilities (cont'd) | | December 31, 2019
(000) | |
CLASS I: | |
Net Assets | | $ | 59,335 | | |
| Shares Outstanding $0.001 par value shares of beneficial interest (unlimited shares authorized) (not in 000's) | | | 4,974,899 | | |
Net Asset Value, Offering and Redemption Price Per Share | | $ | 11.93 | | |
CLASS A: | |
Net Assets | | $ | 233 | | |
| Shares Outstanding $0.001 par value shares of beneficial interest (unlimited shares authorized) (not in 000's) | | | 19,690 | | |
Net Asset Value, Redemption Price Per Share | | $ | 11.83 | | |
Maximum Sales Load | | | 5.25 | % | |
Maximum Sales Charge | | $ | 0.66 | | |
Maximum Offering Price Per Share | | $ | 12.49 | | |
CLASS C: | |
Net Assets | | $ | 37 | | |
| Shares Outstanding $0.001 par value shares of beneficial interest (unlimited shares authorized) (not in 000's) | | | 3,227 | | |
Net Asset Value, Offering and Redemption Price Per Share | | $ | 11.56 | | |
CLASS IS: | |
Net Assets | | $ | 8,225 | | |
| Shares Outstanding $0.001 par value shares of beneficial interest (unlimited shares authorized) (not in 000's) | | | 689,259 | | |
Net Asset Value, Offering and Redemption Price Per Share | | $ | 11.93 | | |
(1) Including:
Securities on Loan, at Value: | | $ | 1,943 | | |
@ Amount is less than $500.
The accompanying notes are an integral part of the financial statements.
9
Morgan Stanley Institutional Fund, Inc.
Annual Report — December 31, 2019
Emerging Markets Small Cap Portfolio
Statement of Operations | | Year Ended
December 31, 2019
(000) | |
Investment Income: | |
Dividends from Securities of Unaffiliated Issuers (Net of $152 of Foreign Taxes Withheld) | | $ | 1,227 | | |
Income from Securities Loaned — Net | | | 51 | | |
Dividends from Security of Affiliated Issuer (Note G) | | | 23 | | |
Total Investment Income | | | 1,301 | | |
Expenses: | |
Advisory Fees (Note B) | | | 798 | | |
Professional Fees | | | 97 | | |
Custodian Fees (Note F) | | | 70 | | |
Registration Fees | | | 55 | | |
Administration Fees (Note C) | | | 51 | | |
Sub Transfer Agency Fees — Class I | | | 42 | | |
Sub Transfer Agency Fees — Class A | | | — | @ | |
Sub Transfer Agency Fees — Class C | | | — | @ | |
Shareholder Reporting Fees | | | 18 | | |
Transfer Agency Fees — Class I (Note E) | | | 3 | | |
Transfer Agency Fees — Class A (Note E) | | | 2 | | |
Transfer Agency Fees — Class C (Note E) | | | 2 | | |
Transfer Agency Fees — Class IS (Note E) | | | 2 | | |
Directors' Fees and Expenses | | | 6 | | |
Pricing Fees | | | 6 | | |
Shareholder Services Fees — Class A (Note D) | | | 1 | | |
Distribution and Shareholder Services Fees — Class C (Note D) | | | — | @ | |
Other Expenses | | | 17 | | |
Total Expenses | | | 1,170 | | |
Waiver of Advisory Fees (Note B) | | | (319 | ) | |
Reimbursement of Class Specific Expenses — Class I (Note B) | | | (17 | ) | |
Reimbursement of Class Specific Expenses — Class A (Note B) | | | (2 | ) | |
Reimbursement of Class Specific Expenses — Class C (Note B) | | | (2 | ) | |
Reimbursement of Class Specific Expenses — Class IS (Note B) | | | (2 | ) | |
Rebate from Morgan Stanley Affiliate (Note G) | | | (2 | ) | |
Net Expenses | | | 826 | | |
Net Investment Income | | | 475 | | |
Realized Gain (Loss): | |
Investments Sold (Net of $85 of Capital Gain Country Tax) | | | (321 | ) | |
Foreign Currency Forward Exchange Contracts | | | 22 | | |
Foreign Currency Translation | | | (64 | ) | |
Net Realized Loss | | | (363 | ) | |
Change in Unrealized Appreciation (Depreciation): | |
Investments (Net of Increase in Deferred Capital Gain Country Tax of $20) | | | 7,437 | | |
Foreign Currency Forward Exchange Contracts | | | (25 | ) | |
Foreign Currency Translation | | | (11 | ) | |
Net Change in Unrealized Appreciation (Depreciation) | | | 7,401 | | |
Net Realized Loss and Change in Unrealized Appreciation (Depreciation) | | | 7,038 | | |
Net Increase in Net Assets Resulting from Operations | | $ | 7,513 | | |
@ Amount is less than $500.
The accompanying notes are an integral part of the financial statements.
10
Morgan Stanley Institutional Fund, Inc.
Annual Report — December 31, 2019
Emerging Markets Small Cap Portfolio
Statements of Changes in Net Assets | | Year Ended
December 31, 2019
(000) | | Year Ended
December 31, 2018
(000) | |
Increase (Decrease) in Net Assets: | |
Operations: | |
Net Investment Income | | $ | 475 | | | $ | 54 | | |
Net Realized Loss | | | (363 | ) | | | (1,613 | ) | |
Net Change in Unrealized Appreciation (Depreciation) | | | 7,401 | | | | (6,836 | ) | |
Net Increase (Decrease) in Net Assets Resulting from Operations | | | 7,513 | | | | (8,395 | ) | |
Dividends and Distributions to Shareholders: | |
Class I | | | (276 | ) | | | (774 | ) | |
Class A | | | (— | @) | | | (3 | ) | |
Class C | | | — | | | | (1 | ) | |
Class IS | | | (42 | ) | | | (114 | ) | |
Total Dividends and Distributions to Shareholders | | | (318 | ) | | | (892 | ) | |
Capital Share Transactions:(1) | |
Class I: | |
Subscribed | | | 7,917 | | | | 35,038 | | |
Distributions Reinvested | | | 192 | | | | 203 | | |
Redeemed | | | (3,998 | ) | | | (3,753 | ) | |
Class A: | |
Subscribed | | | 85 | | | | 82 | | |
Distributions Reinvested | | | — | @ | | | 3 | | |
Redeemed | | | (59 | ) | | | (48 | ) | |
Class C: | |
Subscribed | | | — | | | | 17 | | |
Distributions Reinvested | | | — | | | | — | @ | |
Class IS: | |
Subscribed | | | — | | | | 8,100 | | |
Distributions Reinvested | | | 42 | | | | 114 | | |
Net Increase in Net Assets Resulting from Capital Share Transactions | | | 4,179 | | | | 39,756 | | |
Redemption Fees | | | — | @ | | | — | @ | |
Total Increase in Net Assets | | | 11,374 | | | | 30,469 | | |
Net Assets: | |
Beginning of Period | | | 56,456 | | | | 25,987 | | |
End of Period | | $ | 67,830 | | | $ | 56,456 | | |
(1) Capital Share Transactions: | |
Class I: | |
Shares Subscribed | | | 693 | | | | 2,938 | | |
Shares Issued on Distributions Reinvested | | | 16 | | | | 17 | | |
Shares Redeemed | | | (349 | ) | | | (357 | ) | |
Net Increase in Class I Shares Outstanding | | | 360 | | | | 2,598 | | |
Class A: | |
Shares Subscribed | | | 8 | | | | 6 | | |
Shares Issued on Distributions Reinvested | | | — | @@ | | | — | @@ | |
Shares Redeemed | | | (5 | ) | | | (4 | ) | |
Net Increase in Class A Shares Outstanding | | | 3 | | | | 2 | | |
Class C: | |
Shares Subscribed | | | — | | | | 1 | | |
Shares Issued on Distributions Reinvested | | | — | | | | — | @@ | |
Net Increase in Class C Shares Outstanding | | | — | | | | 1 | | |
Class IS: | |
Shares Subscribed | | | — | | | | 675 | | |
Shares Issued on Distributions Reinvested | | | 4 | | | | 10 | | |
Net Increase in Class IS Shares Outstanding | | | 4 | | | | 685 | | |
@ Amount is less than $500.
@@ Amount is less than 500 shares.
The accompanying notes are an integral part of the financial statements.
11
Morgan Stanley Institutional Fund, Inc.
Annual Report — December 31, 2019
Financial Highlights
Emerging Markets Small Cap Portfolio
| | | Class I | |
| | | Year Ended December 31, | | Period from
December 15, 2015(1) to | |
Selected Per Share Data and Ratios | | 2019 | | 2018 | | 2017 | | 2016 | | December 31, 2015 | |
Net Asset Value, Beginning of Period | | $ | 10.61 | | | $ | 12.77 | | | $ | 9.85 | | | $ | 10.28 | | | $ | 10.00 | | |
Income (Loss) from Investment Operations: | |
Net Investment Income (Loss)(2) | | | 0.09 | | | | 0.02 | | | | (0.01 | ) | | | 0.02 | | | | 0.01 | | |
Net Realized and Unrealized Gain (Loss) | | | 1.29 | | | | (2.01 | ) | | | 3.38 | | | | (0.35 | ) | | | 0.27 | | |
Total from Investment Operations | | | 1.38 | | | | (1.99 | ) | | | 3.37 | | | | (0.33 | ) | | | 0.28 | | |
Distributions from and/or in Excess of: | |
Net Investment Income | | | (0.06 | ) | | | — | | | | — | | | | (0.10 | ) | | | — | | |
Net Realized Gain | | | — | | | | (0.17 | ) | | | (0.45 | ) | | | — | | | | — | | |
Total Distributions | | | (0.06 | ) | | | (0.17 | ) | | | (0.45 | ) | | | (0.10 | ) | | | — | | |
Redemption Fees | | | 0.00 | (3) | | | 0.00 | (3) | | | — | | | | — | | | | — | | |
Net Asset Value, End of Period | | $ | 11.93 | | | $ | 10.61 | | | $ | 12.77 | | | $ | 9.85 | | | $ | 10.28 | | |
Total Return(4) | | | 12.98 | % | | | (15.73 | )% | | | 34.29 | % | | | (3.19 | )% | | | 2.80 | %(8) | |
Ratios to Average Net Assets and Supplemental Data: | |
Net Assets, End of Period (Thousands) | | $ | 59,335 | | | $ | 48,965 | | | $ | 25,762 | | | $ | 19,673 | | | $ | 20,536 | | |
Ratio of Expenses Before Expense Limitation | | | 1.83 | % | | | 2.18 | % | | | 2.58 | % | | | 2.63 | % | | | 7.62 | %(9) | |
Ratio of Expenses After Expense Limitation | | | 1.30 | %(5) | | | 1.41 | %(5)(6) | | | 1.57 | %(5) | | | 1.61 | %(5) | | | 1.58 | %(5)(9) | |
Ratio of Net Investment Income (Loss) | | | 0.74 | %(5) | | | 0.14 | %(5) | | | (0.09 | )%(5) | | | 0.16 | %(5) | | | 1.01 | %(5)(9) | |
Ratio of Rebate from Morgan Stanley Affiliates | | | 0.00 | %(7) | | | 0.01 | % | | | 0.04 | % | | | 0.00 | %(7) | | | 0.03 | %(9) | |
Portfolio Turnover Rate | | | 69 | % | | | 70 | % | | | 71 | % | | | 69 | % | | | 5 | %(8) | |
(1) Commencement of Operations.
(2) Per share amount is based on average shares outstanding.
(3) Amount is less than $0.005 per share.
(4) Calculated based on the net asset value as of the last business day of the period.
(5) The Ratio of Expenses After Expense Limitation and Ratio of Net Investment Income (Loss) reflect the rebate of certain Fund expenses in connection with the investments in Morgan Stanley affiliates during the period. The effect of the rebate on the ratios is disclosed in the above table as "Ratio of Rebate from Morgan Stanley Affiliates."
(6) Effective July 13, 2018, the Adviser has agreed to limit the ratio of expenses to average net assets to the maximum ratio of 1.30% for Class I shares. Prior to July 13, 2018, the maximum ratio was 1.65% for Class I shares.
(7) Amount is less than 0.005%.
(8) Not annualized.
(9) Annualized.
The accompanying notes are an integral part of the financial statements.
12
Morgan Stanley Institutional Fund, Inc.
Annual Report — December 31, 2019
Financial Highlights
Emerging Markets Small Cap Portfolio
| | | Class A | |
| | | Year Ended December 31, | | Period from
December 15, 2015(1) to | |
Selected Per Share Data and Ratios | | 2019 | | 2018 | | 2017 | | 2016 | | December 31, 2015 | |
Net Asset Value, Beginning of Period | | $ | 10.53 | | | $ | 12.72 | | | $ | 9.85 | | | $ | 10.28 | | | $ | 10.00 | | |
Income (Loss) from Investment Operations: | |
Net Investment Income (Loss)(2) | | | 0.05 | | | | (0.01 | ) | | | (0.06 | ) | | | (0.02 | ) | | | 0.00 | (3) | |
Net Realized and Unrealized Gain (Loss) | | | 1.27 | | | | (2.01 | ) | | | 3.38 | | | | (0.35 | ) | | | 0.28 | | |
Total from Investment Operations | | | 1.32 | | | | (2.02 | ) | | | 3.32 | | | | (0.37 | ) | | | 0.28 | | |
Distributions from and/or in Excess of: | |
Net Investment Income | | | (0.02 | ) | | | — | | | | — | | | | (0.06 | ) | | | — | | |
Net Realized Gain | | | — | | | | (0.17 | ) | | | (0.45 | ) | | | — | | | | — | | |
Total Distributions | | | (0.02 | ) | | | (0.17 | ) | | | (0.45 | ) | | | (0.06 | ) | | | — | | |
Redemption Fees | | | 0.00 | (3) | | | 0.00 | (3) | | | — | | | | — | | | | — | | |
Net Asset Value, End of Period | | $ | 11.83 | | | $ | 10.53 | | | $ | 12.72 | | | $ | 9.85 | | | $ | 10.28 | | |
Total Return(4) | | | 12.51 | % | | | (16.03 | )% | | | 33.79 | % | | | (3.58 | )% | | | 2.80 | %(8) | |
Ratios to Average Net Assets and Supplemental Data: | |
Net Assets, End of Period (Thousands) | | $ | 233 | | | $ | 179 | | | $ | 188 | | | $ | 10 | | | $ | 10 | | |
Ratio of Expenses Before Expense Limitation | | | 2.88 | % | | | 3.49 | % | | | 12.38 | % | | | 22.65 | % | | | 21.45 | %(9) | |
Ratio of Expenses After Expense Limitation | | | 1.65 | %(5) | | | 1.83 | %(5)(6) | | | 1.96 | %(5) | | | 2.00 | %(5) | | | 1.97 | %(5)(9) | |
Ratio of Net Investment Income (Loss) | | | 0.42 | %(5) | | | (0.11 | )%(5) | | | (0.50 | )%(5) | | | (0.22 | )%(5) | | | 0.62 | %(5)(9) | |
Ratio of Rebate from Morgan Stanley Affiliates | | | 0.00 | %(7) | | | 0.01 | % | | | 0.04 | % | | | 0.00 | %(7) | | | 0.03 | %(9) | |
Portfolio Turnover Rate | | | 69 | % | | | 70 | % | | | 71 | % | | | 69 | % | | | 5 | %(8) | |
(1) Commencement of Operations.
(2) Per share amount is based on average shares outstanding.
(3) Amount is less than $0.005 per share.
(4) Calculated based on the net asset value which does not reflect sales charges, if applicable, as of the last business day of the period.
(5) The Ratio of Expenses After Expense Limitation and Ratio of Net Investment Income (Loss) reflect the rebate of certain Fund expenses in connection with the investments in Morgan Stanley affiliates during the period. The effect of the rebate on the ratios is disclosed in the above table as "Ratio of Rebate from Morgan Stanley Affiliates."
(6) Effective July 13, 2018, the Adviser has agreed to limit the ratio of expenses to average net assets to the maximum ratio of 1.65% for Class A shares. Prior to July 13, 2018, the maximum ratio was 2.00% for Class A shares.
(7) Amount is less than 0.005%.
(8) Not annualized.
(9) Annualized.
The accompanying notes are an integral part of the financial statements.
13
Morgan Stanley Institutional Fund, Inc.
Annual Report — December 31, 2019
Financial Highlights
Emerging Markets Small Cap Portfolio
| | | Class C | |
| | | Year Ended December 31, | | Period from
December 15, 2015(1) to | |
Selected Per Share Data and Ratios | | 2019 | | 2018 | | 2017 | | 2016 | | December 31, 2015 | |
Net Asset Value, Beginning of Period | | $ | 10.35 | | | $ | 12.60 | | | $ | 9.84 | | | $ | 10.28 | | | $ | 10.00 | | |
Income (Loss) from Investment Operations: | |
Net Investment Loss(2) | | | (0.04 | ) | | | (0.10 | ) | | | (0.15 | ) | | | (0.10 | ) | | | (0.00 | )(3) | |
Net Realized and Unrealized Gain (Loss) | | | 1.25 | | | | (1.98 | ) | | | 3.36 | | | | (0.34 | ) | | | 0.28 | | |
Total from Investment Operations | | | 1.21 | | | | (2.08 | ) | | | 3.21 | | | | (0.44 | ) | | | 0.28 | | |
Distributions from and/or in Excess of: | |
Net Realized Gain | | | — | | | | (0.17 | ) | | | (0.45 | ) | | | — | | | | — | | |
Redemption Fees | | | 0.00 | (3) | | | 0.00 | (3) | | | — | | | | — | | | | — | | |
Net Asset Value, End of Period | | $ | 11.56 | | | $ | 10.35 | | | $ | 12.60 | | | $ | 9.84 | | | $ | 10.28 | | |
Total Return(4) | | | 11.69 | % | | | (16.66 | )% | | | 32.70 | % | | | (4.28 | )% | | | 2.80 | %(8) | |
Ratios to Average Net Assets and Supplemental Data: | |
Net Assets, End of Period (Thousands) | | $ | 37 | | | $ | 33 | | | $ | 24 | | | $ | 10 | | | $ | 10 | | |
Ratio of Expenses Before Expense Limitation | | | 8.37 | % | | | 9.02 | % | | | 20.48 | % | | | 23.48 | % | | | 22.20 | %(9) | |
Ratio of Expenses After Expense Limitation | | | 2.40 | %(5) | | | 2.58 | %(5)(6) | | | 2.71 | %(5) | | | 2.75 | %(5) | | | 2.73 | %(5)(9) | |
Ratio of Net Investment Loss | | | (0.36 | )%(5) | | | (0.84 | )%(5) | | | (1.27 | )%(5) | | | (0.99 | )%(5) | | | (0.14 | )%(5)(9) | |
Ratio of Rebate from Morgan Stanley Affiliates | | | 0.00 | %(7) | | | 0.01 | % | | | 0.04 | % | | | 0.00 | %(7) | | | 0.02 | %(9) | |
Portfolio Turnover Rate | | | 69 | % | | | 70 | % | | | 71 | % | | | 69 | % | | | 5 | %(8) | |
(1) Commencement of Operations.
(2) Per share amount is based on average shares outstanding.
(3) Amount is less than $0.005 per share.
(4) Calculated based on the net asset value which does not reflect sales charges, if applicable, as of the last business day of the period.
(5) The Ratio of Expenses After Expense Limitation and Ratio of Net Investment Loss reflect the rebate of certain Fund expenses in connection with the investments in Morgan Stanley affiliates during the period. The effect of the rebate on the ratios is disclosed in the above table as "Ratio of Rebate from Morgan Stanley Affiliates."
(6) Effective July 13, 2018, the Adviser has agreed to limit the ratio of expenses to average net assets to the maximum ratio of 2.40% for Class C shares. Prior to July 13, 2018, the maximum ratio was 2.75% for Class C shares.
(7) Amount is less than 0.005%.
(8) Not annualized.
(9) Annualized.
The accompanying notes are an integral part of the financial statements.
14
Morgan Stanley Institutional Fund, Inc.
Annual Report — December 31, 2019
Financial Highlights
Emerging Markets Small Cap Portfolio
| | | Class IS | |
| | | Year Ended December 31, | | Period from
December 15, 2015(1) to | |
Selected Per Share Data and Ratios | | 2019 | | 2018 | | 2017 | | 2016 | | December 31, 2015 | |
Net Asset Value, Beginning of Period | | $ | 10.62 | | | $ | 12.77 | | | $ | 9.85 | | | $ | 10.28 | | | $ | 10.00 | | |
Income (Loss) from Investment Operations: | |
Net Investment Income (Loss)(2) | | | 0.09 | | | | 0.00 | (3) | | | (0.01 | ) | | | 0.02 | | | | 0.01 | | |
Net Realized and Unrealized Gain (Loss) | | | 1.28 | | | | (1.98 | ) | | | 3.38 | | | | (0.35 | ) | | | 0.27 | | |
Total from Investment Operations | | | 1.37 | | | | (1.98 | ) | | | 3.37 | | | | (0.33 | ) | | | 0.28 | | |
Distributions from and/or in Excess of: | |
Net Investment Income | | | (0.06 | ) | | | — | | | | — | | | | (0.10 | ) | | | — | | |
Net Realized Gain | | | — | | | | (0.17 | ) | | | (0.45 | ) | | | — | | | | — | | |
Total Distributions | | | (0.06 | ) | | | (0.17 | ) | | | (0.45 | ) | | | (0.10 | ) | | | — | | |
Redemption Fees | | | 0.00 | (3) | | | 0.00 | (3) | | | — | | | | — | | | | — | | |
Net Asset Value, End of Period | | $ | 11.93 | | | $ | 10.62 | | | $ | 12.77 | | | $ | 9.85 | | | $ | 10.28 | | |
Total Return(4) | | | 12.93 | % | | | (15.65 | )% | | | 34.29 | % | | | (3.18 | )% | | | 2.80 | %(8) | |
Ratios to Average Net Assets and Supplemental Data: | |
Net Assets, End of Period (Thousands) | | $ | 8,225 | | | $ | 7,279 | | | $ | 13 | | | $ | 10 | | | $ | 10 | | |
Ratio of Expenses Before Expense Limitation | | | 1.78 | % | | | 2.10 | % | | | 19.47 | % | | | 21.37 | % | | | 21.20 | %(9) | |
Ratio of Expenses After Expense Limitation | | | 1.25 | %(5) | | | 1.26 | %(5)(6) | | | 1.55 | %(5) | | | 1.60 | %(5) | | | 1.58 | %(5)(9) | |
Ratio of Net Investment Income (Loss) | | | 0.79 | %(5) | | | 0.03 | %(5) | | | (0.08 | )%(5) | | | 0.16 | %(5) | | | 1.01 | %(5)(9) | |
Ratio of Rebate from Morgan Stanley Affiliates | | | 0.00 | %(7) | | | 0.01 | % | | | 0.05 | % | | | 0.00 | %(7) | | | 0.02 | %(9) | |
Portfolio Turnover Rate | | | 69 | % | | | 70 | % | | | 71 | % | | | 69 | % | | | 5 | %(8) | |
(1) Commencement of Operations.
(2) Per share amount is based on average shares outstanding.
(3) Amount is less than $0.005 per share.
(4) Calculated based on the net asset value as of the last business day of the period.
(5) The Ratio of Expenses After Expense Limitation and Ratio of Net Investment Income (Loss) reflect the rebate of certain Fund expenses in connection with the investments in Morgan Stanley affiliates during the period. The effect of the rebate on the ratios is disclosed in the above table as "Ratio of Rebate from Morgan Stanley Affiliates."
(6) Effective July 13, 2018, the Adviser has agreed to limit the ratio of expenses to average net assets to the maximum ratio of 1.25% for Class IS shares. Prior to July 13, 2018, the maximum ratio was 1.60% for Class IS shares.
(7) Amount is less than 0.005%.
(8) Not annualized.
(9) Annualized.
The accompanying notes are an integral part of the financial statements.
15
Morgan Stanley Institutional Fund, Inc.
Annual Report — December 31, 2019
Notes to Financial Statements
Morgan Stanley Institutional Fund, Inc. (the "Company") is registered under the Investment Company Act of 1940, as amended (the "Act"), as an open-end management investment company. The Company is comprised of thirty-two separate, active, diversified and non-diversified funds (individually referred to as a "Fund," collectively as the "Funds"). The Company applies investment company accounting and reporting guidance.
The accompanying financial statements relate to the Emerging Markets Small Cap Portfolio. The Fund seeks long-term capital appreciation.
The Fund offers four classes of shares — Class I, Class A, Class C and Class IS.
A. Significant Accounting Policies: The following significant accounting policies are in conformity with U.S. generally accepted accounting principles ("GAAP"). Such policies are consistently followed by the Company in the preparation of its financial statements. GAAP may require management to make estimates and assumptions that affect the reported amounts and disclosures in the financial statements. Actual results may differ from those estimates.
In August 2018, the Financial Accounting Standards Board ("FASB") issued Accounting Standards Update ("ASU") 2018-13, Fair Value Measurement (Topic 820) — Disclosures Framework — Changes to Disclosure Requirements of Fair Value Measurement ("ASU 2018-13") which introduces new fair value disclosure requirements as well as eliminates and modifies certain existing fair value disclosure requirements. ASU 2018-13 would be effective for fiscal years beginning after December 15, 2019 and for interim periods within those fiscal years; however, management has elected to early adopt ASU 2018-13 as permitted by the standard. The impact of the Fund's adoption was limited to changes in the Fund's financial statement disclosures regarding fair value, primarily those disclosures related to transfers between levels of the fair value hierarchy and disclosure of the range and weighted average used to develop significant unobservable inputs for Level 3 fair value measurements, when applicable.
1. Security Valuation: (1) An equity portfolio security listed or traded on an exchange is valued at its latest reported sales price (or at the exchange official closing price if such exchange reports an official closing price), and if there were no sales on a given day and if there is no official exchange closing price for that day, the security is valued at the mean between the last reported bid and asked prices
if such bid and asked prices are available on the relevant exchanges. If only bid prices are available then the latest bid price may be used. Listed equity securities not traded on the valuation date with no reported bid and asked prices available on the exchange are valued at the mean between the current bid and asked prices obtained from one or more reputable brokers or dealers. In cases where a security is traded on more than one exchange, the security is valued on the exchange designated as the primary market; (2) all other equity portfolio securities for which over-the-counter ("OTC") market quotations are readily available are valued at the latest reported sales price (or at the market official closing price if such market reports an official closing price), and if there was no trading in the security on a given day and if there is no official closing price from relevant markets for that day, the security is valued at the mean between the last reported bid and asked prices if such bid and asked prices are available on the relevant markets. An unlisted equity security that does not trade on the valuation date and for which bid and asked prices from the relevant markets are unavailable is valued at the mean between the current bid and asked prices obtained from one or more reputable brokers or dealers; (3) certain portfolio securities may be valued by an outside pricing service/vendor approved by the Company's Board of Directors (the "Directors"). The pricing service/vendor may employ a pricing model that takes into account, among other things, bids, yield spreads and/or other market data and specific security characteristics. Alternatively, if a valuation is not available from an outside pricing service/vendor, and the security trades on an exchange, the security may be valued at its latest reported sale price (or at the exchange official closing price if such exchange reports an official closing price), prior to the time when assets are valued. If there are no sales on a given day and if there is no official exchange closing price for that day, the security is valued at the mean between the last reported bid and asked prices if such bid and asked prices are available in the relevant exchanges. If Morgan Stanley Investment Management Inc. (the "Adviser"), a wholly-owned subsidiary of Morgan Stanley, determines that the price provided by the outside pricing service/vendor or exchange does not reflect the security's fair value or is unable to provide a price, prices from brokers or dealers may also be utilized. In these circumstances, the value of the security will be the mean of bid and asked prices obtained from brokers or dealers; (4) when market
16
Morgan Stanley Institutional Fund, Inc.
Annual Report — December 31, 2019
Notes to Financial Statements (cont'd)
quotations are not readily available, including circumstances under which the Adviser determines that the closing price, last sale price or the mean between the last reported bid and asked prices are not reflective of a security's market value, portfolio securities are valued at their fair value as determined in good faith under procedures established by and under the general supervision of the Directors. Occasionally, developments affecting the closing prices of securities and other assets may occur between the times at which valuations of such securities are determined (that is, close of the foreign market on which the securities trade) and the close of business of the New York Stock Exchange ("NYSE"). If developments occur during such periods that are expected to materially affect the value of such securities, such valuations may be adjusted to reflect the estimated fair value of such securities as of the close of the NYSE, as determined in good faith by the Directors or by the Adviser using a pricing service and/or procedures approved by the Directors; (5) quotations of foreign portfolio securities, other assets and liabilities and forward contracts stated in foreign currency are translated into U.S. dollar equivalents at the prevailing market rates prior to the close of the NYSE; and (6) investments in mutual funds, including the Morgan Stanley Institutional Liquidity Funds, are valued at the net asset value ("NAV") as of the close of each business day.
The Directors have responsibility for determining in good faith the fair value of the investments, and the Directors may appoint others, such as the Company's Adviser or a valuation committee, to assist the Directors in determining fair value and to make the actual calculations pursuant to the fair valuation methodologies previously approved by the Directors. Under procedures approved by the Directors, the Company's Adviser has formed a Valuation Committee whose members are approved by the Directors. The Valuation Committee provides administration and oversight of the Company's valuation policies and procedures, which are reviewed at least annually by the Directors. These procedures allow the Company to utilize independent pricing services, quotations from securities and financial instrument dealers and other market sources to determine fair value.
2. Fair Value Measurement: FASB Accounting Standards CodificationTM ("ASC") 820, "Fair Value
Measurement" ("ASC 820"), defines fair value as the value that the Fund would receive to sell an investment or pay to transfer a liability in a timely transaction with an independent buyer in the principal market, or in the absence of a principal market, the most advantageous market for the investment or liability. ASC 820 establishes a three-tier hierarchy to distinguish between (1) inputs that reflect the assumptions market participants would use in valuing an asset or liability developed based on market data obtained from sources independent of the reporting entity (observable inputs) and (2) inputs that reflect the reporting entity's own assumptions about the assumptions market participants would use in valuing an asset or liability developed based on the best information available in the circumstances (unobservable inputs) and to establish classification of fair value measurements for disclosure purposes. Various inputs are used in determining the value of the Fund's investments. The inputs are summarized in the three broad levels listed below:
• Level 1 – unadjusted quoted prices in active markets for identical investments
• Level 2 – other significant observable inputs (including quoted prices for similar investments, interest rates, prepayment speeds, credit risk, etc.)
• Level 3 – significant unobservable inputs including the Fund's own assumptions in determining the fair value of investments. Factors considered in making this determination may include, but are not limited to, information obtained by contacting the issuer, analysts, or the appropriate stock exchange (for exchange-traded securities), analysis of the issuer's financial statements or other available documents and, if necessary, available information concerning other securities in similar circumstances.
The inputs or methodology used for valuing securities are not necessarily an indication of the risk associated with investing in those securities and the determination of the significance of a particular input to the fair value measurement in its entirety requires judgment and considers factors specific to each security.
17
Morgan Stanley Institutional Fund, Inc.
Annual Report — December 31, 2019
Notes to Financial Statements (cont'd)
The following is a summary of the inputs used to value the Fund's investments as of December 31, 2019:
Investment Type | | Level 1
Unadjusted
quoted
prices
(000) | | Level 2
Other
significant
observable
inputs
(000) | | Level 3
Significant
unobservable
inputs
(000) | | Total
(000) | |
Assets: | |
Common Stocks | |
Air Freight & Logistics | | $ | 1,553 | | | $ | — | | | $ | — | | | $ | 1,553 | | |
Auto Components | | | 1,423 | | | | — | | | | — | | | | 1,423 | | |
Banks | | | 1,474 | | | | 2,528 | | | | — | | | | 4,002 | | |
Building Products | | | 966 | | | | — | | | | — | | | | 966 | | |
Capital Markets | | | 596 | | | | — | | | | — | | | | 596 | | |
Chemicals | | | 1,478 | | | | — | | | | — | | | | 1,478 | | |
Commercial Services &
Supplies | | | 1,419 | | | | — | | | | — | | | | 1,419 | | |
Communications
Equipment | | | 1,065 | | | | — | | | | — | | | | 1,065 | | |
Construction &
Engineering | | | 806 | | | | — | | | | — | | | | 806 | | |
Consumer Finance | | | 4,891 | | | | 703 | | | | — | | | | 5,594 | | |
Containers & Packaging | | | 751 | | | | — | | | | — | | | | 751 | | |
Diversified Consumer
Services | | | 4,269 | | | | 1,518 | | | | — | | | | 5,787 | | |
Diversified Financial
Services | | | 787 | | | | — | | | | — | | | | 787 | | |
Electrical Equipment | | | 877 | | | | 1,009 | | | | — | | | | 1,886 | | |
Entertainment | | | 2,450 | | | | 800 | | | | — | | | | 3,250 | | |
Food & Staples Retailing | | | 742 | | | | 2,039 | | | | — | | | | 2,781 | | |
Food Products | | | 584 | | | | 616 | | | | — | | | | 1,200 | | |
Gas Utilities | | | 1,004 | | | | — | | | | — | | | | 1,004 | | |
Health Care Equipment &
Supplies | | | — | | | | 1,673 | | | | — | | | | 1,673 | | |
Health Care Providers &
Services | | | 678 | | | | 1,525 | | | | — | | | | 2,203 | | |
Hotels, Restaurants &
Leisure | | | 2,242 | | | | 923 | | | | — | | | | 3,165 | | |
Information Technology
Services | | | 828 | | | | — | | | | — | | | | 828 | | |
Interactive Media &
Services | | | — | | | | 863 | | | | — | | | | 863 | | |
Internet & Direct
Marketing Retail | | | 888 | | | | — | | | | — | | | | 888 | | |
Leisure Products | | | 913 | | | | — | | | | — | | | | 913 | | |
Machinery | | | 761 | | | | — | | | | — | | | | 761 | | |
Media | | | — | | | | 1,605 | | | | — | | | | 1,605 | | |
Multi-Line Retail | | | 949 | | | | 666 | | | | — | | | | 1,615 | | |
Personal Products | | | 695 | | | | — | | | | — | | | | 695 | | |
Professional Services | | | 1,027 | | | | 450 | | | | — | | | | 1,477 | | |
Real Estate Management &
Development | | | 867 | | | | — | | | | — | | | | 867 | | |
Semiconductors &
Semiconductor
Equipment | | | 1,891 | | | | 707 | | | | — | | | | 2,598 | | |
Software | | | 1,275 | | | | 2,003 | | | | — | | | | 3,278 | | |
Specialty Retail | | | 1,501 | | | | 2,113 | | | | — | | | | 3,614 | | |
Textiles, Apparel &
Luxury Goods | | | 1,745 | | | | 804 | | | | — | | | | 2,549 | | |
Transportation
Infrastructure | | | 96 | | | | 555 | | | | — | | | | 651 | | |
Water Utilities | | | 101 | | | | — | | | | — | | | | 101 | | |
Total Common Stocks | | | 43,592 | | | | 23,100 | | | | — | | | | 66,692 | | |
Investment Type | | Level 1
Unadjusted
quoted
prices
(000) | | Level 2
Other
significant
observable
inputs
(000) | | Level 3
Significant
unobservable
inputs
(000) | | Total
(000) | |
Short-Term Investment | |
Investment Company | | $ | 1,586 | | | $ | — | | | $ | — | | | $ | 1,586 | | |
Total Assets | | | 45,178 | | | | 23,100 | | | | — | | | | 68,278 | | |
Liabilities: | |
Foreign Currency Forward
Exchange Contract | | | — | | | | (22 | ) | | | — | | | | (22 | ) | |
Total | | $ | 45,178 | | | $ | 23,078 | | | $ | — | | | $ | 68,256 | | |
Transfers between investment levels may occur as the markets fluctuate and/or the availability of data used in an investment's valuation changes.
3. Foreign Currency Translation and Foreign Investments: The books and records of the Fund are maintained in U.S. dollars. Foreign currency amounts are translated into U.S. dollars as follows:
– investments, other assets and liabilities at the prevailing rate of exchange on the valuation date;
– investment transactions and investment income at the prevailing rates of exchange on the dates of such transactions.
Although the net assets of the Fund are presented at the foreign exchange rates and market values at the close of the period, the Fund does not isolate that portion of the results of operations arising as a result of changes in the foreign exchange rates from the fluctuations arising from changes in the market prices of securities held at period end. Similarly, the Fund does not isolate the effect of changes in foreign exchange rates from the fluctuations arising from changes in the market prices of securities sold during the period. Accordingly, realized and unrealized foreign currency gains (losses) on investments in securities are included in the reported net realized and unrealized gains (losses) on investment transactions and balances. However, pursuant to U.S. federal income tax regulations, gains and losses from certain foreign currency transactions and the foreign currency portion of gains and losses realized on sales and maturities of foreign denominated debt securities are treated as ordinary income for U.S. federal income tax purposes.
Net realized gains (losses) on foreign currency transactions represent net foreign exchange gains (losses) from
18
Morgan Stanley Institutional Fund, Inc.
Annual Report — December 31, 2019
Notes to Financial Statements (cont'd)
foreign currency forward exchange contracts, disposition of foreign currencies, currency gains (losses) realized between the trade and settlement dates on securities transactions, and the difference between the amount of investment income and foreign withholding taxes recorded on the Fund's books and the U.S. dollar equivalent amounts actually received or paid. The change in unrealized currency gains (losses) on foreign currency transactions for the period is reflected in the Statement of Operations.
A significant portion of the Fund's net assets consist of securities of issuers located in emerging markets, which are denominated in foreign currencies. Such securities may be concentrated in a limited number of countries and regions and may vary throughout the year. Changes in currency exchange rates will affect the value of securities and investment income from foreign currency denominated securities. Emerging market securities are often subject to greater price volatility, limited capitalization and liquidity, and higher rates of inflation than securities of companies based in the U.S. In addition, emerging market issuers may be subject to substantial governmental involvement in the economy and greater social, economic and political uncertainty.
Governmental approval for foreign investments may be required in advance of making an investment under certain circumstances in some countries, and the extent of foreign investments in domestic companies may be subject to limitation in other countries. Foreign ownership limitations also may be imposed by the charters of individual companies to prevent, among other concerns, violations of foreign investment limitations. As a result, an additional class of shares (identified as "Foreign" in the Portfolio of Investments) may be created and offered for investment. The "local" and "foreign shares" market values may differ. In the absence of trading of the foreign shares in such markets, the Fund values the foreign shares at the closing exchange price of the local shares.
4. Derivatives: The Fund may, but is not required to, use derivative instruments for a variety of purposes, including hedging, risk management, portfolio management or to earn income. Derivatives are financial instruments whose value is based, in part, on the value of an underlying asset, interest rate, index or financial instrument. Prevailing interest rates and volatility levels, among other things, also affect the value of derivative instruments. A derivative
instrument often has risks similar to its underlying asset and may have additional risks, including imperfect correlation between the value of the derivative and the underlying asset, risks of default by the counterparty to certain transactions, magnification of losses incurred due to changes in the market value of the securities, instruments, indices or interest rates to which the derivative instrument relates, risks that the transactions may not be liquid and risks arising from margin requirements. The use of derivatives involves risks that are different from, and possibly greater than, the risks associated with other portfolio investments. Derivatives may involve the use of highly specialized instruments that require investment techniques and risk analyses different from those associated with other portfolio investments. All of the Fund's holdings, including derivative instruments, are marked-to-market each day with the change in value reflected in unrealized appreciation (depreciation). Upon disposition, a realized gain or loss is recognized.
Certain derivative transactions may give rise to a form of leverage. Leverage magnifies the potential for gain and the risk of loss. Leverage associated with derivative transactions may cause the Fund to liquidate portfolio positions when it may not be advantageous to do so to satisfy its obligations or to meet earmarking or segregation requirements, pursuant to applicable Securities and Exchange Commission ("SEC") rules and regulations, or may cause the Fund to be more volatile than if the Fund had not been leveraged. Although the Adviser seek to use derivatives to further the Fund's investment objectives, there is no assurance that the use of derivatives will achieve this result.
Following is a description of the derivative instruments and techniques that the Fund used during the period and their associated risks:
Foreign Currency Forward Exchange Contracts: In connection with its investments in foreign securities, the Fund also entered into contracts with banks, brokers or dealers to purchase or sell securities or foreign currencies at a future date. A foreign currency forward exchange contract ("currency contract") is a negotiated agreement between the contracting parties to exchange a specified amount of currency at a specified future time at a specified rate. The rate can be higher or lower than the spot rate between the currencies that are the subject of the contract. Currency contracts may be used to protect
19
Morgan Stanley Institutional Fund, Inc.
Annual Report — December 31, 2019
Notes to Financial Statements (cont'd)
against uncertainty in the level of future foreign currency exchange rates or to gain or modify exposure to a particular currency. To the extent hedged by the use of currency contracts, the precise matching of the currency contract amounts and the value of the securities involved will not generally be possible because the future value of such securities in foreign currencies will change as a consequence of market movements in the value of those securities between the date on which the contract is entered into and the date it matures. Furthermore, such transactions may reduce or preclude the opportunity for gain if the value of the currency should move in the direction opposite to the position taken. There is additional risk to the extent that currency contracts create exposure to currencies in which the Fund's securities are not denominated. Unanticipated changes in currency prices may result in poorer overall performance for the Fund than if it had not entered into such contracts. The use of currency contracts involves the risk of loss from the insolvency or bankruptcy of the counterparty to the contract or the failure of the counterparty to make payments or otherwise comply with the terms of the contract. A currency contract is marked-to-market daily and the change in market value is recorded by the Fund as unrealized gain or loss. The Fund records realized gains (losses) when the currency contract is closed equal to the difference between the value of the currency contract at the time it was opened and the value at the time it was closed.
FASB ASC 815, "Derivatives and Hedging" ("ASC 815"), is intended to improve financial reporting about derivative instruments by requiring enhanced disclosures to enable investors to better understand how and why the Fund uses derivative instruments, how these derivative instruments are accounted for and their effects on the Fund's financial position and results of operations.
The following table sets forth the fair value of the Fund's derivative contracts by primary risk exposure as of December 31, 2019:
| | | Liability Derivatives
Statement of Assets and
Liabilities Location | | Primary Risk
Exposure | | Value
(000) | |
Foreign Currency
Forward Exchange
Contract | | Unrealized Depreciation
on Foreign Currency
Forward Exchange Contract | |
Currency Risk | | $ | (22 | ) | |
The following tables set forth by primary risk exposure the Fund's change in unrealized appreciation (depreciation) by
type of derivative contract for the year ended December 31, 2019 in accordance with ASC 815:
Realized Gain (Loss) | |
Primary Risk Exposure | | Derivative Type | | Value
(000) | |
Currency Risk | | Foreign Currency
Forward Exchange Contract | | $ | 22 | | |
Change in Unrealized Appreciation (Depreciation) | |
Primary Risk Exposure | | Derivative Type | | Value
(000) | |
Currency Risk | | Foreign Currency
Forward Exchange Contract | | $ | (25 | ) | |
At December 31, 2019, the Fund's derivative assets and liabilities are as follows:
Gross Amounts of Assets and Liabilities
Presented in the Statement of Assets and Liabilities | |
Derivatives | | Assets(a)
(000) | | Liabilities(a)
(000) | |
Foreign Currency Forward
Exchange Contract | | $ | — | | | $ | (22 | ) | |
(a) Absent an event of default or early termination, OTC derivative assets and liabilities are presented gross and not offset in the Statement of Assets and Liabilities.
The Fund typically enters into International Swaps and Derivatives Association, Inc. Master Agreements ("ISDA Master Agreements") or similar master agreements (collectively, "Master Agreements") with its contract counterparties for certain OTC derivatives in order to, among other things, reduce its credit risk to counterparties. ISDA Master Agreements include provisions for general obligations, representations, collateral and events of default or termination. Under an ISDA Master Agreement, the Fund typically may offset with the counterparty certain OTC derivative financial instruments' payables and/or receivables with collateral held and/or posted and create one single net payment (close-out netting) in the event of default, termination and/or potential deterioration in the credit quality of the counterparty. Various Master Agreements govern the terms of certain transactions with counterparties, including transactions such as swap, forward, repurchase and reverse repurchase agreements. These Master Agreements typically attempt to reduce the counterparty risk associated with such transactions by specifying credit protection mechanisms and providing standardization that improves legal certainty. Cross-termination provisions under Master Agreements typically provide that a default in connection with one transaction between the Fund and a counterparty gives the non-defaulting party the right to terminate any other transactions in place with the defaulting party to create one single net payment due to/due from the defaulting party and may be a feature in
20
Morgan Stanley Institutional Fund, Inc.
Annual Report — December 31, 2019
Notes to Financial Statements (cont'd)
certain Master Agreements. In the event the Fund exercises its right to terminate a Master Agreement after a counterparty experiences a termination event as defined in the Master Agreement, the return of collateral with market value in excess of the Fund's net liability may be delayed or denied.
The following table presents derivative financial instruments that are subject to enforceable netting arrangements as of December 31, 2019:
Gross Amounts Not Offset in the Statement of Assets and Liabilities | |
Counterparty | | Gross Liability
Derivatives
Presented in
the Statement of
Assets and
Liabilities
(000) | | Financial
Instrument
(000) | | Collateral
Received
(000) | | Net Amount
(not less
than $0)
(000) | |
UBS AG | | $ | 22 | | | $ | — | | | $ | — | | | $ | 22 | | |
For the year ended December 31, 2019, the approximate average monthly amount outstanding for each derivative type is as follows:
Foreign Currency Forward Exchange Contracts: | |
Average monthly principal amount | | $ | 2,992,000 | | |
5. Securities Lending: The Fund lends securities to qualified financial institutions, such as broker-dealers, to earn additional income. Any increase or decrease in the fair value of the securities loaned that might occur and any interest earned or dividends declared on those securities during the term of the loan would remain in the Fund. The Fund would receive cash or securities as collateral in an amount equal to or exceeding 100% of the current fair value of the loaned securities. The collateral is marked-to-market daily by State Street Bank and Trust Company ("State Street"), the securities lending agent, to ensure that a minimum of 100% collateral coverage is maintained.
Based on pre-established guidelines, the securities lending agent invests any cash collateral that is received in an affiliated money market portfolio and repurchase agreements. Securities lending income is generated from the earnings on the invested collateral and borrowing fees, less any rebates owed to the borrowers and compensation to the lending agent, and is recorded as "Income from Securities Loaned — Net" in the Fund's Statement of Operations. Risks in securities lending transactions are that a borrower may not provide additional collateral when required or return the securities when due, and that the value of the short-term investments will be less
than the amount of cash collateral plus any rebate that is required to be returned to the borrower.
The Fund has the right under the securities lending agreement to recover the securities from the borrower on demand.
The following table presents financial instruments that are subject to enforceable netting arrangements as of December 31, 2019:
Gross Amounts Not Offset in the Statement of Assets and Liabilities | |
Gross Asset
Amounts
Presented in
the Statement
of Assets and
Liabilities
(000) | | Financial
Instrument
(000) | | Collateral
Received
(000) | | Net Amount
(not less
than $0)
(000) | |
| $ | 1,943 | (b) | | $ | — | | | $ | (1,943 | )(c)(d) | | $ | 0 | | |
(b) Represents market value of loaned securities at year end.
(c) The Fund received cash collateral of approximately $1,586,000 which was subsequently invested in Morgan Stanley Institutional Liquidity Funds as reported in the Portfolio of Investments. In addition, the Fund received non-cash collateral of approximately $393,000 in the form of U.S. Government obligations, which the Fund cannot sell or repledge, and accordingly are not reflected in the Portfolio of Investments.
(d) The actual collateral received is greater than the amount shown here due to overcollateralization.
FASB ASC 860, "Transfers & Servicing: Repurchase-to- Maturity Transactions, Repurchase Financings, and Disclosures", is intended to provide increased transparency about the types of collateral pledged in securities lending transactions and other similar transactions that are accounted for as secured borrowing.
The following table displays a breakdown of transactions accounted for as secured borrowings, the gross obligations by class of collateral pledged and the remaining contractual maturity of those transactions as of December 31, 2019:
Remaining Contractual Maturity of the Agreements | |
| | | Overnight and
Continuous
(000) | | <30 days
(000) | | Between
30 &
90 days
(000) | | >90 days
(000) | | Total
(000) | |
Securities Lending
Transactions | |
Common Stocks | | $ | 1,586 | | | $ | — | | | $ | — | | | $ | — | | | $ | 1,586 | | |
Total Borrowings | | $ | 1,586 | | | $ | — | | | $ | — | | | $ | — | | | $ | 1,586 | | |
Gross amount of
recognized liabilities
for securities lending
transactions | | | | | | | | | | $ | 1,586 | | |
21
Morgan Stanley Institutional Fund, Inc.
Annual Report — December 31, 2019
Notes to Financial Statements (cont'd)
6. Redemption Fees: The Fund will assess a 2% redemption fee, on Class I shares, Class A shares, Class C shares and Class IS shares, which is paid directly to the Fund, for shares redeemed or exchanged within thirty days of purchase, subject to certain exceptions. The redemption fee is designed to protect the Fund and its remaining shareholders from the effects of short-term trading. These fees, if any, are included in the Statements of Changes in Net Assets.
7. Indemnifications: The Company enters into contracts that contain a variety of indemnifications. The Company's maximum exposure under these arrangements is unknown. However, the Company has not had prior claims or losses pursuant to these contracts and expects the risk of loss to be remote.
8. Dividends and Distributions to Shareholders: Dividends and distributions to shareholders are recorded on the ex-dividend date. Dividends from net investment income, if any, are declared and paid annually. Net realized capital gains, if any, are distributed at least annually.
9. Security Transactions, Income and Expenses: Security transactions are accounted for on the trade date (date the order to buy or sell is executed). Realized gains and losses on the sale of investment securities are determined on the specific identified cost method. Dividend income and other distributions are recorded on the ex-dividend date (except for certain foreign dividends which may be recorded as soon as the Fund is informed of such dividends) net of applicable withholding taxes. Interest income is recognized on the accrual basis except where collection is in doubt. Discounts are accreted and premiums are amortized over the life of the respective securities. Most expenses of the Company can be directly attributed to a particular Fund. Expenses which cannot be directly attributed are apportioned among the Funds based upon relative net assets or other appropriate methods. Income, expenses (other than class specific expenses — distribution and shareholder services, transfer agency and sub transfer agency fees) and realized and unrealized gains or losses are allocated to each class of shares based upon their relative net assets.
B. Advisory Fees: The Adviser, a wholly-owned subsidiary of Morgan Stanley, provides the Fund with advisory services under the terms of an Investment Advisory Agreement, paid quarterly, at an annual rate of 1.25% of the average daily net assets of the Fund.
The Adviser has agreed to reduce its advisory fee and/or reimburse the Fund so that total annual Fund operating expenses, excluding certain investment related expenses, taxes, interest and other extraordinary expenses (including litigation), will not exceed 1.30% Class I shares, 1.65% for Class A shares, 2.40% for Class C shares and 1.25% for Class IS shares. The fee waivers and/or expense reimbursements will continue for at least one year from the date of the Fund's prospectus or until such time as the Directors act to discontinue all or a portion of such waivers and/or reimbursements when they deem such action is appropriate. For the year ended December 31, 2019, approximately $319,000 of advisory fees were waived and approximately $23,000 of other expenses were reimbursed by the Adviser pursuant to this arrangement.
C. Administration Fees: The Adviser also serves as Administrator to the Company and provides administrative services pursuant to an Administration Agreement for an annual fee, accrued daily and paid monthly, of 0.08% of the Fund's average daily net assets.
Under a Sub-Administration Agreement between the Administrator and State Street, State Street provides certain administrative services to the Company. For such services, the Administrator pays State Street a portion of the fee the Administrator receives from the Fund.
D. Distribution and Shareholder Services Fees: Morgan Stanley Distribution, Inc. ("MSDI" or the "Distributor"), a wholly-owned subsidiary of the Adviser and an indirect subsidiary of Morgan Stanley, serves as the Company's Distributor of Fund shares pursuant to a Distribution Agreement. The Company has adopted a Shareholder Services Plan with respect to Class A shares pursuant to Rule 12b-1 under the Act. Under the Shareholder Services Plan, the Fund pays the Distributor a shareholder services fee, accrued daily and paid monthly, at an annual rate of 0.25% of the Fund's average daily net assets attributable to Class A shares.
The Company has adopted a Distribution and Shareholder Services Plan with respect to Class C shares pursuant to Rule 12b-1 under the Act. Under the Distribution and Shareholder Services Plan, the Fund pays the Distributor a distribution fee, accrued daily and paid monthly, at an annual rate of 0.75% and a shareholder services fee, accrued daily and paid monthly, at an annual rate of 0.25% of the Fund's average daily net assets attributable to Class C shares.
22
Morgan Stanley Institutional Fund, Inc.
Annual Report — December 31, 2019
Notes to Financial Statements (cont'd)
The distribution and shareholder services fees are used to support the expenses associated with servicing and maintaining accounts. The Distributor may compensate other parties for providing shareholder support services to investors who purchase Class A and Class C shares.
E. Dividend Disbursing and Transfer Agent: The Company's dividend disbursing and transfer agent is DST Asset Manager Solutions, Inc. ("DST"). Pursuant to a Transfer Agency Agreement, the Company pays DST a fee based on the number of classes, accounts and transactions relating to the Funds of the Company.
F. Custodian Fees: State Street (the "Custodian") also serves as Custodian for the Company in accordance with a Custodian Agreement. The Custodian holds cash, securities and other assets of the Company as required by the Act. Custody fees are payable monthly based on assets held in custody, investment purchases and sales activity and account maintenance fees, plus reimbursement for certain out-of-pocket expenses.
G. Security Transactions and Transactions with Affiliates: For the year ended December 31, 2019, purchases and sales of investment securities for the Fund, other than long-term U.S. Government securities and short-term investments were approximately $46,984,000 and $43,467,000, respectively. There were no purchases and sales of long-term U.S. Government securities for the year ended December 31, 2019.
The Fund invests in the Institutional Class of the Morgan Stanley Institutional Liquidity Funds — Government Portfolio (the "Liquidity Funds"), an open-end management investment company managed by the Adviser, both directly and as a portion of the securities held as collateral on loaned securities. Advisory fees paid by the Fund are reduced by an amount equal to its pro-rata share of the advisory and administration fees paid by the Fund due to its investment in the Liquidity Funds. For the year ended December 31, 2019, advisory fees paid were reduced by approximately $2,000 relating to the Fund's investment in the Liquidity Funds.
A summary of the Fund's transactions in shares of affiliated investments during the year ended December 31, 2019 is as follows:
Affiliated
Investment
Company | | Value
December 31,
2018
(000) | | Purchases
at Cost
(000) | | Proceeds
from Sales
(000) | | Dividend
Income
(000) | |
Liquidity Funds | | $ | 1,517 | | | $ | 22,845 | | | $ | 22,776 | | | $ | 23 | | |
Affiliated
Investment
Company (cont'd) | | Realized
Gain (Loss)
(000) | | Change in
Unrealized
Appreciation
(Depreciation)
(000) | | Value
December 31,
2019
(000) | |
Liquidity Funds | | $ | — | | | $ | — | | | $ | 1,586 | | |
The Fund is permitted to purchase and sell securities ("cross-trade") from and to other Morgan Stanley funds as well as other funds and client accounts for which the Adviser or an affiliate of the Adviser serves as investment adviser, pursuant to procedures approved by the Directors in compliance with Rule 17a-7 under the Act (the "Rule"). Each cross-trade is executed at the current market price in compliance with provisions of the Rule. For the year ended December 31, 2019, the Fund did not engage in any cross-trade transactions.
The Fund has an unfunded Deferred Compensation Plan (the "Compensation Plan"), which allows each independent Director to defer payment of all, or a portion, of the fees he or she receives for serving on the Board of Directors. Each eligible Director generally may elect to have the deferred amounts credited with a return equal to the total return on one or more of the Morgan Stanley funds that are offered as investment options under the Compensation Plan. Appreciation/depreciation and distributions received from these investments are recorded with an offsetting increase/decrease in the deferred compensation obligation and do not affect the NAV of the Fund.
H. Federal Income Taxes: It is the Fund's intention to continue to qualify as a regulated investment company and distribute all of its taxable and tax-exempt income. Accordingly, no provision for federal income taxes is required in the financial statements.
The Fund may be subject to taxes imposed by countries in which it invests. Such taxes are generally based on income and/or capital gains earned or repatriated. Taxes are accrued based on net investment income, net realized gains and net unrealized appreciation as such income and/or gains are earned. Taxes may also be based on transactions in foreign currency and are accrued based on the value of investments denominated in such currency.
FASB ASC 740-10, "Income Taxes — Overall", sets forth a minimum threshold for financial statement recognition of the benefit of a tax position taken or expected to be taken in a tax return. Management has concluded there are no significant uncertain tax positions that would require recognition in the financial statements. If applicable, the Fund recognizes interest accrued related to unrecognized tax benefits in "Interest
23
Morgan Stanley Institutional Fund, Inc.
Annual Report — December 31, 2019
Notes to Financial Statements (cont'd)
Expense" and penalties in "Other Expenses" in the Statement of Operations. The Fund files tax returns with the U.S. Internal Revenue Service, New York and various states. Generally, each of the tax years in the four-year period ended December 31, 2019 remains subject to examination by taxing authorities.
The tax character of distributions paid may differ from the character of distributions shown for GAAP purposes due to short-term capital gains being treated as ordinary income for tax purposes. The tax character of distributions paid during fiscal years 2019 and 2018 was as follows:
2019
Distributions
Paid From: | | 2018
Distributions
Paid From: | |
Ordinary
Income
(000) | | Long-Term
Capital Gain
(000) | | Ordinary
Income
(000) | | Long-Term
Capital Gain
(000) | |
| $ | 318 | | | $ | — | | | $ | — | | | $ | 892 | | |
The amount and character of income and gains to be distributed are determined in accordance with income tax regulations which may differ from GAAP. These book/tax differences are either considered temporary or permanent in nature.
Temporary differences are attributable to differing book and tax treatments for the timing of the recognition of gains (losses) on certain investment transactions and the timing of the deductibility of certain expenses.
The Fund had no permanent differences causing reclassifications among the components of net assets for the year ended December 31, 2019.
At December 31, 2019, the components of distributable earnings for the Fund on a tax basis were as follows:
Undistributed
Ordinary
Income
(000) | | Undistributed
Long-Term
Capital Gain
(000) | |
| $ | 12 | | | $ | — | | |
At December 31, 2019, the Fund had available for federal income tax purposes unused short-term capital losses of approximately $1,650,000 that do not have an expiration date.
To the extent that capital loss carryforwards are used to offset any future capital gains realized, no capital gains tax liability will be incurred by the Fund for gains realized and not distributed. To the extent that capital gains are offset, such gains will not be distributed to the shareholders.
I. Credit Facility: The Company and other Morgan Stanley funds participated in a $150,000,000 committed, unsecured
revolving line of credit facility (the "Facility") with State Street. Effective April 22, 2019, the committed line amount increased to $300,000,000. This Facility is to be used for temporary emergency purposes or funding of shareholder redemption requests. The interest rate on borrowings is based on the federal funds rate or 1 month LIBOR rate plus a spread. The Facility also has a commitment fee of 0.25% per annum based on the unused portion of the Facility. During the year ended December 31, 2019, the Fund did not have any borrowings under the Facility.
J. Other: At December 31, 2019, the Fund had record owners of 10% or greater. Investment activities of these shareholders could have a material impact on the Fund. The aggregate percentage of such owners was 60.1%.
24
Morgan Stanley Institutional Fund, Inc.
Annual Report — December 31, 2019
Report of Independent Registered Public Accounting Firm
To the Shareholders and Board of Directors of
Morgan Stanley Institutional Fund, Inc. —
Emerging Markets Small Cap Portfolio
Opinion on the Financial Statements
We have audited the accompanying statement of assets and liabilities of Emerging Markets Small Cap Portfolio (the "Fund") (one of the funds constituting Morgan Stanley Institutional Fund, Inc. (the "Company")), including the portfolio of investments, as of December 31, 2019, and the related statement of operations for the year then ended, the statements of changes in net assets for each of the two years in the period then ended, the financial highlights for each of the four years in the period then ended and the period from December 15, 2015 (commencement of operations) through December 31, 2015 and the related notes (collectively referred to as the "financial statements"). In our opinion, the financial statements present fairly, in all material respects, the financial position of Emerging Markets Small Cap Portfolio (one of the funds constituting Morgan Stanley Institutional Fund, Inc.) at December 31, 2019, the results of its operations for the year then ended, the changes in its net assets for each of the two years in the period then ended and its financial highlights for each of the four years in the period then ended and the period from December 15, 2015 (commencement of operations) through December 31, 2015, in conformity with U.S. generally accepted accounting principles.
Basis for Opinion
These financial statements are the responsibility of the Company's management. Our responsibility is to express an opinion on the Fund's financial statements based on our audits. We are a public accounting firm registered with the Public Company Accounting Oversight Board (United States) ("PCAOB") and are required to be independent with respect to the Company in accordance with the U.S. federal securities law and the applicable rules and regulations of the Securities and Exchange Commission and the PCAOB.
We conducted our audits in accordance with the standards of the PCAOB. Those standards require that we plan and perform the audit to obtain reasonable assurance about whether the financial statements are free of material misstatement, whether due to error or fraud. The Company is not required to have, nor were we engaged to perform, an audit of the Company's internal control over financial reporting. As part of our audits, we are required to obtain an understanding of internal control over financial reporting, but not for the purpose of expressing an opinion on the effectiveness of the Company's internal control over financial reporting. Accordingly, we express no such opinion.
Our audits included performing procedures to assess the risks of material misstatement of the financial statements, whether due to error or fraud, and performing procedures that respond to those risks. Such procedures included examining, on a test basis, evidence regarding the amounts and disclosures in the financial statements. Our procedures included confirmation of securities owned as of December 31, 2019 by correspondence with the custodian and others or by other appropriate auditing procedures where replies from others were not received. Our audits also included evaluating the accounting principles used and significant estimates made by management, as well as evaluating the overall presentation of the financial statements. We believe that our audits provide a reasonable basis for our opinion.

We have served as the auditor of one or more Morgan Stanley investment companies since 2000.
Boston, Massachusetts
February 27, 2020
25
Morgan Stanley Institutional Fund, Inc.
Annual Report — December 31, 2019
Federal Tax Notice (unaudited)
For federal income tax purposes, the following information is furnished with respect to the Fund's earnings for its taxable year ended December 31, 2019. When distributed, certain earnings may be subject to a maximum tax rate of 15% as provided for by the Jobs and Growth Tax Relief Reconciliation Act of 2003. The Fund designated up to a maximum of approximately $463,000 as taxable at this lower rate.
The Fund intends to pass through foreign tax credits of approximately $144,000 and has derived net income from sources within foreign countries amounting to approximately $1,379,000.
In January, the Fund provides tax information to shareholders for the preceding calendar year.
26
Privacy Notice (unaudited) April 2019
FACTS | | WHAT DOES MSIM DO WITH YOUR PERSONAL INFORMATION? | |
Why? | | Financial companies choose how they share your personal information. Federal law gives consumers the right to limit some but not all sharing. Federal law also requires us to tell you how we collect, share, and protect your personal information. Please read this notice carefully to understand what we do. | |
What? | | The types of personal information we collect and share depend on the product or service you have with us. This information can include:
n Social Security number and income
n investment experience and risk tolerance
n checking account number and wire transfer instructions | |
How? | | All financial companies need to share customers' personal information to run their everyday business. In the section below, we list the reasons financial companies can share their customers' personal information; the reasons MSIM chooses to share; and whether you can limit this sharing. | |
Reasons we can share your personal information | | Does MSIM share? | | Can you limit this sharing? | |
For our everyday business purposes —
such as to process your transactions, maintain your account(s), respond to court orders and legal investigations, or report to credit bureaus | | Yes | | No | |
For our marketing purposes —
to offer our products and services to you | | Yes | | No | |
For joint marketing with other financial companies | | No | | We don't share | |
For our affiliates' everyday business purposes —
information about your transactions and experiences | | Yes | | No | |
For our affiliates' everyday business purposes —
information about your creditworthiness | | No | | We don't share | |
For our affiliates to market to you | | No | | We don't share | |
For non-affiliates to market to you | | No | | We don't share | |
Questions?
Call toll-free (844) 312-6327 or email: imprivacyinquiries@morganstanley.com
27
Privacy Notice (unaudited) (cont'd) April 2019
Who we are
Who is providing this notice? | | Morgan Stanley Investment Management, Inc. and its affiliated registered investment advisers, registered broker-dealers, and registered and unregistered funds ("MSIM") | |
What we do
How does MSIM protect my personal information? | | To protect your personal information from unauthorized access and use, we use security measures that comply with federal law. These measures include computer safeguards and secured files and buildings. We have policies governing the proper handling of customer information by personnel and requiring third parties that provide support to adhere to appropriate security standards with respect to such information. | |
How does MSIM collect my personal information? | | We collect your personal information, for example, when you
n open an account or make deposits or withdrawals from your account
n buy securities from us or make a wire transfer
n give us your contact information
We also collect your personal information from others, such as credit bureaus, affiliates, or other companies. | |
Why can't I limit all sharing? | | Federal law gives you the right to limit only
n sharing for affiliates' everyday business purposes — information about your creditworthiness
n affiliates from using your information to market to you
n sharing for non-affiliates to market to you
State laws and individual companies may give you additional rights to limit sharing. See below for more on your rights under state law. | |
Definitions
Affiliates | | Companies related by common ownership or control. They can be financial and non-financial companies.
n Our affiliates include companies with a Morgan Stanley name and financial companies such as Morgan Stanley Smith Barney LLC and Morgan Stanley & Co. | |
Non-affiliates | | Companies not related by common ownership or control. They can be financial and non-financial companies.
n MSIM does not share with non-affiliates so they can market to you. | |
Joint marketing | | A formal agreement between non-affiliated financial companies that together market financial products or services to you.
n MSIM doesn't jointly market | |
Other important information
Vermont: Except as permitted by law, we will not share personal information we collect about Vermont residents with Non-affiliates unless you provide us with your written consent to share such information.
California: Except as permitted by law, we will not share personal information we collect about California residents with Non-affiliates and we will limit sharing such personal information with our Affiliates to comply with California privacy laws that apply to us.
28
Morgan Stanley Institutional Fund, Inc.
Annual Report — December 31, 2019
Director and Officer Information (unaudited)
Independent Directors:
Name, Birth Year
and Address of
Independent Director | | Position(s)
Held with
Registrant | | Length of Time
Served* | | Principal Occupation(s) During Past 5 Years
and Other Relevant Professional Experience | | Number of
Funds in Fund
Complex
Overseen by
Independent
Director** | | Other Directorships
Held by Independent
Director*** | |
Frank L. Bowman
c/o Perkins Coie LLP
Counsel to the Independent Directors
1155 Avenue of the Americas
New York, NY 10036
Birth Year 1944 | | Director | | Since August 2006 | | President, Strategic Decisions, LLC (consulting) (since February 2009); Director or Trustee of various Morgan Stanley Funds (since August 2006); Chairperson of the Compliance and Insurance Committee (since October 2015); formerly, Chairperson of the Insurance Sub-Committee of the Compliance and Insurance Committee (2007-2015); served as President and Chief Executive Officer of the Nuclear Energy Institute (policy organization) (February 2005-November 2008); retired as Admiral, U.S. Navy after serving over 38 years on active duty including 8 years as Director of the Naval Nuclear Propulsion Program in the Department of the Navy and the U.S. Department of Energy (1996-2004); served as Chief of Naval Personnel (July 1994-September 1996) and on the Joint Staff as Director of Political Military Affairs (June 1992-July 1994); knighted as Honorary Knight Commander of the Most Excellent Order of the British Empire; awarded the Officier de l'Orde National du Mérite by the French Government; elected to the National Academy of Engineering (2009). | | | 86 | | | Director of Naval and Nuclear Technologies LLP; Director Emeritus of the Armed Services YMCA; Member of the National Security Advisory Council of the Center for U.S. Global Engagement and a member of the CNA Military Advisory Board; Trustee of Fairhaven United Methodist Church; Member of the Board of Advisors of the Dolphin Scholarship Foundation; Director of other various non-profit organizations; formerly, Director of BP p.l.c. (November 2010-May 2019). | |
Kathleen A. Dennis
c/o Perkins Coie LLP
Counsel to the Independent Directors
1155 Avenue of the Americas
New York, NY 10036
Birth Year 1953 | | Director | | Since August 2006 | | President, Cedarwood Associates (mutual fund and investment management consulting) (since July 2006); Chairperson of the Liquidity and Alternatives Sub-Committee of the Investment Committee (since October 2006) and Director or Trustee of various Morgan Stanley Funds (since August 2006); formerly, Senior Managing Director of Victory Capital Management (1993-2006). | | | 86 | | | Director of various non-profit organizations. | |
Nancy C. Everett
c/o Perkins Coie LLP
Counsel to the Independent Directors
1155 Avenue of the Americas
New York, NY 10036
Birth Year 1955 | | Director | | Since January 2015 | | Chief Executive Officer, Virginia Commonwealth University Investment Company (since November 2015); Owner, OBIR, LLC (institutional investment management consulting) (since June 2014); formerly, Managing Director, BlackRock, Inc. (February 2011-December 2013); and Chief Executive Officer, General Motors Asset Management (a/k/a Promark Global Advisors, Inc.) (June 2005-May 2010). | | | 87 | | | Formerly, Member of Virginia Commonwealth University School of Business Foundation (2005-2016); Member of Virginia Commonwealth University Board of Visitors (2013-2015); Member of Committee on Directors for Emerging Markets Growth Fund, Inc. (2007-2010); Chairperson of Performance Equity Management, LLC (2006-2010); and Chairperson, GMAM Absolute Return Strategies Fund, LLC (2006-2010). | |
29
Morgan Stanley Institutional Fund, Inc.
Annual Report — December 31, 2019
Director and Officer Information (unaudited) (cont'd)
Independent Directors: (cont'd)
Name, Birth Year
and Address of
Independent Director | | Position(s)
Held with
Registrant | | Length of Time
Served* | | Principal Occupation(s) During Past 5 Years
and Other Relevant Professional Experience | | Number of
Funds in Fund
Complex
Overseen by
Independent
Director** | | Other Directorships
Held by Independent
Director*** | |
Jakki L. Haussler
c/o Perkins Coie LLP
Counsel to the Independent Directors
1155 Avenue of the Americas
New York, NY 10036
Birth Year 1957 | | Director | | Since January 2015 | | Chairman, Opus Capital Group (since 1996); formerly, Chief Executive Officer, Opus Capital Group (1996-2019); Director, Capvest Venture Fund, LP (May 2000-December 2011); Partner, Adena Ventures, LP (July 1999-December 2010); Director, The Victory Funds (February 2005-July 2008). | | | 87 | | | Director of Service Corporation International and Member, Audit Committee and Investment Committee; Director of Cincinnati Bell Inc. and Member, Audit Committee and Governance and Nominating Committee; Chairman of Northern Kentucky University Member Investment Committee; Member of Chase College of Law Transactional Law Practice Center Board of Advisors; Director of Best Transport; Director of Chase College of Law Board of Visitors; formerly, Member, University of Cincinnati Foundation Investment Committee; Member, Miami University Board of Visitors (2008-2011); Trustee of Victory Funds (2005-2008) and Chairman, Investment Committee (2007-2008) and Member, Service Provider Committee (2005-2008). | |
Dr. Manuel H. Johnson
c/o Johnson Smick International, Inc.
220 I Street, NE — Suite 200
Washington, D.C. 20002
Birth Year 1949 | | Director | | Since July 1991 | | Senior Partner, Johnson Smick International, Inc. (consulting firm); Chairperson of the Investment Committee (since October 2006) and Director or Trustee of various Morgan Stanley Funds (since July 1991); Co-Chairman and a founder of the Group of Seven Council (G7C) (international economic commission); formerly, Chairperson of the Audit Committee (July 1991-September 2006), Vice Chairman of the Board of Governors of the Federal Reserve System and Assistant Secretary of the U.S. Treasury. | | | 86 | | | Director of NVR, Inc. (home construction). | |
Joseph J. Kearns
c/o Perkins Coie LLP
Counsel to the Independent Directors
1155 Avenue of the Americas
New York, NY 10036
Birth Year 1942 | | Director | | Since August 1994 | | Senior Adviser, Kearns & Associates LLC (investment consulting); Chairperson of the Audit Committee (since October 2006) and Director or Trustee of various Morgan Stanley Funds (since August 1994); formerly, Deputy Chairperson of the Audit Committee (July 2003-September 2006) and Chairperson of the Audit Committee of various Morgan Stanley Funds (since August 1994); CFO of the J. Paul Getty Trust. | | | 87 | | | Prior to August 10, 2016, Director of Electro Rent Corporation (equipment leasing); Prior to December 31, 2013, Director of The Ford Family Foundation. | |
30
Morgan Stanley Institutional Fund, Inc.
Annual Report — December 31, 2019
Director and Officer Information (unaudited) (cont'd)
Independent Directors: (cont'd)
Name, Birth Year
and Address of
Independent Director | | Position(s)
Held with
Registrant | | Length of Time
Served* | | Principal Occupation(s) During Past 5 Years
and Other Relevant Professional Experience | | Number of
Funds in Fund
Complex
Overseen by
Independent
Director** | | Other Directorships
Held by Independent
Director*** | |
Michael F. Klein
c/o Perkins Coie LLP
Counsel to the Independent Directors
1155 Avenue of the Americas
New York, NY 10036
Birth Year 1958 | | Director | | Since August 2006 | | Managing Director, Aetos Alternatives Management, LP (since March 2000); Co-President, Aetos Alternatives Management, LP (since January 2004) and Co-Chief Executive Officer of Aetos Alternatives Management, LP (since August 2013); Chairperson of the Fixed Income Sub-Committee of the Investment Committee (since October 2006) and Director or Trustee of various Morgan Stanley Funds (since August 2006); formerly, Managing Director, Morgan Stanley & Co. Inc. and Morgan Stanley Dean Witter Investment Management and President, various Morgan Stanley Funds (June 1998-March 2000); Principal, Morgan Stanley & Co. Inc. and Morgan Stanley Dean Witter Investment Management (August 1997-December 1999). | | | 86 | | | Director of certain investment funds managed or sponsored by Aetos Alternatives Management, LP; Director of Sanitized AG and Sanitized Marketing AG (specialty chemicals). | |
Patricia Maleski
c/o Perkins Coie LLP
Counsel to the Independent Directors
1155 Avenue of the Americas
New York, NY 10036
Birth Year 1960 | | Director | | Since January 2017 | | Managing Director, JPMorgan Asset Management (2004-2016); Oversight and Control Head of Fiduciary and Conflicts of Interest Program (2015-2016); Chief Control Officer-Global Asset Management (2013-2015); President, JPMorgan Funds (2010-2013); Chief Administrative Officer (2004-2013); various other positions including Treasurer and Board Liaison (since 2001). | | | 87 | | | None. | |
Michael E. Nugent
522 Fifth Avenue
New York, NY 10036
Birth Year 1936 | | Chair of the Board and Director | | Chair of the Boards since July 2006 and Director since July 1991 | | Chair of the Boards of various Morgan Stanley Funds (since July 2006); Chairperson of the Governance Committee (since January 2019) and Director or Trustee of various Morgan Stanley Funds (since July 1991); formerly, Chairperson of each of the Closed-End Fund committee (until December 2019) and the Insurance Committee (until July 2006); General Partner, Triumph Capital, L.P. (private investment partnership) (1988-2013). | | | 86 | | | None. | |
W. Allen Reed
c/o Perkins Coie LLP
Counsel to the Independent Directors
1155 Avenue of the Americas
New York, NY 10036
Birth Year 1947 | | Vice Chair of the Board and Director | | Vice Chair of the Boards since January 2020 and Director Since August 2006 | | Chairperson of the Equity Sub-Committee of the Investment Committee (since October 2006) and Director or Trustee of various Morgan Stanley Funds (since August 2006); formerly, President and CEO of General Motors Asset Management; Chairman and Chief Executive Officer of the GM Trust Bank and Corporate Vice President of General Motors Corporation (August 1994-December 2005). | | | 86 | | | Formerly, Director of Legg Mason, Inc.; formerly, Director of the Auburn University Foundation (2010-2015). | |
* This is the earliest date the Director began serving the Morgan Stanley Funds. Each Director serves an indefinite term, until his or her successor is elected.
** The Fund Complex includes (as of December 31, 2019) all open-end and closed-end funds (including all of their portfolios) advised by Morgan Stanley Investment Management Inc. (the "Adviser") and any funds that have an adviser that is an affiliated person of the Adviser (including, but not limited to, Morgan Stanley AIP GP LP).
*** This includes any directorships at public companies and registered investment companies held by the Director at any time during the past five years.
31
Morgan Stanley Institutional Fund, Inc.
Annual Report — December 31, 2019
Director and Officer Information (unaudited) (cont'd)
Executive Officers:
Name, Birth Year and Address of
Executive Officer | | Position(s)
Held with
Registrant | | Length of Time
Served* | | Principal Occupation(s) During Past 5 Years | |
John H. Gernon
522 Fifth Avenue
New York, NY 10036
Birth Year 1963 | | President and Principal Executive Officer | | Since September 2013 | | President and Principal Executive Officer of the Equity and Fixed Income Funds and the Morgan Stanley AIP Funds (since September 2013) and the Liquidity Funds and various money market funds (since May 2014) in the Fund Complex; Managing Director of the Adviser; Head of Product (since 2006). | |
Timothy J. Knierim
522 Fifth Avenue
New York, NY 10036
Birth Year 1959 | | Chief Compliance Officer | | Since December 2016 | | Managing Director of the Adviser and various entities affiliated with the Adviser; Chief Compliance Officer of various Morgan Stanley Funds and the Adviser (since December 2016) and Chief Compliance Officer of Morgan Stanley AIP GP LP (since 2014). Formerly, Managing Director and Deputy Chief Compliance Officer of the Adviser (2014-2016); and formerly, Chief Compliance Officer of Prudential Investment Management, Inc. (2007-2014). | |
Francis J. Smith
522 Fifth Avenue
New York, NY 10036
Birth Year 1965 | | Treasurer and Principal Financial Officer | | Treasurer since July 2003 and Principal Financial Officer since September 2002 | | Managing Director of the Adviser and various entities affiliated with the Adviser; Treasurer (since July 2003) and Principal Financial Officer of various Morgan Stanley Funds (since September 2002). | |
Mary E. Mullin
522 Fifth Avenue
New York, NY 10036
Birth Year 1967 | | Secretary | | Since June 1999 | | Managing Director of the Adviser; Secretary of various Morgan Stanley Funds (since June 1999). | |
Michael J. Key
522 Fifth Avenue
New York, NY 10036
Birth Year 1979 | | Vice President | | Since June 2017 | | Vice President of the Equity and Fixed Income Funds, Liquidity Funds, various money market funds and the Morgan Stanley AIP Funds in the Fund Complex (since June 2017); Executive Director of the Adviser; Head of Product Development for Equity and Fixed Income Funds (since August 2013). | |
* This is the earliest date the officer began serving the Morgan Stanley Funds. Each officer serves a one-year term, until his or her successor is elected and qualifies.
32
Morgan Stanley Institutional Fund, Inc.
Annual Report — December 31, 2019
Adviser and Administrator
Morgan Stanley Investment Management Inc.
522 Fifth Avenue
New York, New York 10036
Distributor
Morgan Stanley Distribution, Inc.
522 Fifth Avenue
New York, New York 10036
Dividend Disbursing and Transfer Agent
DST Asset Manager Solutions, Inc.
2000 Crown Colony Drive
Quincy, Massachusetts 02169
Custodian
State Street Bank and Trust Company
One Lincoln Street
Boston, Massachusetts 02111
Legal Counsel
Dechert LLP
1095 Avenue of the Americas
New York, New York 10036
Counsel to the Independent Directors
Perkins Coie LLP
1155 Avenue of the Americas
New York, New York 10036
Independent Registered Public Accounting Firm
Ernst & Young LLP
200 Clarendon Street
Boston, Massachusetts 02116
Reporting to Shareholders
Each Morgan Stanley fund provides a complete schedule of portfolio holdings in its Semi-Annual and the Annual Reports within 60 days of the end of the fund's second and fourth fiscal quarters. The Semi-Annual and Annual Reports are filed electronically with the Securities and Exchange Commission ("SEC") on Form N-CSRS and Form N-CSR, respectively. Morgan Stanley also delivers the Semi-Annual and Annual Reports to fund shareholders and makes these reports available on its public website, www.morganstanley.com/im/shareholderreports. Each Morgan Stanley non-money market fund also files a complete schedule of portfolio holdings with the SEC for the fund's first and third fiscal quarters as an attachment to Form N-PORT. Morgan Stanley does not deliver the reports for the first and third fiscal quarters to shareholders, nor are the reports posted to the Morgan Stanley public website. However, the holdings for each money market fund are posted to the Morgan Stanley public website. You may obtain the Form N-PORT filings (as well as the Form N-CSR and N-CSRS filings) by accessing the SEC's website, www.sec.gov. You can also request copies of these materials, upon payment of a duplicating fee, by electronic request at the SEC's email address (publicinfo@sec.gov).
Proxy Voting Policies and Procedures and Proxy Voting Record
You may obtain a copy of the Company's Proxy Voting Policy and Procedures and information regarding how the Company voted proxies relating to portfolio securities during the most recent twelve-month period ended June 30, without charge, upon request, by calling toll free 1 (800) 548-7786 or by visiting our website at www.morganstanley.com/im/shareholderreports. This information is also available on the SEC's website at www.sec.gov.
This report is authorized for distribution only when preceded or accompanied by a prospectus or summary prospectus of the applicable fund of Morgan Stanley Institutional Fund, Inc., which describes in detail the fund's investment policies, risks, fees and expenses. Please read the prospectus carefully before you invest or send money. For additional information, including information regarding the investments comprising the Fund, please visit our website at www.morganstanley.com/im/shareholderreports or call toll free 1 (800) 548-7786.
33
Printed in U.S.A.
This Report has been prepared for shareholders and may be distributed to others only if preceded or accompanied by a current prospectus.
Morgan Stanley Investment Management Inc.
522 Fifth Avenue
New York, New York 10036
© 2020 Morgan Stanley. Morgan Stanley Distribution, Inc.

IFIEMSCANN
2911215 EXP. 02.28.21

Morgan Stanley Institutional Fund, Inc.
Global Concentrated Portfolio
Annual Report
December 31, 2019
Beginning on January 1, 2021, as permitted by regulations adopted by the Securities and Exchange Commission ("SEC"), paper copies of the Fund's Annual and Semi-Annual Reports to Shareholders ("Shareholder Reports") will no longer be sent by mail, unless you specifically request paper copies of the Shareholder Reports from the Fund or from your financial intermediary, such as a broker-dealer or a bank. Instead, the Shareholder Reports will be made available on the Fund's website, https://www.morganstanley.com/im/shareholderreports and you will be notified by mail each time a Shareholder Report is posted and provided with a website link to access the Shareholder Report. If you already elected to receive Shareholder Reports electronically, you will not be affected by this change and you need not take any action. You may elect to receive Shareholder Reports and other communications from the Fund electronically anytime by contacting your financial intermediary or, if you are a direct investor, please follow the instructions on the envelope.
Beginning on January 1, 2019, you may elect to receive all future Shareholder Reports in paper free of charge. If you invest through a financial intermediary, you can contact your financial intermediary to request that you continue to receive paper copies of your Shareholder Reports. If you invest directly with the Fund, please follow the instructions on the envelope to let the Fund know you wish to continue receiving paper copies of your Shareholder Reports. Your election to receive Shareholder Reports in paper will apply to all funds held in your account if you invest through your financial intermediary or all funds held with the fund complex if you invest directly with a fund.

Morgan Stanley Institutional Fund, Inc.
Annual Report — December 31, 2019
Shareholders' Letter | | | 2 | | |
Expense Example | | | 3 | | |
Investment Overview | | | 4 | | |
Portfolio of Investments | | | 6 | | |
Statement of Assets and Liabilities | | | 7 | | |
Statement of Operations | | | 8 | | |
Statements of Changes in Net Assets | | | 9 | | |
Financial Highlights | | | 10 | | |
Notes to Financial Statements | | | 14 | | |
Report of Independent Registered Public Accounting Firm | | | 20 | | |
Federal Tax Notice | | | 21 | | |
Privacy Notice | | | 22 | | |
Director and Officer Information | | | 24 | | |
This report is authorized for distribution only when preceded or accompanied by a prospectus or summary prospectus of the applicable Fund of Morgan Stanley Institutional Fund, Inc. To receive a prospectus and/or statement of additional information ("SAI"), which contains more complete information such as investment objectives, charges, expenses, policies for voting proxies, risk considerations and describes in detail each of the Fund's investment policies to the prospective investor, please call toll free 1 (800) 548-7786. Please read the prospectuses carefully before you invest or send money.
Additionally, you can access information about the Fund, including performance, characteristics and investment team commentary, through Morgan Stanley Investment Management's website: www.morganstanley.com/im/shareholderreports.
Market forecasts provided in this report may not necessarily come to pass. There is no guarantee that any sectors mentioned will continue to perform as discussed herein or that securities in such sectors will be held by the Fund in the future. There is no assurance that a fund will achieve its investment objective. Funds are subject to market risk, which is the possibility that market values of securities owned by the Fund will decline and, therefore, the value of the Fund's shares may be less than what you paid for them. Accordingly, you can lose money investing in this Fund. Please see the prospectus for more complete information on investment risks.
1
Morgan Stanley Institutional Fund, Inc.
Annual Report — December 31, 2019
Shareholders' Letter (unaudited)
Dear Shareholders,
We are pleased to provide this Annual Report, in which you will learn how your investment in Global Concentrated Portfolio (the "Fund") performed during the latest twelve-month period.
Morgan Stanley Investment Management is a client-centric, investor-led organization. Our global presence, intellectual capital, and breadth of products and services enable us to partner with investors to meet the evolving challenges of today's financial markets. We aim to deliver superior investment service and to empower our clients to make the informed decisions that help them reach their investment goals.
As always, we thank you for selecting Morgan Stanley Investment Management, and look forward to working with you in the months and years ahead.
Sincerely,

John H. Gernon
President and Principal Executive Officer
January 2020
2
Morgan Stanley Institutional Fund, Inc.
Annual Report — December 31, 2019
Expense Example (unaudited)
Global Concentrated Portfolio
As a shareholder of the Fund, you incur two types of costs: (1) transactional costs; and (2) ongoing costs, which may include advisory fees, administration fees, distribution and shareholder services fees and other Fund expenses. This example is intended to help you understand your ongoing costs (in dollars) of investing in the Fund and to compare these costs with the ongoing costs of investing in other mutual funds.
This example is based on an investment of $1,000 invested at the beginning of the six-month period ended December 31, 2019 and held for the entire six-month period.
Actual Expenses
The table below provides information about actual account values and actual expenses. You may use the information in this table, together with the amount you invested, to estimate the expenses that you paid over the period. Simply divide your account value by $1,000 (for example, an $8,600 account value divided by $1,000 = 8.6), then multiply the result by the number in the table under the heading entitled "Actual Expenses Paid During Period" to estimate the expenses you paid on your account during this period.
Hypothetical Example for Comparison Purposes
The table below provides information about hypothetical account values and hypothetical expenses based on the Fund's actual expense ratio and an assumed rate of return of 5% per year before expenses, which is not the Fund's actual return. The hypothetical account values and expenses may not be used to estimate the actual ending account balance or expenses you paid for the period. You may use this information to compare the ongoing costs of investing in the Fund and other funds. To do so, compare this 5% hypothetical example with the 5% hypothetical examples that appear in the shareholder reports of the other funds.
Please note that the expenses shown in the table are meant to highlight your ongoing costs only and do not reflect any transactional costs, such as sales charges (loads). Therefore, the information for each class in the table is useful in comparing ongoing costs only, and will not help you determine the relative total costs of owning different funds. In addition, if these transactional costs were included, your costs would have been higher.
| | | Beginning
Account
Value
7/1/19 | | Actual Ending
Account
Value
12/31/19 | | Hypothetical
Ending Account
Value | | Actual
Expenses
Paid
During
Period* | | Hypothetical
Expenses Paid
During Period* | | Net
Expense
Ratio
During
Period** | |
Global Concentrated Portfolio Class I | | $ | 1,000.00 | | | $ | 1,120.40 | | | $ | 1,020.16 | | | $ | 5.34 | | | $ | 5.09 | | | | 1.00 | % | |
Global Concentrated Portfolio Class A | | | 1,000.00 | | | | 1,118.50 | | | | 1,018.45 | | | | 7.16 | | | | 6.82 | | | | 1.34 | | |
Global Concentrated Portfolio Class C | | | 1,000.00 | | | | 1,114.70 | | | | 1,014.62 | | | | 11.19 | | | | 10.66 | | | | 2.10 | | |
Global Concentrated Portfolio Class IS | | | 1,000.00 | | | | 1,120.90 | | | | 1,020.42 | | | | 5.08 | | | | 4.84 | | | | 0.95 | | |
* Expenses are calculated using each Fund Class' annualized net expense ratio (as disclosed), multiplied by the average account value over the period and multiplied by 184/365 (to reflect the most recent one-half year period).
** Annualized.
3
Morgan Stanley Institutional Fund, Inc.
Annual Report — December 31, 2019
Investment Overview (unaudited)
Global Concentrated Portfolio
The Fund seeks long-term capital appreciation.
Performance
For the fiscal year ended December 31, 2019, the Fund's Class I shares had a total return based on net asset value and reinvestment of distributions per share of 33.10%, net of fees. The Fund's Class I shares outperformed the Fund's benchmark, the MSCI World Net Index (the "Index"), which returned 27.67%.
Please keep in mind that double-digit returns are highly unusual and cannot be sustained. Investors should also be aware that these returns were primarily achieved during favorable market conditions.
Factors Affecting Performance
• The Fund returned strong performance on both an absolute and relative basis in 2019.
• The correction in December 2018 set the market up for recovery and strength early in 2019, with the U.S. region resuming leadership versus other parts of the world once again during the first half of 2019.
• Correctly positioned entering 2019, we had an underweight to defensives, maintained an overweight to growth, and had previously added in some value exposure in the form of energy and financials. The addition of value had proved to be too early from a nearer-term timing standpoint at the end of 2018, yet was successful over the longer term in the first half of 2019, contributing to performance as the market gathered strength.
• During the second quarter of 2019 the market became short-term overbought and vulnerable to correction. We therefore added some defensive bond proxy stocks in the form of real estate investment trusts (REITs) and utilities prior to the summer months, a correct decision that also contributed to performance.
• As it entered the second half of 2019, the Fund continued to hold both growth and value stocks, with some exposure to more defensive bond proxy stocks in terms of utilities and REITs to help mitigate market volatility throughout the summer.
• Exiting the summer months, we somewhat reduced the defensive positioning of the Fund. The reduction was due to expectations that the market would break out of its trading range as a result of easier earnings comparisons against the fourth
quarter of 2018, a strengthening U.S. housing market, combined accommodative U.S. Federal Reserve and European Central Bank stimulus policy, overly negative investor sentiment, and potential resolution to the U.S. versus China trade dispute. We increased the Fund weighting to value names going into year-end, which served us well. Value cyclical stocks performed strongly into year-end. Although growth somewhat lagged, we correctly maintained our weighting moving into 2020.
• From a geographic standpoint, the extreme underperformance of non-U.S. stocks relative to U.S. stocks continued from 2018 into the beginning of 2019. Remaining more defensive in the European region and staying underweight Japan were correct decisions that positively contributed to performance.
• Yet with valuations of Asia technology versus their U.S. technology peers at extreme lows, our decision in early 2019 to maintain weighting in Asia technology stocks paid off. The group began to outperform its U.S. counterparts meaningfully by the end of the summer. Asia technology was the largest overweight in the portfolio in 2019 and remains so entering 2020.
• The Fund's consistent underweight to Japan in 2019 was a positive contributor to performance. Not only do we struggle quantitatively to find factors that have persistence, but we also struggle to find specific stocks that persistently outperform. This poses a longer-term risk, and the team remained negative on the region.
• Within stock selection, the largest detractors were a U.S.-based energy company weighed down by sector decline, as well as an Irish airline company impacted by fears of overcapacity, and a U.K.-based global alcoholic beverage company impacted by trade concerns.
• The Fund benefited the most from stock positions in technology, most notably a U.S.-based global payments and technology company, a U.S.-based technology and services company, a China-based internet company, and a China-based semiconductor company. Another top contributor to performance for the period was a U.S.-based cosmetics company.
Management Strategies
• There have been no changes to our investment process during the period. Applied Equity Advisors'
4
Morgan Stanley Institutional Fund, Inc.
Annual Report — December 31, 2019
Investment Overview (unaudited) (cont'd)
Global Concentrated Portfolio
investment process is comprised of two parts: a Factor Timing Engine and a Stock Selection Engine. The first step, the Factor Timing Engine, takes into account not only what market factors or areas of the market are in leadership, but also how much momentum a particular factor has, whether that factor is cheap or expensive, and whether the timing is right to be tilted toward that factor. The timing decision comes down to the team's judgment and our combined decades of experience in factor investing. With regard to the Factor Timing Engine, investing in a particular area of the market that shows cheap historical valuation levels may not appear to be advantageous at first, but if chosen correctly, sticking with that investment often proves to be successful over the longer term. The Stock Selection Engine begins its work once the desired factor positioning is understood. There are three steps to the Stock Selection Engine: 1. regression analysis to determine the drivers of a particular stock's price performance, 2. sustainability analysis, and 3. further evaluation of the company fundamentals. The result is a highly active portfolio of fundamentally attractive stocks which the team believes could benefit from what we have identified to be quantitative investment styles likely to outperform in each region.

* Minimum Investment for Class I shares
** Commenced Operations on May 27, 2016.
In accordance with SEC regulations, the Fund's performance shown assumes that all recurring fees (including management fees) were deducted and all dividends and distributions were reinvested. The performance of Class A, C and IS shares will vary from the performance of Class I shares and will be negatively impacted by additional fees assessed to those classes (if applicable).
Performance Compared to the MSCI World Net Index(1) and the Lipper Global Large-Cap Core Funds Index(2)
| | | Period Ended December 31, 2019
Total Returns(3) | |
| | | | | Average Annual | |
| | | One
Year | | Five
Years | | Ten
Years | | Since
Inception(5) | |
Fund — Class I Shares
w/o sales charges(4) | | | 33.10 | % | | | — | | | | — | | | | 10.35 | % | |
Fund — Class A Shares
w/o sales charges(4) | | | 32.64 | | | | — | | | | — | | | | 9.95 | | |
Fund — Class A Shares with
maximum 5.25% sales charges(4) | | | 25.69 | | | | — | | | | — | | | | 8.33 | | |
Fund — Class C Shares
w/o sales charges(4) | | | 31.69 | | | | — | | | | — | | | | 9.15 | | |
Fund — Class C Shares with
maximum 1.00% deferred sales
charges(4) | | | 30.69 | | | | — | | | | — | | | | 9.15 | | |
Fund — Class IS Shares
w/o sales charges(4) | | | 33.16 | | | | — | | | | — | | | | 10.40 | | |
MSCI World Net Index | | | 27.67 | | | | — | | | | — | | | | 12.06 | | |
Lipper Global Large-Cap Core
Funds Index | | | 27.78 | | | | — | | | | — | | | | 11.64 | | |
Performance data quoted represents past performance, which is no guarantee of future results, and current performance may be lower or higher than the figures shown. Performance assumes that all dividends and distributions, if any, were reinvested. For the most recent month-end performance figures, please visit www.morganstanley.com/im/shareholderreports. Investment return and principal value will fluctuate so that Fund shares, when redeemed, may be worth more or less than their original cost. Total returns do not reflect the deduction of taxes that a shareholder would pay on Fund distributions or the redemption of Fund shares. Performance of share classes will vary due to difference in sales charges and expenses.
(1) The MSCI World Net Index is a free float-adjusted market capitalization weighted index designed to measure the equity market performance of developed markets. The term "free float" represents the portion of shares outstanding that are deemed to be available for purchase in the public equity markets by investors. The MSCI World Net Index currently consists of 23 developed market country indices. The performance of the Index is listed in US dollars and assumes reinvestment of net dividends. Net total return indices reinvest dividends after the deduction of withholding taxes, using (for international indices) a tax rate applicable to non-resident institutional investors who do not benefit from double taxation treaties. The Index is unmanaged and its returns do not include any sales charges or fees. Such costs would lower performance. It is not possible to invest directly in an index.
(2) The Lipper Global Large-Cap Core Funds Index is an equally weighted performance index of the largest qualifying funds (based on net assets) in the Lipper Global Large-Cap Core Funds classification. The Index, which is adjusted for capital gains distributions and income dividends, is unmanaged and should not be considered an investment. There are currently 10 funds represented in this Index. As of the date of this report, the Fund was in the Lipper Global Large-Cap Core Funds classification.
(3) Total returns for the Fund reflect fees waived and expenses reimbursed, if applicable, by the Adviser (as defined herein). Without such waivers and reimbursements, total returns would have been lower.
(4) Commenced operations on May 27, 2016.
(5) For comparative purposes, average annual since inception returns listed for the Indexes refer to the inception date of the Fund, not the inception of the Index.
5
Morgan Stanley Institutional Fund, Inc.
Annual Report — December 31, 2019
Portfolio of Investments
Global Concentrated Portfolio
| | | Shares | | Value
(000) | |
Common Stocks (93.2%) | |
China (12.9%) | |
Alibaba Group Holding Ltd. ADR (a) | | | 8,409 | | | $ | 1,783 | | |
Tencent Holdings Ltd. ADR | | | 21,178 | | | | 1,017 | | |
| | | | 2,800 | | |
France (6.4%) | |
LVMH Moet Hennessy Louis Vuitton SE ADR | | | 14,962 | | | | 1,396 | | |
India (6.3%) | |
HDFC Bank Ltd. ADR | | | 21,347 | | | | 1,353 | | |
Taiwan (5.7%) | |
Taiwan Semiconductor Manufacturing Co., Ltd. ADR | | | 21,395 | | | | 1,243 | | |
United Kingdom (5.5%) | |
Diageo PLC ADR | | | 7,011 | | | | 1,181 | | |
United States (56.4%) | |
Essex Property Trust, Inc. REIT | | | 1,077 | | | | 324 | | |
Estee Lauder Cos., Inc. (The), Class A | | | 5,349 | | | | 1,105 | | |
IPG Photonics Corp. (a) | | | 5,053 | | | | 732 | | |
JPMorgan Chase & Co. | | | 7,741 | | | | 1,079 | | |
Lennar Corp., Class A | | | 14,167 | | | | 790 | | |
Lululemon Athletica, Inc. (a) | | | 1,831 | | | | 424 | | |
Mastercard, Inc., Class A | | | 5,325 | | | | 1,590 | | |
McDonald's Corp. | | | 911 | | | | 180 | | |
Microsoft Corp. | | | 11,565 | | | | 1,824 | | |
NextEra Energy, Inc. | | | 3,855 | | | | 934 | | |
Starbucks Corp. | | | 10,360 | | | | 911 | | |
STORE Capital Corp. REIT | | | 28,190 | | | | 1,050 | | |
SVB Financial Group (a) | | | 4,956 | | | | 1,244 | | |
| | | | 12,187 | | |
Total Common Stocks (Cost $16,605) | | | 20,160 | | |
Investment Companies (5.0%) | |
iShares Europe ETF | | | 645 | | | | 30 | | |
Vanguard FTSE Europe ETF | | | 17,905 | | | | 1,049 | | |
Total Investment Companies (Cost $1,026) | | | 1,079 | | |
Short-Term Investment (1.7%) | |
Investment Company (1.7%) | |
Morgan Stanley Institutional Liquidity
Funds — Treasury Securities Portfolio —
Institutional Class (See Note G)
(Cost $359) | | | 359,123 | | | | 359 | | |
Total Investments (99.9%) (Cost $17,990) (b) | | | 21,598 | | |
Other Assets in Excess of Liabilities (0.1%) | | | 14 | | |
Net Assets (100.0%) | | $ | 21,612 | | |
Country assignments and aggregations are based generally on third party vendor classifications and information, and may be different from the assignments and aggregations under the policies set forth in the Fund's prospectus and/or statement of additional information relating to geographic classifications.
(a) Non-income producing security.
(b) At December 31, 2019, the aggregate cost for federal income tax purposes is approximately $18,054,000. The aggregate gross unrealized appreciation is approximately $3,544,000 and the aggregate gross unrealized depreciation is $0, resulting in net unrealized appreciation of approximately $3,544,000.
ADR American Depositary Receipt.
ETF Exchange Traded Fund.
REIT Real Estate Investment Trust.
Portfolio Composition
Classification | | Percentage of
Total Investments | |
Other* | | | 17.7 | % | |
Banks | | | 17.0 | | |
Software | | | 8.4 | | |
Textiles, Apparel & Luxury Goods | | | 8.4 | | |
Internet & Direct Marketing Retail | | | 8.3 | | |
Information Technology Services | | | 7.4 | | |
Equity Real Estate Investment Trusts (REITs) | | | 6.4 | | |
Semiconductors & Semiconductor Equipment | | | 5.8 | | |
Beverages | | | 5.5 | | |
Personal Products | | | 5.1 | | |
Hotels, Restaurants & Leisure | | | 5.0 | | |
Investment Companies | | | 5.0 | | |
Total Investments | | | 100.0 | % | |
* Industries and/or investment types representing less than 5% of total investments.
The accompanying notes are an integral part of the financial statements.
6
Morgan Stanley Institutional Fund, Inc.
Annual Report — December 31, 2019
Global Concentrated Portfolio
Statement of Assets and Liabilities | | December 31, 2019
(000) | |
Assets: | |
Investments in Securities of Unaffiliated Issuers, at Value (Cost $17,631) | | $ | 21,239 | | |
Investment in Security of Affiliated Issuer, at Value (Cost $359) | | | 359 | | |
Total Investments in Securities, at Value (Cost $17,990) | | | 21,598 | | |
Dividends Receivable | | | 19 | | |
Due from Adviser | | | 16 | | |
Receivable for Fund Shares Sold | | | 2 | | |
Tax Reclaim Receivable | | | 1 | | |
Receivable from Affiliate | | | — | @ | |
Other Assets | | | 24 | | |
Total Assets | | | 21,660 | | |
Liabilities: | |
Payable for Professional Fees | | | 34 | | |
Payable for Shareholder Services Fees — Class A | | | 1 | | |
Payable for Distribution and Shareholder Services Fees — Class C | | | 2 | | |
Payable for Transfer Agency Fees — Class I | | | 1 | | |
Payable for Transfer Agency Fees — Class A | | | — | @ | |
Payable for Transfer Agency Fees — Class C | | | 1 | | |
Payable for Transfer Agency Fees — Class IS | | | — | @ | |
Payable for Sub Transfer Agency Fees — Class I | | | 1 | | |
Payable for Sub Transfer Agency Fees — Class A | | | — | @ | |
Payable for Sub Transfer Agency Fees — Class C | | | — | @ | |
Payable for Custodian Fees | | | 1 | | |
Payable for Administration Fees | | | 1 | | |
Other Liabilities | | | 6 | | |
Total Liabilities | | | 48 | | |
Net Assets | | $ | 21,612 | | |
Net Assets Consist of: | |
Paid-in-Capital | | $ | 18,217 | | |
Total Distributable Earnings | | | 3,395 | | |
Net Assets | | $ | 21,612 | | |
CLASS I: | |
Net Assets | | $ | 14,885 | | |
| Shares Outstanding $0.001 par value shares of beneficial interest (unlimited shares authorized) (not in 000's) | | | 1,074,066 | | |
Net Asset Value, Offering and Redemption Price Per Share | | $ | 13.86 | | |
CLASS A: | |
Net Assets | | $ | 4,009 | | |
| Shares Outstanding $0.001 par value shares of beneficial interest (unlimited shares authorized) (not in 000's) | | | 290,483 | | |
Net Asset Value, Redemption Price Per Share | | $ | 13.80 | | |
Maximum Sales Load | | | 5.25 | % | |
Maximum Sales Charge | | $ | 0.76 | | |
Maximum Offering Price Per Share | | $ | 14.56 | | |
CLASS C: | |
Net Assets | | $ | 2,704 | | |
| Shares Outstanding $0.001 par value shares of beneficial interest (unlimited shares authorized) (not in 000's) | | | 198,387 | | |
Net Asset Value, Offering and Redemption Price Per Share | | $ | 13.63 | | |
CLASS IS: | |
Net Assets | | $ | 14 | | |
| Shares Outstanding $0.001 par value shares of beneficial interest (unlimited shares authorized) (not in 000's) | | | 1,012 | | |
Net Asset Value, Offering and Redemption Price Per Share | | $ | 13.86 | | |
@ Amount is less than $500.
The accompanying notes are an integral part of the financial statements.
7
Morgan Stanley Institutional Fund, Inc.
Annual Report — December 31, 2019
Global Concentrated Portfolio
Statement of Operations | | Year Ended
December 31, 2019
(000) | |
Investment Income: | |
Dividends from Securities of Unaffiliated Issuers (Net of $13 of Foreign Taxes Withheld) | | $ | 293 | | |
Dividends from Security of Affiliated Issuer (Note G) | | | 4 | | |
Total Investment Income | | | 297 | | |
Expenses: | |
Advisory Fees (Note B) | | | 136 | | |
Professional Fees | | | 88 | | |
Registration Fees | | | 58 | | |
Shareholder Services Fees — Class A (Note D) | | | 7 | | |
Distribution and Shareholder Services Fees — Class C (Note D) | | | 23 | | |
Shareholder Reporting Fees | | | 18 | | |
Administration Fees (Note C) | | | 14 | | |
Transfer Agency Fees — Class I (Note E) | | | 2 | | |
Transfer Agency Fees — Class A (Note E) | | | 2 | | |
Transfer Agency Fees — Class C (Note E) | | | 2 | | |
Transfer Agency Fees — Class IS (Note E) | | | 2 | | |
Sub Transfer Agency Fees — Class I | | | 5 | | |
Sub Transfer Agency Fees — Class A | | | 2 | | |
Sub Transfer Agency Fees — Class C | | | 1 | | |
Custodian Fees (Note F) | | | 6 | | |
Directors' Fees and Expenses | | | 5 | | |
Pricing Fees | | | 1 | | |
Other Expenses | | | 19 | | |
Total Expenses | | | 391 | | |
Waiver of Advisory Fees (Note B) | | | (136 | ) | |
Expenses Reimbursed by Adviser (Note B) | | | (37 | ) | |
Reimbursement of Class Specific Expenses — Class I (Note B) | | | (1 | ) | |
Reimbursement of Class Specific Expenses — Class C (Note B) | | | (— | @) | |
Reimbursement of Class Specific Expenses — Class IS (Note B) | | | (2 | ) | |
Rebate from Morgan Stanley Affiliate (Note G) | | | (— | @) | |
Net Expenses | | | 215 | | |
Net Investment Income | | | 82 | | |
Realized Gain: | |
Investments Sold | | | 559 | | |
Change in Unrealized Appreciation (Depreciation): | |
Investments | | | 4,466 | | |
Net Realized Gain and Change in Unrealized Appreciation (Depreciation) | | | 5,025 | | |
Net Increase in Net Assets Resulting from Operations | | $ | 5,107 | | |
@ Amount is less than $500.
The accompanying notes are an integral part of the financial statements.
8
Morgan Stanley Institutional Fund, Inc.
Annual Report — December 31, 2019
Global Concentrated Portfolio
Statements of Changes in Net Assets | | Year Ended
December 31, 2019
(000) | | Year Ended
December 31, 2018
(000) | |
Increase (Decrease) in Net Assets: | |
Operations: | |
Net Investment Income | | $ | 82 | | | $ | 209 | | |
Net Realized Gain (Loss) | | | 559 | | | | (585 | ) | |
Net Change in Unrealized Appreciation (Depreciation) | | | 4,466 | | | | (3,093 | ) | |
Net Increase (Decrease) in Net Assets Resulting from Operations | | | 5,107 | | | | (3,469 | ) | |
Dividends and Distributions to Shareholders: | |
Class I | | | (164 | ) | | | (84 | ) | |
Class A | | | (24 | ) | | | (8 | ) | |
Class C | | | (2 | ) | | | — | | |
Class IS | | | (— | @) | | | (— | @) | |
Total Dividends and Distributions to Shareholders | | | (190 | ) | | | (92 | ) | |
Capital Share Transactions:(1) | |
Class I: | |
Subscribed | | | 1,770 | | | | 9,706 | | |
Distributions Reinvested | | | 164 | | | | 47 | | |
Redeemed | | | (2,155 | ) | | | (7,354 | ) | |
Class A: | |
Subscribed | | | 2,061 | | | | 1,453 | | |
Distributions Reinvested | | | 24 | | | | 7 | | |
Redeemed | | | (1,014 | ) | | | (470 | ) | |
Class C: | |
Subscribed | | | 590 | | | | 1,750 | | |
Distributions Reinvested | | | 2 | | | | — | | |
Redeemed | | | (788 | ) | | | (757 | ) | |
Class IS: | |
Distributions Reinvested | | | — | @ | | | — | | |
Net Increase in Net Assets Resulting from Capital Share Transactions | | | 654 | | | | 4,382 | | |
Total Increase in Net Assets | | | 5,571 | | | | 821 | | |
Net Assets: | |
Beginning of Period | | | 16,041 | | | | 15,220 | | |
End of Period | | $ | 21,612 | | | $ | 16,041 | | |
(1) Capital Share Transactions: | |
Class I: | |
Shares Subscribed | | | 142 | | | | 762 | | |
Shares Issued on Distributions Reinvested | | | 12 | | | | 4 | | |
Shares Redeemed | | | (177 | ) | | | (620 | ) | |
Net Increase (Decrease) in Class I Shares Outstanding | | | (23 | ) | | | 146 | | |
Class A: | |
Shares Subscribed | | | 161 | | | | 115 | | |
Shares Issued on Distributions Reinvested | | | 2 | | | | 1 | | |
Shares Redeemed | | | (84 | ) | | | (40 | ) | |
Net Increase in Class A Shares Outstanding | | | 79 | | | | 76 | | |
Class C: | |
Shares Subscribed | | | 46 | | | | 141 | | |
Shares Issued on Distributions Reinvested | | | — | @@ | | | — | | |
Shares Redeemed | | | (66 | ) | | | (63 | ) | |
Net Increase (Decrease) in Class C Shares Outstanding | | | (20 | ) | | | 78 | | |
Class IS: | |
Shares Issued on Distributions Reinvested | | | — | @@ | | | — | | |
@ Amount is less than $500.
@@ Amount is less than 500 shares.
The accompanying notes are an integral part of the financial statements.
9
Morgan Stanley Institutional Fund, Inc.
Annual Report — December 31, 2019
Financial Highlights
Global Concentrated Portfolio
| | | Class I | |
| | | Year Ended December 31, | | Period from
May 27, 2016(1) to | |
Selected Per Share Data and Ratios | | 2019 | | 2018 | | 2017 | | December 31, 2016 | |
Net Asset Value, Beginning of Period | | $ | 10.53 | | | $ | 12.42 | | | $ | 10.16 | | | $ | 10.00 | | |
Income (Loss) from Investment Operations: | |
Net Investment Income(2) | | | 0.08 | | | | 0.14 | | | | 0.02 | | | | 0.03 | | |
Net Realized and Unrealized Gain (Loss) | | | 3.40 | | | | (1.95 | ) | | | 2.28 | | | | 0.19 | | |
Total from Investment Operations | | | 3.48 | | | | (1.81 | ) | | | 2.30 | | | | 0.22 | | |
Distributions from and/or in Excess of: | |
Net Investment Income | | | (0.15 | ) | | | (0.08 | ) | | | (0.03 | ) | | | (0.06 | ) | |
Paid-in-Capital | | | — | | | | — | | | | (0.01 | ) | | | — | | |
Total Distributions | | | (0.15 | ) | | | (0.08 | ) | | | (0.04 | ) | | | (0.06 | ) | |
Net Asset Value, End of Period | | $ | 13.86 | | | $ | 10.53 | | | $ | 12.42 | | | $ | 10.16 | | |
Total Return(3) | | | 33.10 | % | | | (14.61 | )% | | | 22.64 | % | | | 2.24 | %(6) | |
Ratios to Average Net Assets and Supplemental Data: | |
Net Assets, End of Period (Thousands) | | $ | 14,885 | | | $ | 11,554 | | | $ | 11,814 | | | $ | 6,922 | | |
Ratio of Expenses Before Expense Limitation | | | 1.96 | % | | | 1.90 | % | | | 3.13 | % | | | 3.57 | %(7) | |
Ratio of Expenses After Expense Limitation | | | 1.00 | %(4) | | | 1.00 | %(4) | | | 0.98 | %(4) | | | 0.97 | %(4)(7) | |
Ratio of Net Investment Income | | | 0.64 | %(4) | | | 1.13 | %(4) | | | 0.15 | %(4) | | | 0.48 | %(4)(7) | |
Ratio of Rebate from Morgan Stanley Affiliates | | | 0.00 | %(5) | | | 0.00 | %(5) | | | 0.00 | %(5) | | | 0.00 | %(5)(7) | |
Portfolio Turnover Rate | | | 123 | % | | | 94 | % | | | 68 | % | | | 44 | %(6) | |
(1) Commencement of Operations.
(2) Per share amount is based on average shares outstanding.
(3) Calculated based on the net asset value as of the last business day of the period.
(4) The Ratio of Expenses After Expense Limitation and Ratio of Net Investment Income reflect the rebate of certain Fund expenses in connection with the investments in Morgan Stanley affiliates during the period. The effect of the rebate on the ratios is disclosed in the above table as "Ratio of Rebate from Morgan Stanley Affiliates."
(5) Amount is less than 0.005%.
(6) Not annualized.
(7) Annualized.
The accompanying notes are an integral part of the financial statements.
10
Morgan Stanley Institutional Fund, Inc.
Annual Report — December 31, 2019
Financial Highlights
Global Concentrated Portfolio
| | | Class A | |
| | | Year Ended December 31, | | Period from
May 27, 2016(1) to | |
Selected Per Share Data and Ratios | | 2019 | | 2018 | | 2017 | | December 31, 2016 | |
Net Asset Value, Beginning of Period | | $ | 10.49 | | | $ | 12.37 | | | $ | 10.15 | | | $ | 10.00 | | |
Income (Loss) from Investment Operations: | |
Net Investment Income (Loss)(2) | | | 0.04 | | | | 0.11 | | | | (0.03 | ) | | | 0.01 | | |
Net Realized and Unrealized Gain (Loss) | | | 3.38 | | | | (1.95 | ) | | | 2.28 | | | | 0.19 | | |
Total from Investment Operations | | | 3.42 | | | | (1.84 | ) | | | 2.25 | | | | 0.20 | | |
Distributions from and/or in Excess of: | |
Net Investment Income | | | (0.11 | ) | | | (0.04 | ) | | | (0.03 | ) | | | (0.05 | ) | |
Net Asset Value, End of Period | | $ | 13.80 | | | $ | 10.49 | | | $ | 12.37 | | | $ | 10.15 | | |
Total Return(3) | | | 32.64 | % | | | (14.91 | )% | | | 22.17 | % | | | 2.02 | %(6) | |
Ratios to Average Net Assets and Supplemental Data: | |
Net Assets, End of Period (Thousands) | | $ | 4,009 | | | $ | 2,213 | | | $ | 1,666 | | | $ | 782 | | |
Ratio of Expenses Before Expense Limitation | | | 2.29 | % | | | 2.24 | % | | | 3.61 | % | | | 4.23 | %(7) | |
Ratio of Expenses After Expense Limitation | | | 1.34 | %(4) | | | 1.35 | %(4) | | | 1.35 | %(4) | | | 1.35 | %(4)(7) | |
Ratio of Net Investment Income (Loss) | | | 0.32 | %(4) | | | 0.91 | %(4) | | | (0.25 | )%(4) | | | 0.16 | %(4)(7) | |
Ratio of Rebate from Morgan Stanley Affiliates | | | 0.00 | %(5) | | | 0.00 | %(5) | | | 0.00 | %(5) | | | 0.00 | %(5)(7) | |
Portfolio Turnover Rate | | | 123 | % | | | 94 | % | | | 68 | % | | | 44 | %(6) | |
(1) Commencement of Operations.
(2) Per share amount is based on average shares outstanding.
(3) Calculated based on the net asset value which does not reflect sales charges, if applicable, as of the last business day of the period.
(4) The Ratio of Expenses After Expense Limitation and Net Investment Income (Loss) reflect the rebate of certain Fund expenses in connection with the investments Morgan Stanley affiliates during the period. The effect of the rebate on the ratios is disclosed in the above table as "Ratio of Rebate from Morgan Stanley Affiliates."
(5) Amount is less than 0.005%.
(6) Not annualized.
(7) Annualized.
The accompanying notes are an integral part of the financial statements.
11
Morgan Stanley Institutional Fund, Inc.
Annual Report — December 31, 2019
Financial Highlights
Global Concentrated Portfolio
| | | Class C | |
| | | Year Ended December 31, | | Period from
May 27, 2016(1) to | |
Selected Per Share Data and Ratios | | 2019 | | 2018 | | 2017 | | December 31, 2016 | |
Net Asset Value, Beginning of Period | | $ | 10.36 | | | $ | 12.27 | | | $ | 10.15 | | | $ | 10.00 | | |
Income (Loss) from Investment Operations: | |
Net Investment Income (Loss)(2) | | | (0.06 | ) | | | 0.02 | | | | (0.11 | ) | | | (0.04 | ) | |
Net Realized and Unrealized Gain (Loss) | | | 3.34 | | | | (1.93 | ) | | | 2.26 | | | | 0.21 | | |
Total from Investment Operations | | | 3.28 | | | | (1.91 | ) | | | 2.15 | | | | 0.17 | | |
Distributions from and/or in Excess of: | |
Net Investment Income | | | (0.01 | ) | | | — | | | | (0.03 | ) | | | (0.02 | ) | |
Net Asset Value, End of Period | | $ | 13.63 | | | $ | 10.36 | | | $ | 12.27 | | | $ | 10.15 | | |
Total Return(3) | | | 31.69 | % | | | (15.57 | )% | | | 21.18 | % | | | 1.69 | %(6) | |
Ratios to Average Net Assets and Supplemental Data: | |
Net Assets, End of Period (Thousands) | | $ | 2,704 | | | $ | 2,263 | | | $ | 1,728 | | | $ | 877 | | |
Ratio of Expenses Before Expense Limitation | | | 3.06 | % | | | 2.98 | % | | | 4.36 | % | | | 4.81 | %(7) | |
Ratio of Expenses After Expense Limitation | | | 2.10 | %(4) | | | 2.09 | %(4) | | | 2.10 | %(4) | | | 2.10 | %(4)(7) | |
Ratio of Net Investment Income (Loss) | | | (0.46 | )%(4) | | | 0.18 | %(4) | | | (0.95 | )%(4) | | | (0.69 | )%(4)(7) | |
Ratio of Rebate from Morgan Stanley Affiliates | | | 0.00 | %(5) | | | 0.00 | %(5) | | | 0.00 | %(5) | | | 0.00 | %(5)(7) | |
Portfolio Turnover Rate | | | 123 | % | | | 94 | % | | | 68 | % | | | 44 | %(6) | |
(1) Commencement of Operations.
(2) Per share amount is based on average shares outstanding.
(3) Calculated based on the net asset value which does not reflect sales charges, if applicable, as of the last business day of the period.
(4) The Ratio of Expenses After Expense Limitation and Net Investment Income (Loss) reflect the rebate of certain Fund expenses in connection with the investments Morgan Stanley affiliates during the period. The effect of the rebate on the ratios is disclosed in the above table as "Ratio of Rebate from Morgan Stanley Affiliates."
(5) Amount is less than 0.005%.
(6) Not annualized.
(7) Annualized.
The accompanying notes are an integral part of the financial statements.
12
Morgan Stanley Institutional Fund, Inc.
Annual Report — December 31, 2019
Financial Highlights
Global Concentrated Portfolio
| | | Class IS | |
| | | Year Ended December 31, | | Period from
May 27, 2016(1) to | |
Selected Per Share Data and Ratios | | 2019 | | 2018 | | 2017 | | December 31, 2016 | |
Net Asset Value, Beginning of Period | | $ | 10.53 | | | $ | 12.42 | | | $ | 10.16 | | | $ | 10.00 | | |
Income (Loss) from Investment Operations: | |
Net Investment Income(2) | | | 0.09 | | | | 0.16 | | | | 0.02 | | | | 0.03 | | |
Net Realized and Unrealized Gain (Loss) | | | 3.40 | | | | (1.97 | ) | | | 2.28 | | | | 0.20 | | |
Total from Investment Operations | | | 3.49 | | | | (1.81 | ) | | | 2.30 | | | | 0.23 | | |
Distributions from and/or in Excess of: | |
Net Investment Income | | | (0.16 | ) | | | (0.08 | ) | | | (0.03 | ) | | | (0.07 | ) | |
Paid-in-Capital | | | — | | | | — | | | | (0.01 | ) | | | — | | |
Total Distributions | | | (0.16 | ) | | | (0.08 | ) | | | (0.04 | ) | | | (0.07 | ) | |
Net Asset Value, End of Period | | $ | 13.86 | | | $ | 10.53 | | | $ | 12.42 | | | $ | 10.16 | | |
Total Return(3) | | | 33.16 | % | | | (14.55 | )% | | | 22.67 | % | | | 2.25 | %(6) | |
Ratios to Average Net Assets and Supplemental Data: | |
Net Assets, End of Period (Thousands) | | $ | 14 | | | $ | 11 | | | $ | 12 | | | $ | 10 | | |
Ratio of Expenses Before Expense Limitation | | | 17.68 | % | | | 17.97 | % | | | 18.61 | % | | | 19.43 | %(7) | |
Ratio of Expenses After Expense Limitation | | | 0.95 | %(4) | | | 0.95 | %(4) | | | 0.95 | %(4) | | | 0.95 | %(4)(7) | |
Ratio of Net Investment Income | | | 0.68 | %(4) | | | 1.27 | %(4) | | | 0.22 | %(4) | | | 0.56 | %(4)(7) | |
Ratio of Rebate from Morgan Stanley Affiliates | | | 0.00 | %(5) | | | 0.00 | %(5) | | | 0.00 | %(5) | | | 0.00 | %(5)(7) | |
Portfolio Turnover Rate | | | 123 | % | | | 94 | % | | | 68 | % | | | 44 | %(6) | |
(1) Commencement of Operations.
(2) Per share amount is based on average shares outstanding.
(3) Calculated based on the net asset value as of the last business day of the period.
(4) The Ratio of Expenses After Expense Limitation and Ratio of Net Investment Income reflect the rebate of certain Fund expenses in connection with the investments in Morgan Stanley affiliates during the period. The effect of the rebate on the ratios is disclosed in the above table as "Ratio of Rebate from Morgan Stanley Affiliates."
(5) Amount is less than 0.005%.
(6) Not annualized.
(7) Annualized.
The accompanying notes are an integral part of the financial statements.
13
Morgan Stanley Institutional Fund, Inc.
Annual Report — December 31, 2019
Notes to Financial Statements
Morgan Stanley Institutional Fund, Inc. (the "Company") is registered under the Investment Company Act of 1940, as amended (the "Act"), as an open-end management investment company. The Company is comprised of thirty-two separate, active, diversified and non-diversified funds (individually referred to as a "Fund," collectively as the "Funds"). The Company applies investment company accounting and reporting guidance.
The accompanying financial statements relate to the Global Concentrated Portfolio. The Fund seeks long-term capital appreciation.
The Fund offers four classes of shares — Class I, Class A, Class C and Class IS.
A. Significant Accounting Policies: The following significant accounting policies are in conformity with U.S. generally accepted accounting principles ("GAAP"). Such policies are consistently followed by the Company in the preparation of its financial statements. GAAP may require management to make estimates and assumptions that affect the reported amounts and disclosures in the financial statements. Actual results may differ from those estimates.
In August 2018, the Financial Accounting Standards Board ("FASB") issued Accounting Standards Update ("ASU") 2018-13, Fair Value Measurement (Topic 820) — Disclosures Framework — Changes to Disclosure Requirements of Fair Value Measurement ("ASU 2018-13") which introduces new fair value disclosure requirements as well as eliminates and modifies certain existing fair value disclosure requirements. ASU 2018-13 would be effective for fiscal years beginning after December 15, 2019 and for interim periods within those fiscal years; however, management has elected to early adopt ASU 2018-13 as permitted by the standard. The impact of the Fund's adoption was limited to changes in the Fund's financial statement disclosures regarding fair value, primarily those disclosures related to transfers between levels of the fair value hierarchy and disclosure of the range and weighted average used to develop significant unobservable inputs for Level 3 fair value measurements, when applicable.
1. Security Valuation: (1) An equity portfolio security listed or traded on an exchange is valued at its latest reported sales price (or at the exchange official closing price if such exchange reports an official closing price), and if there were no sales on a given day and if there is no official exchange closing price for that day, the security is valued
at the mean between the last reported bid and asked prices if such bid and asked prices are available on the relevant exchanges. If only bid prices are available then the latest bid price may be used. Listed equity securities not traded on the valuation date with no reported bid and asked prices available on the exchange are valued at the mean between the current bid and asked prices obtained from one or more reputable brokers or dealers. In cases where a security is traded on more than one exchange, the security is valued on the exchange designated as the primary market; (2) all other equity portfolio securities for which over-the-counter ("OTC") market quotations are readily available are valued at the latest reported sales price (or at the market official closing price if such market reports an official closing price), and if there was no trading in the security on a given day and if there is no official closing price from relevant markets for that day, the security is valued at the mean between the last reported bid and asked prices if such bid and asked prices are available on the relevant markets. An unlisted equity security that does not trade on the valuation date and for which bid and asked prices from the relevant markets are unavailable is valued at the mean between the current bid and asked prices obtained from one or more reputable brokers or dealers; (3) certain portfolio securities may be valued by an outside pricing service/vendor approved by the Company's Board of Directors (the "Directors"). The pricing service/vendor may employ a pricing model that takes into account, among other things, bids, yield spreads and/or other market data and specific security characteristics. Alternatively, if a valuation is not available from an outside pricing service/vendor, and the security trades on an exchange, the security may be valued at its latest reported sale price (or at the exchange official closing price if such exchange reports an official closing price), prior to the time when assets are valued. If there are no sales on a given day and if there is no official exchange closing price for that day, the security is valued at the mean between the last reported bid and asked prices if such bid and asked prices are available in the relevant exchanges. If Morgan Stanley Investment Management Inc. (the "Adviser"), a wholly-owned subsidiary of Morgan Stanley, determines that the price provided by the outside pricing service/vendor or exchange does not reflect the security's fair value or is unable to provide a price, prices from brokers or dealers may also be utilized. In these circumstances, the value of the security will be the mean of
14
Morgan Stanley Institutional Fund, Inc.
Annual Report — December 31, 2019
Notes to Financial Statements (cont'd)
bid and asked prices obtained from brokers or dealers; (4) when market quotations are not readily available, including circumstances under which the Adviser determines that the closing price, last sale price or the mean between the last reported bid and asked prices are not reflective of a security's market value, portfolio securities are valued at their fair value as determined in good faith under procedures established by and under the general supervision of the Directors. Occasionally, developments affecting the closing prices of securities and other assets may occur between the times at which valuations of such securities are determined (that is, close of the foreign market on which the securities trade) and the close of business of the New York Stock Exchange ("NYSE"). If developments occur during such periods that are expected to materially affect the value of such securities, such valuations may be adjusted to reflect the estimated fair value of such securities as of the close of the NYSE, as determined in good faith by the Directors or by the Adviser using a pricing service and/or procedures approved by the Directors; and (5) investments in mutual funds, including the Morgan Stanley Institutional Liquidity Funds, are valued at the net asset value ("NAV") as of the close of each business day.
The Directors have responsibility for determining in good faith the fair value of the investments, and the Directors may appoint others, such as the Company's Adviser or a valuation committee, to assist the Directors in determining fair value and to make the actual calculations pursuant to the fair valuation methodologies previously approved by the Directors. Under procedures approved by the Directors, the Company's Adviser has formed a Valuation Committee whose members are approved by the Directors. The Valuation Committee provides administration and oversight of the Company's valuation policies and procedures, which are reviewed at least annually by the Directors. These procedures allow the Company to utilize independent pricing services, quotations from securities and financial instrument dealers and other market sources to determine fair value.
2. Fair Value Measurement: FASB Accounting Standards CodificationTM ("ASC") 820, "Fair Value Measurement" ("ASC 820"), defines fair value as the value that the Fund would receive to sell an investment or pay to transfer
a liability in a timely transaction with an independent buyer in the principal market, or in the absence of a principal market, the most advantageous market for the investment or liability. ASC 820 establishes a three-tier hierarchy to distinguish between (1) inputs that reflect the assumptions market participants would use in valuing an asset or liability developed based on market data obtained from sources independent of the reporting entity (observable inputs) and (2) inputs that reflect the reporting entity's own assumptions about the assumptions market participants would use in valuing an asset or liability developed based on the best information available in the circumstances (unobservable inputs) and to establish classification of fair value measurements for disclosure purposes. Various inputs are used in determining the value of the Fund's investments. The inputs are summarized in the three broad levels listed below:
• Level 1 – unadjusted quoted prices in active markets for identical investments
• Level 2 – other significant observable inputs (including quoted prices for similar investments, interest rates, prepayment speeds, credit risk, etc.)
• Level 3 – significant unobservable inputs including the Fund's own assumptions in determining the fair value of investments. Factors considered in making this determination may include, but are not limited to, information obtained by contacting the issuer, analysts, or the appropriate stock exchange (for exchange-traded securities), analysis of the issuer's financial statements or other available documents and, if necessary, available information concerning other securities in similar circumstances.
The inputs or methodology used for valuing securities are not necessarily an indication of the risk associated with investing in those securities and the determination of the significance of a particular input to the fair value measurement in its entirety requires judgment and considers factors specific to each security.
15
Morgan Stanley Institutional Fund, Inc.
Annual Report — December 31, 2019
Notes to Financial Statements (cont'd)
The following is a summary of the inputs used to value the Fund's investments as of December 31, 2019:
Investment Type | | Level 1
Unadjusted
quoted
prices
(000) | | Level 2
Other
significant
observable
inputs
(000) | | Level 3
Significant
unobservable
inputs
(000) | | Total
(000) | |
Assets: | |
Common Stocks | |
Banks | | $ | 3,676 | | | $ | — | | | $ | — | | | $ | 3,676 | | |
Beverages | | | 1,181 | | | | — | | | | — | | | | 1,181 | | |
Electric Utilities | | | 934 | | | | — | | | | — | | | | 934 | | |
Electronic Equipment,
Instruments &
Components | | | 732 | | | | — | | | | — | | | | 732 | | |
Equity Real Estate
Investment Trusts
(REITs) | | | 1,374 | | | | — | | | | — | | | | 1,374 | | |
Hotels, Restaurants &
Leisure | | | 1,091 | | | | — | | | | — | | | | 1,091 | | |
Household Durables | | | 790 | | | | — | | | | — | | | | 790 | | |
Information Technology
Services | | | 1,590 | | | | — | | | | — | | | | 1,590 | | |
Interactive Media &
Services | | | 1,017 | | | | — | | | | — | | | | 1,017 | | |
Internet & Direct
Marketing Retail | | | 1,783 | | | | — | | | | — | | | | 1,783 | | |
Personal Products | | | 1,105 | | | | — | | | | — | | | | 1,105 | | |
Semiconductors &
Semiconductor
Equipment | | | 1,243 | | | | — | | | | — | | | | 1,243 | | |
Software | | | 1,824 | | | | — | | | | — | | | | 1,824 | | |
Textiles, Apparel &
Luxury Goods | | | 1,820 | | | | — | | | | — | | | | 1,820 | | |
Total Common Stocks | | | 20,160 | | | | — | | | | — | | | | 20,160 | | |
Investment Companies | | | 1,079 | | | | — | | | | — | | | | 1,079 | | |
Short-Term Investment | |
Investment Company | | | 359 | | | | — | | | | — | | | | 359 | | |
Total Assets | | $ | 21,598 | | | $ | — | | | $ | — | | | $ | 21,598 | | |
Transfers between investment levels may occur as the markets fluctuate and/or the availability of data used in an investment's valuation changes.
3. Indemnifications: The Company enters into contracts that contain a variety of indemnifications. The Company's maximum exposure under these arrangements is unknown. However, the Company has not had prior claims or losses pursuant to these contracts and expects the risk of loss to be remote.
4. Dividends and Distributions to Shareholders: Dividends and distributions to shareholders are recorded on the ex-dividend date. Dividends from net investment income, if any, are declared and paid annually. Net realized capital gains, if any, are distributed at least annually.
5. Security Transactions, Income and Expenses: Security transactions are accounted for on the trade date (date the order to buy or sell is executed). Realized gains and losses on the sale of investment securities are determined on the specific identified cost method. Dividend income and other distributions are recorded on the ex-dividend date (except for certain foreign dividends which may be recorded as soon as the Fund is informed of such dividends) net of applicable withholding taxes. Interest income is recognized on the accrual basis except where collection is in doubt. Discounts are accreted and premiums are amortized over the life of the respective securities. Most expenses of the Company can be directly attributed to a particular Fund. Expenses which cannot be directly attributed are apportioned among the Funds based upon relative net assets or other appropriate methods. Income, expenses (other than class specific expenses — distribution and shareholder services, transfer agency and sub transfer agency fees) and realized and unrealized gains or losses are allocated to each class of shares based upon their relative net assets.
B. Advisory Fees: The Adviser, a wholly-owned subsidiary of Morgan Stanley, provides the Fund with advisory services under the terms of an Investment Advisory Agreement, paid quarterly, at the annual rate based on the daily net assets as follows:
First $750
million | | Next $750
million | | Over $1.5
billion | |
| | 0.75 | % | | | 0.70 | % | | | 0.65 | % | |
For the year ended December 31, 2019, the advisory fee rate (net of waiver/rebate) was equivalent to an annual effective rate of 0.00% of the Fund's average daily net assets.
The Adviser has agreed to reduce its advisory fee and/or reimburse the Fund so that total annual Fund operating expenses, excluding certain investment related expenses, taxes, interest and other extraordinary expenses (including litigation), will not exceed 1.00% for Class I shares, 1.35% for Class A shares, 2.10% for Class C shares and 0.95% for Class IS shares. The fee waivers and/or expense reimbursements will continue for at least one year from the date of the Fund's prospectus or until such time as the Directors act to discontinue all or a portion of such waivers and/or reimbursements when they deem such action is appropriate. For the year ended December 31, 2019, approximately $136,000 of advisory fees were waived and approximately $40,000 of other expenses were reimbursed by the Adviser pursuant to this arrangement.
16
Morgan Stanley Institutional Fund, Inc.
Annual Report — December 31, 2019
Notes to Financial Statements (cont'd)
C. Administration Fees: The Adviser also serves as Administrator to the Company and provides administrative services pursuant to an Administration Agreement for an annual fee, accrued daily and paid monthly, of 0.08% of the Fund's average daily net assets.
Under a Sub-Administration Agreement between the Administrator and State Street Bank and Trust Company ("State Street"), State Street provides certain administrative services to the Company. For such services, the Administrator pays State Street a portion of the fee the Administrator receives from the Fund.
D. Distribution and Shareholder Services Fees: Morgan Stanley Distribution, Inc. ("MSDI" or the "Distributor"), a wholly-owned subsidiary of the Adviser and an indirect subsidiary of Morgan Stanley, serves as the Company's Distributor of Fund shares pursuant to a Distribution Agreement. The Company has adopted a Shareholder Services Plan with respect to Class A shares pursuant to Rule 12b-1 under the Act. Under the Shareholder Services Plan, the Fund pays the Distributor a shareholder services fee, accrued daily and paid monthly, at an annual rate of 0.25% of the Fund's average daily net assets attributable to Class A shares.
The Company has adopted a Distribution and Shareholder Services Plan with respect to Class C shares pursuant to Rule 12b-1 under the Act. Under the Distribution and Shareholder Services Plan, the Fund pays the Distributor a distribution fee, accrued daily and paid monthly, at an annual rate of 0.75% and a shareholder services fee, accrued daily and paid monthly, at an annual rate of 0.25% of the Fund's average daily net assets attributable to Class C shares.
The distribution and shareholder services fees are used to support the expenses associated with servicing and maintaining accounts. The Distributor may compensate other parties for providing shareholder support services to investors who purchase Class A and Class C shares.
E. Dividend Disbursing and Transfer Agent: The Company's dividend disbursing and transfer agent is DST Asset Manager Solutions, Inc. ("DST"). Pursuant to a Transfer Agency Agreement, the Company pays DST a fee based on the number of classes, accounts and transactions relating to the Funds of the Company.
F. Custodian Fees: State Street (the "Custodian") also serves as Custodian for the Company in accordance with a Custodian Agreement. The Custodian holds cash, securities
and other assets of the Company as required by the Act. Custody fees are payable monthly based on assets held in custody, investment purchases and sales activity and account maintenance fees, plus reimbursement for certain out-of-pocket expenses.
G. Security Transactions and Transactions with Affiliates: For the year ended December 31, 2019, purchases and sales of investment securities for the Fund, other than long-term U.S. Government securities and short-term investments were approximately $22,544,000 and $22,143,000, respectively. There were no purchases and sales of long-term U.S. Government securities for the year ended December 31, 2019.
The Fund invests in the Institutional Class of the Morgan Stanley Institutional Liquidity Funds — Treasury Securities Portfolio (the "Liquidity Funds"), an open-end management investment company managed by the Adviser. Advisory fees paid by the Fund are reduced by an amount equal to its pro-rata share of the advisory and administration fees paid by the Fund due to its investment in the Liquidity Funds. For the year ended December 31, 2019, advisory fees paid were reduced by less than $500 relating to the Fund's investment in the Liquidity Funds.
A summary of the Fund's transactions in shares of affiliated investments during the year ended December 31, 2019 is as follows:
Affiliated
Investment
Company | | Value
December 31,
2018
(000) | | Purchases
at Cost
(000) | | Proceeds
from Sales
(000) | | Dividend
Income
(000) | |
Liquidity Funds | | $ | 28 | | | $ | 5,254 | | | $ | 4,923 | | | $ | 4 | | |
Affiliated
Investment
Company (cont'd) | | Realized
Gain (Loss)
(000) | | Change in
Unrealized
Appreciation
(Depreciation)
(000) | | Value
December 31,
2019
(000) | |
Liquidity Funds | | $ | — | | | $ | — | | | $ | 359 | | |
The Fund is permitted to purchase and sell securities ("cross-trade") from and to other Morgan Stanley funds as well as other funds and client accounts for which the Adviser or an affiliate of the Adviser serves as investment adviser, pursuant to procedures approved by the Directors in compliance with Rule 17a-7 under the Act (the "Rule"). Each cross-trade is executed at the current market price in compliance with provisions of the Rule. For the year ended December 31, 2019, the Fund did not engage in any cross-trade transactions.
17
Morgan Stanley Institutional Fund, Inc.
Annual Report — December 31, 2019
Notes to Financial Statements (cont'd)
The Fund has an unfunded Deferred Compensation Plan (the "Compensation Plan"), which allows each independent Director to defer payment of all, or a portion, of the fees he or she receives for serving on the Board of Directors. Each eligible Director generally may elect to have the deferred amounts credited with a return equal to the total return on one or more of the Morgan Stanley funds that are offered as investment options under the Compensation Plan. Appreciation/depreciation and distributions received from these investments are recorded with an offsetting increase/decrease in the deferred compensation obligation and do not affect the NAV of the Fund.
H. Federal Income Taxes: It is the Fund's intention to continue to qualify as a regulated investment company and distribute all of its taxable and tax-exempt income. Accordingly, no provision for federal income taxes is required in the financial statements.
The Fund may be subject to taxes imposed by countries in which it invests. Such taxes are generally based on income and/or capital gains earned or repatriated. Taxes are accrued based on net investment income, net realized gains and net unrealized appreciation as such income and/or gains are earned. Taxes may also be based on transactions in foreign currency and are accrued based on the value of investments denominated in such currency.
FASB ASC 740-10, "Income Taxes — Overall", sets forth a minimum threshold for financial statement recognition of the benefit of a tax position taken or expected to be taken in a tax return. Management has concluded there are no significant uncertain tax positions that would require recognition in the financial statements. If applicable, the Fund recognizes interest accrued related to unrecognized tax benefits in "Interest Expense" and penalties in "Other Expenses" in the Statement of Operations. The Fund files tax returns with the U.S. Internal Revenue Service, New York and various states. Generally, each of the tax years in the four-year period ended December 31, 2019 remains subject to examination by taxing authorities.
The tax character of distributions paid may differ from the character of distributions shown for GAAP purposes due to short-term capital gains being treated as ordinary income for tax purposes. The tax character of distributions paid during fiscal years 2019 and 2018 was as follows:
2019 Distributions
Paid From:
Ordinary Income
(000) | | 2018 Distributions
Paid From:
Ordinary Income
(000) | |
| $ | 190 | | | $ | 92 | | |
The amount and character of income and gains to be distributed are determined in accordance with income tax regulations which may differ from GAAP. These book/tax differences are either considered temporary or permanent in nature.
Temporary differences are attributable to differing book and tax treatments for the timing of the recognition of gains (losses) on certain investment transactions and the timing of the deductibility of certain expenses.
Permanent differences, primarily due to a nondeductible expense, resulted in the following reclassifications among the components of net assets at December 31, 2019:
Total
Distributable
Earnings
(000) | | Paid-in
Capital
(000) | |
| $ | 4 | | | $ | (4 | ) | |
At December 31, 2019, the components of distributable earnings for the Fund on a tax basis were as follows:
Undistributed
Ordinary
Income
(000) | | Undistributed
Long-Term
Capital Gain
(000) | |
| $ | 5 | | | | — | | |
At December 31, 2019, the Fund had available for federal income tax purposes unused short-term capital losses of approximately $111,000 that do not have an expiration date.
To the extent that capital loss carryforwards are used to offset any future capital gains realized, no capital gains tax liability will be incurred by the Fund for gains realized and not distributed. To the extent that capital gains are offset, such gains will not be distributed to the shareholders. During the year ended December 31, 2019, the Fund utilized capital loss carryforwards for U.S. federal income tax purposes of approximately $484,000.
I. Credit Facility: The Company and other Morgan Stanley funds participated in a $150,000,000 committed, unsecured revolving line of credit facility (the "Facility") with State Street. Effective April 22, 2019, the committed line amount increased to $300,000,000. This Facility is to be used for temporary emergency purposes or funding of shareholder redemption requests. The interest rate on borrowings is based on the federal funds rate or 1 month LIBOR rate plus a spread. The Facility also has a commitment fee of 0.25% per annum based on the unused portion of the Facility. During the year ended December 31, 2019, the Fund did not have any borrowings under the Facility.
18
Morgan Stanley Institutional Fund, Inc.
Annual Report — December 31, 2019
Notes to Financial Statements (cont'd)
J. Other: At December 31, 2019, the Fund had record owners of 10% or greater. Investment activities of these shareholders could have a material impact on the Fund. The aggregate percentage of such owners was 66.2%.
19
Morgan Stanley Institutional Fund, Inc.
Annual Report — December 31, 2019
Report of Independent Registered Public Accounting Firm
To the Shareholders and Board of Directors of
Morgan Stanley Institutional Fund, Inc. —
Global Concentrated Portfolio
Opinion on the Financial Statements
We have audited the accompanying statement of assets and liabilities of Global Concentrated Portfolio (the "Fund") (one of the funds constituting Morgan Stanley Institutional Fund, Inc. (the "Company")), including the portfolio of investments, as of December 31, 2019, and the related statement of operations for the year then ended, the statements of changes in net assets for each of the two years in the period then ended, the financial highlights for each of the three years in the period then ended and the period from May 27, 2016 (commencement of operations) through December 31, 2016 and the related notes (collectively referred to as the "financial statements"). In our opinion, the financial statements present fairly, in all material respects, the financial position of Global Concentrated Portfolio (one of the funds constituting Morgan Stanley Institutional Fund, Inc.) at December 31, 2019, the results of its operations for the year then ended, the changes in its net assets for each of the two years in the period then ended and its financial highlights for each of the three years in the period then ended and the period from May 27, 2016 (commencement of operations) through December 31, 2016, in conformity with U.S. generally accepted accounting principles.
Basis for Opinion
These financial statements are the responsibility of the Company's management. Our responsibility is to express an opinion on the Fund's financial statements based on our audits. We are a public accounting firm registered with the Public Company Accounting Oversight Board (United States) ("PCAOB") and are required to be independent with respect to the Company in accordance with the U.S. federal securities law and the applicable rules and regulations of the Securities and Exchange Commission and the PCAOB.
We conducted our audits in accordance with the standards of the PCAOB. Those standards require that we plan and perform the audit to obtain reasonable assurance about whether the financial statements are free of material misstatement, whether due to error or fraud. The Company is not required to have, nor were we engaged to perform, an audit of the Company's internal control over financial reporting. As part of our audits, we are required to obtain an understanding of internal control over financial reporting, but not for the purpose of expressing an opinion on the effectiveness of the Company's internal control over financial reporting. Accordingly, we express no such opinion.
Our audits included performing procedures to assess the risks of material misstatement of the financial statements, whether due to error or fraud, and performing procedures that respond to those risks. Such procedures included examining, on a test basis, evidence regarding the amounts and disclosures in the financial statements. Our procedures included confirmation of securities owned as of December 31, 2019 by correspondence with the custodian. Our audits also included evaluating the accounting principles used and significant estimates made by management, as well as evaluating the overall presentation of the financial statements. We believe that our audits provide a reasonable basis for our opinion.

We have served as the auditor of one or more Morgan Stanley investment companies since 2000.
Boston, Massachusetts
February 27, 2020
20
Morgan Stanley Institutional Fund, Inc.
Annual Report — December 31, 2019
Federal Tax Notice (unaudited)
For federal income tax purposes, the following information is furnished with respect to the distributions paid by the Fund during its taxable year ended December 31, 2019. For corporate shareholders 100% of the dividends qualified for the dividends received deduction.
For federal income tax purposes, the following information is furnished with respect to the Fund's earnings for its taxable year ended December 31, 2019. When distributed, certain earnings may be subject to a maximum tax rate of 15% as provided for by the Jobs and Growth Tax Relief Reconciliation Act of 2003. The Fund designated up to a maximum of approximately $191,000 as taxable at this lower rate.
In January, the Fund provides tax information to shareholders for the preceding calendar year.
21
Privacy Notice (unaudited) April 2019
FACTS | | WHAT DOES MSIM DO WITH YOUR PERSONAL INFORMATION? | |
Why? | | Financial companies choose how they share your personal information. Federal law gives consumers the right to limit some but not all sharing. Federal law also requires us to tell you how we collect, share, and protect your personal information. Please read this notice carefully to understand what we do. | |
What? | | The types of personal information we collect and share depend on the product or service you have with us. This information can include:
n Social Security number and income
n investment experience and risk tolerance
n checking account number and wire transfer instructions | |
How? | | All financial companies need to share customers' personal information to run their everyday business. In the section below, we list the reasons financial companies can share their customers' personal information; the reasons MSIM chooses to share; and whether you can limit this sharing. | |
Reasons we can share your personal information | | Does MSIM share? | | Can you limit this sharing? | |
For our everyday business purposes —
such as to process your transactions, maintain your account(s), respond to court orders and legal investigations, or report to credit bureaus | | Yes | | No | |
For our marketing purposes —
to offer our products and services to you | | Yes | | No | |
For joint marketing with other financial companies | | No | | We don't share | |
For our affiliates' everyday business purposes —
information about your transactions and experiences | | Yes | | No | |
For our affiliates' everyday business purposes —
information about your creditworthiness | | No | | We don't share | |
For our affiliates to market to you | | No | | We don't share | |
For non-affiliates to market to you | | No | | We don't share | |
Questions? Call toll-free (844) 312-6327 or email: imprivacyinquiries@morganstanley.com
22
Privacy Notice (unaudited) (cont'd) April 2019
Who we are
Who is providing this notice? | | Morgan Stanley Investment Management, Inc. and its affiliated registered investment advisers, registered broker-dealers, and registered and unregistered funds ("MSIM") | |
What we do
How does MSIM protect my personal information? | | To protect your personal information from unauthorized access and use, we use security measures that comply with federal law. These measures include computer safeguards and secured files and buildings. We have policies governing the proper handling of customer information by personnel and requiring third parties that provide support to adhere to appropriate security standards with respect to such information. | |
How does MSIM collect my personal information? | | We collect your personal information, for example, when you
n open an account or make deposits or withdrawals from your account
n buy securities from us or make a wire transfer
n give us your contact information
We also collect your personal information from others, such as credit bureaus, affiliates, or other companies. | |
Why can't I limit all sharing? | | Federal law gives you the right to limit only
n sharing for affiliates' everyday business purposes — information about your creditworthiness
n affiliates from using your information to market to you
n sharing for non-affiliates to market to you
State laws and individual companies may give you additional rights to limit sharing. See below for more on your rights under state law. | |
Definitions
Affiliates | | Companies related by common ownership or control. They can be financial and non-financial companies.
n Our affiliates include companies with a Morgan Stanley name and financial companies such as Morgan Stanley Smith Barney LLC and Morgan Stanley & Co. | |
Non-affiliates | | Companies not related by common ownership or control. They can be financial and non-financial companies.
n MSIM does not share with non-affiliates so they can market to you. | |
Joint marketing | | A formal agreement between non-affiliated financial companies that together market financial products or services to you.
n MSIM doesn't jointly market | |
Other important information
Vermont: Except as permitted by law, we will not share personal information we collect about Vermont residents with Non-affiliates unless you provide us with your written consent to share such information.
California: Except as permitted by law, we will not share personal information we collect about California residents with Non-affiliates and we will limit sharing such personal information with our Affiliates to comply with California privacy laws that apply to us.
23
Morgan Stanley Institutional Fund, Inc.
Annual Report — December 31, 2019
Director and Officer Information (unaudited)
Independent Directors:
Name, Birth Year
and Address of
Independent Director | | Position(s)
Held with
Registrant | | Length of Time
Served* | | Principal Occupation(s) During Past 5 Years
and Other Relevant Professional Experience | | Number of
Funds in
Fund Complex
Overseen by
Independent
Director** | | Other Directorships
Held by Independent
Director*** | |
Frank L. Bowman
c/o Perkins Coie LLP
Counsel to the Independent Directors
1155 Avenue of the Americas
New York, NY 10036
Birth Year 1944 | | Director | | Since August 2006 | | President, Strategic Decisions, LLC (consulting) (since February 2009); Director or Trustee of various Morgan Stanley Funds (since August 2006); Chairperson of the Compliance and Insurance Committee (since October 2015); formerly, Chairperson of the Insurance Sub-Committee of the Compliance and Insurance Committee (2007-2015); served as President and Chief Executive Officer of the Nuclear Energy Institute (policy organization) (February 2005-November 2008); retired as Admiral, U.S. Navy after serving over 38 years on active duty including 8 years as Director of the Naval Nuclear Propulsion Program in the Department of the Navy and the U.S. Department of Energy (1996-2004); served as Chief of Naval Personnel (July 1994-September 1996) and on the Joint Staff as Director of Political Military Affairs (June 1992-July 1994); knighted as Honorary Knight Commander of the Most Excellent Order of the British Empire; awarded the Officier de l'Orde National du Mérite by the French Government; elected to the National Academy of Engineering (2009). | | | 86 | | | Director of Naval and Nuclear Technologies LLP; Director Emeritus of the Armed Services YMCA; Member of the National Security Advisory Council of the Center for U.S. Global Engagement and a member of the CNA Military Advisory Board; Trustee of Fairhaven United Methodist Church; Member of the Board of Advisors of the Dolphin Scholarship Foundation; Director of other various non-profit organizations; formerly, Director of BP p.l.c. (November 2010-May 2019). | |
Kathleen A. Dennis
c/o Perkins Coie LLP
Counsel to the Independent Directors
1155 Avenue of the Americas
New York, NY 10036
Birth Year 1953 | | Director | | Since August 2006 | | President, Cedarwood Associates (mutual fund and investment management consulting) (since July 2006); Chairperson of the Liquidity and Alternatives Sub-Committee of the Investment Committee (since October 2006) and Director or Trustee of various Morgan Stanley Funds (since August 2006); formerly, Senior Managing Director of Victory Capital Management (1993-2006). | | | 86 | | | Director of various non-profit organizations. | |
Nancy C. Everett
c/o Perkins Coie LLP
Counsel to the Independent Directors
1155 Avenue of the Americas
New York, NY 10036
Birth Year 1955 | | Director | | Since January 2015 | | Chief Executive Officer, Virginia Commonwealth University Investment Company (since November 2015); Owner, OBIR, LLC (institutional investment management consulting) (since June 2014); formerly, Managing Director, BlackRock, Inc. (February 2011-December 2013); and Chief Executive Officer, General Motors Asset Management (a/k/a Promark Global Advisors, Inc.) (June 2005-May 2010). | | | 87 | | | Formerly, Member of Virginia Commonwealth University School of Business Foundation (2005-2016); Member of Virginia Commonwealth University Board of Visitors (2013-2015); Member of Committee on Directors for Emerging Markets Growth Fund, Inc. (2007-2010); Chairperson of Performance Equity Management, LLC (2006-2010); and Chairperson, GMAM Absolute Return Strategies Fund, LLC (2006-2010). | |
24
Morgan Stanley Institutional Fund, Inc.
Annual Report — December 31, 2019
Director and Officer Information (unaudited) (cont'd)
Independent Directors: (cont'd)
Name, Birth Year
and Address of
Independent Director | | Position(s)
Held with
Registrant | | Length of Time
Served* | | Principal Occupation(s) During Past 5 Years
and Other Relevant Professional Experience | | Number of
Funds in
Fund Complex
Overseen by
Independent
Director** | | Other Directorships
Held by Independent
Director*** | |
Jakki L. Haussler
c/o Perkins Coie LLP
Counsel to the Independent Directors
1155 Avenue of the Americas
New York, NY 10036
Birth Year 1957 | | Director | | Since January 2015 | | Chairman, Opus Capital Group (since 1996); formerly, Chief Executive Officer, Opus Capital Group (1996-2019); Director, Capvest Venture Fund, LP (May 2000-December 2011); Partner, Adena Ventures, LP (July 1999-December 2010); Director, The Victory Funds (February 2005-July 2008). | | | 87 | | | Director of Service Corporation International and Member, Audit Committee and Investment Committee; Director of Cincinnati Bell Inc. and Member, Audit Committee and Governance and Nominating Committee; Chairman of Northern Kentucky University Member Investment Committee; Member of Chase College of Law Transactional Law Practice Center Board of Advisors; Director of Best Transport; Director of Chase College of Law Board of Visitors; formerly, Member, University of Cincinnati Foundation Investment Committee; Member, Miami University Board of Visitors (2008-2011); Trustee of Victory Funds (2005-2008) and Chairman, Investment Committee (2007-2008) and Member, Service Provider Committee (2005-2008). | |
Dr. Manuel H. Johnson
c/o Johnson Smick International, Inc.
220 I Street, NE — Suite 200
Washington, D.C. 20002
Birth Year 1949 | | Director | | Since July 1991 | | Senior Partner, Johnson Smick International, Inc. (consulting firm); Chairperson of the Investment Committee (since October 2006) and Director or Trustee of various Morgan Stanley Funds (since July 1991); Co-Chairman and a founder of the Group of Seven Council (G7C) (international economic commission); formerly, Chairperson of the Audit Committee (July 1991-September 2006), Vice Chairman of the Board of Governors of the Federal Reserve System and Assistant Secretary of the U.S. Treasury. | | | 86 | | | Director of NVR, Inc. (home construction). | |
Joseph J. Kearns
c/o Perkins Coie LLP
Counsel to the Independent Directors
1155 Avenue of the Americas
New York, NY 10036
Birth Year 1942 | | Director | | Since August 1994 | | Senior Adviser, Kearns & Associates LLC (investment consulting); Chairperson of the Audit Committee (since October 2006) and Director or Trustee of various Morgan Stanley Funds (since August 1994); formerly, Deputy Chairperson of the Audit Committee (July 2003-September 2006) and Chairperson of the Audit Committee of various Morgan Stanley Funds (since August 1994); CFO of the J. Paul Getty Trust. | | | 87 | | | Prior to August 10, 2016, Director of Electro Rent Corporation (equipment leasing); Prior to December 31, 2013, Director of The Ford Family Foundation. | |
25
Morgan Stanley Institutional Fund, Inc.
Annual Report — December 31, 2019
Director and Officer Information (unaudited) (cont'd)
Independent Directors: (cont'd)
Name, Birth Year
and Address of
Independent Director | | Position(s)
Held with
Registrant | | Length of Time
Served* | | Principal Occupation(s) During Past 5 Years
and Other Relevant Professional Experience | | Number of
Funds in
Fund Complex
Overseen by
Independent
Director** | | Other Directorships
Held by Independent
Director*** | |
Michael F. Klein
c/o Perkins Coie LLP
Counsel to the Independent Directors
1155 Avenue of the Americas
New York, NY 10036
Birth Year 1958 | | Director | | Since August 2006 | | Managing Director, Aetos Alternatives Management, LP (since March 2000); Co-President, Aetos Alternatives Management, LP (since January 2004) and Co-Chief Executive Officer of Aetos Alternatives Management, LP (since August 2013); Chairperson of the Fixed Income Sub-Committee of the Investment Committee (since October 2006) and Director or Trustee of various Morgan Stanley Funds (since August 2006); formerly, Managing Director, Morgan Stanley & Co. Inc. and Morgan Stanley Dean Witter Investment Management and President, various Morgan Stanley Funds (June 1998-March 2000); Principal, Morgan Stanley & Co. Inc. and Morgan Stanley Dean Witter Investment Management (August 1997-December 1999). | | | 86 | | | Director of certain investment funds managed or sponsored by Aetos Alternatives Management, LP; Director of Sanitized AG and Sanitized Marketing AG (specialty chemicals). | |
Patricia Maleski
c/o Perkins Coie LLP
Counsel to the Independent Directors
1155 Avenue of the Americas
New York, NY 10036
Birth Year 1960 | | Director | | Since January 2017 | | Managing Director, JPMorgan Asset Management (2004-2016); Oversight and Control Head of Fiduciary and Conflicts of Interest Program (2015-2016); Chief Control Officer-Global Asset Management (2013-2015); President, JPMorgan Funds (2010-2013); Chief Administrative Officer (2004-2013); various other positions including Treasurer and Board Liaison (since 2001). | | | 87 | | | None. | |
Michael E. Nugent
522 Fifth Avenue
New York, NY 10036
Birth Year 1936 | | Chair of the Board and Director | | Chair of the Boards since July 2006 and Director since July 1991 | | Chair of the Boards of various Morgan Stanley Funds (since July 2006); Chairperson of the Governance Committee (since January 2019) and Director or Trustee of various Morgan Stanley Funds (since July 1991); formerly, Chairperson of each of the Closed-End Fund committee (until December 2019) and the Insurance Committee (until July 2006); General Partner, Triumph Capital, L.P. (private investment partnership) (1988-2013). | | | 86 | | | None. | |
W. Allen Reed
c/o Perkins Coie LLP
Counsel to the Independent Directors
1155 Avenue of the Americas
New York, NY 10036
Birth Year 1947 | | Vice Chair of the Board and Director | | Vice Chair of the Boards since January 2020 and Director Since August 2006 | | Chairperson of the Equity Sub-Committee of the Investment Committee (since October 2006) and Director or Trustee of various Morgan Stanley Funds (since August 2006); formerly, President and CEO of General Motors Asset Management; Chairman and Chief Executive Officer of the GM Trust Bank and Corporate Vice President of General Motors Corporation (August 1994-December 2005). | | | 86 | | | Formerly, Director of Legg Mason, Inc.; formerly, Director of the Auburn University Foundation (2010-2015). | |
* This is the earliest date the Director began serving the Morgan Stanley Funds. Each Director serves an indefinite term, until his or her successor is elected.
** The Fund Complex includes (as of December 31, 2019) all open-end and closed-end funds (including all of their portfolios) advised by Morgan Stanley Investment Management Inc. (the "Adviser") and any funds that have an adviser that is an affiliated person of the Adviser (including, but not limited to, Morgan Stanley AIP GP LP).
*** This includes any directorships at public companies and registered investment companies held by the Director at any time during the past five years.
26
Morgan Stanley Institutional Fund, Inc.
Annual Report — December 31, 2019
Director and Officer Information (unaudited) (cont'd)
Executive Officers:
Name, Birth Year and Address of
Executive Officer | | Position(s)
Held with
Registrant | | Length of Time
Served* | | Principal Occupation(s) During Past 5 Years | |
John H. Gernon
522 Fifth Avenue
New York, NY 10036
Birth Year 1963 | | President and Principal Executive Officer | | Since September 2013 | | President and Principal Executive Officer of the Equity and Fixed Income Funds and the Morgan Stanley AIP Funds (since September 2013) and the Liquidity Funds and various money market funds (since May 2014) in the Fund Complex; Managing Director of the Adviser; Head of Product (since 2006). | |
Timothy J. Knierim
522 Fifth Avenue
New York, NY 10036
Birth Year 1959 | | Chief Compliance Officer | | Since December 2016 | | Managing Director of the Adviser and various entities affiliated with the Adviser; Chief Compliance Officer of various Morgan Stanley Funds and the Adviser (since December 2016) and Chief Compliance Officer of Morgan Stanley AIP GP LP (since 2014). Formerly, Managing Director and Deputy Chief Compliance Officer of the Adviser (2014-2016); and formerly, Chief Compliance Officer of Prudential Investment Management, Inc. (2007-2014). | |
Francis J. Smith
522 Fifth Avenue
New York, NY 10036
Birth Year 1965 | | Treasurer and Principal Financial Officer | | Treasurer since July 2003 and Principal Financial Officer since September 2002 | | Managing Director of the Adviser and various entities affiliated with the Adviser; Treasurer (since July 2003) and Principal Financial Officer of various Morgan Stanley Funds (since September 2002). | |
Mary E. Mullin
522 Fifth Avenue
New York, NY 10036
Birth Year 1967 | | Secretary | | Since June 1999 | | Managing Director of the Adviser; Secretary of various Morgan Stanley Funds (since June 1999). | |
Michael J. Key
522 Fifth Avenue
New York, NY 10036
Birth Year 1979 | | Vice President | | Since June 2017 | | Vice President of the Equity and Fixed Income Funds, Liquidity Funds, various money market funds and the Morgan Stanley AIP Funds in the Fund Complex (since June 2017); Executive Director of the Adviser; Head of Product Development for Equity and Fixed Income Funds (since August 2013). | |
* This is the earliest date the officer began serving the Morgan Stanley Funds. Each officer serves a one-year term, until his or her successor is elected and qualifies.
27
Morgan Stanley Institutional Fund, Inc.
Annual Report — December 31, 2019
Adviser and Administrator
Morgan Stanley Investment Management Inc.
522 Fifth Avenue
New York, New York 10036
Distributor
Morgan Stanley Distribution, Inc.
522 Fifth Avenue
New York, New York 10036
Dividend Disbursing and Transfer Agent
DST Asset Manager Solutions, Inc.
2000 Crown Colony Drive
Quincy, Massachusetts 02169
Custodian
State Street Bank and Trust Company
One Lincoln Street
Boston, Massachusetts 02111
Legal Counsel
Dechert LLP
1095 Avenue of the Americas
New York, New York 10036
Counsel to the Independent Directors
Perkins Coie LLP
1155 Avenue of the Americas
New York, New York 10036
Independent Registered Public Accounting Firm
Ernst & Young LLP
200 Clarendon Street
Boston, Massachusetts 02116
Reporting to Shareholders
Each Morgan Stanley fund provides a complete schedule of portfolio holdings in its Semi-Annual and the Annual Reports within 60 days of the end of the fund's second and fourth fiscal quarters. The Semi-Annual and Annual Reports are filed electronically with the Securities and Exchange Commission ("SEC") on Form N-CSRS and Form N-CSR, respectively. Morgan Stanley also delivers the Semi-Annual and Annual Reports to fund shareholders and makes these reports available on its public website, www.morganstanley.com/im/shareholderreports. Each Morgan Stanley non-money market fund also files a complete schedule of portfolio holdings with the SEC for the fund's first and third fiscal quarters as an attachment to Form N-PORT. Morgan Stanley does not deliver the reports for the first and third fiscal quarters to shareholders, nor are the reports posted to the Morgan Stanley public website. However, the holdings for each money market fund are posted to the Morgan Stanley public website. You may obtain the Form N-PORT filings (as well as the Form N-CSR and N-CSRS filings) by accessing the SEC's website, www.sec.gov. You can also request copies of these materials, upon payment of a duplicating fee, by electronic request at the SEC's email address (publicinfo@sec.gov).
Proxy Voting Policies and Procedures and Proxy Voting Record
You may obtain a copy of the Company's Proxy Voting Policy and Procedures and information regarding how the Company voted proxies relating to portfolio securities during the most recent twelve-month period ended June 30, without charge, upon request, by calling toll free 1 (800) 548-7786 or by visiting our website at www.morganstanley.com/im/shareholderreports. This information is also available on the SEC's website at www.sec.gov.
This report is authorized for distribution only when preceded or accompanied by a prospectus or summary prospectus of the applicable fund of Morgan Stanley Institutional Fund, Inc., which describes in detail the fund's investment policies, risks, fees and expenses. Please read the prospectus carefully before you invest or send money. For additional information, including information regarding the investments comprising the Fund, please visit our website at www.morganstanley.com/im/shareholderreports or call toll free 1 (800) 548-7786.
28
Printed in U.S.A.
This Report has been prepared for shareholders and may be distributed to others only if preceded or accompanied by a current prospectus.
Morgan Stanley Investment Management Inc.
522 Fifth Avenue
New York, New York 10036
© 2020 Morgan Stanley. Morgan Stanley Distribution, Inc.

IFIGCNPANN
2916013 EXP. 02.28.21

Morgan Stanley Institutional Fund, Inc.
Global Core
Portfolio
Annual Report
December 31, 2019
Beginning on January 1, 2021, as permitted by regulations adopted by the Securities and Exchange Commission ("SEC"), paper copies of the Fund's Annual and Semi-Annual Reports to Shareholders ("Shareholder Reports") will no longer be sent by mail, unless you specifically request paper copies of the Shareholder Reports from the Fund or from your financial intermediary, such as a broker-dealer or a bank. Instead, the Shareholder Reports will be made available on the Fund's website, https://www.morganstanley.com/im/shareholderreports and you will be notified by mail each time a Shareholder Report is posted and provided with a website link to access the Shareholder Report. If you already elected to receive Shareholder Reports electronically, you will not be affected by this change and you need not take any action. You may elect to receive Shareholder Reports and other communications from the Fund electronically anytime by contacting your financial intermediary or, if you are a direct investor, please follow the instructions on the envelope.
Beginning on January 1, 2019, you may elect to receive all future Shareholder Reports in paper free of charge. If you invest through a financial intermediary, you can contact your financial intermediary to request that you continue to receive paper copies of your Shareholder Reports. If you invest directly with the Fund, please follow the instructions on the envelope to let the Fund know you wish to continue receiving paper copies of your Shareholder Reports. Your election to receive Shareholder Reports in paper will apply to all funds held in your account if you invest through your financial intermediary or all funds held with the fund complex if you invest directly with a fund.

Morgan Stanley Institutional Fund, Inc.
Annual Report — December 31, 2019
Shareholders' Letter | | | 2 | | |
Expense Example | | | 3 | | |
Investment Overview | | | 4 | | |
Portfolio of Investments | | | 6 | | |
Statement of Assets and Liabilities | | | 7 | | |
Statement of Operations | | | 8 | | |
Statements of Changes in Net Assets | | | 9 | | |
Financial Highlights | | | 10 | | |
Notes to Financial Statements | | | 14 | | |
Report of Independent Registered Public Accounting Firm | | | 20 | | |
Federal Tax Notice | | | 21 | | |
Privacy Notice | | | 22 | | |
Director and Officer Information | | | 24 | | |
This report is authorized for distribution only when preceded or accompanied by a prospectus or summary prospectus of the applicable Fund of Morgan Stanley Institutional Fund, Inc. To receive a prospectus and/or statement of additional information ("SAI"), which contains more complete information such as investment objectives, charges, expenses, policies for voting proxies, risk considerations and describes in detail each of the Fund's investment policies to the prospective investor, please call toll free 1 (800) 548-7786. Please read the prospectuses carefully before you invest or send money.
Additionally, you can access information about the Fund, including performance, characteristics and investment team commentary, through Morgan Stanley Investment Management's website: www.morganstanley.com/im/shareholderreports.
Market forecasts provided in this report may not necessarily come to pass. There is no guarantee that any sectors mentioned will continue to perform as discussed herein or that securities in such sectors will be held by the Fund in the future. There is no assurance that a fund will achieve its investment objective. Funds are subject to market risk, which is the possibility that market values of securities owned by the Fund will decline and, therefore, the value of the Fund's shares may be less than what you paid for them. Accordingly, you can lose money investing in this Fund. Please see the prospectus for more complete information on investment risks.
1
Morgan Stanley Institutional Fund, Inc.
Annual Report — December 31, 2019
Shareholders' Letter (unaudited)
Dear Shareholders,
We are pleased to provide this Annual Report, in which you will learn how your investment in Global Core Portfolio (the "Fund") performed during the latest twelve-month period.
Morgan Stanley Investment Management is a client-centric, investor-led organization. Our global presence, intellectual capital, and breadth of products and services enable us to partner with investors to meet the evolving challenges of today's financial markets. We aim to deliver superior investment service and to empower our clients to make the informed decisions that help them reach their investment goals.
As always, we thank you for selecting Morgan Stanley Investment Management, and look forward to working with you in the months and years ahead.
Sincerely,

John H. Gernon
President and Principal Executive Officer
January 2020
2
Morgan Stanley Institutional Fund, Inc.
Annual Report — December 31, 2019
Expense Example (unaudited)
Global Core Portfolio
As a shareholder of the Fund, you incur two types of costs: (1) transactional costs; and (2) ongoing costs, which may include advisory fees, administration fees, distribution and shareholder services fees and other Fund expenses. This example is intended to help you understand your ongoing costs (in dollars) of investing in the Fund and to compare these costs with the ongoing costs of investing in other mutual funds.
This example is based on an investment of $1,000 invested at the beginning of the six-month period ended December 31, 2019 and held for the entire six-month period.
Actual Expenses
The table below provides information about actual account values and actual expenses. You may use the information in this table, together with the amount you invested, to estimate the expenses that you paid over the period. Simply divide your account value by $1,000 (for example, an $8,600 account value divided by $1,000 = 8.6), then multiply the result by the number in the table under the heading entitled "Actual Expenses Paid During Period" to estimate the expenses you paid on your account during this period.
Hypothetical Example for Comparison Purposes
The table below provides information about hypothetical account values and hypothetical expenses based on the Fund's actual expense ratio and an assumed rate of return of 5% per year before expenses, which is not the Fund's actual return. The hypothetical account values and expenses may not be used to estimate the actual ending account balance or expenses you paid for the period. You may use this information to compare the ongoing costs of investing in the Fund and other funds. To do so, compare this 5% hypothetical example with the 5% hypothetical examples that appear in the shareholder reports of the other funds.
Please note that the expenses shown in the table are meant to highlight your ongoing costs only and do not reflect any transactional costs, such as sales charges (loads). Therefore, the information for each class in the table is useful in comparing ongoing costs only, and will not help you determine the relative total costs of owning different funds. In addition, if these transactional costs were included, your costs would have been higher.
| | | Beginning
Account
Value
7/1/19 | | Actual Ending
Account
Value
12/31/19 | | Hypothetical
Ending Account
Value | | Actual
Expenses
Paid
During
Period* | | Hypothetical
Expenses Paid
During Period* | | Net
Expense
Ratio
During
Period** | |
Global Core Portfolio Class I | | $ | 1,000.00 | | | $ | 1,106.80 | | | $ | 1,020.32 | | | $ | 5.15 | | | $ | 4.94 | | | | 0.97 | % | |
Global Core Portfolio Class A | | | 1,000.00 | | | | 1,104.50 | | | | 1,018.40 | | | | 7.16 | | | | 6.87 | | | | 1.35 | | |
Global Core Portfolio Class C | | | 1,000.00 | | | | 1,101.00 | | | | 1,014.62 | | | | 11.12 | | | | 10.66 | | | | 2.10 | | |
Global Core Portfolio Class IS | | | 1,000.00 | | | | 1,106.30 | | | | 1,020.42 | | | | 5.04 | | | | 4.84 | | | | 0.95 | | |
* Expenses are calculated using each Fund Class' annualized net expense ratio (as disclosed), multiplied by the average account value over the period and multiplied by 184/365 (to reflect the most recent one-half year period).
** Annualized.
3
Morgan Stanley Institutional Fund, Inc.
Annual Report — December 31, 2019
Investment Overview (unaudited)
Global Core Portfolio
The Fund seeks long-term capital appreciation.
Performance
For the fiscal year ended December 31, 2019, the Fund's Class I shares had a total return based on net asset value and reinvestment of distributions per share of 30.96%, net of fees. The Fund's Class I shares outperformed the Fund's benchmark, the MSCI World Net Index (the "Index"), which returned 27.67%.
Please keep in mind that double-digit returns are highly unusual and cannot be sustained. Investors should also be aware that these returns were primarily achieved during favorable market conditions.
Factors Affecting Performance
• The Fund returned strong performance on both an absolute and relative basis in 2019.
• The correction in December 2018 set the market up for recovery and strength early in 2019, with the U.S. region resuming leadership versus other parts of the world once again during the first half of 2019.
• Correctly positioned entering 2019, we had an underweight to defensives, maintained an overweight to growth, and had previously added in some value exposure in the form of energy and financials. The addition of value had proved to be too early from a nearer-term timing standpoint at the end of 2018, yet was successful over the longer term in the first half of 2019, contributing to performance as the market gathered strength.
• During the second quarter of 2019 the market became short-term overbought and vulnerable to correction. We therefore added some defensive bond proxy stocks in the form of real estate investment trusts (REITs) and utilities prior to the summer months, a correct decision that also contributed to performance.
• As it entered the second half of 2019, the Fund continued to hold both growth and value stocks, with some exposure to more defensive bond proxy stocks in terms of utilities and REITs to help mitigate market volatility throughout the summer.
• Exiting the summer months, we somewhat reduced the defensive positioning of the Fund. The reduction was due to expectations that the market would break out of its trading range as a result of easier earnings comparisons against the fourth
quarter of 2018, a strengthening U.S. housing market, combined accommodative U.S. Federal Reserve and European Central Bank stimulus policy, overly negative investor sentiment, and potential resolution to the U.S. versus China trade dispute. We increased the Fund weighting to value names going into year-end, which served us well. Value cyclical stocks performed strongly into year-end. Although growth somewhat lagged, we correctly maintained our weighting moving into 2020.
• From a geographic standpoint, the extreme underperformance of non-U.S. stocks relative to U.S. stocks continued from 2018 into the beginning of 2019. Remaining more defensive in the European region and staying underweight Japan were correct decisions that positively contributed to performance.
• Yet with valuations of Asia technology versus their U.S. technology peers at extreme lows, our decision in early 2019 to maintain weighting in Asia technology stocks paid off. The group began to outperform its U.S. counterparts meaningfully by the end of the summer. Asia technology was the largest overweight in the portfolio in 2019 and remains so entering 2020.
• The Fund's consistent underweight to Japan in 2019 was a positive contributor to performance. Not only do we struggle quantitatively to find factors that have persistence, but we also struggle to find specific stocks that persistently outperform. This poses a longer-term risk, and the team remained negative on the region.
• Within stock selection, the largest detractors were a U.S.-based health services company weighed down by fears of increased government regulation, as well as a Spanish bank negatively impacted by low economic growth in Europe, and a U.S.-based energy company weighed down by sector decline.
• The Fund benefited the most from stock positions in consumer discretionary and technology, most notably a U.S.-based global technology and services company, a U.S.-based global payments and technology company, a China-based internet company, and a China-based semiconductor company. Another top contributor to performance for the period was a French luxury goods manufacturer.
Management Strategies
• There have been no changes to our investment process during the period. Applied Equity Advisors'
4
Morgan Stanley Institutional Fund, Inc.
Annual Report — December 31, 2019
Investment Overview (unaudited) (cont'd)
Global Core Portfolio
investment process is comprised of two parts: a Factor Timing Engine and a Stock Selection Engine. The first step, the Factor Timing Engine, takes into account not only what market factors or areas of the market are in leadership, but also how much momentum a particular factor has, whether that factor is cheap or expensive, and whether the timing is right to be tilted toward that factor. The timing decision comes down to the team's judgment and our combined decades of experience in factor investing. With regard to the Factor Timing Engine, investing in a particular area of the market that shows cheap historical valuation levels may not appear to be advantageous at first, but if chosen correctly, sticking with that investment often proves to be successful over the longer term. The Stock Selection Engine begins its work once the desired factor positioning is understood. There are three steps to the Stock Selection Engine: 1. regression analysis to determine the drivers of a particular stock's price performance, 2. Sustainability Analysis, and 3. further evaluation of the company fundamentals. The result is a highly active portfolio of fundamentally attractive stocks which the team believes could benefit from what we have identified to be quantitative investment styles likely to outperform in each region.

* Minimum Investment for Class I shares
** Commenced Operations on May 27, 2016.
In accordance with SEC regulations, the Fund's performance shown assumes that all recurring fees (including management fees) were deducted and all dividends and distributions were reinvested. The performance of Class A, C and IS shares will vary from the performance of Class I shares and will be negatively impacted by additional fees assessed to those classes (if applicable).
Performance Compared to the MSCI World Net Index(1) and the Lipper Global Large-Cap Core Funds Index(2)
| | | Period Ended December 31, 2019
Total Returns(3) | |
| | | | | Average Annual | |
| | | One
Year | | Five
Years | | Ten
Years | | Since
Inception(5) | |
Fund — Class I Shares
w/o sales charges(4) | | | 30.96 | % | | | — | | | | — | | | | 8.86 | % | |
Fund — Class A Shares
w/o sales charges(4) | | | 30.36 | | | | — | | | | — | | | | 8.44 | | |
Fund — Class A Shares with
maximum 5.25% sales charges(4) | | | 23.54 | | | | — | | | | — | | | | 6.84 | | |
Fund — Class C Shares
w/o sales charges(4) | | | 29.44 | | | | — | | | | — | | | | 7.65 | | |
Fund — Class C Shares with
maximum 1.00% deferred
sales charges(4) | | | 28.44 | | | | — | | | | — | | | | 7.65 | | |
Fund — Class IS Shares
w/o sales charges(4) | | | 30.90 | | | | — | | | | — | | | | 8.88 | | |
MSCI World Net Index | | | 27.67 | | | | — | | | | — | | | | 12.06 | | |
Lipper Global Large-Cap Core
Funds Index | | | 27.78 | | | | — | | | | — | | | | 11.64 | | |
Performance data quoted represents past performance, which is no guarantee of future results, and current performance may be lower or higher than the figures shown. Performance assumes that all dividends and distributions, if any, were reinvested. For the most recent month-end performance figures, please visit www.morganstanley.com/im/shareholderreports. Investment return and principal value will fluctuate so that Fund shares, when redeemed, may be worth more or less than their original cost. Total returns do not reflect the deduction of taxes that a shareholder would pay on Fund distributions or the redemption of Fund shares. Performance of share classes will vary due to difference in sales charges and expenses.
(1) The MSCI World Net Index is a free float-adjusted market capitalization weighted index designed to measure the equity market performance of developed markets. The term "free float" represents the portion of shares outstanding that are deemed to be available for purchase in the public equity markets by investors. The MSCI World Net Index currently consists of 23 developed market country indices. The performance of the Index is listed in U.S. dollars and assumes reinvestment of net dividends. Net total return indices reinvest dividends after the deduction of withholding taxes, using (for international indices) a tax rate applicable to non-resident institutional investors who do not benefit from double taxation treaties. The Index is unmanaged and its returns do not include any sales charges or fees. Such costs would lower performance. It is not possible to invest directly in an index.
(2) The Lipper Global Large-Cap Core Funds Index is an equally weighted performance index of the largest qualifying funds (based on net assets) in the Lipper Global Large-Cap Core Funds classification. The Index, which is adjusted for capital gains distributions and income dividends, is unmanaged and should not be considered an investment. There are currently 10 funds represented in this Index. As of the date of this report, the Fund was in the Lipper Global Large-Cap Core Funds classification.
(3) Total returns for the Fund reflect fees waived and expenses reimbursed, if applicable, by the Adviser (as defined herein). Without such waivers and reimbursements, total returns would have been lower.
(4) Commenced operations on May 27, 2016.
(5) For comparative purposes, average annual since inception returns listed for the Indexes refer to the inception date of the Fund, not the inception of the Index.
5
Morgan Stanley Institutional Fund, Inc.
Annual Report — December 31, 2019
Portfolio of Investments
Global Core Portfolio
| | | Shares | | Value
(000) | |
Common Stocks (97.3%) | |
China (11.8%) | |
Alibaba Group Holding Ltd. ADR (a) | | | 3,223 | | | $ | 683 | | |
NetEase, Inc. ADR | | | 511 | | | | 157 | | |
Tencent Holdings Ltd. ADR | | | 11,481 | | | | 551 | | |
| | | | 1,391 | | |
France (7.5%) | |
Airbus SE ADR | | | 10,690 | | | | 393 | | |
LVMH Moet Hennessy Louis Vuitton SE | | | 1,059 | | | | 492 | | |
| | | | 885 | | |
India (2.8%) | |
HDFC Bank Ltd. ADR | | | 5,286 | | | | 335 | | |
Ireland (2.2%) | |
CRH PLC ADR | | | 2,874 | | | | 116 | | |
Ryanair Holdings PLC ADR (a) | | | 1,582 | | | | 138 | | |
| | | | 254 | | |
Japan (1.8%) | |
Nippon Telegraph & Telephone Corp. ADR | | | 4,277 | | | | 216 | | |
Panama (1.3%) | |
Copa Holdings SA, Class A | | | 1,442 | | | | 156 | | |
Taiwan (3.0%) | |
Taiwan Semiconductor Manufacturing Co., Ltd. ADR | | | 6,139 | | | | 357 | | |
United Kingdom (6.5%) | |
Diageo PLC ADR | | | 3,546 | | | | 597 | | |
Experian PLC ADR | | | 4,865 | | | | 166 | | |
| | | | 763 | | |
United States (60.4%) | |
American Electric Power Co., Inc. | | | 1,463 | | | | 138 | | |
Ameriprise Financial, Inc. | | | 1,646 | | | | 274 | | |
Apple, Inc. | | | 2,023 | | | | 594 | | |
Charles Schwab Corp. (The) | | | 1,303 | | | | 62 | | |
Cigna Corp. (a) | | | 427 | | | | 87 | | |
Comcast Corp., Class A | | | 4,427 | | | | 199 | | |
ConocoPhillips | | | 2,400 | | | | 156 | | |
Danaher Corp. | | | 2,238 | | | | 344 | | |
Essex Property Trust, Inc. REIT | | | 906 | | | | 273 | | |
Estee Lauder Cos., Inc. (The), Class A | | | 1,345 | | | | 278 | | |
Extra Space Storage, Inc. REIT | | | 683 | | | | 72 | | |
Ferrari N.V. | | | 2,402 | | | | 398 | | |
Fortune Brands Home & Security, Inc. | | | 2,174 | | | | 142 | | |
JPMorgan Chase & Co. | | | 3,546 | | | | 494 | | |
Lennar Corp., Class A | | | 4,471 | | | | 249 | | |
Lululemon Athletica, Inc. (a) | | | 1,313 | | | | 304 | | |
Mastercard, Inc., Class A | | | 2,652 | | | | 792 | | |
McDonald's Corp. | | | 1,290 | | | | 255 | | |
Microsoft Corp. | | | 2,561 | | | | 404 | | |
NextEra Energy, Inc. | | | 995 | | | | 241 | | |
Northern Trust Corp. | | | 1,302 | | | | 138 | | |
Starbucks Corp. | | | 769 | | | | 68 | | |
STORE Capital Corp. REIT | | | 7,113 | | | | 265 | | |
SVB Financial Group (a) | | | 1,056 | | | | 265 | | |
| | | Shares | | Value
(000) | |
Target Corp. | | | 757 | | | $ | 97 | | |
Veeva Systems, Inc., Class A (a) | | | 589 | | | | 83 | | |
VMware, Inc., Class A (a) | | | 1,437 | | | | 218 | | |
Welltower, Inc. REIT | | | 2,994 | | | | 245 | | |
| | | | 7,135 | | |
Total Common Stocks (Cost $8,399) | | | 11,492 | | |
Investment Company (1.8%) | |
Vanguard FTSE Europe ETF (Cost $197) | | | 3,599 | | | | 211 | | |
Short-Term Investment (0.7%) | |
Investment Company (0.7%) | |
Morgan Stanley Institutional Liquidity
Funds — Treasury Securities Portfolio —
Institutional Class (See Note G)
(Cost $80) | | | 80,057 | | | | 80 | | |
Total Investments (99.8%) (Cost $8,676) (b) | | | 11,783 | | |
Other Assets in Excess of Liabilities (0.2%) | | | 21 | | |
Net Assets (100.0%) | | $ | 11,804 | | |
Country assignments and aggregations are based generally on third party vendor classifications and information, and may be different from the assignments and aggregations under the policies set forth in the Fund's prospectus and/or statement of additional information relating to geographic classifications.
(a) Non-income producing security.
(b) At December 31, 2019, the aggregate cost for federal income tax purposes is approximately $8,683,000. The aggregate gross unrealized appreciation is approximately $3,104,000 and the aggregate gross unrealized depreciation is approximately $4,000, resulting in net unrealized appreciation of approximately $3,100,000.
ADR American Depositary Receipt.
ETF Exchange Traded Fund.
REIT Real Estate Investment Trust.
Portfolio Composition
Classification | | Percentage of
Total Investments | |
Other* | | | 48.8 | % | |
Banks | | | 9.3 | | |
Equity Real Estate Investment Trusts (REITs) | | | 7.3 | | |
Textiles, Apparel & Luxury Goods | | | 6.7 | | |
Information Technology Services | | | 6.7 | | |
Internet & Direct Marketing Retail | | | 5.8 | | |
Software | | | 5.3 | | |
Beverages | | | 5.1 | | |
Tech Hardware, Storage & Peripherals | | | 5.0 | | |
Total Investments | | | 100.0 | % | |
* Industries and/or investment types representing less than 5% of total investments.
The accompanying notes are an integral part of the financial statements.
6
Morgan Stanley Institutional Fund, Inc.
Annual Report — December 31, 2019
Statement of Assets and Liabilities | | December 31, 2019
(000) | |
Assets: | |
Investments in Securities of Unaffiliated Issuers, at Value (Cost $8,596) | | $ | 11,703 | | |
Investment in Security of Affiliated Issuer, at Value (Cost $80) | | | 80 | | |
Total Investments in Securities, at Value (Cost $8,676) | | | 11,783 | | |
Receivable for Investments Sold | | | 41 | | |
Due from Adviser | | | 35 | | |
Dividends Receivable | | | 11 | | |
Tax Reclaim Receivable | | | 3 | | |
Receivable from Affiliate | | | — | @ | |
Other Assets | | | 23 | | |
Total Assets | | | 11,896 | | |
Liabilities: | |
Payable for Professional Fees | | | 42 | | |
Payable for Investments Purchased | | | 40 | | |
Payable for Transfer Agency Fees — Class I | | | 1 | | |
Payable for Transfer Agency Fees — Class A | | | 1 | | |
Payable for Transfer Agency Fees — Class C | | | — | @ | |
Payable for Transfer Agency Fees — Class IS | | | — | @ | |
Payable for Shareholder Services Fees — Class A | | | — | @ | |
Payable for Distribution and Shareholder Services Fees — Class C | | | 1 | | |
Payable for Custodian Fees | | | 1 | | |
Payable for Administration Fees | | | 1 | | |
Payable for Sub Transfer Agency Fees — Class I | | | — | @ | |
Payable for Sub Transfer Agency Fees — Class A | | | — | @ | |
Payable for Sub Transfer Agency Fees — Class C | | | — | @ | |
Other Liabilities | | | 5 | | |
Total Liabilities | | | 92 | | |
Net Assets | | $ | 11,804 | | |
Net Assets Consist of: | |
Paid-in-Capital | | $ | 8,998 | | |
Total Distributable Earnings | | | 2,806 | | |
Net Assets | | $ | 11,804 | | |
CLASS I: | |
Net Assets | | $ | 8,157 | | |
| Shares Outstanding $0.001 par value shares of beneficial interest (unlimited shares authorized) (not in 000's) | | | 618,635 | | |
Net Asset Value, Offering and Redemption Price Per Share | | $ | 13.19 | | |
CLASS A: | |
Net Assets | | $ | 2,186 | | |
| Shares Outstanding $0.001 par value shares of beneficial interest (unlimited shares authorized) (not in 000's) | | | 165,919 | | |
Net Asset Value, Redemption Price Per Share | | $ | 13.17 | | |
Maximum Sales Load | | | 5.25 | % | |
Maximum Sales Charge | | $ | 0.73 | | |
Maximum Offering Price Per Share | | $ | 13.90 | | |
CLASS C: | |
Net Assets | | $ | 1,448 | | |
| Shares Outstanding $0.001 par value shares of beneficial interest (unlimited shares authorized) (not in 000's) | | | 111,678 | | |
Net Asset Value, Offering and Redemption Price Per Share | | $ | 12.97 | | |
CLASS IS: | |
Net Assets | | $ | 13 | | |
| Shares Outstanding $0.001 par value shares of beneficial interest (unlimited shares authorized) (not in 000's) | | | 1,008 | | |
Net Asset Value, Offering and Redemption Price Per Share | | $ | 13.18 | | |
@ Amount is less than $500.
The accompanying notes are an integral part of the financial statements.
7
Morgan Stanley Institutional Fund, Inc.
Annual Report — December 31, 2019
Statement of Operations | | Year Ended
December 31, 2019
(000) | |
Investment Income: | |
Dividends from Securities of Unaffiliated Issuers (Net of $5 of Foreign Taxes Withheld) | | $ | 163 | | |
Dividends from Security of Affiliated Issuer (Note G) | | | 2 | | |
Total Investment Income | | | 165 | | |
Expenses: | |
Professional Fees | | | 97 | | |
Advisory Fees (Note B) | | | 77 | | |
Registration Fees | | | 56 | | |
Shareholder Services Fees — Class A (Note D) | | | 5 | | |
Distribution and Shareholder Services Fees — Class C (Note D) | | | 13 | | |
Shareholder Reporting Fees | | | 12 | | |
Transfer Agency Fees — Class I (Note E) | | | 2 | | |
Transfer Agency Fees — Class A (Note E) | | | 2 | | |
Transfer Agency Fees — Class C (Note E) | | | 2 | | |
Transfer Agency Fees — Class IS (Note E) | | | 2 | | |
Administration Fees (Note C) | | | 8 | | |
Custodian Fees (Note F) | | | 6 | | |
Directors' Fees and Expenses | | | 5 | | |
Pricing Fees | | | 3 | | |
Sub Transfer Agency Fees — Class I | | | — | @ | |
Sub Transfer Agency Fees — Class A | | | 1 | | |
Sub Transfer Agency Fees — Class C | | | 1 | | |
Other Expenses | | | 14 | | |
Total Expenses | | | 306 | | |
Expenses Reimbursed by Adviser (Note B) | | | (103 | ) | |
Waiver of Advisory Fees (Note B) | | | (77 | ) | |
Reimbursement of Class Specific Expenses — Class A (Note B) | | | (— | @) | |
Reimbursement of Class Specific Expenses — Class C (Note B) | | | (1 | ) | |
Reimbursement of Class Specific Expenses — Class IS (Note B) | | | (2 | ) | |
Rebate from Morgan Stanley Affiliate (Note G) | | | (— | @) | |
Net Expenses | | | 123 | | |
Net Investment Income | | | 42 | | |
Realized Gain: | |
Investments Sold | | | 54 | | |
Foreign Currency Translation | | | — | @ | |
Net Realized Gain | | | 54 | | |
Change in Unrealized Appreciation (Depreciation): | |
Investments | | | 2,613 | | |
Net Realized Gain and Change in Unrealized Appreciation (Depreciation) | | | 2,667 | | |
Net Increase in Net Assets Resulting from Operations | | $ | 2,709 | | |
@ Amount is less than $500.
The accompanying notes are an integral part of the financial statements.
8
Morgan Stanley Institutional Fund, Inc.
Annual Report — December 31, 2019
Statements of Changes in Net Assets | | Year Ended
December 31, 2019
(000) | | Year Ended
December 31, 2018
(000) | |
Increase (Decrease) in Net Assets: | |
Operations: | |
Net Investment Income | | $ | 42 | | | $ | 103 | | |
Net Realized Gain | | | 54 | | | | 35 | | |
Net Change in Unrealized Appreciation (Depreciation) | | | 2,613 | | | | (2,135 | ) | |
Net Increase (Decrease) in Net Assets Resulting from Operations | | | 2,709 | | | | (1,997 | ) | |
Dividends and Distributions to Shareholders: | |
Class I | | | (57 | ) | | | (54 | ) | |
Class A | | | (9 | ) | | | (4 | ) | |
Class IS | | | (— | @) | | | (— | @) | |
Paid-in-Capital: | |
Class I | | | (3 | ) | | | — | | |
Class A | | | (1 | ) | | | — | | |
Class IS | | | (— | @) | | | — | | |
Total Dividends and Distributions to Shareholders | | | (70 | ) | | | (58 | ) | |
Capital Share Transactions:(1) | |
Class I: | |
Subscribed | | | 342 | | | | 743 | | |
Distributions Reinvested | | | 60 | | | | 15 | | |
Redeemed | | | (821 | ) | | | (2,928 | ) | |
Class A: | |
Subscribed | | | 1,100 | | | | 340 | | |
Distributions Reinvested | | | 10 | | | | 4 | | |
Redeemed | | | (688 | ) | | | (691 | ) | |
Class C: | |
Subscribed | | | 135 | | | | 422 | | |
Redeemed | | | (352 | ) | | | (89 | ) | |
Class IS: | |
Distributions Reinvested | | | — | @ | | | — | | |
Net Decrease in Net Assets Resulting from Capital Share Transactions | | | (214 | ) | | | (2,184 | ) | |
Total Increase (Decrease) in Net Assets | | | 2,425 | | | | (4,239 | ) | |
Net Assets: | |
Beginning of Period | | | 9,379 | | | | 13,618 | | |
End of Period | | $ | 11,804 | | | $ | 9,379 | | |
(1) Capital Share Transactions: | |
Class I: | |
Shares Subscribed | | | 27 | | | | 60 | | |
Shares Issued on Distributions Reinvested | | | 5 | | | | 1 | | |
Shares Redeemed | | | (77 | ) | | | (250 | ) | |
Net Decrease in Class I Shares Outstanding | | | (45 | ) | | | (189 | ) | |
Class A: | |
Shares Subscribed | | | 95 | | | | 29 | | |
Shares Issued on Distributions Reinvested | | | 1 | | | | — | @@ | |
Shares Redeemed | | | (60 | ) | | | (60 | ) | |
Net Increase (Decrease) in Class A Shares Outstanding | | | 36 | | | | (31 | ) | |
Class C: | |
Shares Subscribed | | | 12 | | | | 36 | | |
Shares Redeemed | | | (31 | ) | | | (8 | ) | |
Net Increase (Decrease) in Class C Shares Outstanding | | | (19 | ) | | | 28 | | |
Class IS: | |
Shares Issued on Distributions Reinvested | | | — | @@ | | | — | | |
@ Amount is less than $500.
@@ Amount is less than 500 shares.
The accompanying notes are an integral part of the financial statements.
9
Morgan Stanley Institutional Fund, Inc.
Annual Report — December 31, 2019
Financial Highlights
Global Core Portfolio
| | | Class I | |
| | | Year Ended December 31, | | Period from
May 27, 2016(1) to | |
Selected Per Share Data and Ratios | | 2019 | | 2018 | | 2017 | | December 31, 2016 | |
Net Asset Value, Beginning of Period | | $ | 10.15 | | | $ | 12.20 | | | $ | 10.03 | | | $ | 10.00 | | |
Income (Loss) from Investment Operations: | |
Net Investment Income(2) | | | 0.07 | | | | 0.12 | | | | 0.07 | | | | 0.05 | | |
Net Realized and Unrealized Gain (Loss) | | | 3.07 | | | | (2.09 | ) | | | 2.16 | | | | 0.06 | | |
Total from Investment Operations | | | 3.14 | | | | (1.97 | ) | | | 2.23 | | | | 0.11 | | |
Distributions from and/or in Excess of: | |
Net Investment Income | | | (0.09 | ) | | | (0.08 | ) | | | (0.06 | ) | | | (0.08 | ) | |
Paid-in-Capital | | | (0.01 | ) | | | — | | | | (0.00 | )(3) | | | — | | |
Total Distributions | | | (0.10 | ) | | | (0.08 | ) | | | (0.06 | ) | | | (0.08 | ) | |
Net Asset Value, End of Period | | $ | 13.19 | | | $ | 10.15 | | | $ | 12.20 | | | $ | 10.03 | | |
Total Return(4) | | | 30.96 | % | | | (16.15 | )% | | | 22.27 | % | | | 1.08 | %(7) | |
Ratios to Average Net Assets and Supplemental Data: | |
Net Assets, End of Period (Thousands) | | $ | 8,157 | | | $ | 6,738 | | | $ | 10,398 | | | $ | 6,517 | | |
Ratio of Expenses Before Expense Limitation | | | 2.73 | % | | | 2.53 | % | | | 2.89 | % | | | 3.73 | %(8) | |
Ratio of Expenses After Expense Limitation | | | 0.98 | %(5) | | | 1.00 | %(5) | | | 0.97 | %(5) | | | 0.98 | %(5)(8) | |
Ratio of Net Investment Income | | | 0.61 | %(5) | | | 0.97 | %(5) | | | 0.64 | %(5) | | | 0.82 | %(5)(8) | |
Ratio of Rebate from Morgan Stanley Affiliates | | | 0.00 | %(6) | | | 0.00 | %(6) | | | 0.00 | %(6) | | | 0.01 | %(8) | |
Portfolio Turnover Rate | | | 61 | % | | | 50 | % | | | 41 | % | | | 22 | %(7) | |
(1) Commencement of Operations.
(2) Per share amount is based on average shares outstanding.
(3) Amount is less than $0.005 per share.
(4) Calculated based on the net asset value as of the last business day of the period.
(5) The Ratio of Expenses After Expense Limitation and Ratio of Net Investment Income reflect the rebate of certain Fund expenses in connection with the investments in Morgan Stanley affiliates during the period. The effect of the rebate on the ratios is disclosed in the above table as "Ratio of Rebate from Morgan Stanley Affiliates."
(6) Amount is less than 0.005%.
(7) Not annualized.
(8) Annualized.
The accompanying notes are an integral part of the financial statements.
10
Morgan Stanley Institutional Fund, Inc.
Annual Report — December 31, 2019
Financial Highlights
Global Core Portfolio
| | | Class A | |
| | | Year Ended December 31, | | Period from
May 27, 2016(1) to | |
Selected Per Share Data and Ratios | | 2019 | | 2018 | | 2017 | | December 31, 2016 | |
Net Asset Value, Beginning of Period | | $ | 10.15 | | | $ | 12.18 | | | $ | 10.02 | | | $ | 10.00 | | |
Income (Loss) from Investment Operations: | |
Net Investment Income(2) | | | 0.03 | | | | 0.07 | | | | 0.03 | | | | 0.02 | | |
Net Realized and Unrealized Gain (Loss) | | | 3.05 | | | | (2.07 | ) | | | 2.15 | | | | 0.06 | | |
Total from Investment Operations | | | 3.08 | | | | (2.00 | ) | | | 2.18 | | | | 0.08 | | |
Distributions from and/or in Excess of: | |
Net Investment Income | | | (0.05 | ) | | | (0.03 | ) | | | (0.02 | ) | | | (0.06 | ) | |
Paid-in-Capital | | | (0.01 | ) | | | — | | | | (0.00 | )(3) | | | — | | |
Total Distributions | | | (0.06 | ) | | | (0.03 | ) | | | (0.02 | ) | | | (0.06 | ) | |
Net Asset Value, End of Period | | $ | 13.17 | | | $ | 10.15 | | | $ | 12.18 | | | $ | 10.02 | | |
Total Return(4) | | | 30.36 | % | | | (16.41 | )% | | | 21.82 | % | | | 0.83 | %(7) | |
Ratios to Average Net Assets and Supplemental Data: | |
Net Assets, End of Period (Thousands) | | $ | 2,186 | | | $ | 1,320 | | | $ | 1,962 | | | $ | 1,263 | | |
Ratio of Expenses Before Expense Limitation | | | 3.12 | % | | | 2.89 | % | | | 3.36 | % | | | 4.16 | %(8) | |
Ratio of Expenses After Expense Limitation | | | 1.35 | %(5) | | | 1.35 | %(5) | | | 1.35 | %(5) | | | 1.35 | %(5)(8) | |
Ratio of Net Investment Income | | | 0.26 | %(5) | | | 0.62 | %(5) | | | 0.25 | %(5) | | | 0.39 | %(5)(8) | |
Ratio of Rebate from Morgan Stanley Affiliates | | | 0.00 | %(6) | | | 0.00 | %(6) | | | 0.00 | %(6) | | | 0.00 | %(6)(8) | |
Portfolio Turnover Rate | | | 61 | % | | | 50 | % | | | 41 | % | | | 22 | %(7) | |
(1) Commencement of Operations.
(2) Per share amount is based on average shares outstanding.
(3) Amount is less than $0.005 per share.
(4) Calculated based on the net asset value which does not reflect sales charges, if applicable, as of the last business day of the period.
(5) The Ratio of Expenses After Expense Limitation and Ratio of Net Investment Income reflect the rebate of certain Fund expenses in connection with the investments in Morgan Stanley affiliates during the period. The effect of the rebate on the ratios is disclosed in the above table as "Ratio of Rebate from Morgan Stanley Affiliates."
(6) Amount is less than 0.005%.
(7) Not annualized.
(8) Annualized.
The accompanying notes are an integral part of the financial statements.
11
Morgan Stanley Institutional Fund, Inc.
Annual Report — December 31, 2019
Financial Highlights
Global Core Portfolio
| | | Class C | |
| | | Year Ended December 31, | | Period from
May 27, 2016(1) to | |
Selected Per Share Data and Ratios | | 2019 | | 2018 | | 2017 | | December 31, 2016 | |
Net Asset Value, Beginning of Period | | $ | 10.02 | | | $ | 12.08 | | | $ | 10.00 | | | $ | 10.00 | | |
Income (Loss) from Investment Operations: | |
Net Investment Loss(2) | | | (0.05 | ) | | | (0.01 | ) | | | (0.06 | ) | | | (0.02 | ) | |
Net Realized and Unrealized Gain (Loss) | | | 3.00 | | | | (2.05 | ) | | | 2.15 | | | | 0.06 | | |
Total from Investment Operations | | | 2.95 | | | | (2.06 | ) | | | 2.09 | | | | 0.04 | | |
Distributions from and/or in Excess of: | |
Net Investment Income | | | — | | | | — | | | | (0.01 | ) | | | (0.04 | ) | |
Net Asset Value, End of Period | | $ | 12.97 | | | $ | 10.02 | | | $ | 12.08 | | | $ | 10.00 | | |
Total Return(3) | | | 29.44 | % | | | (17.05 | )% | | | 20.92 | % | | | 0.41 | %(6) | |
Ratios to Average Net Assets and Supplemental Data: | |
Net Assets, End of Period (Thousands) | | $ | 1,448 | | | $ | 1,311 | | | $ | 1,246 | | | $ | 901 | | |
Ratio of Expenses Before Expense Limitation | | | 3.92 | % | | | 3.66 | % | | | 4.19 | % | | | 5.02 | %(7) | |
Ratio of Expenses After Expense Limitation | | | 2.10 | %(4) | | | 2.10 | %(4) | | | 2.10 | %(4) | | | 2.10 | %(4)(7) | |
Ratio of Net Investment Loss | | | (0.45 | )%(4) | | | (0.05 | )%(4) | | | (0.50 | )%(4) | | | (0.36 | )%(4)(7) | |
Ratio of Rebate from Morgan Stanley Affiliates | | | 0.00 | %(5) | | | 0.00 | %(5) | | | 0.00 | %(5) | | | 0.00 | %(5)(7) | |
Portfolio Turnover Rate | | | 61 | % | | | 50 | % | | | 41 | % | | | 22 | %(6) | |
(1) Commencement of Operations.
(2) Per share amount is based on average shares outstanding.
(3) Calculated based on the net asset value which does not reflect sales charges, if applicable, as of the last business day of the period.
(4) The Ratio of Expenses After Expense Limitation and Ratio of Net Investment Loss reflect the rebate of certain Fund expenses in connection with the investments in Morgan Stanley affiliates during the period. The effect of the rebate on the ratios is disclosed in the above table as "Ratio of Rebate from Morgan Stanley Affiliates."
(5) Amount is less than 0.005%.
(6) Not annualized.
(7) Annualized.
The accompanying notes are an integral part of the financial statements.
12
Morgan Stanley Institutional Fund, Inc.
Annual Report — December 31, 2019
Financial Highlights
Global Core Portfolio
| | | Class IS | |
| | | Year Ended December 31, | | Period from
May 27, 2016(1) to | |
Selected Per Share Data and Ratios | | 2019 | | 2018 | | 2017 | | December 31, 2016 | |
Net Asset Value, Beginning of Period | | $ | 10.15 | | | $ | 12.20 | | | $ | 10.03 | | | $ | 10.00 | | |
Income (Loss) from Investment Operations: | |
Net Investment Income(2) | | | 0.07 | | | | 0.13 | | | | 0.07 | | | | 0.05 | | |
Net Realized and Unrealized Gain (Loss) | | | 3.06 | | | | (2.09 | ) | | | 2.17 | | | | 0.06 | | |
Total from Investment Operations | | | 3.13 | | | | (1.96 | ) | | | 2.24 | | | | 0.11 | | |
Distributions from and/or in Excess of: | |
Net Investment Income | | | (0.09 | ) | | | (0.09 | ) | | | (0.07 | ) | | | (0.08 | ) | |
Paid-in-Capital | | | (0.01 | ) | | | — | | | | (0.00 | )(3) | | | — | | |
Total Distributions | | | (0.10 | ) | | | (0.09 | ) | | | (0.07 | ) | | | (0.08 | ) | |
Net Asset Value, End of Period | | $ | 13.18 | | | $ | 10.15 | | | $ | 12.20 | | | $ | 10.03 | | |
Total Return(4) | | | 30.90 | % | | | (16.10 | )% | | | 22.29 | % | | | 1.10 | %(7) | |
Ratios to Average Net Assets and Supplemental Data: | |
Net Assets, End of Period (Thousands) | | $ | 13 | | | $ | 10 | | | $ | 12 | | | $ | 10 | | |
Ratio of Expenses Before Expense Limitation | | | 18.98 | % | | | 19.09 | % | | | 18.67 | % | | | 19.70 | %(8) | |
Ratio of Expenses After Expense Limitation | | | 0.95 | %(5) | | | 0.95 | %(5) | | | 0.95 | %(5) | | | 0.95 | %(5)(8) | |
Ratio of Net Investment Income | | | 0.63 | %(5) | | | 1.06 | %(5) | | | 0.66 | %(5) | | | 0.84 | %(5)(8) | |
Ratio of Rebate from Morgan Stanley Affiliates | | | 0.00 | %(6) | | | 0.00 | %(6) | | | 0.00 | %(6) | | | 0.00 | %(6)(8) | |
Portfolio Turnover Rate | | | 61 | % | | | 50 | % | | | 41 | % | | | 22 | %(7) | |
(1) Commencement of Operations.
(2) Per share amount is based on average shares outstanding.
(3) Amount is less than $0.005 per share.
(4) Calculated based on the net asset value as of the last business day of the period.
(5) The Ratio of Expenses After Expense Limitation and Ratio of Net Investment Income reflect the rebate of certain Fund expenses in connection with the investments in Morgan Stanley affiliates during the period. The effect of the rebate on the ratios is disclosed in the above table as "Ratio of Rebate from Morgan Stanley Affiliates."
(6) Amount is less than 0.005%.
(7) Not annualized.
(8) Annualized.
The accompanying notes are an integral part of the financial statements.
13
Morgan Stanley Institutional Fund, Inc.
Annual Report — December 31, 2019
Notes to Financial Statements
Morgan Stanley Institutional Fund, Inc. (the "Company") is registered under the Investment Company Act of 1940, as amended (the "Act"), as an open-end management investment company. The Company is comprised of thirty-two separate, active, diversified and non-diversified funds (individually referred to as a "Fund," collectively as the "Funds"). The Company applies investment company accounting and reporting guidance.
The accompanying financial statements relate to the Global Core Portfolio. The Fund seeks long-term capital appreciation.
The Fund offers four classes of shares — Class I, Class A, Class C and Class IS.
A. Significant Accounting Policies: The following significant accounting policies are in conformity with U.S. generally accepted accounting principles ("GAAP"). Such policies are consistently followed by the Company in the preparation of its financial statements. GAAP may require management to make estimates and assumptions that affect the reported amounts and disclosures in the financial statements. Actual results may differ from those estimates.
In August 2018, the Financial Accounting Standards Board ("FASB") issued Accounting Standards Update ("ASU") 2018-13, Fair Value Measurement (Topic 820) — Disclosures Framework — Changes to Disclosure Requirements of Fair Value Measurement ("ASU 2018-13") which introduces new fair value disclosure requirements as well as eliminates and modifies certain existing fair value disclosure requirements. ASU 2018-13 would be effective for fiscal years beginning after December 15, 2019 and for interim periods within those fiscal years; however, management has elected to early adopt ASU 2018-13 as permitted by the standard. The impact of the Fund's adoption was limited to changes in the Fund's financial statement disclosures regarding fair value, primarily those disclosures related to transfers between levels of the fair value hierarchy and disclosure of the range and weighted average used to develop significant unobservable inputs for Level 3 fair value measurements, when applicable.
1. Security Valuation: (1) An equity portfolio security listed or traded on an exchange is valued at its latest reported sales price (or at the exchange official closing price if such exchange reports an official closing price), and if there were no sales on a given day and if there is no official exchange closing price for that day, the security is valued at
the mean between the last reported bid and asked prices if such bid and asked prices are available on the relevant exchanges. If only bid prices are available then the latest bid price may be used. Listed equity securities not traded on the valuation date with no reported bid and asked prices available on the exchange are valued at the mean between the current bid and asked prices obtained from one or more reputable brokers or dealers. In cases where a security is traded on more than one exchange, the security is valued on the exchange designated as the primary market; (2) all other equity portfolio securities for which over-the-counter ("OTC") market quotations are readily available are valued at the latest reported sales price (or at the market official closing price if such market reports an official closing price), and if there was no trading in the security on a given day and if there is no official closing price from relevant markets for that day, the security is valued at the mean between the last reported bid and asked prices if such bid and asked prices are available on the relevant markets. An unlisted equity security that does not trade on the valuation date and for which bid and asked prices from the relevant markets are unavailable is valued at the mean between the current bid and asked prices obtained from one or more reputable brokers or dealers; (3) certain portfolio securities may be valued by an outside pricing service/vendor approved by the Company's Board of Directors (the "Directors"). The pricing service/vendor may employ a pricing model that takes into account, among other things, bids, yield spreads and/or other market data and specific security characteristics. Alternatively, if a valuation is not available from an outside pricing service/vendor, and the security trades on an exchange, the security may be valued at its latest reported sale price (or at the exchange official closing price if such exchange reports an official closing price), prior to the time when assets are valued. If there are no sales on a given day and if there is no official exchange closing price for that day, the security is valued at the mean between the last reported bid and asked prices if such bid and asked prices are available in the relevant exchanges. If Morgan Stanley Investment Management Inc. (the "Adviser"), a wholly-owned subsidiary of Morgan Stanley, determines that the price provided by the outside pricing service/vendor or exchange does not reflect the security's fair value or is unable to provide a price, prices from brokers or dealers may also be utilized. In these circumstances, the value of
14
Morgan Stanley Institutional Fund, Inc.
Annual Report — December 31, 2019
Notes to Financial Statements (cont'd)
the security will be the mean of bid and asked prices obtained from brokers or dealers; (4) when market quotations are not readily available, including circumstances under which the Adviser determines that the closing price, last sale price or the mean between the last reported bid and asked prices are not reflective of a security's market value, portfolio securities are valued at their fair value as determined in good faith under procedures established by and under the general supervision of the Directors. Occasionally, developments affecting the closing prices of securities and other assets may occur between the times at which valuations of such securities are determined (that is, close of the foreign market on which the securities trade) and the close of business of the New York Stock Exchange ("NYSE"). If developments occur during such periods that are expected to materially affect the value of such securities, such valuations may be adjusted to reflect the estimated fair value of such securities as of the close of the NYSE, as determined in good faith by the Directors or by the Adviser using a pricing service and/or procedures approved by the Directors; and (5) investments in mutual funds, including the Morgan Stanley Institutional Liquidity Funds, are valued at the net asset value ("NAV") as of the close of each business day.
The Directors have responsibility for determining in good faith the fair value of the investments, and the Directors may appoint others, such as the Company's Adviser or a valuation committee, to assist the Directors in determining fair value and to make the actual calculations pursuant to the fair valuation methodologies previously approved by the Directors. Under procedures approved by the Directors, the Company's Adviser has formed a Valuation Committee whose members are approved by the Directors. The Valuation Committee provides administration and oversight of the Company's valuation policies and procedures, which are reviewed at least annually by the Directors. These procedures allow the Company to utilize independent pricing services, quotations from securities and financial instrument dealers and other market sources to determine fair value.
2. Fair Value Measurement: FASB Accounting Standards CodificationTM ("ASC") 820, "Fair Value Measurement" ("ASC 820"), defines fair value as the value that the
Fund would receive to sell an investment or pay to transfer a liability in a timely transaction with an independent buyer in the principal market, or in the absence of a principal market, the most advantageous market for the investment or liability. ASC 820 establishes a three-tier hierarchy to distinguish between (1) inputs that reflect the assumptions market participants would use in valuing an asset or liability developed based on market data obtained from sources independent of the reporting entity (observable inputs) and (2) inputs that reflect the reporting entity's own assumptions about the assumptions market participants would use in valuing an asset or liability developed based on the best information available in the circumstances (unobservable inputs) and to establish classification of fair value measurements for disclosure purposes. Various inputs are used in determining the value of the Fund's investments. The inputs are summarized in the three broad levels listed below:
• Level 1 – unadjusted quoted prices in active markets for identical investments
• Level 2 – other significant observable inputs (including quoted prices for similar investments, interest rates, prepayment speeds, credit risk, etc.)
• Level 3 – significant unobservable inputs including the Fund's own assumptions in determining the fair value of investments. Factors considered in making this determination may include, but are not limited to, information obtained by contacting the issuer, analysts, or the appropriate stock exchange (for exchange-traded securities), analysis of the issuer's financial statements or other available documents and, if necessary, available information concerning other securities in similar circumstances.
The inputs or methodology used for valuing securities are not necessarily an indication of the risk associated with investing in those securities and the determination of the significance of a particular input to the fair value measurement in its entirety requires judgment and considers factors specific to each security.
15
Morgan Stanley Institutional Fund, Inc.
Annual Report — December 31, 2019
Notes to Financial Statements (cont'd)
The following is a summary of the inputs used to value the Fund's investments as of December 31, 2019:
Investment Type | | Level 1
Unadjusted
quoted
prices
(000) | | Level 2
Other
significant
observable
inputs
(000) | | Level 3
Significant
unobservable
inputs
(000) | | Total
(000) | |
Assets: | |
Common Stocks | |
Aerospace & Defense | | $ | 393 | | | $ | — | | | $ | — | | | $ | 393 | | |
Airlines | | | 294 | | | | — | | | | — | | | | 294 | | |
Automobiles | | | 398 | | | | — | | | | — | | | | 398 | | |
Banks | | | 1,094 | | | | — | | | | — | | | | 1,094 | | |
Beverages | | | 597 | | | | — | | | | — | | | | 597 | | |
Building Products | | | 142 | | | | — | | | | — | | | | 142 | | |
Capital Markets | | | 474 | | | | — | | | | — | | | | 474 | | |
Construction Materials | | | 116 | | | | — | | | | — | | | | 116 | | |
Diversified
Telecommunication
Services | | | 216 | | | | — | | | | — | | | | 216 | | |
Electric Utilities | | | 379 | | | | — | | | | — | | | | 379 | | |
Entertainment | | | 157 | | | | — | | | | — | | | | 157 | | |
Equity Real Estate
Investment Trusts
(REITs) | | | 855 | | | | — | | | | — | | | | 855 | | |
Health Care
Equipment &
Supplies | | | 344 | | | | — | | | | — | | | | 344 | | |
Health Care
Providers & Services | | | 87 | | | | — | | | | — | | | | 87 | | |
Health Care
Technology | | | 83 | | | | — | | | | — | | | | 83 | | |
Hotels, Restaurants &
Leisure | | | 323 | | | | — | | | | — | | | | 323 | | |
Household Durables | | | 249 | | | | — | | | | — | | | | 249 | | |
Information Technology
Services | | | 792 | | | | — | | | | — | | | | 792 | | |
Interactive Media &
Services | | | 551 | | | | — | | | | — | | | | 551 | | |
Internet & Direct
Marketing Retail | | | 683 | | | | — | | | | — | | | | 683 | | |
Media | | | 199 | | | | — | | | | — | | | | 199 | | |
Multi-Line Retail | | | 97 | | | | — | | | | — | | | | 97 | | |
Oil, Gas & Consumable
Fuels | | | 156 | | | | — | | | | — | | | | 156 | | |
Personal Products | | | 278 | | | | — | | | | — | | | | 278 | | |
Professional Services | | | 166 | | | | — | | | | — | | | | 166 | | |
Semiconductors &
Semiconductor
Equipment | | | 357 | | | | — | | | | — | | | | 357 | | |
Software | | | 622 | | | | — | | | | — | | | | 622 | | |
Tech Hardware,
Storage &
Peripherals | | | 594 | | | | — | | | | — | | | | 594 | | |
Textiles, Apparel &
Luxury Goods | | | 796 | | | | — | | | | — | | | | 796 | | |
Total Common Stocks | | | 11,492 | | | | — | | | | — | | | | 11,492 | | |
Investment Company | | | 211 | | | | — | | | | — | | | | 211 | | |
Short-Term Investment | |
Investment Company | | | 80 | | | | — | | | | — | | | | 80 | | |
Total Assets | | $ | 11,783 | | | $ | — | | | $ | — | | | $ | 11,783 | | |
Transfers between investment levels may occur as the markets fluctuate and/or the availability of data used in an investment's valuation changes.
3. Foreign Currency Translation and Foreign Investments: The books and records of the Fund are maintained in U.S. dollars. Foreign currency amounts are translated into U.S. dollars as follows:
– investments, other assets and liabilities at the prevailing rate of exchange on the valuation date;
– investment transactions and investment income at the prevailing rates of exchange on the dates of such transactions.
Although the net assets of the Fund are presented at the foreign exchange rates and market values at the close of the period, the Fund does not isolate that portion of the results of operations arising as a result of changes in the foreign exchange rates from the fluctuations arising from changes in the market prices of securities held at period end. Similarly, the Fund does not isolate the effect of changes in foreign exchange rates from the fluctuations arising from changes in the market prices of securities sold during the period. Accordingly, realized and unrealized foreign currency gains (losses) on investments in securities are included in the reported net realized and unrealized gains (losses) on investment transactions and balances. However, pursuant to U.S. federal income tax regulations, gains and losses from certain foreign currency transactions and the foreign currency portion of gains and losses realized on sales and maturities of foreign denominated debt securities are treated as ordinary income for U.S. federal income tax purposes.
Net realized gains (losses) on foreign currency transactions represent net foreign exchange gains (losses) from foreign currency forward exchange contracts, disposition of foreign currencies, currency gains (losses) realized between the trade and settlement dates on securities transactions, and the difference between the amount of investment income and foreign withholding taxes recorded on the Fund's books and the U.S. dollar equivalent amounts actually received or paid. The change in unrealized currency gains (losses) on foreign currency transactions for the period is reflected in the Statement of Operations.
16
Morgan Stanley Institutional Fund, Inc.
Annual Report — December 31, 2019
Notes to Financial Statements (cont'd)
Foreign security and currency transactions may involve certain considerations and risks not typically associated with those of U.S. dollar denominated transactions as a result of, among other factors, fluctuations of exchange rates in relation to the U.S. dollar, the possibility of lower levels of governmental supervision and regulation of foreign security markets and the possibility of political or economic instability.
Governmental approval for foreign investments may be required in advance of making an investment under cercircumstances in some countries, and the extent of foreign investments in domestic companies may be subject to limitation in other countries. Foreign ownership limitations also may be imposed by the charters of individual companies to prevent, among other concerns, violations of foreign investment limitations. As a result, an additional class of shares (identified as "Foreign" in the Portfolio of Investments) may be created and offered for investment. The "local" and "foreign shares" market values may differ. In the absence of trading of the foreign shares in such markets, the Fund values the foreign shares at the closing exchange price of the local shares.
4. Indemnifications: The Company enters into contracts that contain a variety of indemnifications. The Company's maximum exposure under these arrangements is unknown. However, the Company has not had prior claims or losses pursuant to these contracts and expects the risk of loss to be remote.
5. Dividends and Distributions to Shareholders: Dividends and distributions to shareholders are recorded on the ex-dividend date. Dividends from net investment income, if any, are declared and paid annually. Net realized capital gains, if any, are distributed at least annually.
6. Security Transactions, Income and Expenses: Security transactions are accounted for on the trade date (date the order to buy or sell is executed). Realized gains and losses on the sale of investment securities are determined on the specific identified cost method. Dividend income and other distributions are recorded on the ex-dividend date (except for certain foreign dividends which may be recorded as soon as the Fund is informed of such dividends) net of applicable withholding taxes. Interest income is recognized on the accrual basis except where collection is in doubt. Discounts are accreted and premiums are amortized over the life of the respective securities.
Most expenses of the Company can be directly attributed to a particular Fund. Expenses which cannot be directly attributed are apportioned among the Funds based upon relative net assets or other appropriate methods. Income, expenses (other than class specific expenses — distribution and shareholder services, transfer agency and sub transfer agency fees) and realized and unrealized gains or losses are allocated to each class of shares based upon their relative net assets.
B. Advisory Fees: The Adviser, a wholly-owned subsidiary of Morgan Stanley, provides the Fund with advisory services under the terms of an Investment Advisory Agreement, paid quarterly, at the annual rate based on the daily net assets as follows:
First $750
million | | Next $750
million | | Over $1.5
billion | |
| | 0.75 | % | | | 0.70 | % | | | 0.65 | % | |
For the year ended December 31, 2019, the advisory fee rate (net of waiver/rebate) was equivalent to an annual effective rate of 0.00% of the Fund's average daily net assets.
The Adviser has agreed to reduce its advisory fee and/or reimburse the Fund so that total annual Fund operating expenses, excluding certain investment related expenses, taxes, interest and other extraordinary expenses (including litigation), will not exceed 1.00% for Class I shares, 1.35% for Class A shares, 2.10% for Class C shares and 0.95% for Class IS shares. The fee waivers and/or expense reimbursements will continue for at least one year from the date of the Fund's prospectus or until such time as the Directors act to discontinue all or a portion of such waivers and/or reimbursements when they deem such action is appropriate. For the year ended December 31, 2019, approximately $77,000 of advisory fees were waived and approximately $106,000 of other expenses were reimbursed by the Adviser pursuant to this arrangement.
C. Administration Fees: The Adviser also serves as Administrator to the Company and provides administrative services pursuant to an Administration Agreement for an annual fee, accrued daily and paid monthly, of 0.08% of the Fund's average daily net assets.
Under a Sub-Administration Agreement between the Administrator and State Street Bank and Trust Company ("State Street"), State Street provides certain administrative services to the Company. For such services, the Administrator pays State Street a portion of the fee the Administrator receives from the Fund.
17
Morgan Stanley Institutional Fund, Inc.
Annual Report — December 31, 2019
Notes to Financial Statements (cont'd)
D. Distribution and Shareholder Services Fees: Morgan Stanley Distribution, Inc. ("MSDI" or the "Distributor"), a wholly-owned subsidiary of the Adviser and an indirect subsidiary of Morgan Stanley, serves as the Company's Distributor of Fund shares pursuant to a Distribution Agreement. The Company has adopted a Shareholder Services Plan with respect to Class A shares pursuant to Rule 12b-1 under the Act. Under the Shareholder Services Plan, the Fund pays the Distributor a shareholder services fee, accrued daily and paid monthly, at an annual rate of 0.25% of the Fund's average daily net assets attributable to Class A shares.
The Company has adopted a Distribution and Shareholder Services Plan with respect to Class C shares pursuant to Rule 12b-1 under the Act. Under the Distribution and Shareholder Services Plan, the Fund pays the Distributor a distribution fee, accrued daily and paid monthly, at an annual rate of 0.75% and a shareholder services fee, accrued daily and paid monthly, at an annual rate of 0.25% of the Fund's average daily net assets attributable to Class C shares.
The distribution and shareholder services fees are used to support the expenses associated with servicing and maintaining accounts. The Distributor may compensate other parties for providing shareholder support services to investors who purchase Class A and Class C shares.
E. Dividend Disbursing and Transfer Agent: The Company's dividend disbursing and transfer agent is DST Asset Manager Solutions, Inc. ("DST"). Pursuant to a Transfer Agency Agreement, the Company pays DST a fee based on the number of classes, accounts and transactions relating to the Funds of the Company.
F. Custodian Fees: State Street (the "Custodian") also serves as Custodian for the Company in accordance with a Custodian Agreement. The Custodian holds cash, securities and other assets of the Company as required by the Act. Custody fees are payable monthly based on assets held in custody, investment purchases and sales activity and account maintenance fees, plus reimbursement for certain out-of-pocket expenses.
G. Security Transactions and Transactions with Affiliates: For the year ended December 31, 2019, purchases and sales of investment securities for the Fund, other than long-term U.S. Government securities and short-term investments were approximately $6,291,000 and $6,725,000, respectively. There were no purchases and sales of long-term
U.S. Government securities for the year ended December 31, 2019.
The Fund invests in the Institutional Class of the Morgan Stanley Institutional Liquidity Funds — Treasury Securities Portfolio (the "Liquidity Funds"), an open-end management investment company managed by the Adviser. Advisory fees paid by the Fund are reduced by an amount equal to its pro-rata share of the advisory and administration fees paid by the Fund due to its investment in the Liquidity Funds. For the year ended December 31, 2019, advisory fees paid were reduced by less than $500 relating to the Fund's investment in the Liquidity Funds.
A summary of the Fund's transactions in shares of affiliated investments during the year ended December 31, 2019 is as follows:
Affiliated
Investment
Company | | Value
December 31,
2018
(000) | | Purchases
at Cost
(000) | | Proceeds
from Sales
(000) | | Dividend
Income
(000) | |
Liquidity Funds | | $ | — | | | $ | 1,960 | | | $ | 1,880 | | | $ | 2 | | |
Affiliated
Investment
Company (cont'd) | | Realized
Gain (Loss)
(000) | | Change in
Unrealized
Appreciation
(Depreciation)
(000) | | Value
December 31,
2019
(000) | |
Liquidity Funds | | $ | — | | | $ | — | | | $ | 80 | | |
The Fund is permitted to purchase and sell securities ("cross-trade") from and to other Morgan Stanley funds as well as other funds and client accounts for which the Adviser or an affiliate of the Adviser serves as investment adviser, pursuant to procedures approved by the Directors in compliance with Rule 17a-7 under the Act (the "Rule"). Each cross-trade is executed at the current market price in compliance with provisions of the Rule. For the year ended December 31, 2019, the Fund did not engage in any cross-trade transactions.
The Fund has an unfunded Deferred Compensation Plan (the "Compensation Plan"), which allows each independent Director to defer payment of all, or a portion, of the fees he or she receives for serving on the Board of Directors. Each eligible Director generally may elect to have the deferred amounts credited with a return equal to the total return on one or more of the Morgan Stanley funds that are offered as investment options under the Compensation Plan. Appreciation/depreciation and distributions received from these investments are recorded with an offsetting increase/decrease in the deferred compensation obligation and do not affect the NAV of the Fund.
18
Morgan Stanley Institutional Fund, Inc.
Annual Report — December 31, 2019
Notes to Financial Statements (cont'd)
H. Federal Income Taxes: It is the Fund's intention to continue to qualify as a regulated investment company and distribute all of its taxable and tax-exempt income. Accordingly, no provision for federal income taxes is required in the financial statements.
The Fund may be subject to taxes imposed by countries in which it invests. Such taxes are generally based on income and/or capital gains earned or repatriated. Taxes are accrued based on net investment income, net realized gains and net unrealized appreciation as such income and/or gains are earned. Taxes may also be based on transactions in foreign currency and are accrued based on the value of investments denominated in such currency.
FASB ASC 740-10, "Income Taxes — Overall", sets forth a minimum threshold for financial statement recognition of the benefit of a tax position taken or expected to be taken in a tax return. Management has concluded there are no significant uncertain tax positions that would require recognition in the financial statements. If applicable, the Fund recognizes interest accrued related to unrecognized tax benefits in "Interest Expense" and penalties in "Other Expenses" in the Statement of Operations. The Fund files tax returns with the U.S. Internal Revenue Service, New York and various states. Generally, each of the tax years in the four-year period ended December 31, 2019 remains subject to examination by taxing authorities.
The tax character of distributions paid may differ from the character of distributions shown for GAAP purposes due to short-term capital gains being treated as ordinary income for tax purposes. The tax character of distributions paid during fiscal years 2019 and 2018 was as follows:
2019
Distributions
Paid From: | | 2018
Distributions
Paid From: | |
Ordinary
Income
(000) | | Paid-in-
Capital
(000) | | Ordinary
Income
(000) | |
| $ | 66 | | | $ | 4 | | | $ | 58 | | |
The amount and character of income and gains to be distributed are determined in accordance with income tax regulations which may differ from GAAP. These book/tax differences are either considered temporary or permanent in nature.
Temporary differences are attributable to differing book and tax treatments for the timing of the recognition of gains (losses) on certain investment transactions and the timing of the deductibility of certain expenses.
Permanent differences, primarily due to a nondeductible expense, resulted in the following reclassifications among the components of net assets at December 31, 2019:
Total
Distributable
Earnings
(000) | | Paid-in
Capital
(000) | |
| $ | 1 | | | $ | (1 | ) | |
At December 31, 2019, the Fund had no distributable earnings on a tax basis.
At December 31, 2019, the Fund had available for federal income tax purposes unused short-term capital losses of approximately $258,000 that do not have an expiration date.
To the extent that capital loss carryforwards are used to offset any future capital gains realized, no capital gains tax liability will be incurred by the Fund for gains realized and not distributed. To the extent that capital gains are offset, such gains will not be distributed to the shareholders. During the year ended December 31, 2019, the Fund utilized capital loss carryforwards for U.S. federal income tax purposes of approximately $41,000.
I. Credit Facility: The Company and other Morgan Stanley funds participated in a $150,000,000 committed, unsecured revolving line of credit facility (the "Facility") with State Street. Effective April 22, 2019, the committed line amount increased to $300,000,000. This Facility is to be used for temporary emergency purposes or funding of shareholder redemption requests. The interest rate on borrowings is based on the federal funds rate or 1 month LIBOR rate plus a spread. The Facility also has a commitment fee of 0.25% per annum based on the unused portion of the Facility. During the year ended December 31, 2019, the Fund did not have any borrowings under the Facility.
J. Other: At December 31, 2019, the Fund had record owners of 10% or greater. Investment activities of these shareholders could have a material impact on the Fund. The aggregate percentage of such owners was 41.5%.
19
Morgan Stanley Institutional Fund, Inc.
Annual Report — December 31, 2019
Report of Independent Registered Public Accounting Firm
To the Shareholders and Board of Directors of
Morgan Stanley Institutional Fund, Inc. —
Global Core Portfolio
Opinion on the Financial Statements
We have audited the accompanying statement of assets and liabilities of Global Core Portfolio (the "Fund") (one of the funds constituting Morgan Stanley Institutional Fund, Inc. (the "Company")), including the portfolio of investments, as of December 31, 2019, and the related statement of operations for the year then ended, the statements of changes in net assets for each of the two years in the period then ended and the financial highlights for each of the three years in the period then ended and the period from May 27, 2016 (commencement of operations) through December 31, 2016 and the related notes (collectively referred to as the "financial statements"). In our opinion, the financial statements present fairly, in all material respects, the financial position of Global Core Portfolio (one of the funds constituting Morgan Stanley Institutional Fund, Inc.) at December 31, 2019, the results of its operations for the year then ended, the changes in its net assets for each of the two years in the period then ended, and its financial highlights for each of the three years in the period then ended and the period from May 27, 2016 (commencement of operations) through December 31, 2016, in conformity with U.S. generally accepted accounting principles.
Basis for Opinion
These financial statements are the responsibility of the Company's management. Our responsibility is to express an opinion on the Fund's financial statements based on our audits. We are a public accounting firm registered with the Public Company Accounting Oversight Board (United States) ("PCAOB") and are required to be independent with respect to the Company in accordance with the U.S. federal securities law and the applicable rules and regulations of the Securities and Exchange Commission and the PCAOB.
We conducted our audits in accordance with the standards of the PCAOB. Those standards require that we plan and perform the audit to obtain reasonable assurance about whether the financial statements are free of material misstatement, whether due to error or fraud. The Company is not required to have, nor were we engaged to perform, an audit of the Company's internal control over financial reporting. As part of our audits, we are required to obtain an understanding of internal control over financial reporting, but not for the purpose of expressing an opinion on the effectiveness of the Company's internal control over financial reporting. Accordingly, we express no such opinion.
Our audits included performing procedures to assess the risks of material misstatement of the financial statements, whether due to error or fraud, and performing procedures that respond to those risks. Such procedures included examining, on a test basis, evidence regarding the amounts and disclosures in the financial statements. Our procedures included confirmation of securities owned as of December 31, 2019 by correspondence with the custodian and others or by other appropriate auditing procedures where replies from others were not received. Our audits also included evaluating the accounting principles used and significant estimates made by management, as well as evaluating the overall presentation of the financial statements. We believe that our audits provide a reasonable basis for our opinion.

We have served as the auditor of one or more Morgan Stanley investment companies since 2000.
Boston, Massachusetts
February 27, 2020
20
Morgan Stanley Institutional Fund, Inc.
Annual Report — December 31, 2019
Federal Tax Notice (unaudited)
For federal income tax purposes, the following information is furnished with respect to the distributions paid by the Fund during its taxable year ended December 31, 2019. For corporate shareholders 100% of the dividends qualified for the dividends received deduction.
For federal income tax purposes, the following information is furnished with respect to the Fund's earnings for its taxable year ended December 31, 2019. When distributed, certain earnings may be subject to a maximum tax rate of 15% as provided for by the Jobs and Growth Tax Relief Reconciliation Act of 2003. The Fund designated up to a maximum of approximately $70,000 as taxable at this lower rate.
In January, the Fund provides tax information to shareholders for the preceding calendar year.
21
Privacy Notice (unaudited) April 2019
FACTS | | WHAT DOES MSIM DO WITH YOUR PERSONAL INFORMATION? | |
Why? | | Financial companies choose how they share your personal information. Federal law gives consumers the right to limit some but not all sharing. Federal law also requires us to tell you how we collect, share, and protect your personal information. Please read this notice carefully to understand what we do. | |
What? | | The types of personal information we collect and share depend on the product or service you have with us. This information can include:
n Social Security number and income
n investment experience and risk tolerance
n checking account number and wire transfer instructions | |
How? | | All financial companies need to share customers' personal information to run their everyday business. In the section below, we list the reasons financial companies can share their customers' personal information; the reasons MSIM chooses to share; and whether you can limit this sharing. | |
Reasons we can share your personal information | | Does MSIM share? | | Can you limit this sharing? | |
For our everyday business purposes —
such as to process your transactions, maintain your account(s), respond to court orders and legal investigations, or report to credit bureaus | | Yes | | No | |
For our marketing purposes —
to offer our products and services to you | | Yes | | No | |
For joint marketing with other financial companies | | No | | We don't share | |
For our affiliates' everyday business purposes —
information about your transactions and experiences | | Yes | | No | |
For our affiliates' everyday business purposes —
information about your creditworthiness | | No | | We don't share | |
For our affiliates to market to you | | No | | We don't share | |
For non-affiliates to market to you | | No | | We don't share | |
Questions? Call toll-free (844) 312-6327 or email: imprivacyinquiries@morganstanley.com
22
Privacy Notice (unaudited) (cont'd) April 2019
Who we are
Who is providing this notice? | | Morgan Stanley Investment Management, Inc. and its affiliated registered investment advisers, registered broker-dealers, and registered and unregistered funds ("MSIM") | |
What we do
How does MSIM protect my personal information? | | To protect your personal information from unauthorized access and use, we use security measures that comply with federal law. These measures include computer safeguards and secured files and buildings. We have policies governing the proper handling of customer information by personnel and requiring third parties that provide support to adhere to appropriate security standards with respect to such information. | |
How does MSIM collect my personal information? | | We collect your personal information, for example, when you
n open an account or make deposits or withdrawals from your account
n buy securities from us or make a wire transfer
n give us your contact information
We also collect your personal information from others, such as credit bureaus, affiliates, or other companies. | |
Why can't I limit all sharing? | | Federal law gives you the right to limit only
n sharing for affiliates' everyday business purposes — information about your creditworthiness
n affiliates from using your information to market to you
n sharing for non-affiliates to market to you
State laws and individual companies may give you additional rights to limit sharing. See below for more on your rights under state law. | |
Definitions
Affiliates | | Companies related by common ownership or control. They can be financial and non-financial companies.
n Our affiliates include companies with a Morgan Stanley name and financial companies such as Morgan Stanley Smith Barney LLC and Morgan Stanley & Co. | |
Non-affiliates | | Companies not related by common ownership or control. They can be financial and non-financial companies.
n MSIM does not share with non-affiliates so they can market to you. | |
Joint marketing | | A formal agreement between non-affiliated financial companies that together market financial products or services to you.
n MSIM doesn't jointly market | |
Other important information
Vermont: Except as permitted by law, we will not share personal information we collect about Vermont residents with Non-affiliates unless you provide us with your written consent to share such information.
California: Except as permitted by law, we will not share personal information we collect about California residents with Non-affiliates and we will limit sharing such personal information with our Affiliates to comply with California privacy laws that apply to us.
23
Morgan Stanley Institutional Fund, Inc.
Annual Report — December 31, 2019
Director and Officer Information (unaudited)
Independent Directors:
Name, Birth Year
and Address of
Independent Director | | Position(s)
Held with
Registrant | | Length of Time
Served* | | Principal Occupation(s) During Past 5 Years
and Other Relevant Professional Experience | | Number of
Funds in
Fund Complex
Overseen by
Independent
Director** | | Other Directorships
Held by Independent
Director*** | |
Frank L. Bowman
c/o Perkins Coie LLP
Counsel to the Independent Directors
1155 Avenue of the Americas
New York, NY 10036
Birth Year 1944 | | Director | | Since August 2006 | | President, Strategic Decisions, LLC (consulting) (since February 2009); Director or Trustee of various Morgan Stanley Funds (since August 2006); Chairperson of the Compliance and Insurance Committee (since October 2015); formerly, Chairperson of the Insurance Sub-Committee of the Compliance and Insurance Committee (2007-2015); served as President and Chief Executive Officer of the Nuclear Energy Institute (policy organization) (February 2005-November 2008); retired as Admiral, U.S. Navy after serving over 38 years on active duty including 8 years as Director of the Naval Nuclear Propulsion Program in the Department of the Navy and the U.S. Department of Energy (1996-2004); served as Chief of Naval Personnel (July 1994-September 1996) and on the Joint Staff as Director of Political Military Affairs (June 1992-July 1994); knighted as Honorary Knight Commander of the Most Excellent Order of the British Empire; awarded the Officier de l'Orde National du Mérite by the French Government; elected to the National Academy of Engineering (2009). | | | 86 | | | Director of Naval and Nuclear Technologies LLP; Director Emeritus of the Armed Services YMCA; Member of the National Security Advisory Council of the Center for U.S. Global Engagement and a member of the CNA Military Advisory Board; Trustee of Fairhaven United Methodist Church; Member of the Board of Advisors of the Dolphin Scholarship Foundation; Director of other various non-profit organizations; formerly, Director of BP p.l.c. (November 2010-May 2019). | |
Kathleen A. Dennis
c/o Perkins Coie LLP
Counsel to the Independent Directors
1155 Avenue of the Americas
New York, NY 10036
Birth Year 1953 | | Director | | Since August 2006 | | President, Cedarwood Associates (mutual fund and investment management consulting) (since July 2006); Chairperson of the Liquidity and Alternatives Sub-Committee of the Investment Committee (since October 2006) and Director or Trustee of various Morgan Stanley Funds (since August 2006); formerly, Senior Managing Director of Victory Capital Management (1993-2006). | | | 86 | | | Director of various non-profit organizations. | |
Nancy C. Everett
c/o Perkins Coie LLP
Counsel to the Independent Directors
1155 Avenue of the Americas
New York, NY 10036
Birth Year 1955 | | Director | | Since January 2015 | | Chief Executive Officer, Virginia Commonwealth University Investment Company (since November 2015); Owner, OBIR, LLC (institutional investment management consulting) (since June 2014); formerly, Managing Director, BlackRock, Inc. (February 2011-December 2013); and Chief Executive Officer, General Motors Asset Management (a/k/a Promark Global Advisors, Inc.) (June 2005-May 2010). | | | 87 | | | Formerly, Member of Virginia Commonwealth University School of Business Foundation (2005-2016); Member of Virginia Commonwealth University Board of Visitors (2013-2015); Member of Committee on Directors for Emerging Markets Growth Fund, Inc. (2007-2010); Chairperson of Performance Equity Management, LLC (2006-2010); and Chairperson, GMAM Absolute Return Strategies Fund, LLC (2006-2010). | |
24
Morgan Stanley Institutional Fund, Inc.
Annual Report — December 31, 2019
Director and Officer Information (unaudited) (cont'd)
Independent Directors: (cont'd)
Name, Birth Year
and Address of
Independent Director | | Position(s)
Held with
Registrant | | Length of Time
Served* | | Principal Occupation(s) During Past 5 Years
and Other Relevant Professional Experience | | Number of
Funds in
Fund Complex
Overseen by
Independent
Director** | | Other Directorships
Held by Independent
Director*** | |
Jakki L. Haussler
c/o Perkins Coie LLP
Counsel to the Independent Directors
1155 Avenue of the Americas
New York, NY 10036
Birth Year 1957 | | Director | | Since January 2015 | | Chairman, Opus Capital Group (since 1996); formerly, Chief Executive Officer, Opus Capital Group (1996-2019); Director, Capvest Venture Fund, LP (May 2000-December 2011); Partner, Adena Ventures, LP (July 1999-December 2010); Director, The Victory Funds (February 2005-July 2008). | | | 87 | | | Director of Service Corporation International and Member, Audit Committee and Investment Committee; Director of Cincinnati Bell Inc. and Member, Audit Committee and Governance and Nominating Committee; Chairman of Northern Kentucky University Member Investment Committee; Member of Chase College of Law Transactional Law Practice Center Board of Advisors; Director of Best Transport; Director of Chase College of Law Board of Visitors; formerly, Member, University of Cincinnati Foundation Investment Committee; Member, Miami University Board of Visitors (2008-2011); Trustee of Victory Funds (2005-2008) and Chairman, Investment Committee (2007-2008) and Member, Service Provider Committee (2005-2008). | |
Dr. Manuel H. Johnson
c/o Johnson Smick International, Inc.
220 I Street, NE — Suite 200
Washington, D.C. 20002
Birth Year 1949 | | Director | | Since July 1991 | | Senior Partner, Johnson Smick International, Inc. (consulting firm); Chairperson of the Investment Committee (since October 2006) and Director or Trustee of various Morgan Stanley Funds (since July 1991); Co-Chairman and a founder of the Group of Seven Council (G7C) (international economic commission); formerly, Chairperson of the Audit Committee (July 1991-September 2006), Vice Chairman of the Board of Governors of the Federal Reserve System and Assistant Secretary of the U.S. Treasury. | | | 86 | | | Director of NVR, Inc. (home construction). | |
Joseph J. Kearns
c/o Perkins Coie LLP
Counsel to the Independent Directors
1155 Avenue of the Americas
New York, NY 10036
Birth Year 1942 | | Director | | Since August 1994 | | Senior Adviser, Kearns & Associates LLC (investment consulting); Chairperson of the Audit Committee (since October 2006) and Director or Trustee of various Morgan Stanley Funds (since August 1994); formerly, Deputy Chairperson of the Audit Committee (July 2003-September 2006) and Chairperson of the Audit Committee of various Morgan Stanley Funds (since August 1994); CFO of the J. Paul Getty Trust. | | | 87 | | | Prior to August 10, 2016, Director of Electro Rent Corporation (equipment leasing); Prior to December 31, 2013, Director of The Ford Family Foundation. | |
25
Morgan Stanley Institutional Fund, Inc.
Annual Report — December 31, 2019
Director and Officer Information (unaudited) (cont'd)
Independent Directors: (cont'd)
Name, Birth Year
and Address of
Independent Director | | Position(s)
Held with
Registrant | | Length of Time
Served* | | Principal Occupation(s) During Past 5 Years
and Other Relevant Professional Experience | | Number of
Funds in
Fund Complex
Overseen by
Independent
Director** | | Other Directorships
Held by Independent
Director*** | |
Michael F. Klein
c/o Perkins Coie LLP
Counsel to the Independent Directors
1155 Avenue of the Americas
New York, NY 10036
Birth Year 1958 | | Director | | Since August 2006 | | Managing Director, Aetos Alternatives Management, LP (since March 2000); Co-President, Aetos Alternatives Management, LP (since January 2004) and Co-Chief Executive Officer of Aetos Alternatives Management, LP (since August 2013); Chairperson of the Fixed Income Sub-Committee of the Investment Committee (since October 2006) and Director or Trustee of various Morgan Stanley Funds (since August 2006); formerly, Managing Director, Morgan Stanley & Co. Inc. and Morgan Stanley Dean Witter Investment Management and President, various Morgan Stanley Funds (June 1998-March 2000); Principal, Morgan Stanley & Co. Inc. and Morgan Stanley Dean Witter Investment Management (August 1997-December 1999). | | | 86 | | | Director of certain investment funds managed or sponsored by Aetos Alternatives Management, LP; Director of Sanitized AG and Sanitized Marketing AG (specialty chemicals). | |
Patricia Maleski
c/o Perkins Coie LLP
Counsel to the Independent Directors
1155 Avenue of the Americas
New York, NY 10036
Birth Year 1960 | | Director | | Since January 2017 | | Managing Director, JPMorgan Asset Management (2004-2016); Oversight and Control Head of Fiduciary and Conflicts of Interest Program (2015-2016); Chief Control Officer-Global Asset Management (2013-2015); President, JPMorgan Funds (2010-2013); Chief Administrative Officer (2004-2013); various other positions including Treasurer and Board Liaison (since 2001). | | | 87 | | | None. | |
Michael E. Nugent
522 Fifth Avenue
New York, NY 10036
Birth Year 1936 | | Chair of the Board and Director | | Chair of the Boards since July 2006 and Director since July 1991 | | Chair of the Boards of various Morgan Stanley Funds (since July 2006); Chairperson of the Governance Committee (since January 2019) and Director or Trustee of various Morgan Stanley Funds (since July 1991); formerly, Chairperson of each of the Closed-End Fund committee (until December 2019) and the Insurance Committee (until July 2006); General Partner, Triumph Capital, L.P. (private investment partnership) (1988-2013). | | | 86 | | | None. | |
W. Allen Reed
c/o Perkins Coie LLP
Counsel to the Independent Directors
1155 Avenue of the Americas
New York, NY 10036
Birth Year 1947 | | Vice Chair of the Board and Director | | Vice Chair of the Boards since January 2020 and Director since August 2006 | | Chairperson of the Equity Sub-Committee of the Investment Committee (since October 2006) and Director or Trustee of various Morgan Stanley Funds (since August 2006); formerly, President and CEO of General Motors Asset Management; Chairman and Chief Executive Officer of the GM Trust Bank and Corporate Vice President of General Motors Corporation (August 1994-December 2005). | | | 86 | | | Formerly, Director of Legg Mason, Inc.; formerly, Director of the Auburn University Foundation (2010-2015). | |
* This is the earliest date the Director began serving the Morgan Stanley Funds. Each Director serves an indefinite term, until his or her successor is elected.
** The Fund Complex includes (as of December 31, 2019) all open-end and closed-end funds (including all of their portfolios) advised by Morgan Stanley Investment Management Inc. (the "Adviser") and any funds that have an adviser that is an affiliated person of the Adviser (including, but not limited to, Morgan Stanley AIP GP LP).
*** This includes any directorships at public companies and registered investment companies held by the Director at any time during the past five years.
26
Morgan Stanley Institutional Fund, Inc.
Annual Report — December 31, 2019
Director and Officer Information (unaudited) (cont'd)
Executive Officers:
Name, Birth Year and Address of
Executive Officer | | Position(s)
Held with
Registrant | | Length of Time
Served* | | Principal Occupation(s) During Past 5 Years | |
John H. Gernon
522 Fifth Avenue
New York, NY 10036
Birth Year 1963 | | President and Principal Executive Officer | | Since September 2013 | | President and Principal Executive Officer of the Equity and Fixed Income Funds and the Morgan Stanley AIP Funds (since September 2013) and the Liquidity Funds and various money market funds (since May 2014) in the Fund Complex; Managing Director of the Adviser; Head of Product (since 2006). | |
Timothy J. Knierim
522 Fifth Avenue
New York, NY 10036
Birth Year 1959 | | Chief Compliance Officer | | Since December 2016 | | Managing Director of the Adviser and various entities affiliated with the Adviser; Chief Compliance Officer of various Morgan Stanley Funds and the Adviser (since December 2016) and Chief Compliance Officer of Morgan Stanley AIP GP LP (since 2014). Formerly, Managing Director and Deputy Chief Compliance Officer of the Adviser (2014-2016); and formerly, Chief Compliance Officer of Prudential Investment Management, Inc. (2007-2014). | |
Francis J. Smith
522 Fifth Avenue
New York, NY 10036
Birth Year 1965 | | Treasurer and Principal Financial Officer | | Treasurer since July 2003 and Principal Financial Officer since September 2002 | | Managing Director of the Adviser and various entities affiliated with the Adviser; Treasurer (since July 2003) and Principal Financial Officer of various Morgan Stanley Funds (since September 2002). | |
Mary E. Mullin
522 Fifth Avenue
New York, NY 10036
Birth Year 1967 | | Secretary | | Since June 1999 | | Managing Director of the Adviser; Secretary of various Morgan Stanley Funds (since June 1999). | |
Michael J. Key
522 Fifth Avenue
New York, NY 10036
Birth Year 1979 | | Vice President | | Since June 2017 | | Vice President of the Equity and Fixed Income Funds, Liquidity Funds, various money market funds and the Morgan Stanley AIP Funds in the Fund Complex (since June 2017); Executive Director of the Adviser; Head of Product Development for Equity and Fixed Income Funds (since August 2013). | |
* This is the earliest date the officer began serving the Morgan Stanley Funds. Each officer serves a one-year term, until his or her successor is elected and qualifies.
27
Morgan Stanley Institutional Fund, Inc.
Annual Report — December 31, 2019
Adviser and Administrator
Morgan Stanley Investment Management Inc.
522 Fifth Avenue
New York, New York 10036
Distributor
Morgan Stanley Distribution, Inc.
522 Fifth Avenue
New York, New York 10036
Dividend Disbursing and Transfer Agent
DST Asset Manager Solutions, Inc.
2000 Crown Colony Drive
Quincy, Massachusetts 02169
Custodian
State Street Bank and Trust Company
One Lincoln Street
Boston, Massachusetts 02111
Legal Counsel
Dechert LLP
1095 Avenue of the Americas
New York, New York 10036
Counsel to the Independent Directors
Perkins Coie LLP
1155 Avenue of the Americas
New York, New York 10036
Independent Registered Public Accounting Firm
Ernst & Young LLP
200 Clarendon Street
Boston, Massachusetts 02116
Reporting to Shareholders
Each Morgan Stanley fund provides a complete schedule of portfolio holdings in its Semi-Annual and the Annual Reports within 60 days of the end of the fund's second and fourth fiscal quarters. The Semi-Annual and Annual Reports are filed electronically with the Securities and Exchange Commission ("SEC") on Form N-CSRS and Form N-CSR, respectively. Morgan Stanley also delivers the Semi-Annual and Annual Reports to fund shareholders and makes these reports available on its public website, www.morganstanley.com/im/shareholderreports. Each Morgan Stanley non-money market fund also files a complete schedule of portfolio holdings with the SEC for the fund's first and third fiscal quarters as an attachment to Form N-PORT. Morgan Stanley does not deliver the reports for the first and third fiscal quarters to shareholders, nor are the reports posted to the Morgan Stanley public website. However, the holdings for each money market fund are posted to the Morgan Stanley public website. You may obtain the Form N-PORT filings (as well as the Form N-CSR and N-CSRS filings) by accessing the SEC's website, www.sec.gov. You can also request copies of these materials, upon payment of a duplicating fee, by electronic request at the SEC's email address (publicinfo@sec.gov).
Proxy Voting Policies and Procedures and Proxy Voting Record
You may obtain a copy of the Company's Proxy Voting Policy and Procedures and information regarding how the Company voted proxies relating to portfolio securities during the most recent twelve-month period ended June 30, without charge, upon request, by calling toll free 1 (800) 548-7786 or by visiting our website at www.morganstanley.com/im/shareholderreports. This information is also available on the SEC's website at www.sec.gov.
This report is authorized for distribution only when preceded or accompanied by a prospectus or summary prospectus of the applicable fund of Morgan Stanley Institutional Fund, Inc., which describes in detail the fund's investment policies, risks, fees and expenses. Please read the prospectus carefully before you invest or send money. For additional information, including information regarding the investments comprising the Fund, please visit our website at www.morganstanley.com/im/shareholderreports or call toll free 1 (800) 548-7786.
28
Printed in U.S.A.
This Report has been prepared for shareholders and may be distributed to others only if preceded or accompanied by a current prospectus.
Morgan Stanley Investment Management Inc.
522 Fifth Avenue
New York, New York 10036
© 2020 Morgan Stanley. Morgan Stanley Distribution, Inc.

IFIGCPANN
2916014 EXP. 02.28.21

Morgan Stanley Institutional Fund, Inc.
US Core Portfolio
Annual Report
December 31, 2019
Beginning on January 1, 2021, as permitted by regulations adopted by the Securities and Exchange Commission ("SEC"), paper copies of the Fund's Annual and Semi-Annual Reports to Shareholders ("Shareholder Reports") will no longer be sent by mail, unless you specifically request paper copies of the Shareholder Reports from the Fund or from your financial intermediary, such as a broker-dealer or a bank. Instead, the Shareholder Reports will be made available on the Fund's website, https://www.morganstanley.com/im/shareholderreports and you will be notified by mail each time a Shareholder Report is posted and provided with a website link to access the Shareholder Report. If you already elected to receive Shareholder Reports electronically, you will not be affected by this change and you need not take any action. You may elect to receive Shareholder Reports and other communications from the Fund electronically anytime by contacting your financial intermediary or, if you are a direct investor, please follow the instructions on the envelope.
Beginning on January 1, 2019, you may elect to receive all future Shareholder Reports in paper free of charge. If you invest through a financial intermediary, you can contact your financial intermediary to request that you continue to receive paper copies of your Shareholder Reports. If you invest directly with the Fund, please follow the instructions on the envelope to let the Fund know you wish to continue receiving paper copies of your Shareholder Reports. Your election to receive Shareholder Reports in paper will apply to all funds held in your account if you invest through your financial intermediary or all funds held with the fund complex if you invest directly with a fund.

Morgan Stanley Institutional Fund, Inc.
Annual Report — December 31, 2019
Shareholders' Letter | | | 2 | | |
Expense Example | | | 3 | | |
Investment Overview | | | 4 | | |
Portfolio of Investments | | | 6 | | |
Statement of Assets and Liabilities | | | 7 | | |
Statement of Operations | | | 8 | | |
Statements of Changes in Net Assets | | | 9 | | |
Financial Highlights | | | 10 | | |
Notes to Financial Statements | | | 14 | | |
Report of Independent Registered Public Accounting Firm | | | 19 | | |
Federal Tax Notice | | | 20 | | |
Privacy Notice | | | 21 | | |
Director and Officer Information | | | 23 | | |
This report is authorized for distribution only when preceded or accompanied by a prospectus or summary prospectus of the applicable Fund of Morgan Stanley Institutional Fund, Inc. To receive a prospectus and/or statement of additional information ("SAI"), which contains more complete information such as investment objectives, charges, expenses, policies for voting proxies, risk considerations and describes in detail each of the Fund's investment policies to the prospective investor, please call toll free 1 (800) 548-7786. Please read the prospectuses carefully before you invest or send money.
Additionally, you can access information about the Fund, including performance, characteristics and investment team commentary, through Morgan Stanley Investment Management's website: www.morganstanley.com/im/shareholderreports.
Market forecasts provided in this report may not necessarily come to pass. There is no guarantee that any sectors mentioned will continue to perform as discussed herein or that securities in such sectors will be held by the Fund in the future. There is no assurance that a fund will achieve its investment objective. Funds are subject to market risk, which is the possibility that market values of securities owned by the Fund will decline and, therefore, the value of the Fund's shares may be less than what you paid for them. Accordingly, you can lose money investing in this Fund. Please see the prospectus for more complete information on investment risks.
1
Morgan Stanley Institutional Fund, Inc.
Annual Report — December 31, 2019
Shareholders' Letter (unaudited)
Dear Shareholders,
We are pleased to provide this Annual Report, in which you will learn how your investment in US Core Portfolio (the "Fund") performed during the latest twelve-month period.
Morgan Stanley Investment Management is a client-centric, investor-led organization. Our global presence, intellectual capital, and breadth of products and services enable us to partner with investors to meet the evolving challenges of today's financial markets. We aim to deliver superior investment service and to empower our clients to make the informed decisions that help them reach their investment goals.
As always, we thank you for selecting Morgan Stanley Investment Management, and look forward to working with you in the months and years ahead.
Sincerely,

John H. Gernon
President and Principal Executive Officer
January 2020
2
Morgan Stanley Institutional Fund, Inc.
Annual Report — December 31, 2019
Expense Example (unaudited)
US Core Portfolio
As a shareholder of the Fund, you incur two types of costs: (1) transactional costs; and (2) ongoing costs, which may include advisory fees, administration fees, distribution and shareholder services fees and other Fund expenses. This example is intended to help you understand your ongoing costs (in dollars) of investing in the Fund and to compare these costs with the ongoing costs of investing in other mutual funds.
This example is based on an investment of $1,000 invested at the beginning of the six-month period ended December 31, 2019 and held for the entire six-month period.
Actual Expenses
The table below provides information about actual account values and actual expenses. You may use the information in this table, together with the amount you invested, to estimate the expenses that you paid over the period. Simply divide your account value by $1,000 (for example, an $8,600 account value divided by $1,000 = 8.6), then multiply the result by the number in the table under the heading entitled "Actual Expenses Paid During Period" to estimate the expenses you paid on your account during this period.
Hypothetical Example for Comparison Purposes
The table below provides information about hypothetical account values and hypothetical expenses based on the Fund's actual expense ratio and an assumed rate of return of 5% per year before expenses, which is not the Fund's actual return. The hypothetical account values and expenses may not be used to estimate the actual ending account balance or expenses you paid for the period. You may use this information to compare the ongoing costs of investing in the Fund and other funds. To do so, compare this 5% hypothetical example with the 5% hypothetical examples that appear in the shareholder reports of the other funds.
Please note that the expenses shown in the table are meant to highlight your ongoing costs only and do not reflect any transactional costs, such as sales charges (loads). Therefore, the information for each class in the table is useful in comparing ongoing costs only, and will not help you determine the relative total costs of owning different funds. In addition, if these transactional costs were included, your costs would have been higher.
| | | Beginning
Account
Value
7/1/19 | | Actual Ending
Account
Value
12/31/19 | | Hypothetical
Ending Account
Value | | Actual
Expenses
Paid
During
Period* | | Hypothetical
Expenses Paid
During Period* | | Net
Expense
Ratio
During
Period** | |
US Core Portfolio Class I | | $ | 1,000.00 | | | $ | 1,125.50 | | | $ | 1,021.27 | | | $ | 4.18 | | | $ | 3.97 | | | | 0.78 | % | |
US Core Portfolio Class A | | | 1,000.00 | | | | 1,124.00 | | | | 1,019.36 | | | | 6.21 | | | | 5.90 | | | | 1.16 | | |
US Core Portfolio Class C | | | 1,000.00 | | | | 1,119.20 | | | | 1,015.63 | | | | 10.15 | | | | 9.65 | | | | 1.90 | | |
US Core Portfolio Class IS | | | 1,000.00 | | | | 1,125.80 | | | | 1,021.42 | | | | 4.02 | | | | 3.82 | | | | 0.75 | | |
* Expenses are calculated using each Fund Class' annualized net expense ratio (as disclosed), multiplied by the average account value over the period and multiplied by 184/365 (to reflect the most recent one-half year period).
** Annualized.
3
Morgan Stanley Institutional Fund, Inc.
Annual Report — December 31, 2019
Investment Overview (unaudited)
US Core Portfolio
The Fund seeks long-term capital appreciation.
Performance
For the fiscal year ended December 31, 2019, the Fund's Class I shares had a total return based on net asset value and reinvestment of distributions per share of 36.01%, net of fees. The Fund's Class I shares outperformed the Fund's benchmark, the S&P 500® Index (the "Index"), which returned 31.49%.
Please keep in mind that double-digit returns are highly unusual and cannot be sustained. Investors should also be aware that these returns were primarily achieved during favorable market conditions.
Factors Affecting Performance
• The Fund returned strong performance on both an absolute and relative basis in 2019.
• The correction in December 2018 set the market up for recovery and strength early in 2019.
• Correctly positioned entering 2019, we had an underweight to defensives, maintained an overweight to growth, and had previously added in some value exposure in the form of energy and financials. The addition of value had proved to be too early from a nearer-term timing standpoint at the end of 2018, yet was successful over the longer term in the first half of 2019, contributing to performance as the market gathered strength.
• During the second quarter of 2019 the market became short-term overbought and vulnerable to correction. We therefore added some defensive bond proxy stocks in the form of real estate investment trusts (REITs) and utilities prior to the summer months, a correct decision that also contributed to performance.
• As it entered the second half of 2019, the Fund continued to hold both growth and value stocks, with some exposure to more defensive bond proxy stocks in terms of utilities and REITs to help mitigate market volatility throughout the summer.
• Exiting the summer months, we somewhat reduced the defensive positioning of the Fund. The reduction was due to expectations that the market would break out of its trading range as a result of easier earnings comparisons against the fourth
quarter of 2018, a strengthening U.S. housing market, accommodative U.S. Federal Reserve stimulus policy, overly negative investor sentiment, and potential resolution to the U.S. versus China trade dispute. We increased the Fund weighting to value names going into year-end, which served us well. Value cyclical stocks performed strongly into year-end. Although growth somewhat lagged, we correctly maintained our weighting moving into 2020.
• Within stock selection, the largest detractors were a health services company and an integrated pharmacy health care company weighed down by fears of increased government regulation, as well as two energy companies weighed down by sector decline.
• The Fund benefited the most from stock positions in technology, most notably two U.S.-based global technology and services companies and a U.S.-based global payments and technology company. Another top contributor to performance for the period was a U.S.-based global beauty products company.
Management Strategies
• There have been no changes to our investment process during the period. Applied Equity Advisors' investment process is comprised of two parts: a Factor Timing Engine and a Stock Selection Engine. The first step, the Factor Timing Engine, takes into account not only what market factors or areas of the market are in leadership, but also how much momentum a particular factor has, whether that factor is cheap or expensive, and whether the timing is right to be tilted toward that factor. The timing decision comes down to the team's judgment and our combined decades of experience in factor investing. With regard to the Factor Timing Engine, investing in a particular area of the market that shows cheap historical valuation levels may not appear to be advantageous at first, but if chosen correctly, sticking with that investment often proves to be successful over the longer term. The Stock Selection Engine begins its work once the desired factor positioning is understood. There are three steps to the Stock Selection Engine: 1. regression analysis to determine the drivers of a particular stock's price performance, 2. sustainability analysis, and 3. further evaluation of the company
4
Morgan Stanley Institutional Fund, Inc.
Annual Report — December 31, 2019
Investment Overview (unaudited) (cont'd)
US Core Portfolio
fundamentals. The result is a highly active portfolio of fundamentally attractive stocks which the team believes could benefit from what we have identified to be quantitative investment styles likely to outperform.

* Minimum Investment for Class I shares
** Commenced Operations on May 27, 2016.
In accordance with SEC regulations, the Fund's performance shown assumes that all recurring fees (including management fees) were deducted and all dividends and distributions were reinvested. The performance of Class A, C and IS shares will vary from the performance of Class I shares and will be impacted by additional fees assessed to those classes (if applicable).
Performance Compared to the S&P 500® Index(1) and the Lipper Large-Cap Core Funds Index(2)
| | | Period Ended December 31, 2019
Total Returns(3) | |
| | | Average Annual | |
| | | One
Year | | Five
Years | | Ten
Years | | Since
Inception(5) | |
Fund — Class I Shares
w/o sales charges(4) | | | 36.01 | % | | | — | | | | — | | | | 12.43 | % | |
Fund — Class A Shares
w/o sales charges(4) | | | 35.68 | | | | — | | | | — | | | | 12.02 | | |
Fund — Class A Shares with
maximum 5.25% sales charges(4) | | | 28.58 | | | | — | | | | — | | | | 10.37 | | |
Fund — Class C Shares
w/o sales charges(4) | | | 34.50 | | | | — | | | | — | | | | 11.18 | | |
Fund — Class C Shares with
maximum 1.00% deferred sales
charges(4) | | | 33.50 | | | | — | | | | — | | | | 11.18 | | |
Fund — Class IS Shares
w/o sales charges(4) | | | 36.17 | | | | — | | | | — | | | | 12.47 | | |
S&P 500® Index | | | 31.49 | | | | — | | | | — | | | | 15.04 | | |
Lipper Large-Cap Core Funds Index | | | 29.00 | | | | — | | | | — | | | | 14.05 | | |
Performance data quoted represents past performance, which is no guarantee of future results, and current performance may be lower or higher than the figures shown. Performance assumes that all dividends and distributions, if any, were reinvested. For the most recent month-end performance figures, please visit www.morganstanley.com/im/shareholderreports. Investment return and principal value will fluctuate so that Fund shares, when redeemed, may be worth more or less than their original cost. Total returns do not reflect the deduction of taxes that a shareholder would pay on Fund distributions or the redemption of Fund shares. Performance of share classes will vary due to difference in sales charges and expenses.
(1) The Standard & Poor's 500® Index (S&P 500® Index) measures the performance of the large cap segment of the U.S. equities market, covering approximately 80% of the U.S. equities market. The Index includes 500 leading companies in leading industries of the U.S. economy. The Index is unmanaged and its returns do not include any sales charges or fees. Such costs would lower performance. It is not possible to invest directly in an index.
(2) The Lipper Large-Cap Core Funds Index is an equally weighted performance index of the largest qualifying funds (based on net assets) in the Lipper Large-Cap Core Funds classification. The Index, which is adjusted for capital gains distributions and income dividends, is unmanaged and should not be considered an investment. There are currently 30 funds represented in this Index. As of the date of this report, the Fund was in the Lipper Large-Cap Core Funds classification.
(3) Total returns for the Fund reflect fees waived and expenses reimbursed, if applicable, by the Adviser (as defined herein). Without such waivers and reimbursements, total returns would have been lower.
(4) Commenced operations on May 27, 2016.
(5) For comparative purposes, average annual since inception returns listed for the Indexes refer to the inception date of the Fund, not the inception of the Index.
5
Morgan Stanley Institutional Fund, Inc.
Annual Report — December 31, 2019
Portfolio of Investments
US Core Portfolio
| | | Shares | | Value
(000) | |
Common Stocks (98.3%) | |
Banks (9.5%) | |
JPMorgan Chase & Co. | | | 6,684 | | | $ | 932 | | |
SVB Financial Group (a) | | | 3,451 | | | | 866 | | |
| | | | 1,798 | | |
Building Products (3.5%) | |
Fortune Brands Home & Security, Inc. | | | 10,197 | | | | 666 | | |
Capital Markets (9.8%) | |
Ameriprise Financial, Inc. | | | 4,203 | | | | 700 | | |
Charles Schwab Corp. (The) | | | 12,175 | | | | 579 | | |
Northern Trust Corp. | | | 5,414 | | | | 575 | | |
| | | | 1,854 | | |
Construction & Engineering (1.3%) | |
Quanta Services, Inc. | | | 6,174 | | | | 251 | | |
Electric Utilities (4.2%) | |
American Electric Power Co., Inc. | | | 2,615 | | | | 247 | | |
NextEra Energy, Inc. | | | 2,290 | | | | 555 | | |
| | | | 802 | | |
Electronic Equipment, Instruments & Components (2.0%) | |
IPG Photonics Corp. (a) | | | 2,586 | | | | 375 | | |
Equity Real Estate Investment Trusts (REITs) (9.0%) | |
Essex Property Trust, Inc. REIT | | | 1,771 | | | | 533 | | |
STORE Capital Corp. REIT | | | 15,523 | | | | 578 | | |
Welltower, Inc. REIT | | | 7,287 | | | | 596 | | |
| | | | 1,707 | | |
Health Care Equipment & Supplies (4.0%) | |
Danaher Corp. | | | 4,969 | | | | 763 | | |
Health Care Providers & Services (2.4%) | |
Cigna Corp. (a) | | | 2,204 | | | | 451 | | |
Health Care Technology (1.3%) | |
Veeva Systems, Inc., Class A (a) | | | 1,744 | | | | 245 | | |
Hotels, Restaurants & Leisure (7.6%) | |
McDonald's Corp. | | | 4,416 | | | | 873 | | |
Starbucks Corp. | | | 6,489 | | | | 570 | | |
| | | | 1,443 | | |
Household Durables (2.7%) | |
Lennar Corp., Class A | | | 9,244 | | | | 516 | | |
Information Technology Services (7.3%) | |
Mastercard, Inc., Class A | | | 4,626 | | | | 1,381 | | |
Interactive Media & Services (2.5%) | |
Alphabet, Inc., Class A (a) | | | 352 | | | | 471 | | |
Media (0.6%) | |
Comcast Corp., Class A | | | 2,438 | | | | 110 | | |
Oil, Gas & Consumable Fuels (2.1%) | |
ConocoPhillips | | | 6,043 | | | | 393 | | |
Personal Products (3.9%) | |
Estee Lauder Cos., Inc. (The), Class A | | | 3,625 | | | | 749 | | |
| | | Shares | | Value
(000) | |
Software (10.5%) | |
Microsoft Corp. | | | 11,569 | | | $ | 1,825 | | |
VMware, Inc., Class A (a) | | | 1,076 | | | | 163 | | |
| | | | 1,988 | | |
Specialty Retail (2.3%) | |
Home Depot, Inc. (The) | | | 1,977 | | | | 432 | | |
Tech Hardware, Storage & Peripherals (6.4%) | |
Apple, Inc. | | | 4,163 | | | | 1,222 | | |
Textiles, Apparel & Luxury Goods (3.4%) | |
Lululemon Athletica, Inc. (a) | | | 2,837 | | | | 657 | | |
Trading Companies & Distributors (2.0%) | |
United Rentals, Inc. (a) | | | 2,318 | | | | 387 | | |
Total Common Stocks (Cost $14,081) | | | 18,661 | | |
Short-Term Investment (0.4%) | |
Investment Company (0.4%) | |
Morgan Stanley Institutional Liquidity
Funds — Treasury Securities Portfolio —
Institutional Class (See Note G)
(Cost $83) | | | 83,405 | | | | 83 | | |
Total Investments (98.7%) (Cost $14,164) (b) | | | 18,744 | | |
Other Assets in Excess of Liabilities (1.3%) | | | 250 | | |
Net Assets (100.0%) | | $ | 18,994 | | |
(a) Non-income producing security.
(b) At December 31, 2019, the aggregate cost for federal income tax purposes is approximately $14,164,000. The aggregate gross unrealized appreciation is approximately $4,580,000 and the aggregate gross unrealized depreciation is $0, resulting in net unrealized appreciation of approximately $4,580,000.
REIT Real Estate Investment Trust.
Portfolio Composition
Classification | | Percentage of
Total Investments | |
Other* | | | 39.2 | % | |
Software | | | 10.6 | | |
Capital Markets | | | 9.9 | | |
Banks | | | 9.6 | | |
Equity Real Estate Investment Trusts (REITs) | | | 9.1 | | |
Hotels, Restaurants & Leisure | | | 7.7 | | |
Information Technology Services | | | 7.4 | | |
Tech Hardware, Storage & Peripherals | | | 6.5 | | |
Total Investments | | | 100.0 | % | |
* Industries and/or investment types representing less than 5% of total investments.
The accompanying notes are an integral part of the financial statements.
6
Morgan Stanley Institutional Fund, Inc.
Annual Report — December 31, 2019
Statement of Assets and Liabilities | | December 31, 2019
(000) | |
Assets: | |
Investments in Securities of Unaffiliated Issuers, at Value (Cost $14,081) | | $ | 18,661 | | |
Investment in Security of Affiliated Issuer, at Value (Cost $83) | | | 83 | | |
Total Investments in Securities, at Value (Cost $14,164) | | | 18,744 | | |
Receivable for Fund Shares Sold | | | 287 | | |
Due from Adviser | | | 32 | | |
Dividends Receivable | | | 14 | | |
Other Assets | | | 23 | | |
Total Assets | | | 19,100 | | |
Liabilities: | |
Payable for Fund Shares Redeemed | | | 47 | | |
Payable for Professional Fees | | | 47 | | |
Payable for Shareholder Services Fees — Class A | | | 1 | | |
Payable for Distribution and Shareholder Services Fees — Class C | | | 2 | | |
Payable for Transfer Agency Fees — Class I | | | — | @ | |
Payable for Transfer Agency Fees — Class A | | | 1 | | |
Payable for Transfer Agency Fees — Class C | | | — | @ | |
Payable for Transfer Agency Fees — Class IS | | | — | @ | |
Payable for Custodian Fees | | | 1 | | |
Payable for Administration Fees | | | 1 | | |
Payable for Sub Transfer Agency Fees — Class I | | | — | @ | |
Payable for Sub Transfer Agency Fees — Class A | | | — | @ | |
Payable for Sub Transfer Agency Fees — Class C | | | — | @ | |
Other Liabilities | | | 6 | | |
Total Liabilities | | | 106 | | |
Net Assets | | $ | 18,994 | | |
Net Assets Consist of: | |
Paid-in-Capital | | $ | 14,358 | | |
Total Distributable Earnings | | | 4,636 | | |
Net Assets | | $ | 18,994 | | |
CLASS I: | |
Net Assets | | $ | 13,086 | | |
| Shares Outstanding $0.001 par value shares of beneficial interest (unlimited shares authorized) (not in 000's) | | | 895,466 | | |
Net Asset Value, Offering and Redemption Price Per Share | | $ | 14.61 | | |
CLASS A: | |
Net Assets | | $ | 3,393 | | |
| Shares Outstanding $0.001 par value shares of beneficial interest (unlimited shares authorized) (not in 000's) | | | 232,773 | | |
Net Asset Value, Redemption Price Per Share | | $ | 14.58 | | |
Maximum Sales Load | | | 5.25 | % | |
Maximum Sales Charge | | $ | 0.81 | | |
Maximum Offering Price Per Share | | $ | 15.39 | | |
CLASS C: | |
Net Assets | | $ | 2,489 | | |
| Shares Outstanding $0.001 par value shares of beneficial interest (unlimited shares authorized) (not in 000's) | | | 174,044 | | |
Net Asset Value, Offering and Redemption Price Per Share | | $ | 14.30 | | |
CLASS IS: | |
Net Assets | | $ | 26 | | |
| Shares Outstanding $0.001 par value shares of beneficial interest (unlimited shares authorized) (not in 000's) | | | 1,751 | | |
Net Asset Value, Offering and Redemption Price Per Share | | $ | 14.61 | | |
@ Amount is less than $500.
The accompanying notes are an integral part of the financial statements.
7
Morgan Stanley Institutional Fund, Inc.
Annual Report — December 31, 2019
Statement of Operations | | Year Ended
December 31, 2019
(000) | |
Investment Income: | |
Dividends from Securities of Unaffiliated Issuers | | $ | 205 | | |
Dividends from Security of Affiliated Issuer (Note G) | | | 4 | | |
Total Investment Income | | | 209 | | |
Expenses: | |
Professional Fees | | | 99 | | |
Advisory Fees (Note B) | | | 84 | | |
Registration Fees | | | 56 | | |
Shareholder Services Fees — Class A (Note D) | | | 6 | | |
Distribution and Shareholder Services Fees — Class C (Note D) | | | 19 | | |
Shareholder Reporting Fees | | | 14 | | |
Administration Fees (Note C) | | | 11 | | |
Transfer Agency Fees — Class I (Note E) | | | 2 | | |
Transfer Agency Fees — Class A (Note E) | | | 2 | | |
Transfer Agency Fees — Class C (Note E) | | | 2 | | |
Transfer Agency Fees — Class IS (Note E) | | | 2 | | |
Custodian Fees (Note F) | | | 5 | | |
Directors' Fees and Expenses | | | 5 | | |
Sub Transfer Agency Fees — Class I | | | 1 | | |
Sub Transfer Agency Fees — Class A | | | 1 | | |
Sub Transfer Agency Fees — Class C | | | 1 | | |
Pricing Fees | | | 2 | | |
Other Expenses | | | 13 | | |
Total Expenses | | | 325 | | |
Expenses Reimbursed by Adviser (Note B) | | | (99 | ) | |
Waiver of Advisory Fees (Note B) | | | (84 | ) | |
Reimbursement of Class Specific Expenses — Class A (Note B) | | | (— | @) | |
Reimbursement of Class Specific Expenses — Class C (Note B) | | | (— | @) | |
Reimbursement of Class Specific Expenses — Class IS (Note B) | | | (2 | ) | |
Rebate from Morgan Stanley Affiliate (Note G) | | | (— | @) | |
Net Expenses | | | 140 | | |
Net Investment Income | | | 69 | | |
Realized Gain: | |
Investments Sold | | | 263 | | |
Change in Unrealized Appreciation (Depreciation): | |
Investments | | | 3,862 | | |
Net Realized Gain and Change in Unrealized Appreciation (Depreciation) | | | 4,125 | | |
Net Increase in Net Assets Resulting from Operations | | $ | 4,194 | | |
@ Amount is less than $500.
The accompanying notes are an integral part of the financial statements.
8
Morgan Stanley Institutional Fund, Inc.
Annual Report — December 31, 2019
Statements of Changes in Net Assets | | Year Ended
December 31, 2019
(000) | | Year Ended
December 31, 2018
(000) | |
Increase (Decrease) in Net Assets: | |
Operations: | |
Net Investment Income | | $ | 69 | | | $ | 84 | | |
Net Realized Gain | | | 263 | | | | 298 | | |
Net Change in Unrealized Appreciation (Depreciation) | | | 3,862 | | | | (1,769 | ) | |
Net Increase (Decrease) in Net Assets Resulting from Operations | | | 4,194 | | | | (1,387 | ) | |
Dividends and Distributions to Shareholders: | |
Class I | | | (171 | ) | | | (115 | ) | |
Class A | | | (30 | ) | | | (20 | ) | |
Class C | | | (16 | ) | | | (16 | ) | |
Class IS | | | (— | @) | | | (— | @) | |
Total Dividends and Distributions to Shareholders | | | (217 | ) | | | (151 | ) | |
Capital Share Transactions:(1) | |
Class I: | |
Subscribed | | | 2,907 | | | | 1,070 | | |
Distributions Reinvested | | | 171 | | | | 34 | | |
Redeemed | | | (280 | ) | | | (1,470 | ) | |
Class A: | |
Subscribed | | | 1,732 | | | | 503 | | |
Distributions Reinvested | | | 30 | | | | 19 | | |
Redeemed | | | (872 | ) | | | (315 | ) | |
Class C: | |
Subscribed | | | 1,100 | | | | 227 | | |
Distributions Reinvested | | | 16 | | | | 16 | | |
Redeemed | | | (736 | ) | | | (289 | ) | |
Class IS: | |
Subscribed | | | 10 | | | | — | | |
Distributions Reinvested | | | — | @ | | | — | | |
Net Increase (Decrease) in Net Assets Resulting from Capital Share Transactions | | | 4,078 | | | | (205 | ) | |
Total Increase (Decrease) in Net Assets | | | 8,055 | | | | (1,743 | ) | |
Net Assets: | |
Beginning of Period | | | 10,939 | | | | 12,682 | | |
End of Period | | $ | 18,994 | | | $ | 10,939 | | |
(1) Capital Share Transactions: | |
Class I: | |
Shares Subscribed | | | 214 | | | | 88 | | |
Shares Issued on Distributions Reinvested | | | 12 | | | | 3 | | |
Shares Redeemed | | | (23 | ) | | | (122 | ) | |
Net Increase (Decrease) in Class I Shares Outstanding | | | 203 | | | | (31 | ) | |
Class A: | |
Shares Subscribed | | | 132 | | | | 41 | | |
Shares Issued on Distributions Reinvested | | | 2 | | | | 2 | | |
Shares Redeemed | | | (70 | ) | | | (26 | ) | |
Net Increase in Class A Shares Outstanding | | | 64 | | | | 17 | | |
Class C: | |
Shares Subscribed | | | 84 | | | | 20 | | |
Shares Issued on Distributions Reinvested | | | 1 | | | | 1 | | |
Shares Redeemed | | | (57 | ) | | | (24 | ) | |
Net Increase (Decrease) in Class C Shares Outstanding | | | 28 | | | | (3 | ) | |
Class IS: | |
Shares Subscribed | | | 1 | | | | — | | |
Shares Issued on Distributions Reinvested | | | — | @@ | | | — | | |
Net Increase in Class IS Shares Outstanding | | | 1 | | | | — | | |
@ Amount is less than $500.
@@ Amount is less than 500 shares.
The accompanying notes are an integral part of the financial statements.
9
Morgan Stanley Institutional Fund, Inc.
Annual Report — December 31, 2019
Financial Highlights
US Core Portfolio
| | | Class I | |
| | | Year Ended December 31, | | Period from
May 27, 2016(1) to | |
Selected Per Share Data and Ratios | | 2019 | | 2018 | | 2017 | | December 31, 2016 | |
Net Asset Value, Beginning of Period | | $ | 10.89 | | | $ | 12.41 | | | $ | 10.45 | | | $ | 10.00 | | |
Income (Loss) from Investment Operations: | |
Net Investment Income(2) | | | 0.09 | | | | 0.11 | | | | 0.08 | | | | 0.07 | | |
Net Realized and Unrealized Gain (Loss) | | | 3.82 | | | | (1.47 | ) | | | 1.94 | | | | 0.48 | | |
Total from Investment Operations | | | 3.91 | | | | (1.36 | ) | | | 2.02 | | | | 0.55 | | |
Distributions from and/or in Excess of: | |
Net Investment Income | | | (0.09 | ) | | | (0.05 | ) | | | (0.05 | ) | | | (0.10 | ) | |
Net Realized Gain | | | (0.10 | ) | | | (0.11 | ) | | | — | | | | — | | |
Paid-in-Capital | | | — | | | | — | | | | (0.01 | ) | | | — | | |
Total Distributions | | | (0.19 | ) | | | (0.16 | ) | | | (0.06 | ) | | | (0.10 | ) | |
Net Asset Value, End of Period | | $ | 14.61 | | | $ | 10.89 | | | $ | 12.41 | | | $ | 10.45 | | |
Total Return(3) | | | 36.01 | % | | | (11.00 | )% | | | 19.33 | % | | | 5.50 | %(6) | |
Ratios to Average Net Assets and Supplemental Data: | |
Net Assets, End of Period (Thousands) | | $ | 13,086 | | | $ | 7,532 | | | $ | 8,965 | | | $ | 7,314 | | |
Ratio of Expenses Before Expense Limitation | | | 2.09 | % | | | 2.31 | % | | | 2.78 | % | | | 3.62 | %(7) | |
Ratio of Expenses After Expense Limitation | | | 0.78 | %(4) | | | 0.80 | %(4) | | | 0.78 | %(4) | | | 0.77 | %(4)(7) | |
Ratio of Net Investment Income | | | 0.71 | %(4) | | | 0.86 | %(4) | | | 0.68 | %(4) | | | 1.12 | %(4)(7) | |
Ratio of Rebate from Morgan Stanley Affiliates | | | 0.00 | %(5) | | | 0.00 | %(5) | | | 0.00 | %(5) | | | 0.00 | %(5)(7) | |
Portfolio Turnover Rate | | | 69 | % | | | 60 | % | | | 57 | % | | | 28 | %(6) | |
(1) Commencement of Operations.
(2) Per share amount is based on average shares outstanding.
(3) Calculated based on the net asset value as of the last business day of the period.
(4) The Ratio of Expenses After Expenses Limitation and Ratio of Net Investment Income reflect the rebate of certain Fund expenses in connection with the investments in Morgan Stanley affiliates during the period. The effect of the rebate on the ratios is disclosed in the above table as "Ratio of Rebate from Morgan Stanley Affiliates."
(5) Amount is less than 0.005%.
(6) Not annualized.
(7) Annualized.
The accompanying notes are an integral part of the financial statements.
10
Morgan Stanley Institutional Fund, Inc.
Annual Report — December 31, 2019
Financial Highlights
US Core Portfolio
| | | Class A | |
| | | Year Ended December 31, | | Period from
May 27, 2016(1) to | |
Selected Per Share Data and Ratios | | 2019 | | 2018 | | 2017 | | December 31, 2016 | |
Net Asset Value, Beginning of Period | | $ | 10.86 | | | $ | 12.38 | | | $ | 10.44 | | | $ | 10.00 | | |
Income (Loss) from Investment Operations: | |
Net Investment Income(2) | | | 0.05 | | | | 0.07 | | | | 0.04 | | | | 0.04 | | |
Net Realized and Unrealized Gain (Loss) | | | 3.82 | | | | (1.47 | ) | | | 1.92 | | | | 0.49 | | |
Total from Investment Operations | | | 3.87 | | | | (1.40 | ) | | | 1.96 | | | | 0.53 | | |
Distributions from and/or in Excess of: | |
Net Investment Income | | | (0.05 | ) | | | (0.01 | ) | | | (0.01 | ) | | | (0.09 | ) | |
Net Realized Gain | | | (0.10 | ) | | | (0.11 | ) | | | — | | | | — | | |
Paid-in-Capital | | | — | | | | — | | | | (0.01 | ) | | | — | | |
Total Distributions | | | (0.15 | ) | | | (0.12 | ) | | | (0.02 | ) | | | (0.09 | ) | |
Net Asset Value, End of Period | | $ | 14.58 | | | $ | 10.86 | | | $ | 12.38 | | | $ | 10.44 | | |
Total Return(3) | | | 35.68 | % | | | (11.35 | )% | | | 18.80 | % | | | 5.30 | %(6) | |
Ratios to Average Net Assets and Supplemental Data: | |
Net Assets, End of Period (Thousands) | | $ | 3,393 | | | $ | 1,833 | | | $ | 1,874 | | | $ | 1,406 | | |
Ratio of Expenses Before Expense Limitation | | | 2.46 | % | | | 2.68 | % | | | 3.23 | % | | | 4.12 | %(7) | |
Ratio of Expenses After Expense Limitation | | | 1.15 | %(4) | | | 1.15 | %(4) | | | 1.15 | %(4) | | | 1.15 | %(4)(7) | |
Ratio of Net Investment Income | | | 0.34 | %(4) | | | 0.55 | %(4) | | | 0.31 | %(4) | | | 0.66 | %(4)(7) | |
Ratio of Rebate from Morgan Stanley Affiliates | | | 0.00 | %(5) | | | 0.00 | %(5) | | | 0.00 | %(5) | | | 0.00 | %(5)(7) | |
Portfolio Turnover Rate | | | 69 | % | | | 60 | % | | | 57 | % | | | 28 | %(6) | |
(1) Commencement of Operations.
(2) Per share amount is based on average shares outstanding.
(3) Calculated based on the net asset value which does not reflect sales charges, if applicable, as of the last business day of the period.
(4) The Ratio of Expenses After Expenses Limitation and Ratio of Net Investment Income reflect the rebate of certain Fund expenses in connection with the investments in Morgan Stanley affiliates during the period. The effect of the rebate on the ratios is disclosed in the above table as "Ratio of Rebate from Morgan Stanley Affiliates."
(5) Amount is less than 0.005%.
(6) Not annualized.
(7) Annualized.
The accompanying notes are an integral part of the financial statements.
11
Morgan Stanley Institutional Fund, Inc.
Annual Report — December 31, 2019
Financial Highlights
US Core Portfolio
| | | Class C | |
| | | Year Ended December 31, | | Period from
May 27, 2016(1) to | |
Selected Per Share Data and Ratios | | 2019 | | 2018 | | 2017 | | December 31, 2016 | |
Net Asset Value, Beginning of Period | | $ | 10.70 | | | $ | 12.28 | | | $ | 10.41 | | | $ | 10.00 | | |
Income (Loss) from Investment Operations: | |
Net Investment Loss(2) | | | (0.05 | ) | | | (0.03 | ) | | | (0.05 | ) | | | (0.00 | )(3) | |
Net Realized and Unrealized Gain (Loss) | | | 3.75 | | | | (1.44 | ) | | | 1.92 | | | | 0.48 | | |
Total from Investment Operations | | | 3.70 | | | | (1.47 | ) | | | 1.87 | | | | 0.48 | | |
Distributions from and/or in Excess of: | |
Net Investment Income | | | — | | | | — | | | | — | | | | (0.07 | ) | |
Net Realized Gain | | | (0.10 | ) | | | (0.11 | ) | | | — | | | | — | | |
Total Distributions | | | (0.10 | ) | | | (0.11 | ) | | | — | | | | (0.07 | ) | |
Net Asset Value, End of Period | | $ | 14.30 | | | $ | 10.70 | | | $ | 12.28 | | | $ | 10.41 | | |
Total Return(4) | | | 34.50 | % | | | (11.94 | )% | | | 17.96 | % | | | 4.79 | %(7) | |
Ratios to Average Net Assets and Supplemental Data: | |
Net Assets, End of Period (Thousands) | | $ | 2,489 | | | $ | 1,563 | | | $ | 1,831 | | | $ | 1,377 | | |
Ratio of Expenses Before Expense Limitation | | | 3.23 | % | | | 3.44 | % | | | 3.94 | % | | | 4.99 | %(8) | |
Ratio of Expenses After Expense Limitation | | | 1.90 | %(5) | | | 1.90 | %(5) | | | 1.90 | %(5) | | | 1.90 | %(5)(8) | |
Ratio of Net Investment Loss | | | (0.39 | )%(5) | | | (0.22 | )%(5) | | | (0.43 | )%(5) | | | (0.05 | )%(5)(8) | |
Ratio of Rebate from Morgan Stanley Affiliates | | | 0.00 | %(6) | | | 0.00 | %(6) | | | 0.00 | %(6) | | | 0.00 | %(6)(8) | |
Portfolio Turnover Rate | | | 69 | % | | | 60 | % | | | 57 | % | | | 28 | %(7) | |
(1) Commencement of Operations.
(2) Per share amount is based on average shares outstanding.
(3) Amount is less than $0.005 per share.
(4) Calculated based on the net asset value which does not reflect sales charges, if applicable, as of the last business day of the period.
(5) The Ratio of Expenses After Expenses Limitation and Ratio of Net Investment Loss reflect the rebate of certain Fund expenses in connection with the investments in Morgan Stanley affiliates during the period. The effect of the rebate on the ratios is disclosed in the above table as "Ratio of Rebate from Morgan Stanley Affiliates."
(6) Amount is less than 0.005%.
(7) Not annualized.
(8) Annualized.
The accompanying notes are an integral part of the financial statements.
12
Morgan Stanley Institutional Fund, Inc.
Annual Report — December 31, 2019
Financial Highlights
US Core Portfolio
| | | Class IS | |
| | | Year Ended December 31, | | Period from
May 27, 2016(1) to | |
Selected Per Share Data and Ratios | | 2019 | | 2018 | | 2017 | | December 31, 2016 | |
Net Asset Value, Beginning of Period | | $ | 10.88 | | | $ | 12.41 | | | $ | 10.45 | | | $ | 10.00 | | |
Income (Loss) from Investment Operations: | |
Net Investment Income(2) | | | 0.10 | | | | 0.12 | | | | 0.08 | | | | 0.07 | | |
Net Realized and Unrealized Gain (Loss) | | | 3.83 | | | | (1.48 | ) | | | 1.94 | | | | 0.48 | | |
Total from Investment Operations | | | 3.93 | | | | (1.36 | ) | | | 2.02 | | | | 0.55 | | |
Distributions from and/or in Excess of: | |
Net Investment Income | | | (0.10 | ) | | | (0.06 | ) | | | (0.01 | ) | | | (0.10 | ) | |
Net Realized Gain | | | (0.10 | ) | | | (0.11 | ) | | | — | | | | — | | |
Paid-in-Capital | | | — | | | | — | | | | (0.05 | ) | | | — | | |
Total Distributions | | | (0.20 | ) | | | (0.17 | ) | | | (0.06 | ) | | | (0.10 | ) | |
Net Asset Value, End of Period | | $ | 14.61 | | | $ | 10.88 | | | $ | 12.41 | | | $ | 10.45 | | |
Total Return(3) | | | 36.17 | % | | | (11.04 | )% | | | 19.37 | % | | | 5.52 | %(6) | |
Ratios to Average Net Assets and Supplemental Data: | |
Net Assets, End of Period (Thousands) | | $ | 26 | | | $ | 11 | | | $ | 12 | | | $ | 10 | | |
Ratio of Expenses Before Expense Limitation | | | 16.90 | % | | | 16.44 | % | | | 19.96 | % | | | 19.22 | %(7) | |
Ratio of Expenses After Expense Limitation | | | 0.75 | %(4) | | | 0.75 | %(4) | | | 0.75 | %(4) | | | 0.75 | %(4)(7) | |
Ratio of Net Investment Income | | | 0.74 | %(4) | | | 0.92 | %(4) | | | 0.71 | %(4) | | | 1.17 | %(4)(7) | |
Ratio of Rebate from Morgan Stanley Affiliates | | | 0.00 | %(5) | | | 0.00 | %(5) | | | 0.00 | %(5) | | | 0.00 | %(5)(7) | |
Portfolio Turnover Rate | | | 69 | % | | | 60 | % | | | 57 | % | | | 28 | %(6) | |
(1) Commencement of Operations.
(2) Per share amount is based on average shares outstanding.
(3) Calculated based on the net asset value as of the last business day of the period.
(4) The Ratio of Expenses After Expenses Limitation and Ratio of Net Investment Income reflect the rebate of certain Fund expenses in connection with the investments in Morgan Stanley affiliates during the period. The effect of the rebate on the ratios is disclosed in the above table as "Ratio of Rebate from Morgan Stanley Affiliates."
(5) Amount is less than 0.005%.
(6) Not annualized.
(7) Annualized.
The accompanying notes are an integral part of the financial statements.
13
Morgan Stanley Institutional Fund, Inc.
Annual Report — December 31, 2019
Notes to Financial Statements
Morgan Stanley Institutional Fund, Inc. (the "Company") is registered under the Investment Company Act of 1940, as amended (the "Act"), as an open-end management investment company. The Company is comprised of thirty-two separate, active, diversified and non-diversified funds (individually referred to as a "Fund," collectively as the "Funds"). The Company applies investment company accounting and reporting guidance.
The accompanying financial statements relate to the US Core Portfolio. The Fund seeks long-term capital appreciation.
The Fund offers four classes of shares — Class I, Class A, Class C and Class IS.
A. Significant Accounting Policies: The following significant accounting policies are in conformity with U.S. generally accepted accounting principles ("GAAP"). Such policies are consistently followed by the Company in the preparation of its financial statements. GAAP may require management to make estimates and assumptions that affect the reported amounts and disclosures in the financial statements. Actual results may differ from those estimates.
In August 2018, the Financial Accounting Standards Board ("FASB") issued Accounting Standards Update ("ASU") 2018-13, Fair Value Measurement (Topic 820) — Disclosures Framework — Changes to Disclosure Requirements of Fair Value Measurement ("ASU 2018-13") which introduces new fair value disclosure requirements as well as eliminates and modifies certain existing fair value disclosure requirements. ASU 2018-13 would be effective for fiscal years beginning after December 15, 2019 and for interim periods within those fiscal years; however, management has elected to early adopt ASU 2018-13 as permitted by the standard. The impact of the Fund's adoption was limited to changes in the Fund's financial statement disclosures regarding fair value, primarily those disclosures related to transfers between levels of the fair value hierarchy and disclosure of the range and weighted average used to develop significant unobservable inputs for Level 3 fair value measurements, when applicable.
1. Security Valuation: (1) An equity portfolio security listed or traded on an exchange is valued at its latest reported sales price (or at the exchange official closing price if such exchange reports an official closing price), and if there were no sales on a given day and if there is no official exchange closing price for that day, the security is valued
at the mean between the last reported bid and asked prices if such bid and asked prices are available on the relevant exchanges. If only bid prices are available then the latest bid price may be used. Listed equity securities not traded on the valuation date with no reported bid and asked prices available on the exchange are valued at the mean between the current bid and asked prices obtained from one or more reputable brokers or dealers. In cases where a security is traded on more than one exchange, the security is valued on the exchange designated as the primary market; (2) all other equity portfolio securities for which over-the-counter ("OTC") market quotations are readily available are valued at the latest reported sales price (or at the market official closing price if such market reports an official closing price), and if there was no trading in the security on a given day and if there is no official closing price from relevant markets for that day, the security is valued at the mean between the last reported bid and asked prices if such bid and asked prices are available on the relevant markets. An unlisted equity security that does not trade on the valuation date and for which bid and asked prices from the relevant markets are unavailable is valued at the mean between the current bid and asked prices obtained from one or more reputable brokers or dealers; (3) certain portfolio securities may be valued by an outside pricing service/vendor approved by the Company's Board of Directors (the "Directors"). The pricing service/vendor may employ a pricing model that takes into account, among other things, bids, yield spreads and/or other market data and specific security characteristics. Alternatively, if a valuation is not available from an outside pricing service/vendor, and the security trades on an exchange, the security may be valued at its latest reported sale price (or at the exchange official closing price if such exchange reports an official closing price), prior to the time when assets are valued. If there are no sales on a given day and if there is no official exchange closing price for that day, the security is valued at the mean between the last reported bid and asked prices if such bid and asked prices are available in the relevant exchanges. If Morgan Stanley Investment Management Inc. (the "Adviser"), a wholly-owned subsidiary of Morgan Stanley, determines that the price provided by the outside pricing service/vendor or exchange does not reflect the security's fair value or is unable to provide a price, prices from brokers or dealers may also be
14
Morgan Stanley Institutional Fund, Inc.
Annual Report — December 31, 2019
Notes to Financial Statements (cont'd)
utilized. In these circumstances, the value of the security will be the mean of bid and asked prices obtained from brokers or dealers; (4) when market quotations are not readily available, including circumstances under which the Adviser determines that the closing price, last sale price or the mean between the last reported bid and asked prices are not reflective of a security's market value, portfolio securities are valued at their fair value as determined in good faith under procedures established by and under the general supervision of the Directors. Occasionally, developments affecting the closing prices of securities and other assets may occur between the times at which valuations of such securities are determined (that is, close of the foreign market on which the securities trade) and the close of business of the New York Stock Exchange ("NYSE"). If developments occur during such periods that are expected to materially affect the value of such securities, such valuations may be adjusted to reflect the estimated fair value of such securities as of the close of the NYSE, as determined in good faith by the Directors or by the Adviser using a pricing service and/or procedures approved by the Directors; and (5) investments in mutual funds, including the Morgan Stanley Institutional Liquidity Funds, are valued at the net asset value ("NAV") as of the close of each business day.
The Directors have responsibility for determining in good faith the fair value of the investments, and the Directors may appoint others, such as the Company's Adviser or a valuation committee, to assist the Directors in determining fair value and to make the actual calculations pursuant to the fair valuation methodologies previously approved by the Directors. Under procedures approved by the Directors, the Company's Adviser has formed a Valuation Committee whose members are approved by the Directors. The Valuation Committee provides administration and oversight of the Company's valuation policies and procedures, which are reviewed at least annually by the Directors. These procedures allow the Company to utilize independent pricing services, quotations from securities and financial instrument dealers and other market sources to determine fair value.
2. Fair Value Measurement: FASB Accounting Standards CodificationTM ("ASC") 820, "Fair Value
Measurement" ("ASC 820"), defines fair value as the value that the Fund would receive to sell an investment or pay to transfer a liability in a timely transaction with an independent buyer in the principal market, or in the absence of a principal market, the most advantageous market for the investment or liability. ASC 820 establishes a three-tier hierarchy to distinguish between (1) inputs that reflect the assumptions market participants would use in valuing an asset or liability developed based on market data obtained from sources independent of the reporting entity (observable inputs) and (2) inputs that reflect the reporting entity's own assumptions about the assumptions market participants would use in valuing an asset or liability developed based on the best information available in the circumstances (unobservable inputs) and to establish classification of fair value measurements for disclosure purposes. Various inputs are used in determining the value of the Fund's investments. The inputs are summarized in the three broad levels listed below:
• Level 1 – unadjusted quoted prices in active markets for identical investments
• Level 2 – other significant observable inputs (including quoted prices for similar investments, interest rates, prepayment speeds, credit risk, etc.)
• Level 3 – significant unobservable inputs including the Fund's own assumptions in determining the fair value of investments. Factors considered in making this determination may include, but are not limited to, information obtained by contacting the issuer, analysts, or the appropriate stock exchange (for exchange-traded securities), analysis of the issuer's financial statements or other available documents and, if necessary, available information concerning other securities in similar circumstances.
The inputs or methodology used for valuing securities are not necessarily an indication of the risk associated with investing in those securities and the determination of the significance of a particular input to the fair value measurement in its entirety requires judgment and considers factors specific to each security.
15
Morgan Stanley Institutional Fund, Inc.
Annual Report — December 31, 2019
Notes to Financial Statements (cont'd)
The following is a summary of the inputs used to value the Fund's investments as of December 31, 2019:
Investment Type | | Level 1
Unadjusted
quoted
prices
(000) | | Level 2
Other
significant
observable
inputs
(000) | | Level 3
Significant
unobservable
inputs
(000) | | Total
(000) | |
Assets: | |
Common Stocks | |
Banks | | $ | 1,798 | | | $ | — | | | $ | — | | | $ | 1,798 | | |
Building Products | | | 666 | | | | — | | | | — | | | | 666 | | |
Capital Markets | | | 1,854 | | | | — | | | | — | | | | 1,854 | | |
Construction &
Engineering | | | 251 | | | | — | | | | — | | | | 251 | | |
Electric Utilities | | | 802 | | | | — | | | | — | | | | 802 | | |
Electronic Equipment,
Instruments &
Components | | | 375 | | | | — | | | | — | | | | 375 | | |
Equity Real Estate
Investment Trusts
(REITs) | | | 1,707 | | | | — | | | | — | | | | 1,707 | | |
Health Care Equipment &
Supplies | | | 763 | | | | — | | | | — | | | | 763 | | |
Health Care Providers &
Services | | | 451 | | | | — | | | | — | | | | 451 | | |
Health Care Technology | | | 245 | | | | — | | | | — | | | | 245 | | |
Hotels, Restaurants &
Leisure | | | 1,443 | | | | — | | | | — | | | | 1,443 | | |
Household Durables | | | 516 | | | | — | | | | — | | | | 516 | | |
Information Technology
Services | | | 1,381 | | | | — | | | | — | | | | 1,381 | | |
Interactive Media &
Services | | | 471 | | | | — | | | | — | | | | 471 | | |
Media | | | 110 | | | | — | | | | — | | | | 110 | | |
Oil, Gas & Consumable
Fuels | | | 393 | | | | — | | | | — | | | | 393 | | |
Personal Products | | | 749 | | | | — | | | | — | | | | 749 | | |
Software | | | 1,988 | | | | — | | | | — | | | | 1,988 | | |
Specialty Retail | | | 432 | | | | — | | | | — | | | | 432 | | |
Tech Hardware,
Storage & Peripherals | | | 1,222 | | | | — | | | | — | | | | 1,222 | | |
Textiles, Apparel &
Luxury Goods | | | 657 | | | | — | | | | — | | | | 657 | | |
Trading Companies &
Distributors | | | 387 | | | | — | | | | — | | | | 387 | | |
Total Common Stocks | | | 18,661 | | | | — | | | | — | | | | 18,661 | | |
Short-Term Investment | |
Investment Company | | | 83 | | | | — | | | | — | | | | 83 | | |
Total Assets | | $ | 18,744 | | | $ | — | | | $ | — | | | $ | 18,744 | | |
Transfers between investment levels may occur as the markets fluctuate and/or the availability of data used in an investment's valuation changes.
3. Indemnifications: The Company enters into contracts that contain a variety of indemnifications. The Company's maximum exposure under these arrangements is unknown. However, the Company has not had prior claims or losses pursuant to these contracts and expects the risk of loss to be remote.
4. Dividends and Distributions to Shareholders: Dividends and distributions to shareholders are recorded on the ex-dividend date. Dividends from net investment income, if any, are declared and paid annually. Net realized capital gains, if any, are distributed at least annually.
5. Security Transactions, Income and Expenses: Security transactions are accounted for on the trade date (date the order to buy or sell is executed). Realized gains and losses on the sale of investment securities are determined on the specific identified cost method. Dividend income and other distributions are recorded on the ex-dividend date (except for certain foreign dividends which may be recorded as soon as the Fund is informed of such dividends) net of applicable withholding taxes. Interest income is recognized on the accrual basis except where collection is in doubt. Discounts are accreted and premiums are amortized over the life of the respective securities. Most expenses of the Company can be directly attributed to a particular Fund. Expenses which cannot be directly attributed are apportioned among the Funds based upon relative net assets or other appropriate methods. Income, expenses (other than class specific expenses — distribution and shareholder services, transfer agency and sub transfer agency fees) and realized and unrealized gains or losses are allocated to each class of shares based upon their relative net assets.
B. Advisory Fees: The Adviser, a wholly-owned subsidiary of Morgan Stanley, provides the Fund with advisory services under the terms of an Investment Advisory Agreement, paid quarterly, at the annual rate based on the daily net assets as follows:
First $750
million | | Next $750
million | | Over $1.5
billion | |
| | 0.60 | % | | | 0.55 | % | | | 0.50 | % | |
For the year ended December 31, 2019, the advisory fee rate (net of waiver/rebate) was equivalent to an annual effective rate of 0.00% of the Fund's average daily net assets.
The Adviser has agreed to reduce its advisory fee and/or reimburse the Fund so that total annual Fund operating expenses, excluding certain investment related expenses, taxes, interest and other extraordinary expenses (including litigation), will not exceed 0.80% for Class I shares, 1.15% for Class A shares, 1.90% for Class C shares and 0.75% for Class IS shares. The fee waivers and/or expense reimbursements will continue for at least one year from the date of the Fund's prospectus or until such time as the Directors act to discontinue all or a portion of
16
Morgan Stanley Institutional Fund, Inc.
Annual Report — December 31, 2019
Notes to Financial Statements (cont'd)
such waivers and/or reimbursements when they deem such action is appropriate. For the year ended December 31, 2019, approximately $84,000 of advisory fees were waived and approximately $101,000 of other expenses were reimbursed by the Adviser pursuant to this arrangement.
C. Administration Fees: The Adviser also serves as Administrator to the Company and provides administrative services pursuant to an Administration Agreement for an annual fee, accrued daily and paid monthly, of 0.08% of the Fund's average daily net assets.
Under a Sub-Administration Agreement between the Administrator and State Street Bank and Trust Company ("State Street"), State Street provides certain administrative services to the Company. For such services, the Administrator pays State Street a portion of the fee the Administrator receives from the Fund.
D. Distribution and Shareholder Services Fees: Morgan Stanley Distribution, Inc. ("MSDI" or the "Distributor"), a wholly-owned subsidiary of the Adviser and an indirect subsidiary of Morgan Stanley, serves as the Company's Distributor of Fund shares pursuant to a Distribution Agreement. The Company has adopted a Shareholder Services Plan with respect to Class A shares pursuant to Rule 12b-1 under the Act. Under the Shareholder Services Plan, the Fund pays the Distributor a shareholder services fee, accrued daily and paid monthly, at an annual rate of 0.25% of the Fund's average daily net assets attributable to Class A shares.
The Company has adopted a Distribution and Shareholder Services Plan with respect to Class C shares pursuant to Rule 12b-1 under the Act. Under the Distribution and Shareholder Services Plan, the Fund pays the Distributor a distribution fee, accrued daily and paid monthly, at an annual rate of 0.75% and a shareholder services fee, accrued daily and paid monthly, at an annual rate of 0.25% of the Fund's average daily net assets attributable to Class C shares.
The distribution and shareholder services fees are used to support the expenses associated with servicing and maintaining accounts. The Distributor may compensate other parties for providing shareholder support services to investors who purchase Class A and Class C shares.
E. Dividend Disbursing and Transfer Agent: The Company's dividend disbursing and transfer agent is DST Asset Manager Solutions, Inc. ("DST"). Pursuant to a Transfer Agency Agreement, the Company pays DST a fee based on the
number of classes, accounts and transactions relating to the Funds of the Company.
F. Custodian Fees: State Street (the "Custodian") also serves as Custodian for the Company in accordance with a Custodian Agreement. The Custodian holds cash, securities and other assets of the Company as required by the Act. Custody fees are payable monthly based on assets held in custody, investment purchases and sales activity and account maintenance fees, plus reimbursement for certain out-of-pocket expenses.
G. Security Transactions and Transactions with Affiliates: For the year ended December 31, 2019, purchases and sales of investment securities for the Fund, other than long-term U.S. Government securities and short-term investments were approximately $13,226,000 and $9,499,000, respectively. There were no purchases and sales of long-term U.S. Government securities for the year ended December 31, 2019.
The Fund invests in the Institutional Class of the Morgan Stanley Institutional Liquidity Funds — Treasury Securities Portfolio (the "Liquidity Funds"), an open-end management investment company managed by the Adviser. Advisory fees paid by the Fund are reduced by an amount equal to its pro-rata share of the advisory and administration fees paid by the Fund due to its investment in the Liquidity Funds. For the year ended December 31, 2019, advisory fees paid were reduced by less than $500 relating to the Fund's investment in the Liquidity Funds.
A summary of the Fund's transactions in shares of affiliated investments during the year ended December 31, 2019 is as follows:
Affiliated
Investment
Company | | Value
December 31,
2018
(000) | | Purchases
at Cost
(000) | | Proceeds
from Sales
(000) | | Dividend
Income
(000) | |
Liquidity Funds | | $ | 341 | | | $ | 5,714 | | | $ | 5,972 | | | $ | 4 | | |
Affiliated
Investment
Company (cont'd) | | Realized
Gain (Loss)
(000) | | Change in
Unrealized
Appreciation
(Depreciation)
(000) | | Value
December 31,
2019
(000) | |
Liquidity Funds | | $ | — | | | $ | — | | | $ | 83 | | |
The Fund is permitted to purchase and sell securities ("cross-trade") from and to other Morgan Stanley funds as well as other funds and client accounts for which the Adviser or an affiliate of the Adviser serves as investment adviser, pursuant to procedures approved by the Directors in compliance with
17
Morgan Stanley Institutional Fund, Inc.
Annual Report — December 31, 2019
Notes to Financial Statements (cont'd)
Rule 17a-7 under the Act (the "Rule"). Each cross-trade is executed at the current market price in compliance with provisions of the Rule. For the year ended December 31, 2019, the Fund did not engage in any cross-trade transactions.
The Fund has an unfunded Deferred Compensation Plan (the "Compensation Plan"), which allows each independent Director to defer payment of all, or a portion, of the fees he or she receives for serving on the Board of Directors. Each eligible Director generally may elect to have the deferred amounts credited with a return equal to the total return on one or more of the Morgan Stanley funds that are offered as investment options under the Compensation Plan. Appreciation/depreciation and distributions received from these investments are recorded with an offsetting increase/decrease in the deferred compensation obligation and do not affect the NAV of the Fund.
H. Federal Income Taxes: It is the Fund's intention to continue to qualify as a regulated investment company and distribute all of its taxable and tax-exempt income. Accordingly, no provision for federal income taxes is required in the financial statements.
The Fund may be subject to taxes imposed by countries in which it invests. Such taxes are generally based on income and/or capital gains earned or repatriated. Taxes are accrued based on net investment income, net realized gains and net unrealized appreciation as such income and/or gains are earned. Taxes may also be based on transactions in foreign currency and are accrued based on the value of investments denominated in such currency.
FASB ASC 740-10, "Income Taxes — Overall", sets forth a minimum threshold for financial statement recognition of the benefit of a tax position taken or expected to be taken in a tax return. Management has concluded there are no significant uncertain tax positions that would require recognition in the financial statements. If applicable, the Fund recognizes interest accrued related to unrecognized tax benefits in "Interest Expense" and penalties in "Other Expenses" in the Statement of Operations. The Fund files tax returns with the U.S. Internal Revenue Service, New York and various states. Generally, each of the tax years in the four-year period ended December 31, 2019 remains subject to examination by taxing authorities.
The tax character of distributions paid may differ from the character of distributions shown for GAAP purposes due to short-term capital gains being treated as ordinary income for
tax purposes. The tax character of distributions paid during fiscal years 2019 and 2018 was as follows:
2019
Distributions
Paid From: | | 2018
Distributions
Paid From: | |
Ordinary
Income
(000) | | Long-Term
Capital
Gain
(000) | | Ordinary
Income
(000) | | Long-Term
Capital
Gain
(000) | |
| $ | 92 | | | $ | 125 | | | $ | 40 | | | $ | 111 | | |
The amount and character of income and gains to be distributed are determined in accordance with income tax regulations which may differ from GAAP. These book/tax differences are either considered temporary or permanent in nature.
Temporary differences are attributable to differing book and tax treatments for the timing of the recognition of gains (losses) on certain investment transactions and the timing of the deductibility of certain expenses.
Permanent differences, primarily due to a nondeductible expense, resulted in the following reclassifications among the components of net assets at December 31, 2019:
Total
Distributable
Earnings
(000) | | Paid-in-
Capital
(000) | |
| $ | 1 | | | $ | (1 | ) | |
At December 31, 2019, the components of distributable earnings for the Fund on a tax basis were as follows:
Undistributed
Ordinary
Income
(000) | | Undistributed
Long-Term
Capital Gain
(000) | |
| | @ | | | $ | 83 | | |
@ Amount is less than $500
I. Credit Facility: The Company and other Morgan Stanley funds participated in a $150,000,000 committed, unsecured revolving line of credit facility (the "Facility") with State Street. Effective April 22, 2019, the committed line amount increased to $300,000,000. This Facility is to be used for temporary emergency purposes or funding of shareholder redemption requests. The interest rate on borrowings is based on the federal funds rate or 1 month LIBOR rate plus a spread. The Facility also has a commitment fee of 0.25% per annum based on the unused portion of the Facility. During the year ended December 31, 2019, the Fund did not have any borrowings under the Facility.
J. Other: At December 31, 2019, the Fund had record owners of 10% or greater. Investment activities of these shareholders could have a material impact on the Fund. The aggregate percentage of such owners was 59.3%.
18
Morgan Stanley Institutional Fund, Inc.
Annual Report — December 31, 2019
Report of Independent Registered Public Accounting Firm
To the Shareholders and Board of Directors of
Morgan Stanley Institutional Fund, Inc. —
US Core Portfolio
Opinion on the Financial Statements
We have audited the accompanying statement of assets and liabilities of US Core Portfolio (the "Fund") (one of the funds constituting Morgan Stanley Institutional Fund, Inc. (the "Company")), including the portfolio of investments, as of December 31, 2019, and the related statement of operations for the year then ended, the statements of changes in net assets for each of the two years in the period then ended and the financial highlights for each of the three years in the period then ended and the period from May 27, 2016 (commencement of operations) through December 31, 2016 and the related notes (collectively referred to as the "financial statements"). In our opinion, the financial statements present fairly, in all material respects, the financial position of US Core Portfolio (one of the funds constituting Morgan Stanley Institutional Fund, Inc.) at December 31, 2019, the results of its operations for the year then ended, the changes in its net assets for each of the two years in the period then ended and its financial highlights for each of the three years in the period then ended and the period from May 27, 2016 (commencement of operations) through December 31, 2016, in conformity with U.S. generally accepted accounting principles.
Basis for Opinion
These financial statements are the responsibility of the Company's management. Our responsibility is to express an opinion on the Fund's financial statements based on our audits. We are a public accounting firm registered with the Public Company Accounting Oversight Board (United States) ("PCAOB") and are required to be independent with respect to the Company in accordance with the U.S. federal securities law and the applicable rules and regulations of the Securities and Exchange Commission and the PCAOB.
We conducted our audits in accordance with the standards of the PCAOB. Those standards require that we plan and perform the audit to obtain reasonable assurance about whether the financial statements are free of material misstatement, whether due to error or fraud. The Company is not required to have, nor were we engaged to perform, an audit of the Company's internal control over financial reporting. As part of our audits, we are required to obtain an understanding of internal control over financial reporting, but not for the purpose of expressing an opinion on the effectiveness of the Company's internal control over financial reporting. Accordingly, we express no such opinion.
Our audits included performing procedures to assess the risks of material misstatement of the financial statements, whether due to error or fraud, and performing procedures that respond to those risks. Such procedures included examining, on a test basis, evidence regarding the amounts and disclosures in the financial statements. Our procedures included confirmation of securities owned as of December 31, 2019 by correspondence with the custodian and others or by other appropriate auditing procedures where replies from others were not received. Our audits also included evaluating the accounting principles used and significant estimates made by management, as well as evaluating the overall presentation of the financial statements. We believe that our audits provide a reasonable basis for our opinion.

We have served as the auditor of one or more Morgan Stanley investment companies since 2000.
Boston, Massachusetts
February 27, 2020
19
Morgan Stanley Institutional Fund, Inc.
Annual Report — December 31, 2019
Federal Tax Notice (unaudited)
For federal income tax purposes, the following information is furnished with respect to the distributions paid by the Fund during its taxable year ended December 31, 2019. For corporate shareholders 100% of the dividends qualified for the dividends received deduction.
The Fund designated and paid approximately $125,000 as a long-term capital gain distribution.
For federal income tax purposes, the following information is furnished with respect to the Fund's earnings for its taxable year ended December 31, 2019. When distributed, certain earnings may be subject to a maximum tax rate of 15% as provided for by the Jobs and Growth Tax Relief Reconciliation Act of 2003. The Fund designated up to a maximum of approximately $92,000 as taxable at this lower rate.
In January, the Fund provides tax information to shareholders for the preceding calendar year.
20
Privacy Notice (unaudited) April 2019
FACTS | | WHAT DOES MSIM DO WITH YOUR PERSONAL INFORMATION? | |
Why? | | Financial companies choose how they share your personal information. Federal law gives consumers the right to limit some but not all sharing. Federal law also requires us to tell you how we collect, share, and protect your personal information. Please read this notice carefully to understand what we do. | |
What? | | The types of personal information we collect and share depend on the product or service you have with us. This information can include:
n Social Security number and income
n investment experience and risk tolerance
n checking account number and wire transfer instructions | |
How? | | All financial companies need to share customers' personal information to run their everyday business. In the section below, we list the reasons financial companies can share their customers' personal information; the reasons MSIM chooses to share; and whether you can limit this sharing. | |
Reasons we can share your personal information | | Does MSIM share? | | Can you limit this sharing? | |
For our everyday business purposes —
such as to process your transactions, maintain your account(s), respond to court orders and legal investigations, or report to credit bureaus | | Yes | | No | |
For our marketing purposes —
to offer our products and services to you | | Yes | | No | |
For joint marketing with other financial companies | | No | | We don't share | |
For our affiliates' everyday business purposes —
information about your transactions and experiences | | Yes | | No | |
For our affiliates' everyday business purposes —
information about your creditworthiness | | No | | We don't share | |
For our affiliates to market to you | | No | | We don't share | |
For non-affiliates to market to you | | No | | We don't share | |
Questions? Call toll-free (844) 312-6327 or email: imprivacyinquiries@morganstanley.com
21
Privacy Notice (unaudited) (cont'd) April 2019
Who we are
Who is providing this notice? | | Morgan Stanley Investment Management, Inc. and its affiliated registered investment advisers, registered broker-dealers, and registered and unregistered funds ("MSIM") | |
What we do
How does MSIM protect my personal information? | | To protect your personal information from unauthorized access and use, we use security measures that comply with federal law. These measures include computer safeguards and secured files and buildings. We have policies governing the proper handling of customer information by personnel and requiring third parties that provide support to adhere to appropriate security standards with respect to such information. | |
How does MSIM collect my personal information? | | We collect your personal information, for example, when you
n open an account or make deposits or withdrawals from your account
n buy securities from us or make a wire transfer
n give us your contact information
We also collect your personal information from others, such as credit bureaus, affiliates, or other companies. | |
Why can't I limit all sharing? | | Federal law gives you the right to limit only
n sharing for affiliates' everyday business purposes — information about your creditworthiness
n affiliates from using your information to market to you
n sharing for non-affiliates to market to you
State laws and individual companies may give you additional rights to limit sharing. See below for more on your rights under state law. | |
Definitions
Affiliates | | Companies related by common ownership or control. They can be financial and non-financial companies.
n Our affiliates include companies with a Morgan Stanley name and financial companies such as Morgan Stanley Smith Barney LLC and Morgan Stanley & Co. | |
Non-affiliates | | Companies not related by common ownership or control. They can be financial and non-financial companies.
n MSIM does not share with non-affiliates so they can market to you. | |
Joint marketing | | A formal agreement between non-affiliated financial companies that together market financial products or services to you.
n MSIM doesn't jointly market | |
Other important information
Vermont: Except as permitted by law, we will not share personal information we collect about Vermont residents with Non-affiliates unless you provide us with your written consent to share such information.
California: Except as permitted by law, we will not share personal information we collect about California residents with Non-affiliates and we will limit sharing such personal information with our Affiliates to comply with California privacy laws that apply to us.
22
Morgan Stanley Institutional Fund, Inc.
Annual Report — December 31, 2019
Director and Officer Information (unaudited)
Independent Directors:
Name, Birth Year
and Address of
Independent Director | | Position(s)
Held with
Registrant | | Length of Time
Served* | | Principal Occupation(s) During Past 5 Years
and Other Relevant Professional Experience | | Number of
Funds in Fund
Complex
Overseen by
Independent
Director** | | Other Directorships
Held by Independent
Director*** | |
Frank L. Bowman
c/o Perkins Coie LLP
Counsel to the Independent Directors
1155 Avenue of the Americas
New York, NY 10036
Birth Year 1944 | | Director | | Since August 2006 | | President, Strategic Decisions, LLC (consulting) (since February 2009); Director or Trustee of various Morgan Stanley Funds (since August 2006); Chairperson of the Compliance and Insurance Committee (since October 2015); formerly, Chairperson of the Insurance Sub-Committee of the Compliance and Insurance Committee (2007-2015); served as President and Chief Executive Officer of the Nuclear Energy Institute (policy organization) (February 2005-November 2008); retired as Admiral, U.S. Navy after serving over 38 years on active duty including 8 years as Director of the Naval Nuclear Propulsion Program in the Department of the Navy and the U.S. Department of Energy (1996-2004); served as Chief of Naval Personnel (July 1994-September 1996) and on the Joint Staff as Director of Political Military Affairs (June 1992-July 1994); knighted as Honorary Knight Commander of the Most Excellent Order of the British Empire; awarded the Officier de l'Orde National du Mérite by the French Government; elected to the National Academy of Engineering (2009). | | | 86 | | | Director of Naval and Nuclear Technologies LLP; Director Emeritus of the Armed Services YMCA; Member of the National Security Advisory Council of the Center for U.S. Global Engagement and a member of the CNA Military Advisory Board; Trustee of Fairhaven United Methodist Church; Member of the Board of Advisors of the Dolphin Scholarship Foundation; Director of other various non-profit organizations; formerly, Director of BP p.l.c. (November 2010-May 2019). | |
Kathleen A. Dennis
c/o Perkins Coie LLP
Counsel to the Independent Directors
1155 Avenue of the Americas
New York, NY 10036
Birth Year 1953 | | Director | | Since August 2006 | | President, Cedarwood Associates (mutual fund and investment management consulting) (since July 2006); Chairperson of the Liquidity and Alternatives Sub-Committee of the Investment Committee (since October 2006) and Director or Trustee of various Morgan Stanley Funds (since August 2006); formerly, Senior Managing Director of Victory Capital Management (1993-2006). | | | 86 | | | Director of various non-profit organizations. | |
Nancy C. Everett
c/o Perkins Coie LLP
Counsel to the Independent Directors
1155 Avenue of the Americas
New York, NY 10036
Birth Year 1955 | | Director | | Since January 2015 | | Chief Executive Officer, Virginia Commonwealth University Investment Company (since November 2015); Owner, OBIR, LLC (institutional investment management consulting) (since June 2014); formerly, Managing Director, BlackRock, Inc. (February 2011-December 2013); and Chief Executive Officer, General Motors Asset Management (a/k/a Promark Global Advisors, Inc.) (June 2005-May 2010). | | | 87 | | | Formerly, Member of Virginia Commonwealth University School of Business Foundation (2005-2016); Member of Virginia Commonwealth University Board of Visitors (2013-2015); Member of Committee on Directors for Emerging Markets Growth Fund, Inc. (2007-2010); Chairperson of Performance Equity Management, LLC (2006-2010); and Chairperson, GMAM Absolute Return Strategies Fund, LLC (2006-2010). | |
23
Morgan Stanley Institutional Fund, Inc.
Annual Report — December 31, 2019
Director and Officer Information (unaudited) (cont'd)
Independent Directors: (cont'd)
Name, Birth Year
and Address of
Independent Director | | Position(s)
Held with
Registrant | | Length of Time
Served* | | Principal Occupation(s) During Past 5 Years
and Other Relevant Professional Experience | | Number of
Funds in Fund
Complex
Overseen by
Independent
Director** | | Other Directorships
Held by Independent
Director*** | |
Jakki L. Haussler
c/o Perkins Coie LLP
Counsel to the Independent Directors
1155 Avenue of the Americas
New York, NY 10036
Birth Year 1957 | | Director | | Since January 2015 | | Chairman, Opus Capital Group (since 1996); formerly, Chief Executive Officer, Opus Capital Group (1996-2019); Director, Capvest Venture Fund, LP (May 2000-December 2011); Partner, Adena Ventures, LP (July 1999-December 2010); Director, The Victory Funds (February 2005-July 2008). | | | 87 | | | Director of Service Corporation International and Member, Audit Committee and Investment Committee; Director of Cincinnati Bell Inc. and Member, Audit Committee and Governance and Nominating Committee; Chairman of Northern Kentucky University Member Investment Committee; Member of Chase College of Law Transactional Law Practice Center Board of Advisors; Director of Best Transport; Director of Chase College of Law Board of Visitors; formerly, Member, University of Cincinnati Foundation Investment Committee; Member, Miami University Board of Visitors (2008-2011); Trustee of Victory Funds (2005-2008) and Chairman, Investment Committee (2007-2008) and Member, Service Provider Committee (2005-2008). | |
Dr. Manuel H. Johnson
c/o Johnson Smick International, Inc.
220 I Street, NE — Suite 200
Washington, D.C. 20002
Birth Year 1949 | | Director | | Since July 1991 | | Senior Partner, Johnson Smick International, Inc. (consulting firm); Chairperson of the Investment Committee (since October 2006) and Director or Trustee of various Morgan Stanley Funds (since July 1991); Co-Chairman and a founder of the Group of Seven Council (G7C) (international economic commission); formerly, Chairperson of the Audit Committee (July 1991-September 2006), Vice Chairman of the Board of Governors of the Federal Reserve System and Assistant Secretary of the U.S. Treasury. | | | 86 | | | Director of NVR, Inc. (home construction). | |
Joseph J. Kearns
c/o Perkins Coie LLP
Counsel to the Independent Directors
1155 Avenue of the Americas
New York, NY 10036
Birth Year 1942 | | Director | | Since August 1994 | | Senior Adviser, Kearns & Associates LLC (investment consulting); Chairperson of the Audit Committee (since October 2006) and Director or Trustee of various Morgan Stanley Funds (since August 1994); formerly, Deputy Chairperson of the Audit Committee (July 2003-September 2006) and Chairperson of the Audit Committee of various Morgan Stanley Funds (since August 1994); CFO of the J. Paul Getty Trust. | | | 87 | | | Prior to August 10, 2016, Director of Electro Rent Corporation (equipment leasing); Prior to December 31, 2013, Director of The Ford Family Foundation. | |
24
Morgan Stanley Institutional Fund, Inc.
Annual Report — December 31, 2019
Director and Officer Information (unaudited) (cont'd)
Independent Directors: (cont'd)
Name, Birth Year
and Address of
Independent Director | | Position(s)
Held with
Registrant | | Length of Time
Served* | | Principal Occupation(s) During Past 5 Years
and Other Relevant Professional Experience | | Number of
Funds in Fund
Complex
Overseen by
Independent
Director** | | Other Directorships
Held by Independent
Director*** | |
Michael F. Klein
c/o Perkins Coie LLP
Counsel to the Independent Directors
1155 Avenue of the Americas
New York, NY 10036
Birth Year 1958 | | Director | | Since August 2006 | | Managing Director, Aetos Alternatives Management, LP (since March 2000); Co-President, Aetos Alternatives Management, LP (since January 2004) and Co-Chief Executive Officer of Aetos Alternatives Management, LP (since August 2013); Chairperson of the Fixed Income Sub-Committee of the Investment Committee (since October 2006) and Director or Trustee of various Morgan Stanley Funds (since August 2006); formerly, Managing Director, Morgan Stanley & Co. Inc. and Morgan Stanley Dean Witter Investment Management and President, various Morgan Stanley Funds (June 1998-March 2000); Principal, Morgan Stanley & Co. Inc. and Morgan Stanley Dean Witter Investment Management (August 1997-December 1999). | | | 86 | | | Director of certain investment funds managed or sponsored by Aetos Alternatives Management, LP; Director of Sanitized AG and Sanitized Marketing AG (specialty chemicals). | |
Patricia Maleski
c/o Perkins Coie LLP
Counsel to the Independent Directors
1155 Avenue of the Americas
New York, NY 10036
Birth Year 1960 | | Director | | Since January 2017 | | Managing Director, JPMorgan Asset Management (2004-2016); Oversight and Control Head of Fiduciary and Conflicts of Interest Program (2015-2016); Chief Control Officer-Global Asset Management (2013-2015); President, JPMorgan Funds (2010-2013); Chief Administrative Officer (2004-2013); various other positions including Treasurer and Board Liaison (since 2001). | | | 87 | | | None. | |
Michael E. Nugent
522 Fifth Avenue
New York, NY 10036
Birth Year 1936 | | Chair of the Board and Director | | Chair of the Boards since July 2006 and Director since July 1991 | | Chair of the Boards of various Morgan Stanley Funds (since July 2006); Chairperson of the Governance Committee (since January 2019) and Director or Trustee of various Morgan Stanley Funds (since July 1991); formerly, Chairperson of each of the Closed-End Fund committee (until December 2019) and the Insurance Committee (until July 2006); General Partner, Triumph Capital, L.P. (private investment partnership) (1988-2013). | | | 86 | | | None. | |
W. Allen Reed
c/o Perkins Coie LLP
Counsel to the Independent Directors
1155 Avenue of the Americas
New York, NY 10036
Birth Year 1947 | | Vice Chair of the Board and Director | | Vice Chair of the Boards since January 2020 and Director since August 2006 | | Chairperson of the Equity Sub-Committee of the Investment Committee (since October 2006) and Director or Trustee of various Morgan Stanley Funds (since August 2006); formerly, President and CEO of General Motors Asset Management; Chairman and Chief Executive Officer of the GM Trust Bank and Corporate Vice President of General Motors Corporation (August 1994- December 2005). | | | 86 | | | Formerly, Director of Legg Mason, Inc.; formerly, Director of the Auburn University Foundation (2010-2015). | |
* This is the earliest date the Director began serving the Morgan Stanley Funds. Each Director serves an indefinite term, until his or her successor is elected.
** The Fund Complex includes (as of December 31, 2019) all open-end and closed-end funds (including all of their portfolios) advised by Morgan Stanley Investment Management Inc. (the "Adviser") and any funds that have an adviser that is an affiliated person of the Adviser (including, but not limited to, Morgan Stanley AIP GP LP).
*** This includes any directorships at public companies and registered investment companies held by the Director at any time during the past five years.
25
Morgan Stanley Institutional Fund, Inc.
Annual Report — December 31, 2019
Director and Officer Information (unaudited) (cont'd)
Executive Officers:
Name, Birth Year and Address of
Executive Officer | | Position(s)
Held with
Registrant | | Length of Time
Served* | | Principal Occupation(s) During Past 5 Years | |
John H. Gernon
522 Fifth Avenue
New York, NY 10036
Birth Year 1963 | | President and Principal Executive Officer | | Since September 2013 | | President and Principal Executive Officer of the Equity and Fixed Income Funds and the Morgan Stanley AIP Funds (since September 2013) and the Liquidity Funds and various money market funds (since May 2014) in the Fund Complex; Managing Director of the Adviser; Head of Product (since 2006). | |
Timothy J. Knierim
522 Fifth Avenue
New York, NY 10036
Birth Year 1959 | | Chief Compliance Officer | | Since December 2016 | | Managing Director of the Adviser and various entities affiliated with the Adviser; Chief Compliance Officer of various Morgan Stanley Funds and the Adviser (since December 2016) and Chief Compliance Officer of Morgan Stanley AIP GP LP (since 2014). Formerly, Managing Director and Deputy Chief Compliance Officer of the Adviser (2014-2016); and formerly, Chief Compliance Officer of Prudential Investment Management, Inc. (2007-2014). | |
Francis J. Smith
522 Fifth Avenue
New York, NY 10036
Birth Year 1965 | | Treasurer and Principal Financial Officer | | Treasurer since July 2003 and Principal Financial Officer since September 2002 | | Managing Director of the Adviser and various entities affiliated with the Adviser; Treasurer (since July 2003) and Principal Financial Officer of various Morgan Stanley Funds (since September 2002). | |
Mary E. Mullin
522 Fifth Avenue
New York, NY 10036
Birth Year 1967 | | Secretary | | Since June 1999 | | Managing Director of the Adviser; Secretary of various Morgan Stanley Funds (since June 1999). | |
Michael J. Key
522 Fifth Avenue
New York, NY 10036
Birth Year 1979 | | Vice President | | Since June 2017 | | Vice President of the Equity and Fixed Income Funds, Liquidity Funds, various money market funds and the Morgan Stanley AIP Funds in the Fund Complex (since June 2017); Executive Director of the Adviser; Head of Product Development for Equity and Fixed Income Funds (since August 2013). | |
* This is the earliest date the officer began serving the Morgan Stanley Funds. Each officer serves a one-year term, until his or her successor is elected and qualifies.
26
Morgan Stanley Institutional Fund, Inc.
Annual Report — December 31, 2019
Adviser and Administrator
Morgan Stanley Investment Management Inc.
522 Fifth Avenue
New York, New York 10036
Distributor
Morgan Stanley Distribution, Inc.
522 Fifth Avenue
New York, New York 10036
Dividend Disbursing and Transfer Agent
DST Asset Manager Solutions, Inc.
2000 Crown Colony Drive
Quincy, Massachusetts 02169
Custodian
State Street Bank and Trust Company
One Lincoln Street
Boston, Massachusetts 02111
Legal Counsel
Dechert LLP
1095 Avenue of the Americas
New York, New York 10036
Counsel to the Independent Directors
Perkins Coie LLP
1155 Avenue of the Americas
New York, New York 10036
Independent Registered Public Accounting Firm
Ernst & Young LLP
200 Clarendon Street
Boston, Massachusetts 02116
Reporting to Shareholders
Each Morgan Stanley fund provides a complete schedule of portfolio holdings in its Semi-Annual and the Annual Reports within 60 days of the end of the fund's second and fourth fiscal quarters. The Semi-Annual and Annual Reports are filed electronically with the Securities and Exchange Commission ("SEC") on Form N-CSRS and Form N-CSR, respectively. Morgan Stanley also delivers the Semi-Annual and Annual Reports to fund shareholders and makes these reports available on its public website, www.morganstanley.com/im/shareholderreports. Each Morgan Stanley non-money market fund also files a complete schedule of portfolio holdings with the SEC for the fund's first and third fiscal quarters as an attachment to Form N-PORT. Morgan Stanley does not deliver the reports for the first and third fiscal quarters to shareholders, nor are the reports posted to the Morgan Stanley public website. However, the holdings for each money market fund are posted to the Morgan Stanley public website. You may obtain the Form N-PORT filings (as well as the Form N-CSR and N-CSRS filings) by accessing the SEC's website, www.sec.gov. You can also request copies of these materials, upon payment of a duplicating fee, by electronic request at the SEC's email address (publicinfo@sec.gov).
Proxy Voting Policies and Procedures and Proxy Voting Record
You may obtain a copy of the Company's Proxy Voting Policy and Procedures and information regarding how the Company voted proxies relating to portfolio securities during the most recent twelve-month period ended June 30, without charge, upon request, by calling toll free 1 (800) 548-7786 or by visiting our website at www.morganstanley.com/im/shareholderreports. This information is also available on the SEC's website at www.sec.gov.
This report is authorized for distribution only when preceded or accompanied by a prospectus or summary prospectus of the applicable fund of Morgan Stanley Institutional Fund, Inc., which describes in detail the fund's investment policies, risks, fees and expenses. Please read the prospectus carefully before you invest or send money. For additional information, including information regarding the investments comprising the Fund, please visit our website at www.morganstanley.com/im/shareholderreports or call toll free 1 (800) 548-7786.
27
Printed in U.S.A.
This Report has been prepared for shareholders and may be distributed to others only if preceded or accompanied by a current prospectus.
Morgan Stanley Investment Management Inc.
522 Fifth Avenue
New York, New York 10036
© 2020 Morgan Stanley. Morgan Stanley Distribution, Inc.

IFIUSCPANN
2916008 EXP. 02.28.21

Morgan Stanley Institutional Fund, Inc.
Global Concentrated Real Estate Portfolio
Annual Report
December 31, 2019
Beginning on January 1, 2021, as permitted by regulations adopted by the Securities and Exchange Commission ("SEC"), paper copies of the Fund's Annual and Semi-Annual Reports to Shareholders ("Shareholder Reports") will no longer be sent by mail, unless you specifically request paper copies of the Shareholder Reports from the Fund or from your financial intermediary, such as a broker-dealer or a bank. Instead, the Shareholder Reports will be made available on the Fund's website, https://www.morganstanley.com/im/shareholderreports and you will be notified by mail each time a Shareholder Report is posted and provided with a website link to access the Shareholder Report. If you already elected to receive Shareholder Reports electronically, you will not be affected by this change and you need not take any action. You may elect to receive Shareholder Reports and other communications from the Fund electronically anytime by contacting your financial intermediary or, if you are a direct investor, please follow the instructions on the envelope.
Beginning on January 1, 2019, you may elect to receive all future Shareholder Reports in paper free of charge. If you invest through a financial intermediary, you can contact your financial intermediary to request that you continue to receive paper copies of your Shareholder Reports. If you invest directly with the Fund, please follow the instructions on the envelope to let the Fund know you wish to continue receiving paper copies of your Shareholder Reports. Your election to receive Shareholder Reports in paper will apply to all funds held in your account if you invest through your financial intermediary or all funds held with the fund complex if you invest directly with a fund.

Morgan Stanley Institutional Fund, Inc.
Annual Report — December 31, 2019
Shareholders' Letter | | | 2 | | |
Expense Example | | | 3 | | |
Investment Overview | | | 4 | | |
Portfolio of Investments | | | 8 | | |
Statement of Assets and Liabilities | | | 10 | | |
Statement of Operations | | | 11 | | |
Statements of Changes in Net Assets | | | 12 | | |
Financial Highlights | | | 13 | | |
Notes to Financial Statements | | | 17 | | |
Report of Independent Registered Public Accounting Firm | | | 23 | | |
Federal Tax Notice | | | 24 | | |
Privacy Notice | | | 25 | | |
Director and Officer Information | | | 27 | | |
This report is authorized for distribution only when preceded or accompanied by a prospectus or summary prospectus of the applicable Fund of Morgan Stanley Institutional Fund, Inc. To receive a prospectus and/or statement of additional information ("SAI"), which contains more complete information such as investment objectives, charges, expenses, policies for voting proxies, risk considerations and describes in detail each of the Fund's investment policies to the prospective investor, please call toll free 1 (800) 548-7786. Please read the prospectuses carefully before you invest or send money.
Additionally, you can access information about the Fund, including performance, characteristics and investment team commentary, through Morgan Stanley Investment Management's website: www.morganstanley.com/im/shareholderreports.
Market forecasts provided in this report may not necessarily come to pass. There is no guarantee that any sectors mentioned will continue to perform as discussed herein or that securities in such sectors will be held by the Fund in the future. There is no assurance that a fund will achieve its investment objective. Funds are subject to market risk, which is the possibility that market values of securities owned by the Fund will decline and, therefore, the value of the Fund's shares may be less than what you paid for them. Accordingly, you can lose money investing in this Fund. Please see the prospectus for more complete information on investment risks.
1
Morgan Stanley Institutional Fund, Inc.
Annual Report — December 31, 2019
Shareholders' Letter (unaudited)
Dear Shareholders,
We are pleased to provide this Annual Report, in which you will learn how your investment in Global Concentrated Real Estate Portfolio (the "Fund") performed during the latest twelve-month period.
Morgan Stanley Investment Management is a client-centric, investor-led organization. Our global presence, intellectual capital, and breadth of products and services enable us to partner with investors to meet the evolving challenges of today's financial markets. We aim to deliver superior investment service and to empower our clients to make the informed decisions that help them reach their investment goals.
As always, we thank you for selecting Morgan Stanley Investment Management, and look forward to working with you in the months and years ahead.
Sincerely,

John H. Gernon
President and Principal Executive Officer
January 2020
2
Morgan Stanley Institutional Fund, Inc.
Annual Report — December 31, 2019
Expense Example (unaudited)
Global Concentrated Real Estate Portfolio
As a shareholder of the Fund, you incur two types of costs: (1) transactional costs; and (2) ongoing costs, which may include advisory fees, administration fees, distribution and shareholder services fees and other Fund expenses. This example is intended to help you understand your ongoing costs (in dollars) of investing in the Fund and to compare these costs with the ongoing costs of investing in other mutual funds.
This example is based on an investment of $1,000 invested at the beginning of the six-month period ended December 31, 2019 and held for the entire six-month period.
Actual Expenses
The table below provides information about actual account values and actual expenses. You may use the information in this table, together with the amount you invested, to estimate the expenses that you paid over the period. Simply divide your account value by $1,000 (for example, an $8,600 account value divided by $1,000 = 8.6), then multiply the result by the number in the table under the heading entitled "Actual Expenses Paid During Period" to estimate the expenses you paid on your account during this period.
Hypothetical Example for Comparison Purposes
The table below provides information about hypothetical account values and hypothetical expenses based on the Fund's actual expense ratio and an assumed rate of return of 5% per year before expenses, which is not the Fund's actual return. The hypothetical account values and expenses may not be used to estimate the actual ending account balance or expenses you paid for the period. You may use this information to compare the ongoing costs of investing in the Fund and other funds. To do so, compare this 5% hypothetical example with the 5% hypothetical examples that appear in the shareholder reports of the other funds.
Please note that the expenses shown in the table are meant to highlight your ongoing costs only and do not reflect any transactional costs, such as sales charges (loads). Therefore, the information for each class in the table is useful in comparing ongoing costs only, and will not help you determine the relative total costs of owning different funds. In addition, if these transactional costs were included, your costs would have been higher.
| | | Beginning
Account
Value
7/1/19 | | Actual Ending
Account
Value
12/31/19 | | Hypothetical
Ending Account
Value | | Actual
Expenses
Paid
During
Period* | | Hypothetical
Expenses Paid
During Period* | | Net
Expense
Ratio
During
Period** | |
Global Concentrated Real Estate Portfolio Class I | | $ | 1,000.00 | | | $ | 1,044.40 | | | $ | 1,020.47 | | | $ | 4.84 | | | $ | 4.79 | | | | 0.94 | % | |
Global Concentrated Real Estate Portfolio Class A | | | 1,000.00 | | | | 1,041.80 | | | | 1,018.65 | | | | 6.69 | | | | 6.61 | | | | 1.30 | | |
Global Concentrated Real Estate Portfolio Class C | | | 1,000.00 | | | | 1,038.50 | | | | 1,014.87 | | | | 10.53 | | | | 10.41 | | | | 2.05 | | |
Global Concentrated Real Estate Portfolio Class IS | | | 1,000.00 | | | | 1,043.70 | | | | 1,020.67 | | | | 4.64 | | | | 4.58 | | | | 0.90 | | |
* Expenses are calculated using each Fund Class' annualized net expense ratio (as disclosed), multiplied by the average account value over the period and multiplied by 184/365 (to reflect the most recent one-half year period).
** Annualized.
3
Morgan Stanley Institutional Fund, Inc.
Annual Report — December 31, 2019
Investment Overview (unaudited)
Global Concentrated Real Estate Portfolio
The Fund seeks to provide current income and long-term capital appreciation.
Performance
For the fiscal year ended December 31, 2019, the Fund's Class I shares had a total return based on net asset value and reinvestment of distributions per share of 13.38%, net of fees. The Fund's Class I shares underperformed the Fund's benchmark, the FTSE EPRA Nareit Developed Real Estate Net Total Return Index (the "Index"), which returned 21.91%.
Factors Affecting Performance
• Overall returns have been strong in the real estate investment trust (REIT) market for full year 2019, but there was a wide disparity in share price performance; sectors viewed as defensive generally outperformed as the lower-for-longer investment theme strengthened and segments of the equity market appeared to be pricing in an economic slowdown/recession scenario. Bond yields continued to decline, achieving all-time lows in late August 2019; a phase that began in the fourth quarter of 2018, resulting in negative sovereign bond yields in certain markets (Germany, Japan) and significant bond yield declines in the U.S. and Australia. Given this combination of thematic investing and all-time low bond yields, we have witnessed a continued willingness among investors to pay premium valuations for segments of the market that are viewed as having greater predictability in cash flows. We suspect that underlying private market property valuation has become a less relevant metric as generalist investors and passive funds have become the marginal buyer of real estate securities. Generalist investors appear to place a greater focus on secular themes and are untethered to private market valuations.
• With share prices generally appearing untethered to private real estate values, there are sectors trading at relative valuations previously witnessed during the 2008-09 global financial crisis and some sectors trading in excess of 50% premiums to net asset values (NAVs). There has been a continued willingness to pay premium valuations for segments of the REIT market that are viewed as having greater predictability in cash flows (e.g., U.S. net lease and health care REITs, Japan REITs) or benefiting from a secular investment theme
(e.g., U.S. industrial and data centers). In addition, the concerns with regard to economic growth have generally placed downward pressure on segments that are viewed as more vulnerable — office, retail and hotels. Many of these stocks are trading at large discounts to NAVs, despite significant transactional evidence in the private markets in the office and hotel sectors. This has resulted in a further widening of the disparity in share price valuations among market segments.
• The global real estate securities market gained 21.9% during the 12-month period ending December 31, 2019, as measured by the Index.
o In the U.S., property stocks gained 24.3%, as measured by the FTSE EPRA Nareit U.S. Index.(i) Continued negative sentiment and share price weakness in NYC office and Class A malls resulted in very wide discounts to NAVs, while data centers and net lease assets experienced share price strength due to being viewed as defensive in a lower-for-longer interest rate environment (in the case of net lease) or having a secular growth theme (in the case of data centers).
o In Asia, property stocks gained 17.1%, as measured by the FTSE EPRA Nareit Developed Asia Index.(i) There have been three important macro events impacting Asia: the protests in Hong Kong, the ongoing U.S.-China trade war and the overall view of the market from lower-for-longer (this sentiment peaked in August 2019) to a more recent shift towards modestly higher sovereign bond yields. Following declines due to the continuation of anti-government protests, Hong Kong stocks traded at a wide discount to NAV and continue to trade at the widest discounts on a global basis. In Japan, REITs posted gains due to investors' search for yield, the Bank of Japan's commitment to monetary easing and the asset purchase program, and the segment's defensive characteristics.
o In Europe, property stocks gained 27.3%, as measured by the FTSE EPRA Nareit Developed Europe Index.(i) The U.K. posted the largest gains on a global basis due to currency strength and less uncertainty over Brexit.
4
Morgan Stanley Institutional Fund, Inc.
Annual Report — December 31, 2019
Investment Overview (unaudited) (cont'd)
Global Concentrated Real Estate Portfolio
• The top contributors to performance were the overweight exposure to the U.K. Majors and London office specialists and underweight exposure to German residential.
o U.K. Majors and London office specialists overweight — the U.K. Majors and London office specialists traded at attractive discounted valuations throughout the year, and experienced a strong recovery in share prices in the fourth quarter of 2019 on reduced concerns over Brexit.
o German residential underweight — the Fund's underweight to this sector was a key contributor as the sector experienced steep declines and volatility, particularly after the second quarter of 2019 when the City of Berlin proposed to freeze rents and have rental reductions in some cases, in response to a surge in housing costs.
• The key detractors from performance were the Fund's exposure to the U.S. malls sector and Hong Kong real estate operating companies (REOCs); exposure to U.S. primary central business district (CBD) office, primarily NYC office; and underweight exposure to the U.S. net lease and U.S. industrial sectors.
o U.S. malls — the Fund remained overweight to select owners of Class A malls, as tenant sales in the "A mall" portfolios continue to experience growth despite retailer challenges, but the sector underperformed in the period as sentiment towards retail remains negative.
o Hong Kong REOCs — the overweight to Hong Kong REOCs detracted for the period due to escalation of anti-government protests and market sentiment on the economic uncertainties related to the U.S.-Sino trade war. The stocks experienced a recovery in the fourth quarter of 2019, but still ended the year trading at a significant 47% discount to NAVs.
o U.S. primary CBD office (NYC office) — NYC office REITs posted the top performance in the fourth quarter, but still ended the year trading at a significant discount to NAVs of 25%
o U.S. net lease sector underweight — the sector traded at one of the most significant premiums
to NAV (+47% at the end of December) but the companies experienced share price gains on investor preference for stocks viewed as more defensive, given that net lease companies generally feature more bond-like cash flows.
o U.S. industrial sector underweight — this sector outperformed as it continued to benefit from a secular investment theme despite trading at a +23% premium to NAVs at the end of December 2019.
Management Strategies
• We believe listed real estate security returns should mirror private real estate performance. This strategy may result in periods of underperformance, particularly when the market is driven more by thematic/momentum investing and macro factors, as opposed to fundamentals and intrinsic value. The current prolonged period in which underlying private market valuation is not a relevant determinant of share prices has been surprising. The private market is more than six times larger than the public markets and has, up until this period, always served as a key determinant of share prices and our key metric. It is logical to us that persistent discounts cannot exist when there is so much capital on the sidelines needing to invest, and we believe we will be rewarded as these stocks provide favorable risk-adjusted return opportunities based on our analysis.
• We would note the lack of focus on valuations/fundamentals has been, in our opinion, prolonged due to the following factors:
o Institutional investors have demonstrated a significant preference for private real estate (as opposed to public real estate); as a result, generalist and passive investors have become the marginal buyers.
o Generalist investors tend to focus less on valuations and more on traditional stock market metrics (such as earnings growth and dividend yields) and secular themes.
o Growth of passive investing in the REIT space has contributed to exacerbating the dislocation due to a lack of focus on differentiating among stocks based on fundamentals, and instead adding to overvalued stocks that have grown in
5
Morgan Stanley Institutional Fund, Inc.
Annual Report — December 31, 2019
Investment Overview (unaudited) (cont'd)
Global Concentrated Real Estate Portfolio
market capitalization and reducing exposure to undervalued stocks that have decreased in size.
o Untethered to private real estate valuations, earnings multiples have expanded to record levels in sectors viewed as more defensive or benefiting from favorable secular themes. This has resulted in a willingness to ignore the distinction in multiples used to value assets in the private real estate sector and therefore indifference about the quality of the real estate cash flow when buying stocks based on fund from operations (FFO) multiples, as shown by net lease and health care REITs trading at higher multiples than NYC office REITs.
• Regional bets are currently relatively muted due to a lack of large valuation disparities among the regions and due to macro uncertainties which may impact regional share prices far more than underlying fundamentals and valuations, and we have instead focused more on the significant disparity in valuations within each of the regions. While the overall global real estate securities market ended the period trading at a 5% premium to NAVs, we see significant disparities in valuations among market segments within each of the major regions, with the most attractive expected return prospects from companies concentrated in U.S. central business district office (especially NYC office), U.S. and Continental European high quality retail, the Hong Kong commercial property companies, the U.K. Majors, U.S. hotels, and select opportunities to invest in other core assets at attractive discounted valuations in a number of other global markets.
(i) The FTSE EPRA Nareit U.S. Index is a subset of the FTSE EPRA Nareit Developed Index and is a free float-adjusted market capitalization weighted index composed of listed real estate securities in the U.S. real estate markets. The FTSE EPRA Nareit Developed Asia Index is a subset of the FTSE EPRA Nareit Developed Index and is a free float-adjusted market capitalization weighted index composed of listed real estate securities in the Asia real estate markets. The FTSE EPRA Nareit Developed Europe Index is a subset of the FTSE EPRA Nareit Developed Index and is a free float-adjusted market capitalization weighted index composed of listed real estate securities in the European real estate markets. The performance of the indexes are listed in U.S. dollars and assume reinvestment of dividends. The indexes are unmanaged and their returns do not include any sales charges or fees. Such costs would lower performance. It is not possible to invest directly in an index.
6
Morgan Stanley Institutional Fund, Inc.
Annual Report — December 31, 2019
Investment Overview (unaudited) (cont'd)
Global Concentrated Real Estate Portfolio
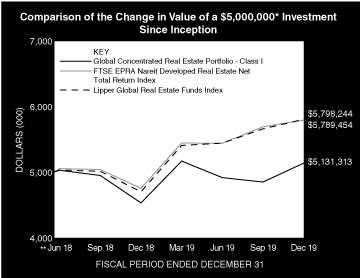
* Minimum Investment for Class I shares
** Commenced Operations on June 18, 2018.
In accordance with SEC regulations, the Fund's performance shown assumes that all recurring fees (including management fees) were deducted and all dividends and distributions were reinvested. The performance of Class A, C and IS shares will vary from the performance of Class I shares and will be negatively impacted by additional fees assessed to those classes (if applicable).
Performance Compared to the FTSE EPRA Nareit Developed Real Estate Net Total Return Index(1) and the Lipper Global Real Estate Funds Index(2)
| | | Period Ended December 31, 2019
Total Returns(3) | |
| | | | | Average Annual | |
| | | One
Year | | Five
Years | | Ten
Years | | Since
Inception(5) | |
Fund — Class I Shares
w/o sales charges(4) | | | 13.38 | % | | | — | | | | — | | | | 1.70 | % | |
Fund — Class A Shares
w/o sales charges(4) | | | 12.85 | | | | — | | | | — | | | | 1.33 | | |
Fund — Class A Shares with
maximum 5.25% sales charges(4) | | | 6.92 | | | | — | | | | — | | | | –2.14 | | |
Fund — Class C Shares
w/o sales charges(4) | | | 12.01 | | | | — | | | | — | | | | 0.57 | | |
Fund — Class C Shares with
maximum 1.00% deferred
sales charges(4) | | | 11.01 | | | | — | | | | — | | | | 0.57 | | |
Fund — Class IS Shares
w/o sales charges(4) | | | 13.43 | | | | — | | | | — | | | | 1.74 | | |
FTSE EPRA Nareit Developed
Real Estate Net Total Return Index | | | 21.91 | | | | — | | | | — | | | | 10.01 | | |
Lipper Global Real Estate
Funds Index | | | 23.63 | | | | — | | | | — | | | | 10.24 | | |
Performance data quoted represents past performance, which is no guarantee of future results, and current performance may be lower or higher than the figures shown. Performance assumes that all dividends and distributions, if any, were reinvested. For the most recent month-end performance figures, please visit www.morganstanley.com/im/shareholderreports. Investment return and principal value will fluctuate so that Fund shares, when redeemed, may be worth more or less than their original cost. Total returns do not reflect the deduction of taxes that a shareholder would pay on Fund distributions or the redemption of Fund shares. Performance of share classes will vary due to difference in sales charges and expenses.
(1) The FTSE EPRA Nareit Developed Real Estate Net Total Return Index is a market capitalization weighted index designed to reflect the stock performance of companies engaged in the North American, European and Asian real estate markets. The performance of the Index is listed in U.S. dollars and assumes reinvestment of net dividends. The Index is unmanaged and its returns do not include any sales charges or fees. Such costs would lower performance. It is not possible to invest directly in an index.
(2) The Lipper Global Real Estate Funds Index is an equally weighted performance index of the largest qualifying funds (based on net assets) in the Lipper Global Real Estate Funds classification. The Index, which is adjusted for capital gains distributions and income dividends, is unmanaged and should not be considered an investment. There are currently 30 funds represented in this Index. As of the date of this report, the Fund was in the Lipper Global Real Estate Funds classification.
(3) Total returns for the Fund reflect fees waived and expenses reimbursed, if applicable, by the Adviser (as defined herein). Without such waivers and reimbursements, total returns would have been lower.
(4) Commenced operations on June 18, 2018.
(5) For comparative purposes, average annual since inception returns listed for the Indexes refer to the inception date of the Fund, not the inception of the Index.
7
Morgan Stanley Institutional Fund, Inc.
Annual Report — December 31, 2019
Portfolio of Investments
Global Concentrated Real Estate Portfolio
| | | Shares | | Value
(000) | |
Common Stocks (95.0%) | |
Australia (1.6%) | |
Dexus REIT | | | 2,163 | | | $ | 18 | | |
GPT Group (The) REIT | | | 5,159 | | | | 20 | | |
Scentre Group REIT | | | 14,673 | | | | 40 | | |
| | | | 78 | | |
Canada (0.3%) | |
RioCan Real Estate Investment Trust REIT | | | 838 | | | | 17 | | |
Finland (0.3%) | |
Citycon Oyj | | | 1,361 | | | | 14 | | |
France (6.7%) | |
Gecina SA REIT | | | 507 | | | | 91 | | |
ICADE REIT | | | 97 | | | | 11 | | |
Klepierre SA REIT | | | 4,766 | | | | 181 | | |
Unibail-Rodamco-Westfield REIT | | | 299 | | | | 47 | | |
| | | | 330 | | |
Germany (1.7%) | |
ADO Properties SA | | | 185 | | | | 7 | | |
Deutsche Wohnen SE | | | 1,899 | | | | 77 | | |
| | | | 84 | | |
Hong Kong (18.3%) | |
CK Asset Holdings Ltd. | | | 1,935 | | | | 14 | | |
Hongkong Land Holdings Ltd. | | | 37,972 | | | | 218 | | |
Hysan Development Co., Ltd. | | | 10,547 | | | | 41 | | |
Link REIT | | | 4,982 | | | | 53 | | |
Mandarin Oriental International Ltd. | | | 58,076 | | | | 106 | | |
New World Development Co., Ltd. | | | 10,047 | | | | 14 | | |
Sino Land Co., Ltd. | | | 10,338 | | | | 15 | | |
Sun Hung Kai Properties Ltd. | | | 15,291 | | | | 234 | | |
Swire Properties Ltd. | | | 45,134 | | | | 150 | | |
Wharf Real Estate Investment Co., Ltd. | | | 8,028 | | | | 49 | | |
| | | | 894 | | |
Ireland (0.4%) | |
Hibernia REIT PLC | | | 13,471 | | | | 21 | | |
Japan (5.1%) | |
GLP J-REIT | | | 1 | | | | 1 | | |
Mitsubishi Estate Co., Ltd. | | | 5,567 | | | | 107 | | |
Mitsui Fudosan Co., Ltd. | | | 4,027 | | | | 99 | | |
Nippon Building Fund, Inc. REIT | | | 4 | | | | 29 | | |
Sumitomo Realty & Development Co., Ltd. | | | 404 | | | | 14 | | |
| | | | 250 | | |
Netherlands (1.5%) | |
Eurocommercial Properties N.V. CVA REIT | | | 2,567 | | | | 72 | | |
Norway (0.2%) | |
Entra ASA | | | 746 | | | | 12 | | |
Singapore (0.3%) | |
CapitaLand Ltd. | | | 3,097 | | | | 8 | | |
UOL Group Ltd. | | | 937 | | | | 6 | | |
| | | | 14 | | |
| | | Shares | | Value
(000) | |
Spain (1.6%) | |
Inmobiliaria Colonial Socimi SA REIT | | | 1,071 | | | $ | 14 | | |
Merlin Properties Socimi SA REIT | | | 4,407 | | | | 63 | | |
| | | | 77 | | |
Sweden (0.5%) | |
Hufvudstaden AB, Class A | | | 1,162 | | | | 23 | | |
United Kingdom (9.5%) | |
British Land Co., PLC (The) REIT | | | 9,917 | | | | 84 | | |
Derwent London PLC REIT | | | 1,343 | | | | 71 | | |
Great Portland Estates PLC REIT | | | 8,411 | | | | 96 | | |
Hammerson PLC REIT | | | 19,549 | | | | 80 | | |
Land Securities Group PLC REIT | | | 9,335 | | | | 122 | | |
St. Modwen Properties PLC | | | 1,003 | | | | 7 | | |
Urban & Civic PLC | | | 1,129 | | | | 5 | | |
| | | | 465 | | |
United States (47.0%) | |
American Homes 4 Rent, Class A REIT | | | 371 | | | | 10 | | |
Apartment Investment & Management Co.,
Class A REIT | | | 759 | | | | 39 | | |
AvalonBay Communities, Inc. REIT | | | 598 | | | | 125 | | |
Boston Properties, Inc. REIT | | | 1,451 | | | | 200 | | |
Brixmor Property Group, Inc. REIT | | | 604 | | | | 13 | | |
Camden Property Trust REIT | | | 154 | | | | 16 | | |
CubeSmart REIT | | | 32 | | | | 1 | | |
DiamondRock Hospitality Co. REIT | | | 4,851 | | | | 54 | | |
Equity Residential REIT | | | 1,384 | | | | 112 | | |
Essex Property Trust, Inc. REIT | | | 93 | | | | 28 | | |
Federal Realty Investment Trust REIT | | | 188 | | | | 24 | | |
Healthcare Realty Trust, Inc. REIT | | | 552 | | | | 18 | | |
Host Hotels & Resorts, Inc. REIT | | | 7,724 | | | | 143 | | |
Hudson Pacific Properties, Inc. REIT | | | 1,511 | | | | 57 | | |
JBG SMITH Properties REIT | | | 783 | | | | 31 | | |
Life Storage, Inc. REIT | | | 242 | | | | 26 | | |
Macerich Co. (The) REIT | | | 5,864 | | | | 158 | | |
Mack-Cali Realty Corp. REIT | | | 3,122 | | | | 72 | | |
Mid-America Apartment Communities, Inc. REIT | | | 117 | | | | 16 | | |
Paramount Group, Inc. REIT | | | 3,439 | | | | 48 | | |
ProLogis, Inc. REIT | | | 342 | | | | 31 | | |
Public Storage REIT | | | 54 | | | | 12 | | |
QTS Realty Trust, Inc., Class A REIT | | | 64 | | | | 4 | | |
Regency Centers Corp. REIT | | | 1,239 | | | | 78 | | |
Simon Property Group, Inc. REIT | | | 2,042 | | | | 304 | | |
SITE Centers Corp. REIT | | | 459 | | | | 7 | | |
SL Green Realty Corp. REIT | | | 4,278 | | | | 393 | | |
Sunstone Hotel Investors, Inc. REIT | | | 5,183 | | | | 72 | | |
Vornado Realty Trust REIT | | | 3,147 | | | | 209 | | |
| | | | 2,301 | | |
Total Common Stocks (Cost $4,767) | | | 4,652 | | |
The accompanying notes are an integral part of the financial statements.
8
Morgan Stanley Institutional Fund, Inc.
Annual Report — December 31, 2019
Portfolio of Investments (cont'd)
Global Concentrated Real Estate Portfolio
| | | Shares | | Value
(000) | |
Short-Term Investment (4.7%) | |
Investment Company (4.7%) | |
Morgan Stanley Institutional Liquidity
Funds — Treasury Portfolio —
Institutional Class (See Note G)
(Cost $231) | | | 231,379 | | | $ | 231 | | |
Total Investments (99.7%) (Cost $4,998) (a)(b) | | | 4,883 | | |
Other Assets in Excess of Liabilities (0.3%) | | | 13 | | |
Net Assets (100.0%) | | $ | 4,896 | | |
Country assignments and aggregations are based generally on third party vendor classifications and information, and may be different from the assignments and aggregations under the policies set forth in the Fund's prospectus and/or statement of additional information relating to geographic classifications.
(a) The approximate fair value and percentage of net assets, $383,000 and 7.8%, respectively, represent the securities that have been fair valued under the fair valuation policy for international investments as described in Note A-1 within the Notes to the Financial Statements.
(b) At December 31, 2019, the aggregate cost for federal income tax purposes is approximately $5,029,000. The aggregate gross unrealized appreciation is approximately $272,000 and the aggregate gross unrealized depreciation is approximately $418,000, resulting in net unrealized depreciation of approximately $146,000.
CVA Certificaten Van Aandelen.
REIT Real Estate Investment Trust.
Portfolio Composition
Classification | | Percentage of
Total Investments | |
Diversified | | | 30.7 | % | |
Office | | | 24.0 | | |
Retail | | | 22.3 | | |
Residential | | | 8.8 | | |
Lodging/Resorts | | | 7.7 | | |
Other* | | | 6.5 | | |
Total Investments | | | 100.0 | % | |
* Industries and/or investment types representing less than 5% of total investments.
The accompanying notes are an integral part of the financial statements.
9
Morgan Stanley Institutional Fund, Inc.
Annual Report — December 31, 2019
Global Concentrated Real Estate Portfolio
Statement of Assets and Liabilities | | December 31, 2019
(000) | |
Assets: | |
Investments in Securities of Unaffiliated Issuers, at Value (Cost $4,767) | | $ | 4,652 | | |
Investment in Security of Affiliated Issuer, at Value (Cost $231) | | | 231 | | |
Total Investments in Securities, at Value (Cost $4,998) | | | 4,883 | | |
Foreign Currency, at Value (Cost $7) | | | 7 | | |
Dividends Receivable | | | 23 | | |
Receivable for Investments Sold | | | 12 | | |
Due from Adviser | | | 8 | | |
Tax Reclaim Receivable | | | 2 | | |
Receivable from Affiliate | | | — | @ | |
Other Assets | | | 23 | | |
Total Assets | | | 4,958 | | |
Liabilities: | |
Payable for Professional Fees | | | 44 | | |
Payable for Custodian Fees | | | 4 | | |
Payable for Transfer Agency Fees — Class I | | | — | @ | |
Payable for Transfer Agency Fees — Class A | | | — | @ | |
Payable for Transfer Agency Fees — Class C | | | — | @ | |
Payable for Transfer Agency Fees — Class IS | | | — | @ | |
Payable for Shareholder Services Fees — Class A | | | — | @ | |
Payable for Distribution and Shareholder Services Fees — Class C | | | — | @ | |
Payable for Investments Purchased | | | — | @ | |
Payable for Administration Fees | | | — | @ | |
Other Liabilities | | | 14 | | |
Total Liabilities | | | 62 | | |
Net Assets | | $ | 4,896 | | |
Net Assets Consist of: | |
Paid-in-Capital | | $ | 5,066 | | |
Total Accumulated Loss | | | (170 | ) | |
Net Assets | | $ | 4,896 | | |
CLASS I: | |
Net Assets | | $ | 4,866 | | |
| Shares Outstanding $0.001 par value shares of beneficial interest (unlimited shares authorized) (not in 000's) | | | 513,587 | | |
Net Asset Value, Offering and Redemption Price Per Share | | $ | 9.48 | | |
CLASS A: | |
Net Assets | | $ | 10 | | |
| Shares Outstanding $0.001 par value shares of beneficial interest (unlimited shares authorized) (not in 000's) | | | 1,030 | | |
Net Asset Value, Redemption Price Per Share | | $ | 9.48 | | |
Maximum Sales Load | | | 5.25 | % | |
Maximum Sales Charge | | $ | 0.53 | | |
Maximum Offering Price Per Share | | $ | 10.01 | | |
CLASS C: | |
Net Assets | | $ | 10 | | |
| Shares Outstanding $0.001 par value shares of beneficial interest (unlimited shares authorized) (not in 000's) | | | 1,022 | | |
Net Asset Value, Offering and Redemption Price Per Share | | $ | 9.48 | | |
CLASS IS: | |
Net Assets | | $ | 10 | | |
| Shares Outstanding $0.001 par value shares of beneficial interest (unlimited shares authorized) (not in 000's) | | | 1,034 | | |
Net Asset Value, Offering and Redemption Price Per Share | | $ | 9.48 | | |
@ Amount is less than $500.
The accompanying notes are an integral part of the financial statements.
10
Morgan Stanley Institutional Fund, Inc.
Annual Report — December 31, 2019
Global Concentrated Real Estate Portfolio
Statement of Operations | | Year Ended
December 31, 2019
(000) | |
Investment Income: | |
Dividends from Securities of Unaffiliated Issuers (Net of $11 of Foreign Taxes Withheld) | | $ | 106 | | |
Non-Cash Dividends from Securities of Unaffiliated Issuers | | | 14 | | |
Dividends from Security of Affiliated Issuer (Note G) | | | 2 | | |
Total Investment Income | | | 122 | | |
Expenses: | |
Professional Fees | | | 103 | | |
Offering Costs | | | 36 | | |
Advisory Fees (Note B) | | | 35 | | |
Registration Fees | | | 34 | | |
Custodian Fees (Note F) | | | 25 | | |
Shareholder Reporting Fees | | | 18 | | |
Transfer Agency Fees — Class I (Note E) | | | 2 | | |
Transfer Agency Fees — Class A (Note E) | | | 2 | | |
Transfer Agency Fees — Class C (Note E) | | | 2 | | |
Transfer Agency Fees — Class IS (Note E) | | | 2 | | |
Pricing Fees | | | 5 | | |
Administration Fees (Note C) | | | 4 | | |
Directors' Fees and Expenses | | | 3 | | |
Shareholder Services Fees — Class A (Note D) | | | — | @ | |
Distribution and Shareholder Services Fees — Class C (Note D) | | | — | @ | |
Other Expenses | | | 25 | | |
Total Expenses | | | 296 | | |
Expenses Reimbursed by Adviser (Note B) | | | (210 | ) | |
Waiver of Advisory Fees (Note B) | | | (35 | ) | |
Reimbursement of Class Specific Expenses — Class A (Note B) | | | (2 | ) | |
Reimbursement of Class Specific Expenses — Class C (Note B) | | | (2 | ) | |
Reimbursement of Class Specific Expenses — Class IS (Note B) | | | (2 | ) | |
Rebate from Morgan Stanley Affiliate (Note G) | | | (— | @) | |
Net Expenses | | | 45 | | |
Net Investment Income | | | 77 | | |
Realized Gain: | |
Investments Sold | | | 53 | | |
Foreign Currency Translation | | | — | @ | |
Net Realized Gain | | | 53 | | |
Change in Unrealized Appreciation (Depreciation): | |
Investments | | | 443 | | |
Foreign Currency Translation | | | — | @ | |
Net Change in Unrealized Appreciation (Depreciation) | | | 443 | | |
Net Realized Loss and Change in Unrealized Appreciation (Depreciation) | | | 496 | | |
Net Increase in Net Assets Resulting from Operations | | $ | 573 | | |
@ Amount is less than $500.
The accompanying notes are an integral part of the financial statements.
11
Morgan Stanley Institutional Fund, Inc.
Annual Report — December 31, 2019
Global Concentrated Real Estate Portfolio
Statements of Changes in Net Assets | | Year Ended
December 31, 2019
(000) | | Period from
June 15, 2018^ to
December 31, 2018
(000) | |
Increase (Decrease) in Net Assets: | |
Operations: | |
Net Investment Income | | $ | 77 | | | $ | 115 | | |
Net Realized Gain (Loss) | | | 53 | | | | (23 | ) | |
Net Change in Unrealized Appreciation (Depreciation) | | | 443 | | | | (558 | ) | |
Net Increase (Decrease) in Net Assets Resulting from Operations | | | 573 | | | | (466 | ) | |
Dividends and Distributions to Shareholders: | |
Class I | | | (154 | ) | | | (141 | ) | |
Class A | | | (— | @) | | | (— | @) | |
Class C | | | (— | @) | | | (— | @) | |
Class IS | | | (— | @) | | | (— | @) | |
Paid-in-Capital: | |
Class I | | | — | | | | (71 | ) | |
Class A | | | — | | | | (— | @) | |
Class C | | | — | | | | (— | @) | |
Class IS | | | — | | | | (— | @) | |
Total Dividends and Distributions to Shareholders | | | (154 | ) | | | (212 | ) | |
Capital Share Transactions:(1) | |
Class I: | |
Subscribed | | | — | | | | 4,970 | | |
Distributions Reinvested | | | 154 | | | | — | | |
Class A: | |
Subscribed | | | 1 | | | | 10 | | |
Distributions Reinvested | | | — | @ | | | — | | |
Redeemed | | | (— | @) | | | — | | |
Class C: | |
Subscribed | | | — | | | | 10 | | |
Distributions Reinvested | | | — | @ | | | — | | |
Class IS: | |
Subscribed | | | — | | | | 10 | | |
Distributions Reinvested | | | — | @ | | | — | | |
Net Increase in Net Assets Resulting from Capital Share Transactions | | | 155 | | | | 5,000 | | |
Total Increase in Net Assets | | | 574 | | | | 4,322 | | |
Net Assets: | |
Beginning of Period | | | 4,322 | | | | — | | |
End of Period | | $ | 4,896 | | | $ | 4,322 | | |
(1) Capital Share Transactions: | |
Class I: | |
Shares Subscribed | | | — | | | | 497 | | |
Shares Issued on Distributions Reinvested | | | 17 | | | | — | | |
Net Increase in Class I Shares Outstanding | | | 17 | | | | 497 | | |
Class A: | |
Shares Subscribed | | | — | @@ | | | 1 | | |
Shares Issued on Distributions Reinvested | | | — | @@ | | | — | | |
Shares Redeemed | | | (— | @@) | | | — | | |
Net Increase in Class A Shares Outstanding | | | — | @@ | | | 1 | | |
Class C: | |
Shares Subscribed | | | — | | | | 1 | | |
Shares Issued on Distributions Reinvested | | | — | @@ | | | — | | |
Net Increase in Class C Shares Outstanding | | | — | @@ | | | 1 | | |
Class IS: | |
Shares Subscribed | | | — | | | | 1 | | |
Shares Issued on Distributions Reinvested | | | — | @@ | | | — | | |
Net Increase in Class IS Shares Outstanding | | | — | @@ | | | 1 | | |
^ Commencement of Operations.
@ Amount is less than $500.
@@ Amount is less than 500 shares.
The accompanying notes are an integral part of the financial statements.
12
Morgan Stanley Institutional Fund, Inc.
Annual Report — December 31, 2019
Financial Highlights
Global Concentrated Real Estate Portfolio
| | | Class I | |
Selected Per Share Data and Ratios | | Year Ended
December 31, 2019 | | Period from
June 18, 2018(1) to
December 31, 2018 | |
Net Asset Value, Beginning of Period | | $ | 8.64 | | | $ | 10.00 | | |
Income (Loss) from Investment Operations: | |
Net Investment Income(2) | | | 0.16 | | | | 0.23 | | |
Net Realized and Unrealized Gain (Loss) | | | 0.99 | | | | (1.16 | ) | |
Total from Investment Operations | | | 1.15 | | | | (0.93 | ) | |
Distributions from and/or in Excess of: | |
Net Investment Income | | | (0.31 | ) | | | (0.29 | ) | |
Paid-in-Capital | | | — | | | | (0.14 | ) | |
Total Distributions | | | (0.31 | ) | | | (0.43 | ) | |
Net Asset Value, End of Period | | $ | 9.48 | | | $ | 8.64 | | |
Total Return(3) | | | 13.38 | % | | | (9.49 | )%(6) | |
Ratios to Average Net Assets and Supplemental Data: | |
Net Assets, End of Period (Thousands) | | $ | 4,866 | | | $ | 4,295 | | |
Ratio of Expenses Before Expense Limitation | | | 6.15 | % | | | 8.58 | %(7) | |
Ratio of Expenses After Expense Limitation | | | 0.94 | %(4) | | | 0.94 | %(4)(7) | |
Ratio of Net Investment Income | | | 1.67 | %(4) | | | 4.42 | %(4)(7) | |
Ratio of Rebate from Morgan Stanley Affiliates | | | 0.00 | %(5) | | | 0.00 | %(5)(7) | |
Portfolio Turnover Rate | | | 21 | % | | | 19 | %(6) | |
(1) Commencement of Operations.
(2) Per share amount is based on average shares outstanding.
(3) Calculated based on the net asset value as of the last business day of the period.
(4) The Ratio of Expenses After Expense Limitation and Ratio of Net Investment Income reflect the rebate of certain Fund expenses in connection with the investments in Morgan Stanley affiliates during the period. The effect of the rebate on the ratios is disclosed in the above table as "Ratio of Rebate from Morgan Stanley Affiliates."
(5) Amount is less than 0.005%.
(6) Not annualized.
(7) Annualized.
The accompanying notes are an integral part of the financial statements.
13
Morgan Stanley Institutional Fund, Inc.
Annual Report — December 31, 2019
Financial Highlights
Global Concentrated Real Estate Portfolio
| | | Class A | |
Selected Per Share Data and Ratios | | Year Ended
December 31, 2019 | | Period from
June 18, 2018(1) to
December 31, 2018 | |
Net Asset Value, Beginning of Period | | $ | 8.65 | | | $ | 10.00 | | |
Income (Loss) from Investment Operations: | |
Net Investment Income(2) | | | 0.12 | | | | 0.21 | | |
Net Realized and Unrealized Gain (Loss) | | | 0.99 | | | | (1.15 | ) | |
Total from Investment Operations | | | 1.11 | | | | (0.94 | ) | |
Distributions from and/or in Excess of: | |
Net Investment Income | | | (0.28 | ) | | | (0.27 | ) | |
Paid-in-Capital | | | — | | | | (0.14 | ) | |
Total Distributions | | | (0.28 | ) | | | (0.41 | ) | |
Net Asset Value, End of Period | | $ | 9.48 | | | $ | 8.65 | | |
Total Return(3) | | | 12.85 | % | | | (9.57 | )%(6) | |
Ratios to Average Net Assets and Supplemental Data: | |
Net Assets, End of Period (Thousands) | | $ | 10 | | | $ | 9 | | |
Ratio of Expenses Before Expense Limitation | | | 26.09 | % | | | 26.73 | %(7) | |
Ratio of Expenses After Expense Limitation | | | 1.30 | %(4) | | | 1.30 | %(4)(7) | |
Ratio of Net Investment Income | | | 1.31 | %(4) | | | 4.06 | %(4)(7) | |
Ratio of Rebate from Morgan Stanley Affiliates | | | 0.00 | %(5) | | | 0.00 | %(5)(7) | |
Portfolio Turnover Rate | | | 21 | % | | | 19 | %(6) | |
(1) Commencement of Operations.
(2) Per share amount is based on average shares outstanding.
(3) Calculated based on the net asset value which does not reflect sales charges, if applicable, as of the last business day of the period.
(4) The Ratio of Expenses After Expense Limitation and Ratio of Net Investment Income reflect the rebate of certain Fund expenses in connection with the investments in Morgan Stanley affiliates during the period. The effect of the rebate on the ratios is disclosed in the above table as "Ratio of Rebate from Morgan Stanley Affiliates."
(5) Amount is less than 0.005%.
(6) Not annualized.
(7) Annualized.
The accompanying notes are an integral part of the financial statements.
14
Morgan Stanley Institutional Fund, Inc.
Annual Report — December 31, 2019
Financial Highlights
Global Concentrated Real Estate Portfolio
| | | Class C | |
Selected Per Share Data and Ratios | | Year Ended
December 31, 2019 | | Period from
June 18, 2018(1) to
December 31, 2018 | |
Net Asset Value, Beginning of Period | | $ | 8.65 | | | $ | 10.00 | | |
Income (Loss) from Investment Operations: | |
Net Investment Income(2) | | | 0.05 | | | | 0.17 | | |
Net Realized and Unrealized Gain (Loss) | | | 0.98 | | | | (1.15 | ) | |
Total from Investment Operations | | | 1.03 | | | | (0.98 | ) | |
Distributions from and/or in Excess of: | |
Net Investment Income | | | (0.20 | ) | | | (0.23 | ) | |
Paid-in-Capital | | | — | | | | (0.14 | ) | |
Total Distributions | | | (0.20 | ) | | | (0.37 | ) | |
Net Asset Value, End of Period | | $ | 9.48 | | | $ | 8.65 | | |
Total Return(3) | | | 12.01 | % | | | (9.94 | )%(6) | |
Ratios to Average Net Assets and Supplemental Data: | |
Net Assets, End of Period (Thousands) | | $ | 10 | | | $ | 9 | | |
Ratio of Expenses Before Expense Limitation | | | 26.91 | % | | | 27.50 | %(7) | |
Ratio of Expenses After Expense Limitation | | | 2.05 | %(4) | | | 2.05 | %(4)(7) | |
Ratio of Net Investment Income | | | 0.55 | %(4) | | | 3.30 | %(4)(7) | |
Ratio of Rebate from Morgan Stanley Affiliates | | | 0.00 | %(5) | | | 0.00 | %(5)(7) | |
Portfolio Turnover Rate | | | 21 | % | | | 19 | %(6) | |
(1) Commencement of Operations.
(2) Per share amount is based on average shares outstanding.
(3) Calculated based on the net asset value which does not reflect sales charges, if applicable, as of the last business day of the period.
(4) The Ratio of Expenses After Expense Limitation and Ratio of Net Investment Income reflect the rebate of certain Fund expenses in connection with the investments in Morgan Stanley affiliates during the period. The effect of the rebate on the ratios is disclosed in the above table as "Ratio of Rebate from Morgan Stanley Affiliates."
(5) Amount is less than 0.005%.
(6) Not annualized.
(7) Annualized.
The accompanying notes are an integral part of the financial statements.
15
Morgan Stanley Institutional Fund, Inc.
Annual Report — December 31, 2019
Financial Highlights
Global Concentrated Real Estate Portfolio
| | | Class IS | |
Selected Per Share Data and Ratios | | Year Ended
December 31, 2019 | | Period from
June 18, 2018(1) to
December 31, 2018 | |
Net Asset Value, Beginning of Period | | $ | 8.64 | | | $ | 10.00 | | |
Income (Loss) from Investment Operations: | |
Net Investment Income(2) | | | 0.16 | | | | 0.23 | | |
Net Realized and Unrealized Gain (Loss) | | | 0.99 | | | | (1.16 | ) | |
Total from Investment Operations | | | 1.15 | | | | (0.93 | ) | |
Distributions from and/or in Excess of: | |
Net Investment Income | | | (0.31 | ) | | | (0.29 | ) | |
Paid-in-Capital | | | — | | | | (0.14 | ) | |
Total Distributions | | | (0.31 | ) | | | (0.43 | ) | |
Net Asset Value, End of Period | | $ | 9.48 | | | $ | 8.64 | | |
Total Return(3) | | | 13.43 | % | | | (9.47 | )%(6) | |
Ratios to Average Net Assets and Supplemental Data: | |
Net Assets, End of Period (Thousands) | | $ | 10 | | | $ | 9 | | |
Ratio of Expenses Before Expense Limitation | | | 25.85 | % | | | 26.46 | %(7) | |
Ratio of Expenses After Expense Limitation | | | 0.90 | %(4) | | | 0.90 | %(4)(7) | |
Ratio of Net Investment Income | | | 1.71 | %(4) | | | 4.45 | %(4)(7) | |
Ratio of Rebate from Morgan Stanley Affiliates | | | 0.00 | %(5) | | | 0.00 | %(5)(7) | |
Portfolio Turnover Rate | | | 21 | % | | | 19 | %(6) | |
(1) Commencement of Operations.
(2) Per share amount is based on average shares outstanding.
(3) Calculated based on the net asset value as of the last business day of the period.
(4) The Ratio of Expenses After Expense Limitation and Ratio of Net Investment Income reflect the rebate of certain Fund expenses in connection with the investments in Morgan Stanley affiliates during the period. The effect of the rebate on the ratios is disclosed in the above table as "Ratio of Rebate from Morgan Stanley Affiliates."
(5) Amount is less than 0.005%.
(6) Not annualized.
(7) Annualized.
The accompanying notes are an integral part of the financial statements.
16
Morgan Stanley Institutional Fund, Inc.
Annual Report — December 31, 2019
Notes to Financial Statements
Morgan Stanley Institutional Fund, Inc. (the "Company") is registered under the Investment Company Act of 1940, as amended (the "Act"), as an open-end management investment company. The Company is comprised of thirty-two separate, active, diversified and non-diversified funds (individually referred to as a "Fund," collectively as the "Funds"). The Company applies investment company accounting and reporting guidance.
The accompanying financial statements relate to the Global Concentrated Real Estate Portfolio. The Fund seeks to provide current income and long-term capital appreciation.
The Fund offers four classes of shares — Class I, Class A, Class C and Class IS.
A. Significant Accounting Policies: The following significant accounting policies are in conformity with U.S. generally accepted accounting principles ("GAAP"). Such policies are consistently followed by the Company in the preparation of its financial statements. GAAP may require management to make estimates and assumptions that affect the reported amounts and disclosures in the financial statements. Actual results may differ from those estimates.
In August 2018, the Financial Accounting Standards Board ("FASB") issued Accounting Standards Update ("ASU") 2018-13, Fair Value Measurement (Topic 820) — Disclosures Framework — Changes to Disclosure Requirements of Fair Value Measurement ("ASU 2018-13") which introduces new fair value disclosure requirements as well as eliminates and modifies certain existing fair value disclosure requirements. ASU 2018-13 would be effective for fiscal years beginning after December 15, 2019 and for interim periods within those fiscal years; however, management has elected to early adopt ASU 2018-13 as permitted by the standard. The impact of the Fund's adoption was limited to changes in the Fund's financial statement disclosures regarding fair value, primarily those disclosures related to transfers between levels of the fair value hierarchy and disclosure of the range and weighted average used to develop significant unobservable inputs for Level 3 fair value measurements, when applicable.
1. Security Valuation: (1) An equity portfolio security listed or traded on an exchange is valued at its latest reported sales price (or at the exchange official closing price if such exchange reports an official closing price), and if there were no sales on a given day and if there is no official exchange closing price for that day, the security is valued at the mean between the last reported bid and asked prices
if such bid and asked prices are available on the relevant exchanges. If only bid prices are available then the latest bid price may be used. Listed equity securities not traded on the valuation date with no reported bid and asked prices available on the exchange are valued at the mean between the current bid and asked prices obtained from one or more reputable brokers or dealers. In cases where a security is traded on more than one exchange, the security is valued on the exchange designated as the primary market; (2) all other equity portfolio securities for which over-the-counter ("OTC") market quotations are readily available are valued at the latest reported sales price (or at the market official closing price if such market reports an official closing price), and if there was no trading in the security on a given day and if there is no official closing price from relevant markets for that day, the security is valued at the mean between the last reported bid and asked prices if such bid and asked prices are available on the relevant markets. An unlisted equity security that does not trade on the valuation date and for which bid and asked prices from the relevant markets are unavailable is valued at the mean between the current bid and asked prices obtained from one or more reputable brokers or dealers; (3) certain portfolio securities may be valued by an outside pricing service/vendor approved by the Company's Board of Directors (the "Directors"). The pricing service/vendor may employ a pricing model that takes into account, among other things, bids, yield spreads and/or other market data and specific security characteristics. Alternatively, if a valuation is not available from an outside pricing service/vendor, and the security trades on an exchange, the security may be valued at its latest reported sale price (or at the exchange official closing price if such exchange reports an official closing price), prior to the time when assets are valued. If there are no sales on a given day and if there is no official exchange closing price for that day, the security is valued at the mean between the last reported bid and asked prices if such bid and asked prices are available in the relevant exchanges. If Morgan Stanley Investment Management Inc. (the "Adviser") or Morgan Stanley Investment Management Limited ("MSIM Limited") and Morgan Stanley Investment Management Company ("MSIM Company") (together, the "Sub-Advisers"), (effective April 30, 2019, MSIM Company and MSIM Limited are no longer Sub-Advisers to the Fund), each a wholly-owned subsidiary of Morgan Stanley, determines
17
Morgan Stanley Institutional Fund, Inc.
Annual Report — December 31, 2019
Notes to Financial Statements (cont'd)
that the price provided by the outside pricing service/vendor or exchange does not reflect the security's fair value or is unable to provide a price, prices from brokers or dealers may also be utilized. In these circumstances, the value of the security will be the mean of bid and asked prices obtained from brokers or dealers; (4) when market quotations are not readily available, including circumstances under which the Adviser or Sub-Advisers determine that the closing price, last sale price or the mean between the last reported bid and asked prices are not reflective of a security's market value, portfolio securities are valued at their fair value as determined in good faith under procedures established by and under the general supervision of the Directors. Occasionally, developments affecting the closing prices of securities and other assets may occur between the times at which valuations of such securities are determined (that is, close of the foreign market on which the securities trade) and the close of business of the New York Stock Exchange ("NYSE"). If developments occur during such periods that are expected to materially affect the value of such securities, such valuations may be adjusted to reflect the estimated fair value of such securities as of the close of the NYSE, as determined in good faith by the Directors or by the Adviser using a pricing service and/or procedures approved by the Directors; (5) quotations of foreign portfolio securities, other assets and liabilities and forward contracts stated in foreign currency are translated into U.S. dollar equivalents at the prevailing market rates prior to the close of the NYSE; and (6) investments in mutual funds, including the Morgan Stanley Institutional Liquidity Funds, are valued at the net asset value ("NAV") as of the close of each business day.
The Directors have responsibility for determining in good faith the fair value of the investments, and the Directors may appoint others, such as the Company's Adviser or a valuation committee, to assist the Directors in determining fair value and to make the actual calculations pursuant to the fair valuation methodologies previously approved by the Directors. Under procedures approved by the Directors, the Company's Adviser has formed a Valuation Committee whose members are approved by the Directors. The Valuation Committee provides administration and oversight of the Company's valuation policies and procedures, which are reviewed at least annually by the Directors. These procedures allow the Company to utilize independent pricing services,
quotations from securities and financial instrument dealers and other market sources to determine fair value.
The Fund invests a significant portion of its assets in securities of real estate investment trusts ("REITs"). The market's perception of prospective declines in private real estate values and other financial assets may result in increased volatility of market prices that can negatively impact the valuation of certain issuers held by the Fund.
2. Fair Value Measurement: FASB Accounting Standards CodificationTM ("ASC") 820, "Fair Value Measurement" ("ASC 820"), defines fair value as the value that the Fund would receive to sell an investment or pay to transfer a liability in a timely transaction with an independent buyer in the principal market, or in the absence of a principal market, the most advantageous market for the investment or liability. ASC 820 establishes a three-tier hierarchy to distinguish between (1) inputs that reflect the assumptions market participants would use in valuing an asset or liability developed based on market data obtained from sources independent of the reporting entity (observable inputs) and (2) inputs that reflect the reporting entity's own assumptions about the assumptions market participants would use in valuing an asset or liability developed based on the best information available in the circumstances (unobservable inputs) and to establish classification of fair value measurements for disclosure purposes. Various inputs are used in determining the value of the Fund's investments. The inputs are summarized in the three broad levels listed below:
• Level 1 – unadjusted quoted prices in active markets for identical investments
• Level 2 – other significant observable inputs (including quoted prices for similar investments, interest rates, prepayment speeds, credit risk, etc.)
• Level 3 – significant unobservable inputs including the Fund's own assumptions in determining the fair value of investments. Factors considered in making this determination may include, but are not limited to, information obtained by contacting the issuer, analysts, or the appropriate stock exchange (for exchange-traded securities), analysis of the issuer's financial statements or other available documents and, if necessary, available information concerning other securities in similar circumstances.
18
Morgan Stanley Institutional Fund, Inc.
Annual Report — December 31, 2019
Notes to Financial Statements (cont'd)
The inputs or methodology used for valuing securities are not necessarily an indication of the risk associated with investing in those securities and the determination of the significance of a particular input to the fair value measurement in its entirety requires judgment and considers factors specific to each security.
The following is a summary of the inputs used to value the Fund's investments as of December 31, 2019:
Investment Type | | Level 1
Unadjusted
quoted
prices
(000) | | Level 2
Other
significant
observable
inputs
(000) | | Level 3
Significant
unobservable
inputs
(000) | | Total
(000) | |
Assets: | |
Common Stocks | |
Diversified | | $ | 1,255 | | | $ | 243 | | | $ | — | | | $ | 1,498 | | |
Health Care | | | 18 | | | | — | | | | — | | | | 18 | | |
Industrial | | | 31 | | | | 1 | | | | — | | | | 32 | | |
Lodging/Resorts | | | 375 | | | | — | | | | — | | | | 375 | | |
Office | | | 1,131 | | | | 41 | | | | — | | | | 1,172 | | |
Residential | | | 346 | | | | 84 | | | | — | | | | 430 | | |
Retail | | | 1,074 | | | | 14 | | | | — | | | | 1,088 | | |
Self Storage | | | 39 | | | | — | | | | — | | | | 39 | | |
Total Common Stocks | | | 4,269 | | | | 383 | | | | — | | | | 4,652 | | |
Short-Term Investment | |
Investment Company | | | 231 | | | | — | | | | — | | | | 231 | | |
Total Assets | | $ | 4,500 | | | $ | 383 | | | $ | — | | | $ | 4,883 | | |
Transfers between investment levels may occur as the markets fluctuate and/or the availability of data used in an investment's valuation changes.
3. Foreign Currency Translation and Foreign Investments: The books and records of the Fund are maintained in U.S. dollars. Foreign currency amounts are translated into U.S. dollars as follows:
– investments, other assets and liabilities at the prevailing rate of exchange on the valuation date;
– investment transactions and investment income at the prevailing rates of exchange on the dates of such transactions.
Although the net assets of the Fund are presented at the foreign exchange rates and market values at the close of the period, the Fund does not isolate that portion of the results of operations arising as a result of changes in the foreign exchange rates from the fluctuations arising from changes in the market prices of securities held at period end. Similarly, the Fund does not isolate the effect of changes in foreign exchange rates from the fluctuations arising from changes in the market prices of
securities sold during the period. Accordingly, realized and unrealized foreign currency gains (losses) on investments in securities are included in the reported net realized and unrealized gains (losses) on investment transactions and balances. However, pursuant to U.S. federal income tax regulations, gains and losses from certain foreign currency transactions and the foreign currency portion of gains and losses realized on sales and maturities of foreign denominated debt securities are treated as ordinary income for U.S. federal income tax purposes.
Net realized gains (losses) on foreign currency transactions represent net foreign exchange gains (losses) from foreign currency forward exchange contracts, disposition of foreign currencies, currency gains (losses) realized between the trade and settlement dates on securities transactions, and the difference between the amount of investment income and foreign withholding taxes recorded on the Fund's books and the U.S. dollar equivalent amounts actually received or paid. The change in unrealized currency gains (losses) on foreign currency transactions for the period is reflected in the Statement of Operations.
Foreign security and currency transactions may involve certain considerations and risks not typically associated with those of U.S. dollar denominated transactions as a result of, among other factors, fluctuations of exchange rates in relation to the U.S. dollar, the possibility of lower levels of governmental supervision and regulation of foreign securities markets and the possibility of political or economic instability.
Governmental approval for foreign investments may be required in advance of making an investment under certain circumstances in some countries, and the extent of foreign investments in domestic companies may be subject to limitation in other countries. Foreign ownership limitations also may be imposed by the charters of individual companies to prevent, among other concerns, violations of foreign investment limitations. As a result, an additional class of shares (identified as "Foreign" in the Portfolio of Investments) may be created and offered for investment. The "local" and "foreign shares" market values may differ. In the absence of trading of the foreign shares in such markets, the Fund values the foreign shares at the closing exchange price of the local shares.
19
Morgan Stanley Institutional Fund, Inc.
Annual Report — December 31, 2019
Notes to Financial Statements (cont'd)
4. Indemnifications: The Company enters into contracts that contain a variety of indemnifications. The Company's maximum exposure under these arrangements is unknown. However, the Company has not had prior claims or losses pursuant to these contracts and expects the risk of loss to be remote.
5. Dividends and Distributions to Shareholders: Dividends and distributions to shareholders are recorded on the ex-dividend date. Dividends from net investment income, if any, are declared and paid annually. Net realized capital gains, if any, are distributed at least annually.
6. Security Transactions, Income and Expenses: Security transactions are accounted for on the trade date (date the order to buy or sell is executed). Realized gains and losses on the sale of investment securities are determined on the specific identified cost method. Dividend income and other distributions are recorded on the ex-dividend date (except for certain foreign dividends which may be recorded as soon as the Fund is informed of such dividends) net of applicable withholding taxes. Non-cash dividends received in the form of stock, if any, are recognized on the ex-dividend date and recorded as non-cash dividend income at fair value. Interest income is recognized on the accrual basis except where collection is in doubt. Discounts are accreted and premiums are amortized over the life of the respective securities. Most expenses of the Company can be directly attributed to a particular Fund. Expenses which cannot be directly attributed are apportioned among the Funds based upon relative net assets or other appropriate methods. Income, expenses (other than class specific expenses — distribution and shareholder services, transfer agency and sub transfer agency fees) and realized and unrealized gains or losses are allocated to each class of shares based upon their relative net assets.
The Fund owns shares of REITs which report information on the source of their distributions annually in the following calendar year. A portion of distributions received from REITs during the year is estimated to be a return of capital and is recorded as a reduction of their cost.
B. Advisory/Sub-Advisory Fees: The Adviser, a wholly-owned subsidiary of Morgan Stanley, provides the Fund with advisory services under the terms of an Investment Advisory
Agreement, paid quarterly, at the annual rate based on the daily net assets as follows:
First $2
billion | | Over $2
billion | |
| | 0.75 | % | | | 0.70 | % | |
For the year ended December 31, 2019, the advisory fee rate (net of waiver/rebate) was equivalent to an annual effective rate of 0.00% of the Fund's average daily net assets.
The Adviser has agreed to reduce its advisory fee and/or reimburse the Fund so that total annual Fund operating expenses, excluding certain investment related expenses, taxes, interest and other extraordinary expenses (including litigation), will not exceed 0.95% for Class I shares, 1.30% for Class A shares, 2.05% for Class C shares and 0.90% for Class IS shares. The fee waivers and/or expense reimbursements will continue for at least one year from the date of the Fund's prospectus or until such time that the Directors act to discontinue all or a portion of such waivers or reimbursements when they deem such action is appropriate. For the year ended December 31, 2019, approximately $35,000 of advisory fees were waived and approximately $216,000 of other expenses were reimbursed by the Adviser pursuant to this arrangement.
The Adviser has entered into Sub-Advisory Agreements with the Sub-Advisers, each a wholly-owned subsidiary of Morgan Stanley. The Sub-Advisers provide the Fund with advisory services subject to the overall supervision of the Adviser and the Company's Officers and Directors. The Adviser pays the Sub-Advisers on a monthly basis a portion of the net advisory fees the Adviser receives from the Fund.
Effective April 30, 2019, MSIM Company and MSIM Limited are no longer Sub-Advisers to the Fund.
C. Administration Fees: The Adviser also serves as Administrator to the Company and provides administrative services pursuant to an Administration Agreement for an annual fee, accrued daily and paid monthly, of 0.08% of the Fund's average daily net assets.
Under a Sub-Administration Agreement between the Administrator and State Street Bank and Trust Company ("State Street"), State Street provides certain administrative services to the Company. For such services, the Administrator pays State Street a portion of the fee the Administrator receives from the Fund.
D. Distribution and Shareholder Services Fees: Morgan Stanley Distribution, Inc. ("MSDI" or the "Distributor"), a wholly-owned subsidiary of the Adviser and an indirect
20
Morgan Stanley Institutional Fund, Inc.
Annual Report — December 31, 2019
Notes to Financial Statements (cont'd)
subsidiary of Morgan Stanley, serves as the Company's Distributor of Fund shares pursuant to a Distribution Agreement. The Company has adopted a Shareholder Services Plan with respect to Class A shares pursuant to Rule 12b-1 under the Act. Under the Shareholder Services Plan, the Fund pays the Distributor a shareholder services fee, accrued daily and paid monthly, at an annual rate of 0.25% of the Fund's average daily net assets attributable to Class A shares.
The Company has adopted a Distribution and Shareholder Services Plan with respect to Class C shares pursuant to Rule 12b-1 under the Act. Under the Distribution and Shareholder Services Plan, the Fund pays the Distributor a distribution fee, accrued daily and paid monthly, at an annual rate of 0.75% and a shareholder services fee, accrued daily and paid monthly, at an annual rate of 0.25% of the Fund's average daily net assets attributable to Class C shares.
The distribution and shareholder services fees are used to support the expenses associated with servicing and maintaining accounts. The Distributor may compensate other parties for providing shareholder support services to investors who purchase Class A and Class C shares.
E. Dividend Disbursing and Transfer Agent: The Company's dividend disbursing and transfer agent is DST Asset Manager Solutions, Inc. ("DST"). Pursuant to a Transfer Agency Agreement, the Company pays DST a fee based on the number of classes, accounts and transactions relating to the Funds of the Company.
F. Custodian Fees: State Street (the "Custodian") also serves as Custodian for the Company in accordance with a Custodian Agreement. The Custodian holds cash, securities and other assets of the Company as required by the Act. Custody fees are payable monthly based on assets held in custody, investment purchases and sales activity and account maintenance fees, plus reimbursement for certain out-of-pocket expenses.
G. Security Transactions and Transactions with Affiliates: For the year ended December 31, 2019, purchases and sales of investment securities for the Fund, other than long-term U.S. Government securities and short-term investments were approximately $939,000 and $1,018,000, respectively. There were no purchases and sales of long-term U.S. Government securities for the year ended December 31, 2019.
The Fund invests in the Institutional Class of the Morgan Stanley Institutional Liquidity Funds — Treasury Portfolio
(the "Liquidity Funds"), an open-end management investment company managed by the Adviser. Advisory fees paid by the Fund are reduced by an amount equal to its pro-rata share of the advisory and administration fees paid by the Fund due to its investment in the Liquidity Funds. For the year ended December 31, 2019, advisory fees paid were reduced by less than $500 relating to the Fund's investment in the Liquidity Funds.
A summary of the Fund's transactions in shares of affiliated investments during the year ended December 31, 2019 is as follows:
Affiliated
Investment
Company | | Value
December 31,
2018
(000) | | Purchases
at Cost
(000) | | Proceeds
from Sales
(000) | | Dividend
Income
(000) | |
Liquidity Funds | | $ | 10 | | | $ | 857 | | | $ | 636 | | | $ | 2 | | |
Affiliated
Investment
Company (cont'd) | | Realized
Gain
(Loss)
(000) | | Change in
Unrealized
Appreciation
(Depreciation)
(000) | | Value
December 31,
2019
(000) | |
Liquidity Funds | | $ | — | | | $ | — | | | $ | 231 | | |
The Fund is permitted to purchase and sell securities ("cross-trade") from and to other Morgan Stanley funds as well as other funds and client accounts for which the Adviser or an affiliate of the Adviser serves as investment adviser, pursuant to procedures approved by the Directors in compliance with Rule 17a-7 under the Act (the "Rule"). Each cross-trade is executed at the current market price in compliance with provisions of the Rule. For the year ended December 31, 2019, the Fund did not engage in any cross-trade transactions.
The Fund has an unfunded Deferred Compensation Plan (the "Compensation Plan"), which allows each independent Director to defer payment of all, or a portion, of the fees he or she receives for serving on the Board of Directors. Each eligible Director generally may elect to have the deferred amounts credited with a return equal to the total return on one or more of the Morgan Stanley funds that are offered as investment options under the Compensation Plan. Appreciation/depreciation and distributions received from these investments are recorded with an offsetting increase/decrease in the deferred compensation obligation and do not affect the NAV of the Fund.
H. Federal Income Taxes: It is the Fund's intention to continue to qualify as a regulated investment company and distribute all of its taxable and tax-exempt income. Accordingly, no provision for federal income taxes is required in the financial statements.
The Fund may be subject to taxes imposed by countries in which it invests. Such taxes are generally based on income
21
Morgan Stanley Institutional Fund, Inc.
Annual Report — December 31, 2019
Notes to Financial Statements (cont'd)
and/or capital gains earned or repatriated. Taxes are accrued based on net investment income, net realized gains and net unrealized appreciation as such income and/or gains are earned. Taxes may also be based on transactions in foreign currency and are accrued based on the value of investments denominated in such currency.
FASB ASC 740-10, "Income Taxes — Overall", sets forth a minimum threshold for financial statement recognition of the benefit of a tax position taken or expected to be taken in a tax return. Management has concluded there are no significant uncertain tax positions that would require recognition in the financial statements. If applicable, the Fund recognizes interest accrued related to unrecognized tax benefits in "Interest Expense" and penalties in "Other Expenses" in the Statement of Operations. The Fund files tax returns with the U.S. Internal Revenue Service, New York and various states. Each of the tax years in the two-year period ended December 31, 2019 remains subject to examination by taxing authorities.
The tax character of distributions paid may differ from the character of distributions shown for GAAP purposes due to short-term capital gains being treated as ordinary income for tax purposes. The tax character of distributions paid during fiscal years 2019 and 2018 was as follows:
2019
Distributions
Paid From: | | 2018
Distributions
Paid From: | |
Ordinary
Income
(000) | | Long-Term
Capital Gain
(000) | | Ordinary
Income
(000) | | Paid-in-
Capital
(000) | |
| $ | 149 | | | $ | 5 | | | $ | 141 | | | $ | 71 | | |
The amount and character of income and gains to be distributed are determined in accordance with income tax regulations which may differ from GAAP. These book/tax differences are either considered temporary or permanent in nature.
Temporary differences are attributable to differing book and tax treatments for the timing of the recognition of gains (losses) on certain investment transactions and the timing of the deductibility of certain expenses.
Permanent differences, primarily due to an adjustment to prior period distributions, resulted in the following reclassifications among the components of net assets at December 31, 2019:
Total
Accumulated
Loss
(000) | | Paid-in
Capital
(000) | |
| $ | 18 | | | $ | (18 | ) | |
At December 31, 2019, the components of distributable earnings for the Fund on a tax basis were as follows:
Undistributed
Ordinary
Income
(000) | | Undistributed
Long-Term
Capital Gain
(000) | |
| $ | — | | | $ | 4 | | |
Qualified late year losses are capital losses and specified ordinary losses, including currency losses, incurred after October 31 but within the taxable year that, if elected, are deemed to arise on the first day of the Fund's next taxable year. For the year ended December 31, 2019, the Fund intends to defer to January 1, 2020 for U.S. federal income tax purposes the following losses:
Qualified
Late Year
Ordinary
Losses
(000) | | Post-October
Capital
Losses
(000) | |
| $ | 7 | | | $ | — | | |
I. Credit Facility: The Company and other Morgan Stanley funds participated in a $150,000,000 committed, unsecured revolving line of credit facility (the "Facility") with State Street. Effective April 22, 2019, the committed line amount increased to $300,000,000. This Facility is to be used for temporary emergency purposes or funding of shareholder redemption requests. The interest rate on borrowings is based on the federal funds rate or 1 month LIBOR rate plus a spread. The Facility also has a commitment fee of 0.25% per annum based on the unused portion of the Facility. During the year ended December 31, 2019, the Fund did not have any borrowings under the Facility.
J. Other: At December 31, 2019, the Fund did not have record owners of 10% or greater.
22
Morgan Stanley Institutional Fund, Inc.
Annual Report — December 31, 2019
Report of Independent Registered Public Accounting Firm
To the Shareholders and Board of Directors of
Morgan Stanley Institutional Fund, Inc. —
Global Concentrated Real Estate Portfolio
Opinion on the Financial Statements
We have audited the accompanying statement of assets and liabilities of Global Concentrated Real Estate Portfolio (the "Fund") (one of the funds constituting Morgan Stanley Institutional Fund, Inc. (the "Company")), including the portfolio of investments, as of December 31, 2019, and the related statement of operations for the year then ended, the statements of changes in net assets and the financial highlights for the year then ended and the period from June 18, 2018 (commencement of operations) through December 31, 2018 and the related notes (collectively referred to as the "financial statements"). In our opinion, the financial statements present fairly, in all material respects, the financial position of Global Concentrated Real Estate Portfolio (one of the funds constituting Morgan Stanley Institutional Fund, Inc.) at December 31, 2019, the results of its operations for the year then ended, the changes in its net assets and its financial highlights for the year the ended and the period from June 18, 2018 (commencement of operations) through December 31, 2018, in conformity with U.S. generally accepted accounting principles.
Basis for Opinion
These financial statements are the responsibility of the Company's management. Our responsibility is to express an opinion on the Fund's financial statements based on our audit. We are a public accounting firm registered with the Public Company Accounting Oversight Board (United States) ("PCAOB") and are required to be independent with respect to the Company in accordance with the U.S. federal securities law and the applicable rules and regulations of the Securities and Exchange Commission and the PCAOB.
We conducted our audit in accordance with the standards of the PCAOB. Those standards require that we plan and perform the audit to obtain reasonable assurance about whether the financial statements are free of material misstatement, whether due to error or fraud. The Company is not required to have, nor were we engaged to perform, an audit of the Company's internal control over financial reporting. As part of our audit, we are required to obtain an understanding of internal control over financial reporting, but not for the purpose of expressing an opinion on the effectiveness of the Company's internal control over financial reporting. Accordingly, we express no such opinion.
Our audit included performing procedures to assess the risks of material misstatement of the financial statements, whether due to error or fraud, and performing procedures that respond to those risks. Such procedures included examining, on a test basis, evidence regarding the amounts and disclosures in the financial statements. Our procedures included confirmation of securities owned as of December 31, 2019 by correspondence with the custodian. Our audit also included evaluating the accounting principles used and significant estimates made by management, as well as evaluating the overall presentation of the financial statements. We believe that our audit provides a reasonable basis for our opinion.

We have served as the auditor of one or more Morgan Stanley investment companies since 2000.
Boston, Massachusetts
February 27, 2020
23
Morgan Stanley Institutional Fund, Inc.
Annual Report — December 31, 2019
Federal Tax Notice (unaudited)
For federal income tax purposes, the following information is furnished with respect to the distributions paid by the Fund during its taxable year ended December 31, 2019.
The Fund designated and paid approximately $5,000 as a long-term capital gain distribution.
For federal income tax purposes, the following information is furnished with respect to the Fund's earnings for its taxable year ended December 31, 2019. When distributed, certain earnings may be subject to a maximum tax rate of 15% as provided for by the Jobs and Growth Tax Relief Reconciliation Act of 2003. The Fund designated up to a maximum of approximately $49,000 as taxable at this lower rate.
In January, the Fund provides tax information to shareholders for the preceding calendar year.
24
Privacy Notice (unaudited) April 2019
FACTS | | WHAT DOES MSIM DO WITH YOUR PERSONAL INFORMATION? | |
Why? | | Financial companies choose how they share your personal information. Federal law gives consumers the right to limit some but not all sharing. Federal law also requires us to tell you how we collect, share, and protect your personal information. Please read this notice carefully to understand what we do. | |
What? | | The types of personal information we collect and share depend on the product or service you have with us. This information can include:
n Social Security number and income
n investment experience and risk tolerance
n checking account number and wire transfer instructions | |
How? | | All financial companies need to share customers' personal information to run their everyday business. In the section below, we list the reasons financial companies can share their customers' personal information; the reasons MSIM chooses to share; and whether you can limit this sharing. | |
Reasons we can share your personal information | | Does MSIM share? | | Can you limit this sharing? | |
For our everyday business purposes —
such as to process your transactions, maintain your account(s), respond to court orders and legal investigations, or report to credit bureaus | | Yes | | No | |
For our marketing purposes —
to offer our products and services to you | | Yes | | No | |
For joint marketing with other financial companies | | No | | We don't share | |
For our affiliates' everyday business purposes —
information about your transactions and experiences | | Yes | | No | |
For our affiliates' everyday business purposes —
information about your creditworthiness | | No | | We don't share | |
For our affiliates to market to you | | No | | We don't share | |
For non-affiliates to market to you | | No | | We don't share | |
Questions? Call toll-free (844) 312-6327 or email: imprivacyinquiries@morganstanley.com
25
Privacy Notice (unaudited) (cont'd) April 2019
Who we are
Who is providing this notice? | | Morgan Stanley Investment Management, Inc. and its affiliated registered investment advisers, registered broker-dealers, and registered and unregistered funds ("MSIM") | |
What we do
How does MSIM protect my personal information? | | To protect your personal information from unauthorized access and use, we use security measures that comply with federal law. These measures include computer safeguards and secured files and buildings. We have policies governing the proper handling of customer information by personnel and requiring third parties that provide support to adhere to appropriate security standards with respect to such information. | |
How does MSIM collect my personal information? | | We collect your personal information, for example, when you
n open an account or make deposits or withdrawals from your account
n buy securities from us or make a wire transfer
n give us your contact information
We also collect your personal information from others, such as credit bureaus, affiliates, or other companies. | |
Why can't I limit all sharing? | | Federal law gives you the right to limit only
n sharing for affiliates' everyday business purposes — information about your creditworthiness
n affiliates from using your information to market to you
n sharing for non-affiliates to market to you
State laws and individual companies may give you additional rights to limit sharing. See below for more on your rights under state law. | |
Definitions
Affiliates | | Companies related by common ownership or control. They can be financial and non-financial companies.
n Our affiliates include companies with a Morgan Stanley name and financial companies such as Morgan Stanley Smith Barney LLC and Morgan Stanley & Co. | |
Non-affiliates | | Companies not related by common ownership or control. They can be financial and non-financial companies.
n MSIM does not share with non-affiliates so they can market to you. | |
Joint marketing | | A formal agreement between non-affiliated financial companies that together market financial products or services to you.
n MSIM doesn't jointly market | |
Other important information
Vermont: Except as permitted by law, we will not share personal information we collect about Vermont residents with Non-affiliates unless you provide us with your written consent to share such information.
California: Except as permitted by law, we will not share personal information we collect about California residents with Non-affiliates and we will limit sharing such personal information with our Affiliates to comply with California privacy laws that apply to us.
26
Morgan Stanley Institutional Fund, Inc.
Annual Report — December 31, 2019
Director and Officer Information (unaudited)
Independent Directors:
Name, Birth Year
and Address of
Independent Director | | Position(s)
Held with
Registrant | | Length of Time
Served* | | Principal Occupation(s) During Past 5 Years
and Other Relevant Professional Experience | | Number of
Funds in Fund
Complex
Overseen by
Independent
Director** | | Other Directorships
Held by Independent
Director*** | |
Frank L. Bowman
c/o Perkins Coie LLP
Counsel to the Independent Directors
1155 Avenue of the Americas
New York, NY 10036
Birth Year 1944 | | Director | | Since August 2006 | | President, Strategic Decisions, LLC (consulting) (since February 2009); Director or Trustee of various Morgan Stanley Funds (since August 2006); Chairperson of the Compliance and Insurance Committee (since October 2015); formerly, Chairperson of the Insurance Sub-Committee of the Compliance and Insurance Committee (2007-2015); served as President and Chief Executive Officer of the Nuclear Energy Institute (policy organization) (February 2005-November 2008); retired as Admiral, U.S. Navy after serving over 38 years on active duty including 8 years as Director of the Naval Nuclear Propulsion Program in the Department of the Navy and the U.S. Department of Energy (1996-2004); served as Chief of Naval Personnel (July 1994-September 1996) and on the Joint Staff as Director of Political Military Affairs (June 1992-July 1994); knighted as Honorary Knight Commander of the Most Excellent Order of the British Empire; awarded the Officier de l'Orde National du Mérite by the French Government; elected to the National Academy of Engineering (2009). | | | 86 | | | Director of Naval and Nuclear Technologies LLP; Director Emeritus of the Armed Services YMCA; Member of the National Security Advisory Council of the Center for U.S. Global Engagement and a member of the CNA Military Advisory Board; Trustee of Fairhaven United Methodist Church; Member of the Board of Advisors of the Dolphin Scholarship Foundation; Director of other various non-profit organizations; formerly, Director of BP p.l.c. (November 2010-May 2019). | |
Kathleen A. Dennis
c/o Perkins Coie LLP
Counsel to the Independent Directors
1155 Avenue of the Americas
New York, NY 10036
Birth Year 1953 | | Director | | Since August 2006 | | President, Cedarwood Associates (mutual fund and investment management consulting) (since July 2006); Chairperson of the Liquidity and Alternatives Sub-Committee of the Investment Committee (since October 2006) and Director or Trustee of various Morgan Stanley Funds (since August 2006); formerly, Senior Managing Director of Victory Capital Management (1993-2006). | | | 86 | | | Director of various non-profit organizations. | |
Nancy C. Everett
c/o Perkins Coie LLP
Counsel to the Independent Directors
1155 Avenue of the Americas
New York, NY 10036
Birth Year 1955 | | Director | | Since January 2015 | | Chief Executive Officer, Virginia Commonwealth University Investment Company (since November 2015); Owner, OBIR, LLC (institutional investment management consulting) (since June 2014); formerly, Managing Director, BlackRock, Inc. (February 2011-December 2013); and Chief Executive Officer, General Motors Asset Management (a/k/a Promark Global Advisors, Inc.) (June 2005-May 2010). | | | 87 | | | Formerly, Member of Virginia Commonwealth University School of Business Foundation (2005-2016); Member of Virginia Commonwealth University Board of Visitors (2013-2015); Member of Committee on Directors for Emerging Markets Growth Fund, Inc. (2007-2010); Chairperson of Performance Equity Management, LLC (2006-2010); and Chairperson, GMAM Absolute Return Strategies Fund, LLC (2006-2010). | |
27
Morgan Stanley Institutional Fund, Inc.
Annual Report — December 31, 2019
Director and Officer Information (unaudited) (cont'd)
Independent Directors: (cont'd)
Name, Birth Year
and Address of
Independent Director | | Position(s)
Held with
Registrant | | Length of Time
Served* | | Principal Occupation(s) During Past 5 Years
and Other Relevant Professional Experience | | Number of
Funds in Fund
Complex
Overseen by
Independent
Director** | | Other Directorships
Held by Independent
Director*** | |
Jakki L. Haussler
c/o Perkins Coie LLP
Counsel to the Independent Directors
1155 Avenue of the Americas
New York, NY 10036
Birth Year 1957 | | Director | | Since January 2015 | | Chairman, Opus Capital Group (since 1996); formerly, Chief Executive Officer, Opus Capital Group (1996-2019); Director, Capvest Venture Fund, LP (May 2000-December 2011); Partner, Adena Ventures, LP (July 1999-December 2010); Director, The Victory Funds (February 2005-July 2008). | | | 87 | | | Director of Service Corporation International and Member, Audit Committee and Investment Committee; Director of Cincinnati Bell Inc. and Member, Audit Committee and Governance and Nominating Committee; Chairman of Northern Kentucky University Member Investment Committee; Member of Chase College of Law Transactional Law Practice Center Board of Advisors; Director of Best Transport; Director of Chase College of Law Board of Visitors; formerly, Member, University of Cincinnati Foundation Investment Committee; Member, Miami University Board of Visitors (2008-2011); Trustee of Victory Funds (2005-2008) and Chairman, Investment Committee (2007-2008) and Member, Service Provider Committee (2005-2008). | |
Dr. Manuel H. Johnson
c/o Johnson Smick International, Inc.
220 I Street, NE — Suite 200
Washington, D.C. 20002
Birth Year 1949 | | Director | | Since July 1991 | | Senior Partner, Johnson Smick International, Inc. (consulting firm); Chairperson of the Investment Committee (since October 2006) and Director or Trustee of various Morgan Stanley Funds (since July 1991); Co-Chairman and a founder of the Group of Seven Council (G7C) (international economic commission); formerly, Chairperson of the Audit Committee (July 1991-September 2006), Vice Chairman of the Board of Governors of the Federal Reserve System and Assistant Secretary of the U.S. Treasury. | | | 86 | | | Director of NVR, Inc. (home construction). | |
Joseph J. Kearns
c/o Perkins Coie LLP
Counsel to the Independent Directors
1155 Avenue of the Americas
New York, NY 10036
Birth Year 1942 | | Director | | Since August 1994 | | Senior Adviser, Kearns & Associates LLC (investment consulting); Chairperson of the Audit Committee (since October 2006) and Director or Trustee of various Morgan Stanley Funds (since August 1994); formerly, Deputy Chairperson of the Audit Committee (July 2003-September 2006) and Chairperson of the Audit Committee of various Morgan Stanley Funds (since August 1994); CFO of the J. Paul Getty Trust. | | | 87 | | | Prior to August 10, 2016, Director of Electro Rent Corporation (equipment leasing); Prior to December 31, 2013, Director of The Ford Family Foundation. | |
28
Morgan Stanley Institutional Fund, Inc.
Annual Report — December 31, 2019
Director and Officer Information (unaudited) (cont'd)
Independent Directors: (cont'd)
Name, Birth Year
and Address of
Independent Director | | Position(s)
Held with
Registrant | | Length of Time
Served* | | Principal Occupation(s) During Past 5 Years
and Other Relevant Professional Experience | | Number of
Funds in Fund
Complex
Overseen by
Independent
Director** | | Other Directorships
Held by Independent
Director*** | |
Michael F. Klein
c/o Perkins Coie LLP
Counsel to the Independent Directors
1155 Avenue of the Americas
New York, NY 10036
Birth Year 1958 | | Director | | Since August 2006 | | Managing Director, Aetos Alternatives Management, LP (since March 2000); Co-President, Aetos Alternatives Management, LP (since January 2004) and Co-Chief Executive Officer of Aetos Alternatives Management, LP (since August 2013); Chairperson of the Fixed Income Sub-Committee of the Investment Committee (since October 2006) and Director or Trustee of various Morgan Stanley Funds (since August 2006); formerly, Managing Director, Morgan Stanley & Co. Inc. and Morgan Stanley Dean Witter Investment Management and President, various Morgan Stanley Funds (June 1998-March 2000); Principal, Morgan Stanley & Co. Inc. and Morgan Stanley Dean Witter Investment Management (August 1997-December 1999). | | | 86 | | | Director of certain investment funds managed or sponsored by Aetos Alternatives Management, LP; Director of Sanitized AG and Sanitized Marketing AG (specialty chemicals). | |
Patricia Maleski
c/o Perkins Coie LLP
Counsel to the Independent Directors
1155 Avenue of the Americas
New York, NY 10036
Birth Year 1960 | | Director | | Since January 2017 | | Managing Director, JPMorgan Asset Management (2004-2016); Oversight and Control Head of Fiduciary and Conflicts of Interest Program (2015-2016); Chief Control Officer-Global Asset Management (2013-2015); President, JPMorgan Funds (2010-2013); Chief Administrative Officer (2004-2013); various other positions including Treasurer and Board Liaison (since 2001). | | | 87 | | | None. | |
Michael E. Nugent
522 Fifth Avenue
New York, NY 10036
Birth Year 1936 | | Chair of the Board and Director | | Chair of the Boards since July 2006 and Director since July 1991 | | Chair of the Boards of various Morgan Stanley Funds (since July 2006); Chairperson of the Governance Committee (since January 2019) and Director or Trustee of various Morgan Stanley Funds (since July 1991); formerly, Chairperson of each of the Closed-End Fund committee (until December 2019) and the Insurance Committee (until July 2006); General Partner, Triumph Capital, L.P. (private investment partnership) (1988-2013). | | | 86 | | | None. | |
W. Allen Reed
c/o Perkins Coie LLP
Counsel to the Independent Directors
1155 Avenue of the Americas
New York, NY 10036
Birth Year 1947 | | Vice Chair of the Board and Director | | Vice Chair of the Boards since January 2020 and Director since August 2006 | | Chairperson of the Equity Sub-Committee of the Investment Committee (since October 2006) and Director or Trustee of various Morgan Stanley Funds (since August 2006); formerly, President and CEO of General Motors Asset Management; Chairman and Chief Executive Officer of the GM Trust Bank and Corporate Vice President of General Motors Corporation (August 1994-December 2005). | | | 86 | | | Formerly, Director of Legg Mason, Inc.; formerly, Director of the Auburn University Foundation (2010-2015). | |
* This is the earliest date the Director began serving the Morgan Stanley Funds. Each Director serves an indefinite term, until his or her successor is elected.
** The Fund Complex includes (as of December 31, 2019) all open-end and closed-end funds (including all of their portfolios) advised by Morgan Stanley Investment Management Inc. (the "Adviser") and any funds that have an adviser that is an affiliated person of the Adviser (including, but not limited to, Morgan Stanley AIP GP LP).
*** This includes any directorships at public companies and registered investment companies held by the Director at any time during the past five years.
29
Morgan Stanley Institutional Fund, Inc.
Annual Report — December 31, 2019
Director and Officer Information (unaudited) (cont'd)
Executive Officers:
Name, Birth Year and Address of
Executive Officer | | Position(s)
Held with
Registrant | | Length of Time
Served* | | Principal Occupation(s) During Past 5 Years | |
John H. Gernon
522 Fifth Avenue
New York, NY 10036
Birth Year 1963 | | President and Principal Executive Officer | | Since September 2013 | | President and Principal Executive Officer of the Equity and Fixed Income Funds and the Morgan Stanley AIP Funds (since September 2013) and the Liquidity Funds and various money market funds (since May 2014) in the Fund Complex; Managing Director of the Adviser; Head of Product (since 2006). | |
Timothy J. Knierim
522 Fifth Avenue
New York, NY 10036
Birth Year 1959 | | Chief Compliance Officer | | Since December 2016 | | Managing Director of the Adviser and various entities affiliated with the Adviser; Chief Compliance Officer of various Morgan Stanley Funds and the Adviser (since December 2016) and Chief Compliance Officer of Morgan Stanley AIP GP LP (since 2014). Formerly, Managing Director and Deputy Chief Compliance Officer of the Adviser (2014-2016); and formerly, Chief Compliance Officer of Prudential Investment Management, Inc. (2007-2014). | |
Francis J. Smith
522 Fifth Avenue
New York, NY 10036
Birth Year 1965 | | Treasurer and Principal Financial Officer | | Treasurer since July 2003 and Principal Financial Officer since September 2002 | | Managing Director of the Adviser and various entities affiliated with the Adviser; Treasurer (since July 2003) and Principal Financial Officer of various Morgan Stanley Funds (since September 2002). | |
Mary E. Mullin
522 Fifth Avenue
New York, NY 10036
Birth Year 1967 | | Secretary | | Since June 1999 | | Managing Director of the Adviser; Secretary of various Morgan Stanley Funds (since June 1999). | |
Michael J. Key
522 Fifth Avenue
New York, NY 10036
Birth Year 1979 | | Vice President | | Since June 2017 | | Vice President of the Equity and Fixed Income Funds, Liquidity Funds, various money market funds and the Morgan Stanley AIP Funds in the Fund Complex (since June 2017); Executive Director of the Adviser; Head of Product Development for Equity and Fixed Income Funds (since August 2013). | |
* This is the earliest date the officer began serving the Morgan Stanley Funds. Each officer serves a one-year term, until his or her successor is elected and qualifies.
30
Morgan Stanley Institutional Fund, Inc.
Annual Report — December 31, 2019
Adviser and Administrator
Morgan Stanley Investment Management Inc.
522 Fifth Avenue
New York, New York 10036
Distributor
Morgan Stanley Distribution, Inc.
522 Fifth Avenue
New York, New York 10036
Dividend Disbursing and Transfer Agent
DST Asset Manager Solutions, Inc.
2000 Crown Colony Drive
Quincy, Massachusetts 02169
Custodian
State Street Bank and Trust Company
One Lincoln Street
Boston, Massachusetts 02111
Legal Counsel
Dechert LLP
1095 Avenue of the Americas
New York, New York 10036
Counsel to the Independent Directors
Perkins Coie LLP
1155 Avenue of the Americas
New York, New York 10036
Independent Registered Public Accounting Firm
Ernst & Young LLP
200 Clarendon Street
Boston, Massachusetts 02116
Reporting to Shareholders
Each Morgan Stanley fund provides a complete schedule of portfolio holdings in its Semi-Annual and the Annual Reports within 60 days of the end of the fund's second and fourth fiscal quarters. The Semi-Annual and Annual Reports are filed electronically with the Securities and Exchange Commission ("SEC") on Form N-CSRS and Form N-CSR, respectively. Morgan Stanley also delivers the Semi-Annual and Annual Reports to fund shareholders and makes these reports available on its public website, www.morganstanley.com/im/shareholderreports. Each Morgan Stanley non-money market fund also files a complete schedule of portfolio holdings with the SEC for the fund's first and third fiscal quarters as an attachment to Form N-PORT. Morgan Stanley does not deliver the reports for the first and third fiscal quarters to shareholders, nor are the reports posted to the Morgan Stanley public website. However, the holdings for each money market fund are posted to the Morgan Stanley public website. You may obtain the Form N-PORT filings (as well as the Form N-CSR and N-CSRS filings) by accessing the SEC's website, www.sec.gov. You can also request copies of these materials, upon payment of a duplicating fee, by electronic request at the SEC's email address (publicinfo@sec.gov).
Proxy Voting Policies and Procedures and Proxy Voting Record
You may obtain a copy of the Company's Proxy Voting Policy and Procedures and information regarding how the Company voted proxies relating to portfolio securities during the most recent twelve-month period ended June 30, without charge, upon request, by calling toll free 1 (800) 548-7786 or by visiting our website at www.morganstanley.com/im/shareholderreports. This information is also available on the SEC's website at www.sec.gov.
This report is authorized for distribution only when preceded or accompanied by a prospectus or summary prospectus of the applicable fund of Morgan Stanley Institutional Fund, Inc., which describes in detail the fund's investment policies, risks, fees and expenses. Please read the prospectus carefully before you invest or send money. For additional information, including information regarding the investments comprising the Fund, please visit our website at www.morganstanley.com/im/shareholderreports or call toll free 1 (800) 548-7786.
31
Printed in U.S.A.
This Report has been prepared for shareholders and may be distributed to others only if preceded or accompanied by a current prospectus.
Morgan Stanley Investment Management Inc.
522 Fifth Avenue
New York, New York 10036
© 2020 Morgan Stanley. Morgan Stanley Distribution, Inc.

IFIGCREANN
2922342 EXP. 02.28.21

Morgan Stanley Institutional Fund, Inc.
Real Assets Portfolio
Annual Report
December 31, 2019
Beginning on January 1, 2021, as permitted by regulations adopted by the Securities and Exchange Commission ("SEC"), paper copies of the Fund's Annual and Semi-Annual Reports to Shareholders ("Shareholder Reports") will no longer be sent by mail, unless you specifically request paper copies of the Shareholder Reports from the Fund or from your financial intermediary, such as a broker-dealer or a bank. Instead, the Shareholder Reports will be made available on the Fund's website, https://www.morganstanley.com/im/shareholderreports and you will be notified by mail each time a Shareholder Report is posted and provided with a website link to access the Shareholder Report. If you already elected to receive Shareholder Reports electronically, you will not be affected by this change and you need not take any action. You may elect to receive Shareholder Reports and other communications from the Fund electronically anytime by contacting your financial intermediary or, if you are a direct investor, please follow the instructions on the envelope.
Beginning on January 1, 2019, you may elect to receive all future Shareholder Reports in paper free of charge. If you invest through a financial intermediary, you can contact your financial intermediary to request that you continue to receive paper copies of your Shareholder Reports. If you invest directly with the Fund, please follow the instructions on the envelope to let the Fund know you wish to continue receiving paper copies of your Shareholder Reports. Your election to receive Shareholder Reports in paper will apply to all funds held in your account if you invest through your financial intermediary or all funds held with the fund complex if you invest directly with a fund.

Morgan Stanley Institutional Fund, Inc.
Annual Report — December 31, 2019
Shareholders' Letter | | | 2 | | |
Expense Example | | | 3 | | |
Investment Overview | | | 4 | | |
Portfolio of Investments | | | 8 | | |
Statement of Assets and Liabilities | | | 12 | | |
Statement of Operations | | | 13 | | |
Statements of Changes in Net Assets | | | 14 | | |
Financial Highlights | | | 15 | | |
Notes to Financial Statements | | | 19 | | |
Report of Independent Registered Public Accounting Firm | | | 28 | | |
Federal Tax Notice | | | 29 | | |
Privacy Notice | | | 30 | | |
Director and Officer Information | | | 32 | | |
This report is authorized for distribution only when preceded or accompanied by a prospectus or summary prospectus of the applicable Fund of Morgan Stanley Institutional Fund, Inc. To receive a prospectus and/or statement of additional information ("SAI"), which contains more complete information such as investment objectives, charges, expenses, policies for voting proxies, risk considerations and describes in detail each of the Fund's investment policies to the prospective investor, please call toll free 1 (800) 548-7786. Please read the prospectuses carefully before you invest or send money.
Additionally, you can access information about the Fund, including performance, characteristics and investment team commentary, through Morgan Stanley Investment Management's website: www.morganstanley.com/im/shareholderreports.
Market forecasts provided in this report may not necessarily come to pass. There is no guarantee that any sectors mentioned will continue to perform as discussed herein or that securities in such sectors will be held by the Fund in the future. There is no assurance that a fund will achieve its investment objective. Funds are subject to market risk, which is the possibility that market values of securities owned by the Fund will decline and, therefore, the value of the Fund's shares may be less than what you paid for them. Accordingly, you can lose money investing in this Fund. Please see the prospectus for more complete information on investment risks.
1
Morgan Stanley Institutional Fund, Inc.
Annual Report — December 31, 2019
Shareholders' Letter (unaudited)
Dear Shareholders,
We are pleased to provide this Annual Report, in which you will learn how your investment in Real Assets Portfolio (the "Fund") performed during the latest twelve-month period.
Morgan Stanley Investment Management is a client-centric, investor-led organization. Our global presence, intellectual capital, and breadth of products and services enable us to partner with investors to meet the evolving challenges of today's financial markets. We aim to deliver superior investment service and to empower our clients to make the informed decisions that help them reach their investment goals.
As always, we thank you for selecting Morgan Stanley Investment Management, and look forward to working with you in the months and years ahead.
Sincerely,

John H. Gernon
President and Principal Executive Officer
January 2020
2
Morgan Stanley Institutional Fund, Inc.
Annual Report — December 31, 2019
Expense Example (unaudited)
Real Assets Portfolio
As a shareholder of the Fund, you incur two types of costs: (1) transactional costs; and (2) ongoing costs, which may include advisory fees, administration fees, distribution and shareholder services fees and other Fund expenses. This example is intended to help you understand your ongoing costs (in dollars) of investing in the Fund and to compare these costs with the ongoing costs of investing in other mutual funds.
This example is based on an investment of $1,000 invested at the beginning of the six-month period ended December 31, 2019 and held for the entire six-month period.
Actual Expenses
The table below provides information about actual account values and actual expenses. You may use the information in this table, together with the amount you invested, to estimate the expenses that you paid over the period. Simply divide your account value by $1,000 (for example, an $8,600 account value divided by $1,000 = 8.6), then multiply the result by the number in the table under the heading entitled "Actual Expenses Paid During Period" to estimate the expenses you paid on your account during this period.
Hypothetical Example for Comparison Purposes
The table below provides information about hypothetical account values and hypothetical expenses based on the Fund's actual expense ratio and an assumed rate of return of 5% per year before expenses, which is not the Fund's actual return. The hypothetical account values and expenses may not be used to estimate the actual ending account balance or expenses you paid for the period. You may use this information to compare the ongoing costs of investing in the Fund and other funds. To do so, compare this 5% hypothetical example with the 5% hypothetical examples that appear in the shareholder reports of the other funds.
Please note that the expenses shown in the table are meant to highlight your ongoing costs only and do not reflect any transactional costs, such as sales charges (loads). Therefore, the information for each class in the table is useful in comparing ongoing costs only, and will not help you determine the relative total costs of owning different funds. In addition, if these transactional costs were included, your costs would have been higher.
| | | Beginning
Account
Value
7/1/19 | | Actual Ending
Account
Value
12/31/19 | | Hypothetical
Ending Account
Value | | Actual
Expenses
Paid
During
Period* | | Hypothetical
Expenses Paid
During Period* | | Net
Expense
Ratio
During
Period** | |
Real Assets Portfolio Class I | | $ | 1,000.00 | | | $ | 1,050.70 | | | $ | 1,021.37 | | | $ | 3.93 | | | $ | 3.87 | | | | 0.76 | % | |
Real Assets Portfolio Class A | | | 1,000.00 | | | | 1,049.50 | | | | 1,019.46 | | | | 5.89 | | | | 5.80 | | | | 1.14 | | |
Real Assets Portfolio Class C | | | 1,000.00 | | | | 1,045.70 | | | | 1,015.68 | | | | 9.75 | | | | 9.60 | | | | 1.89 | | |
Real Assets Portfolio Class IS | | | 1,000.00 | | | | 1,050.90 | | | | 1,021.48 | | | | 3.83 | | | | 3.77 | | | | 0.74 | | |
* Expenses are calculated using each Fund Class' annualized net expense ratio (as disclosed), multiplied by the average account value over the period and multiplied by 184/365 (to reflect the most recent one-half year period).
** Annualized.
3
Morgan Stanley Institutional Fund, Inc.
Annual Report — December 31, 2019
Investment Overview (unaudited)
Real Assets Portfolio
The Fund seeks total return, targeted to be in excess of inflation, through capital appreciation and current income.
Performance
For the fiscal year ended December 31, 2019, the Fund's Class I shares had a total return based on net asset value and reinvestment of distributions per share of 18.35%, net of fees. The Fund's Class I shares underperformed the Fund's benchmark, the MSCI World Net Index (the "Index"), which returned 27.67%, and underperformed the MSIF Real Assets Benchmark Blend Index, which returned 21.66%.
Factors Affecting Performance
• In spite of weak earnings, a manufacturing recession, the feeblest growth in trade volumes since the 2008-09 crisis and heightened economic and political uncertainty, global assets markets rallied in 2019. Transitioning from a volatile year of poor returns in 2018, 2019 was retrospectively a good year. In 2019, we had the best global equity total returns since 2009, the best U.S. investment grade corporate bond total returns since 2009, the largest annual fall in the VIX Index since 2009 and the largest rally in Brent crude oil since 2007.i The Index returned 27.67%, with all sectors posting positive returns. Information technology, industrials and communication services outperformed, while energy was the big laggard. Growth outperformed value stocks, and large-caps outpaced small-caps.
• Overall returns have been strong in the real estate investment trust (REIT) market for full year 2019, but there was a wide disparity in share price performance; sectors viewed as defensive generally outperformed as the lower-for-longer investment theme strengthened and segments of the equity market appeared to be pricing in an economic slowdown/recession scenario. Bond yields continued to decline, achieving all-time lows in late August 2019; a phase that began in the fourth quarter of 2018, resulting in negative sovereign bond yields in certain markets (Germany, Japan) and significant bond yield declines in the U.S. and Australia. Given this combination of thematic investing and all-time low bond yields, we have witnessed a continued willingness among investors to pay premium valuations for segments of the
market that are viewed as having greater predictability in cash flows. We suspect that underlying private market property valuation has become a less relevant metric as generalist investors and passive funds have become the marginal buyer of real estate securities. Generalist investors appear to place a greater focus on secular themes and are untethered to private market valuations. With share prices generally appearing untethered to private real estate values, there are sectors trading at relative valuations previously witnessed during the 2008-09 global financial crisis and some sectors trading in excess of 50% premiums to net asset values (NAVs). There has been a continued willingness to pay premium valuations for segments of the REIT market that are viewed as having greater predictability in cash flows (e.g., U.S. net lease and health care REITs, Japan REITs) or benefiting from a secular investment theme (e.g., U.S. industrial and data centers). In addition, the concerns with regard to economic growth have generally placed downward pressure on segments that are viewed as more vulnerable — office, retail and hotels. Many of these stocks are trading at large discounts to NAVs, despite significant transactional evidence in the private markets in the office and hotel sectors. This has resulted in a further widening of the disparity in share price valuations among market segments. The Fund continues to be underweight to segments that have benefited from this theme due to premium share price valuations, and overweight to market segments which trade at very attractive discounted valuations.
• Global listed infrastructure securities' favorable performance was driven by a confluence of factors in 2019: (1) a healthy fundamental outlook across most infrastructure sectors, supported by modest global economic growth, (2) declines in cost of capital concurrent with a return to record low interest rates in a number of developed economies, (3) demand for "defensive" equities largely agnostic to political risk in a world of heightened geopolitical uncertainty, and (4) the need for infrastructure network augmentation due to structural shifts in network architecture (most notably in the utilities and communications sectors — e.g., decentralization of the electricity grid through increasing renewable power load and
i Source: Bloomberg L.P. Data as of December 31, 2019. Global equities are represented by the MSCI World Net Index, and U.S. investment grade corporate bonds are represented by the Bloomberg Barclays U.S. Corporate Index.
4
Morgan Stanley Institutional Fund, Inc.
Annual Report — December 31, 2019
Investment Overview (unaudited) (cont'd)
Real Assets Portfolio
5G/Internet of Things buildout for communications infrastructure). Outside of these factors, we would also note a significant focus on capital discipline and balance sheet health benefited several companies in 2019, most notably in the energy infrastructure sectors. Overall, we view 2019 as a strong year for infrastructure securities and the infrastructure markets in general.
• The U.S. Federal Reserve turned dovish in 2019 to ease financial conditions and to counteract the slowdown in global growth. The federal funds rate was cut three times over the year in 25 basis point increments and 10-year U.S. Treasury rates saw a strong rally. As a result, the fixed income portfolio generated strong returns and outperformed the Bloomberg Barclays U.S. Treasury Inflation Notes Total Return Index.
Management Strategies
• The Fund is comprised of independently managed sub-portfolios for each real asset class with an asset allocation that aims to optimize the balance between return potential and risk across the publicly traded real asset categories. Across the underlying real asset categories, the investment approach combines a top-down process with bottom-up stock selection, with each team providing bottom-up insight into their specialist areas, determining sub-sector and regional preferences within listed real assets.
• Going into 2020, we have a constructive near-term view in inflation-sensitive equities given the short-term outlook for economic growth. Our largest overweight allocation in the Fund is to fixed income, where we believe inflation is attractively priced relative to other opportunities. We have an offsetting underweight allocation to global real estate and a broadly neutral stance on global infrastructure.
• Within fixed income, we expect the U.S. Federal Reserve to stay on the dovish side and let inflation drift higher. At the same time, as the headwinds of U.S.-China trade negotiations dissipate and global growth stabilizes, we expect rates to drift higher. Hence, we have a small underweight to duration relative to the Bloomberg Barclays U.S. Treasury Inflation Notes Total Return Index. We also
initiated an inflation breakeven widener position by selling nominal duration in the portfolio, as we expect inflation breakevens to widen from current levels.
• Within global infrastructure, our research currently leads us to an overweighting in the Fund to a group of companies in the toll roads sector, a market-neutral weighting to companies in the water and ports sectors, and an underweighting to companies in the communications, pipeline companies, gas midstream, electricity transmission & distribution, European regulated utilities, diversified, airports, and gas distribution utilities sectors. Finally, we continue to retain an out-of-benchmark position in renewables, as well as a weighting in certain other utilities that are not contained in the Dow Jones Brookfield Global Infrastructure IndexSM. In terms of outlook, while we do expect a moderation in some fundamental trends going forward, specifically in transportation infrastructure where volume/traffic dynamics have generally been running above trend until recently, our outlook for infrastructure securities in 2020 is constructive on a fundamental basis. Furthermore, because there is considerable debate as to whether we are "mid-cycle" or "late-cycle" from an economic perspective, and questions remain about the timing and comprehensiveness of a "full" or "Phase Two" U.S.-China trade agreement, as well as the outcome of a 2020 U.S. presidential election, we believe infrastructure securities could continue to serve as a relative safe-haven for many investors looking for companies with resilient and predictable cash flow profiles. Valuation and regulatory changes are primary risk factors, but we view the former as a risk borne by all long-duration assets, including fixed income and non-infrastructure equities. Encouragingly, value remains at the company level, which we believe is supportive of positive potential returns for the asset class going forward. In particular, we view select areas of energy infrastructure and emerging markets infrastructure more broadly as areas of opportunity, as well as companies currently involved in regulatory processes (with near-term uncertainty but long-term value). Finally, given the considerable amount of private capital raised for infrastructure and the dislocation between public and private valuations, we view public-to-private transactions as a
5
Morgan Stanley Institutional Fund, Inc.
Annual Report — December 31, 2019
Investment Overview (unaudited) (cont'd)
Real Assets Portfolio
considerable opportunity for listed infrastructure over the short to medium term.
• We believe listed real estate security returns should mirror private real estate performance. This strategy may result in periods of underperformance, particularly when the market is driven more by thematic/momentum investing and macro factors, as opposed to fundamentals and intrinsic value. The current prolonged period in which underlying private market valuation is not a relevant determinant of share prices has been surprising. The private market is more than six times larger than the public markets and has, up until this period, always served as a key determinant of share prices and our key metric. It is logical to us that persistent discounts cannot exist when there is so much capital on the sidelines needing to invest, and we believe we will be rewarded as these stocks provide favorable risk-adjusted return opportunities based on our analysis.
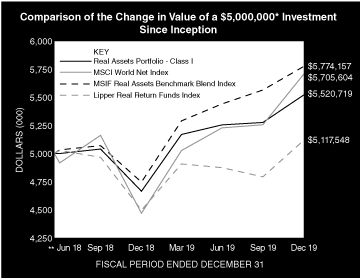
* Minimum Investment for Class I shares
** Commenced Operations on June 18, 2018.
In accordance with SEC regulations, the Fund's performance shown assumes that all recurring fees (including management fees) were deducted and all dividends and distributions were reinvested. The performance of Class A, C and IS shares will vary from the performance of Class I shares and will be negatively impacted by additional fees assessed to those classes (if applicable).
6
Morgan Stanley Institutional Fund, Inc.
Annual Report — December 31, 2019
Investment Overview (unaudited) (cont'd)
Real Assets Portfolio
Performance Compared to the MSCI World Net Index(1), MSIF Real Assets Benchmark Blend Index(2) and the Lipper Real Return Funds Index(3)
| | | Period Ended December 31, 2019
Total Returns(4) | |
| | | | | Average Annual | |
| | | One
Year | | Five
Years | | Ten
Years | | Since
Inception(6) | |
Fund — Class I Shares w/o
sales charges(5) | | | 18.35 | % | | | — | | | | — | | | | 6.66 | % | |
Fund — Class A Shares w/o
sales charges(5) | | | 17.93 | | | | — | | | | — | | | | 6.26 | | |
Fund — Class A Shares with
maximum 5.25%
sales charges(5) | | | 11.76 | | | | — | | | | — | | | | 2.63 | | |
Fund — Class C Shares w/o
sales charges(5) | | | 17.12 | | | | — | | | | — | | | | 5.51 | | |
Fund — Class C Shares with
maximum 1.00% deferred
sales charges(5) | | | 16.12 | | | | — | | | | — | | | | 5.51 | | |
Fund — Class IS Shares w/o
sales charges(5) | | | 18.37 | | | | — | | | | — | | | | 6.68 | | |
MSCI World Net Index | | | 27.67 | | | | — | | | | — | | | | 8.97 | | |
MSIF Real Assets Benchmark
Blend Index | | | 21.66 | | | | — | | | | — | | | | 9.82 | | |
Lipper Real Return Funds Index | | | 13.56 | | | | — | | | | — | | | | 1.39 | | |
Performance data quoted represents past performance, which is no guarantee of future results, and current performance may be lower or higher than the figures shown. Performance assumes that all dividends and distributions, if any, were reinvested. For the most recent month-end performance figures, please visit www.morganstanley.com/im/shareholderreports. Investment return and principal value will fluctuate so that Fund shares, when redeemed, may be worth more or less than their original cost. Total returns do not reflect the deduction of taxes that a shareholder would pay on Fund distributions or the redemption of Fund shares. Performance of share classes will vary due to difference in sales charges and expenses.
(1) The MSCI World Net Index is a free float-adjusted market capitalization weighted index designed to measure the equity market performance of developed markets. The term "free float" represents the portion of shares outstanding that are deemed to be available for purchase in the public equity markets by investors. The MSCI World Net Index currently consists of 23 developed market country indices. The performance of the Index is listed in US dollars and assumes reinvestment of net dividends. Net total return indices reinvest dividends after the deduction of withholding taxes, using (for international indices) a tax rate applicable to non-resident institutional investors who do not benefit from double taxation treaties. The Index is unmanaged and its returns do not include any sales charges or fees. Such costs would lower performance. It is not possible to invest directly in an index.
(2) The MSIF Real Assets Benchmark Blend Index is comprised of 25% MSCI World Net Index (benchmark that measures the equity market performance of developed markets), 25% Dow Jones Brookfield Global Infrastructure IndexSM (benchmark that measures the stock performance of companies that exhibit strong infrastructure characteristics), 25% FTSE EPRA Nareit Developed Real Estate Net Total Return Index (a global market capitalization weighted index composed of listed real estate securities in the North American, European and Asian real estate markets) and 25% Bloomberg Barclays US Treasury Inflation-Protected Securities Index (TIPS) (a benchmark that measures the performance of the TIPS market. TIPS are bonds issued by the US Treasury that pay a coupon on the adjusted principal of the bond). The Index is unmanaged and its returns do not include any sales charges or fees. Such costs would lower performance. It is not possible to invest directly in an index.
(3) The Lipper Real Return Funds Index is an equally weighted performance index of the largest qualifying funds (based on net assets) in the Lipper Real Return Funds classification. The Index, which is adjusted for capital gains distributions and income dividends, is unmanaged and should not be considered an investment. There are currently 10 funds represented in this Index. As of the date of this report, the Fund was in the Lipper Real Return Funds classification.
(4) Total returns for the Fund reflect fees waived and expenses reimbursed, if applicable, by the Adviser (as defined herein). Without such waivers and reimbursements, total returns would have been lower.
(5) Commenced operations on June 18, 2018.
(6) For comparative purposes, average annual since inception returns listed for the Indexes refer to the inception date of the Fund, not the inception of the Index.
7
Morgan Stanley Institutional Fund, Inc.
Annual Report — December 31, 2019
Portfolio of Investments
Real Assets Portfolio
| | | Shares | | Value
(000) | |
Common Stocks (70.9%) | |
Australia (2.4%) | |
APA Group | | | 2,209 | | | $ | 17 | | |
Atlas Arteria Ltd. | | | 2,922 | | | | 16 | | |
BHP Group Ltd. | | | 21 | | | | 1 | | |
Computershare Ltd. | | | 1,362 | | | | 16 | | |
Dexus REIT | | | 1,154 | | | | 10 | | |
GPT Group (The) REIT | | | 2,774 | | | | 11 | | |
Origin Energy Ltd. | | | 34 | | | | — | @ | |
Santos Ltd. | | | 4,213 | | | | 24 | | |
Scentre Group REIT | | | 8,441 | | | | 23 | | |
Sydney Airport | | | 4,004 | | | | 24 | | |
Transurban Group | | | 6,136 | | | | 64 | | |
Wesfarmers Ltd. | | | 64 | | | | 2 | | |
Woodside Petroleum Ltd. | | | 923 | | | | 22 | | |
Woolworths Group Ltd. | | | 1,099 | | | | 28 | | |
| | | | 258 | | |
Canada (4.6%) | |
Bank of Nova Scotia (The) | | | 456 | | | | 26 | | |
Bombardier, Inc., Class B (a) | | | 3,499 | | | | 5 | | |
Enbridge, Inc. | | | 3,238 | | | | 129 | | |
Hydro One Ltd. | | | 2,624 | | | | 51 | | |
National Bank of Canada | | | 1,032 | | | | 57 | | |
Pembina Pipeline Corp. | | | 1,385 | | | | 51 | | |
RioCan Real Estate Investment Trust REIT | | | 438 | | | | 9 | | |
Royal Bank of Canada | | | 485 | | | | 39 | | |
TC Energy Corp. | | | 2,146 | | | | 114 | | |
Toronto-Dominion Bank (The) | | | 375 | | | | 21 | | |
| | | | 502 | | |
China (1.1%) | |
China Everbright International Ltd. | | | 23,328 | | | | 19 | | |
China Gas Holdings Ltd. (b) | | | 13,218 | | | | 50 | | |
China Merchants Port Holdings Co., Ltd. (b) | | | 3,773 | | | | 6 | | |
China Overseas Land & Investment Ltd. (b) | | | 369 | | | | 2 | | |
China Tower Corp. Ltd. H Shares (b) | | | 85,836 | | | | 19 | | |
ENN Energy Holdings Ltd. (b) | | | 2,600 | | | | 28 | | |
| | | 124 | | |
Denmark (0.3%) | |
Carlsberg A/S Series B | | | 202 | | | | 30 | | |
Finland (0.2%) | |
Citycon Oyj | | | 791 | | | | 8 | | |
Nokian Renkaat Oyj | | | 468 | | | | 14 | | |
| | | | 22 | | |
France (3.3%) | |
Aeroports de Paris (ADP) | | | 127 | | | | 25 | | |
Airbus SE | | | 137 | | | | 20 | | |
Gecina SA REIT | | | 274 | | | | 49 | | |
Getlink SE | | | 1,146 | | | | 20 | | |
ICADE REIT | | | 71 | | | | 8 | | |
Klepierre SA REIT | | | 2,466 | | | | 94 | | |
Sanofi | | | 280 | | | | 28 | | |
Unibail-Rodamco-Westfield REIT | | | 187 | | | | 30 | | |
Vinci SA | | | 787 | | | | 87 | | |
| | | | 361 | | |
| | | Shares | | Value
(000) | |
Germany (1.0%) | |
ADO Properties SA | | | 100 | | | $ | 3 | | |
BASF SE | | | 306 | | | | 23 | | |
Deutsche Wohnen SE | | | 1,067 | | | | 43 | | |
SAP SE | | | 146 | | | | 20 | | |
Siemens AG (Registered) | | | 181 | | | | 24 | | |
| | | | 113 | | |
Hong Kong (4.6%) | |
CK Asset Holdings Ltd. | | | 1,016 | | | | 7 | | |
Dairy Farm International Holdings Ltd. | | | 2,034 | | | | 11 | | |
Hong Kong & China Gas Co., Ltd. | | | 13,664 | | | | 27 | | |
Hong Kong Exchanges & Clearing Ltd. | | | 6 | | | | — | @ | |
Hongkong Land Holdings Ltd. | | | 23,593 | | | | 136 | | |
Hysan Development Co., Ltd. | | | 5,515 | | | | 22 | | |
Link REIT | | | 2,654 | | | | 28 | | |
New World Development Co., Ltd. | | | 5,785 | | | | 8 | | |
Sun Hung Kai Properties Ltd. | | | 8,965 | | | | 137 | | |
Swire Properties Ltd. | | | 29,181 | | | | 97 | | |
Wharf Real Estate Investment Co., Ltd. | | | 3,280 | | | | 20 | | |
| | | 493 | | |
India (0.4%) | |
Azure Power Global Ltd. (a) | | | 3,547 | | | | 45 | | |
Ireland (0.1%) | |
Hibernia REIT PLC | | | 7,239 | | | | 11 | | |
Italy (0.9%) | |
Atlantia SpA | | | 1,032 | | | | 24 | | |
Eni SpA | | | 1,625 | | | | 25 | | |
Infrastrutture Wireless Italiane SpA | | | 1,334 | | | | 13 | | |
Snam SpA | | | 1,157 | | | | 6 | | |
Terna Rete Elettrica Nazionale SpA | | | 5,010 | | | | 34 | | |
| | | | 102 | | |
Japan (3.6%) | |
Aeon Co., Ltd. | | | 1,027 | | | | 21 | | |
GLP J-REIT | | | 4 | | | | 5 | | |
ITOCHU Corp. | | | 1,451 | | | | 34 | | |
Japan Airport Terminal Co., Ltd. | | | 152 | | | | 8 | | |
Mitsubishi Corp. | | | 1,086 | | | | 29 | | |
Mitsubishi Estate Co., Ltd. | | | 3,377 | | | | 65 | | |
Mitsui Fudosan Co., Ltd. | | | 2,072 | | | | 51 | | |
Mizuho Financial Group, Inc. | | | 18,399 | | | | 28 | | |
Nippon Building Fund, Inc. REIT | | | 2 | | | | 15 | | |
Shiseido Co., Ltd. | | | 237 | | | | 17 | | |
Sumitomo Corp. | | | 1,393 | | | | 21 | | |
Sumitomo Electric Industries Ltd. | | | 1,634 | | | | 24 | | |
Sumitomo Mitsui Financial Group, Inc. | | | 780 | | | | 29 | | |
Sumitomo Realty & Development Co., Ltd. | | | 215 | | | | 7 | | |
Tokyo Gas Co., Ltd. | | | 1,484 | | | | 36 | | |
| | | | 390 | | |
Mexico (1.5%) | |
Promotora y Operadora de Infraestructura
SAB de CV | | | 15,772 | | | | 161 | | |
The accompanying notes are an integral part of the financial statements.
8
Morgan Stanley Institutional Fund, Inc.
Annual Report — December 31, 2019
Portfolio of Investments (cont'd)
Real Assets Portfolio
| | | Shares | | Value
(000) | |
Netherlands (0.7%) | |
Eurocommercial Properties N.V. CVA REIT | | | 1,505 | | | $ | 42 | | |
Koninklijke DSM N.V. | | | 266 | | | | 35 | | |
| | | | 77 | | |
New Zealand (0.2%) | |
Auckland International Airport Ltd. | | | 3,738 | | | | 22 | | |
Norway (0.1%) | |
Telenor ASA | | | 851 | | | | 15 | | |
Portugal (0.2%) | |
Galp Energia SGPS SA | | | 1,332 | | | | 22 | | |
Singapore (0.3%) | |
Keppel Corp., Ltd. | | | 4,956 | | | | 25 | | |
UOL Group Ltd. | | | 592 | | | | 4 | | |
| | | | 29 | | |
Spain (1.9%) | |
Aena SME SA | | | 96 | | | | 18 | | |
Atlantica Yield PLC | | | 2,791 | | | | 74 | | |
Cellnex Telecom SA | | | 297 | | | | 13 | | |
Ferrovial SA | | | 1,276 | | | | 39 | | |
Inmobiliaria Colonial Socimi SA REIT | | | 167 | | | | 2 | | |
Merlin Properties Socimi SA REIT | | | 2,304 | | | | 33 | | |
Repsol SA | | | 1,878 | | | | 29 | | |
| | | | 208 | | |
Sweden (0.1%) | |
Hufvudstaden AB, Class A | | | 723 | | | | 14 | | |
Switzerland (1.3%) | |
Barry Callebaut AG (Registered) (Registered) | | | 10 | | | | 22 | | |
Credit Suisse Group AG (Registered) (a) | | | 1,791 | | | | 24 | | |
Flughafen Zurich AG (Registered) | | | 125 | | | | 23 | | |
Nestle SA (Registered) | | | 241 | | | | 26 | | |
Novartis AG (Registered) | | | 245 | | | | 23 | | |
Roche Holding AG (Genusschein) | | | 89 | | | | 29 | | |
| | | | 147 | | |
United Kingdom (5.8%) | |
Anglo American PLC | | | 836 | | | | 24 | | |
British Land Co., PLC (The) REIT | | | 6,446 | | | | 55 | | |
Derwent London PLC REIT | | | 791 | | | | 42 | | |
Diageo PLC | | | 536 | | | | 23 | | |
GlaxoSmithKline PLC | | | 13 | | | | — | @ | |
Great Portland Estates PLC REIT | | | 5,683 | | | | 65 | | |
Hammerson PLC REIT | | | 11,077 | | | | 45 | | |
HSBC Holdings PLC | | | 3,516 | | | | 28 | | |
John Laing Group PLC | | | 4,149 | | | | 21 | | |
Land Securities Group PLC REIT | | | 6,126 | | | | 80 | | |
National Grid PLC | | | 9,868 | | | | 123 | | |
Pennon Group PLC | | | 2,118 | | | | 29 | | |
Royal Dutch Shell PLC, Class A | | | 893 | | | | 26 | | |
RSA Insurance Group PLC | | | 2,694 | | | | 20 | | |
Severn Trent PLC | | | 703 | | | | 23 | | |
United Utilities Group PLC | | | 1,096 | | | | 14 | | |
| | | Shares | | Value
(000) | |
Urban & Civic PLC | | | 608 | | | $ | 3 | | |
Weir Group PLC (The) | | | 846 | | | | 17 | | |
| | | | 638 | | |
United States (36.3%) | |
Abbott Laboratories | | | 323 | | | | 28 | | |
AbbVie, Inc. | | | 199 | | | | 18 | | |
Adobe, Inc. (a) | | | 92 | | | | 30 | | |
Agilent Technologies, Inc. | | | 272 | | | | 23 | | |
Alphabet, Inc., Class C (a) | | | 46 | | | | 62 | | |
Amazon.com, Inc. (a) | | | 29 | | | | 54 | | |
American Electric Power Co., Inc. | | | 128 | | | | 12 | | |
American Express Co. | | | 254 | | | | 32 | | |
American Homes 4 Rent, Class A REIT | | | 315 | | | | 8 | | |
American Tower Corp. REIT | | | 839 | | | | 193 | | |
American Water Works Co., Inc. | | | 417 | | | | 51 | | |
Analog Devices, Inc. | | | 190 | | | | 23 | | |
Apartment Investment & Management Co.,
Class A REIT | | | 239 | | | | 12 | | |
Apple, Inc. | | | 321 | | | | 94 | | |
Aqua America, Inc. | | | 819 | | | | 38 | | |
Arthur J Gallagher & Co. | | | 261 | | | | 25 | | |
AT&T, Inc. | | | 690 | | | | 27 | | |
Atmos Energy Corp. | | | 584 | | | | 65 | | |
AvalonBay Communities, Inc. REIT | | | 333 | | | | 70 | | |
Bank of America Corp. | | | 926 | | | | 33 | | |
Baxter International, Inc. | | | 260 | | | | 22 | | |
Boston Properties, Inc. REIT | | | 793 | | | | 109 | | |
Brixmor Property Group, Inc. REIT | | | 827 | | | | 18 | | |
Camden Property Trust REIT | | | 156 | | | | 17 | | |
Caterpillar, Inc. | | | 141 | | | | 21 | | |
Celanese Corp. | | | 182 | | | | 22 | | |
CenterPoint Energy, Inc. | | | 1,644 | | | | 45 | | |
Charles Schwab Corp. (The) | | | 415 | | | | 20 | | |
Cheniere Energy, Inc. (a) | | | 659 | | | | 40 | | |
Chevron Corp. | | | 184 | | | | 22 | | |
Citrix Systems, Inc. | | | 205 | | | | 23 | | |
Coca-Cola Co. (The) | | | 429 | | | | 24 | | |
Comcast Corp., Class A | | | 483 | | | | 22 | | |
Consolidated Edison, Inc. | | | 454 | | | | 41 | | |
Corteva, Inc. (a) | | | 156 | | | | 5 | | |
Crown Castle International Corp. REIT | | | 749 | | | | 106 | | |
CSX Corp. | | | 328 | | | | 24 | | |
CubeSmart REIT | | | 219 | | | | 7 | | |
DiamondRock Hospitality Co. REIT | | | 2,576 | | | | 29 | | |
Discover Financial Services | | | 329 | | | | 28 | | |
Dover Corp. | | | 203 | | | | 23 | | |
DuPont de Nemours, Inc. | | | 156 | | | | 10 | | |
Edison International | | | 711 | | | | 54 | | |
Equity Residential REIT | | | 644 | | | | 52 | | |
Essex Property Trust, Inc. REIT | | | 67 | | | | 20 | | |
Eversource Energy | | | 719 | | | | 61 | | |
F5 Networks, Inc. (a) | | | 109 | | | | 15 | | |
The accompanying notes are an integral part of the financial statements.
9
Morgan Stanley Institutional Fund, Inc.
Annual Report — December 31, 2019
Portfolio of Investments (cont'd)
Real Assets Portfolio
| | | Shares | | Value
(000) | |
United States (cont'd) | |
Facebook, Inc., Class A (a) | | | 170 | | | $ | 35 | | |
Federal Realty Investment Trust REIT | | | 64 | | | | 8 | | |
FLIR Systems, Inc. | | | 375 | | | | 20 | | |
Garmin Ltd. | | | 341 | | | | 33 | | |
Gilead Sciences, Inc. | | | 273 | | | | 18 | | |
Globe Life, Inc. | | | 319 | | | | 34 | | |
HCA Healthcare, Inc. | | | 143 | | | | 21 | | |
Healthcare Realty Trust, Inc. REIT | | | 295 | | | | 10 | | |
Healthpeak Properties, Inc. REIT | | | 275 | | | | 9 | | |
Host Hotels & Resorts, Inc. REIT | | | 4,055 | | | | 75 | | |
Hudson Pacific Properties, Inc. REIT | | | 649 | | | | 24 | | |
Intel Corp. | | | 401 | | | | 24 | | |
International Business Machines Corp. | | | 211 | | | | 28 | | |
Intuitive Surgical, Inc. (a) | | | 41 | | | | 24 | | |
JBG SMITH Properties REIT | | | 335 | | | | 13 | | |
Johnson & Johnson | | | 274 | | | | 40 | | |
JPMorgan Chase & Co. | | | 376 | | | | 52 | | |
Kinder Morgan, Inc. | | | 3,052 | | | | 65 | | |
LKQ Corp. (a) | | | 649 | | | | 23 | | |
Macerich Co. (The) REIT | | | 3,323 | | | | 89 | | |
Mack-Cali Realty Corp. REIT | | | 1,851 | | | | 43 | | |
Mastercard, Inc., Class A | | | 108 | | | | 32 | | |
Merck & Co., Inc. | | | 286 | | | | 26 | | |
Microsoft Corp. | | | 604 | | | | 95 | | |
Mid-America Apartment Communities, Inc. REIT | | | 61 | | | | 8 | | |
Mondelez International, Inc., Class A | | | 500 | | | | 28 | | |
Netflix, Inc. (a) | | | 45 | | | | 15 | | |
NiSource, Inc. | | | 1,781 | | | | 50 | | |
Norfolk Southern Corp. | | | 135 | | | | 26 | | |
ONEOK, Inc. | | | 715 | | | | 54 | | |
Paramount Group, Inc. REIT | | | 1,363 | | | | 19 | | |
PepsiCo, Inc. | | | 230 | | | | 31 | | |
Pfizer, Inc. | | | 661 | | | | 26 | | |
Procter & Gamble Co. (The) | | | 228 | | | | 28 | | |
ProLogis, Inc. REIT | | | 211 | | | | 19 | | |
Prudential Financial, Inc. | | | 251 | | | | 24 | | |
PTC, Inc. (a) | | | 230 | | | | 17 | | |
Public Storage REIT | | | 22 | | | | 5 | | |
QTS Realty Trust, Inc., Class A REIT | | | 144 | | | | 8 | | |
QUALCOMM, Inc. | | | 289 | | | | 26 | | |
Regency Centers Corp. REIT | | | 626 | | | | 39 | | |
salesforce.com, Inc. (a) | | | 150 | | | | 24 | | |
SBA Communications Corp. REIT | | | 261 | | | | 63 | | |
Sempra Energy | | | 490 | | | | 74 | | |
Simon Property Group, Inc. REIT | | | 1,074 | | | | 160 | | |
SL Green Realty Corp. REIT | | | 2,165 | | | | 199 | | |
Steel Dynamics, Inc. | | | 486 | | | | 17 | | |
Sunstone Hotel Investors, Inc. REIT | | | 2,519 | | | | 35 | | |
Targa Resources Corp. | | | 417 | | | | 17 | | |
Thermo Fisher Scientific, Inc. | | | 80 | | | | 26 | | |
Tiffany & Co. | | | 174 | | | | 23 | | |
| | | Shares | | Value
(000) | |
UnitedHealth Group, Inc. | | | 85 | | | $ | 25 | | |
Verizon Communications, Inc. | | | 464 | | | | 28 | | |
Vornado Realty Trust REIT | | | 1,740 | | | | 116 | | |
Walt Disney Co. (The) | | | 214 | | | | 31 | | |
Waste Connections, Inc. | | | 224 | | | | 20 | | |
Williams Cos., Inc. (The) | | | 2,521 | | | | 60 | | |
Xylem, Inc. | | | 266 | | | | 21 | | |
| | | | 3,981 | | |
Total Common Stocks (Cost $7,085) | | | 7,765 | | |
| | | No. of
Rights | | | |
Right (0.0%) | |
Spain (0.0%) | |
| Repsol SA, expires 1/21/20 (a) (Cost $1) | | | 1,878 | | | | 1 | | |
| | | Face
Amount
(000) | | | |
U.S. Treasury Securities (26.0%) | |
United States (26.0%) | |
U.S. Treasury Inflation Index Notes (TIPS), | |
0.13%, 4/15/21 - 7/15/24 | | $ | 677 | | | | 681 | | |
0.38%, 7/15/23 - 1/15/27 | | | 633 | | | | 642 | | |
0.50%, 1/15/28 | | | 286 | | | | 293 | | |
0.75%, 2/15/42 | | | 69 | | | | 72 | | |
0.88%, 1/15/29 | | | 197 | | | | 209 | | |
1.00%, 2/15/46 | | | 217 | | | | 239 | | |
2.00%, 1/15/26 | | | 18 | | | | 20 | | |
2.13%, 2/15/40 | | | 55 | | | | 72 | | |
3.88%, 4/15/29 | | | 216 | | | | 288 | | |
U.S. Treasury Inflation Indexed Bonds, | |
0.25%, 1/15/25 | | | 276 | | | | 279 | | |
1.00%, 2/15/48 | | | 46 | | | | 51 | | |
Total U.S. Treasury Securities (Cost $2,781) | | | 2,846 | | |
| | | Shares | | | |
Short-Term Investment (4.0%) | |
Investment Company (4.0%) | |
Morgan Stanley Institutional Liquidity
Funds — Treasury Portfolio —
Institutional Class (See Note G)
(Cost $442) | | | 441,774 | | | | 442 | | |
Total Investments (100.9%) (Cost $10,309) (c)(d)(e) | | | 11,054 | | |
Liabilities in Excess of Other Assets (–0.9%) | | | (101 | ) | |
Net Assets (100.0%) | | $ | 10,953 | | |
Country assignments and aggregations are based generally on third party vendor classifications and information, and may be different from the assignments and aggregations under the policies set forth in the Fund's prospectus and/or statement of additional information relating to geographic classifications.
(a) Non-income producing security.
(b) Security trades on the Hong Kong exchange.
(c) Securities are available for collateral in connection with open futures contract.
The accompanying notes are an integral part of the financial statements.
10
Morgan Stanley Institutional Fund, Inc.
Annual Report — December 31, 2019
Portfolio of Investments (cont'd)
Real Assets Portfolio
(d) The approximate fair value and percentage of net assets, $833,000 and 7.6%, respectively, represent the securities that have been fair valued under the fair valuation policy for international investments as described in Note A-1 within the Notes to the Financial Statements.
(e) At December 31, 2019, the aggregate cost for federal income tax purposes is approximately $10,376,000. The aggregate gross unrealized appreciation is approximately $920,000 and the aggregate gross unrealized depreciation is approximately $241,000, resulting in net unrealized appreciation of approximately $679,000.
CVA Certificaten Van Aandelen.
REIT Real Estate Investment Trust.
TIPS Treasury Inflation Protected Security.
Futures Contract:
The Fund had the following futures contract open at December 31, 2019:
| | | Number
of
Contracts | | Expiration
Date | | Notional
Amount
(000) | | Value
(000) | | Unrealized
Appreciation
(000) | |
Short: | |
U.S. Treasury 10 yr. Ultra Long Bond
(United States) | | | 1 | | | Mar-20 | | | (100 | ) | | $ | (141 | ) | | $ | 2 | | |
@ Value is less than $500.
Portfolio Composition
Classification | | Percentage of
Total Investments | |
Other* | | | 42.0 | % | |
U.S. Treasury Securities | | | 25.7 | | |
Equity Real Estate Investment Trusts (REITs) | | | 20.3 | | |
Oil, Gas & Consumable Fuels | | | 6.3 | | |
Real Estate Management & Development | | | 5.7 | | |
Total Investments | | | 100.0 | %** | |
* Industries and/or investment types representing less than 5% of total investments.
** Does not include an open short futures contract with a value of approximately $141,000 and unrealized appreciation of approximately $2,000
The accompanying notes are an integral part of the financial statements.
11
Morgan Stanley Institutional Fund, Inc.
Annual Report — December 31, 2019
Statement of Assets and Liabilities | | December 31, 2019
(000) | |
Assets: | |
Investments in Securities of Unaffiliated Issuers, at Value (Cost $9,867) | | $ | 10,612 | | |
Investment in Security of Affiliated Issuer, at Value (Cost $442) | | | 442 | | |
Total Investments in Securities, at Value (Cost $10,309) | | | 11,054 | | |
Foreign Currency, at Value (Cost $18) | | | 18 | | |
Receivable for Investments Sold | | | 135 | | |
Dividends Receivable | | | 20 | | |
Interest Receivable | | | 7 | | |
Due from Adviser | | | 5 | | |
Receivable for Variation Margin on Futures Contracts | | | 4 | | |
Tax Reclaim Receivable | | | 2 | | |
Receivable from Affiliate | | | 1 | | |
Other Assets | | | 24 | | |
Total Assets | | | 11,270 | | |
Liabilities: | |
Payable for Investments Purchased | | | 121 | | |
Payable for Offering Costs | | | 121 | | |
Payable for Professional Fees | | | 44 | | |
Payable for Custodian Fees | | | 15 | | |
Payable for Transfer Agency Fees — Class I | | | — | @ | |
Payable for Transfer Agency Fees — Class A | | | — | @ | |
Payable for Transfer Agency Fees — Class C | | | — | @ | |
Payable for Transfer Agency Fees — Class IS | | | — | @ | |
Payable for Administration Fees | | | 1 | | |
Payable for Shareholder Services Fees — Class A | | | — | @ | |
Payable for Distribution and Shareholder Services Fees — Class C | | | — | @ | |
Other Liabilities | | | 15 | | |
Total Liabilities | | | 317 | | |
Net Assets | | $ | 10,953 | | |
Net Assets Consist of: | |
Paid-in-Capital | | $ | 10,335 | | |
Total Distributable Earnings | | | 618 | | |
Net Assets | | $ | 10,953 | | |
CLASS I: | |
Net Assets | | $ | 10,728 | | |
| Shares Outstanding $0.001 par value shares of beneficial interest (unlimited shares authorized) (not in 000's) | | | 1,020,302 | | |
Net Asset Value, Offering and Redemption Price Per Share | | $ | 10.51 | | |
CLASS A: | |
Net Assets | | $ | 42 | | |
| Shares Outstanding $0.001 par value shares of beneficial interest (unlimited shares authorized) (not in 000's) | | | 3,996 | | |
Net Asset Value, Redemption Price Per Share | | $ | 10.53 | | |
Maximum Sales Load | | | 5.25 | % | |
Maximum Sales Charge | | $ | 0.58 | | |
Maximum Offering Price Per Share | | $ | 11.11 | | |
CLASS C: | |
Net Assets | | $ | 172 | | |
| Shares Outstanding $0.001 par value shares of beneficial interest (unlimited shares authorized) (not in 000's) | | | 16,394 | | |
Net Asset Value, Offering and Redemption Price Per Share | | $ | 10.50 | | |
CLASS IS: | |
Net Assets | | $ | 11 | | |
| Shares Outstanding $0.001 par value shares of beneficial interest (unlimited shares authorized) (not in 000's) | | | 1,020 | | |
Net Asset Value, Offering and Redemption Price Per Share | | $ | 10.51 | | |
@ Amount is less than $500.
The accompanying notes are an integral part of the financial statements.
12
Morgan Stanley Institutional Fund, Inc.
Annual Report — December 31, 2019
Statement of Operations | | Year Ended
December 31, 2019
(000) | |
Investment Income: | |
Dividends from Securities of Unaffiliated Issuers (Net of $15 of Foreign Taxes Withheld) | | $ | 194 | | |
Interest from Securities of Unaffiliated Issuers | | | 45 | | |
Non-Cash Dividends from Securities of Unaffiliated Issuers | | | 22 | | |
Dividends from Security of Affiliated Issuer (Note G) | | | 8 | | |
Total Investment Income | | | 269 | | |
Expenses: | |
Professional Fees | | | 102 | | |
Custodian Fees (Note F) | | | 70 | | |
Advisory Fees (Note B) | | | 61 | | |
Offering Costs | | | 50 | | |
Registration Fees | | | 35 | | |
Shareholder Reporting Fees | | | 17 | | |
Pricing Fees | | | 17 | | |
Administration Fees (Note C) | | | 8 | | |
Transfer Agency Fees — Class I (Note E) | | | 2 | | |
Transfer Agency Fees — Class A (Note E) | | | 2 | | |
Transfer Agency Fees — Class C (Note E) | | | 2 | | |
Transfer Agency Fees — Class IS (Note E) | | | 2 | | |
Directors' Fees and Expenses | | | 3 | | |
Shareholder Services Fees — Class A (Note D) | | | — | @ | |
Distribution and Shareholder Services Fees — Class C (Note D) | | | 1 | | |
Sub Transfer Agency Fees — Class I | | | — | @ | |
Sub Transfer Agency Fees — Class A | | | — | @ | |
Sub Transfer Agency Fees — Class C | | | — | @ | |
Other Expenses | | | 24 | | |
Total Expenses | | | 396 | | |
Expenses Reimbursed by Adviser (Note B) | | | (250 | ) | |
Waiver of Advisory Fees (Note B) | | | (61 | ) | |
Reimbursement of Class Specific Expenses — Class A (Note B) | | | (2 | ) | |
Reimbursement of Class Specific Expenses — Class C (Note B) | | | (2 | ) | |
Reimbursement of Class Specific Expenses — Class IS (Note B) | | | (2 | ) | |
Rebate from Morgan Stanley Affiliate (Note G) | | | (1 | ) | |
Net Expenses | | | 78 | | |
Net Investment Income | | | 191 | | |
Realized Gain (Loss): | |
Investments Sold | | | 8 | | |
Foreign Currency Forward Exchange Contracts | | | (1 | ) | |
Foreign Currency Translation | | | (1 | ) | |
Futures Contracts | | | (1 | ) | |
Net Realized Gain | | | 5 | | |
Change in Unrealized Appreciation (Depreciation): | |
Investments | | | 1,478 | | |
Foreign Currency Forward Exchange Contracts | | | 8 | | |
Foreign Currency Translation | | | — | @ | |
Futures Contracts | | | 2 | | |
Net Change in Unrealized Appreciation (Depreciation) | | | 1,488 | | |
Net Realized Gain and Change in Unrealized Appreciation (Depreciation) | | | 1,493 | | |
Net Increase in Net Assets Resulting from Operations | | $ | 1,684 | | |
@ Amount is less than $500.
The accompanying notes are an integral part of the financial statements.
13
Morgan Stanley Institutional Fund, Inc.
Annual Report — December 31, 2019
Statements of Changes in Net Assets | | Year Ended
December 31, 2019
(000) | | Period from
June 18, 2018^ to
December 31, 2018
(000) | |
Increase (Decrease) in Net Assets: | |
Operations: | |
Net Investment Income | | $ | 191 | | | $ | 132 | | |
Net Realized Gain (Loss) | | | 5 | | | | (52 | ) | |
Net Change in Unrealized Appreciation (Depreciation) | | | 1,488 | | | | (739 | ) | |
Net Increase (Decrease) in Net Assets Resulting from Operations | | | 1,684 | | | | (659 | ) | |
Dividends and Distributions to Shareholders: | |
Class I | | | (201 | ) | | | (225 | ) | |
Class A | | | (1 | ) | | | (— | @) | |
Class C | | | (1 | ) | | | (— | @) | |
Class IS | | | (— | @) | | | (— | @) | |
Paid-in-Capital: | |
Class I | | | (3 | ) | | | (56 | ) | |
Class A | | | (— | @) | | | (— | @) | |
Class C | | | (— | @) | | | (— | @) | |
Class IS | | | (— | @) | | | (— | @) | |
Total Dividends and Distributions to Shareholders | | | (206 | ) | | | (281 | ) | |
Capital Share Transactions:(1) | |
Class I: | |
Subscribed | | | 37 | | | | 9,970 | | |
Distributions Reinvested | | | 204 | | | | — | | |
Redeemed | | | (6 | ) | | | — | | |
Class A: | |
Subscribed | | | 130 | | | | 10 | | |
Distributions Reinvested | | | 1 | | | | — | | |
Redeemed | | | (105 | ) | | | — | | |
Class C: | |
Subscribed | | | 153 | | | | 10 | | |
Distributions Reinvested | | | 1 | | | | — | | |
Class IS: | |
Subscribed | | | — | | | | 10 | | |
Distributions Reinvested | | | — | @ | | | — | | |
Net Increase in Net Assets Resulting from Capital Share Transactions | | | 415 | | | | 10,000 | | |
Total Increase in Net Assets | | | 1,893 | | | | 9,060 | | |
Net Assets: | |
Beginning of Period | | | 9,060 | | | | — | | |
End of Period | | $ | 10,953 | | | $ | 9,060 | | |
(1) Capital Share Transactions: | |
Class I: | |
Shares Subscribed | | | 4 | | | | 997 | | |
Shares Issued on Distributions Reinvested | | | 20 | | | | — | | |
Shares Redeemed | | | (1 | ) | | | — | | |
Net Increase in Class I Shares Outstanding | | | 23 | | | | 997 | | |
Class A: | |
Shares Subscribed | | | 13 | | | | 1 | | |
Shares Issued on Distributions Reinvested | | | — | @@ | | | — | | |
Shares Redeemed | | | (10 | ) | | | — | | |
Net Increase in Class A Shares Outstanding | | | 3 | | | | 1 | | |
Class C: | |
Shares Subscribed | | | 15 | | | | 1 | | |
Shares Issued on Distributions Reinvested | | | — | @@ | | | — | | |
Net Increase in Class C Shares Outstanding | | | 15 | | | | 1 | | |
Class IS: | |
Shares Subscribed | | | — | | | | 1 | | |
Shares Issued on Distributions Reinvested | | | — | @@ | | | — | | |
Net Increase in Class C Shares Outstanding | | | — | @@ | | | 1 | | |
^ Commencement of Operations.
@ Amount is less than $500.
@@ Amount is less than 500 shares.
The accompanying notes are an integral part of the financial statements.
14
Morgan Stanley Institutional Fund, Inc.
Annual Report — December 31, 2019
Financial Highlights
Real Assets Portfolio
| | | Class I | |
Selected Per Share Data and Ratios | | Year Ended
December 31, 2019 | | Period from
June 18, 2018(1) to
December 31, 2018 | |
Net Asset Value, Beginning of Period | | $ | 9.06 | | | $ | 10.00 | | |
Income (Loss) from Investment Operations: | |
Net Investment Income(2) | | | 0.19 | | | | 0.13 | | |
Net Realized and Unrealized Gain (Loss) | | | 1.46 | | | | (0.79 | ) | |
Total from Investment Operations | | | 1.65 | | | | (0.66 | ) | |
Distributions from and/or in Excess of: | |
Net Investment Income | | | (0.20 | ) | | | (0.22 | ) | |
Paid-in-Capital | | | (0.00 | )(7) | | | (0.06 | ) | |
Total Distributions | | | (0.20 | ) | | | (0.28 | ) | |
Net Asset Value, End of Period | | $ | 10.51 | | | $ | 9.06 | | |
Total Return(3) | | | 18.35 | % | | | (6.70 | )%(5) | |
Ratios to Average Net Assets and Supplemental Data: | |
Net Assets, End of Period (Thousands) | | $ | 10,728 | | | $ | 9,033 | | |
Ratio of Expenses Before Expense Limitation | | | 3.82 | % | | | 4.76 | %(6) | |
Ratio of Expenses After Expense Limitation | | | 0.76 | %(4) | | | 0.76 | %(4)(6) | |
Ratio of Net Investment Income | | | 1.88 | %(4) | | | 2.52 | %(4)(6) | |
Ratio of Rebate from Morgan Stanley Affiliates | | | 0.01 | % | | | 0.01 | %(6) | |
Portfolio Turnover Rate | | | 65 | % | | | 26 | %(5) | |
(1) Commencement of Operations.
(2) Per share amount is based on average shares outstanding.
(3) Calculated based on the net asset value as of the last business day of the period.
(4) The Ratio of Expenses After Expense Limitation and Ratio of Net Investment Income reflect the rebate of certain Fund expenses in connection with the investments in Morgan Stanley affiliates during the period. The effect of the rebate on the ratios is disclosed in the above table as "Ratio of Rebate from Morgan Stanley Affiliates."
(5) Not annualized.
(6) Annualized.
(7) Amount is less than $0.005 per share.
The accompanying notes are an integral part of the financial statements.
15
Morgan Stanley Institutional Fund, Inc.
Annual Report — December 31, 2019
Financial Highlights
Real Assets Portfolio
| | | Class A | |
Selected Per Share Data and Ratios | | Year Ended
December 31, 2019 | | Period from
June 18, 2018(1) to
December 31, 2018 | |
Net Asset Value, Beginning of Period | | $ | 9.06 | | | $ | 10.00 | | |
Income (Loss) from Investment Operations: | |
Net Investment Income(2) | | | 0.15 | | | | 0.11 | | |
Net Realized and Unrealized Gain (Loss) | | | 1.47 | | | | (0.79 | ) | |
Total from Investment Operations | | | 1.62 | | | | (0.68 | ) | |
Distributions from and/or in Excess of: | |
Net Investment Income | | | (0.15 | ) | | | (0.20 | ) | |
Paid-in-Capital | | | (0.00 | )(7) | | | (0.06 | ) | |
Total Distributions | | | (0.15 | ) | | | (0.26 | ) | |
Net Asset Value, End of Period | | $ | 10.53 | | | $ | 9.06 | | |
Total Return(3) | | | 17.93 | % | | | (6.90 | )%(5) | |
Ratios to Average Net Assets and Supplemental Data: | |
Net Assets, End of Period (Thousands) | | $ | 42 | | | $ | 9 | | |
Ratio of Expenses Before Expense Limitation | | | 7.63 | % | | | 22.79 | %(6) | |
Ratio of Expenses After Expense Limitation | | | 1.14 | %(4) | | | 1.14 | %(4)(6) | |
Ratio of Net Investment Income | | | 1.46 | %(4) | | | 2.18 | %(4)(6) | |
Ratio of Rebate from Morgan Stanley Affiliates | | | 0.01 | % | | | 0.01 | %(6) | |
Portfolio Turnover Rate | | | 65 | % | | | 26 | %(5) | |
(1) Commencement of Operations.
(2) Per share amount is based on average shares outstanding.
(3) Calculated based on the net asset value which does not reflect sales charges, if applicable, as of the last business day of the period.
(4) The Ratio of Expenses After Expense Limitation and Ratio of Net Investment Income reflect the rebate of certain Fund expenses in connection with the investments in Morgan Stanley affiliates during the period. The effect of the rebate on the ratios is disclosed in the above table as "Ratio of Rebate from Morgan Stanley Affiliates."
(5) Not annualized.
(6) Annualized.
(7) Amount is less than $0.005 per share.
The accompanying notes are an integral part of the financial statements.
16
Morgan Stanley Institutional Fund, Inc.
Annual Report — December 31, 2019
Financial Highlights
Real Assets Portfolio
| | | Class C | |
Selected Per Share Data and Ratios | | Year Ended
December 31, 2019 | | Period from
June 18, 2018(1) to
December 31, 2018 | |
Net Asset Value, Beginning of Period | | $ | 9.06 | | | $ | 10.00 | | |
Income (Loss) from Investment Operations: | |
Net Investment Income(2) | | | 0.07 | | | | 0.07 | | |
Net Realized and Unrealized Gain (Loss) | | | 1.48 | | | | (0.79 | ) | |
Total from Investment Operations | | | 1.55 | | | | (0.72 | ) | |
Distributions from and/or in Excess of: | |
Net Investment Income | | | (0.11 | ) | | | (0.16 | ) | |
Paid-in-Capital | | | (0.00 | )(7) | | | (0.06 | ) | |
Total Distributions | | | (0.11 | ) | | | (0.22 | ) | |
Net Asset Value, End of Period | | $ | 10.50 | | | $ | 9.06 | | |
Total Return(3) | | | 17.12 | % | | | (7.27 | )%(5) | |
Ratios to Average Net Assets and Supplemental Data: | |
Net Assets, End of Period (Thousands) | | $ | 172 | | | $ | 9 | | |
Ratio of Expenses Before Expense Limitation | | | 8.50 | % | | | 23.55 | %(6) | |
Ratio of Expenses After Expense Limitation | | | 1.89 | %(4) | | | 1.89 | %(4)(6) | |
Ratio of Net Investment Income | | | 0.68 | %(4) | | | 1.37 | %(4)(6) | |
Ratio of Rebate from Morgan Stanley Affiliates | | | 0.01 | % | | | 0.01 | %(6) | |
Portfolio Turnover Rate | | | 65 | % | | | 26 | %(5) | |
(1) Commencement of Operations.
(2) Per share amount is based on average shares outstanding.
(3) Calculated based on the net asset value which does not reflect sales charges, if applicable, as of the last business day of the period.
(4) The Ratio of Expenses After Expense Limitation and Ratio of Net Investment Income reflect the rebate of certain Fund expenses in connection with the investments in Morgan Stanley affiliates during the period. The effect of the rebate on the ratios is disclosed in the above table as "Ratio of Rebate from Morgan Stanley Affiliates."
(5) Not annualized.
(6) Annualized.
(7) Amount is less than $0.005 per share.
The accompanying notes are an integral part of the financial statements.
17
Morgan Stanley Institutional Fund, Inc.
Annual Report — December 31, 2019
Financial Highlights
Real Assets Portfolio
| | | Class IS | |
Selected Per Share Data and Ratios | | Year Ended
December 31, 2019 | | Period from
June 18, 2018(1) to
December 31, 2018 | |
Net Asset Value, Beginning of Period | | $ | 9.06 | | | $ | 10.00 | | |
Income (Loss) from Investment Operations: | |
Net Investment Income(2) | | | 0.19 | | | | 0.13 | | |
Net Realized and Unrealized Gain (Loss) | | | 1.47 | | | | (0.79 | ) | |
Total from Investment Operations | | | 1.66 | | | | (0.66 | ) | |
Distributions from and/or in Excess of: | |
Net Investment Income | | | (0.21 | ) | | | (0.22 | ) | |
Paid-in-Capital | | | (0.00 | )(7) | | | (0.06 | ) | |
Total Distributions | | | (0.21 | ) | | | (0.28 | ) | |
Net Asset Value, End of Period | | $ | 10.51 | | | $ | 9.06 | | |
Total Return(3) | | | 18.37 | % | | | (6.69 | )%(5) | |
Ratios to Average Net Assets and Supplemental Data: | |
Net Assets, End of Period (Thousands) | | $ | 11 | | | $ | 9 | | |
Ratio of Expenses Before Expense Limitation | | | 22.24 | % | | | 22.53 | %(6) | |
Ratio of Expenses After Expense Limitation | | | 0.74 | %(4) | | | 0.74 | %(4)(6) | |
Ratio of Net Investment Income | | | 1.90 | %(4) | | | 2.53 | %(4)(6) | |
Ratio of Rebate from Morgan Stanley Affiliates | | | 0.01 | % | | | 0.01 | %(6) | |
Portfolio Turnover Rate | | | 65 | % | | | 26 | %(5) | |
(1) Commencement of Operations.
(2) Per share amount is based on average shares outstanding.
(3) Calculated based on the net asset value as of the last business day of the period.
(4) The Ratio of Expenses After Expense Limitation and Ratio of Net Investment Income reflect the rebate of certain Fund expenses in connection with the investments in Morgan Stanley affiliates during the period. The effect of the rebate on the ratios is disclosed in the above table as "Ratio of Rebate from Morgan Stanley Affiliates."
(5) Not annualized.
(6) Annualized.
(7) Amount is less than $0.005 per share.
The accompanying notes are an integral part of the financial statements.
18
Morgan Stanley Institutional Fund, Inc.
Annual Report — December 31, 2019
Notes to Financial Statements
Morgan Stanley Institutional Fund, Inc. (the "Company") is registered under the Investment Company Act of 1940, as amended (the "Act"), as an open-end management investment company. The Company is comprised of thirty-two separate, active, diversified and non-diversified funds (individually referred to as a "Fund," collectively as the "Funds"). The Company applies investment company accounting and reporting guidance.
The accompanying financial statements relate to the Real Assets Portfolio. The Fund seeks total return, targeted to be in excess of inflation, through capital appreciation and current income.
The Fund offers four classes of shares — Class I, Class A, Class C and Class IS.
A. Significant Accounting Policies: The following significant accounting policies are in conformity with U.S. generally accepted accounting principles ("GAAP"). Such policies are consistently followed by the Company in the preparation of its financial statements. GAAP may require management to make estimates and assumptions that affect the reported amounts and disclosures in the financial statements. Actual results may differ from those estimates.
In August 2018, the Financial Accounting Standards Board ("FASB") issued Accounting Standards Update ("ASU") 2018-13, Fair Value Measurement (Topic 820) — Disclosures Framework — Changes to Disclosure Requirements of Fair Value Measurement ("ASU 2018-13") which introduces new fair value disclosure requirements as well as eliminates and modifies certain existing fair value disclosure requirements. ASU 2018-13 would be effective for fiscal years beginning after December 15, 2019 and for interim periods within those fiscal years; however, management has elected to early adopt ASU 2018-13 as permitted by the standard. The impact of the Fund's adoption was limited to changes in the Fund's financial statement disclosures regarding fair value, primarily those disclosures related to transfers between levels of the fair value hierarchy and disclosure of the range and weighted average used to develop significant unobservable inputs for Level 3 fair value measurements, when applicable.
1. Security Valuation: (1) An equity portfolio security listed or traded on an exchange is valued at its latest reported sales price (or at the exchange official closing price if such exchange reports an official closing price), and if there were no sales on a given day and if there is no official exchange closing price for that day, the security is valued at the mean between the last reported bid and asked prices
if such bid and asked prices are available on the relevant exchanges. If only bid prices are available then the latest bid price may be used. Listed equity securities not traded on the valuation date with no reported bid and asked prices available on the exchange are valued at the mean between the current bid and asked prices obtained from one or more reputable brokers or dealers. In cases where a security is traded on more than one exchange, the security is valued on the exchange designated as the primary market; (2) all other equity portfolio securities for which over-the-counter ("OTC") market quotations are readily available are valued at the latest reported sales price (or at the market official closing price if such market reports an official closing price), and if there was no trading in the security on a given day and if there is no official closing price from relevant markets for that day, the security is valued at the mean between the last reported bid and asked prices if such bid and asked prices are available on the relevant markets. An unlisted equity security that does not trade on the valuation date and for which bid and asked prices from the relevant markets are unavailable is valued at the mean between the current bid and asked prices obtained from one or more reputable brokers or dealers; (3) futures are valued at the settlement price on the exchange on which they trade or, if a settlement price is unavailable, at the last sale price on the exchange; (4) certain portfolio securities may be valued by an outside pricing service/vendor approved by the Company's Board of Directors (the "Directors"). The pricing service/vendor may employ a pricing model that takes into account, among other things, bids, yield spreads and/or other market data and specific security characteristics. Alternatively, if a valuation is not available from an outside pricing service/vendor, and the security trades on an exchange, the security may be valued at its latest reported sale price (or at the exchange official closing price if such exchange reports an official closing price), prior to the time when assets are valued. If there are no sales on a given day and if there is no official exchange closing price for that day, the security is valued at the mean between the last reported bid and asked prices if such bid and asked prices are available in the relevant exchanges. If Morgan Stanley Investment Management Inc. (the "Adviser") or Morgan Stanley Investment Management Limited ("MSIM Limited") and Morgan Stanley Investment Management Company ("MSIM Company") (together, the "Sub-Advisers"), (effective April 30, 2019), MSIM Company is no longer Sub-Adviser to the Fund, each a wholly-owned subsidiary
19
Morgan Stanley Institutional Fund, Inc.
Annual Report — December 31, 2019
Notes to Financial Statements (cont'd)
of Morgan Stanley, determines that the price provided by the outside pricing service/vendor or exchange does not reflect the security's fair value or is unable to provide a price, prices from brokers or dealers may also be utilized. In these circumstances, the value of the security will be the mean of bid and asked prices obtained from brokers or dealers; (5) when market quotations are not readily available, including circumstances under which the Adviser or Sub-Advisers determine that the closing price, last sale price or the mean between the last reported bid and asked prices are not reflective of a security's market value, portfolio securities are valued at their fair value as determined in good faith under procedures established by and under the general supervision of the Directors. Occasionally, developments affecting the closing prices of securities and other assets may occur between the times at which valuations of such securities are determined (that is, close of the foreign market on which the securities trade) and the close of business of the New York Stock Exchange ("NYSE"). If developments occur during such periods that are expected to materially affect the value of such securities, such valuations may be adjusted to reflect the estimated fair value of such securities as of the close of the NYSE, as determined in good faith by the Directors or by the Adviser using a pricing service and/or procedures approved by the Directors; (6) quotations of foreign portfolio securities, other assets and liabilities and forward contracts stated in foreign currency are translated into U.S. dollar equivalents at the prevailing market rates prior to the close of the NYSE; and (7) investments in mutual funds, including the Morgan Stanley Institutional Liquidity Funds, are valued at the net asset value ("NAV") as of the close of each business day.
The Directors have responsibility for determining in good faith the fair value of the investments, and the Directors may appoint others, such as the Company's Adviser or a valuation committee, to assist the Directors in determining fair value and to make the actual calculations pursuant to the fair valuation methodologies previously approved by the Directors. Under procedures approved by the Directors, the Company's Adviser has formed a Valuation Committee whose members are approved by the Directors. The Valuation Committee provides administration and oversight of the Company's valuation policies and procedures, which are reviewed at least annually by the Directors. These procedures allow the Company to utilize independent pricing services, quotations from securities and financial instrument dealers and other market sources to determine fair value.
The Fund invests a significant portion of its assets in securities of real estate investment trusts ("REITs"). The market's perception of prospective declines in private real estate values and other financial assets may result in increased volatility of market prices that can negatively impact the valuation of certain issuers held by the Fund.
2. Fair Value Measurement: FASB Accounting Standards CodificationTM ("ASC") 820, "Fair Value Measurement" ("ASC 820"), defines fair value as the value that the Fund would receive to sell an investment or pay to transfer a liability in a timely transaction with an independent buyer in the principal market, or in the absence of a principal market, the most advantageous market for the investment or liability. ASC 820 establishes a three-tier hierarchy to distinguish between (1) inputs that reflect the assumptions market participants would use in valuing an asset or liability developed based on market data obtained from sources independent of the reporting entity (observable inputs) and (2) inputs that reflect the reporting entity's own assumptions about the assumptions market participants would use in valuing an asset or liability developed based on the best information available in the circumstances (unobservable inputs) and to establish classification of fair value measurements for disclosure purposes. Various inputs are used in determining the value of the Fund's investments. The inputs are summarized in the three broad levels listed below:
• Level 1 – unadjusted quoted prices in active markets for identical investments
• Level 2 – other significant observable inputs (including quoted prices for similar investments, interest rates, prepayment speeds, credit risk, etc.)
• Level 3 – significant unobservable inputs including the Fund's own assumptions in determining the fair value of investments. Factors considered in making this determination may include, but are not limited to, information obtained by contacting the issuer, analysts, or the appropriate stock exchange (for exchange-traded securities), analysis of the issuer's financial statements or other available documents and, if necessary, available information concerning other securities in similar circumstances.
The inputs or methodology used for valuing securities are not necessarily an indication of the risk associated
20
Morgan Stanley Institutional Fund, Inc.
Annual Report — December 31, 2019
Notes to Financial Statements (cont'd)
with investing in those securities and the determination of the significance of a particular input to the fair value measurement in its entirety requires judgment and considers factors specific to each security.
The following is a summary of the inputs used to value the Fund's investments as of December 31, 2019:
Investment Type | | Level 1
Unadjusted
quoted
prices
(000) | | Level 2
Other
significant
observable
inputs
(000) | | Level 3
Significant
unobservable
inputs
(000) | | Total
(000) | |
Assets: | |
Common Stocks | |
Aerospace & Defense | | $ | 25 | | | $ | — | | | $ | — | | | $ | 25 | | |
Auto Components | | | — | | | | 38 | | | | — | | | | 38 | | |
Banks | | | 256 | | | | 57 | | | | — | | | | 313 | | |
Beverages | | | 78 | | | | 30 | | | | — | | | | 108 | | |
Biotechnology | | | 36 | | | | — | | | | — | | | | 36 | | |
Capital Markets | | | 20 | | | | 24 | | | | — | | | | 44 | | |
Chemicals | | | 72 | | | | 23 | | | | — | | | | 95 | | |
Commercial Services &
Supplies | | | 39 | | | | — | | | | — | | | | 39 | | |
Communications
Equipment | | | 15 | | | | — | | | | — | | | | 15 | | |
Construction &
Engineering | | | 147 | | | | — | | | | — | | | | 147 | | |
Consumer Finance | | | 60 | | | | — | | | | — | | | | 60 | | |
Distributors | | | 23 | | | | — | | | | — | | | | 23 | | |
Diversified
Telecommunication
Services | | | 87 | | | | 28 | | | | — | | | | 115 | | |
Electric Utilities | | | 178 | | | | 34 | | | | — | | | | 212 | | |
Electronic Equipment,
Instruments &
Components | | | 20 | | | | — | | | | — | | | | 20 | | |
Entertainment | | | 46 | | | | — | | | | — | | | | 46 | | |
Equity Real Estate
Investment
Trusts (REITs) | | | 2,220 | | | | 20 | | | | — | | | | 2,240 | | |
Food & Staples Retailing | | | 39 | | | | 21 | | | | — | | | | 60 | | |
Food Products | | | 28 | | | | 48 | | | | — | | | | 76 | | |
Gas Utilities | | | 187 | | | | 42 | | | | — | | | | 229 | | |
Health Care Equipment &
Supplies | | | 74 | | | | — | | | | — | | | | 74 | | |
Health Care Providers &
Services | | | 46 | | | | — | | | | — | | | | 46 | | |
Household Durables | | | 33 | | | | — | | | | — | | | | 33 | | |
Household Products | | | 28 | | | | — | | | | — | | | | 28 | | |
Independent Power &
Renewable Electricity
Producers | | | 119 | | | | — | | | | — | | | | 119 | | |
Industrial Conglomerates | | | 25 | | | | 24 | | | | — | | | | 49 | | |
Information Technology
Services | | | 76 | | | | — | | | | — | | | | 76 | | |
Insurance | | | 103 | | | | — | | | | — | | | | 103 | | |
Interactive Media &
Services | | | 97 | | | | — | | | | — | | | | 97 | | |
Internet & Direct
Marketing Retail | | | 54 | | | | — | | | | — | | | | 54 | | |
Life Sciences Tools &
Services | | | 49 | | | | — | | | | — | | | | 49 | | |
Machinery | | | 82 | | | | — | | | | — | | | | 82 | | |
Media | | | 22 | | | | — | | | | — | | | | 22 | | |
Metals & Mining | | | 42 | | | | — | | | | — | | | | 42 | | |
Multi-Line Retail | | | 2 | | | | — | | | | — | | | | 2 | | |
Investment Type | | Level 1
Unadjusted
quoted
prices
(000) | | Level 2
Other
significant
observable
inputs
(000) | | Level 3
Significant
unobservable
inputs
(000) | | Total
(000) | |
Common Stocks (cont'd) | |
Multi-Utilities | | $ | 333 | | | $ | — | | | $ | — | | | $ | 333 | | |
Oil, Gas &
Consumable Fuels | | | 675 | | | | 25 | | | | — | | | | 700 | | |
Personal Products | | | — | | | | 17 | | | | — | | | | 17 | | |
Pharmaceuticals | | | 120 | | | | 52 | | | | — | | | | 172 | | |
Real Estate Management &
Development | | | 436 | | | | 191 | | | | — | | | | 627 | | |
Road & Rail | | | 50 | | | | — | | | | — | | | | 50 | | |
Semiconductors &
Semiconductor
Equipment | | | 73 | | | | — | | | | — | | | | 73 | | |
Software | | | 189 | | | | 20 | | | | — | | | | 209 | | |
Specialty Retail | | | 23 | | | | — | | | | — | | | | 23 | | |
Tech Hardware, Storage &
Peripherals | | | 94 | | | | — | | | | — | | | | 94 | | |
Trading Companies &
Distributors | | | — | | | | 84 | | | | — | | | | 84 | | |
Transportation
Infrastructure | | | 356 | | | | 55 | | | | — | | | | 411 | | |
Water Utilities | | | 155 | | | | — | | | | — | | | | 155 | | |
Total Common Stocks | | | 6,932 | | | | 833 | | | | — | | | | 7,765 | | |
Rights | | | 1 | | | | — | | | | — | | | | 1 | | |
U.S. Treasury Securities | | | — | | | | 2,846 | | | | — | | | | 2,846 | | |
Short-Term Investment | |
Investment Company | | | 442 | | | | — | | | | — | | | | 442 | | |
Futures Contracts | | | 2 | | | | — | | | | — | | | | 2 | | |
Total Assets | | $ | 7,377 | | | $ | 3,679 | | | $ | — | | | $ | 11,056 | | |
Transfers between investment levels may occur as the markets fluctuate and/or the availability of data used in an investment's valuation changes.
3. Foreign Currency Translation and Foreign Investments: The books and records of the Fund are maintained in U.S. dollars. Foreign currency amounts are translated into U.S. dollars as follows:
– investments, other assets and liabilities at the prevailing rate of exchange on the valuation date;
– investment transactions and investment income at the prevailing rates of exchange on the dates of such transactions.
Although the net assets of the Fund are presented at the foreign exchange rates and market values at the close of the period, the Fund does not isolate that portion of the results of operations arising as a result of changes in the foreign exchange rates from the fluctuations arising from changes in the market prices of securities held at period end. Similarly, the Fund does not isolate the effect of changes in foreign exchange rates from the fluctuations arising from changes in the market prices of
21
Morgan Stanley Institutional Fund, Inc.
Annual Report — December 31, 2019
Notes to Financial Statements (cont'd)
securities sold during the period. Accordingly, realized and unrealized foreign currency gains (losses) on investments in securities are included in the reported net realized and unrealized gains (losses) on investment transactions and balances. However, pursuant to U.S. federal income tax regulations, gains and losses from certain foreign currency transactions and the foreign currency portion of gains and losses realized on sales and maturities of foreign denominated debt securities are treated as ordinary income for U.S. federal income tax purposes.
Net realized gains (losses) on foreign currency transactions represent net foreign exchange gains (losses) from foreign currency forward exchange contracts, disposition of foreign currencies, currency gains (losses) realized between the trade and settlement dates on securities transactions, and the difference between the amount of investment income and foreign withholding taxes recorded on the Fund's books and the U.S. dollar equivalent amounts actually received or paid. The change in unrealized currency gains (losses) on foreign currency transactions for the period is reflected in the Statement of Operations.
Foreign security and currency transactions may involve certain considerations and risks not typically associated with those of U.S. dollar denominated transactions as a result of, among other factors, fluctuations of exchange rates in relation to the U.S. dollar, the possibility of lower levels of governmental supervision and regulation of foreign securities markets and the possibility of political or economic instability.
Governmental approval for foreign investments may be required in advance of making an investment under certain circumstances in some countries, and the extent of foreign investments in domestic companies may be subject to limitation in other countries. Foreign ownership limitations also may be imposed by the charters of individual companies to prevent, among other concerns, violations of foreign investment limitations. As a result, an additional class of shares (identified as "Foreign" in the Portfolio of Investments) may be created and offered for investment. The "local" and "foreign shares" market values may differ. In the absence of trading of the foreign shares in such markets, the Fund values the foreign shares at the closing exchange price of the local shares.
4. Treasury Inflation-Protected Securities: The Fund may invest in Treasury Inflation-Protected Securities ("TIPS"), including structured bonds in which the principal amount is adjusted daily to keep pace with inflation, as measured by the U.S. Consumer Pricing Index for Urban Consumers. The adjustments to principal due to inflation/deflation are reflected as increases/decreases to interest income with a corresponding adjustment to cost. Such adjustments may have a significant impact on the Fund's distributions and may result in a return of capital to shareholders. The repayment of the original bond principal upon maturity is guaranteed by the full faith and credit of the U.S. Government.
5. Derivatives: The Fund may, but is not required to, use derivative instruments for a variety of purposes, including hedging, risk management, portfolio management or to earn income. Derivatives are financial instruments whose value is based, in part, on the value of an underlying asset, interest rate, index or financial instrument. Prevailing interest rates and volatility levels, among other things, also affect the value of derivative instruments. A derivative instrument often has risks similar to its underlying asset and may have additional risks, including imperfect correlation between the value of the derivative and the underlying asset, risks of default by the counterparty to certain transactions, magnification of losses incurred due to changes in the market value of the securities, instruments, indices or interest rates to which the derivative instrument relates, risks that the transactions may not be liquid and risks arising from margin requirements. The use of derivatives involves risks that are different from, and possibly greater than, the risks associated with other portfolio investments. Derivatives may involve the use of highly specialized instruments that require investment techniques and risk analyses different from those associated with other portfolio investments. All of the Fund's holdings, including derivative instruments, are marked-to-market each day with the change in value reflected in unrealized appreciation (depreciation). Upon disposition, a realized gain or loss is recognized.
Certain derivative transactions may give rise to a form of leverage. Leverage magnifies the potential for gain and the risk of loss. Leverage associated with derivative transactions may cause the Fund to liquidate portfolio positions when it may not be advantageous to do so to satisfy its obligations or to meet earmarking or segregation requirements, pursuant to applicable Securities and
22
Morgan Stanley Institutional Fund, Inc.
Annual Report — December 31, 2019
Notes to Financial Statements (cont'd)
Exchange Commission rules and regulations, or may cause the Fund to be more volatile than if the Fund had not been leveraged. Although the Adviser and/or Sub-Advisers seek to use derivatives to further the Fund's investment objectives, there is no assurance that the use of derivatives will achieve this result.
Following is a description of the derivative instruments and techniques that the Fund used during the period and their associated risks:
Foreign Currency Forward Exchange Contracts: In connection with its investments in foreign securities, the Fund also entered into contracts with banks, brokers or dealers to purchase or sell securities or foreign currencies at a future date. A foreign currency forward exchange contract ("currency contract") is a negotiated agreement between the contracting parties to exchange a specified amount of currency at a specified future time at a specified rate. The rate can be higher or lower than the spot rate between the currencies that are the subject of the contract. Currency contracts may be used to protect against uncertainty in the level of future foreign currency exchange rates or to gain or modify exposure to a particular currency. To the extent hedged by the use of currency contracts, the precise matching of the currency contract amounts and the value of the securities involved will not generally be possible because the future value of such securities in foreign currencies will change as a consequence of market movements in the value of those securities between the date on which the contract is entered into and the date it matures. Furthermore, such transactions may reduce or preclude the opportunity for gain if the value of the currency should move in the direction opposite to the position taken. There is additional risk to the extent that currency contracts create exposure to currencies in which the Fund's securities are not denominated. Unanticipated changes in currency prices may result in poorer overall performance for the Fund than if it had not entered into such contracts. The use of currency contracts involves the risk of loss from the insolvency or bankruptcy of the counterparty to the contract or the failure of the counterparty to make payments or otherwise comply with the terms of the contract. A currency contract is marked-to-market daily and the change in market value is recorded by the Fund as unrealized gain or loss. The Fund records realized gains (losses) when the currency contract is closed equal to the difference between the value of the currency contract at
the time it was opened and the value at the time it was closed.
As of December 31, 2019, the Fund did not have any open foreign currency forward exchange contracts.
Futures: A futures contract is a standardized, exchange-traded agreement to buy or sell a specific quantity of an underlying asset, reference rate or index at a specific price at a specific future time. The value of a futures contract tends to increase and decrease in tandem with the value of the underlying instrument. Depending on the terms of the particular contract, futures contracts are settled through either physical delivery of the underlying instrument on the settlement date or by payment of a cash settlement amount on the settlement date. During the period the futures contract is open, payments are received from or made to the broker based upon changes in the value of the contract (the variation margin). A decision as to whether, when and how to use futures contracts involves the exercise of skill and judgment and even a well-conceived futures transaction may be unsuccessful because of market behavior or unexpected events. In addition to the derivatives risks discussed above, the prices of futures contracts can be highly volatile, using futures contracts can lower total return and the potential loss from futures contracts can exceed the Fund's initial investment in such contracts. No assurance can be given that a liquid market will exist for any particular futures contract at any particular time. There is also the risk of loss by the Fund of margin deposits in the event of bankruptcy of a broker with which the Fund has open positions in the futures contract.
FASB ASC 815, "Derivatives and Hedging" ("ASC 815") is intended to improve financial reporting about derivative instruments by requiring enhanced disclosures to enable investors to better understand how and why the Funds use derivative instruments, how these derivative instruments are accounted for and their effects on a Fund's financial position and results of operations.
The following table sets forth the fair value of the Fund's derivative contracts by primary risk exposure as of December 31, 2019:
| | | Asset Derivatives
Statement of Assets and
Liabilities Location | | Primary Risk
Exposure | | Value
(000) | |
Futures Contracts | | Variation Margin on
Futures Contracts | | Interest Rate Risk | | | 2 | (a) | |
(a) This amount represents the cumulative appreciation (depreciation) as reported in the Portfolio of Investments. The Statement of Assets and Liabilities only reflects the current day's net variation margin.
23
Morgan Stanley Institutional Fund, Inc.
Annual Report — December 31, 2019
Notes to Financial Statements (cont'd)
The following tables set forth by primary risk exposure the Fund's realized gain(loss) and change in unrealized appreciation (depreciation) by type of derivative contract for the period ended December 31, 2019 in accordance with ASC 815:
Realized Gain (Loss) | |
Primary Risk Exposure | | Derivative Type | | Value
(000) | |
Currency Risk | | Foreign Currency
Forward Exchange Contracts | | $ | (1 | ) | |
Interest Rate Risk | | Futures Contracts | | | (1 | ) | |
| | | Total | | $ | (2 | ) | |
Change in Unrealized Appreciation (Depreciation) | |
Primary Risk Exposure | | Derivative Type | | Value
(000) | |
Currency Risk | | Foreign Currency
Forward Exchange Contract | | $ | 8 | | |
Interest Rate Risk | | Futures Contracts | | | 2 | | |
| | | Total | | $ | 10 | | |
For the period ended December 31, 2019, the approximate average monthly amount outstanding for each derivative type is as follows:
Foreign Currency Forward Exchange Contracts: | |
Average monthly principal amount | | $ | 928,000 | | |
Futures Contracts: | |
Average monthly notional value | | $ | 35,000 | | |
6. Indemnifications: The Company enters into contracts that contain a variety of indemnifications. The Company's maximum exposure under these arrangements is unknown. However, the Company has not had prior claims or losses pursuant to these contracts and expects the risk of loss to be remote.
7. Dividends and Distributions to Shareholders: Dividends and distributions to shareholders are recorded on the ex-dividend date. Dividends from net investment income, if any, are declared and paid quarterly. Net realized capital gains, if any, are distributed at least annually.
8. Security Transactions, Income and Expenses: Security transactions are accounted for on the trade date (date the order to buy or sell is executed). Realized gains and losses on the sale of investment securities are determined on the specific identified cost method. Dividend income and other distributions are recorded on the ex-dividend date (except for certain foreign dividends which may be recorded as soon as the Fund is informed of such dividends) net of applicable withholding taxes. Non-cash dividends received in the form of stock, if any, are recognized on the ex-dividend date and recorded as non-cash dividend income at fair value. Interest income is
recognized on the accrual basis except where collection is in doubt. Discounts are accreted and premiums are amortized over the life of the respective securities. Most expenses of the Company can be directly attributed to a particular Fund. Expenses which cannot be directly attributed are apportioned among the Funds based upon relative net assets or other appropriate methods. Income, expenses (other than class specific expenses — distribution and shareholder services, transfer agency and sub transfer agency fees) and realized and unrealized gains or losses are allocated to each class of shares based upon their relative net assets.
The Fund owns shares of REITs which report information on the source of their distributions annually in the following calendar year. A portion of distributions received from REITs during the year is estimated to be a return of capital and is recorded as a reduction of their cost.
B. Advisory/Sub-Advisory Fees: The Adviser, a wholly-owned subsidiary of Morgan Stanley, provides the Fund with advisory services under the terms of an Investment Advisory Agreement, paid quarterly, at the annual rate based on the daily net assets as follows:
First $1
billion | | Over $1
billion | |
| | 0.60 | % | | | 0.55 | % | |
For the year ended December 31, 2019, the advisory fee rate (net of waiver/rebate) was equivalent to an annual effective rate of 0.00% of the Fund's average daily net assets.
The Adviser has agreed to reduce its advisory fee and/or reimburse the Fund so that total annual Fund operating expenses, excluding certain investment related expenses, taxes, interest and other extraordinary expenses (including litigation), will not exceed 0.80% for Class I shares, 1.15% for Class A shares, 1.90% for Class C shares and 0.75% for Class IS shares. The fee waivers and/or expense reimbursements will continue for at least one year from the date of the Fund's prospectus or until such time that the Directors act to discontinue all or a portion of such waivers or reimbursements when they deem such action is appropriate. For the year ended December 31, 2019, approximately $61,000 of advisory fees were waived and approximately $256,000 of other expenses were reimbursed by the Adviser pursuant to this arrangement.
The Adviser has entered into Sub-Advisory Agreements with the Sub-Advisers, each a wholly-owned subsidiary of Morgan Stanley. The Sub-Advisers provide the Fund with advisory
24
Morgan Stanley Institutional Fund, Inc.
Annual Report — December 31, 2019
Notes to Financial Statements (cont'd)
services subject to the overall supervision of the Adviser and the Company's Officers and Directors. The Adviser pays the Sub-Advisers on a monthly basis a portion of the net advisory fees the Adviser receives from the Fund.
Effective April 30, 2019, MSIM Company is no longer Sub-Adviser to the Fund.
C. Administration Fees: The Adviser also serves as Administrator to the Company and provides administrative services pursuant to an Administration Agreement for an annual fee, accrued daily and paid monthly, of 0.08% of the Fund's average daily net assets.
Under a Sub-Administration Agreement between the Administrator and State Street Bank and Trust Company ("State Street"), State Street provides certain administrative services to the Company. For such services, the Administrator pays State Street a portion of the fee the Administrator receives from the Fund.
D. Distribution and Shareholder Services Fees: Morgan Stanley Distribution, Inc. ("MSDI" or the "Distributor"), a wholly-owned subsidiary of the Adviser and an indirect subsidiary of Morgan Stanley, serves as the Company's Distributor of Fund shares pursuant to a Distribution Agreement. The Company has adopted a Shareholder Services Plan with respect to Class A shares pursuant to Rule 12b-1 under the Act. Under the Shareholder Services Plan, the Fund pays the Distributor a shareholder services fee, accrued daily and paid monthly, at an annual rate of 0.25% of the Fund's average daily net assets attributable to Class A shares.
The Company has adopted a Distribution and Shareholder Services Plan with respect to Class C shares pursuant to Rule 12b-1 under the Act. Under the Distribution and Shareholder Services Plan, the Fund pays the Distributor a distribution fee, accrued daily and paid monthly, at an annual rate of 0.75% and a shareholder services fee, accrued daily and paid monthly, at an annual rate of 0.25% of the Fund's average daily net assets attributable to Class C shares.
The distribution and shareholder services fees are used to support the expenses associated with servicing and maintaining accounts. The Distributor may compensate other parties for providing shareholder support services to investors who purchase Class A and Class C shares.
E. Dividend Disbursing and Transfer Agent: The Company's dividend disbursing and transfer agent is DST Asset Manager Solutions, Inc. ("DST"). Pursuant to a Transfer
Agency Agreement, the Company pays DST a fee based on the number of classes, accounts and transactions relating to the Funds of the Company.
F. Custodian Fees: State Street (the "Custodian") also serves as Custodian for the Company in accordance with a Custodian Agreement. The Custodian holds cash, securities and other assets of the Company as required by the Act. Custody fees are payable monthly based on assets held in custody, investment purchases and sales activity and account maintenance fees, plus reimbursement for certain out-of-pocket expenses.
G. Security Transactions and Transactions with Affiliates: For the year ended December 31, 2019, purchases and sales of investment securities for the Fund, other than long-term U.S. Government securities and short-term investments were approximately $3,881,000 and $5,204,000, respectively. For the year ended December 31, 2019, purchases and sales of long-term U.S. Government securities were approximately $3,008,000 and $1,310,000, respectively.
The Fund invests in the Institutional Class of the Morgan Stanley Institutional Liquidity Funds — Treasury Portfolio (the "Liquidity Funds"), an open-end management investment company managed by the Adviser. Advisory fees paid by the Fund are reduced by an amount equal to its pro-rata share of the advisory and administration fees paid by the Fund due to its investment in the Liquidity Funds. For the year ended December 31, 2019, advisory fees paid were reduced by approximately $1,000 relating to the Fund's investment in the Liquidity Funds.
A summary of the Fund's transactions in shares of affiliated investments during the year ended December 31, 2019 is as follows:
Affiliated
Investment
Company | | Value
December 31,
2018
(000) | | Purchases
at Cost
(000) | | Proceeds
from Sales
(000) | | Dividend
Income
(000) | |
Liquidity Funds | | $ | 307 | | | $ | 2,291 | | | $ | 2,156 | | | $ | 8 | | |
Affiliated
Investment
Company (cont'd) | | Realized
Gain (Loss)
(000) | | Change in
Unrealized
Appreciation
(Depreciation)
(000) | | Value
December 31,
2019
(000) | |
Liquidity Funds | | $ | — | | | $ | — | | | $ | 442 | | |
The Fund is permitted to purchase and sell securities ("cross-trade") from and to other Morgan Stanley funds as well as other funds and client accounts for which the Adviser or an affiliate of the Adviser serves as investment adviser, pursuant to procedures approved by the Directors in compliance with
25
Morgan Stanley Institutional Fund, Inc.
Annual Report — December 31, 2019
Notes to Financial Statements (cont'd)
Rule 17a-7 under the Act (the "Rule"). Each cross-trade is executed at the current market price in compliance with provisions of the Rule. For the year ended December 31, 2019, the Fund did not engage in any cross-trade transactions.
The Fund has an unfunded Deferred Compensation Plan (the "Compensation Plan"), which allows each independent Director to defer payment of all, or a portion, of the fees he or she receives for serving on the Board of Directors. Each eligible Director generally may elect to have the deferred amounts credited with a return equal to the total return on one or more of the Morgan Stanley funds that are offered as investment options under the Compensation Plan. Appreciation/depreciation and distributions received from these investments are recorded with an offsetting increase/decrease in the deferred compensation obligation and do not affect the NAV of the Fund.
H. Federal Income Taxes: It is the Fund's intention to continue to qualify as a regulated investment company and distribute all of its taxable and tax-exempt income. Accordingly, no provision for federal income taxes is required in the financial statements.
The Fund may be subject to taxes imposed by countries in which it invests. Such taxes are generally based on income and/or capital gains earned or repatriated. Taxes are accrued based on net investment income, net realized gains and net unrealized appreciation as such income and/or gains are earned. Taxes may also be based on transactions in foreign currency and are accrued based on the value of investments denominated in such currency.
FASB ASC 740-10, "Income Taxes — Overall", sets forth a minimum threshold for financial statement recognition of the benefit of a tax position taken or expected to be taken in a tax return. Management has concluded there are no significant uncertain tax positions that would require recognition in the financial statements. If applicable, the Fund recognizes interest accrued related to unrecognized tax benefits in "Interest Expense" and penalties in "Other Expenses" in the Statement of Operations. The Fund files tax returns with the U.S. Internal Revenue Service, New York and various states. Each of the tax years in the two-year period ended December 31, 2019 remains subject to examination by taxing authorities.
The tax character of distributions paid may differ from the character of distributions shown for GAAP purposes due to short-term capital gains being treated as ordinary income for
tax purposes. The tax character of distributions paid during fiscal years 2019 and 2018 was as follows:
2019
Distributions
Paid From: | | 2018
Distributions
Paid From: | |
Ordinary
Income
(000) | | Paid-in-
Capital
(000) | | Ordinary
Income
(000) | | Paid-in-
Capital
(000) | |
| $ | 203 | | | $ | 3 | | | $ | 225 | | | $ | 56 | | |
The amount and character of income and gains to be distributed are determined in accordance with income tax regulations which may differ from GAAP. These book/tax differences are either considered temporary or permanent in nature.
Temporary differences are attributable to differing book and tax treatments for the timing of the recognition of gains (losses) on certain investment transactions and the timing of the deductibility of certain expenses.
Permanent differences, primarily due to tax adjustments related to real estate investment trusts, resulted in the following reclassifications among the components of net assets at December 31, 2019:
Total
Distributable
Earnings
(000) | | Paid-in
Capital
(000) | |
| $ | 21 | | | $ | (21 | ) | |
At December 31, 2019, the Fund had no distributable earnings on a tax basis.
At December 31, 2019, the Fund had available for federal income tax purposes unused short-term capital losses of approximately $21,000 that do not have an expiration date.
To the extent that capital loss carryforwards are used to offset any future capital gains realized, no capital gains tax liability will be incurred by the Fund for gains realized and not distributed. To the extent that capital gains are offset, such gains will not be distributed to the shareholders. During the year ended December 31, 2019, the Fund utilized capital loss carryforwards for U.S. federal income tax purposes of approximately $26,000.
Qualified late year losses are capital losses and specified ordinary losses, including currency losses, incurred after October 31 but within the taxable year that, if elected, are deemed to arise on the first day of the Fund's next taxable year. For the year ended December 31, 2019, the Fund intends to defer to January 1, 2020 for U.S. federal income tax purposes the following losses:
Qualified
Late Year
Ordinary
Losses
(000) | | Post-October
Capital
Losses
(000) | |
| $ | 4 | | | | — | | |
26
Morgan Stanley Institutional Fund, Inc.
Annual Report — December 31, 2019
Notes to Financial Statements (cont'd)
I. Credit Facility: The Company and other Morgan Stanley funds participated in a $150,000,000 committed, unsecured revolving line of credit facility (the "Facility") with State Street. Effective April 22, 2019, the committed line amount increased to $300,000,000. This Facility is to be used for temporary emergency purposes or funding of shareholder redemption requests. The interest rate on borrowings is based on the federal funds rate or 1 month LIBOR rate plus a spread. The Facility also has a commitment fee of 0.25% per annum based on the unused portion of the Facility. During the year ended December 31, 2019, the Fund did not have any borrowings under the Facility.
J. Other: At December 31, 2019, the Fund did not have record owners of 10% or greater.
K. Accounting Pronouncement: In March 2017, FASB issued an Accounting Standard Update, ASU 2017-08, Receivables-Nonrefundable Fees and Other Costs (Subtopic 310-20), Premium Amortization on Purchased Callable Debt Securities ("ASU 2017-08") which amends the amortization period for certain purchased callable debt securities held at a premium, shortening such period to the earliest call date. ASU 2017-08 does not require any accounting change for debt securities held at a discount; the discount continues to be accreted to maturity. ASU 2017-08 is effective for fiscal years, and interim periods within those fiscal years, beginning after December 15, 2018. The Fund has adopted ASU 2017-08 as of December 31, 2019 and it did not have an impact on the Fund's financial statements.
27
Morgan Stanley Institutional Fund, Inc.
Annual Report — December 31, 2019
Report of Independent Registered Public Accounting Firm
To the Shareholders and Board of Directors of
Morgan Stanley Institutional Fund, Inc. —
Real Assets Portfolio
Opinion on the Financial Statements
We have audited the accompanying statement of assets and liabilities of Real Assets Portfolio (the "Fund") (one of the funds constituting Morgan Stanley Institutional Fund, Inc. (the "Company")), including the portfolio of investments, as of December 31, 2019, and the related statement of operations for the year then ended, the statements of changes in net assets and the financial highlights for the year then ended and the period from June 18, 2018 (commencement of operations) through December 31, 2018, and the related notes (collectively referred to as the "financial statements"). In our opinion, the financial statements present fairly, in all material respects, the financial position of Real Assets Portfolio (one of the funds constituting Morgan Stanley Institutional Fund, Inc.) at December 31, 2019, the results of its operations for the year then ended and the changes in its net assets and its financial highlights for the year then ended and the period from June 18, 2018 (commencement of operations) through December 31, 2018, in conformity with U.S. generally accepted accounting principles.
Basis for Opinion
These financial statements are the responsibility of the Company's management. Our responsibility is to express an opinion on the Fund's financial statements based on our audits. We are a public accounting firm registered with the Public Company Accounting Oversight Board (United States) ("PCAOB") and are required to be independent with respect to the Company in accordance with the U.S. federal securities law and the applicable rules and regulations of the Securities and Exchange Commission and the PCAOB.
We conducted our audits in accordance with the standards of the PCAOB. Those standards require that we plan and perform the audit to obtain reasonable assurance about whether the financial statements are free of material misstatement, whether due to error or fraud. The Company is not required to have, nor were we engaged to perform, an audit of the Company's internal control over financial reporting. As part of our audits, we are required to obtain an understanding of internal control over financial reporting, but not for the purpose of expressing an opinion on the effectiveness of the Company's internal control over financial reporting. Accordingly, we express no such opinion.
Our audits included performing procedures to assess the risks of material misstatement of the financial statements, whether due to error or fraud, and performing procedures that respond to those risks. Such procedures included examining, on a test basis, evidence regarding the amounts and disclosures in the financial statements. Our procedures included confirmation of securities owned as of December 31, 2019 by correspondence with the custodian and others or by other appropriate auditing procedures where replies from others were not received. Our audits also included evaluating the accounting principles used and significant estimates made by management, as well as evaluating the overall presentation of the financial statements. We believe that our audits provide a reasonable basis for our opinion.

We have served as the auditor of one or more Morgan Stanley investment companies since 2000.
Boston, Massachusetts
February 27, 2020
28
Morgan Stanley Institutional Fund, Inc.
Annual Report — December 31, 2019
Federal Tax Notice (unaudited)
For federal income tax purposes, the following information is furnished with respect to the distributions paid by the Fund during its taxable year ended December 31, 2019. For corporate shareholders 23.46% of the dividends qualified for the dividends received deduction.
For federal income tax purposes, the following information is furnished with respect to the Fund's earnings for its taxable year ended December 31, 2019. When distributed, certain earnings may be subject to a maximum tax rate of 15% as provided for by the Jobs and Growth Tax Relief Reconciliation Act of 2003. The Fund designated up to a maximum of approximately $161,000 as taxable at this lower rate.
In January, the Fund provides tax information to shareholders for the preceding calendar year.
29
Privacy Notice (unaudited) April 2019
FACTS | | WHAT DOES MSIM DO WITH YOUR PERSONAL INFORMATION? | |
Why? | | Financial companies choose how they share your personal information. Federal law gives consumers the right to limit some but not all sharing. Federal law also requires us to tell you how we collect, share, and protect your personal information. Please read this notice carefully to understand what we do. | |
What? | | The types of personal information we collect and share depend on the product or service you have with us. This information can include:
n Social Security number and income
n investment experience and risk tolerance
n checking account number and wire transfer instructions | |
How? | | All financial companies need to share customers' personal information to run their everyday business. In the section below, we list the reasons financial companies can share their customers' personal information; the reasons MSIM chooses to share; and whether you can limit this sharing. | |
Reasons we can share your personal information | | Does MSIM share? | | Can you limit this sharing? | |
For our everyday business purposes —
such as to process your transactions, maintain your account(s), respond to court orders and legal investigations, or report to credit bureaus | | Yes | | No | |
For our marketing purposes —
to offer our products and services to you | | Yes | | No | |
For joint marketing with other financial companies | | No | | We don't share | |
For our affiliates' everyday business purposes —
information about your transactions and experiences | | Yes | | No | |
For our affiliates' everyday business purposes —
information about your creditworthiness | | No | | We don't share | |
For our affiliates to market to you | | No | | We don't share | |
For non-affiliates to market to you | | No | | We don't share | |
Questions? Call toll-free (844) 312-6327 or email: imprivacyinquiries@morganstanley.com
30
Privacy Notice (unaudited) (cont'd) April 2019
Who we are
Who is providing this notice? | | Morgan Stanley Investment Management, Inc. and its affiliated registered investment advisers, registered broker-dealers, and registered and unregistered funds ("MSIM") | |
What we do
How does MSIM protect my personal information? | | To protect your personal information from unauthorized access and use, we use security measures that comply with federal law. These measures include computer safeguards and secured files and buildings. We have policies governing the proper handling of customer information by personnel and requiring third parties that provide support to adhere to appropriate security standards with respect to such information. | |
How does MSIM collect my personal information? | | We collect your personal information, for example, when you
n open an account or make deposits or withdrawals from your account
n buy securities from us or make a wire transfer
n give us your contact information
We also collect your personal information from others, such as credit bureaus, affiliates, or other companies. | |
Why can't I limit all sharing? | | Federal law gives you the right to limit only
n sharing for affiliates' everyday business purposes — information about your creditworthiness
n affiliates from using your information to market to you
n sharing for non-affiliates to market to you
State laws and individual companies may give you additional rights to limit sharing. See below for more on your rights under state law. | |
Definitions
Affiliates | | Companies related by common ownership or control. They can be financial and non-financial companies.
n Our affiliates include companies with a Morgan Stanley name and financial companies such as Morgan Stanley Smith Barney LLC and Morgan Stanley & Co. | |
Non-affiliates | | Companies not related by common ownership or control. They can be financial and non-financial companies.
n MSIM does not share with non-affiliates so they can market to you. | |
Joint marketing | | A formal agreement between non-affiliated financial companies that together market financial products or services to you.
n MSIM doesn't jointly market | |
Other Important Information
Vermont: Except as permitted by law, we will not share personal information we collect about Vermont residents with Non-affiliates unless you provide us with your written consent to share such information.
California: Except as permitted by law, we will not share personal information we collect about California residents with Non-affiliates and we will limit sharing such personal information with our Affiliates to comply with California privacy laws that apply to us.
31
Morgan Stanley Institutional Fund, Inc.
Annual Report — December 31, 2019
Director and Officer Information (unaudited)
Independent Directors:
Name, Birth Year
and Address of
Independent Director | | Position(s)
Held with
Registrant | | Length of Time
Served* | | Principal Occupation(s) During Past 5 Years
and Other Relevant Professional Experience | | Number of
Funds in
Fund Complex
Overseen by
Independent
Director** | | Other Directorships
Held by Independent
Director*** | |
Frank L. Bowman
c/o Perkins Coie LLP
Counsel to the Independent Directors
1155 Avenue of the Americas
New York, NY 10036
Birth Year 1944 | | Director | | Since
August 2006 | | President, Strategic Decisions, LLC (consulting) (since February 2009); Director or Trustee of various Morgan Stanley Funds (since August 2006); Chairperson of the Compliance and Insurance Committee (since October 2015); formerly, Chairperson of the Insurance Sub-Committee of the Compliance and Insurance Committee (2007-2015); served as President and Chief Executive Officer of the Nuclear Energy Institute (policy organization) (February 2005-November 2008); retired as Admiral, U.S. Navy after serving over 38 years on active duty including 8 years as Director of the Naval Nuclear Propulsion Program in the Department of the Navy and the U.S. Department of Energy (1996-2004); served as Chief of Naval Personnel (July 1994-September 1996) and on the Joint Staff as Director of Political Military Affairs (June 1992-July 1994); knighted as Honorary Knight Commander of the Most Excellent Order of the British Empire; awarded the Officier de l'Orde National du Mérite by the French Government; elected to the National Academy of Engineering (2009). | | | 86 | | | Director of Naval and Nuclear Technologies LLP; Director Emeritus of the Armed Services YMCA; Member of the National Security Advisory Council of the Center for U.S. Global Engagement and a member of the CNA Military Advisory Board; Trustee of Fairhaven United Methodist Church; Member of the Board of Advisors of the Dolphin Scholarship Foundation; Director of other various non-profit organizations; formerly, Director of BP p.l.c. (November 2010-May 2019). | |
Kathleen A. Dennis
c/o Perkins Coie LLP
Counsel to the Independent Directors
1155 Avenue of the Americas
New York, NY 10036
Birth Year 1953 | | Director | | Since August 2006 | | President, Cedarwood Associates (mutual fund and investment management consulting) (since July 2006); Chairperson of the Liquidity and Alternatives Sub-Committee of the Investment Committee (since October 2006) and Director or Trustee of various Morgan Stanley Funds (since August 2006); formerly, Senior Managing Director of Victory Capital Management (1993-2006). | | | 86 | | | Director of various non-profit organizations. | |
Nancy C. Everett
c/o Perkins Coie LLP
Counsel to the Independent Directors
1155 Avenue of the Americas
New York, NY 10036
Birth Year 1955 | | Director | | Since January 2015 | | Chief Executive Officer, Virginia Commonwealth University Investment Company (since November 2015); Owner, OBIR, LLC (institutional investment management consulting) (since June 2014); formerly, Managing Director, BlackRock, Inc. (February 2011-December 2013); and Chief Executive Officer, General Motors Asset Management (a/k/a Promark Global Advisors, Inc.) (June 2005-May 2010). | | | 87 | | | Formerly, Member of Virginia Commonwealth University School of Business Foundation (2005-2016); Member of Virginia Commonwealth University Board of Visitors (2013-2015); Member of Committee on Directors for Emerging Markets Growth Fund, Inc. (2007-2010); Chairperson of Performance Equity Management, LLC (2006-2010); and Chairperson, GMAM Absolute Return Strategies Fund, LLC (2006-2010). | |
32
Morgan Stanley Institutional Fund, Inc.
Annual Report — December 31, 2019
Director and Officer Information (unaudited) (cont'd)
Independent Directors: (cont'd)
Name, Birth Year
and Address of
Independent Director | | Position(s)
Held with
Registrant | | Length of Time
Served* | | Principal Occupation(s) During Past 5 Years
and Other Relevant Professional Experience | | Number of
Funds in
Fund Complex
Overseen by
Independent
Director** | | Other Directorships
Held by Independent
Director*** | |
Jakki L. Haussler
c/o Perkins Coie LLP
Counsel to the Independent Directors
1155 Avenue of the Americas
New York, NY 10036
Birth Year 1957 | | Director | | Since January 2015 | | Chairman, Opus Capital Group (since 1996); formerly, Chief Executive Officer, Opus Capital Group (1996-2019); Director, Capvest Venture Fund, LP (May 2000-December 2011); Partner, Adena Ventures, LP (July 1999-December 2010); Director, The Victory Funds (February 2005-July 2008). | | | 87 | | | Director of Service Corporation International and Member, Audit Committee and Investment Committee; Director of Cincinnati Bell Inc. and Member, Audit Committee and Governance and Nominating Committee; Chairman of Northern Kentucky University Member Investment Committee; Member of Chase College of Law Transactional Law Practice Center Board of Advisors; Director of Best Transport; Director of Chase College of Law Board of Visitors; formerly, Member, University of Cincinnati Foundation Investment Committee; Member, Miami University Board of Visitors (2008-2011); Trustee of Victory Funds (2005-2008) and Chairman, Investment Committee (2007-2008) and Member, Service Provider Committee (2005-2008). | |
Dr. Manuel H. Johnson
c/o Johnson Smick International, Inc.
220 I Street, NE — Suite 200
Washington, D.C. 20002
Birth Year 1949 | | Director | | Since July 1991 | | Senior Partner, Johnson Smick International, Inc. (consulting firm); Chairperson of the Investment Committee (since October 2006) and Director or Trustee of various Morgan Stanley Funds (since July 1991); Co-Chairman and a founder of the Group of Seven Council (G7C) (international economic commission); formerly, Chairperson of the Audit Committee (July 1991-September 2006), Vice Chairman of the Board of Governors of the Federal Reserve System and Assistant Secretary of the U.S. Treasury. | | | 86 | | | Director of NVR, Inc. (home construction). | |
Joseph J. Kearns
c/o Perkins Coie LLP
Counsel to the Independent Directors
1155 Avenue of the Americas
New York, NY 10036
Birth Year 1942 | | Director | | Since August 1994 | | Senior Adviser, Kearns & Associates LLC (investment consulting); Chairperson of the Audit Committee (since October 2006) and Director or Trustee of various Morgan Stanley Funds (since August 1994); formerly, Deputy Chairperson of the Audit Committee (July 2003-September 2006) and Chairperson of the Audit Committee of various Morgan Stanley Funds (since August 1994); CFO of the J. Paul Getty Trust. | | | 87 | | | Prior to August 10, 2016, Director of Electro Rent Corporation (equipment leasing); Prior to December 31, 2013, Director of The Ford Family Foundation. | |
33
Morgan Stanley Institutional Fund, Inc.
Annual Report — December 31, 2019
Director and Officer Information (unaudited) (cont'd)
Independent Directors: (cont'd)
Name, Birth Year
and Address of
Independent Director | | Position(s)
Held with
Registrant | | Length of Time
Served* | | Principal Occupation(s) During Past 5 Years
and Other Relevant Professional Experience | | Number of
Funds in
Fund Complex
Overseen by
Independent
Director** | | Other Directorships
Held by Independent
Director*** | |
Michael F. Klein
c/o Perkins Coie LLP
Counsel to the Independent Directors
1155 Avenue of the Americas
New York, NY 10036
Birth Year 1958 | | Director | | Since August 2006 | | Managing Director, Aetos Alternatives Management, LP (since March 2000); Co-President, Aetos Alternatives Management, LP (since January 2004) and Co-Chief Executive Officer of Aetos Alternatives Management, LP (since August 2013); Chairperson of the Fixed Income Sub-Committee of the Investment Committee (since October 2006) and Director or Trustee of various Morgan Stanley Funds (since August 2006); formerly, Managing Director, Morgan Stanley & Co. Inc. and Morgan Stanley Dean Witter Investment Management and President, various Morgan Stanley Funds (June 1998-March 2000); Principal, Morgan Stanley & Co. Inc. and Morgan Stanley Dean Witter Investment Management (August 1997-December 1999). | | | 86 | | | Director of certain investment funds managed or sponsored by Aetos Alternatives Management, LP; Director of Sanitized AG and Sanitized Marketing AG (specialty chemicals). | |
Patricia Maleski
c/o Perkins Coie LLP
Counsel to the Independent Directors
1155 Avenue of the Americas
New York, NY 10036
Birth Year 1960 | | Director | | Since January 2017 | | Managing Director, JPMorgan Asset Management (2004-2016); Oversight and Control Head of Fiduciary and Conflicts of Interest Program (2015-2016); Chief Control Officer-Global Asset Management (2013-2015); President, JPMorgan Funds (2010-2013); Chief Administrative Officer (2004-2013); various other positions including Treasurer and Board Liaison (since 2001). | | | 87 | | | None. | |
Michael E. Nugent
522 Fifth Avenue
New York, NY 10036
Birth Year 1936 | | Chair of the Board and Director | | Chair of the Boards since July 2006 and Director since July 1991 | | Chair of the Boards of various Morgan Stanley Funds (since July 2006); Chairperson of the Governance Committee (since January 2019) and Director or Trustee of various Morgan Stanley Funds (since July 1991); formerly, Chairperson of each of the Closed-End Fund committee (until December 2019) and the Insurance Committee (until July 2006); General Partner, Triumph Capital, L.P. (private investment partnership) (1988-2013). | | | 86 | | | None. | |
W. Allen Reed
c/o Perkins Coie LLP
Counsel to the Independent Directors
1155 Avenue of the Americas
New York, NY 10036
Birth Year 1947 | | Vice Chair of the Board and Director | | Vice Chair of the Boards since January 2020 and Director since August 2006 | | Chairperson of the Equity Sub-Committee of the Investment Committee (since October 2006) and Director or Trustee of various Morgan Stanley Funds (since August 2006); formerly, President and CEO of General Motors Asset Management; Chairman and Chief Executive Officer of the GM Trust Bank and Corporate Vice President of General Motors Corporation (August 1994-December 2005). | | | 86 | | | Formerly, Director of Legg Mason, Inc.; formerly, Director of the Auburn University Foundation (2010-2015). | |
* This is the earliest date the Director began serving the Morgan Stanley Funds. Each Director serves an indefinite term, until his or her successor is elected.
** The Fund Complex includes (as of December 31, 2019) all open-end and closed-end funds (including all of their portfolios) advised by Morgan Stanley Investment Management Inc. (the "Adviser") and any funds that have an adviser that is an affiliated person of the Adviser (including, but not limited to, Morgan Stanley AIP GP LP).
*** This includes any directorships at public companies and registered investment companies held by the Director at any time during the past five years.
34
Morgan Stanley Institutional Fund, Inc.
Annual Report — December 31, 2019
Director and Officer Information (unaudited) (cont'd)
Executive Officers:
Name, Birth Year and Address of
Executive Officer | | Position(s) Held
with
Registrant | | Length of
Time Served* | | Principal Occupation(s) During Past 5 Years | |
John H. Gernon
522 Fifth Avenue
New York, NY 10036
Birth Year 1963 | | President and Principal Executive Officer | | Since September 2013 | | President and Principal Executive Officer of the Equity and Fixed Income Funds and the Morgan Stanley AIP Funds (since September 2013) and the Liquidity Funds and various money market funds (since May 2014) in the Fund Complex; Managing Director of the Adviser; Head of Product (since 2006). | |
Timothy J. Knierim
522 Fifth Avenue
New York, NY 10036
Birth Year 1959 | | Chief Compliance Officer | | Since December 2016 | | Managing Director of the Adviser and various entities affiliated with the Adviser; Chief Compliance Officer of various Morgan Stanley Funds and the Adviser (since December 2016) and Chief Compliance Officer of Morgan Stanley AIP GP LP (since 2014). Formerly, Managing Director and Deputy Chief Compliance Officer of the Adviser (2014-2016); and formerly, Chief Compliance Officer of Prudential Investment Management, Inc. (2007-2014). | |
Francis J. Smith
522 Fifth Avenue
New York, NY 10036
Birth Year 1965 | | Treasurer and Principal Financial Officer | | Treasurer since July 2003 and Principal Financial Officer since September 2002 | | Managing Director of the Adviser and various entities affiliated with the Adviser; Treasurer (since July 2003) and Principal Financial Officer of various Morgan Stanley Funds (since September 2002). | |
Mary E. Mullin
522 Fifth Avenue
New York, NY 10036
Birth Year 1967 | | Secretary | | Since June 1999 | | Managing Director of the Adviser; Secretary of various Morgan Stanley Funds (since June 1999). | |
Michael J. Key
522 Fifth Avenue
New York, NY 10036
Birth Year 1979 | | Vice President | | Since June 2017 | | Vice President of the Equity and Fixed Income Funds, Liquidity Funds, various money market funds and the Morgan Stanley AIP Funds in the Fund Complex (since June 2017); Executive Director of the Adviser; Head of Product Development for Equity and Fixed Income Funds (since August 2013). | |
* This is the earliest date the officer began serving the Morgan Stanley Funds. Each officer serves a one-year term, until his or her successor is elected and qualifies.
35
Morgan Stanley Institutional Fund, Inc.
Annual Report — December 31, 2019
Adviser and Administrator
Morgan Stanley Investment Management Inc.
522 Fifth Avenue
New York, New York 10036
Sub-Adviser
Morgan Stanley Investment Management Limited
25 Cabot Square, Canary Wharf
London, E14 4QA, England
Distributor
Morgan Stanley Distribution, Inc.
522 Fifth Avenue
New York, New York 10036
Dividend Disbursing and Transfer Agent
DST Asset Manager Solutions, Inc.
2000 Crown Colony Drive
Quincy, Massachusetts 02169
Custodian
State Street Bank and Trust Company
One Lincoln Street
Boston, Massachusetts 02111
Legal Counsel
Dechert LLP
1095 Avenue of the Americas
New York, New York 10036
Counsel to the Independent Directors
Perkins Coie LLP
1155 Avenue of the Americas
New York, New York 10036
Independent Registered Public Accounting Firm
Ernst & Young LLP
200 Clarendon Street
Boston, Massachusetts 02116
Reporting to Shareholders
Each Morgan Stanley fund provides a complete schedule of portfolio holdings in its Semi-Annual and the Annual Reports within 60 days of the end of the fund's second and fourth fiscal quarters. The Semi-Annual and Annual Reports are filed electronically with the Securities and Exchange Commission ("SEC") on Form N-CSRS and Form N-CSR, respectively. Morgan Stanley also delivers the Semi-Annual and Annual Reports to fund shareholders and makes these reports available on its public website, www.morganstanley.com/im/shareholderreports. Each Morgan Stanley non-money market fund also files a complete schedule of portfolio holdings with the SEC for the fund's first and third fiscal quarters as an attachment to Form N-PORT. Morgan Stanley does not deliver the reports for the first and third fiscal quarters to shareholders, nor are the reports posted to the Morgan Stanley public website. However, the holdings for each money market fund are posted to the Morgan Stanley public website. You may obtain the Form N-PORT filings (as well as the Form N-CSR and N-CSRS filings) by accessing the SEC's website, www.sec.gov. You can also request copies of these materials, upon payment of a duplicating fee, by electronic request at the SEC's email address (publicinfo@sec.gov).
Proxy Voting Policies and Procedures and Proxy Voting Record
You may obtain a copy of the Company's Proxy Voting Policy and Procedures and information regarding how the Company voted proxies relating to portfolio securities during the most recent twelve-month period ended June 30, without charge, upon request, by calling toll free 1 (800) 548-7786 or by visiting our website at www.morganstanley.com/im/shareholderreports. This information is also available on the SEC's website at www.sec.gov.
This report is authorized for distribution only when preceded or accompanied by a prospectus or summary prospectus of the applicable fund of Morgan Stanley Institutional Fund, Inc., which describes in detail the fund's investment policies, risks, fees and expenses. Please read the prospectus carefully before you invest or send money. For additional information, including information regarding the investments comprising the Fund, please visit our website at www.morganstanley.com/im/shareholderreports or call toll free 1 (800) 548-7786.
36
Printed in U.S.A.
This Report has been prepared for shareholders and may be distributed to others only if preceded or accompanied by a current prospectus.
Morgan Stanley Investment Management Inc.
522 Fifth Avenue
New York, New York 10036
© 2020 Morgan Stanley. Morgan Stanley Distribution, Inc.

IFIRAANN
2925091 EXP. 02.28.21

Morgan Stanley Institutional Fund, Inc.
Global Counterpoint Portfolio
Annual Report
December 31, 2019
Beginning on January 1, 2021, as permitted by regulations adopted by the Securities and Exchange Commission ("SEC"), paper copies of the Fund's Annual and Semi-Annual Reports to Shareholders ("Shareholder Reports") will no longer be sent by mail, unless you specifically request paper copies of the Shareholder Reports from the Fund or from your financial intermediary, such as a broker-dealer or a bank. Instead, the Shareholder Reports will be made available on the Fund's website, https://www.morganstanley.com/im/shareholderreports and you will be notified by mail each time a Shareholder Report is posted and provided with a website link to access the Shareholder Report. If you already elected to receive Shareholder Reports electronically, you will not be affected by this change and you need not take any action. You may elect to receive Shareholder Reports and other communications from the Fund electronically anytime by contacting your financial intermediary or, if you are a direct investor, please follow the instructions on the envelope.
Beginning on January 1, 2019, you may elect to receive all future Shareholder Reports in paper free of charge. If you invest through a financial intermediary, you can contact your financial intermediary to request that you continue to receive paper copies of your Shareholder Reports. If you invest directly with the Fund, please follow the instructions on the envelope to let the Fund know you wish to continue receiving paper copies of your Shareholder Reports. Your election to receive Shareholder Reports in paper will apply to all funds held in your account if you invest through your financial intermediary or all funds held with the fund complex if you invest directly with a fund.

Morgan Stanley Institutional Fund, Inc.
Annual Report — December 31, 2019
Shareholders' Letter | | | 2 | | |
Expense Example | | | 3 | | |
Investment Overview | | | 4 | | |
Portfolio of Investments | | | 6 | | |
Statement of Assets and Liabilities | | | 10 | | |
Statement of Operations | | | 11 | | |
Statements of Changes in Net Assets | | | 12 | | |
Financial Highlights | | | 13 | | |
Notes to Financial Statements | | | 17 | | |
Report of Independent Registered Public Accounting Firm | | | 26 | | |
Privacy Notice | | | 27 | | |
Director and Officer Information | | | 29 | | |
This report is authorized for distribution only when preceded or accompanied by a prospectus or summary prospectus of the applicable Fund of Morgan Stanley Institutional Fund, Inc. To receive a prospectus and/or statement of additional information ("SAI"), which contains more complete information such as investment objectives, charges, expenses, policies for voting proxies, risk considerations and describes in detail each of the Fund's investment policies to the prospective investor, please call toll free 1 (800) 548-7786. Please read the prospectuses carefully before you invest or send money.
Additionally, you can access information about the Fund, including performance, characteristics and investment team commentary, through Morgan Stanley Investment Management's website: www.morganstanley.com/im/shareholderreports.
Market forecasts provided in this report may not necessarily come to pass. There is no guarantee that any sectors mentioned will continue to perform as discussed herein or that securities in such sectors will be held by the Fund in the future. There is no assurance that a fund will achieve its investment objective. Funds are subject to market risk, which is the possibility that market values of securities owned by the Fund will decline and, therefore, the value of the Fund's shares may be less than what you paid for them. Accordingly, you can lose money investing in this Fund. Please see the prospectus for more complete information on investment risks.
1
Morgan Stanley Institutional Fund, Inc.
Annual Report — December 31, 2019
Shareholders' Letter (unaudited)
Dear Shareholders,
We are pleased to provide this Annual Report, in which you will learn how your investment in Global Counterpoint Portfolio (the "Fund") performed during the latest twelve-month period.
Morgan Stanley Investment Management is a client-centric, investor-led organization. Our global presence, intellectual capital, and breadth of products and services enable us to partner with investors to meet the evolving challenges of today's financial markets. We aim to deliver superior investment service and to empower our clients to make the informed decisions that help them reach their investment goals.
As always, we thank you for selecting Morgan Stanley Investment Management, and look forward to working with you in the months and years ahead.
Sincerely,

John H. Gernon
President and Principal Executive Officer
January 2020
2
Morgan Stanley Institutional Fund, Inc.
Annual Report — December 31, 2019
Expense Example (unaudited)
Global Counterpoint Portfolio
As a shareholder of the Fund, you incur two types of costs: (1) transactional costs; and (2) ongoing costs, which may include advisory fees, administration fees, distribution and shareholder services fees and other Fund expenses. This example is intended to help you understand your ongoing costs (in dollars) of investing in the Fund and to compare these costs with the ongoing costs of investing in other mutual funds.
This example is based on an investment of $1,000 invested at the beginning of the six-month period ended December 31, 2019 and held for the entire six-month period.
Actual Expenses
The table below provides information about actual account values and actual expenses. You may use the information in this table, together with the amount you invested, to estimate the expenses that you paid over the period. Simply divide your account value by $1,000 (for example, an $8,600 account value divided by $1,000 = 8.6), then multiply the result by the number in the table under the heading entitled "Actual Expenses Paid During Period" to estimate the expenses you paid on your account during this period.
Hypothetical Example for Comparison Purposes
The table below provides information about hypothetical account values and hypothetical expenses based on the Fund's actual expense ratio and an assumed rate of return of 5% per year before expenses, which is not the Fund's actual return. The hypothetical account values and expenses may not be used to estimate the actual ending account balance or expenses you paid for the period. You may use this information to compare the ongoing costs of investing in the Fund and other funds. To do so, compare this 5% hypothetical example with the 5% hypothetical examples that appear in the shareholder reports of the other funds.
Please note that the expenses shown in the table are meant to highlight your ongoing costs only and do not reflect any transactional costs, such as sales charges (loads). Therefore, the information for each class in the table is useful in comparing ongoing costs only, and will not help you determine the relative total costs of owning different funds. In addition, if these transactional costs were included, your costs would have been higher.
| | | Beginning
Account
Value
7/1/19 | | Actual Ending
Account
Value
12/31/19 | | Hypothetical
Ending Account
Value | | Actual
Expenses
Paid
During
Period* | | Hypothetical
Expenses Paid
During Period* | | Net
Expense
Ratio
During
Period** | |
Global Counterpoint Portfolio Class I | | $ | 1,000.00 | | | $ | 1,031.90 | | | $ | 1,020.01 | | | $ | 5.28 | | | $ | 5.24 | | | | 1.03 | % | |
Global Counterpoint Portfolio Class A | | | 1,000.00 | | | | 1,030.10 | | | | 1,018.20 | | | | 7.11 | | | | 7.07 | | | | 1.39 | | |
Global Counterpoint Portfolio Class C | | | 1,000.00 | | | | 1,025.60 | | | | 1,014.42 | | | | 10.93 | | | | 10.87 | | | | 2.14 | | |
Global Counterpoint Portfolio Class IS | | | 1,000.00 | | | | 1,031.90 | | | | 1,020.21 | | | | 5.07 | | | | 5.04 | | | | 0.99 | | |
* Expenses are calculated using each Fund Class' annualized net expense ratio (as disclosed), multiplied by the average account value over the period and multiplied by 184/365 (to reflect the most recent one-half year period).
** Annualized.
3
Morgan Stanley Institutional Fund, Inc.
Annual Report — December 31, 2019
Investment Overview (unaudited)
Global Counterpoint Portfolio(i)
The Fund seeks long-term capital appreciation.
Performance
For the fiscal year ended December 31, 2019, the Fund's Class I shares had a total return based on net asset value and reinvestment of distributions per share of 33.81%, net of fees. The Fund's Class I shares outperformed the Fund's benchmark, the MSCI All Country World Net Index (the "Index"), which returned 26.60%.
Please keep in mind that double-digit returns are highly unusual and cannot be sustained. Investors should also be aware that these returns were primarily achieved during favorable market conditions.
Factors Affecting Performance
• Easing geopolitical tensions, reduced recession fears and central bank support drove global equities sharply higher over 2019. Although the U.S.-China trade relations dampened global manufacturing and export activity, many economies remained supported by relatively stronger consumer sectors that had remained mostly unaffected by the manufacturing slowdown. To further extend the economic cycle, global central banks resumed cutting policy interest rates and enacting other stimulus measures. Volatility increased in 2019, but stock prices continued to rally higher, notably at year end when the U.S. and China announced a partial trade deal, Brexit uncertainty eased with the Conservative Party winning a large majority in the U.K. general election, and some economic indicators appeared to be stabilizing.
• Global equities, as measured by the Index, performed well during the year, with information technology, consumer discretionary and industrials the best performing sectors in the Index. All sectors advanced over the period, but the energy sector lagged the Index by the widest margin.
• Counterpoint Global seeks high quality companies, which we define primarily as those with sustainable competitive advantages. We manage concentrated portfolios that are highly differentiated from the benchmark, with securities weighted on our assessment of the quality of the company and our
conviction. The value added or detracted in any period of time will result from stock selection, given our philosophy and process. For the year, the Fund outperformed the Index.
• The long-term investment horizon and conviction-weighted investment approach embraced by the team since 1998 can result in periods of performance deviation from the benchmark and peers. The Fund outperformed the Index in this reporting period due to favorable stock selection and sector allocations.
• The largest contributors to the Fund's relative performance were our stock selection and overweight allocations in both the information technology and consumer discretionary sectors. Performance in the information technology sector was led by a holding in a U.S. company providing a cloud-based spending management platform to enterprises in the consumer discretionary sector; the Fund's holding in a leading provider of math and science tutoring in China added the most to relative performance. Stock selection in the health care sector also contributed positively to performance, driven by strong performance from a provider of cloud-based software solutions to life sciences companies.
• There were no material detractors from relative performance at the sector level in this reporting period. The communication services and real estate sectors had a nearly neutral impact on performance. The largest detracting holding across the whole Fund was a London-based global online marketplace for luxury goods, which underperformed after the company's management reduced its financial outlook in the third quarter of 2019.
Management Strategies
• As a team, we believe having a market outlook can be an anchor. Our focus is on assessing company prospects over a five-year horizon, and owning a portfolio of unique companies whose market value we believe can increase significantly for underlying fundamental reasons.
(i) On January 2, 2020, the MSIF Global Counterpoint Portfolio was renamed to the MSIF Counterpoint Global Portfolio and there were no changes made to the investment objective.
4
Morgan Stanley Institutional Fund, Inc.
Annual Report — December 31, 2019
Investment Overview (unaudited) (cont'd)
Global Counterpoint Portfolio

* Minimum Investment for Class I shares
** Commenced Operations on June 29, 2018.
In accordance with SEC regulations, the Fund's performance shown assumes that all recurring fees (including management fees) were deducted and all dividends and distributions were reinvested. The performance of Class A, C and IS shares will vary from the performance of Class I shares and will be negatively impacted by additional fees assessed to those classes (if applicable).
Performance Compared to the MSCI All Country World Net Index(1) and the Lipper Global Multi-Cap Growth Funds Index(2)
| | | Period Ended December 31, 2019
Total Returns(3) | |
| | | | | Average Annual | |
| | | One
Year | | Five
Years | | Ten
Years | | Since
Inception(5) | |
Fund — Class I Shares
w/o sales charges(4) | | | 33.81 | % | | | — | | | | — | | | | 9.46 | % | |
Fund — Class A Shares w/o
sales charges(4) | | | 33.18 | | | | — | | | | — | | | | 9.05 | | |
Fund — Class A Shares with
maximum 5.25% sales charges(4) | | | 26.17 | | | | — | | | | — | | | | 5.25 | | |
Fund — Class C Shares
w/o sales charges(4) | | | 32.23 | | | | — | | | | — | | | | 8.23 | | |
Fund — Class C Shares with
maximum 1.00% deferred
sales charges(4) | | | 31.23 | | | | — | | | | — | | | | 8.23 | | |
Fund — Class IS Shares
w/o sales charges(4) | | | 33.81 | | | | — | | | | — | | | | 9.48 | | |
MSCI All Country World Net Index | | | 26.60 | | | | — | | | | — | | | | 9.83 | | |
Lipper Global Multi-Cap Growth
Funds Index | | | 29.00 | | | | — | | | | — | | | | 9.21 | | |
Performance data quoted represents past performance, which is no guarantee of future results, and current performance may be lower or higher than the figures shown. Performance assumes that all dividends and distributions, if any, were reinvested. For the most recent month-end performance figures, please visit www.morganstanley.com/im/shareholderreports. Investment return and principal value will fluctuate so that Fund shares, when redeemed, may be worth more or less than their original cost. Total returns do not reflect the deduction of taxes that a shareholder would pay on Fund distributions or the redemption of Fund shares. Performance of share classes will vary due to difference in sales charges and expenses.
(1) The MSCI All Country World Net Index is a free float-adjusted market capitalization weighted index designed to measure the equity market performance of developed and emerging markets. The term "free float" represents the portion of shares outstanding that are deemed to be available for purchase in the public equity markets by investors. The performance of the Index is listed in U.S. dollars and assumes reinvestment of net dividends. Net total return indices reinvest dividends after the deduction of withholding taxes, using (for international indices) a tax rate applicable to non-resident institutional investors who do not benefit from double taxation treaties. The Index is unmanaged and its returns do not include any sales charges or fees. Such costs would lower performance. It is not possible to invest directly in an index.
(2) The Lipper Global Multi-Cap Growth Funds Index is an equally weighted performance index of the largest qualifying funds (based on net assets) in the Lipper Global Multi-Cap Growth Funds classification. The Index, which is adjusted for capital gains distributions and income dividends, is unmanaged and should not be considered an investment. There are currently 30 funds represented in this Index. As of the date of this report, the Fund was in the Lipper Global Multi-Cap Growth Funds classification.
(3) Total returns for the Fund reflect fees waived and expenses reimbursed, if applicable, by the Adviser (as defined herein). Without such waivers and reimbursements, total returns would have been lower.
(4) Commenced operations on June 29, 2018.
(5) For comparative purposes, average annual since inception returns listed for the Indexes refer to the inception date of the Fund, not the inception of the Index.
5
Morgan Stanley Institutional Fund, Inc.
Annual Report — December 31, 2019
Portfolio of Investments
Global Counterpoint Portfolio
| | | Shares | | Value
(000) | |
Common Stocks (82.6%) | |
Argentina (0.3%) | |
Globant SA (a) | | | 300 | | | $ | 32 | | |
Australia (0.3%) | |
Brookfield Infrastructure Partners LP | | | 700 | | | | 35 | | |
Brazil (0.4%) | |
B3 SA - Brasil Bolsa Balcao | | | 1,407 | | | | 15 | | |
Magazine Luiza SA | | | 2,266 | | | | 27 | | |
| | | | 42 | | |
Canada (3.6%) | |
Brookfield Asset Management, Inc., Class A | | | 456 | | | | 26 | | |
Canadian National Railway Co. | | | 394 | | | | 36 | | |
Colliers International Group, Inc. | | | 138 | | | | 11 | | |
Constellation Software, Inc. | | | 60 | | | | 58 | | |
FirstService Corp. | | | 808 | | | | 75 | | |
Shopify, Inc., Class A (a) | | | 386 | | | | 154 | | |
| | | | 360 | | |
China (8.3%) | |
Alibaba Group Holding Ltd. ADR (a) | | | 203 | | | | 43 | | |
China East Education Holdings Ltd. (a)(b) | | | 13,000 | | | | 27 | | |
China Resources Beer Holdings Co., Ltd. (b) | | | 10,000 | | | | 55 | | |
Foshan Haitian Flavouring & Food Co., Ltd.,
Class A | | | 6,000 | | | | 93 | | |
GSX Techedu, Inc. ADR (a) | | | 1,263 | | | | 28 | | |
Haidilao International Holding Ltd. (b)(c) | | | 7,000 | | | | 28 | | |
Hangzhou Tigermed Consulting Co., Ltd.,
Class A | | | 1,598 | | | | 15 | | |
Huazhu Group Ltd. ADR | | | 1,063 | | | | 43 | | |
HUYA, Inc. ADR (a) | | | 1,971 | | | | 35 | | |
Inner Mongolia Yili Industrial Group Co., Ltd.,
Class A | | | 1,500 | | | | 7 | | |
Kweichow Moutai Co., Ltd., Class A | | | 200 | | | | 34 | | |
Meituan Dianping, Class B (a)(b) | | | 6,600 | | | | 86 | | |
Poly Property Development Co., Ltd.,
Class H (a)(b) | | | 400 | | | | 2 | | |
Shenzhou International Group Holdings Ltd. (b) | | | 2,700 | | | | 39 | | |
TAL Education Group ADR (a) | | | 4,377 | | | | 211 | | |
Tencent Holdings Ltd. (b) | | | 800 | | | | 39 | | |
Trip.com Group Ltd. ADR (a) | | | 1,679 | | | | 56 | | |
| | | | 841 | | |
Denmark (2.6%) | |
Chr Hansen Holding A/S | | | 1,239 | | | | 99 | | |
DSV A/S | | | 1,433 | | | | 165 | | |
| | | | 264 | | |
France (5.0%) | |
Christian Dior SE | | | 193 | | | | 99 | | |
EssilorLuxottica SA | | | 642 | | | | 98 | | |
Getlink SE | | | 762 | | | | 13 | | |
Hermes International | | | 257 | | | | 192 | | |
L'Oreal SA | | | 69 | | | | 20 | | |
LVMH Moet Hennessy Louis Vuitton SE | | | 13 | | | | 6 | | |
| | | Shares | | Value
(000) | |
Pernod Ricard SA | | | 196 | | | $ | 35 | | |
Remy Cointreau SA | | | 207 | | | | 25 | | |
Safran SA | | | 87 | | | | 14 | | |
| | | | 502 | | |
Germany (0.4%) | |
Adidas AG | | | 23 | | | | 8 | | |
CompuGroup Medical SE | | | 89 | | | | 6 | | |
Nemetschek SE | | | 120 | | | | 8 | | |
Rational AG | | | 11 | | | | 9 | | |
Zalando SE (a) | | | 166 | | | | 8 | | |
| | | | 39 | | |
Hong Kong (0.4%) | |
AIA Group Ltd. | | | 4,200 | | | | 44 | | |
India (3.0%) | |
HDFC Bank Ltd. ADR | | | 4,822 | | | | 305 | | |
Israel (0.1%) | |
Wix.com Ltd. (a) | | | 59 | | | | 7 | | |
Italy (1.3%) | |
Brunello Cucinelli SpA | | | 190 | | | | 6 | | |
Moncler SpA | | | 2,707 | | | | 122 | | |
| | | | 128 | | |
Japan (1.7%) | |
Calbee, Inc. | | | 1,300 | | | | 43 | | |
Demae-Can Co., Ltd. | | | 300 | | | | 3 | | |
Keyence Corp. | | | 200 | | | | 70 | | |
Nihon M&A Center, Inc. | | | 700 | | | | 24 | | |
Pigeon Corp. | | | 900 | | | | 33 | | |
| | | | 173 | | |
Korea, Republic of (0.7%) | |
NAVER Corp. | | | 420 | | | | 68 | | |
Mexico (0.2%) | |
Grupo Aeroportuario del Sureste SAB de CV,
Class B | | | 1,240 | | | | 23 | | |
Netherlands (1.2%) | |
Adyen N.V. (a) | | | 90 | | | | 74 | | |
ASML Holding N.V. | | | 163 | | | | 48 | | |
| | | | 122 | | |
New Zealand (0.6%) | |
Ryman Healthcare Ltd. | | | 1,144 | | | | 13 | | |
Xero Ltd. (a) | | | 822 | | | | 46 | | |
| | | | 59 | | |
South Africa (0.0%) | |
Discovery Ltd. | | | 263 | | | | 2 | | |
Spain (0.1%) | |
Aena SME SA | | | 68 | | | | 13 | | |
Sweden (0.4%) | |
AddLife AB, Class B | | | 176 | | | | 6 | | |
Cellavision AB | | | 112 | | | | 4 | | |
Vitrolife AB | | | 1,486 | | | | 31 | | |
| | | | 41 | | |
The accompanying notes are an integral part of the financial statements.
6
Morgan Stanley Institutional Fund, Inc.
Annual Report — December 31, 2019
Portfolio of Investments (cont'd)
Global Counterpoint Portfolio
| | | Shares | | Value
(000) | |
Switzerland (0.2%) | |
Kuehne & Nagel International AG (Registered) | | | 122 | | | $ | 21 | | |
Taiwan (1.0%) | |
Nien Made Enterprise Co., Ltd. | | | 1,000 | | | | 9 | | |
Taiwan Semiconductor Manufacturing Co., Ltd. | | | 3,000 | | | | 33 | | |
Taiwan Semiconductor Manufacturing Co., Ltd. ADR | | | 990 | | | | 58 | | |
| | | | 100 | | |
Turkey (0.0%) | |
Ulker Biskuvi Sanayi AS (a) | | | 957 | | | | 4 | | |
United Kingdom (2.8%) | |
Atlassian Corp. PLC, Class A (a) | | | 283 | | | | 34 | | |
Blue Prism Group PLC (a) | | | 293 | | | | 4 | | |
Compass Group PLC | | | 488 | | | | 12 | | |
Diageo PLC | | | 635 | | | | 27 | | |
Fevertree Drinks PLC | | | 736 | | | | 21 | | |
Melrose Industries PLC | | | 2,162 | | | | 7 | | |
Reckitt Benckiser Group PLC | | | 435 | | | | 35 | | |
Rentokil Initial PLC | | | 14,365 | | | | 86 | | |
Rightmove PLC | | | 5,627 | | | | 47 | | |
Victoria PLC (a) | | | 1,559 | | | | 9 | | |
| | | | 282 | | |
United States (48.0%) | |
10X Genomics, Inc., Class A (a) | | | 696 | | | | 53 | | |
Adaptive Biotechnologies Corp. (a) | | | 74 | | | | 2 | | |
Adobe, Inc. (a) | | | 182 | | | | 60 | | |
Alnylam Pharmaceuticals, Inc. (a) | | | 132 | | | | 15 | | |
Alphabet, Inc., Class C (a) | | | 70 | | | | 94 | | |
Alteryx, Inc., Class A (a) | | | 236 | | | | 24 | | |
Amazon.com, Inc. (a) | | | 154 | | | | 285 | | |
Anaplan, Inc. (a) | | | 139 | | | | 7 | | |
Anterix, Inc. | | | 287 | | | | 12 | | |
Appfolio, Inc., Class A (a) | | | 111 | | | | 12 | | |
Appian Corp. (a) | | | 535 | | | | 20 | | |
At Home Group, Inc. (a) | | | 576 | | | | 3 | | |
Autodesk, Inc. (a) | | | 42 | | | | 8 | | |
Avalara, Inc. (a) | | | 625 | | | | 46 | | |
Ball Corp. | | | 106 | | | | 7 | | |
Bill.Com Holdings, Inc. (a) | | | 137 | | | | 5 | | |
Booking Holdings, Inc. (a) | | | 39 | | | | 80 | | |
Broadridge Financial Solutions, Inc. | | | 345 | | | | 43 | | |
Brown-Forman Corp., Class B | | | 249 | | | | 17 | | |
Cardlytics, Inc. (a) | | | 407 | | | | 26 | | |
Carvana Co. (a) | | | 495 | | | | 46 | | |
Chegg, Inc. (a) | | | 190 | | | | 7 | | |
Chewy, Inc., Class A (a) | | | 1,170 | | | | 34 | | |
Cintas Corp. | | | 53 | | | | 14 | | |
CME Group, Inc. | | | 249 | | | | 50 | | |
Cognex Corp. | | | 132 | | | | 7 | | |
Copart, Inc. (a) | | | 576 | | | | 52 | | |
Coupa Software, Inc. (a) | | | 794 | | | | 116 | | |
Covetrus, Inc. (a) | | | 1,319 | | | | 17 | | |
Danaher Corp. | | | 51 | | | | 8 | | |
| | | Shares | | Value
(000) | |
Datadog, Inc., Class A (a) | | | 124 | | | $ | 5 | | |
DexCom, Inc. (a) | | | 333 | | | | 73 | | |
Ecolab, Inc. | | | 662 | | | | 128 | | |
Editas Medicine, Inc. (a) | | | 87 | | | | 3 | | |
EPAM Systems, Inc. (a) | | | 609 | | | | 129 | | |
Estee Lauder Cos., Inc. (The), Class A | | | 34 | | | | 7 | | |
Everbridge, Inc. (a) | | | 87 | | | | 7 | | |
EVI Industries, Inc. | | | 194 | | | | 5 | | |
Exact Sciences Corp. (a) | | | 85 | | | | 8 | | |
Facebook, Inc., Class A (a) | | | 293 | | | | 60 | | |
Farfetch Ltd., Class A (a) | | | 5,003 | | | | 52 | | |
Fastly, Inc., Class A (a) | | | 812 | | | | 16 | | |
Gartner, Inc. (a) | | | 384 | | | | 59 | | |
Guardant Health, Inc. (a) | | | 572 | | | | 45 | | |
Guidewire Software, Inc. (a) | | | 44 | | | | 5 | | |
Healthcare Merger Corp. (a) | | | 112 | | | | 1 | | |
HealthEquity, Inc. (a) | | | 310 | | | | 23 | | |
HEICO Corp. | | | 54 | | | | 6 | | |
HEICO Corp., Class A | | | 442 | | | | 40 | | |
Illumina, Inc. (a) | | | 206 | | | | 68 | | |
Inspire Medical Systems, Inc. (a) | | | 780 | | | | 58 | | |
Installed Building Products, Inc. (a) | | | 61 | | | | 4 | | |
Intellia Therapeutics, Inc. (a) | | | 132 | | | | 2 | | |
Intercontinental Exchange, Inc. | | | 545 | | | | 50 | | |
Intersect ENT, Inc. (a) | | | 120 | | | | 3 | | |
Intuit, Inc. | | | 27 | | | | 7 | | |
Intuitive Surgical, Inc. (a) | | | 352 | | | | 208 | | |
Invitae Corp. (a) | | | 139 | | | | 2 | | |
LiveRamp Holdings, Inc. (a) | | | 237 | | | | 11 | | |
Lyft, Inc., Class A | | | 403 | | | | 17 | | |
Madison Square Garden Co. (The), Class A (a) | | | 73 | | | | 21 | | |
MakeMyTrip Ltd. (a) | | | 291 | | | | 7 | | |
Martin Marietta Materials, Inc. | | | 107 | | | | 30 | | |
Mastercard, Inc., Class A | | | 367 | | | | 110 | | |
Match Group, Inc. (a) | | | 91 | | | | 7 | | |
McCormick & Co., Inc. | | | 91 | | | | 15 | | |
MercadoLibre, Inc. (a) | | | 224 | | | | 128 | | |
Moderna, Inc. (a) | | | 425 | | | | 8 | | |
Mohawk Group Holdings, Inc. (a) | | | 122 | | | | 1 | | |
MongoDB, Inc. (a) | | | 617 | | | | 81 | | |
NanoString Technologies, Inc. (a) | | | 1,946 | | | | 54 | | |
New Frontier Health Corp. (a) | | | 1,068 | | | | 10 | | |
Okta, Inc. (a) | | | 901 | | | | 104 | | |
Overstock.com, Inc. (a) | | | 1,302 | | | | 9 | | |
Party City Holdco, Inc. (a) | | | 1,136 | | | | 3 | | |
Peloton Interactive, Inc., Class A (a) | | | 376 | | | | 11 | | |
Penumbra, Inc. (a) | | | 133 | | | | 22 | | |
Phreesia, Inc. (a) | | | 293 | | | | 8 | | |
Pinterest, Inc., Class A (a) | | | 413 | | | | 8 | | |
Quotient Ltd. (a) | | | 1,447 | | | | 14 | | |
RealReal, Inc. (The) (a) | | | 259 | | | | 5 | | |
Redfin Corp. (a) | | | 341 | | | | 7 | | |
Roku, Inc. (a) | | | 356 | | | | 48 | | |
The accompanying notes are an integral part of the financial statements.
7
Morgan Stanley Institutional Fund, Inc.
Annual Report — December 31, 2019
Portfolio of Investments (cont'd)
Global Counterpoint Portfolio
| | | Shares | | Value
(000) | |
United States (cont'd) | |
Rollins, Inc. | | | 1,236 | | | $ | 41 | | |
Roper Technologies, Inc. | | | 19 | | | | 7 | | |
S&P Global, Inc. | | | 196 | | | | 54 | | |
salesforce.com, Inc. (a) | | | 259 | | | | 42 | | |
Service Corp. International | | | 326 | | | | 15 | | |
ServiceNow, Inc. (a) | | | 500 | | | | 141 | | |
Shake Shack, Inc., Class A (a) | | | 117 | | | | 7 | | |
Sherwin-Williams Co. (The) | | | 25 | | | | 15 | | |
Shockwave Medical, Inc. (a) | | | 116 | | | | 5 | | |
Slack Technologies, Inc., Class A (a) | | | 2,998 | | | | 67 | | |
Smartsheet, Inc., Class A (a) | | | 1,279 | | | | 57 | | |
Snap, Inc., Class A (a) | | | 1,833 | | | | 30 | | |
Spotify Technology SA (a) | | | 1,231 | | | | 184 | | |
Square, Inc., Class A (a) | | | 526 | | | | 33 | | |
Starbucks Corp. | | | 351 | | | | 31 | | |
Stitch Fix, Inc., Class A (a) | | | 806 | | | | 21 | | |
Trade Desk, Inc. (The), Class A (a) | | | 237 | | | | 62 | | |
Trupanion, Inc. (a) | | | 204 | | | | 8 | | |
Twilio, Inc., Class A (a) | | | 617 | | | | 61 | | |
Twitter, Inc. (a) | | | 3,807 | | | | 122 | | |
Uber Technologies, Inc. (a) | | | 3,096 | | | | 92 | | |
Union Pacific Corp. | | | 68 | | | | 12 | | |
UnitedHealth Group, Inc. | | | 31 | | | | 9 | | |
Vail Resorts, Inc. | | | 59 | | | | 14 | | |
Veeva Systems, Inc., Class A (a) | | | 1,095 | | | | 154 | | |
Verisk Analytics, Inc. | | | 291 | | | | 43 | | |
Visa, Inc., Class A | | | 305 | | | | 57 | | |
Vulcan Materials Co. | | | 100 | | | | 14 | | |
Walt Disney Co. (The) | | | 785 | | | | 114 | | |
Waste Connections, Inc. | | | 463 | | | | 42 | | |
Watsco, Inc. | | | 81 | | | | 15 | | |
Wayfair, Inc., Class A (a) | | | 385 | | | | 35 | | |
Workday, Inc., Class A (a) | | | 472 | | | | 78 | | |
XP, Inc., Class A (a) | | | 759 | | | | 29 | | |
XPO Logistics, Inc. (a) | | | 182 | | | | 14 | | |
Zillow Group, Inc., Class A (a) | | | 299 | | | | 14 | | |
Zillow Group, Inc., Class C (a) | | | 981 | | | | 45 | | |
Zoetis, Inc. | | | 502 | | | | 66 | | |
Zoom Video Communications, Inc., Class A (a) | | | 419 | | | | 29 | | |
| | | | 4,862 | | |
Total Common Stocks (Cost $7,156) | | | 8,369 | | |
| | | Shares | | Value
(000) | |
Short-Term Investment (21.3%) | |
Investment Company (21.3%) | |
Morgan Stanley Institutional Liquidity
Funds — Treasury Securities Portfolio —
Institutional Class (See Note G)
(Cost $2,154) | | | 2,154,213 | | | $ | 2,154 | | |
Total Investments Excluding Purchased
Options (103.9%) (Cost $9,310) | | | | | 10,523 | | |
Total Purchased Options Outstanding (0.0%)
(Cost $20) | | | 3 | | |
Total Investments (103.9%) (Cost $9,330) (d)(e) | | | 10,526 | | |
Liabilities in Excess of Other Assets (–3.9%) | | | (392 | ) | |
Net Assets (100.0%) | | $ | 10,134 | | |
Country assignments and aggregations are based generally on third party vendor classifications and information, and may be different from the assignments and aggregations under the policies set forth in the Fund's prospectus and/or statement of additional information relating to geographic classifications.
(a) Non-income producing security.
(b) Security trades on the Hong Kong exchange.
(c) 144A security — Certain conditions for public sale may exist. Unless otherwise noted, these securities are deemed to be liquid.
(d) The approximate fair value and percentage of net assets, $776,000 and 7.7%, respectively, represent the securities that have been fair valued under the fair valuation policy for international investments as described in Note A-1 within the Notes to the Financial Statements.
(e) At December 31, 2019, the aggregate cost for federal income tax purposes is approximately $9,423,000. The aggregate gross unrealized appreciation is approximately $1,362,000 and the aggregate gross unrealized depreciation is approximately $259,000, resulting in net unrealized appreciation of approximately $1,103,000.
ADR American Depositary Receipt.
The accompanying notes are an integral part of the financial statements.
8
Morgan Stanley Institutional Fund, Inc.
Annual Report — December 31, 2019
Portfolio of Investments (cont'd)
Global Counterpoint Portfolio
Call Options Purchased:
The Fund had the following call options purchased open at December 31, 2019:
Counterparty | | Description | | Strike
Price | | Expiration
Date | | Number of
Contracts | | Notional
Amount
(000) | | Value
(000) | | Premiums
Paid
(000) | | Unrealized
Depreciation
(000) | |
JP Morgan Chase Bank NA | | USD/CNH | | CNH | 7.62 | | | Jan-20 | | | 1,200,000 | | | | 1,200 | | | $ | — | @ | | $ | 5 | | | $ | (5 | ) | |
JP Morgan Chase Bank NA | | USD/CNH | | CNH | 8.09 | | | Sep-20 | | | 1,626,361 | | | | 1,626 | | | | 2 | | | | 7 | | | | (5 | ) | |
JPMorgan Chase Bank NA | | USD/CNH | | CNH | 7.86 | | | Jun-20 | | | 1,534,000 | | | | 1,534 | | | | 1 | | | | 8 | | | | (7 | ) | |
| | | | | | | | | | | | | $ | 3 | | | $ | 20 | | | $ | (17 | ) | |
@ Value is less than $500.
CNH — Chinese Yuan Renminbi Offshore
USD — United States Dollar
Portfolio Composition
Classification | | Percentage of
Total Investments | |
Other* | | | 42.7 | % | |
Short-Term Investments | | | 20.5 | | |
Software | | | 9.3 | | |
Information Technology Services | | | 8.9 | | |
Internet & Direct Marketing Retail | | | 8.1 | | |
Textiles, Apparel & Luxury Goods | | | 5.4 | | |
Interactive Media & Services | | | 5.1 | | |
Total Investments | | | 100.0 | % | |
* Industries and/or investment types representing less than 5% of total investments.
The accompanying notes are an integral part of the financial statements.
9
Morgan Stanley Institutional Fund, Inc.
Annual Report — December 31, 2019
Global Counterpoint Portfolio
Statement of Assets and Liabilities | | December 31, 2019
(000) | |
Assets: | |
Investments in Securities of Unaffiliated Issuers, at Value (Cost $7,176) | | $ | 8,372 | | |
Investment in Security of Affiliated Issuer, at Value (Cost $2,154) | | | 2,154 | | |
Total Investments in Securities, at Value (Cost $9,330) | | | 10,526 | | |
Foreign Currency, at Value (Cost $6) | | | 6 | | |
Cash | | | — | @ | |
Receivable for Fund Shares Sold | | | 297 | | |
Due from Adviser | | | 52 | | |
Receivable for Investments Sold | | | 23 | | |
Dividends Receivable | | | 3 | | |
Tax Reclaim Receivable | | | 2 | | |
Receivable from Affiliate | | | 1 | | |
Other Assets | | | 23 | | |
Total Assets | | | 10,933 | | |
Liabilities: | |
Payable for Investments Purchased | | | 600 | | |
Payable for Offering Costs | | | 133 | | |
Payable for Professional Fees | | | 42 | | |
Payable for Custodian Fees | | | 11 | | |
Payable for Transfer Agency Fees — Class A | | | — | @ | |
Payable for Transfer Agency Fees — Class C | | | — | @ | |
Payable for Transfer Agency Fees — Class IS | | | — | @ | |
Payable for Administration Fees | | | 1 | | |
Payable for Shareholder Services Fees — Class A | | | — | @ | |
Payable for Distribution and Shareholder Services Fees — Class C | | | — | @ | |
Other Liabilities | | | 12 | | |
Total Liabilities | | | 799 | | |
Net Assets | | $ | 10,134 | | |
Net Assets Consist of: | |
Paid-in-Capital | | $ | 9,150 | | |
Total Distributable Earnings | | | 984 | | |
Net Assets | | $ | 10,134 | | |
CLASS I: | |
Net Assets | | $ | 10,097 | | |
| Shares Outstanding $0.001 par value shares of beneficial interest (unlimited shares authorized) (not in 000's) | | | 891,878 | | |
Net Asset Value, Offering and Redemption Price Per Share | | $ | 11.32 | | |
CLASS A: | |
Net Assets | | $ | 15 | | |
| Shares Outstanding $0.001 par value shares of beneficial interest (unlimited shares authorized) (not in 000's) | | | 1,323 | | |
Net Asset Value, Redemption Price Per Share | | $ | 11.28 | | |
Maximum Sales Load | | | 5.25 | % | |
Maximum Sales Charge | | $ | 0.63 | | |
Maximum Offering Price Per Share | | $ | 11.91 | | |
CLASS C: | |
Net Assets | | $ | 11 | | |
| Shares Outstanding $0.001 par value shares of beneficial interest (unlimited shares authorized) (not in 000's) | | | 1,000 | | |
Net Asset Value, Offering and Redemption Price Per Share | | $ | 11.20 | | |
CLASS IS: | |
Net Assets | | $ | 11 | | |
| Shares Outstanding $0.001 par value shares of beneficial interest (unlimited shares authorized) (not in 000's) | | | 1,000 | | |
Net Asset Value, Offering and Redemption Price Per Share | | $ | 11.32 | | |
@ Amount is less than $500.
The accompanying notes are an integral part of the financial statements.
10
Morgan Stanley Institutional Fund, Inc.
Annual Report — December 31, 2019
Global Counterpoint Portfolio
Statement of Operations | | Year Ended
December 31, 2019
(000) | |
Investment Income: | |
Dividends from Securities of Unaffiliated Issuers (Net of $6 of Foreign Taxes Withheld) | | $ | 48 | | |
Dividends from Security of Affiliated Issuer (Note G) | | | 7 | | |
Total Investment Income | | | 55 | | |
Expenses: | |
Professional Fees | | | 107 | | |
Custodian Fees (Note F) | | | 58 | | |
Advisory Fees (Note B) | | | 57 | | |
Offering Costs | | | 53 | | |
Registration Fees | | | 33 | | |
Shareholder Reporting Fees | | | 16 | | |
Pricing Fees | | | 14 | | |
Transfer Agency Fees — Class I (Note E) | | | 3 | | |
Transfer Agency Fees — Class A (Note E) | | | 2 | | |
Transfer Agency Fees — Class C (Note E) | | | 2 | | |
Transfer Agency Fees — Class IS (Note E) | | | 2 | | |
Administration Fees (Note C) | | | 6 | | |
Directors' Fees and Expenses | | | 3 | | |
Shareholder Services Fees — Class A (Note D) | | | — | @ | |
Distribution and Shareholder Services Fees — Class C (Note D) | | | — | @ | |
Other Expenses | | | 23 | | |
Total Expenses | | | 379 | | |
Expenses Reimbursed by Adviser (Note B) | | | (242 | ) | |
Waiver of Advisory Fees (Note B) | | | (57 | ) | |
Reimbursement of Class Specific Expenses — Class A (Note B) | | | (2 | ) | |
Reimbursement of Class Specific Expenses — Class C (Note B) | | | (2 | ) | |
Reimbursement of Class Specific Expenses — Class IS (Note B) | | | (2 | ) | |
Rebate from Morgan Stanley Affiliate (Note G) | | | (1 | ) | |
Net Expenses | | | 73 | | |
Net Investment Loss | | | (18 | ) | |
Realized Gain (Loss): | |
Investments Sold | | | 230 | | |
Foreign Currency Translation | | | (— | @) | |
Net Realized Gain | | | 230 | | |
Change in Unrealized Appreciation (Depreciation): | |
Investments | | | 1,737 | | |
Foreign Currency Translation | | | — | @ | |
Net Change in Unrealized Appreciation (Depreciation) | | | 1,737 | | |
Net Realized Gain and Change in Unrealized Appreciation (Depreciation) | | | 1,967 | | |
Net Increase in Net Assets Resulting from Operations | | $ | 1,949 | | |
@ Amount is less than $500.
The accompanying notes are an integral part of the financial statements.
11
Morgan Stanley Institutional Fund, Inc.
Annual Report — December 31, 2019
Global Counterpoint Portfolio
Statements of Changes in Net Assets | | Year Ended
December 31, 2019
(000) | | Period from
June 29, 2018^ to
December 31, 2018
(000) | |
Increase (Decrease) in Net Assets: | |
Operations: | |
Net Investment Loss | | $ | (18 | ) | | $ | (19 | ) | |
Net Realized Gain (Loss) | | | 230 | | | | (411 | ) | |
Net Change in Unrealized Appreciation (Depreciation) | | | 1,737 | | | | (541 | ) | |
Net Increase (Decrease) in Net Assets Resulting from Operations | | | 1,949 | | | | (971 | ) | |
Dividends and Distributions to Shareholders: | |
Class I | | | — | | | | (21 | ) | |
Class A | | | — | | | | (— | @) | |
Class C | | | — | | | | (— | @) | |
Class IS | | | — | | | | (— | @) | |
Paid-in-Capital: | |
Class I | | | — | | | | (50 | ) | |
Class A | | | — | | | | (— | @) | |
Class C | | | — | | | | (— | @) | |
Class IS | | | — | | | | (— | @) | |
Total Dividends and Distributions to Shareholders | | | — | | | | (71 | ) | |
Capital Share Transactions:(1) | |
Class I: | |
Subscribed | | | 2,424 | | | | 6,750 | | |
Distributions Reinvested | | | — | | | | 19 | | |
Class A: | |
Subscribed | | | 4 | | | | 10 | | |
Redeemed | | | (— | @) | | | — | | |
Class C: | |
Subscribed | | | — | | | | 10 | | |
Class IS: | |
Subscribed | | | — | | | | 10 | | |
Net Increase in Net Assets Resulting from Capital Share Transactions | | | 2,428 | | | | 6,799 | | |
Total Increase in Net Assets | | | 4,377 | | | | 5,757 | | |
Net Assets: | |
Beginning of Period | | | 5,757 | | | | — | | |
End of Period | | $ | 10,134 | | | $ | 5,757 | | |
(1) Capital Share Transactions: | |
Class I: | |
Shares Subscribed | | | 215 | | | | 675 | | |
Shares Issued on Distributions Reinvested | | | — | | | | 2 | | |
Net Increase in Class I Shares Outstanding | | | 215 | | | | 677 | | |
Class A: | |
Shares Subscribed | | | — | @@ | | | 1 | | |
Shares Redeemed | | | (— | @@) | | | — | | |
Net Increase in Class A Shares Outstanding | | | — | @@ | | | 1 | | |
Class C: | |
Shares Subscribed | | | — | | | | 1 | | |
Class IS: | |
Shares Subscribed | | | — | | | | 1 | | |
^ Commencement of Operations.
@ Amount is less than $500.
@@ Amount is less than 500 shares.
The accompanying notes are an integral part of the financial statements.
12
Morgan Stanley Institutional Fund, Inc.
Annual Report — December 31, 2019
Financial Highlights
Global Counterpoint Portfolio
| | | Class I | |
Selected Per Share Data and Ratios | | Year Ended
December 31, 2019 | | Period from
June 29, 2018(1) to
December 31, 2018 | |
Net Asset Value, Beginning of Period | | $ | 8.46 | | | $ | 10.00 | | |
Income (Loss) from Investment Operations: | |
Net Investment Loss(2) | | | (0.03 | ) | | | (0.03 | ) | |
Net Realized and Unrealized Gain (Loss) | | | 2.89 | | | | (1.41 | ) | |
Total from Investment Operations | | | 2.86 | | | | (1.44 | ) | |
Distributions from and/or in Excess of: | |
Net Investment Income | | | — | | | | (0.03 | ) | |
Paid-in-Capital | | | — | | | | (0.07 | ) | |
Total Distributions | | | — | | | | (0.10 | ) | |
Net Asset Value, End of Period | | $ | 11.32 | | | $ | 8.46 | | |
Total Return(3) | | | 33.81 | % | | | (14.36 | )%(5) | |
Ratios to Average Net Assets and Supplemental Data: | |
Net Assets, End of Period (Thousands) | | $ | 10,097 | | | $ | 5,733 | | |
Ratio of Expenses Before Expense Limitation | | | 5.22 | % | | | 6.83 | %(6) | |
Ratio of Expenses After Expense Limitation | | | 1.03 | %(4) | | | 1.03 | %(4)(6) | |
Ratio of Net Investment Loss | | | (0.25 | )%(4) | | | (0.54 | )%(4)(6) | |
Ratio of Rebate from Morgan Stanley Affiliates | | | 0.01 | % | | | 0.01 | %(6) | |
Portfolio Turnover Rate | | | 67 | % | | | 54 | %(5) | |
(1) Commencement of Operations.
(2) Per share amount is based on average shares outstanding.
(3) Calculated based on the net asset value as of the last business day of the period.
(4) The Ratio of Expenses After Expense Limitation and Ratio of Net Investment Loss reflect the rebate of certain Fund expenses in connection with the investments in Morgan Stanley affiliates during the period. The effect of the rebate on the ratios is disclosed in the above table as "Ratio of Rebate from Morgan Stanley Affiliates."
(5) Not annualized.
(6) Annualized.
The accompanying notes are an integral part of the financial statements.
13
Morgan Stanley Institutional Fund, Inc.
Annual Report — December 31, 2019
Financial Highlights
Global Counterpoint Portfolio
| | | Class A | |
Selected Per Share Data and Ratios | | Year Ended
December 31, 2019 | | Period from
June 29, 2018(1) to
December 31, 2018 | |
Net Asset Value, Beginning of Period | | $ | 8.47 | | | $ | 10.00 | | |
Income (Loss) from Investment Operations: | |
Net Investment Loss(2) | | | (0.06 | ) | | | (0.04 | ) | |
Net Realized and Unrealized Gain (Loss) | | | 2.87 | | | | (1.40 | ) | |
Total from Investment Operations | | | 2.81 | | | | (1.44 | ) | |
Distributions from and/or in Excess of: | |
Net Investment Income | | | — | | | | (0.03 | ) | |
Paid-in-Capital | | | — | | | | (0.06 | ) | |
Total Distributions | | | — | | | | (0.09 | ) | |
Net Asset Value, End of Period | | $ | 11.28 | | | $ | 8.47 | | |
Total Return(3) | | | 33.18 | % | | | (14.44 | )%(5) | |
Ratios to Average Net Assets and Supplemental Data: | |
Net Assets, End of Period (Thousands) | | $ | 15 | | | $ | 8 | | |
Ratio of Expenses Before Expense Limitation | | | 23.73 | % | | | 26.82 | %(6) | |
Ratio of Expenses After Expense Limitation | | | 1.39 | %(4) | | | 1.39 | %(4)(6) | |
Ratio of Net Investment Loss | | | (0.62 | )%(4) | | | (0.91 | )%(4)(6) | |
Ratio of Rebate from Morgan Stanley Affiliates | | | 0.01 | % | | | 0.01 | %(6) | |
Portfolio Turnover Rate | | | 67 | % | | | 54 | %(5) | |
(1) Commencement of Operations.
(2) Per share amount is based on average shares outstanding.
(3) Calculated based on the net asset value which does not reflect sales charges, if applicable, as of the last business day of the period.
(4) The Ratio of Expenses After Expense Limitation and Ratio of Net Investment Loss reflect the rebate of certain Fund expenses in connection with the investments in Morgan Stanley affiliates during the period. The effect of the rebate on the ratios is disclosed in the above table as "Ratio of Rebate from Morgan Stanley Affiliates."
(5) Not annualized.
(6) Annualized.
The accompanying notes are an integral part of the financial statements.
14
Morgan Stanley Institutional Fund, Inc.
Annual Report — December 31, 2019
Financial Highlights
Global Counterpoint Portfolio
| | | Class C | |
Selected Per Share Data and Ratios | | Year Ended
December 31, 2019 | | Period from
June 29, 2018(1) to
December 31, 2018 | |
Net Asset Value, Beginning of Period | | $ | 8.47 | | | $ | 10.00 | | |
Income (Loss) from Investment Operations: | |
Net Investment Loss(2) | | | (0.14 | ) | | | (0.08 | ) | |
Net Realized and Unrealized Gain (Loss) | | | 2.87 | | | | (1.40 | ) | |
Total from Investment Operations | | | 2.73 | | | | (1.48 | ) | |
Distributions from and/or in Excess of: | |
Net Investment Income | | | — | | | | (0.02 | ) | |
Paid-in-Capital | | | — | | | | (0.03 | ) | |
Total Distributions | | | — | | | | (0.05 | ) | |
Net Asset Value, End of Period | | $ | 11.20 | | | $ | 8.47 | | |
Total Return(3) | | | 32.23 | % | | | (14.80 | )%(5) | |
Ratios to Average Net Assets and Supplemental Data: | |
Net Assets, End of Period (Thousands) | | $ | 11 | | | $ | 8 | | |
Ratio of Expenses Before Expense Limitation | | | 24.53 | % | | | 27.44 | %(6) | |
Ratio of Expenses After Expense Limitation | | | 2.14 | %(4) | | | 2.14 | %(4)(6) | |
Ratio of Net Investment Loss | | | (1.37 | )%(4) | | | (1.66 | )%(4)(6) | |
Ratio of Rebate from Morgan Stanley Affiliates | | | 0.01 | % | | | 0.01 | %(6) | |
Portfolio Turnover Rate | | | 67 | % | | | 54 | %(5) | |
(1) Commencement of Operations.
(2) Per share amount is based on average shares outstanding.
(3) Calculated based on the net asset value which does not reflect sales charges, if applicable, as of the last business day of the period.
(4) The Ratio of Expenses After Expense Limitation and Ratio of Net Investment Loss reflect the rebate of certain Fund expenses in connection with the investments in Morgan Stanley affiliates during the period. The effect of the rebate on the ratios is disclosed in the above table as "Ratio of Rebate from Morgan Stanley Affiliates."
(5) Not annualized.
(6) Annualized.
The accompanying notes are an integral part of the financial statements.
15
Morgan Stanley Institutional Fund, Inc.
Annual Report — December 31, 2019
Financial Highlights
Global Counterpoint Portfolio
| | | Class IS | |
Selected Per Share Data and Ratios | | Year Ended
December 31, 2019 | | Period from
June 29, 2018(1) to
December 31, 2018 | |
Net Asset Value, Beginning of Period | | $ | 8.46 | | | $ | 10.00 | | |
Income (Loss) from Investment Operations: | |
Net Investment Loss(2) | | | (0.02 | ) | | | (0.02 | ) | |
Net Realized and Unrealized Gain (Loss) | | | 2.88 | | | | (1.41 | ) | |
Total from Investment Operations | | | 2.86 | | | | (1.43 | ) | |
Distributions from and/or in Excess of: | |
Net Investment Income | | | — | | | | (0.03 | ) | |
Paid-in-Capital | | | — | | | | (0.08 | ) | |
Total Distributions | | | — | | | | (0.11 | ) | |
Net Asset Value, End of Period | | $ | 11.32 | | | $ | 8.46 | | |
Total Return(3) | | | 33.81 | % | | | (14.34 | )%(5) | |
Ratios to Average Net Assets and Supplemental Data: | |
Net Assets, End of Period (Thousands) | | $ | 11 | | | $ | 8 | | |
Ratio of Expenses Before Expense Limitation | | | 23.44 | % | | | 26.39 | %(6) | |
Ratio of Expenses After Expense Limitation | | | 0.99 | %(4) | | | 0.99 | %(4)(6) | |
Ratio of Net Investment Loss | | | (0.22 | )%(4) | | | (0.51 | )%(4)(6) | |
Ratio of Rebate from Morgan Stanley Affiliates | | | 0.01 | % | | | 0.01 | %(6) | |
Portfolio Turnover Rate | | | 67 | % | | | 54 | %(5) | |
(1) Commencement of Operations.
(2) Per share amount is based on average shares outstanding.
(3) Calculated based on the net asset value as of the last business day of the period.
(4) The Ratio of Expenses After Expense Limitation and Ratio of Net Investment Loss reflect the rebate of certain Fund expenses in connection with the investments in Morgan Stanley affiliates during the period. The effect of the rebate on the ratios is disclosed in the above table as "Ratio of Rebate from Morgan Stanley Affiliates."
(5) Not annualized.
(6) Annualized.
The accompanying notes are an integral part of the financial statements.
16
Morgan Stanley Institutional Fund, Inc.
Annual Report — December 31, 2019
Notes to Financial Statements
Morgan Stanley Institutional Fund, Inc. (the "Company") is registered under the Investment Company Act of 1940, as amended (the "Act"), as an open-end management investment company. The Company is comprised of thirty-two separate, active, diversified and non-diversified funds (individually referred to as a "Fund," collectively as the "Funds"). The Company applies investment company accounting and reporting guidance.
The accompanying financial statements relate to the Global Counterpoint Portfolio. The Fund seeks long-term capital appreciation.
The Fund offers four classes of shares — Class I, Class A, Class C and Class IS.
A. Significant Accounting Policies: The following significant accounting policies are in conformity with U.S. generally accepted accounting principles ("GAAP"). Such policies are consistently followed by the Company in the preparation of its financial statements. GAAP may require management to make estimates and assumptions that affect the reported amounts and disclosures in the financial statements. Actual results may differ from those estimates.
In August 2018, the Financial Accounting Standards Board ("FASB") issued Accounting Standards Update ("ASU") 2018-13, Fair Value Measurement (Topic 820) — Disclosures Framework — Changes to Disclosure Requirements of Fair Value Measurement ("ASU 2018-13") which introduces new fair value disclosure requirements as well as eliminates and modifies certain existing fair value disclosure requirements. ASU 2018-13 would be effective for fiscal years beginning after December 15, 2019 and for interim periods within those fiscal years; however, management has elected to early adopt ASU 2018-13 as permitted by the standard. The impact of the Fund's adoption was limited to changes in the Fund's financial statement disclosures regarding fair value, primarily those disclosures related to transfers between levels of the fair value hierarchy and disclosure of the range and weighted average used to develop significant unobservable inputs for Level 3 fair value measurements, when applicable.
1. Security Valuation: (1) An equity portfolio security listed or traded on an exchange is valued at its latest reported sales price (or at the exchange official closing price if such exchange reports an official closing price), and if there were no sales on a given day and if there is no official exchange closing price for that day, the security is valued at the mean between the last reported bid and asked prices
if such bid and asked prices are available on the relevant exchanges. If only bid prices are available then the latest bid price may be used. Listed equity securities not traded on the valuation date with no reported bid and asked prices available on the exchange are valued at the mean between the current bid and asked prices obtained from one or more reputable brokers or dealers. In cases where a security is traded on more than one exchange, the security is valued on the exchange designated as the primary market; (2) all other equity portfolio securities for which over-the-counter ("OTC") market quotations are readily available are valued at the latest reported sales price (or at the market official closing price if such market reports an official closing price), and if there was no trading in the security on a given day and if there is no official closing price from relevant markets for that day, the security is valued at the mean between the last reported bid and asked prices if such bid and asked prices are available on the relevant markets. An unlisted equity security that does not trade on the valuation date and for which bid and asked prices from the relevant markets are unavailable is valued at the mean between the current bid and asked prices obtained from one or more reputable brokers or dealers; (3) listed options are valued at the last reported sales price on the exchange on which they are listed (or at the exchange official closing price if such exchange reports an official closing price). If an official closing price or last reported sales price is unavailable, the listed option should be fair valued at the mean between its latest bid and ask prices. Unlisted options are valued at the mean between their latest bid and ask prices from a broker/dealer or valued by a pricing service/vendor; (4) certain portfolio securities may be valued by an outside pricing service/vendor approved by the Company's Board of Directors (the "Directors"). The pricing service/vendor may employ a pricing model that takes into account, among other things, bids, yield spreads and/or other market data and specific security characteristics. Alternatively, if a valuation is not available from an outside pricing service/vendor, and the security trades on an exchange, the security may be valued at its latest reported sale price (or at the exchange official closing price if such exchange reports an official closing price), prior to the time when assets are valued. If there are no sales on a given day and if there is no official exchange closing price for that day, the security is valued at the mean between the last reported bid and asked prices if such bid and asked prices are available in the relevant exchanges. If Morgan
17
Morgan Stanley Institutional Fund, Inc.
Annual Report — December 31, 2019
Notes to Financial Statements (cont'd)
Stanley Investment Management Inc. (the "Adviser"), a wholly-owned subsidiary of Morgan Stanley, determines that the price provided by the outside pricing service/vendor or exchange does not reflect the security's fair value or is unable to provide a price, prices from brokers or dealers may also be utilized. In these circumstances, the value of the security will be the mean of bid and asked prices obtained from brokers or dealers; (5) when market quotations are not readily available, including circumstances under which the Adviser determines that the closing price, last sale price or the mean between the last reported bid and asked prices are not reflective of a security's market value, portfolio securities are valued at their fair value as determined in good faith under procedures established by and under the general supervision of the Directors. Occasionally, developments affecting the closing prices of securities and other assets may occur between the times at which valuations of such securities are determined (that is, close of the foreign market on which the securities trade) and the close of business of the New York Stock Exchange ("NYSE"). If developments occur during such periods that are expected to materially affect the value of such securities, such valuations may be adjusted to reflect the estimated fair value of such securities as of the close of the NYSE, as determined in good faith by the Directors or by the Adviser using a pricing service and/or procedures approved by the Directors; (6) quotations of foreign portfolio securities, other assets and liabilities and forward contracts stated in foreign currency are translated into U.S. dollar equivalents at the prevailing market rates prior to the close of the NYSE; and (7) investments in mutual funds, including the Morgan Stanley Institutional Liquidity Funds, are valued at the net asset value ("NAV") as of the close of each business day.
The Directors have responsibility for determining in good faith the fair value of the investments, and the Directors may appoint others, such as the Company's Adviser or a valuation committee, to assist the Directors in determining fair value and to make the actual calculations pursuant to the fair valuation methodologies previously approved by the Directors. Under procedures approved by the Directors, the Company's Adviser has formed a Valuation Committee whose members are approved by the Directors. The Valuation Committee provides administration and oversight of the Company's valuation policies and procedures, which are reviewed at
least annually by the Directors. These procedures allow the Company to utilize independent pricing services, quotations from securities and financial instrument dealers and other market sources to determine fair value.
2. Fair Value Measurement: FASB Accounting Standards CodificationTM ("ASC") 820, "Fair Value Measurement" ("ASC 820"), defines fair value as the value that the Fund would receive to sell an investment or pay to transfer a liability in a timely transaction with an independent buyer in the principal market, or in the absence of a principal market, the most advantageous market for the investment or liability. ASC 820 establishes a three-tier hierarchy to distinguish between (1) inputs that reflect the assumptions market participants would use in valuing an asset or liability developed based on market data obtained from sources independent of the reporting entity (observable inputs) and (2) inputs that reflect the reporting entity's own assumptions about the assumptions market participants would use in valuing an asset or liability developed based on the best information available in the circumstances (unobservable inputs) and to establish classification of fair value measurements for disclosure purposes. Various inputs are used in determining the value of the Fund's investments. The inputs are summarized in the three broad levels listed below:
• Level 1 – unadjusted quoted prices in active markets for identical investments
• Level 2 – other significant observable inputs (including quoted prices for similar investments, interest rates, prepayment speeds, credit risk, etc.)
• Level 3 – significant unobservable inputs including the Fund's own assumptions in determining the fair value of investments. Factors considered in making this determination may include, but are not limited to, information obtained by contacting the issuer, analysts, or the appropriate stock exchange (for exchange-traded securities), analysis of the issuer's financial statements or other available documents and, if necessary, available information concerning other securities in similar circumstances.
The inputs or methodology used for valuing securities are not necessarily an indication of the risk associated
18
Morgan Stanley Institutional Fund, Inc.
Annual Report — December 31, 2019
Notes to Financial Statements (cont'd)
with investing in those securities and the determination of the significance of a particular input to the fair value measurement in its entirety requires judgment and considers factors specific to each security.
The following is a summary of the inputs used to value the Fund's investments as of December 31, 2019:
Investment Type | | Level 1
Unadjusted
quoted
prices
(000) | | Level 2
Other
significant
observable
inputs
(000) | | Level 3
Significant
unobservable
inputs
(000) | | Total
(000) | |
Assets: | |
Common Stocks | |
Aerospace & Defense | | $ | 60 | | | $ | — | | | $ | — | | | $ | 60 | | |
Air Freight & Logistics | | | 14 | | | | 165 | | | | — | | | | 179 | | |
Banks | | | 305 | | | | — | | | | — | | | | 305 | | |
Beverages | | | 214 | | | | — | | | | — | | | | 214 | | |
Biotechnology | | | 38 | | | | 31 | | | | — | | | | 69 | | |
Capital Markets | | | 209 | | | | 15 | | | | — | | | | 224 | | |
Chemicals | | | 143 | | | | 99 | | | | — | | | | 242 | | |
Commercial Services &
Supplies | | | 235 | | | | — | | | | — | | | | 235 | | |
Construction Materials | | | 44 | | | | — | | | | — | | | | 44 | | |
Containers &
Packaging | | | 7 | | | | — | | | | — | | | | 7 | | |
Diversified Consumer
Services | | | 288 | | | | — | | | | — | | | | 288 | | |
Diversified Holding
Companies | | | 1 | | | | — | | | | — | | | | 1 | | |
Diversified
Telecommunication
Services | | | 12 | | | | — | | | | — | | | | 12 | | |
Electrical Equipment | | | 7 | | | | — | | | | — | | | | 7 | | |
Electronic Equipment,
Instruments &
Components | | | 7 | | | | 70 | | | | — | | | | 77 | | |
Entertainment | | | 402 | | | | — | | | | — | | | | 402 | | |
Food Products | | | 119 | | | | 43 | | | | — | | | | 162 | | |
Health Care
Equipment &
Supplies | | | 330 | | | | 4 | | | | — | | | | 334 | | |
Health Care
Providers &
Services | | | 107 | | | | 10 | | | | — | | | | 117 | | |
Health Care
Technology | | | 220 | | | | 6 | | | | — | | | | 226 | | |
Hotels,
Restaurants &
Leisure | | | 135 | | | | — | | | | — | | | | 135 | | |
Household Durables | | | 23 | | | | — | | | | — | | | | 23 | | |
Household Products | | | 35 | | | | 33 | | | | — | | | | 68 | | |
Industrial
Conglomerates | | | 7 | | | | — | | | | — | | | | 7 | | |
Information Technology
Services | | | 939 | | | | — | | | | — | | | | 939 | | |
Insurance | | | 54 | | | | — | | | | — | | | | 54 | | |
Interactive Media &
Services | | | 466 | | | | 68 | | | | — | | | | 534 | | |
Internet & Direct
Marketing Retail | | | 841 | | | | 11 | | | | — | | | | 852 | | |
Leisure Products | | | 11 | | | | — | | | | — | | | | 11 | | |
Investment Type | | Level 1
Unadjusted
quoted
prices
(000) | | Level 2
Other
significant
observable
inputs
(000) | | Level 3
Significant
unobservable
inputs
(000) | | Total
(000) | |
Common Stocks (cont'd) | |
Life Sciences Tools &
Services | | $ | 192 | | | $ | 6 | | | $ | — | | | $ | 198 | | |
Machinery | | | — | | | | 9 | | | | — | | | | 9 | | |
Marine | | | — | | | | 21 | | | | — | | | | 21 | | |
Media | | | 26 | | | | — | | | | — | | | | 26 | | |
Multi-Line Retail | | | — | | | | 27 | | | | — | | | | 27 | | |
Multi-Utilities | | | 35 | | | | — | | | | — | | | | 35 | | |
Personal Products | | | 27 | | | | — | | | | — | | | | 27 | | |
Pharmaceuticals | | | 69 | | | | — | | | | — | | | | 69 | | |
Professional Services | | | 43 | | | | 24 | | | | — | | | | 67 | | |
Real Estate
Management &
Development | | | 95 | | | | — | | | | — | | | | 95 | | |
Road & Rail | | | 157 | | | | — | | | | — | | | | 157 | | |
Semiconductors &
Semiconductor
Equipment | | | 139 | | | | — | | | | — | | | | 139 | | |
Software | | | 972 | | | | 8 | | | | — | | | | 980 | | |
Specialty Retail | | | 52 | | | | — | | | | — | | | | 52 | | |
Textiles, Apparel &
Luxury Goods | | | 434 | | | | 136 | | | | — | | | | 570 | | |
Trading Companies &
Distributors | | | 20 | | | | — | | | | — | | | | 20 | | |
Transportation
Infrastructure | | | 49 | | | | — | | | | — | | | | 49 | | |
Total Common Stocks | | | 7,583 | | | | 786 | | | | — | | | | 8,369 | | |
Call Options Purchased | | | — | | | | 3 | | | | — | | | | 3 | | |
Short-Term Investment | |
Investment Company | | | 2,154 | | | | — | | | | — | | | | 2,154 | | |
Total Assets | | $ | 9,737 | | | $ | 789 | | | $ | — | | | $ | 10,526 | | |
Transfers between investment levels may occur as the markets fluctuate and/or the availability of data used in an investment's valuation changes.
3. Foreign Currency Translation and Foreign Investments: The books and records of the Fund are maintained in U.S. dollars. Foreign currency amounts are translated into U.S. dollars as follows:
– investments, other assets and liabilities at the prevailing rate of exchange on the valuation date;
– investment transactions and investment income at the prevailing rates of exchange on the dates of such transactions.
Although the net assets of the Fund are presented at the foreign exchange rates and market values at the close of the period, the Fund does not isolate that portion of the results of operations arising as a result of changes in the foreign exchange rates from the fluctuations arising from changes in the market prices of securities held at
19
Morgan Stanley Institutional Fund, Inc.
Annual Report — December 31, 2019
Notes to Financial Statements (cont'd)
period end. Similarly, the Fund does not isolate the effect of changes in foreign exchange rates from the fluctuations arising from changes in the market prices of securities sold during the period. Accordingly, realized and unrealized foreign currency gains (losses) on investments in securities are included in the reported net realized and unrealized gains (losses) on investment transactions and balances. However, pursuant to U.S. federal income tax regulations, gains and losses from certain foreign currency transactions and the foreign currency portion of gains and losses realized on sales and maturities of foreign denominated debt securities are treated as ordinary income for U.S. federal income tax purposes.
Net realized gains (losses) on foreign currency transactions represent net foreign exchange gains (losses) from foreign currency forward exchange contracts, disposition of foreign currencies, currency gains (losses) realized between the trade and settlement dates on securities transactions, and the difference between the amount of investment income and foreign withholding taxes recorded on the Fund's books and the U.S. dollar equivalent amounts actually received or paid. The change in unrealized currency gains (losses) on foreign currency transactions for the period is reflected in the Statement of Operations.
Foreign security and currency transactions may involve certain considerations and risks not typically associated with those of U.S. dollar denominated transactions as a result of, among other factors, fluctuations of exchange rates in relation to the U.S. dollar, the possibility of lower levels of governmental supervision and regulation of foreign securities markets and the possibility of political or economic instability.
Governmental approval for foreign investments may be required in advance of making an investment under certain circumstances in some countries, and the extent of foreign investments in domestic companies may be subject to limitation in other countries. Foreign ownership limitations also may be imposed by the charters of individual companies to prevent, among other concerns, violations of foreign investment limitations. As a result, an additional class of shares (identified as "Foreign" in the Portfolio of Investments) may be created and offered
for investment. The "local" and "foreign shares" market values may differ. In the absence of trading of the foreign shares in such markets, the Fund values the foreign shares at the closing exchange price of the local shares.
4. Derivatives: The Fund may, but is not required to, use derivative instruments for a variety of purposes, including hedging, risk management, portfolio management or to earn income. Derivatives are financial instruments whose value is based, in part, on the value of an underlying asset, interest rate, index or financial instrument. Prevailing interest rates and volatility levels, among other things, also affect the value of derivative instruments. A derivative instrument often has risks similar to its underlying asset and may have additional risks, including imperfect correlation between the value of the derivative and the underlying asset, risks of default by the counterparty to certain transactions, magnification of losses incurred due to changes in the market value of the securities, instruments, indices or interest rates to which the derivative instrument relates, risks that the transactions may not be liquid and risks arising from margin requirements. The use of derivatives involves risks that are different from, and possibly greater than, the risks associated with other portfolio investments. Derivatives may involve the use of highly specialized instruments that require investment techniques and risk analyses different from those associated with other portfolio investments. All of the Fund's holdings, including derivative instruments, are marked-to-market each day with the change in value reflected in unrealized appreciation (depreciation). Upon disposition, a realized gain or loss is recognized.
Certain derivative transactions may give rise to a form of leverage. Leverage magnifies the potential for gain and the risk of loss. Leverage associated with derivative transactions may cause the Fund to liquidate portfolio positions when it may not be advantageous to do so to satisfy its obligations or to meet earmarking or segregation requirements, pursuant to applicable Securities and Exchange Commission ("SEC") rules and regulations, or may cause the Fund to be more volatile than if the Fund had not been leveraged. Although the Adviser seeks to use derivatives to further the Fund's investment objectives, there is no assurance that the use of derivatives will achieve this result.
20
Morgan Stanley Institutional Fund, Inc.
Annual Report — December 31, 2019
Notes to Financial Statements (cont'd)
Following is a description of the derivative instruments and techniques that the Fund used during the period and their associated risks:
Options: With respect to options, the Fund is subject to equity risk, interest rate risk and foreign currency exchange risk in the normal course of pursuing its investment objectives. If the Fund buys an option, it buys a legal contract giving it the right to buy or sell a specific amount of the underlying instrument or foreign currency, or futures contract on the underlying instrument or foreign currency, at an agreed-upon price during a period of time or on a specified date typically in exchange for a premium paid by the Fund. The Fund may purchase and/or sell put and call options. Purchasing call options tends to increase the Fund's exposure to the underlying (or similar) instrument. Purchasing put options tends to decrease the Fund's exposure to the underlying (or similar) instrument. When entering into purchased option contracts, the Fund bears the risk of interest or exchange rates or securities prices moving unexpectedly, in which case, the Fund may not achieve the anticipated benefits of the purchased option contracts; however the risk of loss is limited to the premium paid. Purchased options are reported as part of "Total Investments in Securities" in the Statement of Assets and Liabilities. Premiums paid for purchasing options which expired are treated as realized losses. If the Fund sells an option, it sells to another party the right to buy from or sell to the Fund a specific amount of the underlying instrument or foreign currency, or futures contract on the underlying instrument or foreign currency, at an agreed-upon price during a period of time or on a specified date typically in exchange for a premium received by the Fund. When options are purchased OTC, the Fund bears the risk that the counterparty that wrote the option will be unable or unwilling to perform its obligations under the option contract. Options may also be illiquid and the Fund may have difficulty closing out its position. A decision as to whether, when and how to use options involves the exercise of skill and judgment and even a well-conceived option transaction may be unsuccessful because of market behavior or unexpected events. The prices of options can be highly volatile and the use of options can lower total returns.
FASB ASC 815, "Derivatives and Hedging" ("ASC 815"), is intended to improve financial reporting about derivative instruments by requiring enhanced disclosures to enable
investors to better understand how and why the Fund uses derivative instruments, how these derivative instruments are accounted for and their effects on the Fund's financial position and results of operations.
The following table sets forth the fair value of the Fund's derivative contracts by primary risk exposure as of December 31, 2019:
| | | Asset Derivatives
Statement of Assets and
Liabilities Location | | Primary Risk
Exposure | | Value
(000) | |
Purchased Options
| | Investments, at Value
(Purchased Options) | |
Currency Risk | | $ | 3 | (a) | |
(a) Amounts are included in Investments in Securities in the Statement of Assets and Liabilities.
The following tables set forth by primary risk exposure the Fund's realized gain (losses) and change in unrealized appreciation (depreciation) by type of derivative contract for the year ended December 31, 2019 in accordance with ASC 815:
Realized Gain (Loss) | |
Primary Risk Exposure | | Derivative Type | | Value
(000) | |
Currency Risk
| | Investments
(Purchased Options) | | | $(13)(b) | | |
(b) Amounts are included in Investments Sold in the Statement of Operations.
Change in Unrealized Appreciation (Depreciation) | |
Primary Risk Exposure | | Derivative Type | | Value
(000) | |
Currency Risk
| | Investments
(Purchased Options) | | | $(9)(c) | | |
(c) Amounts are included in Investments in the Statement of Operations.
At December 31, 2019, the Fund's derivative assets and liabilities are as follows:
Gross Amounts of Assets and Liabilities
Presented in the Statement of Assets and Liabilities | |
Derivatives | | Assets(d)
(000) | | Liabilities(d)
(000) | |
Purchased Options | | $ | 3 | (a) | | $ | — | | |
(a) Amounts are included in Investments in Securities in the Statement of Assets and Liabilities.
(d) Absent an event of default or early termination, OTC derivative assets and liabilities are presented gross and not offset in the Statement of Assets and Liabilities.
The Fund typically enters into International Swaps and Derivatives Association, Inc. Master Agreements ("ISDA Master Agreements") or similar master agreements (collectively, "Master Agreements") with its contract counterparties for certain OTC derivatives in order to, among other things, reduce its credit risk to counterparties. ISDA Master Agreements include provisions for
21
Morgan Stanley Institutional Fund, Inc.
Annual Report — December 31, 2019
Notes to Financial Statements (cont'd)
general obligations, representations, collateral and events of default or termination. Under an ISDA Master Agreement, the Fund typically may offset with the counterparty certain OTC derivative financial instruments' payables and/or receivables with collateral held and/or posted and create one single net payment (close-out netting) in the event of default, termination and/or potential deterioration in the credit quality of the counterparty. Various Master Agreements govern the terms of certain transactions with counterparties, including transactions such as swap, forward, repurchase and reverse repurchase agreements. These Master Agreements typically attempt to reduce the counterparty risk associated with such transactions by specifying credit protection mechanisms and providing standardization that improves legal certainty. Cross-termination provisions under Master Agreements typically provide that a default in connection with one transaction between the Fund and a counterparty gives the non-defaulting party the right to terminate any other transactions in place with the defaulting party to create one single net payment due to/due from the defaulting party and may be a feature in certain Master Agreements. In the event the Fund exercises its right to terminate a Master Agreement after a counterparty experiences a termination event as defined in the Master Agreement, the return of collateral with market value in excess of the Fund's net liability may be delayed or denied.
The following table presents derivative financial instruments that are subject to enforceable netting arrangements as of December 31, 2019:
Gross Amounts Not Offset in the Statement of Assets and Liabilities | |
Counterparty | | Gross Asset
Derivatives
Presented in the
Statement of
Assets and
Liabilities
(000) | | Financial
Instrument
(000) | | Collateral
Received
(000) | | Net Amount
(not less
than $0)
(000) | |
JPMorgan Chase Bank NA | | $ | 3 | (a) | | $ | — | | | $ | — | | | $ | 3 | | |
(a) Amounts are included in Investments in Securities in the Statement of Assets and Liabilities.
For the year ended December 31, 2019, the approximate average monthly amount outstanding for each derivative type is as follows:
Purchased Options: | |
Average monthly notional amount | | | 4,329,000 | | |
5. Indemnifications: The Company enters into contracts that contain a variety of indemnifications. The Company's maximum exposure under these arrangements is unknown. However, the Company has not had prior claims or losses pursuant to these contracts and expects the risk of loss to be remote.
6. Dividends and Distributions to Shareholders: Dividends and distributions to shareholders are recorded on the ex-dividend date. Dividends from net investment income, if any, are declared and paid annually. Net realized capital gains, if any, are distributed at least annually.
7. Security Transactions, Income and Expenses: Security transactions are accounted for on the trade date (date the order to buy or sell is executed). Realized gains and losses on the sale of investment securities are determined on the specific identified cost method. Dividend income and other distributions are recorded on the ex-dividend date (except for certain foreign dividends which may be recorded as soon as the Fund is informed of such dividends) net of applicable withholding taxes. Interest income is recognized on the accrual basis except where collection is in doubt. Discounts are accreted and premiums are amortized over the life of the respective securities. Most expenses of the Company can be directly attributed to a particular Fund. Expenses which cannot be directly attributed are apportioned among the Funds based upon relative net assets or other appropriate methods. Income, expenses (other than class specific expenses — distribution and shareholder services, transfer agency and sub transfer agency fees) and realized and unrealized gains or losses are allocated to each class of shares based upon their relative net assets.
B. Advisory Fees: The Adviser, a wholly-owned subsidiary of Morgan Stanley, provides the Fund with advisory services under the terms of an Investment Advisory Agreement, paid quarterly, at the annual rate based on the daily net assets as follows:
First $1
billion | | Over $1
billion | |
| | 0.80 | % | | | 0.75 | % | |
For the year ended December 31, 2019, the advisory fee rate (net of waiver/rebate) was equivalent to an annual effective rate of 0.00% of the Fund's average daily net assets.
The Adviser has agreed to reduce its advisory fee and/or reimburse the Fund so that total annual Fund operating expenses, excluding certain investment related expenses, taxes, interest
22
Morgan Stanley Institutional Fund, Inc.
Annual Report — December 31, 2019
Notes to Financial Statements (cont'd)
and other extraordinary expenses (including litigation), will not exceed 1.05% for Class I shares, 1.40% for Class A shares, 2.15% for Class C shares and 1.00% for Class IS shares. The fee waivers and/or expense reimbursements will continue for at least one year from the date of the Fund's prospectus or until such time as the Directors act to discontinue all or a portion of such waivers and/or reimbursements when they deem such action is appropriate. For the year ended December 31, 2019, approximately $57,000 of advisory fees were waived and approximately $248,000 of other expenses were reimbursed by the Adviser pursuant to this arrangement.
C. Administration Fees: The Adviser also serves as Administrator to the Company and provides administrative services pursuant to an Administration Agreement for an annual fee, accrued daily and paid monthly, of 0.08% of the Fund's average daily net assets.
Under a Sub-Administration Agreement between the Administrator and State Street Bank and Trust Company ("State Street"), State Street provides certain administrative services to the Company. For such services, the Administrator pays State Street a portion of the fee the Administrator receives from the Fund.
D. Distribution and Shareholder Services Fees: Morgan Stanley Distribution, Inc. ("MSDI" or the "Distributor"), a wholly-owned subsidiary of the Adviser and an indirect subsidiary of Morgan Stanley, serves as the Company's Distributor of Fund shares pursuant to a Distribution Agreement. The Company has adopted a Shareholder Services Plan with respect to Class A shares pursuant to Rule 12b-1 under the Act. Under the Shareholder Services Plan, the Fund pays the Distributor a shareholder services fee, accrued daily and paid monthly, at an annual rate of 0.25% of the Fund's average daily net assets attributable to Class A shares.
The Company has adopted a Distribution and Shareholder Services Plan with respect to Class C shares pursuant to Rule 12b-1 under the Act. Under the Distribution and Shareholder Services Plan, the Fund pays the Distributor a distribution fee, accrued daily and paid monthly, at an annual rate of 0.75% and a shareholder services fee, accrued daily and paid monthly, at an annual rate of 0.25% of the Fund's average daily net assets attributable to Class C shares.
The distribution and shareholder services fees are used to support the expenses associated with servicing and maintaining accounts. The Distributor may compensate other parties for providing shareholder support services to investors who purchase Class A and Class C shares.
E. Dividend Disbursing and Transfer Agent: The Company's dividend disbursing and transfer agent is DST Asset Manager Solutions, Inc. ("DST"). Pursuant to a Transfer Agency Agreement, the Company pays DST a fee based on the number of classes, accounts and transactions relating to the Funds of the Company.
F. Custodian Fees: State Street (the "Custodian") also serves as Custodian for the Company in accordance with a Custodian Agreement. The Custodian holds cash, securities and other assets of the Company as required by the Act. Custody fees are payable monthly based on assets held in custody, investment purchases and sales activity and account maintenance fees, plus reimbursement for certain out-of-pocket expenses.
G. Security Transactions and Transactions with Affiliates: For the year ended December 31, 2019, purchases and sales of investment securities for the Fund, other than long-term U.S. Government securities and short-term investments were approximately $5,463,000 and $4,674,000, respectively. There were no purchases and sales of long-term U.S. Government securities for the year ended December 31, 2019.
The Fund invests in the Institutional Class of the Morgan Stanley Institutional Liquidity Funds — Treasury Securities Portfolio (the "Liquidity Funds"), an open-end management investment company managed by the Adviser. Advisory fees paid by the Fund are reduced by an amount equal to its pro-rata share of the advisory and administration fees paid by the Fund due to its investment in the Liquidity Funds. For the year ended December 31, 2019, advisory fees paid were reduced by approximately $1,000 relating to the Fund's investment in the Liquidity Funds.
A summary of the Fund's transactions in shares of affiliated investments during the year ended December 31, 2019 is as follows:
Affiliated
Investment
Company | | Value
December 31,
2018
(000) | | Purchases
at Cost
(000) | | Proceeds
from Sales
(000) | | Dividend
Income
(000) | |
Liquidity Funds | | $ | 212 | | | $ | 3,401 | | | $ | 1,459 | | | $ | 7 | | |
Affiliated
Investment
Company (cont'd) | | Realized
Gain (Loss)
(000) | | Change in
Unrealized
Appreciation
(Depreciation)
(000) | | Value
December 31,
2019
(000) | |
Liquidity Funds | | $ | — | | | $ | — | | | $ | 2,154 | | |
23
Morgan Stanley Institutional Fund, Inc.
Annual Report — December 31, 2019
Notes to Financial Statements (cont'd)
The Fund is permitted to purchase and sell securities ("cross-trade") from and to other Morgan Stanley Funds as well as other funds and client accounts for which the Adviser or an affiliate of the Adviser serves as investment adviser, pursuant to procedures approved by the Directors in compliance with Rule 17a-7 under the Act (the "Rule"). Each cross-trade is executed at the current market price in compliance with provisions of the Rule. For the period ended December 31, 2019, the Fund did not engage in any cross-trade transactions.
The Fund has an unfunded Deferred Compensation Plan (the "Compensation Plan"), which allows each independent Director to defer payment of all, or a portion, of the fees he or she receives for serving on the Board of Directors. Each eligible Director generally may elect to have the deferred amounts credited with a return equal to the total return on one or more of the Morgan Stanley funds that are offered as investment options under the Compensation Plan. Appreciation/depreciation and distributions received from these investments are recorded with an offsetting increase/decrease in the deferred compensation obligation and do not affect the NAV of the Fund.
H. Federal Income Taxes: It is the Fund's intention to continue to qualify as a regulated investment company and distribute all of its taxable and tax-exempt income. Accordingly, no provision for federal income taxes is required in the financial statements.
The Fund may be subject to taxes imposed by countries in which it invests. Such taxes are generally based on income and/or capital gains earned or repatriated. Taxes are accrued based on net investment income, net realized gains and net unrealized appreciation as such income and/or gains are earned. Taxes may also be based on transactions in foreign currency and are accrued based on the value of investments denominated in such currency.
FASB ASC 740-10, "Income Taxes — Overall", sets forth a minimum threshold for financial statement recognition of the benefit of a tax position taken or expected to be taken in a tax return. Management has concluded there are no significant uncertain tax positions that would require recognition in the financial statements. If applicable, the Fund recognizes interest accrued related to unrecognized tax benefits in "Interest Expense" and penalties in "Other Expenses" in the Statement of Operations. The Fund files tax returns with the U.S. Internal
Revenue Service, New York and various states. Each of the tax years in the two-year period ended December 31, 2019 remains subject to examination by taxing authorities.
The tax character of distributions paid may differ from the character of distributions shown for GAAP purposes due to short-term capital gains being treated as ordinary income for tax purposes. The tax character of distributions paid during fiscal years 2019 and 2018 was as follows:
2019
Distributions
Paid From: | | 2018
Distributions
Paid From: | |
Ordinary
Income
(000) | | Long-Term
Capital Gain
(000) | | Ordinary
Income
(000) | | Paid-in-
Capital
(000) | |
| $ | — | | | $ | — | | | $ | 21 | | | $ | 50 | | |
The amount and character of income and gains to be distributed are determined in accordance with income tax regulations which may differ from GAAP. These book/tax differences are either considered temporary or permanent in nature.
Temporary differences are attributable to differing book and tax treatments for the timing of the recognition of gains (losses) on certain investment transactions and the timing of the deductibility of certain expenses.
Permanent differences, primarily due to a net operating loss, resulted in the following reclassifications among the components of net assets at December 31, 2019:
Total
Distributable
Earnings
(000) | | Paid-in
Capital
(000) | |
| $ | 27 | | | $ | (27 | ) | |
At December 31, 2019, the Fund had no distributable earnings on a tax basis.
At December 31, 2019, the Fund had available for federal income tax purposes unused short-term capital losses of approximately $88,000 that do not have an expiration date.
To the extent that capital loss carryforwards are used to offset any future capital gains realized, no capital gains tax liability will be incurred by the Fund for gains realized and not distributed. To the extent that capital gains are offset, such gains will not be distributed to the shareholders.
I. Credit Facility: The Company and other Morgan Stanley funds participated in a $150,000,000 committed, unsecured revolving line of credit facility (the "Facility") with State
24
Morgan Stanley Institutional Fund, Inc.
Annual Report — December 31, 2019
Notes to Financial Statements (cont'd)
Street. Effective April 22, 2019, the committed line amount increased to $300,000,000. This Facility is to be used for temporary emergency purposes or funding of shareholder redemption requests. The interest rate on borrowings is based on the federal funds rate or 1 month LIBOR rate plus a spread. The Facility also has a commitment fee of 0.25% per annum based on the unused portion of the Facility. During the year ended December 31, 2019, the Fund did not have any borrowings under the Facility.
J. Other: At December 31, 2019, the Fund had record owners of 10% or greater. Investment activities of these shareholders could have a material impact on the Fund. The aggregate percentage of such owners was 21.7%.
25
Morgan Stanley Institutional Fund, Inc.
Annual Report — December 31, 2019
Report of Independent Registered Public Accounting Firm
To the Shareholders and Board of Directors of
Morgan Stanley Institutional Fund, Inc. —
Global Counterpoint Portfolio
Opinion on the Financial Statements
We have audited the accompanying statement of assets and liabilities of Global Counterpoint Portfolio (the "Fund") (one of the funds constituting Morgan Stanley Institutional Fund, Inc. (the "Company")), including the portfolio of investments, as of December 31, 2019, and the related statement of operations for the year then ended, and the statements of changes in net assets and the financial highlights for the year then ended and the period from June 29, 2018 (commencement of operations) through December 31, 2018 and the related notes (collectively referred to as the "financial statements"). In our opinion, the financial statements present fairly, in all material respects, the financial position of Global Counterpoint Portfolio (one of the funds constituting Morgan Stanley Institutional Fund, Inc.) at December 31, 2019, the results of its operations for the year then ended, and the changes in its net assets and its financial highlights for the year then ended and the period from June 29, 2018 (commencement of operations) through December 31, 2018, in conformity with U.S. generally accepted accounting principles.
Basis for Opinion
These financial statements are the responsibility of the Company's management. Our responsibility is to express an opinion on the Fund's financial statements based on our audit. We are a public accounting firm registered with the Public Company Accounting Oversight Board (United States) ("PCAOB") and are required to be independent with respect to the Company in accordance with the U.S. federal securities law and the applicable rules and regulations of the Securities and Exchange Commission and the PCAOB.
We conducted our audits in accordance with the standards of the PCAOB. Those standards require that we plan and perform the audit to obtain reasonable assurance about whether the financial statements are free of material misstatement, whether due to error or fraud. The Company is not required to have, nor were we engaged to perform, an audit of the Company's internal control over financial reporting. As part of our audits, we are required to obtain an understanding of internal control over financial reporting, but not for the purpose of expressing an opinion on the effectiveness of the Company's internal control over financial reporting. Accordingly, we express no such opinion.
Our audits included performing procedures to assess the risks of material misstatement of the financial statements, whether due to error or fraud, and performing procedures that respond to those risks. Such procedures included examining, on a test basis, evidence regarding the amounts and disclosures in the financial statements. Our procedures included confirmation of securities owned as of December 31, 2019 by correspondence with the custodian and others or by other appropriate auditing procedures where replies from others were not received. Our audits also included evaluating the accounting principles used and significant estimates made by management, as well as evaluating the overall presentation of the financial statements. We believe that our audits provide a reasonable basis for our opinion.

We have served as the auditor of one or more Morgan Stanley investment companies since 2000.
Boston, Massachusetts
February 27, 2020
26
Privacy Notice (unaudited) April 2019
FACTS | | WHAT DOES MSIM DO WITH YOUR PERSONAL INFORMATION? | |
Why? | | Financial companies choose how they share your personal information. Federal law gives consumers the right to limit some but not all sharing. Federal law also requires us to tell you how we collect, share, and protect your personal information. Please read this notice carefully to understand what we do. | |
What? | | The types of personal information we collect and share depend on the product or service you have with us. This information can include:
n Social Security number and income
n investment experience and risk tolerance
n checking account number and wire transfer instructions | |
How? | | All financial companies need to share customers' personal information to run their everyday business. In the section below, we list the reasons financial companies can share their customers' personal information; the reasons MSIM chooses to share; and whether you can limit this sharing. | |
Reasons we can share your personal information | | Does MSIM share? | | Can you limit this sharing? | |
For our everyday business purposes —
such as to process your transactions, maintain your account(s), respond to court orders and legal investigations, or report to credit bureaus | | Yes | | No | |
For our marketing purposes —
to offer our products and services to you | | Yes | | No | |
For joint marketing with other financial companies | | No | | We don't share | |
For our affiliates' everyday business purposes —
information about your transactions and experiences | | Yes | | No | |
For our affiliates' everyday business purposes —
information about your creditworthiness | | No | | We don't share | |
For our affiliates to market to you | | No | | We don't share | |
For non-affiliates to market to you | | No | | We don't share | |
Questions? Call toll-free (844) 312-6327 or email: imprivacyinquiries@morganstanley.com
27
Privacy Notice (unaudited) (cont'd) April 2019
Who we are
Who is providing this notice? | | Morgan Stanley Investment Management, Inc. and its affiliated registered investment advisers, registered broker-dealers, and registered and unregistered funds ("MSIM") | |
What we do
How does MSIM protect my personal information? | | To protect your personal information from unauthorized access and use, we use security measures that comply with federal law. These measures include computer safeguards and secured files and buildings. We have policies governing the proper handling of customer information by personnel and requiring third parties that provide support to adhere to appropriate security standards with respect to such information. | |
How does MSIM collect my personal information? | | We collect your personal information, for example, when you
n open an account or make deposits or withdrawals from your account
n buy securities from us or make a wire transfer
n give us your contact information
We also collect your personal information from others, such as credit bureaus, affiliates, or other companies. | |
Why can't I limit all sharing? | | Federal law gives you the right to limit only
n sharing for affiliates' everyday business purposes — information about your creditworthiness
n affiliates from using your information to market to you
n sharing for non-affiliates to market to you
State laws and individual companies may give you additional rights to limit sharing. See below for more on your rights under state law. | |
Definitions
Affiliates | | Companies related by common ownership or control. They can be financial and non-financial companies.
n Our affiliates include companies with a Morgan Stanley name and financial companies such as Morgan Stanley Smith Barney LLC and Morgan Stanley & Co. | |
Non-affiliates | | Companies not related by common ownership or control. They can be financial and non-financial companies.
n MSIM does not share with non-affiliates so they can market to you. | |
Joint marketing | | A formal agreement between non-affiliated financial companies that together market financial products or services to you.
n MSIM doesn't jointly market | |
Other Important Information
Vermont: Except as permitted by law, we will not share personal information we collect about Vermont residents with Non-affiliates unless you provide us with your written consent to share such information.
California: Except as permitted by law, we will not share personal information we collect about California residents with Non-affiliates and we will limit sharing such personal information with our Affiliates to comply with California privacy laws that apply to us.
28
Morgan Stanley Institutional Fund, Inc.
Annual Report — December 31, 2019
Director and Officer Information (unaudited)
Independent Directors:
Name, Birth Year
and Address of
Independent Director | | Position(s)
Held with
Registrant | | Length of Time
Served* | | Principal Occupation(s) During Past 5 Years
and Other Relevant Professional Experience | | Number of
Funds in
Fund Complex
Overseen by
Independent
Director** | | Other Directorships
Held by Independent
Director*** | |
Frank L. Bowman
c/o Perkins Coie LLP
Counsel to the Independent Directors
1155 Avenue of the Americas
New York, NY 10036
Birth Year 1944 | | Director | | Since
August
2006 | | President, Strategic Decisions, LLC (consulting) (since February 2009); Director or Trustee of various Morgan Stanley Funds (since August 2006); Chairperson of the Compliance and Insurance Committee (since October 2015); formerly, Chairperson of the Insurance Sub-Committee of the Compliance and Insurance Committee (2007-2015); served as President and Chief Executive Officer of the Nuclear Energy Institute (policy organization) (February 2005-November 2008); retired as Admiral, U.S. Navy after serving over 38 years on active duty including 8 years as Director of the Naval Nuclear Propulsion Program in the Department of the Navy and the U.S. Department of Energy (1996-2004); served as Chief of Naval Personnel (July 1994-September 1996) and on the Joint Staff as Director of Political Military Affairs (June 1992-July 1994); knighted as Honorary Knight Commander of the Most Excellent Order of the British Empire; awarded the Officier de l'Orde National du Mérite by the French Government; elected to the National Academy of Engineering (2009). | | | 86 | | | Director of Naval and Nuclear Technologies LLP; Director Emeritus of the Armed Services YMCA; Member of the National Security Advisory Council of the Center for U.S. Global Engagement and a member of the CNA Military Advisory Board; Trustee of Fairhaven United Methodist Church; Member of the Board of Advisors of the Dolphin Scholarship Foundation; Director of other various non-profit organizations; formerly, Director of BP p.l.c. (November 2010-May 2019). | |
Kathleen A. Dennis
c/o Perkins Coie LLP
Counsel to the Independent Directors
1155 Avenue of the Americas
New York, NY 10036
Birth Year 1953 | | Director | | Since
August
2006 | | President, Cedarwood Associates (mutual fund and investment management consulting) (since July 2006); Chairperson of the Liquidity and Alternatives Sub-Committee of the Investment Committee (since October 2006) and Director or Trustee of various Morgan Stanley Funds (since August 2006); formerly, Senior Managing Director of Victory Capital Management (1993-2006). | | | 86 | | | Director of various non-profit organizations. | |
Nancy C. Everett
c/o Perkins Coie LLP
Counsel to the Independent Directors
1155 Avenue of the Americas
New York, NY 10036
Birth Year 1955 | | Director | | Since
January
2015 | | Chief Executive Officer, Virginia Commonwealth University Investment Company (since November 2015); Owner, OBIR, LLC (institutional investment management consulting) (since June 2014); formerly, Managing Director, BlackRock, Inc. (February 2011-December 2013); and Chief Executive Officer, General Motors Asset Management (a/k/a Promark Global Advisors, Inc.) (June 2005-May 2010). | | | 87 | | | Formerly, Member of Virginia Commonwealth University School of Business Foundation (2005-2016); Member of Virginia Commonwealth University Board of Visitors (2013-2015); Member of Committee on Directors for Emerging Markets Growth Fund, Inc. (2007-2010); Chairperson of Performance Equity Management, LLC (2006-2010); and Chairperson, GMAM Absolute Return Strategies Fund, LLC (2006-2010). | |
29
Morgan Stanley Institutional Fund, Inc.
Annual Report — December 31, 2019
Director and Officer Information (unaudited) (cont'd)
Independent Directors: (cont'd)
Name, Birth Year
and Address of
Independent Director | | Position(s)
Held with
Registrant | | Length of Time
Served* | | Principal Occupation(s) During Past 5 Years
and Other Relevant Professional Experience | | Number of
Funds in
Fund Complex
Overseen by
Independent
Director** | | Other Directorships
Held by Independent
Director*** | |
Jakki L. Haussler
c/o Perkins Coie LLP
Counsel to the Independent Directors
1155 Avenue of the Americas
New York, NY 10036
Birth Year 1957 | | Director | | Since
January
2015 | | Chairman, Opus Capital Group (since 1996); formerly, Chief Executive Officer, Opus Capital Group (1996-2019); Director, Capvest Venture Fund, LP (May 2000-December 2011); Partner, Adena Ventures, LP (July 1999-December 2010); Director, The Victory Funds (February 2005-July 2008). | | | 87 | | | Director of Service Corporation International and Member, Audit Committee and Investment Committee; Director of Cincinnati Bell Inc. and Member, Audit Committee and Governance and Nominating Committee; Chairman of Northern Kentucky University Member Investment Committee; Member of Chase College of Law Transactional Law Practice Center Board of Advisors; Director of Best Transport; Director of Chase College of Law Board of Visitors; formerly, Member, University of Cincinnati Foundation Investment Committee; Member, Miami University Board of Visitors (2008-2011); Trustee of Victory Funds (2005-2008) and Chairman, Investment Committee (2007-2008) and Member, Service Provider Committee (2005-2008). | |
Dr. Manuel H. Johnson
c/o Johnson Smick International, Inc.
220 I Street, NE — Suite 200
Washington, D.C. 20002
Birth Year 1949 | | Director | | Since
July
1991 | | Senior Partner, Johnson Smick International, Inc. (consulting firm); Chairperson of the Investment Committee (since October 2006) and Director or Trustee of various Morgan Stanley Funds (since July 1991); Co-Chairman and a founder of the Group of Seven Council (G7C) (international economic commission); formerly, Chairperson of the Audit Committee (July 1991-September 2006), Vice Chairman of the Board of Governors of the Federal Reserve System and Assistant Secretary of the U.S. Treasury. | | | 86 | | | Director of NVR, Inc. (home construction). | |
Joseph J. Kearns
c/o Perkins Coie LLP
Counsel to the Independent Directors
1155 Avenue of the Americas
New York, NY 10036
Birth Year 1942 | | Director | | Since
August
1994 | | Senior Adviser, Kearns & Associates LLC (investment consulting); Chairperson of the Audit Committee (since October 2006) and Director or Trustee of various Morgan Stanley Funds (since August 1994); formerly, Deputy Chairperson of the Audit Committee (July 2003-September 2006) and Chairperson of the Audit Committee of various Morgan Stanley Funds (since August 1994); CFO of the J. Paul Getty Trust. | | | 87 | | | Prior to August 10, 2016, Director of Electro Rent Corporation (equipment leasing); Prior to December 31, 2013, Director of The Ford Family Foundation. | |
30
Morgan Stanley Institutional Fund, Inc.
Annual Report — December 31, 2019
Director and Officer Information (unaudited) (cont'd)
Independent Directors: (cont'd)
Name, Birth Year
and Address of
Independent Director | | Position(s)
Held with
Registrant | | Length of Time
Served* | | Principal Occupation(s) During Past 5 Years
and Other Relevant Professional Experience | | Number of
Funds in
Fund Complex
Overseen by
Independent
Director** | | Other Directorships
Held by Independent
Director*** | |
Michael F. Klein
c/o Perkins Coie LLP
Counsel to the Independent Directors
1155 Avenue of the Americas
New York, NY 10036
Birth Year 1958 | | Director | | Since
August
2006 | | Managing Director, Aetos Alternatives Management, LP (since March 2000); Co-President, Aetos Alternatives Management, LP (since January 2004) and Co-Chief Executive Officer of Aetos Alternatives Management, LP (since August 2013); Chairperson of the Fixed Income Sub-Committee of the Investment Committee (since October 2006) and Director or Trustee of various Morgan Stanley Funds (since August 2006); formerly, Managing Director, Morgan Stanley & Co. Inc. and Morgan Stanley Dean Witter Investment Management and President, various Morgan Stanley Funds (June 1998-March 2000); Principal, Morgan Stanley & Co. Inc. and Morgan Stanley Dean Witter Investment Management (August 1997-December 1999). | | | 86 | | | Director of certain investment funds managed or sponsored by Aetos Alternatives Management, LP; Director of Sanitized AG and Sanitized Marketing AG (specialty chemicals). | |
Patricia Maleski
c/o Perkins Coie LLP
Counsel to the Independent Directors
1155 Avenue of the Americas
New York, NY 10036
Birth Year 1960 | | Director | | Since
January
2017 | | Managing Director, JPMorgan Asset Management (2004-2016); Oversight and Control Head of Fiduciary and Conflicts of Interest Program (2015-2016); Chief Control Officer-Global Asset Management (2013-2015); President, JPMorgan Funds (2010-2013); Chief Administrative Officer (2004-2013); various other positions including Treasurer and Board Liaison (since 2001). | | | 87 | | | None. | |
Michael E. Nugent
522 Fifth Avenue
New York, NY 10036
Birth Year 1936 | | Chair of the Board and Director | | Chair of the Boards since July 2006 and Director since July 1991 | | Chair of the Boards of various Morgan Stanley Funds (since July 2006); Chairperson of the Governance Committee (since January 2019) and Director or Trustee of various Morgan Stanley Funds (since July 1991); formerly, Chairperson of each of the Closed-End Fund committee (until December 2019) and the Insurance Committee (until July 2006); General Partner, Triumph Capital, L.P. (private investment partnership) (1988-2013). | | | 86 | | | None. | |
W. Allen Reed
c/o Perkins Coie LLP
Counsel to the Independent Directors
1155 Avenue of the Americas
New York, NY 10036
Birth Year 1947 | | Vice Chair of the Board and Director | | Vice Chair of the Boards since January 2020 and Director Since August 2006 | | Chairperson of the Equity Sub-Committee of the Investment Committee (since October 2006) and Director or Trustee of various Morgan Stanley Funds (since August 2006); formerly, President and CEO of General Motors Asset Management; Chairman and Chief Executive Officer of the GM Trust Bank and Corporate Vice President of General Motors Corporation (August 1994-December 2005). | | | 86 | | | Formerly, Director of Legg Mason, Inc.; formerly, Director of the Auburn University Foundation (2010-2015). | |
* This is the earliest date the Director began serving the Morgan Stanley Funds. Each Director serves an indefinite term, until his or her successor is elected.
** The Fund Complex includes (as of December 31, 2019) all open-end and closed-end funds (including all of their portfolios) advised by Morgan Stanley Investment Management Inc. (the "Adviser") and any funds that have an adviser that is an affiliated person of the Adviser (including, but not limited to, Morgan Stanley AIP GP LP).
*** This includes any directorships at public companies and registered investment companies held by the Director at any time during the past five years.
31
Morgan Stanley Institutional Fund, Inc.
Annual Report — December 31, 2019
Director and Officer Information (unaudited) (cont'd)
Executive Officers:
Name, Birth Year and Address of
Executive Officer | | Position(s) Held
with
Registrant | | Length of Time
Served* | | Principal Occupation(s) During Past 5 Years | |
John H. Gernon
522 Fifth Avenue
New York, NY 10036
Birth Year 1963 | | President and Principal Executive Officer | | Since September 2013 | | President and Principal Executive Officer of the Equity and Fixed Income Funds and the Morgan Stanley AIP Funds (since September 2013) and the Liquidity Funds and various money market funds (since May 2014) in the Fund Complex; Managing Director of the Adviser; Head of Product (since 2006). | |
Timothy J. Knierim
522 Fifth Avenue
New York, NY 10036
Birth Year 1959 | | Chief Compliance Officer | | Since December 2016 | | Managing Director of the Adviser and various entities affiliated with the Adviser; Chief Compliance Officer of various Morgan Stanley Funds and the Adviser (since December 2016) and Chief Compliance Officer of Morgan Stanley AIP GP LP (since 2014). Formerly, Managing Director and Deputy Chief Compliance Officer of the Adviser (2014-2016); and formerly, Chief Compliance Officer of Prudential Investment Management, Inc. (2007-2014). | |
Francis J. Smith
522 Fifth Avenue
New York, NY 10036
Birth Year 1965 | | Treasurer and Principal Financial Officer | | Treasurer since July 2003 and Principal Financial Officer since September 2002 | | Managing Director of the Adviser and various entities affiliated with the Adviser; Treasurer (since July 2003) and Principal Financial Officer of various Morgan Stanley Funds (since September 2002). | |
Mary E. Mullin
522 Fifth Avenue
New York, NY 10036
Birth Year 1967 | | Secretary | | Since
June
1999 | | Managing Director of the Adviser; Secretary of various Morgan Stanley Funds (since June 1999). | |
Michael J. Key
522 Fifth Avenue
New York, NY 10036
Birth Year 1979 | | Vice President | | Since
June
2017 | | Vice President of the Equity and Fixed Income Funds, Liquidity Funds, various money market funds and the Morgan Stanley AIP Funds in the Fund Complex (since June 2017); Executive Director of the Adviser; Head of Product Development for Equity and Fixed Income Funds (since August 2013). | |
* This is the earliest date the officer began serving the Morgan Stanley Funds. Each officer serves a one-year term, until his or her successor is elected and qualifies.
32
Morgan Stanley Institutional Fund, Inc.
Annual Report — December 31, 2019
Adviser and Administrator
Morgan Stanley Investment Management Inc.
522 Fifth Avenue
New York, New York 10036
Distributor
Morgan Stanley Distribution, Inc.
522 Fifth Avenue
New York, New York 10036
Dividend Disbursing and Transfer Agent
DST Asset Manager Solutions, Inc.
2000 Crown Colony Drive
Quincy, Massachusetts 02169
Custodian
State Street Bank and Trust Company
One Lincoln Street
Boston, Massachusetts 02111
Legal Counsel
Dechert LLP
1095 Avenue of the Americas
New York, New York 10036
Counsel to the Independent Directors
Perkins Coie LLP
1155 Avenue of the Americas
New York, New York 10036
Independent Registered Public Accounting Firm
Ernst & Young LLP
200 Clarendon Street
Boston, Massachusetts 02116
Reporting to Shareholders
Each Morgan Stanley fund provides a complete schedule of portfolio holdings in its Semi-Annual and the Annual Reports within 60 days of the end of the fund's second and fourth fiscal quarters. The Semi-Annual and Annual Reports are filed electronically with the Securities and Exchange Commission ("SEC") on Form N-CSRS and Form N-CSR, respectively. Morgan Stanley also delivers the Semi-Annual and Annual Reports to fund shareholders and makes these reports available on its public website, www.morganstanley.com/im/shareholderreports. Each Morgan Stanley non-money market fund also files a complete schedule of portfolio holdings with the SEC for the fund's first and third fiscal quarters as an attachment to Form N-PORT. Morgan Stanley does not deliver the reports for the first and third fiscal quarters to shareholders, nor are the reports posted to the Morgan Stanley public website. However, the holdings for each money market fund are posted to the Morgan Stanley public website. You may obtain the Form N-PORT filings (as well as the Form N-CSR and N-CSRS filings) by accessing the SEC's website, www.sec.gov. You can also request copies of these materials, upon payment of a duplicating fee, by electronic request at the SEC's email address (publicinfo@sec.gov).
Proxy Voting Policies and Procedures and Proxy Voting Record
You may obtain a copy of the Company's Proxy Voting Policy and Procedures and information regarding how the Company voted proxies relating to portfolio securities during the most recent twelve-month period ended June 30, without charge, upon request, by calling toll free 1 (800) 548-7786 or by visiting our website at www.morganstanley.com/im/shareholderreports. This information is also available on the SEC's website at www.sec.gov.
This report is authorized for distribution only when preceded or accompanied by a prospectus or summary prospectus of the applicable fund of Morgan Stanley Institutional Fund, Inc., which describes in detail the fund's investment policies, risks, fees and expenses. Please read the prospectus carefully before you invest or send money. For additional information, including information regarding the investments comprising the Fund, please visit our website at www.morganstanley.com/im/shareholderreports or call toll free 1 (800) 548-7786.
33
Printed in U.S.A.
This Report has been prepared for shareholders and may be distributed to others only if preceded or accompanied by a current prospectus.
Morgan Stanley Investment Management Inc.
522 Fifth Avenue
New York, New York 10036
© 2020 Morgan Stanley. Morgan Stanley Distribution, Inc.

IFIGCPTANN
2922367 EXP. 02.28.21

Morgan Stanley Institutional Fund, Inc.
Global Endurance Portfolio
Annual Report
December 31, 2019
Beginning on January 1, 2021, as permitted by regulations adopted by the Securities and Exchange Commission ("SEC"), paper copies of the Fund's Annual and Semi-Annual Reports to Shareholders ("Shareholder Reports") will no longer be sent by mail, unless you specifically request paper copies of the Shareholder Reports from the Fund or from your financial intermediary, such as a broker-dealer or a bank. Instead, the Shareholder Reports will be made available on the Fund's website, https://www.morganstanley.com/im/shareholderreports and you will be notified by mail each time a Shareholder Report is posted and provided with a website link to access the Shareholder Report. If you already elected to receive Shareholder Reports electronically, you will not be affected by this change and you need not take any action. You may elect to receive Shareholder Reports and other communications from the Fund electronically anytime by contacting your financial intermediary or, if you are a direct investor, please follow the instructions on the envelope.
Beginning on January 1, 2019, you may elect to receive all future Shareholder Reports in paper free of charge. If you invest through a financial intermediary, you can contact your financial intermediary to request that you continue to receive paper copies of your Shareholder Reports. If you invest directly with the Fund, please follow the instructions on the envelope to let the Fund know you wish to continue receiving paper copies of your Shareholder Reports. Your election to receive Shareholder Reports in paper will apply to all funds held in your account if you invest through your financial intermediary or all funds held with the fund complex if you invest directly with a fund.

Morgan Stanley Institutional Fund, Inc.
Annual Report — December 31, 2019
Shareholders' Letter | | | 2 | | |
Expense Example | | | 3 | | |
Investment Overview | | | 4 | | |
Portfolio of Investments | | | 6 | | |
Statement of Assets and Liabilities | | | 8 | | |
Statement of Operations | | | 9 | | |
Statements of Changes in Net Assets | | | 10 | | |
Financial Highlights | | | 11 | | |
Notes to Financial Statements | | | 15 | | |
Report of Independent Registered Public Accounting Firm | | | 22 | | |
Privacy Notice | | | 23 | | |
Director and Officer Information | | | 25 | | |
This report is authorized for distribution only when preceded or accompanied by a prospectus or summary prospectus of the applicable Fund of Morgan Stanley Institutional Fund, Inc. To receive a prospectus and/or statement of additional information ("SAI"), which contains more complete information such as investment objectives, charges, expenses, policies for voting proxies, risk considerations and describes in detail each of the Fund's investment policies to the prospective investor, please call toll free 1 (800) 548-7786. Please read the prospectuses carefully before you invest or send money.
Additionally, you can access information about the Fund, including performance, characteristics and investment team commentary, through Morgan Stanley Investment Management's website: www.morganstanley.com/im/shareholderreports.
Market forecasts provided in this report may not necessarily come to pass. There is no guarantee that any sectors mentioned will continue to perform as discussed herein or that securities in such sectors will be held by the Fund in the future. There is no assurance that a fund will achieve its investment objective. Funds are subject to market risk, which is the possibility that market values of securities owned by the Fund will decline and, therefore, the value of the Fund's shares may be less than what you paid for them. Accordingly, you can lose money investing in this Fund. Please see the prospectus for more complete information on investment risks.
1
Morgan Stanley Institutional Fund, Inc.
Annual Report — December 31, 2019
Shareholders' Letter (unaudited)
Dear Shareholders,
We are pleased to provide this Annual Report, in which you will learn how your investment in Global Endurance Portfolio (the "Fund") performed during the latest twelve-month period.
Morgan Stanley Investment Management is a client-centric, investor-led organization. Our global presence, intellectual capital, and breadth of products and services enable us to partner with investors to meet the evolving challenges of today's financial markets. We aim to deliver superior investment service and to empower our clients to make the informed decisions that help them reach their investment goals.
As always, we thank you for selecting Morgan Stanley Investment Management, and look forward to working with you in the months and years ahead.
Sincerely,

John H. Gernon
President and Principal Executive Officer
January 2020
2
Morgan Stanley Institutional Fund, Inc.
Annual Report — December 31, 2019
Expense Example (unaudited)
Global Endurance Portfolio
As a shareholder of the Fund, you incur two types of costs: (1) transactional costs; and (2) ongoing costs, which may include advisory fees, administration fees, distribution and shareholder services fees and other Fund expenses. This example is intended to help you understand your ongoing costs (in dollars) of investing in the Fund and to compare these costs with the ongoing costs of investing in other mutual funds.
This example is based on an investment of $1,000 invested at the beginning of the six-month period ended December 31, 2019 and held for the entire six-month period.
Actual Expenses
The table below provides information about actual account values and actual expenses. You may use the information in this table, together with the amount you invested, to estimate the expenses that you paid over the period. Simply divide your account value by $1,000 (for example, an $8,600 account value divided by $1,000 = 8.6), then multiply the result by the number in the table under the heading entitled "Actual Expenses Paid During Period" to estimate the expenses you paid on your account during this period.
Hypothetical Example for Comparison Purposes
The table below provides information about hypothetical account values and hypothetical expenses based on the Fund's actual expense ratio and an assumed rate of return of 5% per year before expenses, which is not the Fund's actual return. The hypothetical account values and expenses may not be used to estimate the actual ending account balance or expenses you paid for the period. You may use this information to compare the ongoing costs of investing in the Fund and other funds. To do so, compare this 5% hypothetical example with the 5% hypothetical examples that appear in the shareholder reports of the other funds.
Please note that the expenses shown in the table are meant to highlight your ongoing costs only and do not reflect any transactional costs, such as sales charges (loads). Therefore, the information for each class in the table is useful in comparing ongoing costs only, and will not help you determine the relative total costs of owning different funds. In addition, if these transactional costs were included, your costs would have been higher.
| | | Beginning
Account
Value
7/1/19 | | Actual Ending
Account
Value
12/31/19 | | Hypothetical
Ending Account
Value | | Actual
Expenses
Paid
During
Period* | | Hypothetical
Expenses Paid
During Period* | | Net
Expense
Ratio
During
Period** | |
Global Endurance Portfolio Class I | | $ | 1,000.00 | | | $ | 1,066.30 | | | $ | 1,020.16 | | | $ | 5.21 | | | $ | 5.09 | | | | 1.00 | % | |
Global Endurance Portfolio Class A | | | 1,000.00 | | | | 1,064.80 | | | | 1,018.40 | | | | 7.03 | | | | 6.87 | | | | 1.35 | | |
Global Endurance Portfolio Class C | | | 1,000.00 | | | | 1,060.90 | | | | 1,014.62 | | | | 10.91 | | | | 10.66 | | | | 2.10 | | |
Global Endurance Portfolio Class IS | | | 1,000.00 | | | | 1,067.10 | | | | 1,020.42 | | | | 4.95 | | | | 4.84 | | | | 0.95 | | |
* Expenses are calculated using each fundcode not found Class' annualized net expense ratio (as disclosed), multiplied by the average account value over the period and multiplied by 184/365 (to reflect the most recent one-half year period).
** Annualized.
3
Morgan Stanley Institutional Fund, Inc.
Annual Report — December 31, 2019
Investment Overview
Global Endurance Portfolio
The Fund seeks long-term capital appreciation.
Performance
For the fiscal year ended December 31, 2019, the Fund's Class I shares had a total return based on net asset value and reinvestment of distributions per share of 30.30%, net of fees. The Fund's Class I shares outperformed the Fund's benchmark, the MSCI All Country World Net Index (the "Index"), which returned 26.60%.
Please keep in mind that double-digit returns are highly unusual and cannot be sustained. Investors should also be aware that these returns were primarily achieved during favorable market conditions.
Factors Affecting Performance
• Easing geopolitical tensions, reduced recession fears and central bank support drove global equities sharply higher over 2019. Although the U.S.-China trade relations dampened global manufacturing and export activity, many economies remained supported by relatively stronger consumer sectors that had remained mostly unaffected by the manufacturing slowdown. To further extend the economic cycle, global central banks resumed cutting policy interest rates and enacting other stimulus measures. Volatility increased in 2019, but stock prices continued to rally higher, notably at year end when the U.S. and China announced a partial trade deal, Brexit uncertainty eased with the Conservative Party winning a large majority in the U.K. general election, and some economic indicators appeared to be stabilizing.
• Global equities, as measured by the Index, performed well during the year, with information technology, consumer discretionary and industrials the best performing sectors in the Index. All sectors advanced over the period, but the energy sector lagged the Index by the widest margin.
• Counterpoint Global seeks high quality companies, which we define primarily as those with sustainable competitive advantages. We manage concentrated portfolios that are highly differentiated from the benchmark, with securities weighted on our assessment of the quality of the company and our conviction. The value added or detracted in any period of time will result from stock selection, given our philosophy and process. For the year, the Fund outperformed the Index.
• The long-term investment horizon and conviction-weighted investment approach embraced by the team since 1998 can result in periods of performance deviation from the benchmark and peers. The Fund outperformed the Index in this reporting period due to favorable sector allocations and a small contribution from stock selection.
• The Fund's relative outperformance was driven by stock selection and an overweight allocation in the industrials sector. A holding in a U.S.-based auto salvage auction platform operator was the top contributor in the industrials sector and among the largest contributors across the whole Fund. Stock selection in the consumer discretionary sector was also advantageous, with strong performance from a U.S.-based e-commerce platform for buying and selling cars.
• Although an overweight allocation to the information technology sector was beneficial, it was offset by unfavorable stock selection in the sector. A U.S.-based provider of cloud networking services was the largest detractor in the sector and across the Fund (and the stock is not held in the Index). Stock selection in the financial sector was detrimental as well, mainly due to share price weakness in a U.K. retail and commercial bank (which is not held in the Index).
Management Strategies
• As a team, we believe having a market outlook can be an anchor. Our focus is on assessing company prospects over a five-year horizon, and owning a portfolio of unique companies whose market value we believe can increase significantly for underlying fundamental reasons.
4
Morgan Stanley Institutional Fund, Inc.
Annual Report — December 31, 2019
Investment Overview (cont'd)
Global Endurance Portfolio

* Minimum Investment for Class I shares
** Commenced Operations on December 31, 2018.
In accordance with SEC regulations, the Fund's performance shown assumes that all recurring fees (including management fees) were deducted and all dividends and distributions were reinvested. The performance of Class A, C and IS shares will vary from the performance of Class I shares and will be negatively impacted by additional fees assessed to those classes (if applicable).
Performance Compared to the MSCI All Country World Net Index(1) and the Lipper Global Small-/Mid-Cap Funds Index(2)
| | Period Ended December 31, 2019
Total Returns(3) | |
| | | | | Average Annual | |
| | | One
Year | | Five
Years | | Ten
Years | | Since
Inception(5) | |
Fund — Class I Shares w/o
sales charges(4) | | | 30.30 | % | | | — | | | | — | | | | 30.30 | % | |
Fund — Class A Shares w/o
sales charges(4) | | | 29.90 | | | | — | | | | — | | | | 29.90 | | |
Fund — Class A Shares with
maximum 5.25% sales charges(4) | | | 23.13 | | | | — | | | | — | | | | 23.13 | | |
Fund — Class C Shares w/o
sales charges(4) | | | 28.90 | | | | — | | | | — | | | | 28.90 | | |
Fund — Class C Shares with
maximum 1.00% deferred
sales charges(4) | | | 27.90 | | | | — | | | | — | | | | 27.90 | | |
Fund — Class IS Shares w/o
sales charges(4) | | | 30.40 | | | | — | | | | — | | | | 30.40 | | |
MSCI All Country
World Net Index | | | 26.60 | | | | — | | | | — | | | | 26.60 | | |
Lipper Global Small-/Mid-Cap
Funds Index | | | 23.57 | | | | — | | | | — | | | | 23.57 | | |
Performance data quoted represents past performance, which is no guarantee of future results, and current performance may be lower or higher than the figures shown. Performance assumes that all dividends and distributions, if any, were reinvested. For the most recent month-end performance figures, please visit www.morganstanley.com/im/shareholderreports. Investment return and principal value will fluctuate so that Fund shares, when redeemed, may be worth more or less than their original cost. Total returns do not reflect the deduction of taxes that a shareholder would pay on Fund distributions or the redemption of Fund shares. Performance of share classes will vary due to difference in sales charges and expenses.
(1) The MSCI All Country World Net Index is a free float-adjusted market capitalization weighted index designed to measure the equity market performance of developed and emerging markets. The term "free float" represents the portion of shares outstanding that are deemed to be available for purchase in the public equity markets by investors. The performance of the Index is listed in U.S. dollars and assumes reinvestment of net dividends. Net total return indices reinvest dividends after the deduction of withholding taxes, using (for international indices) a tax rate applicable to non-resident institutional investors who do not benefit from double taxation treaties. The Index is unmanaged and its returns do not include any sales charges or fees. Such costs would lower performance. It is not possible to invest directly in an index.
(2) The Lipper Global Small-/Mid-Cap Funds Index is an equally weighted performance index of the largest qualifying funds (based on net assets) in the Lipper Global Small-/Mid-Cap Funds classification. The Index, which is adjusted for capital gains distributions and income dividends, is unmanaged and should not be considered an investment. There are currently 30 funds represented in this Index. As of the date of this report, the Fund was in the Lipper Global Small-/Mid-Cap Funds classification.
(3) Total returns for the Fund reflect fees waived and expenses reimbursed, if applicable, by the Adviser (as defined herein). Without such waivers and reimbursements, total returns would have been lower.
(4) Commenced operations on December 31, 2018.
(5) For comparative purposes, average annual since inception returns listed for the Indexes refer to the inception date of the Fund, not the inception of the Index.
5
Morgan Stanley Institutional Fund, Inc.
Annual Report — December 31, 2019
Portfolio of Investments
Global Endurance Portfolio
| | | Shares | | Value
(000) | |
Common Stocks (101.1%) | |
Canada (11.0%) | |
Colliers International Group, Inc. | | | 1,829 | | | $ | 143 | | |
Constellation Software, Inc. | | | 170 | | | | 165 | | |
| | | | 308 | | |
Germany (3.0%) | |
CompuGroup Medical SE | | | 1,182 | | | | 84 | | |
New Zealand (6.0%) | |
Ryman Healthcare Ltd. | | | 15,165 | | | | 167 | | |
South Africa (1.1%) | |
Discovery Ltd. | | | 3,500 | | | | 30 | | |
Sweden (4.4%) | |
AddLife AB, Class B | | | 2,335 | | | | 72 | | |
Cellavision AB | | | 1,492 | | | | 51 | | |
| | | | 123 | | |
United Kingdom (9.5%) | |
Blue Prism Group PLC (a) | | | 3,882 | | | | 58 | | |
Melrose Industries PLC | | | 28,691 | | | | 91 | | |
Victoria PLC (a) | | | 20,675 | | | | 118 | | |
| | | | 267 | | |
United States (66.1%) | |
Alteryx, Inc., Class A (a) | | | 610 | | | | 61 | | |
Appfolio, Inc., Class A (a) | | | 626 | | | | 69 | | |
Appian Corp. (a) | | | 2,990 | | | | 114 | | |
At Home Group, Inc. (a) | | | 7,645 | | | | 42 | | |
Cardlytics, Inc. (a) | | | 2,903 | | | | 182 | | |
Carvana Co. (a) | | | 2,994 | | | | 276 | | |
Copart, Inc. (a) | | | 795 | | | | 72 | | |
Fastly, Inc., Class A (a) | | | 5,946 | | | | 119 | | |
HEICO Corp. | | | 718 | | | | 82 | | |
Installed Building Products, Inc. (a) | | | 810 | | | | 56 | | |
Invitae Corp. (a) | | | 1,846 | | | | 30 | | |
LiveRamp Holdings, Inc. (a) | | | 1,283 | | | | 62 | | |
Party City Holdco, Inc. (a)(b) | | | 15,016 | | | | 35 | | |
Smartsheet, Inc., Class A (a) | | | 3,143 | | | | 141 | | |
Stitch Fix, Inc., Class A (a) | | | 4,446 | | | | 114 | | |
UnitedHealth Group, Inc. | | | 410 | | | | 121 | | |
Wayfair, Inc., Class A (a) | | | 653 | | | | 59 | | |
XPO Logistics, Inc. (a) | | | 2,419 | | | | 193 | | |
Zoom Video Communications, Inc., Class A (a) | | | 293 | | | | 20 | | |
| | | | 1,848 | | |
Total Common Stocks (Cost $2,172) | | | 2,827 | | |
Short-Term Investments (2.4%) | |
Securities held as Collateral on Loaned Securities (1.3%) | |
Investment Company (1.1%) | |
Morgan Stanley Institutional Liquidity
Funds — Treasury Securities Portfolio —
Institutional Class (See Note G) | | | 32,465 | | | | 32 | | |
| | | Face
Amount
(000) | | Value
(000) | |
Repurchase Agreements (0.2%) | |
Merrill Lynch & Co., Inc. (1.55%, dated
12/31/19, due 01/02/20; proceeds
$4; fully collateralized by a
U.S. Government obligation; 1.63% due
11/30/26; valued at $4) | | $ | 4 | | | $ | 4 | | |
HSBC Securities USA, Inc. (1.55%, dated
12/31/19, due 01/02/20; proceeds
$1; fully collateralized by a
U.S. Government obligation; 2.88% due
08/15/28; valued at $1) | | | 1 | | | | 1 | | |
| | | | 5 | | |
Total Securities held as Collateral on
Loaned Securities (Cost $37) | | | 37 | | |
| | | Shares | | | |
Investment Company (1.1%) | |
Morgan Stanley Institutional Liquidity
Funds — Treasury Securities Portfolio —
Institutional Class (See Note G)
(Cost $30) | | | 30,394 | | | | 30 | | |
Total Short-Term Investments (Cost $67) | | | 67 | | |
Total Investments (103.5%) (Cost $2,239)
Including $35 of Securities Loaned (c)(d) | | | 2,894 | | |
Liabilities in Excess of Other Assets (–3.5%) | | | (98 | ) | |
Net Assets (100.0%) | | $ | 2,796 | | |
Country assignments and aggregations are based generally on third party vendor classifications and information, and may be different from the assignments and aggregations under the policies set forth in the Fund's prospectus and/or statement of additional information relating to geographic classifications.
(a) Non-income producing security.
(b) All or a portion of this security was on loan at December 31, 2019.
(c) The approximate fair value and percentage of net assets, $207,000 and 7.4%, respectively, represent the securities that have been fair valued under the fair valuation policy for international investments as described in Note A-1 within the Notes to the Financial Statements.
(d) At December 31, 2019, the aggregate cost for federal income tax purposes is approximately $2,243,000. The aggregate gross unrealized appreciation is approximately $697,000 and the aggregate gross unrealized depreciation is approximately $46,000, resulting in net unrealized appreciation of approximately $651,000.
The accompanying notes are an integral part of the financial statements.
6
Morgan Stanley Institutional Fund, Inc.
Annual Report — December 31, 2019
Portfolio of Investments (cont'd)
Global Endurance Portfolio
Portfolio Composition*
Classification | | Percentage of
Total Investments | |
Software | | | 22.0 | % | |
Other** | | | 19.0 | | |
Specialty Retail | | | 12.4 | | |
Health Care Providers & Services | | | 10.1 | | |
Air Freight & Logistics | | | 6.7 | | |
Media | | | 6.4 | | |
Information Technology Services | | | 6.3 | | |
Household Durables | | | 6.1 | | |
Internet & Direct Marketing Retail | | | 6.0 | | |
Real Estate Management & Development | | | 5.0 | | |
Total Investments | | | 100.0 | % | |
* Percentages indicated are based upon total investments (excluding Securities held as Collateral on Loaned Securities) as of December 31, 2019.
** Industries and/or investment types representing less than 5% of total investments.
The accompanying notes are an integral part of the financial statements.
7
Morgan Stanley Institutional Fund, Inc.
Annual Report — December 31, 2019
Global Endurance Portfolio
Statement of Assets and Liabilities | | December 31, 2019
(000) | |
Assets: | |
Investments in Securities of Unaffiliated Issuers, at Value(1) (Cost $2,177) | | $ | 2,832 | | |
Investment in Security of Affiliated Issuer, at Value (Cost $62) | | | 62 | | |
Total Investments in Securities, at Value (Cost $2,239) | | | 2,894 | | |
Cash from Securities Lending | | | 1 | | |
Due from Adviser | | | 85 | | |
Dividends Receivable | | | — | @ | |
Receivable from Affiliate | | | — | @ | |
Receivable from Securities Lending Income | | | — | @ | |
Other Assets | | | 36 | | |
Total Assets | | | 3,016 | | |
Liabilities: | |
Payable for Offering Costs | | | 131 | | |
Payable for Professional Fees | | | 39 | | |
Collateral on Securities Loaned, at Value | | | 38 | | |
Payable for Custodian Fees | | | 2 | | |
Payable for Transfer Agency Fees — Class I | | | — | @ | |
Payable for Transfer Agency Fees — Class A | | | — | @ | |
Payable for Transfer Agency Fees — Class C | | | — | @ | |
Payable for Transfer Agency Fees — Class IS | | | — | @ | |
Payable for Shareholder Services Fees — Class A | | | — | @ | |
Payable for Distribution and Shareholder Services Fees — Class C | | | — | @ | |
Payable for Administration Fees | | | — | @ | |
Other Liabilities | | | 10 | | |
Total Liabilities | | | 220 | | |
Net Assets | | $ | 2,796 | | |
Net Assets Consist of: | |
Paid-in-Capital | | $ | 2,155 | | |
Total Distributable Earnings | | | 641 | | |
Net Assets | | $ | 2,796 | | |
CLASS I: | |
Net Assets | | $ | 2,757 | | |
| Shares Outstanding $0.001 par value shares of beneficial interest (unlimited shares authorized) (not in 000's) | | | 211,493 | | |
Net Asset Value, Offering and Redemption Price Per Share | | $ | 13.03 | | |
CLASS A: | |
Net Assets | | $ | 13 | | |
| Shares Outstanding $0.001 par value shares of beneficial interest (unlimited shares authorized) (not in 000's) | | | 1,000 | | |
Net Asset Value, Redemption Price Per Share | | $ | 12.99 | | |
Maximum Sales Load | | | 5.25 | % | |
Maximum Sales Charge | | $ | 0.72 | | |
Maximum Offering Price Per Share | | $ | 13.71 | | |
CLASS C: | |
Net Assets | | $ | 13 | | |
| Shares Outstanding $0.001 par value shares of beneficial interest (unlimited shares authorized) (not in 000's) | | | 1,000 | | |
Net Asset Value, Offering and Redemption Price Per Share | | $ | 12.89 | | |
CLASS IS: | |
Net Assets | | $ | 13 | | |
| Shares Outstanding $0.001 par value shares of beneficial interest (unlimited shares authorized) (not in 000's) | | | 1,000 | | |
Net Asset Value, Offering and Redemption Price Per Share | | $ | 13.04 | | |
(1) Including:
Securities on Loan, at Value: | | $ | 35 | | |
@ Amount is less than $500.
The accompanying notes are an integral part of the financial statements.
8
Morgan Stanley Institutional Fund, Inc.
Annual Report — December 31, 2019
Global Endurance Portfolio
Statement of Operations | | Year Ended
December 31, 2019
(000) | |
Investment Income: | |
Dividends from Securities of Unaffiliated Issuers (Net of $1 of Foreign Taxes Withheld) | | $ | 13 | | |
Dividends from Security of Affiliated Issuer (Note G) | | | 1 | | |
Income from Securities Loaned — Net | | | — | @ | |
Total Investment Income | | | 14 | | |
Expenses: | |
Offering Costs | | | 175 | | |
Professional Fees | | | 112 | | |
Advisory Fees (Note B) | | | 20 | | |
Shareholder Reporting Fees | | | 17 | | |
Registration Fees | | | 11 | | |
Transfer Agency Fees — Class I (Note E) | | | 2 | | |
Transfer Agency Fees — Class A (Note E) | | | 2 | | |
Transfer Agency Fees — Class C (Note E) | | | 2 | | |
Transfer Agency Fees — Class IS (Note E) | | | 2 | | |
Custodian Fees (Note F) | | | 7 | | |
Administration Fees (Note C) | | | 2 | | |
Pricing Fees | | | 2 | | |
Shareholder Services Fees — Class A (Note D) | | | — | @ | |
Distribution and Shareholder Services Fees — Class C (Note D) | | | — | @ | |
Directors' Fees and Expenses | | | — | @ | |
Other Expenses | | | 10 | | |
Total Expenses | | | 364 | | |
Expenses Reimbursed by Adviser (Note B) | | | (312 | ) | |
Waiver of Advisory Fees (Note B) | | | (20 | ) | |
Reimbursement of Class Specific Expenses — Class I (Note B) | | | (1 | ) | |
Reimbursement of Class Specific Expenses — Class A (Note B) | | | (2 | ) | |
Reimbursement of Class Specific Expenses — Class C (Note B) | | | (2 | ) | |
Reimbursement of Class Specific Expenses — Class IS (Note B) | | | (2 | ) | |
Rebate from Morgan Stanley Affiliate (Note G) | | | (— | @) | |
Net Expenses | | | 25 | | |
Net Investment Loss | | | (11 | ) | |
Realized Loss: | |
Investments Sold | | | (3 | ) | |
Foreign Currency Translation | | | (— | @) | |
Net Realized Loss | | | (3 | ) | |
Change in Unrealized Appreciation (Depreciation): | |
Investments | | | 658 | | |
Foreign Currency Translation | | | (— | @) | |
Net Change in Unrealized Appreciation (Depreciation) | | | 658 | | |
Net Realized Loss and Change in Unrealized Appreciation (Depreciation) | | | 655 | | |
Net Increase in Net Assets Resulting from Operations | | $ | 644 | | |
@ Amount is less than $500.
The accompanying notes are an integral part of the financial statements.
9
Morgan Stanley Institutional Fund, Inc.
Annual Report — December 31, 2019
Global Endurance Portfolio
Statements of Changes in Net Assets | | Year Ended
December 31, 2019
(000) | | Year Ended
December 31, 2018^
(000) | |
Increase (Decrease) in Net Assets: | |
Operations: | |
Net Investment Income (Loss) | | $ | (11 | ) | | $ | — | | |
Net Realized Loss | | | (3 | ) | | | (— | @) | |
Net Change in Unrealized Appreciation (Depreciation) | | | 658 | | | | (3 | ) | |
Net Increase (Decrease) in Net Assets Resulting from Operations | | | 644 | | | | (3 | ) | |
Capital Share Transactions:(1) | |
Class I: | |
Subscribed | | | 105 | | | | 2,020 | | |
Class A: | |
Subscribed | | | — | | | | 10 | | |
Class C: | |
Subscribed | | | — | | | | 10 | | |
Class IS: | |
Subscribed | | | — | | | | 10 | | |
Net Increase in Net Assets Resulting from Capital Share Transactions | | | 105 | | | | 2,050 | | |
Total Increase in Net Assets | | | 749 | | | | 2,047 | | |
Net Assets: | |
Beginning of Period | | | 2,047 | | | | — | | |
End of Period | | $ | 2,796 | | | $ | 2,047 | | |
(1) Capital Share Transactions: | |
Class I: | |
Shares Subscribed | | | 9 | | | | 202 | | |
Class A: | |
Shares Subscribed | | | — | | | | 1 | | |
Class C: | |
Shares Subscribed | | | — | | | | 1 | | |
Class IS: | |
Shares Subscribed | | | — | | | | 1 | | |
^ Commencement of Operations.
@ Amount is less than $500.
The accompanying notes are an integral part of the financial statements.
10
Morgan Stanley Institutional Fund, Inc.
Annual Report — December 31, 2019
Financial Highlights
Global Endurance Portfolio
| | | Class I | |
Selected Per Share Data and Ratios | | Year Ended
December 31, 2019 | | Period Ended
December 31, 2018(1) | |
Net Asset Value, Beginning of Period | | $ | 9.98 | | | $ | 10.00 | | |
Income (Loss) from Investment Operations: | |
Net Investment Loss(2) | | | (0.05 | ) | | | (0.00 | )(3) | |
Net Realized and Unrealized Gain (Loss) | | | 3.10 | | | | (0.02 | ) | |
Total from Investment Operations | | | 3.05 | | | | (0.02 | ) | |
Net Asset Value, End of Period | | $ | 13.03 | | | $ | 9.98 | | |
Total Return(4) | | | 30.30 | % | | | 0.00 | %(7) | |
Ratios to Average Net Assets and Supplemental Data: | |
Net Assets, End of Period (Thousands) | | $ | 2,757 | | | $ | 2,017 | | |
Ratio of Expenses Before Expense Limitation | | | 14.17 | % | | | 913.94 | %(8) | |
Ratio of Expenses After Expense Limitation | | | 1.00 | %(5) | | | 1.00 | %(8) | |
Ratio of Net Investment Loss | | | (0.42 | )%(5) | | | (1.00 | )%(8) | |
Ratio of Rebate from Morgan Stanley Affiliates | | | 0.00 | %(6) | | | N/A | | |
Portfolio Turnover Rate | | | 74 | % | | | 0 | %(7) | |
(1) Commencement of Operations.
(2) Per share amount is based on average shares outstanding.
(3) Amount is less than $0.005 per share.
(4) Calculated based on the net asset value as of the last business day of the period.
(5) The Ratio of Expenses After Expense Limitation and Ratio of Net Investment Loss reflect the rebate of certain Fund expenses in connection with the investments in Morgan Stanley affiliates during the period. The effect of the rebate on the ratios is disclosed in the above table as "Ratio of Rebate from Morgan Stanley Affiliates."
(6) Amount is less than 0.005%.
(7) Not annualized.
(8) Annualized.
The accompanying notes are an integral part of the financial statements.
11
Morgan Stanley Institutional Fund, Inc.
Annual Report — December 31, 2019
Financial Highlights
Global Endurance Portfolio
| | | Class A | |
Selected Per Share Data and Ratios | | Year Ended
December 31, 2019 | | Period Ended
December 31, 2018(1) | |
Net Asset Value, Beginning of Period | | $ | 9.98 | | | $ | 10.00 | | |
Income (Loss) from Investment Operations: | |
Net Investment Loss(2) | | | (0.09 | ) | | | (0.00 | )(3) | |
Net Realized and Unrealized Gain (Loss) | | | 3.10 | | | | (0.02 | ) | |
Total from Investment Operations | | | 3.01 | | | | (0.02 | ) | |
Net Asset Value, End of Period | | $ | 12.99 | | | $ | 9.98 | | |
Total Return(4) | | | 29.90 | % | | | 0.00 | %(7) | |
Ratios to Average Net Assets and Supplemental Data: | |
Net Assets, End of Period (Thousands) | | $ | 13 | | | $ | 10 | | |
Ratio of Expenses Before Expense Limitation | | | 29.52 | % | | | 927.90 | %(8) | |
Ratio of Expenses After Expense Limitation | | | 1.35 | %(5) | | | 1.35 | %(8) | |
Ratio of Net Investment Loss | | | (0.77 | )%(5) | | | (1.35 | )%(8) | |
Ratio of Rebate from Morgan Stanley Affiliates | | | 0.00 | %(6) | | | N/A | | |
Portfolio Turnover Rate | | | 74 | % | | | 0 | %(7) | |
(1) Commencement of Operations.
(2) Per share amount is based on average shares outstanding.
(3) Amount is less than $0.005 per share.
(4) Calculated based on the net asset value which does not reflect sales charges, if applicable, as of the last business day of the period.
(5) The Ratio of Expenses After Expense Limitation and Ratio of Net Investment Loss reflect the rebate of certain Fund expenses in connection with the investments in Morgan Stanley affiliates during the period. The effect of the rebate on the ratios is disclosed in the above table as "Ratio of Rebate from Morgan Stanley Affiliates."
(6) Amount is less than 0.005%.
(7) Not annualized.
(8) Annualized.
The accompanying notes are an integral part of the financial statements.
12
Morgan Stanley Institutional Fund, Inc.
Annual Report — December 31, 2019
Financial Highlights
Global Endurance Portfolio
| | | Class C | |
Selected Per Share Data and Ratios | | Year Ended
December 31, 2019 | | Period Ended
December 31, 2018(1) | |
Net Asset Value, Beginning of Period | | $ | 9.98 | | | $ | 10.00 | | |
Income (Loss) from Investment Operations: | |
Net Investment Loss(2) | | | (0.18 | ) | | | (0.00 | )(3) | |
Net Realized and Unrealized Gain (Loss) | | | 3.09 | | | | (0.02 | ) | |
Total from Investment Operations | | | 2.91 | | | | (0.02 | ) | |
Net Asset Value, End of Period | | $ | 12.89 | | | $ | 9.98 | | |
Total Return(4) | | | 28.90 | % | | | 0.00 | %(7) | |
Ratios to Average Net Assets and Supplemental Data: | |
Net Assets, End of Period (Thousands) | | $ | 13 | | | $ | 10 | | |
Ratio of Expenses Before Expense Limitation | | | 30.23 | % | | | 928.63 | %(8) | |
Ratio of Expenses After Expense Limitation | | | 2.10 | %(5) | | | 2.10 | %(8) | |
Ratio of Net Investment Loss | | | (1.52 | )%(5) | | | (2.10 | )%(8) | |
Ratio of Rebate from Morgan Stanley Affiliates | | | 0.00 | %(6) | | | N/A | | |
Portfolio Turnover Rate | | | 74 | %(7) | | | 0 | %(7) | |
(1) Commencement of Operations.
(2) Per share amount is based on average shares outstanding.
(3) Amount is less than $0.005 per share.
(4) Calculated based on the net asset value which does not reflect sales charges, if applicable, as of the last business day of the period.
(5) The Ratio of Expenses After Expense Limitation and Ratio of Net Investment Loss reflect the rebate of certain Fund expenses in connection with the investments in Morgan Stanley affiliates during the period. The effect of the rebate on the ratios is disclosed in the above table as "Ratio of Rebate from Morgan Stanley Affiliates."
(6) Amount is less than 0.005%.
(7) Not annualized.
(8) Annualized.
The accompanying notes are an integral part of the financial statements.
13
Morgan Stanley Institutional Fund, Inc.
Annual Report — December 31, 2019
Financial Highlights
Global Endurance Portfolio
| | | Class IS | |
Selected Per Share Data and Ratios | | Year Ended
December 31, 2019 | | Period Ended
December 31, 2018(1) | |
Net Asset Value, Beginning of Period | | $ | 9.98 | | | $ | 10.00 | | |
Income (Loss) from Investment Operations: | |
Net Investment Loss(2) | | | (0.04 | ) | | | (0.00 | )(3) | |
Net Realized and Unrealized Gain (Loss) | | | 3.10 | | | | (0.02 | ) | |
Total from Investment Operations | | | 3.06 | | | | (0.02 | ) | |
Net Asset Value, End of Period | | $ | 13.04 | | | $ | 9.98 | | |
Total Return(4) | | | 30.40 | % | | | 0.00 | %(7) | |
Ratios to Average Net Assets and Supplemental Data: | |
Net Assets, End of Period (Thousands) | | $ | 13 | | | $ | 10 | | |
Ratio of Expenses Before Expense Limitation | | | 29.13 | % | | | 927.65 | %(8) | |
Ratio of Expenses After Expense Limitation | | | 0.95 | %(5) | | | 0.95 | %(8) | |
Ratio of Net Investment Loss | | | (0.37 | )%(5) | | | (0.95 | )%(8) | |
Ratio of Rebate from Morgan Stanley Affiliates | | | 0.00 | %(6) | | | N/A | | |
Portfolio Turnover Rate | | | 74 | % | | | 0 | %(7) | |
(1) Commencement of Operations.
(2) Per share amount is based on average shares outstanding.
(3) Amount is less than $0.005 per share.
(4) Calculated based on the net asset value as of the last business day of the period.
(5) The Ratio of Expenses After Expense Limitation and Ratio of Net Investment Loss reflect the rebate of certain Fund expenses in connection with the investments in Morgan Stanley affiliates during the period. The effect of the rebate on the ratios is disclosed in the above table as "Ratio of Rebate from Morgan Stanley Affiliates."
(6) Amount is less than 0.005%.
(7) Not annualized.
(8) Annualized.
The accompanying notes are an integral part of the financial statements.
14
Morgan Stanley Institutional Fund, Inc.
Annual Report — December 31, 2019
Notes to Financial Statements
Morgan Stanley Institutional Fund, Inc. (the "Company") is registered under the Investment Company Act of 1940, as amended (the "Act"), as an open-end management investment company. The Company is comprised of thirty-two separate, active, diversified and non-diversified funds (individually referred to as a "Fund," collectively as the "Funds"). The Company applies investment company accounting and reporting guidance.
The accompanying financial statements relate to the Global Endurance Portfolio. The Fund seeks long-term capital appreciation.
The Fund offers four classes of shares — Class I, Class A, Class C and Class IS.
A. Significant Accounting Policies: The following significant accounting policies are in conformity with U.S. generally accepted accounting principles ("GAAP"). Such policies are consistently followed by the Company in the preparation of its financial statements. GAAP may require management to make estimates and assumptions that affect the reported amounts and disclosures in the financial statements. Actual results may differ from those estimates.
In August 2018, the Financial Accounting Standards Board ("FASB") issued Accounting Standards Update ("ASU") 2018-13, Fair Value Measurement (Topic 820) — Disclosures Framework — Changes to Disclosure Requirements of Fair Value Measurement ("ASU 2018-13") which introduces new fair value disclosure requirements as well as eliminates and modifies certain existing fair value disclosure requirements. ASU 2018-13 would be effective for fiscal years beginning after December 15, 2019 and for interim periods within those fiscal years; however, management has elected to early adopt ASU 2018-13 as permitted by the standard. The impact of the Fund's adoption was limited to changes in the Fund's financial statement disclosures regarding fair value, primarily those disclosures related to transfers between levels of the fair value hierarchy and disclosure of the range and weighted average used to develop significant unobservable inputs for Level 3 fair value measurements, when applicable.
1. Security Valuation: (1) An equity portfolio security listed or traded on an exchange is valued at its latest reported sales price (or at the exchange official closing price if such exchange reports an official closing price), and if there were no sales on a given day and if there is no official exchange closing price for that day, the security is valued at the mean between the last reported bid and asked prices
if such bid and asked prices are available on the relevant exchanges. If only bid prices are available then the latest bid price may be used. Listed equity securities not traded on the valuation date with no reported bid and asked prices available on the exchange are valued at the mean between the current bid and asked prices obtained from one or more reputable brokers or dealers. In cases where a security is traded on more than one exchange, the security is valued on the exchange designated as the primary market; (2) all other equity portfolio securities for which over-the-counter ("OTC") market quotations are readily available are valued at the latest reported sales price (or at the market official closing price if such market reports an official closing price), and if there was no trading in the security on a given day and if there is no official closing price from relevant markets for that day, the security is valued at the mean between the last reported bid and asked prices if such bid and asked prices are available on the relevant markets. An unlisted equity security that does not trade on the valuation date and for which bid and asked prices from the relevant markets are unavailable is valued at the mean between the current bid and asked prices obtained from one or more reputable brokers or dealers; (3) certain portfolio securities may be valued by an outside pricing service/vendor approved by the Company's Board of Directors (the "Directors"). The pricing service/vendor may employ a pricing model that takes into account, among other things, bids, yield spreads and/or other market data and specific security characteristics. Alternatively, if a valuation is not available from an outside pricing service/vendor, and the security trades on an exchange, the security may be valued at its latest reported sale price (or at the exchange official closing price if such exchange reports an official closing price), prior to the time when assets are valued. If there are no sales on a given day and if there is no official exchange closing price for that day, the security is valued at the mean between the last reported bid and asked prices if such bid and asked prices are available in the relevant exchanges. If Morgan Stanley Investment Management Inc. (the "Adviser"), a wholly-owned subsidiary of Morgan Stanley, determines that the price provided by the outside pricing service/vendor or exchange does not reflect the security's fair value or is unable to provide a price, prices from brokers or dealers may also be utilized. In these circumstances, the value of the security will be the mean of bid and asked prices obtained from brokers or dealers; (4) when market quotations are not readily
15
Morgan Stanley Institutional Fund, Inc.
Annual Report — December 31, 2019
Notes to Financial Statements (cont'd)
available, including circumstances under which the Adviser determines that the closing price, last sale price or the mean between the last reported bid and asked prices are not reflective of a security's market value, portfolio securities are valued at their fair value as determined in good faith under procedures established by and under the general supervision of the Directors. Occasionally, developments affecting the closing prices of securities and other assets may occur between the times at which valuations of such securities are determined (that is, close of the foreign market on which the securities trade) and the close of business of the New York Stock Exchange ("NYSE"). If developments occur during such periods that are expected to materially affect the value of such securities, such valuations may be adjusted to reflect the estimated fair value of such securities as of the close of the NYSE, as determined in good faith by the Directors or by the Adviser using a pricing service and/or procedures approved by the Directors; (5) quotations of foreign portfolio securities, other assets and liabilities and forward contracts stated in foreign currency are translated into U.S. dollar equivalents at the prevailing market rates prior to the close of the NYSE; and (6) investments in mutual funds, including the Morgan Stanley Institutional Liquidity Funds, are valued at the net asset value ("NAV") as of the close of each business day.
The Directors have responsibility for determining in good faith the fair value of the investments, and the Directors may appoint others, such as the Company's Adviser or a valuation committee, to assist the Directors in determining fair value and to make the actual calculations pursuant to the fair valuation methodologies previously approved by the Directors. Under procedures approved by the Directors, the Company's Adviser has formed a Valuation Committee whose members are approved by the Directors. The Valuation Committee provides administration and oversight of the Company's valuation policies and procedures, which are reviewed at least annually by the Directors. These procedures allow the Company to utilize independent pricing services, quotations from securities and financial instrument dealers and other market sources to determine fair value.
2. Fair Value Measurement: FASB Accounting Standards CodificationTM ("ASC") 820, "Fair Value Measurement" ("ASC 820"), defines fair value as the value that the
Fund would receive to sell an investment or pay to transfer a liability in a timely transaction with an independent buyer in the principal market, or in the absence of a principal market, the most advantageous market for the investment or liability. ASC 820 establishes a three-tier hierarchy to distinguish between (1) inputs that reflect the assumptions market participants would use in valuing an asset or liability developed based on market data obtained from sources independent of the reporting entity (observable inputs) and (2) inputs that reflect the reporting entity's own assumptions about the assumptions market participants would use in valuing an asset or liability developed based on the best information available in the circumstances (unobservable inputs) and to establish classification of fair value measurements for disclosure purposes. Various inputs are used in determining the value of the Fund's investments. The inputs are summarized in the three broad levels listed below:
• Level 1 – unadjusted quoted prices in active markets for identical investments
• Level 2 – other significant observable inputs (including quoted prices for similar investments, interest rates, prepayment speeds, credit risk, etc.)
• Level 3 – significant unobservable inputs including the Fund's own assumptions in determining the fair value of investments. Factors considered in making this determination may include, but are not limited to, information obtained by contacting the issuer, analysts, or the appropriate stock exchange (for exchange-traded securities), analysis of the issuer's financial statements or other available documents and, if necessary, available information concerning other securities in similar circumstances.
The inputs or methodology used for valuing securities are not necessarily an indication of the risk associated with investing in those securities and the determination of the significance of a particular input to the fair value measurement in its entirety requires judgment and considers factors specific to each security.
16
Morgan Stanley Institutional Fund, Inc.
Annual Report — December 31, 2019
Notes to Financial Statements (cont'd)
The following is a summary of the inputs used to value the Fund's investments as of December 31, 2019:
Investment Type | | Level 1
Unadjusted
quoted
prices
(000) | | Level 2
Other
significant
observable
inputs
(000) | | Level 3
Significant
unobservable
inputs
(000) | | Total
(000) | |
Assets: | |
Common Stocks | |
Aerospace & Defense | | $ | 82 | | | $ | — | | | $ | — | | | $ | 82 | | |
Air Freight & Logistics | | | 193 | | | | — | | | | — | | | | 193 | | |
Biotechnology | | | 30 | | | | — | | | | — | | | | 30 | | |
Commercial Services &
Supplies | | | 72 | | | | — | | | | — | | | | 72 | | |
Electrical Equipment | | | 91 | | | | — | | | | — | | | | 91 | | |
Health Care Equipment &
Supplies | | | — | | | | 51 | | | | — | | | | 51 | | |
Health Care Providers &
Services | | | 288 | | | | — | | | | — | | | | 288 | | |
Health Care Technology | | | — | | | | 84 | | | | — | | | | 84 | | |
Household Durables | | | 174 | | | | — | | | | — | | | | 174 | | |
Information Technology
Services | | | 181 | | | | — | | | | — | | | | 181 | | |
Insurance | | | 30 | | | | — | | | | — | | | | 30 | | |
Internet & Direct
Marketing Retail | | | 173 | | | | — | | | | — | | | | 173 | | |
Life Sciences Tools &
Services | | | — | | | | 72 | | | | — | | | | 72 | | |
Media | | | 182 | | | | — | | | | — | | | | 182 | | |
Real Estate Management &
Development | | | 143 | | | | — | | | | — | | | | 143 | | |
Software | | | 628 | | | | — | | | | — | | | | 628 | | |
Specialty Retail | | | 353 | | | | — | | | | — | | | | 353 | | |
Total Common Stocks | | | 2,620 | | | | 207 | | | | — | | | | 2,827 | | |
Short-Term Investments | |
Investment Company | | | 62 | | | | — | | | | — | | | | 62 | | |
Repurchase Agreements | | | — | | | | 5 | | | | — | | | | 5 | | |
Total Short-Term
Investments | | | 62 | | | | 5 | | | | — | | | | 67 | | |
Total Assets | | $ | 2,682 | | | $ | 212 | | | $ | — | | | $ | 2,894 | | |
Transfers between investment levels may occur as the markets fluctuate and/or the availability of data used in an investment's valuation changes.
3. Foreign Currency Translation and Foreign Investments: The books and records of the Fund are maintained in U.S. dollars. Foreign currency amounts are translated into U.S. dollars as follows:
— investments, other assets and liabilities at the prevailing rate of exchange on the valuation date;
— investment transactions and investment income at the prevailing rates of exchange on the dates of such transactions.
Although the net assets of the Fund are presented at the foreign exchange rates and market values at the close of
the period, the Fund does not isolate that portion of the results of operations arising as a result of changes in the foreign exchange rates from the fluctuations arising from changes in the market prices of securities held at period end. Similarly, the Fund does not isolate the effect of changes in foreign exchange rates from the fluctuations arising from changes in the market prices of securities sold during the period. Accordingly, realized and unrealized foreign currency gains (losses) on investments in securities are included in the reported net realized and unrealized gains (losses) on investment transactions and balances. However, pursuant to U.S. federal income tax regulations, gains and losses from certain foreign currency transactions and the foreign currency portion of gains and losses realized on sales and maturities of foreign denominated debt securities are treated as ordinary income for U.S. federal income tax purposes.
Net realized gains (losses) on foreign currency transactions represent net foreign exchange gains (losses) from foreign currency forward exchange contracts, disposition of foreign currencies, currency gains (losses) realized between the trade and settlement dates on securities transactions, and the difference between the amount of investment income and foreign withholding taxes recorded on the Fund's books and the U.S. dollar equivalent amounts actually received or paid. The change in unrealized currency gains (losses) on foreign currency transactions for the period is reflected in the Statement of Operations.
Foreign security and currency transactions may involve certain considerations and risks not typically associated with those of U.S. dollar denominated transactions as a result of, among other factors, fluctuations of exchange rates in relation to the U.S. dollar, the possibility of lower levels of governmental supervision and regulation of foreign securities markets and the possibility of political or economic instability.
Governmental approval for foreign investments may be required in advance of making an investment under certain circumstances in some countries, and the extent of foreign investments in domestic companies may be subject to limitation in other countries. Foreign ownership limitations also may be imposed by the charters of individual companies to prevent, among other concerns, violations of foreign investment limitations. As a result, an additional class of shares (identified as "Foreign" in
17
Morgan Stanley Institutional Fund, Inc.
Annual Report — December 31, 2019
Notes to Financial Statements (cont'd)
the Portfolio of Investments) may be created and offered for investment. The "local" and "foreign shares" market values may differ. In the absence of trading of the foreign shares in such markets, the Fund values the foreign shares at the closing exchange price of the local shares.
4. Securities Lending: The Fund lends securities to qualified financial institutions, such as broker-dealers, to earn additional income. Any increase or decrease in the fair value of the securities loaned that might occur and any interest earned or dividends declared on those securities during the term of the loan would remain in the Fund. The Fund would receive cash or securities as collateral in an amount equal to or exceeding 100% of the current fair value of the loaned securities. The collateral is marked-to-market daily by State Street Bank and Trust Company ("State Street"), the securities lending agent, to ensure that a minimum of 100% collateral coverage is maintained.
Based on pre-established guidelines, the securities lending agent invests any cash collateral that is received in an affiliated money market portfolio and repurchase agreements. Securities lending income is generated from the earnings on the invested collateral and borrowing fees, less any rebates owed to the borrowers and compensation to the lending agent, and is recorded as "Income from Securities Loaned — Net" in the Fund's Statement of Operations. Risks in securities lending transactions are that a borrower may not provide additional collateral when required or return the securities when due, and that the value of the short-term investments will be less than the amount of cash collateral plus any rebate that is required to be returned to the borrower.
The Fund has the right under the securities lending agreement to recover the securities from the borrower on demand.
The following table presents financial instruments that are subject to enforceable netting arrangements as of December 31, 2019:
Gross Amounts Not Offset in the Statement of Assets and Liabilities | |
Gross Asset
Amounts
Presented in the
Statement of
Assets and
Liabilities
(000) | | Financial
Instrument
(000) | | Collateral
Received
(000) | | Net Amount
(not less
than $0)
(000) | |
| $ | 35 | (a) | | $ | — | | | $ | (35 | )(b)(c) | | $ | 0 | | |
(a) Represents market value of loaned securities at period end.
(b) The Fund received cash collateral of approximately $38,000, of which approximately $37,000 was subsequently invested in Repurchase Agreements and Morgan Stanley Institutional Liquidity Funds as reported in the Portfolio of Investments. As of December 31, 2019, there was uninvested cash of approximately $1,000, which is not reflected in the Portfolio of Investments.
(c) The actual collateral received is greater than the amount shown here due to overcollateralization.
FASB ASC 860, "Transfers & Servicing: Repurchase-to-Maturity Transactions, Repurchase Financings, and Disclosures", is intended to provide increased transparency about the types of collateral pledged in securities lending transactions and other similar transactions that are accounted for as secured borrowing.
The following table displays a breakdown of transactions accounted for as secured borrowings, the gross obligations by class of collateral pledged and the remaining contractual maturity of those transactions as of December 31, 2019:
Remaining Contractual Maturity of the Agreements | |
| | | Overnight and
Continuous
(000) | | <30 days
(000) | | Between
30 &
90 days
(000) | | >90 days
(000) | | Total
(000) | |
Securities Lending
Transactions | |
Common Stocks | | $ | 38 | | | $ | — | | | $ | — | | | $ | — | | | $ | 38 | | |
Total Borrowings | | $ | 38 | | | $ | — | | | $ | — | | | $ | — | | | $ | 38 | | |
Gross amount of
recognized liabilities
for securities lending
transactions | | | | | | | | | | $ | 38 | | |
5. Indemnifications: The Company enters into contracts that contain a variety of indemnifications. The Company's maximum exposure under these arrangements is unknown. However, the Company has not had prior claims or losses pursuant to these contracts and expects the risk of loss to be remote.
6. Dividends and Distributions to Shareholders: Dividends and distributions to shareholders are recorded on the ex-dividend date. Dividends from net investment income, if any, are declared and paid annually. Net realized capital gains, if any, are distributed at least annually.
7. Security Transactions, Income and Expenses: Security transactions are accounted for on the trade date (date the order to buy or sell is executed). Realized gains and losses on the sale of investment securities are determined on the specific identified cost method. Dividend income and other distributions are recorded on the ex-dividend date (except for certain foreign dividends which may be recorded as soon as the Fund is informed of such dividends) net of applicable withholding taxes.
18
Morgan Stanley Institutional Fund, Inc.
Annual Report — December 31, 2019
Notes to Financial Statements (cont'd)
Interest income is recognized on the accrual basis except where collection is in doubt. Discounts are accreted and premiums are amortized over the life of the respective securities. Most expenses of the Company can be directly attributed to a particular Fund. Expenses which cannot be directly attributed are apportioned among the Funds based upon relative net assets or other appropriate methods. Income, expenses (other than class specific expenses — distribution and shareholder services, transfer agency and sub transfer agency fees) and realized and unrealized gains or losses are allocated to each class of shares based upon their relative net assets.
B. Advisory Fees: The Adviser, a wholly-owned subsidiary of Morgan Stanley, provides the Fund with advisory services under the terms of an Investment Advisory Agreement, paid quarterly, at the annual rate based on the daily net assets as follows:
First $1
billion | | Over $1
billion | |
| | 0.80 | % | | | 0.75 | % | |
For the year ended December 31, 2019, the advisory fee rate (net of waiver/rebate) was equivalent to an annual effective rate of 0.00% of the Fund's average daily net assets.
The Adviser has agreed to reduce its advisory fee and/or reimburse the Fund so that total annual Fund operating expenses, excluding certain investment related expenses, taxes, interest and other extraordinary expenses (including litigation), will not exceed 1.00% for Class I shares, 1.35% for Class A shares, 2.10% for Class C shares and 0.95% for Class IS shares. The fee waivers and/or expense reimbursements will continue for at least one year from the date of the Fund's prospectus or until such time as the Directors act to discontinue all or a portion of such waivers and/or reimbursements when they deem such action is appropriate. For the year ended December 31, 2019, approximately $20,000 of advisory fees were waived and approximately $319,000 of other expenses were reimbursed by the Adviser pursuant to this arrangement.
C. Administration Fees: The Adviser also serves as Administrator to the Company and provides administrative services pursuant to an Administration Agreement for an annual fee, accrued daily and paid monthly, of 0.08% of the Fund's average daily net assets.
Under a Sub-Administration Agreement between the Administrator and State Street, State Street provides certain administrative services to the Company. For such services, the
Administrator pays State Street a portion of the fee the Administrator receives from the Fund.
D. Distribution and Shareholder Services Fees: Morgan Stanley Distribution, Inc. ("MSDI" or the "Distributor"), a wholly-owned subsidiary of the Adviser and an indirect subsidiary of Morgan Stanley, serves as the Company's Distributor of Fund shares pursuant to a Distribution Agreement. The Company has adopted a Shareholder Services Plan with respect to Class A shares pursuant to Rule 12b-1 under the Act. Under the Shareholder Services Plan, the Fund pays the Distributor a shareholder services fee, accrued daily and paid monthly, at an annual rate of 0.25% of the Fund's average daily net assets attributable to Class A shares.
The Company has adopted a Distribution and Shareholder Services Plan with respect to Class C shares pursuant to Rule 12b-1 under the Act. Under the Distribution and Shareholder Services Plan, the Fund pays the Distributor a distribution fee, accrued daily and paid monthly, at an annual rate of 0.75% and a shareholder services fee, accrued daily and paid monthly, at an annual rate of 0.25% of the Fund's average daily net assets attributable to Class C shares.
The distribution and shareholder services fees are used to support the expenses associated with servicing and maintaining accounts. The Distributor may compensate other parties for providing shareholder support services to investors who purchase Class A and Class C shares.
E. Dividend Disbursing and Transfer Agent: The Company's dividend disbursing and transfer agent is DST Asset Manager Solutions, Inc. ("DST"). Pursuant to a Transfer Agency Agreement, the Company pays DST a fee based on the number of classes, accounts and transactions relating to the Funds of the Company.
F. Custodian Fees: State Street (the "Custodian") also serves as Custodian for the Company in accordance with a Custodian Agreement. The Custodian holds cash, securities and other assets of the Company as required by the Act. Custody fees are payable monthly based on assets held in custody, investment purchases and sales activity and account maintenance fees, plus reimbursement for certain out-of-pocket expenses.
G. Security Transactions and Transactions with Affiliates: For the year ended December 31, 2019, purchases and sales of investment securities for the Fund, other than long-term U.S. Government securities and short-term investments were approximately $2,184,000 and $1,849,000, respectively.
19
Morgan Stanley Institutional Fund, Inc.
Annual Report — December 31, 2019
Notes to Financial Statements (cont'd)
There were no purchases and sales of long-term U.S. Government securities for the year ended December 31, 2019.
The Fund invests in the Institutional Class of the Morgan Stanley Institutional Liquidity Funds — Treasury Securities Portfolio (the "Liquidity Funds"), an open-end management investment company managed by the Adviser, both directly and as a portion of securities held as collateral on loaned securities. Advisory fees paid by the Fund are reduced by an amount equal to its pro-rata share of the advisory and administration fees paid by the Fund due to its investment in the Liquidity Funds. For the year ended December 31, 2019, advisory fees paid were reduced by less than $500 relating to the Fund's investment in the Liquidity Funds.
A summary of the Fund's transactions in shares of affiliated investments during the year ended December 31, 2019 is as follows:
Affiliated
Investment
Company | | Value
December 31,
2018
(000) | | Purchases
at Cost
(000) | | Proceeds
from Sales
(000) | | Dividend
Income
(000) | |
Liquidity Funds | | $ | — | | | $ | 3,006 | | | $ | 2,944 | | | $ | 1 | | |
Affiliated
Investment
Company (cont'd) | | Realized
Gain (Loss)
(000) | | Change in
Unrealized
Appreciation
(Depreciation)
(000) | | Value
December 31,
2019
(000) | |
Liquidity Funds | | $ | — | | | $ | — | | | $ | 62 | | |
The Fund is permitted to purchase and sell securities ("cross-trade") from and to other Morgan Stanley funds as well as other funds and client accounts for which the Adviser or an affiliate of the Adviser serves as investment adviser, pursuant to procedures approved by the Directors in compliance with Rule 17a-7 under the Act (the "Rule"). Each cross-trade is executed at the current market price in compliance with provisions of the Rule. For the year ended December 31, 2019, the Fund did not engage in any cross-trade transactions.
The Fund has an unfunded Deferred Compensation Plan (the "Compensation Plan"), which allows each independent Director to defer payment of all, or a portion, of the fees he or she receives for serving on the Board of Directors. Each eligible Director generally may elect to have the deferred amounts credited with a return equal to the total return on one or more of the Morgan Stanley funds that are offered as investment options under the Compensation Plan. Appreciation/depreciation and distributions received from these investments are recorded with an offsetting increase/decrease in the deferred compensation obligation and do not affect the NAV of the Fund.
H. Federal Income Taxes: It is the Fund's intention to continue to qualify as a regulated investment company and distribute all of its taxable and tax-exempt income. Accordingly, no provision for federal income taxes is required in the financial statements.
The Fund may be subject to taxes imposed by countries in which it invests. Such taxes are generally based on income and/or capital gains earned or repatriated. Taxes are accrued based on net investment income, net realized gains and net unrealized appreciation as such income and/or gains are earned. Taxes may also be based on transactions in foreign currency and are accrued based on the value of investments denominated in such currency.
FASB ASC 740-10, "Income Taxes — Overall", sets forth a minimum threshold for financial statement recognition of the benefit of a tax position taken or expected to be taken in a tax return. Management has concluded there are no significant uncertain tax positions that would require recognition in the financial statements. If applicable, the Fund recognizes interest accrued related to unrecognized tax benefits in "Interest Expense" and penalties in "Other Expenses" in the Statement of Operations. The Fund files tax returns with the U.S. Internal Revenue Service, New York and various states. Each of the tax years in the two-year period ended December 31, 2019 remains subject to examination by taxing authorities.
The tax character of distributions paid may differ from the character of distributions shown for GAAP purposes due to short-term capital gains being treated as ordinary income for tax purposes. There were no distributions paid during fiscal years 2019 and 2018.
The amount and character of income and gains to be distributed are determined in accordance with income tax regulations which may differ from GAAP. These book/tax differences are either considered temporary or permanent in nature.
Temporary differences are attributable to differing book and tax treatments for the timing of the recognition of gains (losses) on certain investment transactions and the timing of the deductibility of certain expenses.
The Fund had no permanent differences causing reclassifications among the components of net assets for the year ended December 31, 2019.
20
Morgan Stanley Institutional Fund, Inc.
Annual Report — December 31, 2019
Notes to Financial Statements (cont'd)
At December 31, 2019, the components of distributable earnings for the Fund on a tax basis were as follows:
Undistributed
Ordinary
Income
(000) | | Undistributed
Long-Term
Capital Gain
(000) | |
| $ | 9 | | | $ | — | | |
I. Credit Facility: The Company and other Morgan Stanley funds participated in a $150,000,000 committed, unsecured revolving line of credit facility (the "Facility") with State Street. Effective April 22, 2019, the committed line amount increased to $300,000,000. This Facility is to be used for temporary emergency purposes or funding of shareholder redemption requests. The interest rate on borrowings is based on the federal funds rate or 1 month LIBOR rate plus a spread. The Facility also has a commitment fee of 0.25% per annum based on the unused portion of the Facility. During the year ended December 31, 2019, the Fund did not have any borrowings under the Facility.
J. Other: At December 31, 2019, the Fund had record owners of 10% or greater. Investment activities of these shareholders could have a material impact on the Fund. The aggregate percentage of such owners was 46.6%.
21
Morgan Stanley Institutional Fund, Inc.
Annual Report — December 31, 2019
Report of Independent Registered Public Accounting Firm
To the Shareholders and Board of Directors of
Morgan Stanley Institutional Fund, Inc. —
Global Endurance Portfolio
Opinion on the Financial Statements
We have audited the accompanying statement of assets and liabilities of Global Endurance Portfolio (the "Fund") (one of the funds constituting Morgan Stanley Institutional Fund, Inc. (the "Company")), including the portfolio of investments, as of December 31, 2019, and the related statement of operations for the year then ended, the statements of changes in net assets and the financial highlights for the year then ended and the period from December 31, 2018 (commencement of operations) through December 31, 2018 and the related notes (collectively referred to as the "financial statements"). In our opinion, the financial statements present fairly, in all material respects, the financial position of Global Endurance Portfolio (one of the funds constituting Morgan Stanley Institutional Fund, Inc.) at December 31, 2019, the results of its operations for the year then ended and the changes in its net assets and its financial highlights for the year then ended and the period from December 31, 2018 (commencement of operations) through December 31, 2018, in conformity with U.S. generally accepted accounting principles.
Basis for Opinion
These financial statements are the responsibility of the Company's management. Our responsibility is to express an opinion on the Fund's financial statements based on our audits. We are a public accounting firm registered with the Public Company Accounting Oversight Board (United States) ("PCAOB") and are required to be independent with respect to the Company in accordance with the U.S. federal securities law and the applicable rules and regulations of the Securities and Exchange Commission and the PCAOB.
We conducted our audits in accordance with the standards of the PCAOB. Those standards require that we plan and perform the audit to obtain reasonable assurance about whether the financial statements are free of material misstatement, whether due to error or fraud. The Company is not required to have, nor were we engaged to perform, an audit of the Company's internal control over financial reporting. As part of our audits, we are required to obtain an understanding of internal control over financial reporting, but not for the purpose of expressing an opinion on the effectiveness of the Company's internal control over financial reporting. Accordingly, we express no such opinion.
Our audits included performing procedures to assess the risks of material misstatement of the financial statements, whether due to error or fraud, and performing procedures that respond to those risks. Such procedures included examining, on a test basis, evidence regarding the amounts and disclosures in the financial statements. Our procedures included confirmation of securities owned as of December 31, 2019 by correspondence with the custodian and others or by other appropriate auditing procedures where replies from others were not received. Our audits also included evaluating the accounting principles used and significant estimates made by management, as well as evaluating the overall presentation of the financial statements. We believe that our audits provide a reasonable basis for our opinion.

We have served as the auditor of one or more Morgan Stanley investment companies since 2000.
Boston, Massachusetts
February 27, 2020
22
Privacy Notice (unaudited) April 2019
FACTS | | WHAT DOES MSIM DO WITH YOUR PERSONAL INFORMATION? | |
Why? | | Financial companies choose how they share your personal information. Federal law gives consumers the right to limit some but not all sharing. Federal law also requires us to tell you how we collect, share, and protect your personal information. Please read this notice carefully to understand what we do. | |
What? | | The types of personal information we collect and share depend on the product or service you have with us. This information can include:
n Social Security number and income
n investment experience and risk tolerance
n checking account number and wire transfer instructions | |
How? | | All financial companies need to share customers' personal information to run their everyday business. In the section below, we list the reasons financial companies can share their customers' personal information; the reasons MSIM chooses to share; and whether you can limit this sharing. | |
Reasons we can share your personal information | | Does MSIM share? | | Can you limit this sharing? | |
For our everyday business purposes —
such as to process your transactions, maintain your account(s), respond to court orders and legal investigations, or report to credit bureaus | | Yes | | No | |
For our marketing purposes —
to offer our products and services to you | | Yes | | No | |
For joint marketing with other financial companies | | No | | We don't share | |
For our affiliates' everyday business purposes —
information about your transactions and experiences | | Yes | | No | |
For our affiliates' everyday business purposes —
information about your creditworthiness | | No | | We don't share | |
For our affiliates to market to you | | No | | We don't share | |
For non-affiliates to market to you | | No | | We don't share | |
Questions? Call toll-free (844) 312-6327 or email: imprivacyinquiries@morganstanley.com
23
Privacy Notice (unaudited) (cont'd) April 2019
Who we are
Who is providing this notice? | | Morgan Stanley Investment Management, Inc. and its affiliated registered investment advisers, registered broker-dealers, and registered and unregistered funds ("MSIM") | |
What we do
How does MSIM protect my personal information? | | To protect your personal information from unauthorized access and use, we use security measures that comply with federal law. These measures include computer safeguards and secured files and buildings. We have policies governing the proper handling of customer information by personnel and requiring third parties that provide support to adhere to appropriate security standards with respect to such information. | |
How does MSIM collect my personal information? | | We collect your personal information, for example, when you
n open an account or make deposits or withdrawals from your account
n buy securities from us or make a wire transfer
n give us your contact information
We also collect your personal information from others, such as credit bureaus, affiliates, or other companies. | |
Why can't I limit all sharing? | | Federal law gives you the right to limit only
n sharing for affiliates' everyday business purposes — information about your creditworthiness
n affiliates from using your information to market to you
n sharing for non-affiliates to market to you
State laws and individual companies may give you additional rights to limit sharing. See below for more on your rights under state law. | |
Definitions
Affiliates | | Companies related by common ownership or control. They can be financial and non-financial companies.
n Our affiliates include companies with a Morgan Stanley name and financial companies such as Morgan Stanley Smith Barney LLC and Morgan Stanley & Co. | |
Non-affiliates | | Companies not related by common ownership or control. They can be financial and non-financial companies.
n MSIM does not share with non-affiliates so they can market to you. | |
Joint marketing | | A formal agreement between non-affiliated financial companies that together market financial products or services to you.
n MSIM doesn't jointly market | |
Other Important Information
Vermont: Except as permitted by law, we will not share personal information we collect about Vermont residents with Non-affiliates unless you provide us with your written consent to share such information.
California: Except as permitted by law, we will not share personal information we collect about California residents with Non-affiliates and we will limit sharing such personal information with our Affiliates to comply with California privacy laws that apply to us.
24
Morgan Stanley Institutional Fund, Inc.
Annual Report — December 31, 2019
Director and Officer Information (unaudited)
Independent Directors:
Name, Birth Year
and Address of
Independent Director | | Position(s)
Held with
Registrant | | Length of Time
Served* | | Principal Occupation(s) During Past 5 Years
and Other Relevant Professional Experience | | Number of
Funds in
Fund Complex
Overseen by
Independent
Director** | | Other Directorships
Held by Independent
Director*** | |
Frank L. Bowman
c/o Perkins Coie LLP
Counsel to the Independent Directors
1155 Avenue of the Americas
New York, NY 10036
Birth Year 1944 | | Director | | Since
August 2006 | | President, Strategic Decisions, LLC (consulting) (since February 2009); Director or Trustee of various Morgan Stanley Funds (since August 2006); Chairperson of the Compliance and Insurance Committee (since October 2015); formerly, Chairperson of the Insurance Sub-Committee of the Compliance and Insurance Committee (2007-2015); served as President and Chief Executive Officer of the Nuclear Energy Institute (policy organization) (February 2005-November 2008); retired as Admiral, U.S. Navy after serving over 38 years on active duty including 8 years as Director of the Naval Nuclear Propulsion Program in the Department of the Navy and the U.S. Department of Energy (1996-2004); served as Chief of Naval Personnel (July 1994-September 1996) and on the Joint Staff as Director of Political Military Affairs (June 1992-July 1994); knighted as Honorary Knight Commander of the Most Excellent Order of the British Empire; awarded the Officier de l'Orde National du Mérite by the French Government; elected to the National Academy of Engineering (2009). | | | 86 | | | Director of Naval and Nuclear Technologies LLP; Director Emeritus of the Armed Services YMCA; Member of the National Security Advisory Council of the Center for U.S. Global Engagement and a member of the CNA Military Advisory Board; Trustee of Fairhaven United Methodist Church; Member of the Board of Advisors of the Dolphin Scholarship Foundation; Director of other various non-profit organizations; formerly, Director of BP p.l.c. (November 2010-May 2019). | |
Kathleen A. Dennis
c/o Perkins Coie LLP
Counsel to the Independent Directors
1155 Avenue of the Americas
New York, NY 10036
Birth Year 1953 | | Director | | Since August 2006 | | President, Cedarwood Associates (mutual fund and investment management consulting) (since July 2006); Chairperson of the Liquidity and Alternatives Sub-Committee of the Investment Committee (since October 2006) and Director or Trustee of various Morgan Stanley Funds (since August 2006); formerly, Senior Managing Director of Victory Capital Management (1993-2006). | | | 86 | | | Director of various non-profit organizations. | |
Nancy C. Everett
c/o Perkins Coie LLP
Counsel to the Independent Directors
1155 Avenue of the Americas
New York, NY 10036
Birth Year 1955 | | Director | | Since January 2015 | | Chief Executive Officer, Virginia Commonwealth University Investment Company (since November 2015); Owner, OBIR, LLC (institutional investment management consulting) (since June 2014); formerly, Managing Director, BlackRock, Inc. (February 2011-December 2013); and Chief Executive Officer, General Motors Asset Management (a/k/a Promark Global Advisors, Inc.) (June 2005-May 2010). | | | 87 | | | Formerly, Member of Virginia Commonwealth University School of Business Foundation (2005-2016); Member of Virginia Commonwealth University Board of Visitors (2013-2015); Member of Committee on Directors for Emerging Markets Growth Fund, Inc. (2007-2010); Chairperson of Performance Equity Management, LLC (2006-2010); and Chairperson, GMAM Absolute Return Strategies Fund, LLC (2006-2010). | |
25
Morgan Stanley Institutional Fund, Inc.
Annual Report — December 31, 2019
Director and Officer Information (unaudited) (cont'd)
Independent Directors: (cont'd)
Name, Birth Year
and Address of
Independent Director | | Position(s)
Held with
Registrant | | Length of Time
Served* | | Principal Occupation(s) During Past 5 Years
and Other Relevant Professional Experience | | Number of
Funds in
Fund Complex
Overseen by
Independent
Director** | | Other Directorships
Held by Independent
Director*** | |
Jakki L. Haussler
c/o Perkins Coie LLP
Counsel to the Independent Directors
1155 Avenue of the Americas
New York, NY 10036
Birth Year 1957 | | Director | | Since January 2015 | | Chairman, Opus Capital Group (since 1996); formerly, Chief Executive Officer, Opus Capital Group (1996-2019); Director, Capvest Venture Fund, LP (May 2000-December 2011); Partner, Adena Ventures, LP (July 1999-December 2010); Director, The Victory Funds (February 2005-July 2008). | | | 87 | | | Director of Service Corporation International and Member, Audit Committee and Investment Committee; Director of Cincinnati Bell Inc. and Member, Audit Committee and Governance and Nominating Committee; Chairman of Northern Kentucky University Member Investment Committee; Member of Chase College of Law Transactional Law Practice Center Board of Advisors; Director of Best Transport; Director of Chase College of Law Board of Visitors; formerly, Member, University of Cincinnati Foundation Investment Committee; Member, Miami University Board of Visitors (2008-2011); Trustee of Victory Funds (2005-2008) and Chairman, Investment Committee (2007-2008) and Member, Service Provider Committee (2005-2008). | |
Dr. Manuel H. Johnson
c/o Johnson Smick International, Inc.
220 I Street, NE — Suite 200
Washington, D.C. 20002
Birth Year 1949 | | Director | | Since July 1991 | | Senior Partner, Johnson Smick International, Inc. (consulting firm); Chairperson of the Investment Committee (since October 2006) and Director or Trustee of various Morgan Stanley Funds (since July 1991); Co-Chairman and a founder of the Group of Seven Council (G7C) (international economic commission); formerly, Chairperson of the Audit Committee (July 1991-September 2006), Vice Chairman of the Board of Governors of the Federal Reserve System and Assistant Secretary of the U.S. Treasury. | | | 86 | | | Director of NVR, Inc. (home construction). | |
Joseph J. Kearns
c/o Perkins Coie LLP
Counsel to the Independent Directors
1155 Avenue of the Americas
New York, NY 10036
Birth Year 1942 | | Director | | Since August 1994 | | Senior Adviser, Kearns & Associates LLC (investment consulting); Chairperson of the Audit Committee (since October 2006) and Director or Trustee of various Morgan Stanley Funds (since August 1994); formerly, Deputy Chairperson of the Audit Committee (July 2003-September 2006) and Chairperson of the Audit Committee of various Morgan Stanley Funds (since August 1994); CFO of the J. Paul Getty Trust. | | | 87 | | | Prior to August 10, 2016, Director of Electro Rent Corporation (equipment leasing); Prior to December 31, 2013, Director of The Ford Family Foundation. | |
26
Morgan Stanley Institutional Fund, Inc.
Annual Report — December 31, 2019
Director and Officer Information (unaudited) (cont'd)
Independent Directors: (cont'd)
Name, Birth Year
and Address of
Independent Director | | Position(s)
Held with
Registrant | | Length of Time
Served* | | Principal Occupation(s) During Past 5 Years
and Other Relevant Professional Experience | | Number of
Funds in
Fund Complex
Overseen by
Independent
Director** | | Other Directorships
Held by Independent
Director*** | |
Michael F. Klein
c/o Perkins Coie LLP
Counsel to the Independent Directors
1155 Avenue of the Americas
New York, NY 10036
Birth Year 1958 | | Director | | Since August 2006 | | Managing Director, Aetos Alternatives Management, LP (since March 2000); Co-President, Aetos Alternatives Management, LP (since January 2004) and Co-Chief Executive Officer of Aetos Alternatives Management, LP (since August 2013); Chairperson of the Fixed Income Sub-Committee of the Investment Committee (since October 2006) and Director or Trustee of various Morgan Stanley Funds (since August 2006); formerly, Managing Director, Morgan Stanley & Co. Inc. and Morgan Stanley Dean Witter Investment Management and President, various Morgan Stanley Funds (June 1998-March 2000); Principal, Morgan Stanley & Co. Inc. and Morgan Stanley Dean Witter Investment Management (August 1997-December 1999). | | | 86 | | | Director of certain investment funds managed or sponsored by Aetos Alternatives Management, LP; Director of Sanitized AG and Sanitized Marketing AG (specialty chemicals). | |
Patricia Maleski
c/o Perkins Coie LLP
Counsel to the Independent Directors
1155 Avenue of the Americas
New York, NY 10036
Birth Year 1960 | | Director | | Since January 2017 | | Managing Director, JPMorgan Asset Management (2004-2016); Oversight and Control Head of Fiduciary and Conflicts of Interest Program (2015-2016); Chief Control Officer-Global Asset Management (2013-2015); President, JPMorgan Funds (2010-2013); Chief Administrative Officer (2004-2013); various other positions including Treasurer and Board Liaison (since 2001). | | | 87 | | | None. | |
Michael E. Nugent
522 Fifth Avenue
New York, NY 10036
Birth Year 1936 | | Chair of the Board and Director | | Chair of the Boards since July 2006 and Director since July 1991 | | Chair of the Boards of various Morgan Stanley Funds (since July 2006); Chairperson of the Governance Committee (since January 2019) and Director or Trustee of various Morgan Stanley Funds (since July 1991); formerly, Chairperson of each of the Closed-End Fund committee (until December 2019) and the Insurance Committee (until July 2006); General Partner, Triumph Capital, L.P. (private investment partnership) (1988-2013). | | | 86 | | | None. | |
W. Allen Reed
c/o Perkins Coie LLP
Counsel to the Independent Directors
1155 Avenue of the Americas
New York, NY 10036
Birth Year 1947 | | Vice Chair of the Board and Director | | Vice Chair of the Boards since January 2020 and Director since August 2006 | | Chairperson of the Equity Sub-Committee of the Investment Committee (since October 2006) and Director or Trustee of various Morgan Stanley Funds (since August 2006); formerly, President and CEO of General Motors Asset Management; Chairman and Chief Executive Officer of the GM Trust Bank and Corporate Vice President of General Motors Corporation (August 1994-December 2005). | | | 86 | | | Formerly, Director of Legg Mason, Inc.; formerly, Director of the Auburn University Foundation (2010-2015). | |
* This is the earliest date the Director began serving the Morgan Stanley Funds. Each Director serves an indefinite term, until his or her successor is elected.
** The Fund Complex includes (as of December 31, 2019) all open-end and closed-end funds (including all of their portfolios) advised by Morgan Stanley Investment Management Inc. (the "Adviser") and any funds that have an adviser that is an affiliated person of the Adviser (including, but not limited to, Morgan Stanley AIP GP LP).
*** This includes any directorships at public companies and registered investment companies held by the Director at any time during the past five years.
27
Morgan Stanley Institutional Fund, Inc.
Annual Report — December 31, 2019
Director and Officer Information (unaudited) (cont'd)
Executive Officers:
Name, Birth Year and Address of
Executive Officer | | Position(s) Held
with
Registrant | | Length of
Time Served* | | Principal Occupation(s) During Past 5 Years | |
John H. Gernon
522 Fifth Avenue
New York, NY 10036
Birth Year 1963 | | President and Principal Executive Officer | | Since September 2013 | | President and Principal Executive Officer of the Equity and Fixed Income Funds and the Morgan Stanley AIP Funds (since September 2013) and the Liquidity Funds and various money market funds (since May 2014) in the Fund Complex; Managing Director of the Adviser; Head of Product (since 2006). | |
Timothy J. Knierim
522 Fifth Avenue
New York, NY 10036
Birth Year 1959 | | Chief Compliance Officer | | Since December 2016 | | Managing Director of the Adviser and various entities affiliated with the Adviser; Chief Compliance Officer of various Morgan Stanley Funds and the Adviser (since December 2016) and Chief Compliance Officer of Morgan Stanley AIP GP LP (since 2014). Formerly, Managing Director and Deputy Chief Compliance Officer of the Adviser (2014-2016); and formerly, Chief Compliance Officer of Prudential Investment Management, Inc. (2007-2014). | |
Francis J. Smith
522 Fifth Avenue
New York, NY 10036
Birth Year 1965 | | Treasurer and Principal Financial Officer | | Treasurer since July 2003 and Principal Financial Officer since September 2002 | | Managing Director of the Adviser and various entities affiliated with the Adviser; Treasurer (since July 2003) and Principal Financial Officer of various Morgan Stanley Funds (since September 2002). | |
Mary E. Mullin
522 Fifth Avenue
New York, NY 10036
Birth Year 1967 | | Secretary | | Since June 1999 | | Managing Director of the Adviser; Secretary of various Morgan Stanley Funds (since June 1999). | |
Michael J. Key
522 Fifth Avenue
New York, NY 10036
Birth Year 1979 | | Vice President | | Since June 2017 | | Vice President of the Equity and Fixed Income Funds, Liquidity Funds, various money market funds and the Morgan Stanley AIP Funds in the Fund Complex (since June 2017); Executive Director of the Adviser; Head of Product Development for Equity and Fixed Income Funds (since August 2013). | |
* This is the earliest date the officer began serving the Morgan Stanley Funds. Each officer serves a one-year term, until his or her successor is elected and qualifies.
28
Morgan Stanley Institutional Fund, Inc.
Annual Report — December 31, 2019
Adviser and Administrator
Morgan Stanley Investment Management Inc.
522 Fifth Avenue
New York, New York 10036
Distributor
Morgan Stanley Distribution, Inc.
522 Fifth Avenue
New York, New York 10036
Dividend Disbursing and Transfer Agent
DST Asset Manager Solutions, Inc.
2000 Crown Colony Drive
Quincy, Massachusetts 02169
Custodian
State Street Bank and Trust Company
One Lincoln Street
Boston, Massachusetts 02111
Legal Counsel
Dechert LLP
1095 Avenue of the Americas
New York, New York 10036
Counsel to the Independent Directors
Perkins Coie LLP
1155 Avenue of the Americas
New York, New York 10036
Independent Registered Public Accounting Firm
Ernst & Young LLP
200 Clarendon Street
Boston, Massachusetts 02116
Reporting to Shareholders
Each Morgan Stanley fund provides a complete schedule of portfolio holdings in its Semi-Annual and the Annual Reports within 60 days of the end of the fund's second and fourth fiscal quarters. The Semi-Annual and Annual Reports are filed electronically with the Securities and Exchange Commission ("SEC") on Form N-CSRS and Form N-CSR, respectively. Morgan Stanley also delivers the Semi-Annual and Annual Reports to fund shareholders and makes these reports available on its public website, www.morganstanley.com/im/shareholderreports. Each Morgan Stanley non-money market fund also files a complete schedule of portfolio holdings with the SEC for the fund's first and third fiscal quarters as an attachment to Form N-PORT. Morgan Stanley does not deliver the reports for the first and third fiscal quarters to shareholders, nor are the reports posted to the Morgan Stanley public website. However, the holdings for each money market fund are posted to the Morgan Stanley public website. You may obtain the Form N-PORT filings (as well as the Form N-CSR and N-CSRS filings) by accessing the SEC's website, www.sec.gov. You can also request copies of these materials, upon payment of a duplicating fee, by electronic request at the SEC's email address (publicinfo@sec.gov).
Proxy Voting Policies and Procedures and Proxy Voting Record
You may obtain a copy of the Company's Proxy Voting Policy and Procedures and information regarding how the Company voted proxies relating to portfolio securities during the most recent twelve-month period ended June 30, without charge, upon request, by calling toll free 1 (800) 548-7786 or by visiting our website at www.morganstanley.com/im/shareholderreports. This information is also available on the SEC's website at www.sec.gov.
This report is authorized for distribution only when preceded or accompanied by a prospectus or summary prospectus of the applicable fund of Morgan Stanley Institutional Fund, Inc., which describes in detail the fund's investment policies, risks, fees and expenses. Please read the prospectus carefully before you invest or send money. For additional information, including information regarding the investments comprising the Fund, please visit our website at www.morganstanley.com/im/shareholderreports or call toll free 1 (800) 548-7786.
29
Printed in U.S.A.
This Report has been prepared for shareholders and may be distributed to others only if preceded or accompanied by a current prospectus.
Morgan Stanley Investment Management Inc.
522 Fifth Avenue
New York, New York 10036
© 2020 Morgan Stanley. Morgan Stanley Distribution, Inc.

IFIGENDANN
2922370 EXP. 02.28.21

Morgan Stanley Institutional Fund, Inc.
Global Permanence Portfolio
Annual Report
December 31, 2019
Beginning on January 1, 2021, as permitted by regulations adopted by the Securities and Exchange Commission ("SEC"), paper copies of the Fund's Annual and Semi-Annual Reports to Shareholders ("Shareholder Reports") will no longer be sent by mail, unless you specifically request paper copies of the Shareholder Reports from the Fund or from your financial intermediary, such as a broker-dealer or a bank. Instead, the Shareholder Reports will be made available on the Fund's website, https://www.morganstanley.com/im/shareholderreports and you will be notified by mail each time a Shareholder Report is posted and provided with a website link to access the Shareholder Report. If you already elected to receive Shareholder Reports electronically, you will not be affected by this change and you need not take any action. You may elect to receive Shareholder Reports and other communications from the Fund electronically anytime by contacting your financial intermediary or, if you are a direct investor, please follow the instructions on the envelope.
Beginning on January 1, 2019, you may elect to receive all future Shareholder Reports in paper free of charge. If you invest through a financial intermediary, you can contact your financial intermediary to request that you continue to receive paper copies of your Shareholder Reports. If you invest directly with the Fund, please follow the instructions on the envelope to let the Fund know you wish to continue receiving paper copies of your Shareholder Reports. Your election to receive Shareholder Reports in paper will apply to all funds held in your account if you invest through your financial intermediary or all funds held with the fund complex if you invest directly with a fund.

Morgan Stanley Institutional Fund, Inc.
Annual Report — December 31, 2019
Shareholders' Letter | | | 2 | | |
Expense Example | | | 3 | | |
Investment Overview | | | 4 | | |
Portfolio of Investments | | | 6 | | |
Statement of Assets and Liabilities | | | 8 | | |
Statement of Operations | | | 9 | | |
Statement of Changes in Net Assets | | | 10 | | |
Financial Highlights | | | 11 | | |
Notes to Financial Statements | | | 15 | | |
Report of Independent Registered Public Accounting Firm | | | 23 | | |
Privacy Notice | | | 24 | | |
Director and Officer Information | | | 26 | | |
This report is authorized for distribution only when preceded or accompanied by a prospectus or summary prospectus of the applicable Fund of Morgan Stanley Institutional Fund, Inc. To receive a prospectus and/or statement of additional information ("SAI"), which contains more complete information such as investment objectives, charges, expenses, policies for voting proxies, risk considerations and describes in detail each of the Fund's investment policies to the prospective investor, please call toll free 1 (800) 548-7786. Please read the prospectuses carefully before you invest or send money.
Additionally, you can access information about the Fund, including performance, characteristics and investment team commentary, through Morgan Stanley Investment Management's website: www.morganstanley.com/im/shareholderreports.
Market forecasts provided in this report may not necessarily come to pass. There is no guarantee that any sectors mentioned will continue to perform as discussed herein or that securities in such sectors will be held by the Fund in the future. There is no assurance that a fund will achieve its investment objective. Funds are subject to market risk, which is the possibility that market values of securities owned by the Fund will decline and, therefore, the value of the Fund's shares may be less than what you paid for them. Accordingly, you can lose money investing in this Fund. Please see the prospectus for more complete information on investment risks.
1
Morgan Stanley Institutional Fund, Inc.
Annual Report — December 31, 2019
Shareholders' Letter (unaudited)
Dear Shareholders,
We are pleased to provide this Annual Report, in which you will learn how your investment in Global Permanence Portfolio (the "Fund") performed during the period beginning April 30, 2019 (when the Fund commenced operations) and ended December 31, 2019.
Morgan Stanley Investment Management is a client-centric, investor-led organization. Our global presence, intellectual capital, and breadth of products and services enable us to partner with investors to meet the evolving challenges of today's financial markets. We aim to deliver superior investment service and to empower our clients to make the informed decisions that help them reach their investment goals.
As always, we thank you for selecting Morgan Stanley Investment Management, and look forward to working with you in the months and years ahead.
Sincerely,

John H. Gernon
President and Principal Executive Officer
January 2020
2
Morgan Stanley Institutional Fund, Inc.
Annual Report — December 31, 2019
Expense Example (unaudited)
Global Permanence Portfolio
As a shareholder of the Fund, you incur two types of costs: (1) transactional costs; and (2) ongoing costs, which may include advisory fees, administration fees, distribution and shareholder services fees and other Fund expenses. This example is intended to help you understand your ongoing costs (in dollars) of investing in the Fund and to compare these costs with the ongoing costs of investing in other mutual funds.
This example is based on an investment of $1,000 invested at the beginning of the six-month period ended December 31, 2019 and held for the entire six-month period.
Actual Expenses
The table below provides information about actual account values and actual expenses. You may use the information in this table, together with the amount you invested, to estimate the expenses that you paid over the period. Simply divide your account value by $1,000 (for example, an $8,600 account value divided by $1,000 = 8.6), then multiply the result by the number in the table under the heading entitled "Actual Expenses Paid During Period" to estimate the expenses you paid on your account during this period.
Hypothetical Example for Comparison Purposes
The table below provides information about hypothetical account values and hypothetical expenses based on the Fund's actual expense ratio and an assumed rate of return of 5% per year before expenses, which is not the Fund's actual return. The hypothetical account values and expenses may not be used to estimate the actual ending account balance or expenses you paid for the period. You may use this information to compare the ongoing costs of investing in the Fund and other funds. To do so, compare this 5% hypothetical example with the 5% hypothetical examples that appear in the shareholder reports of the other funds.
Please note that the expenses shown in the table are meant to highlight your ongoing costs only and do not reflect any transactional costs, such as sales charges (loads). Therefore, the information for each class in the table is useful in comparing ongoing costs only, and will not help you determine the relative total costs of owning different funds. In addition, if these transactional costs were included, your costs would have been higher.
| | | Beginning
Account
Value
7/1/19 | | Actual Ending
Account
Value
12/31/19 | | Hypothetical
Ending Account
Value | | Actual
Expenses
Paid
During
Period* | | Hypothetical
Expenses Paid
During Period* | | Net
Expense
Ratio
During
Period** | |
Global Permanence Portfolio Class I | | $ | 1,000.00 | | | $ | 1,027.10 | | | $ | 1,020.21 | | | $ | 5.06 | | | $ | 5.04 | | | | 0.99 | % | |
Global Permanence Portfolio Class A | | | 1,000.00 | | | | 1,026.10 | | | | 1,018.45 | | | | 6.84 | | | | 6.82 | | | | 1.34 | | |
Global Permanence Portfolio Class C | | | 1,000.00 | | | | 1,022.30 | | | | 1,014.67 | | | | 10.65 | | | | 10.61 | | | | 2.09 | | |
Global Permanence Portfolio Class IS | | | 1,000.00 | | | | 1,028.00 | | | | 1,020.47 | | | | 4.80 | | | | 4.79 | | | | 0.94 | | |
* Expenses are calculated using each Fund Class' annualized net expense ratio (as disclosed), multiplied by the average account value over the period and multiplied by 184/365 (to reflect the most recent one-half year period).
** Annualized.
3
Morgan Stanley Institutional Fund, Inc.
Annual Report — December 31, 2019
Investment Overview (unaudited)
Global Permanence Portfolio
The Fund seeks long-term capital appreciation.
Performance
For the since inception period from April 30, 2019 through December 31, 2019, the Fund's Class I shares had a total return based on net asset value and reinvestment of distributions per share of 6.30%, net of fees. The Fund's Class I shares underperformed the Fund's benchmark, the MSCI All Country World Net Index (the "Index"), which returned 9.17%.
Factors Affecting Performance
• As of the end of the reporting period, the Fund had less than one year of performance history. Such a short time frame would not provide a meaningful performance analysis as short-term returns may not be indicative of the Fund's long-term performance potential.
Management Strategies
• We invest primarily in equity securities of established companies located throughout the world with capitalizations within the range of companies included in the Index. We seek to invest in companies with strong name recognition, sustainable competitive advantages, rising returns on invested capital, strong free cash flow generation and attractive risk/reward. We focus on long-term growth rather than short-term events, with our stock selection informed by rigorous fundamental analysis.

* Minimum Investment for Class I shares
** Commenced Operations on April 30, 2019.
In accordance with SEC regulations, the Fund's performance shown assumes that all recurring fees (including management fees) were deducted and all dividends and distributions were reinvested. The performance of Class A, C and IS shares will vary from the performance of Class I shares and will be negatively impacted by additional fees assessed to those classes (if applicable).
4
Morgan Stanley Institutional Fund, Inc.
Annual Report — December 31, 2019
Investment Overview (unaudited) (cont'd)
Global Permanence Portfolio
Performance Compared to the MSCI All Country World Net Index(1) and the Lipper Global Multi-Cap Core Funds Index(2)
| | | Period Ended December 31, 2019
Total Returns(3) | |
| | | One
Year | | Five
Years | | Ten
Years | | Since
Inception(5) | |
Fund — Class I Shares w/o
sales charges(4) | | | — | | | | — | | | | — | | | | 6.30 | % | |
Fund — Class A Shares w/o
sales charges(4) | | | — | | | | — | | | | — | | | | 6.10 | | |
Fund — Class A Shares with
maximum 5.25% sales charges(4) | | | — | | | | — | | | | — | | | | 0.57 | | |
Fund — Class C Shares w/o
sales charges(4) | | | — | | | | — | | | | — | | | | 5.60 | | |
Fund — Class C Shares with
maximum 1.00% deferred
sales charges(4) | | | — | | | | — | | | | — | | | | 4.60 | | |
Fund — Class IS Shares w/o
sales charges(4) | | | — | | | | — | | | | — | | | | 6.40 | | |
MSCI All Country World
Net Index | | | — | | | | — | | | | — | | | | 9.17 | | |
Lipper Global Multi-Cap Core
Funds Index | | | — | | | | — | | | | — | | | | 8.03 | | |
Performance data quoted represents past performance, which is no guarantee of future results, and current performance may be lower or higher than the figures shown. Performance assumes that all dividends and distributions, if any, were reinvested. For the most recent month-end performance figures, please visit www.morganstanley.com/im/shareholderreports. Investment return and principal value will fluctuate so that Fund shares, when redeemed, may be worth more or less than their original cost. Returns for periods less than one year are not annualized. Total returns do not reflect the deduction of taxes that a shareholder would pay on Fund distributions or the redemption of Fund shares. Performance of share classes will vary due to difference in sales charges and expenses.
(1) The MSCI All Country World Net Index is a free float-adjusted market capitalization weighted index designed to measure the equity market performance of developed and emerging markets. The term "free float" represents the portion of shares outstanding that are deemed to be available for purchase in the public equity markets by investors. The performance of the Index is listed in U.S. dollars and assumes reinvestment of net dividends. Net total return indices reinvest dividends after the deduction of withholding taxes, using (for international indices) a tax rate applicable to non-resident institutional investors who do not benefit from double taxation treaties. The Index is unmanaged and its returns do not include any sales charges or fees. Such costs would lower performance. It is not possible to invest directly in an index.
(2) The Lipper Global Multi-Cap Core Funds Index is an equally weighted performance index of the largest qualifying funds (based on net assets) in the Lipper Global Multi-Cap Core Funds classification. The Index, which is adjusted for capital gains distributions and income dividends, is unmanaged and should not be considered an investment. There are currently 30 funds represented in this Index. As of the date of this report, the Fund was in the Lipper Global Multi-Cap Core Funds classification.
(3) Total returns for the Fund reflect fees waived and expenses reimbursed, if applicable, by the Adviser (as defined herein). Without such waivers and reimbursements, total returns would have been lower.
(4) Commenced operations on April 30, 2019.
(5) For comparative purposes, average annual since inception returns listed for the Indexes refer to the inception date of the Fund, not the inception of the Index.
5
Morgan Stanley Institutional Fund, Inc.
Annual Report — December 31, 2019
Portfolio of Investments
Global Permanence Portfolio
| | | Shares | | Value
(000) | |
Common Stocks (99.5%) | |
Canada (5.2%) | |
Canadian National Railway Co. | | | 703 | | | $ | 64 | | |
FirstService Corp. | | | 700 | | | | 65 | | |
| | | | 129 | | |
Denmark (3.7%) | |
Chr Hansen Holding A/S | | | 1,171 | | | | 93 | | |
France (19.6%) | |
Christian Dior SE | | | 241 | | | | 123 | | |
EssilorLuxottica SA | | | 789 | | | | 120 | | |
Getlink SE | | | 1,527 | | | | 27 | | |
Hermes International | | | 124 | | | | 93 | | |
L'Oreal SA | | | 135 | | | | 40 | | |
Pernod Ricard SA | | | 203 | | | | 36 | | |
Remy Cointreau SA | | | 203 | | | | 25 | | |
Safran SA | | | 169 | | | | 26 | | |
| | | | 490 | | |
India (1.8%) | |
HDFC Bank Ltd. ADR | | | 712 | | | | 45 | | |
Mexico (1.1%) | |
Grupo Aeroportuario del Sureste SAB de CV, Class B | | | 1,500 | | | | 28 | | |
Spain (1.0%) | |
Aena SME SA | | | 133 | | | | 26 | | |
United Kingdom (6.2%) | |
Compass Group PLC | | | 978 | | | | 25 | | |
Diageo PLC | | | 612 | | | | 26 | | |
Rentokil Initial PLC | | | 17,400 | | | | 104 | | |
| | | | 155 | | |
United States (60.9%) | |
Amazon.com, Inc. (a) | | | 49 | | | | 91 | | |
Broadridge Financial Solutions, Inc. | | | 517 | | | | 64 | | |
Brown-Forman Corp., Class B | | | 433 | | | | 29 | | |
Cintas Corp. | | | 92 | | | | 25 | | |
CME Group, Inc. | | | 303 | | | | 61 | | |
Copart, Inc. (a) | | | 761 | | | | 69 | | |
Ecolab, Inc. | | | 673 | | | | 130 | | |
Gartner, Inc. (a) | | | 558 | | | | 86 | | |
HEICO Corp., Class A | | | 656 | | | | 59 | | |
Intercontinental Exchange, Inc. | | | 664 | | | | 61 | | |
Intuitive Surgical, Inc. (a) | | | 165 | | | | 98 | | |
Madison Square Garden Co. (The), Class A (a) | | | 130 | | | | 38 | | |
Martin Marietta Materials, Inc. | | | 90 | | | | 25 | | |
McCormick & Co., Inc. | | | 159 | | | | 27 | | |
Rollins, Inc. | | | 1,857 | | | | 62 | | |
S&P Global, Inc. | | | 243 | | | | 66 | | |
Service Corp. International | | | 582 | | | | 27 | | |
Sherwin-Williams Co. (The) | | | 44 | | | | 26 | | |
Starbucks Corp. | | | 442 | | | | 39 | | |
Vail Resorts, Inc. | | | 106 | | | | 25 | | |
Veeva Systems, Inc., Class A (a) | | | 457 | | | | 64 | | |
Verisk Analytics, Inc. | | | 421 | | | | 63 | | |
Walt Disney Co. (The) | | | 906 | | | | 131 | | |
| | | Shares | | Value
(000) | |
Waste Connections, Inc. | | | 698 | | | $ | 63 | | |
Watsco, Inc. | | | 144 | | | | 26 | | |
Zoetis, Inc. | | | 532 | | | | 70 | | |
| | | | 1,525 | | |
Total Common Stocks (Cost $2,361) | | | 2,491 | | |
Short-Term Investment (2.0%) | |
Investment Company (2.0%) | |
Morgan Stanley Institutional Liquidity
Funds — Treasury Securities Portfolio —
Institutional Class (See Note G)
(Cost $51) | | | 51,309 | | | | 51 | | |
Total Investments Excluding Purchased
Options (101.5%) (Cost $2,412) | | | 2,542 | | |
Total Purchased Options Outstanding (0.0%)
(Cost $5) | | | 1 | | |
Total Investments (101.5%) (Cost $2,417) (b)(c) | | | 2,543 | | |
Liabilities in Excess of Other Assets (–1.5%) | | | (39 | ) | |
Net Assets (100.0%) | | $ | 2,504 | | |
Country assignments and aggregations are based generally on third party vendor classifications and information, and may be different from the assignments and aggregations under the policies set forth in the Fund's prospectus and/or statement of additional information relating to geographic classifications.
(a) Non-income producing security.
(b) The approximate fair value and percentage of net assets, $93,000 and 3.7%, respectively, represent the securities that have been fair valued under the fair valuation policy for international investments as described in Note A-1 within the Notes to the Financial Statements.
(c) At December 31, 2019, the aggregate cost for federal income tax purposes is approximately $2,417,000. The aggregate gross unrealized appreciation is approximately $160,000 and the aggregate gross unrealized depreciation is approximately $35,000, resulting in net unrealized appreciation of approximately $125,000.
ADR American Depositary Receipt.
The accompanying notes are an integral part of the financial statements.
6
Morgan Stanley Institutional Fund, Inc.
Annual Report — December 31, 2019
Portfolio of Investments (cont'd)
Global Permanence Portfolio
Call Options Purchased:
The Fund had the following call options purchased open at December 31, 2019:
Counterparty | | Description | | Strike
Price | | Expiration
Date | | Number of
Contracts | | Notional
Amount
(000) | | Value
(000) | | Premiums
Paid
(000) | | Unrealized
Depreciation
(000) | |
Royal Bank of Scotland | | USD/CNH | | CNH | 7.85 | | | Jun-20 | | | 396,201 | | | | 396 | | | $ | — | @ | | $ | 2 | | | $ | (2 | ) | |
Royal Bank of Scotland | | USD/CNH | | CNH | 8.09 | | | Sep-20 | | | 457,174 | | | | 457 | | | | 1 | | | | 3 | | | | (2 | ) | |
| | | | | | | | | | | | | $ | 1 | | | $ | 5 | | | $ | (4 | ) | |
@ — Value is less than $500.
CNH — Chinese Yuan Renminbi Offshore
USD — United States Dollar
Portfolio Composition
Classification | | Percentage of
Total Investments | |
Other* | | | 44.4 | % | |
Textiles, Apparel & Luxury Goods | | | 13.2 | | |
Commercial Services & Supplies | | | 12.7 | | |
Chemicals | | | 9.8 | | |
Capital Markets | | | 7.4 | | |
Entertainment | | | 6.6 | | |
Information Technology Services | | | 5.9 | | |
Total Investments | | | 100.0 | % | |
* Industries and/or investment types representing less than 5% of total investments.
The accompanying notes are an integral part of the financial statements.
7
Morgan Stanley Institutional Fund, Inc.
Annual Report — December 31, 2019
Global Permanence Portfolio
Statement of Assets and Liabilities | | December 31, 2019
(000) | |
Assets: | |
Investments in Securities of Unaffiliated Issuers, at Value (Cost $2,366) | | $ | 2,492 | | |
Investment in Security of Affiliated Issuer, at Value (Cost $51) | | | 51 | | |
Total Investments in Securities, at Value (Cost $2,417) | | | 2,543 | | |
Foreign Currency, at Value (Cost $9) | | | 9 | | |
Due from Adviser | | | 69 | | |
Prepaid Offering Costs | | | 42 | | |
Receivable for Investments Sold | | | 39 | | |
Dividends Receivable | | | 3 | | |
Tax Reclaim Receivable | | | — | @ | |
Receivable from Affiliate | | | — | @ | |
Other Assets | | | 2 | | |
Total Assets | | | 2,707 | | |
Liabilities: | |
Payable for Offering Costs | | | 115 | | |
Payable for Professional Fees | | | 40 | | |
Payable for Investments Purchased | | | 39 | | |
Payable for Transfer Agency Fees — Class I | | | — | @ | |
Payable for Transfer Agency Fees — Class A | | | — | @ | |
Payable for Transfer Agency Fees — Class C | | | — | @ | |
Payable for Transfer Agency Fees — Class IS | | | — | @ | |
Payable for Custodian Fees | | | 1 | | |
Payable for Shareholder Services Fees — Class A | | | — | @ | |
Payable for Distribution and Shareholder Services Fees — Class C | | | — | @ | |
Payable for Administration Fees | | | — | @ | |
Other Liabilities | | | 8 | | |
Total Liabilities | | | 203 | | |
Net Assets | | $ | 2,504 | | |
Net Assets Consist of: | |
Paid-in-Capital | | $ | 2,367 | | |
Total Distributable Earnings | | | 137 | | |
Net Assets | | $ | 2,504 | | |
CLASS I: | |
Net Assets | | $ | 2,471 | | |
| Shares Outstanding $0.001 par value shares of beneficial interest (unlimited shares authorized) (not in 000's) | | | 232,441 | | |
Net Asset Value, Offering and Redemption Price Per Share | | $ | 10.63 | | |
CLASS A: | |
Net Assets | | $ | 11 | | |
| Shares Outstanding $0.001 par value shares of beneficial interest (unlimited shares authorized) (not in 000's) | | | 1,003 | | |
Net Asset Value, Redemption Price Per Share | | $ | 10.61 | | |
Maximum Sales Load | | | 5.25 | % | |
Maximum Sales Charge | | $ | 0.59 | | |
Maximum Offering Price Per Share | | $ | 11.20 | | |
CLASS C: | |
Net Assets | | $ | 11 | | |
| Shares Outstanding $0.001 par value shares of beneficial interest (unlimited shares authorized) (not in 000's) | | | 1,000 | | |
Net Asset Value, Offering and Redemption Price Per Share | | $ | 10.56 | | |
CLASS IS: | |
Net Assets | | $ | 11 | | |
| Shares Outstanding $0.001 par value shares of beneficial interest (unlimited shares authorized) (not in 000's) | | | 1,000 | | |
Net Asset Value, Offering and Redemption Price Per Share | | $ | 10.64 | | |
@ Amount is less than $500.
The accompanying notes are an integral part of the financial statements.
8
Morgan Stanley Institutional Fund, Inc.
Annual Report — December 31, 2019
Global Permanence Portfolio
Statement of Operations | | Period from
April 30, 2019^ to
December 31, 2019
(000) | |
Investment Income: | |
Dividends from Securities of Unaffiliated Issuers (Net of $3 of Foreign Taxes Withheld) | | $ | 23 | | |
Dividends from Security of Affiliated Issuer (Note G) | | | 1 | | |
Total Investment Income | | | 24 | | |
Expenses: | |
Offering Costs | | | 86 | | |
Professional Fees | | | 81 | | |
Advisory Fees (Note B) | | | 13 | | |
Shareholder Reporting Fees | | | 13 | | |
Transfer Agency Fees — Class I (Note E) | | | 2 | | |
Transfer Agency Fees — Class A (Note E) | | | 1 | | |
Transfer Agency Fees — Class C (Note E) | | | 1 | | |
Transfer Agency Fees — Class IS (Note E) | | | 1 | | |
Custodian Fees (Note F) | | | 3 | | |
Administration Fees (Note C) | | | 1 | | |
Pricing Fees | | | 1 | | |
Registration Fees | | | 1 | | |
Shareholder Services Fees — Class A (Note D) | | | — | @ | |
Distribution and Shareholder Services Fees — Class C (Note D) | | | — | @ | |
Sub Transfer Agency Fees — Class A | | | — | @ | |
Directors' Fees and Expenses | | | — | @ | |
Other Expenses | | | 1 | | |
Total Expenses | | | 205 | | |
Expenses Reimbursed by Adviser (Note B) | | | (172 | ) | |
Waiver of Advisory Fees (Note B) | | | (13 | ) | |
Reimbursement of Class Specific Expenses — Class I (Note B) | | | (1 | ) | |
Reimbursement of Class Specific Expenses — Class A (Note B) | | | (1 | ) | |
Reimbursement of Class Specific Expenses — Class C (Note B) | | | (1 | ) | |
Reimbursement of Class Specific Expenses — Class IS (Note B) | | | (1 | ) | |
Rebate from Morgan Stanley Affiliate (Note G) | | | (— | @) | |
Net Expenses | | | 16 | | |
Net Investment Income | | | 8 | | |
Realized Gain (Loss): | |
Investments Sold | | | 4 | | |
Foreign Currency Translation | | | (1 | ) | |
Net Realized Gain | | | 3 | | |
Change in Unrealized Appreciation (Depreciation): | |
Investments | | | 126 | | |
Foreign Currency Translation | | | — | @ | |
Net Change in Unrealized Appreciation (Depreciation) | | | 126 | | |
Net Realized Gain and Change in Unrealized Appreciation (Depreciation) | | | 129 | | |
Net Increase in Net Assets Resulting from Operations | | $ | 137 | | |
^ Commencement of Operations.
@ Amount is less than $500.
The accompanying notes are an integral part of the financial statements.
9
Morgan Stanley Institutional Fund, Inc.
Annual Report — December 31, 2019
Global Permanence Portfolio
Statement of Changes in Net Assets | | Period from
April 30, 2019^ to
December 31, 2019
(000) | |
Increase in Net Assets: | |
Operations: | |
Net Investment Income | | $ | 8 | | |
Net Realized Gain | | | 3 | | |
Net Change in Unrealized Appreciation (Depreciation) | | | 126 | | |
Net Increase in Net Assets Resulting from Operations | | | 137 | | |
Capital Share Transactions:(1) | |
Class I: | |
Subscribed | | | 2,337 | | |
Class A: | |
Subscribed | | | 11 | | |
Redeemed | | | (1 | ) | |
Class C: | |
Subscribed | | | 10 | | |
Class IS: | |
Subscribed | | | 10 | | |
Net Increase in Net Assets Resulting from Capital Share Transactions | | | 2,367 | | |
Total Increase in Net Assets | | | 2,504 | | |
Net Assets: | |
Beginning of Period | | | — | | |
End of Period | | $ | 2,504 | | |
(1) Capital Share Transactions: | |
Class I: | |
Shares Subscribed | | | 232 | | |
Class A: | |
Shares Subscribed | | | 1 | | |
Shares Redeemed | | | (— | @@) | |
Net Increase in Class A Shares Outstanding | | | 1 | | |
Class C: | |
Shares Subscribed | | | 1 | | |
Class IS: | |
Shares Subscribed | | | 1 | | |
^ Commencement of Operations.
@@ Amount is less than 500 shares.
The accompanying notes are an integral part of the financial statements.
10
Morgan Stanley Institutional Fund, Inc.
Annual Report — December 31, 2019
Financial Highlights
Global Permanence Portfolio
| | | Class I | |
Selected Per Share Data and Ratios | | Period from
April 30, 2019(1) to
December 31, 2019 | |
Net Asset Value, Beginning of Period | | $ | 10.00 | | |
Income from Investment Operations: | |
Net Investment Income(2) | | | 0.04 | | |
Net Realized and Unrealized Gain | | | 0.59 | | |
Total from Investment Operations | | | 0.63 | | |
Net Asset Value, End of Period | | $ | 10.63 | | |
Total Return(3) | | | 6.30 | %(5) | |
Ratios to Average Net Assets and Supplemental Data: | |
Net Assets, End of Period (Thousands) | | $ | 2,471 | | |
Ratio of Expenses Before Expense Limitation | | | 12.79 | %(6) | |
Ratio of Expenses After Expense Limitation | | | 0.99 | %(4)(6) | |
Ratio of Net Investment Income | | | 0.53 | %(4)(6) | |
Ratio of Rebate from Morgan Stanley Affiliates | | | 0.01 | %(6) | |
Portfolio Turnover Rate | | | 35 | %(5) | |
(1) Commencement of Operations.
(2) Per share amount is based on average shares outstanding.
(3) Calculated based on the net asset value as of the last business day of the period.
(4) The Ratio of Expenses After Expense Limitation and Ratio of Net Investment Income reflect the rebate of certain Fund expenses in connection with the investments in Morgan Stanley affiliates during the period. The effect of the rebate on the ratios is disclosed in the above table as "Ratio of Rebate from Morgan Stanley Affiliates."
(5) Not annualized.
(6) Annualized.
The accompanying notes are an integral part of the financial statements.
11
Morgan Stanley Institutional Fund, Inc.
Annual Report — December 31, 2019
Financial Highlights
Global Permanence Portfolio
| | | Class A | |
Selected Per Share Data and Ratios | | Period from
April 30, 2019(1) to
December 31, 2019 | |
Net Asset Value, Beginning of Period | | $ | 10.00 | | |
Income from Investment Operations: | |
Net Investment Income(2) | | | 0.01 | | |
Net Realized and Unrealized Gain | | | 0.60 | | |
Total from Investment Operations | | | 0.61 | | |
Net Asset Value, End of Period | | $ | 10.61 | | |
Total Return(3) | | | 6.10 | %(5) | |
Ratios to Average Net Assets and Supplemental Data: | |
Net Assets, End of Period (Thousands) | | $ | 11 | | |
Ratio of Expenses Before Expense Limitation | | | 30.61 | %(6) | |
Ratio of Expenses After Expense Limitation | | | 1.34 | %(4)(6) | |
Ratio of Net Investment Income | | | 0.17 | %(4)(6) | |
Ratio of Rebate from Morgan Stanley Affiliates | | | 0.01 | %(6) | |
Portfolio Turnover Rate | | | 35 | %(5) | |
(1) Commencement of Operations.
(2) Per share amount is based on average shares outstanding.
(3) Calculated based on the net asset value which does not reflect sales charges, if applicable, as of the last business day of the period.
(4) The Ratio of Expenses After Expense Limitation and Ratio of Net Investment Income reflect the rebate of certain Fund expenses in connection with the investments in Morgan Stanley affiliates during the period. The effect of the rebate on the ratios is disclosed in the above table as "Ratio of Rebate from Morgan Stanley Affiliates."
(5) Not annualized.
(6) Annualized.
The accompanying notes are an integral part of the financial statements.
12
Morgan Stanley Institutional Fund, Inc.
Annual Report — December 31, 2019
Financial Highlights
Global Permanence Portfolio
| | | Class C | |
Selected Per Share Data and Ratios | | Period from
April 30, 2019(1) to
December 31, 2019 | |
Net Asset Value, Beginning of Period | | $ | 10.00 | | |
Income (Loss) from Investment Operations: | |
Net Investment Loss(2) | | | (0.04 | ) | |
Net Realized and Unrealized Gain | | | 0.60 | | |
Total from Investment Operations | | | 0.56 | | |
Net Asset Value, End of Period | | $ | 10.56 | | |
Total Return(3) | | | 5.60 | %(5) | |
Ratios to Average Net Assets and Supplemental Data: | |
Net Assets, End of Period (Thousands) | | $ | 11 | | |
Ratio of Expenses Before Expense Limitation | | | 31.59 | %(6) | |
Ratio of Expenses After Expense Limitation | | | 2.09 | %(4)(6) | |
Ratio of Net Investment Loss | | | (0.57 | )%(4)(6) | |
Ratio of Rebate from Morgan Stanley Affiliates | | | 0.01 | %(6) | |
Portfolio Turnover Rate | | | 35 | %(5) | |
(1) Commencement of Operations.
(2) Per share amount is based on average shares outstanding.
(3) Calculated based on the net asset value which does not reflect sales charges, if applicable, as of the last business day of the period.
(4) The Ratio of Expenses After Expense Limitation and Ratio of Net Investment Loss reflect the rebate of certain Fund expenses in connection with the investments in Morgan Stanley affiliates during the period. The effect of the rebate on the ratios is disclosed in the above table as "Ratio of Rebate from Morgan Stanley Affiliates."
(5) Not annualized.
(6) Annualized.
The accompanying notes are an integral part of the financial statements.
13
Morgan Stanley Institutional Fund, Inc.
Annual Report — December 31, 2019
Financial Highlights
Global Permanence Portfolio
| | | Class IS | |
Selected Per Share Data and Ratios | | Period from
April 30, 2019(1) to
December 31, 2019 | |
Net Asset Value, Beginning of Period | | $ | 10.00 | | |
Income from Investment Operations: | |
Net Investment Income(2) | | | 0.04 | | |
Net Realized and Unrealized Gain | | | 0.60 | | |
Total from Investment Operations | | | 0.64 | | |
Net Asset Value, End of Period | | $ | 10.64 | | |
Total Return(3) | | | 6.40 | %(5) | |
Ratios to Average Net Assets and Supplemental Data: | |
Net Assets, End of Period (Thousands) | | $ | 11 | | |
Ratio of Expenses Before Expense Limitation | | | 30.53 | %(6) | |
Ratio of Expenses After Expense Limitation | | | 0.94 | %(4)(6) | |
Ratio of Net Investment Income | | | 0.59 | %(4)(6) | |
Ratio of Rebate from Morgan Stanley Affiliates | | | 0.01 | %(6) | |
Portfolio Turnover Rate | | | 35 | %(5) | |
(1) Commencement of Operations.
(2) Per share amount is based on average shares outstanding.
(3) Calculated based on the net asset value as of the last business day of the period.
(4) The Ratio of Expenses After Expense Limitation and Ratio of Net Investment Income reflect the rebate of certain Fund expenses in connection with the investments in Morgan Stanley affiliates during the period. The effect of the rebate on the ratios is disclosed in the above table as "Ratio of Rebate from Morgan Stanley Affiliates."
(5) Not annualized.
(6) Annualized.
The accompanying notes are an integral part of the financial statements.
14
Morgan Stanley Institutional Fund, Inc.
Annual Report — December 31, 2019
Notes to Financial Statements
Morgan Stanley Institutional Fund, Inc. (the "Company") is registered under the Investment Company Act of 1940, as amended (the "Act"), as an open-end management investment company. The Company is comprised of thirty-two separate, active, diversified and non-diversified funds (individually referred to as a "Fund," collectively as the "Funds"). The Company applies investment company accounting and reporting guidance.
The accompanying financial statements relate to the Global Permanence Portfolio. The Fund seeks long-term capital appreciation.
The Fund commenced operations on April 30, 2019 and offers four classes of shares — Class I, Class A, Class C and Class IS.
A. Significant Accounting Policies: The following significant accounting policies are in conformity with U.S. generally accepted accounting principles ("GAAP"). Such policies are consistently followed by the Company in the preparation of its financial statements. GAAP may require management to make estimates and assumptions that affect the reported amounts and disclosures in the financial statements. Actual results may differ from those estimates.
In August 2018, the Financial Accounting Standards Board ("FASB") issued Accounting Standards Update ("ASU") 2018-13, Fair Value Measurement (Topic 820) — Disclosures Framework — Changes to Disclosure Requirements of Fair Value Measurement ("ASU 2018-13") which introduces new fair value disclosure requirements as well as eliminates and modifies certain existing fair value disclosure requirements. ASU 2018-13 would be effective for fiscal years beginning after December 15, 2019 and for interim periods within those fiscal years; however, management has elected to early adopt ASU 2018-13 as permitted by the standard. The impact of the Fund's adoption was limited to changes in the Fund's financial statement disclosures regarding fair value, primarily those disclosures related to transfers between levels of the fair value hierarchy and disclosure of the range and weighted average used to develop significant unobservable inputs for Level 3 fair value measurements, when applicable.
1. Security Valuation: (1) An equity portfolio security listed or traded on an exchange is valued at its latest reported sales price (or at the exchange official closing price if such exchange reports an official closing price), and if there were no sales on a given day and if there is no official exchange closing price for that day, the security is valued
at the mean between the last reported bid and asked prices if such bid and asked prices are available on the relevant exchanges. If only bid prices are available then the latest bid price may be used. Listed equity securities not traded on the valuation date with no reported bid and asked prices available on the exchange are valued at the mean between the current bid and asked prices obtained from one or more reputable brokers or dealers. In cases where a security is traded on more than one exchange, the security is valued on the exchange designated as the primary market; (2) all other equity portfolio securities for which over-the-counter ("OTC") market quotations are readily available are valued at the latest reported sales price (or at the market official closing price if such market reports an official closing price), and if there was no trading in the security on a given day and if there is no official closing price from relevant markets for that day, the security is valued at the mean between the last reported bid and asked prices if such bid and asked prices are available on the relevant markets. An unlisted equity security that does not trade on the valuation date and for which bid and asked prices from the relevant markets are unavailable is valued at the mean between the current bid and asked prices obtained from one or more reputable brokers or dealers; (3) listed options are valued at the last reported sales price on the exchange on which they are listed (or at the exchange official closing price if such exchange reports an official closing price). If an official closing price or last reported sales price is unavailable, the listed option should be fair valued at the mean between its latest bid and ask prices. Unlisted options are valued at the mean between their latest bid and ask prices from a broker/dealer or valued by a pricing service/vendor; (4) certain portfolio securities may be valued by an outside pricing service/vendor approved by the Company's Board of Directors (the "Directors"). The pricing service/vendor may employ a pricing model that takes into account, among other things, bids, yield spreads and/or other market data and specific security characteristics. Alternatively, if a valuation is not available from an outside pricing service/vendor, and the security trades on an exchange, the security may be valued at its latest reported sale price (or at the exchange official closing price if such exchange reports an official closing price), prior to the time when assets are valued. If there are no sales on a given day and if there is no official exchange closing price for that day, the security is valued at the mean between the
15
Morgan Stanley Institutional Fund, Inc.
Annual Report — December 31, 2019
Notes to Financial Statements (cont'd)
last reported bid and asked prices if such bid and asked prices are available in the relevant exchanges. If Morgan Stanley Investment Management Inc. (the "Adviser"), a wholly-owned subsidiary of Morgan Stanley, determines that the price provided by the outside pricing service/vendor or exchange does not reflect the security's fair value or is unable to provide a price, prices from brokers or dealers may also be utilized. In these circumstances, the value of the security will be the mean of bid and asked prices obtained from brokers or dealers; (5) when market quotations are not readily available, including circumstances under which the Adviser determines that the closing price, last sale price or the mean between the last reported bid and asked prices are not reflective of a security's market value, portfolio securities are valued at their fair value as determined in good faith under procedures established by and under the general supervision of the Directors. Occasionally, developments affecting the closing prices of securities and other assets may occur between the times at which valuations of such securities are determined (that is, close of the foreign market on which the securities trade) and the close of business of the New York Stock Exchange ("NYSE"). If developments occur during such periods that are expected to materially affect the value of such securities, such valuations may be adjusted to reflect the estimated fair value of such securities as of the close of the NYSE, as determined in good faith by the Directors or by the Adviser using a pricing service and/or procedures approved by the Directors; (6) quotations of foreign portfolio securities, other assets and liabilities and forward contracts stated in foreign currency are translated into U.S. dollar equivalents at the prevailing market rates prior to the close of the NYSE; and (7) investments in mutual funds, including the Morgan Stanley Institutional Liquidity Funds, are valued at the net asset value ("NAV") as of the close of each business day.
The Directors have responsibility for determining in good faith the fair value of the investments, and the Directors may appoint others, such as the Company's Adviser or a valuation committee, to assist the Directors in determining fair value and to make the actual calculations pursuant to the fair valuation methodologies previously approved by the Directors. Under procedures approved by the Directors, the Company's Adviser has formed a Valuation Committee whose members are approved by the Directors. The Valuation Committee
provides administration and oversight of the Company's valuation policies and procedures, which are reviewed at least annually by the Directors. These procedures allow the Company to utilize independent pricing services, quotations from securities and financial instrument dealers and other market sources to determine fair value.
2. Fair Value Measurement: FASB Accounting Standards CodificationTM ("ASC") 820, "Fair Value Measurement" ("ASC 820"), defines fair value as the value that the Fund would receive to sell an investment or pay to transfer a liability in a timely transaction with an independent buyer in the principal market, or in the absence of a principal market, the most advantageous market for the investment or liability. ASC 820 establishes a three-tier hierarchy to distinguish between (1) inputs that reflect the assumptions market participants would use in valuing an asset or liability developed based on market data obtained from sources independent of the reporting entity (observable inputs) and (2) inputs that reflect the reporting entity's own assumptions about the assumptions market participants would use in valuing an asset or liability developed based on the best information available in the circumstances (unobservable inputs) and to establish classification of fair value measurements for disclosure purposes. Various inputs are used in determining the value of the Fund's investments. The inputs are summarized in the three broad levels listed below:
• Level 1 – unadjusted quoted prices in active markets for identical investments
• Level 2 – other significant observable inputs (including quoted prices for similar investments, interest rates, prepayment speeds, credit risk, etc.)
• Level 3 – significant unobservable inputs including the Fund's own assumptions in determining the fair value of investments. Factors considered in making this determination may include, but are not limited to, information obtained by contacting the issuer, analysts, or the appropriate stock exchange (for exchange-traded securities), analysis of the issuer's financial statements or other available documents and, if necessary, available information concerning other securities in similar circumstances.
16
Morgan Stanley Institutional Fund, Inc.
Annual Report — December 31, 2019
Notes to Financial Statements (cont'd)
The inputs or methodology used for valuing securities are not necessarily an indication of the risk associated with investing in those securities and the determination of the significance of a particular input to the fair value measurement in its entirety requires judgment and considers factors specific to each security.
The following is a summary of the inputs used to value the Fund's investments as of December 31, 2019:
Investment Type | | Level 1
Unadjusted
quoted
prices
(000) | | Level 2
Other
significant
observable
inputs
(000) | | Level 3
Significant
unobservable
inputs
(000) | | Total
(000) | |
Assets: | |
Common Stocks | |
Aerospace & Defense | | $ | 85 | | | $ | — | | | $ | — | | | $ | 85 | | |
Banks | | | 45 | | | | — | | | | — | | | | 45 | | |
Beverages | | | 116 | | | | — | | | | — | | | | 116 | | |
Capital Markets | | | 188 | | | | — | | | | — | | | | 188 | | |
Chemicals | | | 156 | | | | 93 | | | | — | | | | 249 | | |
Commercial Services &
Supplies | | | 323 | | | | — | | | | — | | | | 323 | | |
Construction Materials | | | 25 | | | | — | | | | — | | | | 25 | | |
Diversified Consumer
Services | | | 27 | | | | — | | | | — | | | | 27 | | |
Entertainment | | | 169 | | | | — | | | | — | | | | 169 | | |
Food Products | | | 27 | | | | — | | | | — | | | | 27 | | |
Health Care Equipment &
Supplies | | | 98 | | | | — | | | | — | | | | 98 | | |
Health Care Technology | | | 64 | | | | — | | | | — | | | | 64 | | |
Hotels, Restaurants &
Leisure | | | 89 | | | | — | | | | — | | | | 89 | | |
Information Technology
Services | | | 150 | | | | — | | | | — | | | | 150 | | |
Internet & Direct Marketing
Retail | | | 91 | | | | — | | | | — | | | | 91 | | |
Personal Products | | | 40 | | | | — | | | | — | | | | 40 | | |
Pharmaceuticals | | | 70 | | | | — | | | | — | | | | 70 | | |
Professional Services | | | 63 | | | | — | | | | — | | | | 63 | | |
Real Estate Management &
Development | | | 65 | | | | — | | | | — | | | | 65 | | |
Road & Rail | | | 64 | | | | — | | | | — | | | | 64 | | |
Textiles, Apparel & Luxury
Goods | | | 336 | | | | — | | | | — | | | | 336 | | |
Trading Companies &
Distributors | | | 26 | | | | — | | | | — | | | | 26 | | |
Transportation Infrastructure | | | 81 | | | | — | | | | — | | | | 81 | | |
Total Common Stocks | | | 2,398 | | | | 93 | | | | — | | | | 2,491 | | |
Call Options Purchased | | | — | | | | 1 | | | | — | | | | 1 | | |
Short-Term Investment | |
Investment Company | | | 51 | | | | — | | | | — | | | | 51 | | |
Total Assets | | $ | 2,449 | | | $ | 94 | | | $ | — | | | $ | 2,543 | | |
Transfers between investment levels may occur as the markets fluctuate and/or the availability of data used in an investment's valuation changes.
3. Foreign Currency Translation and Foreign Investments: The books and records of the Fund are maintained in U.S. dollars. Foreign currency amounts are translated into U.S. dollars as follows:
– investments, other assets and liabilities at the prevailing rate of exchange on the valuation date;
– investment transactions and investment income at the prevailing rates of exchange on the dates of such transactions.
Although the net assets of the Fund are presented at the foreign exchange rates and market values at the close of the period, the Fund does not isolate that portion of the results of operations arising as a result of changes in the foreign exchange rates from the fluctuations arising from changes in the market prices of securities held at period end. Similarly, the Fund does not isolate the effect of changes in foreign exchange rates from the fluctuations arising from changes in the market prices of securities sold during the period. Accordingly, realized and unrealized foreign currency gains (losses) on investments in securities are included in the reported net realized and unrealized gains (losses) on investment transactions and balances. However, pursuant to U.S. federal income tax regulations, gains and losses from certain foreign currency transactions and the foreign currency portion of gains and losses realized on sales and maturities of foreign denominated debt securities are treated as ordinary income for U.S. federal income tax purposes.
Net realized gains (losses) on foreign currency transactions represent net foreign exchange gains (losses) from foreign currency forward exchange contracts, disposition of foreign currencies, currency gains (losses) realized between the trade and settlement dates on securities transactions, and the difference between the amount of investment income and foreign withholding taxes recorded on the Fund's books and the U.S. dollar equivalent amounts actually received or paid. The change in unrealized currency gains (losses) on foreign currency transactions for the period is reflected in the Statement of Operations.
Foreign security and currency transactions may involve certain considerations and risks not typically associated
17
Morgan Stanley Institutional Fund, Inc.
Annual Report — December 31, 2019
Notes to Financial Statements (cont'd)
with those of U.S. dollar denominated transactions as a result of, among other factors, fluctuations of exchange rates in relation to the U.S. dollar, the possibility of lower levels of governmental supervision and regulation of foreign securities markets and the possibility of political or economic instability.
Governmental approval for foreign investments may be required in advance of making an investment under certain circumstances in some countries, and the extent of foreign investments in domestic companies may be subject to limitation in other countries. Foreign ownership limitations also may be imposed by the charters of individual companies to prevent, among other concerns, violations of foreign investment limitations. As a result, an additional class of shares (identified as "Foreign" in the Portfolio of Investments) may be created and offered for investment. The "local" and "foreign shares" market values may differ. In the absence of trading of the foreign shares in such markets, the Fund values the foreign shares at the closing exchange price of the local shares.
4. Derivatives: The Fund may, but is not required to, use derivative instruments for a variety of purposes, including hedging, risk management, portfolio management or to earn income. Derivatives are financial instruments whose value is based, in part, on the value of an underlying asset, interest rate, index or financial instrument. Prevailing interest rates and volatility levels, among other things, also affect the value of derivative instruments. A derivative instrument often has risks similar to its underlying asset and may have additional risks, including imperfect correlation between the value of the derivative and the underlying asset, risks of default by the counterparty to certain transactions, magnification of losses incurred due to changes in the market value of the securities, instruments, indices or interest rates to which the derivative instrument relates, risks that the transactions may not be liquid and risks arising from margin requirements. The use of derivatives involves risks that are different from, and possibly greater than, the risks associated with other portfolio investments. Derivatives may involve the use of highly specialized instruments that require investment techniques and risk analyses different from those associated with other portfolio investments. All of the Fund's holdings, including derivative instruments, are marked-to-market each day with the change in value reflected in unrealized appreciation
(depreciation). Upon disposition, a realized gain or loss is recognized.
Certain derivative transactions may give rise to a form of leverage. Leverage magnifies the potential for gain and the risk of loss. Leverage associated with derivative transactions may cause the Fund to liquidate portfolio positions when it may not be advantageous to do so to satisfy its obligations or to meet earmarking or segregation requirements, pursuant to applicable Securities and Exchange Commission ("SEC") rules and regulations, or may cause the Fund to be more volatile than if the Fund had not been leveraged. Although the Adviser Seeks to use derivatives to further the Fund's investment objectives, there is no assurance that the use of derivatives will achieve this result.
Following is a description of the derivative instruments and techniques that the Fund used during the period and their associated risks:
Options: With respect to options, the Fund is subject to equity risk, interest rate risk and foreign currency exchange risk in the normal course of pursuing its investment objectives. If the Fund buys an option, it buys a legal contract giving it the right to buy or sell a specific amount of the underlying instrument or foreign currency, or futures contract on the underlying instrument or foreign currency, at an agreed-upon price during a period of time or on a specified date typically in exchange for a premium paid by the Fund. The Fund may purchase and/or sell put and call options. Purchasing call options tends to increase the Fund's exposure to the underlying (or similar) instrument. Purchasing put options tends to decrease the Fund's exposure to the underlying (or similar) instrument. When entering into purchased option contracts, the Fund bears the risk of interest or exchange rates or securities prices moving unexpectedly, in which case, the Fund may not achieve the anticipated benefits of the purchased option contracts; however the risk of loss is limited to the premium paid. Purchased options are reported as part of "Total Investments in Securities" in the Statement of Assets and Liabilities. Premiums paid for purchasing options which expired are treated as realized losses. If the Fund sells an option, it sells to another party the right to buy from or sell to the Fund a specific amount of the underlying
18
Morgan Stanley Institutional Fund, Inc.
Annual Report — December 31, 2019
Notes to Financial Statements (cont'd)
instrument or foreign currency, or futures contract on the underlying instrument or foreign currency, at an agreed-upon price during a period of time or on a specified date typically in exchange for a premium received by the Fund. When options are purchased OTC, the Fund bears the risk that the counterparty that wrote the option will be unable or unwilling to perform its obligations under the option contract. Options may also be illiquid and the Fund may have difficulty closing out its position. A decision as to whether, when and how to use options involves the exercise of skill and judgment and even a well-conceived option transaction may be unsuccessful because of market behavior or unexpected events. The prices of options can be highly volatile and the use of options can lower total returns.
FASB ASC 815, "Derivatives and Hedging" ("ASC 815"), is intended to improve financial reporting about derivative instruments by requiring enhanced disclosures to enable investors to better understand how and why the Fund uses derivative instruments, how these derivative instruments are accounted for and their effects on the Fund's financial position and results of operations.
The following table sets forth the fair value of the Fund's derivative contracts by primary risk exposure as of December 31, 2019:
| | | Asset Derivatives
Statement of Assets and
Liabilities Location | | Primary Risk
Exposure | | Value
(000) | |
Purchased Options
| | Investments, at Value
(Purchased Options) | |
Currency Risk | | $ | 1 | (a) | |
(a) Amounts are included in Investments in Securities in the Statement of Assets and Liabilities.
The following table sets forth by primary risk exposure the Fund's change in unrealized appreciation (depreciation) by type of derivative contract for the period ended December 31, 2019 in accordance with ASC 815:
Change in Unrealized Appreciation (Depreciation) | |
Primary Risk Exposure | | Derivative Type | | Value
(000) | |
Currency Risk | | Investments
(Purchased Options) | | $ | (4 | )(b) | |
(b) Amounts are included in Investments in the Statement of Operations.
At December 31, 2019, the Fund's derivative assets and liabilities are as follows:
Gross Amounts of Assets and Liabilities
Presented in the Statement of Assets and Liabilities | |
Derivatives | | Assets(c)
(000) | | Liabilities(c)
(000) | |
Purchased Options | | $ | 1 | (a) | | $ | — | | |
(a) Amounts are included in Investments in Securities in the Statement of Assets and Liabilities.
(c) Absent an event of default or early termination, OTC derivative assets and liabilities are presented gross and not offset in the Statement of Assets and Liabilities.
The Fund typically enters into International Swaps and Derivatives Association, Inc. Master Agreements ("ISDA Master Agreements") or similar master agreements (collectively, "Master Agreements") with its contract counterparties for certain OTC derivatives in order to, among other things, reduce its credit risk to counterparties. ISDA Master Agreements include provisions for general obligations, representations, collateral and events of default or termination. Under an ISDA Master Agreement, the Fund typically may offset with the counterparty certain OTC derivative financial instruments' payables and/or receivables with collateral held and/or posted and create one single net payment (close-out netting) in the event of default, termination and/or potential deterioration in the credit quality of the counterparty. Various Master Agreements govern the terms of certain transactions with counterparties, including transactions such as swap, forward, repurchase and reverse repurchase agreements. These Master Agreements typically attempt to reduce the counterparty risk associated with such transactions by specifying credit protection mechanisms and providing standardization that improves legal certainty. Cross-termination provisions under Master Agreements typically provide that a default in connection with one transaction between the Fund and a counterparty gives the non-defaulting party the right to terminate any other transactions in place with the defaulting party to create one single net payment due to/due from the defaulting party and may be a feature in certain Master Agreements. In the event the Fund exercises its right to terminate a Master Agreement after a counterparty experiences a termination event as defined in the Master Agreement, the return of collateral with market value in excess of the Fund's net liability may be delayed or denied.
19
Morgan Stanley Institutional Fund, Inc.
Annual Report — December 31, 2019
Notes to Financial Statements (cont'd)
The following table presents derivative financial instruments that are subject to enforceable netting arrangements as of December 31, 2019:
Gross Amounts Not Offset in the Statement of Assets and Liabilities | |
Counterparty | | Gross Asset
Derivatives
Presented in the
Statement of
Assets and
Liabilities
(000) | | Financial
Instrument
(000) | | Collateral
Received
(000) | | Net Amount
(not less
than $0)
(000) | |
Royal Bank of Scotland | | $ | 1 | (a) | | $ | — | | | $ | — | | | $ | 1 | | |
(a) Amounts are included in Investments in Securities in the Statement of Assets and Liabilities.
For the period ended December 31, 2019, the approximate average monthly amount outstanding for each derivative type is as follows:
Purchased Options: | |
Average monthly notional amount | | | 511,000 | | |
5. Indemnifications: The Company enters into contracts that contain a variety of indemnifications. The Company's maximum exposure under these arrangements is unknown. However, the Company has not had prior claims or losses pursuant to these contracts and expects the risk of loss to be remote.
6. Dividends and Distributions to Shareholders: Dividends and distributions to shareholders are recorded on the ex-dividend date. Dividends from net investment income, if any, are declared and paid annually. Net realized capital gains, if any, are distributed at least annually.
7. Security Transactions, Income and Expenses: Security transactions are accounted for on the trade date (date the order to buy or sell is executed). Realized gains and losses on the sale of investment securities are determined on the specific identified cost method. Dividend income and other distributions are recorded on the ex-dividend date (except for certain foreign dividends which may be recorded as soon as the Fund is informed of such dividends) net of applicable withholding taxes. Interest income is recognized on the accrual basis except where collection is in doubt. Discounts are accreted and premiums are amortized over the life of the respective securities. Most expenses of the Company can be directly attributed to a particular Fund. Expenses which cannot be directly attributed are apportioned among the Funds based upon
relative net assets or other appropriate methods. Income, expenses (other than class specific expenses — distribution and shareholder services, transfer agency and sub transfer agency fees) and realized and unrealized gains or losses are allocated to each class of shares based upon their relative net assets.
B. Advisory Fees: The Adviser, a wholly-owned subsidiary of Morgan Stanley, provides the Fund with advisory services under the terms of an Investment Advisory Agreement, paid quarterly, at the annual rate based on the daily net assets as follows:
First $1
billion | | Over $1
billion | |
| | 0.80 | % | | | 0.75 | % | |
For the period ended December 31, 2019, the advisory fee rate (net of waiver/rebate) was equivalent to an annual effective rate of 0.00% of the Fund's average daily net assets.
The Adviser has agreed to reduce its advisory fee and/or reimburse the Fund so that total annual Fund operating expenses, excluding certain investment related expenses, taxes, interest and other extraordinary expenses (including litigation), will not exceed 1.00% for Class I shares, 1.35% for Class A shares, 2.10% for Class C shares and 0.95% for Class IS shares. The fee waivers and/or expense reimbursements will continue for at least one year from the date of the Fund's prospectus or until such time as the Directors act to discontinue all or a portion of such waivers and/or reimbursements when they deem such action is appropriate. For the period ended December 31, 2019, approximately $13,000 of advisory fees were waived and approximately $176,000 of other expenses were reimbursed by the Adviser pursuant to this arrangement.
C. Administration Fees: The Adviser also serves as Administrator to the Company and provides administrative services pursuant to an Administration Agreement for an annual fee, accrued daily and paid monthly, of 0.08% of the Fund's average daily net assets.
Under a Sub-Administration Agreement between the Administrator and State Street Bank and Trust Company ("State Street"), State Street provides certain administrative services to the Company. For such services, the Administrator pays State Street a portion of the fee the Administrator receives from the Fund.
20
Morgan Stanley Institutional Fund, Inc.
Annual Report — December 31, 2019
Notes to Financial Statements (cont'd)
D. Distribution and Shareholder Services Fees: Morgan Stanley Distribution, Inc. ("MSDI" or the "Distributor"), a wholly-owned subsidiary of the Adviser and an indirect subsidiary of Morgan Stanley, serves as the Company's Distributor of Fund shares pursuant to a Distribution Agreement. The Company has adopted a Shareholder Services Plan with respect to Class A shares pursuant to Rule 12b-1 under the Act. Under the Shareholder Services Plan, the Fund pays the Distributor a shareholder services fee, accrued daily and paid monthly, at an annual rate of 0.25% of the Fund's average daily net assets attributable to Class A shares.
The Company has adopted a Distribution and Shareholder Services Plan with respect to Class C shares pursuant to Rule 12b-1 under the Act. Under the Distribution and Shareholder Services Plan, the Fund pays the Distributor a distribution fee, accrued daily and paid monthly, at an annual rate of 0.75% and a shareholder services fee, accrued daily and paid monthly, at an annual rate of 0.25% of the Fund's average daily net assets attributable to Class C shares.
The distribution and shareholder services fees are used to support the expenses associated with servicing and maintaining accounts. The Distributor may compensate other parties for providing shareholder support services to investors who purchase Class A and Class C shares.
E. Dividend Disbursing and Transfer Agent: The Company's dividend disbursing and transfer agent is DST Asset Manager Solutions, Inc. ("DST"). Pursuant to a Transfer Agency Agreement, the Company pays DST a fee based on the number of classes, accounts and transactions relating to the Funds of the Company.
F. Custodian Fees: State Street (the "Custodian") also serves as Custodian for the Company in accordance with a Custodian Agreement. The Custodian holds cash, securities and other assets of the Company as required by the Act. Custody fees are payable monthly based on assets held in custody, investment purchases and sales activity and account maintenance fees, plus reimbursement for certain out-of-pocket expenses.
G. Security Transactions and Transactions with Affiliates: For the period ended December 31, 2019, purchases and sales of investment securities for the Fund, other than long-term U.S. Government securities and short-term investments were approximately $3,157,000 and $796,000, respectively. There were no purchases and sales of long-term
U.S. Government securities for the period ended December 31, 2019.
The Fund invests in the Institutional Class of the Morgan Stanley Institutional Liquidity Funds — Treasury Securities Portfolio (the "Liquidity Funds"), an open-end management investment company managed by the Adviser. Advisory fees paid by the Fund are reduced by an amount equal to its pro-rata share of the advisory and administration fees paid by the Fund due to its investment in the Liquidity Funds. For the period ended December 31, 2019, advisory fees paid were reduced by less than $500 relating to the Fund's investment in the Liquidity Funds.
A summary of the Fund's transactions in shares of affiliated investments during the period ended December 31, 2019 is as follows:
Affiliated
Investment
Company | | Value
April 30,
2019
(000) | | Purchases
at Cost
(000) | | Proceeds
from Sales
(000) | | Dividend
Income
(000) | |
Liquidity Funds | | $ | — | | | $ | 2,818 | | | $ | 2,767 | | | $ | 1 | | |
Affiliated
Investment
Company (cont'd) | | Realized
Gain (Loss)
(000) | | Change in
Unrealized
Appreciation
(Depreciation)
(000) | | Value
December 31,
2019
(000) | |
Liquidity Funds | | $ | — | | | $ | — | | | $ | 51 | | |
The Fund is permitted to purchase and sell securities ("cross-trade") from and to other Morgan Stanley Funds as well as other funds and client accounts for which the Adviser or an affiliate of the Adviser serves as investment adviser, pursuant to procedures approved by the Directors in compliance with Rule 17a-7 under the Act (the "Rule"). Each cross-trade is executed at the current market price in compliance with provisions of the Rule. For the period ended December 31, 2019, the Fund did not engage in any cross-trade transactions.
The Fund has an unfunded Deferred Compensation Plan (the "Compensation Plan"), which allows each independent Director to defer payment of all, or a portion, of the fees he or she receives for serving on the Board of Directors. Each eligible Director generally may elect to have the deferred amounts credited with a return equal to the total return on one or more of the Morgan Stanley funds that are offered as investment options under the Compensation Plan. Appreciation/depreciation and distributions received from these investments are recorded with an offsetting increase/decrease in the deferred compensation obligation and do not affect the NAV of the Fund.
21
Morgan Stanley Institutional Fund, Inc.
Annual Report — December 31, 2019
Notes to Financial Statements (cont'd)
H. Federal Income Taxes: It is the Fund's intention to continue to qualify as a regulated investment company and distribute all of its taxable and tax-exempt income. Accordingly, no provision for federal income taxes is required in the financial statements.
The Fund may be subject to taxes imposed by countries in which it invests. Such taxes are generally based on income and/or capital gains earned or repatriated. Taxes are accrued based on net investment income, net realized gains and net unrealized appreciation as such income and/or gains are earned. Taxes may also be based on transactions in foreign currency and are accrued based on the value of investments denominated in such currency.
FASB ASC 740-10, "Income Taxes — Overall", sets forth a minimum threshold for financial statement recognition of the benefit of a tax position taken or expected to be taken in a tax return. Management has concluded there are no significant uncertain tax positions that would require recognition in the financial statements. If applicable, the Fund recognizes interest accrued related to unrecognized tax benefits in "Interest Expense" and penalties in "Other Expenses" in the Statement of Operations. The Fund files tax returns with the U.S. Internal Revenue Service, New York and various states. The tax year ended December 31, 2019 remains subject to examination by taxing authorities.
The tax character of distributions paid may differ from the character of distributions shown for GAAP purposes due to short-term capital gains being treated as ordinary income for tax purposes. There were no distributions paid during fiscal year 2019.
The amount and character of income and gains to be distributed are determined in accordance with income tax regulations which may differ from GAAP. These book/tax differences are either considered temporary or permanent in nature.
Temporary differences are attributable to differing book and tax treatments for the timing of the recognition of gains (losses) on certain investment transactions and the timing of the deductibility of certain expenses.
The Fund had no permanent differences causing reclassifications among the components of net assets for the year ended December 31, 2019.
At December 31, 2019, the components of distributable earnings for the Fund on a tax basis were as follows:
Undistributed
Ordinary
Income
(000) | | Undistributed
Long-Term
Capital Gain
(000) | |
| $ | 22 | | | $ | — | | |
I. Other: At December 31, 2019, the Fund had record owners of 10% or greater. Investment activities of these shareholders could have a material impact on the Fund. The aggregate percentage of such owners was 35.6%.
22
Morgan Stanley Institutional Fund, Inc.
Annual Report — December 31, 2019
Report of Independent Registered Public Accounting Firm
To the Shareholders and Board of Directors of
Morgan Stanley Institutional Fund, Inc. —
Global Permanence Portfolio
Opinion on the Financial Statements
We have audited the accompanying statement of assets and liabilities of Global Permanence Portfolio (the "Fund") (one of the funds constituting Morgan Stanley Institutional Fund, Inc. (the "Company")), including the portfolio of investments, as of December 31, 2019, and the related statements of operations and changes in net assets and the financial highlights for the period from April 30, 2019 (commencement of operations) through December 31, 2019 and the related notes (collectively referred to as the "financial statements"). In our opinion, the financial statements present fairly, in all material respects, the financial position of Global Permanence Portfolio (one of the funds constituting Morgan Stanley Institutional Fund, Inc.) at December 31, 2019, and the results of its operations, the changes in its net assets and its financial highlights for the period from April 30, 2019 (commencement of operations) through December 31, 2019, in conformity with U.S. generally accepted accounting principles.
Basis for Opinion
These financial statements are the responsibility of the Company's management. Our responsibility is to express an opinion on the Fund's financial statements based on our audit. We are a public accounting firm registered with the Public Company Accounting Oversight Board (United States) ("PCAOB") and are required to be independent with respect to the Company in accordance with the U.S. federal securities law and the applicable rules and regulations of the Securities and Exchange Commission and the PCAOB.
We conducted our audit in accordance with the standards of the PCAOB. Those standards require that we plan and perform the audit to obtain reasonable assurance about whether the financial statements are free of material misstatement, whether due to error or fraud. The Company is not required to have, nor were we engaged to perform, an audit of the Company's internal control over financial reporting. As part of our audit, we are required to obtain an understanding of internal control over financial reporting, but not for the purpose of expressing an opinion on the effectiveness of the Company's internal control over financial reporting. Accordingly, we express no such opinion.
Our audit included performing procedures to assess the risks of material misstatement of the financial statements, whether due to error or fraud, and performing procedures that respond to those risks. Such procedures included examining, on a test basis, evidence regarding the amounts and disclosures in the financial statements. Our procedures included confirmation of securities owned as of December 31, 2019 by correspondence with the custodian and others or by other appropriate auditing procedures where replies from others were not received. Our audit also included evaluating the accounting principles used and significant estimates made by management, as well as evaluating the overall presentation of the financial statements. We believe that our audit provides a reasonable basis for our opinion.

We have served as the auditor of one or more Morgan Stanley investment companies since 2000.
Boston, Massachusetts
February 27, 2020
23
Privacy Notice (unaudited) April 2019
FACTS | | WHAT DOES MSIM DO WITH YOUR PERSONAL INFORMATION? | |
Why? | | Financial companies choose how they share your personal information. Federal law gives consumers the right to limit some but not all sharing. Federal law also requires us to tell you how we collect, share, and protect your personal information. Please read this notice carefully to understand what we do. | |
What? | | The types of personal information we collect and share depend on the product or service you have with us. This information can include:
n Social Security number and income
n investment experience and risk tolerance
n checking account number and wire transfer instructions | |
How? | | All financial companies need to share customers' personal information to run their everyday business. In the section below, we list the reasons financial companies can share their customers' personal information; the reasons MSIM chooses to share; and whether you can limit this sharing. | |
Reasons we can share your personal information | | Does MSIM share? | | Can you limit this sharing? | |
For our everyday business purposes —
such as to process your transactions, maintain your account(s), respond to court orders and legal investigations, or report to credit bureaus | | Yes | | No | |
For our marketing purposes —
to offer our products and services to you | | Yes | | No | |
For joint marketing with other financial companies | | No | | We don't share | |
For our affiliates' everyday business purposes —
information about your transactions and experiences | | Yes | | No | |
For our affiliates' everyday business purposes —
information about your creditworthiness | | No | | We don't share | |
For our affiliates to market to you | | No | | We don't share | |
For non-affiliates to market to you | | No | | We don't share | |
Questions? Call toll-free (844) 312-6327 or email: imprivacyinquiries@morganstanley.com
24
Privacy Notice (unaudited) (cont'd) April 2019
Who we are
Who is providing this notice? | | Morgan Stanley Investment Management, Inc. and its affiliated registered investment advisers, registered broker-dealers, and registered and unregistered funds ("MSIM") | |
What we do
How does MSIM protect my personal information? | | To protect your personal information from unauthorized access and use, we use security measures that comply with federal law. These measures include computer safeguards and secured files and buildings. We have policies governing the proper handling of customer information by personnel and requiring third parties that provide support to adhere to appropriate security standards with respect to such information. | |
How does MSIM collect my personal information? | | We collect your personal information, for example, when you
n open an account or make deposits or withdrawals from your account
n buy securities from us or make a wire transfer
n give us your contact information
We also collect your personal information from others, such as credit bureaus, affiliates, or other companies. | |
Why can't I limit all sharing? | | Federal law gives you the right to limit only
n sharing for affiliates' everyday business purposes — information about your creditworthiness
n affiliates from using your information to market to you
n sharing for non-affiliates to market to you
State laws and individual companies may give you additional rights to limit sharing. See below for more on your rights under state law. | |
Definitions
Affiliates | | Companies related by common ownership or control. They can be financial and non-financial companies.
n Our affiliates include companies with a Morgan Stanley name and financial companies such as Morgan Stanley Smith Barney LLC and Morgan Stanley & Co. | |
Non-affiliates | | Companies not related by common ownership or control. They can be financial and non-financial companies.
n MSIM does not share with non-affiliates so they can market to you. | |
Joint marketing | | A formal agreement between non-affiliated financial companies that together market financial products or services to you.
n MSIM doesn't jointly market | |
Other Important Information
Vermont: Except as permitted by law, we will not share personal information we collect about Vermont residents with Non-affiliates unless you provide us with your written consent to share such information.
California: Except as permitted by law, we will not share personal information we collect about California residents with Non-affiliates and we will limit sharing such personal information with our Affiliates to comply with California privacy laws that apply to us.
25
Morgan Stanley Institutional Fund, Inc.
Annual Report — December 31, 2019
Director and Officer Information (unaudited)
Independent Directors:
Name, Birth Year
and Address of
Independent Director | | Position(s)
Held with
Registrant | | Length of Time
Served* | | Principal Occupation(s) During Past 5 Years
and Other Relevant Professional Experience | | Number of
Funds in
Fund Complex
Overseen by
Independent
Director** | | Other Directorships
Held by Independent
Director*** | |
Frank L. Bowman
c/o Perkins Coie LLP
Counsel to the Independent Directors
1155 Avenue of the Americas
New York, NY 10036
Birth Year 1944 | | Director | | Since
August 2006 | | President, Strategic Decisions, LLC (consulting) (since February 2009); Director or Trustee of various Morgan Stanley Funds (since August 2006); Chairperson of the Compliance and Insurance Committee (since October 2015); formerly, Chairperson of the Insurance Sub-Committee of the Compliance and Insurance Committee (2007-2015); served as President and Chief Executive Officer of the Nuclear Energy Institute (policy organization) (February 2005-November 2008); retired as Admiral, U.S. Navy after serving over 38 years on active duty including 8 years as Director of the Naval Nuclear Propulsion Program in the Department of the Navy and the U.S. Department of Energy (1996-2004); served as Chief of Naval Personnel (July 1994-September 1996) and on the Joint Staff as Director of Political Military Affairs (June 1992-July 1994); knighted as Honorary Knight Commander of the Most Excellent Order of the British Empire; awarded the Officier de l'Orde National du Mérite by the French Government; elected to the National Academy of Engineering (2009). | | | 86 | | | Director of Naval and Nuclear Technologies LLP; Director Emeritus of the Armed Services YMCA; Member of the National Security Advisory Council of the Center for U.S. Global Engagement and a member of the CNA Military Advisory Board; Trustee of Fairhaven United Methodist Church; Member of the Board of Advisors of the Dolphin Scholarship Foundation; Director of other various non-profit organizations; formerly, Director of BP p.l.c. (November 2010-May 2019). | |
Kathleen A. Dennis
c/o Perkins Coie LLP
Counsel to the Independent Directors
1155 Avenue of the Americas
New York, NY 10036
Birth Year 1953 | | Director | | Since August 2006 | | President, Cedarwood Associates (mutual fund and investment management consulting) (since July 2006); Chairperson of the Liquidity and Alternatives Sub-Committee of the Investment Committee (since October 2006) and Director or Trustee of various Morgan Stanley Funds (since August 2006); formerly, Senior Managing Director of Victory Capital Management (1993-2006). | | | 86 | | | Director of various non-profit organizations. | |
Nancy C. Everett
c/o Perkins Coie LLP
Counsel to the Independent Directors
1155 Avenue of the Americas
New York, NY 10036
Birth Year 1955 | | Director | | Since January 2015 | | Chief Executive Officer, Virginia Commonwealth University Investment Company (since November 2015); Owner, OBIR, LLC (institutional investment management consulting) (since June 2014); formerly, Managing Director, BlackRock, Inc. (February 2011-December 2013); and Chief Executive Officer, General Motors Asset Management (a/k/a Promark Global Advisors, Inc.) (June 2005-May 2010). | | | 87 | | | Formerly, Member of Virginia Commonwealth University School of Business Foundation (2005-2016); Member of Virginia Commonwealth University Board of Visitors (2013-2015); Member of Committee on Directors for Emerging Markets Growth Fund, Inc. (2007-2010); Chairperson of Performance Equity Management, LLC (2006-2010); and Chairperson, GMAM Absolute Return Strategies Fund, LLC (2006-2010). | |
26
Morgan Stanley Institutional Fund, Inc.
Annual Report — December 31, 2019
Director and Officer Information (unaudited) (cont'd)
Independent Directors: (cont'd)
Name, Birth Year
and Address of
Independent Director | | Position(s)
Held with
Registrant | | Length of Time
Served* | | Principal Occupation(s) During Past 5 Years
and Other Relevant Professional Experience | | Number of
Funds in
Fund Complex
Overseen by
Independent
Director** | | Other Directorships
Held by Independent
Director*** | |
Jakki L. Haussler
c/o Perkins Coie LLP
Counsel to the Independent Directors
1155 Avenue of the Americas
New York, NY 10036
Birth Year 1957 | | Director | | Since January 2015 | | Chairman, Opus Capital Group (since 1996); formerly, Chief Executive Officer, Opus Capital Group (1996-2019); Director, Capvest Venture Fund, LP (May 2000-December 2011); Partner, Adena Ventures, LP (July 1999-December 2010); Director, The Victory Funds (February 2005-July 2008). | | | 87 | | | Director of Service Corporation International and Member, Audit Committee and Investment Committee; Director of Cincinnati Bell Inc. and Member, Audit Committee and Governance and Nominating Committee; Chairman of Northern Kentucky University Member Investment Committee; Member of Chase College of Law Transactional Law Practice Center Board of Advisors; Director of Best Transport; Director of Chase College of Law Board of Visitors; formerly, Member, University of Cincinnati Foundation Investment Committee; Member, Miami University Board of Visitors (2008-2011); Trustee of Victory Funds (2005-2008) and Chairman, Investment Committee (2007-2008) and Member, Service Provider Committee (2005-2008). | |
Dr. Manuel H. Johnson
c/o Johnson Smick International, Inc.
220 I Street, NE — Suite 200
Washington, D.C. 20002
Birth Year 1949 | | Director | | Since July 1991 | | Senior Partner, Johnson Smick International, Inc. (consulting firm); Chairperson of the Investment Committee (since October 2006) and Director or Trustee of various Morgan Stanley Funds (since July 1991); Co-Chairman and a founder of the Group of Seven Council (G7C) (international economic commission); formerly, Chairperson of the Audit Committee (July 1991-September 2006), Vice Chairman of the Board of Governors of the Federal Reserve System and Assistant Secretary of the U.S. Treasury. | | | 86 | | | Director of NVR, Inc. (home construction). | |
Joseph J. Kearns
c/o Perkins Coie LLP
Counsel to the Independent Directors
1155 Avenue of the Americas
New York, NY 10036
Birth Year 1942 | | Director | | Since August 1994 | | Senior Adviser, Kearns & Associates LLC (investment consulting); Chairperson of the Audit Committee (since October 2006) and Director or Trustee of various Morgan Stanley Funds (since August 1994); formerly, Deputy Chairperson of the Audit Committee (July 2003-September 2006) and Chairperson of the Audit Committee of various Morgan Stanley Funds (since August 1994); CFO of the J. Paul Getty Trust. | | | 87 | | | Prior to August 10, 2016, Director of Electro Rent Corporation (equipment leasing); Prior to December 31, 2013, Director of The Ford Family Foundation. | |
27
Morgan Stanley Institutional Fund, Inc.
Annual Report — December 31, 2019
Director and Officer Information (unaudited) (cont'd)
Independent Directors: (cont'd)
Name, Birth Year
and Address of
Independent Director | | Position(s)
Held with
Registrant | | Length of Time
Served* | | Principal Occupation(s) During Past 5 Years
and Other Relevant Professional Experience | | Number of
Funds in
Fund Complex
Overseen by
Independent
Director** | | Other Directorships
Held by Independent
Director*** | |
Michael F. Klein
c/o Perkins Coie LLP
Counsel to the Independent Directors
1155 Avenue of the Americas
New York, NY 10036
Birth Year 1958 | | Director | | Since August 2006 | | Managing Director, Aetos Alternatives Management, LP (since March 2000); Co-President, Aetos Alternatives Management, LP (since January 2004) and Co-Chief Executive Officer of Aetos Alternatives Management, LP (since August 2013); Chairperson of the Fixed Income Sub-Committee of the Investment Committee (since October 2006) and Director or Trustee of various Morgan Stanley Funds (since August 2006); formerly, Managing Director, Morgan Stanley & Co. Inc. and Morgan Stanley Dean Witter Investment Management and President, various Morgan Stanley Funds (June 1998-March 2000); Principal, Morgan Stanley & Co. Inc. and Morgan Stanley Dean Witter Investment Management (August 1997-December 1999). | | | 86 | | | Director of certain investment funds managed or sponsored by Aetos Alternatives Management, LP; Director of Sanitized AG and Sanitized Marketing AG (specialty chemicals). | |
Patricia Maleski
c/o Perkins Coie LLP
Counsel to the Independent Directors
1155 Avenue of the Americas
New York, NY 10036
Birth Year 1960 | | Director | | Since January 2017 | | Managing Director, JPMorgan Asset Management (2004-2016); Oversight and Control Head of Fiduciary and Conflicts of Interest Program (2015-2016); Chief Control Officer-Global Asset Management (2013-2015); President, JPMorgan Funds (2010-2013); Chief Administrative Officer (2004-2013); various other positions including Treasurer and Board Liaison (since 2001). | | | 87 | | | None. | |
Michael E. Nugent
522 Fifth Avenue
New York, NY 10036
Birth Year 1936 | | Chair of the Board and Director | | Chair of the Boards since July 2006 and Director since July 1991 | | Chair of the Boards of various Morgan Stanley Funds (since July 2006); Chairperson of the Governance Committee (since January 2019) and Director or Trustee of various Morgan Stanley Funds (since July 1991); formerly, Chairperson of each of the Closed-End Fund committee (until December 2019) and the Insurance Committee (until July 2006); General Partner, Triumph Capital, L.P. (private investment partnership) (1988-2013). | | | 86 | | | None. | |
W. Allen Reed
c/o Perkins Coie LLP
Counsel to the Independent Directors
1155 Avenue of the Americas
New York, NY 10036
Birth Year 1947 | | Vice Chair of the Board and Director | | Vice Chair of the Boards since January 2020 and Director since August 2006 | | Chairperson of the Equity Sub-Committee of the Investment Committee (since October 2006) and Director or Trustee of various Morgan Stanley Funds (since August 2006); formerly, President and CEO of General Motors Asset Management; Chairman and Chief Executive Officer of the GM Trust Bank and Corporate Vice President of General Motors Corporation (August 1994-December 2005). | | | 86 | | | Formerly, Director of Legg Mason, Inc.; formerly, Director of the Auburn University Foundation (2010-2015). | |
* This is the earliest date the Director began serving the Morgan Stanley Funds. Each Director serves an indefinite term, until his or her successor is elected.
** The Fund Complex includes (as of December 31, 2019) all open-end and closed-end funds (including all of their portfolios) advised by Morgan Stanley Investment Management Inc. (the "Adviser") and any funds that have an adviser that is an affiliated person of the Adviser (including, but not limited to, Morgan Stanley AIP GP LP).
*** This includes any directorships at public companies and registered investment companies held by the Director at any time during the past five years.
28
Morgan Stanley Institutional Fund, Inc.
Annual Report — December 31, 2019
Director and Officer Information (unaudited) (cont'd)
Executive Officers:
Name, Birth Year and Address of
Executive Officer | | Position(s) Held
with
Registrant | | Length of
Time Served* | | Principal Occupation(s) During Past 5 Years | |
John H. Gernon
522 Fifth Avenue
New York, NY 10036
Birth Year 1963 | | President and Principal Executive Officer | | Since September 2013 | | President and Principal Executive Officer of the Equity and Fixed Income Funds and the Morgan Stanley AIP Funds (since September 2013) and the Liquidity Funds and various money market funds (since May 2014) in the Fund Complex; Managing Director of the Adviser; Head of Product (since 2006). | |
Timothy J. Knierim
522 Fifth Avenue
New York, NY 10036
Birth Year 1959 | | Chief Compliance Officer | | Since December 2016 | | Managing Director of the Adviser and various entities affiliated with the Adviser; Chief Compliance Officer of various Morgan Stanley Funds and the Adviser (since December 2016) and Chief Compliance Officer of Morgan Stanley AIP GP LP (since 2014). Formerly, Managing Director and Deputy Chief Compliance Officer of the Adviser (2014-2016); and formerly, Chief Compliance Officer of Prudential Investment Management, Inc. (2007-2014). | |
Francis J. Smith
522 Fifth Avenue
New York, NY 10036
Birth Year 1965 | | Treasurer and Principal Financial Officer | | Treasurer since July 2003 and Principal Financial Officer since September 2002 | | Managing Director of the Adviser and various entities affiliated with the Adviser; Treasurer (since July 2003) and Principal Financial Officer of various Morgan Stanley Funds (since September 2002). | |
Mary E. Mullin
522 Fifth Avenue
New York, NY 10036
Birth Year 1967 | | Secretary | | Since June 1999 | | Managing Director of the Adviser; Secretary of various Morgan Stanley Funds (since June 1999). | |
Michael J. Key
522 Fifth Avenue
New York, NY 10036
Birth Year 1979 | | Vice President | | Since June 2017 | | Vice President of the Equity and Fixed Income Funds, Liquidity Funds, various money market funds and the Morgan Stanley AIP Funds in the Fund Complex (since June 2017); Executive Director of the Adviser; Head of Product Development for Equity and Fixed Income Funds (since August 2013). | |
* This is the earliest date the officer began serving the Morgan Stanley Funds. Each officer serves a one-year term, until his or her successor is elected and qualifies.
29
Morgan Stanley Institutional Fund, Inc.
Annual Report — December 31, 2019
Adviser and Administrator
Morgan Stanley Investment Management Inc.
522 Fifth Avenue
New York, New York 10036
Distributor
Morgan Stanley Distribution, Inc.
522 Fifth Avenue
New York, New York 10036
Dividend Disbursing and Transfer Agent
DST Asset Manager Solutions, Inc.
2000 Crown Colony Drive
Quincy, Massachusetts 02169
Custodian
State Street Bank and Trust Company
One Lincoln Street
Boston, Massachusetts 02111
Legal Counsel
Dechert LLP
1095 Avenue of the Americas
New York, New York 10036
Counsel to the Independent Directors
Perkins Coie LLP
1155 Avenue of the Americas
New York, New York 10036
Independent Registered Public Accounting Firm
Ernst & Young LLP
200 Clarendon Street
Boston, Massachusetts 02116
Reporting to Shareholders
Each Morgan Stanley fund provides a complete schedule of portfolio holdings in its Semi-Annual and the Annual Reports within 60 days of the end of the fund's second and fourth fiscal quarters. The Semi-Annual and Annual Reports are filed electronically with the Securities and Exchange Commission ("SEC") on Form N-CSRS and Form N-CSR, respectively. Morgan Stanley also delivers the Semi-Annual and Annual Reports to fund shareholders and makes these reports available on its public website, www.morganstanley.com/im/shareholderreports. Each Morgan Stanley non-money market fund also files a complete schedule of portfolio holdings with the SEC for the fund's first and third fiscal quarters as an attachment to Form N-PORT. Morgan Stanley does not deliver the reports for the first and third fiscal quarters to shareholders, nor are the reports posted to the Morgan Stanley public website. However, the holdings for each money market fund are posted to the Morgan Stanley public website. You may obtain the Form N-PORT filings (as well as the Form N-CSR and N-CSRS filings) by accessing the SEC's website, www.sec.gov. You can also request copies of these materials, upon payment of a duplicating fee, by electronic request at the SEC's email address (publicinfo@sec.gov).
Proxy Voting Policies and Procedures and Proxy Voting Record
You may obtain a copy of the Company's Proxy Voting Policy and Procedures and information regarding how the Company voted proxies relating to portfolio securities during the most recent twelve-month period ended June 30, without charge, upon request, by calling toll free 1 (800) 548-7786 or by visiting our website at www.morganstanley.com/im/shareholderreports. This information is also available on the SEC's website at www.sec.gov.
This report is authorized for distribution only when preceded or accompanied by a prospectus or summary prospectus of the applicable fund of Morgan Stanley Institutional Fund, Inc., which describes in detail the fund's investment policies, risks, fees and expenses. Please read the prospectus carefully before you invest or send money. For additional information, including information regarding the investments comprising the Fund, please visit our website at www.morganstanley.com/im/shareholderreports or call toll free 1 (800) 548-7786.
30
Printed in U.S.A.
This Report has been prepared for shareholders and may be distributed to others only if preceded or accompanied by a current prospectus.
Morgan Stanley Investment Management Inc.
522 Fifth Avenue
New York, New York 10036
© 2020 Morgan Stanley. Morgan Stanley Distribution, Inc.

IFIGPERMANN
2922374 EXP. 02.28.21

Morgan Stanley Institutional Fund, Inc.
China Equity Portfolio
Annual Report
December 31, 2019
Beginning on January 1, 2021, as permitted by regulations adopted by the Securities and Exchange Commission ("SEC"), paper copies of the Fund's Annual and Semi-Annual Reports to Shareholders ("Shareholder Reports") will no longer be sent by mail, unless you specifically request paper copies of the Shareholder Reports from the Fund or from your financial intermediary, such as a broker-dealer or a bank. Instead, the Shareholder Reports will be made available on the Fund's website, https://www.morganstanley.com/im/shareholderreports and you will be notified by mail each time a Shareholder Report is posted and provided with a website link to access the Shareholder Report. If you already elected to receive Shareholder Reports electronically, you will not be affected by this change and you need not take any action. You may elect to receive Shareholder Reports and other communications from the Fund electronically anytime by contacting your financial intermediary or, if you are a direct investor, please follow the instructions on the envelope.
Beginning on January 1, 2019, you may elect to receive all future Shareholder Reports in paper free of charge. If you invest through a financial intermediary, you can contact your financial intermediary to request that you continue to receive paper copies of your Shareholder Reports. If you invest directly with the Fund, please follow the instructions on the envelope to let the Fund know you wish to continue receiving paper copies of your Shareholder Reports. Your election to receive Shareholder Reports in paper will apply to all funds held in your account if you invest through your financial intermediary or all funds held with the fund complex if you invest directly with a fund.

Morgan Stanley Institutional Fund, Inc.
Annual Report — December 31, 2019
Shareholders' Letter | | | 2 | | |
Expense Example | | | 3 | | |
Investment Overview | | | 4 | | |
Portfolio of Investments | | | 6 | | |
Statement of Assets and Liabilities | | | 7 | | |
Statement of Operations | | | 8 | | |
Statement of Changes in Net Assets | | | 9 | | |
Financial Highlights | | | 10 | | |
Notes to Financial Statements | | | 14 | | |
Report of Independent Registered Public Accounting Firm | | | 20 | | |
Privacy Notice | | | 21 | | |
Director and Officer Information | | | 23 | | |
This report is authorized for distribution only when preceded or accompanied by a prospectus or summary prospectus of the applicable Fund of Morgan Stanley Institutional Fund, Inc. To receive a prospectus and/or statement of additional information ("SAI"), which contains more complete information such as investment objectives, charges, expenses, policies for voting proxies, risk considerations and describes in detail each of the Fund's investment policies to the prospective investor, please call toll free 1 (800) 548-7786. Please read the prospectuses carefully before you invest or send money.
Additionally, you can access information about the Fund, including performance, characteristics and investment team commentary, through Morgan Stanley Investment Management's website: www.morganstanley.com/im/shareholderreports.
Market forecasts provided in this report may not necessarily come to pass. There is no guarantee that any sectors mentioned will continue to perform as discussed herein or that securities in such sectors will be held by the Fund in the future. There is no assurance that a fund will achieve its investment objective. Funds are subject to market risk, which is the possibility that market values of securities owned by the Fund will decline and, therefore, the value of the Fund's shares may be less than what you paid for them. Accordingly, you can lose money investing in this Fund. Please see the prospectus for more complete information on investment risks.
1
Morgan Stanley Institutional Fund, Inc.
Annual Report — December 31, 2019
Shareholders' Letter (unaudited)
Dear Shareholders,
We are pleased to provide this Annual Report, in which you will learn how your investment in China Equity Portfolio (the "Fund") performed during the period beginning October 31, 2019 (when the Fund commenced operations) and ended December 31, 2019.
Morgan Stanley Investment Management is a client-centric, investor-led organization. Our global presence, intellectual capital, and breadth of products and services enable us to partner with investors to meet the evolving challenges of today's financial markets. We aim to deliver superior investment service and to empower our clients to make the informed decisions that help them reach their investment goals.
As always, we thank you for selecting Morgan Stanley Investment Management, and look forward to working with you in the months and years ahead.
Sincerely,

John H. Gernon
President and Principal Executive Officer
January 2020
2
Morgan Stanley Institutional Fund, Inc.
Annual Report — December 31, 2019
Expense Example (unaudited)
China Equity Portfolio
As a shareholder of the Fund, you incur two types of costs: (1) transactional costs, including redemption fees; and (2) ongoing costs, which may include advisory fees, administration fees, distribution and shareholder services fees and other Fund expenses. This example is intended to help you understand your ongoing costs (in dollars) of investing in the Fund and to compare these costs with the ongoing costs of investing in other mutual funds.
This example is based on an investment of $1,000 invested at the beginning of the period and held for the entire period 10/31/19-12/31/19.
Actual Expenses
The table below provides information about actual account values and actual expenses. You may use the information in this table, together with the amount you invested, to estimate the expenses that you paid over the period. Simply divide your account value by $1,000 (for example, an $8,600 account value divided by $1,000 = 8.6), then multiply the result by the number in the table under the heading entitled "Actual Expenses Paid During Period" to estimate the expenses you paid on your account during this period.
Hypothetical Example for Comparison Purposes
The table below provides information about hypothetical account values and hypothetical expenses based on the Fund's actual expense ratio and an assumed rate of return of 5% per year before expenses, which is not the Fund's actual return. The hypothetical account values and expenses may not be used to estimate the actual ending account balance or expenses you paid for the period. You may use this information to compare the ongoing costs of investing in the Fund and other funds. To do so, compare this 5% hypothetical example with the 5% hypothetical examples that appear in the shareholder reports of the other funds.
Please note that the expenses shown in the table are meant to highlight your ongoing costs only and do not reflect any transactional costs, such as sales charges (loads) and redemption fees. Therefore, the information for each class in the table is useful in comparing ongoing costs only, and will not help you determine the relative total costs of owning different funds. In addition, if these transactional costs were included, your costs would have been higher.
| | | Beginning
Account
Value
10/31/19 | | Actual Ending
Account
Value
12/31/19 | | Hypothetical
Ending Account
Value | | Actual
Expenses
Paid
During
Period* | | Hypothetical
Expenses Paid
During Period* | | Net
Expense
Ratio
During
Period** | |
China Equity Portfolio Class I^ | | $ | 1,000.00 | | | $ | 1,088.00 | | | $ | 1,006.43 | | | $ | 2.01 | | | $ | 1.93 | | | | 1.15 | % | |
China Equity Portfolio Class A^ | | | 1,000.00 | | | | 1,087.00 | | | | 1,005.78 | | | | 2.69 | | | | 2.58 | | | | 1.54 | | |
China Equity Portfolio Class C^ | | | 1,000.00 | | | | 1,086.00 | | | | 1,004.53 | | | | 3.99 | | | | 3.84 | | | | 2.29 | | |
China Equity Portfolio Class IS^ | | | 1,000.00 | | | | 1,088.00 | | | | 1,006.45 | | | | 1.99 | | | | 1.91 | | | | 1.14 | | |
* Expenses are calculated using each Fund Class' annualized net expense ratio (as disclosed), multiplied by the average account value over the period and multiplied by 61/365 (to reflect the actual days in the period).
** Annualized.
^ The Fund commenced operations on October 31, 2019.
3
Morgan Stanley Institutional Fund, Inc.
Annual Report — December 31, 2019
Investment Overview (unaudited)
China Equity Portfolio
The Fund seeks long-term capital appreciation.
Performance
For the since inception period from October 31, 2019 through December 31, 2019, the Fund's Class I shares had a total return based on net asset value and reinvestment of distributions per share of 8.80%, net of fees. The Fund's Class I shares underperformed the Fund's benchmark, the MSCI China Net Index, which returned 10.26%.
Factors Affecting Performance
• As of the end of the reporting period, the Fund had less than one year of performance history. Such a short time frame would not provide a meaningful performance analysis as short-term returns may not be indicative of the Fund's long-term performance potential.
Management Strategies
• The investment team actively selects positions in a limited number of equity securities (25 to 50 holdings) using a fundamental bottom-up stock selection process informed by macro thematic research on China. We employ this consistent and targeted approach, seeking companies with strong sustainable earnings growth and fundamentals. Investment selection criteria include attractive growth characteristics, reasonable valuations and company managements oriented toward creating strong shareholder value.
• The investment process takes into account information about environmental, social and governance (ESG) issues when making investment decisions. The team focuses on engaging company management around corporate governance practices, as well as what we consider to be materially important environmental and/or social issues facing a company.
• In the near term, we remain optimistic on China equities, which appear likely to be supported by continuous earnings growth, potential further policy easing, a stabilized currency trend and improvement in trade talks/external conditions. From bottom-up perspective, we expect sustained earnings growth in 2020 to provide fundamental support to the equity market. Meanwhile, we have deemed the current valuation level reasonable given the expected improvement in external conditions.
• Our medium-term view on the market hinges on whether the Chinese government can take the external pressure to further launch and implement long-term reform measures. We also expect global interest rates (and thus risk-free rates) to stay lower for longer. Against this macro backdrop, there are structural themes that we believe will likely play out, including ongoing industry consolidation and consumption upgrade. Many sectors have passed the rapidly rising penetration stage, and industry leaders with strong competitive advantages and financial strength should be able to gain market share and become even bigger and stronger. Thus, we continue to focus on industry consolidators with sustainable compounding growth. We expect the market appetite to resume for the so-called "New China" companies, as the growth expectation resets and valuation levels find their support. We also expect the consumption upgrade to continue in the foreseeable future as household income rises and the middle-class population expands over time.
4
Morgan Stanley Institutional Fund, Inc.
Annual Report — December 31, 2019
Investment Overview (unaudited) (cont'd)
China Equity Portfolio
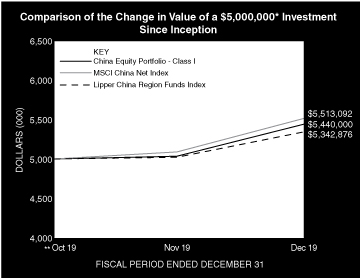
* Minimum Investment for Class I shares
** Commenced Operations on October 31, 2019.
In accordance with SEC regulations, the Fund's performance shown assumes that all recurring fees (including management fees) were deducted and all dividends and distributions were reinvested. The performance of Class A, C and IS shares will vary from the performance of Class I shares and will be negatively impacted by additional fees assessed to those classes (if applicable).
Performance Compared to the MSCI China Net Index(1) and the Lipper China Region Funds Index(2)
| | | Period Ended December 31, 2019
Total Returns(3) | |
| | | One
Year | | Five
Years | | Ten
Years | | Since
Inception(5) | |
Fund — Class I Shares
w/o sales charges(4) | | | — | | | | — | | | | — | | | | 8.80 | % | |
Fund — Class A Shares
w/o sales charges(4) | | | — | | | | — | | | | — | | | | 8.70 | | |
Fund — Class A Shares with
maximum 5.25% sales charges(4) | | | — | | | | — | | | | — | | | | 3.03 | | |
Fund — Class C Shares
w/o sales charges(4) | | | — | | | | — | | | | — | | | | 8.60 | | |
Fund — Class C Shares with
maximum 1.00% deferred
sales charges(4) | | | — | | | | — | | | | — | | | | 7.60 | | |
Fund — Class IS Shares
w/o sales charges(4) | | | — | | | | — | | | | — | | | | 8.80 | | |
MSCI China Net Index | | | — | | | | — | | | | — | | | | 10.26 | | |
Lipper China Region Funds Index | | | — | | | | — | | | | — | | | | 7.46 | | |
Performance data quoted represents past performance, which is no guarantee of future results, and current performance may be lower or higher than the figures shown. Performance assumes that all dividends and distributions, if any, were reinvested. For the most recent month-end performance figures, please visit www.morganstanley.com/im/shareholderreports. Investment return and principal value will fluctuate so that Fund shares, when redeemed, may be worth more or less than their original cost. Returns for periods less than one year are not annualized. Total returns do not reflect the deduction of taxes that a shareholder would pay on Fund distributions or the redemption of Fund shares. Performance of share classes will vary due to difference in sales charges and expenses.
(1) The MSCI China Net Index is a free float-adjusted market capitalization index that captures large and mid cap representation across China A shares, H shares, B shares, Red chips, P chips and foreign listings (e.g. ADRs). The performance of the Index is listed in U.S. dollars and assumes reinvestment of net dividends. Net total return indices reinvest dividends after the deduction of withholding taxes, using (for international indices) a tax rate applicable to non-resident institutional investors who do not benefit from double taxation treaties. The Index is unmanaged and its returns do not include any sales charges or fees. Such costs would lower performance. It is not possible to invest directly in an index.
(2) The Lipper China Region Funds Index is an equally weighted performance index of the largest qualifying funds (based on net assets) in the Lipper China Region Funds classification. The Index, which is adjusted for capital gains distributions and income dividends, is unmanaged and should not be considered an investment. There are currently 10 funds represented in this Index. As of the date of this report, the Fund was in the Lipper China Region Funds classification.
(3) Total returns for the Fund reflect fees waived and expenses reimbursed, if applicable, by the Adviser (as defined herein). Without such waivers and reimbursements, total returns would have been lower.
(4) Commenced operations on October 31, 2019.
(5) For comparative purposes, average annual since inception returns listed for the Indexes refer to the inception date of the Fund, not the inception of the Index.
5
Morgan Stanley Institutional Fund, Inc.
Annual Report — December 31, 2019
Portfolio of Investments
China Equity Portfolio
| | | Shares | | Value
(000) | |
Common Stocks (95.0%) | |
Banks (11.0%) | |
Bank of China Ltd. H Shares (a) | | | 487,000 | | | $ | 208 | | |
China Construction Bank Corp. H Shares (a) | | | 503,000 | | | | 434 | | |
China Merchants Bank Co., Ltd. H Shares (a) | | | 31,500 | | | | 162 | | |
Industrial & Commercial Bank of China Ltd.
H Shares (a) | | | 506,000 | | | | 390 | | |
| | | | 1,194 | | |
Beverages (10.8%) | |
China Resources Beer Holdings Co., Ltd. (a) | | | 96,000 | | | | 531 | | |
Kweichow Moutai Co., Ltd., Class A | | | 3,800 | | | | 645 | | |
| | | | 1,176 | | |
Capital Markets (1.0%) | |
China International Capital Corp., Ltd.
H Shares (a) | | | 54,400 | | | | 105 | | |
Construction Materials (3.6%) | |
Anhui Conch Cement Co., Ltd., Class A | | | 50,400 | | | | 397 | | |
Diversified Consumer Services (5.8%) | |
New Oriental Education & Technology
Group, Inc. ADR (b) | | | 3,300 | | | | 400 | | |
TAL Education Group ADR (b) | | | 4,700 | | | | 227 | | |
| | | | 627 | | |
Electronic Equipment, Instruments & Components (1.3%) | |
Universal Scientific Industrial Shanghai Co., Ltd.,
Class A | | | 50,700 | | | | 140 | | |
Food Products (6.2%) | |
China Mengniu Dairy Co., Ltd. (a)(b) | | | 111,000 | | | | 449 | | |
Inner Mongolia Yili Industrial Group Co., Ltd.,
Class A | | | 50,300 | | | | 223 | | |
| | | | 672 | | |
Health Care Providers & Services (0.9%) | |
Sinopharm Group Co., Ltd. H Shares (a) | | | 28,000 | | | | 102 | | |
Insurance (6.4%) | |
China Life Insurance Co., Ltd. H Shares (a) | | | 78,000 | | | | 217 | | |
Ping An Insurance Group Co. of China Ltd.
H Shares (a) | | | 40,500 | | | | 478 | | |
| | | | 695 | | |
Interactive Media & Services (16.5%) | |
Tencent Holdings Ltd. (a) | | | 37,200 | | | | 1,793 | | |
Internet & Direct Marketing Retail (17.2%) | |
Alibaba Group Holding Ltd. ADR (b) | | | 8,400 | | | | 1,781 | | |
Pinduoduo, Inc. ADR (b) | | | 2,400 | | | | 91 | | |
| | | | 1,872 | | |
Pharmaceuticals (5.6%) | |
CSPC Pharmaceutical Group Ltd. (a) | | | 138,000 | | | | 329 | | |
Sino Biopharmaceutical Ltd. (a) | | | 203,000 | | | | 284 | | |
| | | | 613 | | |
Real Estate Management & Development (4.1%) | |
China Resources Land Ltd. (a) | | | 70,000 | | | | 349 | | |
Shenzhen Investment Ltd. (a) | | | 252,000 | | | | 101 | | |
| | | | 450 | | |
| | | Shares | | Value
(000) | |
Textiles, Apparel & Luxury Goods (3.7%) | |
Shenzhou International Group Holdings Ltd. (a) | | | 27,800 | | | $ | 406 | | |
Transportation Infrastructure (0.9%) | |
Shenzhen Airport Co., Ltd., Class A | | | 72,700 | | | | 102 | | |
Total Common Stocks (Cost $9,454) | | | 10,344 | | |
Short-Term Investment (5.1%) | |
Investment Company (5.1%) | |
Morgan Stanley Institutional Liquidity
Funds — Government Portfolio —
Institutional Class (See Note G)
(Cost $550) | | | 549,980 | | | | 550 | | |
Total Investments (100.1%) (Cost $10,004) (c) | | | 10,894 | | |
Liabilities in Excess of Other Assets (–0.1%) | | | (15 | ) | |
Net Assets (100.0%) | | $ | 10,879 | | |
(a) Security trades on the Hong Kong exchange.
(b) Non-income producing security.
(c) At December 31, 2019, the aggregate cost for federal income tax purposes is approximately $10,004,000. The aggregate gross unrealized appreciation is approximately $951,000 and the aggregate gross unrealized depreciation is approximately $61,000, resulting in net unrealized appreciation of approximately $890,000.
ADR American Depositary Receipt.
Portfolio Composition
Classification | | Percentage of
Total Investments | |
Internet & Direct Marketing Retail | | | 17.2 | % | |
Interactive Media & Services | | | 16.5 | | |
Other* | | | 15.5 | | |
Banks | | | 11.0 | | |
Beverages | | | 10.8 | | |
Insurance | | | 6.4 | | |
Food Products | | | 6.2 | | |
Diversified Consumer Services | | | 5.8 | | |
Pharmaceuticals | | | 5.6 | | |
Short-Term Investments | | | 5.0 | | |
Total Investments | | | 100.0 | % | |
* Industries and/or investment types representing less than 5% of total investments.
The accompanying notes are an integral part of the financial statements.
6
Morgan Stanley Institutional Fund, Inc.
Annual Report — December 31, 2019
Statement of Assets and Liabilities | | December 31, 2019
(000) | |
Assets: | |
Investments in Securities of Unaffiliated Issuers, at Value (Cost $9,454) | | $ | 10,344 | | |
Investment in Security of Affiliated Issuer, at Value (Cost $550) | | | 550 | | |
Total Investments in Securities, at Value (Cost $10,004) | | | 10,894 | | |
Prepaid Offering Costs | | | 129 | | |
Due from Adviser | | | 66 | | |
Receivable from Affiliate | | | 1 | | |
Other Assets | | | 1 | | |
Total Assets | | | 11,091 | | |
Liabilities: | |
Payable for Offering Costs | | | 154 | | |
Payable for Professional Fees | | | 50 | | |
Payable for Custodian Fees | | | 1 | | |
Payable for Administration Fees | | | 1 | | |
Payable for Transfer Agency Fees — Class I | | | — | @ | |
Payable for Transfer Agency Fees — Class A | | | — | @ | |
Payable for Transfer Agency Fees — Class C | | | — | @ | |
Payable for Shareholder Services Fees — Class A | | | — | @ | |
Payable for Distribution and Shareholder Services Fees — Class C | | | — | @ | |
Other Liabilities | | | 6 | | |
Total Liabilities | | | 212 | | |
Net Assets | | $ | 10,879 | | |
Net Assets Consist of: | |
Paid-in-Capital | | $ | 10,000 | | |
Total Distributable Earnings | | | 879 | | |
Net Assets | | $ | 10,879 | | |
CLASS I: | |
Net Assets | | $ | 10,846 | | |
| Shares Outstanding $0.001 par value shares of beneficial interest (unlimited shares authorized) (not in 000's) | | | 997,000 | | |
Net Asset Value, Offering and Redemption Price Per Share | | $ | 10.88 | | |
CLASS A: | |
Net Assets | | $ | 11 | | |
| Shares Outstanding $0.001 par value shares of beneficial interest (unlimited shares authorized) (not in 000's) | | | 1,000 | | |
Net Asset Value, Redemption Price Per Share | | $ | 10.87 | | |
Maximum Sales Load | | | 5.25 | % | |
Maximum Sales Charge | | $ | 0.60 | | |
Maximum Offering Price Per Share | | $ | 11.47 | | |
CLASS C: | |
Net Assets | | $ | 11 | | |
| Shares Outstanding $0.001 par value shares of beneficial interest (unlimited shares authorized) (not in 000's) | | | 1,000 | | |
Net Asset Value, Offering and Redemption Price Per Share | | $ | 10.86 | | |
CLASS IS: | |
Net Assets | | $ | 11 | | |
| Shares Outstanding $0.001 par value shares of beneficial interest (unlimited shares authorized) (not in 000's) | | | 1,000 | | |
Net Asset Value, Offering and Redemption Price Per Share | | $ | 10.88 | | |
@ Amount is less than $500.
The accompanying notes are an integral part of the financial statements.
7
Morgan Stanley Institutional Fund, Inc.
Annual Report — December 31, 2019
Statement of Operations | | Period from
October 31, 2019^ to
December 31, 2019
(000) | |
Investment Income: | |
Dividends from Security of Affiliated Issuer (Note G) | | $ | 3 | | |
Dividends from Securities of Unaffiliated Issuers | | | 1 | | |
Total Investment Income | | | 4 | | |
Expenses: | |
Professional Fees | | | 52 | | |
Offering Costs | | | 26 | | |
Advisory Fees (Note B) | | | 14 | | |
Shareholder Reporting Fees | | | 4 | | |
Custodian Fees (Note F) | | | 1 | | |
Administration Fees (Note C) | | | 1 | | |
Transfer Agency Fees — Class I (Note E) | | | — | @ | |
Transfer Agency Fees — Class A (Note E) | | | — | @ | |
Transfer Agency Fees — Class C (Note E) | | | — | @ | |
Transfer Agency Fees — Class IS (Note E) | | | — | @ | |
Shareholder Services Fees — Class A (Note D) | | | — | @ | |
Distribution and Shareholder Services Fees — Class C (Note D) | | | — | @ | |
Pricing Fees | | | — | @ | |
Other Expenses | | | 1 | | |
Total Expenses | | | 99 | | |
Expenses Reimbursed by Adviser (Note B) | | | (65 | ) | |
Waiver of Advisory Fees (Note B) | | | (14 | ) | |
Reimbursement of Class Specific Expenses — Class A (Note B) | | | (— | @) | |
Reimbursement of Class Specific Expenses — Class C (Note B) | | | (— | @) | |
Reimbursement of Class Specific Expenses — Class IS (Note B) | | | (— | @) | |
Rebate from Morgan Stanley Affiliate (Note G) | | | (— | @) | |
Net Expenses | | | 20 | | |
Net Investment Loss | | | (16 | ) | |
Realized Gain: | |
Foreign Currency Translation | | | 5 | | |
Change in Unrealized Appreciation (Depreciation): | |
Investments | | | 890 | | |
Net Realized Gain and Change in Unrealized Appreciation (Depreciation) | | | 895 | | |
Net Increase in Net Assets Resulting from Operations | | $ | 879 | | |
^ Commencement of Operations.
@ Amount is less than $500.
The accompanying notes are an integral part of the financial statements.
8
Morgan Stanley Institutional Fund, Inc.
Annual Report — December 31, 2019
Statement of Changes in Net Assets | | Period from
October 31, 2019^ to
December 31, 2019
(000) | |
Increase (Decrease) in Net Assets: | |
Operations: | |
Net Investment Loss | | $ | (16 | ) | |
Net Realized Gain | | | 5 | | |
Net Change in Unrealized Appreciation (Depreciation) | | | 890 | | |
Net Increase in Net Assets Resulting from Operations | | | 879 | | |
Capital Share Transactions:(1) | |
Class I: | |
Subscribed | | | 9,970 | | |
Class A: | |
Subscribed | | | 10 | | |
Class C: | |
Subscribed | | | 10 | | |
Class IS: | |
Subscribed | | | 10 | | |
Net Increase in Net Assets Resulting from Capital Share Transactions | | | 10,000 | | |
Total Increase in Net Assets | | | 10,879 | | |
Net Assets: | |
Beginning of Period | | | — | | |
End of Period | | $ | 10,879 | | |
(1) Capital Share Transactions: | |
Class I: | |
Shares Subscribed | | | 997 | | |
Class A: | |
Shares Subscribed | | | 1 | | |
Class C: | |
Shares Subscribed | | | 1 | | |
Class IS: | |
Shares Subscribed | | | 1 | | |
^ Commencement of Operations.
The accompanying notes are an integral part of the financial statements.
9
Morgan Stanley Institutional Fund, Inc.
Annual Report — December 31, 2019
Financial Highlights
China Equity Portfolio
| | | Class I | |
Selected Per Share Data and Ratios | | Period from
October 31, 2019(1) to
December 31, 2019 | |
Net Asset Value, Beginning of Period | | $ | 10.00 | | |
Income (Loss) from Investment Operations: | |
Net Investment Loss(2) | | | (0.02 | ) | |
Net Realized and Unrealized Gain | | | 0.90 | | |
Total from Investment Operations | | | 0.88 | | |
Net Asset Value, End of Period | | $ | 10.88 | | |
Total Return(3) | | | 8.80 | %(5) | |
Ratios to Average Net Assets and Supplemental Data: | |
Net Assets, End of Period (Thousands) | | $ | 10,846 | | |
Ratio of Expenses Before Expense Limitation | | | 5.72 | %(6) | |
Ratio of Expenses After Expense Limitation | | | 1.15 | %(4)(6) | |
Ratio of Net Investment Loss | | | (0.98 | )%(4)(6) | |
Ratio of Rebate from Morgan Stanley Affiliates | | | 0.01 | %(6) | |
Portfolio Turnover Rate | | | 0 | %(5) | |
(1) Commencement of Operations.
(2) Per share amount is based on average shares outstanding.
(3) Calculated based on the net asset value as of the last business day of the period.
(4) The Ratio of Expenses After Expense Limitation and Ratio of Net Investment Loss reflect the rebate of certain Fund expenses in connection with the investments in Morgan Stanley affiliates during the period. The effect of the rebate on the ratios is disclosed in the above table as "Ratio of Rebate from Morgan Stanley Affiliates."
(5) Not annualized.
(6) Annualized.
The accompanying notes are an integral part of the financial statements.
10
Morgan Stanley Institutional Fund, Inc.
Annual Report — December 31, 2019
Financial Highlights
China Equity Portfolio
| | | Class A | |
Selected Per Share Data and Ratios | | Period from
October 31, 2019(1) to
December 31, 2019 | |
Net Asset Value, Beginning of Period | | $ | 10.00 | | |
Income (Loss) from Investment Operations: | |
Net Investment Loss(2) | | | (0.02 | ) | |
Net Realized and Unrealized Gain | | | 0.89 | | |
Total from Investment Operations | | | 0.87 | | |
Net Asset Value, End of Period | | $ | 10.87 | | |
Total Return(3) | | | 8.70 | %(5) | |
Ratios to Average Net Assets and Supplemental Data: | |
Net Assets, End of Period (Thousands) | | $ | 11 | | |
Ratio of Expenses Before Expense Limitation | | | 19.30 | %(6) | |
Ratio of Expenses After Expense Limitation | | | 1.54 | %(4)(6) | |
Ratio of Net Investment Loss | | | (1.37 | )%(4)(6) | |
Ratio of Rebate from Morgan Stanley Affiliates | | | 0.01 | %(6) | |
Portfolio Turnover Rate | | | 0 | %(5) | |
(1) Commencement of Operations.
(2) Per share amount is based on average shares outstanding.
(3) Calculated based on the net asset value which does not reflect sales charges, if applicable, as of the last business day of the period.
(4) The Ratio of Expenses After Expense Limitation and Ratio of Net Investment Loss reflect the rebate of certain Fund expenses in connection with the investments in Morgan Stanley affiliates during the period. The effect of the rebate on the ratios is disclosed in the above table as "Ratio of Rebate from Morgan Stanley Affiliates."
(5) Not annualized.
(6) Annualized.
The accompanying notes are an integral part of the financial statements.
11
Morgan Stanley Institutional Fund, Inc.
Annual Report — December 31, 2019
Financial Highlights
China Equity Portfolio
| | | Class C | |
Selected Per Share Data and Ratios | | Period from
October 31, 2019(1) to
December 31, 2019 | |
Net Asset Value, Beginning of Period | | $ | 10.00 | | |
Income (Loss) from Investment Operations: | |
Net Investment Loss(2) | | | (0.04 | ) | |
Net Realized and Unrealized Gain | | | 0.90 | | |
Total from Investment Operations | | | 0.86 | | |
Net Asset Value, End of Period | | $ | 10.86 | | |
Total Return(3) | | | 8.60 | %(5) | |
Ratios to Average Net Assets and Supplemental Data: | |
Net Assets, End of Period (Thousands) | | $ | 11 | | |
Ratio of Expenses Before Expense Limitation | | | 20.07 | %(6) | |
Ratio of Expenses After Expense Limitation | | | 2.29 | %(4)(6) | |
Ratio of Net Investment Loss | | | (2.12 | )%(4)(6) | |
Ratio of Rebate from Morgan Stanley Affiliates | | | 0.01 | %(6) | |
Portfolio Turnover Rate | | | 0 | %(5) | |
(1) Commencement of Operations.
(2) Per share amount is based on average shares outstanding.
(3) Calculated based on the net asset value which does not reflect sales charges, if applicable, as of the last business day of the period.
(4) The Ratio of Expenses After Expense Limitation and Ratio of Net Investment Loss reflect the rebate of certain Fund expenses in connection with the investments in Morgan Stanley affiliates during the period. The effect of the rebate on the ratios is disclosed in the above table as "Ratio of Rebate from Morgan Stanley Affiliates."
(5) Not annualized.
(6) Annualized.
The accompanying notes are an integral part of the financial statements.
12
Morgan Stanley Institutional Fund, Inc.
Annual Report — December 31, 2019
Financial Highlights
China Equity Portfolio
| | | Class IS | |
Selected Per Share Data and Ratios | | Period from
October 31, 2019(1) to
December 31, 2019 | |
Net Asset Value, Beginning of Period | | $ | 10.00 | | |
Income (Loss) from Investment Operations: | |
Net Investment Loss(2) | | | (0.02 | ) | |
Net Realized and Unrealized Gain | | | 0.90 | | |
Total from Investment Operations | | | 0.88 | | |
Net Asset Value, End of Period | | $ | 10.88 | | |
Total Return(3) | | | 8.80 | %(5) | |
Ratios to Average Net Assets and Supplemental Data: | |
Net Assets, End of Period (Thousands) | | $ | 11 | | |
Ratio of Expenses Before Expense Limitation | | | 19.05 | %(6) | |
Ratio of Expenses After Expense Limitation | | | 1.14 | %(4)(6) | |
Ratio of Net Investment Loss | | | (0.97 | )%(4)(6) | |
Ratio of Rebate from Morgan Stanley Affiliates | | | 0.01 | %(6) | |
Portfolio Turnover Rate | | | 0 | %(5) | |
(1) Commencement of Operations.
(2) Per share amount is based on average shares outstanding.
(3) Calculated based on the net asset value as of the last business day of the period.
(4) The Ratio of Expenses After Expense Limitation and Ratio of Net Investment Loss reflect the rebate of certain Fund expenses in connection with the investments in Morgan Stanley affiliates during the period. The effect of the rebate on the ratios is disclosed in the above table as "Ratio of Rebate from Morgan Stanley Affiliates."
(5) Not annualized.
(6) Annualized.
The accompanying notes are an integral part of the financial statements.
13
Morgan Stanley Institutional Fund, Inc.
Annual Report — December 31, 2019
Notes to Financial Statements
Morgan Stanley Institutional Fund, Inc. (the "Company") is registered under the Investment Company Act of 1940, as amended (the "Act"), as an open-end management investment company. The Company is comprised of thirty-two separate, active, diversified and non-diversified funds (individually referred to as a "Fund," collectively as the "Funds"). The Company applies investment company accounting and reporting guidance.
The accompanying financial statements relate to the China Equity Portfolio. The Fund seeks long-term capital appreciation.
The Fund commenced operations on October 31, 2019 and offers four classes of shares — Class I, Class A, Class C and Class IS.
A. Significant Accounting Policies: The following significant accounting policies are in conformity with U.S. generally accepted accounting principles ("GAAP"). Such policies are consistently followed by the Company in the preparation of its financial statements. GAAP may require management to make estimates and assumptions that affect the reported amounts and disclosures in the financial statements. Actual results may differ from those estimates.
In August 2018, the Financial Accounting Standards Board ("FASB") issued Accounting Standards Update ("ASU") 2018-13, Fair Value Measurement (Topic 820) — Disclosures Framework — Changes to Disclosure Requirements of Fair Value Measurement ("ASU 2018-13") which introduces new fair value disclosure requirements as well as eliminates and modifies certain existing fair value disclosure requirements. ASU 2018-13 would be effective for fiscal years beginning after December 15, 2019 and for interim periods within those fiscal years; however, management has elected to early adopt ASU 2018-13 as permitted by the standard. The impact of the Fund's adoption was limited to changes in the Fund's financial statement disclosures regarding fair value, primarily those disclosures related to transfers between levels of the fair value hierarchy and disclosure of the range and weighted average used to develop significant unobservable inputs for Level 3 fair value measurements, when applicable.
1. Security Valuation: (1) An equity portfolio security listed or traded on an exchange is valued at its latest reported sales price (or at the exchange official closing price if such exchange reports an official closing price), and if there were no sales on a given day and if there is no official exchange closing price for that day, the security is valued at the mean between the last reported bid and asked prices
if such bid and asked prices are available on the relevant exchanges. If only bid prices are available then the latest bid price may be used. Listed equity securities not traded on the valuation date with no reported bid and asked prices available on the exchange are valued at the mean between the current bid and asked prices obtained from one or more reputable brokers or dealers. In cases where a security is traded on more than one exchange, the security is valued on the exchange designated as the primary market; (2) all other equity portfolio securities for which over-the-counter ("OTC") market quotations are readily available are valued at the latest reported sales price (or at the market official closing price if such market reports an official closing price), and if there was no trading in the security on a given day and if there is no official closing price from relevant markets for that day, the security is valued at the mean between the last reported bid and asked prices if such bid and asked prices are available on the relevant markets. An unlisted equity security that does not trade on the valuation date and for which bid and asked prices from the relevant markets are unavailable is valued at the mean between the current bid and asked prices obtained from one or more reputable brokers or dealers; (3) certain portfolio securities may be valued by an outside pricing service/vendor approved by the Company's Board of Directors (the "Directors"). The pricing service/vendor may employ a pricing model that takes into account, among other things, bids, yield spreads and/or other market data and specific security characteristics. Alternatively, if a valuation is not available from an outside pricing service/vendor, and the security trades on an exchange, the security may be valued at its latest reported sale price (or at the exchange official closing price if such exchange reports an official closing price), prior to the time when assets are valued. If there are no sales on a given day and if there is no official exchange closing price for that day, the security is valued at the mean between the last reported bid and asked prices if such bid and asked prices are available in the relevant exchanges. If Morgan Stanley Investment Management Inc. (the "Adviser"), a wholly-owned subsidiary of Morgan Stanley, determines that the price provided by the outside pricing service/vendor or exchange does not reflect the security's fair value or is unable to provide a price, prices from brokers or dealers may also be utilized. In these circumstances, the value of the security will be the mean of bid and asked prices obtained from brokers or dealers; (4) when market quotations are not readily available, including circumstances under which the
14
Morgan Stanley Institutional Fund, Inc.
Annual Report — December 31, 2019
Notes to Financial Statements (cont'd)
Adviser determines that the closing price, last sale price or the mean between the last reported bid and asked prices are not reflective of a security's market value, portfolio securities are valued at their fair value as determined in good faith under procedures established by and under the general supervision of the Directors. Occasionally, developments affecting the closing prices of securities and other assets may occur between the times at which valuations of such securities are determined (that is, close of the foreign market on which the securities trade) and the close of business of the New York Stock Exchange ("NYSE"). If developments occur during such periods that are expected to materially affect the value of such securities, such valuations may be adjusted to reflect the estimated fair value of such securities as of the close of the NYSE, as determined in good faith by the Directors or by the Adviser using a pricing service and/or procedures approved by the Directors; (5) quotations of foreign portfolio securities, other assets and liabilities and forward contracts stated in foreign currency are translated into U.S. dollar equivalents at the prevailing market rates prior to the close of the NYSE; and (6) investments in mutual funds, including the Morgan Stanley Institutional Liquidity Funds, are valued at the net asset value ("NAV") as of the close of each business day.
The Directors have responsibility for determining in good faith the fair value of the investments, and the Directors may appoint others, such as the Company's Adviser or a valuation committee, to assist the Directors in determining fair value and to make the actual calculations pursuant to the fair valuation methodologies previously approved by the Directors. Under procedures approved by the Directors, the Company's Adviser has formed a Valuation Committee whose members are approved by the Directors. The Valuation Committee provides administration and oversight of the Company's valuation policies and procedures, which are reviewed at least annually by the Directors. These procedures allow the Company to utilize independent pricing services, quotations from securities and financial instrument dealers and other market sources to determine fair value.
2. Fair Value Measurement: FASB Accounting Standards CodificationTM ("ASC") 820, "Fair Value Measurement" ("ASC 820"), defines fair value as the value that the Fund would receive to sell an investment or pay to
transfer a liability in a timely transaction with an independent buyer in the principal market, or in the absence of a principal market, the most advantageous market for the investment or liability. ASC 820 establishes a three-tier hierarchy to distinguish between (1) inputs that reflect the assumptions market participants would use in valuing an asset or liability developed based on market data obtained from sources independent of the reporting entity (observable inputs) and (2) inputs that reflect the reporting entity's own assumptions about the assumptions market participants would use in valuing an asset or liability developed based on the best information available in the circumstances (unobservable inputs) and to establish classification of fair value measurements for disclosure purposes. Various inputs are used in determining the value of the Fund's investments. The inputs are summarized in the three broad levels listed below:
• Level 1 – unadjusted quoted prices in active markets for identical investments
• Level 2 – other significant observable inputs (including quoted prices for similar investments, interest rates, prepayment speeds, credit risk, etc.)
• Level 3 – significant unobservable inputs including the Fund's own assumptions in determining the fair value of investments. Factors considered in making this determination may include, but are not limited to, information obtained by contacting the issuer, analysts, or the appropriate stock exchange (for exchange-traded securities), analysis of the issuer's financial statements or other available documents and, if necessary, available information concerning other securities in similar circumstances.
The inputs or methodology used for valuing securities are not necessarily an indication of the risk associated with investing in those securities and the determination of the significance of a particular input to the fair value measurement in its entirety requires judgment and considers factors specific to each security.
15
Morgan Stanley Institutional Fund, Inc.
Annual Report — December 31, 2019
Notes to Financial Statements (cont'd)
The following is a summary of the inputs used to value the Fund's investments as of December 31, 2019:
Investment Type | | Level 1
Unadjusted
quoted
prices
(000) | | Level 2
Other
significant
observable
inputs
(000) | | Level 3
Significant
unobservable
inputs
(000) | | Total
(000) | |
Assets: | |
Common Stocks | |
Banks | | $ | 1,194 | | | $ | — | | | $ | — | | | $ | 1,194 | | |
Beverages | | | 1,176 | | | | — | | | | — | | | | 1,176 | | |
Capital Markets | | | 105 | | | | — | | | | — | | | | 105 | | |
Construction Materials | | | 397 | | | | — | | | | — | | | | 397 | | |
Diversified Consumer
Services | | | 627 | | | | — | | | | — | | | | 627 | | |
Electronic Equipment,
Instruments &
Components | | | 140 | | | | — | | | | — | | | | 140 | | |
Food Products | | | 672 | | | | — | | | | — | | | | 672 | | |
Health Care Providers &
Services | | | 102 | | | | — | | | | — | | | | 102 | | |
Insurance | | | 695 | | | | — | | | | — | | | | 695 | | |
Interactive Media &
Services | | | 1,793 | | | | — | | | | — | | | | 1,793 | | |
Internet & Direct Marketing
Retail | | | 1,872 | | | | — | | | | — | | | | 1,872 | | |
Pharmaceuticals | | | 613 | | | | — | | | | — | | | | 613 | | |
Real Estate Management &
Development | | | 450 | | | | — | | | | — | | | | 450 | | |
Textiles, Apparel & Luxury
Goods | | | 406 | | | | — | | | | — | | | | 406 | | |
Transportation
Infrastructure | | | 102 | | | | — | | | | — | | | | 102 | | |
Total Common Stocks | | | 10,344 | | | | — | | | | — | | | | 10,344 | | |
Short-Term Investment | |
Investment Company | | | 550 | | | | — | | | | — | | | | 550 | | |
Total Assets | | $ | 10,894 | | | $ | — | | | $ | — | | | $ | 10,894 | | |
Transfers between investment levels may occur as the markets fluctuate and/or the availability of data used in an investment's valuation changes.
3. Foreign Currency Translation and Foreign Investments: The books and records of the Fund are maintained in U.S. dollars. Foreign currency amounts are translated into U.S. dollars as follows:
– investments, other assets and liabilities at the prevailing rate of exchange on the valuation date;
– investment transactions and investment income at the prevailing rates of exchange on the dates of such transactions.
Although the net assets of the Fund are presented at the foreign exchange rates and market values at the close of the period, the Fund does not isolate that portion of the results of operations arising as a result of changes in the
foreign exchange rates from the fluctuations arising from changes in the market prices of securities held at period end. Similarly, the Fund does not isolate the effect of changes in foreign exchange rates from the fluctuations arising from changes in the market prices of securities sold during the period. Accordingly, realized and unrealized foreign currency gains (losses) on investments in securities are included in the reported net realized and unrealized gains (losses) on investment transactions and balances. However, pursuant to U.S. federal income tax regulations, gains and losses from certain foreign currency transactions and the foreign currency portion of gains and losses realized on sales and maturities of foreign denominated debt securities are treated as ordinary income for U.S. federal income tax purposes.
Net realized gains (losses) on foreign currency transactions represent net foreign exchange gains (losses) from foreign currency forward exchange contracts, disposition of foreign currencies, currency gains (losses) realized between the trade and settlement dates on securities transactions, and the difference between the amount of investment income and foreign withholding taxes recorded on the Fund's books and the U.S. dollar equivalent amounts actually received or paid. The change in unrealized currency gains (losses) on foreign currency transactions for the period is reflected in the Statement of Operations.
Foreign security and currency transactions may involve certain considerations and risks not typically associated with those of U.S. dollar denominated transactions as a result of, among other factors, fluctuations of exchange rates in relation to the U.S. dollar, the possibility of lower levels of governmental supervision and regulation of foreign securities markets and the possibility of political or economic instability.
Governmental approval for foreign investments may be required in advance of making an investment under certain circumstances in some countries, and the extent of foreign investments in domestic companies may be subject to limitation in other countries. Foreign ownership limitations also may be imposed by the charters of individual companies to prevent, among other concerns, violations of foreign investment limitations. As a result, an additional class of shares (identified as "Foreign" in
16
Morgan Stanley Institutional Fund, Inc.
Annual Report — December 31, 2019
Notes to Financial Statements (cont'd)
the Portfolio of Investments) may be created and offered for investment. The "local" and "foreign shares" market values may differ. In the absence of trading of the foreign shares in such markets, the Fund values the foreign shares at the closing exchange price of the local shares.
4. Redemption Fees: The Fund will assess a 2% redemption fee on Class I shares, Class A shares, Class C shares and Class IS shares, which is paid directly to the Fund, for shares redeemed or exchanged within thirty days of purchase, subject to certain exceptions. The redemption fee is designed to protect the Fund and its remaining shareholders from the effects of short-term trading. These fees, if any, are included in the Statements of Changes in Net Assets.
5. Indemnifications: The Company enters into contracts that contain a variety of indemnifications. The Company's maximum exposure under these arrangements is unknown. However, the Company has not had prior claims or losses pursuant to these contracts and expects the risk of loss to be remote.
6. Dividends and Distributions to Shareholders: Dividends and distributions to shareholders are recorded on the ex-dividend date. Dividends from net investment income, if any, are declared and paid annually. Net realized capital gains, if any, are distributed at least annually.
7. Security Transactions, Income and Expenses: Security transactions are accounted for on the trade date (date the order to buy or sell is executed). Realized gains and losses on the sale of investment securities are determined on the specific identified cost method. Dividend income and other distributions are recorded on the ex-dividend date (except for certain foreign dividends which may be recorded as soon as the Fund is informed of such dividends) net of applicable withholding taxes. Interest income is recognized on the accrual basis except where collection is in doubt. Discounts are accreted and premiums are amortized over the life of the respective securities. Most expenses of the Company can be directly attributed to a particular Fund. Expenses which cannot be directly attributed are apportioned among the Funds based upon relative net assets or other appropriate methods. Income, expenses (other than class specific expenses — distribution and shareholder services, transfer agency and sub transfer agency fees) and realized and unrealized gains or losses are
allocated to each class of shares based upon their relative net assets.
B. Advisory Fees: The Adviser, a wholly-owned subsidiary of Morgan Stanley, provides the Fund with advisory services under the terms of an Investment Advisory Agreement, paid quarterly, at an annual rate of 0.80% of the daily net assets of the Fund.
The Adviser has agreed to reduce its advisory fee and/or reimburse the Fund so that total annual Fund operating expenses, excluding certain investment related expenses, taxes, interest and other extraordinary expenses (including litigation), will not exceed 1.20% for Class I shares, 1.55% for Class A shares, 2.30% for Class C shares and 1.15% for Class IS shares. The fee waivers and/or expense reimbursements will continue for at least one year from the date of the Fund's prospectus or until such time as the Directors act to discontinue all or a portion of such waivers and/or reimbursements when they deem such action is appropriate. For the period ended December 31, 2019, approximately $14,000 of advisory fees were waived and approximately $65,000 of other expenses were reimbursed by the Adviser pursuant to this arrangement.
C. Administration Fees: The Adviser also serves as Administrator to the Company and provides administrative services pursuant to an Administration Agreement for an annual fee, accrued daily and paid monthly, of 0.08% of the Fund's average daily net assets.
Under a Sub-Administration Agreement between the Administrator and State Street Bank and Trust Company ("State Street"), State Street provides certain administrative services to the Company. For such services, the Administrator pays State Street a portion of the fee the Administrator receives from the Fund.
D. Distribution and Shareholder Services Fees: Morgan Stanley Distribution, Inc. ("MSDI" or the "Distributor"), a wholly-owned subsidiary of the Adviser and an indirect subsidiary of Morgan Stanley, serves as the Company's Distributor of Fund shares pursuant to a Distribution Agreement. The Company has adopted a Shareholder Services Plan with respect to Class A shares pursuant to Rule 12b-1 under the Act. Under the Shareholder Services Plan, the Fund pays the Distributor a shareholder services fee, accrued daily and paid monthly, at an annual rate of 0.25% of the Fund's average daily net assets attributable to Class A shares.
17
Morgan Stanley Institutional Fund, Inc.
Annual Report — December 31, 2019
Notes to Financial Statements (cont'd)
The Company has adopted a Distribution and Shareholder Services Plan with respect to Class C shares pursuant to Rule 12b-1 under the Act. Under the Distribution and Shareholder Services Plan, the Fund pays the Distributor a distribution fee, accrued daily and paid monthly, at an annual rate of 0.75% and a shareholder services fee, accrued daily and paid monthly, at an annual rate of 0.25% of the Fund's average daily net assets attributable to Class C shares.
The distribution and shareholder services fees are used to support the expenses associated with servicing and maintaining accounts. The Distributor may compensate other parties for providing shareholder support services to investors who purchase Class A and Class C shares.
E. Dividend Disbursing and Transfer Agent: The Company's dividend disbursing and transfer agent is DST Asset Manager Solutions, Inc. ("DST"). Pursuant to a Transfer Agency Agreement, the Company pays DST a fee based on the number of classes, accounts and transactions relating to the Funds of the Company.
F. Custodian Fees: State Street (the "Custodian") also serves as Custodian for the Company in accordance with a Custodian Agreement. The Custodian holds cash, securities and other assets of the Company as required by the Act. Custody fees are payable monthly based on assets held in custody, investment purchases and sales activity and account maintenance fees, plus reimbursement for certain out-of-pocket expenses.
G. Security Transactions and Transactions with Affiliates: For the period ended December 31, 2019, purchases and sales of investment securities for the Fund, other than long-term U.S. Government securities and short-term investments were approximately $9,454,000 and $0, respectively. There were no purchases and sales of long-term U.S. Government securities for the period ended December 31, 2019.
The Fund invests in the Institutional Class of the Morgan Stanley Institutional Liquidity Funds — Treasury Securities Portfolio (the "Liquidity Funds"), an open-end management investment company managed by the Adviser. Advisory fees paid by the Fund are reduced by an amount equal to its pro-rata share of the advisory and administration fees paid by the Fund due to its investment in the Liquidity Funds. For the period ended December 31, 2019, advisory fees paid were reduced by less than $500 relating to the Fund's investment in the Liquidity Funds.
A summary of the Fund's transactions in shares of affiliated investments during the period ended December 31, 2019 is as follows:
Affiliated
Investment
Company | | Value
October 31,
2019
(000) | | Purchases
at Cost
(000) | | Proceeds
from Sales
(000) | | Dividend
Income
(000) | |
Liquidity Funds | | $ | — | | | $ | 8,651 | | | $ | 8,101 | | | $ | 3 | | |
Affiliated
Investment
Company (cont'd) | | Realized
Gain (Loss)
(000) | | Change in
Unrealized
Appreciation
(Depreciation)
(000) | | Value
December 31,
2019
(000) | |
Liquidity Funds | | $ | — | | | $ | — | | | $ | 550 | | |
The Fund is permitted to purchase and sell securities ("cross-trade") from and to other Morgan Stanley Funds as well as other funds and client accounts for which the Adviser or an affiliate of the Adviser serves as investment adviser, pursuant to procedures approved by the Directors in compliance with Rule 17a-7 under the Act (the "Rule"). Each cross-trade is executed at the current market price in compliance with provisions of the Rule. For the period ended December 31, 2019, the Fund did not engage in any cross-trade transactions.
The Fund has an unfunded Deferred Compensation Plan (the "Compensation Plan"), which allows each independent Director to defer payment of all, or a portion, of the fees he or she receives for serving on the Board of Directors. Each eligible Director generally may elect to have the deferred amounts credited with a return equal to the total return on one or more of the Morgan Stanley funds that are offered as investment options under the Compensation Plan. Appreciation/depreciation and distributions received from these investments are recorded with an offsetting increase/decrease in the deferred compensation obligation and do not affect the NAV of the Fund.
H. Federal Income Taxes: It is the Fund's intention to continue to qualify as a regulated investment company and distribute all of its taxable and tax-exempt income. Accordingly, no provision for federal income taxes is required in the financial statements.
The Fund may be subject to taxes imposed by countries in which it invests. Such taxes are generally based on income and/or capital gains earned or repatriated. Taxes are accrued based on net investment income, net realized gains and net unrealized appreciation as such income and/or gains are earned. Taxes may also be based on transactions in foreign currency and are accrued based on the value of investments denominated in such currency.
18
Morgan Stanley Institutional Fund, Inc.
Annual Report — December 31, 2019
Notes to Financial Statements (cont'd)
FASB ASC 740-10, "Income Taxes — Overall", sets forth a minimum threshold for financial statement recognition of the benefit of a tax position taken or expected to be taken in a tax return. Management has concluded there are no significant uncertain tax positions that would require recognition in the financial statements. If applicable, the Fund recognizes interest accrued related to unrecognized tax benefits in "Interest Expense" and penalties in "Other Expenses" in the Statement of Operations. The Fund files tax returns with the U.S. Internal Revenue Service, New York and various states. The tax year ended December 31, 2019 remains subject to examination by taxing authorities.
The tax character of distributions paid may differ from the character of distributions shown for GAAP purposes due to short-term capital gains being treated as ordinary income for tax purposes. There were no distributions paid during fiscal year 2019.
The amount and character of income and gains to be distributed are determined in accordance with income tax regulations which may differ from GAAP. These book/tax differences are either considered temporary or permanent in nature.
Temporary differences are attributable to differing book and tax treatments for the timing of the recognition of gains (losses) on certain investment transactions and the timing of the deductibility of certain expenses.
The Fund had no permanent differences causing reclassifications among the components of net assets for the year ended December 31, 2019.
At December 31, 2019, the components of distributable earnings for the Fund on a tax basis were as follows:
Undistributed
Ordinary
Income
(000) | | Undistributed
Long-Term
Capital Gain
(000) | |
| $ | 4 | | | | — | | |
I. Other: At December 31, 2019, the Fund did not have record owners of 10% or greater.
19
Morgan Stanley Institutional Fund, Inc.
Annual Report — December 31, 2019
Report of Independent Registered Public Accounting Firm
To the Shareholders and Board of Directors of
Morgan Stanley Institutional Fund, Inc. —
China Equity Portfolio
Opinion on the Financial Statements
We have audited the accompanying statement of assets and liabilities of China Equity Portfolio (the "Fund") (one of the funds constituting Morgan Stanley Institutional Fund, Inc. (the "Company")), including the portfolio of investments, as of December 31, 2019, and the related statements of operations and changes in net assets and the financial highlights for the period from October 31, 2019 (commencement of operations) through December 31, 2019 and the related notes (collectively referred to as the "financial statements"). In our opinion, the financial statements present fairly, in all material respects, the financial position of China Equity Portfolio (one of the funds constituting Morgan Stanley Institutional Fund, Inc.) at December 31, 2019, and the results of its operations, the changes in its net assets and its financial highlights for the period from October 31, 2019 (commencement of operations) through December 31, 2019, in conformity with U.S. generally accepted accounting principles.
Basis for Opinion
These financial statements are the responsibility of the Company's management. Our responsibility is to express an opinion on the Fund's financial statements based on our audit. We are a public accounting firm registered with the Public Company Accounting Oversight Board (United States) ("PCAOB") and are required to be independent with respect to the Company in accordance with the U.S. federal securities law and the applicable rules and regulations of the Securities and Exchange Commission and the PCAOB.
We conducted our audit in accordance with the standards of the PCAOB. Those standards require that we plan and perform the audit to obtain reasonable assurance about whether the financial statements are free of material misstatement, whether due to error or fraud. The Company is not required to have, nor were we engaged to perform, an audit of the Company's internal control over financial reporting. As part of our audit, we are required to obtain an understanding of internal control over financial reporting, but not for the purpose of expressing an opinion on the effectiveness of the Company's internal control over financial reporting. Accordingly, we express no such opinion.
Our audit included performing procedures to assess the risks of material misstatement of the financial statements, whether due to error or fraud, and performing procedures that respond to those risks. Such procedures included examining, on a test basis, evidence regarding the amounts and disclosures in the financial statements. Our procedures included confirmation of securities owned as of December 31, 2019 by correspondence with the custodian and others or by other appropriate auditing procedures where replies from others were not received. Our audit also included evaluating the accounting principles used and significant estimates made by management, as well as evaluating the overall presentation of the financial statements. We believe that our audit provides a reasonable basis for our opinion.

We have served as the auditor of one or more Morgan Stanley investment companies since 2000.
Boston, Massachusetts
February 27, 2020
20
Privacy Notice (unaudited) April 2019
FACTS | | WHAT DOES MSIM DO WITH YOUR PERSONAL INFORMATION? | |
Why? | | Financial companies choose how they share your personal information. Federal law gives consumers the right to limit some but not all sharing. Federal law also requires us to tell you how we collect, share, and protect your personal information. Please read this notice carefully to understand what we do. | |
What? | | The types of personal information we collect and share depend on the product or service you have with us. This information can include:
n Social Security number and income
n investment experience and risk tolerance
n checking account number and wire transfer instructions | |
How? | | All financial companies need to share customers' personal information to run their everyday business. In the section below, we list the reasons financial companies can share their customers' personal information; the reasons MSIM chooses to share; and whether you can limit this sharing. | |
Reasons we can share your personal information | | Does MSIM share? | | Can you limit this sharing? | |
For our everyday business purposes —
such as to process your transactions, maintain your account(s), respond to court orders and legal investigations, or report to credit bureaus | | Yes | | No | |
For our marketing purposes —
to offer our products and services to you | | Yes | | No | |
For joint marketing with other financial companies | | No | | We don't share | |
For our affiliates' everyday business purposes —
information about your transactions and experiences | | Yes | | No | |
For our affiliates' everyday business purposes —
information about your creditworthiness | | No | | We don't share | |
For our affiliates to market to you | | No | | We don't share | |
For non-affiliates to market to you | | No | | We don't share | |
Questions? Call toll-free (844) 312-6327 or email: imprivacyinquiries@morganstanley.com
21
Privacy Notice (unaudited) (cont'd) April 2019
Who we are
Who is providing this notice? | | Morgan Stanley Investment Management, Inc. and its affiliated registered investment advisers, registered broker-dealers, and registered and unregistered funds ("MSIM") | |
What we do
How does MSIM protect my personal information? | | To protect your personal information from unauthorized access and use, we use security measures that comply with federal law. These measures include computer safeguards and secured files and buildings. We have policies governing the proper handling of customer information by personnel and requiring third parties that provide support to adhere to appropriate security standards with respect to such information. | |
How does MSIM collect my personal information? | | We collect your personal information, for example, when you
n open an account or make deposits or withdrawals from your account
n buy securities from us or make a wire transfer
n give us your contact information
We also collect your personal information from others, such as credit bureaus, affiliates, or other companies. | |
Why can't I limit all sharing? | | Federal law gives you the right to limit only
n sharing for affiliates' everyday business purposes — information about your creditworthiness
n affiliates from using your information to market to you
n sharing for non-affiliates to market to you
State laws and individual companies may give you additional rights to limit sharing. See below for more on your rights under state law. | |
Definitions
Affiliates | | Companies related by common ownership or control. They can be financial and non-financial companies.
n Our affiliates include companies with a Morgan Stanley name and financial companies such as Morgan Stanley Smith Barney LLC and Morgan Stanley & Co. | |
Non-affiliates | | Companies not related by common ownership or control. They can be financial and non-financial companies.
n MSIM does not share with non-affiliates so they can market to you. | |
Joint marketing | | A formal agreement between non-affiliated financial companies that together market financial products or services to you.
n MSIM doesn't jointly market | |
Other Important Information
Vermont: Except as permitted by law, we will not share personal information we collect about Vermont residents with Non-affiliates unless you provide us with your written consent to share such information.
California: Except as permitted by law, we will not share personal information we collect about California residents with Non-affiliates and we will limit sharing such personal information with our Affiliates to comply with California privacy laws that apply to us.
22
Morgan Stanley Institutional Fund, Inc.
Annual Report — December 31, 2019
Director and Officer Information (unaudited)
Independent Directors:
Name, Birth Year
and Address of
Independent Director | | Position(s)
Held with
Registrant | | Length of Time
Served* | | Principal Occupation(s) During Past 5 Years
and Other Relevant Professional Experience | | Number of
Funds in
Fund Complex
Overseen by
Independent
Director** | | Other Directorships
Held by Independent
Director*** | |
Frank L. Bowman
c/o Perkins Coie LLP
Counsel to the Independent Directors
1155 Avenue of the Americas
New York, NY 10036
Birth Year 1944 | | Director | | Since
August 2006 | | President, Strategic Decisions, LLC (consulting) (since February 2009); Director or Trustee of various Morgan Stanley Funds (since August 2006); Chairperson of the Compliance and Insurance Committee (since October 2015); formerly, Chairperson of the Insurance Sub-Committee of the Compliance and Insurance Committee (2007-2015); served as President and Chief Executive Officer of the Nuclear Energy Institute (policy organization) (February 2005-November 2008); retired as Admiral, U.S. Navy after serving over 38 years on active duty including 8 years as Director of the Naval Nuclear Propulsion Program in the Department of the Navy and the U.S. Department of Energy (1996-2004); served as Chief of Naval Personnel (July 1994-September 1996) and on the Joint Staff as Director of Political Military Affairs (June 1992-July 1994); knighted as Honorary Knight Commander of the Most Excellent Order of the British Empire; awarded the Officier de l'Orde National du Mérite by the French Government; elected to the National Academy of Engineering (2009). | | | 86 | | | Director of Naval and Nuclear Technologies LLP; Director Emeritus of the Armed Services YMCA; Member of the National Security Advisory Council of the Center for U.S. Global Engagement and a member of the CNA Military Advisory Board; Trustee of Fairhaven United Methodist Church; Member of the Board of Advisors of the Dolphin Scholarship Foundation; Director of other various non-profit organizations; formerly, Director of BP p.l.c. (November 2010-May 2019). | |
Kathleen A. Dennis
c/o Perkins Coie LLP
Counsel to the Independent Directors
1155 Avenue of the Americas
New York, NY 10036
Birth Year 1953 | | Director | | Since August 2006 | | President, Cedarwood Associates (mutual fund and investment management consulting) (since July 2006); Chairperson of the Liquidity and Alternatives Sub-Committee of the Investment Committee (since October 2006) and Director or Trustee of various Morgan Stanley Funds (since August 2006); formerly, Senior Managing Director of Victory Capital Management (1993-2006). | | | 86 | | | Director of various non-profit organizations. | |
Nancy C. Everett
c/o Perkins Coie LLP
Counsel to the Independent Directors
1155 Avenue of the Americas
New York, NY 10036
Birth Year 1955 | | Director | | Since January 2015 | | Chief Executive Officer, Virginia Commonwealth University Investment Company (since November 2015); Owner, OBIR, LLC (institutional investment management consulting) (since June 2014); formerly, Managing Director, BlackRock, Inc. (February 2011-December 2013); and Chief Executive Officer, General Motors Asset Management (a/k/a Promark Global Advisors, Inc.) (June 2005-May 2010). | | | 87 | | | Formerly, Member of Virginia Commonwealth University School of Business Foundation (2005-2016); Member of Virginia Commonwealth University Board of Visitors (2013-2015); Member of Committee on Directors for Emerging Markets Growth Fund, Inc. (2007-2010); Chairperson of Performance Equity Management, LLC (2006-2010); and Chairperson, GMAM Absolute Return Strategies Fund, LLC (2006-2010). | |
23
Morgan Stanley Institutional Fund, Inc.
Annual Report — December 31, 2019
Director and Officer Information (unaudited) (cont'd)
Independent Directors: (cont'd)
Name, Birth Year
and Address of
Independent Director | | Position(s)
Held with
Registrant | | Length of Time
Served* | | Principal Occupation(s) During Past 5 Years
and Other Relevant Professional Experience | | Number of
Funds in
Fund Complex
Overseen by
Independent
Director** | | Other Directorships
Held by Independent
Director*** | |
Jakki L. Haussler
c/o Perkins Coie LLP
Counsel to the Independent Directors
1155 Avenue of the Americas
New York, NY 10036
Birth Year 1957 | | Director | | Since January 2015 | | Chairman, Opus Capital Group (since 1996); formerly, Chief Executive Officer, Opus Capital Group (1996-2019); Director, Capvest Venture Fund, LP (May 2000-December 2011); Partner, Adena Ventures, LP (July 1999-December 2010); Director, The Victory Funds (February 2005-July 2008). | | | 87 | | | Director of Service Corporation International and Member, Audit Committee and Investment Committee; Director of Cincinnati Bell Inc. and Member, Audit Committee and Governance and Nominating Committee; Chairman of Northern Kentucky University Member Investment Committee; Member of Chase College of Law Transactional Law Practice Center Board of Advisors; Director of Best Transport; Director of Chase College of Law Board of Visitors; formerly, Member, University of Cincinnati Foundation Investment Committee; Member, Miami University Board of Visitors (2008-2011); Trustee of Victory Funds (2005-2008) and Chairman, Investment Committee (2007-2008) and Member, Service Provider Committee (2005-2008). | |
Dr. Manuel H. Johnson
c/o Johnson Smick International, Inc.
220 I Street, NE — Suite 200
Washington, D.C. 20002
Birth Year 1949 | | Director | | Since July 1991 | | Senior Partner, Johnson Smick International, Inc. (consulting firm); Chairperson of the Investment Committee (since October 2006) and Director or Trustee of various Morgan Stanley Funds (since July 1991); Co-Chairman and a founder of the Group of Seven Council (G7C) (international economic commission); formerly, Chairperson of the Audit Committee (July 1991-September 2006), Vice Chairman of the Board of Governors of the Federal Reserve System and Assistant Secretary of the U.S. Treasury. | | | 86 | | | Director of NVR, Inc. (home construction). | |
Joseph J. Kearns
c/o Perkins Coie LLP
Counsel to the Independent Directors
1155 Avenue of the Americas
New York, NY 10036
Birth Year 1942 | | Director | | Since August 1994 | | Senior Adviser, Kearns & Associates LLC (investment consulting); Chairperson of the Audit Committee (since October 2006) and Director or Trustee of various Morgan Stanley Funds (since August 1994); formerly, Deputy Chairperson of the Audit Committee (July 2003-September 2006) and Chairperson of the Audit Committee of various Morgan Stanley Funds (since August 1994); CFO of the J. Paul Getty Trust. | | | 87 | | | Prior to August 10, 2016, Director of Electro Rent Corporation (equipment leasing); Prior to December 31, 2013, Director of The Ford Family Foundation. | |
24
Morgan Stanley Institutional Fund, Inc.
Annual Report — December 31, 2019
Director and Officer Information (unaudited) (cont'd)
Independent Directors: (cont'd)
Name, Birth Year
and Address of
Independent Director | | Position(s)
Held with
Registrant | | Length of Time
Served* | | Principal Occupation(s) During Past 5 Years
and Other Relevant Professional Experience | | Number of
Funds in
Fund Complex
Overseen by
Independent
Director** | | Other Directorships
Held by Independent
Director*** | |
Michael F. Klein
c/o Perkins Coie LLP
Counsel to the Independent Directors
1155 Avenue of the Americas
New York, NY 10036
Birth Year 1958 | | Director | | Since August 2006 | | Managing Director, Aetos Alternatives Management, LP (since March 2000); Co-President, Aetos Alternatives Management, LP (since January 2004) and Co-Chief Executive Officer of Aetos Alternatives Management, LP (since August 2013); Chairperson of the Fixed Income Sub-Committee of the Investment Committee (since October 2006) and Director or Trustee of various Morgan Stanley Funds (since August 2006); formerly, Managing Director, Morgan Stanley & Co. Inc. and Morgan Stanley Dean Witter Investment Management and President, various Morgan Stanley Funds (June 1998-March 2000); Principal, Morgan Stanley & Co. Inc. and Morgan Stanley Dean Witter Investment Management (August 1997-December 1999). | | | 86 | | | Director of certain investment funds managed or sponsored by Aetos Alternatives Management, LP; Director of Sanitized AG and Sanitized Marketing AG (specialty chemicals). | |
Patricia Maleski
c/o Perkins Coie LLP
Counsel to the Independent Directors
1155 Avenue of the Americas
New York, NY 10036
Birth Year 1960 | | Director | | Since January 2017 | | Managing Director, JPMorgan Asset Management (2004-2016); Oversight and Control Head of Fiduciary and Conflicts of Interest Program (2015-2016); Chief Control Officer-Global Asset Management (2013-2015); President, JPMorgan Funds (2010-2013); Chief Administrative Officer (2004-2013); various other positions including Treasurer and Board Liaison (since 2001). | | | 87 | | | None. | |
Michael E. Nugent
522 Fifth Avenue
New York, NY 10036
Birth Year 1936 | | Chair of the Board and Director | | Chair of the Boards since July 2006 and Director since July 1991 | | Chair of the Boards of various Morgan Stanley Funds (since July 2006); Chairperson of the Governance Committee (since January 2019) and Director or Trustee of various Morgan Stanley Funds (since July 1991); formerly, Chairperson of each of the Closed-End Fund committee (until December 2019) and the Insurance Committee (until July 2006); General Partner, Triumph Capital, L.P. (private investment partnership) (1988-2013). | | | 86 | | | None. | |
W. Allen Reed
c/o Perkins Coie LLP
Counsel to the Independent Directors
1155 Avenue of the Americas
New York, NY 10036
Birth Year 1947 | | Vice Chair of the Board and Director | | Vice Chair of the Boards since January 2020 and Director since August 2006 | | Chairperson of the Equity Sub-Committee of the Investment Committee (since October 2006) and Director or Trustee of various Morgan Stanley Funds (since August 2006); formerly, President and CEO of General Motors Asset Management; Chairman and Chief Executive Officer of the GM Trust Bank and Corporate Vice President of General Motors Corporation (August 1994-December 2005). | | | 86 | | | Formerly, Director of Legg Mason, Inc.; formerly, Director of the Auburn University Foundation (2010-2015). | |
* This is the earliest date the Director began serving the Morgan Stanley Funds. Each Director serves an indefinite term, until his or her successor is elected.
** The Fund Complex includes (as of December 31, 2019) all open-end and closed-end funds (including all of their portfolios) advised by Morgan Stanley Investment Management Inc. (the "Adviser") and any funds that have an adviser that is an affiliated person of the Adviser (including, but not limited to, Morgan Stanley AIP GP LP).
*** This includes any directorships at public companies and registered investment companies held by the Director at any time during the past five years.
25
Morgan Stanley Institutional Fund, Inc.
Annual Report — December 31, 2019
Director and Officer Information (unaudited) (cont'd)
Executive Officers:
Name, Birth Year and Address of
Executive Officer | | Position(s) Held
with
Registrant | | Length of
Time Served* | | Principal Occupation(s) During Past 5 Years | |
John H. Gernon
522 Fifth Avenue
New York, NY 10036
Birth Year 1963 | | President and Principal Executive Officer | | Since September 2013 | | President and Principal Executive Officer of the Equity and Fixed Income Funds and the Morgan Stanley AIP Funds (since September 2013) and the Liquidity Funds and various money market funds (since May 2014) in the Fund Complex; Managing Director of the Adviser; Head of Product (since 2006). | |
Timothy J. Knierim
522 Fifth Avenue
New York, NY 10036
Birth Year 1959 | | Chief Compliance Officer | | Since December 2016 | | Managing Director of the Adviser and various entities affiliated with the Adviser; Chief Compliance Officer of various Morgan Stanley Funds and the Adviser (since December 2016) and Chief Compliance Officer of Morgan Stanley AIP GP LP (since 2014). Formerly, Managing Director and Deputy Chief Compliance Officer of the Adviser (2014-2016); and formerly, Chief Compliance Officer of Prudential Investment Management, Inc. (2007-2014). | |
Francis J. Smith
522 Fifth Avenue
New York, NY 10036
Birth Year 1965 | | Treasurer and Principal Financial Officer | | Treasurer since July 2003 and Principal Financial Officer since September 2002 | | Managing Director of the Adviser and various entities affiliated with the Adviser; Treasurer (since July 2003) and Principal Financial Officer of various Morgan Stanley Funds (since September 2002). | |
Mary E. Mullin
522 Fifth Avenue
New York, NY 10036
Birth Year 1967 | | Secretary | | Since June 1999 | | Managing Director of the Adviser; Secretary of various Morgan Stanley Funds (since June 1999). | |
Michael J. Key
522 Fifth Avenue
New York, NY 10036
Birth Year 1979 | | Vice President | | Since June 2017 | | Vice President of the Equity and Fixed Income Funds, Liquidity Funds, various money market funds and the Morgan Stanley AIP Funds in the Fund Complex (since June 2017); Executive Director of the Adviser; Head of Product Development for Equity and Fixed Income Funds (since August 2013). | |
* This is the earliest date the officer began serving the Morgan Stanley Funds. Each officer serves a one-year term, until his or her successor is elected and qualifies.
26
Morgan Stanley Institutional Fund, Inc.
Annual Report — December 31, 2019
Adviser and Administrator
Morgan Stanley Investment Management Inc.
522 Fifth Avenue
New York, New York 10036
Distributor
Morgan Stanley Distribution, Inc.
522 Fifth Avenue
New York, New York 10036
Dividend Disbursing and Transfer Agent
DST Asset Manager Solutions, Inc.
2000 Crown Colony Drive
Quincy, Massachusetts 02169
Custodian
State Street Bank and Trust Company
One Lincoln Street
Boston, Massachusetts 02111
Legal Counsel
Dechert LLP
1095 Avenue of the Americas
New York, New York 10036
Counsel to the Independent Directors
Perkins Coie LLP
1155 Avenue of the Americas
New York, New York 10036
Independent Registered Public Accounting Firm
Ernst & Young LLP
200 Clarendon Street
Boston, Massachusetts 02116
Reporting to Shareholders
Each Morgan Stanley fund provides a complete schedule of portfolio holdings in its Semi-Annual and the Annual Reports within 60 days of the end of the fund's second and fourth fiscal quarters. The Semi-Annual and Annual Reports are filed electronically with the Securities and Exchange Commission ("SEC") on Form N-CSRS and Form N-CSR, respectively. Morgan Stanley also delivers the Semi-Annual and Annual Reports to fund shareholders and makes these reports available on its public website, www.morganstanley.com/im/shareholderreports. Each Morgan Stanley non-money market fund also files a complete schedule of portfolio holdings with the SEC for the fund's first and third fiscal quarters as an attachment to Form N-PORT. Morgan Stanley does not deliver the reports for the first and third fiscal quarters to shareholders, nor are the reports posted to the Morgan Stanley public website. However, the holdings for each money market fund are posted to the Morgan Stanley public website. You may obtain the Form N-PORT filings (as well as the Form N-CSR and N-CSRS filings) by accessing the SEC's website, www.sec.gov. You can also request copies of these materials, upon payment of a duplicating fee, by electronic request at the SEC's email address (publicinfo@sec.gov).
Proxy Voting Policies and Procedures and Proxy Voting Record
You may obtain a copy of the Company's Proxy Voting Policy and Procedures and information regarding how the Company voted proxies relating to portfolio securities during the most recent twelve-month period ended June 30, without charge, upon request, by calling toll free 1 (800) 548-7786 or by visiting our website at www.morganstanley.com/im/shareholderreports. This information is also available on the SEC's website at www.sec.gov.
This report is authorized for distribution only when preceded or accompanied by a prospectus or summary prospectus of the applicable fund of Morgan Stanley Institutional Fund, Inc., which describes in detail the fund's investment policies, risks, fees and expenses. Please read the prospectus carefully before you invest or send money. For additional information, including information regarding the investments comprising the Fund, please visit our website at www.morganstanley.com/im/shareholderreports or call toll free 1 (800) 548-7786.
27
Printed in U.S.A.
This Report has been prepared for shareholders and may be distributed to others only if preceded or accompanied by a current prospectus.
Morgan Stanley Investment Management Inc.
522 Fifth Avenue
New York, New York 10036
© 2020 Morgan Stanley. Morgan Stanley Distribution, Inc.

IFICEQANN
2907068 EXP. 02.28.21
Item 2. Code of Ethics.
(a) The registrant has adopted a code of ethics (the “Code of Ethics”) that applies to its principal executive officer, principal financial officer, principal accounting officer or controller, or persons performing similar functions, regardless of whether these individuals are employed by the registrant or a third party.
(b) No information need be disclosed pursuant to this paragraph.
(c) Not applicable.
(d) Not applicable.
(e) Not applicable.
(f)
(1) The registrant’s Code of Ethics is attached hereto as Exhibit 13 A.
(2) Not applicable.
(3) Not applicable.
Item 3. Audit Committee Financial Expert.
The registrant’s Board of Directors has determined that Joseph J. Kearns, an “independent” Trustee, is an “audit committee financial expert” serving on its audit committee. Under applicable securities laws, a person who is determined to be an audit committee financial expert will not be deemed an “expert” for any purpose, including without limitation for the purposes of Section 11 of the Securities Act of 1933, as a result of being designated or identified as an audit committee financial expert. The designation or identification of a person as an audit committee financial expert does not impose on such person any duties, obligations, or liabilities that are greater than the duties, obligations, and liabilities imposed on such person as a member of the audit committee and Board of Directors in the absence of such designation or identification.
Item 4. Principal Accountant Fees and Services.
(a)(b)(c)(d) and (g). Based on fees billed for the periods shown:
2019
| | Registrant | | Covered Entities(1) | |
Audit Fees | | $ | 1,501,837 | | N/A | |
| | | | | |
Non-Audit Fees | | | | | |
Audit-Related Fees | | $ | — | (2) | $ | — | (2) |
Tax Fees | | $ | 163,394 | (3) | $ | 535,939 | (4) |
All Other Fees | | $ | — | | $ | 30,000 | (5) |
Total Non-Audit Fees | | $ | 163,394 | | $ | 565,939 | |
| | | | | |
Total | | $ | 1,665,231 | | $ | 565,939 | |
2018
| | Registrant | | Covered Entities(1) | |
Audit Fees | | $ | 1,340,837 | | N/A | |
| | | | | |
Non-Audit Fees | | | | | |
Audit-Related Fees | | $ | — | (2) | $ | — | (2) |
Tax Fees | | $ | 158,795 | (3) | $ | 8,773,935 | (4) |
All Other Fees | | $ | — | | $ | 18,115 | (5) |
Total Non-Audit Fees | | $ | 158,795 | | $ | 8,792,050 | |
| | | | | |
Total | | $ | 1,499,632 | | $ | 8,792,050 | |
N/A- Not applicable, as not required by Item 4.
(1) Covered Entities include the Adviser (excluding sub-advisors) and any entity controlling, controlled by or under common control with the Adviser that provides ongoing services to the Registrant.
(2) Audit-Related Fees represent assurance and related services provided that are reasonably related to the performance of the audit of the financial statements of the Covered Entities’ and funds advised by the Adviser or its affiliates, specifically data verification and agreed-upon procedures related to asset securitizations and agreed-upon procedures engagements.
(3) Tax Fees represent tax compliance, tax planning and tax advice services provided in connection with the preparation and review of the Registrant’s tax returns.
(4) Tax Fees represent tax compliance, tax planning and tax advice services provided in connection with the review of Covered Entities’ tax returns.
(5) All other fees represent project management for future business applications and improving business and operational processes.
(e)(1) The audit committee’s pre-approval policies and procedures are as follows:
APPENDIX A
AUDIT COMMITTEE
AUDIT AND NON-AUDIT SERVICES
PRE-APPROVAL POLICY AND PROCEDURES
OF THE
MORGAN STANLEY FUNDS
AS ADOPTED AND AMENDED JULY 23, 2004 AND JUNE 15 AND 16, 2016(3)
1. Statement of Principles
The Audit Committee of the Board is required to review and, in its sole discretion, pre-approve all Covered Services to be provided by the Independent Auditors to the Fund and Covered Entities in order to assure that services performed by the Independent Auditors do not impair the auditor’s independence from the Fund.
The SEC has issued rules specifying the types of services that an independent auditor may not provide to its audit client, as well as the audit committee’s administration of the engagement of the independent auditor. The SEC’s rules establish two different approaches to pre-approving services, which the SEC considers to be equally valid. Proposed services either: may be pre-approved without consideration of specific case-by-case services by the Audit Committee (“general pre-approval”); or require the specific pre-approval of the Audit Committee or its delegate (“specific pre-approval”). The Audit Committee believes that the combination of these two approaches in this Policy will result in an effective and efficient procedure to pre-approve services performed by the Independent Auditors. As set forth in this Policy, unless a type of service has received general pre-approval, it will require specific pre-approval by the Audit Committee (or by any member of the Audit Committee to which pre-approval authority has been delegated) if it is to be provided by the Independent Auditors. Any proposed services exceeding pre-approved cost levels or budgeted amounts will also require specific pre-approval by the Audit Committee.
The appendices to this Policy describe the Audit, Audit-related, Tax and All Other services that have the general pre-approval of the Audit Committee. The term of any general pre-approval is 12 months from the date of pre-approval, unless the Audit Committee considers and provides a different period and states otherwise. The Audit Committee will annually review and pre-approve the services that may be provided by the Independent Auditors without obtaining specific pre-approval from the Audit Committee. The Audit Committee will add to or subtract from the list of general pre-approved services from time to time, based on subsequent determinations.
The purpose of this Policy is to set forth the policy and procedures by which the Audit Committee intends to fulfill its responsibilities. It does not delegate the Audit Committee’s responsibilities to pre-approve services performed by the Independent Auditors to management.
The Fund’s Independent Auditors have reviewed this Policy and believes that implementation of the Policy will not adversely affect the Independent Auditors’ independence.
(3) This Audit Committee Audit and Non-Audit Services Pre-Approval Policy and Procedures (the “Policy”), adopted as of the date above, supersedes and replaces all prior versions that may have been adopted from time to time.
2. Delegation
As provided in the Act and the SEC’s rules, the Audit Committee may delegate either type of pre-approval authority to one or more of its members. The member to whom such authority is delegated must report, for informational purposes only, any pre-approval decisions to the Audit Committee at its next scheduled meeting.
3. Audit Services
The annual Audit services engagement terms and fees are subject to the specific pre-approval of the Audit Committee. Audit services include the annual financial statement audit and other procedures required to be performed by the Independent Auditors to be able to form an opinion on the Fund’s financial statements. These other procedures include information systems and procedural reviews and testing performed in order to understand and place reliance on the systems of internal control, and consultations relating to the audit. The Audit Committee will approve, if necessary, any changes in terms, conditions and fees resulting from changes in audit scope, Fund structure or other items.
In addition to the annual Audit services engagement approved by the Audit Committee, the Audit Committee may grant general pre-approval to other Audit services, which are those services that only the Independent Auditors reasonably can provide. Other Audit services may include statutory audits and services associated with SEC registration statements (on Forms N-1A, N-2, N-3, N-4, etc.), periodic reports and other documents filed with the SEC or other documents issued in connection with securities offerings.
The Audit Committee has pre-approved the Audit services in Appendix B.1. All other Audit services not listed in Appendix B.1 must be specifically pre-approved by the Audit Committee (or by any member of the Audit Committee to which pre-approval has been delegated).
4. Audit-related Services
Audit-related services are assurance and related services that are reasonably related to the performance of the audit or review of the Fund’s financial statements and, to the extent they are Covered Services, the Covered Entities or that are traditionally performed by the Independent Auditors. Because the Audit Committee believes that the provision of Audit-related services does not impair the independence of the auditor and is consistent with the SEC’s rules on auditor independence, the Audit Committee may grant general pre-approval to Audit-related services. Audit-related services include, among others, accounting consultations related to accounting, financial reporting or disclosure matters not classified as “Audit services”; assistance with understanding and implementing new accounting and financial reporting guidance from rulemaking authorities; agreed-upon or expanded audit procedures related to accounting and/or billing records required to respond to or comply with financial, accounting or regulatory reporting matters; and assistance with internal control reporting requirements under Forms N-CEN and/or N-CSR.
The Audit Committee has pre-approved the Audit-related services in Appendix B.2. All other Audit-related services not listed in Appendix B.2 must be specifically pre-approved by the Audit Committee (or by any member of the Audit Committee to which pre-approval has been delegated).
5. Tax Services
The Audit Committee believes that the Independent Auditors can provide Tax services to the Fund and, to the extent they are Covered Services, the Covered Entities, such as tax compliance, tax planning and tax advice without impairing the auditor’s independence, and the SEC has stated that the Independent Auditors may provide such services.
Pursuant to the preceding paragraph, the Audit Committee has pre-approved the Tax Services in Appendix B.3. All Tax services in Appendix B.3 must be specifically pre-approved by the Audit Committee (or by any member of the Audit Committee to which pre-approval has been delegated).
6. All Other Services
The Audit Committee believes, based on the SEC’s rules prohibiting the Independent Auditors from providing specific non-audit services, that other types of non-audit services are permitted. Accordingly, the Audit Committee believes it may grant general pre-approval to those permissible non-audit services classified as All Other services that it believes are routine and recurring services, would not impair the independence of the auditor and are consistent with the SEC’s rules on auditor independence.
The Audit Committee has pre-approved the All Other services in Appendix B.4. Permissible All Other services not listed in Appendix B.4 must be specifically pre-approved by the Audit Committee (or by any member of the Audit Committee to which pre-approval has been delegated).
7. Pre-Approval Fee Levels or Budgeted Amounts
Pre-approval fee levels or budgeted amounts for all services to be provided by the Independent Auditors will be established annually by the Audit Committee. Any proposed services exceeding these levels or amounts will require specific pre-approval by the Audit Committee. The Audit Committee is mindful of the overall relationship of fees for audit and non-audit services in determining whether to pre-approve any such services.
8. Procedures
All requests or applications for services to be provided by the Independent Auditors that do not require specific approval by the Audit Committee will be submitted to the Fund’s Principal Financial and Accounting Officer and must include a detailed description of the services to be rendered. The Fund’s Principal Financial and Accounting Officer will determine whether such services are included within the list of services that have received the general pre-approval of the Audit Committee. The Audit Committee will be informed on a timely basis of any such services rendered by the Independent Auditors. Requests or applications to provide services that require specific approval by the Audit Committee or Chairman of the Audit Committee will be submitted to the Audit Committee by the Fund’s Principal Financial and Accounting Officer,
who, after consultation with the Independent Auditors, will discuss whether, the request or application is consistent with the SEC’s rules on auditor independence.
The Audit Committee has designated the Fund’s Principal Financial and Accounting Officer to monitor the performance of all services provided by the Independent Auditors and to determine whether such services are in compliance with this Policy. The Fund’s Principal Financial and Accounting Officer will report to the Audit Committee on a periodic basis on the results of its monitoring. Both the Fund’s Principal Financial and Accounting Officer and management will immediately report to the chairman of the Audit Committee any breach of this Policy that comes to the attention of the Fund’s Principal Financial and Accounting Officer or any member of management.
9. Additional Requirements
The Audit Committee has determined to take additional measures on an annual basis to meet its responsibility to oversee the work of the Independent Auditors and to assure the auditor’s independence from the Fund, such as reviewing a formal written statement from the Independent Auditors delineating all relationships between the Independent Auditors and the Fund, consistent with the PCAOB’s Ethics and Independence Rule 3526, and discussing with the Independent Auditors its methods and procedures for ensuring independence.
10. Covered Entities
Covered Entities include the Fund’s investment adviser(s) and any entity controlling, controlled by or under common control with the Fund’s investment adviser(s) that provides ongoing services to the Fund(s). Beginning with non-audit service contracts entered into on or after May 6, 2003, the Fund’s audit committee must pre-approve non-audit services provided not only to the Fund but also to the Covered Entities if the engagements relate directly to the operations and financial reporting of the Fund. This list of Covered Entities would include:
Morgan Stanley Funds
Morgan Stanley & Co. LLC
Morgan Stanley Investment Management Inc.
Morgan Stanley Investment Management Limited
Morgan Stanley Investment Management Private Limited
Morgan Stanley Asset & Investment Trust Management Co., Limited
Morgan Stanley Investment Management Company
Morgan Stanley Services Company, Inc.
Morgan Stanley Distribution, Inc.
Morgan Stanley AIP GP LP
Morgan Stanley Alternative Investment Partners LP
Morgan Stanley Smith Barney LLC
Morgan Stanley Capital Management LLC
Morgan Stanley Asia Limited
(e)(2) Beginning with non-audit service contracts entered into on or after May 6, 2003, the audit committee also is required to pre-approve services to Covered Entities to the extent that the services are determined to have a direct impact on the operations or financial reporting of the
Registrant. 100% of such services were pre-approved by the audit committee pursuant to the Audit Committee’s pre-approval policies and procedures (attached hereto).
(f) Not applicable.
(g) See table above.
(h) The audit committee of the Board of Directors has considered whether the provision of services other than audit services performed by the auditors to the Registrant and Covered Entities is compatible with maintaining the auditors’ independence in performing audit services.
Item 5. Audit Committee of Listed Registrants.
(a) The registrant has a separately-designated standing audit committee established in accordance with Section 3(a)(58)(A) of the Exchange Act whose members are:
Joseph J. Kearns, Jakki L. Haussler, Michael F. Klein and W. Allen Reed.
(b) Not applicable.
Item 6. Schedule of Investments
(a) Refer to Item 1.
(b) Not applicable.
Item 7. Disclosure of Proxy Voting Policies and Procedures for Closed-End Management Investment Companies.
Applicable only to reports filed by closed-end funds.
Item 8. Portfolio Managers of Closed-End Management Investment Companies
Applicable only to reports filed by closed-end funds.
Item 9. Closed-End Fund Repurchases
Applicable only to reports filed by closed-end funds.
Item 10. Submission of Matters to a Vote of Security Holders
There have been no material changes to the procedures by which shareholders may recommend nominee to the Fund’s Board of Directors since the Fund last provided disclosure in response to this item.
Item 11. Controls and Procedures
(a) The registrant’s principal executive officer and principal financial officer have concluded that the registrant’s disclosure controls and procedures are sufficient to ensure that information required to be disclosed by the registrant in this Form N-CSR was recorded, processed, summarized and reported within the time periods specified in the Securities and Exchange Commission’s rules and forms, based upon such officers’ evaluation of these controls and procedures as of a date within 90 days of the filing date of the report.
(b) There were no changes in the registrant’s internal control over financial reporting that occurred during the second fiscal quarter of the period covered by this report that has materially affected, or is reasonably likely to materially affect, the registrant’s internal control over financial reporting.
Item 12. Disclosure of Securities Lending Activities for Closed End Management Investment Companies.
Not Applicable
Item 13. Exhibits
(a) The Code of Ethics for Principal Executive and Senior Financial Officers is attached hereto.
(b) A separate certification for each principal executive officer and principal financial officer of the registrant are attached hereto as part of EX-99.CERT.
SIGNATURES
Pursuant to the requirements of the Securities Exchange Act of 1934 and the Investment Company Act of 1940, the registrant has duly caused this report to be signed on its behalf by the undersigned, thereunto duly authorized.
Morgan Stanley Institutional Fund, Inc. | |
| |
/s/ John H. Gernon | |
John H. Gernon | |
Principal Executive Officer | |
February 18, 2020 | |
Pursuant to the requirements of the Securities Exchange Act of 1934 and the Investment Company Act of 1940, this report has been signed by the following persons on behalf of the registrant and in the capacities and on the dates indicated.
/s/ John H. Gernon | |
John H. Gernon | |
Principal Executive Officer | |
February 18, 2020 | |
| |
/s/ Francis Smith | |
Francis Smith | |
Principal Financial Officer | |
February 18, 2020 | |