UNITED STATES
SECURITIES AND EXCHANGE COMMISSION
Washington, D.C. 20549
FORM N-CSR
CERTIFIED SHAREHOLDER REPORT OF REGISTERED
MANAGEMENT INVESTMENT COMPANIES
Investment Company Act file number | 811-05624 |
|
Morgan Stanley Institutional Fund, Inc. |
(Exact name of registrant as specified in charter) |
|
522 Fifth Avenue, New York, New York | | 10036 |
(Address of principal executive offices) | | (Zip code) |
|
John H. Gernon 522 Fifth Avenue, New York, New York 10036 |
(Name and address of agent for service) |
|
Registrant’s telephone number, including area code: | 212-296-0289 | |
|
Date of fiscal year end: | December 31, | |
|
Date of reporting period: | December 31, 2016 | |
| | | | | | | | |
Item 1 - Report to Shareholders

Morgan Stanley Institutional Fund, Inc.
Active International Allocation Portfolio
Annual Report
December 31, 2016

Morgan Stanley Institutional Fund, Inc.
Annual Report — December 31, 2016
Shareholders' Letter | | | 2 | | |
Expense Example | | | 3 | | |
Investment Overview | | | 4 | | |
Portfolio of Investments | | | 7 | | |
Statement of Assets and Liabilities | | | 18 | | |
Statement of Operations | | | 20 | | |
Statements of Changes in Net Assets | | | 21 | | |
Financial Highlights | | | 23 | | |
Notes to Financial Statements | | | 27 | | |
Report of Independent Registered Public Accounting Firm | | | 39 | | |
Federal Tax Notice | | | 40 | | |
Privacy Notice | | | 41 | | |
Director and Officer Information | | | 44 | | |
This report is authorized for distribution only when preceded or accompanied by a prospectus or summary prospectus of the applicable Portfolio of Morgan Stanley Institutional Fund, Inc. To receive a prospectus and/or statement of additional information (SAI), which contains more complete information such as investment objectives, charges, expenses, policies for voting proxies, risk considerations, and describes in detail each of the Portfolio's investment policies to the prospective investor, please call toll free 1 (800) 548-7786. Please read the prospectuses carefully before you invest or send money.
Additionally, you can access information about the Portfolio, including performance, characteristics, and investment team commentary, through Morgan Stanley Investment Management's website: www.morganstanley.com/im.
Market forecasts provided in this report may not necessarily come to pass. There is no guarantee that any sectors mentioned will continue to perform as discussed herein or that securities in such sectors will be held by the Portfolio in the future. There is no assurance that a Portfolio will achieve its investment objective. Portfolios are subject to market risk, which is the possibility that market values of securities owned by the Portfolio will decline and, therefore, the value of the Portfolio's shares may be less than what you paid for them. Accordingly, you can lose money investing in this Portfolio. Please see the prospectus for more complete information on investment risks.
1
Morgan Stanley Institutional Fund, Inc.
Annual Report — December 31, 2016
Shareholders' Letter (unaudited)
Dear Shareholders,
We are pleased to provide this Annual report, in which you will learn how your investment in Active International Allocation Portfolio (the "Portfolio") performed during the latest twelve-month period.
Morgan Stanley Investment Management is a client-centric, investor-led organization. Our global presence, intellectual capital, and breadth of products and services enable us to partner with investors to meet the evolving challenges of today's financial markets. We aim to deliver superior investment service and to empower our clients to make the informed decisions that help them reach their investment goals.
As always, we thank you for selecting Morgan Stanley Investment Management, and look forward to working with you in the months and years ahead.
Sincerely,

John H. Gernon
President and Principal Executive Officer
January 2017
2
Morgan Stanley Institutional Fund, Inc.
Annual Report — December 31, 2016
Expense Example (unaudited)
Active International Allocation Portfolio
As a shareholder of the Portfolio, you incur two types of costs: (1) transactional costs, including redemption fees; and (2) ongoing costs, which may include advisory fees, administration fees, distribution and shareholder services fees and other Portfolio expenses. This example is intended to help you understand your ongoing costs (in dollars) of investing in the Portfolio and to compare these costs with the ongoing costs of investing in other mutual funds.
This example is based on an investment of $1,000 invested at the beginning of the six-month period ended December 31, 2016 and held for the entire six-month period.
Actual Expenses
The table below provides information about actual account values and actual expenses. You may use the information in this table, together with the amount you invested, to estimate the expenses that you paid over the period. Simply divide your account value by $1,000 (for example, an $8,600 account value divided by $1,000 = 8.6), then multiply the result by the number in the table under the heading entitled "Actual Expenses Paid During Period" to estimate the expenses you paid on your account during this period.
Hypothetical Example for Comparison Purposes
The table below provides information about hypothetical account values and hypothetical expenses based on the Portfolio's actual expense ratio and an assumed rate of return of 5% per year before expenses, which is not the Portfolio's actual return. The hypothetical account values and expenses may not be used to estimate the actual ending account balance or expenses you paid for the period. You may use this information to compare the ongoing costs of investing in the Portfolio and other funds. To do so, compare this 5% hypothetical example with the 5% hypothetical examples that appear in the shareholder reports of the other funds.
Please note that the expenses shown in the table are meant to highlight your ongoing costs only and do not reflect any transactional costs, such as sales charges (loads) and redemption fees. Therefore, the information for each class in the table is useful in comparing ongoing costs only, and will not help you determine the relative total costs of owning different funds. In addition, if these transactional costs were included, your costs would have been higher.
| | | Beginning
Account
Value
7/1/16 | | Actual Ending
Account
Value
12/31/16 | | Hypothetical
Ending Account
Value | | Actual
Expenses
Paid
During
Period* | | Hypothetical
Expenses Paid
During Period* | | Net
Expense
Ratio
During
Period** | |
Active International Allocation Portfolio Class I | | $ | 1,000.00 | | | $ | 1,044.60 | | | $ | 1,021.97 | | | $ | 3.24 | | | $ | 3.20 | | | | 0.63 | %*** | |
Active International Allocation Portfolio Class A | | | 1,000.00 | | | | 1,043.10 | | | | 1,019.91 | | | | 5.34 | | | | 5.28 | | | | 1.04 | *** | |
Active International Allocation Portfolio Class L | | | 1,000.00 | | | | 1,038.50 | | | | 1,016.39 | | | | 8.92 | | | | 8.82 | | | | 1.74 | *** | |
Active International Allocation Portfolio Class C | | | 1,000.00 | | | | 1,036.70 | | | | 1,015.13 | | | | 10.19 | | | | 10.08 | | | | 1.99 | *** | |
* Expenses are calculated using each Portfolio Class' annualized net expense ratio (as disclosed), multiplied by the average account value over the period, and multiplied by 184/366 (to reflect the most recent one-half year period).
** Annualized.
*** Refer to Note F in the Notes to Financial Statements for discussion of prior period custodian out-of-pocket expenses that were reimbursed in the current period.
3
Morgan Stanley Institutional Fund, Inc.
Annual Report — December 31, 2016
Investment Overview (unaudited)
Active International Allocation Portfolio
The Portfolio seeks long-term capital appreciation by investing primarily, in accordance with country and sector weightings determined by the Adviser, Morgan Stanley Investment Management Inc., in equity securities of non-U.S. issuers which, in the aggregate, replicate broad market indices.
Performance
For the year ended December 31, 2016, the Portfolio's Class I shares had a total return based on net asset value and reinvestment of distributions per share of –0.67%, net of fees. The Portfolio's Class I shares underperformed the Portfolio's benchmark, the MSCI EAFE Index (the "Index"), which returned 1.00%.
Factors Affecting Performance
• Global equities had a nice finish to 2016, but the Index ended the year with a meager 1% return (in U.S. dollars). The Portfolio suffered the bulk of underperformance versus the Index in the first and third quarters when equity markets were particularly volatile.
• The main detractors from performance included the allocation to the eurozone and overweight to Japan. On a sector basis, the underweight allocations to the financials and materials sectors were detrimental to relative performance, as was the overweight to health care.
• Positive contributors to performance were an overweight allocation to the industrials sector and underweight allocations to telecommunication services and utilities. Overweight allocations to European autos and European technology added relative gains. An allocation to emerging markets was beneficial to performance.
• The Portfolio utilizes stock index futures as an additional vehicle to implement the portfolio manager's macro investment decisions. For 2016, macro investment decisions made with the use of stock index futures resulted in a realized loss for the Portfolio.
Management Strategies
• Following fairly sharp upturns in the fourth quarter, global equities and bond yields seemed to be taking a breather in early 2017, as President Trump was inaugurated and as fourth-quarter corporate
earnings season got underway. Global economic data into year-end and the beginning of 2017 continued to be largely positive, though future policy uncertainty remained high. Business and consumer surveys and activity measures in most large economies improved in December and in the fourth quarter, as did jobs, wage levels and corporate earnings. While the second half of the year's lift in global inflation measures is expected to flatten as the 2016 bottom in oil and other commodity prices are lapped — cycle low unemployment rates in the U.S., Japan, Germany, and China, plus the upturn in the Chinese producer price index and corporate earnings in the second half of 2016, could signal an inflection toward global reflation.
• Europe continues to enjoy a twice-delayed pick-up in credit growth and improving corporate earnings, in spite of the heavy 2016 and 2017 political calendar. Both Europe and Japan have benefited from monetary policy divergence versus the U.S. Federal Reserve and from weaker currencies following Trump's election win — but these could prove ephemeral without ongoing structural reforms to improve productivity. We have slight overweight positions to both regions as we begin 2017. Their respective cyclical economic upturns should drive 2017 earnings — and encourage some positive equity market re-ratings (especially versus the more expensive U.S. market) in the first half. However, Europe needs decisively clear up its remaining bank bad debt/high regulatory overhang — and Japan's Prime Minister Abe needs find a way to reignite structural reforms that revive animal spirits and pry the excess (and deadweight) cash away from the Japanese corporates. In all regions of the world, if corporate costs of capital (and interest rates) rise moderately, but for the right reasons, they could help to clear away unproductive competitors and raise expected investment returns to enticing levels. Much will depend, though, on keeping geopolitical and currency tensions at bay — and on domestic policies that increase productivity — not just short-term nominal growth (e.g., wasteful fiscal spending) and/or costs (protectionist measures).
• Equity valuations in Europe, Japan, and emerging markets are near their respective long-term historic norms, but they are cheap relative to the U.S., and
4
Morgan Stanley Institutional Fund, Inc.
Annual Report — December 31, 2016
Investment Overview (unaudited) (cont'd)
Active International Allocation Portfolio
look attractive versus local bonds and cash yields. Further, household allocations to equities outside the U.S. remain very low — which is not the case in the U.S., where short-term sentiment is moderate; but long-term allocations to equities are on the high side.
• With the highest global political uncertainty in at least 30 years — not to mention potential domestic policy upheaval — we believe 2017 will be a more volatile year than the second half of 2016, with investors possibly prone to overreaction. That said, if the global economic regime successfully makes the shift toward reflation — and trend, or even slightly above-trend, growth is maintained — we believe earnings should come through and 2017 could be another year of positive equity returns. From a sector perspective, we are sticking with a slight overweight to cyclicals, with the caveat that if geopolitics get "hot" and/or economic growth/inflation roll over, cash and defensives will likely be preferred.

* Minimum Investment for Class I shares
In accordance with SEC regulations, Portfolio's performance shown assumes that all recurring fees (including management fees) were deducted and all dividends and distributions were reinvested. The performance of Class A , L and C shares will vary from the performance of Class I shares based upon their different inception dates and will be negatively impacted by additional fees assessed to those classes.
5
Morgan Stanley Institutional Fund, Inc.
Annual Report — December 31, 2016
Investment Overview (unaudited) (cont'd)
Active International Allocation Portfolio
Performance Compared to the MSCI EAFE Index(1) and the Lipper International Large-Cap Core Funds Index(2)
| | | Period Ended December 31, 2016
Total Returns(3) | |
| | | | | Average Annual | |
| | | One
Year | | Five
Years | | Ten
Years | | Since
Inception(8) | |
Portfolio — Class I Shares
w/o sales charges(4) | | | –0.67 | % | | | 5.43 | % | | | 0.78 | % | | | 5.38 | % | |
Portfolio — Class A Shares
w/o sales charges(5) | | | –1.05 | | | | 5.09 | | | | 0.49 | | | | 4.52 | | |
Portfolio — Class A Shares with
maximum 5.25% sales charges(5) | | | –6.23 | | | | 3.96 | | | | –0.05 | | | | 4.25 | | |
Portfolio — Class L Shares
w/o sales charges(6) | | | –1.68 | | | | — | | | | — | | | | 5.45 | | |
Portfolio — Class C Shares
w/o sales charges(7) | | | –1.94 | | | | — | | | | — | | | | –7.80 | | |
Portfolio — Class C Shares with
maximum 1.00% deferred
sales charges(7) | | | –2.92 | | | | — | | | | — | | | | –7.80 | | |
MSCI EAFE Index | | | 1.00 | | | | 6.53 | | | | 0.75 | | | | 5.16 | | |
Lipper International Large-Cap
Core Funds Index | | | 2.64 | | | | 6.27 | | | | 0.50 | | | | 5.99 | | |
Performance data quoted represents past performance, which is no guarantee of future results, and current performance may be lower or higher than the figures shown. Performance assumes that all dividends and distributions, if any, were reinvested. For the most recent month-end performance figures, please visit www.morganstanley.com/im. Investment return and principal value will fluctuate so that Portfolio shares, when redeemed, may be worth more or less than their original cost. Total returns do not reflect the deduction of taxes that a shareholder would pay on Portfolio distributions or the redemption of Portfolio shares. Performance of share classes will vary due to difference in sales charges and expenses.
(1) The MSCI EAFE Index (Europe, Australasia, Far East) is a free float-adjusted market capitalization index that is designed to measure the international equity market performance of developed markets, excluding the United States & Canada. The term "free float" represents the portion of shares outstanding that are deemed to be available for purchase in the public equity markets by investors. The MSCI EAFE Index currently consists of 21 developed market country indices. The performance of the Index is listed in U.S. dollars and assumes reinvestment of net dividends. The Index is unmanaged and its returns do not include any sales charges or fees. Such costs would lower performance. It is not possible to invest directly in an index. Effective January 1, 2017, the Portfolio's primary benchmark will change to MSCI All Country World ex USA Index because the Adviser believes the MSCI All Country World ex USA Index is a more appropriate benchmark for the Portfolio.
(2) The Lipper International Large-Cap Core Funds Index is an equally weighted performance index of the largest qualifying funds (based on net assets) in the Lipper International Large-Cap Core Funds classification. The Index, which is adjusted for capital gains distributions and income dividends, is unmanaged and should not be considered an investment. There are currently 30 funds represented in this Index. As of the date of this report, the Portfolio was in the Lipper International Large-Cap Core Funds classification.
(3) Total returns for the Portfolio reflect fees waived and expenses reimbursed, if applicable, by the Adviser. Without such waivers and reimbursements, total returns would have been lower.
(4) Commenced operations on January 17, 1992.
(5) Commenced offering on January 2, 1996.
(6) Commenced offering on June 14, 2012.
(7) Commenced offering on April 30, 2015.
(8) For comparative purposes, average annual since inception returns listed for the Indexes refer to the inception date of Class I of the Portfolio, not the inception of the Index.
6
Morgan Stanley Institutional Fund, Inc.
Annual Report — December 31, 2016
Portfolio of Investments
Active International Allocation Portfolio
| | | Shares | | Value
(000) | |
Common Stocks (86.1%) | |
Australia (4.7%) | |
AGL Energy Ltd. | | | 7,331 | | | $ | 117 | | |
Amcor Ltd. | | | 19,280 | | | | 208 | | |
AMP Ltd. | | | 39,489 | | | | 144 | | |
APA Group | | | 9,968 | | | | 62 | | |
Aristocrat Leisure Ltd. | | | 4,445 | | | | 50 | | |
ASX Ltd. | | | 1,618 | | | | 58 | | |
Aurizon Holding Ltd. | | | 21,925 | | | | 80 | | |
AusNet Services | | | 15,135 | | | | 17 | | |
Australia & New Zealand Banking Group Ltd. | | | 44,145 | | | | 969 | | |
Bank of Queensland Ltd. | | | 3,158 | | | | 27 | | |
Bendigo and Adelaide Bank Ltd. | | | 3,931 | | | | 36 | | |
BHP Billiton Ltd. | | | 15,035 | | | | 272 | | |
Boral Ltd. | | | 6,179 | | | | 24 | | |
Brambles Ltd. | | | 20,728 | | | | 186 | | |
Caltex Australia Ltd. | | | 2,253 | | | | 50 | | |
Challenger Ltd. | | | 4,918 | | | | 40 | | |
CIMIC Group Ltd. | | | 1,755 | | | | 44 | | |
Coca-Cola Amatil Ltd. | | | 10,473 | | | | 77 | | |
Cochlear Ltd. | | | 733 | | | | 65 | | |
Commonwealth Bank of Australia | | | 19,608 | | | | 1,166 | | |
Computershare Ltd. | | | 4,182 | | | | 38 | | |
Crown Resorts Ltd. | | | 5,257 | | | | 44 | | |
CSL Ltd. | | | 6,614 | | | | 479 | | |
CYBG PLC CDI (a)(b) | | | 7,987 | | | | 28 | | |
Dexus Property Group REIT | | | 7,884 | | | | 55 | | |
Domino's Pizza Enterprises Ltd. | | | 508 | | | | 24 | | |
DUET Group (a) | | | 19,375 | | | | 38 | | |
Flight Centre Travel Group Ltd. | | | 470 | | | | 11 | | |
Fortescue Metals Group Ltd. (a) | | | 19,054 | | | | 81 | | |
Goodman Group REIT | | | 24,674 | | | | 127 | | |
GPT Group REIT | | | 14,490 | | | | 53 | | |
Harvey Norman Holdings Ltd. | | | 9,538 | | | | 35 | | |
Healthscope Ltd. | | | 14,434 | | | | 24 | | |
Incitec Pivot Ltd. | | | 25,640 | | | | 67 | | |
Insurance Australia Group Ltd. | | | 28,554 | | | | 123 | | |
James Hardie Industries PLC CDI | | | 3,707 | | | | 59 | | |
Lend Lease Group REIT | | | 4,685 | | | | 49 | | |
Macquarie Group Ltd. | | | 3,727 | | | | 234 | | |
Medibank Pvt Ltd. | | | 22,765 | | | | 46 | | |
Mirvac Group REIT | | | 30,562 | | | | 47 | | |
National Australia Bank Ltd. | | | 34,294 | | | | 759 | | |
Newcrest Mining Ltd. | | | 38,939 | | | | 569 | | |
Oil Search Ltd. | | | 11,430 | | | | 59 | | |
Orica Ltd. | | | 5,628 | | | | 72 | | |
Origin Energy Ltd. | | | 14,717 | | | | 70 | | |
Platinum Asset Management Ltd. (a) | | | 1,946 | | | | 7 | | |
Qantas Airways Ltd. | | | 4,352 | | | | 10 | | |
QBE Insurance Group Ltd. | | | 15,406 | | | | 138 | | |
Ramsay Health Care Ltd. | | | 1,186 | | | | 58 | | |
REA Group Ltd. | | | 447 | | | | 18 | | |
Rio Tinto Ltd. | | | 1,970 | | | | 85 | | |
| | | Shares | | Value
(000) | |
Santos Ltd. | | | 13,379 | | | $ | 39 | | |
Scentre Group REIT | | | 92,526 | | | | 310 | | |
Seek Ltd. | | | 2,726 | | | | 29 | | |
Sonic Healthcare Ltd. | | | 6,068 | | | | 94 | | |
South32 Ltd. | | | 64,440 | | | | 128 | | |
South32 Ltd. | | | 68,015 | | | | 135 | | |
Stockland REIT | | | 76,042 | | | | 251 | | |
Suncorp Group Ltd. | | | 15,886 | | | | 155 | | |
Sydney Airport | | | 9,120 | | | | 39 | | |
Tabcorp Holdings Ltd. | | | 9,093 | | | | 32 | | |
Tatts Group Ltd. (a) | | | 17,755 | | | | 57 | | |
Telstra Corp., Ltd. | | | 52,539 | | | | 193 | | |
TPG Telecom Ltd. (a) | | | 2,760 | | | | 14 | | |
Transurban Group | | | 17,085 | | | | 127 | | |
Treasury Wine Estates Ltd. | | | 6,239 | | | | 48 | | |
Vicinity Centres REIT | | | 27,343 | | | | 59 | | |
Vocus Communications Ltd. | | | 3,826 | | | | 11 | | |
Wesfarmers Ltd. | | | 16,216 | | | | 493 | | |
Westfield Corp. REIT | | | 32,588 | | | | 221 | | |
Westpac Banking Corp. | | | 35,661 | | | | 839 | | |
Woodside Petroleum Ltd. | | | 8,243 | | | | 185 | | |
Woolworths Ltd. | | | 20,234 | | | | 352 | | |
| | | | 11,010 | | |
Austria (0.1%) | |
Andritz AG | | | 691 | | | | 35 | | |
Erste Group Bank AG (b) | | | 4,557 | | | | 133 | | |
OMV AG | | | 656 | | | | 23 | | |
Raiffeisen Bank International AG (b) | | | 1,708 | | | | 31 | | |
Voestalpine AG | | | 2,003 | | | | 79 | | |
| | | | 301 | | |
Belgium (0.8%) | |
Ageas | | | 1,051 | | | | 42 | | |
Anheuser-Busch InBev N.V. | | | 8,692 | | | | 920 | | |
Groupe Bruxelles Lambert SA | | | 2,680 | | | | 225 | | |
KBC Group N.V. | | | 3,137 | | | | 194 | | |
Proximus | | | 277 | | | | 8 | | |
Solvay SA | | | 434 | | | | 51 | | |
Telenet Group Holding N.V. (b) | | | 1,131 | | | | 63 | | |
UCB SA | | | 2,374 | | | | 152 | | |
Umicore SA | | | 4,098 | | | | 233 | | |
| | | | 1,888 | | |
Brazil (0.0%) | |
Cia Energetica de Minas Gerais (Preference) | | | 1 | | | | — | @ | |
Chile (0.0%) | |
Antofagasta PLC (a) | | | 2,540 | | | | 21 | | |
China (0.0%) | |
WH Group Ltd. (c)(d) | | | 46,000 | | | | 37 | | |
Colombia (1.0%) | |
Bancolombia SA (Preference) | | | 60,230 | | | | 545 | | |
Cementos Argos SA | | | 61,005 | | | | 241 | | |
Corp. Financiera Colombiana SA | | | 11,474 | | | | 142 | | |
Ecopetrol SA (b) | | | 657,973 | | | | 303 | | |
The accompanying notes are an integral part of the financial statements.
7
Morgan Stanley Institutional Fund, Inc.
Annual Report — December 31, 2016
Portfolio of Investments (cont'd)
Active International Allocation Portfolio
| | | Shares | | Value
(000) | |
Colombia (cont'd) | |
Grupo Argos SA | | | 38,621 | | | $ | 248 | | |
Grupo Aval Acciones y Valores SA (Preference) | | | 465,000 | | | | 188 | | |
Grupo de Inversiones Suramericana SA | | | 44,662 | | | | 568 | | |
Interconexion Electrica SA ESP | | | 51,148 | | | | 170 | | |
| | | | 2,405 | | |
Czech Republic (1.0%) | |
CEZ AS | | | 52,540 | | | | 880 | | |
Komercni Banka AS | | | 24,747 | | | | 853 | | |
Moneta Money Bank AS (b)(d) | | | 131,874 | | | | 426 | | |
O2 Czech Republic AS | | | 20,158 | | | | 204 | | |
| | | | 2,363 | | |
Denmark (1.4%) | |
AP Moeller - Maersk A/S Series A | | | 97 | | | | 146 | | |
AP Moeller - Maersk A/S Series B | | | 431 | | | | 688 | | |
Carlsberg A/S Series B | | | 134 | | | | 11 | | |
Danske Bank A/S | | | 10,807 | | | | 328 | | |
DSV A/S | | | 12,372 | | | | 550 | | |
ISS A/S | | | 3,153 | | | | 106 | | |
Novo Nordisk A/S Series B | | | 32,715 | | | | 1,180 | | |
Novozymes A/S Series B | | | 3,185 | | | | 110 | | |
TDC A/S (b) | | | 7,513 | | | | 39 | | |
Vestas Wind Systems A/S | | | 1,348 | | | | 88 | | |
| | | | 3,246 | | |
Egypt (1.0%) | |
Commercial International Bank Egypt SAE | | | 410,370 | | | | 1,653 | | |
Global Telecom Holding SAE (b) | | | 1,036,456 | | | | 406 | | |
Talaat Moustafa Group | | | 366,951 | | | | 184 | | |
| | | | 2,243 | | |
Finland (1.0%) | |
Elisa Oyj | | | 3,005 | | | | 98 | | |
Kone Oyj, Class B | | | 5,582 | | | | 250 | | |
Metso Oyj | | | 2,675 | | | | 76 | | |
Neste Oyj | | | 3,145 | | | | 121 | | |
Nokia Oyj | | | 110,241 | | | | 533 | | |
Nokian Renkaat Oyj | | | 573 | | | | 21 | | |
Orion Oyj, Class B | | | 1,856 | | | | 83 | | |
Sampo Oyj, Class A | | | 7,025 | | | | 315 | | |
Stora Enso Oyj, Class R | | | 17,162 | | | | 185 | | |
UPM-Kymmene Oyj | | | 14,785 | | | | 363 | | |
Wartsila Oyj | | | 4,482 | | | | 201 | | |
| | | | 2,246 | | |
France (7.9%) | |
Accor SA | | | 4,602 | | | | 172 | | |
Aeroports de Paris (ADP) | | | 999 | | | | 107 | | |
Air Liquide SA | | | 4,497 | | | | 500 | | |
Airbus Group SE | | | 10,440 | | | | 691 | | |
Alstom SA (b) | | | 4,050 | | | | 112 | | |
Arkema SA | | | 826 | | | | 81 | | |
Atos SE | | | 1,887 | | | | 199 | | |
AXA SA | | | 34,739 | | | | 877 | | |
| | | Shares | | Value
(000) | |
BNP Paribas SA | | | 15,218 | | | $ | 970 | | |
Bouygues SA | | | 5,368 | | | | 192 | | |
Cap Gemini SA | | | 3,200 | | | | 270 | | |
Carrefour SA | | | 7,927 | | | | 191 | | |
Casino Guichard Perrachon SA | | | 932 | | | | 45 | | |
Christian Dior SE | | | 548 | | | | 115 | | |
Cie de Saint-Gobain | | | 9,069 | | | | 423 | | |
Cie Generale des Etablissements Michelin | | | 3,015 | | | | 335 | | |
CNP Assurances | | | 1,932 | | | | 36 | | |
Credit Agricole SA | | | 14,221 | | | | 176 | | |
Danone SA | | | 6,536 | | | | 414 | | |
Dassault Systemes | | | 3,533 | | | | 269 | | |
Edenred | | | 5,726 | | | | 114 | | |
Eiffage SA | | | 298 | | | | 21 | | |
Electricite de France SA (a) | | | 7,256 | | | | 74 | | |
Engie SA | | | 40,095 | | | | 512 | | |
Essilor International SA | | | 1,887 | | | | 213 | | |
Eurazeo SA | | | 325 | | | | 19 | | |
Eutelsat Communications SA | | | 1,721 | | | | 33 | | |
Fonciere Des Regions REIT | | | 804 | | | | 70 | | |
Gecina SA REIT | | | 697 | | | | 96 | | |
Groupe Eurotunnel SE | | | 5,742 | | | | 55 | | |
Hermes International | | | 142 | | | | 58 | | |
ICADE REIT | | | 802 | | | | 57 | | |
Iliad SA | | | 639 | | | | 123 | | |
Imerys SA | | | 654 | | | | 50 | | |
Kering | | | 687 | | | | 154 | | |
Klepierre REIT | | | 3,077 | | | | 121 | | |
L'Oreal SA | | | 1,950 | | | | 356 | | |
Lagardere SCA | | | 1,270 | | | | 35 | | |
Legrand SA | | | 8,375 | | | | 476 | | |
LVMH Moet Hennessy Louis Vuitton SE | | | 2,234 | | | | 427 | | |
Natixis SA | | | 5,987 | | | | 34 | | |
Orange SA | | | 21,557 | | | | 328 | | |
Pernod Ricard SA | | | 2,002 | | | | 217 | | |
Peugeot SA (b) | | | 7,394 | | | | 121 | | |
Publicis Groupe SA | | | 2,045 | | | | 141 | | |
Remy Cointreau SA | | | 227 | | | | 19 | | |
Renault SA | | | 3,106 | | | | 276 | | |
Safran SA | | | 6,902 | | | | 497 | | |
Sanofi | | | 15,393 | | | | 1,246 | | |
Schneider Electric SE | | | 12,925 | | | | 899 | | |
SES SA | | | 4,287 | | | | 94 | | |
| SFR Group SA (b) | | | 1,285 | | | | 36 | | |
Societe BIC SA | | | 413 | | | | 56 | | |
Societe Generale SA | | | 14,386 | | | | 708 | | |
Sodexo SA | | | 855 | | | | 98 | | |
STMicroelectronics N.V. (a) | | | 15,377 | | | | 174 | | |
Suez | | | 8,388 | | | | 124 | | |
Technip SA | | | 1,903 | | | | 136 | | |
Thales SA | | | 2,415 | | | | 234 | | |
Total SA | | | 38,651 | | | | 1,982 | | |
Unibail-Rodamco SE REIT | | | 1,520 | | | | 363 | | |
The accompanying notes are an integral part of the financial statements.
8
Morgan Stanley Institutional Fund, Inc.
Annual Report — December 31, 2016
Portfolio of Investments (cont'd)
Active International Allocation Portfolio
| | | Shares | | Value
(000) | |
France (cont'd) | |
Valeo SA | | | 4,881 | | | $ | 281 | | |
Veolia Environnement SA | | | 10,809 | | | | 184 | | |
Vinci SA | | | 11,211 | | | | 764 | | |
Vivendi SA | | | 4,595 | | | | 87 | | |
Zodiac Aerospace | | | 1,086 | | | | 25 | | |
| | | | 18,363 | | |
Germany (7.4%) | |
Adidas AG | | | 2,447 | | | | 387 | | |
Allianz SE (Registered) | | | 7,457 | | | | 1,232 | | |
Axel Springer SE | | | 377 | | | | 18 | | |
BASF SE | | | 10,488 | | | | 975 | | |
Bayer AG (Registered) | | | 11,828 | | | | 1,234 | | |
Bayerische Motoren Werke AG | | | 5,359 | | | | 501 | | |
Bayerische Motoren Werke AG (Preference) | | | 727 | | | | 56 | | |
Beiersdorf AG | | | 805 | | | | 68 | | |
Brenntag AG | | | 1,510 | | | | 84 | | |
Commerzbank AG | | | 15,199 | | | | 116 | | |
Continental AG | | | 2,374 | | | | 459 | | |
Covestro AG (d) | | | 996 | | | | 68 | | |
Daimler AG (Registered) | | | 15,665 | | | | 1,166 | | |
Deutsche Bank AG (Registered) (b) | | | 21,127 | | | | 384 | | |
Deutsche Boerse AG (b) | | | 3,083 | | | | 252 | | |
Deutsche Lufthansa AG (Registered) | | | 1,654 | | | | 21 | | |
Deutsche Post AG (Registered) | | | 9,727 | | | | 320 | | |
Deutsche Telekom AG (Registered) | | | 61,460 | | | | 1,058 | | |
Deutsche Wohnen AG | | | 4,830 | | | | 152 | | |
E.ON SE | | | 36,069 | | | | 254 | | |
Fraport AG Frankfurt Airport Services Worldwide | | | 453 | | | | 27 | | |
Fresenius Medical Care AG & Co., KGaA | | | 4,051 | | | | 343 | | |
Fresenius SE & Co., KGaA | | | 419 | | | | 33 | | |
GEA Group AG | | | 3,514 | | | | 141 | | |
Hannover Rueck SE (Registered) | | | 799 | | | | 87 | | |
HeidelbergCement AG | | | 3,654 | | | | 341 | | |
Henkel AG & Co., KGaA (Preference) | | | 2,015 | | | | 240 | | |
Hochtief AG | | | 114 | | | | 16 | | |
Hugo Boss AG | | | 357 | | | | 22 | | |
Infineon Technologies AG | | | 28,353 | | | | 493 | | |
K&S AG (Registered) | | | 225 | | | | 5 | | |
Kabel Deutschland Holding AG | | | 577 | | | | 66 | | |
Lanxess AG | | | 422 | | | | 28 | | |
Linde AG | | | 1,525 | | | | 251 | | |
MAN SE | | | 193 | | | | 19 | | |
Merck KGaA | | | 1,950 | | | | 204 | | |
Metro AG | | | 5,638 | | | | 187 | | |
Muenchener Rueckversicherungs AG (Registered) | | | 2,162 | | | | 409 | | |
Osram Licht AG | | | 2,974 | | | | 156 | | |
Porsche Automobil Holding SE (Preference) | | | 2,449 | | | | 133 | | |
ProSiebenSat.1 Media SE (Registered) | | | 4,208 | | | | 162 | | |
QIAGEN N.V. (b) | | | 5,938 | | | | 167 | | |
RTL Group SA (b) | | | 957 | | | | 70 | | |
RWE AG (b) | | | 12,263 | | | | 153 | | |
| | | Shares | | Value
(000) | |
SAP SE | | | 20,800 | | | $ | 1,813 | | |
Siemens AG (Registered) | | | 16,259 | | | | 1,999 | | |
Symrise AG | | | 205 | | | | 13 | | |
Telefonica Deutschland Holding AG | | | 4,483 | | | | 19 | | |
ThyssenKrupp AG | | | 5,838 | | | | 139 | | |
TUI AG | | | 7,047 | | | | 101 | | |
Uniper SE (b) | | | 3,610 | | | | 50 | | |
United Internet AG (Registered) | | | 6,643 | | | | 259 | | |
Vonovia SE | | | 6,589 | | | | 214 | | |
| | | | 17,165 | | |
Hong Kong (1.2%) | |
AIA Group Ltd. | | | 89,000 | | | | 502 | | |
Bank of East Asia Ltd. (The) (a) | | | 10,477 | | | | 40 | | |
BOC Hong Kong Holdings Ltd. | | | 30,000 | | | | 107 | | |
Cheung Kong Infrastructure Holdings Ltd. | | | 5,000 | | | | 40 | | |
Cheung Kong Property Holdings Ltd. | | | 21,500 | | | | 132 | | |
CK Hutchison Holdings Ltd. | | | 21,000 | | | | 238 | | |
CLP Holdings Ltd. | | | 14,000 | | | | 129 | | |
Galaxy Entertainment Group Ltd. | | | 18,000 | | | | 78 | | |
Hang Lung Properties Ltd. | | | 19,000 | | | | 40 | | |
Hang Seng Bank Ltd. | | | 6,000 | | | | 112 | | |
Henderson Land Development Co., Ltd. | | | 11,000 | | | | 59 | | |
HK Electric Investments & HK Electric
Investments Ltd. (a)(d) | | | 20,500 | | | | 17 | | |
HKT Trust & HKT Ltd. | | | 21,000 | | | | 26 | | |
Hong Kong & China Gas Co., Ltd. | | | 58,300 | | | | 103 | | |
Hong Kong Exchanges and Clearing Ltd. | | | 9,290 | | | | 219 | | |
Hongkong Land Holdings Ltd. | | | 5,000 | | | | 32 | | |
Hysan Development Co., Ltd. | | | 5,000 | | | | 21 | | |
Link REIT | | | 17,000 | | | | 110 | | |
MTR Corp., Ltd. (a) | | | 11,825 | | | | 57 | | |
New World Development Co., Ltd. | | | 48,265 | | | | 51 | | |
NWS Holdings Ltd. | | | 14,000 | | | | 23 | | |
PCCW Ltd. | | | 36,764 | | | | 20 | | |
Power Assets Holdings Ltd. | | | 10,500 | | | | 93 | | |
Sands China Ltd. | | | 18,800 | | | | 82 | | |
Sino Land Co., Ltd. | | | 27,363 | | | | 41 | | |
Sun Hung Kai Properties Ltd. | | | 13,000 | | | | 164 | | |
Swire Pacific Ltd., Class A | | | 5,000 | | | | 48 | | |
Swire Properties Ltd. | | | 9,800 | | | | 27 | | |
Techtronic Industries Co., Ltd. | | | 11,000 | | | | 39 | | |
Wharf Holdings Ltd. (The) | | | 12,000 | | | | 80 | | |
Wheelock & Co., Ltd. | | | 8,000 | | | | 45 | | |
Yue Yuen Industrial Holdings Ltd. | | | 6,500 | | | | 24 | | |
| | | | 2,799 | | |
Indonesia (2.9%) | |
Adaro Energy Tbk PT | | | 1,037,600 | | | | 130 | | |
Astra International Tbk PT | | | 1,367,800 | | | | 840 | | |
Bank Central Asia Tbk PT | | | 841,900 | | | | 969 | | |
Bank Mandiri Persero Tbk PT | | | 642,500 | | | | 552 | | |
Bank Negara Indonesia Persero Tbk PT | | | 565,600 | | | | 232 | | |
Bank Rakyat Indonesia Persero Tbk PT | | | 757,700 | | | | 657 | | |
The accompanying notes are an integral part of the financial statements.
9
Morgan Stanley Institutional Fund, Inc.
Annual Report — December 31, 2016
Portfolio of Investments (cont'd)
Active International Allocation Portfolio
| | | Shares | | Value
(000) | |
Indonesia (cont'd) | |
Charoen Pokphand Indonesia Tbk PT | | | 551,900 | | | $ | 127 | | |
Gudang Garam Tbk PT | | | 35,900 | | | | 170 | | |
Hanjaya Mandala Sampoerna Tbk PT | | | 667,200 | | | | 190 | | |
Indocement Tunggal Prakarsa Tbk PT | | | 120,700 | | | | 138 | | |
Indofood Sukses Makmur Tbk PT | | | 335,200 | | | | 197 | | |
Kalbe Farma Tbk PT | | | 1,575,900 | | | | 177 | | |
Lippo Karawaci Tbk PT | | | 1,738,100 | | | | 93 | | |
Matahari Department Store Tbk PT | | | 187,700 | | | | 211 | | |
Perusahaan Gas Negara Persero Tbk | | | 794,800 | | | | 159 | | |
Semen Indonesia Persero Tbk PT | | | 228,700 | | | | 156 | | |
Summarecon Agung Tbk PT | | | 872,000 | | | | 86 | | |
Surya Citra Media Tbk PT | | | 498,000 | | | | 103 | | |
Telekomunikasi Indonesia Persero Tbk PT | | | 3,450,300 | | | | 1,019 | | |
Unilever Indonesia Tbk PT | | | 108,900 | | | | 314 | | |
United Tractors Tbk PT | | | 122,600 | | | | 193 | | |
| | | | 6,713 | | |
Ireland (0.6%) | |
Bank of Ireland (b) | | | 397,379 | | | | 98 | | |
CRH PLC | | | 27,786 | | | | 964 | | |
DCC PLC | | | 505 | | | | 38 | | |
Kerry Group PLC, Class A | | | 2,049 | | | | 146 | | |
Ryanair Holdings PLC ADR (a)(b) | | | 1,537 | | | | 128 | | |
| | | | 1,374 | | |
Italy (1.2%) | |
Assicurazioni Generali SpA | | | 22,451 | | | | 334 | | |
Eni SpA | | | 51,850 | | | | 844 | | |
Intesa Sanpaolo SpA | | | 435,375 | | | | 1,106 | | |
Leonardo-Finmeccanica SpA (b) | | | 3,196 | | | | 45 | | |
Mediobanca SpA | | | 8,694 | | | | 71 | | |
Prysmian SpA | | | 1,573 | | | | 40 | | |
Saipem SpA (b) | | | 319,490 | | | | 180 | | |
UniCredit SpA | | | 52,699 | | | | 152 | | |
| | | | 2,772 | | |
Japan (20.1%) | |
ABC-Mart, Inc. | | | 300 | | | | 17 | | |
Acom Co., Ltd. (b) | | | 10,600 | | | | 46 | | |
Aeon Co., Ltd. | | | 12,700 | | | | 180 | | |
AEON Financial Service Co., Ltd. | | | 2,600 | | | | 46 | | |
Aeon Mall Co., Ltd. | | | 800 | | | | 11 | | |
Aisin Seiki Co., Ltd. | | | 100 | | | | 4 | | |
Ajinomoto Co., Inc. | | | 10,200 | | | | 205 | | |
Alfresa Holdings Corp. | | | 200 | | | | 3 | | |
Amada Holdings Co., Ltd. | | | 6,400 | | | | 71 | | |
ANA Holdings, Inc. | | | 52,000 | | | | 140 | | |
Aozora Bank Ltd. | | | 1,000 | | | | 4 | | |
Asahi Glass Co., Ltd. | | | 10,300 | | | | 70 | | |
Asahi Group Holdings Ltd. | | | 6,600 | | | | 208 | | |
Asahi Kasei Corp. | | | 14,000 | | | | 122 | | |
Asics Corp. | | | 2,100 | | | | 42 | | |
Astellas Pharma, Inc. | | | 40,500 | | | | 563 | | |
Bandai Namco Holdings, Inc. | | | 5,700 | | | | 157 | | |
| | | Shares | | Value
(000) | |
Bank of Kyoto Ltd. (The) | | | 7,000 | | | $ | 52 | | |
Benesse Holdings, Inc. (a) | | | 654 | | | | 18 | | |
Bridgestone Corp. | | | 11,200 | | | | 404 | | |
Brother Industries Ltd. | | | 6,200 | | | | 112 | | |
Canon, Inc. | | | 12,704 | | | | 358 | | |
Casio Computer Co., Ltd. | | | 2,400 | | | | 34 | | |
Central Japan Railway Co. | | | 2,492 | | | | 410 | | |
Chiba Bank Ltd. (The) | | | 13,000 | | | | 80 | | |
Chubu Electric Power Co., Inc. | | | 5,500 | | | | 77 | | |
Chugai Pharmaceutical Co., Ltd. | | | 3,400 | | | | 98 | | |
Chugoku Bank Ltd. (The) | | | 2,900 | | | | 42 | | |
Concordia Financial Group Ltd. | | | 50,200 | | | | 242 | | |
Credit Saison Co., Ltd. | | | 4,700 | | | | 84 | | |
Dai Nippon Printing Co., Ltd. | | | 4,100 | | | | 41 | | |
Dai-ichi Life Insurance Co., Ltd. (The) | | | 27,200 | | | | 453 | | |
Daicel Corp. | | | 300 | | | | 3 | | |
Daiichi Sankyo Co., Ltd. | | | 12,900 | | | | 264 | | |
Daikin Industries Ltd. | | | 5,300 | | | | 487 | | |
Daito Trust Construction Co., Ltd. | | | 1,356 | | | | 204 | | |
Daiwa House Industry Co., Ltd. | | | 9,000 | | | | 246 | | |
Daiwa Securities Group, Inc. | | | 38,000 | | | | 234 | | |
Denso Corp. | | | 10,950 | | | | 474 | | |
Dentsu, Inc. | | | 3,300 | | | | 155 | | |
Don Quijote Holdings Co., Ltd. | | | 3,000 | | | | 111 | | |
East Japan Railway Co. | | | 6,300 | | | | 544 | | |
Eisai Co., Ltd. | | | 4,700 | | | | 270 | | |
Electric Power Development Co., Ltd. | | | 100 | | | | 2 | | |
FANUC Corp. | | | 4,050 | | | | 687 | | |
Fast Retailing Co., Ltd. | | | 1,200 | | | | 429 | | |
Fuji Electric Co., Ltd. | | | 7,000 | | | | 36 | | |
Fuji Heavy Industries Ltd. | | | 5,500 | | | | 225 | | |
FUJIFILM Holdings Corp. | | | 12,800 | | | | 486 | | |
Fujitsu Ltd. | | | 34,200 | | | | 190 | | |
Fukuoka Financial Group, Inc. | | | 18,000 | | | | 80 | | |
Hachijuni Bank Ltd. (The) | | | 7,000 | | | | 41 | | |
Hakuhodo DY Holdings, Inc. | | | 7,200 | | | | 89 | | |
Hamamatsu Photonics KK | | | 3,300 | | | | 87 | | |
Hankyu Hanshin Holdings, Inc. | | | 1,600 | | | | 51 | | |
Hikari Tsushin, Inc. | | | 100 | | | | 9 | | |
Hino Motors Ltd. | | | 4,700 | | | | 48 | | |
Hirose Electric Co., Ltd. | | | 300 | | | | 37 | | |
Hisamitsu Pharmaceutical Co., Inc. | | | 500 | | | | 25 | | |
Hitachi Construction Machinery Co., Ltd. | | | 4,400 | | | | 95 | | |
Hitachi Ltd. | | | 65,000 | | | | 352 | | |
Hitachi Metals Ltd. | | | 200 | | | | 3 | | |
Honda Motor Co., Ltd. | | | 24,213 | | | | 707 | | |
Hoshino Resorts, Inc. REIT | | | 5 | | | | 26 | | |
Hoshizaki Corp. | | | 200 | | | | 16 | | |
Hoya Corp. | | | 11,500 | | | | 483 | | |
Hulic Co., Ltd. | | | 300 | | | | 3 | | |
IHI Corp. (b) | | | 24,530 | | | | 64 | | |
Inpex Corp. | | | 20,400 | | | | 204 | | |
Isetan Mitsukoshi Holdings Ltd. | | | 9,500 | | | | 102 | | |
The accompanying notes are an integral part of the financial statements.
10
Morgan Stanley Institutional Fund, Inc.
Annual Report — December 31, 2016
Portfolio of Investments (cont'd)
Active International Allocation Portfolio
| | | Shares | | Value
(000) | |
Japan (cont'd) | |
Isuzu Motors Ltd. | | | 10,000 | | | $ | 127 | | |
Ito En Ltd. | | | 3,800 | | | | 126 | | |
ITOCHU Corp. | | | 27,351 | | | | 363 | | |
J Front Retailing Co., Ltd. | | | 3,400 | | | | 46 | | |
Japan Airlines Co., Ltd. | | | 2,000 | | | | 58 | | |
Japan Exchange Group, Inc. | | | 14,300 | | | | 204 | | |
Japan Hotel REIT Investment Corp. REIT | | | 70 | | | | 47 | | |
Japan Post Bank Co., Ltd. | | | 6,900 | | | | 83 | | |
Japan Post Holdings Co., Ltd. | | | 6,200 | | | | 77 | | |
Japan Prime Realty Investment Corp. REIT | | | 9 | | | | 35 | | |
Japan Real Estate Investment Corp. REIT | | | 22 | | | | 120 | | |
Japan Retail Fund Investment Corp. REIT | | | 39 | | | | 79 | | |
Japan Tobacco, Inc. | | | 21,300 | | | | 701 | | |
JFE Holdings, Inc. | | | 8,900 | | | | 136 | | |
JGC Corp. | | | 14,146 | | | | 257 | | |
JSR Corp. | | | 1,208 | | | | 19 | | |
JTEKT Corp. | | | 700 | | | | 11 | | |
JX Holdings, Inc. | | | 53,446 | | | | 226 | | |
Kajima Corp. | | | 42,000 | | | | 291 | | |
Kakaku.com, Inc. | | | 4,100 | | | | 68 | | |
Kansai Electric Power Co., Inc. (The) (b) | | | 7,800 | | | | 85 | | |
Kansai Paint Co., Ltd. | | | 3,200 | | | | 59 | | |
Kao Corp. | | | 12,300 | | | | 583 | | |
Kawasaki Heavy Industries Ltd. | | | 24,500 | | | | 77 | | |
KDDI Corp. | | | 13,600 | | | | 344 | | |
Keihan Holdings Co. Ltd. | | | 1,000 | | | | 7 | | |
Keikyu Corp. | | | 3,000 | | | | 35 | | |
Keio Corp. | | | 3,000 | | | | 25 | | |
Keyence Corp. | | | 1,157 | | | | 794 | | |
Kinden Corp. | | | 7,000 | | | | 87 | | |
Kintetsu Group Holdings Co., Ltd. | | | 14,750 | | | | 56 | | |
Kirin Holdings Co., Ltd. | | | 14,300 | | | | 233 | | |
Kobe Steel Ltd. (b) | | | 1,200 | | | | 11 | | |
Koito Manufacturing Co., Ltd. | | | 100 | | | | 5 | | |
Komatsu Ltd. | | | 17,600 | | | | 399 | | |
Konica Minolta, Inc. | | | 9,530 | | | | 95 | | |
Kose Corp. | | | 2,000 | | | | 166 | | |
Kubota Corp. | | | 600 | | | | 9 | | |
Kuraray Co., Ltd. | | | 7,056 | | | | 106 | | |
Kurita Water Industries Ltd. | | | 3,800 | | | | 84 | | |
Kyocera Corp. | | | 7,100 | | | | 353 | | |
Kyowa Exeo Corp. | | | 4,500 | | | | 65 | | |
Kyowa Hakko Kirin Co., Ltd. | | | 7,200 | | | | 100 | | |
Kyushu Electric Power Co., Inc. | | | 3,500 | | | | 38 | | |
Lawson, Inc. | | | 2,000 | | | | 141 | | |
LIXIL Group Corp. | | | 4,662 | | | | 106 | | |
M3, Inc. | | | 100 | | | | 3 | | |
Mabuchi Motor Co., Ltd. | | | 1,800 | | | | 94 | | |
Makita Corp. | | | 1,400 | | | | 94 | | |
Marubeni Corp. | | | 27,950 | | | | 159 | | |
Marui Group Co., Ltd. | | | 2,800 | | | | 41 | | |
Maruichi Steel Tube Ltd. | | | 100 | | | | 3 | | |
| | | Shares | | Value
(000) | |
Mazda Motor Corp. | | | 8,500 | | | $ | 139 | | |
Mebuki Financial Group, Inc. | | | 23,400 | | | | 87 | | |
Medipal Holdings Corp. | | | 200 | | | | 3 | | |
MEIJI Holdings Co., Ltd. | | | 1,500 | | | | 118 | | |
Minebea Co., Ltd. | | | 3,000 | | | | 28 | | |
Miraca Holdings, Inc. | | | 1,800 | | | | 81 | | |
Mitsubishi Chemical Holdings Corp. | | | 27,600 | | | | 179 | | |
Mitsubishi Corp. | | | 19,800 | | | | 422 | | |
Mitsubishi Electric Corp. | | | 28,952 | | | | 404 | | |
Mitsubishi Estate Co., Ltd. | | | 24,000 | | | | 478 | | |
Mitsubishi Heavy Industries Ltd. | | | 70,550 | | | | 322 | | |
Mitsubishi Materials Corp. | | | 1,700 | | | | 52 | | |
Mitsubishi Motors Corp. | | | 8,500 | | | | 48 | | |
Mitsubishi Tanabe Pharma Corp. | | | 2,000 | | | | 39 | | |
Mitsubishi UFJ Financial Group, Inc. (See Note G) | | | 92,506 | | | | 570 | | |
Mitsui & Co., Ltd. | | | 20,100 | | | | 276 | | |
Mitsui Fudosan Co., Ltd. | | | 17,900 | | | | 414 | | |
Mitsui OSK Lines Ltd. | | | 3,000 | | | | 8 | | |
Mizuho Financial Group, Inc. | | | 559,100 | | | | 1,004 | | |
MS&AD Insurance Group Holdings, Inc. | | | 7,460 | | | | 231 | | |
Murata Manufacturing Co., Ltd. | | | 3,800 | | | | 509 | | |
Nabtesco Corp. | | | 1,400 | | | | 33 | | |
Nagoya Railroad Co., Ltd. | | | 1,000 | | | | 5 | | |
NEC Corp. | | | 23,900 | | | | 63 | | |
NGK Insulators Ltd. | | | 3,760 | | | | 73 | | |
NGK Spark Plug Co., Ltd. | | | 4,359 | | | | 97 | | |
NH Foods Ltd. | | | 2,000 | | | | 54 | | |
Nidec Corp. | | | 6,100 | | | | 526 | | |
Nikon Corp. | | | 8,000 | | | | 124 | | |
Nintendo Co., Ltd. | | | 1,508 | | | | 317 | | |
Nippon Building Fund, Inc. REIT | | | 24 | | | | 133 | | |
Nippon Express Co., Ltd. | | | 7,300 | | | | 39 | | |
Nippon Paint Holdings Co., Ltd. | | | 2,000 | | | | 55 | | |
Nippon Prologis, Inc. REIT | | | 15 | | | | 31 | | |
Nippon Steel Sumitomo Metal Corp. | | | 7,700 | | | | 172 | | |
Nippon Telegraph & Telephone Corp. | | | 16,100 | | | | 677 | | |
Nippon Television Holdings, Inc. | | | 3,900 | | | | 71 | | |
Nippon Yusen KK | | | 13,015 | | | | 24 | | |
Nissan Motor Co., Ltd. | | | 39,205 | | | | 394 | | |
Nissin Foods Holdings Co., Ltd. | | | 100 | | | | 5 | | |
Nitori Holdings Co., Ltd. | | | 1,600 | | | | 183 | | |
Nitto Denko Corp. | | | 3,100 | | | | 238 | | |
Nomura Holdings, Inc. | | | 84,550 | | | | 499 | | |
Nomura Real Estate Master Fund, Inc. REIT | | | 37 | | | | 56 | | |
Nomura Research Institute Ltd. | | | 110 | | | | 3 | | |
NSK Ltd. | | | 5,853 | | | | 68 | | |
NTT Data Corp. | | | 1,600 | | | | 77 | | |
NTT DoCoMo, Inc. | | | 15,000 | | | | 342 | | |
Obayashi Corp. | | | 21,171 | | | | 202 | | |
Obic Co., Ltd. | | | 2,300 | | | | 101 | | |
Odakyu Electric Railway Co., Ltd. | | | 9,000 | | | | 178 | | |
Oji Holdings Corp. | | | 3,000 | | | | 12 | | |
Olympus Corp. | | | 200 | | | | 7 | | |
The accompanying notes are an integral part of the financial statements.
11
Morgan Stanley Institutional Fund, Inc.
Annual Report — December 31, 2016
Portfolio of Investments (cont'd)
Active International Allocation Portfolio
| | | Shares | | Value
(000) | |
Japan (cont'd) | |
Omron Corp. | | | 5,504 | | | $ | 211 | | |
Ono Pharmaceutical Co., Ltd. | | | 6,700 | | | | 147 | | |
Oriental Land Co., Ltd. | | | 4,300 | | | | 243 | | |
ORIX Corp. | | | 29,760 | | | | 464 | | |
Osaka Gas Co., Ltd. | | | 51,600 | | | | 199 | | |
Otsuka Holdings Co., Ltd. | | | 8,300 | | | | 362 | | |
Panasonic Corp. | | | 21,800 | | | | 222 | | |
Rakuten, Inc. (b) | | | 17,100 | | | | 168 | | |
Resona Holdings, Inc. | | | 21,500 | | | | 110 | | |
Ricoh Co., Ltd. | | | 400 | | | | 3 | | |
Rohm Co., Ltd. | | | 1,505 | | | | 87 | | |
Santen Pharmaceutical Co., Ltd. | | | 7,100 | | | | 87 | | |
SBI Holdings, Inc. | | | 5,300 | | | | 67 | | |
Secom Co., Ltd. | | | 5,085 | | | | 372 | | |
Sega Sammy Holdings, Inc. | | | 2,300 | | | | 34 | | |
Seibu Holdings, Inc. | | | 5,700 | | | | 102 | | |
Seiko Epson Corp. | | | 2,400 | | | | 51 | | |
Sekisui Chemical Co., Ltd. | | | 7,172 | | | | 114 | | |
Sekisui House Ltd. | | | 21,746 | | | | 362 | | |
Seven & I Holdings Co., Ltd. | | | 13,700 | | | | 522 | | |
Seven Bank Ltd. | | | 800 | | | | 2 | | |
Shimamura Co., Ltd. | | | 100 | | | | 12 | | |
Shimano, Inc. | | | 2,250 | | | | 353 | | |
Shimizu Corp. | | | 18,000 | | | | 165 | | |
Shin-Etsu Chemical Co., Ltd. | | | 6,993 | | | | 543 | | |
Shionogi & Co., Ltd. | | | 8,000 | | | | 383 | | |
Shiseido Co., Ltd. | | | 7,400 | | | | 187 | | |
Shizuoka Bank Ltd. (The) | | | 13,000 | | | | 109 | | |
SMC Corp. | | | 1,105 | | | | 264 | | |
SoftBank Group Corp. | | | 13,600 | | | | 904 | | |
Sojitz Corp. | | | 50,300 | | | | 122 | | |
Sompo Holdings, Inc. | | | 5,300 | | | | 180 | | |
Sony Corp. | | | 15,493 | | | | 434 | | |
Sumitomo Chemical Co., Ltd. | | | 11,600 | | | | 55 | | |
Sumitomo Corp. | | | 23,000 | | | | 271 | | |
Sumitomo Electric Industries Ltd. | | | 14,200 | | | | 205 | | |
Sumitomo Heavy Industries Ltd. | | | 2,000 | | | | 13 | | |
Sumitomo Metal Mining Co., Ltd. | | | 6,300 | | | | 81 | | |
Sumitomo Mitsui Financial Group, Inc. | | | 27,800 | | | | 1,061 | | |
Sumitomo Mitsui Trust Holdings, Inc. | | | 8,116 | | | | 290 | | |
Sumitomo Realty & Development Co., Ltd. | | | 6,500 | | | | 173 | | |
Suruga Bank Ltd. | | | 4,000 | | | | 89 | | |
Suzuken Co., Ltd. | | | 2,600 | | | | 85 | | |
Suzuki Motor Corp. | | | 3,100 | | | | 109 | | |
Sysmex Corp. | | | 1,600 | | | | 93 | | |
T&D Holdings, Inc. | | | 9,100 | | | | 120 | | |
Taiheiyo Cement Corp. | | | 18,000 | | | | 57 | | |
Taisei Corp. | | | 48,000 | | | | 336 | | |
Takashimaya Co., Ltd. | | | 4,000 | | | | 33 | | |
Takeda Pharmaceutical Co., Ltd. | | | 13,300 | | | | 550 | | |
TDK Corp. | | | 1,852 | | | | 127 | | |
Teijin Ltd. | | | 221 | | | | 4 | | |
| | | Shares | | Value
(000) | |
Terumo Corp. | | | 7,000 | | | $ | 258 | | |
THK Co., Ltd. | | | 4,700 | | | | 104 | | |
Tobu Railway Co., Ltd. | | | 36,900 | | | | 183 | | |
Toho Co., Ltd. | | | 3,600 | | | | 102 | | |
Tohoku Electric Power Co., Inc. | | | 5,100 | | | | 64 | | |
Tokio Marine Holdings, Inc. | | | 12,320 | | | | 506 | | |
Tokyo Electron Ltd. | | | 1,800 | | | | 170 | | |
Tokyo Gas Co., Ltd. | | | 54,600 | | | | 247 | | |
Tokyu Corp. | | | 18,400 | | | | 135 | | |
Tokyu Fudosan Holdings Corp. | | | 4,700 | | | | 28 | | |
Toppan Printing Co., Ltd. | | | 4,600 | | | | 44 | | |
Toray Industries, Inc. | | | 26,100 | | | | 211 | | |
Toshiba Corp. (b) | | | 56,026 | | | | 136 | | |
TOTO Ltd. | | | 2,100 | | | | 83 | | |
Toyo Suisan Kaisha Ltd. | | | 2,400 | | | | 87 | | |
Toyota Industries Corp. | | | 950 | | | | 45 | | |
Toyota Motor Corp. | | | 36,455 | | | | 2,145 | | |
Toyota Tsusho Corp. | | | 200 | | | | 5 | | |
Trend Micro, Inc. (b) | | | 1,200 | | | | 43 | | |
Unicharm Corp. | | | 9,600 | | | | 210 | | |
United Urban Investment Corp. REIT | | | 29 | | | | 44 | | |
USS Co., Ltd. | | | 4,300 | | | | 69 | | |
West Japan Railway Co. | | | 542 | | | | 33 | | |
Yahoo! Japan Corp. | | | 33,000 | | | | 127 | | |
Yakult Honsha Co., Ltd. | | | 2,100 | | | | 97 | | |
Yamada Denki Co., Ltd. (a) | | | 25,200 | | | | 136 | | |
Yamaha Corp. | | | 4,200 | | | | 128 | | |
Yamaha Motor Co., Ltd. | | | 3,000 | | | | 66 | | |
Yamato Holdings Co., Ltd. | | | 6,135 | | | | 125 | | |
Yaskawa Electric Corp. | | | 3,400 | | | | 53 | | |
| | | | 46,786 | | |
Korea, Republic of (0.0%) | |
Nexon Co., Ltd. | | | 6,300 | | | | 91 | | |
Malta (0.0%) | |
BGP Holdings PLC (b)(e)(f) | | | 72,261 | | | | 2 | | |
Mexico (0.0%) | |
Fresnillo PLC | | | 1,397 | | | | 21 | | |
Netherlands (2.6%) | |
Aegon N.V. | | | 29,744 | | | | 164 | | |
Akzo Nobel N.V. | | | 3,993 | | | | 250 | | |
Altice N.V., Class A (b) | | | 3,200 | | | | 63 | | |
Altice N.V., Class B (b) | | | 1,070 | | | | 21 | | |
ArcelorMittal (b) | | | 25,105 | | | | 185 | | |
ASML Holding N.V. | | | 9,811 | | | | 1,101 | | |
Boskalis Westminster | | | 625 | | | | 22 | | |
CNH Industrial N.V. | | | 8,288 | | | | 72 | | |
Fiat Chrysler Automobiles N.V. | | | 21,124 | | | | 193 | | |
Gemalto N.V. | | | 2,555 | | | | 148 | | |
Heineken Holding N.V. | | | 111 | | | | 8 | | |
Heineken N.V. | | | 2,844 | | | | 213 | | |
ING Groep N.V. | | | 58,897 | | | | 829 | | |
Koninklijke DSM N.V. | | | 2,602 | | | | 156 | | |
The accompanying notes are an integral part of the financial statements.
12
Morgan Stanley Institutional Fund, Inc.
Annual Report — December 31, 2016
Portfolio of Investments (cont'd)
Active International Allocation Portfolio
| | | Shares | | Value
(000) | |
Netherlands (cont'd) | |
Koninklijke KPN N.V. | | | 67,724 | | | $ | 201 | | |
Koninklijke Philips N.V. | | | 23,791 | | | | 726 | | |
Randstad Holding N.V. | | | 2,951 | | | | 160 | | |
RELX N.V. | | | 26,469 | | | | 445 | | |
Unilever N.V. CVA | | | 18,238 | | | | 751 | | |
Wolters Kluwer N.V. | | | 11,696 | | | | 424 | | |
| | | | 6,132 | | |
Norway (0.5%) | |
Akastor ASA (a)(b) | | | 157 | | | | — | @ | |
DNB ASA | | | 20,951 | | | | 311 | | |
Norsk Hydro ASA | | | 22,081 | | | | 106 | | |
Orkla ASA | | | 2,042 | | | | 18 | | |
Statoil ASA | | | 20,800 | | | | 382 | | |
Telenor ASA | | | 13,363 | | | | 200 | | |
Yara International ASA | | | 2,890 | | | | 114 | | |
| | | | 1,131 | | |
Peru (1.8%) | |
Cia de Minas Buenaventura SA ADR | | | 49,900 | | | | 563 | | |
Credicorp Ltd. | | | 17,700 | | | | 2,794 | | |
Southern Copper Corp. | | | 22,300 | | | | 712 | | |
| | | | 4,069 | | |
Philippines (2.3%) | |
Aboitiz Equity Ventures, Inc. | | | 237,950 | | | | 339 | | |
Aboitiz Power Corp. | | | 161,700 | | | | 136 | | |
Ayala Corp. | | | 30,330 | | | | 446 | | |
Ayala Land, Inc. | | | 905,500 | | | | 583 | | |
Bank of the Philippine Islands | | | 96,550 | | | | 172 | | |
BDO Unibank, Inc. | | | 201,420 | | | | 454 | | |
DMCI Holdings, Inc. | | | 514,300 | | | | 137 | | |
Energy Development Corp. | | | 1,206,000 | | | | 125 | | |
Globe Telecom, Inc. | | | 4,270 | | | | 130 | | |
GT Capital Holdings, Inc. | | | 9,860 | | | | 252 | | |
International Container Terminal Services, Inc. | | | 65,320 | | | | 94 | | |
JG Summit Holdings, Inc. | | | 345,550 | | | | 470 | | |
Jollibee Foods Corp. | | | 52,030 | | | | 203 | | |
Metro Pacific Investments Corp. | | | 1,868,000 | | | | 250 | | |
PLDT, Inc. | | | 11,675 | | | | 321 | | |
SM Investments Corp. | | | 29,470 | | | | 388 | | |
SM Prime Holdings, Inc. | | | 977,600 | | | | 557 | | |
Universal Robina Corp. | | | 103,250 | | | | 340 | | |
| | | | 5,397 | | |
Portugal (0.2%) | |
EDP - Energias de Portugal SA | | | 33,841 | | | | 103 | | |
Galp Energia SGPS SA | | | 15,107 | | | | 226 | | |
| | | | 329 | | |
South Africa (0.0%) | |
Mondi PLC | | | 676 | | | | 14 | | |
Spain (2.2%) | |
Abertis Infraestructuras SA | | | 5,546 | | | | 78 | | |
ACS Actividades de Construccion y Servicios SA | | | 2,588 | | | | 82 | | |
| | | Shares | | Value
(000) | |
Aena SA (d) | | | 456 | | | $ | 62 | | |
Amadeus IT Holding SA, Class A | | | 7,946 | | | | 361 | | |
Banco Bilbao Vizcaya Argentaria SA | | | 126,368 | | | | 853 | | |
Banco Santander SA | | | 391,997 | | | | 2,046 | | |
CaixaBank SA | | | 25,650 | | | | 85 | | |
Distribuidora Internacional de Alimentacion SA | | | 5,572 | | | | 27 | | |
Endesa SA (a) | | | 16,926 | | | | 359 | | |
Ferrovial SA | | | 6,612 | | | | 118 | | |
Industria de Diseno Textil SA | | | 7,467 | | | | 255 | | |
Mapfre SA | | | 4,939 | | | | 15 | | |
Red Electrica Corp., SA | | | 20,742 | | | | 392 | | |
Repsol SA | | | 14,739 | | | | 208 | | |
Telefonica SA | | | 19,427 | | | | 180 | | |
Zardoya Otis SA | | | 3,146 | | | | 27 | | |
| | | | 5,148 | | |
Sweden (3.0%) | |
Alfa Laval AB | | | 2,358 | | | | 39 | | |
Assa Abloy AB, Class B | | | 19,039 | | | | 353 | | |
Atlas Copco AB, Class A | | | 14,828 | | | | 452 | | |
Atlas Copco AB, Class B | | | 8,384 | | | | 229 | | |
Boliden AB | | | 317 | | | | 8 | | |
Electrolux AB, Class B | | | 40,350 | | | | 1,002 | | |
Elekta AB, Class B | | | 5,031 | | | | 45 | | |
Getinge AB, Class B | | | 4,638 | | | | 74 | | |
Hennes & Mauritz AB, Class B | | | 10,858 | | | | 302 | | |
Hexagon AB, Class B | | | 8,941 | | | | 319 | | |
Husqvarna AB, Class B | | | 28,002 | | | | 218 | | |
Investor AB, Class B | | | 11,261 | | | | 421 | | |
Lundin Petroleum AB (b) | | | 3,215 | | | | 70 | | |
Nordea Bank AB | | | 56,649 | | | | 630 | | |
Saab AB | | | 1,565 | | | | 59 | | |
Sandvik AB | | | 23,797 | | | | 294 | | |
Securitas AB, Class B | | | 1,530 | | | | 24 | | |
Skandinaviska Enskilda Banken AB, Class A | | | 27,431 | | | | 288 | | |
Skanska AB, Class B | | | 8,209 | | | | 194 | | |
| SKF AB, Class B | | | 5,553 | | | | 102 | | |
Svenska Cellulosa AB SCA, Class B | | | 11,475 | | | | 324 | | |
Svenska Handelsbanken AB, Class A | | | 18,875 | | | | 262 | | |
Swedbank AB, Class A | | | 11,873 | | | | 287 | | |
Swedish Match AB | | | 4,266 | | | | 136 | | |
Tele2 AB, Class B | | | 431 | | | | 3 | | |
Telefonaktiebolaget LM Ericsson, Class B | | | 67,972 | | | | 399 | | |
Telia Co AB | | | 32,120 | | | | 129 | | |
Volvo AB, Class B | | | 25,385 | | | | 297 | | |
| | | | 6,960 | | |
Switzerland (7.2%) | |
ABB Ltd. (Registered) (b) | | | 47,629 | | | | 1,005 | | |
Actelion Ltd. (Registered) (b) | | | 1,864 | | | | 404 | | |
Adecco Group AG (Registered) | | | 4,663 | | | | 305 | | |
Baloise Holding AG (Registered) | | | 913 | | | | 115 | | |
Cie Financiere Richemont SA (Registered) | | | 5,319 | | | | 352 | | |
Coca-Cola HBC AG (b) | | | 424 | | | | 9 | | |
The accompanying notes are an integral part of the financial statements.
13
Morgan Stanley Institutional Fund, Inc.
Annual Report — December 31, 2016
Portfolio of Investments (cont'd)
Active International Allocation Portfolio
| | | Shares | | Value
(000) | |
Switzerland (cont'd) | |
Credit Suisse Group AG (Registered) (b) | | | 30,752 | | | $ | 441 | | |
Galenica AG (Registered) | | | 7 | | | | 8 | | |
Geberit AG (Registered) | | | 1,086 | | | | 435 | | |
Givaudan SA (Registered) | | | 122 | | | | 224 | | |
Julius Baer Group Ltd. (b) | | | 3,275 | | | | 145 | | |
LafargeHolcim Ltd. (Registered) (b) | | | 9,623 | | | | 507 | | |
LafargeHolcim Ltd. (Registered) (b) | | | 3,101 | | | | 163 | | |
Lonza Group AG (Registered) (b) | | | 1,154 | | | | 200 | | |
Nestle SA (Registered) | | | 50,101 | | | | 3,594 | | |
Novartis AG (Registered) | | | 36,153 | | | | 2,631 | | |
Pargesa Holding SA | | | 107 | | | | 7 | | |
Partners Group Holding AG | | | 198 | | | | 93 | | |
Roche Holding AG (Genusschein) | | | 11,020 | | | | 2,517 | | |
Schindler Holding AG | | | 782 | | | | 138 | | |
SGS SA (Registered) | | | 18 | | | | 37 | | |
Sonova Holding AG (Registered) | | | 559 | | | | 68 | | |
Swatch Group AG (The) | | | 318 | | | | 99 | | |
Swatch Group AG (The) (Registered) | | | 460 | | | | 28 | | |
Swiss Life Holding AG (Registered) (b) | | | 1,023 | | | | 289 | | |
Swiss Prime Site AG (Registered) (b) | | | 2,367 | | | | 194 | | |
Swisscom AG (Registered) | | | 594 | | | | 266 | | |
Syngenta AG (b) | | | 1,524 | | | | 604 | | |
UBS Group AG (Registered) | | | 72,670 | | | | 1,138 | | |
Zurich Insurance Group AG (b) | | | 2,398 | | | | 660 | | |
| | | | 16,676 | | |
Thailand (1.0%) | |
Advanced Info Service PCL | | | 26,900 | | | | 110 | | |
Airports of Thailand PCL | | | 12,300 | | | | 137 | | |
Bangkok Dusit Medical Services PCL | | | 120,300 | | | | 78 | | |
Bangkok Expressway & Metro PCL | | | 212,600 | | | | 44 | | |
Bumrungrad Hospital PCL | | | 10,100 | | | | 51 | | |
Central Pattana PCL | | | 42,800 | | | | 68 | | |
Charoen Pokphand Foods PCL | | | 76,100 | | | | 63 | | |
| CP ALL PCL | | | 131,200 | | | | 229 | | |
Delta Electronics Thailand PCL | | | 21,100 | | | | 48 | | |
Home Product Center PCL | | | 161,400 | | | | 46 | | |
Indorama Ventures PCL | | | 45,100 | | | | 42 | | |
IRPC PCL | | | 369,500 | | | | 50 | | |
Kasikornbank PCL (Foreign) | | | 45,500 | | | | 226 | | |
Krung Thai Bank PCL | | | 132,300 | | | | 65 | | |
Minor International PCL | | | 58,600 | | | | 59 | | |
PTT Exploration & Production PCL | | | 44,700 | | | | 120 | | |
PTT Global Chemical PCL | | | 59,400 | | | | 104 | | |
PTT PCL | | | 26,400 | | | | 274 | | |
Siam Cement PCL (The) (Foreign) | | | 11,500 | | | | 160 | | |
Siam Commercial Bank PCL | | | 46,700 | | | | 199 | | |
Thai Oil PCL | | | 30,800 | | | | 62 | | |
True Corp. PCL | | | 261,300 | | | | 52 | | |
| | | | 2,287 | | |
| | | Shares | | Value
(000) | |
United Kingdom (12.7%) | |
| 3i Group PLC | | | 7,590 | | | $ | 66 | | |
Aberdeen Asset Management PLC | | | 10,484 | | | | 33 | | |
Admiral Group PLC | | | 1,588 | | | | 36 | | |
Aggreko PLC | | | 4,346 | | | | 49 | | |
Amec Foster Wheeler PLC | | | 2,515 | | | | 15 | | |
Anglo American PLC (b) | | | 20,020 | | | | 286 | | |
Ashtead Group PLC | | | 931 | | | | 18 | | |
Associated British Foods PLC | | | 570 | | | | 19 | | |
AstraZeneca PLC | | | 16,326 | | | | 893 | | |
Aviva PLC | | | 57,083 | | | | 342 | | |
Babcock International Group PLC | | | 4,169 | | | | 49 | | |
BAE Systems PLC | | | 69,815 | | | | 509 | | |
Barclays PLC | | | 250,224 | | | | 689 | | |
Barratt Developments PLC | | | 19,177 | | | | 109 | | |
BHP Billiton PLC | | | 31,679 | | | | 510 | | |
| BP PLC | | | 310,536 | | | | 1,950 | | |
British American Tobacco PLC | | | 19,834 | | | | 1,130 | | |
British Land Co., PLC REIT | | | 2,284 | | | | 18 | | |
BT Group PLC | | | 126,389 | | | | 572 | | |
Bunzl PLC | | | 5,004 | | | | 130 | | |
Burberry Group PLC | | | 4,157 | | | | 77 | | |
Capita PLC | | | 16,220 | | | | 106 | | |
Carnival PLC | | | 2,846 | | | | 145 | | |
Centrica PLC | | | 69,318 | | | | 200 | | |
Cobham PLC | | | 41,494 | | | | 84 | | |
Compass Group PLC | | | 30,700 | | | | 568 | | |
Croda International PLC | | | 1,822 | | | | 72 | | |
Diageo PLC | | | 23,077 | | | | 600 | | |
Dixons Carphone PLC | | | 1,832 | | | | 8 | | |
easyJet PLC | | | 3,216 | | | | 40 | | |
Experian PLC | | | 16,094 | | | | 312 | | |
G4S PLC | | | 10,444 | | | | 30 | | |
GKN PLC | | | 28,664 | | | | 117 | | |
GlaxoSmithKline PLC | | | 62,908 | | | | 1,211 | | |
Glencore PLC (b) | | | 189,340 | | | | 647 | | |
Hammerson PLC REIT | | | 2,117 | | | | 15 | | |
Hargreaves Lansdown PLC | | | 1,234 | | | | 18 | | |
HSBC Holdings PLC | | | 278,523 | | | | 2,255 | | |
Imperial Brands PLC | | | 10,784 | | | | 471 | | |
Indivior PLC | | | 8,539 | | | | 31 | | |
Inmarsat PLC | | | 793 | | | | 7 | | |
InterContinental Hotels Group PLC | | | 4,073 | | | | 183 | | |
International Consolidated Airlines Group SA | | | 5,481 | | | | 30 | | |
International Consolidated Airlines Group SA | | | 4,376 | | | | 24 | | |
Intertek Group PLC | | | 2,408 | | | | 103 | | |
Intu Properties PLC REIT (a) | | | 1,647 | | | | 6 | | |
Investec PLC | | | 5,043 | | | | 33 | | |
ITV PLC | | | 5,540 | | | | 14 | | |
J Sainsbury PLC | | | 18,966 | | | | 58 | | |
Johnson Matthey PLC | | | 2,526 | | | | 99 | | |
Kingfisher PLC | | | 37,488 | | | | 162 | | |
Land Securities Group PLC REIT | | | 2,821 | | | | 37 | | |
The accompanying notes are an integral part of the financial statements.
14
Morgan Stanley Institutional Fund, Inc.
Annual Report — December 31, 2016
Portfolio of Investments (cont'd)
Active International Allocation Portfolio
| | | Shares | | Value
(000) | |
United Kingdom (cont'd) | |
Legal & General Group PLC | | | 55,584 | | | $ | 170 | | |
Lloyds Banking Group PLC | | | 1,358,080 | | | | 1,046 | | |
Lonmin PLC (b) | | | 23 | | | | — | @ | |
Marks & Spencer Group PLC | | | 30,412 | | | | 131 | | |
Meggitt PLC | | | 16,829 | | | | 95 | | |
Melrose Industries PLC | | | 311 | | | | 1 | | |
Merlin Entertainments PLC (d) | | | 1,309 | | | | 7 | | |
National Grid PLC | | | 18,773 | | | | 220 | | |
Next PLC | | | 2,193 | | | | 135 | | |
Old Mutual PLC | | | 42,304 | | | | 108 | | |
Pearson PLC | | | 11,921 | | | | 120 | | |
Persimmon PLC | | | 5,527 | | | | 121 | | |
Petrofac Ltd. | | | 1,866 | | | | 20 | | |
Prudential PLC | | | 28,844 | | | | 579 | | |
Reckitt Benckiser Group PLC | | | 7,146 | | | | 606 | | |
RELX PLC | | | 20,956 | | | | 374 | | |
Rio Tinto PLC | | | 15,657 | | | | 609 | | |
Rolls-Royce Holdings PLC (b) | | | 38,734 | | | | 319 | | |
Royal Dutch Shell PLC, Class A | | | 84,847 | | | | 2,345 | | |
Royal Dutch Shell PLC, Class B | | | 63,857 | | | | 1,853 | | |
Royal Mail PLC | | | 1,495 | | | | 9 | | |
RSA Insurance Group PLC | | | 6,288 | | | | 45 | | |
Sage Group PLC (The) | | | 26,348 | | | | 213 | | |
Schroders PLC | | | 1,066 | | | | 39 | | |
Segro PLC REIT | | | 5,885 | | | | 33 | | |
Severn Trent PLC | | | 1,201 | | | | 33 | | |
Shire PLC | | | 12,610 | | | | 728 | | |
Sky PLC | | | 24,778 | | | | 303 | | |
Smith & Nephew PLC | | | 30,352 | | | | 457 | | |
Smiths Group PLC | | | 8,817 | | | | 154 | | |
SSE PLC | | | 4,912 | | | | 94 | | |
Standard Chartered PLC (b) | | | 45,462 | | | | 372 | | |
Standard Life PLC | | | 14,018 | | | | 64 | | |
Tate & Lyle PLC | | | 734 | | | | 6 | | |
Taylor Wimpey PLC | | | 62,655 | | | | 119 | | |
Tesco PLC (b) | | | 106,131 | | | | 271 | | |
Travis Perkins PLC | | | 460 | | | | 8 | | |
Unilever PLC | | | 13,168 | | | | 534 | | |
United Utilities Group PLC | | | 3,447 | | | | 38 | | |
Vodafone Group PLC | | | 349,272 | | | | 860 | | |
Weir Group PLC (The) | | | 3,513 | | | | 82 | | |
Whitbread PLC | | | 3,377 | | | | 157 | | |
William Hill PLC | | | 1,633 | | | | 6 | | |
WM Morrison Supermarkets PLC | | | 4,346 | | | | 12 | | |
Wolseley PLC | | | 3,404 | | | | 208 | | |
WPP PLC | | | 29,173 | | | | 653 | | |
| | | | 29,543 | | |
United States (0.3%) | |
Grifols SA (a) | | | 6,973 | | | | 139 | | |
IMI PLC | | | 2,247 | | | | 29 | | |
Koninklijke Ahold Delhaize N.V. | | | 13,210 | | | | 278 | | |
| | | Shares | | Value
(000) | |
Li & Fung Ltd. (a)(c) | | | 48,000 | | | $ | 21 | | |
Mobileye N.V. (a)(b) | | | 1,640 | | | | 62 | | |
Tenaris SA | | | 10,797 | | | | 193 | | |
| | | | 722 | | |
Total Common Stocks (Cost $176,812) | | | 200,254 | | |
Short-Term Investments (21.0%) | |
Securities held as Collateral on Loaned Securities (0.3%) | |
Investment Company (0.2%) | |
Morgan Stanley Institutional Liquidity
Funds — Treasury Securities Portfolio —
Institutional Class (See Note G) | | | 463,494 | | | | 463 | | |
| | | Face
Amount
(000) | | | |
Repurchase Agreements (0.1%) | |
Merrill Lynch & Co., Inc., (0.50%,
dated 12/30/16, due 1/3/17; proceeds
$9; fully collateralized by a
U.S. Government obligation; 1.88%
due 8/31/22; valued at $9) | | $ | 9 | | | | 9 | | |
Merrill Lynch & Co., Inc., (0.50%,
dated 12/30/16, due 1/3/17; proceeds
$44; fully collateralized by
U.S. Government agency securities;
2.88% - 4.60% due 11/20/65 - 11/20/66;
valued at $45) | | | 44 | | | | 44 | | |
Merrill Lynch & Co., Inc., (0.81%,
dated 12/30/16, due 1/3/17; proceeds
$65; fully collateralized by Exchange
Traded Funds; valued at $72) | | | 65 | | | | 65 | | |
| | | | 118 | | |
Total Securities held as Collateral on Loaned
Securities (Cost $581) | | | 581 | | |
| | | Shares | | | |
Investment Company (20.7%) | |
Morgan Stanley Institutional Liquidity
Funds — Treasury Securities Portfolio —
Institutional Class (See Note G)
(Cost $48,223) | | | 48,222,817 | | | | 48,223 | | |
Total Short-Term Investments (Cost $48,804) | | | 48,804 | | |
Total Investments (107.1%) (Cost $225,616)
Including $1,202 of Securities Loaned (g)(h) | | | 249,058 | | |
Liabilities in Excess of Other Assets (–7.1%) | | | (16,473 | ) | |
Net Assets (100.0%) | | $ | 232,585 | | |
Country assignments and aggregations are based generally on third party vendor classifications and information, and may be different from the assignments and aggregations under the policies set forth in the Portfolio's prospectus and/or statement of additional information relating to geographic classifications.
(a) All or a portion of this security was on loan at December 31, 2016.
(b) Non-income producing security.
(c) Security trades on the Hong Kong exchange.
(d) 144A security — Certain conditions for public sale may exist. Unless otherwise noted, these securities are deemed to be liquid.
The accompanying notes are an integral part of the financial statements.
15
Morgan Stanley Institutional Fund, Inc.
Annual Report — December 31, 2016
Portfolio of Investments (cont'd)
Active International Allocation Portfolio
(e) At December 31, 2016, the Portfolio held a fair valued security valued at approximately $2,000, representing less than 0.05% of net assets. This security has been fair valued as determined in good faith under procedures established by and under the general supervision of the Fund's Directors.
(f) Security has been deemed illiquid at December 31, 2016.
(g) Securities are available for collateral in connection with open foreign currency forward exchange contracts and futures contracts.
(h) At December 31, 2016, the aggregate cost for federal income tax purposes is approximately $231,695,000. The aggregate gross unrealized appreciation is approximately $27,902,000 and the aggregate gross unrealized depreciation is approximately $10,539,000, resulting in net unrealized appreciation of approximately $17,363,000.
@ Value is less than $500.
ADR American Depositary Receipt.
CDI CHESS Depositary Interest.
CVA Certificaten Van Aandelen.
REIT Real Estate Investment Trust.
Foreign Currency Forward Exchange Contracts:
The Portfolio had the following foreign currency forward exchange contracts open at December 31, 2016:
Counterparty | | Contracts to
Deliver
(000) | | In Exchange
For
(000) | | Delivery
Date | | Unrealized
Appreciation
(Depreciation)
(000) | |
Citibank NA | | EUR | 5,163 | | | $ | 5,505 | | | 1/19/17 | | $ | 66 | | |
Citibank NA | | JPY | 571,233 | | | $ | 4,966 | | | 1/19/17 | | | 74 | | |
Credit Suisse International | | $ | 3,455 | | | AUD | 4,613 | | | 1/19/17 | | | (127 | ) | |
State Street Bank and Trust Co. | | EUR | 2,197 | | | $ | 2,343 | | | 1/19/17 | | | 28 | | |
State Street Bank and Trust Co. | | EUR | 963 | | | $ | 1,007 | | | 1/19/17 | | | (8 | ) | |
State Street Bank and Trust Co. | | GBP | 1,230 | | | $ | 1,562 | | | 1/19/17 | | | 45 | | |
State Street Bank and Trust Co. | | JPY | 618,261 | | | $ | 5,374 | | | 1/19/17 | | | 79 | | |
State Street Bank and Trust Co. | | JPY | 502,960 | | | $ | 4,303 | | | 1/19/17 | | | (4 | ) | |
State Street Bank and Trust Co. | | SEK | 31,321 | | | $ | 3,432 | | | 1/19/17 | | | (9 | ) | |
State Street Bank and Trust Co. | | $ | 1,158 | | | AUD | 1,546 | | | 1/19/17 | | | (42 | ) | |
State Street Bank and Trust Co. | | $ | 18,261 | | | EUR | 17,435 | | | 1/19/17 | | | 108 | | |
State Street Bank and Trust Co. | | $ | 2,608 | | | GBP | 2,055 | | | 1/19/17 | | | (74 | ) | |
State Street Bank and Trust Co. | | $ | 12,765 | | | JPY | 1,487,945 | | | 1/19/17 | | | (22 | ) | |
| | | | | | | | | $ | 114 | | |
Futures Contracts:
The Portfolio had the following futures contracts open at December 31, 2016:
| | | Number
of
Contracts | | Value
(000) | | Expiration
Date | | Unrealized
Appreciation
(Depreciation)
(000) | |
Long: | |
Bovespa Index (Brazil) | | | 160 | | | $ | 3,003 | | | Feb-17 | | $ | 18 | | |
FTSE MIB Index (Italy) | | | 16 | | | | 1,617 | | | Mar-17 | | | 47 | | |
Hang Seng Index (Hong Kong) | | | 9 | | | | 1,275 | | | Jan-17 | | | 18 | | |
MEX BOLSA Index (Mexico) | | | 204 | | | | 4,506 | | | Mar-17 | | | (— | @) | |
S&P TSE 60 Index (Canada) | | | 72 | | | | 9,619 | | | Mar-17 | | | (72 | ) | |
SGX NIFTY 50 (Singapore) | | | 423 | | | | 6,924 | | | Jan-17 | | | 109 | | |
WIG20 Index (Poland) | | | 475 | | | | 4,413 | | | Mar-17 | | | 29 | | |
| | | | | | | | | $ | 149 | | |
@ Value is less than $500.
AUD — Australian Dollar
BRL — Brazilian Real
EUR — Euro
GBP — British Pound
JPY — Japanese Yen
SEK — Swedish Krona
The accompanying notes are an integral part of the financial statements.
16
Morgan Stanley Institutional Fund, Inc.
Annual Report — December 31, 2016
Portfolio of Investments (cont'd)
Active International Allocation Portfolio
Portfolio Composition*
Classification | | Percentage of
Total Investments | |
Other** | | | 61.9 | % | |
Short-Term Investment | | | 19.4 | | |
Banks | | | 12.9 | | |
Pharmaceuticals | | | 5.8 | | |
Total Investments | | | 100.0 | %*** | |
* Percentages indicated are based upon total investments (excluding Securities held as Collateral on Loaned Securities) as of December 31, 2016.
** Industries and/or investment types representing less than 5% of total investments.
*** Does not include open long futures contracts with an underlying face amount of approximately $31,357,000 with net unrealized appreciation of approximately $149,000. Does not include open foreign currency forward exchange contracts with net unrealized appreciation of approximately $114,000.
The accompanying notes are an integral part of the financial statements.
17
Morgan Stanley Institutional Fund, Inc.
Annual Report — December 31, 2016
Active International Allocation Portfolio
Statement of Assets and Liabilities | | December 31, 2016
(000) | |
Assets: | |
Investments in Securities of Unaffiliated Issuers, at Value(1) (Cost $175,908) | | $ | 199,802 | | |
Investments in Securities of Affiliated Issuers, at Value (Cost $49,708) | | | 49,256 | | |
Total Investments in Securities, at Value (Cost $225,616) | | | 249,058 | | |
Foreign Currency, at Value (Cost $2,960) | | | 2,982 | | |
Cash | | | 2,726 | | |
Receivable for Variation Margin on Futures Contracts | | | 2,493 | | |
Unrealized Appreciation on Foreign Currency Forward Exchange Contracts | | | 400 | | |
Tax Reclaim Receivable | | | 280 | | |
Dividends Receivable | | | 203 | | |
Receivable for Portfolio Shares Sold | | | 116 | | |
Receivable for Investments Sold | | | 71 | | |
Receivable from Affiliate | | | 3 | | |
Other Assets | | | 43 | | |
Total Assets | | | 258,375 | | |
Liabilities: | |
Payable for Investments Purchased | | | 23,129 | | |
Payable for Portfolio Shares Redeemed | | | 1,053 | | |
Collateral on Securities Loaned, at Value | | | 582 | | |
Payable for Advisory Fees | | | 481 | | |
Unrealized Depreciation on Foreign Currency Forward Exchange Contracts | | | 286 | | |
Payable for Professional Fees | | | 59 | | |
Payable for Sub Transfer Agency Fees — Class I | | | 23 | | |
Payable for Sub Transfer Agency Fees — Class A | | | 22 | | |
Payable for Sub Transfer Agency Fees — Class L | | | 4 | | |
Payable for Sub Transfer Agency Fees — Class C | | | — | @ | |
Payable for Custodian Fees | | | 30 | | |
Payable for Directors' Fees and Expenses | | | 21 | | |
Payable for Administration Fees | | | 16 | | |
Payable for Shareholder Services Fees — Class A | | | 12 | | |
Payable for Distribution and Shareholder Services Fees — Class L | | | 4 | | |
Payable for Distribution and Shareholder Services Fees — Class C | | | — | @ | |
Payable for Transfer Agency Fees — Class I | | | 2 | | |
Payable for Transfer Agency Fees — Class A | | | 4 | | |
Payable for Transfer Agency Fees — Class L | | | 1 | | |
Payable for Transfer Agency Fees — Class C | | | — | @ | |
Other Liabilities | | | 61 | | |
Total Liabilities | | | 25,790 | | |
Net Assets | | $ | 232,585 | | |
Net Assets Consist of: | |
Paid-in-Capital | | $ | 277,759 | | |
Distributions in Excess of Net Investment Income | | | (306 | ) | |
Accumulated Net Realized Loss | | | (68,462 | ) | |
Unrealized Appreciation (Depreciation) on: | |
Investments | | | 23,894 | | |
Investments in Affiliates | | | (452 | ) | |
Futures Contracts | | | 149 | | |
Foreign Currency Forward Exchange Contracts | | | 114 | | |
Foreign Currency Translations | | | (111 | ) | |
Net Assets | | $ | 232,585 | | |
The accompanying notes are an integral part of the financial statements.
18
Morgan Stanley Institutional Fund, Inc.
Annual Report — December 31, 2016
Active International Allocation Portfolio
Statement of Assets and Liabilities (cont'd) | | December 31, 2016
(000) | |
CLASS I: | |
Net Assets | | $ | 169,589 | | |
| Shares Outstanding $0.001 par value shares of beneficial interest (unlimited shares authorized) (not in 000's) | | | 14,338,302 | | |
Net Asset Value, Offering and Redemption Price Per Share | | $ | 11.83 | | |
CLASS A: | |
Net Assets | | $ | 56,934 | | |
| Shares Outstanding $0.001 par value shares of beneficial interest (unlimited shares authorized) (not in 000's) | | | 4,706,788 | | |
Net Asset Value, Redemption Price Per Share | | $ | 12.10 | | |
Maximum Sales Load | | | 5.25 | % | |
Maximum Sales Charge | | $ | 0.67 | | |
Maximum Offering Price Per Share | | $ | 12.77 | | |
CLASS L: | |
Net Assets | | $ | 6,053 | | |
| Shares Outstanding $0.001 par value shares of beneficial interest (unlimited shares authorized) (not in 000's) | | | 502,568 | | |
Net Asset Value, Offering and Redemption Price Per Share | | $ | 12.04 | | |
CLASS C: | |
Net Assets | | $ | 9 | | |
| Shares Outstanding $0.001 par value shares of beneficial interest (unlimited shares authorized) (not in 000's) | | | 717 | | |
Net Asset Value, Offering and Redemption Price Per Share | | $ | 12.15 | | |
(1) Including:
Securities on Loan, at Value: | | $ | 1,202 | | |
@ Amount is less than $500.
The accompanying notes are an integral part of the financial statements.
19
Morgan Stanley Institutional Fund, Inc.
Annual Report — December 31, 2016
Active International Allocation Portfolio
Statement of Operations | | Year Ended
December 31, 2016
(000) | |
Investment Income: | |
Dividends from Securities of Unaffiliated Issuers (Net of $652 of Foreign Taxes Withheld) | | $ | 6,992 | | |
Income from Securities Loaned — Net | | | 100 | | |
Dividends from Securities of Affiliated Issuers (Note G) | | | 72 | | |
Interest from Securities of Unaffiliated Issuers | | | 3 | | |
Total Investment Income | | | 7,167 | | |
Expenses: | |
Advisory Fees (Note B) | | | 1,586 | | |
Shareholder Services Fees — Class A (Note D) | | | 148 | | |
Distribution and Shareholder Services Fees — Class L (Note D) | | | 48 | | |
Distribution and Shareholder Services Fees — Class C (Note D) | | | — | @ | |
Administration Fees (Note C) | | | 195 | | |
Sub Transfer Agency Fees — Class I | | | 66 | | |
Sub Transfer Agency Fees — Class A | | | 88 | | |
Sub Transfer Agency Fees — Class L | | | 14 | | |
Sub Transfer Agency Fees — Class C | | | — | @ | |
Professional Fees | | | 135 | | |
Custodian Fees (Note F) | | | 77 | | |
Shareholder Reporting Fees | | | 59 | | |
Registration Fees | | | 56 | | |
Pricing Fees | | | 55 | | |
Transfer Agency Fees — Class I (Note E) | | | 9 | | |
Transfer Agency Fees — Class A (Note E) | | | 13 | | |
Transfer Agency Fees — Class L (Note E) | | | 4 | | |
Transfer Agency Fees — Class C (Note E) | | | 3 | | |
Directors' Fees and Expenses | | | 8 | | |
Other Expenses | | | 29 | | |
Total Expenses | | | 2,593 | | |
Reimbursement of Class Specific Expenses — Class L (Note B) | | | (— | @) | |
Reimbursement of Class Specific Expenses — Class C (Note B) | | | (3 | ) | |
Rebate from Morgan Stanley Affiliate (Note G) | | | (27 | ) | |
Reimbursement of Custodian Fees (Note F) | | | (415 | ) | |
Net Expenses | | | 2,148 | | |
Net Investment Income | | | 5,019 | | |
Realized Gain (Loss): | |
Investments Sold | | | (20,006 | ) | |
Investments in Affiliates | | | (310 | ) | |
Foreign Currency Forward Exchange Contracts | | | 1,162 | | |
Foreign Currency Transactions | | | (561 | ) | |
Futures Contracts | | | (135 | ) | |
Net Realized Loss | | | (19,850 | ) | |
Change in Unrealized Appreciation (Depreciation): | |
Investments | | | 11,673 | | |
Investments in Affiliates | | | 291 | | |
Foreign Currency Forward Exchange Contracts | | | 60 | | |
Foreign Currency Translations | | | (81 | ) | |
Futures Contracts | | | (112 | ) | |
Net Change in Unrealized Appreciation (Depreciation) | | | 11,831 | | |
Net Realized Loss and Change in Unrealized Appreciation (Depreciation) | | | (8,019 | ) | |
Net Decrease in Net Assets Resulting from Operations | | $ | (3,000 | ) | |
@ Amount is less than $500.
The accompanying notes are an integral part of the financial statements.
20
Morgan Stanley Institutional Fund, Inc.
Annual Report — December 31, 2016
Active International Allocation Portfolio
Statements of Changes in Net Assets | | Year Ended
December 31, 2016
(000) | | Year Ended
December 31, 2015
(000) | |
Increase (Decrease) in Net Assets: | |
Operations: | |
Net Investment Income | | $ | 5,019 | | | $ | 4,651 | | |
Net Realized Loss | | | (19,850 | ) | | | (4,578 | ) | |
Net Change in Unrealized Appreciation (Depreciation) | | | 11,831 | | | | (3,740 | ) | |
Net Decrease in Net Assets Resulting from Operations | | | (3,000 | ) | | | (3,667 | ) | |
Distributions from and/or in Excess of: | |
Class I: | |
Net Investment Income | | | (4,058 | ) | | | (1,928 | ) | |
Class A: | |
Net Investment Income | | | (1,111 | ) | | | (382 | ) | |
Class L: | |
Net Investment Income | | | (80 | ) | | | (13 | ) | |
Class C: | |
Net Investment Income | | | — | | | | (— | @) | |
Total Distributions | | | (5,249 | ) | | | (2,323 | ) | |
Capital Share Transactions:(1) | |
Class I: | |
Subscribed | | | 7,873 | | | | 5,523 | | |
Distributions Reinvested | | | 4,046 | | | | 1,915 | | |
Redeemed | | | (34,018 | ) | | | (24,777 | ) | |
Class A: | |
Subscribed | | | 4,280 | | | | 4,676 | | |
Distributions Reinvested | | | 1,094 | | | | 375 | | |
Redeemed | | | (10,963 | ) | | | (11,059 | ) | |
Class L: | |
Subscribed | | | — | | | | 105 | | |
Distributions Reinvested | | | 79 | | | | 13 | | |
Redeemed | | | (1,279 | ) | | | (1,086 | ) | |
Class C: | |
Subscribed | | | 40 | | | | 36 | * | |
Distributions Reinvested | | | — | | | | — | @* | |
Redeemed | | | (60 | ) | | | — | | |
Net Decrease in Net Assets Resulting from Capital Share Transactions | | | (28,908 | ) | | | (24,279 | ) | |
Redemption Fees | | | — | @ | | | — | @ | |
Total Decrease in Net Assets | | | (37,157 | ) | | | (30,269 | ) | |
Net Assets: | |
Beginning of Period | | | 269,742 | | | | 300,011 | | |
End of Period (Including Distributions in Excess of Net Investment Income of $(306) and $(883)) | | $ | 232,585 | | | $ | 269,742 | | |
The accompanying notes are an integral part of the financial statements.
21
Morgan Stanley Institutional Fund, Inc.
Annual Report — December 31, 2016
Active International Allocation Portfolio
Statements of Changes in Net Assets (cont'd) | | Year Ended
December 31, 2016
(000) | | Year Ended
December 31, 2015
(000) | |
(1) Capital Share Transactions: | |
Class I: | |
Shares Subscribed | | | 673 | | | | 428 | | |
Shares Issued on Distributions Reinvested | | | 344 | | | | 154 | | |
Shares Redeemed | | | (2,891 | ) | | | (1,906 | ) | |
Net Decrease in Class I Shares Outstanding | | | (1,874 | ) | | | (1,324 | ) | |
Class A: | |
Shares Subscribed | | | 356 | | | | 352 | | |
Shares Issued on Distributions Reinvested | | | 91 | | | | 29 | | |
Shares Redeemed | | | (913 | ) | | | (834 | ) | |
Net Decrease in Class A Shares Outstanding | | | (466 | ) | | | (453 | ) | |
Class L: | |
Shares Subscribed | | | — | | | | 8 | | |
Shares Issued on Distributions Reinvested | | | 7 | | | | 1 | | |
Shares Redeemed | | | (108 | ) | | | (81 | ) | |
Net Decrease in Class L Shares Outstanding | | | (101 | ) | | | (72 | ) | |
Class C: | |
Shares Subscribed | | | 3 | | | | 3 | * | |
Shares Issued on Distributions Reinvested | | | — | | | | — | @@* | |
Shares Redeemed | | | (5 | ) | | | — | | |
Net Increase (Decrease) in Class C Shares Outstanding | | | (2 | ) | | | 3 | | |
@ Amount is less than $500.
@@ Amount is less than 500 shares.
* For the period April 30, 2015 through December 31, 2015.
The accompanying notes are an integral part of the financial statements.
22
Morgan Stanley Institutional Fund, Inc.
Annual Report — December 31, 2016
Financial Highlights
Active International Allocation Portfolio
| | | Class I | |
| | | Year Ended December 31, | |
Selected Per Share Data and Ratios | | 2016(1) | | 2015 | | 2014 | | 2013 | | 2012 | |
Net Asset Value, Beginning of Period | | $ | 12.20 | | | $ | 12.52 | | | $ | 13.75 | | | $ | 11.65 | | | $ | 10.07 | | |
Income (Loss) from Investment Operations: | |
Net Investment Income (2) | | | 0.26 | | | | 0.22 | | | | 0.34 | | | | 0.22 | | | | 0.23 | | |
Net Realized and Unrealized Gain (Loss) | | | (0.34 | ) | | | (0.42 | ) | | | (1.22 | ) | | | 2.25 | | | | 1.51 | | |
Total from Investment Operations | | | (0.08 | ) | | | (0.20 | ) | | | (0.88 | ) | | | 2.47 | | | | 1.74 | | |
Distributions from and/or in Excess of: | |
Net Investment Income | | | (0.29 | ) | | | (0.12 | ) | | | (0.35 | ) | | | (0.37 | ) | | | (0.16 | ) | |
Redemption Fees | | | 0.00 | (3) | | | 0.00 | (3) | | | 0.00 | (3) | | | 0.00 | (3) | | | 0.00 | (3) | |
Net Asset Value, End of Period | | $ | 11.83 | | | $ | 12.20 | | | $ | 12.52 | | | $ | 13.75 | | | $ | 11.65 | | |
Total Return (4) | | | (0.67 | )% | | | (1.63 | )% | | | (6.37 | )% | | | 21.38 | % | | | 17.30 | % | |
Ratios and Supplemental Data: | |
Net Assets, End of Period (Thousands) | | $ | 169,589 | | | $ | 197,733 | | | $ | 219,467 | | | $ | 260,614 | | | $ | 251,657 | | |
Ratio of Expenses to Average Net Assets (6) | | | 0.76 | %(5) | | | 0.89 | %(5) | | | 0.88 | %(5) | | | 0.83 | %(5) | | | 0.89 | %(5) | |
Ratio of Expenses to Average Net Assets Excluding Non Operating Expenses | | | N/A | | | | N/A | | | | N/A | | | | 0.88 | %(5) | | | N/A | | |
Ratio of Net Investment Income to Average Net Assets (6) | | | 2.18 | %(5) | | | 1.66 | %(5) | | | 2.53 | %(5) | | | 1.71 | %(5) | | | 2.12 | %(5) | |
Ratio of Rebate from Morgan Stanley Affiliates to Average Net Assets | | | 0.01 | % | | | 0.01 | % | | | 0.02 | % | | | 0.02 | % | | | 0.01 | % | |
Portfolio Turnover Rate | | | 40 | % | | | 30 | % | | | 32 | % | | | 36 | % | | | 27 | % | |
(6) Supplemental Information on the Ratios to Average Net Assets: | |
Ratios Before Expense Limitation: | |
Expenses to Average Net Assets | | | 0.94 | % | | | 0.92 | % | | | 0.99 | % | | | 0.99 | % | | | 0.98 | % | |
Net Investment Income to Average Net Assets | | | 2.00 | % | | | 1.63 | % | | | 2.42 | % | | | 1.55 | % | | | 2.03 | % | |
(1) Refer to Note F in the Notes to Financial Statements for discussion of prior period custodian out-of-pocket expenses that were reimbursed in the current period. The amount of the reimbursement was immaterial on a per share basis and did not impact the total return of Class I shares. The Ratio of Expenses to Average Net Assets would have been 0.13% higher and the Ratio of Net Investment Income to Average Net Assets would have been 0.13% lower had the custodian not reimbursed the Portfolio.
(2) Per share amount is based on average shares outstanding.
(3) Amount is less than $0.005 per share.
(4) Calculated based on the net asset value as of the last business day of the period.
(5) The Ratios of Expenses and Net Investment Income reflect the rebate of certain Portfolio expenses in connection with the investments in Morgan Stanley affiliates during the period. The effect of the rebate on the ratios is disclosed in the above table as "Ratio of Rebate from Morgan Stanley Affiliates to Average Net Assets."
The accompanying notes are an integral part of the financial statements.
23
Morgan Stanley Institutional Fund, Inc.
Annual Report — December 31, 2016
Financial Highlights
Active International Allocation Portfolio
| | | Class A | |
| | | Year Ended December 31, | |
Selected Per Share Data and Ratios | | 2016(1) | | 2015 | | 2014 | | 2013 | | 2012 | |
Net Asset Value, Beginning of Period | | $ | 12.47 | | | $ | 12.79 | | | $ | 14.03 | | | $ | 11.89 | | | $ | 10.27 | | |
Income (Loss) from Investment Operations: | |
Net Investment Income (2) | | | 0.21 | | | | 0.17 | | | | 0.30 | | | | 0.11 | | | | 0.20 | | |
Net Realized and Unrealized Gain (Loss) | | | (0.34 | ) | | | (0.42 | ) | | | (1.24 | ) | | | 2.36 | | | | 1.55 | | |
Total from Investment Operations | | | (0.13 | ) | | | (0.25 | ) | | | (0.94 | ) | | | 2.47 | | | | 1.75 | | |
Distributions from and/or in Excess of: | |
Net Investment Income | | | (0.24 | ) | | | (0.07 | ) | | | (0.30 | ) | | | (0.33 | ) | | | (0.13 | ) | |
Redemption Fees | | | 0.00 | (3) | | | 0.00 | (3) | | | 0.00 | (3) | | | 0.00 | (3) | | | 0.00 | (3) | |
Net Asset Value, End of Period | | $ | 12.10 | | | $ | 12.47 | | | $ | 12.79 | | | $ | 14.03 | | | $ | 11.89 | | |
Total Return (4) | | | (1.05 | )% | | | (1.95 | )% | | | (6.70 | )% | | | 20.94 | % | | | 17.05 | % | |
Ratios and Supplemental Data: | |
Net Assets, End of Period (Thousands) | | $ | 56,934 | | | $ | 64,482 | | | $ | 71,938 | | | $ | 90,599 | | | $ | 8,608 | | |
Ratio of Expenses to Average Net Assets (7) | | | 1.14 | %(5) | | | 1.24 | %(5) | | | 1.23 | %(5) | | | 1.09 | %(5)(6) | | | 1.14 | %(5) | |
Ratio of Expenses to Average Net Assets Excluding Non Operating Expenses | | | N/A | | | | N/A | | | | N/A | | | | 1.21 | %(5)(6) | | | N/A | | |
Ratio of Net Investment Income to Average Net Assets (7) | | | 1.79 | %(5) | | | 1.31 | %(5) | | | 2.18 | %(5) | | | 0.84 | %(5) | | | 1.80 | %(5) | |
Ratio of Rebate from Morgan Stanley Affiliates to Average Net Assets | | | 0.01 | % | | | 0.01 | % | | | 0.02 | % | | | 0.02 | % | | | 0.01 | % | |
Portfolio Turnover Rate | | | 40 | % | | | 30 | % | | | 32 | % | | | 36 | % | | | 27 | % | |
(7) Supplemental Information on the Ratios to Average Net Assets: | |
Ratios Before Expense Limitation: | |
Expenses to Average Net Assets | | | 1.32 | % | | | 1.28 | % | | | 1.31 | %(5) | | | 1.25 | %(5) | | | 1.23 | % | |
Net Investment Income to Average Net Assets | | | 1.61 | % | | | 1.27 | % | | | 2.10 | %(5) | | | 0.68 | %(5) | | | 1.71 | % | |
(1) Refer to Note F in the Notes to Financial Statements for discussion of prior period custodian out-of-pocket expenses that were reimbursed in the current period. The amount of the reimbursement was immaterial on a per share basis and did not impact the total return of Class A shares. The Ratio of Expenses to Average Net Assets would have been 0.10% higher and the Ratio of Net Investment Income to Average Net Assets would have been 0.10% lower had the custodian not reimbursed the Portfolio.
(2) Per share amount is based on average shares outstanding.
(3) Amount is less than $0.005 per share.
(4) Calculated based on the net asset value which does not reflect sales charges, if applicable, as of the last business day of the period.
(5) The Ratios of Expenses and Net Investment Income reflect the rebate of certain Portfolio expenses in connection with the investments in Morgan Stanley affiliates during the period. The effect of the rebate on the ratios is disclosed in the above table as "Ratio of Rebate from Morgan Stanley Affiliates to Average Net Assets."
(6) Effective September 16, 2013, the Adviser has agreed to limit the ratio of expenses to average net assets to the maximum ratio of 1.25% for Class A shares. Prior to September 16, 2013, the maximum ratio was 1.15% for Class A shares.
The accompanying notes are an integral part of the financial statements.
24
Morgan Stanley Institutional Fund, Inc.
Annual Report — December 31, 2016
Financial Highlights
Active International Allocation Portfolio
| | | Class L | |
| | | Year Ended December 31, | | Period from
June 14, 2012(2) to | |
Selected Per Share Data and Ratios | | 2016(1) | | 2015 | | 2014 | | 2013 | | December 31, 2012 | |
Net Asset Value, Beginning of Period | | $ | 12.41 | | | $ | 12.74 | | | $ | 13.97 | | | $ | 11.84 | | | $ | 10.09 | | |
Income (Loss) from Investment Operations: | |
Net Investment Income (Loss) (3) | | | 0.14 | | | | 0.11 | | | | 0.23 | | | | 0.12 | | | | (0.02 | ) | |
Net Realized and Unrealized Gain (Loss) | | | (0.35 | ) | | | (0.42 | ) | | | (1.23 | ) | | | 2.27 | | | | 1.91 | | |
Total from Investment Operations | | | (0.21 | ) | | | (0.31 | ) | | | (1.00 | ) | | | 2.39 | | | | 1.89 | | |
Distributions from and/or in Excess of: | |
Net Investment Income | | | (0.16 | ) | | | (0.02 | ) | | | (0.23 | ) | | | (0.26 | ) | | | (0.14 | ) | |
Redemption Fees | | | 0.00 | (4) | | | 0.00 | (4) | | | 0.00 | (4) | | | 0.00 | (4) | | | 0.00 | (4) | |
Net Asset Value, End of Period | | $ | 12.04 | | | $ | 12.41 | | | $ | 12.74 | | | $ | 13.97 | | | $ | 11.84 | | |
Total Return (5) | | | (1.68 | )% | | | (2.44 | )% | | | (7.17 | )% | | | 20.34 | % | | | 18.80 | %(8) | |
Ratios and Supplemental Data: | |
Net Assets, End of Period (Thousands) | | $ | 6,053 | | | $ | 7,495 | | | $ | 8,606 | | | $ | 10,345 | | | $ | 10,246 | | |
Ratio of Expenses to Average Net Assets (10) | | | 1.74 | %(6) | | | 1.74 | %(6) | | | 1.73 | %(6) | | | 1.61 | %(6)(7) | | | 1.63 | %(6)(9) | |
Ratio of Expenses to Average Net Assets Excluding Non Operating Expenses | | | N/A | | | | N/A | | | | N/A | | | | 1.66 | %(6)(7) | | | N/A | | |
Ratio of Net Investment Income (Loss) to Average Net Assets (10) | | | 1.20 | %(6) | | | 0.82 | %(6) | | | 1.68 | %(6) | | | 0.94 | %(6) | | | (0.33 | )%(6)(9) | |
Ratio of Rebate from Morgan Stanley Affiliates to Average Net Assets | | | 0.01 | % | | | 0.01 | % | | | 0.02 | % | | | 0.02 | % | | | 0.02 | %(9) | |
Portfolio Turnover Rate | | | 40 | % | | | 30 | % | | | 32 | % | | | 36 | % | | | 27 | % | |
(10) Supplemental Information on the Ratios to Average Net Assets: | |
Ratios Before Expense Limitation: | |
Expenses to Average Net Assets | | | 1.93 | % | | | 1.87 | % | | | 1.87 | % | | | 1.76 | % | | | 1.79 | %(9) | |
Net Investment Income (Loss) to Average Net Assets | | | 1.01 | % | | | 0.69 | % | | | 1.54 | % | | | 0.79 | % | | | (0.49 | )%(9) | |
(1) Refer to Note F in the Notes to Financial Statements for discussion of prior period custodian out-of-pocket expenses that were reimbursed in the current period. The amount of the reimbursement was immaterial on a per share basis and did not impact the total return of Class L shares. The Ratio of Expenses to Average Net Assets and the Ratio of Net Investment Income to Average Net Assets would be unchanged as the reimbursement of custodian fees was offset against current period expense waivers/reimbursements with no impact to net expenses or net investment income.
(2) Commencement of Offering.
(3) Per share amount is based on average shares outstanding.
(4) Amount is less than $0.005 per share.
(5) Calculated based on the net asset value as of the last business day of the period.
(6) The Ratios of Expenses and Net Investment Income (Loss) reflect the rebate of certain Portfolio expenses in connection with the investments in Morgan Stanley affiliates during the period. The effect of the rebate on the ratios is disclosed in the above table as "Ratio of Rebate from Morgan Stanley Affiliates to Average Net Assets."
(7) Effective September 16, 2013, the Adviser has agreed to limit the ratio of expenses to average net assets to the maximum ratio of 1.75% for Class L shares. Prior to September 16, 2013, the maximum ratio was 1.65% for Class L shares.
(8) Not Annualized.
(9) Annualized.
The accompanying notes are an integral part of the financial statements.
25
Morgan Stanley Institutional Fund, Inc.
Annual Report — December 31, 2016
Financial Highlights
Active International Allocation Portfolio
| | | Class C | |
Selected Per Share Data and Ratios | | Year Ended
December 31, 2016(1) | | Period from
April 30, 2015(2) to
December 31, 2015 | |
Net Asset Value, Beginning of Period | | $ | 12.38 | | | $ | 13.94 | | |
Income (Loss) from Investment Operations: | |
Net Investment Income (Loss) (3) | | | 0.14 | | | | (0.00 | )(4) | |
Net Realized and Unrealized Gain | | | (0.37 | ) | | | (1.53 | ) | |
Total from Investment Operations | | | (0.23 | ) | | | (1.53 | ) | |
Distributions from and/or in Excess of: | |
Net Investment Income | | | — | | | | (0.03 | ) | |
Redemption Fees | | | 0.00 | (4) | | | 0.00 | (4) | |
Net Asset Value, End of Period | | $ | 12.15 | | | $ | 12.38 | | |
Total Return (5) | | | (1.94 | )% | | | (10.96 | )%(7) | |
Ratios and Supplemental Data: | |
Net Assets, End of Period (Thousands) | | $ | 9 | | | $ | 32 | | |
Ratio of Expenses to Average Net Assets (9) | | | 1.99 | %(6) | | | 1.99 | %(6)(8) | |
Ratio of Net Investment Income (Loss) to Average Net Assets (9) | | | 1.19 | %(6) | | | (0.04 | )%(6)(8) | |
Ratio of Rebate from Morgan Stanley Affiliates to Average Net Assets | | | 0.01 | % | | | 0.01 | %(8) | |
Portfolio Turnover Rate | | | 40 | % | | | 30 | % | |
(9) Supplemental Information on the Ratios to Average Net Assets: | |
Ratios Before Expense Limitation: | |
Expense to Average Net Assets | | | 8.58 | % | | | 4.26 | %(8) | |
Net Investment Loss to Average Net Assets | | | (5.40 | )% | | | (2.31 | )%(8) | |
(1) Refer to Note F in the Notes to Financial Statements for discussion of prior period custodian out-of-pocket expenses that were reimbursed in the current period. The amount of the reimbursement was immaterial on a per share basis and did not impact the total return of Class C shares. The Ratio of Expenses to Average Net Assets and the Ratio of Net Investment Income to Average Net Assets would be unchanged as the reimbursement of custodian fees was offset against current period expense waivers/reimbursements with no impact to net expenses or net investment income.
(2) Commencement of Offering.
(3) Per share amount is based on average shares outstanding.
(4) Amount is less than $0.005 per share.
(5) Calculated based on the net asset value which does not reflect sales charges, if applicable, as of the last business day of the period.
(6) The Ratios of Expenses and Net Investment Income (Loss) reflect the rebate of certain Portfolio expenses in connection with the investments in Morgan Stanley affiliates during the period. The effect of the rebate on the ratios is disclosed in the above table as "Ratio of Rebate from Morgan Stanley Affiliates to Average Net Assets."
(7) Not Annualized.
(8) Annualized.
The accompanying notes are an integral part of the financial statements.
26
Morgan Stanley Institutional Fund, Inc.
Annual Report — December 31, 2016
Notes to Financial Statements
Morgan Stanley Institutional Fund, Inc. (the "Fund") is registered under the Investment Company Act of 1940, as amended (the "Act"), as an open-end management investment company. The Fund is comprised of twenty-nine separate, active, diversified and non-diversified portfolios (individually referred to as a "Portfolio", collectively as the "Portfolios"). The Fund applies investment company accounting and reporting guidance.
The accompanying financial statements relate to the Active International Allocation Portfolio. The Portfolio seeks long-term capital appreciation by investing primarily, in accordance with country and sector weightings determined by Morgan Stanley Investment Management Inc. (the "Adviser"), in equity securities of non-U.S. issuers which, in the aggregate, replicate broad market indices.
The Portfolio offers four classes of shares — Class I, Class A, Class L and Class C. On April 30, 2015, the Portfolio suspended offering of Class L shares. Existing Class L shareholders may invest through reinvestment of dividends and distributions.
A. Significant Accounting Policies: The following significant accounting policies are in conformity with U.S. generally accepted accounting principles ("GAAP"). Such policies are consistently followed by the Fund in the preparation of its financial statements. GAAP may require management to make estimates and assumptions that affect the reported amounts and disclosures in the financial statements. Actual results may differ from those estimates.
1. Security Valuation: (1) An equity portfolio security listed or traded on an exchange is valued at its latest reported sales price (or at the exchange official closing price if such exchange reports an official closing price), and if there were no sales on a given day and if there is no official exchange closing price for that day, the security is valued at the mean between the last reported bid and asked prices if such bid and asked prices are available on the relevant exchanges; (2) all other equity portfolio securities for which over-the-counter ("OTC") market quotations are readily available are valued at the latest reported sales price (or at the market official closing price if such market reports an official closing price), and if there was no trading in the security on a given day and if there is no official closing price from relevant markets for that day, the security is valued at the mean between the last reported bid and asked prices if such bid and asked prices are available on the relevant markets. Listed equity securities not traded
on the valuation date with no reported bid and asked prices available on the exchange are valued at the mean between the current bid and asked prices obtained from one or more reputable brokers or dealers. An unlisted equity security that does not trade on the valuation date and for which bid and asked prices from the relevant markets are unavailable is valued at the mean between the current bid and asked prices obtained from one or more reputable brokers or dealers. In cases where a security is traded on more than one exchange, the security is valued on the exchange designated as the primary market; (3) certain portfolio securities may be valued by an outside pricing service/vendor approved by the Fund's Board of Directors (the "Directors"). The pricing service/vendor may employ a pricing model that takes into account, among other things, bids, yield spreads, and/or other market data and specific security characteristics. Alternatively, if a valuation is not available from an outside pricing service/vendor, and the security trades on an exchange, the security may be valued at its latest reported sale price (or at the exchange official closing price if such exchange reports an official closing price), prior to the time when assets are valued. If there are no sales on a given day and if there is no official exchange closing price for that day, the security is valued at the mean between the last reported bid and asked prices if such bid and asked prices are available in the relevant exchanges; (4) futures are valued at the settlement price on the exchange on which they trade or, if a settlement price is unavailable, at the last sale price on the exchange; (5) when market quotations are not readily available, including circumstances under which the Adviser determines that the closing price, last sale price or the mean between the last reported bid and asked prices are not reflective of a security's market value, portfolio securities are valued at their fair value as determined in good faith under procedures established by and under the general supervision of the Directors. Occasionally, developments affecting the closing prices of securities and other assets may occur between the times at which valuations of such securities are determined (that is, close of the foreign market on which the securities trade) and the close of business of the New York Stock Exchange ("NYSE"). If developments occur during such periods that are expected to materially affect the value of such securities, such valuations may be adjusted to reflect the estimated fair value of such securities as of the close of the NYSE, as determined in good faith by the Directors or by the Adviser using a
27
Morgan Stanley Institutional Fund, Inc.
Annual Report — December 31, 2016
Notes to Financial Statements (cont'd)
pricing service and/or procedures approved by the Directors; (6) quotations of foreign portfolio securities, other assets and liabilities and forward contracts stated in foreign currency are translated into U.S. dollar equivalents at the prevailing market rates prior to the close of the NYSE; and (7) investments in mutual funds, including the Morgan Stanley Institutional Liquidity Funds, are valued at the net asset value ("NAV") as of the close of each business day.
The Directors have responsibility for determining in good faith the fair value of the investments, and the Directors may appoint others, such as the Fund's Adviser or a valuation committee, to assist the Directors in determining fair value and to make the actual calculations pursuant to the fair valuation methodologies previously approved by the Directors. Under procedures approved by the Directors, the Fund's Adviser has formed a Valuation Committee whose members are approved by the Directors. The Valuation Committee provides administration and oversight of the Fund's valuation policies and procedures, which are reviewed at least annually by the Directors. These procedures allow the Fund to utilize independent pricing services, quotations from securities and financial instrument dealers, and other market sources to determine fair value.
The Fund has procedures to determine the fair value of securities and other financial instruments for which market prices are not readily available. Under these procedures, the Valuation Committee convenes on a regular and ad hoc basis to review such securities and considers a number of factors, including valuation methodologies and significant unobservable valuation inputs, when arriving at fair value. The Valuation Committee may employ a market-based approach which may use related or comparable assets or liabilities, recent transactions, market multiples, book values, and other relevant information for the investment to determine the fair value of the investment. An income-based valuation approach may also be used in which the anticipated future cash flows of the investment are discounted to calculate fair value. Discounts may also be applied due to the nature or duration of any restrictions on the disposition of the investments. Due to the inherent uncertainty of valuations of such investments, the fair values may differ significantly from the values that would have been used had an active market existed. The Valuation Committee employs various methods for calibrating these valuation approaches including a regular review of valuation methodologies, key inputs and assumptions,
transactional back-testing or disposition analysis, and reviews of any related market activity.
2. Fair Value Measurement: Financial Accounting Standards Board ("FASB") Accounting Standards CodificationTM ("ASC") 820, "Fair Value Measurement" ("ASC 820"), defines fair value as the value that the Fund would receive to sell an investment or pay to transfer a liability in a timely transaction with an independent buyer in the principal market, or in the absence of a principal market, the most advantageous market for the investment or liability. ASC 820 establishes a three-tier hierarchy to distinguish between (1) inputs that reflect the assumptions market participants would use in valuing an asset or liability developed based on market data obtained from sources independent of the reporting entity (observable inputs) and (2) inputs that reflect the reporting entity's own assumptions about the assumptions market participants would use in valuing an asset or liability developed based on the best information available in the circumstances (unobservable inputs) and to establish classification of fair value measurements for disclosure purposes. Various inputs are used in determining the value of the Fund's investments. The inputs are summarized in the three broad levels listed below.
• Level 1 – unadjusted quoted prices in active markets for identical investments
• Level 2 – other significant observable inputs (including quoted prices for similar investments, interest rates, prepayment speeds, credit risk, etc.)
• Level 3 – significant unobservable inputs including the Fund's own assumptions in determining the fair value of investments. Factors considered in making this determination may include, but are not limited to, information obtained by contacting the issuer, analysts, or the appropriate stock exchange (for exchange-traded securities), analysis of the issuer's financial statements or other available documents and, if necessary, available information concerning other securities in similar circumstances
The inputs or methodology used for valuing securities are not necessarily an indication of the risk associated with investing in those securities and the determination of the significance of a particular input to the fair value measurement in its entirety requires judgment and considers factors specific to each security.
28
Morgan Stanley Institutional Fund, Inc.
Annual Report — December 31, 2016
Notes to Financial Statements (cont'd)
The following is a summary of the inputs used to value the Portfolio's investments as of December 31, 2016.
Investment Type | | Level 1
Unadjusted
quoted
prices
(000) | | Level 2
Other
significant
observable
inputs
(000) | | Level 3
Significant
unobservable
inputs
(000) | | Total
(000) | |
Assets: | |
Common Stocks | |
Aerospace & Defense | | $ | 2,558 | | | $ | — | | | $ | — | | | $ | 2,558 | | |
Air Freight & Logistics | | | 454 | | | | — | | | | — | | | | 454 | | |
Airlines | | | 451 | | | | — | | | | — | | | | 451 | | |
Auto Components | | | 2,447 | | | | — | | | | — | | | | 2,447 | | |
Automobiles | | | 7,246 | | | | — | | | | — | | | | 7,246 | | |
Banks | | | 31,830 | | | | 226 | | | | — | | | | 32,056 | | |
Beverages | | | 2,689 | | | | — | | | | — | | | | 2,689 | | |
Biotechnology | | | 1,750 | | | | — | | | | — | | | | 1,750 | | |
Building Products | | | 1,957 | | | | — | | | | — | | | | 1,957 | | |
Capital Markets | | | 4,164 | | | | — | | | | — | | | | 4,164 | | |
Chemicals | | | 5,713 | | | | — | | | | — | | | | 5,713 | | |
Commercial Services &
Supplies | | | 1,071 | | | | — | | | | — | | | | 1,071 | | |
Communications
Equipment | | | 932 | | | | — | | | | — | | | | 932 | | |
Construction & Engineering | | | 2,856 | | | | — | | | | — | | | | 2,856 | | |
Construction Materials | | | 3,108 | | | | — | | | | — | | | | 3,108 | | |
Consumer Finance | | | 176 | | | | — | | | | — | | | | 176 | | |
Containers & Packaging | | | 208 | | | | — | | | | — | | | | 208 | | |
Diversified Consumer
Services | | | 18 | | | | — | | | | — | | | | 18 | | |
Diversified Financial
Services | | | 2,978 | | | | — | | | | — | | | | 2,978 | | |
Diversified
Telecommunication
Services | | | 5,480 | | | | — | | | | — | | | | 5,480 | | |
Electric Utilities | | | 2,632 | | | | — | | | | — | | | | 2,632 | | |
Electrical Equipment | | | 3,725 | | | | — | | | | — | | | | 3,725 | | |
Electronic Equipment,
Instruments &
Components | | | 2,890 | | | | — | | | | — | | | | 2,890 | | |
Energy Equipment &
Services | | | 544 | | | | — | | | | — | | | | 544 | | |
Equity Real Estate
Investment Trusts
(REITs) | | | 2,620 | | | | — | | | | — | | | | 2,620 | | |
Food & Staples Retailing | | | 2,986 | | | | — | | | | — | | | | 2,986 | | |
Food Products | | | 5,527 | | | | — | | | | — | | | | 5,527 | | |
Gas Utilities | | | 770 | | | | — | | | | — | | | | 770 | | |
Health Care Equipment &
Supplies | | | 1,763 | | | | — | | | | — | | | | 1,763 | | |
Health Care Providers &
Services | | | 853 | | | | — | | | | — | | | | 853 | | |
Health Care Technology | | | 3 | | | | — | | | | — | | | | 3 | | |
Hotels, Restaurants &
Leisure | | | 2,320 | | | | — | | | | — | | | | 2,320 | | |
Household Durables | | | 2,898 | | | | — | | | | — | | | | 2,898 | | |
Household Products | | | 1,694 | | | | — | | | | — | | | | 1,694 | | |
Independent Power and
Renewable Electricity
Producers | | | 313 | | | | — | | | | — | | | | 313 | | |
Industrial Conglomerates | | | 4,757 | | | | — | | | | — | | | | 4,757 | | |
Information Technology
Services | | | 1,239 | | | | — | | | | — | | | | 1,239 | | |
Insurance | | | 8,450 | | | | — | | | | — | | | | 8,450 | | |
Investment Type | | Level 1
Unadjusted
quoted
prices
(000) | | Level 2
Other
significant
observable
inputs
(000) | | Level 3
Significant
unobservable
inputs
(000) | | Total
(000) | |
Common Stocks (cont'd) | |
Internet & Direct
Marketing Retail | | $ | 168 | | | $ | — | | | $ | — | | | $ | 168 | | |
Internet Software &
Services | | | 454 | | | | — | | | | — | | | | 454 | | |
Leisure Products | | | 672 | | | | — | | | | — | | | | 672 | | |
Life Sciences Tools &
Services | | | 367 | | | | — | | | | — | | | | 367 | | |
Machinery | | | 5,155 | | | | — | | | | — | | | | 5,155 | | |
Marine | | | 866 | | | | — | | | | — | | | | 866 | | |
Media | | | 2,481 | | | | — | | | | — | | | | 2,481 | | |
Metals & Mining | | | 5,614 | | | | — | | | | — | | | | 5,614 | | |
Multi-Utilities | | | 1,802 | | | | — | | | | — | | | | 1,802 | | |
Multi-line Retail | | | 845 | | | | — | | | | — | | | | 845 | | |
Oil, Gas & Consumable
Fuels | | | 11,969 | | | | — | | | | — | | | | 11,969 | | |
Paper & Forest Products | | | 574 | | | | — | | | | — | | | | 574 | | |
Personal Products | | | 2,645 | | | | — | | | | — | | | | 2,645 | | |
Pharmaceuticals | | | 14,455 | | | | — | | | | — | | | | 14,455 | | |
Professional Services | | | 2,295 | | | | — | | | | — | | | | 2,295 | | |
Real Estate
Management &
Development | | | 4,477 | | | | — | | | | 2 | | | | 4,479 | | |
Road & Rail | | | 2,381 | | | | — | | | | — | | | | 2,381 | | |
Semiconductors &
Semiconductor
Equipment | | | 2,025 | | | | — | | | | — | | | | 2,025 | | |
Software | | | 2,956 | | | | — | | | | — | | | | 2,956 | | |
Specialty Retail | | | 1,628 | | | | — | | | | — | | | | 1,628 | | |
Tech Hardware, Storage &
Peripherals | | | 1,168 | | | | — | | | | — | | | | 1,168 | | |
Textiles, Apparel & Luxury
Goods | | | 1,806 | | | | — | | | | — | | | | 1,806 | | |
Thrifts & Mortgage Finance | | | 28 | | | | — | | | | — | | | | 28 | | |
Tobacco | | | 2,798 | | | | — | | | | — | | | | 2,798 | | |
Trading Companies &
Distributors | | | 2,066 | | | | — | | | | — | | | | 2,066 | | |
Transportation
Infrastructure | | | 770 | | | | — | | | | — | | | | 770 | | |
Water Utilities | | | 71 | | | | — | | | | — | | | | 71 | | |
Wireless
Telecommunication
Services | | | 3,420 | | | | — | | | | — | | | | 3,420 | | |
Total Common Stocks | | | 200,026 | | | | 226 | | | | 2 | | | | 200,254 | | |
Short-Term Investments | |
Investment Company | | | 48,686 | | | | — | | | | — | | | | 48,686 | | |
Repurchase Agreements | | | — | | | | 118 | | | | — | | | | 118 | | |
Total Short-Term
Investments | | | 48,686 | | | | 118 | | | | — | | | | 48,804 | | |
Foreign Currency Forward
Exchange Contracts | | | — | | | | 400 | | | | — | | | | 400 | | |
Futures Contracts | | | 221 | | | | — | | | | — | | | | 221 | | |
Total Assets | | | 248,933 | | | | 744 | | | | 2 | | | | 249,679 | | |
Liabilities: | |
Foreign Currency Forward
Exchange Contracts | | | — | | | | (286 | ) | | | — | | | | (286 | ) | |
Futures Contracts | | | (72 | ) | | | — | | | | — | | | | (72 | ) | |
Total Liabilities | | | (72 | ) | | | (286 | ) | | | — | | | | (358 | ) | |
Total | | $ | 248,861 | | | $ | 458 | | | $ | 2 | | | $ | 249,321 | | |
29
Morgan Stanley Institutional Fund, Inc.
Annual Report — December 31, 2016
Notes to Financial Statements (cont'd)
Transfers between investment levels may occur as the markets fluctuate and/or the availability of data used in an investment's valuation changes. The Portfolio recognizes transfers between the levels as of the end of the period. As of December 31, 2016, securities with a total value of approximately $163,618,000 transferred from Level 2 to Level 1. Securities that were valued using other significant observable inputs at December 31, 2015 were valued using unadjusted quoted prices at December 31, 2016. At December 31, 2015, the fair value of certain securities were adjusted due to developments which occurred between the time of the close of the foreign markets on which they trade and the close of business on the NYSE which resulted in their Level 2 classification.
Following is a reconciliation of investments in which significant unobservable inputs (Level 3) were used in determining fair value.
| | | Common
Stocks
(000) | |
Beginning Balance | | $ | 8 | † | |
Purchases | | | — | | |
Sales | | | (5 | ) | |
Amortization of discount | | | — | | |
Transfers in | | | — | | |
Transfers out | | | — | | |
Corporate actions | | | — | | |
Change in unrealized appreciation (depreciation) | | | 10 | | |
Realized gains (losses) | | | (11 | ) | |
Ending Balance | | $ | 2 | | |
Net change in unrealized appreciation (depreciation) from investments
still held as of December 31, 2016 | | $ | 2 | | |
† Includes one or more securities which are valued at zero.
The following table presents additional information about valuation techniques and inputs used for investments that are measured at fair value and categorized within Level 3 as of December 31, 2016.
| | | Fair Value at
December 31, 2016
(000) | | Valuation
Technique | | Unobservable
Input | | Range | | Selected
Value | | Impact to
Valuation from an
increase in input | |
Real Estate Management & Development | |
Common Stock | | $ | 2 | | | Market Transaction
Method | | Transaction Valuation | | $ | 0.03 | | | $ | 0.03 | | | $ | 0.03 | | | Increase | |
| | | | | | | Discount for Lack of
Marketability | | | 50.0 | % | | | 50.0 | % | | | 50.0 | % | | Decrease | |
3. Repurchase Agreements: The Portfolio may enter into repurchase agreements under which the Portfolio lends cash and takes possession of securities with an agreement that the counterparty will repurchase such securities. In connection with transactions in repurchase agreements, a bank as custodian for the Portfolio takes possession of the underlying securities which are held as collateral, with a market value at least equal to the amount of the repurchase transaction, including principal and accrued interest. To the extent that any repurchase transaction exceeds one business day, the value of the collateral is marked-to-market on a daily basis to determine that the value of the collateral does not decrease below the repurchase price plus accrued interest as earned. If such a decrease occurs, additional collateral will be requested and, when received, will be added to the account to maintain full collateralization. In the event of default on the obligation to repurchase, the Portfolio has the right to liquidate the collateral and apply the proceeds in satisfaction
of the obligation. In the event of default or bankruptcy by the counterparty to the agreement, realization of the collateral proceeds may be subject to cost and delays. The Portfolio, along with other affiliated investment companies, may utilize a joint trading account for the purpose of entering into repurchase agreements.
4. Foreign Currency Translation and Foreign Investments: The books and records of the Portfolio are maintained in U.S. dollars. Foreign currency amounts are translated into U.S. dollars as follows:
– investments, other assets and liabilities at the prevailing rate of exchange on the valuation date;
– investment transactions and investment income at the prevailing rates of exchange on the dates of such transactions.
Although the net assets of the Portfolio are presented at the foreign exchange rates and market values at the close of the period, the Portfolio does not isolate that portion
30
Morgan Stanley Institutional Fund, Inc.
Annual Report — December 31, 2016
Notes to Financial Statements (cont'd)
of the results of operations arising as a result of changes in the foreign exchange rates from the fluctuations arising from changes in the market prices of securities held at period end. Similarly, the Portfolio does not isolate the effect of changes in foreign exchange rates from the fluctuations arising from changes in the market prices of securities sold during the period. Accordingly, realized and unrealized foreign currency gains (losses) on investments in securities are included in the reported net realized and unrealized gains (losses) on investment transactions and balances. However, pursuant to U.S. federal income tax regulations, gains and losses from certain foreign currency transactions and the foreign currency portion of gains and losses realized on sales and maturities of foreign denominated debt securities are treated as ordinary income for U.S. federal income tax purposes.
Net realized gains (losses) on foreign currency transactions represent net foreign exchange gains (losses) from foreign currency forward exchange contracts, disposition of foreign currencies, currency gains (losses) realized between the trade and settlement dates on securities transactions, and the difference between the amount of investment income and foreign withholding taxes recorded on the Portfolio's books and the U.S. dollar equivalent amounts actually received or paid. Net unrealized currency gains (losses) from valuing foreign currency denominated assets and liabilities at period end exchange rates are reflected as a component of unrealized appreciation (depreciation) in the Statement of Assets and Liabilities. The change in unrealized currency gains (losses) on foreign currency translations for the period is reflected in the Statement of Operations.
Foreign security and currency transactions may involve certain considerations and risks not typically associated with those of U.S. dollar denominated transactions as a result of, among other factors, fluctuations of exchange rates in relation to the U.S. dollar, the possibility of lower levels of governmental supervision and regulation of foreign securities markets and the possibility of political or economic instability.
Governmental approval for foreign investments may be required in advance of making an investment under certain circumstances in some countries, and the extent of foreign investments in domestic companies may be subject to limitation in other countries. Foreign ownership
limitations also may be imposed by the charters of individual companies to prevent, among other concerns, violations of foreign investment limitations. As a result, an additional class of shares (identified as "Foreign" in the Portfolio of Investments) may be created and offered for investment. The "local" and "foreign shares" market values may differ. In the absence of trading of the foreign shares in such markets, the Portfolio values the foreign shares at the closing exchange price of the local shares.
5. Derivatives: The Portfolio may, but is not required to, use derivative instruments for a variety of purposes, including hedging, risk management, portfolio management or to earn income. Derivatives are financial instruments whose value is based, in part, on the value of an underlying asset, interest rate, index or financial instrument. Prevailing interest rates and volatility levels, among other things, also affect the value of derivative instruments. A derivative instrument often has risks similar to its underlying asset and may have additional risks, including imperfect correlation between the value of the derivative and the underlying asset, risks of default by the counterparty to certain transactions, magnification of losses incurred due to changes in the market value of the securities, instruments, indices or interest rates to which the derivative instrument relates, risks that the transactions may not be liquid and risks arising from margin requirements. The use of derivatives involves risks that are different from, and possibly greater than, the risks associated with other portfolio investments. Derivatives may involve the use of highly specialized instruments that require investment techniques and risk analyses different from those associated with other portfolio investments. All of the Portfolio's holdings, including derivative instruments, are marked-to-market each day with the change in value reflected in unrealized appreciation (depreciation). Upon disposition, a realized gain or loss is recognized.
Certain derivative transactions may give rise to a form of leverage. Leverage magnifies the potential for gain and the risk of loss. Leverage associated with derivative transactions may cause the Portfolio to liquidate portfolio positions when it may not be advantageous to do so to satisfy its obligations or to meet earmarking or segregation requirements, pursuant to applicable Securities and Exchange Commission rules and regulations, or may cause the Portfolio to be more volatile than if the Portfolio had not been leveraged. Although the Adviser seeks to
31
Morgan Stanley Institutional Fund, Inc.
Annual Report — December 31, 2016
Notes to Financial Statements (cont'd)
use derivatives to further the Portfolio's investment objectives, there is no assurance that the use of derivatives will achieve this result.
Following is a description of the derivative instruments and techniques that the Portfolio used during the period and their associated risks:
Futures: A futures contract is a standardized, exchange-traded agreement to buy or sell a specific quantity of an underlying asset, reference rate or index at a specific price at a specific future time. The value of a futures contract tends to increase and decrease in tandem with the value of the underlying instrument. Depending on the terms of the particular contract, futures contracts are settled through either physical delivery of the underlying instrument on the settlement date or by payment of a cash settlement amount on the settlement date. During the period the futures contract is open, payments are received from or made to the broker based upon changes in the value of the contract (the variation margin). A decision as to whether, when and how to use futures contracts involves the exercise of skill and judgment and even a well-conceived futures transaction may be unsuccessful because of market behavior or unexpected events. In addition to the derivatives risks discussed above, the prices of futures contracts can be highly volatile, using futures contracts can lower total return, and the potential loss from futures contracts can exceed the Portfolio's initial investment in such contracts. No assurance can be given that a liquid market will exist for any particular futures contract at any particular time. There is also the risk of loss by the Portfolio of margin deposits in the event of bankruptcy of a broker with which the Portfolio has open positions in the futures contract.
Foreign Currency Forward Exchange Contracts: In connection with its investments in foreign securities, the Portfolio also entered into contracts with banks, brokers or dealers to purchase or sell securities or foreign currencies at a future date. A foreign currency forward exchange contract ("currency contract") is a negotiated agreement between the contracting parties to exchange a specified amount of currency at a specified future time at a specified rate. The rate can be higher or lower than the spot rate between the currencies that are the subject of the contract. Currency contracts may be used to protect against uncertainty in the level of future foreign
currency exchange rates or to gain or modify exposure to a particular currency. To the extent hedged by the use of currency contracts, the precise matching of the currency contract amounts and the value of the securities involved will not generally be possible because the future value of such securities in foreign currencies will change as a consequence of market movements in the value of those securities between the date on which the contract is entered into and the date it matures. Furthermore, such transactions may reduce or preclude the opportunity for gain if the value of the currency should move in the direction opposite to the position taken. There is additional risk to the extent that currency contracts create exposure to currencies in which the Portfolio's securities are not denominated. Unanticipated changes in currency prices may result in poorer overall performance for the Portfolio than if it had not entered into such contracts. The use of currency contracts involves the risk of loss from the insolvency or bankruptcy of the counterparty to the contract or the failure of the counterparty to make payments or otherwise comply with the terms of the contract. A currency contract is marked-to-market daily and the change in market value is recorded by the Portfolio as unrealized gain or loss. The Portfolio records realized gains (losses) when the currency contract is closed equal to the difference between the value of the currency contract at the time it was opened and the value at the time it was closed.
FASB ASC 815, "Derivatives and Hedging" ("ASC 815"), is intended to improve financial reporting about derivative instruments by requiring enhanced disclosures to enable investors to better understand how and why the Portfolio uses derivative instruments, how these derivative instruments are accounted for and their effects on the Portfolio's financial position and results of operations.
The following tables set forth the fair value of the Portfolio's derivative contracts by primary risk exposure as of December 31, 2016.
| | | Asset Derivatives
Statement of Assets and
Liabilities Location | | Primary Risk
Exposure | | Value
(000) | |
Foreign Currency
Forward Exchange
Contracts | | Unrealized Appreciation on
Foreign Currency Forward
Exchange Contracts | | Currency Risk | | $ | 400 | | |
Futures Contracts | | Variation Margin on
Futures Contracts | | Equity Risk | | | 221 | (a) | |
Total | | | | | | $ | 621 | | |
32
Morgan Stanley Institutional Fund, Inc.
Annual Report — December 31, 2016
Notes to Financial Statements (cont'd)
| | | Liability Derivatives
Statement of Assets and
Liabilities Location | | Primary Risk
Exposure | | Value
(000) | |
Foreign Currency
Forward Exchange
Contracts | | Unrealized Depreciation on
Foreign Currency Forward
Exchange Contracts | | Currency Risk | | $ | (286 | ) | |
Futures Contracts | | Variation Margin on
Futures Contracts | | Equity Risk | | | (72 | )(a) | |
Total | | | | | | $ | (358 | ) | |
(a) This amount represents the cumulative appreciation (depreciation) as reported in the Portfolio of Investments. The Statement of Assets and Liabilities only reflects the current day's net variation margin.
The following tables set forth by primary risk exposure the Portfolio's realized gains (losses) and change in unrealized appreciation (depreciation) by type of derivative contract for the year ended December 31, 2016 in accordance with ASC 815.
Realized Gain (Loss) | |
Primary Risk Exposure | | Derivative Type | | Value
(000) | |
Currency Risk
| | Foreign Currency Forward
Exchange Contracts | | $ | 1,162 | | |
Equity Risk | | Futures Contracts | | | (135 | ) | |
Total | | | | $ | 1,027 | | |
Change in Unrealized Appreciation (Depreciation) | |
Primary Risk Exposure | | Derivative Type | | Value
(000) | |
Currency Risk
| | Foreign Currency Forward
Exchange Contracts | | $ | 60 | | |
Equity Risk | | Futures Contracts | | | (112 | ) | |
Total | | | | $ | (52 | ) | |
At December 31, 2016, the Portfolio's derivative assets and liabilities are as follows:
Gross Amounts of Assets and Liabilities Presented in the
Statement of Assets and Liabilities | |
Derivatives(b) | | Assets(c)
(000) | | Liabilities(c)
(000) | |
Foreign Currency Forward Exchange Contracts | | $ | 400 | | | $ | (286 | ) | |
(b) Excludes exchange traded derivatives.
(c) Absent an event of default or early termination, OTC derivative assets and liabilities are presented gross and not offset in the Statement of Assets and Liabilities.
The Portfolio typically enters into International Swaps and Derivatives Association, Inc. Master Agreements ("ISDA Master Agreements") or similar master agreements (collectively, "Master Agreements") with its contract counterparties for certain OTC derivatives in order to, among other things, reduce its credit risk to counterparties. ISDA Master Agreements include provisions for general obligations, representations, collateral and events of default or termination. Under an ISDA Master Agreement, the Portfolio typically may offset with the counterparty certain
OTC derivative financial instruments' payables and/or receivables with collateral held and/or posted and create one single net payment (close-out netting) in the event of default, termination and/or potential deterioration in the credit quality of the counterparty. Various Master Agreements govern the terms of certain transactions with counterparties, including transactions such as swap, forward, repurchase and reverse repurchase agreements. These Master Agreements typically attempt to reduce the counterparty risk associated with such transactions by specifying credit protection mechanisms and providing standardization that improves legal certainty. Cross-termination provisions under Master Agreements typically provide that a default in connection with one transaction between the Portfolio and a counterparty gives the non-defaulting party the right to terminate any other transactions in place with the defaulting party to create one single net payment due to/due from the defaulting party and may be a feature in certain Master Agreements. In the event the Portfolio exercises its right to terminate a Master Agreement after a counterparty experiences a termination event as defined in the Master Agreement, the return of collateral with market value in excess of the Portfolio's net liability may be delayed or denied.
The following tables present derivative financial instruments that are subject to enforceable netting arrangements as of December 31, 2016.
Gross Amounts Not Offset in the Statement of Assets and Liabilities | |
Counterparty | | Gross Asset
Derivatives
Presented in
Statement of
Assets and
Liabilities
(000) | | Financial
Instrument
(000) | | Collateral
Received
(000) | | Net Amount
(not less
than $0)
(000) | |
Citibank NA | | $ | 140 | | | $ | — | | | $ | — | | | $ | 140 | | |
State Street Bank and Trust Co. | | | 260 | | | | (159 | ) | | | — | | | | 101 | | |
Total | | $ | 400 | | | $ | (159 | ) | | $ | — | | | $ | 241 | | |
Gross Amounts Not Offset in the Statement of Assets and Liabilities | |
Counterparty | | Gross Liability
Derivatives
Presented in
Statement of
Assets and
Liabilities
(000) | | Financial
Instrument
(000) | | Collateral
Pledged
(000) | | Net Amount
(not less
than $0)
(000) | |
Credit Suisse International | | $ | 127 | | | $ | — | | | $ | — | | | $ | 127 | | |
State Street Bank and Trust Co. | | | 159 | | | | (159 | ) | | | — | | | | 0 | | |
Total | | $ | 286 | | | $ | (159 | ) | | $ | — | | | $ | 127 | | |
33
Morgan Stanley Institutional Fund, Inc.
Annual Report — December 31, 2016
Notes to Financial Statements (cont'd)
For the year ended December 31, 2016, the approximate average monthly amount outstanding for each derivative type is as follows:
Foreign Currency Forward Exchange Contracts: | |
Average monthly principal amount | | $ | 27,852,000 | | |
Futures Contracts: | |
Average monthly original value | | $ | 44,354,000 | | |
6. Securities Lending: The Portfolio lends securities to qualified financial institutions, such as broker-dealers, to earn additional income. Any increase or decrease in the fair value of the securities loaned that might occur and any interest earned or dividends declared on those securities during the term of the loan would remain in the Portfolio. The Portfolio would receive cash or securities as collateral in an amount equal to or exceeding 100% of the current fair value of the loaned securities. The collateral is marked-to-market daily by State Street Bank and Trust Company ("State Street"), the securities lending agent, to ensure that a minimum of 100% collateral coverage is maintained.
Based on pre-established guidelines, the securities lending agent invests any cash collateral that is received in an affiliated money market portfolio and repurchase agreements. Securities lending income is generated from the earnings on the invested collateral and borrowing fees, less any rebates owed to the borrowers and compensation to the lending agent, and is recorded as "Income from Securities Loaned — Net" in the Portfolio's Statement of Operations. Risks in securities lending transactions are that a borrower may not provide additional collateral when required or return the securities when due, and that the value of the short-term investments will be less than the amount of cash collateral plus any rebate that is required to be returned to the borrower.
The Portfolio has the right under the lending agreement to recover the securities from the borrower on demand.
The following table presents financial instruments that are subject to enforceable netting arrangements as of December 31, 2016.
Gross Amounts Not Offset in the Statement of Assets and Liabilities | |
Gross Asset
Amounts
Presented in
Statement of
Assets and
Liabilities
(000) | | Financial
Instrument
(000) | | Collateral
Received
(000) | | Net Amount
(not less
than $0)
(000) | |
| $ | 1,202 | (d) | | $ | — | | | $ | (1,202 | )(e)(f) | | $ | 0 | | |
(d) Represents market value of loaned securities at period end.
(e) The Portfolio received cash collateral of approximately $582,000, of which approximately $581,000 was subsequently invested in Repurchase Agreements and Morgan Stanley Institutional Liquidity Funds as reported in the Portfolio of Investments. As of December 31, 2016, there was uninvested cash of approximately $1,000, which is not reflected in the Portfolio of Investments. In addition, the Portfolio received non-cash collateral of approximately $681,000 in the form of U.S. Government obligations, which the Portfolio cannot sell or repledge, and accordingly are not reflected in the Portfolio of Investments.
(f) The actual collateral received is greater than the amount shown here due to overcollateralization.
FASB Accounting Standards Update No. 2014-11 ("ASU No. 2014-11"), "Transfers & Servicing (Topic 860): Repurchase-to-Maturity Transactions, Repurchase Financings, and Disclosures", is intended to provide increased transparency about the types of collateral pledged in securities lending transactions and other similar transactions that are accounted for as secured borrowing.
The following table displays a breakdown of transactions accounted for as secured borrowings, the gross obligations by class of collateral pledged, and the remaining contractual maturity of those transactions as of December 31, 2016.
Remaining Contractual Maturity of the Agreements | |
| | | Overnight and
Continuous
(000) | | <30 days
(000) | | Between
30 &
90 days
(000) | | >90 days
(000) | | Total
(000) | |
Securities Lending
Transactions | |
Common Stocks | | $ | 582 | | | $ | — | | | $ | — | | | $ | — | | | $ | 582 | | |
Total Borrowings | | $ | 582 | | | $ | — | | | $ | — | | | $ | — | | | $ | 582 | | |
Gross amount of
recognized liabilities
for securities lending
transactions | | | | | | | | | | $ | 582 | | |
7. Redemption Fees: The Portfolio will assess a 2% redemption fee on Class I shares, Class A shares, Class L and Class C shares, which is paid directly to the Portfolio, for shares redeemed or exchanged within thirty days of purchase, subject to certain exceptions. The redemption fee is designed to protect the Portfolio and its remaining shareholders from the effects of short-term trading. These fees, if any, are included in the Statements of Changes in Net Assets.
8. Indemnifications: The Fund enters into contracts that contain a variety of indemnifications. The Fund's maximum exposure under these arrangements is unknown. However, the Fund has not had prior claims or losses pursuant to these contracts and expects the risk of loss to be remote.
34
Morgan Stanley Institutional Fund, Inc.
Annual Report — December 31, 2016
Notes to Financial Statements (cont'd)
9. Dividends and Distributions to Shareholders: Dividend income and distributions to shareholders are recorded on the ex-dividend date. Dividends from net investment income, if any, are declared and paid annually. Net realized capital gains, if any, are distributed at least annually.
10. Security Transactions, Income and Expenses: Security transactions are accounted for on the trade date (date the order to buy or sell is executed). Realized gains and losses on the sale of investment securities are determined on the specific identified cost method. Dividend income and other distributions are recorded on the ex-dividend date (except for certain foreign dividends which may be recorded as soon as the Portfolio is informed of such dividends) net of applicable withholding taxes. Interest income is recognized on the accrual basis except where collection is in doubt. Discounts are accreted and premiums are amortized over the life of the respective securities. Most expenses of the Fund can be directly attributed to a particular Portfolio. Expenses which cannot be directly attributed are apportioned among the Portfolios based upon relative net assets or other appropriate methods. Income, expenses (other than class specific expenses — distribution and shareholder services, transfer agency and sub transfer agency fees) and realized and unrealized gains or losses are allocated to each class of shares based upon their relative net assets.
The Portfolio owns shares of real estate investment trusts ("REITs") which report information on the source of their distributions annually in the following calendar year. A portion of distributions received from REITs during the year is estimated to be a return of capital and is recorded as a reduction of their cost.
B. Advisory Fees: The Adviser, a wholly-owned subsidiary of Morgan Stanley, provides the Portfolio with advisory services under the terms of an Investment Advisory Agreement, paid quarterly, at the annual rate based on the daily net assets as follows:
First $1
billion | | Over $1
billion | |
| | 0.65 | % | | | 0.60 | % | |
For the year ended December 31, 2016, the advisory fee rate (net of rebate) was equivalent to an annual effective rate of 0.64% of the Portfolio's average daily net assets.
The Adviser has agreed to reduce its advisory fee and/or reimburse the Portfolio so that total annual portfolio operating expenses, excluding certain investment related expenses, taxes, interest and other extraordinary expenses (including litigation), will not exceed 0.90% for Class I shares, 1.25% for Class A shares, 1.75% for Class L shares and 2.00% for Class C shares. The fee waivers and/or expense reimbursements will continue for at least one year from the date of the Portfolio's prospectus or until such time as the Directors act to discontinue all or a portion of such waivers and/or reimbursements when they deem such action is appropriate. For the year ended December 31, 2016, approximately $3,000 of other expenses were reimbursed by the Adviser pursuant to this arrangement.
C. Administration Fees: The Adviser also serves as Administrator to the Fund and provides administrative services pursuant to an Administration Agreement for an annual fee, accrued daily and paid monthly, of 0.08% of the Portfolio's average daily net assets.
Under a Sub-Administration Agreement between the Administrator and State Street, State Street provides certain administrative services to the Fund. For such services, the Administrator pays State Street a portion of the fee the Administrator receives from the Portfolio.
D. Distribution and Shareholder Services Fees: Morgan Stanley Distribution, Inc. ("MSDI" or the "Distributor"), a wholly-owned subsidiary of the Adviser and an indirect subsidiary of Morgan Stanley, serves as the Fund's Distributor of Portfolio shares pursuant to a Distribution Agreement. The Fund has adopted a Shareholder Services Plan with respect to Class A shares pursuant to Rule 12b-1 under the Act. Under the Shareholder Services Plan, the Portfolio pays the Distributor a shareholder services fee, accrued daily and paid monthly, at an annual rate of 0.25% of the Portfolio's average daily net assets attributable to Class A shares.
The Fund has adopted a Distribution and Shareholder Services Plan with respect to Class L shares pursuant to Rule 12b-1 under the Act. Under the Distribution and Shareholder Services Plan, the Portfolio pays the Distributor a distribution fee, accrued daily and paid monthly, at an annual rate of 0.50% and a shareholder services fee, accrued daily and paid monthly, at an annual rate of 0.25% of the Portfolio's average daily net assets attributable to Class L shares.
The Fund has adopted a Distribution and Shareholder Services Plan with respect to Class C shares pursuant to Rule 12b-1 under the Act. Under the Distribution and Shareholder Services
35
Morgan Stanley Institutional Fund, Inc.
Annual Report — December 31, 2016
Notes to Financial Statements (cont'd)
Plan, the Portfolio pays the Distributor a distribution fee, accrued daily and paid monthly, at an annual rate of 0.75% and a shareholder services fee, accrued daily and paid monthly, at an annual rate of 0.25% of the Portfolio's average daily net assets attributable to Class C shares.
The distribution and shareholder services fees are used to support the expenses associated with servicing and maintaining accounts. The Distributor may compensate other parties for providing shareholder support services to investors who purchase Class A, Class L and Class C shares.
E. Dividend Disbursing and Transfer Agent: The Fund's dividend disbursing and transfer agent is Boston Financial Data Services, Inc. ("BFDS"). Pursuant to a Transfer Agency Agreement, the Fund pays BFDS a fee based on the number of classes, accounts and transactions relating to the Portfolios of the Fund.
F. Custodian Fees: State Street (the "Custodian") serves as Custodian for the Fund in accordance with a Custodian Agreement. The Custodian holds cash, securities, and other assets of the Fund as required by the Act. Custody fees are payable monthly based on assets held in custody, investment purchases and sales activity and account maintenance fees, plus reimbursement for certain out-of-pocket expenses.
In December 2015, the Fund's Custodian announced that it had identified inconsistencies in the way in which clients were invoiced for out-of-pocket expenses from 1998 until November 2015. The dollar amount difference between what was charged and what should have been charged, plus interest, was paid back to the Portfolio in September 2016 as a reimbursement. The Custodian reimbursed the Portfolio directly, which was recognized as a change in accounting estimate and was reflected as "Reimbursement of Custodian Fees" in the Statement of Operations. Pursuant to the expense limitations described in Note B, the Portfolio has experienced expenses reimbursed by the Adviser during the current period. Accordingly, the reimbursement of out-of-pocket custodian expenses in the current period resulted in the reduction in the current period expenses reimbursed by the Adviser.
G. Security Transactions and Transactions with Affiliates: For the year ended December 31, 2016, purchases and sales of investment securities for the Portfolio, other than long-term U.S. Government securities and short-term investments, were approximately $88,108,000 and $129,242,000, respectively. There were no purchases and sales of long-term U.S. Government securities for the year ended December 31, 2016.
The Portfolio invests in the Institutional Class of the Morgan Stanley Institutional Liquidity Funds (the "Liquidity Funds"), an open-end management investment company managed by the Adviser, both directly and as a portion of the securities held as collateral on loaned securities. Advisory fees paid by the Portfolio are reduced by an amount equal to its pro-rata share of the advisory and administration fees paid by the Portfolio due to its investment in the Liquidity Funds. For the year ended December 31, 2016, advisory fees paid were reduced by approximately $27,000 relating to the Portfolio's investment in the Liquidity Funds.
A summary of the Portfolio's transactions in shares of the Liquidity Funds during the year ended December 31, 2016 is as follows:
Value
December 31,
2015
(000) | | Purchases
at Cost
(000) | | Sales
(000) | | Dividend
Income
(000) | | Value
December 31,
2016
(000) | |
| $ | 19,365 | | | $ | 150,451 | | | $ | 121,130 | | | $ | 51 | | | $ | 48,686 | | |
The Portfolio had transactions with Mitsubishi UFJ Financial Group, Inc. and its affiliated broker-dealers, which may be deemed affiliates of the Adviser/Administrator and Distributor under Section 17 the Act.
A summary of the Portfolio's transactions in shares of the Mitsubishi UFJ Financial Group, Inc. during the year ended December 31, 2016 is as follows:
Value
December 31,
2015
(000) | | Purchases
at Cost
(000) | | Sales
(000) | | Realized
Loss
(000) | | Dividend
Income
(000) | | Value
December 31,
2016
(000) | |
| $ | 948 | | | $ | — | | | $ | 359 | | | $ | (310 | ) | | $ | 21 | | | $ | 570 | | |
The Portfolio is permitted to purchase and sell securities ("cross-trade") from and to other Morgan Stanley Funds as well as other funds and client accounts for which the Adviser or an affiliate of the Adviser serves as investment adviser, pursuant to procedures approved by the Directors in compliance with Rule 17a-7 under the Act (the "Rule"). Each cross-trade is executed at the current market price in compliance with provisions of the Rule. For the year ended December 31, 2016, the Portfolio did not engage in any cross-trade transactions.
The Portfolio has an unfunded Deferred Compensation Plan (the "Compensation Plan"), which allows each independent Director to defer payment of all, or a portion, of the fees he or she receives for serving on the Board of Directors. Each eligible Director generally may elect to have the deferred amounts credited with a return equal to the total return on one or more of the Morgan Stanley funds that are offered as investment options under the Compensation Plan. Appreciation/depreciation
36
Morgan Stanley Institutional Fund, Inc.
Annual Report — December 31, 2016
Notes to Financial Statements (cont'd)
and distributions received from these investments are recorded with an offsetting increase/decrease in the deferred compensation obligation and do not affect the NAV of the Portfolio.
H. Federal Income Taxes: It is the Portfolio's intention to continue to qualify as a regulated investment company and distribute all of its taxable and tax-exempt income. Accordingly, no provision for federal income taxes is required in the financial statements.
The Portfolio may be subject to taxes imposed by countries in which it invests. Such taxes are generally based on income and/or capital gains earned or repatriated. Taxes are accrued based on net investment income, net realized gains and net unrealized appreciation as such income and/or gains are earned. Taxes may also be based on transactions in foreign currency and are accrued based on the value of investments denominated in such currency.
FASB ASC 740-10, "Income Taxes — Overall", sets forth a minimum threshold for financial statement recognition of the benefit of a tax position taken or expected to be taken in a tax return. Management has concluded that there are no significant uncertain tax positions that would require recognition in the financial statements. If applicable, the Portfolio recognizes interest accrued related to unrecognized tax benefits in "Interest Expense" and penalties in "Other Expenses" in the Statement of Operations. The Portfolio files tax returns with the U.S. Internal Revenue Service, New York and various states. Generally, each of the tax years in the four-year period ended December 31, 2016, remains subject to examination by taxing authorities.
The tax character of distributions paid may differ from the character of distributions shown in the Statements of Changes in Net Assets due to short-term capital gains being treated as ordinary income for tax purposes. The tax character of distributions paid during fiscal years 2016 and 2015 was as follows:
2016
Distributions
Paid From: | | 2015
Distributions
Paid From: | |
Ordinary
Income
(000) | | Long-Term
Capital Gain
(000) | | Ordinary
Income
(000) | | Long-Term
Capital Gain
(000) | |
| $ | 5,249 | | | $ | — | | | $ | 2,323 | | | $ | — | | |
The amount and character of income and gains to be distributed are determined in accordance with income tax regulations which may differ from GAAP. These book/tax differences are either considered temporary or permanent in nature.
Temporary differences are primarily due to differing book and tax treatments in the timing of the recognition of gains (losses) on certain investment transactions and the timing of the deductibility of certain expenses.
Permanent differences, primarily due to differing treatments of gains (losses) related to foreign currency transactions, an expired capital loss carryforward and basis adjustments on certain equity securities designated as passive foreign investment companies, resulted in the following reclassifications among the components of net assets at December 31, 2016:
Distributions
in Excess of Net
Investment
Income
(000) | | Accumulated
Net Realized
Loss
(000) | | Paid-in-
Capital
(000) | |
| $ | 807 | | | $ | 7,027 | | | $ | (7,834 | ) | |
At December 31, 2016, the components of distributable earnings for the Portfolio on a tax basis were as follows:
Undistributed
Ordinary
Income
(000) | | Undistributed
Long-Term
Capital Gain
(000) | |
| $ | 369 | | | $ | — | | |
At December 31, 2016, the Portfolio had available for federal income tax purposes unused short-term capital losses of approximately $4,770,000 and long-term capital losses of approximately $24,650,000 that do not have an expiration date.
In addition, at December 31, 2016, the Portfolio had available capital loss carryforwards to offset future net capital gains, to the extent provided by regulations, through the indicated expiration dates:
Amount
(000) | | Expiration* | |
| $ | 33,505 | | | December 31, 2017 | |
* Includes capital losses acquired from Morgan Stanley International Fund that may be subject to limitation under IRC Section 382 in future years.
During the year ended December 31, 2016, capital loss carryforwards of approximately $7,834,000 expired for federal income tax purposes.
To the extent that capital loss carryforwards are used to offset any future capital gains realized during the carryover period as provided by U.S. federal income tax regulations, no capital gains tax liability will be incurred by the Portfolio for gains realized and not distributed. To the extent that capital gains are offset, such gains will not be distributed to the shareholders.
I. Credit Facility: As of April 4, 2016, the Fund and other Morgan Stanley funds participated in a $150,000,000 committed, unsecured revolving line of credit facility (the "facility")
37
Morgan Stanley Institutional Fund, Inc.
Annual Report — December 31, 2016
Notes to Financial Statements (cont'd)
with State Street. This facility is to be used for temporary emergency purposes or funding of shareholder redemption requests. The interest rate on borrowings is based on the federal funds rate or one month libor rate plus a spread. The facility also has a commitment fee of 0.25% per annum based on the unused portion of the facility. During the year ended December 31, 2016, the Portfolio did not have any borrowings under the facility.
J. Other: At December 31, 2016, the Portfolio had record owners of 10% or greater. Investment activities of these shareholders could have a material impact on the Portfolio. The aggregate percentage of such owners was 85.3%.
K. Accounting Pronouncements: In December 2016, FASB issued Accounting Standards update 2016-19 — Technical Corrections and Improvements ("ASU 2016-19"), which is effective for interim periods for all entities beginning after December 15, 2016. ASU 2016-19 includes an amendment to Topic 820, Fair Value Measurement, which clarifies the difference between a valuation approach and a valuation technique when applying the guidance in that Topic. That amendment also requires an entity to disclose when there has been a change in either or both a valuation approach and/or a valuation technique. The transition guidance for the amendment must be applied prospectively because it could potentially involve the use of hindsight that includes fair value measurements. Although still evaluating the potential impacts of ASU 2016-19 to the Portfolio, management expects that the impact of the Portfolio's adoption will be limited to additional financial statement disclosures.
In October 2016, the Securities and Exchange Commission ("SEC") issued a new rule, Investment Company Reporting Modernization, which, among other provisions, amends Regulation S-X to require standardized, enhanced disclosures, particularly related to derivatives, in investment company financial statements. Compliance with the guidance is effective for financial statements filed with the SEC on or after August 1, 2017; adoption will have no effect on the Portfolio's net assets or results of operations. Although still evaluating the potential impacts of the Investment Company Reporting Modernization to the Portfolio, management expects that the impact of the Portfolio's adoption will be limited to additional financial statement disclosures.
38
Morgan Stanley Institutional Fund, Inc.
Annual Report — December 31, 2016
Report of Independent Registered Public Accounting Firm
To the Shareholders and Board of Directors of
Morgan Stanley Institutional Fund, Inc. —
Active International Allocation Portfolio
We have audited the accompanying statement of assets and liabilities, including the portfolio of investments, of Active International Allocation Portfolio (one of the portfolios constituting Morgan Stanley Institutional Fund, Inc.) (the "Portfolio") as of December 31, 2016, and the related statement of operations for the year then ended, the statements of changes in net assets for each of the two years in the period then ended and the financial highlights for each of the years or periods indicated therein. These financial statements and financial highlights are the responsibility of the Portfolio's management. Our responsibility is to express an opinion on these financial statements and financial highlights based on our audits.
We conducted our audits in accordance with the standards of the Public Company Accounting Oversight Board (United States). Those standards require that we plan and perform the audit to obtain reasonable assurance about whether the financial statements and financial highlights are free of material misstatement. We were not engaged to perform an audit of the Portfolio's internal control over financial reporting. Our audits included consideration of internal control over financial reporting as a basis for designing audit procedures that are appropriate in the circumstances, but not for the purpose of expressing an opinion on the effectiveness of the Portfolio's internal control over financial reporting. Accordingly, we express no such opinion. An audit also includes examining, on a test basis, evidence supporting the amounts and disclosures in the financial statements and financial highlights, assessing the accounting principles used and significant estimates made by management, and evaluating the overall financial statement presentation. Our procedures included confirmation of securities owned as of December 31, 2016, by correspondence with the custodian and others or by other appropriate auditing procedures where replies from others were not received. We believe that our audits provide a reasonable basis for our opinion.
In our opinion, the financial statements and financial highlights referred to above present fairly, in all material respects, the financial position of Active International Allocation Portfolio (one of the portfolios constituting Morgan Stanley Institutional Fund, Inc.) at December 31, 2016, the results of its operations for the year then ended, the changes in its net assets for each of the two years in the period then ended and the financial highlights for each of the years or periods indicated therein, in conformity with U.S. generally accepted accounting principles.

Boston, Massachusetts
February 28, 2017
39
Morgan Stanley Institutional Fund, Inc.
Annual Report — December 31, 2016
Federal Tax Notice (unaudited)
For federal income tax purposes, the following information is furnished with respect to the Portfolio's earnings for its taxable year ended December 31, 2016. When distributed, certain earnings may be subject to a maximum tax rate of 15% as provided for the Jobs and Growth Tax Relief Reconciliation Act of 2003. The Portfolio designated up to a maximum of approximately $5,417,000 as taxable at this lower rate.
The Portfolio intends to pass through foreign tax credits of approximately $416,000 and has derived net income from sources within foreign countries amounting to approximately $7,513,000.
In January, the Portfolio provides tax information to shareholders for the preceding calendar year.
40
Morgan Stanley Institutional Fund, Inc.
Annual Report — December 31, 2016
Privacy Notice (unaudited)
MORGAN STANLEY INVESTMENT MANAGEMENT INC.
AN IMPORTANT NOTICE CONCERNING OUR U.S. PRIVACY POLICY
We are required by federal law to provide you with a copy of our privacy policy annually. This policy applies to current and former individual investors in funds managed or sponsored by Morgan Stanley Investment Management Inc. ("MSIM") as well as current and former individual clients of MSIM. This policy is not applicable to partnerships, corporations, trusts or other non-individual clients or investors. Please note that we may amend this policy at any time, and will inform you of any changes as required by law.
WE RESPECT YOUR PRIVACY
We appreciate that you have provided us with your personal financial information. We strive to maintain the privacy of such information while we help you achieve your financial objectives. This Notice describes what non-public personal information we collect about you, why we collect it, when we may share it with others and how certain others may use it. It discusses the steps you may take to limit our sharing of certain information about you to affiliated companies in the Morgan Stanley family of companies ("other Morgan Stanley companies"). It also discloses how you may limit use of certain shared information for marketing purposes by other Morgan Stanley branded companies. Throughout this policy, we refer to the non-public information that personally identifies you or your accounts as "personal information.''
1. WHAT PERSONAL INFORMATION DO WE COLLECT ABOUT YOU?
We obtain personal information from applications and other forms you submit to us, from your dealings with us, from consumer reporting agencies, from our Web sites and from third parties and other sources.
For example:
• We may collect information such as your name, address, e-mail address, telephone/fax numbers, assets, income and investment objectives through subscription documents, applications and other forms you submit to us.
• We may obtain information about account balances, your use of account(s) and the types of products and services you prefer to receive from us through your dealings and transactions with us and other sources.
• We may obtain information about your creditworthiness and credit history from consumer reporting agencies.
• We may collect background information from and through third-party vendors to verify representations you have made and to comply with various regulatory requirements.
• If you interact with us through our public and private Web sites, we may collect information that you provide directly through online communications (such as an e-mail address). We may also collect information about your Internet service provider, your domain name, your computer's operating system and Web browser, your use of our Web sites and your product and service preferences, through the use of "cookies." Please consult the Terms of Use of these sites for more details.
2. WHEN DO WE DISCLOSE PERSONAL INFORMATION WE COLLECT ABOUT YOU?
We may disclose personal information we collect about you to other Morgan Stanley companies and to non-affiliated third parties.
a. Information We Disclose to Other Morgan Stanley Companies.
We may disclose personal information to other Morgan Stanley companies for a variety of reasons, including to manage your account(s) effectively, to service and process your transactions, to let you know about products and services offered by us and other Morgan Stanley companies, to manage our business, and as otherwise required or permitted by law. Offers for products and services from other Morgan Stanley companies are developed under conditions designed to safeguard your personal information.
41
Morgan Stanley Institutional Fund, Inc.
Annual Report — December 31, 2016
Privacy Notice (unaudited) (cont'd)
b. Information We Disclose to Non-affiliated Third Parties.
We do not disclose personal information that we collect about you to non-affiliated third parties except to those who provide marketing services on our behalf, to financial institutions with whom we have joint marketing agreements, and as otherwise required or permitted by law. For example, we may disclose personal information to nonaffiliated third parties for servicing and processing transactions, to offer our own products and services, to protect against fraud, for institutional risk control, to respond to judicial process or to perform services on our behalf. When we share personal information with a non-affiliated third party, they are required to limit their use of personal information to the particular purpose for which it was shared and they are not allowed to share personal information with others except to fulfill that limited purpose or as may be permitted or required by law.
3. HOW DO WE PROTECT THE SECURITY AND CONFIDENTIALITY OF PERSONAL INFORMATION WE COLLECT ABOUT YOU?
We maintain physical, electronic and procedural security measures to help safeguard the personal information we collect about you. We have internal policies governing the proper handling of client information. Third parties that provide support or marketing services on our behalf may also receive personal information, and we require them to adhere to confidentiality standards with respect to such information.
4. HOW CAN YOU LIMIT THE SHARING OF CERTAIN TYPES OF PERSONAL INFORMATION WITH OTHER MORGAN STANLEY COMPANIES?
We offer you choices as to whether we share with other Morgan Stanley companies the personal information that was collected to determine your eligibility for products and services you request ("eligibility information"). Eligibility information does not include your identification information or personal information pertaining to our transactions or experiences with you. Please note that, even if you direct us not to share eligibility information with other Morgan Stanley companies ("opt-out"), we may still share personal information, including eligibility information, with those companies in circumstances excluded from the opt-out under applicable law, such as to process transactions or to service your account.
5. HOW CAN YOU LIMIT THE USE OF CERTAIN TYPES OF PERSONAL INFORMATION BY OTHER MORGAN STANLEY COMPANIES FOR MARKETING?
By following the opt-out instructions in Section 6 below, you may limit other Morgan Stanley branded companies from marketing their products or services to you based on personal information we disclose to them. This information may include, for example, your income and account history with us. Please note that, even if you choose to limit Other Morgan Stanley Companies from using personal information about you that we may share with them for marketing their products and services to you, Other Morgan Stanley Companies may use your personal information that they obtain from us to market to you in circumstances permitted by law, such as if the Other Morgan Stanley Company has its own relationship with you.
6. HOW CAN YOU SEND US AN OPT-OUT INSTRUCTION?
If you wish to limit our sharing of eligibility information about you with other Morgan Stanley companies or other Morgan Stanley companies' use of personal information for marketing purposes, as described in this notice, you may do so by:
• Calling us at (800) 548-7786
Monday–Friday between 8a.m. and 6p.m.(EST)
• Writing to us at the following address:
Boston Financial Data Services, Inc.
c/o Privacy Coordinator
P.O. Box 219804
Kansas City, Missouri 64121
42
Morgan Stanley Institutional Fund, Inc.
Annual Report — December 31, 2016
Privacy Notice (unaudited) (cont'd)
Your written request should include your name, address, telephone number and account number(s) to which the opt-out applies and whether you are opting out with respect to sharing of eligibility information (Section 4 above), or if information used for Marketing (Section 5 above) or both. Written opt-out requests should not be sent with any other correspondence. In order to process your request, we require that the request be provided by you directly and not through a third party.
Your opt-out preference will remain in effect with respect to this policy (as it may be amended) until you notify us otherwise. If you have a joint account, your direction for us not to share this information with other Morgan Stanley companies and for those other Morgan Stanley companies not to use your personal information for marketing will be applied to all account holders on that account. Please understand that if you limit our sharing or our affiliated companies' use of personal information, you and any joint account holder(s) may not receive information about Morgan Stanley products and services, including products or services that could help you manage your financial resources and achieve your investment objectives.
7. WHAT IF AN AFFILIATED COMPANY BECOMES A NON-AFFILIATED THIRD PARTY?
If, at any time in the future, an affiliated company becomes a non-affiliated third party, further disclosures of personal information made to the former affiliated company will be limited to those described in Section 2(b) above relating to non-affiliated third parties. If you elected under Section 6 to limit disclosures we make to affiliated companies, or use of personal information by affiliated companies, your election will not apply to use by any former affiliated company of your personal information in their possession once it becomes a non-affiliated third party.
SPECIAL NOTICE TO RESIDENTS OF VERMONT
The following section supplements our policy with respect to our individual clients who have a Vermont address and supersedes anything to the contrary in the above policy with respect to those clients only.
The state of Vermont requires financial institutions to obtain your consent prior to sharing personal information that they collect about you with affiliated companies and non-affiliated third parties other than in certain limited circumstances. Except as permitted by law, we will not share personal information we collect about you with non-affiliated third parties or other Morgan Stanley companies unless you provide us with your written consent to share such information ("opt-in").
If you wish to receive offers for investment products and services offered by or through other Morgan Stanley companies, please notify us in writing at the following address:
Boston Financial Data Services, Inc.
c/o Privacy Coordinator
P.O. Box 219804
Kansas City, Missouri 64121
Your authorization should include your name, address, telephone number and account number(s) to which the opt-in applies and should not be sent with any other correspondence. In order to process your authorization, we require that the authorization be provided by you directly and not through a third party.
SPECIAL NOTICE TO RESIDENTS OF CALIFORNIA
The following section supplements our policy with respect to our individual clients who have a California address and supersedes anything to the contrary in the above policy with respect to those clients only.
In response to a California law, if your account has a California home address, your personal information will not be disclosed to nonaffiliated third parties except as permitted by applicable California law, and we will limit sharing such information with our affiliates to comply with California privacy laws that apply to us.
43
Morgan Stanley Institutional Fund, Inc.
Annual Report — December 31, 2016
Director and Officer Information (unaudited)
Independent Directors:
Name, Age and Address of
Independent Director | | Position(s)
Held with
Registrant | | Length of Time
Served* | | Principal Occupation(s) During Past 5 Years
and Other Relevant Professional Experience | | Number of
Overseen by
Independent
Director** | | Portfolios in
Fund Complex
Other Directorships
Held by Independent
Director*** | |
Frank L. Bowman (72)
c/o Perkins Coie LLP
Counsel to the Independent
Directors
30 Rockefeller Plaza
New York, NY 10112 | | Director | | Since
August
2006 | | President, Strategic Decisions, LLC (consulting) (since February 2009); Director or Trustee of various Morgan Stanley Funds (since August 2006); Chairperson of the Compliance and Insurance Committee (since October 2015); formerly, Chairperson of the Insurance Sub-Committee of the Compliance and Insurance Committee (2007-2015); served as President and Chief Executive Officer of the Nuclear Energy Institute (policy organization) (February 2005-November 2008); retired as Admiral, U.S. Navy after serving over 38 years on active duty including 8 years as Director of the Naval Nuclear Propulsion Program in the Department of the Navy and the U.S. Department of Energy (1996-2004); served as Chief of Naval Personnel (July 1994-September 1996) and on the Joint Staff as Director of Political Military Affairs (June 1992-July 1994); knighted as Honorary Knight Commander of the Most Excellent Order of the British Empire; awarded the Officier de l'Orde National du Mérite by the French Government; elected to the National Academy of Engineering (2009). | | | 90 | | | Director of BP p.l.c.; Director of Naval and Nuclear Technologies LLP; Director Emeritus of the Armed Services YMCA; Director of the U.S. Naval Submarine League; Member of the National Security Advisory Council of the Center for U.S. Global Engagement and a member of the CNA Military Advisory Board; Chairman of the charity J Street Cup Golf; Trustee of Fairhaven United Methodist Church; and Director of other various non-profit organizations. | |
Kathleen A. Dennis (63)
c/o Perkins Coie LLP
Counsel to the Independent Directors
30 Rockefeller Plaza
New York, NY 10112 | | Director | | Since
August
2006 | | President, Cedarwood Associates (mutual fund and investment management consulting) (since July 2006); Chairperson of the Liquidity and Alternatives Sub-Committee of the Investment Committee (since October 2006) and Director or Trustee of various Morgan Stanley Funds (since August 2006); formerly, Senior Managing Director of Victory Capital Management (1993-2006). | | | 91 | | | Director of various non-profit organizations. | |
Nancy C. Everett (61)
c/o Perkins Coie LLP
Counsel to the Independent Directors
30 Rockefeller Plaza
New York, NY 10112 | | Director | | Since
January
2015 | | Chief Executive Officer, Virginia Commonwealth University Investment Company (since November 2015); Owner, OBIR, LLC (institutional investment management consulting) (since June 2014); formerly, Managing Director, BlackRock Inc. (February 2011-December 2013); and Chief Executive Officer, General Motors Asset Management (a/k/a Promark Global Advisors, Inc.) (June 2005-May 2010). | | | 91 | | | Member of Virginia Commonwealth University School of Business Foundation; formerly, Member of Virginia Commonwealth University Board of Visitors (2013-2015); Member of Committee on Directors for Emerging Markets Growth Fund, Inc. (2007-2010); Chairperson of Performance Equity Management, LLC (2006-2010); and Chairperson, GMAM Absolute Return Strategies Fund, LLC (2006-2010). | |
44
Morgan Stanley Institutional Fund, Inc.
Annual Report — December 31, 2016
Director and Officer Information (unaudited) (cont'd)
Independent Directors: (cont'd)
Name, Age and Address of
Independent Director | | Position(s)
Held with
Registrant | | Length of Time
Served* | | Principal Occupation(s) During Past 5 Years
and Other Relevant Professional Experience | | Number of
Overseen by
Independent
Director** | | Portfolios in
Fund Complex
Other Directorships
Held by Independent
Director*** | |
Jakki L. Haussler (59)
c/o Perkins Coie LLP
Counsel to the Independent Directors
30 Rockefeller Plaza
New York, NY 10112 | | Director | | Since
January
2015 | | Chairman and Chief Executive Officer, Opus Capital Group (since January 1996); formerly, Director, Capvest Venture Fund, LP (May 2000-December 2011); Partner, Adena Ventures, LP (July 1999-December 2010); Director, The Victory Funds (February 2005-July 2008). | | | 91 | | | Director of Cincinnati Bell Inc. and Member, Audit Committee and Compensation Committee; Director of Northern Kentucky University Foundation and Member, Investment Committee; Member of Chase College of Law Transactional Law Practice Center Board of Advisors; Director of Best Transport; Director of Chase College of Law Board of Visitors; formerly, Member, University of Cincinnati Foundation Investment Committee; Member, Miami University Board of Visitors (2008-2011); Trustee of Victory Funds (2005-2008) and Chairman, Investment Committee (2007-2008) and Member, Service Provider Committee (2005-2008). | |
Dr. Manuel H. Johnson (67)
c/o Johnson Smick
International, Inc.
220 I Street, N.E. — Suite 200
Washington, D.C. 20002 | | Director | | Since
July
1991 | | Senior Partner, Johnson Smick International, Inc. (consulting firm); Chairperson of the Investment Committee (since October 2006) and Director or Trustee of various Morgan Stanley Funds (since July 1991); Co-Chairman and a founder of the Group of Seven Council (G7C) (international economic commission); formerly, Chairperson of the Audit Committee (July 1991-September 2006), Vice Chairman of the Board of Governors of the Federal Reserve System and Assistant Secretary of the U.S. Treasury. | | | 91 | | | Director of NVR, Inc. (home construction). | |
Joseph J. Kearns (74)
c/o Kearns & Associates LLC
46 E Peninsula Center #385
Rolling Hills Estates, CA 90274-3712 | | Director | | Since
August
1994 | | President, Kearns & Associates LLC (investment consulting); Chairperson of the Audit Committee (since October 2006) and Director or Trustee of various Morgan Stanley Funds (since August 1994); formerly, Deputy Chairperson of the Audit Committee (July 2003-September 2006) and Chairperson of the Audit Committee of various Morgan Stanley Funds (since August 1994); CFO of the J. Paul Getty Trust. | | | 93 | | | Director of Electro Rent Corporation (equipment leasing). Prior to December 31, 2013, Director of The Ford Family Foundation. | |
45
Morgan Stanley Institutional Fund, Inc.
Annual Report — December 31, 2016
Director and Officer Information (unaudited) (cont'd)
Independent Directors: (cont'd)
Name, Age and Address of
Independent Director | | Position(s)
Held with
Registrant | | Length of Time
Served* | | Principal Occupation(s) During Past 5 Years
and Other Relevant Professional Experience | | Number of
Overseen by
Independent
Director** | | Portfolios in
Fund Complex
Other Directorships
Held by Independent
Director*** | |
Michael F. Klein (58)
c/o Perkins Coie LLP
Counsel to the Independent Directors
30 Rockefeller Plaza
New York, NY 10112 | | Director | | Since
August
2006 | | Managing Director, Aetos Capital, LLC (since March 2000); Co-President, Aetos Alternatives Management, LLC (since January 2004) and Co-Chief Executive Officer of Aetos Capital LLC (since August 2013); Chairperson of the Fixed Income Sub-Committee of the Investment Committee (since October 2006) and Director or Trustee of various Morgan Stanley Funds (since August 2006); formerly, Managing Director, Morgan Stanley & Co. Inc. and Morgan Stanley Dean Witter Investment Management, President, various Morgan Stanley Funds (June 1998-March 2000) and Principal, Morgan Stanley & Co. Inc. and Morgan Stanley Dean Witter Investment Management (August 1997-December 1999). | | | 90 | | | Director of certain investment funds managed or sponsored by Aetos Capital, LLC; Director of Sanitized AG and Sanitized Marketing AG (specialty chemicals). | |
Patricia Maleski (56)
c/o Perkins Coie LLP
Counsel to the Independent Directors
30 Rockefeller Plaza
New York, NY 10112 | | Director | | Since
January
2017 | | Management Director, JPMorgan Asset Management (2013-2016); President, JPMorgan Funds (2010-2013), Chief Administrative Officer, JPMorgan Funds (2004-2010), Treasurer, JPMorgan Funds (2003-2004, 2008-2010), and Vice President and Board Liaison, JPMorgan Funds (2001-2004); Managing Director, J.P. Morgan Investment Management Inc. (2001-2013); Vice President of Finance, Pierpont Group (1996-2001); Vice President, Bank of New York (1995-1996); Senior Audit Manager, Price Waterhouse, LLP (1982-1995). | | | 91 | | | None. | |
Michael E. Nugent (80)
522 Fifth Avenue
New York, NY 10036 | | Chair of the Board and Director | | Chair of the Boards since July 2006 and Director since July 1991 | | Chair of the Boards of various Morgan Stanley Funds (since July 2006); Chairperson of the Closed-End Fund Committee (since June 2012) and Director or Trustee of various Morgan Stanley Funds (since July 1991); formerly, Chairperson of the Insurance Committee (until July 2006); General Partner, Triumph Capital, L.P. (private investment partnership) (1988-2013). | | | 92 | | | None. | |
W. Allen Reed (69)
c/o Perkins Coie LLP
Counsel to the Independent Directors
30 Rockefeller Plaza
New York, NY 10112 | | Director | | Since
August
2006 | | Chairperson of the Equity Sub-Committee of the Investment Committee (since October 2006) and Director or Trustee of various Morgan Stanley Funds (since August 2006); formerly, President and CEO of General Motors Asset Management; Chairman and Chief Executive Officer of the GM Trust Bank and Corporate Vice President of General Motors Corporation (August 1994-December 2005). | | | 91 | | | Director of Legg Mason, Inc.; formerly, Director of the Auburn University Foundation (2010-2015). | |
Fergus Reid (84)
c/o Joe Pietryka, Inc.
85 Charles Colman Blvd.
Pawling, NY 12564 | | Director | | Since
June
1992 | | Chairman, Joe Pietryka, Inc.; Chairperson of the Governance Committee and Director or Trustee of various Morgan Stanley Funds (since June 1992). | | | 92 | | | Formerly, Trustee and Director of certain investment companies in the JP Morgan Fund Complex managed by JP Morgan Investment Management Inc. (1987-2012). | |
* This is the earliest date the Director began serving the Morgan Stanley Funds. Each Director serves an indefinite term, until his or her successor is elected.
** The Fund Complex includes (as of December 31, 2016) all open-end and closed-end funds (including all of their portfolios) advised by Morgan Stanley Investment Management Inc. (the "Adviser") and any funds that have an adviser that is an affiliated person of the Adviser (including, but not limited to, Morgan Stanley AIP GP LP).
*** This includes any directorships at public companies and registered investment companies held by the Director at any time during the past five years.
46
Morgan Stanley Institutional Fund, Inc.
Annual Report — December 31, 2016
Director and Officer Information (unaudited) (cont'd)
Executive Officers:
Name, Age and Address of Executive Officer | | Position(s) Held
with
Registrant | | Length of Time
Served* | | Principal Occupation(s) During Past 5 Years | |
John H. Gernon (53)
522 Fifth Avenue
New York, NY 10036 | | President and Principal Executive Officer | | Since
September
2013 | | President and Principal Executive Officer of the Equity and Fixed Income Funds and the Morgan Stanley AIP Funds (since September 2013) and the Liquidity Funds and various money market funds (since May 2014) in the Fund Complex; Managing Director of the Adviser; Head of Product (since 2006). | |
Timothy J. Knierim (58)
522 Fifth Avenue
New York, NY 10036 | | Chief Compliance Officer | | Since
December
2016 | | Managing Director of the Adviser and various entities affiliated with the Adviser; Chief Compliance Officer of various Morgan Stanley Funds and the Adviser (since December 2016) and Chief Compliance Officer of Morgan Stanley AIP GP LP (since 2014). Formerly, Managing Director and Deputy Chief Compliance Officer of the Adviser (2014-2016); and formerly, Chief Compliance Officer of Prudential Investment Management, Inc. (2007-2014). | |
Francis J. Smith (51)
522 Fifth Avenue
New York, NY 10036 | | Treasurer and Principal Financial Officer | | Treasurer since July 2003 and Principal Financial Officer since September 2002 | | Managing Director of the Adviser and various entities affiliated with the Adviser; Treasurer (since July 2003) and Principal Financial Officer of various Morgan Stanley Funds (since September 2002). | |
Mary E. Mullin (49)
522 Fifth Avenue
New York, NY 10036 | | Secretary | | Since
June
1999 | | Executive Director of the Adviser; Secretary of various Morgan Stanley Funds (since June 1999). | |
* This is the earliest date the officer began serving the Morgan Stanley Funds. Each officer serves a one-year term, until his or her successor is elected and qualifies.
47
Morgan Stanley Institutional Fund, Inc.
Annual Report — December 31, 2016
Adviser and Administrator
Morgan Stanley Investment Management Inc.
522 Fifth Avenue
New York, New York 10036
Distributor
Morgan Stanley Distribution, Inc.
522 Fifth Avenue
New York, New York 10036
Dividend Disbursing and Transfer Agent
Boston Financial Data Services, Inc.
2000 Crown Colony Drive
Quincy, Massachusetts 02169
Custodian
State Street Bank and Trust Company
One Lincoln Street
Boston, Massachusetts 02111
Legal Counsel
Dechert LLP
1095 Avenue of the Americas
New York, New York 10036
Counsel to the Independent Directors
Perkins Coie LLP
30 Rockefeller Plaza
New York, New York 10112
Independent Registered Public Accounting Firm
Ernst & Young LLP
200 Clarendon Street
Boston, Massachusetts 02116
Reporting to Shareholders
Each Morgan Stanley fund provides a complete schedule of portfolio holdings in its semi-annual and annual reports within 60 days of the end of the fund's second and fourth fiscal quarters. The semi-annual and annual reports are filed electronically with the Securities and Exchange Commission (SEC) on Form N-CSRS and Form N-CSR, respectively. Morgan Stanley also delivers the semi-annual and annual reports to fund shareholders and makes these reports available on its public website, www.morganstanley.com/im. Each Morgan Stanley fund also files a complete schedule of portfolio holdings with the SEC for the fund's first and third fiscal quarters on Form N-Q. Morgan Stanley does not deliver the reports for the first and third fiscal quarters to shareholders, nor are the reports posted to the Morgan Stanley public website. You may, however, obtain the Form N-Q filings (as well as the Form N-CSR and N-CSRS filings) by accessing the SEC's website, www.sec.gov. You may also review and copy them at the SEC's Public Reference Room in Washington, DC. Information on the operation of the SEC's Public Reference Room may be obtained by calling the SEC toll free at 1 (800) SEC-0330. You can also request copies of these materials, upon payment of a duplicating fee, by electronic request at the SEC's email address (publicinfo@sec.gov) or by writing the Public Reference Room of the SEC, 100 F Street, NE, Washington, DC 20549-0102.
Proxy Voting Policies and Procedures and Proxy Voting Record
You may obtain a copy of the Fund's Proxy Voting Policy and Procedures and information regarding how the Fund voted proxies relating to portfolio securities during the most recent twelve-month period ended June 30, without charge, upon request, by calling toll free 1 (800) 548-7786 or by visiting our website at www.morganstanley.com/im. This information is also available on the SEC's website at www.sec.gov.
This report is authorized for distribution only when preceded or accompanied by a prospectus or summary prospectus of the applicable Portfolio of Morgan Stanley Institutional Fund, Inc., which describes in detail the Portfolio's investment policies, risks, fees and expenses. Please read the prospectus carefully before you invest or send money. For additional information, including information regarding the investments comprising the Portfolio, please visit our website at www.morganstanley.com/im or call toll free 1 (800) 548-7786.
48
(This Page has been left blank intentionally.)
Printed in U.S.A.
This Report has been prepared for shareholders and may be distributed to others only if preceded or accompanied by a current prospectus.
Morgan Stanley Investment Management Inc.
522 Fifth Avenue
New York, New York 10036
© 2017 Morgan Stanley. Morgan Stanley Distribution, Inc.

IFIAIAANN
1709106 EXP. 02.28.18

Morgan Stanley Institutional Fund, Inc.
Advantage Portfolio
Annual Report
December 31, 2016

Morgan Stanley Institutional Fund, Inc.
Annual Report — December 31, 2016
Shareholders' Letter | | | 2 | | |
Expense Example | | | 3 | | |
Investment Overview | | | 4 | | |
Portfolio of Investments | | | 6 | | |
Statement of Assets and Liabilities | | | 8 | | |
Statement of Operations | | | 10 | | |
Statements of Changes in Net Assets | | | 11 | | |
Financial Highlights | | | 13 | | |
Notes to Financial Statements | | | 18 | | |
Report of Independent Registered Public Accounting Firm | | | 27 | | |
Federal Tax Notice | | | 28 | | |
Privacy Notice | | | 29 | | |
Director and Officer Information | | | 32 | | |
This report is authorized for distribution only when preceded or accompanied by a prospectus or summary prospectus of the applicable Portfolio of Morgan Stanley Institutional Fund, Inc. To receive a prospectus and/or statement of additional information (SAI), which contains more complete information such as investment objectives, charges, expenses, policies for voting proxies, risk considerations, and describes in detail each of the Portfolio's investment policies to the prospective investor, please call toll free 1 (800) 548-7786. Please read the prospectuses carefully before you invest or send money.
Additionally, you can access information about the Portfolio, including performance, characteristics, and investment team commentary, through Morgan Stanley Investment Management's website: www.morganstanley.com/im.
Market forecasts provided in this report may not necessarily come to pass. There is no guarantee that any sectors mentioned will continue to perform as discussed herein or that securities in such sectors will be held by the Portfolio in the future. There is no assurance that a Portfolio will achieve its investment objective. Portfolios are subject to market risk, which is the possibility that market values of securities owned by the Portfolio will decline and, therefore, the value of the Portfolio's shares may be less than what you paid for them. Accordingly, you can lose money investing in this Portfolio. Please see the prospectus for more complete information on investment risks.
1
Morgan Stanley Institutional Fund, Inc.
Annual Report — December 31, 2016
Shareholders' Letter (unaudited)
Dear Shareholders,
We are pleased to provide this Annual report, in which you will learn how your investment in Advantage Portfolio (the "Portfolio") performed during the latest twelve-month period.
Morgan Stanley Investment Management is a client-centric, investor-led organization. Our global presence, intellectual capital, and breadth of products and services enable us to partner with investors to meet the evolving challenges of today's financial markets. We aim to deliver superior investment service and to empower our clients to make the informed decisions that help them reach their investment goals.
As always, we thank you for selecting Morgan Stanley Investment Management, and look forward to working with you in the months and years ahead.
Sincerely,

John H. Gernon
President and Principal Executive Officer
January 2017
2
Morgan Stanley Institutional Fund, Inc.
Annual Report — December 31, 2016
Expense Example (unaudited)
Advantage Portfolio
As a shareholder of the Portfolio, you incur two types of costs: (1) transactional costs; and (2) ongoing costs, which may include advisory fees, administration fees, distribution and shareholder services fees and other Portfolio expenses. This example is intended to help you understand your ongoing costs (in dollars) of investing in the Portfolio and to compare these costs with the ongoing costs of investing in other mutual funds.
This example is based on an investment of $1,000 invested at the beginning of the six-month period ended December 31, 2016 and held for the entire six-month period.
Actual Expenses
The table below provides information about actual account values and actual expenses. You may use the information in this table, together with the amount you invested, to estimate the expenses that you paid over the period. Simply divide your account value by $1,000 (for example, an $8,600 account value divided by $1,000 = 8.6), then multiply the result by the number in the table under the heading entitled "Actual Expenses Paid During Period" to estimate the expenses you paid on your account during this period.
Hypothetical Example for Comparison Purposes
The table below provides information about hypothetical account values and hypothetical expenses based on the Portfolio's actual expense ratio and an assumed rate of return of 5% per year before expenses, which is not the Portfolio's actual return. The hypothetical account values and expenses may not be used to estimate the actual ending account balance or expenses you paid for the period. You may use this information to compare the ongoing costs of investing in the Portfolio and other funds. To do so, compare this 5% hypothetical example with the 5% hypothetical examples that appear in the shareholder reports of the other funds.
Please note that the expenses shown in the table are meant to highlight your ongoing costs only and do not reflect any transactional costs, such as sales charges (loads). Therefore, the information for each class in the table is useful in comparing ongoing costs only, and will not help you determine the relative total costs of owning different funds. In addition, if these transactional costs were included, your costs would have been higher.
| | | Beginning
Account
Value
7/1/16 | | Actual Ending
Account
Value
12/31/16 | | Hypothetical
Ending Account
Value | | Actual
Expenses
Paid
During
Period* | | Hypothetical
Expenses Paid
During Period* | | Net
Expense
Ratio
During
Period** | |
Advantage Portfolio Class I | | $ | 1,000.00 | | | $ | 1,029.30 | | | $ | 1,020.91 | | | $ | 4.28 | | | $ | 4.27 | | | | 0.84 | %*** | |
Advantage Portfolio Class A | | | 1,000.00 | | | | 1,027.70 | | | | 1,019.00 | | | | 6.22 | | | | 6.19 | | | | 1.22 | *** | |
Advantage Portfolio Class L | | | 1,000.00 | | | | 1,028.90 | | | | 1,020.81 | | | | 4.39 | | | | 4.37 | | | | 0.86 | *** | |
Advantage Portfolio Class C | | | 1,000.00 | | | | 1,023.60 | | | | 1,015.37 | | | | 9.88 | | | | 9.84 | | | | 1.94 | *** | |
Advantage Portfolio Class IS | | | 1,000.00 | | | | 1,029.70 | | | | 1,021.11 | | | | 4.08 | | | | 4.06 | | | | 0.80 | *** | |
* Expenses are calculated using each Portfolio Class' annualized net expense ratio (as disclosed), multiplied by the average account value over the period, and multiplied by 184/366 (to reflect the most recent one-half year period).
** Annualized.
*** Refer to Note F in the Notes to Financial Statements for discussion of prior period custodian out-of-pocket expenses that were reimbursed in the current period.
3
Morgan Stanley Institutional Fund, Inc.
Annual Report — December 31, 2016
Investment Overview (unaudited)
Advantage Portfolio
The Portfolio seeks long-term capital appreciation.
Performance
For the year ended December 31, 2016, the Portfolio's Class I shares had a total return based on net asset value and reinvestment of distributions per share of 2.82%, net of fees. The Portfolio's Class I shares underperformed the Portfolio's benchmark, the Russell 1000® Growth Index (the "Index"), which returned 7.08%.
Factors Affecting Performance
• The U.S. stock market was overwhelmed by negative news early in 2016, but staged a turnaround over the remainder of the year. Concerns about China's economy, falling oil prices and U.S. Federal Reserve ("Fed") monetary policy weighed heavily on the markets from January through mid-February. From there, oil prices stabilized, economic growth improved, corporate earnings recovered and the Fed refrained from raising interest rates (until its December 2016 meeting), which provided upside to stock prices. Two major political events, the U.K.'s "Brexit" referendum and the election of Donald Trump, were initially viewed as negative surprises, but volatility subsided fairly quickly. Anticipation of pro-growth fiscal policy from the new administration drove share prices sharply higher in the final weeks of the year.
• Large-cap growth stocks, as represented by the Index, were led by the telecommunication services, energy and industrials sectors. Health care (which had a negative return for the period), real estate and consumer staples were the weakest-performing sectors.
• The long-term investment horizon and conviction-weighted investment approach embraced by the team since 1998 can result in periods of performance deviation from the benchmark and peers. In this reporting period, although sector allocation contributed to relative performance, it was offset by unfavorable stock selection.
• The Portfolio's relative underperformance was primarily driven by weak stock selection in the information technology, consumer staples and industrials sectors.
• The health care sector was a positive contributor to relative performance, aided by both strong stock selection and an advantageous underweight to the sector. Although stock selection in the financials sector was detrimental, the relative gain from an overweight in the sector more than compensated for the loss.
Management Strategies
• There were no changes to our bottom-up investment process during the period. We continued to look for franchises with strong name recognition and sustainable competitive advantages. We typically favor companies with rising returns on invested capital, above average business visibility, strong free cash flow generation and an attractive risk/reward profile. Our emphasis is on secular growth, and as a result short-term market events are not as meaningful in the stock selection process.
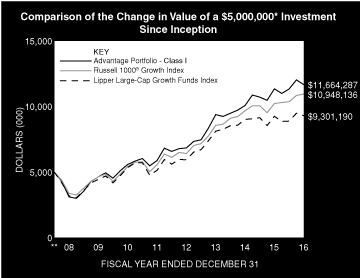
* Minimum Investment for Class I shares
** Commenced Operations on June 30, 2008.
In accordance with SEC regulations, the Portfolio's performance shown assumes that all recurring fees (including management fees) were deducted and all dividends and distributions were reinvested. The performance of Class A, L, C and IS shares will vary from the performance of Class I shares based upon their different inception dates and will be impacted by additional fees assessed to those classes (if applicable).
4
Morgan Stanley Institutional Fund, Inc.
Annual Report — December 31, 2016
Investment Overview (unaudited) (cont'd)
Advantage Portfolio
Performance Compared to the Russell 1000® Growth Index(1) and the Lipper Large-Cap Growth Funds Index(2)
| | | Period Ended December 31, 2016
Total Returns(3) | |
| | | | | Average Annual | |
| | | One
Year | | Five
Years | | Ten
Years | | Since
Inception(7) | |
Portfolio — Class I Shares
w/o sales charges(4) | | | 2.82 | % | | | 14.68 | % | | | — | | | | 10.47 | % | |
Portfolio — Class A Shares
w/o sales charges(4) | | | 2.47 | | | | 14.32 | | | | — | | | | 14.74 | | |
Portfolio — Class A Shares with
maximum 5.25% sales charges(4) | | | –2.88 | | | | 13.10 | | | | — | | | | 13.81 | | |
Portfolio — Class L Shares
w/o sales charges(4) | | | 2.72 | | | | 14.60 | | | | — | | | | 10.34 | | |
Portfolio — Class C Shares
w/o sales charges(6) | | | 1.71 | | | | — | | | | — | | | | 3.36 | | |
Portfolio — Class C Shares with
maximum 1.00% deferred
sales charges(6) | | | 0.71 | | | | — | | | | — | | | | 3.36 | | |
Portfolio — Class IS Shares
w/o sales charges(5) | | | 2.79 | | | | — | | | | — | | | | 11.53 | | |
Russell 1000® Growth Index | | | 7.08 | | | | 14.50 | | | | — | | | | 9.65 | | |
Lipper Large-Cap Growth
Funds Index | | | 0.54 | | | | 12.96 | | | | — | | | | 7.58 | | |
Performance data quoted represents past performance, which is no guarantee of future results, and current performance may be lower or higher than the figures shown. Performance assumes that all dividends and distributions, if any, were reinvested. For the most recent month-end performance figures, please visit www.morganstanley.com/im. Investment return and principal value will fluctuate so that Portfolio shares, when redeemed, may be worth more or less than their original cost. Total returns do not reflect the deduction of taxes that a shareholder would pay on Portfolio distributions or the redemption of Portfolio shares.Returns for periods less than one year are not annualized. Performance of share classes will vary due to difference in sales charges and expenses.
(1) The Russell 1000® Growth Index measures the performance of the large-cap growth segment of the U.S. equity universe. It includes those Russell 1000® Index companies with higher price-to-book ratios and higher forecasted growth values. The Russell 1000® Index is an index of approximately 1,000 of the largest U.S. companies based on a combination of market capitalization and current index membership. The Index is unmanaged and its returns do not include any sales charges or fees. Such costs would lower performance. It is not possible to invest directly in an index.
(2) The Lipper Large-Cap Growth Funds Index is an equally weighted performance index of the largest qualifying funds (based on net assets) in the Lipper Large-Cap Growth Funds classification. The Index, which is adjusted for capital gains distributions and income dividends, is unmanaged and should not be considered an investment. There are currently 30 funds represented in this Index. As of the date of this report, the Portfolio was in the Lipper Large-Cap Growth Funds classification.
(3) Total returns for the Portfolio reflect fees waived and expenses reimbursed, if applicable, by the Adviser. Without such waivers and reimbursements, total returns would have been lower.
(4) On May 21, 2010 Class C and Class I shares of Van Kampen Core Growth Fund ("the Predecessor Fund") were reorganized into Class L and Class I shares of Morgan Stanley Advantage Portfolio ("the Portfolio"), respectively. Class L and Class I shares' returns of the Portfolio will differ from the Predecessor Fund as they have different expenses. Performance shown for the Portfolio's Class I and Class L shares reflects the performance of the shares of the Predecessor Fund for periods prior to May 21, 2010. The Class C and I shares of the Predecessor Fund commenced operations on June 30, 2008. Class P shares, which were renamed Class A shares effective September 9, 2013, commenced operations on May 21, 2010.
(5) Commenced offering on September 13, 2013.
(6) Commenced offering on April 30, 2015.
(7) For comparative purposes, average annual since inception returns listed for the Indexes refer to the inception date of Class I of the Portfolio, not the inception of the Index.
5
Morgan Stanley Institutional Fund, Inc.
Annual Report — December 31, 2016
Portfolio of Investments
Advantage Portfolio
| | | Shares | | Value
(000) | |
Common Stocks (97.7%) | |
Aerospace & Defense (7.4%) | |
TransDigm Group, Inc. | | | 8,478 | | | $ | 2,111 | | |
United Technologies Corp. | | | 38,909 | | | | 4,265 | | |
| | | | 6,376 | | |
Automobiles (1.5%) | |
Harley-Davidson, Inc. | | | 22,657 | | | | 1,322 | | |
Capital Markets (6.8%) | |
MSCI, Inc. | | | 27,380 | | | | 2,157 | | |
S&P Global, Inc. | | | 34,294 | | | | 3,688 | | |
| | | | 5,845 | | |
Chemicals (1.6%) | |
Sherwin-Williams Co. (The) | | | 5,220 | | | | 1,403 | | |
Construction Materials (1.4%) | |
Martin Marietta Materials, Inc. | | | 5,398 | | | | 1,196 | | |
Diversified Financial Services (5.0%) | |
Berkshire Hathaway, Inc., Class B (a) | | | 26,213 | | | | 4,272 | | |
Health Care Equipment & Supplies (1.5%) | |
Danaher Corp. | | | 17,113 | | | | 1,332 | | |
Hotels, Restaurants & Leisure (8.0%) | |
Chipotle Mexican Grill, Inc. (a) | | | 2,066 | | | | 780 | | |
Dunkin' Brands Group, Inc. | | | 39,979 | | | | 2,096 | | |
Marriott International, Inc., Class A | | | 32,451 | | | | 2,683 | | |
Starbucks Corp. | | | 23,655 | | | | 1,313 | | |
| | | | 6,872 | | |
Information Technology Services (7.6%) | |
Mastercard, Inc., Class A | | | 39,732 | | | | 4,102 | | |
Visa, Inc., Class A | | | 31,554 | | | | 2,462 | | |
| | | | 6,564 | | |
Internet & Direct Marketing Retail (11.6%) | |
Amazon.com, Inc. (a) | | | 10,506 | | | | 7,878 | | |
Priceline Group, Inc. (The) (Netherlands) (a) | | | 1,396 | | | | 2,047 | | |
| | | | 9,925 | | |
Internet Software & Services (17.4%) | |
Alphabet, Inc., Class C (a) | | | 7,443 | | | | 5,744 | | |
Facebook, Inc., Class A (a) | | | 63,008 | | | | 7,249 | | |
Twitter, Inc. (a) | | | 117,097 | | | | 1,909 | | |
| | | | 14,902 | | |
Machinery (1.1%) | |
Fortive Corp. | | | 17,102 | | | | 917 | | |
Media (1.1%) | |
Walt Disney Co. (The) | | | 9,357 | | | | 975 | | |
Multi-line Retail (2.2%) | |
Dollar Tree, Inc. (a) | | | 24,101 | | | | 1,860 | | |
Oil, Gas & Consumable Fuels (1.1%) | |
Phillips 66 | | | 10,828 | | | | 936 | | |
Pharmaceuticals (2.9%) | |
Zoetis, Inc. | | | 46,177 | | | | 2,472 | | |
| | | Shares | | Value
(000) | |
Professional Services (4.9%) | |
IHS Markit Ltd. (a) | | | 59,536 | | | $ | 2,108 | | |
Verisk Analytics, Inc. (a) | | | 25,965 | | | | 2,108 | | |
| | | | 4,216 | | |
Software (3.2%) | |
Salesforce.com, Inc. (a) | | | 39,722 | | | | 2,719 | | |
Specialty Retail (5.8%) | |
Home Depot, Inc. | | | 10,472 | | | | 1,404 | | |
Tiffany & Co. | | | 17,360 | | | | 1,344 | | |
TJX Cos., Inc. (The) | | | 29,339 | | | | 2,205 | | |
| | | | 4,953 | | |
Textiles, Apparel & Luxury Goods (5.6%) | |
Christian Dior SE (France) | | | 11,989 | | | | 2,515 | | |
Michael Kors Holdings Ltd. (a) | | | 35,235 | | | | 1,514 | | |
Under Armour, Inc., Class A (a) | | | 26,870 | | | | 781 | | |
| | | | 4,810 | | |
Total Common Stocks (Cost $75,164) | | | 83,867 | | |
| | | Notional
Amount
(000) | | | |
Call Option Purchased (0.0%) | |
Foreign Currency Option (0.0%) | |
USD/CNY May 2017 @ CNY 7.90,
Royal Bank of Scotland (Cost $44) | | | 10,775 | | | | 40 | | |
| | | Shares | | | |
Short-Term Investment (2.7%) | |
Investment Company (2.7%) | |
Morgan Stanley Institutional Liquidity
Funds — Treasury Securities Portfolio —
Institutional Class (See Note G)
(Cost $2,300) | | | 2,299,799 | | | | 2,300 | | |
Total Investments (100.4%) (Cost $77,508) (b) | | | 86,207 | | |
Liabilities in Excess of Other Assets (–0.4%) | | | (329 | ) | |
Net Assets (100.0%) | | $ | 85,878 | | |
(a) Non-income producing security.
(b) At December 31, 2016, the aggregate cost for federal income tax purposes is approximately $77,711,000. The aggregate gross unrealized appreciation is approximately $10,956,000 and the aggregate gross unrealized depreciation is approximately $2,460,000, resulting in net unrealized appreciation of approximately $8,496,000.
CNY Chinese Yuan Renminbi
USD United States Dollar
The accompanying notes are an integral part of the financial statements.
6
Morgan Stanley Institutional Fund, Inc.
Annual Report — December 31, 2016
Portfolio of Investments (cont'd)
Advantage Portfolio
Portfolio Composition
Classification | | Percentage of
Total Investments | |
Other* | | | 25.2 | % | |
Internet Software & Services | | | 17.3 | | |
Internet & Direct Marketing Retail | | | 11.5 | | |
Hotels, Restaurants & Leisure | | | 8.0 | | |
Information Technology Services | | | 7.6 | | |
Aerospace & Defense | | | 7.4 | | |
Capital Markets | | | 6.8 | | |
Specialty Retail | | | 5.7 | | |
Textiles, Apparel & Luxury Goods | | | 5.6 | | |
Diversified Financial Services | | | 4.9 | | |
Total Investments | | | 100.0 | % | |
* Industries and/or investment types representing less than 5% of total investments.
The accompanying notes are an integral part of the financial statements.
7
Morgan Stanley Institutional Fund, Inc.
Annual Report — December 31, 2016
Statement of Assets and Liabilities | | December 31, 2016
(000) | |
Assets: | |
Investments in Securities of Unaffiliated Issuers, at Value (Cost $75,208) | | $ | 83,907 | | |
Investment in Security of Affiliated Issuer, at Value (Cost $2,300) | | | 2,300 | | |
Total Investments in Securities, at Value (Cost $77,508) | | | 86,207 | | |
Receivable for Portfolio Shares Sold | | | 47 | | |
Dividends Receivable | | | 17 | | |
Receivable from Affiliate | | | 1 | | |
Other Assets | | | 33 | | |
Total Assets | | | 86,305 | | |
Liabilities: | |
Payable for Portfolio Shares Redeemed | | | 230 | | |
Payable for Advisory Fees | | | 107 | | |
Payable for Professional Fees | | | 48 | | |
Payable for Sub Transfer Agency Fees — Class I | | | 7 | | |
Payable for Sub Transfer Agency Fees — Class A | | | 4 | | |
Payable for Sub Transfer Agency Fees — Class L | | | — | @ | |
Payable for Sub Transfer Agency Fees — Class C | | | — | @ | |
Payable for Shareholder Services Fees — Class A | | | 4 | | |
Payable for Distribution and Shareholder Services Fees — Class L | | | — | @ | |
Payable for Distribution and Shareholder Services Fees — Class C | | | 5 | | |
Payable for Administration Fees | | | 6 | | |
Payable for Transfer Agency Fees �� Class I | | | 1 | | |
Payable for Transfer Agency Fees — Class A | | | 1 | | |
Payable for Transfer Agency Fees — Class L | | | 1 | | |
Payable for Transfer Agency Fees — Class C | | | 1 | | |
Payable for Transfer Agency Fees — Class IS | | | — | @ | |
Payable for Custodian Fees | | | 2 | | |
Other Liabilities | | | 10 | | |
Total Liabilities | | | 427 | | |
Net Assets | | $ | 85,878 | | |
Net Assets Consist Of: | |
Paid-in-Capital | | $ | 76,840 | | |
Distributions in Excess of Net Investment Income | | | (9 | ) | |
Net Realized Gain | | | 348 | | |
Unrealized Appreciation (Depreciation) on: | |
Investments | | | 8,699 | | |
Net Assets | | $ | 85,878 | | |
The accompanying notes are an integral part of the financial statements.
8
Morgan Stanley Institutional Fund, Inc.
Annual Report — December 31, 2016
Statement of Assets and Liabilities (cont'd) | | December 31, 2016
(000) | |
CLASS I: | |
Net Assets | | $ | 42,695 | | |
| Shares Outstanding $0.001 par value shares of beneficial interest (unlimited shares authorized) (not in 000's) | | | 2,444,512 | | |
Net Asset Value, Offering and Redemption Price Per Share | | $ | 17.47 | | |
CLASS A: | |
Net Assets | | $ | 19,850 | | |
| Shares Outstanding $0.001 par value shares of beneficial interest (unlimited shares authorized) (not in 000's) | | | 1,150,191 | | |
Net Asset Value, Redemption Price Per Share | | $ | 17.26 | | |
Maximum Sales Load | | | 5.25 | % | |
Maximum Sales Charge | | $ | 0.96 | | |
Maximum Offering Price Per Share | | $ | 18.22 | | |
CLASS L: | |
Net Assets | | $ | 3,684 | | |
| Shares Outstanding $0.001 par value shares of beneficial interest (unlimited shares authorized) (not in 000's) | | | 210,940 | | |
Net Asset Value, Offering and Redemption Price Per Share | | $ | 17.46 | | |
CLASS C: | |
Net Assets | | $ | 6,376 | | |
| Shares Outstanding $0.001 par value shares of beneficial interest (unlimited shares authorized) (not in 000's) | | | 371,502 | | |
Net Asset Value, Offering and Redemption Price Per Share | | $ | 17.16 | | |
CLASS IS: | |
Net Assets | | $ | 13,273 | | |
| Shares Outstanding $0.001 par value shares of beneficial interest (unlimited shares authorized) (not in 000's) | | | 759,226 | | |
Net Asset Value, Offering and Redemption Price Per Share | | $ | 17.48 | | |
@ Amount is less than $500.
The accompanying notes are an integral part of the financial statements.
9
Morgan Stanley Institutional Fund, Inc.
Annual Report — December 31, 2016
Statement of Operations | | Year Ended
December 31, 2016
(000) | |
Investment Income: | |
Dividends from Securities of Unaffiliated Issuers (Net of $13 of Foreign Taxes Withheld) | | $ | 861 | | |
Dividends from Security of Affiliated Issuers (Note G) | | | 10 | | |
Total Investment Income | | | 871 | | |
Expenses: | |
Advisory Fees (Note B) | | | 463 | | |
Shareholder Services Fees — Class A (Note D) | | | 40 | | |
Distribution and Shareholder Services Fees — Class L (Note D) | | | 34 | | |
Distribution and Shareholder Services Fees — Class C (Note D) | | | 37 | | |
Professional Fees | | | 90 | | |
Registration Fees | | | 74 | | |
Sub Transfer Agency Fees — Class I | | | 39 | | |
Sub Transfer Agency Fees — Class A | | | 19 | | |
Sub Transfer Agency Fees — Class L | | | 1 | | |
Sub Transfer Agency Fees — Class C | | | 3 | | |
Administration Fees (Note C) | | | 57 | | |
Shareholder Reporting Fees | | | 19 | | |
Transfer Agency Fees — Class I (Note E) | | | 3 | | |
Transfer Agency Fees — Class A (Note E) | | | 4 | | |
Transfer Agency Fees — Class L (Note E) | | | 2 | | |
Transfer Agency Fees — Class C (Note E) | | | 3 | | |
Transfer Agency Fees — Class IS (Note E) | | | 2 | | |
Custodian Fees (Note F) | | | 5 | | |
Directors' Fees and Expenses | | | 3 | | |
Pricing Fees | | | 3 | | |
Other Expenses | | | 22 | | |
Total Expenses | | | 923 | | |
Waiver of Advisory Fees (Note B) | | | (129 | ) | |
Distribution Fees - Class L Shares Waived (Note D) | | | (32 | ) | |
Reimbursement of Class Specific Expenses — Class I (Note B) | | | (27 | ) | |
Reimbursement of Class Specific Expenses — Class A (Note B) | | | (1 | ) | |
Reimbursement of Class Specific Expenses — Class C (Note B) | | | (1 | ) | |
Reimbursement of Class Specific Expenses — Class IS (Note B) | | | (2 | ) | |
Rebate from Morgan Stanley Affiliate (Note G) | | | (5 | ) | |
Reimbursement of Custodian Fees (Note F) | | | (30 | ) | |
Net Expenses | | | 696 | | |
Net Investment Income | | | 175 | | |
Realized Gain: | |
Investments Sold | | | 952 | | |
Foreign Currency Transactions | | | 1 | | |
Net Realized Gain | | | 953 | | |
Change in Unrealized Appreciation (Depreciation): | |
Investments | | | 2,261 | | |
Foreign Currency Translations | | | — | @ | |
Net Change in Unrealized Appreciation (Depreciation) | | | 2,261 | | |
Net Realized Gain and Change in Unrealized Appreciation (Depreciation) | | | 3,214 | | |
Net Increase in Net Assets Resulting from Operations | | $ | 3,389 | | |
The accompanying notes are an integral part of the financial statements.
10
Morgan Stanley Institutional Fund, Inc.
Annual Report — December 31, 2016
Statements of Changes in Net Assets | | Year Ended
December 31, 2016
(000) | | Year Ended
December 31, 2015
(000) | |
Increase in Net Assets: | |
Operations: | |
Net Investment Income (Loss) | | $ | 175 | | | $ | (17 | ) | |
Net Realized Gain | | | 953 | | | | 3,974 | | |
Net Change in Unrealized Appreciation (Depreciation) | | | 2,261 | | | | (475 | ) | |
Net Increase in Net Assets Resulting from Operations | | | 3,389 | | | | 3,482 | | |
Distributions from and/or in Excess of: | |
Class I: | |
Net Investment Income | | | (111 | ) | | | (18 | ) | |
Net Realized Gain | | | (841 | ) | | | (1,736 | ) | |
Class A: | |
Net Realized Gain | | | (348 | ) | | | (866 | ) | |
Class L: | |
Net Investment Income | | | (6 | ) | | | — | | |
Net Realized Gain | | | (96 | ) | | | (453 | ) | |
Class C: | |
Net Investment Income | | | — | | | | (— | @) | |
Net Realized Gain | | | (94 | ) | | | (114 | ) | |
Class IS: | |
Net Investment Income | | | (38 | ) | | | (— | @) | |
Net Realized Gain | | | (282 | ) | | | (1 | ) | |
Total Distributions | | | (1,816 | ) | | | (3,188 | ) | |
Capital Share Transactions:(1) | |
Class I: | |
Subscribed | | | 33,563 | | | | 13,669 | | |
Distributions Reinvested | | | 950 | | | | 1,253 | | |
Redeemed | | | (17,346 | ) | | | (8,664 | ) | |
Class A: | |
Subscribed | | | 16,149 | | | | 11,449 | | |
Distributions Reinvested | | | 347 | | | | 864 | | |
Redeemed | | | (8,863 | ) | | | (3,697 | ) | |
Class L: | |
Exchanged | | | 67 | | | | — | | |
Subscribed | | | — | | | | 2,971 | | |
Distributions Reinvested | | | 99 | | | | 426 | | |
Redeemed | | | (1,880 | ) | | | (4,908 | ) | |
Class C: | |
Subscribed | | | 4,912 | | | | 1,907 | * | |
Distributions Reinvested | | | 94 | | | | 113 | * | |
Redeemed | | | (421 | ) | | | (133 | )* | |
Class IS: | |
Subscribed | | | 12,500 | | | | — | | |
Distributions Reinvested | | | 320 | | | | — | | |
Net Increase in Net Assets Resulting from Capital Share Transactions | | | 40,491 | | | | 15,250 | | |
Total Increase in Net Assets | | | 42,064 | | | | 15,544 | | |
Net Assets: | |
Beginning of Period | | | 43,814 | | | | 28,270 | | |
End of Period (Including Distributions in Excess of Net Investment Income of $(9) and $(10) | | $ | 85,878 | | | $ | 43,814 | | |
The accompanying notes are an integral part of the financial statements.
11
Morgan Stanley Institutional Fund, Inc.
Annual Report — December 31, 2016
Statements of Changes in Net Assets (cont'd) | | Year Ended
December 31, 2016
(000) | | Year Ended
December 31, 2015
(000) | |
(1) Capital Share Transactions: | |
Class I: | |
Shares Subscribed | | | 1,975 | | | | 755 | | |
Shares Issued on Distributions Reinvested | | | 55 | | | | 71 | | |
Shares Redeemed | | | (1,006 | ) | | | (474 | ) | |
Net Increase in Class I Shares Outstanding | | | 1,024 | | | | 352 | | |
Class A: | |
Shares Subscribed | | | 957 | | | | 627 | | |
Shares Issued on Distributions Reinvested | | | 20 | | | | 50 | | |
Shares Redeemed | | | (520 | ) | | | (207 | ) | |
Net Increase in Class A Shares Outstanding | | | 457 | | | | 470 | | |
Class L: | |
Shares Exchanged | | | 3 | | | | — | | |
Shares Subscribed | | | — | | | | 164 | | |
Shares Issued on Distributions Reinvested | | | 6 | | | | 24 | | |
Shares Redeemed | | | (107 | ) | | | (269 | ) | |
Net Decrease in Class L Shares Outstanding | | | (98 | ) | | | (81 | ) | |
Class C: | |
Shares Subscribed | | | 288 | | | | 104 | * | |
Shares Issued on Distributions Reinvested | | | 6 | | | | 7 | * | |
Shares Redeemed | | | (25 | ) | | | (8 | )* | |
Net Increase in Class C Shares Outstanding | | | 269 | | | | 103 | | |
Class IS: | |
Shares Subscribed | | | 741 | | | | — | | |
Shares Issued on Distributions Reinvested | | | 18 | | | | — | | |
Net Increase in Class IS Shares Outstanding | | | 759 | | | | — | | |
@ Amount is less than $500.
* For the period April 30, 2015 through December 31, 2015.
The accompanying notes are an integral part of the financial statements.
12
Morgan Stanley Institutional Fund, Inc.
Annual Report — December 31, 2016
Financial Highlights
Advantage Portfolio
| | | Class I | |
| | | Year Ended December 31, | |
Selected Per Share Data and Ratios | | 2016(1) | | 2015 | | 2014 | | 2013 | | 2012 | |
Net Asset Value, Beginning of Period | | $ | 17.40 | | | $ | 16.83 | | | $ | 16.41 | | | $ | 12.40 | | | $ | 11.38 | | |
Income from Investment Operations: | |
Net Investment Income (2) | | | 0.07 | | | | 0.01 | | | | 0.04 | | | | 0.01 | | | | 0.14 | | |
Net Realized and Unrealized Gain | | | 0.42 | | | | 2.11 | | | | 1.15 | | | | 4.54 | | | | 1.72 | | |
Total from Investment Operations | | | 0.49 | | | | 2.12 | | | | 1.19 | | | | 4.55 | | | | 1.86 | | |
Distributions from and/or in Excess of: | |
Net Investment Income | | | (0.04 | ) | | | (0.02 | ) | | | (0.01 | ) | | | — | | | | (0.10 | ) | |
Net Realized Gain | | | (0.38 | ) | | | (1.53 | ) | | | (0.76 | ) | | | (0.54 | ) | | | (0.74 | ) | |
Total Distributions | | | (0.42 | ) | | | (1.55 | ) | | | (0.77 | ) | | | (0.54 | ) | | | (0.84 | ) | |
Net Asset Value, End of Period | | $ | 17.47 | | | $ | 17.40 | | | $ | 16.83 | | | $ | 16.41 | | | $ | 12.40 | | |
Total Return (3) | | | 2.82 | % | | | 12.56 | % | | | 7.43 | % | | | 37.11 | % | | | 16.38 | % | |
Ratios and Supplemental Data: | |
Net Assets, End of Period (Thousands) | | $ | 42,695 | | | $ | 24,718 | | | $ | 17,971 | | | $ | 14,712 | | | $ | 8,595 | | |
Ratio of Expenses to Average Net Assets (7) | | | 0.84 | %(4) | | | 0.86 | %(4)(5) | | | 1.04 | %(4) | | | 1.04 | %(4) | | | 1.05 | %(4) | |
Ratio of Net Investment Income to Average Net Assets (7) | | | 0.38 | %(4) | | | 0.06 | %(4) | | | 0.23 | %(4) | | | 0.11 | %(4) | | | 1.08 | %(4) | |
Ratio of Rebate from Morgan Stanley Affiliates to Average Net Assets | | | 0.01 | % | | | 0.00 | %(6) | | | 0.01 | % | | | 0.01 | % | | | 0.00 | %(6) | |
Portfolio Turnover Rate | | | 79 | % | | | 51 | % | | | 31 | % | | | 36 | % | | | 50 | % | |
(7) Supplemental Information on the Ratios to Average Net Assets: | |
Ratios Before Expense Limitation: | |
Expenses to Average Net Assets | | | 1.15 | % | | | 1.49 | % | | | 1.78 | % | | | 2.33 | % | | | 2.34 | % | |
Net Investment Income (Loss) to Average Net Assets | | | 0.07 | % | | | (0.57 | )% | | | (0.51 | )% | | | (1.18 | )% | | | (0.21 | )% | |
(1) Refer to Note F in the Notes to Financial Statements for discussion of prior period custodian out-of-pocket expenses that were reimbursed in the current period. The amount of the reimbursement was immaterial on a per share basis and did not impact the total return of Class I shares. The Ratio of Expenses to Average Net Assets and the Ratio of Net Investment Income to Average Net Assets would be unchanged as the reimbursement of custodian fees was offset against current period expense waivers/reimbursements with no impact to net expenses or net investment income.
(2) Per share amount is based on average shares outstanding.
(3) Calculated based on the net asset value as of the last business day of the period.
(4) The Ratios of Expenses and Net Investment Income reflect the rebate of certain Portfolio expenses in connection with the investments in Morgan Stanley affiliates during the period. The effect of the rebate on the ratios is disclosed in the above table as "Ratio of Rebate from Morgan Stanley Affiliates to Average Net Assets."
(5) Effective January 23, 2015, the Adviser has agreed to limit the ratio of expenses to average net assets to the maximum ratio of 0.85% for Class I shares. Prior to January 23, 2015, the maximum ratio was 1.05% for Class I shares.
(6) Amount is less than 0.005%.
The accompanying notes are an integral part of the financial statements.
13
Morgan Stanley Institutional Fund, Inc.
Annual Report — December 31, 2016
Financial Highlights
Advantage Portfolio
| | | Class A | |
| | | Year Ended December 31, | |
Selected Per Share Data and Ratios | | 2016(1) | | 2015 | | 2014 | | 2013 | | 2012 | |
Net Asset Value, Beginning of Period | | $ | 17.22 | | | $ | 16.70 | | | $ | 16.34 | | | $ | 12.39 | | | $ | 11.37 | | |
Income (Loss) from Investment Operations: | |
Net Investment Income (Loss) (2) | | | 0.01 | | | | (0.06 | ) | | | (0.03 | ) | | | (0.07 | ) | | | 0.11 | | |
Net Realized and Unrealized Gain | | | 0.41 | | | | 2.11 | | | | 1.15 | | | | 4.56 | | | | 1.72 | | |
Total from Investment Operations | | | 0.42 | | | | 2.05 | | | | 1.12 | | | | 4.49 | | | | 1.83 | | |
Distributions from and/or in Excess of: | |
Net Investment Income | | | — | | | | — | | | | — | | | | — | | | | (0.07 | ) | |
Net Realized Gain | | | (0.38 | ) | | | (1.53 | ) | | | (0.76 | ) | | | (0.54 | ) | | | (0.74 | ) | |
Total Distributions | | | (0.38 | ) | | | (1.53 | ) | | | (0.76 | ) | | | (0.54 | ) | | | (0.81 | ) | |
Net Asset Value, End of Period | | $ | 17.26 | | | $ | 17.22 | | | $ | 16.70 | | | $ | 16.34 | | | $ | 12.39 | | |
Total Return (3) | | | 2.47 | % | | | 12.20 | % | | | 7.05 | % | | | 36.65 | % | | | 16.11 | % | |
Ratios and Supplemental Data: | |
Net Assets, End of Period (Thousands) | | $ | 19,850 | | | $ | 11,939 | | | $ | 3,738 | | | $ | 3,134 | | | $ | 12 | | |
Ratio of Expenses to Average Net Assets (8) | | | 1.19 | %(4) | | | 1.18 | %(4)(6) | | | 1.39 | %(4) | | | 1.35 | %(4)(5) | | | 1.30 | %(4) | |
Ratio of Net Investment Income (Loss) to Average Net Assets (8) | | | 0.04 | %(4) | | | (0.31 | )%(4) | | | (0.15 | )%(4) | | | (0.44 | )%(4) | | | 0.83 | %(4) | |
Ratio of Rebate from Morgan Stanley Affiliates to Average Net Assets | | | 0.01 | % | | | 0.01 | % | | | 0.01 | % | | | 0.00 | %(7) | | | 0.00 | %(7) | |
Portfolio Turnover Rate | | | 79 | % | | | 51 | % | | | 31 | % | | | 36 | % | | | 50 | % | |
(8) Supplemental Information on the Ratios to Average Net Assets: | |
Ratios Before Expense Limitation: | |
Expenses to Average Net Assets | | | 1.43 | % | | | 1.87 | % | | | 2.14 | % | | | 2.68 | % | | | 2.59 | % | |
Net Investment Loss to Average Net Assets | | | (0.20 | )% | | | (1.00 | )% | | | (0.90 | )% | | | (1.77 | )% | | | (0.46 | )% | |
(1) Refer to Note F in the Notes to Financial Statements for discussion of prior period custodian out-of-pocket expenses that were reimbursed in the current period. The amount of the reimbursement was immaterial on a per share basis and did not impact the total return of Class A shares. The Ratio of Expenses to Average Net Assets and the Ratio of Net Investment Income to Average Net Assets would be unchanged as the reimbursement of custodian fees was offset against current period expense waivers/reimbursements with no impact to net expenses or net investment income.
(2) Per share amount is based on average shares outstanding.
(3) Calculated based on the net asset value which does not reflect sales charges, if applicable, as of the last business day of the period.
(4) The Ratios of Expenses and Net Investment Income (Loss) reflect the rebate of certain Portfolio expenses in connection with the investments in Morgan Stanley affiliates during the period. The effect of the rebate on the ratios is disclosed in the above table as "Ratio of Rebate from Morgan Stanley Affiliates to Average Net Assets."
(5) Effective September 16, 2013, the Adviser has agreed to limit the ratio of expenses to average net assets to the maximum ratio of 1.40% for Class A shares. Prior to September 16, 2013, the maximum ratio was 1.30% for Class A shares.
(6) Effective January 23, 2015, the Adviser has agreed to limit the ratio of expenses to average net assets to the maximum ratio of 1.20% for Class A shares. Prior to January 23, 2015, the maximum ratio was 1.40% for Class A shares.
(7) Amount is less than 0.005%.
The accompanying notes are an integral part of the financial statements.
14
Morgan Stanley Institutional Fund, Inc.
Annual Report — December 31, 2016
Financial Highlights
Advantage Portfolio
| | | Class L | |
| | | Year Ended December 31, | |
Selected Per Share Data and Ratios | | 2016(1) | | 2015 | | 2014 | | 2013 | | 2012 | |
Net Asset Value, Beginning of Period | �� | $ | 17.40 | | | $ | 16.82 | | | $ | 16.42 | | | $ | 12.42 | | | $ | 11.39 | | |
Income (Loss) from Investment Operations: | |
Net Investment Income (Loss) (2) | | | 0.04 | | | | (0.01 | ) | | | 0.02 | | | | (0.01 | ) | | | 0.13 | | |
Net Realized and Unrealized Gain | | | 0.43 | | | | 2.12 | | | | 1.14 | | | | 4.55 | | | | 1.74 | | |
Total from Investment Operations | | | 0.47 | | | | 2.11 | | | | 1.16 | | | | 4.54 | | | | 1.87 | | |
Distributions from and/or in Excess of: | |
Net Investment Income | | | (0.03 | ) | | | — | | | | (0.00 | )(3) | | | — | | | | (0.10 | ) | |
Net Realized Gain | | | (0.38 | ) | | | (1.53 | ) | | | (0.76 | ) | | | (0.54 | ) | | | (0.74 | ) | |
Total Distributions | | | (0.41 | ) | | | (1.53 | ) | | | (0.76 | ) | | | (0.54 | ) | | | (0.84 | ) | |
Net Asset Value, End of Period | | $ | 17.46 | | | $ | 17.40 | | | $ | 16.82 | | | $ | 16.42 | | | $ | 12.42 | | |
Total Return (4) | | | 2.72 | % | | | 12.47 | % | | | 7.28 | % | | | 36.97 | % | | | 16.42 | % | |
Ratios and Supplemental Data: | |
Net Assets, End of Period (Thousands) | | $ | 3,684 | | | $ | 5,369 | | | $ | 6,549 | | | $ | 3,908 | | | $ | 722 | | |
Ratio of Expenses to Average Net Assets (9) | | | 0.91 | %(5) | | | 0.97 | %(5)(7) | | | 1.18 | %(5) | | | 1.08 | %(5)(6) | | | 1.09 | %(5) | |
Ratio of Net Investment Income (Loss) to Average Net Assets (9) | | | 0.26 | %(5) | | | (0.03 | )%(5) | | | 0.12 | %(5) | | | (0.06 | )%(5) | | | 1.04 | %(5) | |
Ratio of Rebate from Morgan Stanley Affiliates to Average Net Assets | | | 0.01 | % | | | 0.01 | % | | | 0.01 | % | | | 0.01 | % | | | 0.00 | %(8) | |
Portfolio Turnover Rate | | | 79 | % | | | 51 | % | | | 31 | % | | | 36 | % | | | 50 | % | |
(9) Supplemental Information on the Ratios to Average Net Assets: | |
Ratios Before Expense Limitation: | |
Expenses to Average Net Assets | | | 1.85 | % | | | 2.33 | % | | | 2.64 | % | | | 3.10 | % | | | 3.09 | % | |
Net Investment Loss to Average Net Assets | | | (0.68 | )% | | | (1.39 | )% | | | (1.34 | )% | | | (2.08 | )% | | | (0.96 | )% | |
(1) Refer to Note F in the Notes to Financial Statements for discussion of prior period custodian out-of-pocket expenses that were reimbursed in the current period. The amount of the reimbursement was immaterial on a per share basis and did not impact the total return of Class L shares. The Ratio of Expenses to Average Net Assets and the Ratio of Net Investment Income to Average Net Assets would be unchanged as the reimbursement of custodian fees was offset against current period expense waivers/reimbursements with no impact to net expenses or net investment income.
(2) Per share amount is based on average shares outstanding.
(3) Amount is less than $0.005 per share.
(4) Calculated based on the net asset value as of the last business day of the period.
(5) The Ratios of Expenses and Net Investment Income (Loss) reflect the rebate of certain Portfolio expenses in connection with the investments in Morgan Stanley affiliates during the period. The effect of the rebate on the ratios is disclosed in the above table as "Ratio of Rebate from Morgan Stanley Affiliates to Average Net Assets."
(6) Effective September 16, 2013, the Adviser has agreed to limit the ratio of expenses to average net assets to the maximum ratio of 1.19% for Class L shares. Prior to September 16, 2013, the maximum ratio was 1.09% for Class L shares.
(7) Effective January 23, 2015, the Adviser has agreed to limit the ratio of expenses to average net assets to the maximum ratio of 0.99% for Class L shares. Prior to January 23, 2015, the maximum ratio was 1.19% for Class L share.
(8) Amount is less than 0.005%.
The accompanying notes are an integral part of the financial statements.
15
Morgan Stanley Institutional Fund, Inc.
Annual Report — December 31, 2016
Financial Highlights
Advantage Portfolio
| | | Class C | |
Selected Per Share Data and Ratios | | Year Ended
December 31,2016(1) | | Period from
April 30, 2015(2) to
December 31, 2015 | |
Net Asset Value, Beginning of Period | | $ | 17.25 | | | $ | 18.08 | | |
Income (Loss) from Investment Operations: | |
Net Investment Loss (3) | | | (0.12 | ) | | | (0.14 | ) | |
Net Realized and Unrealized Gain | | | 0.41 | | | | 0.86 | | |
Total from Investment Operations | | | 0.29 | | | | 0.72 | | |
Distributions from and/or in Excess of: | |
Net Investment Income | | | — | | | | (0.02 | ) | |
Net Realized Gain | | | (0.38 | ) | | | (1.53 | ) | |
Total Distributions | | | (0.38 | ) | | | (1.55 | ) | |
Net Asset Value, End of Period | | $ | 17.16 | | | $ | 17.25 | | |
Total Return (4) | | | 1.71 | % | | | 3.91 | %(6) | |
Ratios and Supplemental Data: | |
Net Assets, End of Period (Thousands) | | $ | 6,376 | | | $ | 1,776 | | |
Ratio of Expenses to Average Net Assets (8) | | | 1.94 | %(5) | | | 1.94 | %(5)(7) | |
Ratio of Net Investment Loss to Average Net Assets (8) | | | (0.72 | )%(5) | | | (1.15 | )%(5)(7) | |
Ratio of Rebate from Morgan Stanley Affiliates to Average Net Assets | | | 0.01 | % | | | 0.01 | %(7) | |
Portfolio Turnover Rate | | | 79 | % | | | 51 | % | |
(8) Supplemental Information on the Ratios to Average Net Assets: | |
Ratios Before Expense Limitation: | |
Expense to Average Net Assets | | | 2.20 | % | | | 2.83 | %(7) | |
Net Investment Loss to Average Net Assets | | | (0.98 | )% | | | (2.04 | )%(7) | |
(1) Refer to Note F in the Notes to Financial Statements for discussion of prior period custodian out-of-pocket expenses that were reimbursed in the current period. The amount of the reimbursement was immaterial on a per share basis and did not impact the total return of Class C shares. The Ratio of Expenses to Average Net Assets and the Ratio of Net Investment Loss to Average Net Assets would be unchanged as the reimbursement of custodian fees was offset against current period expense waivers/reimbursements with no impact to net expenses or net investment loss.
(2) Commencement of Offering.
(3) Per share amount is based on average shares outstanding.
(4) Calculated based on the net asset value which does not reflect sales charges, if applicable, as of the last business day of the period.
(5) The Ratios of Expenses and Net Investment Loss reflect the rebate of certain Portfolio expenses in connection with the investments in Morgan Stanley affiliates during the period. The effect of the rebate on the ratios is disclosed in the above table as "Ratio of Rebate from Morgan Stanley Affiliates to Average Net Assets."
(6) Not Annualized.
(7) Annualized.
The accompanying notes are an integral part of the financial statements.
16
Morgan Stanley Institutional Fund, Inc.
Annual Report — December 31, 2016
Financial Highlights
Advantage Portfolio
| | | Class IS | |
| | | Year Ended December 31, | | Period from
September 13, 2013(2) to | |
Selected Per Share Data and Ratios | | 2016(1) | | 2015 | | 2014 | | December 31, 2013 | |
Net Asset Value, Beginning of Period | | $ | 17.42 | | | $ | 16.84 | | | $ | 16.41 | | | $ | 14.59 | | |
Income (Loss) from Investment Operations: | |
Net Investment Income (Loss) (3) | | | 0.08 | | | | 0.02 | | | | 0.04 | | | | (0.01 | ) | |
Net Realized and Unrealized Gain | | | 0.41 | | | | 2.11 | | | | 1.16 | | | | 2.21 | | |
Total from Investment Operations | | | 0.49 | | | | 2.13 | | | | 1.20 | | | | 2.20 | | |
Distributions from and/or in Excess of: | |
Net Investment Income | | | (0.05 | ) | | | (0.02 | ) | | | (0.01 | ) | | | — | | |
Net Realized Gain | | | (0.38 | ) | | | (1.53 | ) | | | (0.76 | ) | | | (0.38 | ) | |
Total Distributions | | | (0.43 | ) | | | (1.55 | ) | | | (0.77 | ) | | | (0.38 | ) | |
Net Asset Value, End of Period | | $ | 17.48 | | | $ | 17.42 | | | $ | 16.84 | | | $ | 16.41 | | |
Total Return (4) | | | 2.79 | % | | | 12.65 | % | | | 7.50 | % | | | 15.15 | %(9) | |
Ratios and Supplemental Data: | |
Net Assets, End of Period (Thousands) | | $ | 13,273 | | | $ | 12 | | | $ | 12 | | | $ | 11 | | |
Ratio of Expenses to Average Net Assets (11) | | | 0.80 | %(5) | | | 0.82 | %(5)(9) | | | 1.00 | %(5) | | | 1.01 | %(5)(6)(10) | |
Ratio of Net Investment Income (Loss) to Average Net Assets (11) | | | 0.46 | %5) | | | 0.10 | %(5) | | | 0.26 | %(5) | | | (0.25 | )%(5)(10) | |
Ratio of Rebate from Morgan Stanley Affiliates to Average Net Assets | | | 0.01 | % | | | 0.00 | %(8) | | | 0.01 | % | | | 0.00 | %(8)(10) | |
Portfolio Turnover Rate | | | 79 | % | | | 51 | % | | | 31 | % | | | 36 | % | |
(11) Supplemental Information on the Ratios to Average Net Assets: | |
Ratios Before Expense Limitation: | |
Expenses to Average Net Assets | | | 1.05 | % | | | 14.53 | % | | | 18.84 | % | | | 7.31 | %(10) | |
Net Investment Income (Loss) to Average Net Assets | | | 0.21 | % | | | (13.61 | )% | | | (17.58 | )% | | | (6.55 | )%(10) | |
(1) Refer to Note F in the Notes to Financial Statements for discussion of prior period custodian out-of-pocket expenses that were reimbursed in the current period. The amount of the reimbursement was immaterial on a per share basis and did not impact the total return of Class IS shares. The Ratio of Expenses to Average Net Assets and the Ratio of Net Investment Income to Average Net Assets would be unchanged as the reimbursement of custodian fees was offset against current period expense waivers/reimbursements with no impact to net expenses or net investment income.
(2) Commencement of Offering.
(3) Per share amount is based on average shares outstanding.
(4) Calculated based on the net asset value as of the last business day of the period.
(5) The Ratios of Expenses and Net Investment Income (Loss) reflect the rebate of certain Portfolio expenses in connection with the investments in Morgan Stanley affiliates during the period. The effect of the rebate on the ratios is disclosed in the above table as "Ratio of Rebate from Morgan Stanley Affiliates to Average Net Assets."
(6) Effective September 16, 2013, the Adviser has agreed to limit the ratio of expenses to average net assets to the maximum ratio of 1.01% for Class IS shares.
(7) Effective January 23, 2015, the Adviser has agreed to limit the ratio of expenses to average net assets to the maximum ratio of 0.81% for Class IS shares. Prior to January 23, 2015, the maximum ratio was 1.01% for Class IS share.
(8) Amount is less than 0.005%.
(9) Not Annualized.
(10) Annualized.
The accompanying notes are an integral part of the financial statements.
17
Morgan Stanley Institutional Fund, Inc.
Annual Report — December 31, 2016
Notes to Financial Statements
Morgan Stanley Institutional Fund, Inc. (the "Fund") is registered under the Investment Company Act of 1940, as amended (the "Act"), as an open-end management investment company. The Fund is comprised of twenty-nine separate, active, diversified and non-diversified portfolios (individually referred to as a "Portfolio," collectively as the "Portfolios"). The Fund applies investment company accounting and reporting guidance.
The accompanying financial statements relate to the Advantage Portfolio. The Portfolio seeks long-term capital appreciation.
The Portfolio offers five classes of shares — Class I, Class A, Class L, Class C and Class IS. On April 30, 2015, the Portfolio suspended offering of Class L shares. Existing Class L shareholders may invest through reinvestment of dividends and distributions.
A. Significant Accounting Policies: The following significant accounting policies are in conformity with U.S. generally accepted accounting principles ("GAAP"). Such policies are consistently followed by the Fund in the preparation of its financial statements. GAAP may require management to make estimates and assumptions that affect the reported amounts and disclosures in the financial statements. Actual results may differ from those estimates.
1. Security Valuation: (1) An equity portfolio security listed or traded on an exchange is valued at its latest reported sales price (or at the exchange official closing price if such exchange reports an official closing price), and if there were no sales on a given day and if there is no official exchange closing price for that day, the security is valued at the mean between the last reported bid and asked prices if such bid and asked prices are available on the relevant exchanges; (2) all other equity portfolio securities for which over-the-counter ("OTC") market quotations are readily available are valued at the latest reported sales price (or at the market official closing price if such market reports an official closing price), and if there was no trading in the security on a given day and if there is no official closing price from relevant markets for that day, the security is valued at the mean between the last reported bid and asked prices if such bid and asked prices are available on the relevant markets. Listed equity securities not traded on the valuation date with no reported bid and asked prices available on the exchange are valued at the mean between the current bid and asked prices obtained from one or more reputable brokers or dealers. An unlisted equity security
that does not trade on the valuation date and for which bid and asked prices from the relevant markets are unavailable is valued at the mean between the current bid and asked prices obtained from one or more reputable brokers or dealers. In cases where a security is traded on more than one exchange, the security is valued on the exchange designated as the primary market; (3) Listed options are valued at the last reported sales price on the exchange on which they are listed (or at the exchange official closing price if such exchange reports an official closing price). If an official closing price or last reported sale price is unavailable, the listed option should be fair valued at the mean between its latest bid and ask prices. Unlisted options are valued at the mean between their latest bid and ask prices from a broker/dealer or valued by a pricing service/vendor; (4) certain portfolio securities may be valued by an outside pricing service/vendor approved by the Fund's Board of Directors (the "Directors"). The pricing service/vendor may employ a pricing model that takes into account, among other things, bids, yield spreads, and/or other market data and specific security characteristics. Alternatively, if a valuation is not available from an outside pricing service/vendor, and the security trades on an exchange, the security may be valued at its latest reported sale price (or at the exchange official closing price if such exchange reports an official closing price), prior to the time when assets are valued. If there are no sales on a given day and if there is no official exchange closing price for that day, the security is valued at the mean between the last reported bid and asked prices if such bid and asked prices are available in the relevant exchanges; (5) when market quotations are not readily available, including circumstances under which Morgan Stanley Investment Management Inc. (the "Adviser") determines that the closing price, last sale price or the mean between the last reported bid and asked prices are not reflective of a security's market value, portfolio securities are valued at their fair value as determined in good faith under procedures established by and under the general supervision of the Directors. Occasionally, developments affecting the closing prices of securities and other assets may occur between the times at which valuations of such securities are determined (that is, close of the foreign market on which the securities trade) and the close of business of the New York Stock Exchange ("NYSE"). If developments occur during such periods that are expected to materially affect the value of such securities, such valuations may be adjusted to reflect the estimated fair value of
18
Morgan Stanley Institutional Fund, Inc.
Annual Report — December 31, 2016
Notes to Financial Statements (cont'd)
such securities as of the close of the NYSE, as determined in good faith by the Directors or by the Adviser using a pricing service and/or procedures approved by the Directors; (6) quotations of foreign portfolio securities, other assets and liabilities and forward contracts stated in foreign currency are translated into U.S. dollar equivalents at the prevailing market rates prior to the close of the NYSE; and (7) investments in mutual funds, including the Morgan Stanley Institutional Liquidity Funds, are valued at the net asset value ("NAV") as of the close of each business day.
The Directors have responsibility for determining in good faith the fair value of the investments, and the Directors may appoint others, such as the Fund's Adviser or a valuation committee, to assist the Directors in determining fair value and to make the actual calculations pursuant to the fair valuation methodologies previously approved by the Directors. Under procedures approved by the Directors, the Fund's Adviser has formed a Valuation Committee whose members are approved by the Directors. The Valuation Committee provides administration and oversight of the Fund's valuation policies and procedures, which are reviewed at least annually by the Directors. These procedures allow the Fund to utilize independent pricing services, quotations from securities and financial instrument dealers, and other market sources to determine fair value.
The Fund has procedures to determine the fair value of securities and other financial instruments for which market prices are not readily available. Under these procedures, the Valuation Committee convenes on a regular and ad hoc basis to review such securities and considers a number of factors, including valuation methodologies and significant unobservable valuation inputs, when arriving at fair value. The Valuation Committee may employ a market-based approach which may use related or comparable assets or liabilities, recent transactions, market multiples, book values, and other relevant information for the investment to determine the fair value of the investment. An income-based valuation approach may also be used in which the anticipated future cash flows of the investment are discounted to calculate fair value. Discounts may also be applied due to the nature or duration of any restrictions on the disposition of the investments. Due to the inherent uncertainty of valuations of such investments, the fair values may differ significantly from the values that would have been used had an
active market existed. The Valuation Committee employs various methods for calibrating these valuation approaches including a regular review of valuation methodologies, key inputs and assumptions, transactional back-testing or disposition analysis, and reviews of any related market activity.
2. Fair Value Measurement: Financial Accounting Standards Board ("FASB") Accounting Standards CodificationTM ("ASC") 820, "Fair Value Measurement" ("ASC 820"), defines fair value as the value that the Fund would receive to sell an investment or pay to transfer a liability in a timely transaction with an independent buyer in the principal market, or in the absence of a principal market, the most advantageous market for the investment or liability. ASC 820 establishes a three-tier hierarchy to distinguish between (1) inputs that reflect the assumptions market participants would use in valuing an asset or liability developed based on market data obtained from sources independent of the reporting entity (observable inputs) and (2) inputs that reflect the reporting entity's own assumptions about the assumptions market participants would use in valuing an asset or liability developed based on the best information available in the circumstances (unobservable inputs) and to establish classification of fair value measurements for disclosure purposes. Various inputs are used in determining the value of the Fund's investments. The inputs are summarized in the three broad levels listed below.
• Level 1 – unadjusted quoted prices in active markets for identical investments
• Level 2 – other significant observable inputs (including quoted prices for similar investments, interest rates, prepayment speeds, credit risk, etc.)
• Level 3 – significant unobservable inputs including the Fund's own assumptions in determining the fair value of investments. Factors considered in making this determination may include, but are not limited to, information obtained by contacting the issuer, analysts, or the appropriate stock exchange (for exchange-traded securities), analysis of the issuer's financial statements or other available documents and, if necessary, available information concerning other securities in similar circumstances
19
Morgan Stanley Institutional Fund, Inc.
Annual Report — December 31, 2016
Notes to Financial Statements (cont'd)
The inputs or methodology used for valuing securities are not necessarily an indication of the risk associated with investing in those securities and the determination of the significance of a particular input to the fair value measurement in its entirety requires judgment and considers factors specific to each security.
The following is a summary of the inputs used to value the Portfolio's investments as of December 31, 2016.
Investment Type | | Level 1
Unadjusted
quoted
prices
(000) | | Level 2
Other
significant
observable
inputs
(000) | | Level 3
Significant
unobservable
inputs
(000) | | Total
(000) | |
Assets: | |
Common Stocks | |
Aerospace & Defense | | $ | 6,376 | | | $ | — | | | $ | — | | | $ | 6,376 | | |
Automobiles | | | 1,322 | | | | — | | | | — | | | | 1,322 | | |
Capital Markets | | | 5,845 | | | | — | | | | — | | | | 5,845 | | |
Chemicals | | | 1,403 | | | | — | | | | — | | | | 1,403 | | |
Construction Materials | | | 1,196 | | | | — | | | | — | | | | 1,196 | | |
Diversified Financial
Services | | | 4,272 | | | | — | | | | — | | | | 4,272 | | |
Health Care
Equipment & Supplies | | | 1,332 | | | | — | | | | — | | | | 1,332 | | |
Hotels, Restaurants &
Leisure | | | 6,872 | | | | — | | | | — | | | | 6,872 | | |
Information Technology
Services | | | 6,564 | | | | — | | | | — | | | | 6,564 | | |
Internet & Direct
Marketing Retail | | | 9,925 | | | | — | | | | — | | | | 9,925 | | |
Internet Software &
Services | | | 14,902 | | | | — | | | | — | | | | 14,902 | | |
Machinery | | | 917 | | | | — | | | | — | | | | 917 | | |
Media | | | 975 | | | | — | | | | — | | | | 975 | | |
Multi-line Retail | | | 1,860 | | | | — | | | | — | | | | 1,860 | | |
Oil, Gas & Consumable
Fuels | | | 936 | | | | — | | | | — | | | | 936 | | |
Pharmaceuticals | | | 2,472 | | | | — | | | | — | | | | 2,472 | | |
Professional Services | | | 4,216 | | | | — | | | | — | | | | 4,216 | | |
Software | | | 2,719 | | | | — | | | | — | | | | 2,719 | | |
Specialty Retail | | | 4,953 | | | | — | | | | — | | | | 4,953 | | |
Textiles, Apparel &
Luxury Goods | | | 4,810 | | | | — | | | | — | | | | 4,810 | | |
Total Common Stocks | | | 83,867 | | | | — | | | | — | | | | 83,867 | | |
Call Option Purchased | | | — | | | | 40 | | | | — | | | | 40 | | |
Short-Term Investment | |
Investment Company | | | 2,300 | | | | — | | | | — | | | | 2,300 | | |
Total Assets | | $ | 86,167 | | | $ | 40 | | | $ | — | | | $ | 86,207 | | |
Transfers between investment levels may occur as the markets fluctuate and/or the availability of data used in an investment's valuation changes. The Portfolio recognizes transfers between the levels as of the end of the period. As of December 31, 2016, securities with a total value of approximately $2,515,000 transferred from Level 2 to Level 1. Securities that were valued using other significant observable inputs at December 31, 2015 were valued using unadjusted quoted prices at
December 31, 2016. At December 31, 2015, the fair value of certain securities were adjusted due to developments which occurred between the time of the close of the foreign markets on which they trade and the close of business on the NYSE which resulted in their Level 2 classification.
3. Foreign Currency Translation and Foreign Investments: The books and records of the Portfolio are maintained in U.S. dollars. Foreign currency amounts are translated into U.S. dollars as follows:
– investments, other assets and liabilities at the prevailing rate of exchange on the valuation date;
– investment transactions and investment income at the prevailing rates of exchange on the dates of such transactions.
Although the net assets of the Portfolio are presented at the foreign exchange rates and market values at the close of the period, the Portfolio does not isolate that portion of the results of operations arising as a result of changes in the foreign exchange rates from the fluctuations arising from changes in the market prices of securities held at period end. Similarly, the Portfolio does not isolate the effect of changes in foreign exchange rates from the fluctuations arising from changes in the market prices of securities sold during the period. Accordingly, realized and unrealized foreign currency gains (losses) on investments in securities are included in the reported net realized and unrealized gains (losses) on investment transactions and balances. However, pursuant to U.S. federal income tax regulations, gains and losses from certain foreign currency transactions and the foreign currency portion of gains and losses realized on sales and maturities of foreign denominated debt securities are treated as ordinary income for U.S. federal income tax purposes.
Net realized gains (losses) on foreign currency transactions represent net foreign exchange gains (losses) from foreign currency forward exchange contracts, disposition of foreign currencies, currency gains (losses) realized between the trade and settlement dates on securities transactions, and the difference between the amount of investment income and foreign withholding taxes recorded on the Portfolio's books and the U.S. dollar equivalent amounts actually received or paid. Net unrealized currency gains (losses) from valuing foreign currency denominated assets and liabilities at period end
20
Morgan Stanley Institutional Fund, Inc.
Annual Report — December 31, 2016
Notes to Financial Statements (cont'd)
exchange rates are reflected as a component of unrealized appreciation (depreciation) in the Statement of Assets and Liabilities. The change in unrealized currency gains (losses) on foreign currency translations for the period is reflected in the Statement of Operations.
Foreign security and currency transactions may involve certain considerations and risks not typically associated with those of U.S. dollar denominated transactions as a result of, among other factors, fluctuations of exchange rates in relation to the U.S. dollar, the possibility of lower levels of governmental supervision and regulation of foreign securities markets and the possibility of political or economic instability.
Governmental approval for foreign investments may be required in advance of making an investment under certain circumstances in some countries, and the extent of foreign investments in domestic companies may be subject to limitation in other countries. Foreign ownership limitations also may be imposed by the charters of individual companies to prevent, among other concerns, violations of foreign investment limitations. As a result, an additional class of shares (identified as "Foreign" in the Portfolio of Investments) may be created and offered for investment. The "local" and "foreign shares" market values may differ. In the absence of trading of the foreign shares in such markets, the Portfolio values the foreign shares at the closing exchange price of the local shares.
4. Derivatives: The Portfolio may, but is not required to, use derivative instruments for a variety of purposes, including hedging, risk management, portfolio management or to earn income. Derivatives are financial instruments whose value is based, in part, on the value of an underlying asset, interest rate, index or financial instrument. Prevailing interest rates and volatility levels, among other things, also affect the value of derivative instruments. A derivative instrument often has risks similar to its underlying asset and may have additional risks, including imperfect correlation between the value of the derivative and the underlying asset, risks of default by the counterparty to certain transactions, magnification of losses incurred due to changes in the market value of the securities, instruments, indices or interest rates to which the derivative instrument relates, risks that the transactions may not be liquid and risks arising from margin requirements. The use of derivatives involves risks that are different from, and possibly greater than, the risks associated with other
portfolio investments. Derivatives may involve the use of highly specialized instruments that require investment techniques and risk analyses different from those associated with other portfolio investments. All of the Portfolio's holdings, including derivative instruments, are marked-to-market each day with the change in value reflected in unrealized appreciation (depreciation). Upon disposition, a realized gain or loss is recognized.
Certain derivative transactions may give rise to a form of leverage. Leverage magnifies the potential for gain and the risk of loss. Leverage associated with derivative transactions may cause the Portfolio to liquidate portfolio positions when it may not be advantageous to do so to satisfy its obligations or to meet earmarking or segregation requirements, pursuant to applicable Securities and Exchange Commission rules and regulations, or may cause the Portfolio to be more volatile than if the Portfolio had not been leveraged. Although the Adviser seeks to use derivatives to further the Portfolio's investment objectives, there is no assurance that the use of derivatives will achieve this result.
Following is a description of the derivative instruments and techniques that the Portfolio used during the period and their associated risks:
Options: With respect to options, the Portfolio is subject to equity risk, interest rate risk and foreign currency exchange risk in the normal course of pursuing its investment objectives. If the Portfolio buys an option, it buys a legal contract giving it the right to buy or sell a specific amount of the underlying instrument or foreign currency, or futures contract on the underlying instrument or foreign currency, at an agreed-upon price typically in exchange for a premium paid by the Portfolio. The Portfolio may purchase and/or sell put and call options. Purchasing call options tends to increase the Portfolio's exposure to the underlying (or similar) instrument. Purchasing put options tends to decrease the Portfolio's exposure to the underlying (or similar) instrument. When entering into purchased option contracts, the Portfolio bears the risk of interest or exchange rates or securities prices moving unexpectedly, in which case, the Portfolio may not achieve the anticipated benefits of the purchased option contracts; however the risk of loss is limited to the premium paid. Purchased options are reported as part of "Total Investments in Securities" in the Statement of Assets and Liabilities. Premium paid for purchasing options
21
Morgan Stanley Institutional Fund, Inc.
Annual Report — December 31, 2016
Notes to Financial Statements (cont'd)
which expired are treated as realized losses. If the Portfolio sells an option, it sells to another party the right to buy from or sell to the Portfolio a specific amount of the underlying instrument or foreign currency, or futures contract on the underlying instrument or foreign currency, at an agreed-upon price typically in exchange for a premium received by the Portfolio. When options are purchased OTC, the Portfolio bears the risk that the counterparty that wrote the option will be unable or unwilling to perform its obligations under the option contract. Options may also be illiquid and the Portfolio may have difficulty closing out its position. A decision as to whether, when and how to use options involves the exercise of skill and judgment and even a well-conceived option transaction may be unsuccessful because of market behavior or unexpected events. The prices of options can be highly volatile and the use of options can lower total returns.
FASB ASC 815, "Derivatives and Hedging" ("ASC 815"), is intended to improve financial reporting about derivative instruments by requiring enhanced disclosures to enable investors to better understand how and why the Portfolio uses derivative instruments, how these derivative instruments are accounted for and their effects on the Portfolio's financial position and results of operations.
The following table sets forth the fair value of the Portfolio's derivative contracts by primary risk exposure as of December 31, 2016.
| | | Asset Derivatives
Statement of Assets and
Liabilities Location | | Primary Risk
Exposure | | Value
(000) | |
Option Purchased
| | Investments, at Value
(Options Purchased) | |
Currency Risk | | $ | 40 | (a) | |
(a) Amounts are included in Investments in Securities in the Statement of Assets and Liabilities.
The following tables set forth by primary risk exposure the Portfolio's realized gains (losses) and change in unrealized appreciation (depreciation) by type of derivative contract for the year ended December 31, 2016 in accordance with ASC 815.
Realized Gain (Loss) | |
Primary Risk Exposure | | Derivative Type | | Value
(000) | |
Currency Risk
| | Investments
(Options Purchased) | | $ | (53 | )(b) | |
(b) Amounts are included in Investments Sold in the Statement of Operations.
Change in Unrealized Appreciation (Depreciation) | |
Primary Risk Exposure | | Derivative Type | | Value
(000) | |
Currency Risk
| | Investments
(Options Purchased) | | $ | (68 | )(c) | |
(c) Amounts are included in Investments in the Statement of Operations.
At December 31, 2016, the Portfolio's derivative assets and liabilities are as follows:
Gross Amounts of Assets and Liabilities Presented in the
Statement of Assets and Liabilities | |
Derivatives | | Assets(d)
(000) | | Liabilities(d)
(000) | |
Option Purchased | | $ | 40 | (a) | | $ | — | | |
(a) Amounts are included in Investments in Securities in the Statement of Assets and Liabilities.
(d) Absent an event of default or early termination, OTC derivative assets and liabilities are presented gross and not offset in the Statement of Assets and Liabilities.
The Portfolio typically enters into International Swaps and Derivatives Association, Inc. Master Agreements ("ISDA Master Agreements") or similar master agreements (collectively, "Master Agreements") with its contract counterparties for certain OTC derivatives in order to, among other things, reduce its credit risk to counterparties. ISDA Master Agreements include provisions for general obligations, representations, collateral and events of default or termination. Under an ISDA Master Agreement, the Portfolio typically may offset with the counterparty certain OTC derivative financial instruments' payables and/or receivables with collateral held and/or posted and create one single net payment (close-out netting) in the event of default, termination and/or potential deterioration in the credit quality of the counterparty. Various Master Agreements govern the terms of certain transactions with counterparties, including transactions such as swap, forward, repurchase and reverse repurchase agreements. These Master Agreements typically attempt to reduce the counterparty risk associated with such transactions by specifying credit protection mechanisms and providing standardization that improves legal certainty. Cross-termination provisions under Master Agreements typically provide that a default in connection with one transaction between the Portfolio and a counterparty gives the non-defaulting party the right to terminate any other transactions in place with the defaulting party to create one single net payment due to/due from the defaulting party and may be a feature in certain Master Agreements. In the event the Portfolio exercises its right to terminate a Master Agreement after a counterparty experiences a termination event as
22
Morgan Stanley Institutional Fund, Inc.
Annual Report — December 31, 2016
Notes to Financial Statements (cont'd)
defined in the Master Agreement, the return of collateral with market value in excess of the Portfolio's net liability may be delayed or denied.
The following table presents derivative financial instruments that are subject to enforceable netting arrangements as of December 31, 2016.
Gross Amounts Not Offset in the Statement of Assets and Liabilities | |
Counterparty | | Gross Asset
Derivatives
Presented in
Statement of
Assets and
Liabilities
(000) | | Financial
Instrument
(000) | | Collateral
Received
(000) | | Net Amount
(not less
than $0)
(000) | |
Royal Bank of Scotland | | $ | 40 | | | $ | — | | | $ | — | | | $ | 40 | | |
For the year ended December 31, 2016, the approximate average monthly amount outstanding for each derivative type is as follows:
Options Purchased: | |
Average monthly notional amount | | | 8,165,000 | | |
5. Indemnifications: The Fund enters into contracts that contain a variety of indemnifications. The Fund's maximum exposure under these arrangements is unknown. However, the Fund has not had prior claims or losses pursuant to these contracts and expects the risk of loss to be remote.
6. Dividends and Distributions to Shareholders: Dividend income and distributions to shareholders are recorded on the ex-dividend date. Dividends from net investment income, if any, are declared and paid annually. Net realized capital gains, if any, are distributed at least annually.
7. Security Transactions, Income and Expenses: Security transactions are accounted for on the trade date (date the order to buy or sell is executed). Realized gains and losses on the sale of investment securities are determined on the specific identified cost method. Dividend income and other distributions are recorded on the ex-dividend date (except for certain foreign dividends which may be recorded as soon as the Portfolio is informed of such dividends) net of applicable withholding taxes. Interest income is recognized on the accrual basis except where collection is in doubt. Discounts are accreted and premiums are amortized over the life of the respective securities. Most expenses of the Fund can be directly attributed to a particular Portfolio. Expenses which cannot be directly attributed are apportioned among the Portfolios based upon relative net assets or other appropriate methods.
Income, expenses (other than class specific expenses — distribution and shareholder services, transfer agency and sub transfer agency fees) and realized and unrealized gains or losses are allocated to each class of shares based upon their relative net assets.
B. Advisory Fees: The Adviser, a wholly-owned subsidiary of Morgan Stanley, provides the Portfolio with advisory services under the terms of an Investment Advisory Agreement, paid quarterly, at the annual rate based on the daily net assets as follows:
First $750
million | | Next $750
million | | Over $1.5
billion | |
| | 0.65 | % | | | 0.60 | % | | | 0.55 | % | |
For the year ended December 31, 2016, the advisory fee rate (net of waivers/rebate) was equivalent to an annual effective rate of 0.46% of the Portfolio's average daily net assets.
The Adviser has agreed to reduce its advisory fee and/or reimburse the Portfolio so that total annual portfolio operating expenses, excluding certain investment related expenses, taxes, interest and other extraordinary expenses (including litigation), will not exceed 0.85% for Class I shares, 1.20% for Class A shares, 0.99% for Class L shares, 1.95% for Class C shares and 0.81% for Class IS shares. The fee waivers and/or expense reimbursements will continue for at least one year from the date of the Portfolio's prospectus or until such time as the Directors act to discontinue all or a portion of such waivers and/or reimbursements when they deem such action is appropriate. For the year ended December 31, 2016, approximately $129,000 of advisory fees were waived and approximately $31,000 of other expenses were reimbursed by the Adviser pursuant to this arrangement.
C. Administration Fees: The Adviser also serves as Administrator to the Fund and provides administrative services pursuant to an Administration Agreement for an annual fee, accrued daily and paid monthly, of 0.08% of the Portfolio's average daily net assets.
Under a Sub-Administration Agreement between the Administrator and State Street Bank and Trust Company ("State Street"), State Street provides certain administrative services to the Fund. For such services, the Administrator pays State Street a portion of the fee the Administrator receives from the Portfolio.
D. Distribution and Shareholder Services Fees: Morgan Stanley Distribution, Inc. ("MSDI" or the "Distributor"), a wholly-owned subsidiary of the Adviser and an indirect subsidiary of Morgan Stanley, serves as the Fund's Distributor
23
Morgan Stanley Institutional Fund, Inc.
Annual Report — December 31, 2016
Notes to Financial Statements (cont'd)
of Portfolio shares pursuant to a Distribution Agreement. The Fund has adopted a Shareholder Services Plan with respect to Class A shares pursuant to Rule 12b-1 under the Act. Under the Shareholder Services Plan, the Portfolio pays the Distributor a shareholder services fee, accrued daily and paid monthly, at an annual rate of 0.25% of the Portfolio's average daily net assets attributable to Class A shares.
The Fund has adopted a Distribution and Shareholder Services Plan with respect to Class L shares pursuant to Rule 12b-1 under the Act. Under the Distribution and Shareholder Services Plan, the Portfolio pays the Distributor a distribution fee, accrued daily and paid monthly, at an annual rate of 0.50% and a shareholder services fee, accrued daily and paid monthly, at an annual rate of 0.25% of the Portfolio's average daily net assets attributable to Class L shares. The Distributor has agreed to waive for at least one year the 12b-1 fees on Class L shares of the Portfolio to the extent it exceeds 0.04% of the average daily net assets of such shares on an annualized basis. For the year ended December 31, 2016, this waiver amounted to approximately $32,000.
The Fund has adopted a Distribution and Shareholder Services Plan with respect to Class C shares pursuant to Rule 12b-1 under the Act. Under the Distribution and Shareholder Services Plan, the Portfolio pays the Distributor a distribution fee, accrued daily and paid monthly, at an annual rate of 0.75% and a shareholder services fee, accrued daily and paid monthly, at an annual rate of 0.25% of the Portfolio's average daily net assets attributable to Class C shares.
The distribution and shareholder services fees are used to support the expenses associated with servicing and maintaining accounts. The Distributor may compensate other parties for providing shareholder support services to investors who purchase Class A, Class L and Class C shares.
E. Dividend Disbursing and Transfer Agent: The Fund's dividend disbursing and transfer agent is Boston Financial Data Services, Inc. ("BFDS"). Pursuant to a Transfer Agency Agreement, the Fund pays BFDS a fee based on the number of classes, accounts and transactions relating to the Portfolios of the Fund.
F. Custodian Fees: State Street (the "Custodian") serves as Custodian for the Fund in accordance with a Custodian Agreement. The Custodian holds cash, securities, and other assets of the Fund as required by the Act. Custody fees are payable monthly based on assets held in custody, investment
purchases and sales activity and account maintenance fees, plus reimbursement for certain out-of-pocket expenses.
In December 2015, the Fund's Custodian announced that it had identified inconsistencies in the way in which clients were invoiced for out-of-pocket expenses from 1998 until November 2015. The dollar amount difference between what was charged and what should have been charged, plus interest, was paid back to the Portfolio in September 2016 as a reimbursement. The Custodian reimbursed the Portfolio directly, which was recognized as a change in accounting estimate and was reflected as "Reimbursement of Custodian Fees" in the Statement of Operations. Pursuant to the expense limitations described in Note B, the Portfolio has experienced waiver of advisory fees during the current period. Accordingly, the reimbursement of out-of-pocket custodian expenses in the current period resulted in the reduction in the current period waiver of advisory fees.
G. Security Transactions and Transactions with Affiliates: For the year ended December 31, 2016, purchases and sales of investment securities for the Portfolio, other than long-term U.S. Government securities and short-term investments, were approximately $95,383,000 and $53,379,000, respectively. There were no purchases and sales of long-term U.S. Government securities for the year ended December 31, 2016.
The Portfolio invests in the Institutional Class of the Morgan Stanley Institutional Liquidity Funds (the "Liquidity Funds"), an open-end management investment company managed by the Adviser. Advisory fees paid by the Portfolio are reduced by an amount equal to its pro-rata share of the advisory and administration fees paid by the Portfolio due to its investment in the Liquidity Funds. For the year ended December 31, 2016, advisory fees paid were reduced by approximately $5,000 relating to the Portfolio's investment in the Liquidity Funds.
A summary of the Portfolio's transactions in shares of the Liquidity Funds during the year ended December 31, 2016 is as follows:
Value
December 31,
2015
(000) | | Purchases
at Cost
(000) | | Sales
(000) | | Dividend
Income
(000) | | Value
December 31,
2016
(000) | |
| $ | 3,368 | | | $ | 62,118 | | | $ | 63,186 | | | $ | 10 | | | $ | 2,300 | | |
The Portfolio is permitted to purchase and sell securities ("cross-trade") from and to other Morgan Stanley Funds as well as other funds and client accounts for which the Adviser or an affiliate of the Adviser serves as investment adviser, pursuant to procedures approved by the Directors in compliance with
24
Morgan Stanley Institutional Fund, Inc.
Annual Report — December 31, 2016
Notes to Financial Statements (cont'd)
Rule 17a-7 under the Act (the "Rule"). Each cross-trade is executed at the current market price in compliance with provisions of the Rule. For the year ended December 31, 2016, the Portfolio did not engage in any cross-trade transactions.
The Portfolio has an unfunded Deferred Compensation Plan (the "Compensation Plan"), which allows each independent Director to defer payment of all, or a portion, of the fees he or she receives for serving on the Board of Directors. Each eligible Director generally may elect to have the deferred amounts credited with a return equal to the total return on one or more of the Morgan Stanley funds that are offered as investment options under the Compensation Plan. Appreciation/depreciation and distributions received from these investments are recorded with an offsetting increase/decrease in the deferred compensation obligation and do not affect the NAV of the Portfolio.
H. Federal Income Taxes: It is the Portfolio's intention to continue to qualify as a regulated investment company and distribute all of its taxable and tax-exempt income. Accordingly, no provision for federal income taxes is required in the financial statements.
The Portfolio may be subject to taxes imposed by countries in which it invests. Such taxes are generally based on income and/or capital gains earned or repatriated. Taxes are accrued based on net investment income, net realized gains and net unrealized appreciation as such income and/or gains are earned. Taxes may also be based on transactions in foreign currency and are accrued based on the value of investments denominated in such currency.
FASB ASC 740-10, "Income Taxes — Overall", sets forth a minimum threshold for financial statement recognition of the benefit of a tax position taken or expected to be taken in a tax return. Management has concluded that there are no significant uncertain tax positions that would require recognition in the financial statements. If applicable, the Portfolio recognizes interest accrued related to unrecognized tax benefits in "Interest Expense" and penalties in "Other Expenses" in the Statement of Operations. The Portfolio files tax returns with the U.S. Internal Revenue Service, New York and various states. Generally, each of the tax years in the four-year period ended December 31, 2016, remains subject to examination by taxing authorities.
The tax character of distributions paid may differ from the character of distributions shown in the Statements of Changes in Net Assets due to short-term capital gains being treated as
ordinary income for tax purposes. The tax character of distributions paid during fiscal years 2016 and 2015 was as follows:
2016
Distributions
Paid From: | | 2015
Distributions
Paid From: | |
Ordinary
Income
(000) | | Long-Term
Capital Gain
(000) | | Ordinary
Income
(000) | | Long-Term
Capital Gain
(000) | |
| $ | 166 | | | $ | 1,650 | | | $ | 18 | | | $ | 3,170 | | |
The amount and character of income and gains to be distributed are determined in accordance with income tax regulations which may differ from GAAP. These book/tax differences are either considered temporary or permanent in nature.
Temporary differences are primarily due to differing book and tax treatments in the timing of the recognition of gains (losses) on certain investment transactions and the timing of the deductibility of certain expenses.
Permanent differences, primarily due to differing treatments of gains (losses) related to foreign currency transactions and a dividend redesignation, resulted in the following reclassifications among the components of net assets at December 31, 2016:
Distributions in
Excess of Net
Investment
Income
(000) | | Accumulated
Net Realized
Gain
(000) | | Paid-in-
Capital
(000) | |
| $ | (19 | ) | | $ | 19 | | | $ | — | | |
At December 31, 2016, the components of distributable earnings for the Portfolio on a tax basis were as follows:
Undistributed
Ordinary
Income
(000) | | Undistributed
Long-Term
Capital Gain
(000) | |
| $ | — | | | $ | 555 | | |
Qualified late year losses are capital losses and specified ordinary losses, including currency losses, incurred after October 31 but within the taxable year that, if elected, are deemed to arise on the first day of the Portfolio's next taxable year. For the year ended December 31, 2016, the Portfolio deferred to January 1, 2017 for U.S. Federal income tax purposes the following losses:
Qualified Late
Year Ordinary
Losses
(000) | | Post-October
Capital Losses
(000) | |
| $ | 12 | | | $ | — | | |
I. Credit Facility: As of April 4, 2016, the Fund and other Morgan Stanley funds participated in a $150,000,000 committed, unsecured revolving line of credit facility (the "facility") with State Street. This facility is to be used for temporary
25
Morgan Stanley Institutional Fund, Inc.
Annual Report — December 31, 2016
Notes to Financial Statements (cont'd)
emergency purposes or funding of shareholder redemption requests. The interest rate on borrowings is based on the federal funds rate or one month libor rate plus a spread. The facility also has a commitment fee of 0.25% per annum based on the unused portion of the facility. During the year ended December 31, 2016, the Portfolio did not have any borrowings under the facility.
J. Other: At December 31, 2016, the Portfolio had record owners of 10% or greater. Investment activities of these shareholders could have a material impact on the Portfolio. The aggregate percentage of such owners was 45.9%.
K. Accounting Pronouncements: In December 2016, FASB issued Accounting Standards update 2016-19 — Technical Corrections and Improvements ("ASU 2016-19"), which is effective for interim periods for all entities beginning after December 15, 2016. ASU 2016-19 includes an amendment to Topic 820, Fair Value Measurement, which clarifies the difference between a valuation approach and a valuation technique when applying the guidance in that Topic. That amendment also requires an entity to disclose when there has been a change in either or both a valuation approach and/or a valuation technique. The transition guidance for the amendment must be applied prospectively because it could potentially involve the use of hindsight that includes fair value measurements. Although still evaluating the potential impacts of ASU 2016-19 to the Portfolio, management expects that the impact of the Portfolio's adoption will be limited to additional financial statement disclosures.
In October 2016, the Securities and Exchange Commission ("SEC") issued a new rule, Investment Company Reporting Modernization, which, among other provisions, amends Regulation S-X to require standardized, enhanced disclosures, particularly related to derivatives, in investment company financial statements. Compliance with the guidance is effective for financial statements filed with the SEC on or after August 1, 2017; adoption will have no effect on the Portfolio's net assets or results of operations. Although still evaluating the potential impacts of the Investment Company Reporting Modernization to the Portfolio, management expects that the impact of the Portfolio's adoption will be limited to additional financial statement disclosures.
26
Morgan Stanley Institutional Fund, Inc.
Annual Report — December 31, 2016
Report of Independent Registered Public Accounting Firm
To the Shareholders and Board of Directors of
Morgan Stanley Institutional Fund, Inc. —
Advantage Portfolio
We have audited the accompanying statement of assets and liabilities, including the portfolio of investments, of Advantage Portfolio (one of the portfolios constituting Morgan Stanley Institutional Fund, Inc.) (the "Portfolio") as of December 31, 2016, and the related statement of operations for the year then ended, the statements of changes in net assets for each of the two years in the period then ended and the financial highlights for each of the years or periods indicated therein. These financial statements and financial highlights are the responsibility of the Portfolio's management. Our responsibility is to express an opinion on these financial statements and financial highlights based on our audits.
We conducted our audits in accordance with the standards of the Public Company Accounting Oversight Board (United States). Those standards require that we plan and perform the audit to obtain reasonable assurance about whether the financial statements and financial highlights are free of material misstatement. We were not engaged to perform an audit of the Portfolio's internal control over financial reporting. Our audits included consideration of internal control over financial reporting as a basis for designing audit procedures that are appropriate in the circumstances, but not for the purpose of expressing an opinion on the effectiveness of the Portfolio's internal control over financial reporting. Accordingly, we express no such opinion. An audit also includes examining, on a test basis, evidence supporting the amounts and disclosures in the financial statements and financial highlights, assessing the accounting principles used and significant estimates made by management, and evaluating the overall financial statement presentation. Our procedures included confirmation of securities owned as of December 31, 2016, by correspondence with the custodian and others or by other appropriate auditing procedures where replies from others were not received. We believe that our audits provide a reasonable basis for our opinion.
In our opinion, the financial statements and financial highlights referred to above present fairly, in all material respects, the financial position of Advantage Portfolio (one of the portfolios constituting Morgan Stanley Institutional Fund, Inc.) at December 31, 2016, the results of its operations for the year then ended, the changes in its net assets for each of the two years in the period then ended and the financial highlights for each of the years or periods indicated therein, in conformity with U.S. generally accepted accounting principles.

Boston, Massachusetts
February 28, 2017
27
Morgan Stanley Institutional Fund, Inc.
Annual Report — December 31, 2016
Federal Tax Notice (unaudited)
For federal income tax purposes, the following information is furnished with respect to the distributions paid by the Portfolio during its taxable year ended December 31, 2016. For corporate shareholders, 100.0% of the dividends qualified for the dividends received deduction.
The Portfolio designated and paid approximately $1,650,000 as a long-term capital gain distribution.
For federal income tax purposes, the following information is furnished with respect to the Portfolio's earnings for its taxable year ended December 31, 2016. When distributed, certain earnings may be subject to a maximum tax rate of 15% as provided for the Jobs and Growth Tax Relief Reconciliation Act of 2003. The Portfolio designated up to a maximum of approximately $166,000 as taxable at this lower rate.
In January, the Portfolio provides tax information to shareholders for the preceding calendar year.
28
Morgan Stanley Institutional Fund, Inc.
Annual Report — December 31, 2016
Privacy Notice (unaudited)
MORGAN STANLEY INVESTMENT MANAGEMENT INC.
AN IMPORTANT NOTICE CONCERNING OUR U.S. PRIVACY POLICY
We are required by federal law to provide you with a copy of our privacy policy annually. This policy applies to current and former individual investors in funds managed or sponsored by Morgan Stanley Investment Management Inc. ("MSIM") as well as current and former individual clients of MSIM. This policy is not applicable to partnerships, corporations, trusts or other non-individual clients or investors. Please note that we may amend this policy at any time, and will inform you of any changes as required by law.
WE RESPECT YOUR PRIVACY
We appreciate that you have provided us with your personal financial information. We strive to maintain the privacy of such information while we help you achieve your financial objectives. This Notice describes what non-public personal information we collect about you, why we collect it, when we may share it with others and how certain others may use it. It discusses the steps you may take to limit our sharing of certain information about you to affiliated companies in the Morgan Stanley family of companies ("other Morgan Stanley companies"). It also discloses how you may limit use of certain shared information for marketing purposes by other Morgan Stanley branded companies. Throughout this policy, we refer to the non-public information that personally identifies you or your accounts as "personal information.''
1. WHAT PERSONAL INFORMATION DO WE COLLECT ABOUT YOU?
We obtain personal information from applications and other forms you submit to us, from your dealings with us, from consumer reporting agencies, from our Web sites and from third parties and other sources.
For example:
• We may collect information such as your name, address, e-mail address, telephone/fax numbers, assets, income and investment objectives through subscription documents, applications and other forms you submit to us.
• We may obtain information about account balances, your use of account(s) and the types of products and services you prefer to receive from us through your dealings and transactions with us and other sources.
• We may obtain information about your creditworthiness and credit history from consumer reporting agencies.
• We may collect background information from and through third-party vendors to verify representations you have made and to comply with various regulatory requirements.
• If you interact with us through our public and private Web sites, we may collect information that you provide directly through online communications (such as an e-mail address). We may also collect information about your Internet service provider, your domain name, your computer's operating system and Web browser, your use of our Web sites and your product and service preferences, through the use of "cookies." Please consult the Terms of Use of these sites for more details.
2. WHEN DO WE DISCLOSE PERSONAL INFORMATION WE COLLECT ABOUT YOU?
We may disclose personal information we collect about you to other Morgan Stanley companies and to non-affiliated third parties.
a. Information We Disclose to Other Morgan Stanley Companies.
We may disclose personal information to other Morgan Stanley companies for a variety of reasons, including to manage your account(s) effectively, to service and process your transactions, to let you know about products and services offered by us and other Morgan Stanley companies, to manage our business, and as otherwise required or permitted by law. Offers for products and services from other Morgan Stanley companies are developed under conditions designed to safeguard your personal information.
29
Morgan Stanley Institutional Fund, Inc.
Annual Report — December 31, 2016
Privacy Notice (unaudited) (cont'd)
b. Information We Disclose to Non-affiliated Third Parties.
We do not disclose personal information that we collect about you to non-affiliated third parties except to those who provide marketing services on our behalf, to financial institutions with whom we have joint marketing agreements, and as otherwise required or permitted by law. For example, we may disclose personal information to nonaffiliated third parties for servicing and processing transactions, to offer our own products and services, to protect against fraud, for institutional risk control, to respond to judicial process or to perform services on our behalf. When we share personal information with a non-affiliated third party, they are required to limit their use of personal information to the particular purpose for which it was shared and they are not allowed to share personal information with others except to fulfill that limited purpose or as may be permitted or required by law.
3. HOW DO WE PROTECT THE SECURITY AND CONFIDENTIALITY OF PERSONAL INFORMATION WE COLLECT ABOUT YOU?
We maintain physical, electronic and procedural security measures to help safeguard the personal information we collect about you. We have internal policies governing the proper handling of client information. Third parties that provide support or marketing services on our behalf may also receive personal information, and we require them to adhere to confidentiality standards with respect to such information.
4. HOW CAN YOU LIMIT THE SHARING OF CERTAIN TYPES OF PERSONAL INFORMATION WITH OTHER MORGAN STANLEY COMPANIES?
We offer you choices as to whether we share with other Morgan Stanley companies the personal information that was collected to determine your eligibility for products and services you request ("eligibility information"). Eligibility information does not include your identification information or personal information pertaining to our transactions or experiences with you. Please note that, even if you direct us not to share eligibility information with other Morgan Stanley companies ("opt-out"), we may still share personal information, including eligibility information, with those companies in circumstances excluded from the opt-out under applicable law, such as to process transactions or to service your account.
5. HOW CAN YOU LIMIT THE USE OF CERTAIN TYPES OF PERSONAL INFORMATION BY OTHER MORGAN STANLEY COMPANIES FOR MARKETING?
By following the opt-out instructions in Section 6 below, you may limit other Morgan Stanley branded companies from marketing their products or services to you based on personal information we disclose to them. This information may include, for example, your income and account history with us. Please note that, even if you choose to limit Other Morgan Stanley Companies from using personal information about you that we may share with them for marketing their products and services to you, Other Morgan Stanley Companies may use your personal information that they obtain from us to market to you in circumstances permitted by law, such as if the Other Morgan Stanley Company has its own relationship with you.
6. HOW CAN YOU SEND US AN OPT-OUT INSTRUCTION?
If you wish to limit our sharing of eligibility information about you with other Morgan Stanley companies or other Morgan Stanley companies' use of personal information for marketing purposes, as described in this notice, you may do so by:
• Calling us at (800) 548-7786
Monday–Friday between 8a.m. and 6p.m.(EST)
• Writing to us at the following address:
Boston Financial Data Services, Inc.
c/o Privacy Coordinator
P.O. Box 219804
Kansas City, Missouri 64121
30
Morgan Stanley Institutional Fund, Inc.
Annual Report — December 31, 2016
Privacy Notice (unaudited) (cont'd)
Your written request should include your name, address, telephone number and account number(s) to which the opt-out applies and whether you are opting out with respect to sharing of eligibility information (Section 4 above), or if information used for Marketing (Section 5 above) or both. Written opt-out requests should not be sent with any other correspondence. In order to process your request, we require that the request be provided by you directly and not through a third party.
Your opt-out preference will remain in effect with respect to this policy (as it may be amended) until you notify us otherwise. If you have a joint account, your direction for us not to share this information with other Morgan Stanley companies and for those other Morgan Stanley companies not to use your personal information for marketing will be applied to all account holders on that account. Please understand that if you limit our sharing or our affiliated companies' use of personal information, you and any joint account holder(s) may not receive information about Morgan Stanley products and services, including products or services that could help you manage your financial resources and achieve your investment objectives.
7. WHAT IF AN AFFILIATED COMPANY BECOMES A NON-AFFILIATED THIRD PARTY?
If, at any time in the future, an affiliated company becomes a non-affiliated third party, further disclosures of personal information made to the former affiliated company will be limited to those described in Section 2(b) above relating to non-affiliated third parties. If you elected under Section 6 to limit disclosures we make to affiliated companies, or use of personal information by affiliated companies, your election will not apply to use by any former affiliated company of your personal information in their possession once it becomes a non-affiliated third party.
SPECIAL NOTICE TO RESIDENTS OF VERMONT
The following section supplements our policy with respect to our individual clients who have a Vermont address and supersedes anything to the contrary in the above policy with respect to those clients only.
The state of Vermont requires financial institutions to obtain your consent prior to sharing personal information that they collect about you with affiliated companies and non-affiliated third parties other than in certain limited circumstances. Except as permitted by law, we will not share personal information we collect about you with non-affiliated third parties or other Morgan Stanley companies unless you provide us with your written consent to share such information ("opt-in").
If you wish to receive offers for investment products and services offered by or through other Morgan Stanley companies, please notify us in writing at the following address:
Boston Financial Data Services, Inc.
c/o Privacy Coordinator
P.O. Box 219804
Kansas City, Missouri 64121
Your authorization should include your name, address, telephone number and account number(s) to which the opt-in applies and should not be sent with any other correspondence. In order to process your authorization, we require that the authorization be provided by you directly and not through a third party.
SPECIAL NOTICE TO RESIDENTS OF CALIFORNIA
The following section supplements our policy with respect to our individual clients who have a California address and supersedes anything to the contrary in the above policy with respect to those clients only.
In response to a California law, if your account has a California home address, your personal information will not be disclosed to nonaffiliated third parties except as permitted by applicable California law, and we will limit sharing such information with our affiliates to comply with California privacy laws that apply to us.
31
Morgan Stanley Institutional Fund, Inc.
Annual Report — December 31, 2016
Director and Officer Information (unaudited)
Independent Directors:
Name, Age and Address of
Independent Director | | Position(s)
Held with
Registrant | | Length of Time
Served* | | Principal Occupation(s) During Past 5 Years
and Other Relevant Professional Experience | | Number of
Overseen by
Independent
Director** | | Portfolios in
Fund Complex
Other Directorships
Held by Independent
Director*** | |
Frank L. Bowman (72)
c/o Perkins Coie LLP
Counsel to the Independent
Directors
30 Rockefeller Plaza
New York, NY 10112 | | Director | | Since
August
2006 | | President, Strategic Decisions, LLC (consulting) (since February 2009); Director or Trustee of various Morgan Stanley Funds (since August 2006); Chairperson of the Compliance and Insurance Committee (since October 2015); formerly, Chairperson of the Insurance Sub-Committee of the Compliance and Insurance Committee (2007-2015); served as President and Chief Executive Officer of the Nuclear Energy Institute (policy organization) (February 2005-November 2008); retired as Admiral, U.S. Navy after serving over 38 years on active duty including 8 years as Director of the Naval Nuclear Propulsion Program in the Department of the Navy and the U.S. Department of Energy (1996-2004); served as Chief of Naval Personnel (July 1994-September 1996) and on the Joint Staff as Director of Political Military Affairs (June 1992-July 1994); knighted as Honorary Knight Commander of the Most Excellent Order of the British Empire; awarded the Officier de l'Orde National du Mérite by the French Government; elected to the National Academy of Engineering (2009). | | | 90 | | | Director of BP p.l.c.; Director of Naval and Nuclear Technologies LLP; Director Emeritus of the Armed Services YMCA; Director of the U.S. Naval Submarine League; Member of the National Security Advisory Council of the Center for U.S. Global Engagement and a member of the CNA Military Advisory Board; Chairman of the charity J Street Cup Golf; Trustee of Fairhaven United Methodist Church; and Director of other various non-profit organizations. | |
Kathleen A. Dennis (63)
c/o Perkins Coie LLP
Counsel to the Independent Directors
30 Rockefeller Plaza
New York, NY 10112 | | Director | | Since
August
2006 | | President, Cedarwood Associates (mutual fund and investment management consulting) (since July 2006); Chairperson of the Liquidity and Alternatives Sub-Committee of the Investment Committee (since October 2006) and Director or Trustee of various Morgan Stanley Funds (since August 2006); formerly, Senior Managing Director of Victory Capital Management (1993-2006). | | | 91 | | | Director of various non-profit organizations. | |
Nancy C. Everett (61)
c/o Perkins Coie LLP
Counsel to the Independent Directors
30 Rockefeller Plaza
New York, NY 10112 | | Director | | Since
January
2015 | | Chief Executive Officer, Virginia Commonwealth University Investment Company (since November 2015); Owner, OBIR, LLC (institutional investment management consulting) (since June 2014); formerly, Managing Director, BlackRock Inc. (February 2011-December 2013); and Chief Executive Officer, General Motors Asset Management (a/k/a Promark Global Advisors, Inc.) (June 2005-May 2010). | | | 91 | | | Member of Virginia Commonwealth University School of Business Foundation; formerly, Member of Virginia Commonwealth University Board of Visitors (2013-2015); Member of Committee on Directors for Emerging Markets Growth Fund, Inc. (2007-2010); Chairperson of Performance Equity Management, LLC (2006-2010); and Chairperson, GMAM Absolute Return Strategies Fund, LLC (2006-2010). | |
32
Morgan Stanley Institutional Fund, Inc.
Annual Report — December 31, 2016
Director and Officer Information (unaudited) (cont'd)
Independent Directors: (cont'd)
Name, Age and Address of
Independent Director | | Position(s)
Held with
Registrant | | Length of Time
Served* | | Principal Occupation(s) During Past 5 Years
and Other Relevant Professional Experience | | Number of
Overseen by
Independent
Director** | | Portfolios in
Fund Complex
Other Directorships
Held by Independent
Director*** | |
Jakki L. Haussler (59)
c/o Perkins Coie LLP
Counsel to the Independent Directors
30 Rockefeller Plaza
New York, NY 10112 | | Director | | Since
January
2015 | | Chairman and Chief Executive Officer, Opus Capital Group (since January 1996); formerly, Director, Capvest Venture Fund, LP (May 2000-December 2011); Partner, Adena Ventures, LP (July 1999-December 2010); Director, The Victory Funds (February 2005-July 2008). | | | 91 | | | Director of Cincinnati Bell Inc. and Member, Audit Committee and Compensation Committee; Director of Northern Kentucky University Foundation and Member, Investment Committee; Member of Chase College of Law Transactional Law Practice Center Board of Advisors; Director of Best Transport; Director of Chase College of Law Board of Visitors; formerly, Member, University of Cincinnati Foundation Investment Committee; Member, Miami University Board of Visitors (2008-2011); Trustee of Victory Funds (2005-2008) and Chairman, Investment Committee (2007-2008) and Member, Service Provider Committee (2005-2008). | |
Dr. Manuel H. Johnson (67)
c/o Johnson Smick
International, Inc.
220 I Street, N.E. — Suite 200
Washington, D.C. 20002 | | Director | | Since
July
1991 | | Senior Partner, Johnson Smick International, Inc. (consulting firm); Chairperson of the Investment Committee (since October 2006) and Director or Trustee of various Morgan Stanley Funds (since July 1991); Co-Chairman and a founder of the Group of Seven Council (G7C) (international economic commission); formerly, Chairperson of the Audit Committee (July 1991-September 2006), Vice Chairman of the Board of Governors of the Federal Reserve System and Assistant Secretary of the U.S. Treasury. | | | 91 | | | Director of NVR, Inc. (home construction). | |
Joseph J. Kearns (74)
c/o Kearns & Associates LLC
46 E Peninsula Center #385
Rolling Hills Estates, CA 90274-3712 | | Director | | Since
August
1994 | | President, Kearns & Associates LLC (investment consulting); Chairperson of the Audit Committee (since October 2006) and Director or Trustee of various Morgan Stanley Funds (since August 1994); formerly, Deputy Chairperson of the Audit Committee (July 2003-September 2006) and Chairperson of the Audit Committee of various Morgan Stanley Funds (since August 1994); CFO of the J. Paul Getty Trust. | | | 93 | | | Director of Electro Rent Corporation (equipment leasing). Prior to December 31, 2013, Director of The Ford Family Foundation. | |
33
Morgan Stanley Institutional Fund, Inc.
Annual Report — December 31, 2016
Director and Officer Information (unaudited) (cont'd)
Independent Directors: (cont'd)
Name, Age and Address of
Independent Director | | Position(s)
Held with
Registrant | | Length of Time
Served* | | Principal Occupation(s) During Past 5 Years
and Other Relevant Professional Experience | | Number of
Overseen by
Independent
Director** | | Portfolios in
Fund Complex
Other Directorships
Held by Independent
Director*** | |
Michael F. Klein (58)
c/o Perkins Coie LLP
Counsel to the Independent Directors
30 Rockefeller Plaza
New York, NY 10112 | | Director | | Since
August
2006 | | Managing Director, Aetos Capital, LLC (since March 2000); Co-President, Aetos Alternatives Management, LLC (since January 2004) and Co-Chief Executive Officer of Aetos Capital LLC (since August 2013); Chairperson of the Fixed Income Sub-Committee of the Investment Committee (since October 2006) and Director or Trustee of various Morgan Stanley Funds (since August 2006); formerly, Managing Director, Morgan Stanley & Co. Inc. and Morgan Stanley Dean Witter Investment Management, President, various Morgan Stanley Funds (June 1998-March 2000) and Principal, Morgan Stanley & Co. Inc. and Morgan Stanley Dean Witter Investment Management (August 1997-December 1999). | | | 90 | | | Director of certain investment funds managed or sponsored by Aetos Capital, LLC; Director of Sanitized AG and Sanitized Marketing AG (specialty chemicals). | |
Patricia Maleski (56)
c/o Perkins Coie LLP
Counsel to the Independent Directors
30 Rockefeller Plaza
New York, NY 10112 | | Director | | Since
January
2017 | | Management Director, JPMorgan Asset Management (2013-2016); President, JPMorgan Funds (2010-2013), Chief Administrative Officer, JPMorgan Funds (2004-2010), Treasurer, JPMorgan Funds (2003-2004, 2008-2010), and Vice President and Board Liaison, JPMorgan Funds (2001-2004); Managing Director, J.P. Morgan Investment Management Inc. (2001-2013); Vice President of Finance, Pierpont Group (1996-2001); Vice President, Bank of New York (1995-1996); Senior Audit Manager, Price Waterhouse, LLP (1982-1995). | | | 91 | | | None. | |
Michael E. Nugent (80)
522 Fifth Avenue
New York, NY 10036 | | Chair of the Board and Director | | Chair of the Boards since July 2006 and Director since July 1991 | | Chair of the Boards of various Morgan Stanley Funds (since July 2006); Chairperson of the Closed-End Fund Committee (since June 2012) and Director or Trustee of various Morgan Stanley Funds (since July 1991); formerly, Chairperson of the Insurance Committee (until July 2006); General Partner, Triumph Capital, L.P. (private investment partnership) (1988-2013). | | | 92 | | | None. | |
W. Allen Reed (69)
c/o Perkins Coie LLP
Counsel to the Independent Directors
30 Rockefeller Plaza
New York, NY 10112 | | Director | | Since
August
2006 | | Chairperson of the Equity Sub-Committee of the Investment Committee (since October 2006) and Director or Trustee of various Morgan Stanley Funds (since August 2006); formerly, President and CEO of General Motors Asset Management; Chairman and Chief Executive Officer of the GM Trust Bank and Corporate Vice President of General Motors Corporation (August 1994-December 2005). | | | 91 | | | Director of Legg Mason, Inc.; formerly, Director of the Auburn University Foundation (2010-2015). | |
Fergus Reid (84)
c/o Joe Pietryka, Inc.
85 Charles Colman Blvd.
Pawling, NY 12564 | | Director | | Since
June
1992 | | Chairman, Joe Pietryka, Inc.; Chairperson of the Governance Committee and Director or Trustee of various Morgan Stanley Funds (since June 1992). | | | 92 | | | Formerly, Trustee and Director of certain investment companies in the JP Morgan Fund Complex managed by JP Morgan Investment Management Inc. (1987-2012). | |
* This is the earliest date the Director began serving the Morgan Stanley Funds. Each Director serves an indefinite term, until his or her successor is elected.
** The Fund Complex includes (as of December 31, 2016) all open-end and closed-end funds (including all of their portfolios) advised by Morgan Stanley Investment Management Inc. (the "Adviser") and any funds that have an adviser that is an affiliated person of the Adviser (including, but not limited to, Morgan Stanley AIP GP LP).
*** This includes any directorships at public companies and registered investment companies held by the Director at any time during the past five years.
34
Morgan Stanley Institutional Fund, Inc.
Annual Report — December 31, 2016
Director and Officer Information (unaudited) (cont'd)
Executive Officers:
Name, Age and Address of Executive Officer | | Position(s) Held
with
Registrant | | Length of Time
Served* | | Principal Occupation(s) During Past 5 Years | |
John H. Gernon (53)
522 Fifth Avenue
New York, NY 10036 | | President and Principal Executive Officer | | Since
September
2013 | | President and Principal Executive Officer of the Equity and Fixed Income Funds and the Morgan Stanley AIP Funds (since September 2013) and the Liquidity Funds and various money market funds (since May 2014) in the Fund Complex; Managing Director of the Adviser; Head of Product (since 2006). | |
Timothy J. Knierim (58)
522 Fifth Avenue
New York, NY 10036 | | Chief Compliance Officer | | Since
December
2016 | | Managing Director of the Adviser and various entities affiliated with the Adviser; Chief Compliance Officer of various Morgan Stanley Funds and the Adviser (since December 2016) and Chief Compliance Officer of Morgan Stanley AIP GP LP (since 2014). Formerly, Managing Director and Deputy Chief Compliance Officer of the Adviser (2014-2016); and formerly, Chief Compliance Officer of Prudential Investment Management, Inc. (2007-2014). | |
Francis J. Smith (51)
522 Fifth Avenue
New York, NY 10036 | | Treasurer and Principal Financial Officer | | Treasurer since July 2003 and Principal Financial Officer since September 2002 | | Managing Director of the Adviser and various entities affiliated with the Adviser; Treasurer (since July 2003) and Principal Financial Officer of various Morgan Stanley Funds (since September 2002). | |
Mary E. Mullin (49)
522 Fifth Avenue
New York, NY 10036 | | Secretary | | Since
June
1999 | | Executive Director of the Adviser; Secretary of various Morgan Stanley Funds (since June 1999). | |
* This is the earliest date the officer began serving the Morgan Stanley Funds. Each officer serves a one-year term, until his or her successor is elected and qualifies.
35
Morgan Stanley Institutional Fund, Inc.
Annual Report — December 31, 2016
Adviser and Administrator
Morgan Stanley Investment Management Inc.
522 Fifth Avenue
New York, New York 10036
Distributor
Morgan Stanley Distribution, Inc.
522 Fifth Avenue
New York, New York 10036
Dividend Disbursing and Transfer Agent
Boston Financial Data Services, Inc.
2000 Crown Colony Drive
Quincy, Massachusetts 02169
Custodian
State Street Bank and Trust Company
One Lincoln Street
Boston, Massachusetts 02111
Legal Counsel
Dechert LLP
1095 Avenue of the Americas
New York, New York 10036
Counsel to the Independent Directors
Perkins Coie LLP
30 Rockefeller Plaza
New York, New York 10112
Independent Registered Public Accounting Firm
Ernst & Young LLP
200 Clarendon Street
Boston, Massachusetts 02116
Reporting to Shareholders
Each Morgan Stanley fund provides a complete schedule of portfolio holdings in its semi-annual and annual reports within 60 days of the end of the fund's second and fourth fiscal quarters. The semi-annual and annual reports are filed electronically with the Securities and Exchange Commission (SEC) on Form N-CSRS and Form N-CSR, respectively. Morgan Stanley also delivers the semi-annual and annual reports to fund shareholders and makes these reports available on its public website, www.morganstanley.com/im. Each Morgan Stanley fund also files a complete schedule of portfolio holdings with the SEC for the fund's first and third fiscal quarters on Form N-Q. Morgan Stanley does not deliver the reports for the first and third fiscal quarters to shareholders, nor are the reports posted to the Morgan Stanley public website. You may, however, obtain the Form N-Q filings (as well as the Form N-CSR and N-CSRS filings) by accessing the SEC's website, www.sec.gov. You may also review and copy them at the SEC's Public Reference Room in Washington, DC. Information on the operation of the SEC's Public Reference Room may be obtained by calling the SEC toll free at 1 (800) SEC-0330. You can also request copies of these materials, upon payment of a duplicating fee, by electronic request at the SEC's email address (publicinfo@sec.gov) or by writing the Public Reference Room of the SEC, 100 F Street, NE, Washington, DC 20549-0102.
Proxy Voting Policies and Procedures and Proxy Voting Record
You may obtain a copy of the Fund's Proxy Voting Policy and Procedures and information regarding how the Fund voted proxies relating to portfolio securities during the most recent twelve-month period ended June 30, without charge, upon request, by calling toll free 1 (800) 548-7786 or by visiting our website at www.morganstanley.com/im. This information is also available on the SEC's website at www.sec.gov.
This report is authorized for distribution only when preceded or accompanied by a prospectus or summary prospectus of the applicable Portfolio of Morgan Stanley Institutional Fund, Inc., which describes in detail the Portfolio's investment policies, risks, fees and expenses. Please read the prospectus carefully before you invest or send money. For additional information, including information regarding the investments comprising the Portfolio, please visit our website at www.morganstanley.com/im or call toll free 1 (800) 548-7786.
36
(This Page has been left blank intentionally.)
Printed in U.S.A.
This Report has been prepared for shareholders and may be distributed to others only if preceded or accompanied by a current prospectus.
Morgan Stanley Investment Management Inc.
522 Fifth Avenue
New York, New York 10036
© 2017 Morgan Stanley. Morgan Stanley Distribution, Inc.

IFIADVANN
1697069 EXP. 02.28.18

Morgan Stanley Institutional Fund, Inc.
Asia Opportunity Portfolio
Annual Report
December 31, 2016

Morgan Stanley Institutional Fund, Inc.
Annual Report — December 31, 2016
Shareholders' Letter | | | 2 | | |
Expense Example | | | 3 | | |
Investment Overview | | | 4 | | |
Portfolio of Investments | | | 6 | | |
Statement of Assets and Liabilities | | | 7 | | |
Statement of Operations | | | 9 | | |
Statements of Changes in Net Assets | | | 10 | | |
Financial Highlights | | | 11 | | |
Notes to Financial Statements | | | 15 | | |
Report of Independent Registered Public Accounting Firm | | | 25 | | |
Federal Tax Notice | | | 26 | | |
Privacy Notice | | | 27 | | |
Director and Officer Information | | | 30 | | |
This report is authorized for distribution only when preceded or accompanied by a prospectus or summary prospectus of the applicable Portfolio of Morgan Stanley Institutional Fund, Inc. To receive a prospectus and/or statement of additional information (SAI), which contains more complete information such as investment objectives, charges, expenses, policies for voting proxies, risk considerations, and describes in detail each of the Portfolio's investment policies to the prospective investor, please call toll free 1 (800) 548-7786. Please read the prospectuses carefully before you invest or send money.
Additionally, you can access information about the Portfolio, including performance, characteristics, and investment team commentary, through Morgan Stanley Investment Management's website: www.morganstanley.com/im.
Market forecasts provided in this report may not necessarily come to pass. There is no guarantee that any sectors mentioned will continue to perform as discussed herein or that securities in such sectors will be held by the Portfolio in the future. There is no assurance that a Portfolio will achieve its investment objective. Portfolios are subject to market risk, which is the possibility that market values of securities owned by the Portfolio will decline and, therefore, the value of the Portfolio's shares may be less than what you paid for them. Accordingly, you can lose money investing in this Portfolio. Please see the prospectus for more complete information on investment risks.
1
Morgan Stanley Institutional Fund, Inc.
Annual Report — December 31, 2016
Shareholders' Letter (unaudited)
Dear Shareholders,
We are pleased to provide this Annual report, in which you will learn how your investment in Asia Opportunity Portfolio (the "Portfolio") performed during the latest twelve-month period.
Morgan Stanley Investment Management is a client-centric, investor-led organization. Our global presence, intellectual capital, and breadth of products and services enable us to partner with investors to meet the evolving challenges of today's financial markets. We aim to deliver superior investment service and to empower our clients to make the informed decisions that help them reach their investment goals.
As always, we thank you for selecting Morgan Stanley Investment Management, and look forward to working with you in the months and years ahead.
Sincerely,

John H. Gernon
President and Principal Executive Officer
January 2017
2
Morgan Stanley Institutional Fund, Inc.
Annual Report — December 31, 2016
Expense Example (unaudited)
Asia Opportunity Portfolio
As a shareholder of the Portfolio, you incur two types of costs: (1) transactional costs, including redemption fees; and (2) ongoing costs, which may include advisory fees, administration fees, distribution and shareholder services fees and other Portfolio expenses. This example is intended to help you understand your ongoing costs (in dollars) of investing in the Portfolio and to compare these costs with the ongoing costs of investing in other mutual funds.
This example is based on an investment of $1,000 invested at the beginning of the six-month period ended December 31, 2016 and held for the entire six-month period.
Actual Expenses
The table below provides information about actual account values and actual expenses. You may use the information in this table, together with the amount you invested, to estimate the expenses that you paid over the period. Simply divide your account value by $1,000 (for example, an $8,600 account value divided by $1,000 = 8.6), then multiply the result by the number in the table under the heading entitled "Actual Expenses Paid During Period" to estimate the expenses you paid on your account during this period.
Hypothetical Example for Comparison Purposes
The table below provides information about hypothetical account values and hypothetical expenses based on the Portfolio's actual expense ratio and an assumed rate of return of 5% per year before expenses, which is not the Portfolio's actual return. The hypothetical account values and expenses may not be used to estimate the actual ending account balance or expenses you paid for the period. You may use this information to compare the ongoing costs of investing in the Portfolio and other funds. To do so, compare this 5% hypothetical example with the 5% hypothetical examples that appear in the shareholder reports of the other funds.
Please note that the expenses shown in the table are meant to highlight your ongoing costs only and do not reflect any transactional costs, such as sales charges (loads) and redemption fees. Therefore, the information for each class in the table is useful in comparing ongoing costs only, and will not help you determine the relative total costs of owning different funds. In addition, if these transactional costs were included, your costs would have been higher.
| | | Beginning
Account
Value
7/1/16 | | Actual Ending
Account
Value
12/31/16 | | Hypothetical
Ending Account
Value | | Actual
Expenses
Paid
During
Period* | | Hypothetical
Expenses Paid
During Period* | | Net
Expense
Ratio
During
Period** | |
Asia Opportunity Portfolio Class I | | $ | 1,000.00 | | | $ | 971.10 | | | $ | 1,019.71 | | | $ | 5.35 | | | $ | 5.48 | | | | 1.08 | % | |
Asia Opportunity Portfolio Class A | | | 1,000.00 | | | | 968.80 | | | | 1,017.90 | | | | 7.13 | | | | 7.30 | | | | 1.44 | | |
Asia Opportunity Portfolio Class C | | | 1,000.00 | | | | 965.00 | | | | 1,014.13 | | | | 10.82 | | | | 11.09 | | | | 2.19 | | |
Asia Opportunity Portfolio Class IS | | | 1,000.00 | | | | 971.60 | | | | 1,019.86 | | | | 5.20 | | | | 5.33 | | | | 1.05 | | |
* Expenses are calculated using each Portfolio Class' annualized net expense ratio (as disclosed), multiplied by the average account value over the period, and multiplied by 184/366 (to reflect the most recent one-half year period).
** Annualized.
3
Morgan Stanley Institutional Fund, Inc.
Annual Report — December 31, 2016
Investment Overview (unaudited)
Asia Opportunity Portfolio
The Portfolio seeks long-term capital appreciation.
Performance
For the year ended December 31, 2016 the Portfolio's Class I shares had a total return based on net asset value and reinvestment of distributions per share of –1.34%, net of fees. The Portfolio's Class I shares underperformed the Portfolio's benchmark, MSCI All Country Asia ex Japan Index (the "Index"), which returned 5.44%.
Factors Affecting Performance
• Asian equity markets advanced 5.44% for the 12-month period, as measured by the Index. 2016 began on a sour note, with a dramatic sell-off in China's equity markets triggered by concerns about weakening manufacturing data in China, a declining yuan and weakening sentiment about economic growth in China and the United States. China's government stimulus helped improve economic data in the remainder of the year, but China's stock market didn't fully recover its losses by year-end. The Philippines also ended the year in negative territory, as political uncertainty surrounding its new president, Rodrigo Duterte, weighed on share prices. The stronger-performing markets for the period included Thailand, which benefited from the approval of its constitution in a national referendum and relatively resilient economic growth, and Taiwan, which saw strong results in the technology sector.
• The Portfolio underperformed the Index for the period due to unfavorable stock selection and sector allocation.
• Detractors from relative performance were stock selection in the information technology and health care sectors, as well as overweight allocations to the health care, consumer staples and consumer discretionary sectors.
• The Portfolio benefited from stock selection in the consumer discretionary sector and from underweight positions in the industrials, real estate, financials and telecommunication services sectors.
Management Strategies
• We remain focused on assessing company prospects over a longer-term period of three to five years, and owning a portfolio of high-quality companies with
diverse business drivers not tied to a particular market environment.
• At the close of the period, information technology represented the largest sector weight in the Portfolio, followed by consumer discretionary and consumer staples. The team's bottom-up investment process resulted in sector overweight positions in consumer staples, consumer discretionary and health care, and underweight positions in financials, industrials, real estate, telecommunication services, materials, energy, utilities and information technology.
4
Morgan Stanley Institutional Fund, Inc.
Annual Report — December 31, 2016
Investment Overview (unaudited) (cont'd)
Asia Opportunity Portfolio

* Minimum Investment for Class I shares
** Commenced Operations on December 29, 2015.
In accordance with SEC regulations, the Portfolio's performance shown assumes that all recurring fees (including management fees) were deducted and all dividends and distributions were reinvested. The performance of Class A, C and IS shares will vary from the performance of Class I shares and will be impacted by additional fees assessed to those classes (if applicable).
Performance Compared to the MSCI All Country Asia ex Japan Index(1) and the Lipper Pacific Region ex Japan Funds Index(2)
| | | Period Ended December 31, 2016
Total Returns(3) | |
| | | | | Average Annual | |
| | | One
Year | | Five
Years | | Ten
Years | | Since
Inception(5) | |
Portfolio — Class I Shares
w/o sales charges(4) | | | –1.34 | % | | | — | | | | — | | | | –1.04 | % | |
Portfolio — Class A Shares
w/o sales charges(4) | | | –1.67 | | | | — | | | | — | | | | –1.37 | | |
Portfolio — Class A Shares with
maximum 5.25% sales charges(4) | | | –6.87 | | | | — | | | | — | | | | –6.48 | | |
Portfolio — Class C Shares
w/o sales charges(4) | | | –2.44 | | | | — | | | | — | | | | –2.14 | | |
Portfolio — Class C Shares with
maximum 1.00% deferred
sales charges(4) | | | –3.41 | | | | — | | | | — | | | | –2.14 | | |
Portfolio — Class IS Shares
w/o sales charges(4) | | | –1.29 | | | | — | | | | — | | | | –0.99 | | |
MSCI All Country Asia ex Japan Index | | | 5.44 | | | | — | | | | — | | | | 5.22 | | |
Lipper Pacific Region ex Japan
Funds Index | | | 0.27 | | | | — | | | | — | | | | –0.39 | | |
Performance data quoted represents past performance, which is no guarantee of future results, and current performance may be lower or higher than the figures shown. Performance assumes that all dividends and distributions, if any, were reinvested. For the most recent month-end performance figures, please visit www.morganstanley.com/im. Investment return and principal value will fluctuate so that Portfolio shares, when redeemed, may be worth more or less than their original cost. Total returns do not reflect the deduction of taxes that a shareholder would pay on Portfolio distributions or the redemption of Portfolio shares. Performance of share classes will vary due to difference in sales charges and expenses.
(1) The MSCI All Country Asia ex Japan Index is a free float-adjusted market capitalization weighted index that is designed to measure the equity market performance of Asia, excluding Japan. The performance of the Index is listed in U.S. dollars and assumes reinvestment of net dividends. The Index is unmanaged and its returns do not include any sales charges or fees. Such costs would lower performance. It is not possible to invest directly in an index.
(2) The Lipper Pacific Region ex Japan Funds Index is an equally weighted performance index of the largest qualifying funds (based on net assets) in the Lipper Pacific Region ex Japan Funds classification. The Index, which is adjusted for capital gains distributions and income dividends, is unmanaged and should not be considered an investment. There are currently 10 funds represented in this Index. As of the date of this report, the Portfolio was in the Lipper Pacific Region ex Japan Funds classification.
(3) Total returns for the Portfolio reflect fees waived and expenses reimbursed, if applicable, by the Adviser. Without such waivers and reimbursements, total returns would have been lower.
(4) Commenced operations on December 29, 2015.
(5) For comparative purposes, average annual since inception returns listed for the Indexes refer to the inception date of the Portfolio, not the inception of the Index.
5
Morgan Stanley Institutional Fund, Inc.
Annual Report — December 31, 2016
Portfolio of Investments
Asia Opportunity Portfolio
| | | Shares | | Value
(000) | |
Common Stocks (82.4%) | |
China (51.4%) | |
Alibaba Group Holding Ltd. ADR (a) | | | 2,663 | | | $ | 234 | | |
Baidu, Inc. ADR (a) | | | 560 | | | | 92 | | |
China Resources Beer Holdings
Company Ltd. (a)(b)(c) | | | 140,300 | | | | 278 | | |
China Resources Phoenix Healthcare Holdings
Co. Ltd. (c) | | | 98,500 | | | | 126 | | |
Ctrip.com International Ltd. ADR (a)(b) | | | 3,397 | | | | 136 | | |
Foshan Haitian Flavouring & Food Co., Ltd.,
Class A | | | 62,100 | | | | 262 | | |
Inner Mongolia Yili Industrial Group Co., Ltd.,
Class A | | | 24,900 | | | | 63 | | |
JD.com, Inc. ADR (a) | | | 5,885 | | | | 150 | | |
Jiangsu Hengrui Medicine Co., Ltd., Class A | | | 42,560 | | | | 279 | | |
Kweichow Moutai Co., Ltd., Class A | | | 3,800 | | | | 183 | | |
NetEase, Inc. ADR | | | 419 | | | | 90 | | |
Shenzhou International Group Holdings Ltd. (c) | | | 25,000 | | | | 158 | | |
TAL Education Group ADR (a) | | | 6,927 | | | | 486 | | |
Tencent Holdings Ltd. (c) | | | 21,500 | | | | 526 | | |
| | | | 3,063 | | |
Hong Kong (4.6%) | |
AIA Group Ltd. | | | 48,600 | | | | 274 | | |
India (4.4%) | |
HDFC Bank Ltd. ADR | | | 4,362 | | | | 265 | | |
Korea, Republic of (13.4%) | |
Amorepacific Corp. | | | 764 | | | | 203 | | |
Loen Entertainment, Inc. (a) | | | 1,812 | | | | 114 | | |
Medy-Tox, Inc. | | | 726 | | | | 214 | | |
NAVER Corp. | | | 233 | | | | 150 | | |
Osstem Implant Co., Ltd. (a) | | | 2,287 | | | | 115 | | |
| | | | 796 | | |
Taiwan (2.5%) | |
Taiwan Semiconductor Manufacturing Co., Ltd. | | | 27,000 | | | | 152 | | |
United States (6.1%) | |
Cognizant Technology Solutions Corp., Class A (a) | | | 6,445 | | | | 361 | | |
Total Common Stocks (Cost $4,915) | | | 4,911 | | |
Participation Notes (8.9%) | |
China (8.9%) | |
Jiangsu Yanghe Brewery, Class A,
Equity Linked Notes, expires 1/23/17 (a) | | | 27,441 | | | | 279 | | |
Suofeiya Home Collection Co., Ltd., Equity Linked
Notes, expires 4/25/17 (a) | | | 32,500 | | | | 253 | | |
Total Participation Notes (Cost $513) | | | 532 | | |
| | | Notional
Amount
(000) | | | |
Call Option Purchased (0.0%) | |
Foreign Currency Option (0.0%) | |
USD/CNY February 2017 @ CNY 8.70,
Royal Bank of Scotland (Cost $1) | | | 102 | | | | — | @ | |
| | | Shares | | Value
(000) | |
Short-Term Investment (6.4%) | |
Investment Company (6.4%) | |
Morgan Stanley Institutional Liquidity
Funds — Treasury Securities Portfolio —
Institutional Class (See Note G)
(Cost $381) | | | 380,880 | | | $ | 381 | | |
Total Investments (97.7%) (Cost $5,810)
Including $368 of Securities Loaned (d) | | | 5,824 | | |
Other Assets in Excess of Liabilities (2.3%) | | | 136 | | |
Net Assets (100.0%) | | $ | 5,960 | | |
Country assignments and aggregations are based generally on third party vendor classifications and information, and may be different from the assignments and aggregations under the policies set forth in the Portfolio's prospectus and/or statement of additional information relating to geographic classifications.
(a) Non-income producing security.
(b) All or a portion of this security was on loan at December 31, 2016.
(c) Security trades on the Hong Kong exchange.
(d) At December 31, 2016, the aggregate cost for federal income tax purposes is approximately $5,811,000. The aggregate gross unrealized appreciation is approximately $398,000 and the aggregate gross unrealized depreciation is approximately $385,000, resulting in net unrealized appreciation of approximately $13,000.
@ Value is less than $500.
ADR American Depositary Receipt.
CNY Chinese Yuan Renminbi
USD United States Dollar
Portfolio Composition
Classification | | Percentage of
Total Investments | |
Other* | | | 41.9 | % | |
Internet Software & Services | | | 18.8 | | |
Beverages | | | 12.7 | | |
Diversified Consumer Services | | | 8.3 | | |
Short-Term Investment | | | 6.5 | | |
Information Technology Services | | | 6.2 | | |
Food Products | | | 5.6 | | |
Total Investments | | | 100.0 | % | |
* Industries and/or investment types representing less than 5% of total investments.
The accompanying notes are an integral part of the financial statements.
6
Morgan Stanley Institutional Fund, Inc.
Annual Report — December 31, 2016
Asia Opportunity Portfolio
Statement of Assets and Liabilities | | December 31, 2016
(000) | |
Assets: | |
Investments in Securities of Unaffiliated Issuers, at Value(1) (Cost $5,429) | | $ | 5,443 | | |
Investment in Security of Affiliated Issuer, at Value (Cost $381) | | | 381 | | |
Total Investments in Securities, at Value (Cost $5,810) | | | 5,824 | | |
Receivable for Portfolio Shares Sold | | | 125 | | |
Due from Adviser | | | 27 | | |
Dividends Receivable | | | 1 | | |
Receivable from Affiliate | | | — | @ | |
Other Assets | | | 36 | | |
Total Assets | | | 6,013 | | |
Liabilities: | |
Payable for Professional Fees | | | 40 | | |
Payable for Custodian Fees | | | 3 | | |
Payable for Transfer Agency Fees — Class I | | | — | @ | |
Payable for Transfer Agency Fees — Class A | | | — | @ | |
Payable for Transfer Agency Fees — Class C | | | — | @ | |
Payable for Shareholder Services Fees — Class A | | | — | @ | |
Payable for Distribution and Shareholder Services Fees — Class C | | | — | @ | |
Payable for Administration Fees | | | — | @ | |
Other Liabilities | | | 10 | | |
Total Liabilities | | | 53 | | |
Net Assets | | $ | 5,960 | | |
Net Assets Consist Of: | |
Paid-in-Capital | | $ | 6,063 | | |
Distributions in Excess of Net Investment Income | | | (64 | ) | |
Accumulated Net Realized Loss | | | (53 | ) | |
Unrealized Appreciation (Depreciation) on: | |
Investments | | | 14 | | |
Foreign Currency Translations | | | — | @ | |
Net Assets | | $ | 5,960 | | |
The accompanying notes are an integral part of the financial statements.
7
Morgan Stanley Institutional Fund, Inc.
Annual Report — December 31, 2016
Asia Opportunity Portfolio
Statement of Assets and Liabilities (cont'd) | | December 31, 2016
(000) | |
CLASS I: | |
Net Assets | | $ | 5,405 | | |
| Shares Outstanding $0.001 par value shares of beneficial interest (unlimited shares authorized) (not in 000's) | | | 558,338 | | |
Net Asset Value, Offering and Redemption Price Per Share | | $ | 9.68 | | |
CLASS A: | |
Net Assets | | $ | 535 | | |
| Shares Outstanding $0.001 par value shares of beneficial interest (unlimited shares authorized) (not in 000's) | | | 55,305 | | |
Net Asset Value, Redemption Price Per Share | | $ | 9.67 | | |
Maximum Sales Load | | | 5.25 | % | |
Maximum Sales Charge | | $ | 0.54 | | |
Maximum Offering Price Per Share | | $ | 10.21 | | |
CLASS C: | |
Net Assets | | $ | 10 | | |
| Shares Outstanding $0.001 par value shares of beneficial interest (unlimited shares authorized) (not in 000's) | | | 1,000 | | |
Net Asset Value, Offering and Redemption Price Per Share | | $ | 9.68 | | |
CLASS IS: | |
Net Assets | | $ | 10 | | |
| Shares Outstanding $0.001 par value shares of beneficial interest (unlimited shares authorized) (not in 000's) | | | 1,000 | | |
Net Asset Value, Offering and Redemption Price Per Share | | $ | 9.68 | | |
(1) Including:
Securities on Loan, at Value: | | $ | 368 | | |
@ Amount is less than $500.
The accompanying notes are an integral part of the financial statements.
8
Morgan Stanley Institutional Fund, Inc.
Annual Report — December 31, 2016
Asia Opportunity Portfolio
Statement of Operations | | Year Ended
December 31, 2016
(000) | |
Investment Income: | |
Dividends from Securities of Unaffiliated Issuers (Net of $4 of Foreign Taxes Withheld) | | $ | 43 | | |
Dividends from Securities of Affiliated Issuer (Note G) | | | 1 | | |
Income from Securities Loaned — Net | | | — | @ | |
Total Investment Income | | | 44 | | |
Expenses: | |
Offering Costs | | | 116 | | |
Professional Fees | | | 92 | | |
Advisory Fees (Note B) | | | 47 | | |
Registration Fees | | | 12 | | |
Transfer Agency Fees — Class I (Note E) | | | 2 | | |
Transfer Agency Fees — Class A (Note E) | | | 2 | | |
Transfer Agency Fees — Class C (Note E) | | | 2 | | |
Transfer Agency Fees — Class IS (Note E) | | | 2 | | |
Custodian Fees (Note F) | | | 8 | | |
Shareholder Reporting Fees | | | 8 | | |
Administration Fees (Note C) | | | 5 | | |
Pricing Fees | | | 3 | | |
Directors' Fees and Expenses | | | 2 | | |
Shareholder Services Fees — Class A (Note D) | | | 1 | | |
Distribution and Shareholder Services Fees — Class C (Note D) | | | — | @ | |
Sub Transfer Agency Fees — Class A | | | — | @ | |
Other Expenses | | | 15 | | |
Total Expenses | | | 317 | | |
Expenses Reimbursed by Adviser (Note B) | | | (199 | ) | |
Waiver of Advisory Fees (Note B) | | | (47 | ) | |
Reimbursement of Class Specific Expenses — Class A (Note B) | | | (2 | ) | |
Reimbursement of Class Specific Expenses — Class C (Note B) | | | (2 | ) | |
Reimbursement of Class Specific Expenses — Class IS (Note B) | | | (2 | ) | |
Rebate from Morgan Stanley Affiliate (Note G) | | | (1 | ) | |
Net Expenses | | | 64 | | |
Net Investment Loss | | | (20 | ) | |
Realized Gain (Loss): | |
Investments Sold | | | (57 | ) | |
Foreign Currency Transactions | | | — | @ | |
Net Realized Loss | | | (57 | ) | |
Change in Unrealized Appreciation (Depreciation): | |
Investments | | | 7 | | |
Foreign Currency Translations | | | (2 | ) | |
Net Change in Unrealized Appreciation (Depreciation) | | | 5 | | |
Net Realized Loss and Change in Unrealized Appreciation (Depreciation) | | | (52 | ) | |
Net Decrease in Net Assets Resulting from Operations | | $ | (72 | ) | |
@ Amount is less than $500.
The accompanying notes are an integral part of the financial statements.
9
Morgan Stanley Institutional Fund, Inc.
Annual Report — December 31, 2016
Asia Opportunity Portfolio
Statements of Changes in Net Assets | | Year Ended
December 31, 2016
(000) | | Period from
December 29, 2015^ to
December 31, 2015
(000) | |
Increase (Decrease) in Net Assets: | |
Operations: | |
Net Investment Loss | | $ | (20 | ) | | $ | (— | @) | |
Net Realized Gain (Loss) | | | (57 | ) | | | 8 | | |
Net Change in Unrealized Appreciation (Depreciation) | | | 5 | | | | 9 | | |
Net Increase (Decrease) in Net Assets Resulting from Operations | | | (72 | ) | | | 17 | | |
Distributions from and/or in Excess of: | |
Class I: | |
Net Investment Income | | | (46 | ) | | | — | | |
Paid-in-Capital | | | (75 | ) | | | — | | |
Class A: | |
Net Investment Income | | | (2 | ) | | | — | | |
Paid-in-Capital | | | (5 | ) | | | — | | |
Class C: | |
Net Investment Income | | | — | | | | — | | |
Paid-in-Capital | | | (— | @) | | | — | | |
Class IS: | |
Net Investment Income | | | (— | @) | | | — | | |
Paid-in-Capital | | | (— | @) | | | — | | |
Total Distributions | | | (128 | ) | | | — | | |
Capital Share Transactions:(1) | |
Class I: | |
Subscribed | | | — | | | | 5,570 | | |
Distributions Reinvested | | | 13 | | | | — | | |
Class A: | |
Subscribed | | | 550 | | | | 10 | | |
Distributions Reinvested | | | 7 | | | | — | | |
Redeemed | | | (27 | ) | | | — | | |
Class C: | |
Subscribed | | | — | | | | 10 | | |
Class IS: | |
Subscribed | | | — | | | | 10 | | |
Net Increase in Net Assets Resulting from Capital Share Transactions | | | 543 | | | | 5,600 | | |
Total Increase in Net Assets | | | 343 | | | | 5,617 | | |
Net Assets: | |
Beginning of Period | | | 5,617 | | | | — | | |
End of Period (Including Distributions in Excess of Net Investment Income and Accumulated
Undistributed Net Investment Income of $(64) and $8, respectively) | | $ | 5,960 | | | $ | 5,617 | | |
(1) Capital Share Transactions: | |
Class I: | |
Shares Subscribed | | | — | | | | 557 | | |
Shares Issued on Distributions Reinvested | | | 1 | | | | — | | |
Net Increase in Class I Shares Outstanding | | | 1 | | | | 557 | | |
Class A: | |
Shares Subscribed | | | 56 | | | | 1 | | |
Shares Issued on Distributions Reinvested | | | 1 | | | | — | | |
Shares Redeemed | | | (3 | ) | | | — | | |
Net Increase in Class A Shares Outstanding | | | 54 | | | | 1 | | |
Class C: | |
Shares Subscribed | | | — | | | | 1 | | |
Class IS: | |
Shares Subscribed | | | — | | | | 1 | | |
^ Commencement of Operations.
@ Amount is less than $500.
The accompanying notes are an integral part of the financial statements.
10
Morgan Stanley Institutional Fund, Inc.
Annual Report — December 31, 2016
Financial Highlights
Asia Opportunity Portfolio
| | | Class I | |
Selected Per Share Data and Ratios | | Year Ended
December 31, 2016 | | Period from
December 29, 2015(1) to
December 31, 2015 | |
Net Asset Value, Beginning of Period | | $ | 10.03 | | | $ | 10.00 | | |
Income (Loss) from Investment Operations: | |
Net Investment Loss (2) | | | (0.03 | ) | | | (0.00 | )(3) | |
Net Realized and Unrealized Gain (Loss) | | | (0.10 | ) | | | 0.03 | | |
Total from Investment Operations | | | (0.13 | ) | | | 0.03 | | |
Distributions from and/or in Excess of: | |
Net Investment Income | | | (0.08 | ) | | | — | | |
Paid-in-Capital | | | (0.14 | ) | | | — | | |
Total Distributions | | | (0.22 | ) | | | — | | |
Net Asset Value, End of Period | | $ | 9.68 | | | $ | 10.03 | | |
Total Return (4) | | | (1.34 | )% | | | 0.30 | %(6) | |
Ratios and Supplemental Data: | |
Net Assets, End of Period (Thousands) | | $ | 5,405 | | | $ | 5,587 | | |
Ratio of Expenses to Average Net Assets (8) | | | 1.08 | %(5) | | | 1.03 | %(5)(7) | |
Ratio of Net Investment Loss to Average Net Assets (8) | | | (0.31 | )%(5) | | | (0.71 | )%(5)(7) | |
Ratio of Rebate from Morgan Stanley Affiliates to Average Net Assets | | | 0.01 | % | | | 0.04 | %(7) | |
Portfolio Turnover Rate | | | 44 | % | | | 0 | %(6) | |
(8) Supplemental Information on the Ratios to Average Net Assets: | |
Ratios Before Expense Limitation: | |
Expenses to Average Net Assets | | | 5.28 | % | | | 125.50 | %(7) | |
Net Investment Loss to Average Net Assets | | | (4.51 | )% | | | (125.18 | )%(7) | |
(1) Commencement of Operations.
(2) Per share amount is based on average shares outstanding.
(3) Amount is less than $0.005 per share.
(4) Calculated based on the net asset value as of the last business day of the period.
(5) The Ratios of Expenses and Net Investment Loss reflect the rebate of certain Portfolio expenses in connection with the investments in Morgan Stanley affiliates during the period. The effect of the rebate on the ratios is disclosed in the above table as "Ratio of Rebate from Morgan Stanley Affiliates to Average Net Assets."
(6) Not Annualized.
(7) Annualized.
The accompanying notes are an integral part of the financial statements.
11
Morgan Stanley Institutional Fund, Inc.
Annual Report — December 31, 2016
Financial Highlights
Asia Opportunity Portfolio
| | | Class A | |
Selected Per Share Data and Ratios | | Year Ended
December 31, 2016 | | Period from
December 29, 2015(1) to
December 31, 2015 | |
Net Asset Value, Beginning of Period | | $ | 10.03 | | | $ | 10.00 | | |
Income (Loss) from Investment Operations: | |
Net Investment Loss (2) | | | (0.08 | ) | | | (0.00 | )(3) | |
Net Realized and Unrealized Gain (Loss) | | | (0.09 | ) | | | 0.03 | | |
Total from Investment Operations | | | (0.17 | ) | | | 0.03 | | |
Distributions from and/or in Excess of: | |
Net Investment Income | | | (0.05 | ) | | | — | | |
Paid-in-Capital | | | (0.14 | ) | | | — | | |
Total Distributions | | | (0.19 | ) | | | — | | |
Net Asset Value, End of Period | | $ | 9.67 | | | $ | 10.03 | | |
Total Return (4) | | | (1.67 | )% | | | 0.30 | %(6) | |
Ratios and Supplemental Data: | |
Net Assets, End of Period (Thousands) | | $ | 535 | | | $ | 10 | | |
Ratio of Expenses to Average Net Assets (8) | | | 1.44 | %(5) | | | 1.40 | %(5)(7) | |
Ratio of Net Investment Loss to Average Net Assets (8) | | | (0.78 | )%(5) | | | (1.09 | )%(5)(7) | |
Ratio of Rebate from Morgan Stanley Affiliates to Average Net Assets | | | 0.01 | % | | | 0.05 | %(7) | |
Portfolio Turnover Rate | | | 44 | % | | | 0 | %(6) | |
(8) Supplemental Information on the Ratios to Average Net Assets: | |
Ratios Before Expense Limitation: | |
Expenses to Average Net Assets | | | 6.36 | % | | | 139.50 | %(7) | |
Net Investment Loss to Average Net Assets | | | (5.70 | )% | | | (139.19 | )%(7) | |
(1) Commencement of Operations.
(2) Per share amount is based on average shares outstanding.
(3) Amount is less than $0.005 per share.
(4) Calculated based on the net asset value which does not reflect sales charges, if applicable, as of the last business day of the period.
(5) The Ratios of Expenses and Net Investment Loss reflect the rebate of certain Portfolio expenses in connection with the investments in Morgan Stanley affiliates during the period. The effect of the rebate on the ratios is disclosed in the above table as "Ratio of Rebate from Morgan Stanley Affiliates to Average Net Assets."
(6) Not Annualized.
(7) Annualized.
The accompanying notes are an integral part of the financial statements.
12
Morgan Stanley Institutional Fund, Inc.
Annual Report — December 31, 2016
Financial Highlights
Asia Opportunity Portfolio
| | | Class C | |
Selected Per Share Data and Ratios | | Year Ended
December 31, 2016 | | Period from
December 29, 2015(1) to
December 31, 2015 | |
Net Asset Value, Beginning of Period | | $ | 10.03 | | | $ | 10.00 | | |
Income (Loss) from Investment Operations: | |
Net Investment Loss (2) | | | (0.14 | ) | | | (0.00 | )(3) | |
Net Realized and Unrealized Gain | | | (0.10 | ) | | | 0.03 | | |
Total from Investment Operations | | | (0.24 | ) | | | 0.03 | | |
Distributions from and/or in Excess of: | |
Net Investment Income | | | — | | | | — | | |
Paid-in-Capital | | | (0.11 | ) | | | — | | |
Total Distributions | | | (0.11 | ) | | | — | | |
Net Asset Value, End of Period | | $ | 9.68 | | | $ | 10.03 | | |
Total Return (4) | | | (2.44 | )% | | | 0.30 | %(6) | |
Ratios and Supplemental Data: | |
Net Assets, End of Period (Thousands) | | $ | 10 | | | $ | 10 | | |
Ratio of Expenses to Average Net Assets (8) | | | 2.19 | %(5) | | | 2.17 | %(5)(7) | |
Ratio of Net Investment Loss to Average Net Assets (8) | | | (1.42 | )%(5) | | | (1.84 | )%(5)(7) | |
Ratio of Rebate from Morgan Stanley Affiliates to Average Net Assets | | | 0.01 | % | | | 0.03 | %(7) | |
Portfolio Turnover Rate | | | 44 | % | | | 0 | %(6) | |
(8) Supplemental Information on the Ratios to Average Net Assets: | |
Ratios Before Expense Limitation: | |
Expense to Average Net Assets | | | 27.34 | % | | | 140.25 | %(7) | |
Net Investment Loss to Average Net Assets | | | (26.57 | )% | | | (139.92 | )%(7) | |
(1) Commencement of Operations.
(2) Per share amount is based on average shares outstanding.
(3) Amount is less than $0.005 per share.
(4) Calculated based on the net asset value which does not reflect sales charges, if applicable, as of the last business day of the period.
(5) The Ratios of Expenses and Net Investment Loss reflect the rebate of certain Portfolio expenses in connection with the investments in Morgan Stanley affiliates during the period. The effect of the rebate on the ratios is disclosed in the above table as "Ratio of Rebate from Morgan Stanley Affiliates to Average Net Assets."
(6) Not Annualized.
(7) Annualized.
The accompanying notes are an integral part of the financial statements.
13
Morgan Stanley Institutional Fund, Inc.
Annual Report — December 31, 2016
Financial Highlights
Asia Opportunity Portfolio
| | | Class IS | |
Selected Per Share Data and Ratios | | Year Ended
December 31, 2016 | | Period from
December 29, 2015(1) to
December 31, 2015 | |
Net Asset Value, Beginning of Period | | $ | 10.03 | | | $ | 10.00 | | |
Income (Loss) from Investment Operations: | |
Net Investment Loss (2) | | | (0.03 | ) | | | (0.00 | )(3) | |
Net Realized and Unrealized Gain (Loss) | | | (0.10 | ) | | | 0.03 | | |
Total from Investment Operations | | | (0.13 | ) | | | 0.03 | | |
Distributions from and/or in Excess of: | |
Net Investment Income | | | (0.08 | ) | | | — | | |
Paid-in-Capital | | | (0.14 | ) | | | — | | |
Total Distributions | | | (0.22 | ) | | | — | | |
Net Asset Value, End of Period | | $ | 9.68 | | | $ | 10.03 | | |
Total Return (4) | | | (1.29 | )% | | | 0.30 | %(6) | |
Ratios and Supplemental Data: | |
Net Assets, End of Period (Thousands) | | $ | 10 | | | $ | 10 | | |
Ratio of Expenses to Average Net Assets (8) | | | 1.04 | %(5) | | | 1.02 | %(5)(7) | |
Ratio of Net Investment Loss to Average Net Assets (8) | | | (0.26 | )%(5) | | | (0.69 | )%(5)(7) | |
Ratio of Rebate from Morgan Stanley Affiliates to Average Net Assets | | | 0.01 | % | | | 0.03 | %(7) | |
Portfolio Turnover Rate | | | 44 | % | | | 0 | %(6) | |
(8) Supplemental Information on the Ratios to Average Net Assets: | |
Ratios Before Expense Limitation: | |
Expenses to Average Net Assets | | | 25.20 | % | | | 139.25 | %(7) | |
Net Investment Loss to Average Net Assets | | | (24.42 | )% | | | (138.92 | )%(7) | |
(1) Commencement of Operations.
(2) Per share amount is based on average shares outstanding.
(3) Amount is less than $0.005 per share.
(4) Calculated based on the net asset value as of the last business day of the period.
(5) The Ratios of Expenses and Net Investment Loss reflect the rebate of certain Portfolio expenses in connection with the investments in Morgan Stanley affiliates during the period. The effect of the rebate on the ratios is disclosed in the above table as "Ratio of Rebate from Morgan Stanley Affiliates to Average Net Assets."
(6) Not Annualized.
(7) Annualized.
The accompanying notes are an integral part of the financial statements.
14
Morgan Stanley Institutional Fund, Inc.
Annual Report — December 31, 2016
Notes to Financial Statements
Morgan Stanley Institutional Fund, Inc. (the "Fund") is registered under the Investment Company Act of 1940, as amended (the "Act"), as an open-end management investment company. The Fund is comprised of twenty-nine separate, active, diversified and non-diversified portfolios (individually referred to as a "Portfolio", collectively as the "Portfolios"). The Fund applies investment company accounting and reporting guidance.
The accompanying financial statements relate to the Asia Opportunity Portfolio. The Portfolio seeks long-term capital appreciation.
The Portfolio offers four classes of shares — Class I, Class A, Class C and Class IS.
A. Significant Accounting Policies: The following significant accounting policies are in conformity with U.S. generally accepted accounting principles ("GAAP"). Such policies are consistently followed by the Fund in the preparation of its financial statements. GAAP may require management to make estimates and assumptions that affect the reported amounts and disclosures in the financial statements. Actual results may differ from those estimates.
1. Security Valuation: (1) An equity portfolio security listed or traded on an exchange is valued at its latest reported sales price (or at the exchange official closing price if such exchange reports an official closing price), and if there were no sales on a given day and if there is no official exchange closing price for that day, the security is valued at the mean between the last reported bid and asked prices if such bid and asked prices are available on the relevant exchanges; (2) all other equity portfolio securities for which over-the-counter ("OTC") market quotations are readily available are valued at the latest reported sales price (or at the market official closing price if such market reports an official closing price), and if there was no trading in the security on a given day and if there is no official closing price from relevant markets for that day, the security is valued at the mean between the last reported bid and asked prices if such bid and asked prices are available on the relevant markets. Listed equity securities not traded on the valuation date with no reported bid and asked prices available on the exchange are valued at the mean between the current bid and asked prices obtained from one or more reputable brokers or dealers. An unlisted equity security that does not trade on the valuation date and for which bid and asked prices from the relevant markets are unavailable is valued at the mean between the current bid and asked prices obtained
from one or more reputable brokers or dealers. In cases where a security is traded on more than one exchange, the security is valued on the exchange designated as the primary market; (3) certain portfolio securities may be valued by an outside pricing service/vendor approved by the Fund's Board of Directors (the "Directors"). The pricing service/vendor may employ a pricing model that takes into account, among other things, bids, yield spreads, and/or other market data and specific security characteristics. Alternatively, if a valuation is not available from an outside pricing service/vendor, and the security trades on an exchange, the security may be valued at its latest reported sale price (or at the exchange official closing price if such exchange reports an official closing price), prior to the time when assets are valued. If there are no sales on a given day and if there is no official exchange closing price for that day, the security is valued at the mean between the last reported bid and asked prices if such bid and asked prices are available in the relevant exchanges; (4) Listed options are valued at the last reported sales price on the exchange on which they are listed (or at the exchange official closing price if such exchange reports an official closing price). If an official closing price or last reported sale price is unavailable, the listed option should be fair valued at the mean between its latest bid and ask prices. Unlisted options are valued at the mean between their latest bid and ask prices from a broker/dealer or valued by a pricing service/vendor; (5) when market quotations are not readily available, including circumstances under which Morgan Stanley Investment Management Inc. (the "Adviser") determines that the closing price, last sale price or the mean between the last reported bid and asked prices are not reflective of a security's market value, portfolio securities are valued at their fair value as determined in good faith under procedures established by and under the general supervision of the Directors. Occasionally, developments affecting the closing prices of securities and other assets may occur between the times at which valuations of such securities are determined (that is, close of the foreign market on which the securities trade) and the close of business of the New York Stock Exchange ("NYSE"). If developments occur during such periods that are expected to materially affect the value of such securities, such valuations may be adjusted to reflect the estimated fair value of such securities as of the close of the NYSE, as determined in good faith by the Directors or by the Adviser using a pricing service and/or procedures approved by the Directors; (6) quotations of foreign portfolio securities, other assets and liabilities and forward
15
Morgan Stanley Institutional Fund, Inc.
Annual Report — December 31, 2016
Notes to Financial Statements (cont'd)
contracts stated in foreign currency are translated into U.S. dollar equivalents at the prevailing market rates prior to the close of the NYSE; and (7) investments in mutual funds, including the Morgan Stanley Institutional Liquidity Funds, are valued at the net asset value ("NAV") as of the close of each business day.
The Directors have responsibility for determining in good faith the fair value of the investments, and the Directors may appoint others, such as the Fund's Adviser or a valuation committee, to assist the Directors in determining fair value and to make the actual calculations pursuant to the fair valuation methodologies previously approved by the Directors. Under procedures approved by the Directors, the Fund's Adviser has formed a Valuation Committee whose members are approved by the Directors. The Valuation Committee provides administration and oversight of the Fund's valuation policies and procedures, which are reviewed at least annually by the Directors. These procedures allow the Fund to utilize independent pricing services, quotations from securities and financial instrument dealers, and other market sources to determine fair value.
The Fund has procedures to determine the fair value of securities and other financial instruments for which market prices are not readily available. Under these procedures, the Valuation Committee convenes on a regular and ad hoc basis to review such securities and considers a number of factors, including valuation methodologies and significant unobservable valuation inputs, when arriving at fair value. The Valuation Committee may employ a market-based approach which may use related or comparable assets or liabilities, recent transactions, market multiples, book values, and other relevant information for the investment to determine the fair value of the investment. An income-based valuation approach may also be used in which the anticipated future cash flows of the investment are discounted to calculate fair value. Discounts may also be applied due to the nature or duration of any restrictions on the disposition of the investments. Due to the inherent uncertainty of valuations of such investments, the fair values may differ significantly from the values that would have been used had an active market existed. The Valuation Committee employs various methods for calibrating these valuation approaches including a regular review of valuation methodologies, key inputs and assumptions,
transactional back-testing or disposition analysis, and reviews of any related market activity.
2. Fair Value Measurement: Financial Accounting Standards Board ("FASB") Accounting Standards CodificationTM ("ASC") 820, "Fair Value Measurement" ("ASC 820"), defines fair value as the value that the Fund would receive to sell an investment or pay to transfer a liability in a timely transaction with an independent buyer in the principal market, or in the absence of a principal market, the most advantageous market for the investment or liability. ASC 820 establishes a three-tier hierarchy to distinguish between (1) inputs that reflect the assumptions market participants would use in valuing an asset or liability developed based on market data obtained from sources independent of the reporting entity (observable inputs) and (2) inputs that reflect the reporting entity's own assumptions about the assumptions market participants would use in valuing an asset or liability developed based on the best information available in the circumstances (unobservable inputs) and to establish classification of fair value measurements for disclosure purposes. Various inputs are used in determining the value of the Fund's investments. The inputs are summarized in the three broad levels listed below.
• Level 1 – unadjusted quoted prices in active markets for identical investments
• Level 2 – other significant observable inputs (including quoted prices for similar investments, interest rates, prepayment speeds, credit risk, etc.)
• Level 3 – significant unobservable inputs including the Fund's own assumptions in determining the fair value of investments. Factors considered in making this determination may include, but are not limited to, information obtained by contacting the issuer, analysts, or the appropriate stock exchange (for exchange-traded securities), analysis of the issuer's financial statements or other available documents and, if necessary, available information concerning other securities in similar circumstances
The inputs or methodology used for valuing securities are not necessarily an indication of the risk associated with investing in those securities and the determination
16
Morgan Stanley Institutional Fund, Inc.
Annual Report — December 31, 2016
Notes to Financial Statements (cont'd)
of the significance of a particular input to the fair value measurement in its entirety requires judgment and considers factors specific to each security.
The following is a summary of the inputs used to value the Portfolio's investments as of December 31, 2016.
Investment Type | | Level 1
Unadjusted
quoted
prices
(000) | | Level 2
Other
significant
observable
inputs
(000) | | Level 3
Significant
unobservable
inputs
(000) | | Total
(000) | |
Assets: | |
Common Stocks | |
Banks | | $ | 265 | | | $ | — | | | $ | — | | | $ | 265 | | |
Beverages | | | 461 | | | | — | | | | — | | | | 461 | | |
Biotechnology | | | 214 | | | | — | | | | — | | | | 214 | | |
Diversified Consumer
Services | | | 486 | | | | — | | | | — | | | | 486 | | |
Food Products | | | 325 | | | | — | | | | — | | | | 325 | | |
Health Care Equipment &
Supplies | | | 115 | | | | — | | | | — | | | | 115 | | |
Health Care Providers &
Services | | | 126 | | | | — | | | | — | | | | 126 | | |
Information Technology
Services | | | 361 | | | | — | | | | — | | | | 361 | | |
Insurance | | | 274 | | | | — | | | | — | | | | 274 | | |
Internet & Direct
Marketing Retail | | | 286 | | | | — | | | | — | | | | 286 | | |
Internet Software &
Services | | | 1,092 | | | | — | | | | — | | | | 1,092 | | |
Media | | | 114 | | | | — | | | | — | | | | 114 | | |
Personal Products | | | 203 | | | | — | | | | — | | | | 203 | | |
Pharmaceuticals | | | 279 | | | | — | | | | — | | | | 279 | | |
Semiconductors &
Semiconductor
Equipment | | | 152 | | | | — | | | | — | | | | 152 | | |
Textiles, Apparel &
Luxury Goods | | | 158 | | | | — | | | | — | | | | 158 | | |
Total Common Stocks | | | 4,911 | | | | — | | | | — | | | | 4,911 | | |
Participation Notes | | | — | | | | 532 | | | | — | | | | 532 | | |
Call Option Purchased | | | — | | | | — | @ | | | — | | | | — | @ | |
Short-Term Investment | |
Investment Company | | | 381 | | | | — | | | | — | | | | 381 | | |
Total Assets | | $ | 5,292 | | | $ | 532 | | | $ | — | | | $ | 5,824 | | |
@ Value is less than $500.
Transfers between investment levels may occur as the markets fluctuate and/or the availability of data used in an investment's valuation changes. The Portfolio recognizes transfers between the levels as of the end of the period. As of December 31, 2016, securities with a total value of approximately $2,698,000 transferred from Level 2 to Level 1. Securities that were valued using other significant observable inputs at December 31, 2015 were valued using unadjusted quoted prices at December 31, 2016. At December 31, 2015, the fair value of certain securities were adjusted due to developments which occurred
between the time of the close of the foreign markets on which they trade and the close of business on the NYSE which resulted in their Level 2 classification.
3. Foreign Currency Translation and Foreign Investments: The books and records of the Portfolio are maintained in U.S. dollars. Foreign currency amounts are translated into U.S. dollars as follows:
– investments, other assets and liabilities at the prevailing rate of exchange on the valuation date;
– investment transactions and investment income at the prevailing rates of exchange on the dates of such transactions.
Although the net assets of the Portfolio are presented at the foreign exchange rates and market values at the close of the period, the Portfolio does not isolate that portion of the results of operations arising as a result of changes in the foreign exchange rates from the fluctuations arising from changes in the market prices of securities held at period end. Similarly, the Portfolio does not isolate the effect of changes in foreign exchange rates from the fluctuations arising from changes in the market prices of securities sold during the period. Accordingly, realized and unrealized foreign currency gains (losses) on investments in securities are included in the reported net realized and unrealized gains (losses) on investment transactions and balances. However, pursuant to U.S. federal income tax regulations, gains and losses from certain foreign currency transactions and the foreign currency portion of gains and losses realized on sales and maturities of foreign denominated debt securities are treated as ordinary income for U.S. federal income tax purposes.
Net realized gains (losses) on foreign currency transactions represent net foreign exchange gains (losses) from foreign currency forward exchange contracts, disposition of foreign currencies, currency gains (losses) realized between the trade and settlement dates on securities transactions, and the difference between the amount of investment income and foreign withholding taxes recorded on the Portfolio's books and the U.S. dollar equivalent amounts actually received or paid. Net unrealized currency gains (losses) from valuing foreign currency denominated assets and liabilities at period end exchange rates are reflected as a component of unrealized appreciation (depreciation) in the Statement of
17
Morgan Stanley Institutional Fund, Inc.
Annual Report — December 31, 2016
Notes to Financial Statements (cont'd)
Assets and Liabilities. The change in unrealized currency gains (losses) on foreign currency translations for the period is reflected in the Statement of Operations.
Foreign security and currency transactions may involve certain considerations and risks not typically associated with those of U.S. dollar denominated transactions as a result of, among other factors, fluctuations of exchange rates in relation to the U.S. dollar, the possibility of lower levels of governmental supervision and regulation of foreign securities markets and the possibility of political or economic instability.
Governmental approval for foreign investments may be required in advance of making an investment under certain circumstances in some countries, and the extent of foreign investments in domestic companies may be subject to limitation in other countries. Foreign ownership limitations also may be imposed by the charters of individual companies to prevent, among other concerns, violations of foreign investment limitations. As a result, an additional class of shares (identified as "Foreign" in the Portfolio of Investments) may be created and offered for investment. The "local" and "foreign shares" market values may differ. In the absence of trading of the foreign shares in such markets, the Portfolio values the foreign shares at the closing exchange price of the local shares.
4. Derivatives: The Portfolio may, but is not required to, use derivative instruments for a variety of purposes, including hedging, risk management, portfolio management or to earn income. Derivatives are financial instruments whose value is based, in part, on the value of an underlying asset, interest rate, index or financial instrument. Prevailing interest rates and volatility levels, among other things, also affect the value of derivative instruments. A derivative instrument often has risks similar to its underlying asset and may have additional risks, including imperfect correlation between the value of the derivative and the underlying asset, risks of default by the counterparty to certain transactions, magnification of losses incurred due to changes in the market value of the securities, instruments, indices or interest rates to which the derivative instrument relates, risks that the transactions may not be liquid and risks arising from margin requirements. The use of derivatives involves risks that are different from, and possibly greater than, the risks associated with other portfolio investments. Derivatives may involve the use of
highly specialized instruments that require investment techniques and risk analyses different from those associated with other portfolio investments. All of the Portfolio's holdings, including derivative instruments, are marked-to-market each day with the change in value reflected in unrealized appreciation (depreciation). Upon disposition, a realized gain or loss is recognized.
Certain derivative transactions may give rise to a form of leverage. Leverage magnifies the potential for gain and the risk of loss. Leverage associated with derivative transactions may cause the Portfolio to liquidate portfolio positions when it may not be advantageous to do so to satisfy its obligations or to meet earmarking or segregation requirements, pursuant to applicable Securities and Exchange Commission rules and regulations, or may cause the Portfolio to be more volatile than if the Portfolio had not been leveraged. Although the Adviser seeks to use derivatives to further the Portfolio's investment objectives, there is no assurance that the use of derivatives will achieve this result.
Following is a description of the derivative instruments and techniques that the Portfolio used during the period and their associated risks:
Options: With respect to options, the Portfolio is subject to equity risk, interest rate risk and foreign currency exchange risk in the normal course of pursuing its investment objectives. If the Portfolio buys an option, it buys a legal contract giving it the right to buy or sell a specific amount of the underlying instrument or foreign currency, or futures contract on the underlying instrument or foreign currency, at an agreed-upon price typically in exchange for a premium paid by the Portfolio. The Portfolio may purchase and/or sell put and call options. Purchasing call options tends to increase the Portfolio's exposure to the underlying (or similar) instrument. Purchasing put options tends to decrease the Portfolio's exposure to the underlying (or similar) instrument. When entering into purchased option contracts, the Portfolio bears the risk of interest or exchange rates or securities prices moving unexpectedly, in which case, the Portfolio may not achieve the anticipated benefits of the purchased option contracts; however the risk of loss is limited to the premium paid. Purchased options are reported as part of "Total Investments in Securities" in the Statement of Assets and Liabilities. Premium paid for purchasing options which expired are treated as realized losses. If the Portfolio sells an
18
Morgan Stanley Institutional Fund, Inc.
Annual Report — December 31, 2016
Notes to Financial Statements (cont'd)
option, it sells to another party the right to buy from or sell to the Portfolio a specific amount of the underlying instrument or foreign currency, or futures contract on the underlying instrument or foreign currency, at an agreed-upon price typically in exchange for a premium received by the Portfolio. When options are purchased OTC, the Portfolio bears the risk that the counterparty that wrote the option will be unable or unwilling to perform its obligations under the option contract. Options may also be illiquid and the Portfolio may have difficulty closing out its position. A decision as to whether, when and how to use options involves the exercise of skill and judgment and even a well-conceived option transaction may be unsuccessful because of market behavior or unexpected events. The prices of options can be highly volatile and the use of options can lower total returns.
FASB ASC 815, "Derivatives and Hedging" ("ASC 815"), is intended to improve financial reporting about derivative instruments by requiring enhanced disclosures to enable investors to better understand how and why the Portfolio uses derivative instruments, how these derivative instruments are accounted for and their effects on the Portfolio's financial position and results of operations.
The following table sets forth the fair value of the Portfolio's derivative contracts by primary risk exposure as of December 31, 2016.
| | | Asset Derivatives
Statement of Assets and
Liabilities Location | | Primary Risk
Exposure | | Value
(000) | |
Option Purchased
| | Investments, at Value
(Option Purchased) | | Currency Risk | | $ | — | @(a) | |
(a) Amounts are included in Investments in Securities in the Statement of Assets and Liabilities.
@ Value is less than $500.
The following tables set forth by primary risk exposure the Portfolio's realized gains (losses) and change in unrealized appreciation (depreciation) by type of derivative contract for the year ended December 31, 2016 in accordance with ASC 815.
Realized Gain (Loss) | |
Primary Risk Exposure | | Derivative Type | | Value
(000) | |
Currency Risk | | Investments
(Options Purchased) | | | $(4)(b) | | |
(b) Amounts are included in Investments Sold in the Statement of Operations.
Change in Unrealized Appreciation (Depreciation) | |
Primary Risk Exposure | | Derivative Type | | Value
(000) | |
Currency Risk | | Investments
(Options Purchased) | | | $(1)(c) | | |
(c) Amounts are included in Investments in the Statement of Operations.
At December 31, 2016, the Portfolio's derivative assets and liabilities are as follows:
Gross Amounts of Assets and Liabilities Presented in the
Statement of Assets and Liabilities | |
Derivatives | | Assets(d)
(000) | | Liabilities(d)
(000) | |
Option Purchased | | $ | — | @(a) | | $ | — | | |
(a) Amounts are included in Investments in Securities in the Statement of Assets and Liabilities.
(d) Absent an event of default or early termination, OTC derivative assets and liabilities are presented gross and not offset in the Statement of Assets and Liabilities.
@ Value is less than $500.
The Portfolio typically enters into International Swaps and Derivatives Association, Inc. Master Agreements ("ISDA Master Agreements") or similar master agreements (collectively, "Master Agreements") with its contract counterparties for certain OTC derivatives in order to, among other things, reduce its credit risk to counterparties. ISDA Master Agreements include provisions for general obligations, representations, collateral and events of default or termination. Under an ISDA Master Agreement, the Portfolio typically may offset with the counterparty certain OTC derivative financial instruments' payables and/or receivables with collateral held and/or posted and create one single net payment (close-out netting) in the event of default, termination and/or potential deterioration in the credit quality of the counterparty. Various Master Agreements govern the terms of certain transactions with counterparties, including transactions such as swap, forward, repurchase and reverse repurchase agreements. These Master Agreements typically attempt to reduce the counterparty risk associated with such transactions by specifying credit protection mechanisms and providing standardization that improves legal certainty. Cross-termination provisions under Master Agreements typically provide that a default in connection with one transaction between the Portfolio and a counterparty gives the non-defaulting party the right to terminate any other transactions in place with the defaulting party to create one single net payment due to/due from the defaulting party and may be a feature in certain Master Agreements. In the event the Portfolio exercises its right to terminate a Master Agreement after a
19
Morgan Stanley Institutional Fund, Inc.
Annual Report — December 31, 2016
Notes to Financial Statements (cont'd)
counterparty experiences a termination event as defined in the Master Agreement, the return of collateral with market value in excess of the Portfolio's net liability may be delayed or denied.
The following table presents derivative financial instruments that are subject to enforceable netting arrangements as of December 31, 2016.
Gross Amounts Not Offset in the Statement of Assets and Liabilities | |
Counterparty | | Gross Asset
Derivatives
Presented in
Statement of
Assets and
Liabilities
(000) | | Financial
Instrument
(000) | | Collateral
Received
(000) | | Net Amount
(not less
than $0)
(000) | |
Royal Bank of Scotland | | $ | — | @ | | $ | — | | | $ | — | | | $ | — | @ | |
@ Value is less than $500.
For the year ended December 31, 2016, the approximate average monthly amount outstanding for each derivative type is as follows:
Options Purchased: | |
Average monthly notional amount | | | 513,000 | | |
5. Securities Lending: The Portfolio lends securities to qualified financial institutions, such as broker-dealers, to earn additional income. Any increase or decrease in the fair value of the securities loaned that might occur and any interest earned or dividends declared on those securities during the term of the loan would remain in the Portfolio. The Portfolio would receive cash or securities as collateral in an amount equal to or exceeding 100% of the current fair value of the loaned securities. The collateral is marked-to-market daily by State Street Bank and Trust Company ("State Street"), the securities lending agent, to ensure that a minimum of 100% collateral coverage is maintained.
Based on pre-established guidelines, the securities lending agent invests any cash collateral that is received in an affiliated money market portfolio and repurchase agreements. Securities lending income is generated from the earnings on the invested collateral and borrowing fees, less any rebates owed to the borrowers and compensation to the lending agent, and is recorded as "Income from Securities Loaned — Net" in the Portfolio's Statement of Operations. Risks in securities lending transactions are that a borrower may not provide additional collateral when required or return the securities when due, and that the value of the short-term investments will be less than the amount of cash collateral
plus any rebate that is required to be returned to the borrower.
The Portfolio has the right under the lending agreement to recover the securities from the borrower on demand.
The following table presents financial instruments that are subject to enforceable netting arrangements as of December 31, 2016.
Gross Amounts Not Offset in the Statement of Assets and Liabilities | |
Gross Asset
Amounts
Presented in
Statement of
Assets and
Liabilities
(000) | | Financial
Instrument
(000) | | Collateral
Received
(000) | | Net Amount
(not less
than $0)
(000) | |
| $ | 368 | (e) | | $ | — | | | $ | (368 | )(f)(g) | | $ | 0 | | |
(e) Represents market value of loaned securities at period end.
(f) The Portfolio received non-cash collateral of approximately $379,000 in the form of U.S. Government obligations, which the Portfolio cannot sell or repledge, and accordingly are not reflected in the Portfolio of Investments.
(g) The actual collateral received is greater than the amount shown here due to overcollateralization.
6. Structured Investments: The Portfolio invested a portion of its assets in structured investments. A structured investment is a derivative security designed to offer a return linked to a particular underlying security, currency, commodity or market. Structured investments may come in various forms including notes (such as exchange-traded notes), warrants and options to purchase securities. The Portfolio will typically use structured investments to gain exposure to a permitted underlying security, currency, commodity or market when direct access to a market is limited or inefficient from a tax or cost standpoint. There can be no assurance that structured investments will trade at the same price or have the same value as the underlying security, currency, commodity or market. Investments in structured investments involve risks including issuer risk, counterparty risk and market risk. Holders of structured investments bear risks of the underlying investment and are subject to issuer or counterparty risk because the Portfolio is relying on the creditworthiness of such issuer or counterparty and has no rights with respect to the underlying investment. Certain structured investments may be thinly traded or have a limited trading market and may have the effect of increasing the Portfolio's illiquidity to the extent that the Portfolio, at a particular time, may be unable to find qualified buyers for these securities.
20
Morgan Stanley Institutional Fund, Inc.
Annual Report — December 31, 2016
Notes to Financial Statements (cont'd)
7. Redemption Fees: The Portfolio will assess a 2% redemption fee on Class I shares, Class A shares, Class C shares and Class IS shares, which is paid directly to the Portfolio, for shares redeemed or exchanged within thirty days of purchase, subject to certain exceptions. The redemption fee is designed to protect the Portfolio and its remaining shareholders from the effects of short-term trading. These fees, if any, are included in the Statements of Changes in Net Assets.
8. Indemnifications: The Fund enters into contracts that contain a variety of indemnifications. The Fund's maximum exposure under these arrangements is unknown. However, the Fund has not had prior claims or losses pursuant to these contracts and expects the risk of loss to be remote.
9. Dividends and Distributions to Shareholders: Dividend income and distributions to shareholders are recorded on the ex-dividend date. Dividends from net investment income, if any, are declared and paid annually. Net realized capital gains, if any, are distributed at least annually.
10. Security Transactions, Income and Expenses: Security transactions are accounted for on the trade date (date the order to buy or sell is executed). Realized gains and losses on the sale of investment securities are determined on the specific identified cost method. Dividend income and other distributions are recorded on the ex-dividend date (except for certain foreign dividends which may be recorded as soon as the Portfolio is informed of such dividends) net of applicable withholding taxes. Interest income is recognized on the accrual basis except where collection is in doubt. Discounts are accreted and premiums are amortized over the life of the respective securities. Most expenses of the Fund can be directly attributed to a particular Portfolio. Expenses which cannot be directly attributed are apportioned among the Portfolios based upon relative net assets or other appropriate methods. Income, expenses (other than class specific expenses — distribution and shareholder services, transfer agency and sub transfer agency fees) and realized and unrealized gains or losses are allocated to each class of shares based upon their relative net assets.
B. Advisory Fees: The Adviser, a wholly-owned subsidiary of Morgan Stanley, provides the Portfolio with advisory services under the terms of an Investment Advisory Agreement,
paid quarterly, at the annual rate based on the daily net assets as follows:
First $750
million | | Next $750
million | | Over $1.5
billion | |
| | 0.80 | % | | | 0.75 | % | | | 0.70 | % | |
For the year ended December 31, 2016, the advisory fee rate (net of waivers/rebate) was equivalent to an annual effective rate of 0.00% of the Portfolio's average daily net assets.
The Adviser has agreed to reduce its advisory fee and/or reimburse the Portfolio so that total annual portfolio operating expenses, excluding certain investment related expenses, taxes, interest and other extraordinary expenses (including litigation), will not exceed 1.10% for Class I shares, 1.45% for Class A shares, 2.20% for Class C shares and 1.05% for Class IS shares. The fee waivers and/or expense reimbursements will continue for at least one year from the date of the Portfolio's prospectus or until such time as the Directors act to discontinue all or a portion of such waivers and/or reimbursements when they deem such action is appropriate. For the year ended December 31, 2016, approximately $47,000 of advisory fees were waived and approximately $205,000 of other expenses were reimbursed by the Adviser pursuant to this arrangement.
C. Administration Fees: The Adviser also serves as Administrator to the Fund and provides administrative services pursuant to an Administration Agreement for an annual fee, accrued daily and paid monthly, of 0.08% of the Portfolio's average daily net assets.
Under a Sub-Administration Agreement between the Administrator and State Street Bank and Trust Company ("State Street"), State Street provides certain administrative services to the Fund. For such services, the Administrator pays State Street a portion of the fee the Administrator receives from the Portfolio.
D. Distribution and Shareholder Services Fees: Morgan Stanley Distribution, Inc. ("MSDI" or the "Distributor"), a wholly-owned subsidiary of the Adviser and an indirect subsidiary of Morgan Stanley, serves as the Fund's Distributor of Portfolio shares pursuant to a Distribution Agreement. The Fund has adopted a Shareholder Services Plan with respect to Class A shares pursuant to Rule 12b-1 under the Act. Under the Shareholder Services Plan, the Portfolio pays the Distributor a shareholder services fee, accrued daily and paid monthly, at an annual rate of 0.25% of the Portfolio's average daily net assets attributable to Class A shares.
21
Morgan Stanley Institutional Fund, Inc.
Annual Report — December 31, 2016
Notes to Financial Statements (cont'd)
The Fund has adopted a Distribution and Shareholder Services Plan with respect to Class C shares pursuant to Rule 12b-1 under the Act. Under the Distribution and Shareholder Services Plan, the Portfolio pays the Distributor a distribution fee, accrued daily and paid monthly, at an annual rate of 0.75% and a shareholder services fee, accrued daily and paid monthly, at an annual rate of 0.25% of the Portfolio's average daily net assets attributable to Class C shares.
The distribution and shareholder services fees are used to support the expenses associated with servicing and maintaining accounts. The Distributor may compensate other parties for providing shareholder support services to investors who purchase Class A and Class C shares.
E. Dividend Disbursing and Transfer Agent: The Fund's dividend disbursing and transfer agent is Boston Financial Data Services, Inc. ("BFDS"). Pursuant to a Transfer Agency Agreement, the Fund pays BFDS a fee based on the number of classes, accounts and transactions relating to the Portfolios of the Fund.
F. Custodian Fees: State Street (the "Custodian") serves as Custodian for the Fund in accordance with a Custodian Agreement. The Custodian holds cash, securities, and other assets of the Fund as required by the Act. Custody fees are payable monthly based on assets held in custody, investment purchases and sales activity and account maintenance fees, plus reimbursement for certain out-of-pocket expenses.
G. Security Transactions and Transactions with Affiliates: For the year ended December 31, 2016, purchases and sales of investment securities for the Portfolio, other than long-term U.S. Government securities and short-term investments, were approximately $2,366,000 and $2,364,000, respectively. There were no purchases and sales of long-term U.S. Government securities for the year ended December 31, 2016.
The Portfolio invests in the Institutional Class of the Morgan Stanley Institutional Liquidity Funds (the "Liquidity Funds"), an open-end management investment company managed by the Adviser. Advisory fees paid by the Portfolio are reduced by an amount equal to its pro-rata share of the advisory and administration fees paid by the Portfolio due to its investment in the Liquidity Funds. For the year ended December 31, 2016, advisory fees paid were reduced by approximately $1,000 relating to the Portfolio's investment in the Liquidity Funds.
A summary of the Portfolio's transactions in shares of the Liquidity Funds during the year ended December 31, 2016 is as follows:
Value
December 31,
2015
(000) | | Purchases
at Cost
(000) | | Sales
(000) | | Dividend
Income
(000) | | Value
December 31,
2016
(000) | |
| $ | 4,820 | | | $ | 2,199 | | | $ | 6,638 | | | $ | 1 | | | $ | 381 | | |
The Portfolio is permitted to purchase and sell securities ("cross-trade") from and to other Morgan Stanley Funds as well as other funds and client accounts for which the Adviser or an affiliate of the Adviser serves as investment adviser, pursuant to procedures approved by the Directors in compliance with Rule 17a-7 under the Act (the "Rule"). Each cross-trade is executed at the current market price in compliance with provisions of the Rule. For the year ended December 31, 2016, the Portfolio did not engage in any cross-trade transactions.
The Portfolio has an unfunded Deferred Compensation Plan (the "Compensation Plan"), which allows each independent Director to defer payment of all, or a portion, of the fees he or she receives for serving on the Board of Directors. Each eligible Director generally may elect to have the deferred amounts credited with a return equal to the total return on one or more of the Morgan Stanley funds that are offered as investment options under the Compensation Plan. Appreciation/depreciation and distributions received from these investments are recorded with an offsetting increase/decrease in the deferred compensation obligation and do not affect the NAV of the Portfolio.
H. Federal Income Taxes: It is the Portfolio's intention to continue to qualify as a regulated investment company and distribute all of its taxable and tax-exempt income. Accordingly, no provision for federal income taxes is required in the financial statements.
The Portfolio may be subject to taxes imposed by countries in which it invests. Such taxes are generally based on income and/or capital gains earned or repatriated. Taxes are accrued based on net investment income, net realized gains and net unrealized appreciation as such income and/or gains are earned. Taxes may also be based on transactions in foreign currency and are accrued based on the value of investments denominated in such currency.
FASB ASC 740-10, "Income Taxes — Overall", sets forth a minimum threshold for financial statement recognition of the benefit of a tax position taken or expected to be taken in a tax return. Management has concluded there are no significant uncertain tax positions that would require recognition in the
22
Morgan Stanley Institutional Fund, Inc.
Annual Report — December 31, 2016
Notes to Financial Statements (cont'd)
financial statements. If applicable, the Portfolio recognizes interest accrued related to unrecognized tax benefits in "Interest Expense" and penalties in "Other Expenses" in the Statement of Operations. The Portfolio files tax returns with the U.S. Internal Revenue Service, New York and various states. Generally, each of the tax years in the two-year period ended December 31, 2016, remains subject to examination by taxing authorities.
The tax character of distributions paid may differ from the character of distributions shown in the Statements of Changes in Net Assets due to short-term capital gains being treated as ordinary income for tax purposes. The tax character of distributions paid during fiscal years 2016 and 2015 was as follows:
| | | 2016
Distributions
Paid From: | | 2015
Distributions
Paid From: | |
| | | Ordinary
Income
(000) | | Long-Term
Capital Gain
(000) | | Paid-in-
Capital
(000) | | Ordinary
Income
(000) | | Long-Term
Capital Gain
(000) | |
| | | | | $ | 48 | | | $ | — | | | $ | 80 | | | $ | — | | | $ | — | | |
The amount and character of income and gains to be distributed are determined in accordance with income tax regulations which may differ from GAAP. These book/tax differences are either considered temporary or permanent in nature.
Temporary differences are primarily due to differing book and tax treatments for the timing in the recognition of gains (losses) on certain investment transactions and the timing of the deductibility of certain expenses.
Permanent differences, primarily due to differing treatments of gains (losses) related to foreign currency transactions, resulted in the following reclassifications among the components of net assets at December 31, 2016:
Distributions
in Excess of
Net Investment
Income
(000) | | Accumulated
Net Realized
Loss
(000) | | Paid-in-
Capital
(000) | |
| $ | (4 | ) | | $ | 4 | | | $ | (— | @) | |
@ Amount is less than $500.
At December 31, 2016, the Portfolio had no distributable earnings on a tax basis.
At December 31, 2016, the Portfolio had available unused short-term capital losses of approximately $52,000 that do not have an expiration date.
To the extent that capital loss carryforwards are used to offset any future capital gains realized, no capital gains tax liability
will be incurred by the Portfolio for gains realized and not distributed. To the extent that capital gains are offset, such gains will not be distributed to the shareholders.
Qualified late year losses are capital losses and specified ordinary losses, including currency losses, incurred after October 31 but within the taxable year that, if elected, are deemed to arise on the first day of the Portfolio's next taxable year. For the year ended December 31, 2016, the Portfolio deferred to January 1, 2017 for U.S. federal income tax purposes the following losses:
Qualified Late
Year Ordinary
Losses
(000) | | Post-October
Capital
Losses
(000) | |
| $ | 4 | | | $ | — | | |
I. Credit Facility: As of April 4, 2016, the Fund and other Morgan Stanley funds participated in a $150,000,000 committed, unsecured revolving line of credit facility (the "facility") with State Street. This facility is to be used for temporary emergency purposes or funding of shareholder redemption requests. The interest rate on borrowings is based on the federal funds rate or one month libor rate plus a spread. The facility also has a commitment fee of 0.25% per annum based on the unused portion of the facility. During the year ended December 31, 2016, the Portfolio did not have any borrowings under the facility.
J. Other: At December 31, 2016, the Portfolio did not have record owners of 10% or greater.
K. Accounting Pronouncements: In December 2016, FASB issued Accounting Standards update 2016-19 — Technical Corrections and Improvements ("ASU 2016-19"), which is effective for interim periods for all entities beginning after December 15, 2016. ASU 2016-19 includes an amendment to Topic 820, Fair Value Measurement, which clarifies the difference between a valuation approach and a valuation technique when applying the guidance in that Topic. That amendment also requires an entity to disclose when there has been a change in either or both a valuation approach and/or a valuation technique. The transition guidance for the amendment must be applied prospectively because it could potentially involve the use of hindsight that includes fair value measurements. Although still evaluating the potential impacts of ASU 2016-19 to the Portfolio, management expects that the impact of the Portfolio's adoption will be limited to additional financial statement disclosures.
23
Morgan Stanley Institutional Fund, Inc.
Annual Report — December 31, 2016
Notes to Financial Statements (cont'd)
In October 2016, the Securities and Exchange Commission ("SEC") issued a new rule, Investment Company Reporting Modernization, which, among other provisions, amends Regulation S-X to require standardized, enhanced disclosures, particularly related to derivatives, in investment company financial statements. Compliance with the guidance is effective for financial statements filed with the SEC on or after August 1, 2017; adoption will have no effect on the Portfolio's net assets or results of operations. Although still evaluating the potential impacts of the Investment Company Reporting Modernization to the Portfolio, management expects that the impact of the Portfolio's adoption will be limited to additional financial statement disclosures.
24
Morgan Stanley Institutional Fund, Inc.
Annual Report — December 31, 2016
Report of Independent Registered Public Accounting Firm
To the Shareholders and Board of Directors of
Morgan Stanley Institutional Fund, Inc. —
Asia Opportunity Portfolio
We have audited the accompanying statement of assets and liabilities, including the portfolio of investments, of Asia Opportunity Portfolio (one of the portfolios constituting Morgan Stanley Institutional Fund, Inc.) (the "Portfolio") as of December 31, 2016, and the related statement of operations for the year then ended, and the statements of changes in net assets and the financial highlights for each of the years or periods indicated therein. These financial statements and financial highlights are the responsibility of the Portfolio's management. Our responsibility is to express an opinion on these financial statements and financial highlights based on our audits.
We conducted our audits in accordance with the standards of the Public Company Accounting Oversight Board (United States). Those standards require that we plan and perform the audit to obtain reasonable assurance about whether the financial statements and financial highlights are free of material misstatement. We were not engaged to perform an audit of the Portfolio's internal control over financial reporting. Our audits included consideration of internal control over financial reporting as a basis for designing audit procedures that are appropriate in the circumstances, but not for the purpose of expressing an opinion on the effectiveness of the Portfolio's internal control over financial reporting. Accordingly, we express no such opinion. An audit also includes examining, on a test basis, evidence supporting the amounts and disclosures in the financial statements and financial highlights, assessing the accounting principles used and significant estimates made by management, and evaluating the overall financial statement presentation. Our procedures included confirmation of securities owned as of December 31, 2016, by correspondence with the custodian and others or by other appropriate auditing procedures where replies from others were not received. We believe that our audits provides a reasonable basis for our opinion.
In our opinion, the financial statements and financial highlights referred to above present fairly, in all material respects, the financial position of Asia Opportunity Portfolio (one of the portfolios constituting Morgan Stanley Institutional Fund, Inc.) at December 31, 2016, the results of its operations for the year then ended, and the changes in its net assets and the financial highlights for each of the years or periods indicated therein, in conformity with U.S. generally accepted accounting principles.

Boston, Massachusetts
February 28, 2017
25
Morgan Stanley Institutional Fund, Inc.
Annual Report — December 31, 2016
Federal Tax Notice (unaudited)
For federal income tax purposes, the following information is furnished with respect to the Portfolio's earnings for its taxable year ended December 31, 2016. When distributed, certain earnings may be subject to a maximum tax rate of 15% as provided for the Jobs and Growth Tax Relief Reconciliation Act of 2003. The Portfolio designated up to a maximum of approximately $27,000 as taxable at this lower rate.
The Portfolio intends to pass through foreign tax credits of approximately $3,000 and has derived net income from sources within foreign countries amounting to approximately $46,000.
In January, the Portfolio provides tax information to shareholders for the preceding calendar year.
26
Morgan Stanley Institutional Fund, Inc.
Annual Report — December 31, 2016
Privacy Notice (unaudited)
MORGAN STANLEY INVESTMENT MANAGEMENT INC.
AN IMPORTANT NOTICE CONCERNING OUR U.S. PRIVACY POLICY
We are required by federal law to provide you with a copy of our privacy policy annually. This policy applies to current and former individual investors in funds managed or sponsored by Morgan Stanley Investment Management Inc. ("MSIM") as well as current and former individual clients of MSIM. This policy is not applicable to partnerships, corporations, trusts or other non-individual clients or investors. Please note that we may amend this policy at any time, and will inform you of any changes as required by law.
WE RESPECT YOUR PRIVACY
We appreciate that you have provided us with your personal financial information. We strive to maintain the privacy of such information while we help you achieve your financial objectives. This Notice describes what non-public personal information we collect about you, why we collect it, when we may share it with others and how certain others may use it. It discusses the steps you may take to limit our sharing of certain information about you to affiliated companies in the Morgan Stanley family of companies ("other Morgan Stanley companies"). It also discloses how you may limit use of certain shared information for marketing purposes by other Morgan Stanley branded companies. Throughout this policy, we refer to the non-public information that personally identifies you or your accounts as "personal information."
1. WHAT PERSONAL INFORMATION DO WE COLLECT ABOUT YOU?
We obtain personal information from applications and other forms you submit to us, from your dealings with us, from consumer reporting agencies, from our Web sites and from third parties and other sources.
For example:
• We may collect information such as your name, address, e-mail address, telephone/fax numbers, assets, income and investment objectives through subscription documents, applications and other forms you submit to us.
• We may obtain information about account balances, your use of account(s) and the types of products and services you prefer to receive from us through your dealings and transactions with us and other sources.
• We may obtain information about your creditworthiness and credit history from consumer reporting agencies.
• We may collect background information from and through third-party vendors to verify representations you have made and to comply with various regulatory requirements.
• If you interact with us through our public and private Web sites, we may collect information that you provide directly through online communications (such as an e-mail address). We may also collect information about your Internet service provider, your domain name, your computer's operating system and Web browser, your use of our Web sites and your product and service preferences, through the use of "cookies." Please consult the Terms of Use of these sites for more details.
2. WHEN DO WE DISCLOSE PERSONAL INFORMATION WE COLLECT ABOUT YOU?
We may disclose personal information we collect about you to other Morgan Stanley companies and to non-affiliated third parties.
a. Information We Disclose to Other Morgan Stanley Companies.
We may disclose personal information to other Morgan Stanley companies for a variety of reasons, including to manage your account(s) effectively, to service and process your transactions, to let you know about products and services offered by us and other Morgan Stanley companies, to manage our business, and as otherwise required or permitted by law. Offers for products and services from other Morgan Stanley companies are developed under conditions designed to safeguard your personal information.
27
Morgan Stanley Institutional Fund, Inc.
Annual Report — December 31, 2016
Privacy Notice (unaudited) (cont'd)
b. Information We Disclose to Non-affiliated Third Parties.
We do not disclose personal information that we collect about you to non-affiliated third parties except to those who provide marketing services on our behalf, to financial institutions with whom we have joint marketing agreements, and as otherwise required or permitted by law. For example, we may disclose personal information to nonaffiliated third parties for servicing and processing transactions, to offer our own products and services, to protect against fraud, for institutional risk control, to respond to judicial process or to perform services on our behalf. When we share personal information with a non-affiliated third party, they are required to limit their use of personal information to the particular purpose for which it was shared and they are not allowed to share personal information with others except to fulfill that limited purpose or as may be permitted or required by law.
3. HOW DO WE PROTECT THE SECURITY AND CONFIDENTIALITY OF PERSONAL INFORMATION WE COLLECT ABOUT YOU?
We maintain physical, electronic and procedural security measures to help safeguard the personal information we collect about you. We have internal policies governing the proper handling of client information. Third parties that provide support or marketing services on our behalf may also receive personal information, and we require them to adhere to confidentiality standards with respect to such information.
4. HOW CAN YOU LIMIT THE SHARING OF CERTAIN TYPES OF PERSONAL INFORMATION WITH OTHER MORGAN STANLEY COMPANIES?
We offer you choices as to whether we share with other Morgan Stanley companies the personal information that was collected to determine your eligibility for products and services you request ("eligibility information"). Eligibility information does not include your identification information or personal information pertaining to our transactions or experiences with you. Please note that, even if you direct us not to share eligibility information with other Morgan Stanley companies ("opt-out"), we may still share personal information, including eligibility information, with those companies in circumstances excluded from the opt-out under applicable law, such as to process transactions or to service your account.
5. HOW CAN YOU LIMIT THE USE OF CERTAIN TYPES OF PERSONAL INFORMATION BY OTHER MORGAN STANLEY COMPANIES FOR MARKETING?
By following the opt-out instructions in Section 6 below, you may limit other Morgan Stanley branded companies from marketing their products or services to you based on personal information we disclose to them. This information may include, for example, your income and account history with us. Please note that, even if you choose to limit Other Morgan Stanley Companies from using personal information about you that we may share with them for marketing their products and services to you, Other Morgan Stanley Companies may use your personal information that they obtain from us to market to you in circumstances permitted by law, such as if the Other Morgan Stanley Company has its own relationship with you.
6. HOW CAN YOU SEND US AN OPT-OUT INSTRUCTION?
If you wish to limit our sharing of eligibility information about you with other Morgan Stanley companies or other Morgan Stanley companies' use of personal information for marketing purposes, as described in this notice, you may do so by:
• Calling us at (800) 548-7786
Monday–Friday between 8a.m. and 6p.m.(EST)
• Writing to us at the following address:
Boston Financial Data Services, Inc.
c/o Privacy Coordinator
P.O. Box 219804
Kansas City, Missouri 64121
28
Morgan Stanley Institutional Fund, Inc.
Annual Report — December 31, 2016
Privacy Notice (unaudited) (cont'd)
Your written request should include your name, address, telephone number and account number(s) to which the opt-out applies and whether you are opting out with respect to sharing of eligibility information (Section 4 above), or if information used for Marketing (Section 5 above) or both. Written opt-out requests should not be sent with any other correspondence. In order to process your request, we require that the request be provided by you directly and not through a third party.
Your opt-out preference will remain in effect with respect to this policy (as it may be amended) until you notify us otherwise. If you have a joint account, your direction for us not to share this information with other Morgan Stanley companies and for those other Morgan Stanley companies not to use your personal information for marketing will be applied to all account holders on that account. Please understand that if you limit our sharing or our affiliated companies' use of personal information, you and any joint account holder(s) may not receive information about Morgan Stanley products and services, including products or services that could help you manage your financial resources and achieve your investment objectives.
7. WHAT IF AN AFFILIATED COMPANY BECOMES A NON-AFFILIATED THIRD PARTY?
If, at any time in the future, an affiliated company becomes a non-affiliated third party, further disclosures of personal information made to the former affiliated company will be limited to those described in Section 2(b) above relating to non-affiliated third parties. If you elected under Section 6 to limit disclosures we make to affiliated companies, or use of personal information by affiliated companies, your election will not apply to use by any former affiliated company of your personal information in their possession once it becomes a non-affiliated third party.
SPECIAL NOTICE TO RESIDENTS OF VERMONT
The following section supplements our policy with respect to our individual clients who have a Vermont address and supersedes anything to the contrary in the above policy with respect to those clients only.
The state of Vermont requires financial institutions to obtain your consent prior to sharing personal information that they collect about you with affiliated companies and non-affiliated third parties other than in certain limited circumstances. Except as permitted by law, we will not share personal information we collect about you with non-affiliated third parties or other Morgan Stanley companies unless you provide us with your written consent to share such information ("opt-in").
If you wish to receive offers for investment products and services offered by or through other Morgan Stanley companies, please notify us in writing at the following address:
Boston Financial Data Services, Inc.
c/o Privacy Coordinator
P.O. Box 219804
Kansas City, Missouri 64121
Your authorization should include your name, address, telephone number and account number(s) to which the opt-in applies and should not be sent with any other correspondence. In order to process your authorization, we require that the authorization be provided by you directly and not through a third party.
SPECIAL NOTICE TO RESIDENTS OF CALIFORNIA
The following section supplements our policy with respect to our individual clients who have a California address and supersedes anything to the contrary in the above policy with respect to those clients only.
In response to a California law, if your account has a California home address, your personal information will not be disclosed to nonaffiliated third parties except as permitted by applicable California law, and we will limit sharing such information with our affiliates to comply with California privacy laws that apply to us.
29
Morgan Stanley Institutional Fund, Inc.
Annual Report — December 31, 2016
Director and Officer Information (unaudited)
Independent Directors:
Name, Age and Address of
Independent Director | | Position(s)
Held with
Registrant | | Length of Time
Served* | | Principal Occupation(s) During Past 5 Years
and Other Relevant Professional Experience | | Number of
Overseen by
Independent
Director** | | Portfolios in
Fund Complex
Other Directorships
Held by Independent
Director*** | |
Frank L. Bowman (72)
c/o Perkins Coie LLP
Counsel to the Independent
Directors
30 Rockefeller Plaza
New York, NY 10112 | | Director | | Since
August
2006 | | President, Strategic Decisions, LLC (consulting) (since February 2009); Director or Trustee of various Morgan Stanley Funds (since August 2006); Chairperson of the Compliance and Insurance Committee (since October 2015); formerly, Chairperson of the Insurance Sub-Committee of the Compliance and Insurance Committee (2007-2015); served as President and Chief Executive Officer of the Nuclear Energy Institute (policy organization) (February 2005-November 2008); retired as Admiral, U.S. Navy after serving over 38 years on active duty including 8 years as Director of the Naval Nuclear Propulsion Program in the Department of the Navy and the U.S. Department of Energy (1996-2004); served as Chief of Naval Personnel (July 1994-September 1996) and on the Joint Staff as Director of Political Military Affairs (June 1992-July 1994); knighted as Honorary Knight Commander of the Most Excellent Order of the British Empire; awarded the Officier de l'Orde National du Mérite by the French Government; elected to the National Academy of Engineering (2009). | | | 90 | | | Director of BP p.l.c.; Director of Naval and Nuclear Technologies LLP; Director Emeritus of the Armed Services YMCA; Director of the U.S. Naval Submarine League; Member of the National Security Advisory Council of the Center for U.S. Global Engagement and a member of the CNA Military Advisory Board; Chairman of the charity J Street Cup Golf; Trustee of Fairhaven United Methodist Church; and Director of other various non-profit organizations. | |
Kathleen A. Dennis (63)
c/o Perkins Coie LLP
Counsel to the Independent Directors
30 Rockefeller Plaza
New York, NY 10112 | | Director | | Since
August
2006 | | President, Cedarwood Associates (mutual fund and investment management consulting) (since July 2006); Chairperson of the Liquidity and Alternatives Sub-Committee of the Investment Committee (since October 2006) and Director or Trustee of various Morgan Stanley Funds (since August 2006); formerly, Senior Managing Director of Victory Capital Management (1993-2006). | | | 91 | | | Director of various non-profit organizations. | |
Nancy C. Everett (61)
c/o Perkins Coie LLP
Counsel to the Independent Directors
30 Rockefeller Plaza
New York, NY 10112 | | Director | | Since
January
2015 | | Chief Executive Officer, Virginia Commonwealth University Investment Company (since November 2015); Owner, OBIR, LLC (institutional investment management consulting) (since June 2014); formerly, Managing Director, BlackRock Inc. (February 2011-December 2013); and Chief Executive Officer, General Motors Asset Management (a/k/a Promark Global Advisors, Inc.) (June 2005-May 2010). | | | 91 | | | Member of Virginia Commonwealth University School of Business Foundation; formerly, Member of Virginia Commonwealth University Board of Visitors (2013-2015); Member of Committee on Directors for Emerging Markets Growth Fund, Inc. (2007-2010); Chairperson of Performance Equity Management, LLC (2006-2010); and Chairperson, GMAM Absolute Return Strategies Fund, LLC (2006-2010). | |
30
Morgan Stanley Institutional Fund, Inc.
Annual Report — December 31, 2016
Director and Officer Information (unaudited) (cont'd)
Independent Directors: (cont'd)
Name, Age and Address of
Independent Director | | Position(s)
Held with
Registrant | | Length of Time
Served* | | Principal Occupation(s) During Past 5 Years
and Other Relevant Professional Experience | | Number of
Overseen by
Independent
Director** | | Portfolios in
Fund Complex
Other Directorships
Held by Independent
Director*** | |
Jakki L. Haussler (59)
c/o Perkins Coie LLP
Counsel to the Independent Directors
30 Rockefeller Plaza
New York, NY 10112 | | Director | | Since
January
2015 | | Chairman and Chief Executive Officer, Opus Capital Group (since January 1996); formerly, Director, Capvest Venture Fund, LP (May 2000-December 2011); Partner, Adena Ventures, LP (July 1999-December 2010); Director, The Victory Funds (February 2005-July 2008). | | | 91 | | | Director of Cincinnati Bell Inc. and Member, Audit Committee and Compensation Committee; Director of Northern Kentucky University Foundation and Member, Investment Committee; Member of Chase College of Law Transactional Law Practice Center Board of Advisors; Director of Best Transport; Director of Chase College of Law Board of Visitors; formerly, Member, University of Cincinnati Foundation Investment Committee; Member, Miami University Board of Visitors (2008-2011); Trustee of Victory Funds (2005-2008) and Chairman, Investment Committee (2007-2008) and Member, Service Provider Committee (2005-2008). | |
Dr. Manuel H. Johnson (67)
c/o Johnson Smick
International, Inc.
220 I Street, N.E. — Suite 200
Washington, D.C. 20002 | | Director | | Since
July
1991 | | Senior Partner, Johnson Smick International, Inc. (consulting firm); Chairperson of the Investment Committee (since October 2006) and Director or Trustee of various Morgan Stanley Funds (since July 1991); Co-Chairman and a founder of the Group of Seven Council (G7C) (international economic commission); formerly, Chairperson of the Audit Committee (July 1991-September 2006), Vice Chairman of the Board of Governors of the Federal Reserve System and Assistant Secretary of the U.S. Treasury. | | | 91 | | | Director of NVR, Inc. (home construction). | |
Joseph J. Kearns (74)
c/o Kearns & Associates LLC
46 E Peninsula Center #385
Rolling Hills Estates, CA 90274-3712 | | Director | | Since
August
1994 | | President, Kearns & Associates LLC (investment consulting); Chairperson of the Audit Committee (since October 2006) and Director or Trustee of various Morgan Stanley Funds (since August 1994); formerly, Deputy Chairperson of the Audit Committee (July 2003-September 2006) and Chairperson of the Audit Committee of various Morgan Stanley Funds (since August 1994); CFO of the J. Paul Getty Trust. | | | 93 | | | Director of Electro Rent Corporation (equipment leasing). Prior to December 31, 2013, Director of The Ford Family Foundation. | |
31
Morgan Stanley Institutional Fund, Inc.
Annual Report — December 31, 2016
Director and Officer Information (unaudited) (cont'd)
Independent Directors: (cont'd)
Name, Age and Address of
Independent Director | | Position(s)
Held with
Registrant | | Length of Time
Served* | | Principal Occupation(s) During Past 5 Years
and Other Relevant Professional Experience | | Number of
Portfolios in
Fund Complex
Overseen by
Independent
Director** | | Other Directorships
Held by Independent
Director*** | |
Michael F. Klein (58)
c/o Perkins Coie LLP
Counsel to the Independent Directors
30 Rockefeller Plaza
New York, NY 10112 | | Director | | Since
August
2006 | | Managing Director, Aetos Capital, LLC (since March 2000); Co-President, Aetos Alternatives Management, LLC (since January 2004) and Co-Chief Executive Officer of Aetos Capital LLC (since August 2013); Chairperson of the Fixed Income Sub-Committee of the Investment Committee (since October 2006) and Director or Trustee of various Morgan Stanley Funds (since August 2006); formerly, Managing Director, Morgan Stanley & Co. Inc. and Morgan Stanley Dean Witter Investment Management, President, various Morgan Stanley Funds (June 1998-March 2000) and Principal, Morgan Stanley & Co. Inc. and Morgan Stanley Dean Witter Investment Management (August 1997-December 1999). | | | 90 | | | Director of certain investment funds managed or sponsored by Aetos Capital, LLC; Director of Sanitized AG and Sanitized Marketing AG (specialty chemicals). | |
Patricia Maleski (56)
c/o Perkins Coie LLP
Counsel to the Independent Directors
30 Rockefeller Plaza
New York, NY 10112 | | Director | | Since
January
2017 | | Management Director, JPMorgan Asset Management (2013-2016); President, JPMorgan Funds (2010-2013), Chief Administrative Officer, JPMorgan Funds (2004-2010), Treasurer, JPMorgan Funds (2003-2004, 2008-2010), and Vice President and Board Liaison, JPMorgan Funds (2001-2004); Managing Director, J.P. Morgan Investment Management Inc. (2001-2013); Vice President of Finance, Pierpont Group (1996-2001); Vice President, Bank of New York (1995-1996); Senior Audit Manager, Price Waterhouse, LLP (1982-1995). | | | 91 | | | None. | |
Michael E. Nugent (80)
522 Fifth Avenue
New York, NY 10036 | | Chair of the Board and Director | | Chair of the Boards since July 2006 and Director since July 1991 | | Chair of the Boards of various Morgan Stanley Funds (since July 2006); Chairperson of the Closed-End Fund Committee (since June 2012) and Director or Trustee of various Morgan Stanley Funds (since July 1991); formerly, Chairperson of the Insurance Committee (until July 2006); General Partner, Triumph Capital, L.P. (private investment partnership) (1988-2013). | | | 92 | | | None. | |
W. Allen Reed (69)
c/o Perkins Coie LLP
Counsel to the Independent Directors
30 Rockefeller Plaza
New York, NY 10112 | | Director | | Since
August
2006 | | Chairperson of the Equity Sub-Committee of the Investment Committee (since October 2006) and Director or Trustee of various Morgan Stanley Funds (since August 2006); formerly, President and CEO of General Motors Asset Management; Chairman and Chief Executive Officer of the GM Trust Bank and Corporate Vice President of General Motors Corporation (August 1994-December 2005). | | | 91 | | | Director of Legg Mason, Inc.; formerly, Director of the Auburn University Foundation (2010-2015). | |
Fergus Reid (84)
c/o Joe Pietryka, Inc.
85 Charles Colman Blvd.
Pawling, NY 12564 | | Director | | Since
June
1992 | | Chairman, Joe Pietryka, Inc.; Chairperson of the Governance Committee and Director or Trustee of various Morgan Stanley Funds (since June 1992). | | | 92 | | | Formerly, Trustee and Director of certain investment companies in the JP Morgan Fund Complex managed by JP Morgan Investment Management Inc. (1987-2012). | |
* This is the earliest date the Director began serving the Morgan Stanley Funds. Each Director serves an indefinite term, until his or her successor is elected.
** The Fund Complex includes (as of December 31, 2016) all open-end and closed-end funds (including all of their portfolios) advised by Morgan Stanley Investment Management Inc. (the "Adviser") and any funds that have an adviser that is an affiliated person of the Adviser (including, but not limited to, Morgan Stanley AIP GP LP).
*** This includes any directorships at public companies and registered investment companies held by the Director at any time during the past five years.
32
Morgan Stanley Institutional Fund, Inc.
Annual Report — December 31, 2016
Director and Officer Information (unaudited) (cont'd)
Executive Officers:
Name, Age and Address of Executive Officer | | Position(s) Held
with
Registrant | | Length of Time
Served* | | Principal Occupation(s) During Past 5 Years | |
John H. Gernon (53)
522 Fifth Avenue
New York, NY 10036 | | President and Principal Executive Officer | | Since
September
2013 | | President and Principal Executive Officer of the Equity and Fixed Income Funds and the Morgan Stanley AIP Funds (since September 2013) and the Liquidity Funds and various money market funds (since May 2014) in the Fund Complex; Managing Director of the Adviser; Head of Product (since 2006). | |
Timothy J. Knierim (58)
522 Fifth Avenue
New York, NY 10036 | | Chief Compliance Officer | | Since
December
2016 | | Managing Director of the Adviser and various entities affiliated with the Adviser; Chief Compliance Officer of various Morgan Stanley Funds and the Adviser (since December 2016) and Chief Compliance Officer of Morgan Stanley AIP GP LP (since 2014). Formerly, Managing Director and Deputy Chief Compliance Officer of the Adviser (2014-2016); and formerly, Chief Compliance Officer of Prudential Investment Management, Inc. (2007-2014). | |
Francis J. Smith (51)
522 Fifth Avenue
New York, NY 10036 | | Treasurer and Principal Financial Officer | | Treasurer since July 2003 and Principal Financial Officer since September 2002 | | Managing Director of the Adviser and various entities affiliated with the Adviser; Treasurer (since July 2003) and Principal Financial Officer of various Morgan Stanley Funds (since September 2002). | |
Mary E. Mullin (49)
522 Fifth Avenue
New York, NY 10036 | | Secretary | | Since
June
1999 | | Executive Director of the Adviser; Secretary of various Morgan Stanley Funds (since June 1999). | |
* This is the earliest date the officer began serving the Morgan Stanley Funds. Each officer serves a one-year term, until his or her successor is elected and qualifies.
33
Morgan Stanley Institutional Fund, Inc.
Annual Report — December 31, 2016
Adviser and Administrator
Morgan Stanley Investment Management Inc.
522 Fifth Avenue
New York, New York 10036
Distributor
Morgan Stanley Distribution, Inc.
522 Fifth Avenue
New York, New York 10036
Dividend Disbursing and Transfer Agent
Boston Financial Data Services, Inc.
2000 Crown Colony Drive
Quincy, Massachusetts 02169
Custodian
State Street Bank and Trust Company
One Lincoln Street
Boston, Massachusetts 02111
Legal Counsel
Dechert LLP
1095 Avenue of the Americas
New York, New York 10036
Counsel to the Independent Directors
Perkins Coie LLP
30 Rockefeller Plaza
New York, New York 10112
Independent Registered Public Accounting Firm
Ernst & Young LLP
200 Clarendon Street
Boston, Massachusetts 02116
Reporting to Shareholders
Each Morgan Stanley fund provides a complete schedule of portfolio holdings in its semi-annual and annual reports within 60 days of the end of the fund's second and fourth fiscal quarters. The semi-annual and annual reports are filed electronically with the Securities and Exchange Commission (SEC) on Form N-CSRS and Form N-CSR, respectively. Morgan Stanley also delivers the semi-annual and annual reports to fund shareholders and makes these reports available on its public website, www.morganstanley.com/im. Each Morgan Stanley fund also files a complete schedule of portfolio holdings with the SEC for the fund's first and third fiscal quarters on Form N-Q. Morgan Stanley does not deliver the reports for the first and third fiscal quarters to shareholders, nor are the reports posted to the Morgan Stanley public website. You may, however, obtain the Form N-Q filings (as well as the Form N-CSR and N-CSRS filings) by accessing the SEC's website, www.sec.gov. You may also review and copy them at the SEC's Public Reference Room in Washington, DC. Information on the operation of the SEC's Public Reference Room may be obtained by calling the SEC toll free at 1 (800) SEC-0330. You can also request copies of these materials, upon payment of a duplicating fee, by electronic request at the SEC's email address (publicinfo@sec.gov) or by writing the Public Reference Room of the SEC, 100 F Street, NE, Washington, DC 20549-0102.
Proxy Voting Policies and Procedures and Proxy Voting Record
You may obtain a copy of the Fund's Proxy Voting Policy and Procedures and information regarding how the Fund voted proxies relating to portfolio securities during the most recent twelve-month period ended June 30, without charge, upon request, by calling toll free 1 (800) 548-7786 or by visiting our website at www.morganstanley.com/im. This information is also available on the SEC's website at www.sec.gov.
This report is authorized for distribution only when preceded or accompanied by a prospectus or summary prospectus of the applicable Portfolio of Morgan Stanley Institutional Fund, Inc., which describes in detail the Portfolio's investment policies, risks, fees and expenses. Please read the prospectus carefully before you invest or send money. For additional information, including information regarding the investments comprising the Portfolio, please visit our website at www.morganstanley.com/im or call toll free 1 (800) 548-7786.
34
(This Page has been left blank intentionally.)
(This Page has been left blank intentionally.)
(This Page has been left blank intentionally.)
Printed in U.S.A.
This Report has been prepared for shareholders and may be distributed to others only if preceded or accompanied by a current prospectus.
Morgan Stanley Investment Management Inc.
522 Fifth Avenue
New York, New York 10036
© 2017 Morgan Stanley. Morgan Stanley Distribution, Inc.

IFIASOPPANN
1698589 EXP. 02.28.18

Morgan Stanley Institutional Fund, Inc.
Emerging Markets Breakout Nations Portfolio
Annual Report
December 31, 2016

Morgan Stanley Institutional Fund, Inc.
Annual Report — December 31, 2016
Shareholders' Letter | | | 2 | | |
Expense Example | | | 3 | | |
Investment Overview | | | 4 | | |
Portfolio of Investments | | | 5 | | |
Statement of Assets and Liabilities | | | 7 | | |
Statement of Operations | | | 9 | | |
Statement of Changes in Net Assets | | | 10 | | |
Financial Highlights | | | 11 | | |
Notes to Financial Statements | | | 15 | | |
Report of Independent Registered Public Accounting Firm | | | 23 | | |
Privacy Notice | | | 24 | | |
Director and Officer Information | | | 27 | | |
This report is authorized for distribution only when preceded or accompanied by a prospectus or summary prospectus of the applicable Portfolio of Morgan Stanley Institutional Fund, Inc. To receive a prospectus and/or statement of additional information (SAI), which contains more complete information such as investment objectives, charges, expenses, policies for voting proxies, risk considerations, and describes in detail each of the Portfolio's investment policies to the prospective investor, please call toll free 1 (800) 548-7786. Please read the prospectuses carefully before you invest or send money.
Additionally, you can access information about the Portfolio, including performance, characteristics, and investment team commentary, through Morgan Stanley Investment Management's website: www.morganstanley.com/im.
Market forecasts provided in this report may not necessarily come to pass. There is no guarantee that any sectors mentioned will continue to perform as discussed herein or that securities in such sectors will be held by the Portfolio in the future. There is no assurance that a Portfolio will achieve its investment objective. Portfolios are subject to market risk, which is the possibility that market values of securities owned by the Portfolio will decline and, therefore, the value of the Portfolio's shares may be less than what you paid for them. Accordingly, you can lose money investing in this Portfolio. Please see the prospectus for more complete information on investment risks.
1
Morgan Stanley Institutional Fund, Inc.
Annual Report — December 31, 2016
Shareholders' Letter (unaudited)
Dear Shareholders,
We are pleased to provide this Annual report, in which you will learn how your investment in Emerging Markets Breakout Nations Portfolio (the "Portfolio") performed during the period beginning December 15, 2016 (when the Portfolio launched) and ended December 31, 2016.
Morgan Stanley Investment Management is a client-centric, investor-led organization. Our global presence, intellectual capital, and breadth of products and services enable us to partner with investors to meet the evolving challenges of today's financial markets. We aim to deliver superior investment service and to empower our clients to make the informed decisions that help them reach their investment goals.
As always, we thank you for selecting Morgan Stanley Investment Management, and look forward to working with you in the months and years ahead.
Sincerely,

John H. Gernon
President and Principal Executive Officer
January 2017
2
Morgan Stanley Institutional Fund, Inc.
Annual Report — December 31, 2016
Expense Example (unaudited)
Emerging Markets Breakout Nations Portfolio
As a shareholder of the Portfolio, you incur two types of costs: (1) transactional costs, including redemption fees; and (2) ongoing costs, which may include advisory fees, administration fees, distribution and shareholder services fees and other Portfolio expenses. This example is intended to help you understand your ongoing costs (in dollars) of investing in the Portfolio and to compare these costs with the ongoing costs of investing in other mutual funds.
This example is based on an investment of $1,000 invested at the beginning of the period and held for the entire period 12/15/16 - 12/31/16.
Actual Expenses
The table below provides information about actual account values and actual expenses. You may use the information in this table, together with the amount you invested, to estimate the expenses that you paid over the period. Simply divide your account value by $1,000 (for example, an $8,600 account value divided by $1,000 = 8.6), then multiply the result by the number in the table under the heading entitled "Actual Expenses Paid During Period" to estimate the expenses you paid on your account during this period.
Hypothetical Example for Comparison Purposes
The table below provides information about hypothetical account values and hypothetical expenses based on the Portfolio's actual expense ratio and an assumed rate of return of 5% per year before expenses, which is not the Portfolio's actual return. The hypothetical account values and expenses may not be used to estimate the actual ending account balance or expenses you paid for the period. You may use this information to compare the ongoing costs of investing in the Portfolio and other funds. To do so, compare this 5% hypothetical example with the 5% hypothetical examples that appear in the shareholder reports of the other funds.
Please note that the expenses shown in the table are meant to highlight your ongoing costs only and do not reflect any transactional costs, such as sales charges (loads) and redemption fees. Therefore, the information for each class in the table is useful in comparing ongoing costs only, and will not help you determine the relative total costs of owning different funds. In addition, if these transactional costs were included, your costs would have been higher.
| | | Beginning
Account
Value
12/15/16 | | Actual Ending
Account
Value
12/31/16 | | Hypothetical
Ending Account
Value | | Actual
Expenses
Paid
During
Period* | | Hypothetical
Expenses Paid
During Period* | | Net
Expense
Ratio
During
Period** | |
Emerging Markets Breakout Nations Portfolio Class I^ | | $ | 1,000.00 | | | $ | 1,015.00 | | | $ | 1,001.71 | | | $ | 0.48 | | | $ | 0.48 | | | | 1.09 | % | |
Emerging Markets Breakout Nations Portfolio Class A^ | | | 1,000.00 | | | | 1,014.00 | | | | 1,001.53 | | | | 0.66 | | | | 0.66 | | | | 1.51 | | |
Emerging Markets Breakout Nations Portfolio Class C^ | | | 1,000.00 | | | | 1,014.00 | | | | 1,001.20 | | | | 0.99 | | | | 0.99 | | | | 2.26 | | |
Emerging Markets Breakout Nations Portfolio Class IS^ | | | 1,000.00 | | | | 1,015.00 | | | | 1,001.73 | | | | 0.46 | | | | 0.46 | | | | 1.05 | | |
* Expenses are calculated using each Portfolio Class' annualized net expense ratio (as disclosed), multiplied by the average account value over the period, and multiplied by 16/366 (to reflect the actual days in the period).
** Annualized.
^ The Portfolio commenced operations on December 15, 2016.
3
Morgan Stanley Institutional Fund, Inc.
Annual Report — December 31, 2016
Investment Overview (unaudited)
Emerging Markets Breakout Nations Portfolio
The Portfolio seeks long-term capital appreciation.
Performance
For the period from inception on December 15, 2016 through December 31, 2016, the Portfolio's Class I shares had a total return of 1.50%, net of fees. The Portfolio's benchmark, the MSCI Emerging Markets Net Index (the "Index"), returned 0.68% for the same period.
Factors Affecting Performance
• The Portfolio launched a few days prior to the close of the reporting period. Such a short time frame would not provide a meaningful performance analysis as short-term returns may not be indicative of the Portfolio's long-term performance potential.
Management Strategies
• In emerging markets, we believe country and currency factors overwhelmingly drive stock market returns. The Portfolio takes a top-down, benchmark-agnostic approach to investing and seeks positions in countries where we believe future growth is sustainably high or accelerating. We implement these country views using bottom-up stock selection based on local country themes.
Performance Compared to the MSCI Emerging Markets Net Index(1) and the Lipper Emerging Markets Funds Index(2)
| | | Period Ended December 31, 2016
Total Returns(3) | |
| | | One
Year | | Five
Years | | Ten
Years | | Since
Inception(5) | |
Portfolio — Class I Shares
w/o sales charges(4) | | | — | | | | — | | | | — | | | | 1.50 | % | |
Portfolio — Class A Shares
w/o sales charges(4) | | | — | | | | — | | | | — | | | | 1.40 | | |
Portfolio — Class A Shares
with maximum 5.25%
sales charges(4) | | | — | | | | — | | | | — | | | | –3.89 | | |
Portfolio — Class C Shares
w/o sales charges(4) | | | — | | | | — | | | | — | | | | 1.40 | | |
Portfolio — Class C Shares
with maximum 1.00%
deferred sales charges(4) | | | — | | | | — | | | | — | | | | 0.40 | | |
Portfolio — Class IS Shares
w/o sales charges(4) | | | — | | | | — | | | | — | | | | 1.50 | | |
MSCI Emerging Markets Net Index | | | — | | | | — | | | | — | | | | 0.68 | | |
Lipper Emerging Markets Funds Index | | | — | | | | — | | | | — | | | | 0.33 | | |
Performance data quoted represents past performance, which is no guarantee of future results, and current performance may be lower or higher than the figures shown. Performance assumes that all dividends and distributions, if any, were reinvested. For the most recent month-end performance figures, please visit www.morganstanley.com/im. Investment return and principal value will fluctuate so that Portfolio shares, when redeemed, may be worth more or less than their original cost. Total returns do not reflect the deduction of taxes that a shareholder would pay on Portfolio distributions or the redemption of Portfolio shares. Returns for periods less than one year are not annualized. Performance of share classes will vary due to difference in expenses.
(1) The MSCI Emerging Markets Net Index is a free float-adjusted market capitalization weighted index that is designed to measure equity market performance of emerging markets. The term "free float" represents the portion of shares outstanding that are deemed to be available for purchase in the public equity markets by investors. The MSCI Emerging Markets Net Index currently consists of 23 emerging market country indices. The performance of the Index is listed in U.S. dollars and assumes reinvestment of net dividends. The Index is unmanaged and its returns do not include any sales charges or fees. Such costs would lower performance. It is not possible to invest directly in an index.
(2) The Lipper Emerging Markets Funds Index is an equally weighted performance index of the largest qualifying funds (based on net assets) in the Lipper Emerging Markets Funds classification. The Index, which is adjusted for capital gains distributions and income dividends, is unmanaged and should not be considered an investment. There are currently 30 funds represented in this Index. As of the date of this report, the Portfolio is in the Lipper Emerging Markets Funds classification.
(3) Total returns for the Portfolio reflect fees waived and expenses reimbursed, if applicable, by the Adviser. Without such waivers and reimbursements, total returns would have been lower.
(4) Commenced operations on December 15, 2016.
(5) For comparative purposes, average annual since inception returns listed for the Indexes refer to the inception date of the Portfolio, not the inception of the Index.
4
Morgan Stanley Institutional Fund, Inc.
Annual Report — December 31, 2016
Portfolio of Investments
Emerging Markets Breakout Nations Portfolio
| | | Shares | | Value
(000) | |
Common Stocks (72.7%) | |
Argentina (3.5%) | |
Banco Macro SA ADR | | | 826 | | | $ | 53 | | |
BBVA Banco Frances SA ADR | | | 2,377 | | | | 42 | | |
Grupo Financiero Galicia SA ADR | | | 1,100 | | | | 30 | | |
Pampa Energia SA ADR (a) | | | 667 | | | | 23 | | |
YPF SA ADR | | | 1,823 | | | | 30 | | |
| | | | 178 | | |
Brazil (4.7%) | |
Adecoagro SA (a) | | | 2,282 | | | | 23 | | |
Banco Bradesco SA (Preference) | | | 4,254 | | | | 38 | | |
| BRF SA | | | 2,075 | | | | 31 | | |
Itau Unibanco Holding SA (Preference) | | | 4,029 | | | | 42 | | |
Lojas Renner SA | | | 2,556 | | | | 18 | | |
MercadoLibre, Inc. | | | 172 | | | | 27 | | |
Petroleo Brasileiro SA (a) | | | 3,288 | | | | 17 | | |
Petroleo Brasileiro SA (Preference) (a) | | | 4,203 | | | | 19 | | |
Raia Drogasil SA | | | 1,314 | | | | 25 | | |
| | | | 240 | | |
Colombia (3.5%) | |
Cemex Latam Holdings SA (a) | | | 15,198 | | | | 57 | | |
Grupo de Inversiones Suramericana SA | | | 9,562 | | | | 122 | | |
| | | | 179 | | |
Czech Republic (3.2%) | |
CEZ AS | | | 9,580 | | | | 161 | | |
Egypt (3.0%) | |
Commercial International Bank Egypt SAE GDR | | | 25,935 | | | | 95 | | |
Egyptian Financial Group-Hermes Holding Co.
GDR (a) | | | 25,063 | | | | 56 | | |
| | | | 151 | | |
Indonesia (9.2%) | |
Astra International Tbk PT | | | 91,500 | | | | 56 | | |
Bank Mandiri Persero Tbk PT | | | 97,100 | | | | 83 | | |
Bank Negara Indonesia Persero Tbk PT | | | 114,200 | | | | 47 | | |
Bumi Serpong Damai Tbk PT | | | 336,400 | | | | 44 | | |
Link Net Tbk PT | | | 101,000 | | | | 39 | | |
Matahari Department Store Tbk PT | | | 21,600 | | | | 24 | | |
Semen Indonesia Persero Tbk PT | | | 84,400 | | | | 58 | | |
Telekomunikasi Indonesia Persero Tbk PT | | | 269,800 | | | | 80 | | |
XL Axiata Tbk PT (a) | | | 212,500 | | | | 36 | | |
| | | | 467 | | |
Kenya (5.0%) | |
East African Breweries Ltd. | | | 35,000 | | | | 85 | | |
Safaricom Ltd. | | | 910,700 | | | | 170 | | |
| | | | 255 | | |
Mexico (6.5%) | |
Alfa SAB de CV | | | 17,294 | | | | 21 | | |
Alsea SAB de CV | | | 7,527 | | | | 22 | | |
Cemex SAB de CV ADR (a) | | | 9,257 | | | | 74 | | |
Fomento Economico Mexicano SAB de CV ADR | | | 1,112 | | | | 85 | | |
Grupo Financiero Banorte SAB de CV Series O | | | 15,220 | | | | 75 | | |
| | | Shares | | Value
(000) | |
Grupo Financiero Santander Mexico
SAB de CV ADR | | | 3,117 | | | $ | 23 | | |
Mexichem SAB de CV | | | 13,352 | | | | 30 | | |
| | | | 330 | | |
Pakistan (7.1%) | |
Habib Bank Ltd. | | | 32,300 | | | | 84 | | |
Honda Atlas Cars Pakistan Ltd. | | | 1,900 | | | | 12 | | |
K-Electric Ltd. (a) | | | 411,000 | | | | 37 | | |
Lucky Cement Ltd. | | | 11,200 | | | | 93 | | |
Maple Leaf Cement Factory Ltd. | | | 47,751 | | | | 58 | | |
Oil & Gas Development Co., Ltd. | | | 30,600 | | | | 49 | | |
Pak Elektron Ltd. | | | 43,100 | | | | 29 | | |
| | | | 362 | | |
Peru (1.4%) | |
Cia de Minas Buenaventura SA ADR | | | 6,449 | | | | 73 | | |
Philippines (11.0%) | |
Ayala Corp. | | | 4,830 | | | | 71 | | |
BDO Unibank, Inc. | | | 26,640 | | | | 60 | | |
DMCI Holdings, Inc. | | | 249,300 | | | | 66 | | |
International Container Terminal Services, Inc. | | | 37,100 | | | | 54 | | |
Metro Pacific Investments Corp. | | | 595,500 | | | | 80 | | |
Metropolitan Bank & Trust Co. | | | 72,660 | | | | 106 | | |
SM Investments Corp. | | | 8,970 | | | | 118 | | |
| | | | 555 | | |
Poland (6.4%) | |
Bank Pekao SA | | | 1,175 | | | | 35 | | |
Bank Zachodni WBK SA | | | 737 | | | | 56 | | |
CCC SA | | | 1,150 | | | | 56 | | |
Eurocash SA | | | 2,960 | | | | 28 | | |
Jeronimo Martins SGPS SA | | | 3,647 | | | | 57 | | |
LPP SA | | | 24 | | | | 32 | | |
Powszechna Kasa Oszczednosci Bank Polski SA (a) | | | 8,834 | | | | 59 | | |
| | | | 323 | | |
Romania (4.3%) | |
Banca Transilvania SA | | | 231,661 | | | | 128 | | |
BRD-Groupe Societe Generale SA | | | 32,673 | | | | 90 | | |
| | | | 218 | | |
South Africa (0.7%) | |
New Europe Property Investments PLC | | | 2,869 | | | | 33 | | |
Thailand (3.2%) | |
Bangkok Dusit Medical Services PCL (Foreign) | | | 70,100 | | | | 45 | | |
Central Pattana PCL (Foreign) | | | 15,700 | | | | 25 | | |
Kasikornbank PCL NVDR | | | 8,700 | | | | 43 | | |
Minor International PCL (Foreign) | | | 22,900 | | | | 23 | | |
Sino-Thai Engineering & Construction PCL (Foreign) | | | 35,300 | | | | 27 | | |
| | | | 163 | | |
Total Common Stocks (Cost $3,617) | | | 3,688 | | |
Participation Notes (3.4%) | |
Vietnam (3.4%) | |
Bank for Foreign Trade of Vietnam JSC,
Equity Linked Notes, expires 12/17/18 (a) | | | 47,980 | | | | 75 | | |
The accompanying notes are an integral part of the financial statements.
5
Morgan Stanley Institutional Fund, Inc.
Annual Report — December 31, 2016
Portfolio of Investments (cont'd)
Emerging Markets Breakout Nations Portfolio
| | | Shares | | Value
(000) | |
Participation Notes (cont'd) | |
Masan Group Corp., Equity Linked
Notes, expires 12/10/18 (a) | | | 10,830 | | | $ | 31 | | |
Vietnam Dairy Products JSC, Equity
Linked Notes, expires 5/20/17 (a) | | | 12,210 | | | | 67 | | |
| Total Participation Notes (Cost $173) | | | 173 | | |
Investment Companies (8.4%) | |
United States (8.4%) | |
iShares MSCI All Peru Capped ETF | | | 6,918 | | | | 227 | | |
iShares MSCI Frontier 100 ETF | | | 8,019 | | | | 199 | | |
Total Investment Companies (Cost $421) | | | 426 | | |
Short-Term Investment (14.8%) | |
Investment Company (14.8%) | |
Morgan Stanley Institutional Liquidity
Funds — Government Portfolio —
Institutional Class (See Note G)
(Cost $749) | | | 749,060 | | | | 749 | | |
Total Investments (99.3%)
(Cost $4,960) (b) | | | 5,036 | | |
Other Assets in Excess of Liabilities (0.7%) | | | 37 | | |
Net Assets (100.0%) | | $ | 5,073 | | |
Country assignments and aggregations are based generally on third party vendor classifications and information, and may be different from the assignments and aggregations under the policies set forth in the Portfolio's prospectus and/or statement of additional information relating to geographic classifications.
(a) Non-income producing security.
(b) At December 31, 2016, the aggregate cost for federal income tax purposes is approximately $4,960,000. The aggregate gross unrealized appreciation is approximately $94,000 and the aggregate gross unrealized depreciation is approximately $18,000, resulting in net unrealized appreciation of approximately $76,000.
ADR American Depositary Receipt.
ETF Exchange Traded Fund.
GDR Global Depositary Receipt.
NVDR Non-Voting Depositary Receipt.
Futures Contract:
The Portfolio had the following futures contract open at December 31, 2016:
| | | Number
of
Contracts | | Value
(000) | | Expiration
Date | | Unrealized
Appreciation
(000) | |
Long: | |
SGX NIFTY 50 (United States) | | | 31 | | | $ | 507 | | | Jan-17 | | $ | 8 | | |
Portfolio Composition
Classification | | Percentage of
Total Investments | |
Other* | | | 35.3 | % | |
Banks | | | 25.1 | | |
Short-Term Investment | | | 14.9 | | |
Wireless Telecommunication Services | | | 12.5 | | |
Construction Materials | | | 6.8 | | |
Diversified Financial Services | | | 5.4 | | |
Total Investments | | | 100.0 | %** | |
* Industries and/or investment types representing less than 5% of total investments.
** Does not include open long futures contract with an underlying face amount of approximately $507,000 with unrealized appreciation of approximately $8,000.
The accompanying notes are an integral part of the financial statements.
6
Morgan Stanley Institutional Fund, Inc.
Annual Report — December 31, 2016
Emerging Markets Breakout Nations Portfolio
Statement of Assets and Liabilities | | December 31, 2016
(000) | |
Assets: | |
Investments in Securities of Unaffiliated Issuers, at Value (Cost $4,211) | | $ | 4,287 | | |
Investment in Security of Affiliated Issuer, at Value (Cost $749) | | | 749 | | |
Total Investments in Securities, at Value (Cost $4,960) | | | 5,036 | | |
Prepaid Offering Costs | | | 143 | | |
Due from Adviser | | | 46 | | |
Receivable for Variation Margin on Futures Contracts | | | 35 | | |
Dividends Receivable | | | 3 | | |
Receivable from Affiliate | | | — | @ | |
Other Assets | | | 1 | | |
Total Assets | | | 5,264 | | |
Liabilities: | |
Payable for Offering Costs | | | 149 | | |
Payable for Professional Fees | | | 37 | | |
Payable for Custodian Fees | | | 1 | | |
Payable for Transfer Agency Fees — Class I | | | — | @ | |
Payable for Transfer Agency Fees — Class A | | | — | @ | |
Payable for Transfer Agency Fees — Class C | | | — | @ | |
Payable for Transfer Agency Fees — Class IS | | | — | @ | |
Payable for Shareholder Services Fees — Class A | | | — | @ | |
Payable for Distribution and Shareholder Services Fees — Class C | | | — | @ | |
Payable for Administration Fees | | | — | @ | |
Other Liabilities | | | 4 | | |
Total Liabilities | | | 191 | | |
Net Assets | | $ | 5,073 | | |
Net Assets Consist Of: | |
Paid-in-Capital | | $ | 5,000 | | |
Accumulated Undistributed Net Investment Income | | | 2 | | |
Accumulated Net Realized Loss | | | (13 | ) | |
Unrealized Appreciation (Depreciation) on: | |
Investments | | | 76 | | |
Futures Contracts | | | 8 | | |
Foreign Currency Translations | | | — | @ | |
Net Assets | | $ | 5,073 | | |
The accompanying notes are an integral part of the financial statements.
7
Morgan Stanley Institutional Fund, Inc.
Annual Report — December 31, 2016
Emerging Markets Breakout Nations Portfolio
Statement of Assets and Liabilities (cont'd) | | December 31, 2016
(000) | |
CLASS I: | |
Net Assets | | $ | 5,043 | | |
| Shares Outstanding $0.001 par value shares of beneficial interest (unlimited shares authorized) (not in 000's) | | | 497,000 | | |
Net Asset Value, Offering and Redemption Price Per Share | | $ | 10.15 | | |
CLASS A: | |
Net Assets | | $ | 10 | | |
| Shares Outstanding $0.001 par value shares of beneficial interest (unlimited shares authorized) (not in 000's) | | | 1,000 | | |
Net Asset Value, Redemption Price Per Share | | $ | 10.14 | | |
Maximum Sales Load | | | 5.25 | % | |
Maximum Sales Charge | | $ | 0.56 | | |
Maximum Offering Price Per Share | | $ | 10.70 | | |
CLASS C: | |
Net Assets | | $ | 10 | | |
| Shares Outstanding $0.001 par value shares of beneficial interest (unlimited shares authorized) (not in 000's) | | | 1,000 | | |
Net Asset Value, Offering and Redemption Price Per Share | | $ | 10.14 | | |
CLASS IS: | |
Net Assets | | $ | 10 | | |
| Shares Outstanding $0.001 par value shares of beneficial interest (unlimited shares authorized) (not in 000's) | | | 1,000 | | |
Net Asset Value, Offering and Redemption Price Per Share | | $ | 10.15 | | |
@ Amount is less than $500.
The accompanying notes are an integral part of the financial statements.
8
Morgan Stanley Institutional Fund, Inc.
Annual Report — December 31, 2016
Emerging Markets Breakout Nations Portfolio
Statement of Operations | | Period from
December 15, 2016^ to
December 31, 2016
(OOO) | |
Investment Income: | |
Dividends from Securities of Unaffiliated Issuers (Net of $—@ of Foreign Taxes Withheld) | | $ | 4 | | |
Dividends from Security of Affiliated Issuer (Note G) | | | — | @ | |
Total Investment Income | | | 4 | | |
Expenses: | |
Professional Fees | | | 37 | | |
Offering Costs | | | 7 | | |
Shareholder Reporting Fees | | | 3 | | |
Advisory Fees (Note B) | | | 2 | | |
Custodian Fees (Note F) | | | 1 | | |
Transfer Agency Fees — Class I (Note E) | | | — | @ | |
Transfer Agency Fees — Class A (Note E) | | | — | @ | |
Transfer Agency Fees — Class C (Note E) | | | — | @ | |
Transfer Agency Fees — Class IS (Note E) | | | — | @ | |
Shareholder Services Fees — Class A (Note D) | | | — | @ | |
Distribution and Shareholder Services Fees — Class C (Note D) | | | — | @ | |
Administration Fees (Note C) | | | — | @ | |
Pricing Fees | | | — | @ | |
Other Expenses | | | 1 | | |
Total Expenses | | | 51 | | |
Expenses Reimbursed by Adviser (Note B) | | | (46 | ) | |
Waiver of Advisory Fees (Note B) | | | (2 | ) | |
Reimbursement of Class Specific Expenses — Class A (Note B) | | | (— | @) | |
Reimbursement of Class Specific Expenses — Class C (Note B) | | | (— | @) | |
Reimbursement of Class Specific Expenses — Class IS (Note B) | | | (— | @) | |
Rebate from Morgan Stanley Affiliate (Note G) | | | (— | @) | |
Net Expenses | | | 3 | | |
Net Investment Income | | | 1 | | |
Realized Gain (Loss): | |
Investments Sold | | | (3 | ) | |
Investments in Affiliates | | | (1 | ) | |
Foreign Currency Transactions | | | — | @ | |
Futures Contracts | | | (8 | ) | |
Net Realized Loss | | | (12 | ) | |
Change in Unrealized Appreciation (Depreciation): | |
Investments | | | 76 | | |
Foreign Currency Translations | | | — | @ | |
Futures Contracts | | | 8 | | |
Net Change in Unrealized Appreciation (Depreciation) | | | 84 | | |
Net Realized Loss and Change in Unrealized Appreciation (Depreciation) | | | 72 | | |
Net Increase in Net Assets Resulting from Operations | | $ | 73 | | |
^ Commencement of Operations.
@ Amount is less than $500.
The accompanying notes are an integral part of the financial statements.
9
Morgan Stanley Institutional Fund, Inc.
Annual Report — December 31, 2016
Emerging Markets Breakout Nations Portfolio
Statement of Changes in Net Assets | | Period from
December 15, 2016^ to
December 31, 2016
(000) | |
Increase (Decrease) in Net Assets: | |
Operations: | |
Net Investment Income | | $ | 1 | | |
Net Realized Loss | | | (12 | ) | |
Net Change in Unrealized Appreciation (Depreciation) | | | 84 | | |
Net Increase in Net Assets Resulting from Operations | | | 73 | | |
Capital Share Transactions:(1) | |
Class I: | |
Subscribed | | | 4,970 | | |
Class A: | |
Subscribed | | | 10 | | |
Class C: | |
Subscribed | | | 10 | | |
Class IS: | |
Subscribed | | | 10 | | |
Net Increase in Net Assets Resulting from Capital Share Transactions | | | 5,000 | | |
Total Increase in Net Assets | | | 5,073 | | |
Net Assets: | |
Beginning of Period | | | — | | |
End of Period (Including Accumulated Undistributed Net Investment Income of $2) | | $ | 5,073 | | |
(1) Capital Share Transactions: | |
Class I: | |
Shares Subscribed | | | 497 | | |
Class A: | |
Shares Subscribed | | | 1 | | |
Class C: | |
Shares Subscribed | | | 1 | | |
Class IS: | |
Shares Subscribed | | | 1 | | |
^ Commencement of Operations.
The accompanying notes are an integral part of the financial statements.
10
Morgan Stanley Institutional Fund, Inc.
Annual Report — December 31, 2016
Financial Highlights
Emerging Markets Breakout Nations Portfolio
| | | Class I | |
Selected Per Share Data and Ratios | | Period from
December 15, 2016(1)
to December 31, 2016 | |
Net Asset Value, Beginning of Period | | $ | 10.00 | | |
Income from Investment Operations: | |
Net Investment Income (2) | | | 0.00 | (3) | |
Net Realized and Unrealized Gain | | | 0.15 | | |
Total from Investment Operations | | | 0.15 | | |
Net Asset Value, End of Period | | $ | 10.15 | | |
Total Return (4) | | | 1.50 | %(6) | |
Ratios and Supplemental Data: | |
Net Assets, End of Period (Thousands) | | $ | 5,043 | | |
Ratio of Expenses to Average Net Assets (8) | | | 1.09 | %(5)(7) | |
Ratio of Net Investment Income to Average Net Assets (8) | | | 0.67 | %(5)(7) | |
Ratio of Rebate from Morgan Stanley Affiliates to Average Net Assets | | | 0.04 | %(7) | |
Portfolio Turnover Rate | | | 16 | %(6) | |
(8) Supplemental Information on the Ratios to Average Net Assets: | |
Ratios Before Expense Limitation: | |
Expenses to Average Net Assets | | | 22.93 | %(7) | |
Net Investment Loss to Average Net Assets | | | (21.17 | )%(7) | |
(1) Commencement of Operations.
(2) Per share amount is based on average shares outstanding.
(3) Amount is less than $0.005 per share.
(4) Calculated based on the net asset value as of the last business day of the period.
(5) The Ratios of Expenses and Net Investment Income reflect the rebate of certain Portfolio expenses in connection with the investments in Morgan Stanley affiliates during the period. The effect of the rebate on the ratios is disclosed in the above table as "Ratio of Rebate from Morgan Stanley Affiliates to Average Net Assets."
(6) Not Annualized.
(7) Annualized.
The accompanying notes are an integral part of the financial statements.
11
Morgan Stanley Institutional Fund, Inc.
Annual Report — December 31, 2016
Financial Highlights
Emerging Markets Breakout Nations Portfolio
| | | Class A | |
Selected Per Share Data and Ratios | | Period from
December 15, 2016(1)
to December 31, 2016 | |
Net Asset Value, Beginning of Period | | $ | 10.00 | | |
Income from Investment Operations: | |
Net Investment Income (2) | | | 0.00 | (3) | |
Net Realized and Unrealized Gain | | | 0.14 | | |
Total from Investment Operations | | | 0.14 | | |
Net Asset Value, End of Period | | $ | 10.14 | | |
Total Return (4) | | | 1.40 | %(6) | |
Ratios and Supplemental Data: | |
Net Assets, End of Period (Thousands) | | $ | 10 | | |
Ratio of Expenses to Average Net Assets (8) | | | 1.51 | %(5)(7) | |
Ratio of Net Investment Income to Average Net Assets (8) | | | 0.24 | %(5)(7) | |
Ratio of Rebate from Morgan Stanley Affiliates to Average Net Assets | | | 0.04 | %(7) | |
Portfolio Turnover Rate | | | 16 | %(6) | |
(8) Supplemental Information on the Ratios to Average Net Assets: | |
Ratios Before Expense Limitation: | |
Expenses to Average Net Assets | | | 37.02 | %(7) | |
Net Investment Loss to Average Net Assets | | | (35.27 | )%(7) | |
(1) Commencement of Operations.
(2) Per share amount is based on average shares outstanding.
(3) Amount is less than $0.005 per share.
(4) Calculated based on the net asset value which does not reflect sales charges, if applicable, as of the last business day of the period.
(5) The Ratios of Expenses and Net Investment Income reflect the rebate of certain Portfolio expenses in connection with the investments in Morgan Stanley affiliates during the period. The effect of the rebate on the ratios is disclosed in the above table as "Ratio of Rebate from Morgan Stanley Affiliates to Average Net Assets."
(6) Not Annualized.
(7) Annualized.
The accompanying notes are an integral part of the financial statements.
12
Morgan Stanley Institutional Fund, Inc.
Annual Report — December 31, 2016
Financial Highlights
Emerging Markets Breakout Nations Portfolio
| | | Class C | |
Selected Per Share Data and Ratios | | Period from
December 15, 2016(1)
to December 31, 2016 | |
Net Asset Value, Beginning of Period | | $ | 10.00 | | |
Income (Loss) from Investment Operations: | |
Net Investment Loss (2) | | | (0.00 | )(3) | |
Net Realized and Unrealized Gain | | | 0.14 | | |
Total from Investment Operations | | | 0.14 | | |
Net Asset Value, End of Period | | $ | 10.14 | | |
Total Return (4) | | | 1.40 | %(6) | |
Ratios and Supplemental Data: | |
Net Assets, End of Period (Thousands) | | $ | 10 | | |
Ratio of Expenses to Average Net Assets (8) | | | 2.26 | %(5)(7) | |
Ratio of Net Investment Loss to Average Net Assets (8) | | | (0.50 | )%(5)(7) | |
Ratio of Rebate from Morgan Stanley Affiliates to Average Net Assets | | | 0.04 | %(7) | |
Portfolio Turnover Rate | | | 16 | %(6) | |
(8) Supplemental Information on the Ratios to Average Net Assets: | |
Ratios Before Expense Limitation: | |
Expense to Average Net Assets | | | 37.76 | %(7) | |
Net Investment Loss to Average Net Assets | | | (36.00 | )%(7) | |
(1) Commencement of Operations.
(2) Per share amount is based on average shares outstanding.
(3) Amount is less than $0.005 per share.
(4) Calculated based on the net asset value which does not reflect sales charges, if applicable, as of the last business day of the period.
(5) The Ratios of Expenses and Net Investment Loss reflect the rebate of certain Portfolio expenses in connection with the investments in Morgan Stanley affiliates during the period. The effect of the rebate on the ratios is disclosed in the above table as "Ratio of Rebate from Morgan Stanley Affiliates to Average Net Assets."
(6) Not Annualized.
(7) Annualized.
The accompanying notes are an integral part of the financial statements.
13
Morgan Stanley Institutional Fund, Inc.
Annual Report — December 31, 2016
Financial Highlights
Emerging Markets Breakout Nations Portfolio
| | | Class IS | |
Selected Per Share Data and Ratios | | Period from
December 15, 2016(1)
to December 31, 2016 | |
Net Asset Value, Beginning of Period | | $ | 10.00 | | |
Income from Investment Operations: | |
Net Investment Income (2) | | | 0.00 | (3) | |
Net Realized and Unrealized Gain | | | 0.15 | | |
Total from Investment Operations | | | 0.15 | | |
Net Asset Value, End of Period | | $ | 10.15 | | |
Total Return (4) | | | 1.50 | %(6) | |
Ratios and Supplemental Data: | |
Net Assets, End of Period (Thousands) | | $ | 10 | | |
Ratio of Expenses to Average Net Assets (8) | | | 1.06 | %(5)(7) | |
Ratio of Net Investment Income to Average Net Assets (8) | | | 0.70 | %(5)(7) | |
Ratio of Rebate from Morgan Stanley Affiliates to Average Net Assets | | | 0.04 | %(7) | |
Portfolio Turnover Rate | | | 16 | %(6) | |
(8) Supplemental Information on the Ratios to Average Net Assets: | |
Ratios Before Expense Limitation: | |
Expenses to Average Net Assets | | | 36.76 | %(7) | |
Net Investment Loss to Average Net Assets | | | (35.00 | )%(7) | |
(1) Commencement of Operations.
(2) Per share amount is based on average shares outstanding.
(3) Amount is less than $0.005 per share.
(4) Calculated based on the net asset value as of the last business day of the period.
(5) The Ratios of Expenses and Net Investment Income reflect the rebate of certain Portfolio expenses in connection with the investments in Morgan Stanley affiliates during the period. The effect of the rebate on the ratios is disclosed in the above table as "Ratio of Rebate from Morgan Stanley Affiliates to Average Net Assets."
(6) Not Annualized.
(7) Annualized.
The accompanying notes are an integral part of the financial statements.
14
Morgan Stanley Institutional Fund, Inc.
Annual Report — December 31, 2016
Notes to Financial Statements
Morgan Stanley Institutional Fund, Inc. (the "Fund") is registered under the Investment Company Act of 1940, as amended (the "Act"), as an open-end management investment company. The Fund is comprised of twenty-nine separate, active, diversified and non-diversified portfolios (individually referred to as a "Portfolio", collectively as the "Portfolios"). The Fund applies investment company accounting and reporting guidance.
The accompanying financial statements relate to the Emerging Markets Breakout Nations Portfolio. The Portfolio seeks long-term capital appreciation.
The Portfolio commenced operation on December 15, 2016, and offers four classes of shares — Class I, Class A, Class C and Class IS.
A. Significant Accounting Policies: The following significant accounting policies are in conformity with U.S. generally accepted accounting principles ("GAAP"). Such policies are consistently followed by the Fund in the preparation of its financial statements. GAAP may require management to make estimates and assumptions that affect the reported amounts and disclosures in the financial statements. Actual results may differ from those estimates.
1. Security Valuation: (1) An equity portfolio security listed or traded on an exchange is valued at its latest reported sales price (or at the exchange official closing price if such exchange reports an official closing price), and if there were no sales on a given day and if there is no official exchange closing price for that day, the security is valued at the mean between the last reported bid and asked prices if such bid and asked prices are available on the relevant exchanges; (2) all other equity portfolio securities for which over-the-counter ("OTC") market quotations are readily available are valued at the latest reported sales price (or at the market official closing price if such market reports an official closing price), and if there was no trading in the security on a given day and if there is no official closing price from relevant markets for that day, the security is valued at the mean between the last reported bid and asked prices if such bid and asked prices are available on the relevant markets. Listed equity securities not traded on the valuation date with no reported bid and asked prices available on the exchange are valued at the mean between the current bid and asked prices obtained from one or more reputable brokers or dealers. An unlisted equity security that does not trade on the valuation date and for which
bid and asked prices from the relevant markets are unavailable is valued at the mean between the current bid and asked prices obtained from one or more reputable brokers or dealers. In cases where a security is traded on more than one exchange, the security is valued on the exchange designated as the primary market; (3) certain portfolio securities may be valued by an outside pricing service/vendor approved by the Fund's Board of Directors (the "Directors"). The pricing service/vendor may employ a pricing model that takes into account, among other things, bids, yield spreads, and/or other market data and specific security characteristics. Alternatively, if a valuation is not available from an outside pricing service/vendor, and the security trades on an exchange, the security may be valued at its latest reported sale price (or at the exchange official closing price if such exchange reports an official closing price), prior to the time when assets are valued. If there are no sales on a given day and if there is no official exchange closing price for that day, the security is valued at the mean between the last reported bid and asked prices if such bid and asked prices are available in the relevant exchanges; (4) futures are valued at the settlement price on the exchange on which they trade or, if a settlement price is unavailable, at the last sale price on the exchange; (5) when market quotations are not readily available, including circumstances under which the Adviser determines that the closing price, last sale price or the mean between the last reported bid and asked prices are not reflective of a security's market value, portfolio securities are valued at their fair value as determined in good faith under procedures established by and under the general supervision of the Directors. Occasionally, developments affecting the closing prices of securities and other assets may occur between the times at which valuations of such securities are determined (that is, close of the foreign market on which the securities trade) and the close of business of the New York Stock Exchange ("NYSE"). If developments occur during such periods that are expected to materially affect the value of such securities, such valuations may be adjusted to reflect the estimated fair value of such securities as of the close of the NYSE, as determined in good faith by the Directors or by the Adviser using a pricing service and/or procedures approved by the Directors; (6) quotations of foreign portfolio securities, other assets and liabilities and forward contracts stated in foreign currency are translated into U.S. dollar equivalents at the prevailing
15
Morgan Stanley Institutional Fund, Inc.
Annual Report — December 31, 2016
Notes to Financial Statements (cont'd)
market rates prior to the close of the NYSE; and (7) investments in mutual funds, including the Morgan Stanley Institutional Liquidity Funds, are valued at the net asset value ("NAV") as of the close of each business day.
The Directors have responsibility for determining in good faith the fair value of the investments, and the Directors may appoint others, such as the Fund's Adviser or a valuation committee, to assist the Directors in determining fair value and to make the actual calculations pursuant to the fair valuation methodologies previously approved by the Directors. Under procedures approved by the Directors, the Fund's Adviser has formed a Valuation Committee whose members are approved by the Directors. The Valuation Committee provides administration and oversight of the Fund's valuation policies and procedures, which are reviewed at least annually by the Directors. These procedures allow the Fund to utilize independent pricing services, quotations from securities and financial instrument dealers, and other market sources to determine fair value.
The Fund has procedures to determine the fair value of securities and other financial instruments for which market prices are not readily available. Under these procedures, the Valuation Committee convenes on a regular and ad hoc basis to review such securities and considers a number of factors, including valuation methodologies and significant unobservable valuation inputs, when arriving at fair value. The Valuation Committee may employ a market-based approach which may use related or comparable assets or liabilities, recent transactions, market multiples, book values, and other relevant information for the investment to determine the fair value of the investment. An income-based valuation approach may also be used in which the anticipated future cash flows of the investment are discounted to calculate fair value. Discounts may also be applied due to the nature or duration of any restrictions on the disposition of the investments. Due to the inherent uncertainty of valuations of such investments, the fair values may differ significantly from the values that would have been used had an active market existed. The Valuation Committee employs various methods for calibrating these valuation approaches including a regular review of valuation methodologies, key inputs and assumptions, transactional back-testing or disposition analysis, and reviews of any related market activity.
2. Fair Value Measurement: Financial Accounting Standards Board ("FASB") Accounting Standards CodificationTM ("ASC") 820, "Fair Value Measurement" ("ASC 820"), defines fair value as the value that the Fund would receive to sell an investment or pay to transfer a liability in a timely transaction with an independent buyer in the principal market, or in the absence of a principal market, the most advantageous market for the investment or liability. ASC 820 establishes a three-tier hierarchy to distinguish between (1) inputs that reflect the assumptions market participants would use in valuing an asset or liability developed based on market data obtained from sources independent of the reporting entity (observable inputs) and (2) inputs that reflect the reporting entity's own assumptions about the assumptions market participants would use in valuing an asset or liability developed based on the best information available in the circumstances (unobservable inputs) and to establish classification of fair value measurements for disclosure purposes. Various inputs are used in determining the value of the Fund's investments. The inputs are summarized in the three broad levels listed below.
• Level 1 – unadjusted quoted prices in active markets for identical investments
• Level 2 – other significant observable inputs (including quoted prices for similar investments, interest rates, prepayment speeds, credit risk, etc.)
• Level 3 – significant unobservable inputs including the Fund's own assumptions in determining the fair value of investments. Factors considered in making this determination may include, but are not limited to, information obtained by contacting the issuer, analysts, or the appropriate stock exchange (for exchange-traded securities), analysis of the issuer's financial statements or other available documents and, if necessary, available information concerning other securities in similar circumstances
The inputs or methodology used for valuing securities are not necessarily an indication of the risk associated with investing in those securities and the determination of the significance of a particular input to the fair value
16
Morgan Stanley Institutional Fund, Inc.
Annual Report — December 31, 2016
Notes to Financial Statements (cont'd)
measurement in its entirety requires judgment and considers factors specific to each security.
The following is a summary of the inputs used to value the Portfolio's investments as of December 31, 2016.
Investment Type | | Level 1
Unadjusted
quoted
prices
(000) | | Level 2
Other
significant
observable
inputs
(000) | | Level 3
Significant
unobservable
inputs
(000) | | Total
(000) | |
Assets: | |
Common Stocks | |
Automobiles | | $ | 68 | | | $ | — | | | $ | — | | | $ | 68 | | |
Banks | | | 1,189 | | | | — | | | | — | | | | 1,189 | | |
Beverages | | | 170 | | | | — | | | | — | | | | 170 | | |
Capital Markets | | | 56 | | | | — | | | | — | | | | 56 | | |
Chemicals | | | 30 | | | | — | | | | — | | | | 30 | | |
Construction &
Engineering | | | — | | | | 27 | | | | — | | | | 27 | | |
Construction Materials | | | 340 | | | | — | | | | — | | | | 340 | | |
Diversified Financial
Services | | | 273 | | | | — | | | | — | | | | 273 | | |
Diversified
Telecommunication
Services | | | 119 | | | | — | | | | — | | | | 119 | | |
Electric Utilities | | | 221 | | | | — | | | | — | | | | 221 | | |
Electrical Equipment | | | 29 | | | | — | | | | — | | | | 29 | | |
Food & Staples Retailing | | | 110 | | | | — | | | | — | | | | 110 | | |
Food Products | | | 54 | | | | — | | | | — | | | | 54 | | |
Health Care Providers &
Services | | | — | | | | 45 | | | | — | | | | 45 | | |
Hotels, Restaurants &
Leisure | | | 22 | | | | 23 | | | | — | | | | 45 | | |
Industrial Conglomerates | | | 205 | | | | — | | | | — | | | | 205 | | |
Internet Software &
Services | | | 27 | | | | — | | | | — | | | | 27 | | |
Metals & Mining | | | 73 | | | | — | | | | — | | | | 73 | | |
Multi-line Retail | | | 42 | | | | — | | | | — | | | | 42 | | |
Oil, Gas & Consumable
Fuels | | | 115 | | | | — | | | | — | | | | 115 | | |
Real Estate Management &
Development | | | 77 | | | | 25 | | | | — | | | | 102 | | |
Textiles, Apparel & Luxury
Goods | | | 88 | | | | — | | | | — | | | | 88 | | |
Transportation Infrastructure | | | 54 | | | | — | | | | — | | | | 54 | | |
Wireless Telecommunication
Services | | | 206 | | | | — | | | | — | | | | 206 | | |
Total Common Stocks | | | 3,568 | | | | 120 | | | | — | | | | 3,688 | | |
Participation Notes | | | — | | | | 173 | | | | — | | | | 173 | | |
Investment Companies | | | 426 | | | | — | | | | — | | | | 426 | | |
Short-Term Investment | |
Investment Company | | | 749 | | | | — | | | | — | | | | 749 | | |
Futures Contract | | | 8 | | | | — | | | | — | | | | 8 | | |
Total Assets | | $ | 4,751 | | | $ | 293 | | | $ | — | | | $ | 5,044 | | |
Transfers between investment levels may occur as the markets fluctuate and/or the availability of data used in an investment's valuation changes. The Portfolio recognizes transfers between the levels as of the end of the period.
3. Foreign Currency Translation and Foreign Investments: The books and records of the Portfolio are maintained in U.S. dollars. Foreign currency amounts are translated into U.S. dollars as follows:
– investments, other assets and liabilities at the prevailing rate of exchange on the valuation date;
– investment transactions and investment income at the prevailing rates of exchange on the dates of such transactions.
Although the net assets of the Portfolio are presented at the foreign exchange rates and market values at the close of the period, the Portfolio does not isolate that portion of the results of operations arising as a result of changes in the foreign exchange rates from the fluctuations arising from changes in the market prices of securities held at period end. Similarly, the Portfolio does not isolate the effect of changes in foreign exchange rates from the fluctuations arising from changes in the market prices of securities sold during the period. Accordingly, realized and unrealized foreign currency gains (losses) on investments in securities are included in the reported net realized and unrealized gains (losses) on investment transactions and balances. However, pursuant to U.S. federal income tax regulations, gains and losses from certain foreign currency transactions and the foreign currency portion of gains and losses realized on sales and maturities of foreign denominated debt securities are treated as ordinary income for U.S. federal income tax purposes.
Net realized gains (losses) on foreign currency transactions represent net foreign exchange gains (losses) from foreign currency forward exchange contracts, disposition of foreign currencies, currency gains (losses) realized between the trade and settlement dates on securities transactions, and the difference between the amount of investment income and foreign withholding taxes recorded on the Portfolio's books and the U.S. dollar equivalent amounts actually received or paid. Net unrealized currency gains (losses) from valuing foreign currency denominated assets and liabilities at period end exchange rates are reflected as a component of unrealized appreciation (depreciation) in the Statement of Assets and Liabilities. The change in unrealized currency gains (losses) on foreign currency translations for the period is reflected in the Statement of Operations.
17
Morgan Stanley Institutional Fund, Inc.
Annual Report — December 31, 2016
Notes to Financial Statements (cont'd)
A significant portion of the Portfolio's net assets consist of securities of issuers located in emerging markets, which are denominated in foreign currencies. Such securities may be concentrated in a limited number of countries and regions and may vary throughout the year. Changes in currency exchange rates will affect the value of and investment income from foreign currency denominated securities. Emerging market securities are often subject to greater price volatility, limited capitalization and liquidity, and higher rates of inflation than securities of companies based in the U.S. In addition, emerging market issuers may be subject to substantial governmental involvement in the economy and greater social, economic and political uncertainty.
Governmental approval for foreign investments may be required in advance of making an investment under certain circumstances in some countries, and the extent of foreign investments in domestic companies may be subject to limitation in other countries. Foreign ownership limitations also may be imposed by the charters of individual companies to prevent, among other concerns, violations of foreign investment limitations. As a result, an additional class of shares (identified as "Foreign" in the Portfolio of Investments) may be created and offered for investment. The "local" and "foreign shares" market values may differ. In the absence of trading of the foreign shares in such markets, the Portfolio values the foreign shares at the closing exchange price of the local shares.
4. Derivatives: The Portfolio may, but is not required to, use derivative instruments for a variety of purposes, including hedging, risk management, portfolio management or to earn income. Derivatives are financial instruments whose value is based, in part, on the value of an underlying asset, interest rate, index or financial instrument. Prevailing interest rates and volatility levels, among other things, also affect the value of derivative instruments. A derivative instrument often has risks similar to its underlying asset and may have additional risks, including imperfect correlation between the value of the derivative and the underlying asset, risks of default by the counterparty to certain transactions, magnification of losses incurred due to changes in the market value of the securities, instruments, indices or interest rates to which the derivative instrument relates, risks that the transactions may not be liquid and risks arising from margin requirements. The use of derivatives involves risks that are different from, and
possibly greater than, the risks associated with other portfolio investments. Derivatives may involve the use of highly specialized instruments that require investment techniques and risk analyses different from those associated with other portfolio investments. All of the Portfolio's holdings, including derivative instruments, are marked-to-market each day with the change in value reflected in unrealized appreciation (depreciation). Upon disposition, a realized gain or loss is recognized.
Certain derivative transactions may give rise to a form of leverage. Leverage magnifies the potential for gain and the risk of loss. Leverage associated with derivative transactions may cause the Portfolio to liquidate portfolio positions when it may not be advantageous to do so to satisfy its obligations or to meet earmarking or segregation requirements, pursuant to applicable Securities and Exchange Commission rules and regulations, or may cause the Portfolio to be more volatile than if the Portfolio had not been leveraged. Although the Adviser seeks to use derivatives to further the Portfolio's investment objectives, there is no assurance that the use of derivatives will achieve this result.
Following is a description of the derivative instruments and techniques that the Portfolio used during the period and their associated risks:
Futures: A futures contract is a standardized, exchange-traded agreement to buy or sell a specific quantity of an underlying asset, reference rate or index at a specific price at a specific future time. The value of a futures contract tends to increase and decrease in tandem with the value of the underlying instrument. Depending on the terms of the particular contract, futures contracts are settled through either physical delivery of the underlying instrument on the settlement date or by payment of a cash settlement amount on the settlement date. During the period the futures contract is open, payments are received from or made to the broker based upon changes in the value of the contract (the variation margin). A decision as to whether, when and how to use futures contracts involves the exercise of skill and judgment and even a well-conceived futures transaction may be unsuccessful because of market behavior or unexpected events. In addition to the derivatives risks discussed above, the prices of futures contracts can be highly volatile, using futures contracts can lower total return, and the potential loss from futures contracts can exceed the Portfolio's
18
Morgan Stanley Institutional Fund, Inc.
Annual Report — December 31, 2016
Notes to Financial Statements (cont'd)
initial investment in such contracts. No assurance can be given that a liquid market will exist for any particular futures contract at any particular time. There is also the risk of loss by the Portfolio of margin deposits in the event of bankruptcy of a broker with which the Portfolio has open positions in the futures contract.
FASB ASC 815, "Derivatives and Hedging" ("ASC 815"), is intended to improve financial reporting about derivative instruments by requiring enhanced disclosures to enable investors to better understand how and why the Portfolio uses derivative instruments, how these derivative instruments are accounted for and their effects on the Portfolio's financial position and results of operations.
The following table sets forth the fair value of the Portfolio's derivative contracts by primary risk exposure as of December 31, 2016.
| | | Asset Derivatives
Statement of Assets and
Liabilities Location | | Primary Risk
Exposure | | Value
(000) | |
| Futures Contract Variation Margin on | |
Futures Contract | | Equity Risk | | $ | 8 | (a) | |
(a) This amount represents the cumulative appreciation (depreciation) as reported in the Portfolio of Investments. The Statement of Assets and Liabilities only reflects the current day's net variation margin.
The following tables set forth by primary risk exposure the Portfolio's realized gains (losses) and change in unrealized appreciation (depreciation) by type of derivative contract for the period ended December 31, 2016 in accordance with ASC 815.
Realized Gain (Loss) | |
Primary Risk Exposure | | Derivative Type | | Value
(000) | |
Equity Risk | | Futures Contract | | $ | (8 | ) | |
Change in Unrealized Appreciation (Depreciation) | |
Primary Risk Exposure | | Derivative Type | | Value
(000) | |
Equity Risk | | Futures Contract | | $ | 8 | | |
For the period ended December 31, 2016, the approximate average monthly amount outstanding for each derivative type is as follows:
Futures Contracts: | |
| Average original value for the period | | $ | 1,511,000 | | |
5. Structured Investments: The Portfolio invested a portion of its assets in structured investments. A structured investment is a derivative security designed to offer a return linked to a particular underlying security, currency,
commodity or market. Structured investments may come in various forms including notes (such as exchange-traded notes), warrants and options to purchase securities. The Portfolio will typically use structured investments to gain exposure to a permitted underlying security, currency, commodity or market when direct access to a market is limited or inefficient from a tax or cost standpoint. There can be no assurance that structured investments will trade at the same price or have the same value as the underlying security, currency, commodity or market. Investments in structured investments involve risks including issuer risk, counterparty risk and market risk. Holders of structured investments bear risks of the underlying investment and are subject to issuer or counterparty risk because the Portfolio is relying on the creditworthiness of such issuer or counterparty and has no rights with respect to the underlying investment. Certain structured investments may be thinly traded or have a limited trading market and may have the effect of increasing the Portfolio's illiquidity to the extent that the Portfolio, at a particular time, may be unable to find qualified buyers for these securities.
6. Redemption Fees: The Portfolio will assess a 2% redemption fee on Class I shares, Class A shares, Class C shares and Class IS shares, which is paid directly to the Portfolio, for shares redeemed or exchanged within thirty days of purchase, subject to certain exceptions. The redemption fee is designed to protect the Portfolio and its remaining shareholders from the effects of short-term trading. These fees, if any, are included in the Statements of Changes in Net Assets.
7. Indemnifications: The Fund enters into contracts that contain a variety of indemnifications. The Fund's maximum exposure under these arrangements is unknown. However, the Fund has not had prior claims or losses pursuant to these contracts and expects the risk of loss to be remote.
8. Dividends and Distributions to Shareholders: Dividend income and distributions to shareholders are recorded on the ex-dividend date. Dividends from net investment income, if any, are declared and paid annually. Net realized capital gains, if any, are distributed at least annually.
9. Security Transactions, Income and Expenses: Security transactions are accounted for on the trade date (date the order to buy or sell is executed). Realized gains
19
Morgan Stanley Institutional Fund, Inc.
Annual Report — December 31, 2016
Notes to Financial Statements (cont'd)
and losses on the sale of investment securities are determined on the specific identified cost method. Dividend income and other distributions are recorded on the ex-dividend date (except for certain foreign dividends which may be recorded as soon as the Portfolio is informed of such dividends) net of applicable withholding taxes. Interest income is recognized on the accrual basis except where collection is in doubt. Discounts are accreted and premiums are amortized over the life of the respective securities. Most expenses of the Fund can be directly attributed to a particular Portfolio. Expenses which cannot be directly attributed are apportioned among the Portfolios based upon relative net assets or other appropriate methods. Income, expenses (other than class specific expenses — distribution and shareholder services, transfer agency and sub transfer agency fees) and realized and unrealized gains or losses are allocated to each class of shares based upon their relative net assets.
B. Advisory Fees: The Adviser, a wholly-owned subsidiary of Morgan Stanley, provides the Portfolio with advisory services under the terms of an Investment Advisory Agreement, paid quarterly, at the annual rate based on the daily net assets as follows:
First $1
billion | | Over $1
billion | |
| | 0.90 | % | | | 0.85 | % | |
For the period ended December 31, 2016, the advisory fee rate (net of waivers/rebate) was equivalent to an annual effective rate of 0.00% of the Portfolio's average daily net assets.
The Adviser has agreed to reduce its advisory fee and/or reimburse the Portfolio so that total annual portfolio operating expenses, excluding certain investment related expenses, taxes, interest and other extraordinary expenses (including litigation), will not exceed 1.20% for Class I shares, 1.55% for Class A shares, 2.30% for Class C shares and 1.10% for Class IS shares. The fee waivers and/or expense reimbursements will continue for at least one year from the date of the Portfolio's prospectus or until such time as the Directors act to discontinue all or a portion of such waivers and/or reimbursements when they deem such action is appropriate. For the period ended December 31, 2016, approximately $2,000 of advisory fees were waived and approximately $46,000 of other expenses were reimbursed by the Adviser pursuant to this arrangement.
C. Administration Fees: The Adviser also serves as Administrator to the Fund and provides administrative services
pursuant to an Administration Agreement for an annual fee, accrued daily and paid monthly, of 0.08% of the Portfolio's average daily net assets.
Under a Sub-Administration Agreement between the Administrator and State Street Bank and Trust Company ("State Street"), State Street provides certain administrative services to the Fund. For such services, the Administrator pays State Street a portion of the fee the Administrator receives from the Portfolio.
D. Distribution and Shareholder Services Fees: Morgan Stanley Distribution, Inc. ("MSDI" or the "Distributor"), a wholly-owned subsidiary of the Adviser and an indirect subsidiary of Morgan Stanley, serves as the Fund's Distributor of Portfolio shares pursuant to a Distribution Agreement. The Fund has adopted a Shareholder Services Plan with respect to Class A shares pursuant to Rule 12b-1 under the Act. Under the Shareholder Services Plan, the Portfolio pays the Distributor a shareholder services fee, accrued daily and paid monthly, at an annual rate of 0.25% of the Portfolio's average daily net assets attributable to Class A shares.
The Fund has adopted a Distribution and Shareholder Services Plan with respect to Class C shares pursuant to Rule 12b-1 under the Act. Under the Distribution and Shareholder Services Plan, the Portfolio pays the Distributor a distribution fee, accrued daily and paid monthly, at an annual rate of 0.75% and a shareholder services fee, accrued daily and paid monthly, at an annual rate of 0.25% of the Portfolio's average daily net assets attributable to Class C shares.
The distribution and shareholder services fees are used to support the expenses associated with servicing and maintaining accounts. The Distributor may compensate other parties for providing shareholder support services to investors who purchase Class A and Class C shares.
E. Dividend Disbursing and Transfer Agent: The Fund's dividend disbursing and transfer agent is Boston Financial Data Services, Inc. ("BFDS"). Pursuant to a Transfer Agency Agreement, the Fund pays BFDS a fee based on the number of classes, accounts and transactions relating to the Portfolios of the Fund.
F. Custodian Fees: State Street (the "Custodian") serves as Custodian for the Fund in accordance with a Custodian Agreement. The Custodian holds cash, securities, and other assets of the Fund as required by the Act. Custody fees are payable monthly based on assets held in custody, investment purchases
20
Morgan Stanley Institutional Fund, Inc.
Annual Report — December 31, 2016
Notes to Financial Statements (cont'd)
and sales activity and account maintenance fees, plus reimbursement for certain out-of-pocket expenses.
G. Security Transactions and Transactions with Affiliates: For the period ended December 31, 2016, purchases and sales of investment securities for the Portfolio, other than long-term U.S. Government securities and short-term investments, were approximately $4,807,000 and $661,000, respectively. There were no purchases and sales of long-term U.S. Government securities for the period ended December 31, 2016.
The Portfolio invests in the Institutional Class of the Morgan Stanley Institutional Liquidity Funds (the "Liquidity Funds"), an open-end management investment company managed by the Adviser. Advisory fees paid by the Portfolio are reduced by an amount equal to its pro-rata share of the advisory and administration fees paid by the Portfolio due to its investment in the Liquidity Funds. For the period ended December 31, 2016, advisory fees paid were reduced by less than $500 relating to the Portfolio's investment in the Liquidity Funds.
A summary of the Portfolio's transactions in shares of the Liquidity Funds during the period ended December 31, 2016 is as follows:
Purchases
at Cost
(000) | | Sales
(000) | | Dividend
Income
(000) | | Value
December 31,
2016
(000) | |
| $ | 5,001 | | | $ | 4,252 | | | $ | — | @ | | $ | 749 | | |
@ Amount is less than $500
The Portfolio invests in Morgan Stanley India Investment Fund, Inc., a closed-end management investment company advised by an affiliate of the Adviser. Advisory fees paid by the Portfolio are reduced by an amount equal to its pro-rata share of the advisory and administration fees paid by the Morgan Stanley India Investment Fund, Inc. For the period ended December 31, 2016, advisory fees paid were reduced by less than $500 relating to the Portfolio's investment in the Morgan Stanley India Investment Fund, Inc.
A summary of the Portfolio's transactions in shares of the Morgan Stanley India Investment Fund, Inc. during the period ended December 31, 2016 is as follows:
Purchases
at Cost
(000) | | Sales
(000) | | Realized
Loss
(000) | | Value
Dividend
Income
(000) | | December 31,
2016
(000) | |
| $ | 236 | | | $ | 235 | | | $ | (1 | ) | | $ | — | | | $ | — | | |
The Portfolio is permitted to purchase and sell securities ("cross-trade") from and to other Morgan Stanley Funds as well as other funds and client accounts for which the Adviser or an affiliate of the Adviser serves as investment adviser, pursuant to procedures approved by the Directors in compliance with Rule 17a-7 under the Act (the "Rule"). Each cross-trade is executed at the current market price in compliance with provisions of the Rule. For the period ended December 31, 2016, the Portfolio did not engage in any cross-trade transactions.
The Portfolio has an unfunded Deferred Compensation Plan (the "Compensation Plan"), which allows each independent Director to defer payment of all, or a portion, of the fees he or she receives for serving on the Board of Directors. Each eligible Director generally may elect to have the deferred amounts credited with a return equal to the total return on one or more of the Morgan Stanley funds that are offered as investment options under the Compensation Plan. Appreciation/depreciation and distributions received from these investments are recorded with an offsetting increase/decrease in the deferred compensation obligation and do not affect the NAV of the Portfolio.
H. Federal Income Taxes: It is the Portfolio's intention to continue to qualify as a regulated investment company and distribute all of its taxable and tax-exempt income. Accordingly, no provision for federal income taxes is required in the financial statements.
The Portfolio may be subject to taxes imposed by countries in which it invests. Such taxes are generally based on income and/or capital gains earned or repatriated. Taxes are accrued based on net investment income, net realized gains and net unrealized appreciation as such income and/or gains are earned. Taxes may also be based on transactions in foreign currency and are accrued based on the value of investments denominated in such currency.
FASB ASC 740-10, "Income Taxes — Overall", sets forth a minimum threshold for financial statement recognition of the benefit of a tax position taken or expected to be taken in a tax return. Management has concluded that there are no significant uncertain tax positions that would require recognition in the financial statements. If applicable, the Portfolio recognizes interest accrued related to unrecognized tax benefits in "Interest Expense" and penalties in "Other Expenses" in the Statement of Operations. The Portfolio files tax returns with the U.S. Internal Revenue Service, New York and various states.
21
Morgan Stanley Institutional Fund, Inc.
Annual Report — December 31, 2016
Notes to Financial Statements (cont'd)
The tax character of distributions paid may differ from the character of distributions shown in the Statement of Changes in Net Assets due to short-term capital gains being treated as ordinary income for tax purposes. There were no distributions paid during fiscal 2016.
The amount and character of income and gains to be distributed are determined in accordance with income tax regulations which may differ from GAAP. These book/tax differences are either considered temporary or permanent in nature.
Temporary differences are attributable to differing book and tax treatments for the timing of the recognition of gains (losses) on certain investment transactions and the timing of the deductibility of certain expenses.
Permanent differences, primarily due to differing treatments of gains (losses) related to foreign currency transactions resulted in the following reclassifications among the components of net assets at December 31, 2016:
Accumulated
Undistributed Net
Investment
Income
(000) | | Accumulated
Net Realized
Loss
(000) | | Paid-in-
Capital
(000) | |
| $ | 1 | | | $ | (1 | ) | | $ | — | | |
At December 31, 2016, the components of distributable earnings for the Portfolio on a tax basis were as follows:
Undistributed
Ordinary
Income
(000) | | Undistributed
Long-Term
Capital Gain
(000) | |
| $ | 3 | | | $ | — | | |
At December 31, 2016, the Portfolio had available for federal income tax purposes unused short-term capital losses of approximately $13,000 that do not have an expiration date.
To the extent that capital loss carryforwards are used to offset any future capital gains realized, no capital gains tax liability will be incurred by the Portfolio for gains realized and not distributed. To the extent that capital gains are offset, such gains will not be distributed to the shareholders.
I. Other: At December 31, 2016, the Portfolio did not have record owners of 10% or greater.
J. Accounting Pronouncements: In December 2016, FASB issued Accounting Standards update 2016-19 — Technical Corrections and Improvements ("ASU 2016-19"), which is effective for interim periods for all entities beginning after December 15, 2016. ASU 2016-19 includes an amendment to
Topic 820, Fair Value Measurement, which clarifies the difference between a valuation approach and a valuation technique when applying the guidance in that Topic. That amendment also requires an entity to disclose when there has been a change in either or both a valuation approach and/or a valuation technique. The transition guidance for the amendment must be applied prospectively because it could potentially involve the use of hindsight that includes fair value measurements. Although still evaluating the potential impacts of ASU 2016-19 to the Portfolio, management expects that the impact of the Portfolio's adoption will be limited to additional financial statement disclosures.
In October 2016, the Securities and Exchange Commission ("SEC") issued a new rule, Investment Company Reporting Modernization, which, among other provisions, amends Regulation S-X to require standardized, enhanced disclosures, particularly related to derivatives, in investment company financial statements. Compliance with the guidance is effective for financial statements filed with the SEC on or after August 1, 2017; adoption will have no effect on the Portfolio's net assets or results of operations. Although still evaluating the potential impacts of the Investment Company Reporting Modernization to the Portfolio, management expects that the impact of the Portfolio's adoption will be limited to additional financial statement disclosures.
22
Morgan Stanley Institutional Fund, Inc.
Annual Report — December 31, 2016
Report of Independent Registered Public Accounting Firm
To the Shareholders and Board of Directors of
Morgan Stanley Institutional Fund, Inc. —
Emerging Markets Breakout Nations Portfolio
We have audited the accompanying statement of assets and liabilities, including the portfolio of investments, of Emerging Markets Breakout Nations Portfolio (one of the portfolios constituting Morgan Stanley Institutional Fund, Inc.) (the "Portfolio") as of December 31, 2016, and the related statement of operations, the statement of changes in net assets and the financial highlights for the period from December 15, 2016 (commencement of operations) to December 31, 2016. These financial statements and financial highlights are the responsibility of the Portfolio's management. Our responsibility is to express an opinion on these financial statements and financial highlights based on our audit.
We conducted our audit in accordance with the standards of the Public Company Accounting Oversight Board (United States). Those standards require that we plan and perform the audit to obtain reasonable assurance about whether the financial statements and financial highlights are free of material misstatement. We were not engaged to perform an audit of the Portfolio's internal control over financial reporting. Our audit included consideration of internal control over financial reporting as a basis for designing audit procedures that are appropriate in the circumstances, but not for the purpose of expressing an opinion on the effectiveness of the Portfolio's internal control over financial reporting. Accordingly, we express no such opinion. An audit also includes examining, on a test basis, evidence supporting the amounts and disclosures in the financial statements and financial highlights, assessing the accounting principles used and significant estimates made by management, and evaluating the overall financial statement presentation. Our procedures included confirmation of securities owned as of December 31, 2016, by correspondence with the custodian and others or by other appropriate auditing procedures where replies from others were not received. We believe that our audit provides a reasonable basis for our opinion.
In our opinion, the financial statements and financial highlights referred to above present fairly, in all material respects, the financial position of Emerging Markets Breakout Nations Portfolio (one of the portfolios constituting Morgan Stanley Institutional Fund, Inc.) at December 31, 2016, the results of its operations, the changes in its net assets and the financial highlights for the period from December 15, 2016 (commencement of operations) to December 31, 2016, in conformity with U.S. generally accepted accounting principles.

Boston, Massachusetts
February 28, 2017
23
Morgan Stanley Institutional Fund, Inc.
Annual Report — December 31, 2016
Privacy Notice (unaudited)
MORGAN STANLEY INVESTMENT MANAGEMENT INC.
AN IMPORTANT NOTICE CONCERNING OUR U.S. PRIVACY POLICY
We are required by federal law to provide you with a copy of our privacy policy annually. This policy applies to current and former individual investors in funds managed or sponsored by Morgan Stanley Investment Management Inc. ("MSIM") as well as current and former individual clients of MSIM. This policy is not applicable to partnerships, corporations, trusts or other non-individual clients or investors. Please note that we may amend this policy at any time, and will inform you of any changes as required by law.
WE RESPECT YOUR PRIVACY
We appreciate that you have provided us with your personal financial information. We strive to maintain the privacy of such information while we help you achieve your financial objectives. This Notice describes what non-public personal information we collect about you, why we collect it, when we may share it with others and how certain others may use it. It discusses the steps you may take to limit our sharing of certain information about you to affiliated companies in the Morgan Stanley family of companies ("other Morgan Stanley companies"). It also discloses how you may limit use of certain shared information for marketing purposes by other Morgan Stanley branded companies. Throughout this policy, we refer to the non-public information that personally identifies you or your accounts as "personal information.''
1. WHAT PERSONAL INFORMATION DO WE COLLECT ABOUT YOU?
We obtain personal information from applications and other forms you submit to us, from your dealings with us, from consumer reporting agencies, from our Web sites and from third parties and other sources.
For example:
• We may collect information such as your name, address, e-mail address, telephone/fax numbers, assets, income and investment objectives through subscription documents, applications and other forms you submit to us.
• We may obtain information about account balances, your use of account(s) and the types of products and services you prefer to receive from us through your dealings and transactions with us and other sources.
• We may obtain information about your creditworthiness and credit history from consumer reporting agencies.
• We may collect background information from and through third-party vendors to verify representations you have made and to comply with various regulatory requirements.
• If you interact with us through our public and private Web sites, we may collect information that you provide directly through online communications (such as an e-mail address). We may also collect information about your Internet service provider, your domain name, your computer's operating system and Web browser, your use of our Web sites and your product and service preferences, through the use of "cookies." Please consult the Terms of Use of these sites for more details.
2. WHEN DO WE DISCLOSE PERSONAL INFORMATION WE COLLECT ABOUT YOU?
We may disclose personal information we collect about you to other Morgan Stanley companies and to non-affiliated third parties.
a. Information We Disclose to Other Morgan Stanley Companies.
We may disclose personal information to other Morgan Stanley companies for a variety of reasons, including to manage your account(s) effectively, to service and process your transactions, to let you know about products and services offered by us and other Morgan Stanley companies, to manage our business, and as otherwise required or permitted by law. Offers for products and services from other Morgan Stanley companies are developed under conditions designed to safeguard your personal information.
24
Morgan Stanley Institutional Fund, Inc.
Annual Report — December 31, 2016
Privacy Notice (unaudited) (cont'd)
b. Information We Disclose to Non-affiliated Third Parties.
We do not disclose personal information that we collect about you to non-affiliated third parties except to those who provide marketing services on our behalf, to financial institutions with whom we have joint marketing agreements, and as otherwise required or permitted by law. For example, we may disclose personal information to nonaffiliated third parties for servicing and processing transactions, to offer our own products and services, to protect against fraud, for institutional risk control, to respond to judicial process or to perform services on our behalf. When we share personal information with a non-affiliated third party, they are required to limit their use of personal information to the particular purpose for which it was shared and they are not allowed to share personal information with others except to fulfill that limited purpose or as may be permitted or required by law.
3. HOW DO WE PROTECT THE SECURITY AND CONFIDENTIALITY OF PERSONAL INFORMATION WE COLLECT ABOUT YOU?
We maintain physical, electronic and procedural security measures to help safeguard the personal information we collect about you. We have internal policies governing the proper handling of client information. Third parties that provide support or marketing services on our behalf may also receive personal information, and we require them to adhere to confidentiality standards with respect to such information.
4. HOW CAN YOU LIMIT THE SHARING OF CERTAIN TYPES OF PERSONAL INFORMATION WITH OTHER MORGAN STANLEY COMPANIES?
We offer you choices as to whether we share with other Morgan Stanley companies the personal information that was collected to determine your eligibility for products and services you request ("eligibility information"). Eligibility information does not include your identification information or personal information pertaining to our transactions or experiences with you. Please note that, even if you direct us not to share eligibility information with other Morgan Stanley companies ("opt-out"), we may still share personal information, including eligibility information, with those companies in circumstances excluded from the opt-out under applicable law, such as to process transactions or to service your account.
5. HOW CAN YOU LIMIT THE USE OF CERTAIN TYPES OF PERSONAL INFORMATION BY OTHER MORGAN STANLEY COMPANIES FOR MARKETING?
By following the opt-out instructions in Section 6 below, you may limit other Morgan Stanley branded companies from marketing their products or services to you based on personal information we disclose to them. This information may include, for example, your income and account history with us. Please note that, even if you choose to limit Other Morgan Stanley Companies from using personal information about you that we may share with them for marketing their products and services to you, Other Morgan Stanley Companies may use your personal information that they obtain from us to market to you in circumstances permitted by law, such as if the Other Morgan Stanley Company has its own relationship with you.
6. HOW CAN YOU SEND US AN OPT-OUT INSTRUCTION?
If you wish to limit our sharing of eligibility information about you with other Morgan Stanley companies or other Morgan Stanley companies' use of personal information for marketing purposes, as described in this notice, you may do so by:
• Calling us at (800) 548-7786
Monday-Friday between 8a.m. and 6p.m.(EST)
• Writing to us at the following address:
Boston Financial Data Services, Inc.
c/o Privacy Coordinator
P.O. Box 219804
Kansas City, Missouri 64121
25
Morgan Stanley Institutional Fund, Inc.
Annual Report — December 31, 2016
Privacy Notice (unaudited) (cont'd)
Your written request should include your name, address, telephone number and account number(s) to which the opt-out applies and whether you are opting out with respect to sharing of eligibility information (Section 4 above), or if information used for Marketing (Section 5 above) or both. Written opt-out requests should not be sent with any other correspondence. In order to process your request, we require that the request be provided by you directly and not through a third party.
Your opt-out preference will remain in effect with respect to this policy (as it may be amended) until you notify us otherwise. If you have a joint account, your direction for us not to share this information with other Morgan Stanley companies and for those other Morgan Stanley companies not to use your personal information for marketing will be applied to all account holders on that account. Please understand that if you limit our sharing or our affiliated companies' use of personal information, you and any joint account holder(s) may not receive information about Morgan Stanley products and services, including products or services that could help you manage your financial resources and achieve your investment objectives.
7. WHAT IF AN AFFILIATED COMPANY BECOMES A NON-AFFILIATED THIRD PARTY?
If, at any time in the future, an affiliated company becomes a non-affiliated third party, further disclosures of personal information made to the former affiliated company will be limited to those described in Section 2(b) above relating to non-affiliated third parties. If you elected under Section 6 to limit disclosures we make to affiliated companies, or use of personal information by affiliated companies, your election will not apply to use by any former affiliated company of your personal information in their possession once it becomes a non-affiliated third party.
SPECIAL NOTICE TO RESIDENTS OF VERMONT
The following section supplements our policy with respect to our individual clients who have a Vermont address and supersedes anything to the contrary in the above policy with respect to those clients only.
The state of Vermont requires financial institutions to obtain your consent prior to sharing personal information that they collect about you with affiliated companies and non-affiliated third parties other than in certain limited circumstances. Except as permitted by law, we will not share personal information we collect about you with non-affiliated third parties or other Morgan Stanley companies unless you provide us with your written consent to share such information ("opt-in").
If you wish to receive offers for investment products and services offered by or through other Morgan Stanley companies, please notify us in writing at the following address:
Boston Financial Data Services, Inc.
c/o Privacy Coordinator
P.O. Box 219804
Kansas City, Missouri 64121
Your authorization should include your name, address, telephone number and account number(s) to which the opt-in applies and should not be sent with any other correspondence. In order to process your authorization, we require that the authorization be provided by you directly and not through a third party.
SPECIAL NOTICE TO RESIDENTS OF CALIFORNIA
The following section supplements our policy with respect to our individual clients who have a California address and supersedes anything to the contrary in the above policy with respect to those clients only.
In response to a California law, if your account has a California home address, your personal information will not be disclosed to nonaffiliated third parties except as permitted by applicable California law, and we will limit sharing such information with our affiliates to comply with California privacy laws that apply to us.
26
Morgan Stanley Institutional Fund, Inc.
Annual Report — December 31, 2016
Director and Officer Information (unaudited)
Independent Directors:
Name, Age and Address of
Independent Director | | Position(s)
Held with
Registrant | | Length of Time
Served* | | Principal Occupation(s) During Past 5 Years
and Other Relevant Professional Experience | | Number of
Portfolios in
Fund Complex
Overseen by
Independent
Director** | | Other Directorships
Held by Independent
Director*** | |
Frank L. Bowman (72)
c/o Perkins Coie LLP
Counsel to the Independent Directors
30 Rockefeller Plaza
New York, NY 10112 | | Director | | Since
August
2006 | | President, Strategic Decisions, LLC (consulting) (since February 2009); Director or Trustee of various Morgan Stanley Funds (since August 2006); Chairperson of the Compliance and Insurance Committee (since October 2015); formerly, Chairperson of the Insurance Sub-Committee of the Compliance and Insurance Committee (2007-2015); served as President and Chief Executive Officer of the Nuclear Energy Institute (policy organization) (February 2005-November 2008); retired as Admiral, U.S. Navy after serving over 38 years on active duty including 8 years as Director of the Naval Nuclear Propulsion Program in the Department of the Navy and the U.S. Department of Energy (1996-2004); served as Chief of Naval Personnel (July 1994-September 1996) and on the Joint Staff as Director of Political Military Affairs (June 1992-July 1994); knighted as Honorary Knight Commander of the Most Excellent Order of the British Empire; awarded the Officier de l'Orde National du Mérite by the French Government; elected to the National Academy of Engineering (2009). | | | 90 | | | Director of BP p.l.c.; Director of Naval and Nuclear Technologies LLP; Director Emeritus of the Armed Services YMCA; Director of the U.S. Naval Submarine League; Member of the National Security Advisory Council of the Center for U.S. Global Engagement and a member of the CNA Military Advisory Board; Chairman of the charity J Street Cup Golf; Trustee of Fairhaven United Methodist Church; and Director of other various non-profit organizations. | |
Kathleen A. Dennis (63)
c/o Perkins Coie LLP
Counsel to the Independent Directors
30 Rockefeller Plaza
New York, NY 10112 | | Director | | Since
August
2006 | | President, Cedarwood Associates (mutual fund and investment management consulting) (since July 2006); Chairperson of the Liquidity and Alternatives Sub-Committee of the Investment Committee (since October 2006) and Director or Trustee of various Morgan Stanley Funds (since August 2006); formerly, Senior Managing Director of Victory Capital Management (1993-2006). | | | 91 | | | Director of various non-profit organizations. | |
Nancy C. Everett (61)
c/o Perkins Coie LLP
Counsel to the Independent Directors
30 Rockefeller Plaza
New York, NY 10112 | | Director | | Since
January 2015 | | Chief Executive Officer, Virginia Commonwealth University (since November 2015); Owner, OBIR, LLC (institutional investment management consulting) (since June 2014); formerly, Managing Director, BlackRock Inc. (February 2011-December 2013); and Chief Executive Officer, General Motors Asset Management (a/k/a Promark Global Advisors, Inc.) (June 2005-May 2010). | | | 91 | | | Member of Virginia Commonwealth University School of Business Foundation; Investment Company formerly, Member of Virginia Commonwealth University Board of Visitors (2013-2015); Member of Committee on Directors for Emerging Markets Growth Fund, Inc. (2007-2010); Chairperson of Performance Equity Management, LLC (2006-2010); and Chairperson, GMAM Absolute Return Strategies Fund, LLC (2006-2010). | |
27
Morgan Stanley Institutional Fund, Inc.
Annual Report — December 31, 2016
Director and Officer Information (unaudited) (cont'd)
Independent Trustees: (cont'd)
Name, Age and Address of
Independent Director | | Position(s)
Held with
Registrant | | Length of Time
Served* | | Principal Occupation(s) During Past 5 Years
and Other Relevant Professional Experience | | Number of
Portfolios in
Fund Complex
Overseen by
Independent
Director** | | Other Directorships
Held by Independent
Director*** | |
Jakki L. Haussler (59)
c/o Perkins Coie LLP
Counsel to the Independent Directors
30 Rockefeller Plaza
New York, NY 10112 | | Director | | Since
January 2015 | | Chairman and Chief Executive Officer, Opus Capital Group (since January 1996); formerly, Director, Capvest Venture Fund, LP (May 2000-December 2011); Partner, Adena Ventures, LP (July 1999-December 2010); Director, The Victory Funds (February 2005-July 2008). | | | 91 | | | Director of Cincinnati Bell Inc. and Member, Audit Committee and Compensation Committee; Director of Northern Kentucky University Foundation and Member, Investment Committee; Member of Chase College of Law Transactional Law Practice Center Board of Advisors; Director of Best Transport; Director of Chase College of Law Board of Visitors; formerly, Member, University of Cincinnati Foundation Investment Committee; Member, Miami University Board of Visitors (2008-2011); Trustee of Victory Funds (2005-2008) and Chairman, Investment Committee (2007-2008) and Member, Service Provider Committee (2005-2008). | |
Dr. Manuel H. Johnson (67)
c/o Johnson Smick
International, Inc.
220 I Street, N.E. — Suite 200
Washington, D.C. 20002 | | Director | | Since July 1991 | | Senior Partner, Johnson Smick International, Inc. (consulting firm); Chairperson of the Investment Committee (since October 2006) and Director or Trustee of various Morgan Stanley Funds (since July 1991); Co-Chairman and a founder of the Group of Seven Council (G7C) (international economic commission); formerly, Chairperson of the Audit Committee (July 1991-September 2006), Vice Chairman of the Board of Governors of the Federal Reserve System and Assistant Secretary of the U.S. Treasury. | | | 91 | | | Director of NVR, Inc. (home construction). | |
Joseph J. Kearns (74)
c/o Kearns & Associates LLC
46 E Peninsula Center #385
Rolling Hills Estates, CA
90274-3712 | | Director | | Since
August 1994 | | President, Kearns & Associates LLC (investment consulting); Chairperson of the Audit Committee (since October 2006) and Director or Trustee of various Morgan Stanley Funds (since August 1994); formerly, Deputy Chairperson of the Audit Committee (July 2003-September 2006) and Chairperson of the Audit Committee of various Morgan Stanley Funds (since August 1994); CFO of the J. Paul Getty Trust. | | | 93 | | | Director of Electro Rent Corporation (equipment leasing). Prior to December 31, 2013, Director of The Ford Family Foundation. | |
28
Morgan Stanley Institutional Fund, Inc.
Annual Report — December 31, 2016
Director and Officer Information (unaudited) (cont'd)
Independent Trustees: (cont'd)
Name, Age and Address of
Independent Director | | Position(s)
Held with
Registrant | | Length of Time
Served* | | Principal Occupation(s) During Past 5 Years
and Other Relevant Professional Experience | | Number of
Portfolios in
Fund Complex
Overseen by
Independent
Director** | | Other Directorships
Held by Independent
Director*** | |
Michael F. Klein (58)
c/o Perkins Coie LLP
Counsel to the Independent Directors
30 Rockefeller Plaza
New York, NY 10112 | | Director | | Since August 2006 | | Managing Director, Aetos Capital, LLC (since March 2000); Co-President, Aetos Alternatives Management, LLC (since January 2004) and Co-Chief Executive Officer of Aetos Capital LLC (since August 2013); Chairperson of the Fixed Income Sub-Committee of the Investment Committee (since October 2006) and Director or Trustee of various Morgan Stanley Funds (since August 2006); formerly, Managing Director, Morgan Stanley & Co. Inc. and Morgan Stanley Dean Witter Investment Management, President, various Morgan Stanley Funds (June 1998-March 2000) and Principal, Morgan Stanley & Co. Inc. and Morgan Stanley Dean Witter Investment Management (August 1997-December 1999). | | | 90 | | | Director of certain investment funds managed or sponsored by Aetos Capital, LLC; Director of Sanitized AG and Sanitized Marketing AG (specialty chemicals). | |
Patricia Maleski (56)
c/o Perkins Coie LLP
Counsel to the Independent Directors
30 Rockefeller Plaza
New York, NY 10112 | | Director | | Since
January 2017 | | Management Director, JPMorgan Asset Management (2013-2016); President, JPMorgan Funds (2010-2013), Chief Administrative Officer, JPMorgan Funds (2004-2010), Treasurer, JPMorgan Funds (2003-2004, 2008-2010), and Vice President and Board Liaison, JPMorgan Funds (2001-2004); Managing Director, J.P. Morgan Investment Management Inc. (2001-2013); Vice President of Finance, Pierpont Group (1996-2001); Vice President, Bank of New York (1995-1996); Senior Audit Manager, Price Waterhouse, LLP (1982-1995). | | | 91 | | | None. | |
Michael E. Nugent (80)
522 Fifth Avenue
New York, NY 10036 | | Chair of the Board and Director | | Chair of the Boards since July 2006 and Director since July 1991 | | Chair of the Boards of various Morgan Stanley Funds (since July 2006); Chairperson of the Closed-End Fund Committee (since June 2012) and Director or Trustee of various Morgan Stanley Funds (since July 1991); formerly, Chairperson of the Insurance Committee (until July 2006); General Partner, Triumph Capital, L.P. (private investment partnership) (1988-2013). | | | 92 | | | None. | |
W. Allen Reed (69)
c/o Perkins Coie LLP
Counsel to the Independent Directors
30 Rockefeller Plaza
New York, NY 10112 | | Director | | Since August 2006 | | Chairperson of the Equity Sub-Committee of the Investment Committee (since October 2006) and Director or Trustee of various Morgan Stanley Funds (since August 2006); formerly, President and CEO of General Motors Asset Management; Chairman and Chief Executive Officer of the GM Trust Bank and Corporate Vice President of General Motors Corporation (August 1994-December 2005). | | | 91 | | | Director of Legg Mason, Inc.; formerly, Director of the Auburn University | |
Fergus Reid (84)
c/o Joe Pietryka, Inc.
85 Charles Colman Blvd.
Pawling, NY 12564 | | Director | | Since June 1992 | | Chairman, Joe Pietryka, Inc.; Chairperson of the Governance Committee and Director or Trustee of various Morgan Stanley Funds (since June 1992). | | | 92 | | | Formerly, Trustee and Director of certain investment companies in the JP Morgan Fund Complex managed by JP Morgan Investment Management Inc. (1987-2012). | |
* This is the earliest date the Director began serving the Morgan Stanley Funds. Each Director serves an indefinite term, until his or her successor is elected.
** The Fund Complex includes (as of December 31, 2016) all open-end and closed-end funds (including all of their portfolios) advised by Morgan Stanley Investment Management Inc. (the "Adviser") and any funds that have an adviser that is an affiliated person of the Adviser (including, but not limited to, Morgan Stanley AIP GP LP).
*** This includes any directorships at public companies and registered investment companies held by the Director at any time during the past five years.
29
Morgan Stanley Institutional Fund, Inc.
Annual Report — December 31, 2016
Director and Officer Information (unaudited) (cont'd)
Executive Officers:
Name, Age and Address of Executive Officer | | Position(s) Held
with
Registrant | | Length of
Time Served* | | Principal Occupation(s) During Past 5 Years | |
John H. Gernon (53)
522 Fifth Avenue
New York, NY 10036 | | President and
Principal
Executive
Officer | | Since
September
2013 | | President and Principal Executive Officer of the Equity and Fixed Income Funds and the Morgan Stanley AIP Funds (since September 2013) and the Liquidity Funds and various money market funds (since May 2014) in the Fund Complex; Managing Director of the Adviser; Head of Product (since 2006). | |
Timothy J. Knierim (58)
522 Fifth Avenue
New York, NY 10036 | | Chief
Compliance
Officer | | Since
December
2016 | | Managing Director of the Adviser and various entities affiliated with the Adviser; Chief Compliance Officer of various Morgan Stanley Funds and the Adviser (since December 2016) and Chief Compliance Officer of Morgan Stanley AIP GP LP (since 2014). Formerly, Managing Director and Deputy Chief Compliance Officer of the Adviser (2014-2016); and formerly, Chief Compliance Officer of Prudential Investment Management, Inc. (2007-2014). | |
Francis J. Smith (51)
522 Fifth Avenue
New York, NY 10036 | | Treasurer and
Principal
Financial
Officer | | Treasurer
since July
2003 and
Principal
Financial
Officer since
September
2002 | | Managing Director of the Adviser and various entities affiliated with the Adviser; Treasurer (since July 2003) and Principal Financial Officer of various Morgan Stanley Funds (since September 2002). | |
Mary E. Mullin (49)
522 Fifth Avenue
New York, NY 10036 | | Secretary | | Since
June
1999 | | Executive Director of the Adviser; Secretary of various Morgan Stanley Funds (since June 1999). | |
* This is the earliest date the officer began serving the Morgan Stanley Funds. Each officer serves a one-year term, until his or her successor is elected and qualifies.
30
Morgan Stanley Institutional Fund, Inc.
Annual Report — December 31, 2016
Adviser and Administrator
Morgan Stanley Investment Management Inc.
522 Fifth Avenue
New York, New York 10036
Distributor
Morgan Stanley Distribution, Inc.
522 Fifth Avenue
New York, New York 10036
Dividend Disbursing and Transfer Agent
Boston Financial Data Services, Inc.
2000 Crown Colony Drive
Quincy, Massachusetts 02169
Custodian
State Street Bank and Trust Company
One Lincoln Street
Boston, Massachusetts 02111
Legal Counsel
Dechert LLP
1095 Avenue of the Americas
New York, New York 10036
Counsel to the Independent Directors
Perkins Coie LLP
30 Rockefeller Plaza
New York, New York 10112
Independent Registered Public Accounting Firm
Ernst & Young LLP
200 Clarendon Street
Boston, Massachusetts 02116
Reporting to Shareholders
Each Morgan Stanley fund provides a complete schedule of portfolio holdings in its semi-annual and annual reports within 60 days of the end of the fund's second and fourth fiscal quarters. The semi-annual and annual reports are filed electronically with the Securities and Exchange Commission (SEC) on Form N-CSRS and Form N-CSR, respectively. Morgan Stanley also delivers the semi-annual and annual reports to fund shareholders and makes these reports available on its public website, www.morganstanley.com/im. Each Morgan Stanley fund also files a complete schedule of portfolio holdings with the SEC for the fund's first and third fiscal quarters on Form N-Q. Morgan Stanley does not deliver the reports for the first and third fiscal quarters to shareholders, nor are the reports posted to the Morgan Stanley public website. You may, however, obtain the Form N-Q filings (as well as the Form N-CSR and N-CSRS filings) by accessing the SEC's website, www.sec.gov. You may also review and copy them at the SEC's Public Reference Room in Washington, DC. Information on the operation of the SEC's Public Reference Room may be obtained by calling the SEC toll free at 1 (800) SEC-0330. You can also request copies of these materials, upon payment of a duplicating fee, by electronic request at the SEC's email address (publicinfo@sec.gov) or by writing the Public Reference Room of the SEC, 100 F Street, NE, Washington, DC 20549-0102.
Proxy Voting Policies and Procedures and Proxy Voting Record
You may obtain a copy of the Fund's Proxy Voting Policy and Procedures and information regarding how the Fund voted proxies relating to portfolio securities during the most recent twelve-month period ended June 30, without charge, upon request, by calling toll free 1 (800) 548-7786 or by visiting our website at www.morganstanley.com/im. This information is also available on the SEC's website at www.sec.gov.
This report is authorized for distribution only when preceded or accompanied by a prospectus or summary prospectus of the applicable Portfolio of Morgan Stanley Institutional Fund, Inc., which describes in detail the Portfolio's investment policies, risks, fees and expenses. Please read the prospectus carefully before you invest or send money. For additional information, including information regarding the investments comprising the Portfolio, please visit our website at www.morganstanley.com/im or call toll free 1 (800) 548-7786.
31
(This Page has been left blank intentionally.)
(This Page has been left blank intentionally.)
Printed in U.S.A.
This Report has been prepared for shareholders and may be distributed to others only if preceded or accompanied by a current prospectus.
Morgan Stanley Investment Management Inc.
522 Fifth Avenue
New York, New York 10036
© 2017 Morgan Stanley. Morgan Stanley Distribution, Inc.

IFIEMBONANN
1697170 EXP. 02.28.18

Morgan Stanley Institutional Fund, Inc.
Emerging Markets Fixed Income Opportunities Portfolio
Annual Report
December 31, 2016

Morgan Stanley Institutional Fund, Inc.
Annual Report — December 31, 2016
Shareholders' Letter | | | 2 | | |
Expense Example | | | 3 | | |
Investment Overview | | | 4 | | |
Portfolio of Investments | | | 8 | | |
Statement of Assets and Liabilities | | | 13 | | |
Statement of Operations | | | 15 | | |
Statements of Changes in Net Assets | | | 16 | | |
Financial Highlights | | | 18 | | |
Notes to Financial Statements | | | 23 | | |
Report of Independent Registered Public Accounting Firm | | | 33 | | |
Privacy Notice | | | 34 | | |
Director and Officer Information | | | 37 | | |
This report is authorized for distribution only when preceded or accompanied by a prospectus or summary prospectus of the applicable Portfolio of Morgan Stanley Institutional Fund, Inc. To receive a prospectus and/or statement of additional information (SAI), which contains more complete information such as investment objectives, charges, expenses, policies for voting proxies, risk considerations, and describes in detail each of the Portfolio's investment policies to the prospective investor, please call toll free 1 (800) 548-7786. Please read the prospectuses carefully before you invest or send money.
Additionally, you can access information about the Portfolio, including performance, characteristics, and investment team commentary, through Morgan Stanley Investment Management's website: www.morganstanley.com/im.
Market forecasts provided in this report may not necessarily come to pass. There is no guarantee that any sectors mentioned will continue to perform as discussed herein or that securities in such sectors will be held by the Portfolio in the future. There is no assurance that a Portfolio will achieve its investment objective. Portfolios are subject to market risk, which is the possibility that market values of securities owned by the Portfolio will decline and, therefore, the value of the Portfolio's shares may be less than what you paid for them. Accordingly, you can lose money investing in this Portfolio. Please see the prospectus for more complete information on investment risks.
1
Morgan Stanley Institutional Fund, Inc.
Annual Report — December 31, 2016
Shareholders' Letter (unaudited)
Dear Shareholders,
We are pleased to provide this Annual report, in which you will learn how your investment in Emerging Markets Fixed Income Opportunities Portfolio (the "Portfolio") performed during the latest twelve-month period.
Morgan Stanley Investment Management is a client-centric, investor-led organization. Our global presence, intellectual capital, and breadth of products and services enable us to partner with investors to meet the evolving challenges of today's financial markets. We aim to deliver superior investment service and to empower our clients to make the informed decisions that help them reach their investment goals.
As always, we thank you for selecting Morgan Stanley Investment Management, and look forward to working with you in the months and years ahead.
Sincerely,

John H. Gernon
President and Principal Executive Officer
January 2017
2
Morgan Stanley Institutional Fund, Inc.
Annual Report — December 31, 2016
Expense Example (unaudited)
Emerging Markets Fixed Income Opportunities Portfolio
As a shareholder of the Portfolio, you incur two types of costs: (1) transactional costs, including redemption fees; and (2) ongoing costs, which may include advisory fees, administration fees, distribution and shareholder services fees and other Portfolio expenses. This example is intended to help you understand your ongoing costs (in dollars) of investing in the Portfolio and to compare these costs with the ongoing costs of investing in other mutual funds.
This example is based on an investment of $1,000 invested at the beginning of the six-month period ended December 31, 2016 and held for the entire six-month period.
Actual Expenses
The table below provides information about actual account values and actual expenses. You may use the information in this table, together with the amount you invested, to estimate the expenses that you paid over the period. Simply divide your account value by $1,000 (for example, an $8,600 account value divided by $1,000 = 8.6), then multiply the result by the number in the table under the heading entitled "Actual Expenses Paid During Period" to estimate the expenses you paid on your account during this period.
Hypothetical Example for Comparison Purposes
The table below provides information about hypothetical account values and hypothetical expenses based on the Portfolio's actual expense ratio and an assumed rate of return of 5% per year before expenses, which is not the Portfolio's actual return. The hypothetical account values and expenses may not be used to estimate the actual ending account balance or expenses you paid for the period. You may use this information to compare the ongoing costs of investing in the Portfolio and other funds. To do so, compare this 5% hypothetical example with the 5% hypothetical examples that appear in the shareholder reports of the other funds.
Please note that the expenses shown in the table are meant to highlight your ongoing costs only and do not reflect any transactional costs, such as sales charges (loads) and redemption fees. Therefore, the information for each class in the table is useful in comparing ongoing costs only, and will not help you determine the relative total costs of owning different funds. In addition, if these transactional costs were included, your costs would have been higher.
| | | Beginning
Account
Value
7/1/16 | | Actual Ending
Account
Value
12/31/16 | | Hypothetical
Ending Account
Value | | Actual
Expenses
Paid
During
Period* | | Hypothetical
Expenses Paid
During Period* | | Net
Expense
Ratio
During
Period** | |
Emerging Markets Fixed Income Opportunities
Portfolio Class I | | $ | 1,000.00 | | | $ | 1,012.40 | | | $ | 1,020.91 | | | $ | 4.25 | | | $ | 4.27 | | | | 0.84 | %*** | |
Emerging Markets Fixed Income Opportunities
Portfolio Class A | | | 1,000.00 | | | | 1,010.70 | | | | 1,020.21 | | | | 4.95 | | | | 4.98 | | | | 0.98 | *** | |
Emerging Markets Fixed Income Opportunities
Portfolio Class L | | | 1,000.00 | | | | 1,008.90 | | | | 1,017.85 | | | | 7.32 | | | | 7.35 | | | | 1.45 | *** | |
Emerging Markets Fixed Income Opportunities
Portfolio Class C | | | 1,000.00 | | | | 1,006.20 | | | | 1,015.33 | | | | 9.83 | | | | 9.88 | | | | 1.95 | *** | |
Emerging Markets Fixed Income Opportunities
Portfolio Class IS | | | 1,000.00 | | | | 1,011.40 | | | | 1,021.01 | | | | 4.15 | | | | 4.17 | | | | 0.82 | *** | |
* Expenses are calculated using each Portfolio Class' annualized net expense ratio (as disclosed), multiplied by the average account value over the period, and multiplied by 184/366 (to reflect the most recent one-half year period).
** Annualized.
*** Refer to Note F in the Notes to Financial Statements for discussion of prior period custodian out-of-pocket expenses that were reimbursed in the current period.
3
Morgan Stanley Institutional Fund, Inc.
Annual Report — December 31, 2016
Investment Overview (unaudited)
Emerging Markets Fixed Income Opportunities Portfolio
The Portfolio seeks high total return by investing at least 80% of its assets in debt securities of issuers located in emerging market countries, which may include U.S. dollar-denominated, local currency, and corporate debt securities.
Performance
For the year ended December 31, 2016, the Portfolio's Class I shares had a total return based on net asset value and reinvestment of distributions per share of 12.80%, net of fees. The Portfolio's Class I shares outperformed the Portfolio's benchmark, the Emerging Markets Fixed Income Blend Index which reflects the performance of the J.P. Morgan Emerging Markets Bond Global Index from the Portfolio's inception to September 25, 2015 and the performance of the Blended Index which is composed of one-third J.P. Morgan EMBI Global Bond Index, one-third J.P. Morgan GBI-EM Diversified Bond Index and one-third J.P. Morgan CEMBI Broad Diversified Index for the periods thereafter, returned 10.06%.
Factors Affecting Performance
• Emerging market ("EM") fixed income debt returned 10.06% in 2016, as measured by the Index. Lower-rated, higher-yielding bonds, particularly those of energy exporters, outperformed investment grade bonds, which were weighed down by rising U.S. Treasury yields. EM dollar-denominated sovereign and quasi-sovereign debt led the market, followed by EM domestic debt, and EM dollar-denominated corporate debt. EM currencies appreciated 0.59% versus the U.S. dollar, while domestic bonds returned 9.35% in local terms (as measured by the J.P. Morgan GBI-EM Diversified Bond Index).(i)
• Commodity-related credits such as Zambia, Venezuela, Ecuador, Ghana, and Iraq, outperformed as Brent oil prices rose +56% in the year.(ii) Bonds from Brazil, South Africa, Russia, Azerbaijan, and Colombia also outperformed the broader market. Bonds from Belize, Mozambique, Turkey, Poland, Mexico, and Malaysia lagged over the year. Bonds from Belize especially suffered after the country missed an interest payment and defaulted on $544 million worth of bonds in late September 2016.
• EM fixed income assets traveled a bumpy road to reach high single-digit to low double-digit returns for the year. Markets found their footing after a shaky start, which was fueled by concerns over capital flight from China and continued weakness in global growth and commodity prices. Sentiment improved heading into February 2016 as a rebound was built on a mixture of attractive valuations and investor positioning, combined with strengthening commodity prices, an improving EM growth profile, an easing of China fears, as well as a weakening of the U.S. dollar and generally accommodative central bank policies. Investment flows into the asset class were driven by both pull factors, such as political and economic improvement within EM countries, as well as push factors, such as attractive relative valuations and investors fleeing the negative real yields offered by many global government bonds. These flows contributed to the favorable backdrop that provided an entry for new and returning issuers, including Saudi Arabia, Oman, and Argentina. The rise in developed market populism generated ballot surprises with Britain's populace voting for a Brexit (referendum vote to leave the European Union) and the U.S. presidential victory of Donald Trump. While the market reaction to Brexit turned out to be much ado about nothing, Trump's win triggered a rotation from bonds to equities and from emerging to U.S. markets, as the market became excited about the potential for stimulative policies and resulting higher growth and inflation. The populist surge in the U.S. and Western Europe was, for the most part, not mirrored in emerging markets, which benefited from reform-minded leaders in India, Indonesia, Argentina, and Brazil. Assets from these reform story countries, as well as those from energy-exporting nations, led the rally for EM fixed income in 2016.
• There was a changing of the guard in many EM countries as the Philippines elected outspoken President Rodrigo Duterte, President Dilma Rousseff of Brazil was impeached and Vice President Michel Temer took the helm, Thailand's ruler of 70 years, King Bhumibol, passed away, and South Korea's President Park Geun-hye was impeached. EM credit ratings were under pressure during the year. Initially, energy-related countries
(i) Source: JP Morgan
(ii) Source: Bloomberg L.P.
4
Morgan Stanley Institutional Fund, Inc.
Annual Report — December 31, 2016
Investment Overview (unaudited) (cont'd)
Emerging Markets Fixed Income Opportunities Portfolio
and companies sustained a round of downgrades as agencies adjusted their ratings to reflect the new revenue outlook, before attention was turned to politically-driven issues in Brazil, Turkey and South Africa. Brazil completed its seven-year ratings roundtrip after Moody's stripped the country of its final investment grade rating, amid the far-reaching corruption investigation, Lava Jato, which resulted in the impeachment of President Dilma Rousseff and the elevation of Vice President Michel Temer to Acting President. Following an unsuccessful coup attempt, Turkey's weakened institutional strength, coupled with sluggish economic growth and external funding requirements, contributed to the loss of its investment grade rating. In contrast, South Africa maintained its investment grade status despite political infighting involving President Jacob Zuma. In more positive news, Hungary's foreign currency credit rating was upgraded to investment grade on the back of stronger-than-expected economic performance and fiscal rectitude, which reduced external vulnerabilities. In Colombia, the government ratified a peace deal with Revolutionary Armed Forces of Colombia, or FARC, rebels, which ended the 52-year civil war and provided President Santos the political capital necessary to enact fiscal reforms to solidify Colombia's investment grade credit rating.
• After a bearish year in 2015, commodity-related investments led the rally in 2016 as commodity prices bounced back from the lows touched in February 2016. Despite the strong rally in commodity prices ranging from oil and coal to copper and iron ore, the repercussions of overall lower commodity-related revenues continued to reverberate through emerging markets. Energy exporters enacted fiscal adjustments and issued bonds to fund deficits, while importers, and EM economies more broadly, benefited from disinflationary pressures, which allowed them to reduce subsidies and strengthen their fiscal positions.
• For the year 2016, positioning across domestic, external, and corporate investments in Brazil, Argentina, Colombia, and Russia contributed the most to performance, as did domestic and corporate investments in Indonesia. Also contributing were domestic and external investments in South Africa,
external investments in Venezuela, Dominican Republic, Ecuador, Ukraine, Zambia, and Cote D'Ivoire, as well as corporate investments in Kazakhstan, the Philippines, India, Chile, Nigeria, and Jamaica.
• Conversely, domestic debt holdings in Poland, Turkey, and Mexico detracted from performance over the period. The use of German bund futures, to manage interest rate duration, as well as euro currency forwards, also detracted from performance in the year.
Management Strategies
• After the U.S. elections, global fixed income markets are pricing in a significant relaxation in U.S. fiscal policy that may boost economic growth, strengthen the U.S. dollar and, as a result, supercharge the developed market ("DM") yield curve steepening trend that was already underway pre-election. While it is still too early to know the exact contours of the next U.S. administration's fiscal, trade and immigration policies, the market hasn't waited to re-price not only the global fixed income outlook, but also the outlook for EM countries likely to be the most affected, such as Mexico, with the impact on China still a question mark.
• For global growth, the beneficial impact of higher U.S. growth is likely to be offset partly by the extent of the new president's potentially protectionist trade agenda. The net effect won't be known for a while, but Mexico and China will remain a key focus, with joint cooperation between the new president and the more traditional trade-friendly wing of the Republican Party potentially reducing the impact, especially if stronger U.S. economic growth becomes a more important goal than fulfilling populist campaign promises that risk damaging the U.S. economic outlook. We still expect the EM/DM growth differential to recover during 2017 in favor of EM as the negative growth impacts from Brazil and Russia lessen. China's growth slowdown is likely to continue in the medium term, with short-term growth prospects reliant on continued fiscal and monetary policy support. Recent data out of China has been suggesting resilience, but we believe we could see growth slowdown again at the end of the first quarter or in the second quarter of
5
Morgan Stanley Institutional Fund, Inc.
Annual Report — December 31, 2016
Investment Overview (unaudited) (cont'd)
Emerging Markets Fixed Income Opportunities Portfolio
2017. However, we continue to believe that China has ample policy buffers in 2017 to offset a too rapid deceleration in economic growth.
• On Mexico, post the U.S. elections, we note that the Mexican peso is now the most undervalued currency in emerging markets and is pricing in a fairly severe slowdown in Mexican growth and worsening in the funding of the current account deficit. On the rates side, the central bank ("Banxico") has clearly signaled it doesn't want to overreact with tightening and after its prudent 50 basis point (bps) hike mid-November and 50 bps hike following the U.S. Federal Reserve hike in December. We think Banxico will largely follow the U.S. Fed, unless there is another round of severe market pressure on Mexico.
• We expect historically low developed market yields to still support the selective carry opportunities and spreads as we expect an ongoing "push" factor of inflows into higher-yielding assets, including select EM fixed income. Given that the "Trump Tantrum" is not EM-specific, we believe that the various factors both pushing and pulling investors into EM fixed income remain in place: developed market yields remain very low, EM economic data appear to have stabilized, fears of multiple Fed rate hikes have subsided (although two interest rate hikes next year are more likely than one) and concerns of a sharp slowdown in China have diminished. We believe that EM assets could well absorb Fed rate hikes in 2017 if driven by increasing U.S. growth and not inflation; however, assets remain vulnerable to spikes in U.S. policy uncertainty.

* Minimum Investment for Class I shares
** Commenced Operations on May 24, 2012.
In accordance with SEC regulations, the Portfolio's performance shown assumes that all recurring fees (including management fees) were deducted and all dividends and distributions were reinvested. The performance of Class A, L, C and IS shares will vary from the performance of Class I shares based upon their different inception dates and will be impacted by additional fees assessed to those classes (if applicable).
6
Morgan Stanley Institutional Fund, Inc.
Annual Report — December 31, 2016
Investment Overview (unaudited) (cont'd)
Emerging Markets Fixed Income Opportunities Portfolio
Performance Compared to the J.P. Morgan Emerging Markets Bond Global Index(1), the J.P. Morgan GBI-EM Global Diversified Index(2), the J.P. Morgan CEMBI Broad Diversified Index(3), the Emerging Markets Fixed Income Blend Index(4) and the Lipper Emerging Markets Hard Currency Debt Funds Index(5)
| | | Period Ended December 31, 2016
Total Returns(6) | |
| | | | | Average Annual | |
| | | One
Year | | Five
Years | | Ten
Years | | Since
Inception(10) | |
Portfolio — Class I Shares
w/o sales charges(7) | | | 12.80 | % | | | — | | | | — | | | | 4.02 | % | |
Portfolio — Class A Shares
w/o sales charges(7) | | | 12.53 | | | | — | | | | — | | | | 3.69 | | |
Portfolio — Class A Shares with
maximum 4.25% sales charges(7) | | | 7.72 | | | | — | | | | — | | | | 2.73 | | |
Portfolio — Class L Shares
w/o sales charges(7) | | | 12.15 | | | | — | | | | — | | | | 3.36 | | |
Portfolio — Class C Shares
w/o sales charges(9) | | | 11.60 | | | | — | | | | — | | | | 2.29 | | |
Portfolio — Class C Shares with
maximum 1.00% deferred
sales charges(9) | | | 10.60 | | | | — | | | | — | | | | 2.29 | | |
Portfolio — Class IS Shares
w/o sales charges(8) | | | 12.81 | | | | — | | | | — | | | | 4.79 | | |
J.P. Morgan Emerging Markets
Bond Global Index | | | 10.19 | | | | — | | | | — | | | | 5.03 | | |
J.P. Morgan GBI-EM Global
Diversified Index | | | 9.94 | | | | — | | | | — | | | | –2.03 | | |
J.P. Morgan CEMBI Broad
Diversified Index | | | 9.65 | | | | — | | | | — | | | | 5.37 | | |
Emerging Markets Fixed Income
Blend Index | | | 10.06 | | | | — | | | | — | | | | 4.83 | | |
Lipper Emerging Market
Hard Currency Debt Funds Index | | | 12.25 | | | | — | | | | — | | | | 3.90 | | |
Performance data quoted represents past performance, which is no guarantee of future results, and current performance may be lower or higher than the figures shown. Performance assumes that all dividends and distributions, if any, were reinvested. For the most recent month-end performance figures, please visit www.morganstanley.com/im. Investment return and principal value will fluctuate so that Portfolio shares, when redeemed, may be worth more or less than their original cost. Total returns do not reflect the deduction of taxes that a shareholder would pay on Portfolio distributions or the redemption of Portfolio shares. Performance of share classes will vary due to difference in expenses.
(1) The J.P. Morgan Emerging Markets Bond Global Index tracks total returns for U.S. dollar-denominated debt instruments issued by emerging markets sovereign and quasi-sovereign entities: Brady Bonds, loans, Eurobonds and local market instruments for emerging market countries. The Index is unmanaged and its returns do not include any sales charges or fees. Such costs would lower performance. It is not possible to invest directly in an index.
(2) The J.P. Morgan Government Bond Index-Emerging Markets Global Diversified Index (GBI-EM Global Diversified Index) tracks local currency government bonds issued by emerging markets. The Index is unmanaged and its returns do not include any sales charges or fees. Such costs would lower performance. It is not possible to invest directly in an index.
(3) The J.P. Morgan Corporate Emerging Markets Bond Index Broad Diversified (CEMBI Broad Diversified Index) which tracks performance of corporate issued debt instruments issued by emerging markets. The Index is unmanaged and its returns do not include any sales charges or fees. Such costs would lower performance. It is not possible to invest directly in an index.
(4) The Emerging Markets Fixed Income Blend Index is a performance linked benchmark of the old and new benchmark of the Portfolio, the old represented by J.P. Morgan Emerging Markets Bond Global Index for period from the Portfolio's inception to September 25, 2015 and the new Blended Index which consists of 1/3 J.P. Morgan EMBI Global Index, 1/3 J.P. Morgan GBI-EM Global Diversified Index, 1/3 J.P. Morgan CEMBI Broad Diversified Index for periods thereafter. It is not possible to invest directly in an index. Following close of business on September 25, 2015, Morgan Stanley Institutional Fund, Inc. Emerging Markets Domestic Debt Portfolio merged into Morgan Stanley Institutional Fund, Inc. Emerging Markets External Debt Portfolio. In conjunction with the Reorganization, the Portfolio was renamed Morgan Stanley Institutional Fund Inc. Emerging Markets Fixed Income Opportunities Portfolio and changed its principal investment policy. In addition, the Portfolio's benchmark was changed to the Blended Index.The Index is unmanaged and its returns do not include any sales charges or fees. Such costs would lower performance. It is not possible to invest directly in an index.
(5) The Lipper Emerging Market Hard Currency Debt Funds Index is an equally weighted performance index of the largest qualifying funds (based on net assets) in the Lipper Emerging Market Hard Currency Debt Funds classification. The Index, which is adjusted for capital gains distributions and income dividends, is unmanaged and should not be considered an investment. There are currently 30 funds represented in this Index. As of the date of this report, the Portfolio is in the Lipper Emerging Market Hard Currency Debt Funds classification.
(6) Total returns for the Portfolio reflect fees waived and expenses reimbursed, if applicable, by the Adviser. Without such waivers and reimbursements, total returns would have been lower.
(7) Commenced operations on May 24, 2012.
(8) Commenced offering on September 13, 2013.
(9) Commenced offering on April 30, 2015.
(10) For comparative purposes, average annual since inception returns listed for the Indexes refer to the inception date of Class I of the Portfolio, not the inception of the Index.
7
Morgan Stanley Institutional Fund, Inc.
Annual Report — December 31, 2016
Portfolio of Investments
Emerging Markets Fixed Income Opportunities Portfolio
| | | Face
Amount
(000) | | Value
(000) | |
Fixed Income Securities (93.5%) | |
Argentina (8.3%) | |
Corporate Bonds (5.8%) | |
Cia General de Combustibles SA, | |
9.50%, 11/7/21 (a) | | $ | 260 | | | $ | 263 | | |
IRSA Propiedades Comerciales SA, | |
8.75%, 3/23/23 (a) | | | 350 | | | | 371 | | |
Province of Santa Fe, | |
6.90%, 11/1/27 (a) | | | 150 | | | | 141 | | |
Provincia del Chaco Argentina, | |
9.38%, 8/18/24 (a) | | | 240 | | | | 224 | | |
YPF SA, | |
8.88%, 12/19/18 | | | 310 | | | | 338 | | |
| | | | 1,337 | | |
Sovereign (2.5%) | |
Argentina Bonar Bonds, | |
24.26%, 10/9/17 (b) | | ARS | 1,440 | | | | 91 | | |
Argentina Treasury Bond, | |
2.25%, 4/28/20 | | | 3,275 | | | | 217 | | |
Argentine Republic Government
International Bond, | |
6.88%, 4/22/21 (a) | | $ | 260 | | | | 278 | | |
| | | | 586 | | |
| | | | 1,923 | | |
Brazil (9.6%) | |
Corporate Bonds (5.3%) | |
| BRF GmbH, | |
4.35%, 9/29/26 (a) | | | 240 | | | | 223 | | |
Cosan Luxembourg SA, | |
7.00%, 1/20/27 (a) | | | 240 | | | | 241 | | |
Petrobras Global Finance BV, | |
8.38%, 5/23/21 | | | 430 | | | | 464 | | |
QGOG Constellation SA, | |
6.25%, 11/9/19 | | | 440 | | | | 292 | | |
| | | | 1,220 | | |
Sovereign (4.3%) | |
Brazil Notas do Tesouro Nacional, Series F, | |
10.00%, 1/1/21 | | BRL | 3,470 | | | | 977 | | |
| | | | 2,197 | | |
Chile (0.9%) | |
Corporate Bond (0.9%) | |
Cencosud SA,
4.88%, 1/20/23 | | $ | 200 | | | | 206 | | |
Colombia (6.3%) | |
Corporate Bond (2.1%) | |
Millicom International Cellular SA, | |
6.00%, 3/15/25 | | | 485 | | | | 478 | | |
Sovereign (4.2%) | |
Colombia Government International Bond, | |
4.38%, 3/21/23 | | COP | 254,000 | | | | 74 | | |
5.00%, 6/15/45 | | $ | 266 | | | | 254 | | |
11.75%, 2/25/20 | | | 116 | | | | 148 | | |
| | | Face
Amount
(000) | | Value
(000) | |
Colombian TES, | |
7.75%, 9/18/30 | | COP | 230,000 | | | $ | 80 | | |
10.00%, 7/24/24 | | | 847,300 | | | | 334 | | |
11.00%, 7/24/20 | | | 210,000 | | | | 80 | | |
| | | | 970 | | |
| | | | 1,448 | | |
Dominican Republic (1.4%) | |
Corporate Bond (0.9%) | |
AES Andres BV/Dominican Power
Partners/Empresa Generadora
de Electricidad It, (Units)
7.95%, 5/11/26 (a)(c) | | $ | 200 | | | | 207 | | |
Sovereign (0.5%) | |
Dominican Republic International Bond, | |
6.88%, 1/29/26 (a) | | | 100 | | | | 104 | | |
| | | | 311 | | |
Ecuador (2.1%) | |
Sovereign (2.1%) | |
Ecuador Government International Bond, | |
10.75%, 3/28/22 (a) | | | 440 | | | | 478 | | |
Ghana (1.0%) | |
Sovereign (1.0%) | |
Ghana Government International Bond, | |
10.75%, 10/14/30 | | | 200 | | | | 238 | | |
Guatemala (0.8%) | |
Sovereign (0.8%) | |
Guatemala Government Bond, | |
4.50%, 5/3/26 (a) | | | 200 | | | | 193 | | |
Hungary (2.2%) | |
Sovereign (2.2%) | |
Hungary Government Bond, | |
3.00%, 6/26/24 | | HUF | 101,670 | | | | 354 | | |
5.50%, 6/24/25 | | | 38,970 | | | | 159 | | |
| | | | 513 | | |
India (2.0%) | |
Corporate Bonds (2.0%) | |
Greenko Dutch BV, | |
8.00%, 8/1/19 | | $ | 250 | | | | 264 | | |
Greenko Investment Co., | |
4.88%, 8/16/23 (a) | | | 200 | | | | 190 | | |
| | | | 454 | | |
Indonesia (8.0%) | |
Corporate Bonds (4.3%) | |
Jababeka International BV, | |
6.50%, 10/5/23 (a) | | | 260 | | | | 255 | | |
MPM Global Pte Ltd., | |
6.75%, 9/19/19 | | | 450 | | | | 463 | | |
Pakuwon Prima Pte Ltd., | |
7.13%, 7/2/19 | | | 250 | | | | 263 | | |
| | | | 981 | | |
The accompanying notes are an integral part of the financial statements.
8
Morgan Stanley Institutional Fund, Inc.
Annual Report — December 31, 2016
Portfolio of Investments (cont'd)
Emerging Markets Fixed Income Opportunities Portfolio
| | | Face
Amount
(000) | | Value
(000) | |
Sovereign (3.7%) | |
Indonesia Treasury Bond, | |
8.75%, 5/15/31 | | IDR | 1,310,000 | | | $ | 101 | | |
9.00%, 3/15/29 | | | 9,590,000 | | | | 753 | | |
| | | | 854 | | |
| | | | 1,835 | | |
Ivory Coast (1.9%) | |
Sovereign (1.9%) | |
Ivory Coast Government International Bond, | |
5.38%, 7/23/24 (a) | | $ | 200 | | | | 193 | | |
5.75%, 12/31/32 | | | 269 | | | | 250 | | |
| | | | 443 | | |
Jamaica (2.2%) | |
Corporate Bond (1.7%) | |
Digicel Group Ltd., | |
8.25%, 9/30/20 | | | 460 | | | | 397 | | |
Sovereign (0.5%) | |
Jamaica Government International Bond, | |
8.00%, 3/15/39 | | | 100 | | | | 112 | | |
| | | | 509 | | |
Kazakhstan (1.5%) | |
Corporate Bond (1.5%) | |
Zhaikmunai LLP, | |
7.13%, 11/13/19 | | | 350 | | | | 343 | | |
Malaysia (2.1%) | |
Sovereign (2.1%) | |
Malaysia Government Bond, | |
3.66%, 10/15/20 | | MYR | 137 | | | | 31 | | |
3.96%, 9/15/25 | | | 1,489 | | | | 322 | | |
4.16%, 7/15/21 | | | 215 | | | | 49 | | |
4.18%, 7/15/24 | | | 124 | | | | 27 | | |
4.50%, 4/15/30 | | | 249 | | | | 54 | | |
| | | | 483 | | |
Mexico (8.0%) | |
Sovereign (8.0%) | |
Comision Federal de Electricidad, | |
4.75%, 2/23/27 (a) | | $ | 200 | | | | 192 | | |
Mexican Bonos, | |
6.50%, 6/10/21 | | MXN | 12,590 | | | | 593 | | |
7.75%, 5/29/31 | | | 765 | | | | 37 | | |
10.00%, 12/5/24 | | | 1,388 | | | | 78 | | |
Series M | |
8.00%, 6/11/20 | | | 5,600 | | | | 278 | | |
Mexico City Airport Trust, | |
5.50%, 10/31/46 (a) | | $ | 200 | | | | 180 | | |
Petroleos Mexicanos, | |
3.50%, 1/30/23 | | | 79 | | | | 73 | | |
6.50%, 3/13/27 (a) | | | 130 | | | | 134 | | |
6.88%, 8/4/26 (a) | | | 260 | | | | 275 | | |
| | | 1,840 | | |
| | | Face
Amount
(000) | | Value
(000) | |
Mongolia (1.8%) | |
Sovereign (1.8%) | |
Mongolia Government International Bond, | |
10.88%, 4/6/21 | | $ | 400 | | | $ | 422 | | |
Namibia (1.0%) | |
Sovereign (1.0%) | |
Namibia International Bond, | |
5.25%, 10/29/25 (a) | | | 232 | | | | 228 | | |
Nigeria (2.7%) | |
Corporate Bond (1.9%) | |
Zenith Bank PLC, | |
6.25%, 4/22/19 | | | 440 | | | | 430 | | |
Sovereign (0.8%) | |
Nigeria Government International Bond, | |
6.38%, 7/12/23 | | | 200 | | | | 194 | | |
| | | | 624 | | |
Panama (0.9%) | |
Sovereign (0.9%) | |
Aeropuerto Internacional de Tocumen SA, | |
5.63%, 5/18/36 (a) | | | 200 | | | | 208 | | |
Peru (0.7%) | |
Sovereign (0.7%) | |
Peruvian Government International Bond, | |
(Units) | |
6.35%, 8/12/28 (a)(c) | | PEN | 130 | | | | 38 | | |
6.95%, 8/12/31 (c) | | | 380 | | | | 116 | | |
| | | | 154 | | |
Philippines (2.2%) | |
Corporate Bond (2.2%) | |
Petron Corp., | |
7.50%, 8/6/18 (b)(d) | | $ | 480 | | | | 503 | | |
Poland (3.8%) | |
Sovereign (3.8%) | |
Poland Government Bond, | |
3.25%, 7/25/25 | | PLN | 2,254 | | | | 529 | | |
4.00%, 10/25/23 | | | 915 | | | | 228 | | |
5.75%, 10/25/21 - 9/23/22 | | | 400 | | | | 108 | | |
| | | | 865 | | |
Romania (0.5%) | |
Sovereign (0.5%) | |
Romania Government Bond, | |
4.75%, 2/24/25 | | RON | 425 | | | | 107 | | |
5.85%, 4/26/23 | | | 50 | | | | 14 | | |
| | | | 121 | | |
Russia (6.0%) | |
Corporate Bond (1.2%) | |
GTH Finance BV, | |
7.25%, 4/26/23 (a) | | $ | 260 | | | | 280 | | |
The accompanying notes are an integral part of the financial statements.
9
Morgan Stanley Institutional Fund, Inc.
Annual Report — December 31, 2016
Portfolio of Investments (cont'd)
Emerging Markets Fixed Income Opportunities Portfolio
| | | Face
Amount
(000) | | Value
(000) | |
Sovereign (4.8%) | |
Russian Federal Bond — OFZ, | |
6.20%, 1/31/18 | | RUB | 5,172 | | | $ | 82 | | |
6.80%, 12/11/19 | | | 18,200 | | | | 287 | | |
7.00%, 8/16/23 | | | 3,397 | | | | 52 | | |
7.60%, 7/20/22 | | | 16,800 | | | | 268 | | |
Russian Foreign Bond — Eurobond, | |
4.50%, 4/4/22 | | $ | 400 | | | | 417 | | |
| | | | 1,106 | | |
| | | | 1,386 | | |
South Africa (3.4%) | |
Sovereign (3.4%) | |
South Africa Government Bond, | |
6.75%, 3/31/21 | | ZAR | 1,170 | | | | 81 | | |
8.00%, 1/31/30 | | | 9,841 | | | | 645 | | |
10.50%, 12/21/26 | | | 600 | | | | 48 | | |
| | | | 774 | | |
Thailand (2.0%) | |
Sovereign (2.0%) | |
Thailand Government Bond, | |
3.63%, 6/16/23 | | THB | 10,100 | | | | 301 | | |
4.88%, 6/22/29 | | | 4,500 | | | | 149 | | |
| | | | 450 | | |
Turkey (1.8%) | |
Sovereign (1.8%) | |
Turkey Government Bond, | |
7.10%, 3/8/23 | | TRY | 955 | | | | 223 | | |
8.00%, 3/12/25 | | | 503 | | | | 119 | | |
10.40%, 3/20/24 | | | 290 | | | | 80 | | |
| | | | 422 | | |
Ukraine (2.6%) | |
Sovereign (2.6%) | |
Ukraine Government International Bond, | |
7.75%, 9/1/22 - 9/1/26 | | $ | 640 | | | | 605 | | |
United Arab Emirates (2.1%) | |
Corporate Bond (2.1%) | |
MAF Global Securities Ltd., | |
7.13%, 10/29/18 (b)(d) | | | 450 | | | | 474 | | |
Venezuela (3.7%) | |
Sovereign (3.7%) | |
Petroleos de Venezuela SA, | |
6.00%, 11/15/26 | | | 2,222 | | | | 861 | | |
Total Fixed Income Securities (Cost $21,879) | | | 21,511 | | |
| | | No. of
Warrants | | | |
Warrant (0.0%) | |
Venezuela (0.0%) | |
Venezuela Government International
Bond, Oil-Linked Payment Obligation,
expires 4/15/20 (b)(e) (Cost $—) | | | 495 | | | | 2 | | |
| | | Shares | | Value
(000) | |
Short-Term Investments (4.9%) | |
Investment Company (4.9%) | |
United States (4.9%) | |
Morgan Stanley Institutional Liquidity
Funds — Treasury Securities Portfolio —
Institutional Class (See Note G)
(Cost $1,125) | | | 1,124,657 | | | $ | 1,125 | | |
| | | Face
Amount
(000) | | | |
Argentina (0.2%) | |
Sovereign (0.2%) | |
Letras del Banco Central de la
Republica Argentina, | |
28.25%, 1/11/17 | | ARS | 410 | | | | 26 | | |
29.50%, 1/11/17 | | | 410 | | | | 25 | | |
Total Sovereign (Cost $57) | | | 51 | | |
Total Short-Term Investments (Cost $1,182) | | | 1,176 | | |
Total Investments (98.6%) (Cost $23,061) (f)(g) | | | 22,689 | | |
Other Assets in Excess of Liabilities (1.4%) | | | 333 | | |
Net Assets (100.0%) | | $ | 23,022 | | |
Country assignments and aggregations are based generally on third party vendor classifications and information, and may be different from the assignments and aggregations under the policies set forth in the Portfolio's prospectus and/or statement of additional information relating to geographic classifications.
(a) 144A security — Certain conditions for public sale may exist. Unless otherwise noted, these securities are deemed to be liquid.
(b) Variable/Floating Rate Security — Interest rate changes on these instruments are based on changes in a designated base rate. The rates shown are those in effect on December 31, 2016.
(c) Consists of one or more classes of securities traded together as a unit.
(d) Perpetual — One or more securities do not have a predetermined maturity date. Rates for these securities are fixed for a period of time, after which they revert to a floating rate. Interest rates in effect are as of December 31, 2016.
(e) Security has been deemed illiquid at December 31, 2016.
(f) Securities are available for collateral in connection with open foreign currency forward exchange contracts and a futures contract.
(g) At December 31, 2016, the aggregate cost for federal income tax purposes is approximately $23,241,000. The aggregate gross unrealized appreciation is approximately $646,000 and the aggregate gross unrealized depreciation is approximately $1,198,000, resulting in net unrealized depreciation of approximately $552,000.
OFZ Obilgatsyi Federal'novo Zaima (Russian Federal Loan Obligation)
The accompanying notes are an integral part of the financial statements.
10
Morgan Stanley Institutional Fund, Inc.
Annual Report — December 31, 2016
Portfolio of Investments (cont'd)
Emerging Markets Fixed Income Opportunities Portfolio
Foreign Currency Forward Exchange Contracts:
The Portfolio had the following foreign currency forward exchange contracts open at December 31, 2016:
Counterparty | | Contracts to
Deliver
(000) | | In Exchange
For
(000) | | Delivery
Date | | Unrealized
Appreciation
(Depreciation)
(000) | |
JPMorgan Chase Bank NA | | TRY | 910 | | | $ | 259 | | | 1/3/17 | | $ | 1 | | |
JPMorgan Chase Bank NA | | $ | 176 | | | TRY | 610 | | | 1/3/17 | | | (3 | ) | |
JPMorgan Chase Bank NA | | $ | 85 | | | TRY | 300 | | | 1/3/17 | | | — | @ | |
JPMorgan Chase Bank NA | | BRL | 254 | | | $ | 74 | | | 1/4/17 | | | (4 | ) | |
JPMorgan Chase Bank NA | | BRL | 1,000 | | | $ | 287 | | | 1/4/17 | | | (21 | ) | |
JPMorgan Chase Bank NA | | BRL | 160 | | | $ | 47 | | | 1/4/17 | | | (2 | ) | |
JPMorgan Chase Bank NA | | BRL | 235 | | | $ | 72 | | | 1/4/17 | | | (— | @) | |
JPMorgan Chase Bank NA | | BRL | 430 | | | $ | 132 | | | 1/4/17 | | | (— | @) | |
JPMorgan Chase Bank NA | | BRL | 235 | | | $ | 72 | | | 1/4/17 | | | (— | @) | |
JPMorgan Chase Bank NA | | BRL | 514 | | | $ | 158 | | | 1/4/17 | | | (— | @) | |
JPMorgan Chase Bank NA | | $ | 68 | | | BRL | 235 | | | 1/4/17 | | | 4 | | |
JPMorgan Chase Bank NA | | $ | 126 | | | BRL | 430 | | | 1/4/17 | | | 6 | | |
JPMorgan Chase Bank NA | | $ | 69 | | | BRL | 235 | | | 1/4/17 | | | 3 | | |
JPMorgan Chase Bank NA | | $ | 154 | | | BRL | 514 | | | 1/4/17 | | | 4 | | |
JPMorgan Chase Bank NA | | $ | 307 | | | BRL | 1,000 | | | 1/4/17 | | | — | @ | |
JPMorgan Chase Bank NA | | $ | 49 | | | BRL | 160 | | | 1/4/17 | | | — | @ | |
JPMorgan Chase Bank NA | | $ | 78 | | | BRL | 254 | | | 1/4/17 | | | — | @ | |
JPMorgan Chase Bank NA | | COP | 64,000 | | | $ | 21 | | | 1/6/17 | | | — | @ | |
JPMorgan Chase Bank NA | | EUR | 115 | | | $ | 122 | | | 1/6/17 | | | 1 | | |
JPMorgan Chase Bank NA | | PHP | 4,450 | | | $ | 90 | | | 1/6/17 | | | — | @ | |
JPMorgan Chase Bank NA | | $ | 21 | | | COP | 64,000 | | | 1/6/17 | | | 1 | | |
JPMorgan Chase Bank NA | | HUF | 41,491 | | | $ | 142 | | | 1/9/17 | | | 1 | | |
JPMorgan Chase Bank NA | | PLN | 240 | | | $ | 57 | | | 1/9/17 | | | (1 | ) | |
JPMorgan Chase Bank NA | | SGD | 344 | | | $ | 243 | | | 1/9/17 | | | 5 | | |
JPMorgan Chase Bank NA | | SGD | 170 | | | $ | 118 | | | 1/9/17 | | | 1 | | |
JPMorgan Chase Bank NA | | $ | 50 | | | HUF | 15,000 | | | 1/9/17 | | | 1 | | |
JPMorgan Chase Bank NA | | $ | 8 | | | PLN | 34 | | | 1/9/17 | | | (— | @) | |
JPMorgan Chase Bank NA | | $ | 110 | | | RON | 461 | | | 1/9/17 | | | (3 | ) | |
JPMorgan Chase Bank NA | | $ | 8 | | | ZAR | 115 | | | 1/9/17 | | | (— | @) | |
JPMorgan Chase Bank NA | | ZAR | 550 | | | $ | 39 | | | 1/9/17 | | | (1 | ) | |
JPMorgan Chase Bank NA | | RUB | 5,164 | | | $ | 81 | | | 1/10/17 | | | (4 | ) | |
State Street Bank and Trust Co. | | RUB | 4,500 | | | $ | 73 | | | 1/10/17 | | | (— | @) | |
State Street Bank and Trust Co. | | $ | 157 | | | RUB | 9,664 | | | 1/10/17 | | | — | @ | |
JPMorgan Chase Bank NA | | $ | 129 | | | THB | 4,600 | | | 1/13/17 | | | (1 | ) | |
JPMorgan Chase Bank NA | | MYR | 125 | | | $ | 28 | | | 1/17/17 | | | (— | @) | |
JPMorgan Chase Bank NA | | $ | 341 | | | MYR | 1,506 | | | 1/17/17 | | | (6 | ) | |
State Street Bank and Trust Co. | | MYR | 1,050 | | | $ | 236 | | | 1/17/17 | | | 2 | | |
Citibank NA | | ARS | 780 | | | $ | 48 | | | 1/18/17 | | | (1 | ) | |
Citibank NA | | ARS | 230 | | | $ | 14 | | | 1/18/17 | | | (— | @) | |
Citibank NA | | $ | 62 | | | ARS | 1,010 | | | 1/18/17 | | | 1 | | |
JPMorgan Chase Bank NA | | PEN | 100 | | | $ | 29 | | | 1/19/17 | | | (1 | ) | |
JPMorgan Chase Bank NA | | $ | 8 | | | CLP | 5,500 | | | 1/19/17 | | | (— | @) | |
JPMorgan Chase Bank NA | | $ | 144 | | | PEN | 491 | | | 1/19/17 | | | 2 | | |
JPMorgan Chase Bank NA | | IDR | 2,879,000 | | | $ | 213 | | | 1/20/17 | | | — | @ | |
JPMorgan Chase Bank NA | | $ | 111 | | | IDR | 1,490,000 | | | 1/20/17 | | | (— | @) | |
JPMorgan Chase Bank NA | | MXN | 5,712 | | | $ | 278 | | | 1/23/17 | | | 4 | | |
JPMorgan Chase Bank NA | | $ | 33 | | | MXN | 673 | | | 1/23/17 | | | (— | @) | |
JPMorgan Chase Bank NA | | $ | 258 | | | TRY | 910 | | | 1/27/17 | | | (1 | ) | |
State Street Bank and Trust Co. | | RUB | 9,664 | | | $ | 157 | | | 1/27/17 | | | (— | @) | |
JPMorgan Chase Bank NA | | $ | 21 | | | COP | 64,000 | | | 1/30/17 | | | (— | @) | |
JPMorgan Chase Bank NA | | BRL | 514 | | | $ | 153 | | | 2/2/17 | | | (4 | ) | |
JPMorgan Chase Bank NA | | $ | 59 | | | BRL | 196 | | | 2/2/17 | | | 1 | | |
JPMorgan Chase Bank NA | | CNY | 1,700 | | | $ | 247 | | | 4/25/17 | | | 4 | | |
Citibank NA | | ARS | 1,100 | | | $ | 62 | | | 6/13/17 | | | (1 | ) | |
Citibank NA | | ARS | 2,100 | | | $ | 115 | | | 6/13/17 | | | (5 | ) | |
Citibank NA | | ARS | 1,000 | | | $ | 57 | | | 6/13/17 | | | (— | @) | |
Citibank NA | | $ | 127 | | | ARS | 2,200 | | | 6/13/17 | | | (1 | ) | |
Citibank NA | | $ | 58 | | | ARS | 1,000 | | | 6/13/17 | | | (1 | ) | |
JPMorgan Chase Bank NA | | ARS | 7,000 | | | $ | 407 | | | 6/13/17 | | | 7 | | |
JPMorgan Chase Bank NA | | $ | 197 | | | ARS | 3,500 | | | 6/13/17 | | | 2 | | |
| | | | | | | | | $ | (10 | ) | |
The accompanying notes are an integral part of the financial statements.
11
Morgan Stanley Institutional Fund, Inc.
Annual Report — December 31, 2016
Portfolio of Investments (cont'd)
Emerging Markets Fixed Income Opportunities Portfolio
Futures Contract:
The Portfolio had the following futures contract open at December 31, 2016:
| | | Number
of
Contracts | | Value
(000) | | Expiration
Date | | Unrealized
Depreciation
(000) | |
Short: | |
German Euro Bund (Germany) | | | 1 | | | $ | (173 | ) | | Mar-17 | | $ | (4 | ) | |
@ Value is less than $500.
ARS — Argentine Peso
BRL — Brazilian Real
CLP — Chilean Peso
CNY — Chinese Yuan Renminbi
COP — Colombian Peso
EUR — Euro
HUF — Hungarian Forint
IDR — Indonesian Rupiah
MXN — Mexican Peso
MYR — Malaysian Ringgit
PEN — Peruvian Nuevo Sol
PHP — Philippine Peso
PLN — Polish Zloty
RON — Romanian New Leu
RUB — Russian Ruble
SGD — Singapore Dollar
THB — Thai Baht
TRY — Turkish Lira
ZAR — South African Rand
Portfolio Composition*
Classification | | Percentage of
Total Investments | |
Sovereign | | | 62.6 | % | |
Corporate Bonds | | | 32.2 | | |
Short-Term Investments | | | 5.2 | | |
Other** | | | 0.0 | *** | |
Total Investments | | | 100.0 | %**** | |
** Industries and/or investment types representing less than 5% of total investments.
*** Amount is less than 0.05%
**** Does not include an open short futures contract with an underlying face amount of approximately $173,000 with unrealized depreciation of approximately $4,000. Does not include open foreign currency forward exchange contracts with net unrealized depreciation of approximately $10,000.
The accompanying notes are an integral part of the financial statements.
12
Morgan Stanley Institutional Fund, Inc.
Annual Report — December 31, 2016
Emerging Markets Fixed Income Opportunities Portfolio
Statement of Assets and Liabilities | | December 31, 2016
(000) | |
Assets: | |
Investments in Securities of Unaffiliated Issuers, at Value (Cost $21,936) | | $ | 21,564 | | |
Investment in Security of Affiliated Issuer, at Value (Cost $1,125) | | | 1,125 | | |
Total Investments in Securities, at Value (Cost $23,061) | | | 22,689 | | |
Foreign Currency, at Value (Cost $6) | | | 6 | | |
Interest Receivable | | | 491 | | |
Unrealized Appreciation on Foreign Currency Forward Exchange Contracts | | | 51 | | |
Receivable for Variation Margin on Futures Contracts | | | 5 | | |
Receivable for Investments Sold | | | 3 | | |
Tax Reclaim Receivable | | | 1 | | |
Receivable for Portfolio Shares Sold | | | 1 | | |
Dividends Receivable | | | — | @ | |
Receivable from Affiliate | | | — | @ | |
Other Assets | | | 26 | | |
Total Assets | | | 23,273 | | |
Liabilities: | |
Unrealized Depreciation on Foreign Currency Forward Exchange Contracts | | | 61 | | |
Payable for Professional Fees | | | 59 | | |
Payable for Advisory Fees | | | 54 | | |
Payable for Custodian Fees | | | 30 | | |
Deferred Capital Gain Country Tax | | | 18 | | |
Payable for Directors' Fees and Expenses | | | 8 | | |
Payable for Transfer Agency Fees — Class I | | | 1 | | |
Payable for Transfer Agency Fees — Class A | | | — | @ | |
Payable for Transfer Agency Fees — Class L | | | — | @ | |
Payable for Transfer Agency Fees — Class C | | | — | @ | |
Payable for Transfer Agency Fees — Class IS | | | — | @ | |
Payable for Administration Fees | | | 2 | | |
Payable for Shareholder Services Fees — Class A | | | — | @ | |
Payable for Distribution and Shareholder Services Fees — Class L | | | — | @ | |
Payable for Distribution and Shareholder Services Fees — Class C | | | — | @ | |
Payable for Portfolio Shares Redeemed | | | — | @ | |
Other Liabilities | | | 18 | | |
Total Liabilities | | | 251 | | |
Net Assets | | $ | 23,022 | | |
Net Assets Consist Of: | |
Paid-in-Capital | | $ | 28,706 | | |
Distributions in Excess of Net Investment Income | | | (138 | ) | |
Accumulated Net Realized Loss | | | (5,148 | ) | |
Unrealized Appreciation (Depreciation) on: | |
Investments (Net of $10 of Deferred Capital Gain Country Tax) | | | (382 | ) | |
Futures Contract | | | (4 | ) | |
Foreign Currency Forward Exchange Contracts | | | (10 | ) | |
Foreign Currency Translations | | | (2 | ) | |
Net Assets | | $ | 23,022 | | |
The accompanying notes are an integral part of the financial statements.
13
Morgan Stanley Institutional Fund, Inc.
Annual Report — December 31, 2016
Emerging Markets Fixed Income Opportunities Portfolio
Statement of Assets and Liabilities (cont'd) | | December 31, 2016
(000) | |
CLASS I: | |
Net Assets | | $ | 20,332 | | |
| Shares Outstanding $0.001 par value shares of beneficial interest (unlimited shares authorized) (not in 000's) | | | 2,242,334 | | |
Net Asset Value, Offering and Redemption Price Per Share | | $ | 9.07 | | |
CLASS A: | |
Net Assets | | $ | 972 | | |
| Shares Outstanding $0.001 par value shares of beneficial interest (unlimited shares authorized) (not in 000's) | | | 107,271 | | |
Net Asset Value, Redemption Price Per Share | | $ | 9.06 | | |
Maximum Sales Load | | | 4.25 | % | |
Maximum Sales Charge | | $ | 0.40 | | |
Maximum Offering Price Per Share | | $ | 9.46 | | |
CLASS L: | |
Net Assets | | $ | 777 | | |
| Shares Outstanding $0.001 par value shares of beneficial interest (unlimited shares authorized) (not in 000's) | | | 85,833 | | |
Net Asset Value, Offering and Redemption Price Per Share | | $ | 9.05 | | |
CLASS C: | |
Net Assets | | $ | 225 | | |
| Shares Outstanding $0.001 par value shares of beneficial interest (unlimited shares authorized) (not in 000's) | | | 24,878 | | |
Net Asset Value, Offering and Redemption Price Per Share | | $ | 9.05 | | |
CLASS IS: | |
Net Assets | | $ | 716 | | |
| Shares Outstanding $0.001 par value shares of beneficial interest (unlimited shares authorized) (not in 000's) | | | 78,874 | | |
Net Asset Value, Offering and Redemption Price Per Share | | $ | 9.07 | | |
@ Amount is less than $500.
The accompanying notes are an integral part of the financial statements.
14
Morgan Stanley Institutional Fund, Inc.
Annual Report — December 31, 2016
Emerging Markets Fixed Income Opportunities Portfolio
Statement of Operations | | Year Ended
December 31, 2016
(000) | |
Investment Income: | |
Interest from Securities of Unaffiliated Issuers (Net of $11 of Foreign Taxes Withheld) | | $ | 1,909 | | |
Dividends from Security of Affiliated Issuer (Note G) | | | 1 | | |
Dividends from Securities of Unaffiliated Issuers | | | — | @ | |
Total Investment Income | | | 1,910 | | |
Expenses: | |
Advisory Fees (Note B) | | | 176 | | |
Professional Fees | | | 81 | | |
Registration Fees | | | 76 | | |
Custodian Fees (Note F) | | | 69 | | |
Shareholder Reporting Fees | | | 21 | | |
Administration Fees (Note C) | | | 19 | | |
Transfer Agency Fees — Class I (Note E) | | | 3 | | |
Transfer Agency Fees — Class A (Note E) | | | 2 | | |
Transfer Agency Fees — Class L (Note E) | | | 2 | | |
Transfer Agency Fees — Class C (Note E) | | | 2 | | |
Transfer Agency Fees — Class IS (Note E) | | | 2 | | |
Shareholder Services Fees — Class A (Note D) | | | 3 | | |
Distribution and Shareholder Services Fees — Class L (Note D) | | | 4 | | |
Distribution and Shareholder Services Fees — Class C (Note D) | | | 2 | | |
Pricing Fees | | | 9 | | |
Directors' Fees and Expenses | | | 3 | | |
Sub Transfer Agency Fees — Class I | | | 1 | | |
Sub Transfer Agency Fees — Class L | | | — | @ | |
Sub Transfer Agency Fees — Class C | | | — | @ | |
Other Expenses | | | 16 | | |
Total Expenses | | | 491 | | |
Waiver of Advisory Fees (Note B) | | | (176 | ) | |
Reimbursement of Class Specific Expenses — Class L (Note B) | | | (1 | ) | |
Reimbursement of Class Specific Expenses — Class C (Note B) | | | (2 | ) | |
Reimbursement of Class Specific Expenses — Class IS (Note B) | | | (2 | ) | |
Expenses Reimbursed by Adviser (Note B) | | | (4 | ) | |
Rebate from Morgan Stanley Affiliate (Note G) | | | (1 | ) | |
Reimbursement of Custodian Fees (Note F) | | | (98 | ) | |
Net Expenses | | | 207 | | |
Net Investment Income | | | 1,703 | | |
Realized Gain (Loss): | |
Investments Sold (Net of $8 of Capital Gain Country Tax) | | | (58 | ) | |
Foreign Currency Forward Exchange Contracts | | | (51 | ) | |
Foreign Currency Transactions | | | 5 | | |
Futures Contracts | | | (20 | ) | |
Net Realized Loss | | | (124 | ) | |
Change in Unrealized Appreciation (Depreciation): | |
Investments (Net of Increase in Deferred Capital Gain Country Tax of $10) | | | 1,179 | | |
Foreign Currency Forward Exchange Contracts | | | (21 | ) | |
Foreign Currency Translations | | | 3 | | |
Futures Contracts | | | (4 | ) | |
Net Change in Unrealized Appreciation (Depreciation) | | | 1,157 | | |
Net Realized Loss and Change in Unrealized Appreciation (Depreciation) | | | 1,033 | | |
Net Increase in Net Assets Resulting from Operations | | $ | 2,736 | | |
@ Amount is less than $500.
The accompanying notes are an integral part of the financial statements.
15
Morgan Stanley Institutional Fund, Inc.
Annual Report — December 31, 2016
Emerging Markets Fixed Income Opportunities Portfolio
Statements of Changes in Net Assets | | Year Ended
December 31, 2016
(000) | | Year Ended
December 31, 2015
(000) | |
Increase (Decrease) in Net Assets: | |
Operations: | |
Net Investment Income | | $ | 1,703 | | | $ | 1,600 | | |
Net Realized Loss | | | (124 | ) | | | (2,148 | ) | |
Net Change in Unrealized Appreciation (Depreciation) | | | 1,157 | | | | (223 | ) | |
Net Increase (Decrease) in Net Assets Resulting from Operations | | | 2,736 | | | | (771 | ) | |
Distributions from and/or in Excess of: | |
Class I: | |
Net Investment Income | | | (1,221 | ) | | | (1,138 | ) | |
Class A: | |
Net Investment Income | | | (62 | ) | | | (45 | ) | |
Class L: | |
Net Investment Income | | | (43 | ) | | | (28 | ) | |
Class C: | |
Net Investment Income | | | (11 | ) | | | (5 | ) | |
Class IS: | |
Net Investment Income | | | (43 | ) | | | (430 | ) | |
Total Distributions | | | (1,380 | ) | | | (1,646 | ) | |
Capital Share Transactions:(1) | |
Class I: | |
Subscribed | | | 541 | | | | 834 | | |
Issued due to a Tax-Free Reorganization | | | — | | | | 2,383 | | |
Distributions Reinvested | | | 144 | | | | 97 | | |
Redeemed | | | (760 | ) | | | (1,155 | ) | |
Class A: | |
Subscribed | | | 195 | | | | 36 | | |
Issued due to a Tax-Free Reorganization | | | — | | | | 937 | | |
Distributions Reinvested | | | 51 | | | | 35 | | |
Redeemed | | | (443 | ) | | | (152 | ) | |
Class L: | |
Issued due to a Tax-Free Reorganization | | | — | | | | 722 | | |
Distributions Reinvested | | | 38 | | | | 23 | | |
Redeemed | | | (42 | ) | | | (85 | ) | |
Class C: | |
Subscribed | | | 2 | | | | 210 | * | |
Distributions Reinvested | | | 10 | | | | 4 | * | |
Redeemed | | | (2 | ) | | | — | | |
Class IS: | |
Subscribed | | | — | | | | 18,208 | | |
Issued due to a Tax-Free Reorganization | | | — | | | | 8 | | |
Distributions Reinvested | | | — | | | | 403 | | |
Redeemed | | | — | | | | (17,050 | ) | |
Net Increase (Decrease) in Net Assets Resulting from Capital Share Transactions | | | (266 | ) | | | 5,458 | | |
Redemption Fees | | | — | @ | | | — | @ | |
Total Increase in Net Assets | | | 1,090 | | | | 3,041 | | |
Net Assets: | |
Beginning of Period | | | 21,932 | | | | 18,891 | | |
End of Period (Including Distributions in Excess of Net Investment Income of $(138) and $(113)) | | $ | 23,022 | | | $ | 21,932 | | |
The accompanying notes are an integral part of the financial statements.
16
Morgan Stanley Institutional Fund, Inc.
Annual Report — December 31, 2016
Emerging Markets Fixed Income Opportunities Portfolio
Statements of Changes in Net Assets (cont'd) | | Year Ended
December 31, 2016
(000) | | Year Ended
December 31, 2015
(000) | |
(1) Capital Share Transactions: | |
Class I: | |
Shares Subscribed | | | 58 | | | | 94 | | |
Shares Issued due to a Tax-Free Reorganization | | | — | | | | 272 | | |
Shares Issued on Distributions Reinvested | | | 16 | | | | 12 | | |
Shares Redeemed | | | (85 | ) | | | (131 | ) | |
Net Increase (Decrease) in Class I Shares Outstanding | | | (11 | ) | | | 247 | | |
Class A: | |
Shares Subscribed | | | 21 | | | | 4 | | |
Shares Issued due to a Tax-Free Reorganization | | | — | | | | 107 | | |
Shares Issued on Distributions Reinvested | | | 6 | | | | 4 | | |
Shares Redeemed | | | (49 | ) | | | (17 | ) | |
Net Increase (Decrease) in Class A Shares Outstanding | | | (22 | ) | | | 98 | | |
Class L: | |
Shares Issued due to a Tax-Free Reorganization | | | — | | | | 83 | | |
Shares Issued on Distributions Reinvested | | | 4 | | | | 3 | | |
Shares Redeemed | | | (4 | ) | | | (10 | ) | |
Net Increase (Decrease) in Class L Shares Outstanding | | | (— | @@) | | | 76 | | |
Class C: | |
Shares Subscribed | | | — | @@ | | | 23 | * | |
Shares Issued on Distributions Reinvested | | | 1 | | | | 1 | * | |
Shares Redeemed | | | (— | @@) | | | — | | |
Net Increase in Class C Shares Outstanding | | | 1 | | | | 24 | | |
Class IS: | |
Shares Subscribed | | | — | | | | 1,934 | | |
Shares Issued due to a Tax-Free Reorganization | | | — | | | | 1 | | |
Shares Issued on Distributions Reinvested | | | — | | | | 43 | | |
Shares Redeemed | | | — | | | | (1,900 | ) | |
Net Increase in Class IS Shares Outstanding | | | — | | | | 78 | | |
* For the period April 30, 2015 through December 31, 2015.
@ Amount is less than $500.
@@ Amount is less than 500 shares.
The accompanying notes are an integral part of the financial statements.
17
Morgan Stanley Institutional Fund, Inc.
Annual Report — December 31, 2016
Financial Highlights
Emerging Markets Fixed Income Opportunities Portfolio
| | | Class I | |
| | | Year Ended December 31, | | Period from
May 24, 2012(2) to | |
Selected Per Share Data and Ratios | | 2016(1) | | 2015 | | 2014 | | 2013 | | December 31, 2012 | |
Net Asset Value, Beginning of Period | | $ | 8.53 | | | $ | 9.22 | | | $ | 9.40 | | | $ | 11.11 | | | $ | 10.00 | | |
Income (Loss) from Investment Operations: | |
Net Investment Income (3) | | | 0.67 | | | | 0.52 | | | | 0.51 | | | | 0.53 | | | | 0.30 | | |
Net Realized and Unrealized Gain (Loss) | | | 0.41 | | | | (0.68 | ) | | | (0.19 | ) | | | (1.50 | ) | | | 1.18 | | |
Total from Investment Operations | | | 1.09 | | | | (0.16 | ) | | | 0.32 | | | | (0.97 | ) | | | 1.48 | | |
Distributions from and/or in Excess of: | |
Net Investment Income | | | (0.55 | ) | | | (0.53 | ) | | | (0.50 | ) | | | (0.48 | ) | | | (0.30 | ) | |
Net Realized Gain | | | — | | | | — | | | | — | | | | (0.26 | ) | | | (0.07 | ) | |
Total Distributions | | | (0.55 | ) | | | (0.53 | ) | | | (0.50 | ) | | | (0.74 | ) | | | (0.37 | ) | |
Redemption Fees | | | 0.00 | (4) | | | 0.00 | (4) | | | — | | | | 0.00 | (4) | | | — | | |
Net Asset Value, End of Period | | $ | 9.07 | | | $ | 8.53 | | | $ | 9.22 | | | $ | 9.40 | | | $ | 11.11 | | |
Total Return (5) | | | 12.80 | % | | | (1.83 | )% | | | 3.38 | % | | | (8.79 | )% | | | 14.83 | %(8) | |
Ratios and Supplemental Data: | |
Net Assets, End of Period (Thousands) | | $ | 20,332 | | | $ | 19,219 | | | $ | 18,492 | | | $ | 19,400 | | | $ | 22,597 | | |
Ratio of Expenses to Average Net Assets (10) | | | 0.84 | %(6) | | | 0.83 | %(6) | | | 0.83 | %(6) | | | 0.84 | %(6) | | | 0.84 | %(6)(9) | |
Ratio of Net Investment Income to Average Net Assets (10) | | | 7.32 | %(6) | | | 5.74 | %(6) | | | 5.23 | %(6) | | | 5.14 | %(6) | | | 4.63 | %(6)(9) | |
Ratio of Rebate from Morgan Stanley Affiliates to Average Net Assets | | | 0.00 | %(7) | | | 0.00 | %(7) | | | 0.00 | %(7) | | | 0.00 | %(7) | | | 0.01 | %(9) | |
Portfolio Turnover Rate | | | 116 | % | | | 111 | % | | | 95 | % | | | 94 | % | | | 29 | %(8) | |
(10) Supplemental Information on the Ratios to Average Net Assets: | |
Ratios Before Expense Limitation: | |
Expenses to Average Net Assets | | | 2.03 | % | | | 1.82 | % | | | 1.91 | % | | | 2.15 | % | | | 2.02 | %(9) | |
Net Investment Income to Average Net Assets | | | 6.13 | % | | | 4.75 | % | | | 4.15 | % | | | 3.83 | % | | | 3.45 | %(9) | |
(1) Refer to Note F in the Notes to Financial Statements for discussion of prior period custodian out-of-pocket expenses that were reimbursed in the current period. The amount of the reimbursement was immaterial on a per share basis and did not impact the total return of Class I shares. The Ratio of Expenses to Average Net Assets and the Ratio of Net Investment Income to Average Net Assets would be unchanged as the reimbursement of custodian fees was offset against current period expense waivers/reimbursements with no impact to net expenses or net investment income.
(2) Commencement of Operations.
(3) Per share amount is based on average shares outstanding.
(4) Amount is less than $0.005 per share.
(5) Calculated based on the net asset value as of the last business day of the period.
(6) The Ratios of Expenses and Net Investment Income reflect the rebate of certain Portfolio expenses in connection with the investments in Morgan Stanley affiliates during the period. The effect of the rebate on the ratios is disclosed in the above table as "Ratio of Rebate from Morgan Stanley Affiliates to Average Net Assets."
(7) Amount is less than 0.005%.
(8) Not Annualized.
(9) Annualized.
The accompanying notes are an integral part of the financial statements.
18
Morgan Stanley Institutional Fund, Inc.
Annual Report — December 31, 2016
Financial Highlights
Emerging Markets Fixed Income Opportunities Portfolio
| | | Class A | |
| | | Year Ended December 31, | | Period from
May 24, 2012(2) to | |
Selected Per Share Data and Ratios | | 2016(1) | | 2015 | | 2014 | | 2013 | | December 31, 2012 | |
Net Asset Value, Beginning of Period | | $ | 8.52 | | | $ | 9.21 | | | $ | 9.40 | | | $ | 11.11 | | | $ | 10.00 | | |
Income (Loss) from Investment Operations: | |
Net Investment Income (3) | | | 0.64 | | | | 0.50 | | | | 0.47 | | | | 0.49 | | | | 0.29 | | |
Net Realized and Unrealized Gain (Loss) | | | 0.42 | | | | (0.69 | ) | | | (0.19 | ) | | | (1.49 | ) | | | 1.17 | | |
Total from Investment Operations | | | 1.06 | | | | (0.19 | ) | | | 0.28 | | | | (1.00 | ) | | | 1.46 | | |
Distributions from and/or in Excess of: | |
Net Investment Income | | | (0.52 | ) | | | (0.50 | ) | | | (0.47 | ) | | | (0.45 | ) | | | (0.28 | ) | |
Net Realized Gain | | | — | | | | — | | | | — | | | | (0.26 | ) | | | (0.07 | ) | |
Total Distributions | | | (0.52 | ) | | | (0.50 | ) | | | (0.47 | ) | | | (0.71 | ) | | | (0.35 | ) | |
Redemption Fees | | | 0.00 | (4) | | | 0.00 | (4) | | | — | | | | 0.00 | (4) | | | — | | |
Net Asset Value, End of Period | | $ | 9.06 | | | $ | 8.52 | | | $ | 9.21 | | | $ | 9.40 | | | $ | 11.11 | | |
Total Return (5) | | | 12.53 | % | | | (2.14 | )% | | | 2.90 | % | | | (9.05 | )% | | | 14.66 | %(9) | |
Ratios and Supplemental Data: | |
Net Assets, End of Period (Thousands) | | $ | 972 | | | $ | 1,103 | | | $ | 291 | | | $ | 196 | | | $ | 111 | | |
Ratio of Expenses to Average Net Assets (11) | | | 1.09 | %(6) | | | 1.20 | %(6) | | | 1.20 | %(6) | | | 1.14 | %(6)(7) | | | 1.09 | %(6)(10) | |
Ratio of Net Investment Income to Average Net Assets (11) | | | 7.03 | %(6) | | | 5.61 | %(6) | | | 4.88 | %(6) | | | 4.88 | %(6) | | | 4.38 | %(6)(10) | |
Ratio of Rebate from Morgan Stanley Affiliates to Average Net Assets | | | 0.00 | %(8) | | | 0.00 | %(8) | | | 0.00 | %(8) | | | 0.00 | %(8) | | | 0.01 | %(10) | |
Portfolio Turnover Rate | | | 116 | % | | | 111 | % | | | 95 | % | | | 94 | % | | | 29 | %(9) | |
(11) Supplemental Information on the Ratios to Average Net Assets: | |
Ratios Before Expense Limitation: | |
Expenses to Average Net Assets | | | 2.28 | % | | | 2.49 | % | | | 2.85 | % | | | 2.76 | % | | | 2.27 | %(10) | |
Net Investment Income to Average Net Assets | | | 5.84 | % | | | 4.32 | % | | | 3.23 | % | | | 3.26 | % | | | 3.20 | %(10) | |
(1) Refer to Note F in the Notes to Financial Statements for discussion of prior period custodian out-of-pocket expenses that were reimbursed in the current period. The amount of the reimbursement was immaterial on a per share basis and did not impact the total return of Class A shares. The Ratio of Expenses to Average Net Assets and the Ratio of Net Investment Income to Average Net Assets would be unchanged as the reimbursement of custodian fees was offset against current period expense waivers/reimbursements with no impact to net expenses or net investment income.
(2) Commencement of Operations.
(3) Per share amount is based on average shares outstanding.
(4) Amount is less than $0.005 per share.
(5) Calculated based on the net asset value which does not reflect sales charges, if applicable, as of the last business day of the period.
(6) The Ratios of Expenses and Net Investment Income reflect the rebate of certain Portfolio expenses in connection with the investments in Morgan Stanley affiliates during the period. The effect of the rebate on the ratios is disclosed in the above table as "Ratio of Rebate from Morgan Stanley Affiliates to Average Net Assets."
(7) Effective September 16, 2013, the Adviser has agreed to limit the ratio of expenses to average net assets to the maximum ratio of 1.20% for Class A shares. Prior to September 16, 2013, the maximum ratio was 1.10% for Class A shares.
(8) Amount is less than 0.005%.
(9) Not Annualized.
(10) Annualized.
The accompanying notes are an integral part of the financial statements.
19
Morgan Stanley Institutional Fund, Inc.
Annual Report — December 31, 2016
Financial Highlights
Emerging Markets Fixed Income Opportunities Portfolio
| | | Class L | |
| | | Year Ended December 31, | | Period from
May 24, 2012(2) to | |
Selected Per Share Data and Ratios | | 2016(1) | | 2015 | | 2014 | | 2013 | | December 31, 2012 | |
Net Asset Value, Beginning of Period | | $ | 8.51 | | | $ | 9.22 | | | $ | 9.39 | | | $ | 11.11 | | | $ | 10.00 | | |
Income (Loss) from Investment Operations: | |
Net Investment Income (3) | | | 0.62 | | | | 0.49 | | | | 0.45 | | | | 0.47 | | | | 0.25 | | |
Net Realized and Unrealized Gain (Loss) | | | 0.41 | | | | (0.72 | ) | | | (0.18 | ) | | | (1.51 | ) | | | 1.18 | | |
Total from Investment Operations | | | 1.03 | | | | (0.23 | ) | | | 0.27 | | | | (1.04 | ) | | | 1.43 | | |
Distributions from and/or in Excess of: | |
Net Investment Income | | | (0.49 | ) | | | (0.48 | ) | | | (0.44 | ) | | | (0.42 | ) | | | (0.25 | ) | |
Net Realized Gain | | | — | | | | — | | | | — | | | | (0.26 | ) | | | (0.07 | ) | |
Total Distributions | | | (0.49 | ) | | | (0.48 | ) | | | (0.44 | ) | | | (0.68 | ) | | | (0.32 | ) | |
Redemption Fees | | | 0.00 | (4) | | | 0.00 | (4) | | | — | | | | 0.00 | (4) | | | — | | |
Net Asset Value, End of Period | | $ | 9.05 | | | $ | 8.51 | | | $ | 9.22 | | | $ | 9.39 | | | $ | 11.11 | | |
Total Return (5) | | | 12.15 | % | | | (2.53 | )% | | | 2.85 | % | | | (9.41 | )% | | | 14.33 | %(9) | |
Ratios and Supplemental Data: | |
Net Assets, End of Period (Thousands) | | $ | 777 | | | $ | 735 | | | $ | 98 | | | $ | 100 | | | $ | 111 | | |
Ratio of Expenses to Average Net Assets (11) | | | 1.45 | %(6) | | | 1.45 | %(6) | | | 1.45 | %(6) | | | 1.41 | %(6)(7) | | | 1.59 | %(6)(10) | |
Ratio of Net Investment Income to Average Net Assets (11) | | | 6.70 | %(6) | | | 5.44 | %(6) | | | 4.62 | %(6) | | | 4.57 | %(6) | | | 3.88 | %(6)(10) | |
Ratio of Rebate from Morgan Stanley Affiliates to Average Net Assets | | | 0.00 | %(8) | | | 0.00 | %(8) | | | 0.00 | %(8) | | | 0.00 | %(8) | | | 0.01 | %(10) | |
Portfolio Turnover Rate | | | 116 | % | | | 111 | % | | | 95 | % | | | 94 | % | | | 29 | %(9) | |
(11) Supplemental Information on the Ratios to Average Net Assets: | |
Ratios Before Expense Limitation: | |
Expenses to Average Net Assets | | | 2.78 | % | | | 2.94 | % | | | 4.10 | % | | | 3.07 | % | | | 2.77 | %(10) | |
Net Investment Income to Average Net Assets | | | 5.37 | % | | | 3.95 | % | | | 1.97 | % | | | 2.91 | % | | | 2.70 | %(10) | |
(1) Refer to Note F in the Notes to Financial Statements for discussion of prior period custodian out-of-pocket expenses that were reimbursed in the current period. The amount of the reimbursement was immaterial on a per share basis and did not impact the total return of Class L shares. The Ratio of Expenses to Average Net Assets and the Ratio of Net Investment Income to Average Net Assets would be unchanged as the reimbursement of custodian fees was offset against current period expense waivers/reimbursements with no impact to net expenses or net investment income.
(2) Commencement of Operations.
(3) Per share amount is based on average shares outstanding.
(4) Amount is less than $0.005 per share.
(5) Calculated based on the net asset value as of the last business day of the period.
(6) The Ratios of Expenses and Net Investment Income reflect the rebate of certain Portfolio expenses in connection with the investments in Morgan Stanley affiliates during the period. The effect of the rebate on the ratios is disclosed in the above table as "Ratio of Rebate from Morgan Stanley Affiliates to Average Net Assets."
(7) Effective September 16, 2013, the Adviser has agreed to limit the ratio of expenses to average net assets to the maximum ratio of 1.45% for Class L shares. Prior to September 16, 2013, the maximum ratio was 1.35% for Class L shares.
(8) Amount is less than 0.005%.
(9) Not Annualized.
(10) Annualized.
The accompanying notes are an integral part of the financial statements.
20
Morgan Stanley Institutional Fund, Inc.
Annual Report — December 31, 2016
Financial Highlights
Emerging Markets Fixed Income Opportunities Portfolio
| | | Class C | |
Selected Per Share Data and Ratios | | Year Ended
December 31, 2016(1) | | Period from
April 30, 2015(2) to
December 31, 2015 | |
Net Asset Value, Beginning of Period | | $ | 8.52 | | | $ | 9.52 | | |
Income (Loss) from Investment Operations: | |
Net Investment Income (3) | | | 0.54 | | | | 0.32 | | |
Net Realized and Unrealized Gain (Loss) | | | 0.43 | | | | (0.97 | ) | |
Total from Investment Operations | | | 0.97 | | | | (0.65 | ) | |
Distributions from and/or in Excess of: | |
Net Investment Income | | | (0.44 | ) | | | (0.35 | ) | |
Redemption Fees | | | 0.00 | (4) | | | 0.00 | (4) | |
Net Asset Value, End of Period | | $ | 9.05 | | | $ | 8.52 | | |
Total Return (5) | | | 11.60 | % | | | (6.95 | )%(8) | |
Ratios and Supplemental Data: | |
Net Assets, End of Period (Thousands) | | $ | 225 | | | $ | 202 | | |
Ratio of Expenses to Average Net Assets (10) | | | 1.95 | %(6) | | | 1.95 | %(6)(9) | |
Ratio of Net Investment Income to Average Net Assets (10) | | | 5.87 | %(6) | | | 5.34 | %(6)(9) | |
Ratio of Rebate from Morgan Stanley Affiliates to Average Net Assets | | | 0.00 | %(7) | | | 0.00 | %(7)(9) | |
Portfolio Turnover Rate | | | 116 | % | | | 111 | % | |
(10) Supplemental Information on the Ratios to Average Net Assets: | |
Ratios Before Expense Limitation: | |
Expense to Average Net Assets | | | 3.97 | % | | | 6.28 | %(9) | |
Net Investment Income to Average Net Assets | | | 3.85 | % | | | 1.01 | %(9) | |
(1) Refer to Note F in the Notes to Financial Statements for discussion of prior period custodian out-of-pocket expenses that were reimbursed in the current period. The amount of the reimbursement was immaterial on a per share basis and did not impact the total return of Class C shares. The Ratio of Expenses to Average Net Assets and the Ratio of Net Investment Income to Average Net Assets would be unchanged as the reimbursement of custodian fees was offset against current period expense waivers/reimbursements with no impact to net expenses or net investment income.
(2) Commencement of Offering.
(3) Per share amount is based on average shares outstanding.
(4) Amount is less than $0.005 per share.
(5) Calculated based on the net asset value which does not reflect sales charges, if applicable, as of the last business of the period.
(6) The Ratios of Expenses and Net Investment Income reflect the rebate of certain Portfolio expenses in connection with the investments in Morgan Stanley affiliates during the period. The effect of the rebate on the ratios is disclosed in the above table as "Ratio of Rebate from Morgan Stanley Affiliates to Average Net Assets."
(7) Amount is less than 0.005%
(8) Not Annualized.
(9) Annualized.
The accompanying notes are an integral part of the financial statements.
21
Morgan Stanley Institutional Fund, Inc.
Annual Report — December 31, 2016
Financial Highlights
Emerging Markets Fixed Income Opportunities Portfolio
| | | Class IS | |
| | | Year Ended December 31, | | Period from
September 13, 2013(2) to | |
Selected Per Share Data and Ratios | | 2016(1) | | 2015 | | 2014 | | December 31, 2013 | |
Net Asset Value, Beginning of Period | | $ | 8.53 | | | $ | 9.22 | | | $ | 9.40 | | | $ | 9.65 | | |
Income (Loss) from Investment Operations: | |
Net Investment Income (3) | | | 0.67 | | | | 0.50 | | | | 0.51 | | | | 0.15 | | |
Net Realized and Unrealized Gain (Loss) | | | 0.42 | | | | (0.66 | ) | | | (0.19 | ) | | | 0.04 | | |
Total from Investment Operations | | | 1.09 | | | | (0.16 | ) | | | 0.32 | | | | 0.19 | | |
Distributions from and/or in Excess of: | |
Net Investment Income | | | (0.55 | ) | | | (0.53 | ) | | | (0.50 | ) | | | (0.24 | ) | |
Net Realized Gain | | | — | | | | — | | | | — | | | | (0.20 | ) | |
Total Distributions | | | (0.55 | ) | | | (0.53 | ) | | | (0.50 | ) | | | (0.44 | ) | |
Redemption Fees | | | 0.00 | (4) | | | 0.00 | (4) | | | — | | | | 0.00 | (4) | |
Net Asset Value, End of Period | | $ | 9.07 | | | $ | 8.53 | | | $ | 9.22 | | | $ | 9.40 | | |
Total Return (5) | | | 12.81 | % | | | (1.83 | )% | | | 3.39 | % | | | 1.92 | %(9) | |
Ratios and Supplemental Data: | |
Net Assets, End of Period (Thousands) | | $ | 716 | | | $ | 673 | | | $ | 10 | | | $ | 10 | | |
Ratio of Expenses to Average Net Assets (11) | | | 0.82 | %(6) | | | 0.82 | %(6) | | | 0.82 | %(6) | | | 0.81 | %(6)(7)(10) | |
Ratio of Net Investment Income to Average Net Assets (11) | | | 7.33 | %(6) | | | 5.45 | %(6) | | | 5.25 | %(6) | | | 5.36 | %(6)(10) | |
Ratio of Rebate from Morgan Stanley Affiliates to Average Net Assets | | | 0.00 | %(8) | | | 0.00 | %(8) | | | 0.00 | %(8) | | | 0.01 | %(10) | |
Portfolio Turnover Rate | | | 116 | % | | | 111 | % | | | 95 | % | | | 94 | % | |
(11) Supplemental Information on the Ratios to Average Net Assets: | |
Ratios Before Expense Limitation: | |
Expenses to Average Net Assets | | | 2.25 | % | | | 1.86 | % | | | 21.21 | % | | | 7.70 | %(10) | |
Net Investment Income (Loss) to Average Net Assets | | | 5.90 | % | | | 4.41 | % | | | (15.14 | )% | | | (1.53 | )%(10) | |
(1) Refer to Note F in the Notes to Financial Statements for discussion of prior period custodian out-of-pocket expenses that were reimbursed in the current period. The amount of the reimbursement was immaterial on a per share basis and did not impact the total return of Class IS shares. The Ratio of Expenses to Average Net Assets and the Ratio of Net Investment Income to Average Net Assets would be unchanged as the reimbursement of custodian fees was offset against current period expense waivers/reimbursements with no impact to net expenses or net investment income.
(2) Commencement of Offering.
(3) Per share amount is based on average shares outstanding.
(4) Amount is less than $0.005 per share.
(5) Calculated based on the net asset value as of the last business day of the period.
(6) The Ratios of Expenses and Net Investment Income reflect the rebate of certain Portfolio expenses in connection with the investments in Morgan Stanley affiliates during the period. The effect of the rebate on the ratios is disclosed in the above table as "Ratio of Rebate from Morgan Stanley Affiliates to Average Net Assets."
(7) Effective September 16, 2013, the Adviser has agreed to limit the ratio of expenses to average net assets to the maximum ratio of 0.82% for Class IS shares.
(8) Amount is less than 0.005%.
(9) Not Annualized.
(10) Annualized.
The accompanying notes are an integral part of the financial statements.
22
Morgan Stanley Institutional Fund, Inc.
Annual Report — December 31, 2016
Notes to Financial Statements
Morgan Stanley Institutional Fund, Inc. (the "Fund") is registered under the Investment Company Act of 1940, as amended (the "Act"), as an open-end management investment company. The Fund is comprised of twenty-nine separate, active, diversified and non-diversified portfolios (individually referred to as a "Portfolio", collectively as the "Portfolios"). The Fund applies investment company accounting and reporting guidance.
The accompanying financial statements relate to the Emerging Markets Fixed Income Opportunities Portfolio. The Portfolio seeks high total return.
The Portfolio offers five classes of shares — Class I, Class A, Class L, Class C and Class IS. On April 30, 2015, the Portfolio suspended offering of Class L shares. Existing Class L shareholders may invest through reinvestment of dividends and distributions.
On September 28, 2015, the Portfolio acquired the net assets of the Emerging Markets Domestic Debt Portfolio ("Emerging Markets Domestic Debt Portfolio"), an open-end investment company. Based on the respective valuations as of the close of business on September 25, 2015, pursuant to a Plan of Reorganization approved by the shareholders of Emerging Markets Domestic Debt Portfolio on September 21, 2015 ("Reorganization"). The purpose of the transaction was to combine two portfolios managed by Morgan Stanley Investment Management Inc. with comparable investment objectives and strategies. The acquisition was accomplished by a tax-free exchange of 271,765 Class I shares of the Portfolio at a net asset value of $8.77 for 282,261 Class I shares of Emerging Markets Domestic Debt Portfolio; 106,956 Class A shares of the Portfolio at a net asset value of $8.76 for 108,632 Class A shares of Emerging Markets Domestic Debt Portfolio; 82,521 Class L shares of the Portfolio at a net asset value of $8.75 for 85,876 Class L shares of Emerging Markets Domestic Debt Portfolio; 874 Class IS shares of the Portfolio at a net asset value of $8.77 for 907 Class IS shares of Emerging Markets Domestic Debt Portfolio. The net assets of Emerging Markets Domestic Debt Portfolio before the Reorganization were approximately $4,050,000, including unrealized depreciation of approximately $589,000 at September 25, 2015. The investment portfolio of Emerging Markets Domestic Debt Portfolio, with a fair value of approximately $3,079,000 and identified cost of approximately $3,690,000 on September 25, 2015, was the principal asset acquired by the Portfolio. For financial reporting purposes, assets received and shares issued by the Portfolio were recorded at fair value; however, the cost basis of the
investments received from Emerging Markets Domestic Debt Portfolio was carried forward to align ongoing reporting of the Portfolio's realized and unrealized gains and losses with amounts distributable to shareholders for tax purposes. Immediately prior to the Reorganization, the net assets of the Portfolio were approximately $18,402,000. Immediately after the Reorganization, the net assets of the Portfolio were approximately $22,452,000.
Upon closing of the Reorganization, shareholders of Emerging Markets Domestic Debt Portfolio received shares of the Portfolio as follows:
Emerging Markets
Domestic Debt Portfolio | | Emerging Markets Fixed
Income Opportunities Portfolio | |
| Class I | | Class I | |
| Class A | | Class A | |
| Class L | | Class L | |
| Class IS | | Class IS | |
Assuming the acquisition had been completed on January 1, 2015, the beginning of the annual reporting period of the Portfolio, the Portfolio's pro forma results of operations for the period ended December 31, 2015, are as follows:
Net investment income(1) | | $ | 2,023,000 | | |
Net realized gain and unrealized gain/loss(2) | | $ | (4,861,000 | ) | |
Net increase (decrease) in net assets resulting from operations | | $ | (2,838,000 | ) | |
(1) Approximately $1,600,000 as reported, plus approximately $373,000 Emerging Markets Domestic Debt Portfolio prior to the Reorganization, plus approximately $50,000 of estimated pro-forma eliminated expenses.
(2) Approximately $(2,371,000) as reported, plus approximately $(2,490,000) Emerging Markets Domestic Debt Portfolio prior to the Reorganization.
Because the combined investment portfolios have been managed as a single integrated portfolio since the acquisition was completed, it is not practicable to separate the amounts of revenue and earnings of Emerging Markets Domestic Debt Portfolio that have been included in the Portfolio's Statement of Operations since September 28, 2015.
A. Significant Accounting Policies: The following significant accounting policies are in conformity with U.S. generally accepted accounting principles ("GAAP"). Such policies are consistently followed by the Fund in the preparation of its financial statements. GAAP may require management to make estimates and assumptions that affect the reported amounts and disclosures in the financial statements. Actual results may differ from those estimates.
1. Security Valuation: (1) Certain portfolio securities may be valued by an outside pricing service/vendor approved by the Fund's Board of Directors (the "Directors"). The pricing service/vendor may employ a pricing model that takes into account, among other things, bids, yield
23
Morgan Stanley Institutional Fund, Inc.
Annual Report — December 31, 2016
Notes to Financial Statements (cont'd)
spreads, and/or other market data and specific security characteristics. Alternatively, if a valuation is not available from an outside pricing service/vendor, and the security trades on an exchange, the security may be valued at its latest reported sale price (or at the exchange official closing price if such exchange reports an official closing price), prior to the time when assets are valued. If there are no sales on a given day and if there is no official exchange closing price for that day, the security is valued at the mean between the last reported bid and asked prices if such bid and asked prices are available in the relevant exchanges; (2) an equity portfolio security listed or traded on an exchange is valued at its latest reported sales price (or at the exchange official closing price if such exchange reports an official closing price), and if there were no sales on a given day and if there is no official exchange closing price for that day, the security is valued at the mean between the last reported bid and asked prices if such bid and asked prices are available on the relevant exchanges; (3) all other equity portfolio securities for which over-the-counter ("OTC") market quotations are readily available are valued at the latest reported sales price (or at the market official closing price if such market reports an official closing price), and if there was no trading in the security on a given day and if there is no official closing price from relevant markets for that day, the security is valued at the mean between the last reported bid and asked prices if such bid and asked prices are available on the relevant markets. Listed equity securities not traded on the valuation date with no reported bid and asked prices available on the exchange are valued at the mean between the current bid and asked prices obtained from one or more reputable brokers or dealers. An unlisted equity security that does not trade on the valuation date and for which bid and asked prices from the relevant markets are unavailable is valued at the mean between the current bid and asked prices obtained from one or more reputable brokers or dealers. In cases where a security is traded on more than one exchange, the security is valued on the exchange designated as the primary market; (4) futures are valued at the settlement price on the exchange on which they trade or, if a settlement price is unavailable, at the last sale price on the exchange; (5) when market quotations are not readily available, including circumstances under which the Adviser determines that the closing price, last sale price or the mean between the last reported bid and asked prices are not reflective of a security's market value, portfolio
securities are valued at their fair value as determined in good faith under procedures established by and under the general supervision of the Directors. Occasionally, developments affecting the closing prices of securities and other assets may occur between the times at which valuations of such securities are determined (that is, close of the foreign market on which the securities trade) and the close of business of the New York Stock Exchange ("NYSE"). If developments occur during such periods that are expected to materially affect the value of such securities, such valuations may be adjusted to reflect the estimated fair value of such securities as of the close of the NYSE, as determined in good faith by the Directors or by the Adviser using a pricing service and/or procedures approved by the Directors; (6) quotations of foreign portfolio securities, other assets and liabilities and forward contracts stated in foreign currency are translated into U.S. dollar equivalents at the prevailing market rates prior to the close of the NYSE; and (7) investments in mutual funds, including the Morgan Stanley Institutional Liquidity Funds, are valued at the net asset value ("NAV") as of the close of each business day.
The Directors have responsibility for determining in good faith the fair value of the investments, and the Directors may appoint others, such as the Fund's Adviser or a valuation committee, to assist the Directors in determining fair value and to make the actual calculations pursuant to the fair valuation methodologies previously approved by the Directors. Under procedures approved by the Directors, the Fund's Adviser has formed a Valuation Committee whose members are approved by the Directors. The Valuation Committee provides administration and oversight of the Fund's valuation policies and procedures, which are reviewed at least annually by the Directors. These procedures allow the Fund to utilize independent pricing services, quotations from securities and financial instrument dealers, and other market sources to determine fair value.
The Fund has procedures to determine the fair value of securities and other financial instruments for which market prices are not readily available. Under these procedures, the Valuation Committee convenes on a regular and ad hoc basis to review such securities and considers a number of factors, including valuation methodologies and significant unobservable valuation inputs, when arriving at fair value. The Valuation Committee may employ a market-based approach which may use related or
24
Morgan Stanley Institutional Fund, Inc.
Annual Report — December 31, 2016
Notes to Financial Statements (cont'd)
comparable assets or liabilities, recent transactions, market multiples, book values, and other relevant information for the investment to determine the fair value of the investment. An income-based valuation approach may also be used in which the anticipated future cash flows of the investment are discounted to calculate fair value. Discounts may also be applied due to the nature or duration of any restrictions on the disposition of the investments. Due to the inherent uncertainty of valuations of such investments, the fair values may differ significantly from the values that would have been used had an active market existed. The Valuation Committee employs various methods for calibrating these valuation approaches including a regular review of valuation methodologies, key inputs and assumptions, transactional back-testing or disposition analysis, and reviews of any related market activity.
2. Fair Value Measurement: Financial Accounting Standards Board ("FASB") Accounting Standards CodificationTM ("ASC") 820, "Fair Value Measurement" ("ASC 820"), defines fair value as the value that the Fund would receive to sell an investment or pay to transfer a liability in a timely transaction with an independent buyer in the principal market, or in the absence of a principal market, the most advantageous market for the investment or liability. ASC 820 establishes a three-tier hierarchy to distinguish between (1) inputs that reflect the assumptions market participants would use in valuing an asset or liability developed based on market data obtained from sources independent of the reporting entity (observable inputs) and (2) inputs that reflect the reporting entity's own assumptions about the assumptions market participants would use in valuing an asset or liability developed based on the best information available in the circumstances (unobservable inputs) and to establish classification of fair value measurements for disclosure purposes. Various inputs are used in determining the value of the Fund's investments. The inputs are summarized in the three broad levels listed below.
• Level 1 – unadjusted quoted prices in active markets for identical investments
• Level 2 – other significant observable inputs (including quoted prices for similar investments, interest rates, prepayment speeds, credit risk, etc.)
• Level 3 – significant unobservable inputs including the Fund's own assumptions in determining
the fair value of investments. Factors considered in making this determination may include, but are not limited to, information obtained by contacting the issuer, analysts, or the appropriate stock exchange (for exchange-traded securities), analysis of the issuer's financial statements or other available documents and, if necessary, available information concerning other securities in similar circumstances
The inputs or methodology used for valuing securities are not necessarily an indication of the risk associated with investing in those securities and the determination of the significance of a particular input to the fair value measurement in its entirety requires judgment and considers factors specific to each security.
The following is a summary of the inputs used to value the Portfolio's investments as of December 31, 2016.
Investment Type | | Level 1
Unadjusted
quoted
prices
(000) | | Level 2
Other
significant
observable
inputs
(000) | | Level 3
Significant
unobservable
inputs
(000) | | Total
(000) | |
Assets: | |
Fixed Income Securities | |
Corporate Bonds | | $ | — | | | $ | 7,310 | | | $ | — | | | $ | 7,310 | | |
Sovereign | | | — | | | | 14,201 | | | | — | | | | 14,201 | | |
Total Fixed Income
Securities | | | — | | | | 21,511 | | | | — | | | | 21,511 | | |
Warrant | | | — | | | | 2 | | | | — | | | | 2 | | |
Short-Term Investments | |
Investment Company | | | 1,125 | | | | — | | | | — | | | | 1,125 | | |
Sovereign | | | — | | | | 51 | | | | — | | | | 51 | | |
Total Short-Term
Investments | | | 1,125 | | | | 51 | | | | — | | | | 1,176 | | |
Foreign Currency
Forward
Exchange
Contracts | | | — | | | | 51 | | | | — | | | | 51 | | |
Total Assets | | | 1,125 | | | | 21,615 | | | | — | | | | 22,740 | | |
Liabilities: | |
Foreign Currency
Forward
Exchange
Contracts | | | — | | | | (61 | ) | | | — | | | | (61 | ) | |
Futures Contract | | | (4 | ) | | | — | | | | — | | | | (4 | ) | |
Total Liabilities | | | (4 | ) | | | (61 | ) | | | — | | | | (65 | ) | |
Total | | $ | 1,121 | | | $ | 21,554 | | | $ | — | | | $ | 22,675 | | |
Transfers between investment levels may occur as the markets fluctuate and/or the availability of data used in an investment's valuation changes. The Portfolio recognizes transfers between the levels as of the end of the period. As
25
Morgan Stanley Institutional Fund, Inc.
Annual Report — December 31, 2016
Notes to Financial Statements (cont'd)
of December 31, 2016, the Portfolio did not have any investments transfer between investment levels.
3. Foreign Currency Translation and Foreign Investments: The books and records of the Portfolio are maintained in U.S. dollars. Foreign currency amounts are translated into U.S. dollars as follows:
– investments, other assets and liabilities at the prevailing rate of exchange on the valuation date;
– investment transactions and investment income at the prevailing rates of exchange on the dates of such transactions.
Although the net assets of the Portfolio are presented at the foreign exchange rates and market values at the close of the period, the Portfolio does not isolate that portion of the results of operations arising as a result of changes in the foreign exchange rates from the fluctuations arising from changes in the market prices of securities held at period end. Similarly, the Portfolio does not isolate the effect of changes in foreign exchange rates from the fluctuations arising from changes in the market prices of securities sold during the period. Accordingly, realized and unrealized foreign currency gains (losses) on investments in securities are included in the reported net realized and unrealized gains (losses) on investment transactions and balances. However, pursuant to U.S. federal income tax regulations, gains and losses from certain foreign currency transactions and the foreign currency portion of gains and losses realized on sales and maturities of foreign denominated debt securities are treated as ordinary income for U.S. federal income tax purposes.
Net realized gains (losses) on foreign currency transactions represent net foreign exchange gains (losses) from foreign currency forward exchange contracts, disposition of foreign currencies, currency gains (losses) realized between the trade and settlement dates on securities transactions, and the difference between the amount of investment income and foreign withholding taxes recorded on the Portfolio's books and the U.S. dollar equivalent amounts actually received or paid. Net unrealized currency gains (losses) from valuing foreign currency denominated assets and liabilities at period end exchange rates are reflected as a component of unrealized appreciation (depreciation) in the Statement of Assets and Liabilities. The change in unrealized currency
gains (losses) on foreign currency translations for the period is reflected in the Statement of Operations.
Foreign security and currency transactions may involve certain considerations and risks not typically associated with those of U.S. dollar denominated transactions as a result of, among other factors, fluctuations of exchange rates in relation to the U.S. dollar, the possibility of lower levels of governmental supervision and regulation of foreign securities markets and the possibility of political or economic instability.
Governmental approval for foreign investments may be required in advance of making an investment under certain circumstances in some countries, and the extent of foreign investments in domestic companies may be subject to limitation in other countries. Foreign ownership limitations also may be imposed by the charters of individual companies to prevent, among other concerns, violations of foreign investment limitations. As a result, an additional class of shares (identified as "Foreign" in the Portfolio of Investments) may be created and offered for investment. The "local" and "foreign shares" market values may differ. In the absence of trading of the foreign shares in such markets, the Portfolio values the foreign shares at the closing exchange price of the local shares.
4. Structured Investments: The Portfolio invested a portion of its assets in structured investments. A structured investment is a derivative security designed to offer a return linked to a particular underlying security, currency, commodity or market. Structured investments may come in various forms including notes (such as exchange-traded notes), warrants and options to purchase securities. The Portfolio will typically use structured investments to gain exposure to a permitted underlying security, currency, commodity or market when direct access to a market is limited or inefficient from a tax or cost standpoint. There can be no assurance that structured investments will trade at the same price or have the same value as the underlying security, currency, commodity or market. Investments in structured investments involve risks including issuer risk, counterparty risk and market risk. Holders of structured investments bear risks of the underlying investment and are subject to issuer or counterparty risk because the Portfolio is relying on the creditworthiness of such issuer or counterparty and has no rights with respect to the underlying investment. Certain structured investments may be
26
Morgan Stanley Institutional Fund, Inc.
Annual Report — December 31, 2016
Notes to Financial Statements (cont'd)
thinly traded or have a limited trading market and may have the effect of increasing the Portfolio's illiquidity to the extent that the Portfolio, at a particular time, may be unable to find qualified buyers for these securities.
5. Derivatives: The Portfolio may, but is not required to, use derivative instruments for a variety of purposes, including hedging, risk management, portfolio management or to earn income. Derivatives are financial instruments whose value is based, in part, on the value of an underlying asset, interest rate, index or financial instrument. Prevailing interest rates and volatility levels, among other things, also affect the value of derivative instruments. A derivative instrument often has risks similar to its underlying asset and may have additional risks, including imperfect correlation between the value of the derivative and the underlying asset, risks of default by the counterparty to certain transactions, magnification of losses incurred due to changes in the market value of the securities, instruments, indices or interest rates to which the derivative instrument relates, risks that the transactions may not be liquid and risks arising from margin requirements. The use of derivatives involves risks that are different from, and possibly greater than, the risks associated with other portfolio investments. Derivatives may involve the use of highly specialized instruments that require investment techniques and risk analyses different from those associated with other portfolio investments. All of the Portfolio's holdings, including derivative instruments, are marked-to-market each day with the change in value reflected in unrealized appreciation (depreciation). Upon disposition, a realized gain or loss is recognized.
Certain derivative transactions may give rise to a form of leverage. Leverage magnifies the potential for gain and the risk of loss. Leverage associated with derivative transactions may cause the Portfolio to liquidate portfolio positions when it may not be advantageous to do so to satisfy its obligations or to meet earmarking or segregation requirements, pursuant to applicable Securities and Exchange Commission rules and regulations, or may cause the Portfolio to be more volatile than if the Portfolio had not been leveraged. Although the Adviser seeks to use derivatives to further the Portfolio's investment objectives, there is no assurance that the use of derivatives will achieve this result.
Following is a description of the derivative instruments and techniques that the Portfolio used during the period and their associated risks:
Foreign Currency Forward Exchange Contracts: In connection with its investments in foreign securities, the Portfolio also entered into contracts with banks, brokers or dealers to purchase or sell securities or foreign currencies at a future date. A foreign currency forward exchange contract ("currency contract") is a negotiated agreement between the contracting parties to exchange a specified amount of currency at a specified future time at a specified rate. The rate can be higher or lower than the spot rate between the currencies that are the subject of the contract. Currency contracts may be used to protect against uncertainty in the level of future foreign currency exchange rates or to gain or modify exposure to a particular currency. To the extent hedged by the use of currency contracts, the precise matching of the currency contract amounts and the value of the securities involved will not generally be possible because the future value of such securities in foreign currencies will change as a consequence of market movements in the value of those securities between the date on which the contract is entered into and the date it matures. Furthermore, such transactions may reduce or preclude the opportunity for gain if the value of the currency should move in the direction opposite to the position taken. There is additional risk to the extent that currency contracts create exposure to currencies in which the Portfolio's securities are not denominated. Unanticipated changes in currency prices may result in poorer overall performance for the Portfolio than if it had not entered into such contracts. The use of currency contracts involves the risk of loss from the insolvency or bankruptcy of the counterparty to the contract or the failure of the counterparty to make payments or otherwise comply with the terms of the contract. A currency contract is marked-to-market daily and the change in market value is recorded by the Portfolio as unrealized gain or loss. The Portfolio records realized gains (losses) when the currency contract is closed equal to the difference between the value of the currency contract at the time it was opened and the value at the time it was closed.
Futures: A futures contract is a standardized, exchange-traded agreement to buy or sell a specific quantity of an underlying asset, reference rate or index at a specific price at a specific future time. The value of a futures
27
Morgan Stanley Institutional Fund, Inc.
Annual Report — December 31, 2016
Notes to Financial Statements (cont'd)
contract tends to increase and decrease in tandem with the value of the underlying instrument. Depending on the terms of the particular contract, futures contracts are settled through either physical delivery of the underlying instrument on the settlement date or by payment of a cash settlement amount on the settlement date. During the period the futures contract is open, payments are received from or made to the broker based upon changes in the value of the contract (the variation margin). A decision as to whether, when and how to use futures contracts involves the exercise of skill and judgment and even a well-conceived futures transaction may be unsuccessful because of market behavior or unexpected events. In addition to the derivatives risks discussed above, the prices of futures contracts can be highly volatile, using futures contracts can lower total return, and the potential loss from futures contracts can exceed the Portfolio's initial investment in such contracts. No assurance can be given that a liquid market will exist for any particular futures contract at any particular time. There is also the risk of loss by the Portfolio of margin deposits in the event of bankruptcy of a broker with which the Portfolio has open positions in the futures contract.
FASB ASC 815, "Derivatives and Hedging" ("ASC 815"), is intended to improve financial reporting about derivative instruments by requiring enhanced disclosures to enable investors to better understand how and why the Portfolio uses derivative instruments, how these derivative instruments are accounted for and their effects on the Portfolio's financial position and results of operations.
The following tables set forth the fair value of the Portfolio's derivative contracts by primary risk exposure as of December 31, 2016.
| | | Asset Derivatives
Statement of Assets and
Liabilities Location | | Primary Risk
Exposure | | Value
(000) | |
Foreign Currency
Forward
Exchange Contracts | | Unrealized Appreciation on
Foreign Currency Forward
Exchange Contracts | | Currency Risk | | $ | 51 | | |
| | | Liability Derivatives
Statement of Assets and
Liabilities Location | | Primary Risk
Exposure | | Value
(000) | |
Foreign Currency
Forward
Exchange Contracts | | Unrealized Depreciation on
Foreign Currency Forward
Exchange Contracts | | Currency Risk | | $ | (61 | ) | |
Futures Contract
| | Variation Margin on
Futures Contract | | Interest Rate Risk | | | (4 | )(a) | |
| | | Total | | | | $ | (65 | ) | |
(a) This amount represents the cumulative appreciation (depreciation) as reported in the Portfolio of Investments. The Statement of Assets and Liabilities only reflects the current day's net variation margin.
The following tables set forth by primary risk exposure the Portfolio's realized gains (losses) and change in unrealized appreciation (depreciation) by type of derivative contract for the year ended December 31, 2016 in accordance with ASC 815.
Realized Gain (Loss) | |
Primary Risk Exposure | | Derivative Type | | Value
(000) | |
Currency Risk
| | Foreign Currency Forward
Exchange Contracts | | $ | (51 | ) | |
Interest Rate Risk | | Futures Contracts | | | (20 | ) | |
| | | Total | | $ | (71 | ) | |
Change in Unrealized Appreciation (Depreciation) | |
Primary Risk Exposure | | Derivative Type | | Value
(000) | |
Currency Risk
| | Foreign Currency Forward
Exchange Contracts | | $ | (21 | ) | |
Interest Rate Risk | | Futures Contracts | | | (4 | ) | |
| | | Total | | $ | (25 | ) | |
At December 31, 2016, the Portfolio's derivative assets and liabilities are as follows:
Gross Amounts of Assets and Liabilities Presented in the
Statement of Assets and Liabilities | |
Derivatives(b) | | Assets(c)
(000) | | Liabilities(c)
(000) | |
Foreign Currency Forward Exchange Contracts | | $ | 51 | | | $ | (61 | ) | |
(b) Excludes exchange traded derivatives.
(c) Absent an event of default or early termination, OTC derivative assets and liabilities are presented gross and not offset in the Statement of Assets and Liabilities.
The Portfolio typically enters into International Swaps and Derivatives Association, Inc. Master Agreements ("ISDA Master Agreements") or similar master agreements (collectively, "Master Agreements") with its contract counterparties for certain OTC derivatives in order to, among other things, reduce its credit risk to counterparties. ISDA Master Agreements include provisions for general obligations, representations, collateral and events of default or termination. Under an ISDA Master Agreement, the Portfolio typically may offset with the counterparty certain OTC derivative financial instruments' payables and/or receivables with collateral held and/or posted and create one single net payment (close-out netting) in the event of default, termination and/or potential deterioration in the credit quality of the counterparty. Various Master Agreements govern the terms of certain transactions with counterparties, including transactions such as swap, forward, repurchase and reverse repurchase agreements. These Master Agreements typically attempt to reduce the counterparty risk associated with such transactions by specifying credit protection mechanisms and providing standardization that improves legal certainty. Cross-termination
28
Morgan Stanley Institutional Fund, Inc.
Annual Report — December 31, 2016
Notes to Financial Statements (cont'd)
provisions under Master Agreements typically provide that a default in connection with one transaction between the Portfolio and a counterparty gives the non-defaulting party the right to terminate any other transactions in place with the defaulting party to create one single net payment due to/due from the defaulting party and may be a feature in certain Master Agreements. In the event the Portfolio exercises its right to terminate a Master Agreement after a counterparty experiences a termination event as defined in the Master Agreement, the return of collateral with market value in excess of the Portfolio's net liability may be delayed or denied.
The following tables present derivative financial instruments that are subject to enforceable netting arrangements as of December 31, 2016.
Gross Amounts Not Offset in the Statement of Assets and Liabilities | |
Counterparty | | Gross Asset
Derivatives
Presented in
Statement of
Assets and
Liabilities
(000) | | Financial
Instrument
(000) | | Collateral
Received
(000) | | Net Amount
(not less
than $0)
(000) | |
Citibank NA | | $ | 1 | | | $ | (1 | ) | | $ | — | | | $ | 0 | | |
JPMorgan Chase Bank NA | | | 48 | | | | (48 | ) | | | — | | | | 0 | | |
State Street Bank and Trust Co. | | | 2 | | | | (— | @) | | | — | | | | 2 | | |
Total | | $ | 51 | | | $ | (49 | ) | | $ | — | | | $ | 2 | | |
Gross Amounts Not Offset in the Statement of Assets and Liabilities | |
Counterparty | | Gross Liability
Derivatives
Presented in
Statement of
Assets and
Liabilities
(000) | | Financial
Instrument
(000) | | Collateral
Pledged
(000) | | Net Amount
(not less
than $0)
(000) | |
Citibank NA | | $ | 9 | | | $ | (1 | ) | | $ | — | | | $ | 8 | | |
JPMorgan Chase Bank NA | | | 52 | | | | (48 | ) | | | — | | | | 4 | | |
State Street Bank and Trust Co. | | | — | @ | | | (— | @) | | | — | | | | 0 | | |
Total | | $ | 61 | | | $ | (49 | ) | | $ | — | | | $ | 12 | | |
@ Amount is less than $500.
For the year ended December 31, 2016, the approximate average monthly amount outstanding for each derivative type is as follows:
Foreign Currency Forward Exchange Contracts: | |
Average monthly principal amount | | $ | 8,728,000 | | |
Futures Contracts: | |
Average monthly original value | | $ | 732,000 | | |
6. Redemption Fees: The Portfolio will assess a 2% redemption fee on Class I shares, Class A shares, Class L shares, Class C shares and Class IS shares, which is paid directly to the Portfolio, for shares redeemed or exchanged
within thirty days of purchase, subject to certain exceptions. The redemption fee is designed to protect the Portfolio and its remaining shareholders from the effects of short-term trading. These fees, if any, are included in the Statements of Changes in Net Assets.
7. Indemnifications: The Fund enters into contracts that contain a variety of indemnifications. The Fund's maximum exposure under these arrangements is unknown. However, the Fund has not had prior claims or losses pursuant to these contracts and expects the risk of loss to be remote.
8. Dividends and Distributions to Shareholders: Dividend income and distributions to shareholders are recorded on the ex-dividend date. Dividends from net investment income, if any, are declared and paid quarterly. Net realized capital gains, if any, are distributed at least annually.
9. Security Transactions, Income and Expenses: Security transactions are accounted for on the trade date (date the order to buy or sell is executed). Realized gains and losses on the sale of investment securities are determined on the specific identified cost method. Dividend income and other distributions are recorded on the ex-dividend date (except for certain foreign dividends which may be recorded as soon as the Portfolio is informed of such dividends) net of applicable withholding taxes. Interest income is recognized on the accrual basis except where collection is in doubt. Discounts are accreted and premiums are amortized over the life of the respective securities. Most expenses of the Fund can be directly attributed to a particular Portfolio. Expenses which cannot be directly attributed are apportioned among the Portfolios based upon relative net assets or other appropriate methods. Income, expenses (other than class specific expenses — distribution and shareholder services, transfer agency and sub transfer agency fees) and realized and unrealized gains or losses are allocated to each class of shares based upon their relative net assets.
B. Advisory Fees: The Adviser, a wholly-owned subsidiary of Morgan Stanley, provides the Portfolio with advisory services under the terms of an Investment Advisory Agreement, paid quarterly, at the annual rate based on the daily net assets as follows:
First $500
million | | Next $500
million | | Over $1
billion | |
| | 0.75 | % | | | 0.70 | % | | | 0.65 | % | |
29
Morgan Stanley Institutional Fund, Inc.
Annual Report — December 31, 2016
Notes to Financial Statements (cont'd)
For the year ended December 31, 2016, the advisory fee rate (net of waivers/rebate) was equivalent to an annual effective rate of 0.00% of the Portfolio's average daily net assets.
The Adviser has agreed to reduce its advisory fee and/or reimburse the Portfolio so that total annual portfolio operating expenses, excluding certain investment related expenses, taxes, interest and other extraordinary expenses (including litigation), will not exceed 0.85% for Class I shares, 1.20% for Class A shares, 1.45% for Class L shares, 1.95% for Class C shares and 0.82% for Class IS shares. For the year ended December 31, 2016, the fee waivers and/or expense reimbursements will continue for at least one year from the date of the Portfolio's prospectus or until such time as the Directors act to discontinue all or a portion of such waivers and/or reimbursements when they deem such action is appropriate. For the year ended December 31, 2016, approximately $176,000 of advisory fees were waived and approximately $9,000 of other expenses were reimbursed by the Adviser pursuant to this arrangement.
C. Administration Fees: The Adviser also serves as Administrator to the Fund and provides administrative services pursuant to an Administration Agreement for an annual fee, accrued daily and paid monthly, of 0.08% of the Portfolio's average daily net assets.
Under a Sub-Administration Agreement between the Administrator and State Street Bank and Trust Company ("State Street"), State Street provides certain administrative services to the Fund. For such services, the Administrator pays State Street a portion of the fee the Administrator receives from the Portfolio.
D. Distribution and Shareholder Services Fees: Morgan Stanley Distribution, Inc. ("MSDI" or the "Distributor"), a wholly-owned subsidiary of the Adviser and an indirect subsidiary of Morgan Stanley, serves as the Fund's Distributor of Portfolio shares pursuant to a Distribution Agreement. The Fund has adopted a Shareholder Services Plan with respect to Class A shares pursuant to Rule 12b-1 under the Act. Under the Shareholder Services Plan, the Portfolio pays the Distributor a shareholder services fee, accrued daily and paid monthly, at an annual rate of 0.25% of the Portfolio's average daily net assets attributable to Class A shares.
The Fund has adopted a Distribution and Shareholder Services Plan with respect to Class L shares pursuant to Rule 12b-1 under the Act. Under the Distribution and Shareholder Services Plan, the Portfolio pays the Distributor a distribution fee, accrued daily and paid monthly, at an annual rate of 0.25% and
a shareholder services fee, accrued daily and paid monthly, at an annual rate of 0.25% of the Portfolio's average daily net assets attributable to Class L shares.
The Fund has adopted a Distribution and Shareholder Services Plan with respect to Class C shares pursuant to Rule 12b-1 under the Act. Under the Distribution and Shareholder Services Plan, the Portfolio pays the Distributor a distribution fee, accrued daily and paid monthly, at an annual rate of 0.75% and a shareholder services fee, accrued daily and paid monthly, at an annual rate of 0.25% of the Portfolio's average daily net assets attributable to Class C shares.
The distribution and shareholder services fees are used to support the expenses associated with servicing and maintaining accounts. The Distributor may compensate other parties for providing shareholder support services to investors who purchase Class A, Class L and Class C shares.
E. Dividend Disbursing and Transfer Agent: The Fund's dividend disbursing and transfer agent is Boston Financial Data Services, Inc. ("BFDS"). Pursuant to a Transfer Agency Agreement, the Fund pays BFDS a fee based on the number of classes, accounts and transactions relating to the Portfolios of the Fund.
F. Custodian Fees: State Street (the "Custodian") serves as Custodian for the Fund in accordance with a Custodian Agreement. The Custodian holds cash, securities, and other assets of the Fund as required by the Act. Custody fees are payable monthly based on assets held in custody, investment purchases and sales activity and account maintenance fees, plus reimbursement for certain out-of-pocket expenses.
In December 2015, the Fund's Custodian announced that it had identified inconsistencies in the way in which clients were invoiced for out-of-pocket from 1998 until November 2015. The dollar amount difference between what was charged and what should have been charged, plus interest, was paid back to the Portfolio in September 2016 as a reimbursement. The Custodian reimbursed the Portfolio directly, which was recognized as a change in accounting estimate and was reflected as "Reimbursement of Custodian Fees" in the Statement of Operations. Pursuant to the expense limitations described in Note B, the Portfolio has experienced waiver of advisory fees and expenses reimbursed by the Adviser during the current period. Accordingly, the reimbursement of out-of-pocket custodian expenses in the current period resulted in the reduction in the current period expenses reimbursed by the Adviser.
30
Morgan Stanley Institutional Fund, Inc.
Annual Report — December 31, 2016
Notes to Financial Statements (cont'd)
G. Security Transactions and Transactions with Affiliates: For the year ended December 31, 2016, purchases and sales of investment securities for the Portfolio, other than long-term U.S. Government securities and short-term investments, were approximately $25,757,000 and $26,648,000, respectively. There were no purchases and sales of long-term U.S. Government securities for the year ended December 31, 2016.
The Portfolio invests in the Institutional Class of the Morgan Stanley Institutional Liquidity Funds (the "Liquidity Funds"), an open-end management investment company managed by the Adviser. Advisory fees paid by the Portfolio are reduced by an amount equal to its pro-rata share of the advisory and administration fees paid by the Portfolio due to its investment in the Liquidity Funds. For the year ended December 31, 2016, advisory fees paid were reduced by approximately $1,000 relating to the Portfolio's investment in the Liquidity Funds.
A summary of the Portfolio's transactions in shares of the Liquidity Funds during the year ended December 31, 2016 is as follows:
Value
December 31,
2015
(000) | | Purchases
at Cost
(000) | | Sales
(000) | | Dividend
Income
(000) | | Value
December 31,
2016
(000) | |
| $ | 315 | | | $ | 17,620 | | | $ | 16,810 | | | $ | 1 | | | $ | 1,125 | | |
The Portfolio is permitted to purchase and sell securities ("cross-trade") from and to other Morgan Stanley Funds as well as other funds and client accounts for which the Adviser or an affiliate of the Adviser serves as investment adviser, pursuant to procedures approved by the Directors in compliance with Rule 17a-7 under the Act (the "Rule"). Each cross-trade is executed at the current market price in compliance with provisions of the Rule. For the year ended December 31, 2016, the Portfolio did not engage in any cross-trade transactions.
The Portfolio has an unfunded Deferred Compensation Plan (the "Compensation Plan"), which allows each independent Director to defer payment of all, or a portion, of the fees he or she receives for serving on the Board of Directors. Each eligible Director generally may elect to have the deferred amounts credited with a return equal to the total return on one or more of the Morgan Stanley funds that are offered as investment options under the Compensation Plan. Appreciation/depreciation and distributions received from these investments are recorded with an offsetting increase/decrease in the deferred compensation obligation and do not affect the NAV of the Portfolio.
H. Federal Income Taxes: It is the Portfolio's intention to continue to qualify as a regulated investment company and distribute all of its taxable and tax-exempt income. Accordingly, no provision for federal income taxes is required in the financial statements.
The Portfolio may be subject to taxes imposed by countries in which it invests. Such taxes are generally based on income and/or capital gains earned or repatriated. Taxes are accrued based on net investment income, net realized gains and net unrealized appreciation as such income and/or gains are earned. Taxes may also be based on transactions in foreign currency and are accrued based on the value of investments denominated in such currency.
FASB ASC 740-10, "Income Taxes — Overall", sets forth a minimum threshold for financial statement recognition of the benefit of a tax position taken or expected to be taken in a tax return. Management has concluded that there are no significant uncertain tax positions that would require recognition in the financial statements. If applicable, the Portfolio recognizes interest accrued related to unrecognized tax benefits in "Interest Expense" and penalties in "Other Expenses" in the Statement of Operations. The Portfolio files tax returns with the U.S. Internal Revenue Service, New York and various states. Generally, each of the tax years in the four-year period ended December 31, 2016, remains subject to examination by taxing authorities.
The tax character of distributions paid may differ from the character of distributions shown in the Statements of Changes in Net Assets due to short-term capital gains being treated as ordinary income for tax purposes. The tax character of distributions paid during fiscal years 2016 and 2015 was as follows:
2016
Distributions
Paid From: | | 2015
Distributions
Paid From: | |
Ordinary
Income
(000) | | Long-Term
Capital Gain
(000) | | Ordinary
Income
(000) | | Long-Term
Capital Gain
(000) | |
| $ | 1,380 | | | $ | — | | | $ | 1,646 | | | $ | — | | |
The amount and character of income and gains to be distributed are determined in accordance with income tax regulations which may differ from GAAP. These book/tax differences are either considered temporary or permanent in nature.
Temporary differences are primarily due to differing book and tax treatments in the timing of the recognition of gains (losses) on certain investment transactions and the timing of the deductibility of certain expenses.
31
Morgan Stanley Institutional Fund, Inc.
Annual Report — December 31, 2016
Notes to Financial Statements (cont'd)
Permanent differences, primarily due to differing treatments of gains (losses) related to foreign currency transactions, resulted in the following reclassifications among the components of net assets at December 31, 2016:
Distributions
in Excess of
Net Investment
Income
(000) | | Accumulated
Net Realized
Loss
(000) | | Paid-in-
Capital
(000) | |
| $ | (348 | ) | | $ | 348 | | | $ | — | | |
At December 31, 2016, the Portfolio had no distributable earnings on a tax basis.
At December 31, 2016, the Portfolio had available for federal income tax purposes unused short-term capital losses of approximately $1,383,000 and long-term capital losses of approximately $3,723,000 that do not have an expiration date. These amounts include capital losses acquired from MSIF Emerging Markets Domestic Debt that may be subject to limitation under IRC Section 382 in future years.
To the extent that capital loss carryforwards are used to offset any future capital gains realized, no capital gains tax liability will be incurred by the Portfolio for gains realized and not distributed. To the extent that capital gains are offset, such gains will not be distributed to the shareholders.
During the year ended December 31, 2016, the Portfolio utilized capital loss carryforwards for U.S. federal income tax purposes of approximately $583,000.
Qualified late year losses are capital losses and specified ordinary losses, including currency losses, incurred after October 31 but within the taxable year that, if elected, are deemed to arise on the first day of the Portfolio's next taxable year. For the year ended December 31, 2016, the Portfolio deferred to January 1, 2017 for U.S. federal income tax purposes the following losses:
Qualified Late
Year Ordinary
Losses
(000) | | Post-October
Capital
Losses
(000) | |
| $ | 7 | | | $ | — | | |
I. Credit Facility: As of April 4, 2016, the Fund and other Morgan Stanley funds participated in a $150,000,000 committed, unsecured revolving line of credit facility (the "facility") with State Street. This facility is to be used for temporary
emergency purposes or funding of shareholder redemption requests. The interest rate on borrowings is based on the federal funds rate or one month libor rate plus a spread. The facility also has a commitment fee of 0.25% per annum based on the unused portion of the facility. During the year ended December 31, 2016, the Portfolio did not have any borrowings under the facility.
J. Other: At December 31, 2016, the Portfolio did not have record owners of 10% or greater.
K. Accounting Pronouncements: In December 2016, FASB issued Accounting Standards update 2016-19 — Technical Corrections and Improvements ("ASU 2016-19"), which is effective for interim periods for all entities beginning after December 15, 2016. ASU 2016-19 includes an amendment to Topic 820, Fair Value Measurement, which clarifies the difference between a valuation approach and a valuation technique when applying the guidance in that Topic. That amendment also requires an entity to disclose when there has been a change in either or both a valuation approach and/or a valuation technique. The transition guidance for the amendment must be applied prospectively because it could potentially involve the use of hindsight that includes fair value measurements. Although still evaluating the potential impacts of ASU 2016-19 to the Portfolio, management expects that the impact of the Portfolio's adoption will be limited to additional financial statement disclosures.
In October 2016, the Securities and Exchange Commission ("SEC") issued a new rule, Investment Company Reporting Modernization, which, among other provisions, amends Regulation S-X to require standardized, enhanced disclosures, particularly related to derivatives, in investment company financial statements. Compliance with the guidance is effective for financial statements filed with the SEC on or after August 1, 2017; adoption will have no effect on the Portfolio's net assets or results of operations. Although still evaluating the potential impacts of the Investment Company Reporting Modernization to the Portfolio, management expects that the impact of the Portfolio's adoption will be limited to additional financial statement disclosures.
32
Morgan Stanley Institutional Fund, Inc.
Annual Report — December 31, 2016
Report of Independent Registered Public Accounting Firm
To the Shareholders and Board of Directors of
Morgan Stanley Institutional Fund, Inc. —
Emerging Markets Fixed Income Opportunities Portfolio
We have audited the accompanying statement of assets and liabilities, including the portfolio of investments, of Emerging Markets Fixed Income Opportunities Portfolio (one of the portfolios constituting Morgan Stanley Institutional Fund, Inc.) (the "Portfolio") as of December 31, 2016, and the related statement of operations for the year then ended, the statements of changes in net assets for each of the two years in the period then ended and the financial highlights for each of the years or periods indicated therein. These financial statements and financial highlights are the responsibility of the Portfolio's management. Our responsibility is to express an opinion on these financial statements and financial highlights based on our audits.
We conducted our audits in accordance with the standards of the Public Company Accounting Oversight Board (United States). Those standards require that we plan and perform the audit to obtain reasonable assurance about whether the financial statements and financial highlights are free of material misstatement. We were not engaged to perform an audit of the Portfolio's internal control over financial reporting. Our audits included consideration of internal control over financial reporting as a basis for designing audit procedures that are appropriate in the circumstances, but not for the purpose of expressing an opinion on the effectiveness of the Portfolio's internal control over financial reporting. Accordingly, we express no such opinion. An audit also includes examining, on a test basis, evidence supporting the amounts and disclosures in the financial statements and financial highlights, assessing the accounting principles used and significant estimates made by management, and evaluating the overall financial statement presentation. Our procedures included confirmation of securities owned as of December 31, 2016, by correspondence with the custodian and others or by other appropriate auditing procedures where replies from others were not received. We believe that our audits provide a reasonable basis for our opinion.
In our opinion, the financial statements and financial highlights referred to above present fairly, in all material respects, the financial position of Emerging Markets Fixed Income Opportunities Portfolio (one of the portfolios constituting Morgan Stanley Institutional Fund, Inc.) at December 31, 2016, the results of its operations for the year then ended, the changes in its net assets for each of the two years in the period then ended and the financial highlights for each of the years or periods indicated therein, in conformity with U.S. generally accepted accounting principles.

Boston, Massachusetts
February 28, 2017
33
Morgan Stanley Institutional Fund, Inc.
Annual Report — December 31, 2016
Privacy Notice (unaudited)
MORGAN STANLEY INVESTMENT MANAGEMENT INC.
AN IMPORTANT NOTICE CONCERNING OUR U.S. PRIVACY POLICY
We are required by federal law to provide you with a copy of our privacy policy annually. This policy applies to current and former individual investors in funds managed or sponsored by Morgan Stanley Investment Management Inc. ("MSIM") as well as current and former individual clients of MSIM. This policy is not applicable to partnerships, corporations, trusts or other non-individual clients or investors. Please note that we may amend this policy at any time, and will inform you of any changes as required by law.
WE RESPECT YOUR PRIVACY
We appreciate that you have provided us with your personal financial information. We strive to maintain the privacy of such information while we help you achieve your financial objectives. This Notice describes what non-public personal information we collect about you, why we collect it, when we may share it with others and how certain others may use it. It discusses the steps you may take to limit our sharing of certain information about you to affiliated companies in the Morgan Stanley family of companies ("other Morgan Stanley companies"). It also discloses how you may limit use of certain shared information for marketing purposes by other Morgan Stanley branded companies. Throughout this policy, we refer to the non-public information that personally identifies you or your accounts as "personal information."
1. WHAT PERSONAL INFORMATION DO WE COLLECT ABOUT YOU?
We obtain personal information from applications and other forms you submit to us, from your dealings with us, from consumer reporting agencies, from our Web sites and from third parties and other sources.
For example:
• We may collect information such as your name, address, e-mail address, telephone/fax numbers, assets, income and investment objectives through subscription documents, applications and other forms you submit to us.
• We may obtain information about account balances, your use of account(s) and the types of products and services you prefer to receive from us through your dealings and transactions with us and other sources.
• We may obtain information about your creditworthiness and credit history from consumer reporting agencies.
• We may collect background information from and through third-party vendors to verify representations you have made and to comply with various regulatory requirements.
• If you interact with us through our public and private Web sites, we may collect information that you provide directly through online communications (such as an e-mail address). We may also collect information about your Internet service provider, your domain name, your computer's operating system and Web browser, your use of our Web sites and your product and service preferences, through the use of "cookies." Please consult the Terms of Use of these sites for more details.
2. WHEN DO WE DISCLOSE PERSONAL INFORMATION WE COLLECT ABOUT YOU?
We may disclose personal information we collect about you to other Morgan Stanley companies and to non-affiliated third parties.
a. Information We Disclose to Other Morgan Stanley Companies.
We may disclose personal information to other Morgan Stanley companies for a variety of reasons, including to manage your account(s) effectively, to service and process your transactions, to let you know about products and services offered by us and other Morgan Stanley companies, to manage our business, and as otherwise required or permitted by law. Offers for products and services from other Morgan Stanley companies are developed under conditions designed to safeguard your personal information.
34
Morgan Stanley Institutional Fund, Inc.
Annual Report — December 31, 2016
Privacy Notice (unaudited) (cont'd)
b. Information We Disclose to Non-affiliated Third Parties.
We do not disclose personal information that we collect about you to non-affiliated third parties except to those who provide marketing services on our behalf, to financial institutions with whom we have joint marketing agreements, and as otherwise required or permitted by law. For example, we may disclose personal information to nonaffiliated third parties for servicing and processing transactions, to offer our own products and services, to protect against fraud, for institutional risk control, to respond to judicial process or to perform services on our behalf. When we share personal information with a non-affiliated third party, they are required to limit their use of personal information to the particular purpose for which it was shared and they are not allowed to share personal information with others except to fulfill that limited purpose or as may be permitted or required by law.
3. HOW DO WE PROTECT THE SECURITY AND CONFIDENTIALITY OF PERSONAL INFORMATION WE COLLECT ABOUT YOU?
We maintain physical, electronic and procedural security measures to help safeguard the personal information we collect about you. We have internal policies governing the proper handling of client information. Third parties that provide support or marketing services on our behalf may also receive personal information, and we require them to adhere to confidentiality standards with respect to such information.
4. HOW CAN YOU LIMIT THE SHARING OF CERTAIN TYPES OF PERSONAL INFORMATION WITH OTHER MORGAN STANLEY COMPANIES?
We offer you choices as to whether we share with other Morgan Stanley companies the personal information that was collected to determine your eligibility for products and services you request ("eligibility information"). Eligibility information does not include your identification information or personal information pertaining to our transactions or experiences with you. Please note that, even if you direct us not to share eligibility information with other Morgan Stanley companies ("opt-out"), we may still share personal information, including eligibility information, with those companies in circumstances excluded from the opt-out under applicable law, such as to process transactions or to service your account.
5. HOW CAN YOU LIMIT THE USE OF CERTAIN TYPES OF PERSONAL INFORMATION BY OTHER MORGAN STANLEY COMPANIES FOR MARKETING?
By following the opt-out instructions in Section 6 below, you may limit other Morgan Stanley branded companies from marketing their products or services to you based on personal information we disclose to them. This information may include, for example, your income and account history with us. Please note that, even if you choose to limit Other Morgan Stanley Companies from using personal information about you that we may share with them for marketing their products and services to you, Other Morgan Stanley Companies may use your personal information that they obtain from us to market to you in circumstances permitted by law, such as if the Other Morgan Stanley Company has its own relationship with you.
6. HOW CAN YOU SEND US AN OPT-OUT INSTRUCTION?
If you wish to limit our sharing of eligibility information about you with other Morgan Stanley companies or other Morgan Stanley companies' use of personal information for marketing purposes, as described in this notice, you may do so by:
• Calling us at (800) 548-7786
Monday–Friday between 8a.m. and 6p.m.(EST)
• Writing to us at the following address:
Boston Financial Data Services, Inc.
c/o Privacy Coordinator
P.O. Box 219804
Kansas City, Missouri 64121
35
Morgan Stanley Institutional Fund, Inc.
Annual Report — December 31, 2016
Privacy Notice (unaudited) (cont'd)
Your written request should include your name, address, telephone number and account number(s) to which the opt-out applies and whether you are opting out with respect to sharing of eligibility information (Section 4 above), or if information used for Marketing (Section 5 above) or both. Written opt-out requests should not be sent with any other correspondence. In order to process your request, we require that the request be provided by you directly and not through a third party.
Your opt-out preference will remain in effect with respect to this policy (as it may be amended) until you notify us otherwise. If you have a joint account, your direction for us not to share this information with other Morgan Stanley companies and for those other Morgan Stanley companies not to use your personal information for marketing will be applied to all account holders on that account. Please understand that if you limit our sharing or our affiliated companies' use of personal information, you and any joint account holder(s) may not receive information about Morgan Stanley products and services, including products or services that could help you manage your financial resources and achieve your investment objectives.
7. WHAT IF AN AFFILIATED COMPANY BECOMES A NON-AFFILIATED THIRD PARTY?
If, at any time in the future, an affiliated company becomes a non-affiliated third party, further disclosures of personal information made to the former affiliated company will be limited to those described in Section 2(b) above relating to non-affiliated third parties. If you elected under Section 6 to limit disclosures we make to affiliated companies, or use of personal information by affiliated companies, your election will not apply to use by any former affiliated company of your personal information in their possession once it becomes a non-affiliated third party.
SPECIAL NOTICE TO RESIDENTS OF VERMONT
The following section supplements our policy with respect to our individual clients who have a Vermont address and supersedes anything to the contrary in the above policy with respect to those clients only.
The state of Vermont requires financial institutions to obtain your consent prior to sharing personal information that they collect about you with affiliated companies and non-affiliated third parties other than in certain limited circumstances. Except as permitted by law, we will not share personal information we collect about you with non-affiliated third parties or other Morgan Stanley companies unless you provide us with your written consent to share such information ("opt-in").
If you wish to receive offers for investment products and services offered by or through other Morgan Stanley companies, please notify us in writing at the following address:
Boston Financial Data Services, Inc.
c/o Privacy Coordinator
P.O. Box 219804
Kansas City, Missouri 64121
Your authorization should include your name, address, telephone number and account number(s) to which the opt-in applies and should not be sent with any other correspondence. In order to process your authorization, we require that the authorization be provided by you directly and not through a third party.
SPECIAL NOTICE TO RESIDENTS OF CALIFORNIA
The following section supplements our policy with respect to our individual clients who have a California address and supersedes anything to the contrary in the above policy with respect to those clients only.
In response to a California law, if your account has a California home address, your personal information will not be disclosed to nonaffiliated third parties except as permitted by applicable California law, and we will limit sharing such information with our affiliates to comply with California privacy laws that apply to us.
36
Morgan Stanley Institutional Fund, Inc.
Annual Report — December 31, 2016
Director and Officer Information (unaudited)
Independent Directors:
Name, Age and Address of
Independent Director | | Position(s)
Held with
Registrant | | Length of Time
Served* | | Principal Occupation(s) During Past 5 Years
and Other Relevant Professional Experience | | Number of
Portfolios in
Fund Complex
Overseen by
Independent
Director** | | Other Directorships
Held by Independent
Director*** | |
Frank L. Bowman (72)
c/o Perkins Coie LLP
Counsel to the Independent
Directors
30 Rockefeller Plaza
New York, NY 10112 | | Director | | Since
August
2006 | | President, Strategic Decisions, LLC (consulting) (since February 2009); Director or Trustee of various Morgan Stanley Funds (since August 2006); Chairperson of the Compliance and Insurance Committee (since October 2015); formerly, Chairperson of the Insurance Sub-Committee of the Compliance and Insurance Committee (2007-2015); served as President and Chief Executive Officer of the Nuclear Energy Institute (policy organization) (February 2005-November 2008); retired as Admiral, U.S. Navy after serving over 38 years on active duty including 8 years as Director of the Naval Nuclear Propulsion Program in the Department of the Navy and the U.S. Department of Energy (1996-2004); served as Chief of Naval Personnel (July 1994-September 1996) and on the Joint Staff as Director of Political Military Affairs (June 1992-July 1994); knighted as Honorary Knight Commander of the Most Excellent Order of the British Empire; awarded the Officier de l'Orde National du Mérite by the French Government; elected to the National Academy of Engineering (2009). | | | 90 | | | Director of BP p.l.c.; Director of Naval and Nuclear Technologies LLP; Director Emeritus of the Armed Services YMCA; Director of the U.S. Naval Submarine League; Member of the National Security Advisory Council of the Center for U.S. Global Engagement and a member of the CNA Military Advisory Board; Chairman of the charity J Street Cup Golf; Trustee of Fairhaven United Methodist Church; and Director of other various non-profit organizations. | |
Kathleen A. Dennis (63)
c/o Perkins Coie LLP
Counsel to the Independent Directors
30 Rockefeller Plaza
New York, NY 10112 | | Director | | Since
August
2006 | | President, Cedarwood Associates (mutual fund and investment management consulting) (since July 2006); Chairperson of the Liquidity and Alternatives Sub-Committee of the Investment Committee (since October 2006) and Director or Trustee of various Morgan Stanley Funds (since August 2006); formerly, Senior Managing Director of Victory Capital Management (1993-2006). | | | 91 | | | Director of various non-profit organizations. | |
Nancy C. Everett (61)
c/o Perkins Coie LLP
Counsel to the Independent Directors
30 Rockefeller Plaza
New York, NY 10112 | | Director | | Since
January
2015 | | Chief Executive Officer, Virginia Commonwealth University Investment Company (since November 2015); Owner, OBIR, LLC (institutional investment management consulting) (since June 2014); formerly, Managing Director, BlackRock Inc. (February 2011-December 2013); and Chief Executive Officer, General Motors Asset Management (a/k/a Promark Global Advisors, Inc.) (June 2005-May 2010). | | | 91 | | | Member of Virginia Commonwealth University School of Business Foundation; formerly, Member of Virginia Commonwealth University Board of Visitors (2013-2015); Member of Committee on Directors for Emerging Markets Growth Fund, Inc. (2007-2010); Chairperson of Performance Equity Management, LLC (2006-2010); and Chairperson, GMAM Absolute Return Strategies Fund, LLC (2006-2010). | |
37
Morgan Stanley Institutional Fund, Inc.
Annual Report — December 31, 2016
Director and Officer Information (unaudited) (cont'd)
Independent Directors: (cont'd)
Name, Age and Address of
Independent Director | | Position(s)
Held with
Registrant | | Length of Time
Served* | | Principal Occupation(s) During Past 5 Years
and Other Relevant Professional Experience | | Number of
Portfolios in
Fund Complex
Overseen by
Independent
Director** | | Other Directorships
Held by Independent
Director*** | |
Jakki L. Haussler (59)
c/o Perkins Coie LLP
Counsel to the Independent Directors
30 Rockefeller Plaza
New York, NY 10112 | | Director | | Since
January
2015 | | Chairman and Chief Executive Officer, Opus Capital Group (since January 1996); formerly, Director, Capvest Venture Fund, LP (May 2000-December 2011); Partner, Adena Ventures, LP (July 1999-December 2010); Director, The Victory Funds (February 2005-July 2008). | | | 91 | | | Director of Cincinnati Bell Inc. and Member, Audit Committee and Compensation Committee; Director of Northern Kentucky University Foundation and Member, Investment Committee; Member of Chase College of Law Transactional Law Practice Center Board of Advisors; Director of Best Transport; Director of Chase College of Law Board of Visitors; formerly, Member, University of Cincinnati Foundation Investment Committee; Member, Miami University Board of Visitors (2008-2011); Trustee of Victory Funds (2005-2008) and Chairman, Investment Committee (2007-2008) and Member, Service Provider Committee (2005-2008). | |
Dr. Manuel H. Johnson (67)
c/o Johnson Smick
International, Inc.
220 I Street, N.E. — Suite 200
Washington, D.C. 20002 | | Director | | Since
July
1991 | | Senior Partner, Johnson Smick International, Inc. (consulting firm); Chairperson of the Investment Committee (since October 2006) and Director or Trustee of various Morgan Stanley Funds (since July 1991); Co-Chairman and a founder of the Group of Seven Council (G7C) (international economic commission); formerly, Chairperson of the Audit Committee (July 1991-September 2006), Vice Chairman of the Board of Governors of the Federal Reserve System and Assistant Secretary of the U.S. Treasury. | | | 91 | | | Director of NVR, Inc. (home construction). | |
Joseph J. Kearns (74)
c/o Kearns & Associates LLC
46 E Peninsula Center #385
Rolling Hills Estates, CA 90274-3712 | | Director | | Since
August
1994 | | President, Kearns & Associates LLC (investment consulting); Chairperson of the Audit Committee (since October 2006) and Director or Trustee of various Morgan Stanley Funds (since August 1994); formerly, Deputy Chairperson of the Audit Committee (July 2003-September 2006) and Chairperson of the Audit Committee of various Morgan Stanley Funds (since August 1994); CFO of the J. Paul Getty Trust. | | | 93 | | | Director of Electro Rent Corporation (equipment leasing). Prior to December 31, 2013, Director of The Ford Family Foundation. | |
38
Morgan Stanley Institutional Fund, Inc.
Annual Report — December 31, 2016
Director and Officer Information (unaudited) (cont'd)
Independent Directors: (cont'd)
Name, Age and Address of
Independent Director | | Position(s)
Held with
Registrant | | Length of Time
Served* | | Principal Occupation(s) During Past 5 Years
and Other Relevant Professional Experience | | Number of
Portfolios in
Fund Complex
Overseen by
Independent
Director** | | Other Directorships
Held by Independent
Director*** | |
Michael F. Klein (58)
c/o Perkins Coie LLP
Counsel to the Independent Directors
30 Rockefeller Plaza
New York, NY 10112 | | Director | | Since
August
2006 | | Managing Director, Aetos Capital, LLC (since March 2000); Co-President, Aetos Alternatives Management, LLC (since January 2004) and Co-Chief Executive Officer of Aetos Capital LLC (since August 2013); Chairperson of the Fixed Income Sub-Committee of the Investment Committee (since October 2006) and Director or Trustee of various Morgan Stanley Funds (since August 2006); formerly, Managing Director, Morgan Stanley & Co. Inc. and Morgan Stanley Dean Witter Investment Management, President, various Morgan Stanley Funds (June 1998-March 2000) and Principal, Morgan Stanley & Co. Inc. and Morgan Stanley Dean Witter Investment Management (August 1997-December 1999). | | | 90 | | | Director of certain investment funds managed or sponsored by Aetos Capital, LLC; Director of Sanitized AG and Sanitized Marketing AG (specialty chemicals). | |
Patricia Maleski (56)
c/o Perkins Coie LLP
Counsel to the Independent Directors
30 Rockefeller Plaza
New York, NY 10112 | | Director | | Since
January
2017 | | Management Director, JPMorgan Asset Management (2013-2016); President, JPMorgan Funds (2010-2013), Chief Administrative Officer, JPMorgan Funds (2004-2010), Treasurer, JPMorgan Funds (2003-2004, 2008-2010), and Vice President and Board Liaison, JPMorgan Funds (2001-2004); Managing Director, J.P. Morgan Investment Management Inc. (2001-2013); Vice President of Finance, Pierpont Group (1996-2001); Vice President, Bank of New York (1995-1996); Senior Audit Manager, Price Waterhouse, LLP (1982-1995). | | | 91 | | | None. | |
Michael E. Nugent (80)
522 Fifth Avenue
New York, NY 10036 | | Chair of the Board and Director | | Chair of the Boards since July 2006 and Director since July 1991 | | Chair of the Boards of various Morgan Stanley Funds (since July 2006); Chairperson of the Closed-End Fund Committee (since June 2012) and Director or Trustee of various Morgan Stanley Funds (since July 1991); formerly, Chairperson of the Insurance Committee (until July 2006); General Partner, Triumph Capital, L.P. (private investment partnership) (1988-2013). | | | 92 | | | None. | |
W. Allen Reed (69)
c/o Perkins Coie LLP
Counsel to the Independent Directors
30 Rockefeller Plaza
New York, NY 10112 | | Director | | Since
August
2006 | | Chairperson of the Equity Sub-Committee of the Investment Committee (since October 2006) and Director or Trustee of various Morgan Stanley Funds (since August 2006); formerly, President and CEO of General Motors Asset Management; Chairman and Chief Executive Officer of the GM Trust Bank and Corporate Vice President of General Motors Corporation (August 1994-December 2005). | | | 91 | | | Director of Legg Mason, Inc.; formerly, Director of the Auburn University Foundation (2010-2015). | |
Fergus Reid (84)
c/o Joe Pietryka, Inc.
85 Charles Colman Blvd.
Pawling, NY 12564 | | Director | | Since
June
1992 | | Chairman, Joe Pietryka, Inc.; Chairperson of the Governance Committee and Director or Trustee of various Morgan Stanley Funds (since June 1992). | | | 92 | | | Formerly, Trustee and Director of certain investment companies in the JP Morgan Fund Complex managed by JP Morgan Investment Management Inc. (1987-2012). | |
* This is the earliest date the Director began serving the Morgan Stanley Funds. Each Director serves an indefinite term, until his or her successor is elected.
** The Fund Complex includes (as of December 31, 2016) all open-end and closed-end funds (including all of their portfolios) advised by Morgan Stanley Investment Management Inc. (the "Adviser") and any funds that have an adviser that is an affiliated person of the Adviser (including, but not limited to, Morgan Stanley AIP GP LP).
*** This includes any directorships at public companies and registered investment companies held by the Director at any time during the past five years.
39
Morgan Stanley Institutional Fund, Inc.
Annual Report — December 31, 2016
Director and Officer Information (unaudited) (cont'd)
Executive Officers:
Name, Age and Address of Executive Officer | | Position(s) Held
with
Registrant | | Length of Time
Served* | | Principal Occupation(s) During Past 5 Years | |
John H. Gernon (53)
522 Fifth Avenue
New York, NY 10036 | | President and Principal Executive Officer | | Since
September
2013 | | President and Principal Executive Officer of the Equity and Fixed Income Funds and the Morgan Stanley AIP Funds (since September 2013) and the Liquidity Funds and various money market funds (since May 2014) in the Fund Complex; Managing Director of the Adviser; Head of Product (since 2006). | |
Timothy J. Knierim (58)
522 Fifth Avenue
New York, NY 10036 | | Chief Compliance Officer | | Since
December
2016 | | Managing Director of the Adviser and various entities affiliated with the Adviser; Chief Compliance Officer of various Morgan Stanley Funds and the Adviser (since December 2016) and Chief Compliance Officer of Morgan Stanley AIP GP LP (since 2014). Formerly, Managing Director and Deputy Chief Compliance Officer of the Adviser (2014-2016); and formerly, Chief Compliance Officer of Prudential Investment Management, Inc. (2007-2014). | |
Francis J. Smith (51)
522 Fifth Avenue
New York, NY 10036 | | Treasurer and Principal Financial Officer | | Treasurer since July 2003 and Principal Financial Officer since September 2002 | | Managing Director of the Adviser and various entities affiliated with the Adviser; Treasurer (since July 2003) and Principal Financial Officer of various Morgan Stanley Funds (since September 2002). | |
Mary E. Mullin (49)
522 Fifth Avenue
New York, NY 10036 | | Secretary | | Since
June
1999 | | Executive Director of the Adviser; Secretary of various Morgan Stanley Funds (since June 1999). | |
* This is the earliest date the officer began serving the Morgan Stanley Funds. Each officer serves a one-year term, until his or her successor is elected and qualifies.
40
Morgan Stanley Institutional Fund, Inc.
Annual Report — December 31, 2016
Adviser and Administrator
Morgan Stanley Investment Management Inc.
522 Fifth Avenue
New York, New York 10036
Distributor
Morgan Stanley Distribution, Inc.
522 Fifth Avenue
New York, New York 10036
Dividend Disbursing and Transfer Agent
Boston Financial Data Services, Inc.
2000 Crown Colony Drive
Quincy, Massachusetts 02169
Custodian
State Street Bank and Trust Company
One Lincoln Street
Boston, Massachusetts 02111
Legal Counsel
Dechert LLP
1095 Avenue of the Americas
New York, New York 10036
Counsel to the Independent Directors
Perkins Coie LLP
30 Rockefeller Plaza
New York, New York 10112
Independent Registered Public Accounting Firm
Ernst & Young LLP
200 Clarendon Street
Boston, Massachusetts 02116
Reporting to Shareholders
Each Morgan Stanley fund provides a complete schedule of portfolio holdings in its semi-annual and annual reports within 60 days of the end of the fund's second and fourth fiscal quarters. The semi-annual and annual reports are filed electronically with the Securities and Exchange Commission (SEC) on Form N-CSRS and Form N-CSR, respectively. Morgan Stanley also delivers the semi-annual and annual reports to fund shareholders and makes these reports available on its public website, www.morganstanley.com/im. Each Morgan Stanley fund also files a complete schedule of portfolio holdings with the SEC for the fund's first and third fiscal quarters on Form N-Q. Morgan Stanley does not deliver the reports for the first and third fiscal quarters to shareholders, nor are the reports posted to the Morgan Stanley public website. You may, however, obtain the Form N-Q filings (as well as the Form N-CSR and N-CSRS filings) by accessing the SEC's website, www.sec.gov. You may also review and copy them at the SEC's Public Reference Room in Washington, DC. Information on the operation of the SEC's Public Reference Room may be obtained by calling the SEC toll free at 1 (800) SEC-0330. You can also request copies of these materials, upon payment of a duplicating fee, by electronic request at the SEC's email address (publicinfo@sec.gov) or by writing the Public Reference Room of the SEC, 100 F Street, NE, Washington, DC 20549-0102.
Proxy Voting Policies and Procedures and Proxy Voting Record
You may obtain a copy of the Fund's Proxy Voting Policy and Procedures and information regarding how the Fund voted proxies relating to portfolio securities during the most recent twelve-month period ended June 30, without charge, upon request, by calling toll free 1 (800) 548-7786 or by visiting our website at www.morganstanley.com/im. This information is also available on the SEC's website at www.sec.gov.
This report is authorized for distribution only when preceded or accompanied by a prospectus or summary prospectus of the applicable Portfolio of Morgan Stanley Institutional Fund, Inc., which describes in detail the Portfolio's investment policies, risks, fees and expenses. Please read the prospectus carefully before you invest or send money. For additional information, including information regarding the investments comprising the Portfolio, please visit our website at www.morganstanley.com/im or call toll free 1 (800) 548-7786.
41
Printed in U.S.A.
This Report has been prepared for shareholders and may be distributed to others only if preceded or accompanied by a current prospectus.
Morgan Stanley Investment Management Inc.
522 Fifth Avenue
New York, New York 10036
© 2017 Morgan Stanley. Morgan Stanley Distribution, Inc.

IFIEMEDANN
1698757 EXP. 02.28.18

Morgan Stanley Institutional Fund, Inc.
Emerging Markets Leaders Portfolio
Annual Report
December 31, 2016

Morgan Stanley Institutional Fund, Inc.
Annual Report — December 31, 2016
Shareholders' Letter | | | 2 | | |
Expense Example | | | 3 | | |
Investment Overview | | | 4 | | |
Portfolio of Investments | | | 6 | | |
Statement of Assets and Liabilities | | | 7 | | |
Statement of Operations | | | 9 | | |
Statements of Changes in Net Assets | | | 10 | | |
Financial Highlights | | | 12 | | |
Notes to Financial Statements | | | 16 | | |
Report of Independent Registered Public Accounting Firm | | | 24 | | |
Federal Tax Notice | | | 25 | | |
Privacy Notice | | | 26 | | |
Director and Officer Information | | | 29 | | |
This report is authorized for distribution only when preceded or accompanied by a prospectus or summary prospectus of the applicable Portfolio of Morgan Stanley Institutional Fund, Inc. To receive a prospectus and/or statement of additional information (SAI), which contains more complete information such as investment objectives, charges, expenses, policies for voting proxies, risk considerations, and describes in detail each of the Portfolio's investment policies to the prospective investor, please call toll free 1 (800) 548-7786. Please read the prospectuses carefully before you invest or send money.
Additionally, you can access information about the Portfolio, including performance, characteristics, and investment team commentary, through Morgan Stanley Investment Management's website: www.morganstanley.com/im.
Market forecasts provided in this report may not necessarily come to pass. There is no guarantee that any sectors mentioned will continue to perform as discussed herein or that securities in such sectors will be held by the Portfolio in the future. There is no assurance that a Portfolio will achieve its investment objective. Portfolios are subject to market risk, which is the possibility that market values of securities owned by the Portfolio will decline and, therefore, the value of the Portfolio's shares may be less than what you paid for them. Accordingly, you can lose money investing in this Portfolio. Please see the prospectus for more complete information on investment risks.
1
Morgan Stanley Institutional Fund, Inc.
Annual Report — December 31, 2016
Shareholders' Letter (unaudited)
Dear Shareholders,
We are pleased to provide this Annual report, in which you will learn how your investment in Emerging Markets Leaders Portfolio (the "Portfolio") performed during the latest twelve-month period.
Morgan Stanley Investment Management is a client-centric, investor-led organization. Our global presence, intellectual capital, and breadth of products and services enable us to partner with investors to meet the evolving challenges of today's financial markets. We aim to deliver superior investment service and to empower our clients to make the informed decisions that help them reach their investment goals.
As always, we thank you for selecting Morgan Stanley Investment Management, and look forward to working with you in the months and years ahead.
Sincerely,

John H. Gernon
President and Principal Executive Officer
January 2017
2
Morgan Stanley Institutional Fund, Inc.
Annual Report — December 31, 2016
Expense Example (unaudited)
Emerging Markets Leaders Portfolio
As a shareholder of the Portfolio, you incur two types of costs: (1) transactional costs, including redemption fees; and (2) ongoing costs, which may include advisory fees, administration fees, distribution and shareholder services fees and other Portfolio expenses. This example is intended to help you understand your ongoing costs (in dollars) of investing in the Portfolio and to compare these costs with the ongoing costs of investing in other mutual funds.
This example is based on an investment of $1,000 invested at the beginning of the six-month period ended December 31, 2016 and held for the entire six-month period.
Actual Expenses
The table below provides information about actual account values and actual expenses. You may use the information in this table, together with the amount you invested, to estimate the expenses that you paid over the period. Simply divide your account value by $1,000 (for example, an $8,600 account value divided by $1,000 = 8.6), then multiply the result by the number in the table under the heading entitled "Actual Expenses Paid During Period" to estimate the expenses you paid on your account during this period.
Hypothetical Example for Comparison Purposes
The table below provides information about hypothetical account values and hypothetical expenses based on the Portfolio's actual expense ratio and an assumed rate of return of 5% per year before expenses, which is not the Portfolio's actual return. The hypothetical account values and expenses may not be used to estimate the actual ending account balance or expenses you paid for the period. You may use this information to compare the ongoing costs of investing in the Portfolio and other funds. To do so, compare this 5% hypothetical example with the 5% hypothetical examples that appear in the shareholder reports of the other funds.
Please note that the expenses shown in the table are meant to highlight your ongoing costs only and do not reflect any transactional costs, such as sales charges (loads) and redemption fees. Therefore, the information for each class in the table is useful in comparing ongoing costs only, and will not help you determine the relative total costs of owning different funds. In addition, if these transactional costs were included, your costs would have been higher.
| | | Beginning
Account
Value
7/1/16 | | Actual Ending
Account
Value
12/31/16 | | Hypothetical
Ending Account
Value | | Actual
Expenses
Paid
During
Period* | | Hypothetical
Expenses Paid
During Period* | | Net
Expense
Ratio
During
Period** | |
Emerging Markets Leaders Portfolio Class I | | $ | 1,000.00 | | | $ | 962.60 | | | $ | 1,019.61 | | | $ | 5.43 | | | $ | 5.58 | | | | 1.10 | %*** | |
Emerging Markets Leaders Portfolio Class A | | | 1,000.00 | | | | 961.10 | | | | 1,017.44 | | | | 7.54 | | | | 7.76 | | | | 1.53 | *** | |
Emerging Markets Leaders Portfolio Class C | | | 1,000.00 | | | | 957.00 | | | | 1,013.67 | | | | 11.22 | | | | 11.54 | | | | 2.28 | *** | |
Emerging Markets Leaders Portfolio Class IS | | | 1,000.00 | | | | 962.70 | | | | 1,019.71 | | | | 5.33 | | | | 5.48 | | | | 1.08 | *** | |
* Expenses are calculated using each Portfolio Class' annualized net expense ratio (as disclosed), multiplied by the average account value over the period, and multiplied by 184/366 (to reflect the most recent one-half year period).
** Annualized.
*** Refer to Note F in the Notes to Financial Statements for discussion of prior period custodian out-of-pocket expenses that were reimbursed in the current period
3
Morgan Stanley Institutional Fund, Inc.
Annual Report — December 31, 2016
Investment Overview (unaudited)
Emerging Markets Leaders Portfolio
The Portfolio seeks long-term capital appreciation.
Performance
For the year ended December 31, 2016, the Portfolio's Class I shares had a total return based on net asset value and reinvestment of distributions per share of 3.08%, net of fees. The Portfolio's Class I shares underperformed the Portfolio's benchmark, MSCI Emerging Markets Net Index (the "Index"), which returned 11.19%.
Factors Affecting Performance
• Emerging market equities rebounded in 2016 following a protracted period of poor performance relative to developed market equities, helped by still loose monetary policy in the U.S., as well as political momentum in places like Brazil, and a general recovery in commodity prices from low levels.
• The fourth quarter was particularly challenging for the Portfolio as a number of global, local and stock specific events occurred simultaneously. The depreciation of the Mexican peso and the sell-off in the Mexican market following the Trump election, demonetization in India in November, noise around capital controls in China, and the de-rating of quality growth stocks all impacted the Portfolio within the quarter.
• The top contributors to performance over the year were our holdings in a Peruvian bank, a South African quick-service restaurant operator and a Portugal-based owner of a supermarket chain in Poland.
• The largest detractors from performance were our holdings in a Korean confectionary company, a Belgian beer and beverage company and a Hong Kong-based luggage retailer.
Management Strategies
• We believe emerging market outperformance could be sustainable as emerging market gross domestic product growth accelerates relative to growth in the rest of the world. The combination of demographic pressure, lower trade volumes and a huge increase in debt in China remain structural impediments preventing the global economy from achieving the widespread high levels of economic growth of the last decade. We expect that the slowdown in global growth and the development of shale technology will temper the recent rise in commodities.
• In such a macro environment, we believe the hunt for steady return and growth will bring renewed focus to the quality growth companies we are invested in. We continue to believe that staying the course in emerging market equities, by investing in a portfolio of high-quality growth businesses in countries where export dependency is limited, domestic consumer demand is strong and credit growth is in healthy early stages remains the best way to benefit from the growth opportunities unique to emerging markets.

* Minimum Investment for Class I shares
** Commenced Operations on June 30, 2011. Performance shown for the Portfolio's Class I shares reflects the performance of the Morgan Stanley Emerging Markets Leaders Fund (Cayman) LP, a private fund managed by the Adviser for periods prior to close of business on January 5, 2015, when the Portfolio acquired substantially all of the assets and liabilities of the Private Fund in exchange for shares of the Portfolio (the "Emerging Markets Leaders Reorganization").
In accordance with SEC regulations, the Portfolio's performance shown assumes that all recurring fees (including management fees) were deducted and all dividends and distributions were reinvested. The performance of Class A, C and IS shares will vary from the performance of Class I shares and will be negatively impacted by additional fees assessed to those classes (if applicable).
4
Morgan Stanley Institutional Fund, Inc.
Annual Report — December 31, 2016
Investment Overview (unaudited) (cont'd)
Emerging Markets Leaders Portfolio
Performance Compared to the MSCI Emerging Markets Net Index(1) the Lipper Emerging Markets Funds Index(2)
| | | Period Ended December 31, 2016
Total Returns(3) | |
| | | One
Year | | Five
Years | | Ten
Years | | Since
Inception(6) | |
Portfolio — Class I Shares
w/o sales charges(4) | | | 3.08 | % | | | 3.20 | % | | | — | | | | 0.99 | % | |
Portfolio — Class A Shares
w/o sales charges(4) | | | 2.63 | | | | 3.04 | | | | — | | | | 0.84 | | |
Portfolio — Class A Shares with
maximum 5.25% sales charges(4) | | | –2.73 | | | | 1.93 | | | | — | | | | –0.15 | | |
Portfolio — Class C Shares
w/o sales charges(5) | | | 1.89 | | | | — | | | | — | | | | –5.44 | | |
Portfolio — Class C Shares with
maximum 1.00% deferred
sales charges(5) | | | 0.89 | | | | — | | | | — | | | | –5.44 | | |
Portfolio — Class IS Shares
w/o sales charges(4) | | | 3.09 | | | | 3.21 | | | | — | | | | 0.99 | | |
MSCI Emerging Markets Net Index | | | 11.19 | | | | 1.28 | | | | — | | | | –2.67 | | |
Lipper Emerging Market
Funds Index | | | 12.10 | | | | 2.04 | | | | — | | | | –1.91 | | |
Performance data quoted represents past performance, which is no guarantee of future results, and current performance may be lower or higher than the figures shown. Performance assumes that all dividends and distributions, if any, were reinvested. For the most recent month-end performance figures, please visit www.morganstanley.com/im. Investment return and principal value will fluctuate so that Portfolio shares, when redeemed, may be worth more or less than their original cost. Total returns do not reflect the deduction of taxes that a shareholder would pay on Portfolio distributions or the redemption of Portfolio shares. Performance of share classes will vary due to difference in sales charges and expenses.
(1) The MSCI Emerging Markets Net Index is a free float-adjusted market capitalization weighted index that is designed to measure equity market performance of emerging markets. The term "free float" represents the portion of shares outstanding that are deemed to be available for purchase in the public equity markets by investors. The MSCI Emerging Markets Net Index currently consists of 23 emerging market country indices. The performance of the Index is listed in U.S. dollars and assumes reinvestment of net dividends. The Index is unmanaged and its returns do not include any sales charges or fees. Such costs would lower performance. It is not possible to invest directly in an index.
(2) The Lipper Emerging Markets Funds Index is an equally weighted performance index of the largest qualifying funds (based on net assets) in the Lipper Emerging Markets Funds classification. The Index, which is adjusted for capital gains distributions and income dividends, is unmanaged and should not be considered an investment. There are currently 30 funds represented in this Index. As of the date of this report, the Portfolio is in the Lipper Emerging Markets Funds classification.
(3) Total returns for the Portfolio reflect fees waived and expenses reimbursed, if applicable, by the Adviser. Without such waivers and reimbursements, total returns would have been lower.
(4) Pursuant to an agreement and plan of reorganization, between Morgan Stanley Institutional Fund, Inc., on behalf of the Portfolio, and Morgan Stanley Emerging Markets Leaders Fund (Cayman) LP, a private fund managed by the Adviser (the "Private Fund"), following close of business on January 5, 2015, the Portfolio acquired substantially all of the assets and liabilities of the Private Fund in
exchange for shares of the Portfolio (the "Emerging Markets Leaders Reorganization"). The Private Fund commenced operations on June 30, 2011. The Portfolio adopted the performance history of the Private Fund. Performance shown for the Portfolio's Class I, Class A and Class IS shares reflects the performance of the limited partnership interests of the Private Fund, adjusted to reflect any applicable sales charge of the Class, but not adjusted for any other differences in expenses. If adjusted for other expenses, the historical returns would be different.
(5) Commenced offering on April 30, 2015.
(6) For comparative purposes, average annual since inception returns listed for the Indexes refer to the inception date of Class I of the Portfolio, not the inception of the Index.
5
Morgan Stanley Institutional Fund, Inc.
Annual Report — December 31, 2016
Portfolio of Investments
Emerging Markets Leaders Portfolio
| | | Shares | | Value
(000) | |
Common Stocks (97.8%) | |
Belgium (5.6%) | |
Anheuser-Busch InBev N.V. | | | 61,364 | | | $ | 6,495 | | |
Brazil (0.9%) | |
Banco Bradesco SA (Preference) | | | 57,206 | | | | 510 | | |
Itau Unibanco Holding SA (Preference) | | | 47,977 | | | | 499 | | |
| | | | 1,009 | | |
China (6.0%) | |
Tencent Holdings Ltd. (a) | | | 284,300 | | | | 6,955 | | |
Czech Republic (2.8%) | |
Komercni Banka AS | | | 94,109 | | | | 3,244 | | |
Germany (1.8%) | |
Adidas AG | | | 13,068 | | | | 2,066 | | |
Hong Kong (11.8%) | |
AIA Group Ltd. | | | 1,058,400 | | | | 5,971 | | |
Samsonite International SA | | | 2,702,700 | | | | 7,720 | | |
| | | | 13,691 | | |
Hungary (1.8%) | |
OTP Bank PLC | | | 72,008 | | | | 2,059 | | |
India (12.4%) | |
Apollo Hospitals Enterprise Ltd. | | | 143,133 | | | | 2,488 | | |
Colgate-Palmolive India Ltd. | | | 233,016 | | | | 3,106 | | |
Crompton Greaves Consumer Electricals Ltd. (b) | | | 376,637 | | | | 810 | | |
Godrej Consumer Products Ltd. | | | 72,990 | | | | 1,624 | | |
Ipca Laboratories Ltd. (b) | | | 240,647 | | | | 1,890 | | |
Marico Ltd. | | | 697,636 | | | | 2,677 | | |
Shriram Transport Finance Co., Ltd. | | | 141,452 | | | | 1,779 | | |
| | | | 14,374 | | |
Indonesia (7.4%) | |
Bank Mandiri Persero Tbk PT | | | 4,606,800 | | | | 3,958 | | |
Matahari Department Store Tbk PT | | | 1,360,900 | | | | 1,528 | | |
Sumber Alfaria Trijaya Tbk PT | | | 66,770,291 | | | | 3,097 | | |
| | | | 8,583 | | |
Korea, Republic of (9.3%) | |
CJ CGV Co., Ltd. | | | 31,098 | | | | 1,813 | | |
Hanssem Co., Ltd. | | | 23,691 | | | | 3,903 | | |
Orion Corp. | | | 4,304 | | | | 2,334 | | |
Osstem Implant Co., Ltd. (b) | | | 53,458 | | | | 2,687 | | |
| | | | 10,737 | | |
Mexico (6.7%) | |
Fomento Economico Mexicano SAB de CV ADR | | | 58,216 | | | | 4,436 | | |
Grupo Financiero Banorte SAB de CV Series O | | | 665,704 | | | | 3,279 | | |
| | | | 7,715 | | |
Peru (4.0%) | |
Credicorp Ltd. | | | 29,119 | | | | 4,597 | | |
Poland (3.7%) | |
Jeronimo Martins SGPS SA | | | 275,397 | | | | 4,273 | | |
| | | Shares | | Value
(000) | |
South Africa (9.8%) | |
Famous Brands Ltd. | | | 589,581 | | | $ | 6,719 | | |
Life Healthcare Group Holdings Ltd. | | | 1,208,646 | | | | 2,869 | | |
Naspers Ltd., Class N | | | 11,996 | | | | 1,759 | | |
| | | | 11,347 | | |
Taiwan (4.0%) | |
King Slide Works Co. Ltd. | | | 25,000 | | | | 323 | | |
Poya International Co., Ltd. | | | 258,420 | | | | 2,995 | | |
Voltronic Power Technology Corp. | | | 94,750 | | | | 1,310 | | |
| | | | 4,628 | | |
Thailand (4.5%) | |
| DKSH Holding AG | | | 75,945 | | | | 5,217 | | |
Turkey (0.7%) | |
Ulker Biskuvi Sanayi AS | | | 187,137 | | | | 857 | | |
United Kingdom (4.6%) | |
British American Tobacco PLC | | | 93,423 | | | | 5,321 | | |
Total Common Stocks (Cost $116,994) | | | 113,168 | | |
Short-Term Investment (2.4%) | |
Investment Company (2.4%) | |
Morgan Stanley Institutional Liquidity Funds —
Government Portfolio — Institutional Class
(See Note G) (Cost $2,727) | | | 2,727,031 | | | | 2,727 | | |
Total Investments (100.2%) (Cost $119,721) (c) | | | 115,895 | | |
Liabilities in Excess of Other Assets (–0.2%) | | | (233 | ) | |
Net Assets (100.0%) | | $ | 115,662 | | |
Country assignments and aggregations are based generally on third party vendor classifications and information, and may be different from the assignments and aggregations under the policies set forth in the Portfolio's prospectus and/or statement of additional information relating to geographic classifications.
(a) Security trades on the Hong Kong exchange.
(b) Non-income producing security.
(c) At December 31, 2016, the aggregate cost for federal income tax purposes is approximately $119,902,000. The aggregate gross unrealized appreciation is approximately $4,705,000 and the aggregate gross unrealized depreciation is approximately $8,712,000, resulting in net unrealized depreciation of approximately $4,007,000.
ADR American Depositary Receipt.
Portfolio Composition
Classification | | Percentage of
Total Investments | |
Other* | | | 36.8 | % | |
Banks | | | 15.7 | | |
Beverages | | | 9.4 | | |
Textiles, Apparel & Luxury Goods | | | 8.4 | | |
Personal Products | | | 6.4 | | |
Food & Staples Retailing | | | 6.4 | | |
Internet Software & Services | | | 6.0 | | |
Hotels, Restaurants & Leisure | | | 5.8 | | |
Insurance | | | 5.1 | | |
Total Investments | | | 100.0 | % | |
* Industries and/or investment types representing less than 5% of total investments.
The accompanying notes are an integral part of the financial statements.
6
Morgan Stanley Institutional Fund, Inc.
Annual Report — December 31, 2016
Emerging Markets Leaders Portfolio
Statement of Assets and Liabilities | | December 31, 2016
(000) | |
Assets: | |
Investments in Securities of Unaffiliated Issuers, at Value (Cost $116,994) | | $ | 113,168 | | |
Investment in Security of Affiliated Issuer, at Value (Cost $2,727) | | | 2,727 | | |
Total Investments in Securities, at Value (Cost $119,721) | | | 115,895 | | |
Foreign Currency, at Value (Cost—@) | | | — | @ | |
Tax Reclaim Receivable | | | 33 | | |
Receivable for Portfolio Shares Sold | | | 25 | | |
Dividends Receivable | | | 11 | | |
Receivable from Affiliate | | | 1 | | |
Other Assets | | | 37 | | |
Total Assets | | | 116,002 | | |
Liabilities: | |
Payable for Advisory Fees | | | 236 | | |
Payable for Professional Fees | | | 43 | | |
Payable for Custodian Fees | | | 20 | | |
Deferred Capital Gain Country Tax | | | 14 | | |
Payable for Portfolio Shares Redeemed | | | 9 | | |
Payable for Administration Fees | | | 8 | | |
Payable for Transfer Agency Fees — Class I | | | 1 | | |
Payable for Transfer Agency Fees — Class A | | | — | @ | |
Payable for Transfer Agency Fees — Class C | | | — | @ | |
Payable for Transfer Agency Fees — Class IS | | | — | @ | |
Payable for Shareholder Services Fees — Class A | | | — | @ | |
Payable for Distribution and Shareholder Services Fees — Class C | | | — | @ | |
Payable for Sub Transfer Agency Fees — Class I | | | — | @ | |
Other Liabilities | | | 9 | | |
Total Liabilities | | | 340 | | |
Net Assets | | $ | 115,662 | | |
Net Assets Consist Of: | |
Paid-in-Capital | | $ | 120,654 | | |
Distributions in Excess of Net Investment Income | | | (242 | ) | |
Accumulated Net Realized Loss | | | (923 | ) | |
Unrealized Appreciation (Depreciation) on: | |
Investments | | | (3,826 | ) | |
Foreign Currency Translations | | | (1 | ) | |
Net Assets | | $ | 115,662 | | |
The accompanying notes are an integral part of the financial statements.
7
Morgan Stanley Institutional Fund, Inc.
Annual Report — December 31, 2016
Emerging Markets Leaders Portfolio
Statement of Assets and Liabilities (cont'd) | | December 31, 2016
(000) | |
CLASS I: | |
Net Assets | | $ | 25,374 | | |
| Shares Outstanding $0.001 par value shares of beneficial interest (unlimited shares authorized) (not in 000's) | | | 2,607,295 | | |
Net Asset Value, Offering and Redemption Price Per Share | | $ | 9.73 | | |
CLASS A: | |
Net Assets | | $ | 821 | | |
| Shares Outstanding $0.001 par value shares of beneficial interest (unlimited shares authorized) (not in 000's) | | | 84,942 | | |
Net Asset Value, Redemption Price Per Share | | $ | 9.67 | | |
Maximum Sales Load | | | 5.25 | % | |
Maximum Sales Charge | | $ | 0.54 | | |
Maximum Offering Price Per Share | | $ | 10.21 | | |
CLASS C: | |
Net Assets | | $ | 587 | | |
| Shares Outstanding $0.001 par value shares of beneficial interest (unlimited shares authorized) (not in 000's) | | | 61,218 | | |
Net Asset Value, Offering and Redemption Price Per Share | | $ | 9.59 | | |
CLASS IS: | |
Net Assets | | $ | 88,880 | | |
| Shares Outstanding $0.001 par value shares of beneficial interest (unlimited shares authorized) (not in 000's) | | | 9,131,313 | | |
Net Asset Value, Offering and Redemption Price Per Share | | $ | 9.73 | | |
@ Amount is less than $500.
The accompanying notes are an integral part of the financial statements.
8
Morgan Stanley Institutional Fund, Inc.
Annual Report — December 31, 2016
Emerging Markets Leaders Portfolio
Statement of Operations | | Year Ended
December 31, 2016
(000) | |
Investment Income: | |
Dividends from Securities of Unaffiliated Issuers (Net of $78 of Foreign Taxes Withheld) | | $ | 886 | | |
Dividends from Security of Affiliated Issuer (Note G) | | | 13 | | |
Total Investment Income | | | 899 | | |
Expenses: | |
Advisory Fees (Note B) | | | 679 | | |
Professional Fees | | | 108 | | |
Administration Fees (Note C) | | | 60 | | |
Registration Fees | | | 53 | | |
Custodian Fees (Note F) | | | 39 | | |
Shareholder Reporting Fees | | | 12 | | |
Transfer Agency Fees — Class I (Note E) | | | 2 | | |
Transfer Agency Fees — Class A (Note E) | | | 2 | | |
Transfer Agency Fees — Class C (Note E) | | | 2 | | |
Transfer Agency Fees — Class IS (Note E) | | | 2 | | |
Pricing Fees | | | 5 | | |
Shareholder Services Fees — Class A (Note D) | | | 1 | | |
Distribution and Shareholder Services Fees — Class C (Note D) | | | 3 | | |
Directors' Fees and Expenses | | | 4 | | |
Offering Costs | | | 3 | | |
Sub Transfer Agency Fees — Class I | | | — | @ | |
Sub Transfer Agency Fees — Class A | | | — | @ | |
Sub Transfer Agency Fees — Class C | | | — | @ | |
Other Expenses | | | 22 | | |
Total Expenses | | | 997 | | |
Waiver of Advisory Fees (Note B) | | | (138 | ) | |
Rebate from Morgan Stanley Affiliate (Note G) | | | (13 | ) | |
Reimbursement of Class Specific Expenses — Class A (Note B) | | | (1 | ) | |
Reimbursement of Class Specific Expenses — Class C (Note B) | | | (1 | ) | |
Reimbursement of Class Specific Expenses — Class IS (Note B) | | | (2 | ) | |
Reimbursement of Custodian Fees (Note F) | | | (18 | ) | |
Net Expenses | | | 824 | | |
Net Investment Income | | | 75 | | |
Realized Gain (Loss): | |
Investments Sold | | | (528 | ) | |
Investments in Affiliates | | | 217 | | |
Foreign Currency Transactions | | | (52 | ) | |
Net Realized Loss | | | (363 | ) | |
Change in Unrealized Appreciation (Depreciation): | |
Investments | | | (1,852 | ) | |
Foreign Currency Translations | | | (1 | ) | |
Net Change in Unrealized Appreciation (Depreciation) | | | (1,853 | ) | |
Net Realized Loss and Change in Unrealized Appreciation (Depreciation) | | | (2,216 | ) | |
Net Decrease in Net Assets Resulting from Operations | | $ | (2,141 | ) | |
@ Amount is less than $500.
The accompanying notes are an integral part of the financial statements.
9
Morgan Stanley Institutional Fund, Inc.
Annual Report — December 31, 2016
Emerging Markets Leaders Portfolio
Statements of Changes in Net Assets | | Year Ended
December 31, 2016
(000) | | Period from
January 5, 2015^ to
December 31, 2015
(000) | |
Increase (Decrease) in Net Assets: | |
Operations: | |
Net Investment Income | | $ | 75 | | | $ | 181 | | |
Net Realized Loss | | | (363 | ) | | | (633 | ) | |
Net Change in Unrealized Appreciation (Depreciation) | | | (1,853 | ) | | | (1,974 | ) | |
Net Decrease in Net Assets Resulting from Operations | | | (2,141 | ) | | | (2,426 | ) | |
Distributions from and/or in Excess of: | |
Class I: | |
Net Investment Income | | | (22 | ) | | | (174 | ) | |
Paid-in-Capital | | | (7 | ) | | | — | | |
Class A: | |
Net Investment Income | | | (— | @) | | | (2 | ) | |
Paid-in-Capital | | | (— | @) | | | — | | |
Class C: | |
Net Investment Income | | | (— | @) | | | (1 | ) | |
Paid-in-Capital | | | (— | @) | | | — | | |
Class IS: | |
Net Investment Income | | | (21 | ) | | | (206 | ) | |
Paid-in-Capital | | | (27 | ) | | | — | | |
Total Distributions | | | (77 | ) | | | (383 | ) | |
Capital Share Transactions:(1) | |
Class I: | |
Subscribed | | | 15,872 | | | | 14,859 | | |
Distributions Reinvested | | | 15 | | | | 38 | | |
Redeemed | | | (4,035 | ) | | | (583 | ) | |
Class A: | |
Subscribed | | | 1,426 | | | | 195 | | |
Distributions Reinvested | | | — | @ | | | 1 | | |
Redeemed | | | (691 | ) | | | (7 | ) | |
Class C: | |
Subscribed | | | 508 | | | | 110 | * | |
Distributions Reinvested | | | —- | @ | | | 1 | * | |
Class IS: | |
Subscribed | | | 80,451 | | | | 17,575 | | |
Distributions Reinvested | | | 48 | | | | 206 | | |
Redeemed | | | (5,300 | ) | | | — | | |
Net Increase in Net Assets Resulting from Capital Share Transactions | | | 88,294 | | | | 32,395 | | |
Redemption Fees | | | — | @ | | | — | | |
Total Increase in Net Assets | | | 86,076 | | | | 29,586 | | |
Net Assets: | |
Beginning of Period | | | 29,586 | | | | — | | |
End of Period (Including Distributions in Excess of Net Investment Income of $(242) and $(223)) | | $ | 115,662 | | | $ | 29,586 | | |
The accompanying notes are an integral part of the financial statements.
10
Morgan Stanley Institutional Fund, Inc.
Annual Report — December 31, 2016
Emerging Markets Leaders Portfolio
Statements of Changes in Net Assets (cont'd) | | Year Ended
December 31, 2016
(000) | | Period from
January 5, 2015^ to
December 31, 2015
(000) | |
(1) Capital Share Transactions: | |
Class I: | |
Shares Subscribed | | | 1,602 | | | | 1,472 | | |
Shares Issued on Distributions Reinvested | | | 2 | | | | 4 | | |
Shares Redeemed | | | (413 | ) | | | (60 | ) | |
Net Increase in Class I Shares Outstanding | | | 1,191 | | | | 1,416 | | |
Class A: | |
Shares Subscribed | | | 137 | | | | 20 | | |
Shares Issued on Distributions Reinvested | | | — | @@ | | | — | @@ | |
Shares Redeemed | | | (71 | ) | | | (1 | ) | |
Net Increase in Class A Shares Outstanding | | | 66 | | | | 19 | | |
Class C: | |
Shares Subscribed | | | 51 | | | | 11 | * | |
Shares Issued on Distributions Reinvested | | | — | @@ | | | — | @@* | |
Net Increase in Class C Shares Outstanding | | | 51 | | | | 11 | | |
Class IS: | |
Shares Subscribed | | | 7,981 | | | | 1,663 | | |
Shares Issued on Distributions Reinvested | | | 5 | | | | 22 | | |
Shares Redeemed | | | (539 | ) | | | — | | |
Net Increase in Class IS Shares Outstanding | | | 7,447 | | | | 1,685 | | |
^ Date of Reorganization
* For the period April 30, 2015 through December 31, 2015.
@ Amount is less than $500.
@@ Amount is less than 500 shares.
The accompanying notes are an integral part of the financial statements.
11
Morgan Stanley Institutional Fund, Inc.
Annual Report — December 31, 2016
Financial Highlights
Emerging Markets Leaders Portfolio
| | | Class I | |
Selected Per Share Data and Ratios | | Year Ended
December 31, 2016(1) | | Period from
January 5, 2015(2) to
December 31, 2015 | |
Net Asset Value, Beginning of Period | | $ | 9.45 | | | $ | 10.00 | | |
Income (Loss) from Investment Operations: | |
Net Investment Income (3) | | | 0.04 | | | | 0.06 | | |
Net Realized and Unrealized Gain (Loss) | | | 0.25 | | | | (0.49 | ) | |
Total from Investment Operations | | | 0.29 | | | | (0.43 | ) | |
Distributions from and/or in Excess of: | |
Net Investment Income | | | (0.01 | ) | | | (0.12 | ) | |
Paid-in-Capital | | | (0.00 | )(4) | | | — | | |
Total Distributions | | | (0.01 | ) | | | (0.12 | ) | |
Redemption Fees | | | 0.00 | (4) | | | — | | |
Net Asset Value, End of Period | | $ | 9.73 | | | $ | 9.45 | | |
Total Return (5) | | | 3.08 | % | | | (4.26 | )%(7) | |
Ratios and Supplemental Data: | |
Net Assets, End of Period (Thousands) | | $ | 25,374 | | | $ | 13,379 | | |
Ratio of Expenses to Average Net Assets (9) | | | 1.10 | %(6) | | | 1.14 | %(6)(8) | |
Ratio of Net Investment Income to Average Net Assets (9) | | | 0.37 | %(6) | | | 0.65 | %(6)(8) | |
Ratio of Rebate from Morgan Stanley Affiliates to Average Net Assets | | | 0.02 | % | | | 0.01 | %(8) | |
Portfolio Turnover Rate | | | 45 | % | | | 36 | % | |
(9) Supplemental Information on the Ratios to Average Net Assets: | |
Ratios Before Expense Limitation: | |
Expenses to Average Net Assets | | | 1.32 | % | | | 2.80 | %(8) | |
Net Investment Income (Loss) to Average Net Assets | | | 0.15 | % | | | (1.01 | )%(8) | |
(1) Refer to Note F in the Notes to Financial Statements for discussion of prior period custodian out-of-pocket expenses that were reimbursed in the current period. The amount of the reimbursement was immaterial on a per share basis and did not impact the total return of Class I shares. The Ratio of Expenses to Average Net Assets and the Ratio of Net Investment Income to Average Net Assets would be unchanged as the reimbursement of custodian fees was offset against current period expense waivers/reimbursements with no impact to net expenses or net investment income.
(2) Date of Reorganization (close of business).
(3) Per share amount is based on average shares outstanding.
(4) Amount is less than $0.005 per share.
(5) Calculated based on the net asset value as of the last business day of the period.
(6) The Ratios of Expenses and Net Investment Income reflect the rebate of certain Portfolio expenses in connection with the investments in Morgan Stanley affiliates during the period. The effect of the rebate on the ratios is disclosed in the above table as "Ratio of Rebate from Morgan Stanley Affiliates to Average Net Assets."
(7) Not Annualized.
(8) Annualized.
The accompanying notes are an integral part of the financial statements.
12
Morgan Stanley Institutional Fund, Inc.
Annual Report — December 31, 2016
Financial Highlights
Emerging Markets Leaders Portfolio
| | | Class A | |
Selected Per Share Data and Ratios | | Year Ended
December 31, 2016(1) | | Period from
January 5, 2015(2) to
December 31, 2015 | |
Net Asset Value, Beginning of Period | | $ | 9.43 | | | $ | 10.00 | | |
Income (Loss) from Investment Operations: | |
Net Investment Income (Loss) (3) | | | (0.03 | ) | | | 0.02 | | |
Net Realized and Unrealized Gain (Loss) | | | 0.28 | | | | (0.48 | ) | |
Total from Investment Operations | | | 0.25 | | | | (0.46 | ) | |
Distributions from and/or in Excess of: | |
Net Investment Income | | | (0.01 | ) | | | (0.11 | ) | |
Paid-in-Capital | | | (0.00 | )(4) | | | — | | |
Total Distributions | | | (0.01 | ) | | | (0.11 | ) | |
Redemption Fees | | | 0.00 | (4) | | | — | | |
Net Asset Value, End of Period | | $ | 9.67 | | | $ | 9.43 | | |
Total Return (5) | | | 2.63 | % | | | (4.61 | )%(7) | |
Ratios and Supplemental Data: | |
Net Assets, End of Period (Thousands) | | $ | 821 | | | $ | 182 | | |
Ratio of Expenses to Average Net Assets (9) | | | 1.53 | %(6) | | | 1.54 | %(6)(8) | |
Ratio of Net Investment Income (Loss) to Average Net Assets (9) | | | (0.33 | )%(6) | | | 0.21 | %(6)(8) | |
Ratio of Rebate from Morgan Stanley Affiliates to Average Net Assets | | | 0.02 | % | | | 0.01 | %(8) | |
Portfolio Turnover Rate | | | 45 | % | | | 36 | % | |
(9) Supplemental Information on the Ratios to Average Net Assets: | |
Ratios Before Expense Limitation: | |
Expenses to Average Net Assets | | | 1.96 | % | | | 5.89 | %(8) | |
Net Investment Loss to Average Net Assets | | | (0.76 | )% | | | (4.14 | )%(8) | |
(1) Refer to Note F in the Notes to Financial Statements for discussion of prior period custodian out-of-pocket expenses that were reimbursed in the current period. The amount of the reimbursement was immaterial on a per share basis and did not impact the total return of Class A shares. The Ratio of Expenses to Average Net Assets and the Ratio of Net Investment Loss to Average Net Assets would be unchanged as the reimbursement of custodian fees was offset against current period expense waivers/reimbursements with no impact to net expenses or net investment loss.
(2) Date of Reorganization (close of business).
(3) Per share amount is based on average shares outstanding.
(4) Amount is less than $0.005 per share.
(5) Calculated based on the net asset value which does not reflect sales charges, if applicable, as of the last business day of the period.
(6) The Ratios of Expenses and Net Investment Income (Loss) reflect the rebate of certain Portfolio expenses in connection with the investments in Morgan Stanley affiliates during the period. The effect of the rebate on the ratios is disclosed in the above table as "Ratio of Rebate from Morgan Stanley Affiliates to Average Net Assets."
(7) Not Annualized.
(8) Annualized.
The accompanying notes are an integral part of the financial statements.
13
Morgan Stanley Institutional Fund, Inc.
Annual Report — December 31, 2016
Financial Highlights
Emerging Markets Leaders Portfolio
| | | Class C | |
Selected Per Share Data and Ratios | | Year Ended
December 31, 2016(1) | | Period from
April 30, 2015(2) to
December 31, 2015 | |
Net Asset Value, Beginning of Period | | $ | 9.42 | | | $ | 10.61 | | |
Income (Loss) from Investment Operations: | |
Net Investment Loss (3) | | | (0.10 | ) | | | (0.06 | ) | |
Net Realized and Unrealized Gain (Loss) | | | 0.28 | | | | (1.07 | ) | |
Total from Investment Operations | | | 0.18 | | | | (1.13 | ) | |
Distributions from and/or in Excess of: | |
Net Investment Income | | | (0.01 | ) | | | (0.06 | ) | |
Paid-in-Capital | | | (0.00 | )(4) | | | — | | |
Total Distributions | | | (0.01 | ) | | | (0.06 | ) | |
Redemption Fees | | | 0.00 | (4) | | | — | | |
Net Asset Value, End of Period | | $ | 9.59 | | | $ | 9.42 | | |
| Total Return (5) | | | 1.89 | % | | | (10.61 | )%(8) | |
Ratios and Supplemental Data: | |
Net Assets, End of Period (Thousands) | | $ | 587 | | | $ | 100 | | |
Ratio of Expenses to Average Net Assets (10) | | | 2.28 | %(6) | | | 2.30 | %(6)(9) | |
Ratio of Net Investment Loss to Average Net Assets (10) | | | (0.99 | )%(6) | | | (0.85 | )%(6)(9) | |
Ratio of Rebate from Morgan Stanley Affiliates to Average Net Assets | | | 0.02 | % | | | 0.00 | %(7)(9) | |
Portfolio Turnover Rate | | | 45 | % | | | 36 | % | |
(10) Supplemental Information on the Ratios to Average Net Assets: | |
Ratios Before Expense Limitation: | |
Expense to Average Net Assets | | | 3.08 | % | | | 5.73 | %(9) | |
Net Investment Loss to Average Net Assets | | | (1.79 | )% | | | (4.28 | )%(9) | |
(1) Refer to Note F in the Notes to Financial Statements for discussion of prior period custodian out-of-pocket expenses that were reimbursed in the current period. The amount of the reimbursement was immaterial on a per share basis and did not impact the total return of Class C shares. The Ratio of Expenses to Average Net Assets and the Ratio of Net Investment Loss to Average Net Assets would be unchanged as the reimbursement of custodian fees was offset against current period expense waivers/reimbursements with no impact to net expenses or net investment loss.
(2) Commencement of Offering.
(3) Per share amount is based on average shares outstanding.
(4) Amount is less than $0.005 per share.
(5) Calculated based on the net asset value which does not reflect sales charges, if applicable, as of the last business day of the period.
(6) The Ratios of Expenses and Net Investment Loss reflect the rebate of certain Portfolio expenses in connection with the investments in Morgan Stanley affiliates during the period. The effect of the rebate on the ratios is disclosed in the above table as "Ratio of Rebate from Morgan Stanley Affiliates to Average Net Assets."
(7) Amount is less than 0.005%.
(8) Not Annualized.
(9) Annualized.
The accompanying notes are an integral part of the financial statements.
14
Morgan Stanley Institutional Fund, Inc.
Annual Report — December 31, 2016
Financial Highlights
Emerging Markets Leaders Portfolio
| | | Class IS | |
Selected Per Share Data and Ratios | | Year Ended
December 31, 2016(1) | | Period from
January 5, 2015(2) to
December 31, 2015 | |
Net Asset Value, Beginning of Period | | $ | 9.45 | | | $ | 10.00 | | |
Income (Loss) from Investment Operations: | |
Net Investment Income (Loss) (3) | | | (0.00 | )(4) | | | 0.07 | | |
Net Realized and Unrealized Gain (Loss) | | | 0.29 | | | | (0.50 | ) | |
Total from Investment Operations | | | 0.29 | | | | (0.43 | ) | |
Distributions from and/or in Excess of: | |
Net Investment Income | | | (0.01 | ) | | | (0.12 | ) | |
Paid-in-Capital | | | (0.00 | )(4) | | | — | | |
Total Distributions | | | (0.01 | ) | | | (0.12 | ) | |
Redemption Fees | | | 0.00 | (4) | | | — | | |
Net Asset Value, End of Period | | $ | 9.73 | | | $ | 9.45 | | |
Total Return (5) | | | 3.09 | % | | | (4.25 | )%(9) | |
Ratios and Supplemental Data: | |
Net Assets, End of Period (Thousands) | | $ | 88,880 | | | $ | 15,925 | | |
Ratio of Expenses to Average Net Assets (11) | | | 1.08 | %(6) | | | 1.12 | %(6)(7)(10) | |
Ratio of Net Investment Income (Loss) to Average Net Assets (11) | | | (0.00 | )%(6)(8) | | | 0.75 | %(6)(10) | |
Ratio of Rebate from Morgan Stanley Affiliates to Average Net Assets | | | 0.02 | % | | | 0.01 | %(10) | |
Portfolio Turnover Rate | | | 45 | % | | | 36 | % | |
(11) Supplemental Information on the Ratios to Average Net Assets: | |
Ratios Before Expense Limitation: | |
Expenses to Average Net Assets | | | 1.31 | % | | | 2.65 | %(10) | |
Net Investment Loss to Average Net Assets | | | (0.23 | )% | | | (0.78 | )%(10) | |
(1) Refer to Note F in the Notes to Financial Statements for discussion of prior period custodian out-of-pocket expenses that were reimbursed in the current period. The amount of the reimbursement was immaterial on a per share basis and did not impact the total return of Class IS shares. The Ratio of Expenses to Average Net Assets and the Ratio of Net Investment Loss to Average Net Assets would be unchanged as the reimbursement of custodian fees was offset against current period expense waivers/reimbursements with no impact to net expenses or net investment loss.
(2) Date of Reorganization (close of business).
(3) Per share amount is based on average shares outstanding.
(4) Amount is less than $0.005 per share.
(5) Calculated based on the net asset value as of the last business day of the period.
(6) The Ratios of Expenses and Net Investment Income (Loss) reflect the rebate of certain Portfolio expenses in connection with the investments in Morgan Stanley affiliates during the period. The effect of the rebate on the ratios is disclosed in the above table as "Ratio of Rebate from Morgan Stanley Affiliates to Average Net Assets."
(7) Effective September 30, 2015, the Adviser has agreed to limit the ratio of expenses to average net assets to the maximum ratio of 1.10% for Class IS shares. Prior to September 30, 2015, the maximum ratio was 1.15% for Class IS shares.
(8) Amount is less than 0.005%
(9) Not Annualized.
(10) Annualized.
The accompanying notes are an integral part of the financial statements.
15
Morgan Stanley Institutional Fund, Inc.
Annual Report — December 31, 2016
Notes to Financial Statements
Morgan Stanley Institutional Fund, Inc. (the "Fund") is registered under the Investment Company Act of 1940, as amended (the "Act"), as an open-end management investment company. The Fund is comprised of twenty-nine separate, active, diversified and non-diversified portfolios (individually referred to as a "Portfolio", collectively as the "Portfolios"). The Fund applies investment company accounting and reporting guidance.
The accompanying financial statements relate to the Emerging Markets Leaders Portfolio. The Portfolio seeks long-term capital appreciation.
Effective June 30, 2016, Morgan Stanley Investment Management Limited ("MSIM Limited") is no longer a Sub-Adviser to the Portfolio.
The Portfolio offers four classes of shares — Class I, Class A, Class C and Class IS.
Pursuant to an agreement and plan of reorganization, between the Fund, on behalf of the Portfolio, and Morgan Stanley Emerging Markets Leaders Fund (Cayman) LP, a private fund managed by the Adviser (the "Private Fund"), at the close of business on January 5, 2015, the Portfolio acquired substantially all of the assets and liabilities of the Private Fund in exchange for shares of the Portfolio (the "Reorganization"). For financial reporting purposes, the net assets received and shares issued by the Portfolio were recorded at fair value. The investment income and realized and unrealized gain/loss presented in the Statements of Operations represent the revenue and earnings of the Portfolio subsequent to the Reorganization. The partners of the Private Fund were issued 1,104,016 shares of beneficial interest in the Portfolio at a net asset value of $10.00, in exchange for their collective interest in the Private Fund, totaling $11,040,160 in net assets. The Private Fund commenced operations on June 30, 2011, and had an investment objective, policies, and strategies that were, in all material respects, the same as those of the Portfolio, and was managed in a manner that, in all material respects, complied with the investment guidelines and restrictions of the Portfolio. However, the Private Fund was not registered as an investment company under the Act, and therefore was not subject to certain investment limitations, diversification requirements, liquidity requirements, and other restrictions imposed by the Act and the Internal Revenue Code of 1986, as amended (the "Code"), which, if applicable, may have adversely affected its performance.
A. Significant Accounting Policies: The following significant accounting policies are in conformity with U.S. generally accepted accounting principles ("GAAP"). Such policies are consistently followed by the Fund in the preparation of its financial statements. GAAP may require management to make estimates and assumptions that affect the reported amounts and disclosures in the financial statements. Actual results may differ from those estimates.
1. Security Valuation: (1) An equity portfolio security listed or traded on an exchange is valued at its latest reported sales price (or at the exchange official closing price if such exchange reports an official closing price), and if there were no sales on a given day and if there is no official exchange closing price for that day, the security is valued at the mean between the last reported bid and asked prices if such bid and asked prices are available on the relevant exchanges; (2) all other equity portfolio securities for which over-the-counter ("OTC") market quotations are readily available are valued at the latest reported sales price (or at the market official closing price if such market reports an official closing price), and if there was no trading in the security on a given day and if there is no official closing price from relevant markets for that day, the security is valued at the mean between the last reported bid and asked prices if such bid and asked prices are available on the relevant markets. Listed equity securities not traded on the valuation date with no reported bid and asked prices available on the exchange are valued at the mean between the current bid and asked prices obtained from one or more reputable brokers or dealers. An unlisted equity security that does not trade on the valuation date and for which bid and asked prices from the relevant markets are unavailable is valued at the mean between the current bid and asked prices obtained from one or more reputable brokers or dealers. In cases where a security is traded on more than one exchange, the security is valued on the exchange designated as the primary market; (3) certain portfolio securities may be valued by an outside pricing service/vendor approved by the Fund's Board of Directors (the "Directors"). The pricing service/vendor may employ a pricing model that takes into account, among other things, bids, yield spreads, and/or other market data and specific security characteristics. Alternatively, if a valuation is not available from an outside pricing service/vendor, and the security trades on an exchange, the
16
Morgan Stanley Institutional Fund, Inc.
Annual Report — December 31, 2016
Notes to Financial Statements (cont'd)
security may be valued at its latest reported sale price (or at the exchange official closing price if such exchange reports an official closing price), prior to the time when assets are valued. If there are no sales on a given day and if there is no official exchange closing price for that day, the security is valued at the mean between the last reported bid and asked prices if such bid and asked prices are available in the relevant exchanges; (4) when market quotations are not readily available, including circumstances under which Morgan Stanley Investment Management Inc. (the "Adviser") or Morgan Stanley Investment Management Company ("MSIM Company") (the "Sub-Advisers"), a whole owned subsidiary of Morgan Stanley, determines that the closing price, last sale price or the mean between the last reported bid and asked prices are not reflective of a security's market value, portfolio securities are valued at their fair value as determined in good faith under procedures established by and under the general supervision of the Directors. Occasionally, developments affecting the closing prices of securities and other assets may occur between the times at which valuations of such securities are determined (that is, close of the foreign market on which the securities trade) and the close of business of the New York Stock Exchange ("NYSE"). If developments occur during such periods that are expected to materially affect the value of such securities, such valuations may be adjusted to reflect the estimated fair value of such securities as of the close of the NYSE, as determined in good faith by the Directors or by the Adviser using a pricing service and/or procedures approved by the Directors; (5) quotations of foreign portfolio securities, other assets and liabilities and forward contracts stated in foreign currency are translated into U.S. dollar equivalents at the prevailing market rates prior to the close of the NYSE; and (6) investments in mutual funds, including the Morgan Stanley Institutional Liquidity Funds, are valued at the net asset value ("NAV") as of the close of each business day.
The Directors have responsibility for determining in good faith the fair value of the investments, and the Directors may appoint others, such as the Fund's Adviser or a valuation committee, to assist the Directors in determining fair value and to make the actual calculations pursuant to the fair valuation methodologies previously approved by the Directors. Under procedures approved by the Directors, the Fund's Adviser has formed a Valuation Committee whose members are approved by the Directors. The Valuation Committee provides administration and over-
sight of the Fund's valuation policies and procedures, which are reviewed at least annually by the Directors. These procedures allow the Fund to utilize independent pricing services, quotations from securities and financial instrument dealers, and other market sources to determine fair value.
The Fund has procedures to determine the fair value of securities and other financial instruments for which market prices are not readily available. Under these procedures, the Valuation Committee convenes on a regular and ad hoc basis to review such securities and considers a number of factors, including valuation methodologies and significant unobservable valuation inputs, when arriving at fair value. The Valuation Committee may employ a market-based approach which may use related or comparable assets or liabilities, recent transactions, market multiples, book values, and other relevant information for the investment to determine the fair value of the investment. An income-based valuation approach may also be used in which the anticipated future cash flows of the investment are discounted to calculate fair value. Discounts may also be applied due to the nature or duration of any restrictions on the disposition of the investments. Due to the inherent uncertainty of valuations of such investments, the fair values may differ significantly from the values that would have been used had an active market existed. The Valuation Committee employs various methods for calibrating these valuation approaches including a regular review of valuation methodologies, key inputs and assumptions, transactional back-testing or disposition analysis, and reviews of any related market activity.
2. Fair Value Measurement: Financial Accounting Standards Board ("FASB") Accounting Standards CodificationTM ("ASC") 820, "Fair Value Measurement" ("ASC 820"), defines fair value as the value that the Fund would receive to sell an investment or pay to transfer a liability in a timely transaction with an independent buyer in the principal market, or in the absence of a principal market, the most advantageous market for the investment or liability. ASC 820 establishes a three-tier hierarchy to distinguish between (1) inputs that reflect the assumptions market participants would use in valuing an asset or liability developed based on market data obtained from sources independent of the reporting entity (observable inputs) and (2) inputs that reflect the reporting entity's own assumptions about the assumptions market participants
17
Morgan Stanley Institutional Fund, Inc.
Annual Report — December 31, 2016
Notes to Financial Statements (cont'd)
would use in valuing an asset or liability developed based on the best information available in the circumstances (unobservable inputs) and to establish classification of fair value measurements for disclosure purposes. Various inputs are used in determining the value of the Fund's investments. The inputs are summarized in the three broad levels listed below.
• Level 1 – unadjusted quoted prices in active markets for identical investments
• Level 2 – other significant observable inputs (including quoted prices for similar investments, interest rates, prepayment speeds, credit risk, etc.)
• Level 3 – significant unobservable inputs including the Fund's own assumptions in determining the fair value of investments. Factors considered in making this determination may include, but are not limited to, information obtained by contacting the issuer, analysts, or the appropriate stock exchange (for exchange-traded securities), analysis of the issuer's financial statements or other available documents and, if necessary, available information concerning other securities in similar circumstances
The inputs or methodology used for valuing securities are not necessarily an indication of the risk associated with investing in those securities and the determination of the significance of a particular input to the fair value measurement in its entirety requires judgment and considers factors specific to each security.
The following is a summary of the inputs used to value the Portfolio's investments as of December 31, 2016.
Investment Type | | Level 1
Unadjusted
quoted
prices
(000) | | Level 2
Other
significant
observable
inputs
(000) | | Level 3
Significant
unobservable
inputs
(000) | | Total
(000) | |
Assets: | |
Common Stocks | |
Banks | | $ | 18,146 | | | $ | — | | | $ | — | | | $ | 18,146 | | |
Beverages | | | 10,931 | | | | — | | | | — | | | | 10,931 | | |
Consumer Finance | | | 1,779 | | | | — | | | | — | | | | 1,779 | | |
Electrical Equipment | | | 1,310 | | | | — | | | | — | | | | 1,310 | | |
Food & Staples Retailing | | | 7,370 | | | | — | | | | — | | | | 7,370 | | |
Food Products | | | 3,191 | | | | — | | | | — | | | | 3,191 | | |
Investment Type | | Level 1
Unadjusted
quoted
prices
(000) | | Level 2
Other
significant
observable
inputs
(000) | | Level 3
Significant
unobservable
inputs
(000) | | Total
(000) | |
Common Stocks (cont'd) | |
Health Care Equipment &
Supplies | | $ | 2,687 | | | $ | — | | | $ | — | | | $ | 2,687 | | |
Health Care Providers &
Services | | | 5,357 | | | | — | | | | — | | | | 5,357 | | |
Hotels, Restaurants &
Leisure | | | 6,719 | | | | — | | | | — | | | | 6,719 | | |
Household Durables | | | 4,713 | | | | — | | | | — | | | | 4,713 | | |
Insurance | | | 5,971 | | | | — | | | | — | | | | 5,971 | | |
Internet Software &
Services | | | 6,955 | | | | — | | | | — | | | | 6,955 | | |
Machinery | | | 323 | | | | — | | | | — | | | | 323 | | |
Media | | | 3,572 | | | | — | | | | — | | | | 3,572 | | |
Multi-line Retail | | | 4,523 | | | | — | | | | — | | | | 4,523 | | |
Personal Products | | | 7,407 | | | | — | | | | — | | | | 7,407 | | |
Pharmaceuticals | | | 1,890 | | | | — | | | | — | | | | 1,890 | | |
Professional Services | | | 5,217 | | | | — | | | | — | | | | 5,217 | | |
Textiles, Apparel &
Luxury Goods | | | 9,786 | | | | — | | | | — | | | | 9,786 | | |
Tobacco | | | 5,321 | | | | — | | | | — | | | | 5,321 | | |
Total Common Stocks | | | 113,168 | | | | — | | | | — | | | | 113,168 | | |
Short-Term Investment | |
Investment Company | | | 2,727 | | | | — | | | | — | | | | 2,727 | | |
Total Assets | | $ | 115,895 | | | $ | — | | | $ | — | | | $ | 115,895 | | |
Transfers between investment levels may occur as the markets fluctuate and/or the availability of data used in an investment's valuation changes. The Portfolio recognizes transfers between the levels as of the end of the period. As of December 31, 2016, securities with a total value of approximately $61,574 transferred from Level 2 to Level 1. Securities that were valued using other significant observable inputs at December 31, 2015 were valued using unadjusted quoted prices at December 31, 2016.
3. Foreign Currency Translation and Foreign Investments: The books and records of the Portfolio are maintained in U.S. dollars. Foreign currency amounts are translated into U.S. dollars as follows:
– investments, other assets and liabilities at the prevailing rate of exchange on the valuation date;
– investment transactions and investment income at the prevailing rates of exchange on the dates of such transactions.
Although the net assets of the Portfolio are presented at the foreign exchange rates and market values at the close of the period, the Portfolio does not isolate that portion of the results of operations arising as a result of changes in the foreign exchange rates from the fluctuations arising from changes in the market prices of securities held at
18
Morgan Stanley Institutional Fund, Inc.
Annual Report — December 31, 2016
Notes to Financial Statements (cont'd)
period end. Similarly, the Portfolio does not isolate the effect of changes in foreign exchange rates from the fluctuations arising from changes in the market prices of securities sold during the period. Accordingly, realized and unrealized foreign currency gains (losses) on investments in securities are included in the reported net realized and unrealized gains (losses) on investment transactions and balances. However, pursuant to U.S. federal income tax regulations, gains and losses from certain foreign currency transactions and the foreign currency portion of gains and losses realized on sales and maturities of foreign denominated debt securities are treated as ordinary income for U.S. federal income tax purposes.
Net realized gains (losses) on foreign currency transactions represent net foreign exchange gains (losses) from foreign currency forward exchange contracts, disposition of foreign currencies, currency gains (losses) realized between the trade and settlement dates on securities transactions, and the difference between the amount of investment income and foreign withholding taxes recorded on the Portfolio's books and the U.S. dollar equivalent amounts actually received or paid. Net unrealized currency gains (losses) from valuing foreign currency denominated assets and liabilities at period end exchange rates are reflected as a component of unrealized appreciation (depreciation) in the Statement of Assets and Liabilities. The change in unrealized currency gains (losses) on foreign currency translations for the period is reflected in the Statement of Operations.
Foreign security and currency transactions may involve certain considerations and risks not typically associated with those of U.S. dollar denominated transactions as a result of, among other factors, fluctuations of exchange rates in relation to the U.S. dollar, the possibility of lower levels of governmental supervision and regulation of foreign securities markets and the possibility of political or economic instability.
Governmental approval for foreign investments may be required in advance of making an investment under certain circumstances in some countries, and the extent of foreign investments in domestic companies may be subject to limitation in other countries. Foreign ownership limitations also may be imposed by the charters of individual companies to prevent, among other concerns, violations of foreign investment limitations. As a result,
an additional class of shares (identified as "Foreign" in the Portfolio of Investments) may be created and offered for investment. The "local" and "foreign shares" market values may differ. In the absence of trading of the foreign shares in such markets, the Portfolio values the foreign shares at the closing exchange price of the local shares.
4. Redemption Fees: The Portfolio will assess a 2% redemption fee on Class I shares, Class A shares, Class C shares and Class IS shares, which is paid directly to the Portfolio, for shares redeemed or exchanged within thirty days of purchase, subject to certain exceptions. The redemption fee is designed to protect the Portfolio and its remaining shareholders from the effects of short-term trading. These fees, if any, are included in the Statements of Changes in Net Assets.
5. Indemnifications: The Fund enters into contracts that contain a variety of indemnifications. The Fund's maximum exposure under these arrangements is unknown. However, the Fund has not had prior claims or losses pursuant to these contracts and expects the risk of loss to be remote.
6. Dividends and Distributions to Shareholders: Dividend income and distributions to shareholders are recorded on the ex-dividend date. Dividends from net investment income, if any, are declared and paid annually. Net realized capital gains, if any, are distributed at least annually.
7. Security Transactions, Income and Expenses: Security transactions are accounted for on the trade date (date the order to buy or sell is executed). Realized gains and losses on the sale of investment securities are determined on the specific identified cost method. Dividend income and other distributions are recorded on the ex-dividend date (except for certain foreign dividends which may be recorded as soon as the Portfolio is informed of such dividends) net of applicable withholding taxes. Interest income is recognized on the accrual basis except where collection is in doubt. Discounts are accreted and premiums are amortized over the life of the respective securities. Most expenses of the Fund can be directly attributed to a particular Portfolio. Expenses which cannot be directly attributed are apportioned among the Portfolios based upon relative net assets or other appropriate methods. Income, expenses (other than class specific expenses — distribution and shareholder services, transfer agency and sub transfer
19
Morgan Stanley Institutional Fund, Inc.
Annual Report — December 31, 2016
Notes to Financial Statements (cont'd)
agency fees) and realized and unrealized gains or losses are allocated to each class of shares based upon their relative net assets.
B. Advisory/Sub-Advisory Fees: The Adviser, a wholly-owned subsidiary of Morgan Stanley, provides the Portfolio with advisory services under the terms of an Investment Advisory Agreement, paid quarterly, at the annual rate based on the daily net assets as follows:
First $1
billion | | Over $1
billion | |
| | 0.90 | % | | | 0.85 | % | |
For the year ended December 31, 2016, the advisory fee rate (net of waivers/rebate) was equivalent to an annual effective rate of 0.70% of the Portfolio's average daily net assets.
Pursuant to the Reorganization, the Adviser has agreed to reduce its advisory fee and/or reimburse the Portfolio so that total annual portfolio operating expenses, excluding certain investment related expenses, taxes, interest and other extraordinary expenses (including litigation), will not exceed 1.20% for Class I shares, 1.55% for Class A shares, 2.30% for Class C shares and 1.10% for Class IS shares. The fee waivers and/or expense reimbursements will continue for at least three years from the date of the Reorganization or until such time as the Directors act to discontinue all or a portion of such waivers and/or reimbursements when they deem such action is appropriate. For the year ended December 31, 2016, approximately $138,000 of advisory fees were waived and approximately $4,000 of other expenses were reimbursed by the Adviser pursuant to this arrangement.
The Adviser has entered into a Sub-Advisory Agreement with the Sub-Adviser, a wholly-owned subsidiary of Morgan Stanley. The Sub-Adviser provides the Portfolio with advisory services subject to the overall supervision of the Adviser and the Fund's Officers and Directors. The Adviser pays the Sub-Adviser on a monthly basis a portion of the net advisory fees the Adviser receives from the Portfolio.
C. Administration Fees: The Adviser also serves as Administrator to the Fund and provides administrative services pursuant to an Administration Agreement for an annual fee, accrued daily and paid monthly, of 0.08% of the Portfolio's average daily net assets.
Under a Sub-Administration Agreement between the Administrator and State Street Bank and Trust Company ("State Street"), State Street provides certain administrative services to the Fund. For such services, the Administrator pays State
Street a portion of the fee the Administrator receives from the Portfolio.
D. Distribution and Shareholder Services Fees: Morgan Stanley Distribution, Inc. ("MSDI" or the "Distributor"), a wholly-owned subsidiary of the Adviser and Sub-Adviser and an indirect subsidiary of Morgan Stanley, serves as the Fund's Distributor of Portfolio shares pursuant to a Distribution Agreement. The Fund has adopted a Shareholder Services Plan with respect to Class A shares pursuant to Rule 12b-1 under the Act. Under the Shareholder Services Plan, the Portfolio pays the Distributor a shareholder services fee, accrued daily and paid monthly, at an annual rate of 0.25% of the Portfolio's average daily net assets attributable to Class A shares.
The Fund has adopted a Distribution and Shareholder Services Plan with respect to Class C shares pursuant to Rule 12b-1 under the Act. Under the Distribution and Shareholder Services Plan, the Portfolio pays the Distributor a distribution fee, accrued daily and paid monthly, at an annual rate of 0.75% and a shareholder services fee, accrued daily and paid monthly, at an annual rate of 0.25% of the Portfolio's average daily net assets attributable to Class C shares.
The distribution and shareholder services fees are used to support the expenses associated with servicing and maintaining accounts. The Distributor may compensate other parties for providing shareholder support services to investors who purchase Class A and Class C shares.
E. Dividend Disbursing and Transfer Agent: The Fund's dividend disbursing and transfer agent is Boston Financial Data Services, Inc. ("BFDS"). Pursuant to a Transfer Agency Agreement, the Fund pays BFDS a fee based on the number of classes, accounts and transactions relating to the Portfolios of the Fund.
F. Custodian Fees: State Street (the "Custodian") serves as Custodian for the Fund in accordance with a Custodian Agreement. The Custodian holds cash, securities, and other assets of the Fund as required by the Act. Custody fees are payable monthly based on assets held in custody, investment purchases and sales activity and account maintenance fees, plus reimbursement for certain out-of-pocket expenses.
In December 2015, the Fund's Custodian announced that it had identified inconsistencies in the way in which clients were invoiced for out-of-pocket expenses from 1998 until November 2015. The dollar amount difference between what
20
Morgan Stanley Institutional Fund, Inc.
Annual Report — December 31, 2016
Notes to Financial Statements (cont'd)
was charged and what should have been charged, plus interest, was paid back to the Portfolio in September 2016 as a reimbursement. The Custodian reimbursed the Portfolio directly, which was recognized as a change in accounting estimate and was reflected as "Reimbursement of Custodian Fees" in the Statement of Operations. Pursuant to the expense limitations described in Note B, the Portfolio has experienced waiver of advisory fees and expenses reimbursed by the Adviser during the current period. Accordingly, the reimbursement of out-of-pocket custodian expenses in the current period resulted in the reduction in the current period waiver of advisory fees and expenses reimbursed by the Adviser.
G. Security Transactions and Transactions with Affiliates: For the year ended December 31, 2016, purchases and sales of investment securities for the Portfolio, other than long-term U.S. Government securities and short-term investments, were approximately $119,290,000 and $31,412,000, respectively. There were no purchases and sales of long-term U.S. Government securities for the year ended December 31, 2016.
The Portfolio invests in the Institutional Class of the Morgan Stanley Institutional Liquidity Funds (the "Liquidity Funds"), an open-end management investment company managed by the Adviser. Advisory fees paid by the Portfolio are reduced by an amount equal to its pro-rata share of the advisory and administration fees paid by the Portfolio due to its investment in the Liquidity Funds. For the year ended December 31, 2016, advisory fees paid were reduced by approximately $7,000 relating to the Portfolio's investment in the Liquidity Funds.
A summary of the Portfolio's transactions in shares of the Liquidity Funds during the year ended December 31, 2016 is as follows:
Value
December 31,
2015
(000) | | Purchases
at Cost
(000) | | Sales
(000) | | Dividend
Income
(000) | | Value
December 31,
2016
(000) | |
| $ | 1,066 | | | $ | 114,562 | | | $ | 112,901 | | | $ | 13 | | | $ | 2,727 | | |
The Portfolio invests in Morgan Stanley India Investment Fund, Inc., a closed-end management investment company advised by an affiliate of the Adviser. Advisory fees paid by the Portfolio are reduced by an amount equal to its pro-rata share of the advisory and administration fees paid by the Morgan Stanley India Investment Fund, Inc. For the year ended December 31, 2016, advisory fees paid were reduced by approximately $6,000 relating to the Portfolio's investment in the Morgan Stanley India Investment Fund, Inc.
A summary of the Portfolio's transactions in shares of the Morgan Stanley India Investment Fund, Inc. during the year ended December 31, 2016 is as follows:
Value
December 31,
2016
(000) | | Purchases
at Cost
(000) | | Sales
(000) | | Realized
Loss
(000) | | Dividend
Income
(000) | | Value
December 31,
2016
(000) | |
| $ | — | | | $ | 2,949 | | | $ | 3,166 | | | $ | 217 | | | $ | — | | | $ | — | | |
The Portfolio is permitted to purchase and sell securities ("cross-trade") from and to other Morgan Stanley Funds as well as other funds and client accounts for which the Adviser or an affiliate of the Adviser serves as investment adviser, pursuant to procedures approved by the Directors in compliance with Rule 17a-7 under the Act (the "Rule"). Each cross-trade is executed at the current market price in compliance with provisions of the Rule. For the year ended December 31, 2016, the Portfolio did not engage in any cross-trade transactions.
The Portfolio has an unfunded Deferred Compensation Plan (the "Compensation Plan"), which allows each independent Director to defer payment of all, or a portion, of the fees he or she receives for serving on the Board of Directors. Each eligible Director generally may elect to have the deferred amounts credited with a return equal to the total return on one or more of the Morgan Stanley funds that are offered as investment options under the Compensation Plan. Appreciation/depreciation and distributions received from these investments are recorded with an offsetting increase/decrease in the deferred compensation obligation and do not affect the NAV of the Portfolio.
H. Federal Income Taxes: It is the Portfolio's intention to continue to qualify as a regulated investment company and distribute all of its taxable and tax-exempt income. Accordingly, no provision for federal income taxes is required in the financial statements.
The Portfolio may be subject to taxes imposed by countries in which it invests. Such taxes are generally based on income and/or capital gains earned or repatriated. Taxes are accrued based on net investment income, net realized gains and net unrealized appreciation as such income and/or gains are earned. Taxes may also be based on transactions in foreign currency and are accrued based on the value of investments denominated in such currency.
FASB ASC 740-10, "Income Taxes — Overall", sets forth a minimum threshold for financial statement recognition of the benefit of a tax position taken or expected to be taken in a tax return. Management has concluded there are no significant
21
Morgan Stanley Institutional Fund, Inc.
Annual Report — December 31, 2016
Notes to Financial Statements (cont'd)
uncertain tax positions that would require recognition in the financial statements. If applicable, the Portfolio recognizes interest accrued related to unrecognized tax benefits in "Interest Expense" and penalties in "Other Expenses" in the Statement of Operations. The Portfolio files tax returns with the U.S. Internal Revenue Service, New York and various states. Generally, each of the tax years in the two-year period ended December 31, 2016 remains subject to examination by taxing authorities.
The tax character of distributions paid may differ from the character of distributions shown in the Statements of Changes in Net Assets due to short-term capital gains being treated as ordinary income for tax purposes. The tax character of distributions paid during fiscal years 2016 and 2015 was as follows:
2016
Distributions
Paid From: | | 2015
Distributions
Paid From: | |
Ordinary
Income
(000) | | Long-Term
Capital Gain
(000) | | Paid-in-
Capital
(000) | | Ordinary
Income
(000) | | Long-Term
Capital Gain
(000) | |
| $ | 43 | | | $ | — | | | $ | 34 | | | $ | 383 | | | $ | — | | |
The amount and character of income and gains to be distributed are determined in accordance with income tax regulations which may differ from GAAP. These book/tax differences are either considered temporary or permanent in nature.
Temporary differences are primarily due to differing book and tax treatments in the timing of the recognition of gains (losses) on certain investment transactions and the timing of the deductibility of certain expenses.
Permanent differences, primarily due to differing treatments of gains (losses) related to foreign currency transactions and a dividend redesignation, resulted in the following reclassifications among the Portfolio's components of net assets at December 31, 2016:
Distributions
in Excess of Net
Investment
Income
(000) | | Accumulated
Net Realized
Loss
(000) | | Paid-in-
Capital
(000) | |
| $ | (51 | ) | | $ | 52 | | | $ | (1 | ) | |
At December 31, 2016, the Portfolio had no distributable earnings on a tax basis.
At December 31, 2016, the Portfolio had available for federal income tax purposes unused short-term capital losses of approximately $608,000 and long-term capital losses of approximately $134,000 that do not have an expiration date.
To the extent that capital loss carryforwards are used to offset any future capital gains realized, no capital gains tax liability
will be incurred by the Portfolio for gains realized and not distributed. To the extent that capital gains are offset, such gains will not be distributed to the shareholders.
Qualified late year losses are capital losses and specified ordinary losses, including currency losses, incurred after October 31 but within the taxable year that, if elected, are deemed to arise on the first day of the Portfolio's next taxable year. For the year ended December 31, 2016, the Portfolio deferred to January 1, 2017 for U.S. federal income tax purposes the following losses:
Qualified Late
Year Ordinary
Losses
(000) | | Post-October
Capital Losses
(000) | |
| $ | 6 | | | $ | — | | |
I. Credit Facility: As of April 4, 2016, the Fund and other Morgan Stanley funds participated in a $150,000,000 committed, unsecured revolving line of credit facility (the "facility") with State Street. This facility is to be used for temporary emergency purposes or funding of shareholder redemption requests. The interest rate on borrowings is based on the federal funds rate or one month libor rate plus a spread. The facility also has a commitment fee of 0.25% per annum based on the unused portion of the facility. During the year ended December 31, 2016, the Portfolio did not have any borrowings under the facility.
J. Other: At December 31, 2016, the Portfolio had record owners of 10% or greater. Investment activities of these shareholders could have a material impact on the Portfolio. The aggregate percentage of such owners was 67.2%.
K. Accounting Pronouncements: In December 2016, FASB issued Accounting Standards update 2016-19 — Technical Corrections and Improvements ("ASU 2016-19"), which is effective for interim periods for all entities beginning after December 15, 2016. ASU 2016-19 includes an amendment to Topic 820, Fair Value Measurement, which clarifies the difference between a valuation approach and a valuation technique when applying the guidance in that Topic. That amendment also requires an entity to disclose when there has been a change in either or both a valuation approach and/or a valuation technique. The transition guidance for the amendment must be applied prospectively because it could potentially involve the use of hindsight that includes fair value measurements. Although still evaluating the potential impacts of ASU 2016-19 to the Portfolio, management expects that the impact of the Portfolio's adoption will be limited to additional financial statement disclosures.
22
Morgan Stanley Institutional Fund, Inc.
Annual Report — December 31, 2016
Notes to Financial Statements (cont'd)
In October 2016, the Securities and Exchange Commission ("SEC") issued a new rule, Investment Company Reporting Modernization, which, among other provisions, amends Regulation S-X to require standardized, enhanced disclosures, particularly related to derivatives, in investment company financial statements. Compliance with the guidance is effective for financial statements filed with the SEC on or after August 1, 2017; adoption will have no effect on the Portfolio's net assets or results of operations. Although still evaluating the potential impacts of the Investment Company Reporting Modernization to the Portfolio, management expects that the impact of the Portfolio's adoption will be limited to additional financial statement disclosures.
23
Morgan Stanley Institutional Fund, Inc.
Annual Report — December 31, 2016
Report of Independent Registered Public Accounting Firm
To the Stockholders and Board of Directors of
Emerging Markets Leaders Portfolio
We have audited the accompanying statement of assets and liabilities, including the portfolio of investments, of Emerging Markets Leaders Portfolio (one of the portfolios constituting Morgan Stanley Institutional Fund, Inc.) (the "Portfolio") as of December 31, 2016, and the related statement of operations for the year then ended, and the statements of changes in net assets and the financial highlights for each of the years or periods indicated therein. These financial statements and financial highlights are the responsibility of the Portfolio's management. Our responsibility is to express an opinion on these financial statements and financial highlights based on our audits.
We conducted our audits in accordance with the standards of the Public Company Accounting Oversight Board (United States). Those standards require that we plan and perform the audit to obtain reasonable assurance about whether the financial statements and financial highlights are free of material misstatement. We were not engaged to perform an audit of the Portfolio's internal control over financial reporting. Our audits included consideration of internal control over financial reporting as a basis for designing audit procedures that are appropriate in the circumstances, but not for the purpose of expressing an opinion on the effectiveness of the Portfolio's internal control over financial reporting. Accordingly, we express no such opinion. An audit also includes examining, on a test basis, evidence supporting the amounts and disclosures in the financial statements and financial highlights, assessing the accounting principles used and significant estimates made by management, and evaluating the overall financial statement presentation. Our procedures included confirmation of securities owned as of December 31, 2016, by correspondence with the custodian and others or by other appropriate auditing procedures where replies from others were not received. We believe that our audits provide a reasonable basis for our opinion.
In our opinion, the financial statements and financial highlights referred to above present fairly, in all material respects, the financial position of Emerging Markets Leaders Portfolio at December 31, 2016, the results of its operations for the year then ended, and the changes in its net assets and the financial highlights for each of the years or periods indicated therein, in conformity with U.S. generally accepted accounting principles.

Boston, Massachusetts
February 28, 2017
24
Morgan Stanley Institutional Fund, Inc.
Annual Report — December 31, 2016
Federal Tax Notice (unaudited)
For federal income tax purposes, the following information is furnished with respect to the distributions paid by the Portfolio during its taxable year ended December 31, 2016. For corporate shareholders, 38.8% of the dividends qualified for the dividends received deduction.
For federal income tax purposes, the following information is furnished with respect to the Portfolio's earnings for its taxable year ended December 31, 2016. When distributed, certain earnings may be subject to a maximum tax rate of 15% as provided for the Jobs and Growth Tax Relief Reconciliation Act of 2003. The Portfolio designated up to a maximum of approximately $153,000 as taxable at this lower rate.
The Portfolio intends to pass through foreign tax credits of approximately $76,000 and has derived net income from sources within foreign countries amounting to approximately $901,000.
In January, the Portfolio provides tax information to shareholders for the preceding calendar year.
25
Morgan Stanley Institutional Fund, Inc.
Annual Report — December 31, 2016
Privacy Notice (unaudited)
MORGAN STANLEY INVESTMENT MANAGEMENT INC.
AN IMPORTANT NOTICE CONCERNING OUR U.S. PRIVACY POLICY
We are required by federal law to provide you with a copy of our privacy policy annually. This policy applies to current and former individual investors in funds managed or sponsored by Morgan Stanley Investment Management Inc. ("MSIM") as well as current and former individual clients of MSIM. This policy is not applicable to partnerships, corporations, trusts or other non-individual clients or investors. Please note that we may amend this policy at any time, and will inform you of any changes as required by law.
WE RESPECT YOUR PRIVACY
We appreciate that you have provided us with your personal financial information. We strive to maintain the privacy of such information while we help you achieve your financial objectives. This Notice describes what non-public personal information we collect about you, why we collect it, when we may share it with others and how certain others may use it. It discusses the steps you may take to limit our sharing of certain information about you to affiliated companies in the Morgan Stanley family of companies ("other Morgan Stanley companies"). It also discloses how you may limit use of certain shared information for marketing purposes by other Morgan Stanley branded companies. Throughout this policy, we refer to the non-public information that personally identifies you or your accounts as "personal information.''
1. WHAT PERSONAL INFORMATION DO WE COLLECT ABOUT YOU?
We obtain personal information from applications and other forms you submit to us, from your dealings with us, from consumer reporting agencies, from our Web sites and from third parties and other sources.
For example:
• We may collect information such as your name, address, e-mail address, telephone/fax numbers, assets, income and investment objectives through subscription documents, applications and other forms you submit to us.
• We may obtain information about account balances, your use of account(s) and the types of products and services you prefer to receive from us through your dealings and transactions with us and other sources.
• We may obtain information about your creditworthiness and credit history from consumer reporting agencies.
• We may collect background information from and through third-party vendors to verify representations you have made and to comply with various regulatory requirements.
• If you interact with us through our public and private Web sites, we may collect information that you provide directly through online communications (such as an e-mail address). We may also collect information about your Internet service provider, your domain name, your computer's operating system and Web browser, your use of our Web sites and your product and service preferences, through the use of "cookies." Please consult the Terms of Use of these sites for more details.
2. WHEN DO WE DISCLOSE PERSONAL INFORMATION WE COLLECT ABOUT YOU?
We may disclose personal information we collect about you to other Morgan Stanley companies and to non-affiliated third parties.
a. Information We Disclose to Other Morgan Stanley Companies.
We may disclose personal information to other Morgan Stanley companies for a variety of reasons, including to manage your account(s) effectively, to service and process your transactions, to let you know about products and services offered by us and other Morgan Stanley companies, to manage our business, and as otherwise required or permitted by law. Offers for products and services from other Morgan Stanley companies are developed under conditions designed to safeguard your personal information.
26
Morgan Stanley Institutional Fund, Inc.
Annual Report — December 31, 2016
Privacy Notice (unaudited) (cont'd)
b. Information We Disclose to Non-affiliated Third Parties.
We do not disclose personal information that we collect about you to non-affiliated third parties except to those who provide marketing services on our behalf, to financial institutions with whom we have joint marketing agreements, and as otherwise required or permitted by law. For example, we may disclose personal information to nonaffiliated third parties for servicing and processing transactions, to offer our own products and services, to protect against fraud, for institutional risk control, to respond to judicial process or to perform services on our behalf. When we share personal information with a non-affiliated third party, they are required to limit their use of personal information to the particular purpose for which it was shared and they are not allowed to share personal information with others except to fulfill that limited purpose or as may be permitted or required by law.
3. HOW DO WE PROTECT THE SECURITY AND CONFIDENTIALITY OF PERSONAL INFORMATION WE COLLECT ABOUT YOU?
We maintain physical, electronic and procedural security measures to help safeguard the personal information we collect about you. We have internal policies governing the proper handling of client information. Third parties that provide support or marketing services on our behalf may also receive personal information, and we require them to adhere to confidentiality standards with respect to such information.
4. HOW CAN YOU LIMIT THE SHARING OF CERTAIN TYPES OF PERSONAL INFORMATION WITH OTHER MORGAN STANLEY COMPANIES?
We offer you choices as to whether we share with other Morgan Stanley companies the personal information that was collected to determine your eligibility for products and services you request ("eligibility information"). Eligibility information does not include your identification information or personal information pertaining to our transactions or experiences with you. Please note that, even if you direct us not to share eligibility information with other Morgan Stanley companies ("opt-out"), we may still share personal information, including eligibility information, with those companies in circumstances excluded from the opt-out under applicable law, such as to process transactions or to service your account.
5. HOW CAN YOU LIMIT THE USE OF CERTAIN TYPES OF PERSONAL INFORMATION BY OTHER MORGAN STANLEY COMPANIES FOR MARKETING?
By following the opt-out instructions in Section 6 below, you may limit other Morgan Stanley branded companies from marketing their products or services to you based on personal information we disclose to them. This information may include, for example, your income and account history with us. Please note that, even if you choose to limit Other Morgan Stanley Companies from using personal information about you that we may share with them for marketing their products and services to you, Other Morgan Stanley Companies may use your personal information that they obtain from us to market to you in circumstances permitted by law, such as if the Other Morgan Stanley Company has its own relationship with you.
6. HOW CAN YOU SEND US AN OPT-OUT INSTRUCTION?
If you wish to limit our sharing of eligibility information about you with other Morgan Stanley companies or other Morgan Stanley companies' use of personal information for marketing purposes, as described in this notice, you may do so by:
• Calling us at (800) 548-7786
Monday–Friday between 8a.m. and 6p.m.(EST)
• Writing to us at the following address:
Boston Financial Data Services, Inc.
c/o Privacy Coordinator
P.O. Box 219804
Kansas City, Missouri 64121
27
Morgan Stanley Institutional Fund, Inc.
Annual Report — December 31, 2016
Privacy Notice (unaudited) (cont'd)
Your written request should include your name, address, telephone number and account number(s) to which the opt-out applies and whether you are opting out with respect to sharing of eligibility information (Section 4 above), or if information used for Marketing (Section 5 above) or both. Written opt-out requests should not be sent with any other correspondence. In order to process your request, we require that the request be provided by you directly and not through a third party.
Your opt-out preference will remain in effect with respect to this policy (as it may be amended) until you notify us otherwise. If you have a joint account, your direction for us not to share this information with other Morgan Stanley companies and for those other Morgan Stanley companies not to use your personal information for marketing will be applied to all account holders on that account. Please understand that if you limit our sharing or our affiliated companies' use of personal information, you and any joint account holder(s) may not receive information about Morgan Stanley products and services, including products or services that could help you manage your financial resources and achieve your investment objectives.
7. WHAT IF AN AFFILIATED COMPANY BECOMES A NON-AFFILIATED THIRD PARTY?
If, at any time in the future, an affiliated company becomes a non-affiliated third party, further disclosures of personal information made to the former affiliated company will be limited to those described in Section 2(b) above relating to non-affiliated third parties. If you elected under Section 6 to limit disclosures we make to affiliated companies, or use of personal information by affiliated companies, your election will not apply to use by any former affiliated company of your personal information in their possession once it becomes a non-affiliated third party.
SPECIAL NOTICE TO RESIDENTS OF VERMONT
The following section supplements our policy with respect to our individual clients who have a Vermont address and supersedes anything to the contrary in the above policy with respect to those clients only.
The state of Vermont requires financial institutions to obtain your consent prior to sharing personal information that they collect about you with affiliated companies and non-affiliated third parties other than in certain limited circumstances. Except as permitted by law, we will not share personal information we collect about you with non-affiliated third parties or other Morgan Stanley companies unless you provide us with your written consent to share such information ("opt-in").
If you wish to receive offers for investment products and services offered by or through other Morgan Stanley companies, please notify us in writing at the following address:
Boston Financial Data Services, Inc.
c/o Privacy Coordinator
P.O. Box 219804
Kansas City, Missouri 64121
Your authorization should include your name, address, telephone number and account number(s) to which the opt-in applies and should not be sent with any other correspondence. In order to process your authorization, we require that the authorization be provided by you directly and not through a third party.
SPECIAL NOTICE TO RESIDENTS OF CALIFORNIA
The following section supplements our policy with respect to our individual clients who have a California address and supersedes anything to the contrary in the above policy with respect to those clients only.
In response to a California law, if your account has a California home address, your personal information will not be disclosed to nonaffiliated third parties except as permitted by applicable California law, and we will limit sharing such information with our affiliates to comply with California privacy laws that apply to us.
28
Morgan Stanley Institutional Fund, Inc.
Annual Report — December 31, 2016
Director and Officer Information (unaudited)
Independent Directors:
Name, Age and Address of
Independent Director | | Position(s)
Held with
Registrant | | Length of Time
Served* | | Principal Occupation(s) During Past 5 Years
and Other Relevant Professional Experience | | Number of
Portfolios in
Fund Complex
Overseen by
Independent
Director** | | Other Directorships
Held by Independent
Director*** | |
Frank L. Bowman (72)
c/o Perkins Coie LLP
Counsel to the Independent
Directors
30 Rockefeller Plaza
New York, NY 10112 | | Director | | Since
August
2006 | | President, Strategic Decisions, LLC (consulting) (since February 2009); Director or Trustee of various Morgan Stanley Funds (since August 2006); Chairperson of the Compliance and Insurance Committee (since October 2015); formerly, Chairperson of the Insurance Sub-Committee of the Compliance and Insurance Committee (2007-2015); served as President and Chief Executive Officer of the Nuclear Energy Institute (policy organization) (February 2005-November 2008); retired as Admiral, U.S. Navy after serving over 38 years on active duty including 8 years as Director of the Naval Nuclear Propulsion Program in the Department of the Navy and the U.S. Department of Energy (1996-2004); served as Chief of Naval Personnel (July 1994-September 1996) and on the Joint Staff as Director of Political Military Affairs (June 1992-July 1994); knighted as Honorary Knight Commander of the Most Excellent Order of the British Empire; awarded the Officier de l'Orde National du Mérite by the French Government; elected to the National Academy of Engineering (2009). | | | 90 | | | Director of BP p.l.c.; Director of Naval and Nuclear Technologies LLP; Director Emeritus of the Armed Services YMCA; Director of the U.S. Naval Submarine League; Member of the National Security Advisory Council of the Center for U.S. Global Engagement and a member of the CNA Military Advisory Board; Chairman of the charity J Street Cup Golf; Trustee of Fairhaven United Methodist Church; and Director of other various non-profit organizations. | |
Kathleen A. Dennis (63)
c/o Perkins Coie LLP
Counsel to the Independent
Directors
30 Rockefeller Plaza
New York, NY 10112 | | Director | | Since
August
2006 | | President, Cedarwood Associates (mutual fund and investment management consulting) (since July 2006); Chairperson of the Liquidity and Alternatives Sub-Committee of the Investment Committee (since October 2006) and Director or Trustee of various Morgan Stanley Funds (since August 2006); formerly, Senior Managing Director of Victory Capital Management (1993-2006). | | | 91 | | | Director of various non-profit organizations. | |
Nancy C. Everett (61)
c/o Perkins Coie LLP
Counsel to the Independent
Directors
30 Rockefeller Plaza
New York, NY 10112 | | Director | | Since
January
2015 | | Chief Executive Officer, Virginia Commonwealth University Investment Company (since November 2015); Owner, OBIR, LLC (institutional investment management consulting) (since June 2014); formerly, Managing Director, BlackRock Inc. (February 2011-December 2013); and Chief Executive Officer, General Motors Asset Management (a/k/a Promark Global Advisors, Inc.) (June 2005-May 2010). | | | 91 | | | Member of Virginia Commonwealth University School of Business Foundation; formerly, Member of Virginia Commonwealth University Board of Visitors (2013-2015); Member of Committee on Directors for Emerging Markets Growth Fund, Inc. (2007-2010); Chairperson of Performance Equity Management, LLC (2006-2010); and Chairperson, GMAM Absolute Return Strategies Fund, LLC (2006-2010). | |
29
Morgan Stanley Institutional Fund, Inc.
Annual Report — December 31, 2016
Director and Officer Information (unaudited) (cont'd)
Independent Directors: (cont'd)
Name, Age and Address of
Independent Director | | Position(s)
Held with
Registrant | | Length of Time
Served* | | Principal Occupation(s) During Past 5 Years
and Other Relevant Professional Experience | | Number of
Portfolios in
Fund Complex
Overseen by
Independent
Director** | | Other Directorships
Held by Independent
Director*** | |
Jakki L. Haussler (59)
c/o Perkins Coie LLP
Counsel to the Independent
Directors
30 Rockefeller Plaza
New York, NY 10112 | | Director | | Since
January
2015 | | Chairman and Chief Executive Officer, Opus Capital Group (since January 1996); formerly, Director, Capvest Venture Fund, LP (May 2000-December 2011); Partner, Adena Ventures, LP (July 1999-December 2010); Director, The Victory Funds (February 2005-July 2008). | | | 91 | | | Director of Cincinnati Bell Inc. and Member, Audit Committee and Compensation Committee; Director of Northern Kentucky University Foundation and Member, Investment Committee; Member of Chase College of Law Transactional Law Practice Center Board of Advisors; Director of Best Transport; Director of Chase College of Law Board of Visitors; formerly, Member, University of Cincinnati Foundation Investment Committee; Member, Miami University Board of Visitors (2008-2011); Trustee of Victory Funds (2005-2008) and Chairman, Investment Committee (2007-2008) and Member, Service Provider Committee (2005-2008). | |
Dr. Manuel H. Johnson (67)
c/o Johnson Smick
International, Inc.
220 I Street, N.E. — Suite 200
Washington, D.C. 20002 | | Director | | Since
July
1991 | | Senior Partner, Johnson Smick International, Inc. (consulting firm); Chairperson of the Investment Committee (since October 2006) and Director or Trustee of various Morgan Stanley Funds (since July 1991); Co-Chairman and a founder of the Group of Seven Council (G7C) (international economic commission); formerly, Chairperson of the Audit Committee (July 1991-September 2006), Vice Chairman of the Board of Governors of the Federal Reserve System and Assistant Secretary of the U.S. Treasury. | | | 91 | | | Director of NVR, Inc. (home construction). | |
Joseph J. Kearns (74)
c/o Kearns & Associates LLC
46 E Peninsula Center #385
Rolling Hills Estates,
CA 90274-3712 | | Director | | Since
August
1994 | | President, Kearns & Associates LLC (investment consulting); Chairperson of the Audit Committee (since October 2006) and Director or Trustee of various Morgan Stanley Funds (since August 1994); formerly, Deputy Chairperson of the Audit Committee (July 2003-September 2006) and Chairperson of the Audit Committee of various Morgan Stanley Funds (since August 1994); CFO of the J. Paul Getty Trust. | | | 93 | | | Director of Electro Rent Corporation (equipment leasing). Prior to December 31, 2013, Director of The Ford Family Foundation. | |
30
Morgan Stanley Institutional Fund, Inc.
Annual Report — December 31, 2016
Director and Officer Information (unaudited) (cont'd)
Independent Directors: (cont'd)
Name, Age and Address of
Independent Director | | Position(s)
Held with
Registrant | | Length of Time
Served* | | Principal Occupation(s) During Past 5 Years
and Other Relevant Professional Experience | | Number of
Portfolios in
Fund Complex
Overseen by
Independent
Director** | | Other Directorships
Held by Independent
Director*** | |
Michael F. Klein (58)
c/o Perkins Coie LLP
Counsel to the Independent
Directors
30 Rockefeller Plaza
New York, NY 10112 | | Director | | Since
August
2006 | | Managing Director, Aetos Capital, LLC (since March 2000); Co-President, Aetos Alternatives Management, LLC (since January 2004) and Co-Chief Executive Officer of Aetos Capital LLC (since August 2013); Chairperson of the Fixed Income Sub-Committee of the Investment Committee (since October 2006) and Director or Trustee of various Morgan Stanley Funds (since August 2006); formerly, Managing Director, Morgan Stanley & Co. Inc. and Morgan Stanley Dean Witter Investment Management, President, various Morgan Stanley Funds (June 1998-March 2000) and Principal, Morgan Stanley & Co. Inc. and Morgan Stanley Dean Witter Investment Management (August 1997-December 1999). | | | 90 | | | Director of certain investment funds managed or sponsored by Aetos Capital, LLC; Director of Sanitized AG and Sanitized Marketing AG (specialty chemicals). | |
Patricia Maleski (56)
c/o Perkins Coie LLP
Counsel to the Independent
Directors
30 Rockefeller Plaza
New York, NY 10112 | | Director | | Since
January
2017 | | Management Director, JPMorgan Asset Management (2013-2016); President, JPMorgan Funds (2010-2013), Chief Administrative Officer, JPMorgan Funds (2004-2010), Treasurer, JPMorgan Funds (2003-2004, 2008-2010), and Vice President and Board Liaison, JPMorgan Funds (2001-2004); Managing Director, J.P. Morgan Investment Management Inc. (2001-2013); Vice President of Finance, Pierpont Group (1996-2001); Vice President, Bank of New York (1995-1996); Senior Audit Manager, Price Waterhouse, LLP (1982-1995). | | | 91 | | | None. | |
Michael E. Nugent (80)
522 Fifth Avenue
New York, NY 10036 | | Chair of the
Board and
Director | | Chair of the Boards since July 2006 and Director since July 1991 | | Chair of the Boards of various Morgan Stanley Funds (since July 2006); Chairperson of the Closed-End Fund Committee (since June 2012) and Director or Trustee of various Morgan Stanley Funds (since July 1991); formerly, Chairperson of the Insurance Committee (until July 2006); General Partner, Triumph Capital, L.P. (private investment partnership) (1988-2013). | | | 92 | | | None. | |
W. Allen Reed (69)
c/o Perkins Coie LLP
Counsel to the Independent
Directors
30 Rockefeller Plaza
New York, NY 10112 | | Director | | Since
August
2006 | | Chairperson of the Equity Sub-Committee of the Investment Committee (since October 2006) and Director or Trustee of various Morgan Stanley Funds (since August 2006); formerly, President and CEO of General Motors Asset Management; Chairman and Chief Executive Officer of the GM Trust Bank and Corporate Vice President of General Motors Corporation (August 1994-December 2005). | | | 91 | | | Director of Legg Mason, Inc.; formerly, Director of the Auburn University Foundation (2010-2015). | |
Fergus Reid (84)
c/o Joe Pietryka, Inc.
85 Charles Colman Blvd.
Pawling, NY 12564 | | Director | | Since
June
1992 | | Chairman, Joe Pietryka, Inc.; Chairperson of the Governance Committee and Director or Trustee of various Morgan Stanley Funds (since June 1992). | | | 92 | | | Formerly, Trustee and Director of certain investment companies in the JP Morgan Fund Complex managed by JP Morgan Investment Management Inc. (1987-2012). | |
* This is the earliest date the Director began serving the Morgan Stanley Funds. Each Director serves an indefinite term, until his or her successor is elected.
** The Fund Complex includes (as of December 31, 2016) all open-end and closed-end funds (including all of their portfolios) advised by Morgan Stanley Investment Management Inc. (the "Adviser") and any funds that have an adviser that is an affiliated person of the Adviser (including, but not limited to, Morgan Stanley AIP GP LP).
*** This includes any directorships at public companies and registered investment companies held by the Director at any time during the past five years.
31
Morgan Stanley Institutional Fund, Inc.
Annual Report — December 31, 2016
Director and Officer Information (unaudited) (cont'd)
Executive Officers:
Name, Age and Address of Executive Officer | | Position(s) Held
with
Registrant | | Length of Time
Served* | | Principal Occupation(s) During Past 5 Years | |
John H. Gernon (53)
522 Fifth Avenue
New York, NY 10036 | | President and
Principal
Executive
Officer | | Since
September
2013 | | President and Principal Executive Officer of the Equity and Fixed Income Funds and the Morgan Stanley AIP Funds (since September 2013) and the Liquidity Funds and various money market funds (since May 2014) in the Fund Complex; Managing Director of the Adviser; Head of Product (since 2006). | |
Timothy J. Knierim (58)
522 Fifth Avenue
New York, NY 10036 | | Chief
Compliance
Officer | | Since
December
2016 | | Managing Director of the Adviser and various entities affiliated with the Adviser; Chief Compliance Officer of various Morgan Stanley Funds and the Adviser (since December 2016) and Chief Compliance Officer of Morgan Stanley AIP GP LP (since 2014). Formerly, Managing Director and Deputy Chief Compliance Officer of the Adviser (2014-2016); and formerly, Chief Compliance Officer of Prudential Investment Management, Inc. (2007-2014). | |
Francis J. Smith (51)
522 Fifth Avenue
New York, NY 10036 | | Treasurer and
Principal
Financial Officer | | Treasurer
since July
2003 and
Principal
Financial
Officer since
September
2002 | | Managing Director of the Adviser and various entities affiliated with the Adviser; Treasurer (since July 2003) and Principal Financial Officer of various Morgan Stanley Funds (since September 2002). | |
Mary E. Mullin (49)
522 Fifth Avenue
New York, NY 10036 | | Secretary | | Since
June
1999 | | Executive Director of the Adviser; Secretary of various Morgan Stanley Funds (since June 1999). | |
* This is the earliest date the officer began serving the Morgan Stanley Funds. Each officer serves a one-year term, until his or her successor is elected and qualifies.
32
Morgan Stanley Institutional Fund, Inc.
Annual Report — December 31, 2016
Adviser and Administrator
Morgan Stanley Investment Management Inc.
522 Fifth Avenue
New York, New York 10036
Sub-Adviser
Morgan Stanley Investment Management Company
23 Church Street
16-01 Capital Square, Singapore 049481
Distributor
Morgan Stanley Distribution, Inc.
522 Fifth Avenue
New York, New York 10036
Dividend Disbursing and Transfer Agent
Boston Financial Data Services, Inc.
2000 Crown Colony Drive
Quincy, Massachusetts 02169
Custodian
State Street Bank and Trust Company
One Lincoln Street
Boston, Massachusetts 02111
Legal Counsel
Dechert LLP
1095 Avenue of the Americas
New York, New York 10036
Counsel to the Independent Directors
Perkins Coie LLP
30 Rockefeller Plaza
New York, New York 10112
Independent Registered Public Accounting Firm
Ernst & Young LLP
200 Clarendon Street
Boston, Massachusetts 02116
Reporting to Shareholders
Each Morgan Stanley fund provides a complete schedule of portfolio holdings in its semi-annual and annual reports within 60 days of the end of the fund's second and fourth fiscal quarters. The semi-annual and annual reports are filed electronically with the Securities and Exchange Commission (SEC) on Form N-CSRS and Form N-CSR, respectively. Morgan Stanley also delivers the semi-annual and annual reports to fund shareholders and makes these reports available on its public website, www.morganstanley.com/im. Each Morgan Stanley fund also files a complete schedule of portfolio holdings with the SEC for the fund's first and third fiscal quarters on Form N-Q. Morgan Stanley does not deliver the reports for the first and third fiscal quarters to shareholders, nor are the reports posted to the Morgan Stanley public website. You may, however, obtain the Form N-Q filings (as well as the Form N-CSR and N-CSRS filings) by accessing the SEC's website, www.sec.gov. You may also review and copy them at the SEC's Public Reference Room in Washington, DC. Information on the operation of the SEC's Public Reference Room may be obtained by calling the SEC toll free at 1 (800) SEC-0330. You can also request copies of these materials, upon payment of a duplicating fee, by electronic request at the SEC's email address (publicinfo@sec.gov) or by writing the Public Reference Room of the SEC, 100 F Street, NE, Washington, DC 20549-0102.
Proxy Voting Policies and Procedures and Proxy Voting Record
You may obtain a copy of the Fund's Proxy Voting Policy and Procedures and information regarding how the Fund voted proxies relating to portfolio securities during the most recent twelve-month period ended June 30, without charge, upon request, by calling toll free 1 (800) 548-7786 or by visiting our website at www.morganstanley.com/im. This information is also available on the SEC's website at www.sec.gov.
This report is authorized for distribution only when preceded or accompanied by a prospectus or summary prospectus of the applicable Portfolio of Morgan Stanley Institutional Fund, Inc., which describes in detail the Portfolio's investment policies, risks, fees and expenses. Please read the prospectus carefully before you invest or send money. For additional information, including information regarding the investments comprising the Portfolio, please visit our website at www.morganstanley.com/im or call toll free 1 (800) 548-7786.
33
Printed in U.S.A.
This Report has been prepared for shareholders and may be distributed to others only if preceded or accompanied by a current prospectus.
Morgan Stanley Investment Management Inc.
522 Fifth Avenue
New York, New York 10036
© 2017 Morgan Stanley. Morgan Stanley Distribution, Inc.

IFIEMLANN
1696344 EXP. 02.28.18

Morgan Stanley Institutional Fund, Inc.
Emerging Markets Portfolio
Annual Report
December 31, 2016

Morgan Stanley Institutional Fund, Inc.
Annual Report — December 31, 2016
Shareholders' Letter | | | 2 | | |
Expense Example | | | 3 | | |
Investment Overview | | | 4 | | |
Portfolio of Investments | | | 7 | | |
Statement of Assets and Liabilities | | | 10 | | |
Statement of Operations | | | 12 | | |
Statements of Changes in Net Assets | | | 13 | | |
Financial Highlights | | | 15 | | |
Notes to Financial Statements | | | 20 | | |
Report of Independent Registered Public Accounting Firm | | | 31 | | |
Federal Tax Notice | | | 32 | | |
Privacy Notice | | | 33 | | |
Director and Officer Information | | | 36 | | |
This report is authorized for distribution only when preceded or accompanied by a prospectus or summary prospectus of the applicable Portfolio of Morgan Stanley Institutional Fund, Inc. To receive a prospectus and/or statement of additional information (SAI), which contains more complete information such as investment objectives, charges, expenses, policies for voting proxies, risk considerations, and describes in detail each of the Portfolio's investment policies to the prospective investor, please call toll free 1 (800) 548-7786. Please read the prospectuses carefully before you invest or send money.
Additionally, you can access information about the Portfolio, including performance, characteristics, and investment team commentary, through Morgan Stanley Investment Management's website: www.morganstanley.com/im.
Market forecasts provided in this report may not necessarily come to pass. There is no guarantee that any sectors mentioned will continue to perform as discussed herein or that securities in such sectors will be held by the Portfolio in the future. There is no assurance that a Portfolio will achieve its investment objective. Portfolios are subject to market risk, which is the possibility that market values of securities owned by the Portfolio will decline and, therefore, the value of the Portfolio's shares may be less than what you paid for them. Accordingly, you can lose money investing in this Portfolio. Please see the prospectus for more complete information on investment risks.
1
Morgan Stanley Institutional Fund, Inc.
Annual Report — December 31, 2016
Shareholders' Letter (unaudited)
Dear Shareholders,
We are pleased to provide this Annual report, in which you will learn how your investment in Emerging Markets Portfolio (the "Portfolio") performed during the latest twelve-month period.
Morgan Stanley Investment Management is a client-centric, investor-led organization. Our global presence, intellectual capital, and breadth of products and services enable us to partner with investors to meet the evolving challenges of today's financial markets. We aim to deliver superior investment service and to empower our clients to make the informed decisions that help them reach their investment goals.
As always, we thank you for selecting Morgan Stanley Investment Management, and look forward to working with you in the months and years ahead.
Sincerely,

John H. Gernon
President and Principal Executive Officer
January 2017
2
Morgan Stanley Institutional Fund, Inc.
Annual Report — December 31, 2016
Expense Example (unaudited)
Emerging Markets Portfolio
As a shareholder of the Portfolio, you incur two types of costs: (1) transactional costs, including redemption fees; and (2) ongoing costs, which may include advisory fees, administration fees, distribution and shareholder services fees and other Portfolio expenses. This example is intended to help you understand your ongoing costs (in dollars) of investing in the Portfolio and to compare these costs with the ongoing costs of investing in other mutual funds.
This example is based on an investment of $1,000 invested at the beginning of the six-month period ended December 31, 2016 and held for the entire six-month period.
Actual Expenses
The table below provides information about actual account values and actual expenses. You may use the information in this table, together with the amount you invested, to estimate the expenses that you paid over the period. Simply divide your account value by $1,000 (for example, an $8,600 account value divided by $1,000 = 8.6), then multiply the result by the number in the table under the heading entitled "Actual Expenses Paid During Period" to estimate the expenses you paid on your account during this period.
Hypothetical Example for Comparison Purposes
The table below provides information about hypothetical account values and hypothetical expenses based on the Portfolio's actual expense ratio and an assumed rate of return of 5% per year before expenses, which is not the Portfolio's actual return. The hypothetical account values and expenses may not be used to estimate the actual ending account balance or expenses you paid for the period. You may use this information to compare the ongoing costs of investing in the Portfolio and other funds. To do so, compare this 5% hypothetical example with the 5% hypothetical examples that appear in the shareholder reports of the other funds.
Please note that the expenses shown in the table are meant to highlight your ongoing costs only and do not reflect any transactional costs, such as sales charges (loads) and redemption fees. Therefore, the information for each class in the table is useful in comparing ongoing costs only, and will not help you determine the relative total costs of owning different funds. In addition, if these transactional costs were included, your costs would have been higher.
| | | Beginning
Account
Value
7/1/16 | | Actual Ending
Account
Value
12/31/16 | | Hypothetical
Ending Account
Value | | Actual
Expenses
Paid
During
Period* | | Hypothetical
Expenses Paid
During Period* | | Net
Expense
Ratio
During
Period** | |
Emerging Markets Portfolio Class I | | $ | 1,000.00 | | | $ | 1,001.60 | | | $ | 1,020.06 | | | $ | 5.08 | | | $ | 5.13 | | | | 1.01 | %*** | |
Emerging Markets Portfolio Class A | | | 1,000.00 | | | | 999.60 | | | | 1,018.10 | | | | 7.04 | | | | 7.10 | | | | 1.40 | *** | |
Emerging Markets Portfolio Class L | | | 1,000.00 | | | | 997.00 | | | | 1,015.23 | | | | 9.89 | | | | 9.98 | | | | 1.97 | *** | |
Emerging Markets Portfolio Class C | | | 1,000.00 | | | | 995.70 | | | | 1,013.98 | | | | 11.14 | | | | 11.24 | | | | 2.22 | *** | |
Emerging Markets Portfolio Class IS | | | 1,000.00 | | | | 1,001.80 | | | | 1,020.11 | | | | 5.03 | | | | 5.08 | | | | 1.00 | *** | |
* Expenses are calculated using each Portfolio Class' annualized net expense ratio (as disclosed), multiplied by the average account value over the period, and multiplied by 184/366 (to reflect the most recent one-half year period).
** Annualized.
*** Refer to Note F in the Notes to Financial Statements for discussion of prior period custodian out-of-pocket expenses that were reimbursed in the current period.
3
Morgan Stanley Institutional Fund, Inc.
Annual Report — December 31, 2016
Investment Overview (unaudited)
Emerging Markets Portfolio
The Portfolio seeks long-term capital appreciation by investing primarily in growth-oriented equity securities of issuers in emerging market countries.
Performance
For the year ended December 31, 2016, the Portfolio's Class I shares had a total return based on net asset value and reinvestment of distributions per share of 6.73%, net of fees. The Portfolio's Class I shares underperformed the Portfolio's benchmark, the MSCI Emerging Markets Net Index (the "Index"), which returned 11.19%.
Factors Affecting Performance
• Emerging markets ("EM") equities outperformed developed market equities in 2016, with the Index returning +11.19% versus the MSCI World Index's return of +7.51%.(i) Emerging markets were boosted by a combination of both domestic and external factors, contributing to improved investor sentiment: China's growth in such areas as car and residential sales, and industrial production came in better than expected; India passed important tax reform; Brazil's senate voted to impeach former President Dilma Rousseff, creating optimism that Acting President Michel Temer may be able to accomplish critical reform. Externally, the European Central Bank kept policy rates unchanged, the Bank of Japan committed to expanding its monetary base and the U.S. Federal Reserve maintained its dovish monetary policy.
• Positive contributors to the Portfolio's performance during the period included our stock selection and underweight allocation to China and our stock selection and overweight allocation to Peru. Stock selection in Pakistan also contributed, as did the Portfolio's zero allocation to Malaysia. Stock selection in India added value, though it was partially offset by an unfavorable overweight allocation. Stock selection in Panama and Turkey also contributed.
• Key detractors from performance included the Portfolio's stock selection and underweight allocation to Taiwan and Russia, as well as stock selection and a neutral allocation to Brazil. Stock selection in Korea, Indonesia and South Africa also hampered returns.
• From a sector perspective, stock selection in and underweight allocations to health care and telecommunications contributed to returns. Stock
selection in consumer staples and information technology also added to results but gains were partially offset by the negative impact of an overweight to consumer staples and underweight to information technology. Stock selection in and an underweight allocation to the energy sector detracted from results, as did stock selection in financials.
Management Strategies
• The outlook for emerging markets overall finally began improving in 2016 after five previously disappointing years. In a world facing lower economic growth from a combination of demographic pressure, lower trade volumes and a huge increase in debt, we own what we call a "post-China world" portfolio, seeking those pockets of growth in countries where we believe domestic consumer demand is strong and credit growth is in healthy early stages — and far from the excess as it has been in China, Brazil and Turkey.
• In our view, the building blocks are in place for recovery in many EM countries. Markets may still experience some turbulence from the potential for disappointment with China's growth or any depreciation of China's currency and uncertainty about the course of the U.S. presidential election, economic outlook and precise path of the Federal Reserve.
• From a thematic perspective, we continue to own and seek companies benefiting from healthy domestic demand and the growth of the aging population, where demand is high for health care and consumer experiences and services, including travel and leisure activities. We also see demand for financial services in countries with low credit penetration. We are seeking to minimize the Portfolio's exposure to countries highly dependent on trade and where credit growth has greatly exceeded the pace of economic growth over the past five years. With global trade declining as protectionism is becoming more politically appealing and geopolitical tension rising in such areas as the South China Sea and the Middle East, we are also focused on identifying innovative companies benefiting from domestic infrastructure projects and defense spending.
(i) Source: FactSet and Morgan Stanley Investment Management. Emerging markets and developed markets are represented by the MSCI Emerging Markets Index and MSCI World Index, respectively.
4
Morgan Stanley Institutional Fund, Inc.
Annual Report — December 31, 2016
Investment Overview (unaudited) (cont'd)
Emerging Markets Portfolio
• We still consider Central and Eastern Europe an attractive investment opportunity. Growth in the region remains healthy, mostly driven by strong consumption, which has been boosted by rising employment, growing real wages and increasingly more affordable credit. After years of tightening, fiscal policy is set to loosen, but budget deficits should remain below the 3% level. Investment lagged in 2016 due to less absorption of European Union funds, but absorption should accelerate in 2017, driving up public fixed investment spending and further supporting growth.
• As we have for many years, we remain underweight in China and countries with decelerating growth or heavy dependence on exports such as Russia, Taiwan and Korea in the portfolio. Debt levels in China continue to rise to unprecedented levels and ongoing overcapacity issues and the continued property downturn will likely lead to further weakness in industrial production and related investment.
• We also remain positive on the Philippines. In our view, the Philippines continues to deliver some of the most attractive well-rounded growth with the business process outsourcing sector performing well, keeping overall consumption fairly strong. Growth in Pakistan continues to pick up with strong consumer demand and increasing investment, though exports are weak. We remain overweight in Mexico, although we are closely monitoring what policies the upcoming Trump administration will implement. There is positive sentiment surrounding the energy sector and Pemex with the successful bidding of deepwater auctions in the early December round, which will likely boost foreign direct investment and oil production in the medium term. It finally seems like the tide is turning and oil production in Mexico should begin to recover in 2018.
• In Indonesia, we increased our overweight during the third quarter on the improving growth outlook and reform momentum under the Jokowi administration. Turning the economy from externally focused on commodities revenues inward to domestic demand takes time and requires reform, but Indonesia is slowly heading in that direction.
We believe that reform in Brazil is finally moving in the right direction. The deep recession of the past three years is finally fading and gross domestic growth projections for 2017 are expected to turn positive on the face of improving consumer and business confidence.
5
Morgan Stanley Institutional Fund, Inc.
Annual Report — December 31, 2016
Investment Overview (unaudited) (cont'd)
Emerging Markets Portfolio

* Minimum Investment for Class I shares
In accordance with SEC regulations, the Portfolio's performance shown assumes that all recurring fees (including management fees) were deducted and all dividends and distributions were reinvested. The performance of Class A, L, Cand IS shares will vary from the performance of Class I shares based upon their different inception dates and will be negatively impacted by additional fees assessed to those classes (if applicable).
Performance Compared to the MSCI Emerging Markets Net Index(1) and the Lipper Emerging Markets Funds Index(2)
| | | Period Ended December 31, 2016
Total Returns(3) | |
| | | | | Average Annual | |
| | | One
Year | | Five
Years | | Ten
Years | | Since
Inception(9) | |
Portfolio — Class I Shares
w/o sales charges(4) | | | 6.73 | % | | | 1.74 | % | | | 0.98 | % | | | 7.23 | % | |
Portfolio — Class A Shares
w/o sales charges(5) | | | 6.37 | | | | 1.43 | | | | 0.70 | | | | 6.01 | | |
Portfolio — Class A Shares with
maximum 5.25% sales charges(5) | | | 0.80 | | | | 0.35 | | | | 0.16 | | | | 5.74 | | |
Portfolio — Class L Shares
w/o sales charges(6) | | | 5.80 | | | | — | | | | — | | | | –1.51 | | |
Portfolio — Class C Shares
w/o sales charges(8) | | | 5.56 | | | | — | | | | — | | | | –8.29 | | |
Portfolio — Class C Shares with
maximum 1.00% deferred
sales charges(8) | | | 4.56 | | | | — | | | | — | | | | –8.29 | | |
Portfolio — Class IS Shares
w/o sales charges(7) | | | 6.79 | | | | — | | | | — | | | | –2.07 | | |
MSCI Emerging Markets Net Index | | | 11.19 | | | | 1.28 | | | | 1.84 | | | | 6.94 | | |
Lipper Emerging Market Funds Index | | | 12.10 | | | | 2.04 | | | | 1.54 | | | | — | | |
Performance data quoted represents past performance, which is no guarantee of future results, and current performance may be lower or higher than the figures shown. Performance assumes that all dividends and distributions, if any, were reinvested. For the most recent month-end performance figures, please visit www.morganstanley.com/im. Investment return and principal value will fluctuate so that Portfolio shares, when redeemed, may be worth more or less than their original cost. Total returns do not reflect the deduction of taxes that a shareholder would pay on Portfolio distributions or the redemption of Portfolio shares. Performance of share classes will vary due to difference in sales charges and expenses.
(1) The MSCI Emerging Markets Net Index is a free float-adjusted market capitalization weighted index that is designed to measure equity market performance of emerging markets. The term "free float" represents the portion of shares outstanding that are deemed to be available for purchase in the public equity markets by investors. The MSCI Emerging Markets Net Index currently consists of 23 emerging market country indices. The performance of the Index is listed in U.S. dollars and assumes reinvestment of net dividends. The Index is unmanaged and its returns do not include any sales charges or fees. Such costs would lower performance. It is not possible to invest directly in an index.
(2) The Lipper Emerging Market Funds Index is an equally weighted performance index of the largest qualifying funds (based on net assets) in the Lipper Emerging Market Funds classification. The Index, which is adjusted for capital gains distributions and income dividends, is unmanaged and should not be considered an investment. There are currently 30 funds represented in this Index. As of the date of this report, the Portfolio is in the Lipper Emerging Market Funds classification.
(3) Total returns for the Portfolio reflect fees waived and expenses reimbursed, if applicable, by the Adviser. Without such waivers and reimbursements, total returns would have been lower.
(4) Commenced operations on September 25, 1992.
(5) Commenced offering on January 2, 1996.
(6) Commenced offering on April 27, 2012.
(7) Commenced offering on September 13, 2013.
(8) Commenced offering on April 30, 2015.
(9) For comparative purposes, average annual since inception returns listed for the Indexes refer to the inception date of Class I of the Portfolio, not the inception of the Index.
6
Morgan Stanley Institutional Fund, Inc.
Annual Report — December 31, 2016
Portfolio of Investments
Emerging Markets Portfolio
| | | Shares | | Value
(000) | |
Common Stocks (98.0%) | |
Argentina (0.9%) | |
Banco Macro SA ADR | | | 62,067 | | | $ | 3,994 | | |
Grupo Financiero Galicia SA ADR | | | 154,083 | | | | 4,148 | | |
| | | | 8,142 | | |
Austria (0.9%) | |
Erste Group Bank AG (a) | | | 302,877 | | | | 8,871 | | |
Brazil (8.9%) | |
Banco Bradesco SA (Preference) | | | 1,665,972 | | | | 14,844 | | |
| BRF SA | | | 813,232 | | | | 12,056 | | |
Itau Unibanco Holding SA (Preference) | | | 1,589,996 | | | | 16,537 | | |
Lojas Renner SA | | | 997,817 | | | | 7,103 | | |
MercadoLibre, Inc. | | | 67,306 | | | | 10,509 | | |
Petroleo Brasileiro SA (a) | | | 1,297,761 | | | | 6,755 | | |
Petroleo Brasileiro SA (Preference) (a) | | | 1,646,737 | | | | 7,524 | | |
Raia Drogasil SA | | | 511,327 | | | | 9,613 | | |
| | | | 84,941 | | |
Chile (0.6%) | |
SACI Falabella | | | 771,414 | | | | 6,126 | | |
China (17.6%) | |
Alibaba Group Holding Ltd. ADR (a) | | | 155,458 | | | | 13,651 | | |
Bank of China Ltd. H Shares (b) | | | 36,732,000 | | | | 16,295 | | |
China Construction Bank Corp. H Shares (b) | | | 23,853,750 | | | | 18,364 | | |
China Machinery Engineering Corp.
H Shares (b) | | | 2,489,000 | | | | 1,579 | | |
China Mengniu Dairy Co., Ltd. (b) | | | 1,788,000 | | | | 3,445 | | |
China Mobile Ltd. (b) | | | 1,912,500 | | | | 20,273 | | |
China Overseas Land & Investment Ltd. (b) | | | 808,000 | | | | 2,141 | | |
China Pacific Insurance Group Co., Ltd.
H Shares (b) | | | 2,203,600 | | | | 7,687 | | |
China Unicom Hong Kong Ltd. (b) | | | 3,678,000 | | | | 4,283 | | |
Chongqing Changan Automobile Co., Ltd.
B Shares | | | 796,702 | | | | 1,139 | | |
CRCC High-Tech Equipment Corp., Ltd.
H Shares (b) | | | 3,971,000 | | | | 1,593 | | |
CSPC Pharmaceutical Group Ltd. (b) | | | 3,610,000 | | | | 3,855 | | |
Huadian Power International Corp., Ltd.
H Shares (b) | | | 3,594,000 | | | | 1,627 | | |
JD.com, Inc. ADR (a) | | | 232,930 | | | | 5,926 | | |
NetEase, Inc. ADR | | | 15,488 | | | | 3,335 | | |
New Oriental Education & Technology
Group, Inc. ADR (a) | | | 69,638 | | | | 2,932 | | |
PetroChina Co., Ltd. H Shares (b) | | | 5,746,000 | | | | 4,283 | | |
Shanghai Jin Jiang International Hotels
Group Co., Ltd. H Shares (b) | | | 3,796,000 | | | | 1,003 | | |
Shenzhen International Holdings Ltd. (b) | | | 1,365,000 | | | | 1,989 | | |
Shenzhou International Group
Holdings Ltd. (b)(c) | | | 887,000 | | | | 5,611 | | |
TAL Education Group ADR (a) | | | 56,633 | | | | 3,973 | | |
Tencent Holdings Ltd. (b) | | | 1,784,700 | | | | 43,659 | | |
| | | | 168,643 | | |
| | | Shares | | Value
(000) | |
Colombia (0.7%) | |
Cemex Latam Holdings SA (a) | | | 599,961 | | | $ | 2,258 | | |
Grupo de Inversiones Suramericana SA | | | 211,073 | | | | 2,686 | | |
Grupo de Inversiones Suramericana SA
(Preference) | | | 161,171 | | | | 1,987 | | |
| | | | 6,931 | | |
Czech Republic (0.9%) | |
Komercni Banka AS | | | 253,228 | | | | 8,730 | | |
Egypt (0.5%) | |
Commercial International Bank Egypt SAE | | | 1,237,610 | | | | 4,987 | | |
Germany (0.7%) | |
Adidas AG | | | 43,632 | | | | 6,896 | | |
Hong Kong (2.6%) | |
AIA Group Ltd. | | | 1,939,800 | | | | 10,944 | | |
Samsonite International SA | | | 4,730,700 | | | | 13,513 | | |
| | | | 24,457 | | |
Hungary (0.5%) | |
OTP Bank PLC | | | 163,161 | | | | 4,665 | | |
India (7.9%) | |
Ashok Leyland Ltd. | | | 8,216,508 | | | | 9,697 | | |
Bharat Financial Inclusion Ltd. (a) | | | 391,783 | | | | 3,394 | | |
Bharat Petroleum Corp., Ltd. | | | 884,973 | | | | 8,286 | | |
HDFC Bank Ltd. | | | 346,513 | | | | 6,753 | | |
IndusInd Bank Ltd. | | | 583,945 | | | | 9,532 | | |
Larsen & Toubro Ltd. | | | 96,727 | | | | 1,923 | | |
Marico Ltd. | | | 1,347,532 | | | | 5,171 | | |
Maruti Suzuki India Ltd. | | | 74,951 | | | | 5,874 | | |
Shree Cement Ltd. | | | 46,415 | | | | 10,076 | | |
Shriram Transport Finance Co., Ltd. | | | 435,932 | | | | 5,482 | | |
Zee Entertainment Enterprises Ltd. | | | 1,391,649 | | | | 9,290 | | |
| | | | 75,478 | | |
Indonesia (5.4%) | |
Astra International Tbk PT | | | 10,173,700 | | | | 6,249 | | |
Bank Mandiri Persero Tbk PT | | | 10,717,100 | | | | 9,208 | | |
Bank Negara Indonesia Persero Tbk PT | | | 12,375,000 | | | | 5,075 | | |
Bumi Serpong Damai Tbk PT | | | 37,034,400 | | | | 4,824 | | |
Link Net Tbk PT | | | 11,183,300 | | | | 4,275 | | |
Matahari Department Store Tbk PT | | | 2,407,100 | | | | 2,702 | | |
Semen Indonesia Persero Tbk PT | | | 9,285,800 | | | | 6,324 | | |
Telekomunikasi Indonesia Persero Tbk PT | | | 29,777,200 | | | | 8,797 | | |
XL Axiata Tbk PT (a) | | | 23,227,900 | | | | 3,982 | | |
| | | | 51,436 | | |
Korea, Republic of (11.2%) | |
Amorepacific Corp. | | | 19,263 | | | | 5,128 | | |
CJ Corp. | | | 34,099 | | | | 5,279 | | |
Cosmax, Inc. | | | 25,037 | | | | 2,477 | | |
Coway Co., Ltd. | | | 68,346 | | | | 4,997 | | |
Hanwha Techwin Co., Ltd. | | | 79,983 | | | | 2,877 | | |
Hugel, Inc. (a) | | | 15,096 | | | | 4,013 | | |
Hyundai Development Co-Engineering &
Construction | | | 176,725 | | | | 6,577 | | |
The accompanying notes are an integral part of the financial statements.
7
Morgan Stanley Institutional Fund, Inc.
Annual Report — December 31, 2016
Portfolio of Investments (cont'd)
Emerging Markets Portfolio
| | | Shares | | Value
(000) | |
Korea, Republic of (cont'd) | |
Hyundai Motor Co. | | | 26,873 | | | $ | 3,248 | | |
Hyundai Wia Corp. | | | 20,000 | | | | 1,209 | | |
Innocean Worldwide, Inc. (c) | | | 49,212 | | | | 2,327 | | |
Korea Aerospace Industries Ltd. | | | 90,668 | | | | 5,030 | | |
Mando Corp. | | | 21,818 | | | | 4,236 | | |
NAVER Corp. | | | 13,053 | | | | 8,376 | | |
Nexon Co., Ltd. | | | 342,900 | | | | 4,970 | | |
Samsung Electronics Co., Ltd. | | | 22,067 | | | | 32,923 | | |
Samsung Electronics Co., Ltd. (Preference) | | | 7,829 | | | | 9,289 | | |
SK Holdings Co., Ltd. | | | 22,061 | | | | 4,192 | | |
| | | | 107,148 | | |
Mexico (5.7%) | |
Alfa SAB de CV | | | 2,818,215 | | | | 3,488 | | |
Alsea SAB de CV | | | 1,444,672 | | | | 4,127 | | |
Cemex SAB de CV ADR (a)(c) | | | 1,520,186 | | | | 12,207 | | |
Fomento Economico Mexicano
SAB de CV ADR | | | 158,890 | | | | 12,109 | | |
Grupo Financiero Banorte SAB de CV
Series O | | | 2,908,829 | | | | 14,327 | | |
Grupo Financiero Santander Mexico
SAB de CV ADR | | | 515,305 | | | | 3,705 | | |
Mexichem SAB de CV | | | 2,209,439 | | | | 5,013 | | |
| | | | 54,976 | | |
Pakistan (1.8%) | |
Lucky Cement Ltd. | | | 864,000 | | | | 7,151 | | |
United Bank Ltd. | | | 4,266,800 | | | | 9,750 | | |
| | | | 16,901 | | |
Panama (0.6%) | |
Copa Holdings SA, Class A | | | 66,555 | | | | 6,045 | | |
Peru (2.2%) | |
Cia de Minas Buenaventura SA ADR | | | 464,683 | | | | 5,242 | | |
Credicorp Ltd. | | | 102,549 | | | | 16,188 | | |
| | | | 21,430 | | |
Philippines (3.6%) | |
Ayala Corp. | | | 299,610 | | | | 4,403 | | |
BDO Unibank, Inc. | | | 1,637,000 | | | | 3,691 | | |
DMCI Holdings, Inc. | | | 15,428,600 | | | | 4,115 | | |
International Container Terminal Services, Inc. | | | 2,414,460 | | | | 3,495 | | |
Metro Pacific Investments Corp. | | | 37,100,200 | | | | 4,970 | | |
Metropolitan Bank & Trust Co. | | | 4,585,327 | | | | 6,696 | | |
SM Investments Corp. | | | 566,485 | | | | 7,464 | | |
| | | | 34,834 | | |
Poland (3.9%) | |
Bank Pekao SA | | | 141,199 | | | | 4,245 | | |
Bank Zachodni WBK SA | | | 66,282 | | | | 5,005 | | |
CCC SA | | | 139,467 | | | | 6,784 | | |
Eurocash SA | | | 362,493 | | | | 3,408 | | |
Jeronimo Martins SGPS SA | | | 433,710 | | | | 6,729 | | |
LPP SA | | | 2,842 | | | | 3,853 | | |
Powszechna Kasa Oszczednosci Bank
Polski SA (a) | | | 1,063,265 | | | | 7,150 | | |
| | | | 37,174 | | |
| | | Shares | | Value
(000) | |
Russia (3.2%) | |
Gazprom PJSC ADR | | | 31,560 | | | $ | 161 | | |
Gazprom PJSC ADR | | | 2,241,557 | | | | 11,320 | | |
Mail.ru Group Ltd. GDR (a) | | | 251,876 | | | | 4,622 | | |
MMC Norilsk Nickel PJSC ADR | | | 278,929 | | | | 4,685 | | |
X5 Retail Group N.V. GDR (a) | | | 153,664 | | | | 4,986 | | |
Yandex N.V., Class A (a) | | | 247,570 | | | | 4,984 | | |
| | | | 30,758 | | |
South Africa (5.5%) | |
AVI Ltd. | | | 613,098 | | | | 4,079 | | |
Clicks Group Ltd. | | | 495,117 | | | | 4,164 | | |
Mondi PLC | | | 409,764 | | | | 8,316 | | |
Naspers Ltd., Class N | | | 120,784 | | | | 17,713 | | |
Steinhoff International Holdings N.V. H Shares | | | 1,936,561 | | | | 10,051 | | |
Vodacom Group Ltd. | | | 723,467 | | | | 8,028 | | |
| | | | 52,351 | | |
Taiwan (8.6%) | |
Advanced Semiconductor Engineering, Inc. | | | 5,451,000 | | | | 5,590 | | |
Catcher Technology Co., Ltd. | | | 773,000 | | | | 5,372 | | |
Delta Electronics, Inc. | | | 1,042,557 | | | | 5,160 | | |
E.Sun Financial Holding Co., Ltd. | | | 6,166,000 | | | | 3,511 | | |
Eclat Textile Co., Ltd. | | | 256,657 | | | | 2,688 | | |
Fubon Financial Holding Co., Ltd. | | | 1,112,000 | | | | 1,760 | | |
Hon Hai Precision Industry Co., Ltd. | | | 2,791,700 | | | | 7,293 | | |
Largan Precision Co., Ltd. | | | 49,000 | | | | 5,762 | | |
PChome Online, Inc. | | | 238,753 | | | | 2,096 | | |
Pegatron Corp. | | | 1,770,000 | | | | 4,229 | | |
President Chain Store Corp. | | | 328,000 | | | | 2,351 | | |
Taiwan Mobile Co., Ltd. | | | 1,031,000 | | | | 3,327 | | |
Taiwan Semiconductor Manufacturing Co., Ltd. | | | 4,785,205 | | | | 26,948 | | |
Uni-President Enterprises Corp. | | | 3,683,290 | | | | 6,103 | | |
Yeong Guan Energy Technology Group Co., Ltd. | | | 240,000 | | | | 767 | | |
| | | | 82,957 | | |
Thailand (2.9%) | |
Bangkok Dusit Medical Services PCL (Foreign) | | | 8,578,400 | | | | 5,534 | | |
Central Pattana PCL (Foreign) | | | 1,912,300 | | | | 3,030 | | |
| DKSH Holding AG | | | 95,666 | | | | 6,572 | | |
Kasikornbank PCL (Foreign) | | | 966,500 | | | | 4,791 | | |
Kasikornbank PCL NVDR | | | 126,000 | | | | 624 | | |
Minor International PCL (Foreign) | | | 2,788,270 | | | | 2,784 | | |
Sino-Thai Engineering & Construction PCL
(Foreign) | | | 5,934,200 | | | | 4,598 | | |
| | | | 27,933 | | |
Turkey (0.3%) | |
Arcelik AS | | | 353,573 | | | | 2,125 | | |
Ulker Biskuvi Sanayi AS | | | 125,376 | | | | 575 | | |
| | | | 2,700 | | |
United States (0.4%) | |
Nien Made Enterprise Co., Ltd. | | | 398,000 | | | | 4,106 | | |
Total Common Stocks (Cost $827,104) | | | 939,616 | | |
The accompanying notes are an integral part of the financial statements.
8
Morgan Stanley Institutional Fund, Inc.
Annual Report — December 31, 2016
Portfolio of Investments (cont'd)
Emerging Markets Portfolio
| | | Shares | | Value
(000) | |
Short-Term Investments (1.9%) | |
Securities held as Collateral on Loaned Securities (0.0%) | |
Investment Company (0.0%) | |
Morgan Stanley Institutional Liquidity
Funds — Government Portfolio —
Institutional Class (See Note G)
(Cost $248) | | | 248,250 | | | $ | 248 | | |
Investment Company (1.9%) | |
Morgan Stanley Institutional Liquidity
Funds — Government Portfolio —
Institutional Class (See Note G)
(Cost $18,362) | | | 18,362,368 | | | | 18,362 | | |
Total Short-Term Investments (Cost $18,610) | | | 18,610 | | |
Total Investments (99.9%) (Cost $845,714)
Including $12,590 of Securities Loaned (d)(e) | | | 958,226 | | |
Other Assets in Excess of Liabilities (0.1%) | | | 1,225 | | |
Net Assets (100.0%) | | $ | 959,451 | | |
Country assignments and aggregations are based generally on third party vendor classifications and information, and may be different from the assignments and aggregations under the policies set forth in the Portfolio's prospectus and/or statement of additional information relating to geographic classifications.
(a) Non-income producing security.
(b) Security trades on the Hong Kong exchange.
(c) All or a portion of this security was on loan at December 31, 2016.
(d) Securities are available for collateral in connection with an open foreign currency forward exchange contract.
(e) At December 31, 2016, the aggregate cost for federal income tax purposes is approximately $851,453,000. The aggregate gross unrealized appreciation is approximately $164,153,000 and the aggregate gross unrealized depreciation is approximately $57,380,000, resulting in net unrealized appreciation of approximately $106,773,000.
ADR American Depositary Receipt.
GDR Global Depositary Receipt.
NVDR Non-Voting Depositary Receipt.
PJSC Public Joint Stock Company.
Foreign Currency Forward Exchange Contract:
The Portfolio had the following foreign currency forward exchange contract open at December 31, 2016:
Counterparty | | Contracts to
Deliver
(000) | | In Exchange
For
(000) | | Delivery
Date | | Unrealized
Appreciation
(000) | |
UBS AG | | EUR | 18,673 | | | $ | 19,937 | | | 1/19/17 | | $ | 264 | | |
EUR — Euro
Portfolio Composition*
Classification | | Percentage of
Total Investments | |
Other** | | | 63.0 | % | |
Banks | | | 22.1 | | |
Internet Software & Services | | | 9.5 | | |
Tech Hardware, Storage & Peripherals | | | 5.4 | | |
Total Investments | | | 100.0 | %*** | |
* Percentages indicated are based upon total investments (excluding Securities held as Collateral on Loaned Securities) as of December 31, 2016.
** Industries and/or investment types representing less than 5% of total investments.
*** Does not include an open foreign currency forward exchange contract with unrealized appreciation of approximately $264,000.
The accompanying notes are an integral part of the financial statements.
9
Morgan Stanley Institutional Fund, Inc.
Annual Report — December 31, 2016
Emerging Markets Portfolio
Statement of Assets and Liabilities | | December 31, 2016
(000) | |
Assets: | |
Investments in Securities of Unaffiliated Issuers, at Value(1) (Cost $827,104) | | $ | 939,616 | | |
Investment in Security of Affiliated Issuer, at Value (Cost $18,610) | | | 18,610 | | |
Total Investments in Securities, at Value (Cost $845,714) | | | 958,226 | | |
Foreign Currency, at Value (Cost $1,280) | | | 1,308 | | |
Receivable for Investments Sold | | | 3,939 | | |
Dividends Receivable | | | 1,150 | | |
Receivable for Portfolio Shares Sold | | | 539 | | |
Unrealized Appreciation on Foreign Currency Forward Exchange Contract | | | 264 | | |
Tax Reclaim Receivable | | | 342 | | |
Receivable from Affiliate | | | 6 | | |
Other Assets | | | 91 | | |
Total Assets | | | 965,865 | | |
Liabilities: | |
Payable for Investments Purchased | | | 2,792 | | |
Payable for Advisory Fees | | | 1,959 | | |
Deferred Capital Gain Country Tax | | | 596 | | |
Payable for Portfolio Shares Redeemed | | | 255 | | |
Collateral on Securities Loaned, at Value | | | 248 | | |
Payable for Custodian Fees | | | 237 | | |
Payable for Directors' Fees and Expenses | | | 86 | | |
Payable for Administration Fees | | | 64 | | |
Payable for Sub Transfer Agency Fees — Class I | | | 44 | | |
Payable for Sub Transfer Agency Fees — Class A | | | 4 | | |
Payable for Sub Transfer Agency Fees — Class L | | | — | @ | |
Payable for Sub Transfer Agency Fees — Class C | | | — | @ | |
Payable for Professional Fees | | | 47 | | |
Payable for Transfer Agency Fees — Class I | | | 4 | | |
Payable for Transfer Agency Fees — Class A | | | 2 | | |
Payable for Transfer Agency Fees — Class L | | | — | @ | |
Payable for Transfer Agency Fees — Class C | | | — | @ | |
Payable for Transfer Agency Fees — Class IS | | | 1 | | |
Payable for Shareholder Services Fees — Class A | | | 4 | | |
Payable for Distribution and Shareholder Services Fees — Class L | | | — | @ | |
Payable for Distribution and Shareholder Services Fees — Class C | | | 1 | | |
Other Liabilities | | | 70 | | |
Total Liabilities | | | 6,414 | | |
Net Assets | | $ | 959,451 | | |
Net Assets Consist Of: | |
Paid-in-Capital | | $ | 928,853 | | |
Accumulated Undistributed Net Investment Income | | | 810 | | |
Accumulated Net Realized Loss | | | (82,368 | ) | |
Unrealized Appreciation (Depreciation) on: | |
Investments (Net of $595 of Deferred Capital Gain Country Tax) | | | 111,917 | | |
Foreign Currency Forward Exchange Contract | | | 264 | | |
Foreign Currency Translations | | | (25 | ) | |
Net Assets | | $ | 959,451 | | |
The accompanying notes are an integral part of the financial statements.
10
Morgan Stanley Institutional Fund, Inc.
Annual Report — December 31, 2016
Emerging Markets Portfolio
Statement of Assets and Liabilities (cont'd) | | December 31, 2016
(000) | |
CLASS I: | |
Net Assets | | $ | 282,674 | | |
| Shares Outstanding $0.001 par value shares of beneficial interest (unlimited shares authorized) (not in 000's) | | | 13,569,131 | | |
Net Asset Value, Offering and Redemption Price Per Share | | $ | 20.83 | | |
CLASS A: | |
Net Assets | | $ | 18,824 | | |
| Shares Outstanding $0.001 par value shares of beneficial interest (unlimited shares authorized) (not in 000's) | | | 926,696 | | |
Net Asset Value, Redemption Price Per Share | | $ | 20.31 | | |
Maximum Sales Load | | | 5.25 | % | |
Maximum Sales Charge | | $ | 1.13 | | |
Maximum Offering Price Per Share | | $ | 21.44 | | |
CLASS L: | |
Net Assets | | $ | 239 | | |
| Shares Outstanding $0.001 par value shares of beneficial interest (unlimited shares authorized) (not in 000's) | | | 11,899 | | |
Net Asset Value, Offering and Redemption Price Per Share | | $ | 20.08 | | |
CLASS C: | |
Net Assets | | $ | 608 | | |
| Shares Outstanding $0.001 par value shares of beneficial interest (unlimited shares authorized) (not in 000's) | | | 30,419 | | |
Net Asset Value, Offering and Redemption Price Per Share | | $ | 19.99 | | |
CLASS IS: | |
Net Assets | | $ | 657,106 | | |
| Shares Outstanding $0.001 par value shares of beneficial interest (unlimited shares authorized) (not in 000's) | | | 31,541,353 | | |
Net Asset Value, Offering and Redemption Price Per Share | | $ | 20.83 | | |
(1) Including:
Securities on Loan, at Value: | | $ | 12,590 | | |
@ Amount is less than $500.
The accompanying notes are an integral part of the financial statements.
11
Morgan Stanley Institutional Fund, Inc.
Annual Report — December 31, 2016
Emerging Markets Portfolio
Statement of Operations | | Year Ended
December 31, 2016
(000) | |
Investment Income: | |
Dividends from Securities of Unaffiliated Issuers (Net of $2,466 of Foreign Taxes Withheld) | | $ | 17,955 | | |
Income from Securities Loaned — Net | | | 244 | | |
Dividends from Security of Affiliated Issuer (Note G) | | | 61 | | |
Total Investment Income | | | 18,260 | | |
Expenses: | |
Advisory Fees (Note B) | | | 8,021 | | |
Administration Fees (Note C) | | | 731 | | |
Custodian Fees (Note F) | | | 727 | | |
Sub Transfer Agency Fees — Class I | | | 249 | | |
Sub Transfer Agency Fees — Class A | | | 23 | | |
Sub Transfer Agency Fees — Class L | | | — | @ | |
Sub Transfer Agency Fees — Class C | | | — | @ | |
Professional Fees | | | 125 | | |
Registration Fees | | | 85 | | |
Shareholder Services Fees — Class A (Note D) | | | 47 | | |
Distribution and Shareholder Services Fees — Class L (Note D) | | | 2 | | |
Distribution and Shareholder Services Fees — Class C (Note D) | | | 4 | | |
Shareholder Reporting Fees | | | 39 | | |
Transfer Agency Fees — Class I (Note E) | | | 14 | | |
Transfer Agency Fees — Class A (Note E) | | | 6 | | |
Transfer Agency Fees — Class L (Note E) | | | 2 | | |
Transfer Agency Fees — Class C (Note E) | | | 2 | | |
Transfer Agency Fees — Class IS (Note E) | | | 3 | | |
Directors' Fees and Expenses | | | 23 | | |
Pricing Fees | | | 13 | | |
Other Expenses | | | 52 | | |
Total Expenses | | | 10,168 | | |
Reimbursement of Class Specific Expenses — Class I (Note B) | | | (88 | ) | |
Reimbursement of Class Specific Expenses — Class L (Note B) | | | (2 | ) | |
Reimbursement of Class Specific Expenses — Class C (Note B) | | | (1 | ) | |
Reimbursement of Class Specific Expenses — Class IS (Note B) | | | (2 | ) | |
Rebate from Morgan Stanley Affiliate (Note G) | | | (25 | ) | |
Waiver of Advisory Fees (Note B) | | | (11 | ) | |
Reimbursement of Custodian Fees (Note F) | | | (227 | ) | |
Net Expenses | | | 9,812 | | |
Net Investment Income | | | 8,448 | | |
Realized Gain (Loss): | |
Investments Sold | | | (26,002 | ) | |
Foreign Currency Forward Exchange Contracts | | | 721 | | |
Foreign Currency Transactions | | | (220 | ) | |
Net Realized Loss | | | (25,501 | ) | |
Change in Unrealized Appreciation (Depreciation): | |
Investments (Net of Increase in Deferred Capital Gain Country Tax of $595) | | | 72,526 | | |
Foreign Currency Forward Exchange Contracts | | | 140 | | |
Foreign Currency Translations | | | 51 | | |
Net Change in Unrealized Appreciation (Depreciation) | | | 72,717 | | |
Net Realized Loss and Change in Unrealized Appreciation (Depreciation) | | | 47,216 | | |
Net Increase in Net Assets Resulting from Operations | | $ | 55,664 | | |
@ Amount is less than $500.
The accompanying notes are an integral part of the financial statements.
12
Morgan Stanley Institutional Fund, Inc.
Annual Report — December 31, 2016
Emerging Markets Portfolio
Statements of Changes in Net Assets | | Year Ended
December 31, 2016
(000) | | Year Ended
December 31, 2015
(000) | |
Increase (Decrease) in Net Assets: | |
Operations: | |
Net Investment Income | | $ | 8,448 | | | $ | 6,806 | | |
Net Realized Loss | | | (25,501 | ) | | | (41,172 | ) | |
Net Change in Unrealized Appreciation (Depreciation) | | | 72,717 | | | | (65,235 | ) | |
Net Increase (Decrease) in Net Assets Resulting from Operations | | | 55,664 | | | | (99,601 | ) | |
Distributions from and/or in Excess of: | |
Class I: | |
Net Investment Income | | | (2,318 | ) | | | (4,657 | ) | |
Class A: | |
Net Investment Income | | | (93 | ) | | | (96 | ) | |
Class L: | |
Net Investment Income | | | — | | | | (1 | ) | |
Class C: | |
Net Investment Income | | | (— | @) | | | (— | @) | |
Class IS: | |
Net Investment Income | | | (5,700 | ) | | | (2,842 | ) | |
Total Distributions | | | (8,111 | ) | | | (7,596 | ) | |
Capital Share Transactions:(1) | |
Class I: | |
Subscribed | | | 76,859 | | | | 69,057 | | |
Distributions Reinvested | | | 2,281 | | | | 4,608 | | |
Redeemed | | | (323,673 | ) | | | (119,585 | ) | |
Class A: | |
Subscribed | | | 5,925 | | | | 6,118 | | |
Distributions Reinvested | | | 90 | | | | 94 | | |
Redeemed | | | (7,085 | ) | | | (11,629 | ) | |
Class L: | |
Subscribed | | | — | | | | 106 | | |
Distributions Reinvested | | | — | | | | — | @ | |
Redeemed | | | — | | | | (57 | ) | |
Class C: | |
Subscribed | | | 562 | | | | 12 | * | |
Distributions Reinvested | | | — | @ | | | — | | |
Class IS: | |
Subscribed | | | 348,817 | | | | 38,438 | | |
Distributions Reinvested | | | 5,700 | | | | 2,841 | | |
Redeemed | | | (45,556 | ) | | | (31,338 | ) | |
Net Increase (Decrease) in Net Assets Resulting from Capital Share Transactions | | | 63,920 | | | | (41,335 | ) | |
Redemption Fees | | | 14 | | | | 19 | | |
Total Increase (Decrease) in Net Assets | | | 111,487 | | | | (148,513 | ) | |
Net Assets: | |
Beginning of Period | | | 847,964 | | | | 996,477 | | |
End of Period (Including Accumulated Undistributed Net Investment Income and Accumulated Net Investment
Loss of $810 and $(3,288), respectively) | | $ | 959,451 | | | $ | 847,964 | | |
The accompanying notes are an integral part of the financial statements.
13
Morgan Stanley Institutional Fund, Inc.
Annual Report — December 31, 2016
Emerging Markets Portfolio
Statements of Changes in Net Assets (cont'd) | | Year Ended
December 31, 2016
(000) | | Year Ended
December 31, 2015
(000) | |
(1) Capital Share Transactions: | |
Class I: | |
Shares Subscribed | | | 3,587 | | | | 3,093 | | |
Shares Issued on Distributions Reinvested | | | 111 | | | | 225 | | |
Shares Redeemed | | | (17,121 | ) | | | (5,446 | ) | |
Net Decrease in Class I Shares Outstanding | | | (13,423 | ) | | | (2,128 | ) | |
Class A: | |
Shares Subscribed | | | 294 | | | | 293 | | |
Shares Issued on Distributions Reinvested | | | 5 | | | | 5 | | |
Shares Redeemed | | | (366 | ) | | | (542 | ) | |
Net Decrease in Class A Shares Outstanding | | | (67 | ) | | | (244 | ) | |
Class L: | |
Shares Subscribed | | | — | | | | 5 | | |
Shares Issued on Distributions Reinvested | | | — | | | | — | @@ | |
Shares Redeemed | | | — | | | | (3 | ) | |
Net Increase in Class L Shares Outstanding | | | — | | | | 2 | | |
Class C: | |
Shares Subscribed | | | 30 | | | | 1 | * | |
Shares Issued on Distributions Reinvested | | | — | @@ | | | — | | |
Net Increase in Class C Shares Outstanding | | | 30 | | | | 1 | | |
Class IS: | |
Shares Subscribed | | | 18,363 | | | | 1,728 | | |
Shares Issued on Distributions Reinvested | | | 278 | | | | 139 | | |
Shares Redeemed | | | (2,215 | ) | | | (1,435 | ) | |
Net Increase in Class IS Shares Outstanding | | | 16,426 | | | | 432 | | |
@ Amount is less than $500.
@@ Amount is less than 500 shares.
* For the period April 30, 2015 through December 31, 2015.
The accompanying notes are an integral part of the financial statements.
14
Morgan Stanley Institutional Fund, Inc.
Annual Report — December 31, 2016
Financial Highlights
Emerging Markets Portfolio
| | | Class I | |
| | | Year Ended December 31, | |
Selected Per Share Data and Ratios | | 2016(1) | | 2015 | | 2014 | | 2013 | | 2012 | |
Net Asset Value, Beginning of Period | | $ | 19.68 | | | $ | 22.13 | | | $ | 24.64 | | | $ | 25.94 | | | $ | 21.73 | | |
Income (Loss) from Investment Operations: | |
Net Investment Income (2) | | | 0.17 | | | | 0.15 | | | | 0.17 | | | | 0.20 | | | | 0.19 | | |
Net Realized and Unrealized Gain (Loss) | | | 1.15 | | | | (2.43 | ) | | | (1.30 | ) | | | (0.44 | ) | | | 4.19 | | |
Total from Investment Operations | | | 1.32 | | | | (2.28 | ) | | | (1.13 | ) | | | (0.24 | ) | | | 4.38 | | |
Distributions from and/or in Excess of: | |
Net Investment Income | | | (0.17 | ) | | | (0.17 | ) | | | (0.20 | ) | | | (0.20 | ) | | | (0.17 | ) | |
Net Realized Gain | | | — | | | | — | | | | (1.18 | ) | | | (0.86 | ) | | | — | | |
Total Distributions | | | (0.17 | ) | | | (0.17 | ) | | | (1.38 | ) | | | (1.06 | ) | | | (0.17 | ) | |
Redemption Fees | | | 0.00 | (3) | | | 0.00 | (3) | | | 0.00 | (3) | | | 0.00 | (3) | | | 0.00 | (3) | |
Net Asset Value, End of Period | | $ | 20.83 | | | $ | 19.68 | | | $ | 22.13 | | | $ | 24.64 | | | $ | 25.94 | | |
Total Return (4) | | | 6.73 | % | | | (10.33 | )% | | | (4.47 | )% | | | (0.80 | )% | | | 20.19 | % | |
Ratios and Supplemental Data: | |
Net Assets, End of Period (Thousands) | | $ | 282,674 | | | $ | 531,194 | | | $ | 644,537 | | | $ | 1,128,618 | | | $ | 1,278,837 | | |
Ratio of Expenses to Average Net Assets (10) | | | 1.11 | %(5)(8) | | | 1.24 | %(5)(7) | | | 1.25 | %(5) | | | 1.24 | %(5) | | | 1.28 | %(5)(6) | |
Ratio of Expenses to Average Net Assets Excluding Non Operating Expenses | | | N/A | | | | N/A | | | | N/A | | | | 1.24 | %(5) | | | N/A | | |
Ratio of Net Investment Income to Average Net Assets (10) | | | 0.83 | %(5) | | | 0.68 | %(5) | | | 0.68 | %(5) | | | 0.79 | %(5) | | | 0.80 | %(5)(6) | |
Ratio of Rebate from Morgan Stanley Affiliates to Average Net Assets | | | 0.00 | %(9) | | | 0.00 | %(9) | | | 0.00 | %(9) | | | 0.01 | % | | | 0.01 | % | |
Portfolio Turnover Rate | | | 33 | % | | | 40 | % | | | 43 | % | | | 49 | % | | | 47 | % | |
(10) Supplemental Information on the Ratios to Average Net Assets: | |
Ratios Before Expense Limitation: | |
Expenses to Average Net Assets | | | 1.16 | % | | | 1.45 | % | | | 1.52 | % | | | 1.51 | % | | | 1.49 | % | |
Net Investment Income to Average Net Assets | | | 0.78 | % | | | 0.47 | % | | | 0.41 | % | | | 0.52 | % | | | 0.59 | % | |
(1) Refer to Note F in the Notes to Financial Statements for discussion of prior period custodian out-of-pocket expenses that were reimbursed in the current period. The amount of the reimbursement was immaterial on a per share basis and did not impact the total return of Class I shares. The Ratio of Expenses to Average Net Assets and the Ratio of Net Investment Income to Average Net Assets would be unchanged as the reimbursement of custodian fees was offset against current period expense waivers/reimbursements with no impact to net expenses or net investment income.
(2) Per share amount is based on average shares outstanding.
(3) Amount is less than $0.005 per share.
(4) Calculated based on the net asset value as of the last business day of the period.
(5) The Ratios of Expenses and Net Investment Income reflect the rebate of certain Portfolio expenses in connection with the investments in Morgan Stanley affiliates during the period. The effect of the rebate on the ratios is disclosed in the above table as "Ratio of Rebate from Morgan Stanley Affiliates to Average Net Assets."
(6) Effective March 1, 2012, the Adviser has agreed to limit the ratio of expenses to average net assets to the maximum ratio of 1.25% for Class I shares. Prior to March 1, 2012, the maximum ratio was 1.65% for Class I shares.
(7) Effective September 30, 2015, the Adviser has agreed to limit the ratio of expenses to average net assets to the maximum ratio of 1.20% for Class I shares. Prior to September 30, 2015, the maximum ratio was 1.25% for Class I shares.
(8) Effective September 30, 2016, the Adviser has agreed to limit the ratio of expenses to average net assets to the maximum ratio of 1.05% for Class I shares. Prior to September 30, 2016, the maximum ratio was 1.20% for Class I shares.
(9) Amount is less than 0.005%.
The accompanying notes are an integral part of the financial statements.
15
Morgan Stanley Institutional Fund, Inc.
Annual Report — December 31, 2016
Financial Highlights
Emerging Markets Portfolio
| | | Class A | |
| | | Year Ended December 31, | |
Selected Per Share Data and Ratios | | 2016(1) | | 2015 | | 2014 | | 2013 | | 2012 | |
Net Asset Value, Beginning of Period | | $ | 19.19 | | | $ | 21.57 | | | $ | 24.02 | | | $ | 25.31 | | | $ | 21.20 | | |
Income (Loss) from Investment Operations: | |
Net Investment Income (2) | | | 0.11 | | | | 0.07 | | | | 0.11 | | | | 0.12 | | | | 0.14 | | |
Net Realized and Unrealized Gain (Loss) | | | 1.11 | | | | (2.36 | ) | | | (1.28 | ) | | | (0.42 | ) | | | 4.07 | | |
Total from Investment Operations | | | 1.22 | | | | (2.29 | ) | | | (1.17 | ) | | | (0.30 | ) | | | 4.21 | | |
Distributions from and/or in Excess of: | |
Net Investment Income | | | (0.10 | ) | | | (0.09 | ) | | | (0.10 | ) | | | (0.13 | ) | | | (0.10 | ) | |
Net Realized Gain | | | — | | | | — | | | | (1.18 | ) | | | (0.86 | ) | | | — | | |
Total Distributions | | | (0.10 | ) | | | (0.09 | ) | | | (1.28 | ) | | | (0.99 | ) | | | (0.10 | ) | |
Redemption Fees | | | 0.00 | (3) | | | 0.00 | (3) | | | 0.00 | (3) | | | 0.00 | (3) | | | 0.00 | (3) | |
Net Asset Value, End of Period | | $ | 20.31 | | | $ | 19.19 | | | $ | 21.57 | | | $ | 24.02 | | | $ | 25.31 | | |
Total Return (4) | | | 6.37 | % | | | (10.63 | )% | | | (4.77 | )% | | | (1.07 | )% | | | 19.87 | % | |
Ratios and Supplemental Data: | |
Net Assets, End of Period (Thousands) | | $ | 18,824 | | | $ | 19,065 | | | $ | 26,701 | | | $ | 35,863 | | | $ | 40,824 | | |
Ratio of Expenses to Average Net Assets (11) | | | 1.45 | %(5)(9) | | | 1.56 | %(5)(8) | | | 1.57 | %(5) | | | 1.52 | %(5)(7) | | | 1.53 | %(5)(6) | |
Ratio of Expenses to Average Net Assets Excluding Non Operating Expenses | | | N/A | | | | N/A | | | | N/A | | | | 1.52 | %(5)(7) | | | N/A | | |
Ratio of Net Investment Income to Average Net Assets (11) | | | 0.55 | %(5) | | | 0.34 | %(5) | | | 0.45 | %(5) | | | 0.49 | %(5) | | | 0.61 | %(5)(6) | |
Ratio of Rebate from Morgan Stanley Affiliates to Average Net Assets | | | 0.00 | %(10) | | | 0.00 | %(10) | | | 0.00 | %(10) | | | 0.01 | % | | | 0.01 | % | |
Portfolio Turnover Rate | | | 33 | % | | | 40 | % | | | 43 | % | | | 49 | % | | | 47 | % | |
(11) Supplemental Information on the Ratios to Average Net Assets: | |
Ratios Before Expense Limitation: | |
Expenses to Average Net Assets | | | 1.48 | % | | | 1.76 | % | | | 1.82 | % | | | 1.78 | % | | | 1.74 | % | |
Net Investment Income to Average Net Assets | | | 0.52 | % | | | 0.14 | % | | | 0.20 | % | | | 0.23 | % | | | 0.40 | % | |
(1) Refer to Note F in the Notes to Financial Statements for discussion of prior period custodian out-of-pocket expenses that were reimbursed in the current period. The amount of the reimbursement was immaterial on a per share basis and did not impact the total return of Class A shares. The Ratio of Expenses to Average Net Assets and the Ratio of Net Investment Income to Average Net Assets would be unchanged as the reimbursement of custodian fees was offset against current period expense waivers/reimbursements with no impact to net expenses or net investment income.
(2) Per share amount is based on average shares outstanding.
(3) Amount is less than $0.005 per share.
(4) Calculated based on the net asset value which does not reflect sales charges, if applicable, as of the last business day of the period.
(5) The Ratios of Expenses and Net Investment Income reflect the rebate of certain Portfolio expenses in connection with the investments in Morgan Stanley affiliates during the period. The effect of the rebate on the ratios is disclosed in the above table as "Ratio of Rebate from Morgan Stanley Affiliates to Average Net Assets."
(6) Effective March 1, 2012, the Adviser has agreed to limit the ratio of expenses to average net assets to the maximum ratio of 1.50% for Class A shares. Prior to March 1, 2012, the maximum ratio was 1.90% for Class A shares.
(7) Effective September 16, 2013, the Adviser has agreed to limit the ratio of expenses to average net assets to the maximum ratio of 1.60% for Class A shares. Prior to September 16, 2013, the maximum ratio was 1.50% for Class A shares.
(8) Effective September 30, 2015, the Adviser has agreed to limit the ratio of expenses to average net assets to the maximum ratio of 1.55% for Class A shares. Prior to September 30, 2015, the maximum ratio was 1.60% for Class A shares.
(9) Effective September 30, 2016, the Adviser has agreed to limit the ratio of expenses to average net assets to the maximum ratio of 1.40% for Class A shares. Prior to September 30, 2016, the maximum ratio was 1.55% for Class A shares.
(10) Amount is less than 0.005%.
The accompanying notes are an integral part of the financial statements.
16
Morgan Stanley Institutional Fund, Inc.
Annual Report — December 31, 2016
Financial Highlights
Emerging Markets Portfolio
| | | Class L | |
| | | Year Ended December 31, | | Period from
April 27, 2012(2) to | |
Selected Per Share Data and Ratios | | 2016(1) | | 2015 | | 2014 | | 2013 | | December 31, 2012 | |
Net Asset Value, Beginning of Period | | $ | 18.98 | | | $ | 21.39 | | | $ | 23.91 | | | $ | 25.27 | | | $ | 23.85 | | |
Income (Loss) from Investment Operations: | |
Net Investment Income (Loss) (3) | | | 0.00 | (4) | | | (0.04 | ) | | | (0.05 | ) | | | (0.05 | ) | | | 0.04 | | |
Net Realized and Unrealized Gain (Loss) | | | 1.10 | | | | (2.33 | ) | | | (1.23 | ) | | | (0.37 | ) | | | 1.44 | | |
Total from Investment Operations | | | 1.10 | | | | (2.37 | ) | | | (1.28 | ) | | | (0.42 | ) | | | 1.48 | | |
Distributions from and/or in Excess of: | |
Net Investment Income | | | — | | | | (0.04 | ) | | | (0.06 | ) | | | (0.08 | ) | | | (0.06 | ) | |
Net Realized Gain | | | — | | | | — | | | | (1.18 | ) | | | (0.86 | ) | | | — | | |
Total Distributions | | | — | | | | (0.04 | ) | | | (1.24 | ) | | | (0.94 | ) | | | (0.06 | ) | |
Redemption Fees | | | 0.00 | (4) | | | 0.00 | (4) | | | 0.00 | (4) | | | 0.00 | (4) | | | 0.00 | (4) | |
Net Asset Value, End of Period | | $ | 20.08 | | | $ | 18.98 | | | $ | 21.39 | | | $ | 23.91 | | | $ | 25.27 | | |
Total Return (5) | | | 5.80 | % | | | (11.11 | )% | | | (5.26 | )% | | | (1.56 | )% | | | 6.20 | %(11) | |
Ratios and Supplemental Data: | |
Net Assets, End of Period (Thousands) | | $ | 239 | | | $ | 226 | | | $ | 210 | | | $ | 203 | | | $ | 11 | | |
Ratio of Expenses to Average Net Assets (13) | | | 2.01 | %(6)(9) | | | 2.09 | %(6)(8) | | | 2.10 | %(6) | | | 2.03 | %(6)(7) | | | 1.99 | %(6)(12) | |
Ratio of Expenses to Average Net Assets Excluding Non Operating Expenses | | | N/A | | | | N/A | | | | N/A | | | | 2.03 | %(6)(7) | | | N/A | | |
Ratio of Net Investment Income (Loss) to Average Net Assets (13) | | | 0.00 | %(6)(10) | | | (0.19 | )%(6) | | | (0.21 | )%(6) | | | (0.18 | )%(6) | | | 0.27 | %(6)(12) | |
Ratio of Rebate from Morgan Stanley Affiliates to Average Net Assets | | | 0.00 | %(10) | | | 0.00 | %(10) | | | 0.00 | %(10) | | | 0.01 | % | | | 0.01 | %(12) | |
Portfolio Turnover Rate | | | 33 | % | | | 40 | % | | | 43 | % | | | 49 | % | | | 47 | % | |
(13) Supplemental Information on the Ratios to Average Net Assets: | |
Ratios Before Expense Limitation: | |
Expenses to Average Net Assets | | | 2.69 | % | | | 2.78 | % | | | 2.97 | % | | | 2.54 | % | | | 2.28 | %(12) | |
Net Investment Loss to Average Net Assets | | | (0.68 | )% | | | (0.88 | )% | | | (1.08 | )% | | | (0.69 | )% | | | (0.02 | )%(12) | |
(1) Refer to Note F in the Notes to Financial Statements for discussion of prior period custodian out-of-pocket expenses that were reimbursed in the current period. The amount of the reimbursement was immaterial on a per share basis and did not impact the total return of Class L shares. The Ratio of Expenses to Average Net Assets and the Ratio of Net Investment Income to Average Net Assets would be unchanged as the reimbursement of custodian fees was offset against current period expense waivers/reimbursements with no impact to net expenses or net investment income.
(2) Commencement of Offering.
(3) Per share amount is based on average shares outstanding.
(4) Amount is less than $0.005 per share.
(5) Calculated based on the net asset value as of the last business day of the period.
(6) The Ratios of Expenses and Net Investment Income (Loss) reflect the rebate of certain Portfolio expenses in connection with the investments in Morgan Stanley affiliates during the period. The effect of the rebate on the ratios is disclosed in the above table as "Ratio of Rebate from Morgan Stanley Affiliates to Average Net Assets."
(7) Effective September 16, 2013, the Adviser has agreed to limit the ratio of expenses to average net assets to the maximum ratio of 2.10% for Class L shares. Prior to September 16, 2013, the maximum ratio was 2.00% for Class L shares.
(8) Effective September 30, 2015, the Adviser has agreed to limit the ratio of expenses to average net assets to the maximum ratio of 2.05% for Class L shares. Prior to September 30, 2015, the maximum ratio was 2.10% for Class L shares.
(9) Effective September 30, 2016, the Adviser has agreed to limit the ratio of expenses to average net assets to the maximum ratio of 1.90% for Class L shares. Prior to September 30, 2016, the maximum ratio was 2.05% for Class L shares.
(10) Amount is less than 0.005%.
(11) Not Annualized.
(12) Annualized.
The accompanying notes are an integral part of the financial statements.
17
Morgan Stanley Institutional Fund, Inc.
Annual Report — December 31, 2016
Financial Highlights
Emerging Markets Portfolio
| | | Class C | |
Selected Per Share Data and Ratios | | Year Ended
December 31, 2016(1) | | Period from
April 30, 2015(2) to
December 31, 2015 | |
Net Asset Value, Beginning of Period | | $ | 18.95 | | | $ | 23.16 | | |
Income (Loss) from Investment Operations: | |
Net Investment Loss (3) | | | (0.04 | ) | | | (0.03 | ) | |
Net Realized and Unrealized Gain (Loss) | | | 1.09 | | | | (4.14 | ) | |
Total from Investment Operations | | | 1.05 | | | | (4.17 | ) | |
Distributions from and/or in Excess of: | |
Net Investment Income | | | (0.01 | ) | | | (0.04 | ) | |
Redemption Fees | | | 0.00 | (4) | | | 0.00 | (4) | |
Net Asset Value, End of Period | | $ | 19.99 | | | $ | 18.95 | | |
Total Return (5) | | | 5.56 | % | | | (18.03 | )%(10) | |
Ratios and Supplemental Data: | |
Net Assets, End of Period (Thousands) | | $ | 608 | | | $ | 10 | | |
Ratio of Expenses to Average Net Assets (12) | | | 2.24 | %(6)(8) | | | 2.33 | %(6)(7)(11) | |
Ratio of Net Investment Loss to Average Net Assets (12) | | | (0.19 | )%(6) | | | (0.23 | )%(6)(11) | |
Ratio of Rebate from Morgan Stanley Affiliates to Average Net Assets | | | 0.00 | %(9) | | | 0.00 | %(9)(11) | |
Portfolio Turnover Rate | | | 33 | % | | | 40 | % | |
(12) Supplemental Information on the Ratios to Average Net Assets: | |
Ratios Before Expense Limitation: | |
Expense to Average Net Assets | | | 2.58 | % | | | 22.89 | %(11) | |
Net Investment Loss to Average Net Assets | | | (0.53 | )% | | | (20.79 | )%(11) | |
(1) Refer to Note F in the Notes to Financial Statements for discussion of prior period custodian out-of-pocket expenses that were reimbursed in the current period. The amount of the reimbursement was immaterial on a per share basis and did not impact the total return of Class C shares. The Ratio of Expenses to Average Net Assets and the Ratio of Net Investment Loss to Average Net Assets would be unchanged as the reimbursement of custodian fees was offset against current period expense waivers/reimbursements with no impact to net expenses or net investment loss.
(2) Commencement of Offering.
(3) Per share amount is based on average shares outstanding.
(4) Amount is less than $0.005 per share.
(5) Calculated based on the net asset value which does not reflect sales charges, if applicable, as of the last business day of the period.
(6) The Ratios of Expenses and Net Investment Loss reflect the rebate of certain Portfolio expenses in connection with the investments in Morgan Stanley affiliates during the period. The effect of the rebate on the ratios is disclosed in the above table as "Ratio of Rebate from Morgan Stanley Affiliates to Average Net Assets."
(7) Effective September 30, 2015, the Adviser has agreed to limit the ratio of expenses to average net assets to the maximum ratio of 2.30% for Class C shares. Prior to September 30, 2015, the maximum ratio was 2.35% for Class C shares.
(8) Effective September 30, 2016, the Adviser has agreed to limit the ratio of expenses to average net assets to the maximum ratio of 2.15% for Class C shares. Prior to September 30, 2016, the maximum ratio was 2.30% for Class C shares.
(9) Amount is less than 0.005%.
(10) Not Annualized.
(11) Annualized.
The accompanying notes are an integral part of the financial statements.
18
Morgan Stanley Institutional Fund, Inc.
Annual Report — December 31, 2016
Financial Highlights
Emerging Markets Portfolio
| | | Class IS | |
| | | Year Ended December 31, | | Period from
September 13, 2013(2) to | |
Selected Per Share Data and Ratios | | 2016(1) | | 2015 | | 2014 | | December 31, 2013 | |
Net Asset Value, Beginning of Period | | $ | 19.68 | | | $ | 22.14 | | | $ | 24.64 | | | $ | 24.92 | | |
Income (Loss) from Investment Operations: | |
Net Investment Income (Loss) (3) | | | 0.21 | | | | 0.17 | | | | 0.22 | | | | (0.01 | ) | |
Net Realized and Unrealized Gain (Loss) | | | 1.12 | | | | (2.44 | ) | | | (1.32 | ) | | | 0.46 | | |
Total from Investment Operations | | | 1.33 | | | | (2.27 | ) | | | (1.10 | ) | | | 0.45 | | |
Distributions from and/or in Excess of: | |
Net Investment Income | | | (0.18 | ) | | | (0.19 | ) | | | (0.22 | ) | | | (0.14 | ) | |
Net Realized Gain | | | — | | | | — | | | | (1.18 | ) | | | (0.59 | ) | |
Total Distributions | | | (0.18 | ) | | | (0.19 | ) | | | (1.40 | ) | | | (0.73 | ) | |
Redemption Fees | | | 0.00 | (4) | | | 0.00 | (4) | | | 0.00 | (4) | | | 0.00 | (4) | |
Net Asset Value, End of Period | | $ | 20.83 | | | $ | 19.68 | | | $ | 22.14 | | | $ | 24.64 | | |
Total Return (5) | | | 6.79 | % | | | (10.29 | )% | | | (4.36 | )% | | | 1.85 | %(11) | |
Ratios and Supplemental Data: | |
Net Assets, End of Period (Thousands) | | $ | 657,106 | | | $ | 297,469 | | | $ | 325,029 | | | $ | 10 | | |
Ratio of Expenses to Average Net Assets (13) | | | 1.04 | %(6)(9) | | | 1.16 | %(6)(8) | | | 1.18 | %(6) | | | 1.17 | %(6)(7)(12) | |
Ratio of Expenses to Average Net Assets Excluding Non Operating Expenses | | | N/A | | | | N/A | | | | N/A | | | | 1.17 | %(6)(7)(12) | |
Ratio of Net Investment Income (Loss) to Average Net Assets (13) | | | 0.99 | %(6) | | | 0.75 | %(6) | | | 0.89 | %(6) | | | (0.21 | )%(6)(12) | |
Ratio of Rebate from Morgan Stanley Affiliates to Average Net Assets | | | 0.00 | %(10) | | | 0.00 | %(10) | | | 0.00 | %(10) | | | 0.01 | %(12) | |
Portfolio Turnover Rate | | | 33 | % | | | 40 | % | | | 43 | % | | | 49 | % | |
(13) Supplemental Information on the Ratios to Average Net Assets: | |
Ratios Before Expense Limitation: | |
Expenses to Average Net Assets | | | 1.07 | % | | | 1.35 | % | | | 1.42 | % | | | 6.65 | %(12) | |
Net Investment Income (Loss) to Average Net Assets | | | 0.96 | % | | | 0.56 | % | | | 0.65 | % | | | (5.69 | )%(12) | |
(1) Refer to Note F in the Notes to Financial Statements for discussion of prior period custodian out-of-pocket expenses that were reimbursed in the current period. The amount of the reimbursement was immaterial on a per share basis and did not impact the total return of Class IS shares. The Ratio of Expenses to Average Net Assets and the Ratio of Net Investment Income to Average Net Assets would be unchanged as the reimbursement of custodian fees was offset against current period expense waivers/reimbursements with no impact to net expenses or net investment income.
(2) Commencement of Offering.
(3) Per share amount is based on average shares outstanding.
(4) Amount is less than $0.005 per share.
(5) Calculated based on the net asset value as of the last business day of the period.
(6) The Ratios of Expenses and Net Investment Income (Loss) reflect the rebate of certain Portfolio expenses in connection with the investments in Morgan Stanley affiliates during the period. The effect of the rebate on the ratios is disclosed in the above table as "Ratio of Rebate from Morgan Stanley Affiliates to Average Net Assets."
(7) Effective September 16, 2013, the Adviser has agreed to limit the ratio of expenses to average net assets to the maximum ratio of 1.18% for Class IS shares.
(8) Effective September 30, 2015, the Adviser has agreed to limit the ratio of expenses to average net assets to the maximum ratio of 1.10% for Class IS shares. Prior to September 30, 2015, the maximum ratio was 1.18% for Class IS shares.
(9) Effective September 30, 2016, the Adviser has agreed to limit the ratio of expenses to average net assets to the maximum ratio of 0.95% for Class IS shares. Prior to September 30, 2016, the maximum ratio was 1.10% for Class IS shares.
(10) Amount is less than 0.005%.
(11) Not Annualized.
(12) Annualized.
The accompanying notes are an integral part of the financial statements.
19
Morgan Stanley Institutional Fund, Inc.
Annual Report — December 31, 2016
Notes to Financial Statements
Morgan Stanley Institutional Fund, Inc. (the "Fund") is registered under the Investment Company Act of 1940, as amended (the "Act"), as an open-end management investment company. The Fund is comprised of twenty-nine separate, active, diversified and non-diversified portfolios (individually referred to as a "Portfolio", collectively as the "Portfolios"). The Fund applies investment company accounting and reporting guidance.
The accompanying financial statements relate to the Emerging Markets Portfolio. The Portfolio seeks long-term capital appreciation by investing primarily in growth-oriented equity securities of issuers in emerging market countries.
Effective June 30, 2016, Morgan Stanley Investment Management Limited ("MSIM Limited") is no longer a Sub-Adviser to the Portfolio.
The Portfolio offers five classes of shares — Class I, Class A, Class L, Class C and Class IS. On April 30, 2015, the Portfolio suspended offering of Class L shares. Existing Class L shareholders may invest through reinvestment of dividends and distributions.
A. Significant Accounting Policies: The following significant accounting policies are in conformity with U.S. generally accepted accounting principles ("GAAP"). Such policies are consistently followed by the Fund in the preparation of its financial statements. GAAP may require management to make estimates and assumptions that affect the reported amounts and disclosures in the financial statements. Actual results may differ from those estimates.
1. Security Valuation: (1) An equity portfolio security listed or traded on an exchange is valued at its latest reported sales price (or at the exchange official closing price if such exchange reports an official closing price), and if there were no sales on a given day and if there is no official exchange closing price for that day, the security is valued at the mean between the last reported bid and asked prices if such bid and asked prices are available on the relevant exchanges; (2) all other equity portfolio securities for which over-the-counter ("OTC") market quotations are readily available are valued at the latest reported sales price (or at the market official closing price if such market reports an official closing price), and if there was no trading in the security on a given day and if there is no official closing price from relevant markets for that day, the security is valued at the mean between the last reported bid and asked prices if such bid and asked prices are available on the relevant markets. Listed equity securities not traded on the valuation
date with no reported bid and asked prices available on the exchange are valued at the mean between the current bid and asked prices obtained from one or more reputable brokers or dealers. An unlisted equity security that does not trade on the valuation date and for which bid and asked prices from the relevant markets are unavailable is valued at the mean between the current bid and asked prices obtained from one or more reputable brokers or dealers. In cases where a security is traded on more than one exchange, the security is valued on the exchange designated as the primary market; (3) certain portfolio securities may be valued by an outside pricing service/vendor approved by the Fund's Board of Directors (the "Directors"). The pricing service/vendor may employ a pricing model that takes into account, among other things, bids, yield spreads, and/or other market data and specific security characteristics. Alternatively, if a valuation is not available from an outside pricing service/vendor, and the security trades on an exchange, the security may be valued at its latest reported sale price (or at the exchange official closing price if such exchange reports an official closing price), prior to the time when assets are valued. If there are no sales on a given day and if there is no official exchange closing price for that day, the security is valued at the mean between the last reported bid and asked prices if such bid and asked prices are available in the relevant exchanges; (4) when market quotations are not readily available, including circumstances under which Morgan Stanley Investment Management Inc. (the "Adviser") or Morgan Stanley Investment Management Company ("MSIM Company") (the "Sub-Adviser"), a whole owned subsidiary of Morgan Stanley, determines that the closing price, last sale price or the mean between the last reported bid and asked prices are not reflective of a security's market value, portfolio securities are valued at their fair value as determined in good faith under procedures established by and under the general supervision of the Directors. Occasionally, developments affecting the closing prices of securities and other assets may occur between the times at which valuations of such securities are determined (that is, close of the foreign market on which the securities trade) and the close of business of the New York Stock Exchange ("NYSE"). If developments occur during such periods that are expected to materially affect the value of such securities, such valuations may be adjusted to reflect the estimated fair value of such securities as of the close of the NYSE, as determined in good faith by the Directors or by the Adviser using a pricing service and/or procedures approved by the
20
Morgan Stanley Institutional Fund, Inc.
Annual Report — December 31, 2016
Notes to Financial Statements (cont'd)
Directors; (5) quotations of foreign portfolio securities, other assets and liabilities and forward contracts stated in foreign currency are translated into U.S. dollar equivalents at the prevailing market rates prior to the close of the NYSE; and (6) investments in mutual funds, including the Morgan Stanley Institutional Liquidity Funds, are valued at the net asset value ("NAV") as of the close of each business day.
The Directors have responsibility for determining in good faith the fair value of the investments, and the Directors may appoint others, such as the Fund's Adviser or a valuation committee, to assist the Directors in determining fair value and to make the actual calculations pursuant to the fair valuation methodologies previously approved by the Directors. Under procedures approved by the Directors, the Fund's Adviser has formed a Valuation Committee whose members are approved by the Directors. The Valuation Committee provides administration and oversight of the Fund's valuation policies and procedures, which are reviewed at least annually by the Directors. These procedures allow the Fund to utilize independent pricing services, quotations from securities and financial instrument dealers, and other market sources to determine fair value.
The Fund has procedures to determine the fair value of securities and other financial instruments for which market prices are not readily available. Under these procedures, the Valuation Committee convenes on a regular and ad hoc basis to review such securities and considers a number of factors, including valuation methodologies and significant unobservable valuation inputs, when arriving at fair value. The Valuation Committee may employ a market-based approach which may use related or comparable assets or liabilities, recent transactions, market multiples, book values, and other relevant information for the investment to determine the fair value of the investment. An income-based valuation approach may also be used in which the anticipated future cash flows of the investment are discounted to calculate fair value. Discounts may also be applied due to the nature or duration of any restrictions on the disposition of the investments. Due to the inherent uncertainty of valuations of such investments, the fair values may differ significantly from the values that would have been used had an active market existed. The Valuation Committee employs various methods for calibrating these valuation approaches including a regular review of valuation
methodologies, key inputs and assumptions, transactional back-testing or disposition analysis, and reviews of any related market activity.
2. Fair Value Measurement: Financial Accounting Standards Board ("FASB") Accounting Standards CodificationTM ("ASC") 820, "Fair Value Measurement" ("ASC 820"), defines fair value as the value that the Fund would receive to sell an investment or pay to transfer a liability in a timely transaction with an independent buyer in the principal market, or in the absence of a principal market, the most advantageous market for the investment or liability. ASC 820 establishes a three-tier hierarchy to distinguish between (1) inputs that reflect the assumptions market participants would use in valuing an asset or liability developed based on market data obtained from sources independent of the reporting entity (observable inputs) and (2) inputs that reflect the reporting entity's own assumptions about the assumptions market participants would use in valuing an asset or liability developed based on the best information available in the circumstances (unobservable inputs) and to establish classification of fair value measurements for disclosure purposes. Various inputs are used in determining the value of the Fund's investments. The inputs are summarized in the three broad levels listed below.
• Level 1 – unadjusted quoted prices in active markets for identical investments
• Level 2 – other significant observable inputs (including quoted prices for similar investments, interest rates, prepayment speeds, credit risk, etc.)
• Level 3 – significant unobservable inputs including the Fund's own assumptions in determining the fair value of investments. Factors considered in making this determination may include, but are not limited to, information obtained by contacting the issuer, analysts, or the appropriate stock exchange (for exchange-traded securities), analysis of the issuer's financial statements or other available documents and, if necessary, available information concerning other securities in similar circumstances
The inputs or methodology used for valuing securities are not necessarily an indication of the risk associated with investing in those securities and the determination of the significance of a particular input to the fair value
21
Morgan Stanley Institutional Fund, Inc.
Annual Report — December 31, 2016
Notes to Financial Statements (cont'd)
measurement in its entirety requires judgment and considers factors specific to each security.
The following is a summary of the inputs used to value the Portfolio's investments as of December 31, 2016.
Investment Type | | Level 1
Unadjusted
quoted
prices
(000) | | Level 2
Other
significant
observable
inputs
(000) | | Level 3
Significant
unobservable
inputs
(000) | | Total
(000) | |
Assets: | |
Common Stocks | |
Aerospace & Defense | | $ | 7,907 | | | $ | — | | | $ | — | | | $ | 7,907 | | |
Airlines | | | 6,045 | | | | — | | | | — | | | | 6,045 | | |
Auto Components | | | 5,445 | | | | — | | | | — | | | | 5,445 | | |
Automobiles | | | 16,510 | | | | — | | | | — | | | | 16,510 | | |
Banks | | | 200,142 | | | | 11,544 | | | | — | | | | 211,686 | | |
Beverages | | | 12,109 | | | | — | | | | — | | | | 12,109 | | |
Biotechnology | | | 4,013 | | | | — | | | | — | | | | 4,013 | | |
Chemicals | | | 5,013 | | | | — | | | | — | | | | 5,013 | | |
Construction & Engineering | | | 10,079 | | | | 4,598 | | | | — | | | | 14,677 | | |
Construction Materials | | | 38,016 | | | | — | | | | — | | | | 38,016 | | |
Consumer Finance | | | 8,876 | | | | — | | | | — | | | | 8,876 | | |
Diversified Consumer
Services | | | 6,905 | | | | — | | | | — | | | | 6,905 | | |
Diversified Financial
Services | | | 15,806 | | | | — | | | | — | | | | 15,806 | | |
Diversified
Telecommunication
Services | | | 17,355 | | | | — | | | | — | | | | 17,355 | | |
Electronic Equipment,
Instruments &
Components | | | 18,215 | | | | — | | | | — | | | | 18,215 | | |
Food & Staples Retailing | | | 31,251 | | | | — | | | | — | | | | 31,251 | | |
Food Products | | | 26,258 | | | | — | | | | — | | | | 26,258 | | |
Health Care Providers &
Services | | | — | | | | 5,534 | | | | — | | | | 5,534 | | |
Hotels, Restaurants &
Leisure | | | 5,130 | | | | 2,784 | | | | — | | | | 7,914 | | |
Household Durables | | | 21,279 | | | | — | | | | — | | | | 21,279 | | |
Independent Power and
Renewable Electricity
Producers | | | 1,627 | | | | — | | | | — | | | | 1,627 | | |
Industrial Conglomerates | | | 24,538 | | | | — | | | | — | | | | 24,538 | | |
Insurance | | | 18,631 | | | | — | | | | — | | | | 18,631 | | |
Internet & Direct Marketing
Retail | | | 5,926 | | | | — | | | | — | | | | 5,926 | | |
Internet Software &
Services | | | 91,232 | | | | — | | | | — | | | | 91,232 | | |
Machinery | | | 11,290 | | | | — | | | | — | | | | 11,290 | | |
Media | | | 29,330 | | | | — | | | | — | | | | 29,330 | | |
Metals & Mining | | | 10,694 | | | | — | | | | — | | | | 10,694 | | |
Multi-line Retail | | | 15,931 | | | | — | | | | — | | | | 15,931 | | |
Oil, Gas & Consumable
Fuels | | | 38,329 | | | | — | | | | — | | | | 38,329 | | |
Paper & Forest Products | | | 8,316 | | | | — | | | | — | | | | 8,316 | | |
Personal Products | | | 12,776 | | | | — | | | | — | | | | 12,776 | | |
Pharmaceuticals | | | 3,855 | | | | — | | | | — | | | | 3,855 | | |
Professional Services | | | 6,572 | | | | — | | | | — | | | | 6,572 | | |
Real Estate Management &
Development | | | 6,965 | | | | 3,030 | | | | — | | | | 9,995 | | |
Semiconductors &
Semiconductor
Equipment | | | 32,538 | | | | — | | | | — | | | | 32,538 | | |
Investment Type | | Level 1
Unadjusted
quoted
prices
(000) | | Level 2
Other
significant
observable
inputs
(000) | | Level 3
Significant
unobservable
inputs
(000) | | Total
(000) | |
Common Stocks (cont'd) | |
Software | | $ | 4,970 | | | $ | — | | | $ | — | | | $ | 4,970 | | |
Tech Hardware, Storage &
Peripherals | | | 51,813 | | | | — | | | | — | | | | 51,813 | | |
Textiles, Apparel & Luxury
Goods | | | 39,345 | | | | — | | | | — | | | | 39,345 | | |
Transportation
Infrastructure | | | 5,484 | | | | — | | | | — | | | | 5,484 | | |
Wireless
Telecommunication
Services | | | 35,610 | | | | — | | | | — | | | | 35,610 | | |
Total Common Stocks | | | 912,126 | | | | 27,490 | | | | — | | | | 939,616 | | |
Short-Term Investments | |
Investment Company | | | 18,610 | | | | — | | | | — | | | | 18,610 | | |
Foreign Currency Forward
Exchange Contract | | | — | | | | 264 | | | | — | | | | 264 | | |
Total Assets | | $ | 930,736 | | | $ | 27,754 | | | $ | — | | | $ | 958,490 | | |
Transfers between investment levels may occur as the markets fluctuate and/or the availability of data used in an investment's valuation changes. The Portfolio recognizes transfers between the levels as of the end of the period. As of December 31, 2016, securities with a total value of approximately $592,916,000 transferred from Level 2 to Level 1. Securities that were valued using other significant observable inputs at December 31, 2015 were valued using unadjusted quoted prices at December 31, 2016. At December 31, 2015, the fair value of certain securities were adjusted due to developments which occurred between the time of the close of the foreign markets on which they trade and the close of business on the NYSE which resulted in their Level 2 classification.
Following is a reconciliation of investments in which significant unobservable inputs (Level 3) were used in determining fair value.
| | | Common
Stock
(000) | |
Beginning Balance | | $ | 3,114 | | |
Purchases | | | — | | |
Sales | | | (1,974 | ) | |
Amortization of discount | | | — | | |
Transfers in | | | — | | |
Transfers out | | | — | | |
Corporate actions | | | — | | |
Change in unrealized appreciation (depreciation) | | | (91 | ) | |
Realized gains (losses) | | | (1,049 | ) | |
Ending Balance | | $ | — | | |
Net change in unrealized appreciation (depreciation) from investments
still held as of December 31, 2016 | | $ | — | | |
22
Morgan Stanley Institutional Fund, Inc.
Annual Report — December 31, 2016
Notes to Financial Statements (cont'd)
3. Foreign Currency Translation and Foreign Investments: The books and records of the Portfolio are maintained in U.S. dollars. Foreign currency amounts are translated into U.S. dollars as follows:
– investments, other assets and liabilities at the prevailing rate of exchange on the valuation date;
– investment transactions and investment income at the prevailing rates of exchange on the dates of such transactions.
Although the net assets of the Portfolio are presented at the foreign exchange rates and market values at the close of the period, the Portfolio does not isolate that portion of the results of operations arising as a result of changes in the foreign exchange rates from the fluctuations arising from changes in the market prices of securities held at period end. Similarly, the Portfolio does not isolate the effect of changes in foreign exchange rates from the fluctuations arising from changes in the market prices of securities sold during the period. Accordingly, realized and unrealized foreign currency gains (losses) on investments in securities are included in the reported net realized and unrealized gains (losses) on investment transactions and balances. However, pursuant to U.S. federal income tax regulations, gains and losses from certain foreign currency transactions and the foreign currency portion of gains and losses realized on sales and maturities of foreign denominated debt securities are treated as ordinary income for U.S. federal income tax purposes.
Net realized gains (losses) on foreign currency transactions represent net foreign exchange gains (losses) from foreign currency forward exchange contracts, disposition of foreign currencies, currency gains (losses) realized between the trade and settlement dates on securities transactions, and the difference between the amount of investment income and foreign withholding taxes recorded on the Portfolio's books and the U.S. dollar equivalent amounts actually received or paid. Net unrealized currency gains (losses) from valuing foreign currency denominated assets and liabilities at period end exchange rates are reflected as a component of unrealized appreciation (depreciation) in the Statement of Assets and Liabilities. The change in unrealized currency gains (losses) on foreign currency translations for the period is reflected in the Statement of Operations.
Foreign security and currency transactions may involve certain considerations and risks not typically associated with those of U.S. dollar denominated transactions as a result of, among other factors, fluctuations of exchange rates in relation to the U.S. dollar, the possibility of lower levels of governmental supervision and regulation of foreign securities markets and the possibility of political or economic instability.
Governmental approval for foreign investments may be required in advance of making an investment under certain circumstances in some countries, and the extent of foreign investments in domestic companies may be subject to limitation in other countries. Foreign ownership limitations also may be imposed by the charters of individual companies to prevent, among other concerns, violations of foreign investment limitations. As a result, an additional class of shares (identified as "Foreign" in the Portfolio of Investments) may be created and offered for investment. The "local" and "foreign shares" market values may differ. In the absence of trading of the foreign shares in such markets, the Portfolio values the foreign shares at the closing exchange price of the local shares.
4. Derivatives: The Portfolio may, but is not required to, use derivative instruments for a variety of purposes, including hedging, risk management, portfolio management or to earn income. Derivatives are financial instruments whose value is based, in part, on the value of an underlying asset, interest rate, index or financial instrument. Prevailing interest rates and volatility levels, among other things, also affect the value of derivative instruments. A derivative instrument often has risks similar to its underlying asset and may have additional risks, including imperfect correlation between the value of the derivative and the underlying asset, risks of default by the counterparty to certain transactions, magnification of losses incurred due to changes in the market value of the securities, instruments, indices or interest rates to which the derivative instrument relates, risks that the transactions may not be liquid and risks arising from margin requirements. The use of derivatives involves risks that are different from, and possibly greater than, the risks associated with other portfolio investments. Derivatives may involve the use of highly specialized instruments that require investment techniques and risk analyses different from those associated with other portfolio investments. All of the
23
Morgan Stanley Institutional Fund, Inc.
Annual Report — December 31, 2016
Notes to Financial Statements (cont'd)
Portfolio's holdings, including derivative instruments, are marked-to-market each day with the change in value reflected in unrealized appreciation (depreciation). Upon disposition, a realized gain or loss is recognized.
Certain derivative transactions may give rise to a form of leverage. Leverage magnifies the potential for gain and the risk of loss. Leverage associated with derivative transactions may cause the Portfolio to liquidate portfolio positions when it may not be advantageous to do so to satisfy its obligations or to meet earmarking or segregation requirements, pursuant to applicable Securities and Exchange Commission rules and regulations, or may cause the Portfolio to be more volatile than if the Portfolio had not been leveraged. Although the Adviser and/or Sub-Adviser seek to use derivatives to further the Portfolio's investment objectives, there is no assurance that the use of derivatives will achieve this result.
Following is a description of the derivative instruments and techniques that the Portfolio used during the period and their associated risks:
Foreign Currency Forward Exchange Contracts: In connection with its investments in foreign securities, the Portfolio also entered into contracts with banks, brokers or dealers to purchase or sell securities or foreign currencies at a future date. A foreign currency forward exchange contract ("currency contract") is a negotiated agreement between the contracting parties to exchange a specified amount of currency at a specified future time at a specified rate. The rate can be higher or lower than the spot rate between the currencies that are the subject of the contract. Currency contracts may be used to protect against uncertainty in the level of future foreign currency exchange rates or to gain or modify exposure to a particular currency. To the extent hedged by the use of currency contracts, the precise matching of the currency contract amounts and the value of the securities involved will not generally be possible because the future value of such securities in foreign currencies will change as a consequence of market movements in the value of those securities between the date on which the contract is entered into and the date it matures. Furthermore, such transactions may reduce or preclude the opportunity for gain if the value of the currency should move in the direction opposite to the position taken. There is
additional risk to the extent that currency contracts create exposure to currencies in which the Portfolio's securities are not denominated. Unanticipated changes in currency prices may result in poorer overall performance for the Portfolio than if it had not entered into such contracts. The use of currency contracts involves the risk of loss from the insolvency or bankruptcy of the counterparty to the contract or the failure of the counterparty to make payments or otherwise comply with the terms of the contract. A currency contract is marked-to-market daily and the change in market value is recorded by the Portfolio as unrealized gain or loss. The Portfolio records realized gains (losses) when the currency contract is closed equal to the difference between the value of the currency contract at the time it was opened and the value at the time it was closed.
FASB ASC 815, "Derivatives and Hedging" ("ASC 815"), is intended to improve financial reporting about derivative instruments by requiring enhanced disclosures to enable investors to better understand how and why the Portfolio uses derivative instruments, how these derivative instruments are accounted for and their effects on the Portfolio's financial position and results of operations.
The following tables set forth the fair value of the Portfolio's derivative contracts by primary risk exposure as of December 31, 2016.
| | | Asset Derivatives
Statement of Assets and
Liabilities Location | | Primary Risk
Exposure | | Value
(000) | |
Foreign Currency
Forward Exchange
Contract | | Unrealized Appreciation on
Foreign Currency Forward
Exchange Contract | |
Currency Risk | | $ | 264 | | |
The following tables set forth by primary risk exposure the Portfolio's realized gains (losses) and change in unrealized appreciation (depreciation) by type of derivative contract for the year ended December 31, 2016 in accordance with ASC 815.
Realized Gain (Loss) | |
Primary Risk Exposure | | Derivative Type | | Value
(000) | |
Currency Risk | | Foreign Currency Forward
Exchange Contracts | | $ | 721 | | |
Change in Unrealized Appreciation (Depreciation) | |
Primary Risk Exposure | | Derivative Type | | Value
(000) | |
Currency Risk | | Foreign Currency Forward
Exchange Contracts | | $ | 140 | | |
24
Morgan Stanley Institutional Fund, Inc.
Annual Report — December 31, 2016
Notes to Financial Statements (cont'd)
At December 31, 2016, the Portfolio's derivative assets and liabilities are as follows:
Gross Amounts of Assets and Liabilities Presented in the
Statement of Assets and Liabilities | |
Derivatives | | Assets(a)
(000) | | Liabilities(a)
(000) | |
Foreign Currency Forward Exchange Contract | | $ | 264 | | | $ | — | | |
(a) Absent an event of default or early termination, OTC derivative assets and liabilities are presented gross and not offset in the Statement of Assets and Liabilities.
The Portfolio typically enters into International Swaps and Derivatives Association, Inc. Master Agreements ("ISDA Master Agreements") or similar master agreements (collectively, "Master Agreements") with its contract counterparties for certain OTC derivatives in order to, among other things, reduce its credit risk to counterparties. ISDA Master Agreements include provisions for general obligations, representations, collateral and events of default or termination. Under an ISDA Master Agreement, the Portfolio typically may offset with the counterparty certain OTC derivative financial instruments' payables and/or receivables with collateral held and/or posted and create one single net payment (close-out netting) in the event of default, termination and/or potential deterioration in the credit quality of the counterparty. Various Master Agreements govern the terms of certain transactions with counterparties, including transactions such as swap, forward, repurchase and reverse repurchase agreements. These Master Agreements typically attempt to reduce the counterparty risk associated with such transactions by specifying credit protection mechanisms and providing standardization that improves legal certainty. Cross-termination provisions under Master Agreements typically provide that a default in connection with one transaction between the Portfolio and a counterparty gives the non-defaulting party the right to terminate any other transactions in place with the defaulting party to create one single net payment due to/due from the defaulting party and may be a feature in certain Master Agreements. In the event the Portfolio exercises its right to terminate a Master Agreement after a counterparty experiences a termination event as defined in the Master Agreement, the return of collateral with market value in excess of the Portfolio's net liability may be delayed or denied.
The following tables present derivative financial instruments that are subject to enforceable netting arrangements as of December 31, 2016.
Gross Amounts Not Offset in the Statement of Assets and Liabilities | |
Counterparty | | Gross Asset
Derivatives
Presented in
Statement of
Assets and
Liabilities
(000) | | Financial
Instrument
(000) | | Collateral
Received
(000) | | Net Amount
(not less
than $0)
(000) | |
UBS AG | | $ | 264 | | | $ | — | | | $ | — | | | $ | 264 | | |
For the year ended December 31, 2016, the approximate average monthly amount outstanding for each derivative type is as follows:
Foreign Currency Forward Exchange Contracts: | |
Average monthly principal amount | | $ | 20,993,000 | | |
5. Securities Lending: The Portfolio lends securities to qualified financial institutions, such as broker-dealers, to earn additional income. Any increase or decrease in the fair value of the securities loaned that might occur and any interest earned or dividends declared on those securities during the term of the loan would remain in the Portfolio. The Portfolio would receive cash or securities as collateral in an amount equal to or exceeding 100% of the current fair value of the loaned securities. The collateral is marked-to-market daily by State Street Bank and Trust Company ("State Street"), the securities lending agent, to ensure that a minimum of 100% collateral coverage is maintained.
Based on pre-established guidelines, the securities lending agent invests any cash collateral that is received in an affiliated money market portfolio and repurchase agreements. Securities lending income is generated from the earnings on the invested collateral and borrowing fees, less any rebates owed to the borrowers and compensation to the lending agent, and is recorded as "Income from Securities Loaned — Net" in the Portfolio's Statement of Operations. Risks in securities lending transactions are that a borrower may not provide additional collateral when required or return the securities when due, and that the value of the short-term investments will be less than the amount of cash collateral plus any rebate that is required to be returned to the borrower.
The Portfolio has the right under the lending agreement to recover the securities from the borrower on demand.
25
Morgan Stanley Institutional Fund, Inc.
Annual Report — December 31, 2016
Notes to Financial Statements (cont'd)
The following table presents financial instruments that are subject to enforceable netting arrangements as of December 31, 2016.
Gross Amounts Not Offset in the Statement of Assets and Liabilities | |
Gross Asset
Amounts
Presented in
Statement of
Assets and
Liabilities
(000) | | Financial
Instrument
(000) | | Collateral
Received
(000) | | Net Amount
(not less
than $0)
(000) | |
| $ | 12,590 | (b) | | $ | — | | | $ | (12,590 | )(c)(d) | | $ | 0 | | |
(b) Represents market value of loaned securities at period end.
(c) The Portfolio received cash collateral of approximately $248,000, which was subsequently invested in Morgan Stanley Institutional Liquidity Funds as reported in the Portfolio of Investments. In addition, the Portfolio received non-cash collateral of approximately $12,737,000 in the form of U.S. Government obligations, which the Portfolio cannot sell or repledge, and accordingly are not reflected in the Portfolio of Investments.
(d) The actual collateral received is greater than the amount shown here due to overcollateralization.
FASB Accounting Standards Update No. 2014-11 ("ASU No. 2014-11"), "Transfers & Servicing (Topic 860): Repurchase-to-Maturity Transactions, Repurchase Financings, and Disclosures", is intended to provide increased transparency about the types of collateral pledged in securities lending transactions and other similar transactions that are accounted for as secured borrowing.
The following table displays a breakdown of transactions accounted for as secured borrowings, the gross obligations by class of collateral pledged, and the remaining contractual maturity of those transactions as of December 31, 2016.
Remaining Contractual Maturity of the Agreements | |
| | | Overnight and
Continuous
(000) | | <30 days
(000) | | Between
30 &
90 days
(000) | | >90 days
(000) | | Total
(000) | |
Securities Lending
Transactions | |
Common Stocks | | $ | 248 | | | $ | — | | | $ | — | | | $ | — | | | $ | 248 | | |
Total Borrowings | | $ | 248 | | | $ | — | | | $ | — | | | $ | — | | | $ | 248 | | |
Gross amount of
recognized liabilities
for securities lending
transactions | | | | | | | | | | $ | 248 | | |
6. Redemption Fees: The Portfolio will assess a 2% redemption fee on Class I shares, Class A shares, Class L shares, Class C shares and Class IS shares, which is paid directly to the Portfolio, for shares redeemed or exchanged within thirty days of purchase, subject to certain exceptions. The redemption fee is designed to protect the Portfolio and its remaining shareholders from the effects of short-term trading. These fees, if any, are included in the Statements of Changes in Net Assets.
7. Indemnifications: The Fund enters into contracts that contain a variety of indemnifications. The Fund's maximum exposure under these arrangements is unknown. However, the Fund has not had prior claims or losses pursuant to these contracts and expects the risk of loss to be remote.
8. Dividends and Distributions to Shareholders: Dividend income and distributions to shareholders are recorded on the ex-dividend date. Dividends from net investment income, if any, are declared and paid annually. Net realized capital gains, if any, are distributed at least annually.
9. Security Transactions, Income and Expenses: Security transactions are accounted for on the trade date (date the order to buy or sell is executed). Realized gains and losses on the sale of investment securities are determined on the specific identified cost method. Dividend income and other distributions are recorded on the ex-dividend date (except for certain foreign dividends which may be recorded as soon as the Portfolio is informed of such dividends) net of applicable withholding taxes. Interest income is recognized on the accrual basis except where collection is in doubt. Discounts are accreted and premiums are amortized over the life of the respective securities. Most expenses of the Fund can be directly attributed to a particular Portfolio. Expenses which cannot be directly attributed are apportioned among the Portfolios based upon relative net assets or other appropriate methods. Income, expenses (other than class specific expenses — distribution and shareholder services, transfer agency and sub transfer agency fees) and realized and unrealized gains or losses are allocated to each class of shares based upon their relative net assets.
26
Morgan Stanley Institutional Fund, Inc.
Annual Report — December 31, 2016
Notes to Financial Statements (cont'd)
B. Advisory/Sub-Advisory Fees: The Adviser, a wholly-owned subsidiary of Morgan Stanley, provides the Portfolio with advisory services under the terms of an Investment Advisory Agreement, paid quarterly, at the annual rate based on the daily net assets as follows:
First $500
million | | Next $500
million | | Next $1.5
billion | | Over $2.5
billion | |
| | 0.95 | % | | | 0.85 | % | | | 0.80 | % | | | 0.75 | % | |
Effective September 30, 2016, the Portfolio's annual rate based on the daily net assets was reduced and is as follows:
First $500
million | | Next $500
million | | Next $1.5
billion | | Over $2.5
billion | |
| | 0.85 | % | | | 0.75 | % | | | 0.70 | % | | | 0.65 | % | |
For the year ended December 31, 2016, the advisory fee rate (net of waivers/rebate) was equivalent to an annual effective rate of 0.87% of the Portfolio's average daily net assets.
The Adviser has agreed to reduce its advisory fee and/or reimburse the Portfolio so that total annual portfolio operating expenses, excluding certain investment related expenses, taxes, interest and other extraordinary expenses (including litigation), will not exceed 1.20% for Class I shares, 1.55% for Class A shares, 2.05% for Class L shares, 2.30% for Class C shares and 1.10% for Class IS shares. Effective September 30, 2016, the Adviser has agreed to reduce its advisory fee and/or reimburse the Portfolio so that total annual portfolio operating expenses will not exceed 1.05% for Class I shares, 1.40% for Class A shares, 1.90% for Class L shares, 2.15% for Class C shares and 0.95% for Class IS shares. The fee waivers and/or expense reimbursements will continue for at least one year from the date of the Portfolio's prospectus or until such time as the Directors act to discontinue all or a portion of such waivers and/or reimbursements when they deem such action is appropriate. For the year ended December 31, 2016, approximately $11,000 of advisory fees were waived and approximately $93,000 of other expenses were reimbursed by the Adviser pursuant to this arrangement.
The Adviser has entered into a Sub-Advisory Agreement with the Sub-Adviser, a wholly-owned subsidiary of Morgan Stanley. The Sub-Adviser provides the Portfolio with advisory services subject to the overall supervision of the Adviser and the Fund's Officers and Directors. The Adviser pays the Sub-Adviser on a monthly basis a portion of the net advisory fees the Adviser receives from the Portfolio.
C. Administration Fees: The Adviser also serves as Administrator to the Fund and provides administrative services pursuant to an Administration Agreement for an annual fee,
accrued daily and paid monthly, of 0.08% of the Portfolio's average daily net assets.
Under a Sub-Administration Agreement between the Administrator and State Street, State Street provides certain administrative services to the Fund. For such services, the Administrator pays State Street a portion of the fee the Administrator receives from the Portfolio.
D. Distribution and Shareholder Services Fees: Morgan Stanley Distribution, Inc. ("MSDI" or the "Distributor"), a wholly-owned subsidiary of the Adviser and Sub-Adviser and an indirect subsidiary of Morgan Stanley, serves as the Fund's Distributor of Portfolio shares pursuant to a Distribution Agreement. The Fund has adopted a Shareholder Services Plan with respect to Class A shares pursuant to Rule 12b-1 under the Act. Under the Shareholder Services Plan, the Portfolio pays the Distributor a shareholder services fee, accrued daily and paid monthly, at an annual rate of 0.25% of the Portfolio's average daily net assets attributable to Class A shares.
The Fund has adopted a Distribution and Shareholder Services Plan with respect to Class L shares pursuant to Rule 12b-1 under the Act. Under the Distribution and Shareholder Services Plan, the Portfolio pays the Distributor a distribution fee, accrued daily and paid monthly, at an annual rate of 0.50% and a shareholder services fee, accrued daily and paid monthly, at an annual rate of 0.25% of the Portfolio's average daily net assets attributable to Class L shares.
The Fund has adopted a Distribution and Shareholder Services Plan with respect to Class C shares pursuant to Rule 12b-1 under the Act. Under the Distribution and Shareholder Services Plan, the Portfolio pays the Distributor a distribution fee, accrued daily and paid monthly, at an annual rate of 0.75% and a shareholder services fee, accrued daily and paid monthly, at an annual rate of 0.25% of the Portfolio's average daily net assets attributable to Class C shares.
The distribution and shareholder services fees are used to support the expenses associated with servicing and maintaining accounts. The Distributor may compensate other parties for providing shareholder support services to investors who purchase Class A, Class L and Class C shares.
E. Dividend Disbursing and Transfer Agent: The Fund's dividend disbursing and transfer agent is Boston Financial Data Services, Inc. ("BFDS"). Pursuant to a Transfer Agency Agreement, the Fund pays BFDS a fee based on the
27
Morgan Stanley Institutional Fund, Inc.
Annual Report — December 31, 2016
Notes to Financial Statements (cont'd)
number of classes, accounts and transactions relating to the Portfolios of the Fund.
F. Custodian Fees: State Street (the "Custodian") serves as Custodian for the Fund in accordance with a Custodian Agreement. The Custodian holds cash, securities, and other assets of the Fund as required by the Act. Custody fees are payable monthly based on assets held in custody, investment purchases and sales activity and account maintenance fees, plus reimbursement for certain out-of-pocket expenses.
In December 2015, the Fund's Custodian announced that it had identified inconsistencies in the way in which clients were invoiced for out-of-pocket expenses from 1998 until November 2015. The dollar amount difference between what was charged and what should have been charged, plus interest, was paid back to the Portfolio in September 2016 as a reimbursement. The Custodian reimbursed the Portfolio directly, which was recognized as a change in accounting estimate and was reflected as "Reimbursement of Custodian Fees" in the Statement of Operations. Pursuant to the expense limitations described in Note B, the Portfolio has experienced waiver of advisory fees during the current period. Accordingly, the reimbursement of out-of-pocket custodian expenses in the current period resulted in the reduction in the current period waiver of advisory fees.
G. Security Transactions and Transactions with Affiliates: For the year ended December 31, 2016, purchases and sales of investment securities for the Portfolio, other than long-term U.S. Government securities and short-term investments, were approximately $359,259,000 and $295,149,000, respectively. There were no purchases and sales of long-term U.S. Government securities for the year ended December 31, 2016.
The Portfolio invests in the Institutional Class of the Morgan Stanley Institutional Liquidity Funds (the "Liquidity Funds"), an open-end management investment company managed by the Adviser, both directly and as a portion of the securities held as collateral on loaned securities. Advisory fees paid by the Portfolio are reduced by an amount equal to its pro-rata share of the advisory and administration fees paid by the Portfolio due to its investment in the Liquidity Funds. For the year ended December 31, 2016, advisory fees paid were reduced by approximately $25,000 relating to the Portfolio's investment in the Liquidity Funds.
A summary of the Portfolio's transactions in shares of the Liquidity Funds during the year ended December 31, 2016 is as follows:
Value
December 31,
2015
(000) | | Purchases
at Cost
(000) | | Sales
(000) | | Dividend
Income
(000) | | Value
December 31,
2016
(000) | |
| $ | 43,038 | | | $ | 195,277 | | | $ | 219,705 | | | $ | 61 | | | $ | 18,610 | | |
The Portfolio is permitted to purchase and sell securities ("cross-trade") from and to other Morgan Stanley Funds as well as other funds and client accounts for which the Adviser or an affiliate of the Adviser serves as investment adviser, pursuant to procedures approved by the Directors in compliance with Rule 17a-7 under the Act (the "Rule"). Each cross-trade is executed at the current market price in compliance with provisions of the Rule. For the year ended December 31, 2016, the Portfolio did not engage in any cross-trade transactions.
The Portfolio has an unfunded Deferred Compensation Plan (the "Compensation Plan"), which allows each independent Director to defer payment of all, or a portion, of the fees he or she receives for serving on the Board of Directors. Each eligible Director generally may elect to have the deferred amounts credited with a return equal to the total return on one or more of the Morgan Stanley funds that are offered as investment options under the Compensation Plan. Appreciation/depreciation and distributions received from these investments are recorded with an offsetting increase/decrease in the deferred compensation obligation and do not affect the NAV of the Portfolio.
H. Federal Income Taxes: It is the Portfolio's intention to continue to qualify as a regulated investment company and distribute all of its taxable and tax-exempt income. Accordingly, no provision for federal income taxes is required in the financial statements.
The Portfolio may be subject to taxes imposed by countries in which it invests. Such taxes are generally based on income and/or capital gains earned or repatriated. Taxes are accrued based on net investment income, net realized gains and net unrealized appreciation as such income and/or gains are earned. Taxes may also be based on transactions in foreign currency and are accrued based on the value of investments denominated in such currency.
FASB ASC 740-10, "Income Taxes — Overall", sets forth a minimum threshold for financial statement recognition of the benefit of a tax position taken or expected to be taken in a tax return. Management has concluded that there are no
28
Morgan Stanley Institutional Fund, Inc.
Annual Report — December 31, 2016
Notes to Financial Statements (cont'd)
significant uncertain tax positions that would require recognition in the financial statements. If applicable, the Portfolio recognizes interest accrued related to unrecognized tax benefits in "Interest Expense" and penalties in "Other Expenses" in the Statement of Operations. The Portfolio files tax returns with the U.S. Internal Revenue Service, New York and various states. Generally, each of the tax years in the four-year period ended December 31, 2016, remains subject to examination by taxing authorities.
The tax character of distributions paid may differ from the character of distributions shown in the Statements of Changes in Net Assets due to short-term capital gains being treated as ordinary income for tax purposes. The tax character of distributions paid during fiscal years 2016 and 2015 was as follows:
2016
Distributions
Paid From: | | 2015
Distributions
Paid From: | |
Ordinary
Income
(000) | | Long-Term
Capital Gain
(000) | | Ordinary
Income
(000) | | Long-Term
Capital Gain
(000) | |
| $ | 8,111 | | | $ | — | | | $ | 7,596 | | | $ | — | | |
The amount and character of income and gains to be distributed are determined in accordance with income tax regulations which may differ from GAAP. These book/tax differences are either considered temporary or permanent in nature.
Temporary differences are primarily due to differing book and tax treatments in the timing of the recognition of gains (losses) on certain investment transactions and the timing of the deductibility of certain expenses.
Permanent differences, primarily due to differing treatments of gains (losses) related to foreign currency transactions and basis adjustments on certain equity securities designated as passive foreign investment companies, resulted in the following reclassifications among the components of net assets at December 31, 2016:
Accumulated
Net Investment
Income
(000) | | Undistributed
Net Realized
Loss
(000) | | Accumulated
Paid-in-
Capital
(000) | |
| $ | 3,761 | | | $ | (3,761 | ) | | $ | — | | |
At December 31, 2016, the components of distributable earnings for the Portfolio on a tax basis were as follows:
Undistributed
Ordinary
Income
(000) | | Undistributed
Long-Term
Capital Gain
(000) | |
| $ | 1,134 | | | $ | — | | |
At December 31, 2016, the Portfolio had available for federal income tax purposes unused short-term capital losses of approximately $36,051,000 and long-term capital losses of approximately $40,574,000 that do not have an expiration date.
To the extent that capital loss carryforwards are used to offset any future capital gains realized, no capital gains tax liability will be incurred by the Portfolio for gains realized and not distributed. To the extent that capital gains are offset, such gains will not be distributed to the shareholders.
I. Credit Facility: As of April 4, 2016, the Fund and other Morgan Stanley funds participated in a $150,000,000 committed, unsecured revolving line of credit facility (the "facility") with State Street. This facility is to be used for temporary emergency purposes or funding of shareholder redemption requests. The interest rate on borrowings is based on the federal funds rate or one month libor rate plus a spread. The facility also has a commitment fee of 0.25% per annum based on the unused portion of the facility. During the year ended December 31, 2016, the Portfolio did not have any borrowings under the facility.
J. Other: At December 31, 2016, the Portfolio had record owners of 10% or greater. Investment activities of these shareholders could have a material impact on the Portfolio. The aggregate percentage of such owners was 60.1%.
K. Accounting Pronouncements: In December 2016, FASB issued Accounting Standards update 2016-19 — Technical Corrections and Improvements ("ASU 2016-19"), which is effective for interim periods for all entities beginning after December 15, 2016. ASU 2016-19 includes an amendment to Topic 820, Fair Value Measurement, which clarifies the difference between a valuation approach and a valuation technique when applying the guidance in that Topic. That amendment also requires an entity to disclose when there has been a change in either or both a valuation approach and/or a valuation technique. The transition guidance for the amendment must be applied prospectively because it could potentially involve the
29
Morgan Stanley Institutional Fund, Inc.
Annual Report — December 31, 2016
Notes to Financial Statements (cont'd)
use of hindsight that includes fair value measurements. Although still evaluating the potential impacts of ASU 2016-19 to the Portfolio, management expects that the impact of the Portfolio's adoption will be limited to additional financial statement disclosures.
In October 2016, the Securities and Exchange Commission ("SEC") issued a new rule, Investment Company Reporting Modernization, which, among other provisions, amends Regulation S-X to require standardized, enhanced disclosures, particularly related to derivatives, in investment company financial statements. Compliance with the guidance is effective for financial statements filed with the SEC on or after August 1, 2017; adoption will have no effect on the Portfolio's net assets or results of operations. Although still evaluating the potential impacts of the Investment Company Reporting Modernization to the Portfolio, management expects that the impact of the Portfolio's adoption will be limited to additional financial statement disclosures.
30
Morgan Stanley Institutional Fund, Inc.
Annual Report — December 31, 2016
Report of Independent Registered Public Accounting Firm
To the Shareholders and Board of Directors of
Morgan Stanley Institutional Fund, Inc. —
Emerging Markets Portfolio
We have audited the accompanying statement of assets and liabilities, including the portfolio of investments, of Emerging Markets Portfolio (one of the portfolios constituting Morgan Stanley Institutional Fund, Inc.) (the "Portfolio") as of December 31, 2016, and the related statement of operations for the year then ended, the statements of changes in net assets for each of the two years in the period then ended and the financial highlights for each of the years or periods indicated therein. These financial statements and financial highlights are the responsibility of the Portfolio's management. Our responsibility is to express an opinion on these financial statements and financial highlights based on our audits.
We conducted our audits in accordance with the standards of the Public Company Accounting Oversight Board (United States). Those standards require that we plan and perform the audit to obtain reasonable assurance about whether the financial statements and financial highlights are free of material misstatement. We were not engaged to perform an audit of the Portfolio's internal control over financial reporting. Our audits included consideration of internal control over financial reporting as a basis for designing audit procedures that are appropriate in the circumstances, but not for the purpose of expressing an opinion on the effectiveness of the Portfolio's internal control over financial reporting. Accordingly, we express no such opinion. An audit also includes examining, on a test basis, evidence supporting the amounts and disclosures in the financial statements and financial highlights, assessing the accounting principles used and significant estimates made by management, and evaluating the overall financial statement presentation. Our procedures included confirmation of securities owned as of December 31, 2016, by correspondence with the custodian and others or by other appropriate auditing procedures where replies from others were not received. We believe that our audits provide a reasonable basis for our opinion.
In our opinion, the financial statements and financial highlights referred to above present fairly, in all material respects, the financial position of Emerging Markets Portfolio (one of the portfolios constituting Morgan Stanley Institutional Fund, Inc.) at December 31, 2016, the results of its operations for the year then ended, the changes in its net assets for each of the two years in the period then ended and the financial highlights for each of the years or periods indicated therein, in conformity with U.S. generally accepted accounting principles.

Boston, Massachusetts
February 28, 2017
31
Morgan Stanley Institutional Fund, Inc.
Annual Report — December 31, 2016
Federal Tax Notice (unaudited)
For federal income tax purposes, the following information is furnished with respect to the distributions paid by the Portfolio during its taxable year ended December 31, 2016. For corporate shareholders, 1.1% of the dividends qualified for the dividends received deduction.
For federal income tax purposes, the following information is furnished with respect to the Portfolio's earnings for its taxable year ended December 31, 2016. When distributed, certain earnings may be subject to a maximum tax rate of 15% as provided for the Jobs and Growth Tax Relief Reconciliation Act of 2003. The Portfolio designated up to a maximum of approximately $10,377,000 as taxable at this lower rate.
The Portfolio intends to pass through foreign tax credits of approximately $2,266,000 and has derived net income from sources within foreign countries amounting to approximately $19,409,000.
In January, the Portfolio provides tax information to shareholders for the preceding calendar year.
32
Morgan Stanley Institutional Fund, Inc.
Annual Report — December 31, 2016
Privacy Notice (unaudited)
MORGAN STANLEY INVESTMENT MANAGEMENT INC.
AN IMPORTANT NOTICE CONCERNING OUR U.S. PRIVACY POLICY
We are required by federal law to provide you with a copy of our privacy policy annually. This policy applies to current and former individual investors in funds managed or sponsored by Morgan Stanley Investment Management Inc. ("MSIM") as well as current and former individual clients of MSIM. This policy is not applicable to partnerships, corporations, trusts or other non-individual clients or investors. Please note that we may amend this policy at any time, and will inform you of any changes as required by law.
WE RESPECT YOUR PRIVACY
We appreciate that you have provided us with your personal financial information. We strive to maintain the privacy of such information while we help you achieve your financial objectives. This Notice describes what non-public personal information we collect about you, why we collect it, when we may share it with others and how certain others may use it. It discusses the steps you may take to limit our sharing of certain information about you to affiliated companies in the Morgan Stanley family of companies ("other Morgan Stanley companies"). It also discloses how you may limit use of certain shared information for marketing purposes by other Morgan Stanley branded companies. Throughout this policy, we refer to the non-public information that personally identifies you or your accounts as "personal information."
1. WHAT PERSONAL INFORMATION DO WE COLLECT ABOUT YOU?
We obtain personal information from applications and other forms you submit to us, from your dealings with us, from consumer reporting agencies, from our Web sites and from third parties and other sources.
For example:
• We may collect information such as your name, address, e-mail address, telephone/fax numbers, assets, income and investment objectives through subscription documents, applications and other forms you submit to us.
• We may obtain information about account balances, your use of account(s) and the types of products and services you prefer to receive from us through your dealings and transactions with us and other sources.
• We may obtain information about your creditworthiness and credit history from consumer reporting agencies.
• We may collect background information from and through third-party vendors to verify representations you have made and to comply with various regulatory requirements.
• If you interact with us through our public and private Web sites, we may collect information that you provide directly through online communications (such as an e-mail address). We may also collect information about your Internet service provider, your domain name, your computer's operating system and Web browser, your use of our Web sites and your product and service preferences, through the use of "cookies." Please consult the Terms of Use of these sites for more details.
2. WHEN DO WE DISCLOSE PERSONAL INFORMATION WE COLLECT ABOUT YOU?
We may disclose personal information we collect about you to other Morgan Stanley companies and to non-affiliated third parties.
a. Information We Disclose to Other Morgan Stanley Companies.
We may disclose personal information to other Morgan Stanley companies for a variety of reasons, including to manage your account(s) effectively, to service and process your transactions, to let you know about products and services offered by us and other Morgan Stanley companies, to manage our business, and as otherwise required or permitted by law. Offers for products and services from other Morgan Stanley companies are developed under conditions designed to safeguard your personal information.
33
Morgan Stanley Institutional Fund, Inc.
Annual Report — December 31, 2016
Privacy Notice (unaudited) (cont'd)
b. Information We Disclose to Non-affiliated Third Parties.
We do not disclose personal information that we collect about you to non-affiliated third parties except to those who provide marketing services on our behalf, to financial institutions with whom we have joint marketing agreements, and as otherwise required or permitted by law. For example, we may disclose personal information to nonaffiliated third parties for servicing and processing transactions, to offer our own products and services, to protect against fraud, for institutional risk control, to respond to judicial process or to perform services on our behalf. When we share personal information with a non-affiliated third party, they are required to limit their use of personal information to the particular purpose for which it was shared and they are not allowed to share personal information with others except to fulfill that limited purpose or as may be permitted or required by law.
3. HOW DO WE PROTECT THE SECURITY AND CONFIDENTIALITY OF PERSONAL INFORMATION WE COLLECT ABOUT YOU?
We maintain physical, electronic and procedural security measures to help safeguard the personal information we collect about you. We have internal policies governing the proper handling of client information. Third parties that provide support or marketing services on our behalf may also receive personal information, and we require them to adhere to confidentiality standards with respect to such information.
4. HOW CAN YOU LIMIT THE SHARING OF CERTAIN TYPES OF PERSONAL INFORMATION WITH OTHER MORGAN STANLEY COMPANIES?
We offer you choices as to whether we share with other Morgan Stanley companies the personal information that was collected to determine your eligibility for products and services you request ("eligibility information"). Eligibility information does not include your identification information or personal information pertaining to our transactions or experiences with you. Please note that, even if you direct us not to share eligibility information with other Morgan Stanley companies ("opt-out"), we may still share personal information, including eligibility information, with those companies in circumstances excluded from the opt-out under applicable law, such as to process transactions or to service your account.
5. HOW CAN YOU LIMIT THE USE OF CERTAIN TYPES OF PERSONAL INFORMATION BY OTHER MORGAN STANLEY COMPANIES FOR MARKETING?
By following the opt-out instructions in Section 6 below, you may limit other Morgan Stanley branded companies from marketing their products or services to you based on personal information we disclose to them. This information may include, for example, your income and account history with us. Please note that, even if you choose to limit Other Morgan Stanley Companies from using personal information about you that we may share with them for marketing their products and services to you, Other Morgan Stanley Companies may use your personal information that they obtain from us to market to you in circumstances permitted by law, such as if the Other Morgan Stanley Company has its own relationship with you.
6. HOW CAN YOU SEND US AN OPT-OUT INSTRUCTION?
If you wish to limit our sharing of eligibility information about you with other Morgan Stanley companies or other Morgan Stanley companies' use of personal information for marketing purposes, as described in this notice, you may do so by:
• Calling us at (800) 548-7786
Monday–Friday between 8a.m. and 6p.m.(EST)
• Writing to us at the following address:
Boston Financial Data Services, Inc.
c/o Privacy Coordinator
P.O. Box 219804
Kansas City, Missouri 64121
34
Morgan Stanley Institutional Fund, Inc.
Annual Report — December 31, 2016
Privacy Notice (unaudited) (cont'd)
Your written request should include your name, address, telephone number and account number(s) to which the opt-out applies and whether you are opting out with respect to sharing of eligibility information (Section 4 above), or if information used for Marketing (Section 5 above) or both. Written opt-out requests should not be sent with any other correspondence. In order to process your request, we require that the request be provided by you directly and not through a third party.
Your opt-out preference will remain in effect with respect to this policy (as it may be amended) until you notify us otherwise. If you have a joint account, your direction for us not to share this information with other Morgan Stanley companies and for those other Morgan Stanley companies not to use your personal information for marketing will be applied to all account holders on that account. Please understand that if you limit our sharing or our affiliated companies' use of personal information, you and any joint account holder(s) may not receive information about Morgan Stanley products and services, including products or services that could help you manage your financial resources and achieve your investment objectives.
7. WHAT IF AN AFFILIATED COMPANY BECOMES A NON-AFFILIATED THIRD PARTY?
If, at any time in the future, an affiliated company becomes a non-affiliated third party, further disclosures of personal information made to the former affiliated company will be limited to those described in Section 2(b) above relating to non-affiliated third parties. If you elected under Section 6 to limit disclosures we make to affiliated companies, or use of personal information by affiliated companies, your election will not apply to use by any former affiliated company of your personal information in their possession once it becomes a non-affiliated third party.
SPECIAL NOTICE TO RESIDENTS OF VERMONT
The following section supplements our policy with respect to our individual clients who have a Vermont address and supersedes anything to the contrary in the above policy with respect to those clients only.
The state of Vermont requires financial institutions to obtain your consent prior to sharing personal information that they collect about you with affiliated companies and non-affiliated third parties other than in certain limited circumstances. Except as permitted by law, we will not share personal information we collect about you with non-affiliated third parties or other Morgan Stanley companies unless you provide us with your written consent to share such information ("opt-in").
If you wish to receive offers for investment products and services offered by or through other Morgan Stanley companies, please notify us in writing at the following address:
Boston Financial Data Services, Inc.
c/o Privacy Coordinator
P.O. Box 219804
Kansas City, Missouri 64121
Your authorization should include your name, address, telephone number and account number(s) to which the opt-in applies and should not be sent with any other correspondence. In order to process your authorization, we require that the authorization be provided by you directly and not through a third party.
SPECIAL NOTICE TO RESIDENTS OF CALIFORNIA
The following section supplements our policy with respect to our individual clients who have a California address and supersedes anything to the contrary in the above policy with respect to those clients only.
In response to a California law, if your account has a California home address, your personal information will not be disclosed to nonaffiliated third parties except as permitted by applicable California law, and we will limit sharing such information with our affiliates to comply with California privacy laws that apply to us.
35
Morgan Stanley Institutional Fund, Inc.
Annual Report — December 31, 2016
Director and Officer Information (unaudited)
Independent Directors:
Name, Age and Address of
Independent Director | | Position(s)
Held with
Registrant | | Length of Time
Served* | | Principal Occupation(s) During Past 5 Years
and Other Relevant Professional Experience | | Number of
Portfolios in
Fund Complex
Overseen by
Independent
Director** | | Other Directorships
Held by Independent
Director*** | |
Frank L. Bowman (72)
c/o Perkins Coie LLP
Counsel to the Independent
Directors
30 Rockefeller Plaza
New York, NY 10112 | | Director | | Since
August
2006 | | President, Strategic Decisions, LLC (consulting) (since February 2009); Director or Trustee of various Morgan Stanley Funds (since August 2006); Chairperson of the Compliance and Insurance Committee (since October 2015); formerly, Chairperson of the Insurance Sub-Committee of the Compliance and Insurance Committee (2007-2015); served as President and Chief Executive Officer of the Nuclear Energy Institute (policy organization) (February 2005-November 2008); retired as Admiral, U.S. Navy after serving over 38 years on active duty including 8 years as Director of the Naval Nuclear Propulsion Program in the Department of the Navy and the U.S. Department of Energy (1996-2004); served as Chief of Naval Personnel (July 1994-September 1996) and on the Joint Staff as Director of Political Military Affairs (June 1992-July 1994); knighted as Honorary Knight Commander of the Most Excellent Order of the British Empire; awarded the Officier de l'Orde National du Mérite by the French Government; elected to the National Academy of Engineering (2009). | | | 90 | | | Director of BP p.l.c.; Director of Naval and Nuclear Technologies LLP; Director Emeritus of the Armed Services YMCA; Director of the U.S. Naval Submarine League; Member of the National Security Advisory Council of the Center for U.S. Global Engagement and a member of the CNA Military Advisory Board; Chairman of the charity J Street Cup Golf; Trustee of Fairhaven United Methodist Church; and Director of other various non-profit organizations. | |
Kathleen A. Dennis (63)
c/o Perkins Coie LLP
Counsel to the Independent Directors
30 Rockefeller Plaza
New York, NY 10112 | | Director | | Since
August
2006 | | President, Cedarwood Associates (mutual fund and investment management consulting) (since July 2006); Chairperson of the Liquidity and Alternatives Sub-Committee of the Investment Committee (since October 2006) and Director or Trustee of various Morgan Stanley Funds (since August 2006); formerly, Senior Managing Director of Victory Capital Management (1993-2006). | | | 91 | | | Director of various non-profit organizations. | |
Nancy C. Everett (61)
c/o Perkins Coie LLP
Counsel to the Independent Directors
30 Rockefeller Plaza
New York, NY 10112 | | Director | | Since
January
2015 | | Chief Executive Officer, Virginia Commonwealth University Investment Company (since November 2015); Owner, OBIR, LLC (institutional investment management consulting) (since June 2014); formerly, Managing Director, BlackRock Inc. (February 2011-December 2013); and Chief Executive Officer, General Motors Asset Management (a/k/a Promark Global Advisors, Inc.) (June 2005-May 2010). | | | 91 | | | Member of Virginia Commonwealth University School of Business Foundation; formerly, Member of Virginia Commonwealth University Board of Visitors (2013-2015); Member of Committee on Directors for Emerging Markets Growth Fund, Inc. (2007-2010); Chairperson of Performance Equity Management, LLC (2006-2010); and Chairperson, GMAM Absolute Return Strategies Fund, LLC (2006-2010). | |
36
Morgan Stanley Institutional Fund, Inc.
Annual Report — December 31, 2016
Director and Officer Information (unaudited) (cont'd)
Independent Directors: (cont'd)
Name, Age and Address of
Independent Director | | Position(s)
Held with
Registrant | | Length of Time
Served* | | Principal Occupation(s) During Past 5 Years
and Other Relevant Professional Experience | | Number of
Portfolios in
Fund Complex
Overseen by
Independent
Director** | | Other Directorships
Held by Independent
Director*** | |
Jakki L. Haussler (59)
c/o Perkins Coie LLP
Counsel to the Independent Directors
30 Rockefeller Plaza
New York, NY 10112 | | Director | | Since
January
2015 | | Chairman and Chief Executive Officer, Opus Capital Group (since January 1996); formerly, Director, Capvest Venture Fund, LP (May 2000-December 2011); Partner, Adena Ventures, LP (July 1999-December 2010); Director, The Victory Funds (February 2005-July 2008). | | | 91 | | | Director of Cincinnati Bell Inc. and Member, Audit Committee and Compensation Committee; Director of Northern Kentucky University Foundation and Member, Investment Committee; Member of Chase College of Law Transactional Law Practice Center Board of Advisors; Director of Best Transport; Director of Chase College of Law Board of Visitors; formerly, Member, University of Cincinnati Foundation Investment Committee; Member, Miami University Board of Visitors (2008-2011); Trustee of Victory Funds (2005-2008) and Chairman, Investment Committee (2007-2008) and Member, Service Provider Committee (2005-2008). | |
Dr. Manuel H. Johnson (67)
c/o Johnson Smick
International, Inc.
220 I Street, N.E. — Suite 200
Washington, D.C. 20002 | | Director | | Since
July
1991 | | Senior Partner, Johnson Smick International, Inc. (consulting firm); Chairperson of the Investment Committee (since October 2006) and Director or Trustee of various Morgan Stanley Funds (since July 1991); Co-Chairman and a founder of the Group of Seven Council (G7C) (international economic commission); formerly, Chairperson of the Audit Committee (July 1991-September 2006), Vice Chairman of the Board of Governors of the Federal Reserve System and Assistant Secretary of the U.S. Treasury. | | | 91 | | | Director of NVR, Inc. (home construction). | |
Joseph J. Kearns (74)
c/o Kearns & Associates LLC
46 E Peninsula Center #385
Rolling Hills Estates, CA 90274-3712 | | Director | | Since
August
1994 | | President, Kearns & Associates LLC (investment consulting); Chairperson of the Audit Committee (since October 2006) and Director or Trustee of various Morgan Stanley Funds (since August 1994); formerly, Deputy Chairperson of the Audit Committee (July 2003-September 2006) and Chairperson of the Audit Committee of various Morgan Stanley Funds (since August 1994); CFO of the J. Paul Getty Trust. | | | 93 | | | Director of Electro Rent Corporation (equipment leasing). Prior to December 31, 2013, Director of The Ford Family Foundation. | |
37
Morgan Stanley Institutional Fund, Inc.
Annual Report — December 31, 2016
Director and Officer Information (unaudited) (cont'd)
Independent Directors: (cont'd)
Name, Age and Address of
Independent Director | | Position(s)
Held with
Registrant | | Length of Time
Served* | | Principal Occupation(s) During Past 5 Years
and Other Relevant Professional Experience | | Number of
Portfolios in
Fund Complex
Overseen by
Independent
Director** | | Other Directorships
Held by Independent
Director*** | |
Michael F. Klein (58)
c/o Perkins Coie LLP
Counsel to the Independent Directors
30 Rockefeller Plaza
New York, NY 10112 | | Director | | Since
August
2006 | | Managing Director, Aetos Capital, LLC (since March 2000); Co-President, Aetos Alternatives Management, LLC (since January 2004) and Co-Chief Executive Officer of Aetos Capital LLC (since August 2013); Chairperson of the Fixed Income Sub-Committee of the Investment Committee (since October 2006) and Director or Trustee of various Morgan Stanley Funds (since August 2006); formerly, Managing Director, Morgan Stanley & Co. Inc. and Morgan Stanley Dean Witter Investment Management, President, various Morgan Stanley Funds (June 1998-March 2000) and Principal, Morgan Stanley & Co. Inc. and Morgan Stanley Dean Witter Investment Management (August 1997-December 1999). | | | 90 | | | Director of certain investment funds managed or sponsored by Aetos Capital, LLC; Director of Sanitized AG and Sanitized Marketing AG (specialty chemicals). | |
Patricia Maleski (56)
c/o Perkins Coie LLP
Counsel to the Independent Directors
30 Rockefeller Plaza
New York, NY 10112 | | Director | | Since
January
2017 | | Management Director, JPMorgan Asset Management (2013-2016); President, JPMorgan Funds (2010-2013), Chief Administrative Officer, JPMorgan Funds (2004-2010), Treasurer, JPMorgan Funds (2003-2004, 2008-2010), and Vice President and Board Liaison, JPMorgan Funds (2001-2004); Managing Director, J.P. Morgan Investment Management Inc. (2001-2013); Vice President of Finance, Pierpont Group (1996-2001); Vice President, Bank of New York (1995-1996); Senior Audit Manager, Price Waterhouse, LLP (1982-1995). | | | 91 | | | None. | |
Michael E. Nugent (80)
522 Fifth Avenue
New York, NY 10036 | | Chair of the Board and Director | | Chair of the Boards since July 2006 and Director since July 1991 | | Chair of the Boards of various Morgan Stanley Funds (since July 2006); Chairperson of the Closed-End Fund Committee (since June 2012) and Director or Trustee of various Morgan Stanley Funds (since July 1991); formerly, Chairperson of the Insurance Committee (until July 2006); General Partner, Triumph Capital, L.P. (private investment partnership) (1988-2013). | | | 92 | | | None. | |
W. Allen Reed (69)
c/o Perkins Coie LLP
Counsel to the Independent Directors
30 Rockefeller Plaza
New York, NY 10112 | | Director | | Since
August
2006 | | Chairperson of the Equity Sub-Committee of the Investment Committee (since October 2006) and Director or Trustee of various Morgan Stanley Funds (since August 2006); formerly, President and CEO of General Motors Asset Management; Chairman and Chief Executive Officer of the GM Trust Bank and Corporate Vice President of General Motors Corporation (August 1994-December 2005). | | | 91 | | | Director of Legg Mason, Inc.; formerly, Director of the Auburn University Foundation (2010-2015). | |
Fergus Reid (84)
c/o Joe Pietryka, Inc.
85 Charles Colman Blvd.
Pawling, NY 12564 | | Director | | Since
June
1992 | | Chairman, Joe Pietryka, Inc.; Chairperson of the Governance Committee and Director or Trustee of various Morgan Stanley Funds (since June 1992). | | | 92 | | | Formerly, Trustee and Director of certain investment companies in the JP Morgan Fund Complex managed by JP Morgan Investment Management Inc. (1987-2012). | |
* This is the earliest date the Director began serving the Morgan Stanley Funds. Each Director serves an indefinite term, until his or her successor is elected.
** The Fund Complex includes (as of December 31, 2016) all open-end and closed-end funds (including all of their portfolios) advised by Morgan Stanley Investment Management Inc. (the "Adviser") and any funds that have an adviser that is an affiliated person of the Adviser (including, but not limited to, Morgan Stanley AIP GP LP).
*** This includes any directorships at public companies and registered investment companies held by the Director at any time during the past five years.
38
Morgan Stanley Institutional Fund, Inc.
Annual Report — December 31, 2016
Director and Officer Information (unaudited) (cont'd)
Executive Officers:
Name, Age and Address of Executive Officer | | Position(s) Held
with
Registrant | | Length of Time
Served* | | Principal Occupation(s) During Past 5 Years | |
John H. Gernon (53)
522 Fifth Avenue
New York, NY 10036 | | President and Principal Executive Officer | | Since
September
2013 | | President and Principal Executive Officer of the Equity and Fixed Income Funds and the Morgan Stanley AIP Funds (since September 2013) and the Liquidity Funds and various money market funds (since May 2014) in the Fund Complex; Managing Director of the Adviser; Head of Product (since 2006). | |
Timothy J. Knierim (58)
522 Fifth Avenue
New York, NY 10036 | | Chief Compliance Officer | | Since
December
2016 | | Managing Director of the Adviser and various entities affiliated with the Adviser; Chief Compliance Officer of various Morgan Stanley Funds and the Adviser (since December 2016) and Chief Compliance Officer of Morgan Stanley AIP GP LP (since 2014). Formerly, Managing Director and Deputy Chief Compliance Officer of the Adviser (2014-2016); and formerly, Chief Compliance Officer of Prudential Investment Management, Inc. (2007-2014). | |
Francis J. Smith (51)
522 Fifth Avenue
New York, NY 10036 | | Treasurer and Principal Financial Officer | | Treasurer since July 2003 and Principal Financial Officer since September 2002 | | Managing Director of the Adviser and various entities affiliated with the Adviser; Treasurer (since July 2003) and Principal Financial Officer of various Morgan Stanley Funds (since September 2002). | |
Mary E. Mullin (49)
522 Fifth Avenue
New York, NY 10036 | | Secretary | | Since
June
1999 | | Executive Director of the Adviser; Secretary of various Morgan Stanley Funds (since June 1999). | |
* This is the earliest date the officer began serving the Morgan Stanley Funds. Each officer serves a one-year term, until his or her successor is elected and qualifies.
39
Morgan Stanley Institutional Fund, Inc.
Annual Report — December 31, 2016
Adviser and Administrator
Morgan Stanley Investment Management Inc.
522 Fifth Avenue
New York, New York 10036
Sub-Adviser
Morgan Stanley Investment Management Company
23 Church Street
16-01 Capital Square, Singapore 049481
Distributor
Morgan Stanley Distribution, Inc.
522 Fifth Avenue
New York, New York 10036
Dividend Disbursing and Transfer Agent
Boston Financial Data Services, Inc.
2000 Crown Colony Drive
Quincy, Massachusetts 02169
Custodian
State Street Bank and Trust Company
One Lincoln Street
Boston, Massachusetts 02111
Legal Counsel
Dechert LLP
1095 Avenue of the Americas
New York, New York 10036
Counsel to the Independent Directors
Perkins Coie LLP
30 Rockefeller Plaza
New York, New York 10112
Independent Registered Public Accounting Firm
Ernst & Young LLP
200 Clarendon Street
Boston, Massachusetts 02116
Reporting to Shareholders
Each Morgan Stanley fund provides a complete schedule of portfolio holdings in its semi-annual and annual reports within 60 days of the end of the fund's second and fourth fiscal quarters. The semi-annual and annual reports are filed electronically with the Securities and Exchange Commission (SEC) on Form N-CSRS and Form N-CSR, respectively. Morgan Stanley also delivers the semi-annual and annual reports to fund shareholders and makes these reports available on its public website, www.morganstanley.com/im. Each Morgan Stanley fund also files a complete schedule of portfolio holdings with the SEC for the fund's first and third fiscal quarters on Form N-Q. Morgan Stanley does not deliver the reports for the first and third fiscal quarters to shareholders, nor are the reports posted to the Morgan Stanley public website. You may, however, obtain the Form N-Q filings (as well as the Form N-CSR and N-CSRS filings) by accessing the SEC's website, www.sec.gov. You may also review and copy them at the SEC's Public Reference Room in Washington, DC. Information on the operation of the SEC's Public Reference Room may be obtained by calling the SEC toll free at 1 (800) SEC-0330. You can also request copies of these materials, upon payment of a duplicating fee, by electronic request at the SEC's email address (publicinfo@sec.gov) or by writing the Public Reference Room of the SEC, 100 F Street, NE, Washington, DC 20549-0102.
Proxy Voting Policies and Procedures and Proxy Voting Record
You may obtain a copy of the Fund's Proxy Voting Policy and Procedures and information regarding how the Fund voted proxies relating to portfolio securities during the most recent twelve-month period ended June 30, without charge, upon request, by calling toll free 1 (800) 548-7786 or by visiting our website at www.morganstanley.com/im. This information is also available on the SEC's website at www.sec.gov.
This report is authorized for distribution only when preceded or accompanied by a prospectus or summary prospectus of the applicable Portfolio of Morgan Stanley Institutional Fund, Inc., which describes in detail the Portfolio's investment policies, risks, fees and expenses. Please read the prospectus carefully before you invest or send money. For additional information, including information regarding the investments comprising the Portfolio, please visit our website at www.morganstanley.com/im or call toll free 1 (800) 548-7786.
40
(This Page has been left blank intentionally.)
Printed in U.S.A.
This Report has been prepared for shareholders and may be distributed to others only if preceded or accompanied by a current prospectus.
Morgan Stanley Investment Management Inc.
522 Fifth Avenue
New York, New York 10036
© 2017 Morgan Stanley. Morgan Stanley Distribution, Inc.

IFIEMANN
1698572 EXP. 02.28.18

Morgan Stanley Institutional Fund, Inc.
Emerging Markets Small Cap Portfolio
Annual Report
December 31, 2016

Morgan Stanley Institutional Fund, Inc.
Annual Report — December 31, 2016
Shareholders' Letter | | | 2 | | |
Expense Example | | | 3 | | |
Investment Overview | | | 4 | | |
Portfolio of Investments | | | 7 | | |
Statement of Assets and Liabilities | | | 9 | | |
Statement of Operations | | | 11 | | |
Statements of Changes in Net Assets | | | 12 | | |
Financial Highlights | | | 13 | | |
Notes to Financial Statements | | | 17 | | |
Report of Independent Registered Public Accounting Firm | | | 25 | | |
Federal Tax Notice | | | 26 | | |
Privacy Notice | | | 27 | | |
Director and Officer Information | | | 30 | | |
This report is authorized for distribution only when preceded or accompanied by a prospectus or summary prospectus of the applicable Portfolio of Morgan Stanley Institutional Fund, Inc. To receive a prospectus and/or statement of additional information (SAI), which contains more complete information such as investment objectives, charges, expenses, policies for voting proxies, risk considerations, and describes in detail each of the Portfolio's investment policies to the prospective investor, please call toll free 1 (800) 548-7786. Please read the prospectuses carefully before you invest or send money.
Additionally, you can access information about the Portfolio, including performance, characteristics, and investment team commentary, through Morgan Stanley Investment Management's website: www.morganstanley.com/im.
Market forecasts provided in this report may not necessarily come to pass. There is no guarantee that any sectors mentioned will continue to perform as discussed herein or that securities in such sectors will be held by the Portfolio in the future. There is no assurance that a Portfolio will achieve its investment objective. Portfolios are subject to market risk, which is the possibility that market values of securities owned by the Portfolio will decline and, therefore, the value of the Portfolio's shares may be less than what you paid for them. Accordingly, you can lose money investing in this Portfolio. Please see the prospectus for more complete information on investment risks.
1
Morgan Stanley Institutional Fund, Inc.
Annual Report — December 31, 2016
Shareholders' Letter (unaudited)
Dear Shareholders,
We are pleased to provide this Annual report, in which you will learn how your investment in Emerging Markets Small Cap Portfolio (the "Portfolio") performed during the latest twelve-month period.
Morgan Stanley Investment Management is a client-centric, investor-led organization. Our global presence, intellectual capital, and breadth of products and services enable us to partner with investors to meet the evolving challenges of today's financial markets. We aim to deliver superior investment service and to empower our clients to make the informed decisions that help them reach their investment goals.
As always, we thank you for selecting Morgan Stanley Investment Management, and look forward to working with you in the months and years ahead.
Sincerely,

John H. Gernon
President and Principal Executive Officer
January 2017
2
Morgan Stanley Institutional Fund, Inc.
Annual Report — December 31, 2016
Expense Example (unaudited)
Emerging Markets Small Cap Portfolio
As a shareholder of the Portfolio, you incur two types of costs: (1) transactional costs, including redemption fees; and (2) ongoing costs, which may include advisory fees, administration fees, distribution and shareholder services fees and other Portfolio expenses. This example is intended to help you understand your ongoing costs (in dollars) of investing in the Portfolio and to compare these costs with the ongoing costs of investing in other mutual funds.
This example is based on an investment of $1,000 invested at the beginning of the six-month period ended December 31, 2016 and held for the entire six-month period.
Actual Expenses
The table below provides information about actual account values and actual expenses. You may use the information in this table, together with the amount you invested, to estimate the expenses that you paid over the period. Simply divide your account value by $1,000 (for example, an $8,600 account value divided by $1,000 = 8.6), then multiply the result by the number in the table under the heading entitled "Actual Expenses Paid During Period" to estimate the expenses you paid on your account during this period.
Hypothetical Example for Comparison Purposes
The table below provides information about hypothetical account values and hypothetical expenses based on the Portfolio's actual expense ratio and an assumed rate of return of 5% per year before expenses, which is not the Portfolio's actual return. The hypothetical account values and expenses may not be used to estimate the actual ending account balance or expenses you paid for the period. You may use this information to compare the ongoing costs of investing in the Portfolio and other funds. To do so, compare this 5% hypothetical example with the 5% hypothetical examples that appear in the shareholder reports of the other funds.
Please note that the expenses shown in the table are meant to highlight your ongoing costs only and do not reflect any transactional costs, such as sales charges (loads) and redemption fees. Therefore, the information for each class in the table is useful in comparing ongoing costs only, and will not help you determine the relative total costs of owning different funds. In addition, if these transactional costs were included, your costs would have been higher.
| | | Beginning
Account
Value
7/1/16 | | Actual Ending
Account
Value
12/31/16 | | Hypothetical
Ending Account
Value | | Actual
Expenses
Paid
During
Period* | | Hypothetical
Expenses Paid
During Period* | | Net
Expense
Ratio
During
Period** | |
Emerging Markets Small Cap Portfolio Class I | | $ | 1,000.00 | | | $ | 933.60 | | | $ | 1,017.04 | | | $ | 7.83 | | | $ | 8.16 | | | | 1.61 | % | |
Emerging Markets Small Cap Portfolio Class A | | | 1,000.00 | | | | 931.60 | | | | 1,015.13 | | | | 9.66 | | | | 10.08 | | | | 1.99 | | |
Emerging Markets Small Cap Portfolio Class C | | | 1,000.00 | | | | 929.20 | | | | 1,011.31 | | | | 13.34 | | | | 13.90 | | | | 2.75 | | |
Emerging Markets Small Cap Portfolio Class IS | | | 1,000.00 | | | | 933.70 | | | | 1,017.09 | | | | 7.78 | | | | 8.11 | | | | 1.60 | | |
* Expenses are calculated using each Portfolio Class' annualized net expense ratio (as disclosed), multiplied by the average account value over the period, and multiplied by 184/366 (to reflect the most recent one-half year period).
** Annualized.
3
Morgan Stanley Institutional Fund, Inc.
Annual Report — December 31, 2016
Investment Overview (unaudited)
Emerging Markets Small Cap Portfolio
The Portfolio seeks long-term capital appreciation.
Performance
For the year ended December 31, 2016 the Portfolio's Class I shares had a total return based on net asset value and reinvestment of distributions per share of -3.19%, net of fees. The Portfolio's Class I shares underperformed the Portfolio's benchmark, MSCI Emerging Markets Small Cap Net Index (the "Index"), which returned 2.28%.
Factors Affecting Performance
• Emerging markets ("EM") small-cap equities underperformed the broad emerging markets in 2016, with the Index returning +2.28% versus the MSCI Emerging Markets Index returning +11.19%.(i) The underperformance of the MSCI Emerging Markets Small Cap Index is largely attributable to three main factors. Firstly, large liquid asset classes performed better in 2016 from an asset allocation standpoint. Secondly, value outperformed growth in 2016, which on a country level was Brazil and Russia, which make up close to 12% of the MSCI Emerging Market Index, versus 4.5% of the MSCI Emerging Markets Small Cap Index. On a sector basis, value represented energy and financials, which make up 32% of the MSCI Emerging Markets Index versus 10% for the MSCI Emerging Markets Small Cap Index. Lastly, specifically within the MSCI Emerging Markets Small Cap Index, Korea makes up 17% of the Index and MSCI Korea Large Cap Index outperformed MSCI Korea Small Cap Index by 25% due to regulatory changes regarding small-cap exposure of external managers running National Pension Fund assets, which caused large selling pressure through the year for the small cap space in Korea.
• Positive contributors to the Portfolio's performance during the period included our stock selection in and an overweight allocation to Brazil and our overweight allocation to Pakistan. Stock selection in and an overweight allocation to Thailand also contributed, as did overweight allocations to Bangladesh, Romania and Poland. The Portfolio's underweight allocation to Malaysia also benefited results.
• Key detractors from performance included the Portfolio's stock selection in and underweight allocation to Taiwan. While overweight allocations to Indonesia and the Philippines added to results, stock selection in these markets offset any gains. Stock selection in China, India and South Africa also hampered returns, as did stock selection in and an overweight allocation to Egypt.
• From a sector perspective, stock selection in consumer staples and health care contributed to returns, but were slightly offset by overweight allocations to the two sectors. Stock selection in financials also added to the Portfolio's performance. Detracting from returns were our stock selection in information technology and an underweight allocation to materials. Stock selection in utilities and consumer discretionary hurt performance, along with our overweight allocation to the latter.
Management Strategies
• In a world facing lower economic growth from a combination of demographic pressure, lower trade volumes and a huge increase in debt, we own what we call a "post-China world" portfolio, seeking those pockets of growth in countries where we believe domestic consumer demand is strong and credit growth is in healthy early stages.
• The outlook for emerging markets overall finally began improving in 2016 after five previously disappointing years which had been marked in large part by downward revisions to economic output. The election of Donald Trump — while not predicted by most polls — was consistent with the unfolding story of deglobalization and anti-incumbent sentiment among voters in many countries both developed and emerging.
• From a thematic perspective, we continue to own and seek companies benefiting from healthy domestic demand and the growth of the aging population, where demand is high for health care, consumer experiences and services including travel and leisure activities. We also see demand for financial services in countries with low credit penetration. We are seeking to minimize our exposure to countries highly dependent on trade
(i) Source: FactSet and Morgan Stanley Investment Management
4
Morgan Stanley Institutional Fund, Inc.
Annual Report — December 31, 2016
Investment Overview (unaudited) (cont'd)
Emerging Markets Small Cap Portfolio
and where credit growth has greatly exceeded the pace of economic growth over the past five years. With global trade declining, as protectionism is becoming more politically appealing and geopolitical tension rising in such areas as the South China Sea and the Middle East, we are also focused on identifying innovative companies benefiting from domestic infrastructure projects and defense spending.
• We remain positive on Brazil given improving political and economic momentum in the country. President Temer's government has pushed forward with fiscal spending and pension reform, which could improve the country's debt sustainability. Consumer and business confidence has improved sharply, as the deep recession of last three years is finally fading and growth expectations improve. Inflation expectations are falling sharply, paving the way for the central bank to cut interest rates, which could be another support for growth to improve.
• Growth in Pakistan continues to pick up with strong consumer demand and increasing investment, although exports are weak. Fiscal consolidation has brought the deficit down from 8% to 4.5%. The International Monetary Fund program was completed in September so there remains some risk of fiscal slippage. While the current account deficit is -1.0%(ii) of gross domestic product and is well-financed by foreign direct investment, risks are emerging with remittances and exports. The currency has remained relatively stable against the dollar, while strong foreign direct investment and loan flows have allowed the central bank to increase reserves.
• As we have for many years, we remain underweight China and countries with decelerating growth or heavy dependence on exports such as Russia, Taiwan and Korea in the Portfolio. Debt levels in China continue to rise to unprecedented levels and ongoing overcapacity issues, and the continued property downturn will likely lead to further weakness in industrial production and related investment.
• We believe there may be an economic recovery in Russia in 2017, though we think any recovery will
be likely muted and still prone to any unexpected weakness in oil prices. More broadly, political stagnation and demographic decline continue to weigh on an economy in need of structural reform and private investment to raise its potential growth rate. Presidential elections are coming in 2018, and prospects for reform seem limited before the election. Within the market, we continue to like select names for their growth opportunities. In particular, we see opportunities for even a limited growth recovery to boost existing secular trends in the internet stocks. We also see several opportunities for market share gains in sectors that were winnowed by the past recession, where the stronger players have become stronger and are benefiting from ongoing consolidation.
(ii) Source: International Monetary Fund
5
Morgan Stanley Institutional Fund, Inc.
Annual Report — December 31, 2016
Investment Overview (unaudited) (cont'd)
Emerging Markets Small Cap Portfolio

* Minimum Investment for Class I shares
** Commenced Operations on December 15, 2015.
In accordance with SEC regulations, the Portfolio's performance shown assumes that all recurring fees (including management fees) were deducted and all dividends and distributions were reinvested. The performance of Class A, C and IS shares will vary from the performance of Class I shares and will be impacted by additional fees assessed to those classes (if applicable).
Performance Compared to the MSCI Emerging Markets Small Cap Net Index(1) and the Lipper Emerging Markets Funds Index(2)
| | | Period Ended December 31, 2016
Total Returns(3) | |
| | | | | Average Annual | |
| | | One
Year | | Five
Years | | Ten
Years | | Since
Inception(5) | |
Portfolio — Class I Shares
w/o sales charges(4) | | | –3.19 | % | | | — | | | | — | | | | –0.46 | % | |
Portfolio — Class A Shares
w/o sales charges(4) | | | –3.58 | | | | — | | | | — | | | | –0.84 | | |
Portfolio — Class A Shares with
maximum 5.25% sales charges(4) | | | –8.65 | | | | — | | | | — | | | | –5.80 | | |
Portfolio — Class C Shares
w/o sales charges(4) | | | –4.28 | | | | — | | | | — | | | | –1.53 | | |
Portfolio — Class C Shares with
maximum 1.00% deferred
sales charges(4) | | | –5.24 | | | | — | | | | — | | | | –1.53 | | |
Portfolio — Class IS Shares
w/o sales charges(4) | | | –3.18 | | | | — | | | | — | | | | –0.45 | | |
MSCI Emerging Markets Small
Cap Net Index | | | 2.28 | | | | — | | | | — | | | | 6.63 | | |
Lipper Emerging Markets Funds
Index | | | 12.10 | | | | — | | | | — | | | | 12.81 | | |
Performance data quoted represents past performance, which is no guarantee of future results, and current performance may be lower or higher than the figures shown. Performance assumes that all dividends and distributions, if any, were reinvested. For the most recent month-end performance figures, please visit www.morganstanley.com/im. Investment return and principal value will fluctuate so that Portfolio shares, when redeemed, may be worth more or less than their original cost. Total returns do not reflect the deduction of taxes that a shareholder would pay on Portfolio distributions or the redemption of Portfolio shares. Performance of share classes will vary due to difference in expenses.
(1) The MSCI Emerging Markets Small Cap Net Index is a free float-adjusted market capitalization weighted index that is designed to measure small cap equity market performance of emerging markets. The term "free float" represents the portion of shares outstanding that are deemed to be available for purchase in the public equity markets by investors. The performance of the Index is listed in U.S. dollars and assumes reinvestment of net dividends. The Index is unmanaged and its returns do not include any sales charges or fees. Such costs would lower performance. It is not possible to invest directly in an index.
(2 The Lipper Emerging Markets Funds Index is an equally weighted performance index of the largest qualifying funds (based on net assets) in the Lipper Emerging Markets Funds classification. The Index, which is adjusted for capital gains distributions and income dividends, is unmanaged and should not be considered an investment. There are currently 30 funds represented in this Index. As of the date of this report, the Portfolio is in the Lipper Emerging Markets Funds classification.
(3) Total returns for the Portfolio reflect fees waived and expenses reimbursed, if applicable, by the Adviser. Without such waivers and reimbursements, total returns would have been lower.
(4) Commenced operations on December 15, 2015.
(5) For comparative purposes, average annual since inception returns listed for the Indexes refer to the inception date of the Portfolio, not the inception of the Index.
6
Morgan Stanley Institutional Fund, Inc.
Annual Report — December 31, 2016
Portfolio of Investments
Emerging Markets Small Cap Portfolio
| | | Shares | | Value
(000) | |
Common Stocks (85.6%) | |
Argentina (2.5%) | |
Banco Macro SA ADR | | | 4,597 | | | $ | 296 | | |
Pampa Energia SA ADR (a) | | | 5,875 | | | | 204 | | |
| | | | 500 | | |
Bangladesh (2.3%) | |
Brac Bank Ltd. | | | 236,195 | | | | 193 | | |
Olympic Industries Ltd. | | | 66,956 | | | | 262 | | |
| | | | 455 | | |
Brazil (5.2%) | |
Adecoagro SA (a) | | | 20,420 | | | | 212 | | |
Raia Drogasil SA | | | 22,966 | | | | 432 | | |
Ser Educacional SA (b) | | | 66,716 | | | | 382 | | |
| | | | 1,026 | | |
China (14.8%) | |
51job, Inc. ADR (a) | | | 9,023 | | | | 305 | | |
Bitauto Holdings Ltd. ADR (a) | | | 12,800 | | | | 243 | | |
Canvest Environmental Protection Group
Co., Ltd. (c)(d) | | | 1,023,000 | | | | 505 | | |
Dawnrays Pharmaceutical Holdings Ltd. (d) | | | 388,000 | | | | 233 | | |
TAL Education Group ADR (a) | | | 8,700 | | | | 610 | | |
Tarena International, Inc. ADR | | | 29,072 | | | | 436 | | |
Yestar International Holdings Co., Ltd. (d) | | | 1,195,000 | | | | 579 | | |
| | | | 2,911 | | |
Egypt (2.9%) | |
Credit Agricole Egypt SAE | | | 124,259 | | | | 252 | | |
Egyptian Financial Group-Hermes Holding Co. (a) | | | 223,458 | | | | 312 | | |
| | | | 564 | | |
Indonesia (3.6%) | |
Mitra Keluarga Karyasehat Tbk PT | | | 1,575,600 | | | | 300 | | |
Sumber Alfaria Trijaya Tbk PT | | | 8,637,400 | | | | 401 | | |
| | | | 701 | | |
Kenya (1.4%) | |
East African Breweries Ltd. | | | 111,000 | | | | 269 | | |
Korea, Republic of (15.6%) | |
Boryung Pharmaceutical Co., Ltd. | | | 9,177 | | | | 471 | | |
Fila Korea Ltd. | | | 4,434 | | | | 259 | | |
Hanwha Techwin Co., Ltd. | | | 9,521 | | | | 343 | | |
Hugel, Inc. (a) | | | 1,485 | | | | 395 | | |
Hyundai Development Co-Engineering &
Construction | | | 9,280 | | | | 345 | | |
Korea Kolmar Co. Ltd. | | | 4,618 | | | | 252 | | |
LIG Nex1 Co., Ltd. | | | 3,126 | | | | 208 | | |
Loen Entertainment, Inc. (a) | | | 7,817 | | | | 491 | | |
Nasmedia Co., Ltd. | | | 9,325 | | | | 305 | | |
| | | | 3,069 | | |
Mexico (4.9%) | |
Alsea SAB de CV | | | 64,586 | | | | 184 | | |
Banregio Grupo Financiero SAB de CV | | | 92,951 | | | | 518 | | |
Grupo Aeroportuario del Centro Norte SAB de CV | | | 59,673 | | | | 257 | | |
| | | | 959 | | |
| | | Shares | | Value
(000) | |
Pakistan (5.3%) | |
Habib Bank Ltd. | | | 171,400 | | | $ | 447 | | |
Honda Atlas Cars Pakistan Ltd. | | | 32,800 | | | | 210 | | |
Maple Leaf Cement Factory Ltd. | | | 320,000 | | | | 390 | | |
| | | | 1,047 | | |
Philippines (3.4%) | |
Megawide Construction Corp. (a) | | | 992,200 | | | | 295 | | |
Security Bank Corp. | | | 49,510 | | | | 189 | | |
Xurpas, Inc. | | | 1,192,300 | | | | 192 | | |
| | | | 676 | | |
Poland (2.2%) | |
CCC SA | | | 4,902 | | | | 238 | | |
LPP SA | | | 148 | | | | 201 | | |
| | | | 439 | | |
Romania (2.9%) | |
Banca Transilvania SA | | | 509,306 | | | | 282 | | |
BRD-Groupe Societe Generale SA | | | 105,652 | | | | 291 | | |
| | | | 573 | | |
South Africa (5.1%) | |
AVI Ltd. | | | 65,014 | | | | 433 | | |
EOH Holdings Ltd. | | | 22,595 | | | | 269 | | |
Famous Brands Ltd. | | | 26,504 | | | | 302 | | |
| | | | 1,004 | | |
Taiwan (9.8%) | |
Bon Fame Co. Ltd. | | | 63,000 | | | | 299 | | |
Cub Elecparts, Inc. | | | 40,191 | | | | 314 | | |
Gourmet Master Co., Ltd. | | | 51,200 | | | | 389 | | |
Grape King Bio Ltd. | | | 52,000 | | | | 302 | | |
PChome Online, Inc. | | | 33,142 | | | | 291 | | |
Poya International Co., Ltd. | | | 29,200 | | | | 338 | | |
| | | | 1,933 | | |
Thailand (3.7%) | |
Mega Lifesciences PCL (Foreign) | | | 384,600 | | | | 271 | | |
Robinson Department Store PCL (Foreign) | | | 118,300 | | | | 210 | | |
Sino-Thai Engineering & Construction PCL
(Foreign) | | | 326,400 | | | | 253 | | |
| | | | 734 | | |
Total Common Stocks (Cost $16,137) | | | 16,860 | | |
Participation Note (1.7%) | |
Vietnam (1.7%) | |
Bank for Foreign Trade of Vietnam JSC,
Equity Linked Notes, expires 12/17/18 (a)
(Cost $317) | | | 219,496 | | | | 342 | | |
Investment Companies (9.6%) | |
India (5.1%) | |
iShares MSCI India Small-Cap ETF | | | 31,173 | | | | 1,019 | | |
United States (4.5%) | |
Morgan Stanley India Investment Fund, Inc.
(See Note G) | | | 34,400 | | | | 881 | | |
Total Investment Companies (Cost $1,893) | | | 1,900 | | |
The accompanying notes are an integral part of the financial statements.
7
Morgan Stanley Institutional Fund, Inc.
Annual Report — December 31, 2016
Portfolio of Investments (cont'd)
Emerging Markets Small Cap Portfolio
| | | Shares | | Value
(000) | |
Short-Term Investment (3.6%) | |
Investment Company (3.6%) | |
Morgan Stanley Institutional Liquidity Funds —
Government Portfolio — Institutional Class
(See Note G) (Cost $700) | | | 699,903 | | | $ | 700 | | |
Total Investments (100.5%) (Cost $19,047)
Including $1 of Securities Loaned (e) | | | 19,802 | | |
Liabilities in Excess of Other Assets (–0.5%) | | | (99 | ) | |
Net Assets (100.0%) | | $ | 19,703 | | |
Country assignments and aggregations are based generally on third party vendor classifications and information, and may be different from the assignments and aggregations under the policies set forth in the Portfolio's prospectus and/or statement of additional information relating to geographic classifications.
(a) Non-income producing security.
(b) 144A security — Certain conditions for public sale may exist. Unless otherwise noted, these securities are deemed to be liquid.
(c) All or a portion of this security was on loan at December 31, 2016.
(d) Security trades on the Hong Kong exchange.
(e) At December 31, 2016, the aggregate cost for federal income tax purposes is approximately $19,047,000. The aggregate gross unrealized appreciation is approximately $2,101,000 and the aggregate gross unrealized depreciation is approximately $1,346,000 resulting in net unrealized appreciation of approximately $755,000.
ADR American Depositary Receipt.
ETF Exchange Traded Fund.
Portfolio Composition
Classification | | Percentage of
Total Investments | |
Other* | | | 68.4 | % | |
Banks | | | 14.2 | | |
Diversified Consumer Services | | | 7.2 | | |
Wireless Telecommunication Services | | | 5.2 | | |
Textiles, Apparel & Luxury Goods | | | 5.0 | | |
Total Investments | | | 100.0 | % | |
* Industries and/or investment types representing less than 5% of total investments.
The accompanying notes are an integral part of the financial statements.
8
Morgan Stanley Institutional Fund, Inc.
Annual Report — December 31, 2016
Emerging Markets Small Cap Portfolio
Statement of Assets and Liabilities | | December 31, 2016
(000) | |
Assets: | |
Investments in Securities of Unaffiliated Issuers, at Value(1) (Cost $17,488) | | $ | 18,221 | | |
Investments in Securities of Affiliated Issuers, at Value (Cost $1,559) | | | 1,581 | | |
Total Investments in Securities, at Value (Cost $19,047) | | | 19,802 | | |
Foreign Currency, at Value (Cost $17) | | | 16 | | |
Dividends Receivable | | | 5 | | |
Tax Reclaim Receivable | | | — | @ | |
Receivable from Affiliate | | | — | @ | |
Other Assets | | | 37 | | |
Total Assets | | | 19,860 | | |
Liabilities: | |
Deferred Capital Gain Country Tax | | | 53 | | |
Payable for Advisory Fees | | | 49 | | |
Payable for Professional Fees | | | 37 | | |
Payable for Custodian Fees | | | 8 | | |
Payable for Administration Fees | | | 1 | | |
Payable for Transfer Agency Fees — Class I | | | — | @ | |
Payable for Transfer Agency Fees — Class A | | | — | @ | |
Payable for Transfer Agency Fees — Class C | | | — | @ | |
Payable for Shareholder Services Fees — Class A | | | — | @ | |
Payable for Distribution and Shareholder Services Fees — Class C | | | — | @ | |
Other Liabilities | | | 9 | | |
Total Liabilities | | | 157 | | |
Net Assets | | $ | 19,703 | | |
Net Assets Consist Of: | |
Paid-in-Capital | | $ | 19,976 | | |
Distributions in Excess of Net Investment Income | | | (148 | ) | |
Accumulated Net Realized Loss | | | (827 | ) | |
Unrealized Appreciation (Depreciation) on: | |
Investments (Net of $53 of Deferred Capital Gain Country Tax) | | | 680 | | |
Investments in Affiliates | | | 22 | | |
Foreign Currency Translations | | | (— | @) | |
Net Assets | | $ | 19,703 | | |
The accompanying notes are an integral part of the financial statements.
9
Morgan Stanley Institutional Fund, Inc.
Annual Report — December 31, 2016
Emerging Markets Small Cap Portfolio
Statement of Assets and Liabilities (cont'd) | | December 31, 2016
(000) | |
CLASS I: | |
Net Assets | | $ | 19,673 | | |
| Shares Outstanding $0.001 par value shares of beneficial interest (unlimited shares authorized) (not in 000's) | | | 1,997,000 | | |
Net Asset Value, Offering and Redemption Price Per Share | | $ | 9.85 | | |
CLASS A: | |
Net Assets | | $ | 10 | | |
| Shares Outstanding $0.001 par value shares of beneficial interest (unlimited shares authorized) (not in 000's) | | | 1,000 | | |
Net Asset Value, Redemption Price Per Share | | $ | 9.85 | | |
Maximum Sales Load | | | 5.25 | % | |
Maximum Sales Charge | | $ | 0.55 | | |
Maximum Offering Price Per Share | | $ | 10.40 | | |
CLASS C: | |
Net Assets | | $ | 10 | | |
| Shares Outstanding $0.001 par value shares of beneficial interest (unlimited shares authorized) (not in 000's) | | | 1,000 | | |
Net Asset Value, Offering and Redemption Price Per Share | | $ | 9.84 | | |
CLASS IS: | |
Net Assets | | $ | 10 | | |
| Shares Outstanding $0.001 par value shares of beneficial interest (unlimited shares authorized) (not in 000's) | | | 1,000 | | |
Net Asset Value, Offering and Redemption Price Per Share | | $ | 9.85 | | |
(1) Including:
Securities on Loan, at Value: | | $ | 1 | | |
@ Amount is less than $500.
The accompanying notes are an integral part of the financial statements.
10
Morgan Stanley Institutional Fund, Inc.
Annual Report — December 31, 2016
Emerging Markets Small Cap Portfolio
Statement of Operations | | Year Ended
December 31, 2016
(000) | |
Investment Income: | |
Dividends from Securities of Unaffiliated Issuers (Net of $42 of Foreign Taxes Withheld) | | $ | 341 | | |
Income from Securities Loaned — Net | | | 25 | | |
Dividends from Securities of Affiliated Issuer (Note G) | | | 1 | | |
Total Investment Income | | | 367 | | |
Expenses: | |
Advisory Fees (Note B) | | | 260 | | |
Offering Costs | | | 119 | | |
Professional Fees | | | 89 | | |
Custodian Fees (Note F) | | | 20 | | |
Administration Fees (Note C) | | | 17 | | |
Registration Fees | | | 12 | | |
Transfer Agency Fees — Class I (Note E) | | | 2 | | |
Transfer Agency Fees — Class A (Note E) | | | 2 | | |
Transfer Agency Fees — Class C (Note E) | | | 2 | | |
Transfer Agency Fees — Class IS (Note E) | | | 2 | | |
Shareholder Reporting Fees | | | 7 | | |
Pricing Fees | | | 5 | | |
Directors' Fees and Expenses | | | 2 | | |
Shareholder Services Fees — Class A (Note D) | | | — | @ | |
Distribution and Shareholder Services Fees — Class C (Note D) | | | — | @ | |
Other Expenses | | | 16 | | |
Total Expenses | | | 555 | | |
Waiver of Advisory Fees (Note B) | | | (213 | ) | |
Reimbursement of Class Specific Expenses — Class A (Note B) | | | (2 | ) | |
Reimbursement of Class Specific Expenses — Class C (Note B) | | | (2 | ) | |
Reimbursement of Class Specific Expenses — Class IS (Note B) | | | (2 | ) | |
Rebate from Morgan Stanley Affiliate (Note G) | | | (1 | ) | |
Net Expenses | | | 335 | | |
Net Investment Income | | | 32 | | |
Realized Loss: | |
Investments Sold | | | (801 | ) | |
Foreign Currency Transactions | | | (20 | ) | |
Net Realized Loss | | | (821 | ) | |
Change in Unrealized Appreciation (Depreciation): | |
Investments (Net of Increase in Deferred Capital Gain Country Tax of $53) | | | 105 | | |
Investments in Affiliates | | | 22 | | |
Foreign Currency Translations | | | (— | @) | |
Net Change in Unrealized Appreciation (Depreciation) | | | 127 | | |
Net Realized Loss and Change in Unrealized Appreciation (Depreciation) | | | (694 | ) | |
Net Decrease in Net Assets Resulting from Operations | | $ | (662 | ) | |
@ Amount is less than $500.
The accompanying notes are an integral part of the financial statements.
11
Morgan Stanley Institutional Fund, Inc.
Annual Report — December 31, 2016
Emerging Markets Small Cap Portfolio
Statements of Changes in Net Assets | | Year Ended
December 31, 2016
(000) | | Period from
December 15, 2015^ to
December 31, 2015
(000) | |
Increase (Decrease) in Net Assets: | |
Operations: | |
Net Investment Income | | $ | 32 | | | $ | 9 | | |
Net Realized Loss | | | (821 | ) | | | (18 | ) | |
Net Change in Unrealized Appreciation (Depreciation) | | | 127 | | | | 575 | | |
Net Increase (Decrease) in Net Assets Resulting from Operations | | | (662 | ) | | | 566 | | |
Distributions from and/or in Excess of: | |
Class I: | |
Net Investment Income | | | (201 | ) | | | — | | |
Class A: | |
Net Investment Income | | | (— | @) | | | — | | |
Class IS: | |
Net Investment Income | | | (— | @) | | | — | | |
Total Distributions | | | (201 | ) | | | — | | |
Capital Share Transactions:(1) | |
Class I: | |
Subscribed | | | — | | | | 19,970 | | |
Class A: | |
Subscribed | | | — | | | | 10 | | |
Class C: | |
Subscribed | | | — | | | | 10 | | |
Class IS: | |
Subscribed | | | — | | | | 10 | | |
Net Increase in Net Assets Resulting from Capital Share Transactions | | | — | | | | 20,000 | | |
Total Increase (Decrease) in Net Assets | | | (863 | ) | | | 20,566 | | |
Net Assets: | |
Beginning of Period | | | 20,566 | | | | — | | |
End of Period (Including Distributions in Excess of Net Investment Income and Accumulated Net
Investment Loss of $(148) and $(7), respectively) | | $ | 19,703 | | | $ | 20,566 | | |
(1) Capital Share Transactions: | |
Class I: | |
Shares Subscribed | | | — | | | | 1,997 | | |
Class A: | |
Shares Subscribed | | | — | | | | 1 | | |
Class C: | |
Shares Subscribed | | | — | | | | 1 | | |
Class IS: | |
Shares Subscribed | | | — | | | | 1 | | |
^ Commencement of Operations.
@ Amount is less than $500.
The accompanying notes are an integral part of the financial statements.
12
Morgan Stanley Institutional Fund, Inc.
Annual Report — December 31, 2016
Financial Highlights
Emerging Markets Small Cap Portfolio
| | | Class I | |
Selected Per Share Data and Ratios | | Year Ended
December 31, 2016 | | Period from
December 15, 2015(1) to
December 31, 2015 | |
Net Asset Value, Beginning of Period | | $ | 10.28 | | | $ | 10.00 | | |
Income (Loss) from Investment Operations: | |
Net Investment Income (2) | | | 0.02 | | | | 0.01 | | |
Net Realized and Unrealized Gain (Loss) | | | (0.35 | ) | | | 0.27 | | |
Total from Investment Operations | | | (0.33 | ) | | | 0.28 | | |
Distributions from and/or in Excess of: | |
Net Investment Income | | | (0.10 | ) | | | — | | |
Net Asset Value, End of Period | | $ | 9.85 | | | $ | 10.28 | | |
Total Return (3) | | | (3.19 | )% | | | 2.80 | %(6) | |
Ratios and Supplemental Data: | |
Net Assets, End of Period (Thousands) | | $ | 19,673 | | | $ | 20,536 | | |
Ratio of Expenses to Average Net Assets (8) | | | 1.61 | %(4) | | | 1.58 | %(4)(7) | |
Ratio of Net Investment Income to Average Net Assets (8) | | | 0.16 | %(4) | | | 1.01 | %(4)(7) | |
Ratio of Rebate from Morgan Stanley Affiliates to Average Net Assets | | | 0.00 | %(5) | | | 0.03 | %(7) | |
Portfolio Turnover Rate | | | 69 | % | | | 5 | %(6) | |
(8) Supplemental Information on the Ratios to Average Net Assets: | |
Ratios Before Expense Limitation: | |
Expenses to Average Net Assets | | | 2.63 | % | | | 7.62 | %(7) | |
Net Investment Loss to Average Net Assets | | | (0.86 | )% | | | (5.03 | )%(7) | |
(1) Commencement of Operations.
(2) Per share amount is based on average shares outstanding.
(3) Calculated based on the net asset value as of the last business day of the period.
(4) The Ratios of Expenses and Net Investment Income reflect the rebate of certain Portfolio expenses in connection with the investments in Morgan Stanley affiliates during the period. The effect of the rebate on the ratios is disclosed in the above table as "Ratio of Rebate from Morgan Stanley Affiliates to Average Net Assets."
(5) Amount is less than 0.005%.
(6) Not Annualized.
(7) Annualized.
The accompanying notes are an integral part of the financial statements.
13
Morgan Stanley Institutional Fund, Inc.
Annual Report — December 31, 2016
Financial Highlights
Emerging Markets Small Cap Portfolio
| | | Class A | |
Selected Per Share Data and Ratios | | Year Ended
December 31, 2016 | | Period from
December 15, 2015(1) to
December 31, 2015 | |
Net Asset Value, Beginning of Period | | $ | 10.28 | | | $ | 10.00 | | |
Income (Loss) from Investment Operations: | |
Net Investment Income (Loss) (2) | | | (0.02 | ) | | | 0.00 | (3) | |
Net Realized and Unrealized Gain (Loss) | | | (0.35 | ) | | | 0.28 | | |
Total from Investment Operations | | | (0.37 | ) | | | 0.28 | | |
Distributions from and/or in Excess of: | |
Net Investment Income | | | (0.06 | ) | | | — | | |
Net Asset Value, End of Period | | $ | 9.85 | | | $ | 10.28 | | |
Total Return (4) | | | (3.58 | )% | | | 2.80 | %(7) | |
Ratios and Supplemental Data: | |
Net Assets, End of Period (Thousands) | | $ | 10 | | | $ | 10 | | |
Ratio of Expenses to Average Net Assets (9) | | | 2.00 | %(5) | | | 1.97 | %(5)(8) | |
Ratio of Net Investment Income (Loss) to Average Net Assets (9) | | | (0.22 | )%(5) | | | 0.62 | %(5)(8) | |
Ratio of Rebate from Morgan Stanley Affiliates to Average Net Assets | | | 0.00 | %(6) | | | 0.03 | %(8) | |
Portfolio Turnover Rate | | | 69 | % | | | 5 | %(6) | |
(9) Supplemental Information on the Ratios to Average Net Assets: | |
Ratios Before Expense Limitation: | |
Expenses to Average Net Assets | | | 22.65 | % | | | 21.45 | %(8) | |
Net Investment Loss to Average Net Assets | | | (20.87 | )% | | | (18.86 | )%(8) | |
(1) Commencement of Operations.
(2) Per share amount is based on average shares outstanding.
(3) Amount is less than $0.005 per share.
(4) Calculated based on the net asset value which does not reflect sales charges, if applicable, as of the last business day of the period.
(5) The Ratios of Expenses and Net Investment Income (Loss) reflect the rebate of certain Portfolio expenses in connection with the investments in Morgan Stanley affiliates during the period. The effect of the rebate on the ratios is disclosed in the above table as "Ratio of Rebate from Morgan Stanley Affiliates to Average Net Assets."
(6) Amount is less than 0.005%.
(7) Not Annualized.
(8) Annualized.
The accompanying notes are an integral part of the financial statements.
14
Morgan Stanley Institutional Fund, Inc.
Annual Report — December 31, 2016
Financial Highlights
Emerging Markets Small Cap Portfolio
| | | Class C | |
Selected Per Share Data and Ratios | | Year Ended
December 31, 2016 | | Period from
December 15, 2015(1) to
December 31, 2015 | |
Net Asset Value, Beginning of Period | | $ | 10.28 | | | $ | 10.00 | | |
Income (Loss) from Investment Operations: | |
Net Investment Loss (2) | | | (0.10 | ) | | | (0.00 | )(3) | |
Net Realized and Unrealized Gain (Loss) | | | (0.34 | ) | | | 0.28 | | |
Total from Investment Operations | | | (0.44 | ) | | | 0.28 | | |
Net Asset Value, End of Period | | $ | 9.84 | | | $ | 10.28 | | |
Total Return (4) | | | (4.28 | )% | | | 2.80 | %(7) | |
Ratios and Supplemental Data: | |
Net Assets, End of Period (Thousands) | | $ | 10 | | | $ | 10 | | |
Ratio of Expenses to Average Net Assets (9) | | | 2.75 | %(5) | | | 2.73 | %(5)(8) | |
Ratio of Net Investment Loss to Average Net Assets (9) | | | (0.99 | )%(5) | | | (0.14 | )%(5)(8) | |
Ratio of Rebate from Morgan Stanley Affiliates to Average Net Assets | | | 0.00 | %(6) | | | 0.02 | %(8) | |
Portfolio Turnover Rate | | | 69 | % | | | 5 | %(6) | |
(9) Supplemental Information on the Ratios to Average Net Assets: | |
Ratios Before Expense Limitation: | |
Expense to Average Net Assets | | | 23.48 | % | | | 22.20 | %(8) | |
Net Investment Loss to Average Net Assets | | | (21.72 | )% | | | (19.61 | )%(8) | |
(1) Commencement of Operations.
(2) Per share amount is based on average shares outstanding.
(3) Amount is less than $0.005 per share.
(4) Calculated based on the net asset value which does not reflect sales charges, if applicable, as of the last business day of the period.
(5) The Ratios of Expenses and Net Investment Loss reflect the rebate of certain Portfolio expenses in connection with the investments in Morgan Stanley affiliates during the period. The effect of the rebate on the ratios is disclosed in the above table as "Ratio of Rebate from Morgan Stanley Affiliates to Average Net Assets."
(6) Amount is less than 0.005%.
(7) Not Annualized.
(8) Annualized.
The accompanying notes are an integral part of the financial statements.
15
Morgan Stanley Institutional Fund, Inc.
Annual Report — December 31, 2016
Financial Highlights
Emerging Markets Small Cap Portfolio
| | | Class IS | |
Selected Per Share Data and Ratios | | Year Ended
December 31, 2016 | | Period from
December 15, 2015(1) to
December 31, 2015 | |
Net Asset Value, Beginning of Period | | $ | 10.28 | | | $ | 10.00 | | |
Income (Loss) from Investment Operations: | |
Net Investment Income (2) | | | 0.02 | | | | 0.01 | | |
Net Realized and Unrealized Gain (Loss) | | | (0.35 | ) | | | 0.27 | | |
Total from Investment Operations | | | (0.33 | ) | | | 0.28 | | |
Distributions from and/or in Excess of: | |
Net Investment Income | | | (0.10 | ) | | | — | | |
Net Asset Value, End of Period | | $ | 9.85 | | | $ | 10.28 | | |
Total Return (3) | | | (3.18 | )% | | | 2.80 | %(6) | |
Ratios and Supplemental Data: | |
Net Assets, End of Period (Thousands) | | $ | 10 | | | $ | 10 | | |
Ratio of Expenses to Average Net Assets (8) | | | 1.60 | %(4) | | | 1.58 | %(4)(7) | |
Ratio of Net Investment Income to Average Net Assets (8) | | | 0.16 | %(4) | | | 1.01 | %(4)(7) | |
Ratio of Rebate from Morgan Stanley Affiliates to Average Net Assets | | | 0.00 | %(5) | | | 0.02 | %(7) | |
Portfolio Turnover Rate | | | 69 | % | | | 5 | %(6) | |
(8) Supplemental Information on the Ratios to Average Net Assets: | |
Ratios Before Expense Limitation: | |
Expenses to Average Net Assets | | | 21.37 | % | | | 21.20 | %(7) | |
Net Investment Loss to Average Net Assets | | | (19.61 | )% | | | (18.61 | )%(7) | |
(1) Commencement of Operations.
(2) Per share amount is based on average shares outstanding.
(3) Calculated based on the net asset value as of the last business day of the period.
(4) The Ratios of Expenses and Net Investment Income reflect the rebate of certain Portfolio expenses in connection with the investments in Morgan Stanley affiliates during the period. The effect of the rebate on the ratios is disclosed in the above table as "Ratio of Rebate from Morgan Stanley Affiliates to Average Net Assets."
(5) Amount is less than 0.005%.
(6) Not Annualized.
(7) Annualized.
The accompanying notes are an integral part of the financial statements.
16
Morgan Stanley Institutional Fund, Inc.
Annual Report — December 31, 2016
Notes to Financial Statements
Morgan Stanley Institutional Fund, Inc. (the "Fund") is registered under the Investment Company Act of 1940, as amended (the "Act"), as an open-end management investment company. The Fund is comprised of twenty-nine separate, active, diversified and non-diversified portfolios (individually referred to as a "Portfolio", collectively as the "Portfolios"). The Fund applies investment company accounting and reporting guidance.
The accompanying financial statements relate to the Emerging Markets Small Cap Portfolio. The Portfolio seeks long-term capital appreciation.
The Portfolio offers four classes of shares — Class I, Class A, Class C and Class IS.
A. Significant Accounting Policies: The following significant accounting policies are in conformity with U.S. generally accepted accounting principles ("GAAP"). Such policies are consistently followed by the Fund in the preparation of its financial statements. GAAP may require management to make estimates and assumptions that affect the reported amounts and disclosures in the financial statements. Actual results may differ from those estimates.
1. Security Valuation: (1) An equity portfolio security listed or traded on an exchange is valued at its latest reported sales price (or at the exchange official closing price if such exchange reports an official closing price), and if there were no sales on a given day and if there is no official exchange closing price for that day, the security is valued at the mean between the last reported bid and asked prices if such bid and asked prices are available on the relevant exchanges; (2) all other equity portfolio securities for which over-the-counter ("OTC") market quotations are readily available are valued at the latest reported sales price (or at the market official closing price if such market reports an official closing price), and if there was no trading in the security on a given day and if there is no official closing price from relevant markets for that day, the security is valued at the mean between the last reported bid and asked prices if such bid and asked prices are available on the relevant markets. Listed equity securities not traded on the valuation date with no reported bid and asked prices available on the exchange are valued at the mean between the current bid and asked prices obtained from one or more reputable brokers or dealers. An unlisted equity security that does not trade on the valuation date and for which bid and asked prices from the relevant markets are
unavailable is valued at the mean between the current bid and asked prices obtained from one or more reputable brokers or dealers. In cases where a security is traded on more than one exchange, the security is valued on the exchange designated as the primary market; (3) certain portfolio securities may be valued by an outside pricing service/vendor approved by the Fund's Board of Directors (the "Directors"). The pricing service/vendor may employ a pricing model that takes into account, among other things, bids, yield spreads, and/or other market data and specific security characteristics. Alternatively, if a valuation is not available from an outside pricing service/vendor, and the security trades on an exchange, the security may be valued at its latest reported sale price (or at the exchange official closing price if such exchange reports an official closing price), prior to the time when assets are valued. If there are no sales on a given day and if there is no official exchange closing price for that day, the security is valued at the mean between the last reported bid and asked prices if such bid and asked prices are available in the relevant exchanges; (4) when market quotations are not readily available, including circumstances under which the Adviser determines that the closing price, last sale price or the mean between the last reported bid and asked prices are not reflective of a security's market value, portfolio securities are valued at their fair value as determined in good faith under procedures established by and under the general supervision of the Directors. Occasionally, developments affecting the closing prices of securities and other assets may occur between the times at which valuations of such securities are determined (that is, close of the foreign market on which the securities trade) and the close of business of the New York Stock Exchange ("NYSE"). If developments occur during such periods that are expected to materially affect the value of such securities, such valuations may be adjusted to reflect the estimated fair value of such securities as of the close of the NYSE, as determined in good faith by the Directors or by the Adviser using a pricing service and/or procedures approved by the Directors; (5) quotations of foreign portfolio securities, other assets and liabilities and forward contracts stated in foreign currency are translated into U.S. dollar equivalents at the prevailing market rates prior to the close of the NYSE; and (6) investments in mutual funds, including the Morgan Stanley Institutional Liquidity Funds, are valued at the net asset value ("NAV") as of the close of each business day.
17
Morgan Stanley Institutional Fund, Inc.
Annual Report — December 31, 2016
Notes to Financial Statements (cont'd)
The Directors have responsibility for determining in good faith the fair value of the investments, and the Directors may appoint others, such as the Fund's Adviser or a valuation committee, to assist the Directors in determining fair value and to make the actual calculations pursuant to the fair valuation methodologies previously approved by the Directors. Under procedures approved by the Directors, the Fund's Adviser has formed a Valuation Committee whose members are approved by the Directors. The Valuation Committee provides administration and oversight of the Fund's valuation policies and procedures, which are reviewed at least annually by the Directors. These procedures allow the Fund to utilize independent pricing services, quotations from securities and financial instrument dealers, and other market sources to determine fair value.
The Fund has procedures to determine the fair value of securities and other financial instruments for which market prices are not readily available. Under these procedures, the Valuation Committee convenes on a regular and ad hoc basis to review such securities and considers a number of factors, including valuation methodologies and significant unobservable valuation inputs, when arriving at fair value. The Valuation Committee may employ a market-based approach which may use related or comparable assets or liabilities, recent transactions, market multiples, book values, and other relevant information for the investment to determine the fair value of the investment. An income-based valuation approach may also be used in which the anticipated future cash flows of the investment are discounted to calculate fair value. Discounts may also be applied due to the nature or duration of any restrictions on the disposition of the investments. Due to the inherent uncertainty of valuations of such investments, the fair values may differ significantly from the values that would have been used had an active market existed. The Valuation Committee employs various methods for calibrating these valuation approaches including a regular review of valuation methodologies, key inputs and assumptions, transactional back-testing or disposition analysis, and reviews of any related market activity.
2. Fair Value Measurement: Financial Accounting Standards Board ("FASB") Accounting Standards
CodificationTM ("ASC") 820, "Fair Value Measurement" ("ASC 820"), defines fair value as the value that the Fund would receive to sell an investment or pay to transfer a liability in a timely transaction with an independent buyer in the principal market, or in the absence of a principal market, the most advantageous market for the investment or liability. ASC 820 establishes a three-tier hierarchy to distinguish between (1) inputs that reflect the assumptions market participants would use in valuing an asset or liability developed based on market data obtained from sources independent of the reporting entity (observable inputs) and (2) inputs that reflect the reporting entity's own assumptions about the assumptions market participants would use in valuing an asset or liability developed based on the best information available in the circumstances (unobservable inputs) and to establish classification of fair value measurements for disclosure purposes. Various inputs are used in determining the value of the Fund's investments. The inputs are summarized in the three broad levels listed below.
• Level 1 – unadjusted quoted prices in active markets for identical investments
• Level 2 – other significant observable inputs (including quoted prices for similar investments, interest rates, prepayment speeds, credit risk, etc.)
• Level 3 – significant unobservable inputs including the Fund's own assumptions in determining the fair value of investments. Factors considered in making this determination may include, but are not limited to, information obtained by contacting the issuer, analysts, or the appropriate stock exchange (for exchange-traded securities), analysis of the issuer's financial statements or other available documents and, if necessary, available information concerning other securities in similar circumstances
The inputs or methodology used for valuing securities are not necessarily an indication of the risk associated with investing in those securities and the determination of the significance of a particular input to the fair value measurement in its entirety requires judgment and considers factors specific to each security.
18
Morgan Stanley Institutional Fund, Inc.
Annual Report — December 31, 2016
Notes to Financial Statements (cont'd)
The following is a summary of the inputs used to value the Portfolio's investments as of December 31, 2016.
Investment Type | | Level 1
Unadjusted
quoted
prices
(000) | | Level 2
Other
significant
observable
inputs
(000) | | Level 3
Significant
unobservable
inputs
(000) | | Total
(000) | |
Assets: | |
Common Stocks | |
Aerospace & Defense | | $ | 551 | | | $ | — | | | $ | — | | | $ | 551 | | |
Auto Components | | | 314 | | | | — | | | | — | | | | 314 | | |
Automobiles | | | 210 | | | | — | | | | — | | | | 210 | | |
Banks | | | 2,468 | | | | — | | | | — | | | | 2,468 | | |
Beverages | | | 269 | | | | — | | | | — | | | | 269 | | |
Biotechnology | | | 395 | | | | — | | | | — | | | | 395 | | |
Capital Markets | | | 312 | | | | — | | | | — | | | | 312 | | |
Commercial Services &
Supplies | | | 579 | | | | — | | | | — | | | | 579 | | |
Construction &
Engineering | | | 345 | | | | 253 | | | | — | | | | 598 | | |
Construction Materials | | | 390 | | | | — | | | | — | | | | 390 | | |
Diversified Consumer
Services | | | 1,428 | | | | — | | | | — | | | | 1,428 | | |
Electric Utilities | | | 204 | | | | — | | | | — | | | | 204 | | |
Food & Staples Retailing | | | 833 | | | | — | | | | — | | | | 833 | | |
Food Products | | | 907 | | | | — | | | | — | | | | 907 | | |
Health Care Providers &
Services | | | 300 | | | | — | | | | — | | | | 300 | | |
Hotels, Restaurants &
Leisure | | | 875 | | | | — | | | | — | | | | 875 | | |
Household Durables | | | 295 | | | | — | | | | — | | | | 295 | | |
Independent Power and
Renewable Electricity
Producers | | | 505 | | �� | | — | | | | — | | | | 505 | | |
Information Technology
Services | | | 269 | | | | — | | | | — | | | | 269 | | |
Internet Software &
Services | | | 534 | | | | — | | | | — | | | | 534 | | |
Media | | | 796 | | | | — | | | | — | | | | 796 | | |
Multi-line Retail | | | 338 | | | | 210 | | | | — | | | | 548 | | |
Personal Products | | | 554 | | | | — | | | | — | | | | 554 | | |
Pharmaceuticals | | | 704 | | | | 271 | | | | — | | | | 975 | | |
Professional Services | | | 305 | | | | — | | | | — | | | | 305 | | |
Software | | | 192 | | | | — | | | | — | | | | 192 | | |
Textiles, Apparel &
Luxury Goods | | | 997 | | | | — | | | | — | | | | 997 | | |
Transportation
Infrastructure | | | 257 | | | | — | | | | — | | | | 257 | | |
Total Common Stocks | | | 16,126 | | | | 734 | | | | — | | | | 16,860 | | |
Participation Note | | | — | | | | 342 | | | | — | | | | 342 | | |
Investment Companies | | | 1,900 | | | | — | | | | — | | | | 1,900 | | |
Short-Term Investment | |
Investment Company | | | 700 | | | | — | | | | — | | | | 700 | | |
Total Assets | | $ | 18,726 | | | $ | 1,076 | | | $ | — | | | $ | 19,802 | | |
Transfers between investment levels may occur as the markets fluctuate and/or the availability of data used in an investment's valuation changes. The Portfolio recognizes transfers between the levels as of the end of the period. As of December 31, 2016, securities with a total value of approximately $6,744,000 transferred from Level 2 to
Level 1. Securities that were valued using other significant observable inputs at December 31, 2015 were valued using unadjusted quoted prices at December 31, 2016. At December 31, 2015, the fair value of certain securities were adjusted due to developments which occurred between the time of the close of the foreign markets on which they trade and the close of business on the NYSE which resulted in their Level 2 classification.
3. Foreign Currency Translation and Foreign Investments: The books and records of the Portfolio are maintained in U.S. dollars. Foreign currency amounts are translated into U.S. dollars as follows:
– investments, other assets and liabilities at the prevailing rate of exchange on the valuation date;
– investment transactions and investment income at the prevailing rates of exchange on the dates of such transactions.
Although the net assets of the Portfolio are presented at the foreign exchange rates and market values at the close of the period, the Portfolio does not isolate that portion of the results of operations arising as a result of changes in the foreign exchange rates from the fluctuations arising from changes in the market prices of securities held at period end. Similarly, the Portfolio does not isolate the effect of changes in foreign exchange rates from the fluctuations arising from changes in the market prices of securities sold during the period. Accordingly, realized and unrealized foreign currency gains (losses) on investments in securities are included in the reported net realized and unrealized gains (losses) on investment transactions and balances. However, pursuant to U.S. federal income tax regulations, gains and losses from certain foreign currency transactions and the foreign currency portion of gains and losses realized on sales and maturities of foreign denominated debt securities are treated as ordinary income for U.S. federal income tax purposes.
Net realized gains (losses) on foreign currency transactions represent net foreign exchange gains (losses) from foreign currency forward exchange contracts, disposition of foreign currencies, currency gains (losses) realized between the trade and settlement dates on securities transactions, and the difference between the amount of investment income and foreign withholding taxes recorded on the Portfolio's books and the U.S. dollar
19
Morgan Stanley Institutional Fund, Inc.
Annual Report — December 31, 2016
Notes to Financial Statements (cont'd)
equivalent amounts actually received or paid. Net unrealized currency gains (losses) from valuing foreign currency denominated assets and liabilities at period end exchange rates are reflected as a component of unrealized appreciation (depreciation) in the Statement of Assets and Liabilities. The change in unrealized currency gains (losses) on foreign currency translations for the period is reflected in the Statement of Operations.
A significant portion of the Portfolio's net assets consist of securities of issuers located in emerging markets, which are denominated in foreign currencies. Such securities may be concentrated in a limited number of countries and regions and may vary throughout the year. Changes in currency exchange rates will affect the value of and investment income from foreign currency denominated securities. Emerging market securities are often subject to greater price volatility, limited capitalization and liquidity, and higher rates of inflation than securities of companies based in the U.S. In addition, emerging market issuers may be subject to substantial governmental involvement in the economy and greater social, economic and political uncertainty.
Governmental approval for foreign investments may be required in advance of making an investment under certain circumstances in some countries, and the extent of foreign investments in domestic companies may be subject to limitation in other countries. Foreign ownership limitations also may be imposed by the charters of individual companies to prevent, among other concerns, violations of foreign investment limitations. As a result, an additional class of shares (identified as "Foreign" in the Portfolio of Investments) may be created and offered for investment. The "local" and "foreign shares" market values may differ. In the absence of trading of the foreign shares in such markets, the Portfolio values the foreign shares at the closing exchange price of the local shares.
4. Structured Investments: The Portfolio invested a portion of its assets in structured investments. A structured investment is a derivative security designed to offer a return linked to a particular underlying security, currency, commodity or market. Structured investments may come in various forms including notes (such as exchange-traded notes), warrants and options to purchase securities. The Portfolio will typically use structured investments to gain
exposure to a permitted underlying security, currency, commodity or market when direct access to a market is limited or inefficient from a tax or cost standpoint. There can be no assurance that structured investments will trade at the same price or have the same value as the underlying security, currency, commodity or market. Investments in structured investments involve risks including issuer risk, counterparty risk and market risk. Holders of structured investments bear risks of the underlying investment and are subject to issuer or counterparty risk because the Portfolio is relying on the creditworthiness of such issuer or counterparty and has no rights with respect to the underlying investment. Certain structured investments may be thinly traded or have a limited trading market and may have the effect of increasing the Portfolio's illiquidity to the extent that the Portfolio, at a particular time, may be unable to find qualified buyers for these securities.
5. Securities Lending: The Portfolio lends securities to qualified financial institutions, such as broker-dealers, to earn additional income. Any increase or decrease in the fair value of the securities loaned that might occur and any interest earned or dividends declared on those securities during the term of the loan would remain in the Portfolio. The Portfolio would receive cash or securities as collateral in an amount equal to or exceeding 100% of the current fair value of the loaned securities. The collateral is marked-to-market daily by State Street Bank and Trust Company ("State Street"), the securities lending agent, to ensure that a minimum of 100% collateral coverage is maintained.
Based on pre-established guidelines, the securities lending agent invests any cash collateral that is received in an affiliated money market portfolio and repurchase agreements. Securities lending income is generated from the earnings on the invested collateral and borrowing fees, less any rebates owed to the borrowers and compensation to the lending agent, and is recorded as "Income from Securities Loaned — Net" in the Portfolio's Statement of Operations. Risks in securities lending transactions are that a borrower may not provide additional collateral when required or return the securities when due, and that the value of the short-term investments will be less than the amount of cash collateral plus any rebate that is required to be returned to the borrower.
The Portfolio has the right under the lending agreement to recover the securities from the borrower on demand.
20
Morgan Stanley Institutional Fund, Inc.
Annual Report — December 31, 2016
Notes to Financial Statements (cont'd)
The following table presents financial instruments that are subject to enforceable netting arrangements as of December 31, 2016.
Gross Amounts Not Offset in the Statement of Assets and Liabilities | |
Gross Asset
Amounts
Presented in
Statement of
Assets and
Liabilities
(000) | | Financial
Instrument
(000) | | Collateral
Received
(000) | | Net
Amount
(not less
than $0)
(000) | |
| $ | 1 | (a) | | $ | — | | | $ | (1 | )(b) | | $ | 0 | | |
(a) Represents market value of loaned securities at period end.
(b) The Portfolio received non-cash collateral of approximately $1,000 in the form of U.S. Government obligations, which the Portfolio cannot sell or repledge, and accordingly are not reflected in the Portfolio of Investments.
6. Redemption Fees: The Portfolio will assess a 2% redemption fee, on Class I shares, Class A shares, Class C shares and Class IS shares, which is paid directly to the Portfolio, for shares redeemed or exchanged within thirty days of purchase, subject to certain exceptions. The redemption fee is designed to protect the Portfolio and its remaining shareholders from the effects of short-term trading. These fees, if any, are included in the Statement of Changes in Net Assets.
7. Indemnifications: The Fund enters into contracts that contain a variety of indemnifications. The Fund's maximum exposure under these arrangements is unknown. However, the Fund has not had prior claims or losses pursuant to these contracts and expects the risk of loss to be remote.
8. Dividends and Distributions to Shareholders: Dividend income and distributions to shareholders are recorded on the ex-dividend date. Dividends from net investment income, if any, are declared and paid annually. Net realized capital gains, if any, are distributed at least annually.
9. Security Transactions, Income and Expenses: Security transactions are accounted for on the trade date (date the order to buy or sell is executed). Realized gains and losses on the sale of investment securities are determined on the specific identified cost method. Dividend income and other distributions are recorded on the ex-dividend date (except for certain foreign dividends which may be recorded as soon as the Portfolio is informed of such dividends) net of applicable withholding taxes. Interest income is recognized on the accrual basis except where collection is in doubt. Discounts are accreted and
premiums are amortized over the life of the respective securities. Most expenses of the Fund can be directly attributed to a particular Portfolio. Expenses which cannot be directly attributed are apportioned among the Portfolios based upon relative net assets or other appropriate methods. Income, expenses (other than class specific expenses — distribution and shareholder services, transfer agency and sub transfer agency fees) and realized and unrealized gains or losses are allocated to each class of shares based upon their relative net assets.
B. Advisory Fees: The Adviser, a wholly-owned subsidiary of Morgan Stanley, provides the Portfolio with advisory services under the terms of an Investment Advisory Agreement, paid quarterly, at an annual rate of 1.25% of the average daily net assets of the Portfolio.
The Adviser has agreed to reduce its advisory fee and/or reimburse the Portfolio so that total annual portfolio operating expenses, excluding certain investment related expenses, taxes, interest and other extraordinary expenses (including litigation), will not exceed 1.65% for Class I shares, 2.00% for Class A shares, 2.75% for Class C shares and 1.60% for Class IS shares. The fee waivers and/or expense reimbursements will continue for at least one year from the date of the Portfolio's prospectus or until such time as the Directors act to discontinue all or a portion of such waivers and/or reimbursements when they deem such action is appropriate. For the year ended December 31, 2016, approximately $213,000 of advisory fees were waived and approximately $6,000 of other expenses were reimbursed by the Adviser pursuant to this arrangement.
C. Administration Fees: The Adviser also serves as Administrator to the Fund and provides administrative services pursuant to an Administration Agreement for an annual fee, accrued daily and paid monthly, of 0.08% of the Portfolio's average daily net assets.
Under a Sub-Administration Agreement between the Administrator and State Street Bank and Trust Company ("State Street"), State Street provides certain administrative services to the Fund. For such services, the Administrator pays State Street a portion of the fee the Administrator receives from the Portfolio.
D. Distribution and Shareholder Services Fees: Morgan Stanley Distribution, Inc. ("MSDI" or the "Distributor"), a wholly-owned subsidiary of the Adviser and an indirect subsidiary of Morgan Stanley, serves as the Fund's Distributor of Portfolio shares pursuant to a Distribution Agreement. The
21
Morgan Stanley Institutional Fund, Inc.
Annual Report — December 31, 2016
Notes to Financial Statements (cont'd)
Fund has adopted a Shareholder Services Plan with respect to Class A shares pursuant to Rule 12b-1 under the Act. Under the Shareholder Services Plan, the Portfolio pays the Distributor a shareholder services fee, accrued daily and paid monthly, at an annual rate of 0.25% of the Portfolio's average daily net assets attributable to Class A shares.
The Fund has adopted a Distribution and Shareholder Services Plan with respect to Class C shares pursuant to Rule 12b-1 under the Act. Under the Distribution and Shareholder Services Plan, the Portfolio pays the Distributor a distribution fee, accrued daily and paid monthly, at an annual rate of 0.75% and a shareholder services fee, accrued daily and paid monthly, at an annual rate of 0.25% of the Portfolio's average daily net assets attributable to Class C shares.
The distribution and shareholder services fees are used to support the expenses associated with servicing and maintaining accounts. The Distributor may compensate other parties for providing shareholder support services to investors who purchase Class A and Class C shares.
E. Dividend Disbursing and Transfer Agent: The Fund's dividend disbursing and transfer agent is Boston Financial Data Services, Inc. ("BFDS"). Pursuant to a Transfer Agency Agreement, the Fund pays BFDS a fee based on the number of classes, accounts and transactions relating to the Portfolios of the Fund.
F. Custodian Fees: State Street (the "Custodian") serves as Custodian for the Fund in accordance with a Custodian Agreement. The Custodian holds cash, securities, and other assets of the Fund as required by the Act. Custody fees are payable monthly based on assets held in custody, investment purchases and sales activity and account maintenance fees, plus reimbursement for certain out-of-pocket expenses.
G. Security Transactions and Transactions with Affiliates: For the year ended December 31, 2016, purchases and sales of investment securities for the Portfolio, other than long-term U.S. Government securities and short-term investments, were approximately $14,216,000 and $14,518,000, respectively. There were no purchases and sales of long-term U.S. Government securities for the year ended December 31, 2016.
The Portfolio invests in the Institutional Class of the Morgan Stanley Institutional Liquidity Funds (the "Liquidity Funds"), an open-end management investment company managed by the Adviser. Advisory fees paid by the Portfolio are reduced by
an amount equal to its pro-rata share of the advisory and administration fees paid by the Portfolio due to its investment in the Liquidity Funds. For the year ended December 31, 2016, advisory fees paid were reduced by approximately $1,000 relating to the Portfolio's investment in the Liquidity Funds.
A summary of the Portfolio's transactions in shares of the Liquidity Funds during the year ended December 31, 2016 is as follows:
Value
December 31,
2015
(000) | | Purchases
at Cost
(000) | | Sales
(000) | | Dividend
Income
(000) | | Value
December 31,
2016
(000) | |
| $ | 841 | | | $ | 7,809 | | | $ | 7,950 | | | $ | 1 | | | $ | 700 | | |
The Portfolio invests in Morgan Stanley India Investment Fund, Inc., an open-end management investment company advised by an affiliate of the Adviser. Advisory fees paid by the Portfolio are reduced by an amount equal to its pro-rata share of the advisory and administration fees paid by the Portfolio due to its investment in Morgan Stanley India Investment Fund, Inc. For the year ended December 31, 2016, advisory fees paid were reduced by less than $500 relating to the Portfolio's investment in the Morgan Stanley India Investment Fund, Inc. The Morgan Stanley India Investment Fund, Inc. has a cost basis of approximately $859,000 at December 31, 2016.
A summary of the Portfolio's transactions in shares of the Morgan Stanley India Investment Fund, Inc. during the year ended December 31, 2016 is as follows:
Value
December 31,
2015
(000) | | Purchases
at Cost
(000) | | Sales
(000) | | Realized
Gain
(000) | | Dividend
Income
(000) | | Value
December 31,
2016
(000) | |
| $ | — | | | $ | 859 | | | $ | — | | | $ | — | | | $ | — | | | $ | 881 | | |
The Portfolio is permitted to purchase and sell securities ("cross-trade") from and to other Morgan Stanley Funds as well as other funds and client accounts for which the Adviser or an affiliate of the Adviser serves as investment adviser, pursuant to procedures approved by the Directors in compliance with Rule 17a-7 under the Act (the "Rule"). Each cross-trade is executed at the current market price in compliance with provisions of the Rule. For the year ended December 31, 2016, the Portfolio did not engage in any cross-trade transactions.
The Portfolio has an unfunded Deferred Compensation Plan (the "Compensation Plan"), which allows each independent Director to defer payment of all, or a portion, of the fees he or she receives for serving on the Board of Directors. Each eligible Director generally may elect to have the deferred amounts credited with a return equal to the total return on one or more
22
Morgan Stanley Institutional Fund, Inc.
Annual Report — December 31, 2016
Notes to Financial Statements (cont'd)
of the Morgan Stanley funds that are offered as investment options under the Compensation Plan. Appreciation/depreciation and distributions received from these investments are recorded with an offsetting increase/decrease in the deferred compensation obligation and do not affect the NAV of the Portfolio.
H. Federal Income Taxes: It is the Portfolio's intention to continue to qualify as a regulated investment company and distribute all of its taxable and tax-exempt income. Accordingly, no provision for federal income taxes is required in the financial statements.
The Portfolio may be subject to taxes imposed by countries in which it invests. Such taxes are generally based on income and/or capital gains earned or repatriated. Taxes are accrued based on net investment income, net realized gains and net unrealized appreciation as such income and/or gains are earned. Taxes may also be based on transactions in foreign currency and are accrued based on the value of investments denominated in such currency.
FASB ASC 740-10, "Income Taxes — Overall", sets forth a minimum threshold for financial statement recognition of the benefit of a tax position taken or expected to be taken in a tax return. Management has concluded that there are no significant uncertain tax positions that would require recognition in the financial statements. If applicable, the Portfolio recognizes interest accrued related to unrecognized tax benefits in "Interest Expense" and penalties in "Other Expenses" in the Statement of Operations. The Portfolio files tax returns with the U.S. Internal Revenue Service, New York and various states. Generally, each of the tax years in the two-year period ended December 31, 2016, remains subject to examination by taxing authorities.
The tax character of distributions paid may differ from the character of distributions shown in the Statement of Changes in Net Assets due to short-term capital gains being treated as ordinary income for tax purposes. The tax character of distributions paid during fiscal years 2016 and 2015 was as follows:
2016
Distributions
Paid From: | | 2015
Distributions
Paid From: | |
Ordinary
Income
(000) | | Long-Term
Capital Gain
(000) | | Paid-in-
Capital
(000) | | Ordinary
Income
(000) | | Long-Term
Capital Gain
(000) | |
| $ | 178 | | | $ | — | | | $ | 23 | | | $ | — | | | $ | — | | |
The amount and character of income and gains to be distributed are determined in accordance with income tax regulations
which may differ from GAAP. These book/tax differences are either considered temporary or permanent in nature.
Temporary differences are primarily due to differing book and tax treatments in the timing of the recognition of gains (losses) on certain investment transactions and the timing of the deductibility of certain expenses.
Permanent differences, primarily due to differing treatments of gains (losses) related to foreign currency transactions, basis adjustments on certain equity securities designated as passive foreign investment companies, a tax return of capital and nondeductible expense, resulted in the following reclassifications among the components of net assets at December 31, 2016:
Distributions in
Excess of
Net Investment
Income
(000) | | Accumulated
Net Realized
Loss
(000) | | Paid-in-
Capital
(000) | |
| $ | 28 | | | $ | (6 | ) | | $ | (22 | ) | |
At December 31, 2016, the Portfolio had no distributable earnings on a tax basis.
At December 31, 2016, the Portfolio had available for federal income tax purposes unused short-term and long-term capital losses of approximately $754,000 and $73,000 respectively, that do not have an expiration date.
To the extent that capital loss carryforwards are used to offset any future capital gains realized, no capital gains tax liability will be incurred by the Portfolio for gains realized and not distributed. To the extent that capital gains are offset, such gains will not be distributed to the shareholders.
Qualified late year losses are capital losses and specified ordinary losses, including currency losses, incurred after October 31 but within the taxable year that, if elected, are deemed to arise on the first day of the Portfolio's next taxable year. For the year ended December 31, 2016, the Portfolio deferred to January 1, 2017 for U.S. federal income tax purposes the following losses:
Qualified Late
Year Ordinary
Losses
(000) | | Post-October
Capital Losses
(000) | |
| $ | 38 | | | $ | — | | |
I. Credit Facility: As of April 4, 2016, the Fund and other Morgan Stanley funds participated in a $150,000,000 committed, unsecured revolving line of credit facility (the "facility") with State Street. This facility is to be used for temporary
23
Morgan Stanley Institutional Fund, Inc.
Annual Report — December 31, 2016
Notes to Financial Statements (cont'd)
emergency purposes or funding of shareholder redemption requests. The interest rate on borrowings is based on the federal funds rate or one month libor rate plus a spread. The facility also has a commitment fee of 0.25% per annum based on the unused portion of the facility. During the year ended December 31, 2016, the Portfolio did not have any borrowings under the facility.
J. Other: At December 31, 2016, the Portfolio did not have record owners of 10% or greater.
K. Accounting Pronouncements: In December 2016, FASB issued Accounting Standards update 2016-19 — Technical Corrections and Improvements ("ASU 2016-19"), which is effective for interim periods for all entities beginning after December 15, 2016. ASU 2016-19 includes an amendment to Topic 820, Fair Value Measurement, which clarifies the difference between a valuation approach and a valuation technique when applying the guidance in that Topic. That amendment also requires an entity to disclose when there has been a change in either or both a valuation approach and/or a valuation technique. The transition guidance for the amendment must be applied prospectively because it could potentially involve the use of hindsight that includes fair value measurements. Although still evaluating the potential impacts of ASU 2016-19 to the Portfolio, management expects that the impact of the Portfolio's adoption will be limited to additional financial statement disclosures.
In October 2016, the Securities and Exchange Commission ("SEC") issued a new rule, Investment Company Reporting Modernization, which, among other provisions, amends Regulation S-X to require standardized, enhanced disclosures, particularly related to derivatives, in investment company financial statements. Compliance with the guidance is effective for financial statements filed with the SEC on or after August 1, 2017; adoption will have no effect on the Portfolio's net assets or results of operations. Although still evaluating the potential impacts of the Investment Company Reporting Modernization to the Portfolio, management expects that the impact of the Portfolio's adoption will be limited to additional financial statement disclosures.
24
Morgan Stanley Institutional Fund, Inc.
Annual Report — December 31, 2016
Report of Independent Registered Public Accounting Firm
To the Shareholders and Board of Directors of
Morgan Stanley Institutional Fund, Inc. —
Emerging Markets Small Cap Portfolio
We have audited the accompanying statement of assets and liabilities, including the portfolio of investments, of Emerging Markets Small Cap Portfolio (one of the portfolios constituting Morgan Stanley Institutional Fund, Inc.) (the "Portfolio") as of December 31, 2016, and the related statement of operations for the year then ended, and statements of changes in net assets and the financial highlights for each of the years or periods indicated therein. These financial statements and financial highlights are the responsibility of the Portfolio's management. Our responsibility is to express an opinion on these financial statements and financial highlights based on our audits.
We conducted our audits in accordance with the standards of the Public Company Accounting Oversight Board (United States). Those standards require that we plan and perform the audit to obtain reasonable assurance about whether the financial statements and financial highlights are free of material misstatement. We were not engaged to perform an audit of the Portfolio's internal control over financial reporting. Our audits included consideration of internal control over financial reporting as a basis for designing audit procedures that are appropriate in the circumstances, but not for the purpose of expressing an opinion on the effectiveness of the Portfolio's internal control over financial reporting. Accordingly, we express no such opinion. An audit also includes examining, on a test basis, evidence supporting the amounts and disclosures in the financial statements and financial highlights, assessing the accounting principles used and significant estimates made by management, and evaluating the overall financial statement presentation. Our procedures included confirmation of securities owned as of December 31, 2016, by correspondence with the custodian and others or by other appropriate auditing procedures where replies from others were not received. We believe that our audits provide a reasonable basis for our opinion.
In our opinion, the financial statements and financial highlights referred to above present fairly, in all material respects, the financial position of Emerging Markets Small Cap Portfolio (one of the portfolios constituting Morgan Stanley Institutional Fund, Inc.) at December 31, 2016, the results of its operations for the year then ended, and the changes in its net assets and the financial highlights for each of years or periods indicated therein, in conformity with U.S. generally accepted accounting principles.

Boston, Massachusetts
February 28, 2017
25
Morgan Stanley Institutional Fund, Inc.
Annual Report — December 31, 2016
Federal Tax Notice (unaudited)
For federal income tax purposes, the following information is furnished with respect to the Portfolio's earnings for its taxable year ended December 31, 2016. When distributed, certain earnings may be subject to a maximum tax rate of 15% as provided for the Jobs and Growth Tax Relief Reconciliation Act of 2003. The Portfolio designated up to a maximum of approximately $242,000 as taxable at this lower rate.
The Portfolio intends to pass through foreign tax credits of approximately $40,000 and has derived net income from sources within foreign countries amounting to approximately $351,000.
In January, the Portfolio provides tax information to shareholders for the preceding calendar year.
26
Morgan Stanley Institutional Fund, Inc.
Annual Report — December 31, 2016
Privacy Notice (unaudited)
MORGAN STANLEY INVESTMENT MANAGEMENT INC.
AN IMPORTANT NOTICE CONCERNING OUR U.S. PRIVACY POLICY
We are required by federal law to provide you with a copy of our privacy policy annually. This policy applies to current and former individual investors in funds managed or sponsored by Morgan Stanley Investment Management Inc. ("MSIM") as well as current and former individual clients of MSIM. This policy is not applicable to partnerships, corporations, trusts or other non-individual clients or investors. Please note that we may amend this policy at any time, and will inform you of any changes as required by law.
WE RESPECT YOUR PRIVACY
We appreciate that you have provided us with your personal financial information. We strive to maintain the privacy of such information while we help you achieve your financial objectives. This Notice describes what non-public personal information we collect about you, why we collect it, when we may share it with others and how certain others may use it. It discusses the steps you may take to limit our sharing of certain information about you to affiliated companies in the Morgan Stanley family of companies ("other Morgan Stanley companies"). It also discloses how you may limit use of certain shared information for marketing purposes by other Morgan Stanley branded companies. Throughout this policy, we refer to the non-public information that personally identifies you or your accounts as "personal information."
1. WHAT PERSONAL INFORMATION DO WE COLLECT ABOUT YOU?
We obtain personal information from applications and other forms you submit to us, from your dealings with us, from consumer reporting agencies, from our Web sites and from third parties and other sources.
For example:
• We may collect information such as your name, address, e-mail address, telephone/fax numbers, assets, income and investment objectives through subscription documents, applications and other forms you submit to us.
• We may obtain information about account balances, your use of account(s) and the types of products and services you prefer to receive from us through your dealings and transactions with us and other sources.
• We may obtain information about your creditworthiness and credit history from consumer reporting agencies.
• We may collect background information from and through third-party vendors to verify representations you have made and to comply with various regulatory requirements.
• If you interact with us through our public and private Web sites, we may collect information that you provide directly through online communications (such as an e-mail address). We may also collect information about your Internet service provider, your domain name, your computer's operating system and Web browser, your use of our Web sites and your product and service preferences, through the use of "cookies." Please consult the Terms of Use of these sites for more details.
2. WHEN DO WE DISCLOSE PERSONAL INFORMATION WE COLLECT ABOUT YOU?
We may disclose personal information we collect about you to other Morgan Stanley companies and to non-affiliated third parties.
a. Information We Disclose to Other Morgan Stanley Companies.
We may disclose personal information to other Morgan Stanley companies for a variety of reasons, including to manage your account(s) effectively, to service and process your transactions, to let you know about products and services offered by us and other Morgan Stanley companies, to manage our business, and as otherwise required or permitted by law. Offers for products and services from other Morgan Stanley companies are developed under conditions designed to safeguard your personal information.
27
Morgan Stanley Institutional Fund, Inc.
Annual Report — December 31, 2016
Privacy Notice (unaudited) (cont'd)
b. Information We Disclose to Non-affiliated Third Parties.
We do not disclose personal information that we collect about you to non-affiliated third parties except to those who provide marketing services on our behalf, to financial institutions with whom we have joint marketing agreements, and as otherwise required or permitted by law. For example, we may disclose personal information to nonaffiliated third parties for servicing and processing transactions, to offer our own products and services, to protect against fraud, for institutional risk control, to respond to judicial process or to perform services on our behalf. When we share personal information with a non-affiliated third party, they are required to limit their use of personal information to the particular purpose for which it was shared and they are not allowed to share personal information with others except to fulfill that limited purpose or as may be permitted or required by law.
3. HOW DO WE PROTECT THE SECURITY AND CONFIDENTIALITY OF PERSONAL INFORMATION WE COLLECT ABOUT YOU?
We maintain physical, electronic and procedural security measures to help safeguard the personal information we collect about you. We have internal policies governing the proper handling of client information. Third parties that provide support or marketing services on our behalf may also receive personal information, and we require them to adhere to confidentiality standards with respect to such information.
4. HOW CAN YOU LIMIT THE SHARING OF CERTAIN TYPES OF PERSONAL INFORMATION WITH OTHER MORGAN STANLEY COMPANIES?
We offer you choices as to whether we share with other Morgan Stanley companies the personal information that was collected to determine your eligibility for products and services you request ("eligibility information"). Eligibility information does not include your identification information or personal information pertaining to our transactions or experiences with you. Please note that, even if you direct us not to share eligibility information with other Morgan Stanley companies ("opt-out"), we may still share personal information, including eligibility information, with those companies in circumstances excluded from the opt-out under applicable law, such as to process transactions or to service your account.
5. HOW CAN YOU LIMIT THE USE OF CERTAIN TYPES OF PERSONAL INFORMATION BY OTHER MORGAN STANLEY COMPANIES FOR MARKETING?
By following the opt-out instructions in Section 6 below, you may limit other Morgan Stanley branded companies from marketing their products or services to you based on personal information we disclose to them. This information may include, for example, your income and account history with us. Please note that, even if you choose to limit Other Morgan Stanley Companies from using personal information about you that we may share with them for marketing their products and services to you, Other Morgan Stanley Companies may use your personal information that they obtain from us to market to you in circumstances permitted by law, such as if the Other Morgan Stanley Company has its own relationship with you.
6. HOW CAN YOU SEND US AN OPT-OUT INSTRUCTION?
If you wish to limit our sharing of eligibility information about you with other Morgan Stanley companies or other Morgan Stanley companies' use of personal information for marketing purposes, as described in this notice, you may do so by:
• Calling us at (800) 548-7786
Monday–Friday between 8a.m. and 6p.m.(EST)
• Writing to us at the following address:
Boston Financial Data Services, Inc.
c/o Privacy Coordinator
P.O. Box 219804
Kansas City, Missouri 64121
28
Morgan Stanley Institutional Fund, Inc.
Annual Report — December 31, 2016
Privacy Notice (unaudited) (cont'd)
Your written request should include your name, address, telephone number and account number(s) to which the opt-out applies and whether you are opting out with respect to sharing of eligibility information (Section 4 above), or if information used for Marketing (Section 5 above) or both. Written opt-out requests should not be sent with any other correspondence. In order to process your request, we require that the request be provided by you directly and not through a third party.
Your opt-out preference will remain in effect with respect to this policy (as it may be amended) until you notify us otherwise. If you have a joint account, your direction for us not to share this information with other Morgan Stanley companies and for those other Morgan Stanley companies not to use your personal information for marketing will be applied to all account holders on that account. Please understand that if you limit our sharing or our affiliated companies' use of personal information, you and any joint account holder(s) may not receive information about Morgan Stanley products and services, including products or services that could help you manage your financial resources and achieve your investment objectives.
7. WHAT IF AN AFFILIATED COMPANY BECOMES A NON-AFFILIATED THIRD PARTY?
If, at any time in the future, an affiliated company becomes a non-affiliated third party, further disclosures of personal information made to the former affiliated company will be limited to those described in Section 2(b) above relating to non-affiliated third parties. If you elected under Section 6 to limit disclosures we make to affiliated companies, or use of personal information by affiliated companies, your election will not apply to use by any former affiliated company of your personal information in their possession once it becomes a non-affiliated third party.
SPECIAL NOTICE TO RESIDENTS OF VERMONT
The following section supplements our policy with respect to our individual clients who have a Vermont address and supersedes anything to the contrary in the above policy with respect to those clients only.
The state of Vermont requires financial institutions to obtain your consent prior to sharing personal information that they collect about you with affiliated companies and non-affiliated third parties other than in certain limited circumstances. Except as permitted by law, we will not share personal information we collect about you with non-affiliated third parties or other Morgan Stanley companies unless you provide us with your written consent to share such information ("opt-in").
If you wish to receive offers for investment products and services offered by or through other Morgan Stanley companies, please notify us in writing at the following address:
Boston Financial Data Services, Inc.
c/o Privacy Coordinator
P.O. Box 219804
Kansas City, Missouri 64121
Your authorization should include your name, address, telephone number and account number(s) to which the opt-in applies and should not be sent with any other correspondence. In order to process your authorization, we require that the authorization be provided by you directly and not through a third party.
SPECIAL NOTICE TO RESIDENTS OF CALIFORNIA
The following section supplements our policy with respect to our individual clients who have a California address and supersedes anything to the contrary in the above policy with respect to those clients only.
In response to a California law, if your account has a California home address, your personal information will not be disclosed to nonaffiliated third parties except as permitted by applicable California law, and we will limit sharing such information with our affiliates to comply with California privacy laws that apply to us.
29
Morgan Stanley Institutional Fund, Inc.
Annual Report — December 31, 2016
Director and Officer Information (unaudited)
Independent Directors:
Name, Age and Address of
Independent Director | | Position(s)
Held with
Registrant | | Length of Time
Served* | | Principal Occupation(s) During Past 5 Years
and Other Relevant Professional Experience | | Number of
Overseen by
Independent
Director** | | Portfolios in
Fund Complex
Other Directorships
Held by Independent
Director*** | |
Frank L. Bowman (72)
c/o Perkins Coie LLP
Counsel to the Independent
Directors
30 Rockefeller Plaza
New York, NY 10112 | | Director | | Since
August
2006 | | President, Strategic Decisions, LLC (consulting) (since February 2009); Director or Trustee of various Morgan Stanley Funds (since August 2006); Chairperson of the Compliance and Insurance Committee (since October 2015); formerly, Chairperson of the Insurance Sub-Committee of the Compliance and Insurance Committee (2007-2015); served as President and Chief Executive Officer of the Nuclear Energy Institute (policy organization) (February 2005-November 2008); retired as Admiral, U.S. Navy after serving over 38 years on active duty including 8 years as Director of the Naval Nuclear Propulsion Program in the Department of the Navy and the U.S. Department of Energy (1996-2004); served as Chief of Naval Personnel (July 1994-September 1996) and on the Joint Staff as Director of Political Military Affairs (June 1992-July 1994); knighted as Honorary Knight Commander of the Most Excellent Order of the British Empire; awarded the Officier de l'Orde National du Mérite by the French Government; elected to the National Academy of Engineering (2009). | | | 90 | | | Director of BP p.l.c.; Director of Naval and Nuclear Technologies LLP; Director Emeritus of the Armed Services YMCA; Director of the U.S. Naval Submarine League; Member of the National Security Advisory Council of the Center for U.S. Global Engagement and a member of the CNA Military Advisory Board; Chairman of the charity J Street Cup Golf; Trustee of Fairhaven United Methodist Church; and Director of other various non-profit organizations. | |
Kathleen A. Dennis (63)
c/o Perkins Coie LLP
Counsel to the Independent Directors
30 Rockefeller Plaza
New York, NY 10112 | | Director | | Since
August
2006 | | President, Cedarwood Associates (mutual fund and investment management consulting) (since July 2006); Chairperson of the Liquidity and Alternatives Sub-Committee of the Investment Committee (since October 2006) and Director or Trustee of various Morgan Stanley Funds (since August 2006); formerly, Senior Managing Director of Victory Capital Management (1993-2006). | | | 91 | | | Director of various non-profit organizations. | |
Nancy C. Everett (61)
c/o Perkins Coie LLP
Counsel to the Independent Directors
30 Rockefeller Plaza
New York, NY 10112 | | Director | | Since
January
2015 | | Chief Executive Officer, Virginia Commonwealth University Investment Company (since November 2015); Owner, OBIR, LLC (institutional investment management consulting) (since June 2014); formerly, Managing Director, BlackRock Inc. (February 2011-December 2013); and Chief Executive Officer, General Motors Asset Management (a/k/a Promark Global Advisors, Inc.) (June 2005-May 2010). | | | 91 | | | Member of Virginia Commonwealth University School of Business Foundation; formerly, Member of Virginia Commonwealth University Board of Visitors (2013-2015); Member of Committee on Directors for Emerging Markets Growth Fund, Inc. (2007-2010); Chairperson of Performance Equity Management, LLC (2006-2010); and Chairperson, GMAM Absolute Return Strategies Fund, LLC (2006-2010). | |
30
Morgan Stanley Institutional Fund, Inc.
Annual Report — December 31, 2016
Director and Officer Information (unaudited) (cont'd)
Independent Directors: (cont'd)
Name, Age and Address of
Independent Director | | Position(s)
Held with
Registrant | | Length of Time
Served* | | Principal Occupation(s) During Past 5 Years
and Other Relevant Professional Experience | | Number of
Overseen by
Independent
Director** | | Portfolios in
Fund Complex
Other Directorships
Held by Independent
Director*** | |
Jakki L. Haussler (59)
c/o Perkins Coie LLP
Counsel to the Independent Directors
30 Rockefeller Plaza
New York, NY 10112 | | Director | | Since
January
2015 | | Chairman and Chief Executive Officer, Opus Capital Group (since January 1996); formerly, Director, Capvest Venture Fund, LP (May 2000-December 2011); Partner, Adena Ventures, LP (July 1999-December 2010); Director, The Victory Funds (February 2005-July 2008). | | | 91 | | | Director of Cincinnati Bell Inc. and Member, Audit Committee and Compensation Committee; Director of Northern Kentucky University Foundation and Member, Investment Committee; Member of Chase College of Law Transactional Law Practice Center Board of Advisors; Director of Best Transport; Director of Chase College of Law Board of Visitors; formerly, Member, University of Cincinnati Foundation Investment Committee; Member, Miami University Board of Visitors (2008-2011); Trustee of Victory Funds (2005-2008) and Chairman, Investment Committee (2007-2008) and Member, Service Provider Committee (2005-2008). | |
Dr. Manuel H. Johnson (67)
c/o Johnson Smick
International, Inc.
220 I Street, N.E. — Suite 200
Washington, D.C. 20002 | | Director | | Since
July
1991 | | Senior Partner, Johnson Smick International, Inc. (consulting firm); Chairperson of the Investment Committee (since October 2006) and Director or Trustee of various Morgan Stanley Funds (since July 1991); Co-Chairman and a founder of the Group of Seven Council (G7C) (international economic commission); formerly, Chairperson of the Audit Committee (July 1991-September 2006), Vice Chairman of the Board of Governors of the Federal Reserve System and Assistant Secretary of the U.S. Treasury. | | | 91 | | | Director of NVR, Inc. (home construction). | |
Joseph J. Kearns (74)
c/o Kearns & Associates LLC
46 E Peninsula Center #385
Rolling Hills Estates, CA 90274-3712 | | Director | | Since
August
1994 | | President, Kearns & Associates LLC (investment consulting); Chairperson of the Audit Committee (since October 2006) and Director or Trustee of various Morgan Stanley Funds (since August 1994); formerly, Deputy Chairperson of the Audit Committee (July 2003-September 2006) and Chairperson of the Audit Committee of various Morgan Stanley Funds (since August 1994); CFO of the J. Paul Getty Trust. | | | 93 | | | Director of Electro Rent Corporation (equipment leasing). Prior to December 31, 2013, Director of The Ford Family Foundation. | |
31
Morgan Stanley Institutional Fund, Inc.
Annual Report — December 31, 2016
Director and Officer Information (unaudited) (cont'd)
Independent Directors: (cont'd)
Name, Age and Address of
Independent Director | | Position(s)
Held with
Registrant | | Length of Time
Served* | | Principal Occupation(s) During Past 5 Years
and Other Relevant Professional Experience | | Number of
Overseen by
Independent
Director** | | Portfolios in
Fund Complex
Other Directorships
Held by Independent
Director*** | |
Michael F. Klein (58)
c/o Perkins Coie LLP
Counsel to the Independent Directors
30 Rockefeller Plaza
New York, NY 10112 | | Director | | Since
August
2006 | | Managing Director, Aetos Capital, LLC (since March 2000); Co-President, Aetos Alternatives Management, LLC (since January 2004) and Co-Chief Executive Officer of Aetos Capital LLC (since August 2013); Chairperson of the Fixed Income Sub-Committee of the Investment Committee (since October 2006) and Director or Trustee of various Morgan Stanley Funds (since August 2006); formerly, Managing Director, Morgan Stanley & Co. Inc. and Morgan Stanley Dean Witter Investment Management, President, various Morgan Stanley Funds (June 1998-March 2000) and Principal, Morgan Stanley & Co. Inc. and Morgan Stanley Dean Witter Investment Management (August 1997-December 1999). | | | 90 | | | Director of certain investment funds managed or sponsored by Aetos Capital, LLC; Director of Sanitized AG and Sanitized Marketing AG (specialty chemicals). | |
Patricia Maleski (56)
c/o Perkins Coie LLP
Counsel to the Independent Directors
30 Rockefeller Plaza
New York, NY 10112 | | Director | | Since
January
2017 | | Management Director, JPMorgan Asset Management (2013-2016); President, JPMorgan Funds (2010-2013), Chief Administrative Officer, JPMorgan Funds (2004-2010), Treasurer, JPMorgan Funds (2003-2004, 2008-2010), and Vice President and Board Liaison, JPMorgan Funds (2001-2004); Managing Director, J.P. Morgan Investment Management Inc. (2001-2013); Vice President of Finance, Pierpont Group (1996-2001); Vice President, Bank of New York (1995-1996); Senior Audit Manager, Price Waterhouse, LLP (1982-1995). | | | 91 | | | None. | |
Michael E. Nugent (80)
522 Fifth Avenue
New York, NY 10036 | | Chair of the Board and Director | | Chair of the Boards since July 2006 and Director since July 1991 | | Chair of the Boards of various Morgan Stanley Funds (since July 2006); Chairperson of the Closed-End Fund Committee (since June 2012) and Director or Trustee of various Morgan Stanley Funds (since July 1991); formerly, Chairperson of the Insurance Committee (until July 2006); General Partner, Triumph Capital, L.P. (private investment partnership) (1988-2013). | | | 92 | | | None. | |
W. Allen Reed (69)
c/o Perkins Coie LLP
Counsel to the Independent Directors
30 Rockefeller Plaza
New York, NY 10112 | | Director | | Since
August
2006 | | Chairperson of the Equity Sub-Committee of the Investment Committee (since October 2006) and Director or Trustee of various Morgan Stanley Funds (since August 2006); formerly, President and CEO of General Motors Asset Management; Chairman and Chief Executive Officer of the GM Trust Bank and Corporate Vice President of General Motors Corporation (August 1994-December 2005). | | | 91 | | | Director of Legg Mason, Inc.; formerly, Director of the Auburn University Foundation (2010-2015). | |
Fergus Reid (84)
c/o Joe Pietryka, Inc.
85 Charles Colman Blvd.
Pawling, NY 12564 | | Director | | Since
June
1992 | | Chairman, Joe Pietryka, Inc.; Chairperson of the Governance Committee and Director or Trustee of various Morgan Stanley Funds (since June 1992). | | | 92 | | | Formerly, Trustee and Director of certain investment companies in the JP Morgan Fund Complex managed by JP Morgan Investment Management Inc. (1987-2012). | |
* This is the earliest date the Director began serving the Morgan Stanley Funds. Each Director serves an indefinite term, until his or her successor is elected.
** The Fund Complex includes (as of December 31, 2016) all open-end and closed-end funds (including all of their portfolios) advised by Morgan Stanley Investment Management Inc. (the "Adviser") and any funds that have an adviser that is an affiliated person of the Adviser (including, but not limited to, Morgan Stanley AIP GP LP).
*** This includes any directorships at public companies and registered investment companies held by the Director at any time during the past five years.
32
Morgan Stanley Institutional Fund, Inc.
Annual Report — December 31, 2016
Director and Officer Information (unaudited) (cont'd)
Executive Officers:
Name, Age and Address of Executive Officer | | Position(s) Held
with
Registrant | | Length of Time
Served* | | Principal Occupation(s) During Past 5 Years | |
John H. Gernon (53)
522 Fifth Avenue
New York, NY 10036 | | President and Principal Executive Officer | | Since
September
2013 | | President and Principal Executive Officer of the Equity and Fixed Income Funds and the Morgan Stanley AIP Funds (since September 2013) and the Liquidity Funds and various money market funds (since May 2014) in the Fund Complex; Managing Director of the Adviser; Head of Product (since 2006). | |
Timothy J. Knierim (58)
522 Fifth Avenue
New York, NY 10036 | | Chief Compliance Officer | | Since
December
2016 | | Managing Director of the Adviser and various entities affiliated with the Adviser; Chief Compliance Officer of various Morgan Stanley Funds and the Adviser (since December 2016) and Chief Compliance Officer of Morgan Stanley AIP GP LP (since 2014). Formerly, Managing Director and Deputy Chief Compliance Officer of the Adviser (2014-2016); and formerly, Chief Compliance Officer of Prudential Investment Management, Inc. (2007-2014). | |
Francis J. Smith (51)
522 Fifth Avenue
New York, NY 10036 | | Treasurer and Principal Financial Officer | | Treasurer since July 2003 and Principal Financial Officer since September 2002 | | Managing Director of the Adviser and various entities affiliated with the Adviser; Treasurer (since July 2003) and Principal Financial Officer of various Morgan Stanley Funds (since September 2002). | |
Mary E. Mullin (49)
522 Fifth Avenue
New York, NY 10036 | | Secretary | | Since
June
1999 | | Executive Director of the Adviser; Secretary of various Morgan Stanley Funds (since June 1999). | |
* This is the earliest date the officer began serving the Morgan Stanley Funds. Each officer serves a one-year term, until his or her successor is elected and qualifies.
33
Morgan Stanley Institutional Fund, Inc.
Annual Report — December 31, 2016
Adviser and Administrator
Morgan Stanley Investment Management Inc.
522 Fifth Avenue
New York, New York 10036
Distributor
Morgan Stanley Distribution, Inc.
522 Fifth Avenue
New York, New York 10036
Dividend Disbursing and Transfer Agent
Boston Financial Data Services, Inc.
2000 Crown Colony Drive
Quincy, Massachusetts 02169
Custodian
State Street Bank and Trust Company
One Lincoln Street
Boston, Massachusetts 02111
Legal Counsel
Dechert LLP
1095 Avenue of the Americas
New York, New York 10036
Counsel to the Independent Directors
Perkins Coie LLP
30 Rockefeller Plaza
New York, New York 10112
Independent Registered Public Accounting Firm
Ernst & Young LLP
200 Clarendon Street
Boston, Massachusetts 02116
Reporting to Shareholders
Each Morgan Stanley fund provides a complete schedule of portfolio holdings in its semi-annual and annual reports within 60 days of the end of the fund's second and fourth fiscal quarters. The semi-annual and annual reports are filed electronically with the Securities and Exchange Commission (SEC) on Form N-CSRS and Form N-CSR, respectively. Morgan Stanley also delivers the semi-annual and annual reports to fund shareholders and makes these reports available on its public website, www.morganstanley.com/im. Each Morgan Stanley fund also files a complete schedule of portfolio holdings with the SEC for the fund's first and third fiscal quarters on Form N-Q. Morgan Stanley does not deliver the reports for the first and third fiscal quarters to shareholders, nor are the reports posted to the Morgan Stanley public website. You may, however, obtain the Form N-Q filings (as well as the Form N-CSR and N-CSRS filings) by accessing the SEC's website, www.sec.gov. You may also review and copy them at the SEC's Public Reference Room in Washington, DC. Information on the operation of the SEC's Public Reference Room may be obtained by calling the SEC toll free at 1 (800) SEC-0330. You can also request copies of these materials, upon payment of a duplicating fee, by electronic request at the SEC's email address (publicinfo@sec.gov) or by writing the Public Reference Room of the SEC, 100 F Street, NE, Washington, DC 20549-0102.
Proxy Voting Policies and Procedures and Proxy Voting Record
You may obtain a copy of the Fund's Proxy Voting Policy and Procedures and information regarding how the Fund voted proxies relating to portfolio securities during the most recent twelve-month period ended June 30, without charge, upon request, by calling toll free 1 (800) 548-7786 or by visiting our website at www.morganstanley.com/im. This information is also available on the SEC's website at www.sec.gov.
This report is authorized for distribution only when preceded or accompanied by a prospectus or summary prospectus of the applicable Portfolio of Morgan Stanley Institutional Fund, Inc., which describes in detail the Portfolio's investment policies, risks, fees and expenses. Please read the prospectus carefully before you invest or send money. For additional information, including information regarding the investments comprising the Portfolio, please visit our website at www.morganstanley.com/im or call toll free 1 (800) 548-7786.
34
(This Page has been left blank intentionally.)
(This Page has been left blank intentionally.)
(This Page has been left blank intentionally.)
Printed in U.S.A.
This Report has been prepared for shareholders and may be distributed to others only if preceded or accompanied by a current prospectus.
Morgan Stanley Investment Management Inc.
522 Fifth Avenue
New York, New York 10036
© 2017 Morgan Stanley. Morgan Stanley Distribution, Inc.

IFIEMSCANN
1707976 EXP. 02.28.18

Morgan Stanley Institutional Fund, Inc.
Frontier Emerging Markets Portfolio
Annual Report
December 31, 2016

Morgan Stanley Institutional Fund, Inc.
Annual Report — December 31, 2016
Shareholders' Letter | | | 2 | | |
Expense Example | | | 3 | | |
Investment Overview | | | 4 | | |
Portfolio of Investments | | | 7 | | |
Statement of Assets and Liabilities | | | 9 | | |
Statement of Operations | | | 11 | | |
Statements of Changes in Net Assets | | | 12 | | |
Financial Highlights | | | 14 | | |
Notes to Financial Statements | | | 19 | | |
Report of Independent Registered Public Accounting Firm | | | 26 | | |
Federal Tax Notice | | | 27 | | |
Privacy Notice | | | 28 | | |
Director and Officer Information | | | 31 | | |
This report is authorized for distribution only when preceded or accompanied by a prospectus or summary prospectus of the applicable Portfolio of Morgan Stanley Institutional Fund, Inc. To receive a prospectus and/or statement of additional information (SAI), which contains more complete information such as investment objectives, charges, expenses, policies for voting proxies, risk considerations, and describes in detail each of the Portfolio's investment policies to the prospective investor, please call toll free 1 (800) 548-7786. Please read the prospectuses carefully before you invest or send money.
Additionally, you can access information about the Portfolio, including performance, characteristics, and investment team commentary, through Morgan Stanley Investment Management's website: www.morganstanley.com/im.
Market forecasts provided in this report may not necessarily come to pass. There is no guarantee that any sectors mentioned will continue to perform as discussed herein or that securities in such sectors will be held by the Portfolio in the future. There is no assurance that a Portfolio will achieve its investment objective. Portfolios are subject to market risk, which is the possibility that market values of securities owned by the Portfolio will decline and, therefore, the value of the Portfolio's shares may be less than what you paid for them. Accordingly, you can lose money investing in this Portfolio. Please see the prospectus for more complete information on investment risks.
1
Morgan Stanley Institutional Fund, Inc.
Annual Report — December 31, 2016
Shareholders' Letter (unaudited)
Dear Shareholders,
We are pleased to provide this Annual report, in which you will learn how your investment in Frontier Emerging Markets Portfolio (the "Portfolio") performed during the latest twelve-month period.
Morgan Stanley Investment Management is a client-centric, investor-led organization. Our global presence, intellectual capital, and breadth of products and services enable us to partner with investors to meet the evolving challenges of today's financial markets. We aim to deliver superior investment service and to empower our clients to make the informed decisions that help them reach their investment goals.
As always, we thank you for selecting Morgan Stanley Investment Management, and look forward to working with you in the months and years ahead.
Sincerely,

John H. Gernon
President and Principal Executive Officer
January 2017
2
Morgan Stanley Institutional Fund, Inc.
Annual Report — December 31, 2016
Expense Example (unaudited)
Frontier Emerging Markets Portfolio
As a shareholder of the Portfolio, you incur two types of costs: (1) transactional costs, including redemption fees; and (2) ongoing costs, which may include advisory fees, administration fees, distribution and shareholder services fees and other Portfolio expenses. This example is intended to help you understand your ongoing costs (in dollars) of investing in the Portfolio and to compare these costs with the ongoing costs of investing in other mutual funds.
This example is based on an investment of $1,000 invested at the beginning of the six-month period ended December 31, 2016 and held for the entire six-month period.
Actual Expenses
The table below provides information about actual account values and actual expenses. You may use the information in this table, together with the amount you invested, to estimate the expenses that you paid over the period. Simply divide your account value by $1,000 (for example, an $8,600 account value divided by $1,000 = 8.6), then multiply the result by the number in the table under the heading entitled "Actual Expenses Paid During Period" to estimate the expenses you paid on your account during this period.
Hypothetical Example for Comparison Purposes
The table below provides information about hypothetical account values and hypothetical expenses based on the Portfolio's actual expense ratio and an assumed rate of return of 5% per year before expenses, which is not the Portfolio's actual return. The hypothetical account values and expenses may not be used to estimate the actual ending account balance or expenses you paid for the period. You may use this information to compare the ongoing costs of investing in the Portfolio and other funds. To do so, compare this 5% hypothetical example with the 5% hypothetical examples that appear in the shareholder reports of the other funds.
Please note that the expenses shown in the table are meant to highlight your ongoing costs only and do not reflect any transactional costs, such as sales charges (loads) and redemption fees. Therefore, the information for each class in the table is useful in comparing ongoing costs only, and will not help you determine the relative total costs of owning different funds. In addition, if these transactional costs were included, your costs would have been higher.
| | | Beginning
Account
Value
7/1/16 | | Actual Ending
Account
Value
12/31/16 | | Hypothetical
Ending Account
Value | | Actual
Expenses
Paid
During
Period* | | Hypothetical
Expenses Paid
During Period* | | Net
Expense
Ratio
During
Period** | |
Frontier Emerging Markets Portfolio Class I | | $ | 1,000.00 | | | $ | 1,043.80 | | | $ | 1,016.84 | | | $ | 8.48 | | | $ | 8.36 | | | | 1.65 | %*** | |
Frontier Emerging Markets Portfolio Class A | | | 1,000.00 | | | | 1,042.30 | | | | 1,015.03 | | | | 10.32 | | | | 10.18 | | | | 2.01 | *** | |
Frontier Emerging Markets Portfolio Class L | | | 1,000.00 | | | | 1,038.80 | | | | 1,011.56 | | | | 13.84 | | | | 13.65 | | | | 2.70 | *** | |
Frontier Emerging Markets Portfolio Class C | | | 1,000.00 | | | | 1,037.50 | | | | 1,010.56 | | | | 14.85 | | | | 14.66 | | | | 2.90 | *** | |
Frontier Emerging Markets Portfolio Class IS | | | 1,000.00 | | | | 1,044.40 | | | | 1,017.04 | | | | 8.27 | | | | 8.16 | | | | 1.61 | *** | |
* Expenses are calculated using each Portfolio Class' annualized net expense ratio (as disclosed), multiplied by the average account value over the period, and multiplied by 184/366 (to reflect the most recent one-half year period).
** Annualized.
*** Refer to Note F in the Notes to Financial Statements for discussion of prior period custodian out-of-pocket expenses that were reimbursed in the current period.
3
Morgan Stanley Institutional Fund, Inc.
Annual Report — December 31, 2016
Investment Overview (unaudited)
Frontier Emerging Markets Portfolio
The Portfolio seeks long-term capital appreciation.
Performance
For the year ended December 31, 2016, the Portfolio's Class I shares had a total return based on net asset value and reinvestment of distributions per share of 3.83%, net of fees. The Portfolio's Class I shares outperformed the Portfolio's benchmark, the MSCI Frontier Markets Index (the "Index"), which returned 2.66%.
Factors Affecting Performance
• Frontier markets (+2.66%) underperformed the emerging markets (+11.19%) during the year, as measured by the Index and the MSCI Emerging Markets Index, respectively. Within the Index, Pakistan (+40.42%) led market returns, followed by Morocco (+34.33%), Croatia (+22.02%), Romania (+14.07%) and Serbia (+12.93%). Laggards were Nigeria (–35.98%), Slovenia (–15.42%) and Vietnam (–7.79%).
• For the Portfolio, stock selection and country allocation contributed almost equally to returns in the reporting period. Our stock selection in and an overweight allocation to Pakistan contributed the most to results, followed by our underweight allocation to Nigeria. Stock selection in and an overweight allocation to Vietnam also contributed, as did our overweight allocations to Panama and United Arab Emirates. Our stock selection in Kenya and Romania, as well as our overweight allocations to Romania and Brazil, contributed to returns. Our off-Index position in Egypt was the top detractor during the year, which came as a surprise because, for the majority of the year, the government was unable to follow through with meaningful reform to stabilize the currency. It was not until the very end of 2016 that the government announced the devaluation. Our stock selection in and underweight allocations to Kuwait and Morocco also hampered returns. Also detracting were our off-Index positions in Saudi Arabia and Oman, while our stock selection in and an overweight allocation to Argentina also negatively affected returns.
• From a sector perspective, our stock selection in consumer staples contributed the most to results, while it was partially offset by the negative impact of our overweight allocation. Stock selection in the materials and financials sectors also contributed.
Our underweight allocation to telecommunication services detracted the most from returns, as did our stock selection in health care.
Management Strategies
• The outlook for emerging markets ("EM") overall finally began improving in 2016 after five previously disappointing years, which had been marked in large part by downward revisions to economic output. The election of Donald Trump — while not predicted by most polls — was consistent with the unfolding story of deglobalization and anti-incumbent sentiment among voters in many countries both developed and emerging. Our Portfolio has been positioned for such trends for some time. We have written that depopulation, deglobalization, deleveraging and de-democratization will continue to impose constraints on economic growth. The eight years since the global financial crisis have coincided with declining working age populations in most of the developed countries and even in populous EM countries such as China; lower trade volumes sparked by discriminatory trade measures; significant deleveraging in developed countries; and growing popularity for some longstanding autocrats in the emerging world, even as voters turned on established leaders in many democratic countries.
• In the Portfolio, we have been positioned to seek pockets of growth in countries that are largely protected from these trends by taking overweight positions in countries featuring a labor force that is still growing, an economy not overly dependent on exports but rather featuring strong domestic demand, credit growth at a healthy stage; and fresh leaders with the potential to become economic reformers.
• Positive sentiment still surrounds Pakistan as an investment opportunity. There is a level of risk of fiscal stoppage following the completion of the International Monetary Fund program in September, but growth continues to pick up. There is strong consumer demand and increasing investment levels. Fiscal consolidation has brought down the deficit from 8% to 4.5%(i) and the currency has remained relatively stable against the dollar. Strong foreign direct investment levels and
(i) Source: Government of Pakistan Ministry of Finance and Credit Suisse
4
Morgan Stanley Institutional Fund, Inc.
Annual Report — December 31, 2016
Investment Overview (unaudited) (cont'd)
Frontier Emerging Markets Portfolio
loan flows have allowed the central bank to increase its reserves. Inflation and interest rates are at multi-year lows, which may be a point of watch for banks in the near term, but we believe the long-term outlook remains attractive. Government spending has increased on infrastructure and public-private partnerships, though some political risk overhangs until the election in May 2018.
• The sentiment in Romania appeared very positive on a recent trip, particularly on the consumer front. Growth jumped in the first half of 2016 driven primarily by consumption, wage hikes and extremely low inflation. Investment is also accelerating. There are some top-down risks building as the consumption boom pushes the current account deficit deeper into the red while public sector wage hikes and tax cuts drive up the fiscal deficit. Much depends on the stance of the new government following parliamentary elections in December of this year. The overall outlook remains very positive.
• Southeast Asia will be of increasing interest as new markets such as Myanmar are developed, and the Mekong region in general benefits from China's rising labor costs. For example, Vietnam has been a main beneficiary of the manufacturing shift away from China.
• There are many growth levers providing tailwinds to frontier economies such as strong demographics with labor force growth sufficient for high gross domestic product ("GDP") growth, an underpenetrated credit cycle, a relatively low level of private debt to GDP, and healthy domestic demand. Contrast this to emerging markets, where there is widespread declining labor force growth; an overly penetrated credit cycle, especially in some of the largest countries such as China; and high exposure to interest rate hikes given the level of private debt to GDP held by both the corporates and consumers.
• From a positioning perspective, we continue to focus on countries where we believe the outlook for reform is encouraging, as reform usually leads to higher levels of economic growth, which then translates to higher earnings growth at the corporate level. We are overweight countries that benefit from lower oil prices, which translate to lower inflation,
increased purchasing power and improved trade balances.
• Top overweights include Argentina, where we are hopeful for an ongoing normalization in the macroeconomic management of the country given new President Mauricio Macri's ambitious reform agenda. Pakistan remains our largest country position in the Portfolio, as growth is high and investment to GDP is the lowest in frontier markets, which should improve and help boost the economy further. We also remain overweight to Vietnam and Bangladesh, where foreign direct investment and manufacturing remain strong as corporates shift away from China on higher labor costs.
• Top underweights include oil-exporting countries in the Middle East and Nigeria, which are already seeing slower growth and significant spending cuts from low oil prices. We are particularly concerned in Nigeria, where economic deterioration is substantial and further devaluation is needed. Although policy makers have belatedly allowed the currency to devalue, it is clear that the currency is still being managed and has further to go.
5
Morgan Stanley Institutional Fund, Inc.
Annual Report — December 31, 2016
Investment Overview (unaudited) (cont'd)
Frontier Emerging Markets Portfolio

* Minimum Investment for Class I shares
** Commenced Operations on August 25, 2008. Performance shown for the Portfolio's Class I shares reflects the performance of the common shares of the Predecessor Fund for periods prior to September 17, 2012.
In accordance with SEC regulations, the Portfolio's performance shown assumes that all recurring fees (including management fees) were deducted and all dividends and distributions were reinvested. The performance of Class A, L, C and IS shares will vary from the performance of Class I shares based upon their different inception dates and will be impacted by additional fees assessed to those classes (if applicable).
Performance Compared to the MSCI Frontier Markets Index(1) and the Lipper Emerging Markets Funds Index(2)
| | | Period Ended December 31, 2016
Total Returns(3) | |
| | | | | Average Annual | |
| | | One
Year | | Five
Years | | Ten
Years | | Since
Inception(8) | |
Portfolio — Class I Shares
w/o sales charges(4) | | | 3.83 | % | | | 9.15 | % | | | — | | | | 0.21 | % | |
Portfolio — Class A Shares
w/o sales charges(5) | | | 3.49 | | | | — | | | | — | | | | 6.68 | | |
Portfolio — Class A Shares with
maximum 5.25% sales charges(5) | | | –1.96 | | | | — | | | | — | | | | 5.35 | | |
Portfolio — Class L Shares
w/o sales charges(5) | | | 2.77 | | | | — | | | | — | | | | 6.02 | | |
Portfolio — Class C Shares
w/o sales charges(7) | | | 2.63 | | | | — | | | | — | | | | –7.27 | | |
Portfolio — Class C Shares
with maximum 1.00%
deferred sales charges(7) | | | 1.63 | | | | — | | | | — | | | | –7.27 | | |
Portfolio — Class IS Shares
w/o sales charges(6) | | | 3.88 | | | | — | | | | — | | | | –4.25 | | |
MSCI Frontier Markets Index | | | 2.66 | | | | 5.16 | | | | — | | | | –3.55 | | |
Lipper Emerging Market Funds Index | | | 12.10 | | | | 2.04 | | | | — | | | | 1.22 | | |
Performance data quoted represents past performance, which is no guarantee of future results, and current performance may be lower or higher than the figures shown. Performance assumes that all dividends and distributions, if any, were reinvested. For the most recent month-end performance figures, please visit www.morganstanley.com/im. Investment return and principal value will fluctuate so that Portfolio shares, when redeemed, may be worth more or less than their original cost. Total returns do not reflect the deduction of taxes that a shareholder would pay on Portfolio distributions or the redemption of Portfolio shares. Performance of share classes will vary due to difference in sales charges and expenses.
(1) The MSCI Frontier Markets Index is a free float-adjusted market capitalization index that is designed to measure equity market performance of frontier markets. The MSCI Frontier Markets Index currently consists of 23 frontier market country indices. The performance of the Index is calculated in U.S. dollars and assumes reinvestment of net dividends. "Net dividends" reflects a reduction in dividends after taking into account withholding of taxes by certain foreign countries represented in the Index. The Index is unmanaged and its returns do not include any sales charges or fees. Such costs would lower performance. It is not possible to invest directly in an index.
(2) The Lipper Emerging Market Funds Index is an equally weighted performance index of the largest qualifying funds (based on net assets) in the Lipper Emerging Market Funds classification. The Index, which is adjusted for capital gains distributions and income dividends, is unmanaged and should not be considered an investment. There are currently 30 funds represented in this Index. As of the date of this report, the Portfolio is in the Lipper Emerging Market Funds classification.
(3) Total returns for the Portfolio reflect fees waived and expenses reimbursed, if applicable, by the Adviser. Without such waivers and reimbursements, total returns would have been lower.
(4) On September 17, 2012, all assets of Morgan Stanley Frontier Emerging Markets Fund, Inc. (the "Predecessor Fund") were reorganized into Class I shares of Morgan Stanley Institutional Fund, Inc. Frontier Emerging Markets Portfolio ("the Portfolio"). Performance shown for Class I shares reflects the performance of the shares of the Predecessor Fund for periods prior to September 17, 2012. The Predecessor Fund may have performed differently if it were an open-end fund since closed-end funds are generally not subject to the cash flow fluctuations of an open-end fund. In addition, Class I shares' returns of the Portfolio will differ from the Predecessor Fund as they have different expenses. The Predecessor Fund commenced operations on August 25, 2008.
(5) Commenced offering on September 14, 2012.
(6) Commenced offering on February 27, 2015.
(7) Commenced offering on April 30, 2015.
(8) For comparative purposes, average annual since inception returns listed for the Indexes refer to the inception date of Class I of the Portfolio, not the inception of the Index.
6
Morgan Stanley Institutional Fund, Inc.
Annual Report — December 31, 2016
Portfolio of Investments
Frontier Emerging Markets Portfolio
| | | Shares | | Value
(000) | |
Common Stocks (99.4%) | |
Argentina (12.3%) | |
Banco Macro SA ADR | | | 358,616 | | | $ | 23,077 | | |
BBVA Banco Frances SA ADR | | | 1,019,382 | | | | 17,768 | | |
Grupo Financiero Galicia SA ADR | | | 496,670 | | | | 13,370 | | |
Pampa Energia SA ADR (a) | | | 313,966 | | | | 10,929 | | |
YPF SA ADR | | | 759,509 | | | | 12,532 | | |
| | | | 77,676 | | |
Bangladesh (5.4%) | |
Beximco Pharmaceuticals Ltd. | | | 10,694,408 | | | | 10,994 | | |
GrameenPhone Ltd. | | | 987,195 | | | | 3,568 | | |
Olympic Industries Ltd. | | | 4,949,962 | | | | 19,390 | | |
| | | | 33,952 | | |
Brazil (4.2%) | |
Adecoagro SA (a) | | | 902,623 | | | | 9,369 | | |
Arcos Dorados Holdings, Inc., Class A (a) | | | 1,171,953 | | | | 6,329 | | |
MercadoLibre, Inc. | | | 70,541 | | | | 11,014 | | |
| | | | 26,712 | | |
Egypt (3.7%) | |
Commercial International Bank Egypt SAE | | | 3,702,173 | | | | 14,917 | | |
Egyptian Financial Group-Hermes Holding Co. (a) | | | 4,597,834 | | | | 6,421 | | |
Egyptian Financial Group-Hermes
Holding Co. GDR (a) | | | 889,168 | | | | 2,005 | | |
| | | | 23,343 | | |
Kenya (5.1%) | |
East African Breweries Ltd. | | | 4,438,701 | | | | 10,743 | | |
Safaricom Ltd. | | | 115,405,519 | | | | 21,567 | | |
| | | | 32,310 | | |
Kuwait (9.3%) | |
Kuwait Projects Co., Holding KSCP | | | 3,439,013 | | | | 5,626 | | |
Mezzan Holding Co. KSCC | | | 2,863,728 | | | | 8,713 | | |
National Bank of Kuwait | | | 21,122,870 | | | | 44,920 | | |
| | | | 59,259 | | |
Morocco (4.1%) | |
Attijariwafa Bank | | | 467,310 | | | | 19,045 | | |
Societe d'Exploitation des Ports (a) | | | 604,867 | | | | 6,984 | | |
| | | | 26,029 | | |
Nigeria (3.0%) | |
Lafarge Africa PLC | | | 578 | | | | — | @ | |
Nigerian Breweries PLC | | | 28,062,330 | | | | 13,185 | | |
Zenith Bank PLC | | | 126,569,996 | | | | 5,831 | | |
| | | | 19,016 | | |
Pakistan (24.2%) | |
Habib Bank Ltd. | | | 11,378,800 | | | | 29,680 | | |
Honda Atlas Cars Pakistan Ltd. | | | 781,200 | | | | 5,015 | | |
K-Electric Ltd. (a) | | | 142,865,900 | | | | 12,798 | | |
Lucky Cement Ltd. | | | 3,971,862 | | | | 32,875 | | |
Maple Leaf Cement Factory Ltd. | | | 16,954,865 | | | | 20,646 | | |
Oil & Gas Development Co., Ltd. | | | 10,575,300 | | | | 16,768 | | |
| | | Shares | | Value
(000) | |
Pak Elektron Ltd. | | | 15,338,400 | | | $ | 10,435 | | |
United Bank Ltd. | | | 10,955,078 | | | | 25,032 | | |
| | | | 153,249 | | |
Panama (1.5%) | |
Copa Holdings SA, Class A | | | 106,646 | | | | 9,687 | | |
Romania (6.9%) | |
Banca Transilvania SA | | | 46,700,051 | | | | 25,832 | | |
BRD-Groupe Societe Generale SA | | | 6,466,879 | | | | 17,818 | | |
| | | | 43,650 | | |
South Africa (1.1%) | |
New Europe Property Investments PLC | | | 592,239 | | | | 6,857 | | |
Sri Lanka (2.1%) | |
Commercial Bank of Ceylon PLC | | | 13,607,223 | | | | 13,171 | | |
Tanzania, United Republic Of (2.6%) | |
National Microfinance Bank PLC | | | 6,718,721 | | | | 8,472 | | |
Tanzania Breweries Ltd. | | | 1,422,724 | | | | 7,828 | | |
| | | | 16,300 | | |
United Arab Emirates (4.8%) | |
Air Arabia PJSC | | | 26,387,213 | | | | 9,555 | | |
Aramex PJSC | | | 4,436,304 | | | | 4,916 | | |
NMC Health PLC | | | 849,636 | | | | 16,167 | | |
| | | | 30,638 | | |
United States (1.8%) | |
Globant SA (a) | | | 338,336 | | | | 11,284 | | |
Vietnam (7.3%) | |
Bank for Foreign Trade of Vietnam JSC | | | 12,360,573 | | | | 19,243 | | |
Masan Group Corp. (a) | | | 3,276,910 | | | | 9,325 | | |
Vietnam Dairy Products JSC | | | 3,164,740 | | | | 17,456 | | |
| | | | 46,024 | | |
Total Common Stocks (Cost $551,055) | | | 629,157 | | |
Participation Note (0.2%) | |
United Arab Emirates (0.2%) | |
Aramex PJSC, Equity Linked Notes,
expires 3/14/19 (a)
(Cost $995) | | | 1,131,685 | | | | 1,254 | | |
Short-Term Investment (0.7%) | |
Investment Company (0.7%) | |
Morgan Stanley Institutional Liquidity
Funds — Government Portfolio —
Institutional Class (See Note G)
(Cost $4,479) | | | 4,478,785 | | | | 4,479 | | |
Total Investments (100.3%) (Cost $556,529) (b) | | | 634,890 | | |
Liabilities in Excess of Other Assets (–0.3%) | | | (1,799 | ) | |
Net Assets (100.0%) | | $ | 633,091 | | |
Country assignments and aggregations are based generally on third party vendor classifications and information, and may be different from the assignments and aggregations under the policies set forth in the Portfolio's prospectus and/or statement of additional information relating to geographic classifications.
The accompanying notes are an integral part of the financial statements.
7
Morgan Stanley Institutional Fund, Inc.
Annual Report — December 31, 2016
Portfolio of Investments (cont'd)
Frontier Emerging Markets Portfolio
(a) Non-income producing security.
(b) At December 31, 2016, the aggregate cost for federal income tax purposes is approximately $559,176,000. The aggregate gross unrealized appreciation is approximately $124,972,000 and the aggregate gross unrealized depreciation is approximately $49,258,000, resulting in net unrealized appreciation of approximately $75,714,000.
@ Value is less than $500.
ADR American Depositary Receipt.
GDR Global Depositary Receipt.
PJSC Public Joint Stock Company.
Portfolio Composition
Classification | | Percentage of
Total Investments | |
Banks | | | 43.8 | % | |
Other* | | | 32.7 | | |
Food Products | | | 10.1 | | |
Construction Materials | | | 8.4 | | |
Beverages | | | 5.0 | | |
Total Investments | | | 100.0 | % | |
* Industries and/or investment types representing less than 5% of total investments.
The accompanying notes are an integral part of the financial statements.
8
Morgan Stanley Institutional Fund, Inc.
Annual Report — December 31, 2016
Frontier Emerging Markets Portfolio
Statement of Assets and Liabilities | | December 31, 2016
(000) | |
Assets: | |
Investments in Securities of Unaffiliated Issuers, at Value (Cost $552,050) | | $ | 630,411 | | |
Investment in Security of Affiliated Issuer, at Value (Cost $4,479) | | | 4,479 | | |
Total Investments in Securities, at Value (Cost $556,529) | | | 634,890 | | |
Foreign Currency, at Value (Cost $16,052) | | | 16,078 | | |
Receivable for Portfolio Shares Sold | | | 1,883 | | |
Dividends Receivable | | | 347 | | |
Receivable for Investments Sold | | | 65 | | |
Receivable from Affiliate | | | 5 | | |
Tax Reclaim Receivable | | | 3 | | |
Other Assets | | | 55 | | |
Total Assets | | | 653,326 | | |
Liabilities: | |
Deferred Capital Gain Country Tax | | | 8,834 | | |
Payable for Investments Purchased | | | 7,663 | | |
Payable for Advisory Fees | | | 2,008 | | |
Payable for Portfolio Shares Redeemed | | | 959 | | |
Payable for Custodian Fees | | | 531 | | |
Payable for Professional Fees | | | 76 | | |
Payable for Sub Transfer Agency Fees — Class I | | | 44 | | |
Payable for Sub Transfer Agency Fees — Class A | | | 17 | | |
Payable for Sub Transfer Agency Fees — Class L | | | 1 | | |
Payable for Sub Transfer Agency Fees — Class C | | | — | @ | |
Payable for Administration Fees | | | 42 | | |
Payable for Shareholder Services Fees — Class A | | | 19 | | |
Payable for Distribution and Shareholder Services Fees — Class L | | | 2 | | |
Payable for Distribution and Shareholder Services Fees — Class C | | | 2 | | |
Payable for Transfer Agency Fees — Class I | | | 7 | | |
Payable for Transfer Agency Fees — Class A | | | 1 | | |
Payable for Transfer Agency Fees — Class L | | | 4 | | |
Payable for Transfer Agency Fees — Class C | | | 1 | | |
Payable for Transfer Agency Fees — Class IS | | | 1 | | |
Other Liabilities | | | 23 | | |
Total Liabilities | | | 20,235 | | |
Net Assets | | $ | 633,091 | | |
Net Assets Consist Of: | |
Paid-in-Capital | | $ | 697,681 | | |
Distributions in Excess of Net Investment Income | | | (253 | ) | |
Accumulated Net Realized Loss | | | (134,781 | ) | |
Unrealized Appreciation (Depreciation) on: | |
Investments (Net of $7,915 of Deferred Capital Gain Country Tax) | | | 70,446 | | |
Foreign Currency Translations | | | (2 | ) | |
Net Assets | | $ | 633,091 | | |
The accompanying notes are an integral part of the financial statements.
9
Morgan Stanley Institutional Fund, Inc.
Annual Report — December 31, 2016
Frontier Emerging Markets Portfolio
Statement of Assets and Liabilities (cont'd) | | December 31, 2016
(000) | |
CLASS I: | |
Net Assets | | $ | 525,664 | | |
| Shares Outstanding $0.001 par value shares of beneficial interest (unlimited shares authorized) (not in 000's) | | | 30,221,597 | | |
Net Asset Value, Offering and Redemption Price Per Share | | $ | 17.39 | | |
CLASS A: | |
Net Assets | | $ | 90,817 | | |
| Shares Outstanding $0.001 par value shares of beneficial interest (unlimited shares authorized) (not in 000's) | | | 5,245,961 | | |
Net Asset Value, Redemption Price Per Share | | $ | 17.31 | | |
Maximum Sales Load | | | 5.25 | % | |
Maximum Sales Charge | | $ | 0.96 | | |
Maximum Offering Price Per Share | | $ | 18.27 | | |
CLASS L: | |
Net Assets | | $ | 2,630 | | |
| Shares Outstanding $0.001 par value shares of beneficial interest (unlimited shares authorized) (not in 000's) | | | 152,453 | | |
Net Asset Value, Offering and Redemption Price Per Share | | $ | 17.25 | | |
CLASS C: | |
Net Assets | | $ | 1,925 | | |
| Shares Outstanding $0.001 par value shares of beneficial interest (unlimited shares authorized) (not in 000's) | | | 112,773 | | |
Net Asset Value, Offering and Redemption Price Per Share | | $ | 17.07 | | |
CLASS IS: | |
Net Assets | | $ | 12,055 | | |
| Shares Outstanding $0.001 par value shares of beneficial interest (unlimited shares authorized) (not in 000's) | | | 693,375 | | |
Net Asset Value, Offering and Redemption Price Per Share | | $ | 17.39 | | |
@ Amount is less than $500.
The accompanying notes are an integral part of the financial statements.
10
Morgan Stanley Institutional Fund, Inc.
Annual Report — December 31, 2016
Frontier Emerging Markets Portfolio
Statement of Operations | | Year Ended
December 31, 2016
(000) | |
Investment Income: | |
Dividends from Securities of Unaffiliated Issuers (Net of $2,326 of Foreign Taxes Withheld) | | $ | 22,048 | | |
Dividends from Security of Affiliated Issuer (Note G) | | | 40 | | |
Total Investment Income | | | 22,088 | | |
Expenses: | |
Advisory Fees (Note B) | | | 7,935 | | |
Custodian Fees (Note F) | | | 1,570 | | |
Administration Fees (Note C) | | | 508 | | |
Sub Transfer Agency Fees — Class I | | | 342 | | |
Sub Transfer Agency Fees — Class A | | | 140 | | |
Sub Transfer Agency Fees — Class L | | | 2 | | |
Sub Transfer Agency Fees — Class C | | | 2 | | |
Shareholder Services Fees — Class A (Note D) | | | 223 | | |
Distribution and Shareholder Services Fees — Class L (Note D) | | | 28 | | |
Distribution and Shareholder Services Fees — Class C (Note D) | | | 16 | | |
Registration Fees | | | 116 | | |
Transfer Agency Fees — Class I (Note E) | | | 33 | | |
Transfer Agency Fees — Class A (Note E) | | | 5 | | |
Transfer Agency Fees — Class L (Note E) | | | 14 | | |
Transfer Agency Fees — Class C (Note E) | | | 2 | | |
Transfer Agency Fees — Class IS (Note E) | | | 2 | | |
Shareholder Reporting Fees | | | 43 | | |
Professional Fees | | | 38 | | |
Directors' Fees and Expenses | | | 17 | | |
Pricing Fees | | | 6 | | |
Other Expenses | | | 27 | | |
Total Expenses | | | 11,069 | | |
Rebate from Morgan Stanley Affiliate (Note G) | | | (16 | ) | |
Reimbursement of Class Specific Expenses — Class L (Note B) | | | (3 | ) | |
Reimbursement of Class Specific Expenses — Class IS (Note B) | | | (— | @) | |
Reimbursement of Custodian Fees (Note F) | | | (87 | ) | |
Net Expenses | | | 10,963 | | |
Net Investment Income | | | 11,125 | | |
Realized Loss: | |
Investments Sold (Net of $571 of Capital Gain Country Tax) | | | (62,936 | ) | |
Foreign Currency Transactions | | | (2,715 | ) | |
Net Realized Loss | | | (65,651 | ) | |
Change in Unrealized Appreciation (Depreciation): | |
Investments (Net of Increase in Deferred Capital Gain Country Tax of $5,638) | | | 79,449 | | |
Foreign Currency Translations | | | 2 | | |
Net Change in Unrealized Appreciation (Depreciation) | | | 79,451 | | |
Net Realized Loss and Change in Unrealized Appreciation (Depreciation) | | | 13,800 | | |
Net Increase in Net Assets Resulting from Operations | | $ | 24,925 | | |
@ Amount is less than $500.
The accompanying notes are an integral part of the financial statements.
11
Morgan Stanley Institutional Fund, Inc.
Annual Report — December 31, 2016
Frontier Emerging Markets Portfolio
Statements of Changes in Net Assets | | Year Ended
December 31, 2016
(000) | | Year Ended
December 31, 2015
(000) | |
Increase (Decrease) in Net Assets: | |
Operations: | |
Net Investment Income | | $ | 11,125 | | | $ | 6,447 | | |
Net Realized Loss | | | (65,651 | ) | | | (49,804 | ) | |
Net Change in Unrealized Appreciation (Depreciation) | | | 79,451 | | | | (31,051 | ) | |
Net Increase (Decrease) in Net Assets Resulting from Operations | | | 24,925 | | | | (74,408 | ) | |
Distributions from and/or in Excess of: | |
Class I: | |
Net Investment Income | | | (6,910 | ) | | | (4,515 | ) | |
Paid-in-Capital | | | (132 | ) | | | (211 | ) | |
Class A: | |
Net Investment Income | | | (900 | ) | | | (376 | ) | |
Paid-in-Capital | | | (23 | ) | | | (18 | ) | |
Class L: | |
Net Investment Income | | | (2 | ) | | | — | | |
Paid-in-Capital | | | (1 | ) | | | |
Class C: | |
Net Investment Income | | | (5 | ) | | | (7 | ) | |
Paid-in-Capital | | | (1 | ) | | | (— | @) | |
Class IS: | |
Net Investment Income | | | (163 | ) | | | (69 | ) | |
Paid-in-Capital | | | (3 | ) | | | (3 | ) | |
Total Distributions | | | (8,140 | ) | | | (5,199 | ) | |
Capital Share Transactions:(1) | |
Class I: | |
Subscribed | | | 227,451 | | | | 378,909 | | |
Distributions Reinvested | | | 4,530 | | | | 3,040 | | |
Redeemed | | | (252,360 | ) | | | (332,045 | ) | |
Class A: | |
Subscribed | | | 33,925 | | | | 59,471 | | |
Distributions Reinvested | | | 923 | | | | 394 | | |
Redeemed | | | (28,799 | ) | | | (45,079 | ) | |
Class L: | |
Subscribed | | | — | | | | 1,339 | | |
Distributions Reinvested | | | 3 | | | | — | | |
Redeemed | | | (1,934 | ) | | | (4,069 | ) | |
Class C: | |
Subscribed | | | 663 | | | | 1,531 | * | |
Distributions Reinvested | | | 6 | | | | 7 | * | |
Redeemed | | | (193 | ) | | | (34 | )* | |
Class IS: | |
Subscribed | | | 4,172 | | | | 43,080 | ** | |
Distributions Reinvested | | | 166 | | | | 72 | ** | |
Redeemed | | | (295 | ) | | | (31,422 | )** | |
Net Increase (Decrease) in Net Assets Resulting from Capital Share Transactions | | | (11,742 | ) | | | 75,194 | | |
Redemption Fees | | | 19 | | | | 65 | | |
Total Increase (Decrease) in Net Assets | | | 5,062 | | | | (4,348 | ) | |
Net Assets: | |
Beginning of Period | | | 628,029 | | | | 632,377 | | |
End of Period (Including Distributions in Excess of Net Investment Income of $(253) and $(112) | | $ | 633,091 | | | $ | 628,029 | | |
The accompanying notes are an integral part of the financial statements.
12
Morgan Stanley Institutional Fund, Inc.
Annual Report — December 31, 2016
Frontier Emerging Markets Portfolio
Statements of Changes in Net Assets (cont'd) | | Year Ended
December 31, 2016
(000) | | Year Ended
December 31, 2015
(000) | |
(1) Capital Share Transactions: | |
Class I: | |
Shares Subscribed | | | 13,505 | | | | 20,657 | | |
Shares Issued on Distributions Reinvested | | | 267 | | | | 181 | | |
Shares Redeemed | | | (14,884 | ) | | | (18,098 | ) | |
Net Increase (Decrease) in Class I Shares Outstanding | | | (1,112 | ) | | | 2,740 | | |
Class A: | |
Shares Subscribed | | | 2,007 | | | | 3,267 | | |
Shares Issued on Distributions Reinvested | | | 55 | | | | 24 | | |
Shares Redeemed | | | (1,697 | ) | | | (2,442 | ) | |
Net Increase in Class A Shares Outstanding | | | 365 | | | | 849 | | |
Class L: | |
Shares Subscribed | | | — | | | | 70 | | |
Shares Issued on Distributions Reinvested | | | — | @@ | | | — | | |
Shares Redeemed | | | (115 | ) | | | (225 | ) | |
Net Decrease in Class L Shares Outstanding | | | (115 | ) | | | (155 | ) | |
Class C: | |
Shares Subscribed | | | 41 | | | | 86 | * | |
Shares Issued on Distributions Reinvested | | | — | @@ | | | — | @@* | |
Shares Redeemed | | | (12 | ) | | | (2 | )* | |
Net Increase in Class C Shares Outstanding | | | 29 | | | | 84 | | |
Class IS: | |
Shares Subscribed | | | 245 | | | | 2,259 | ** | |
Shares Issued on Distributions Reinvested | | | 10 | | | | 4 | ** | |
Shares Redeemed | | | (17 | ) | | | (1,807 | )** | |
Net Increase in Class IS Shares Outstanding | | | 238 | | | | 456 | | |
* For the period April 30, 2015 through December 31, 2015.
** For the period February 27, 2015 through December 31, 2015.
@ Amount is less than $500.
@@ Amount is less than 500 shares.
The accompanying notes are an integral part of the financial statements.
13
Morgan Stanley Institutional Fund, Inc.
Annual Report — December 31, 2016
Financial Highlights
Frontier Emerging Markets Portfolio
| | | Class I | |
| | | Year Ended December 31, | | Period from
November 1,
2012 to | | | |
| | | | | December 31, | | Year Ended | |
Selected Per Share Data and Ratios | | 2016(1) | | 2015 | | 2014 | | 2013 | | 2012 | | October 31, 2012(2) | |
Net Asset Value, Beginning of Period | | $ | 16.98 | | | $ | 19.15 | | | $ | 18.86 | | | $ | 14.24 | | | $ | 14.00 | | | $ | 12.75 | | |
Income (Loss) from Investment Operations: | |
Net Investment Income (Loss) (3) | | | 0.31 | | | | 0.19 | | | | 0.25 | | | | 0.09 | | | | (0.03 | ) | | | 0.19 | | |
Net Realized and Unrealized Gain (Loss) | | | 0.33 | | | | (2.21 | ) | | | 0.23 | | | | 4.60 | | | | 0.56 | | | | 1.26 | | |
Total from Investment Operations | | | 0.64 | | | | (2.02 | ) | | | 0.48 | | | | 4.69 | | | | 0.53 | | | | 1.45 | | |
Distributions from and/or in Excess of: | |
Net Investment Income | | | (0.23 | ) | | | (0.14 | ) | | | (0.18 | ) | | | (0.07 | ) | | | (0.30 | ) | | | (0.22 | ) | |
Paid-in-Capital | | | (0.00 | )(4) | | | (0.01 | ) | | | (0.01 | ) | | | — | | | | — | | | | — | | |
Total Distributions | | | (0.23 | ) | | | (0.15 | ) | | | (0.19 | ) | | | (0.07 | ) | | | (0.30 | ) | | | (0.22 | ) | |
Redemption Fees | | | 0.00 | (4) | | | 0.00 | (4) | | | 0.00 | (4) | | | 0.00 | (4) | | | 0.01 | | | | 0.02 | | |
Net Asset Value, End of Period | | $ | 17.39 | | | $ | 16.98 | | | $ | 19.15 | | | $ | 18.86 | | | $ | 14.24 | | | $ | 14.00 | | |
Total Return (5) | | | 3.83 | % | | | (10.58 | )% | | | 2.66 | % | | | 32.95 | % | | | 3.94 | %(8) | | | 12.03 | % | |
Ratios and Supplemental Data: | |
Net Assets, End of Period (Thousands) | | $ | 525,664 | | | $ | 531,927 | | | $ | 547,535 | | | $ | 239,378 | | | $ | 51,415 | | | $ | 58,729 | | |
Ratio of Expenses to Average Net Assets (10) | | | 1.67 | %(6) | | | 1.72 | %(6) | | | 1.69 | %(6) | | | 1.77 | %(6) | | | 1.85 | %(6)(9) | | | 2.38 | %(6) | |
Ratio of Expenses to Average Net Assets Excluding
Non Operating Expenses | | | N/A | | | | N/A | | | | 1.71 | %(6) | | | N/A | | | | N/A | | | | 2.38 | %(6) | |
Ratio of Net Investment Income (Loss) to Average
Net Assets (10) | | | 1.82 | %(6) | | | 1.02 | %(6) | | | 1.23 | %(6) | | | 0.54 | %(6) | | | (1.23 | )%(6)(9) | | | 1.47 | %(6) | |
Ratio of Rebate from Morgan Stanley Affiliates to
Average Net Assets | | | 0.00 | %(7) | | | 0.00 | %(7) | | | 0.01 | % | | | 0.01 | % | | | 0.00 | %(7)(9) | | | 0.01 | % | |
Portfolio Turnover Rate | | | 30 | % | | | 37 | % | | | 52 | % | | | 34 | % | | | 13 | %(8) | | | 59 | % | |
(10) Supplemental Information on the Ratios to Average Net Assets: | |
Ratios Before Expense Limitation: | |
Expenses to Average Net Assets | | | 1.69 | % | | | N/A | | | | 1.72 | % | | | 1.89 | % | | | 3.31 | %(9) | | | 2.47 | % | |
Net Investment Income (Loss) to Average
Net Assets | | | 1.80 | % | | | N/A | | | | 1.20 | % | | | 0.42 | % | | | (2.69 | )%(9) | | | 1.38 | % | |
(1) Refer to Note F in the Notes to Financial Statements for discussion of prior period custodian out-of pocket expenses that were reimbursed in the current period. The amount of the reimbursement was immaterial on a per share basis and did not impact the total return of Class I shares. The Ratio of Expenses to Average Net Assets would have been 0.01% higher and the Ratio of Net Investment Income to Average Net Assets would have been 0.01% lower had the custodian not reimbursed the Portfolio.
(2) On September 17, 2012, all assets of Morgan Stanley Frontier Emerging Markets Fund, Inc. (the "Predecessor Fund") were reorganized into Class I shares of Morgan Stanley Institutional Fund, Inc. Frontier Emerging Markets Portfolio (the "Portfolio"). Per share data and ratios shown for Class I shares reflects the historical per share data and performance of the Predecessor Fund for periods prior to September 17, 2012.
(3) Per share amount is based on average shares outstanding.
(4) Amount is less than $0.005 per share.
(5) Calculated based on the net asset value as of the last business day of the period.
(6) The Ratios of Expenses and Net Investment Income (Loss) reflect the rebate of certain Portfolio expenses in connection with the investments in Morgan Stanley affiliates during the period. The effect of the rebate on the ratios is disclosed in the above table as "Ratio of Rebate from Morgan Stanley Affiliates to Average Net Assets."
(7) Amount is less than 0.005%.
(8) Not Annualized.
(9) Annualized.
The accompanying notes are an integral part of the financial statements.
14
Morgan Stanley Institutional Fund, Inc.
Annual Report — December 31, 2016
Financial Highlights
Frontier Emerging Markets Portfolio
| | | Class A | |
| | | Year Ended December 31, | | Period from
November 1,
2012 to
December 31, | | Period from
September 14,
2012(2) to
October 31, | |
Selected Per Share Data and Ratios | | 2016(1) | | 2015 | | 2014 | | 2013 | | 2012 | | 2012 | |
Net Asset Value, Beginning of Period | | $ | 16.90 | | | $ | 19.06 | | | $ | 18.78 | | | $ | 14.20 | | | $ | 13.97 | | | $ | 13.76 | | |
Income (Loss) from Investment Operations: | |
Net Investment Income (Loss) (3) | | | 0.24 | | | | 0.11 | | | | 0.18 | | | | (0.15 | ) | | | (0.03 | ) | | | (0.02 | ) | |
Net Realized and Unrealized Gain (Loss) | | | 0.35 | | | | (2.18 | ) | | | 0.24 | | | | 4.79 | | | | 0.56 | | | | 0.23 | | |
Total from Investment Operations | | | 0.59 | | | | (2.07 | ) | | | 0.42 | | | | 4.64 | | | | 0.53 | | | | 0.21 | | |
Distributions from and/or in Excess of: | |
Net Investment Income | | | (0.18 | ) | | | (0.08 | ) | | | (0.13 | ) | | | (0.06 | ) | | | (0.30 | ) | | | — | | |
Paid-in-Capital | | | (0.00 | )(4) | | | (0.01 | ) | | | (0.01 | ) | | | — | | | | — | | | | — | | |
Total Distributions | | | (0.18 | ) | | | (0.09 | ) | | | (0.14 | ) | | | (0.06 | ) | | | (0.30 | ) | | | — | | |
Redemption Fees | | | 0.00 | (4) | | | 0.00 | (4) | | | 0.00 | (4) | | | 0.00 | (4) | | | — | | | | — | | |
Net Asset Value, End of Period | | $ | 17.31 | | | $ | 16.90 | | | $ | 19.06 | | | $ | 18.78 | | | $ | 14.20 | | | $ | 13.97 | | |
Total Return (5) | | | 3.49 | % | | | (10.90 | )% | | | 2.39 | % | | | 32.53 | % | | | 3.77 | %(9) | | | 1.67 | %(9) | |
Ratios and Supplemental Data: | |
Net Assets, End of Period (Thousands) | | $ | 90,817 | | | $ | 82,480 | | | $ | 76,839 | | | $ | 23,762 | | | $ | 10 | | | $ | 10 | | |
Ratio of Expenses to Average Net Assets (11) | | | 2.01 | %(6) | | | 2.07 | %(6) | | | 2.02 | %(6) | | | 1.95 | %(6)(7) | | | 2.10 | %(6)(10) | | | 2.10 | %(6)(10) | |
Ratio of Expenses to Average Net Assets Excluding
Non Operating Expenses | | | N/A | | | | N/A | | | | 2.04 | %(6) | | | N/A | | | | N/A | | | | 2.09 | %(6)(10) | |
Ratio of Net Investment Income (Loss) to Average
Net Assets (11) | | | 1.40 | %(6) | | | 0.60 | %(6) | | | 0.90 | %(6) | | | (0.81 | )%(6) | | | (1.48 | )%(6)(10) | | | (0.88 | )%(6)(10) | |
Ratio of Rebate from Morgan Stanley Affiliates to
Average Net Assets | | | 0.00 | %(8) | | | 0.00 | %(8) | | | 0.01 | % | | | 0.01 | % | | | 0.00 | %(8)(10) | | | 0.01 | %(10) | |
Portfolio Turnover Rate | | | 30 | % | | | 37 | % | | | 52 | % | | | 34 | % | | | 13 | %(9) | | | 59 | %(9) | |
(11) Supplemental Information on the Ratios to Average Net Assets: | |
Ratios Before Expense Limitation: | |
Expenses to Average Net Assets | | | 2.03 | % | | | N/A | | | | 2.05 | % | | | N/A | | | | 3.56 | %(10) | | | 2.92 | %(10) | |
Net Investment Income (Loss) to Average Net Assets | | | 1.38 | % | | | N/A | | | | 0.87 | % | | | N/A | | | | (2.94 | )%(10) | | | (1.70 | )%(10) | |
(1) Refer to Note F in the Notes to Financial Statements for discussion of prior period custodian out-of pocket expenses that were reimbursed in the current period. The amount of the reimbursement was immaterial on a per share basis and did not impact the total return of Class A shares. The Ratio of Expenses to Average Net Assets would have been 0.01% higher and the Ratio of Net Investment Income to Average Net Assets would have been 0.01% lower had the custodian not reimbursed the Portfolio.
(2) Commencement of Offering.
(3) Per share amount is based on average shares outstanding.
(4) Amount is less than $0.005 per share.
(5) Calculated based on the net asset value which does not reflect sales charges, if applicable, as of the last business day of the period.
(6) The Ratios of Expenses and Net Investment Income (Loss) reflect the rebate of certain Portfolio expenses in connection with the investments in Morgan Stanley affiliates during the period. The effect of the rebate on the ratios is disclosed in the above table as "Ratio of Rebate from Morgan Stanley Affiliates to Average Net Assets."
(7) Effective September 16, 2013, the Adviser has agreed to limit the ratio of expenses to average net assets to the maximum ratio of 2.20% for Class A shares. Prior to September 16, 2013, the maximum ratio was 2.10% for Class A shares.
(8) Amount is less than 0.005%.
(9) Not Annualized.
(10) Annualized.
The accompanying notes are an integral part of the financial statements.
15
Morgan Stanley Institutional Fund, Inc.
Annual Report — December 31, 2016
Financial Highlights
Frontier Emerging Markets Portfolio
| | | Class L | |
| | | Year Ended December 31, | | Period from
November 1,
2012 to
December 31, | | Period from
September 14,
2012(2) to
October 31, | |
Selected Per Share Data and Ratios | | 2016(1) | | 2015 | | 2014 | | 2013 | | 2012 | | 2012 | |
Net Asset Value, Beginning of Period | | $ | 16.79 | | | $ | 18.96 | | | $ | 18.71 | | | $ | 14.19 | | | $ | 13.96 | | | $ | 13.76 | | |
Income (Loss) from Investment Operations: | |
Net Investment Income (Loss) (3) | | | 0.15 | | | | 0.05 | | | | 0.06 | | | | (0.16 | ) | | | (0.05 | ) | | | (0.02 | ) | |
Net Realized and Unrealized Gain (Loss) | | | 0.32 | | | | (2.22 | ) | | | 0.25 | | | | 4.69 | | | | 0.57 | | | | 0.22 | | |
Total from Investment Operations | | | 0.47 | | | | (2.17 | ) | | | 0.31 | | | | 4.53 | | | | 0.52 | | | | 0.20 | | |
Distributions from and/or in Excess of: | |
Net Investment Income | | | (0.01 | ) | | | — | | | | (0.05 | ) | | | (0.01 | ) | | | (0.29 | ) | | | — | | |
Paid-in-Capital | | | (0.00 | )(4) | | | — | | | | (0.01 | ) | | | — | | | | — | | | | — | | |
Total Distributions | | | (0.01 | ) | | | — | | | | (0.06 | ) | | | (0.01 | ) | | | (0.29 | ) | | | — | | |
Redemption Fees | | | 0.00 | (4) | | | 0.00 | (4) | | | 0.00 | (4) | | | 0.00 | (4) | | | — | | | | — | | |
Net Asset Value, End of Period | | $ | 17.25 | | | $ | 16.79 | | | $ | 18.96 | | | $ | 18.71 | | | $ | 14.19 | | | $ | 13.96 | | |
Total Return (5) | | | 2.77 | % | | | (11.49 | )% | | | 1.77 | % | | | 31.81 | % | | | 3.71 | %(9) | | | 1.60 | %(9) | |
Ratios and Supplemental Data: | |
Net Assets, End of Period (Thousands) | | $ | 2,630 | | | $ | 4,490 | | | $ | 8,003 | | | $ | 3,212 | | | $ | 10 | | | $ | 10 | | |
Ratio of Expenses to Average Net Assets (11) | | | 2.70 | %(6) | | | 2.70 | %(6) | | | 2.65 | %(6) | | | 2.53 | %(6)(7) | | | 2.60 | %(6)(10) | | | 2.60 | %(6)(10) | |
Ratio of Expenses to Average Net Assets Excluding
Non Operating Expenses | | | N/A | | | | N/A | | | | 2.67 | %(6) | | | N/A | | | | N/A | | | | 2.59 | %(6)(10) | |
Ratio of Net Investment Income (Loss) to Average
Net Assets (11) | | | 0.88 | %(6) | | | 0.26 | %(6) | | | 0.27 | %(6) | | | (0.92 | )%(6) | | | (1.98 | )%(6)(10) | | | (1.37 | )%(6)(10) | |
Ratio of Rebate from Morgan Stanley Affiliates to Average
Net Assets | | | 0.00 | %(8) | | | 0.00 | %(8) | | | 0.01 | % | | | 0.00 | %(8) | | | 0.00 | %(8)(10) | | | 0.01 | %(10) | |
Portfolio Turnover Rate | | | 30 | % | | | 37 | % | | | 52 | % | | | 34 | % | | | 13 | %(9) | | | 59 | %(9) | |
(11) Supplemental Information on the Ratios to Average Net Assets: | |
Ratios Before Expense Limitation: | |
Expenses to Average Net Assets | | | 2.80 | % | | | 2.73 | % | | | 2.68 | % | | | N/A | | | | 4.08 | %(10) | | | 3.49 | %(10) | |
Net Investment Income (Loss) to Average Net Assets | | | 0.78 | % | | | 0.23 | % | | | 0.24 | % | | | N/A | | | | (3.46 | )%(10) | | | (2.26 | )%(10) | |
(1) Refer to Note F in the Notes to Financial Statements for discussion of prior period custodian out-of pocket expenses that were reimbursed in the current period. The amount of the reimbursement was immaterial on a per share basis and did not impact the total return of Class L shares. The Ratio of Expenses to Average Net Assets and the Ratio of Net Investment Income to Average Net Assets would be unchanged as the reimbursement of custodian fees was offset against current period expense waivers/reimbursements with no impact to net expenses or net investment income.
(2) Commencement of Offering.
(3) Per share amount is based on average shares outstanding.
(4) Amount is less than $0.005 per share.
(5) Calculated based on the net asset value as of the last business day of the period.
(6) The Ratios of Expenses and Net Investment Income (Loss) reflect the rebate of certain Portfolio expenses in connection with the investments in Morgan Stanley affiliates during the period. The effect of the rebate on the ratios is disclosed in the above table as "Ratio of Rebate from Morgan Stanley Affiliates to Average Net Assets."
(7) Effective September 16, 2013, the Adviser has agreed to limit the ratio of expenses to average net assets to the maximum ratio of 2.70% for Class L shares. Prior to September 16, 2013, the maximum ratio was 2.60% for Class L shares.
(8) Amount is less than 0.005%.
(9) Not Annualized.
(10) Annualized.
The accompanying notes are an integral part of the financial statements.
16
Morgan Stanley Institutional Fund, Inc.
Annual Report — December 31, 2016
Financial Highlights
Frontier Emerging Markets Portfolio
| | | Class C | |
Selected Per Share Data and Ratios | | Year Ended
December 31, 2016(1) | | Period from
April 30, 2015(2) to
December 31, 2015 | |
Net Asset Value, Beginning of Period | | $ | 16.69 | | | $ | 19.53 | | |
Income (Loss) from Investment Operations: | |
Net Investment Income (Loss) (3) | | | 0.10 | | | | (0.16 | ) | |
Net Realized and Unrealized Gain (Loss) | | | 0.34 | | | | (2.60 | ) | |
Total from Investment Operations | | | 0.44 | | | | (2.76 | ) | |
Distributions from and/or in Excess of: | |
Net Investment Income | | | (0.06 | ) | | | (0.07 | ) | |
Paid-in-Capital | | | (0.00 | )(4) | | | (0.01 | ) | |
Total Distributions | | | (0.06 | ) | | | (0.08 | ) | |
Redemption Fees | | | 0.00 | (4) | | | 0.00 | (4) | |
Net Asset Value, End of Period | | $ | 17.07 | | | $ | 16.69 | | |
Total Return (5) | | | 2.63 | % | | | (14.10 | )%(8) | |
Ratios and Supplemental Data: | |
Net Assets, End of Period (Thousands) | | $ | 1,925 | | | $ | 1,400 | | |
Ratio of Expenses to Average Net Assets (10) | | | 2.88 | %(6) | | | 2.95 | %(6)(9) | |
Ratio of Net Investment Income (Loss) to Average Net Assets (10) | | | 0.57 | %(6) | | | (1.38 | )%(6)(9) | |
Ratio of Rebate from Morgan Stanley Affiliates to Average Net Assets | | | 0.00 | %(7) | | | 0.00 | %(7)(9) | |
Portfolio Turnover Rate | | | 30 | % | | | 37 | % | |
(10) Supplemental Information on the Ratios to Average Net Assets: | |
Ratios Before Expense Limitation: | |
Expense to Average Net Assets | | | 2.89 | % | | | 3.17 | %(9) | |
Net Investment Income (Loss) to Average Net Assets | | | 0.56 | % | | | (1.60 | )%(9) | |
(1) Refer to Note F in the Notes to Financial Statements for discussion of prior period custodian out-of pocket expenses that were reimbursed in the current period. The amount of the reimbursement was immaterial on a per share basis and did not impact the total return of Class C shares. The Ratio of Expenses to Average Net Assets would have been 0.01% higher and the Ratio of Net Investment Income to Average Net Assets would have been 0.01% lower had the custodian not reimbursed the Portfolio.
(2) Commencement of Offering.
(3) Per share amount is based on average shares outstanding.
(4) Amount is less than $0.005 per share.
(5) Calculated based on the net asset value which does not reflect sales charges, if applicable, as of the last business day of the period.
(6) The Ratios of Expenses and Net Investment Income (Loss) reflect the rebate of certain Portfolio expenses in connection with the investments in Morgan Stanley affiliates during the period. The effect of the rebate on the ratios is disclosed in the above table as "Ratio of Rebate from Morgan Stanley Affiliates to Average Net Assets."
(7) Amount is less than 0.005%
(8) Not Annualized.
(9) Annualized.
The accompanying notes are an integral part of the financial statements.
17
Morgan Stanley Institutional Fund, Inc.
Annual Report — December 31, 2016
Financial Highlights
Frontier Emerging Markets Portfolio
| | | Class IS | |
Selected Per Share Data and Ratios | | Year Ended
December 31, 2016(1) | | Period from
February 27, 2015(2) to
December 31, 2015 | |
Net Asset Value, Beginning of Period | | $ | 16.97 | | | $ | 19.28 | | |
Income (Loss) from Investment Operations: | |
Net Investment Income (3) | | | 0.30 | | | | 0.26 | | |
Net Realized and Unrealized Gain (Loss) | | | 0.36 | | | | (2.41 | ) | |
Total from Investment Operations | | | 0.66 | | | | (2.15 | ) | |
Distributions from and/or in Excess of: | |
Net Investment Income | | | (0.24 | ) | | | (0.15 | ) | |
Paid-in-Capital | | | (0.00 | )(4) | | | (0.01 | ) | |
Total Distributions | | | (0.24 | ) | | | (0.16 | ) | |
Redemption Fees | | | 0.00 | (4) | | | 0.00 | (4) | |
Net Asset Value, End of Period | | $ | 17.39 | | | $ | 16.97 | | |
Total Return (5) | | | 3.88 | % | | | (11.14 | )%(8) | |
Ratios and Supplemental Data: | |
Net Assets, End of Period (Thousands) | | $ | 12,055 | | | $ | 7,732 | | |
Ratio of Expenses to Average Net Assets (10) | | | 1.62 | %(6) | | | 1.68 | %(6)(9) | |
Ratio of Net Investment Income to Average Net Assets (10) | | | 1.75 | %(6) | | | 1.67 | %(6)(9) | |
Ratio of Rebate from Morgan Stanley Affiliates to Average Net Assets | | | 0.00 | %(7) | | | 0.00 | %(7)(9) | |
Portfolio Turnover Rate | | | 30 | % | | | 37 | % | |
(10) Supplemental Information on the Ratios to Average Net Assets: | |
Ratios Before Expense Limitation: | |
Expenses to Average Net Assets | | | 1.64 | % | | | 1.68 | %(9) | |
Net Investment Income to Average Net Assets | | | 1.73 | % | | | 1.67 | %(9) | |
(1) Refer to Note F in the Notes to Financial Statements for discussion of prior period custodian out-of pocket expenses that were reimbursed in the current period. The amount of the reimbursement was immaterial on a per share basis and did not impact the total return of Class IS shares. The Ratio of Expenses to Average Net Assets would have been 0.01% higher and the Ratio of Net Investment Income to Average Net Assets would have been 0.01% lower had the custodian not reimbursed the Portfolio.
(2) Commencement of Offering.
(3) Per share amount is based on average shares outstanding.
(4) Amount is less than $0.005 per share.
(5) Calculated based on the net asset value as of the last business day of the period.
(6) The Ratios of Expenses and Net Investment Income reflect the rebate of certain Portfolio expenses in connection with the investments in Morgan Stanley affiliates during the period. The effect of the rebate on the ratios is disclosed in the above table as "Ratio of Rebate from Morgan Stanley Affiliates to Average Net Assets."
(7) Amount is less than 0.005%.
(8) Not Annualized.
(9) Annualized.
The accompanying notes are an integral part of the financial statements.
18
Morgan Stanley Institutional Fund, Inc.
Annual Report — December 31, 2016
Notes to Financial Statements
Morgan Stanley Institutional Fund, Inc. (the "Fund") is registered under the Investment Company Act of 1940, as amended (the "Act"), as an open-end management investment company. The Fund is comprised of twenty-nine separate, active, diversified and non-diversified portfolios (individually referred to as a "Portfolio", collectively as the "Portfolios"). The Fund applies investment company accounting and reporting guidance.
The accompanying financial statements relate to the Frontier Emerging Markets Portfolio. The Portfolio seeks long-term capital appreciation.
The Portfolio offers five classes of shares — Class I, Class A, Class L, Class C and Class IS. On April 30, 2015, the Portfolio suspended offering of Class L shares. Existing Class L shareholders may invest through reinvestment of dividends and distributions.
A. Significant Accounting Policies: The following significant accounting policies are in conformity with U.S. generally accepted accounting principles ("GAAP"). Such policies are consistently followed by the Fund in the preparation of its financial statements. GAAP may require management to make estimates and assumptions that affect the reported amounts and disclosures in the financial statements. Actual results may differ from those estimates.
1. Security Valuation: (1) An equity portfolio security listed or traded on an exchange is valued at its latest reported sales price (or at the exchange official closing price if such exchange reports an official closing price), and if there were no sales on a given day and if there is no official exchange closing price for that day, the security is valued at the mean between the last reported bid and asked prices if such bid and asked prices are available on the relevant exchanges; (2) all other equity portfolio securities for which over-the-counter ("OTC") market quotations are readily available are valued at the latest reported sales price (or at the market official closing price if such market reports an official closing price), and if there was no trading in the security on a given day and if there is no official closing price from relevant markets for that day, the security is valued at the mean between the last reported bid and asked prices if such bid and asked prices are available on the relevant markets. Listed equity securities not traded on the valuation date with no reported bid and asked prices available on the exchange are valued at the mean between the current bid and asked prices obtained from one or more reputable brokers or dealers. An unlisted equity
security that does not trade on the valuation date and for which bid and asked prices from the relevant markets are unavailable is valued at the mean between the current bid and asked prices obtained from one or more reputable brokers or dealers. In cases where a security is traded on more than one exchange, the security is valued on the exchange designated as the primary market; (3) certain portfolio securities may be valued by an outside pricing service/vendor approved by the Fund's Board of Directors (the "Directors"). The pricing service/vendor may employ a pricing model that takes into account, among other things, bids, yield spreads, and/or other market data and specific security characteristics. Alternatively, if a valuation is not available from an outside pricing service/vendor, and the security trades on an exchange, the security may be valued at its latest reported sale price (or at the exchange official closing price if such exchange reports an official closing price), prior to the time when assets are valued. If there are no sales on a given day and if there is no official exchange closing price for that day, the security is valued at the mean between the last reported bid and asked prices if such bid and asked prices are available in the relevant exchanges; (4) when market quotations are not readily available, including circumstances under which Morgan Stanley Investment Management Inc. (the "Adviser") determines that the closing price, last sale price or the mean between the last reported bid and asked prices are not reflective of a security's market value, portfolio securities are valued at their fair value as determined in good faith under procedures established by and under the general supervision of the Directors. Occasionally, developments affecting the closing prices of securities and other assets may occur between the times at which valuations of such securities are determined (that is, close of the foreign market on which the securities trade) and the close of business of the New York Stock Exchange ("NYSE"). If developments occur during such periods that are expected to materially affect the value of such securities, such valuations may be adjusted to reflect the estimated fair value of such securities as of the close of the NYSE, as determined in good faith by the Directors or by the Adviser using a pricing service and/or procedures approved by the Directors; (5) quotations of foreign portfolio securities, other assets and liabilities and forward contracts stated in foreign currency are translated into U.S. dollar equivalents at the prevailing market rates prior to the close of the NYSE; and (6) investments in mutual funds, including the Morgan
19
Morgan Stanley Institutional Fund, Inc.
Annual Report — December 31, 2016
Notes to Financial Statements (cont'd)
Stanley Institutional Liquidity Funds, are valued at the net asset value ("NAV") as of the close of each business day.
The Directors have responsibility for determining in good faith the fair value of the investments, and the Directors may appoint others, such as the Fund's Adviser or a valuation committee, to assist the Directors in determining fair value and to make the actual calculations pursuant to the fair valuation methodologies previously approved by the Directors. Under procedures approved by the Directors, the Fund's Adviser has formed a Valuation Committee whose members are approved by the Directors. The Valuation Committee provides administration and oversight of the Fund's valuation policies and procedures, which are reviewed at least annually by the Directors. These procedures allow the Fund to utilize independent pricing services, quotations from securities and financial instrument dealers, and other market sources to determine fair value.
The Fund has procedures to determine the fair value of securities and other financial instruments for which market prices are not readily available. Under these procedures, the Valuation Committee convenes on a regular and ad hoc basis to review such securities and considers a number of factors, including valuation methodologies and significant unobservable valuation inputs, when arriving at fair value. The Valuation Committee may employ a market-based approach which may use related or comparable assets or liabilities, recent transactions, market multiples, book values, and other relevant information for the investment to determine the fair value of the investment. An income-based valuation approach may also be used in which the anticipated future cash flows of the investment are discounted to calculate fair value. Discounts may also be applied due to the nature or duration of any restrictions on the disposition of the investments. Due to the inherent uncertainty of valuations of such investments, the fair values may differ significantly from the values that would have been used had an active market existed. The Valuation Committee employs various methods for calibrating these valuation approaches including a regular review of valuation methodologies, key inputs and assumptions, transactional back-testing or disposition analysis, and reviews of any related market activity.
2. Fair Value Measurement: Financial Accounting Standards Board ("FASB") Accounting Standards CodificationTM ("ASC") 820, "Fair Value Measurement" ("ASC 820"), defines fair value as the value that the Fund would receive to sell an investment or pay to transfer a liability in a timely transaction with an independent buyer in the principal market, or in the absence of a principal market, the most advantageous market for the investment or liability. ASC 820 establishes a three-tier hierarchy to distinguish between (1) inputs that reflect the assumptions market participants would use in valuing an asset or liability developed based on market data obtained from sources independent of the reporting entity (observable inputs) and (2) inputs that reflect the reporting entity's own assumptions about the assumptions market participants would use in valuing an asset or liability developed based on the best information available in the circumstances (unobservable inputs) and to establish classification of fair value measurements for disclosure purposes. Various inputs are used in determining the value of the Fund's investments. The inputs are summarized in the three broad levels listed below.
• Level 1 – unadjusted quoted prices in active markets for identical investments
• Level 2 – other significant observable inputs (including quoted prices for similar investments, interest rates, prepayment speeds, credit risk, etc.)
• Level 3 – significant unobservable inputs including the Fund's own assumptions in determining the fair value of investments. Factors considered in making this determination may include, but are not limited to, information obtained by contacting the issuer, analysts, or the appropriate stock exchange (for exchange-traded securities), analysis of the issuer's financial statements or other available documents and, if necessary, available information concerning other securities in similar circumstances
The inputs or methodology used for valuing securities are not necessarily an indication of the risk associated with investing in those securities and the determination of the significance of a particular input to the fair value measurement in its entirety requires judgment and considers factors specific to each security.
20
Morgan Stanley Institutional Fund, Inc.
Annual Report — December 31, 2016
Notes to Financial Statements (cont'd)
The following is a summary of the inputs used to value the Portfolio's investments as of December 31, 2016.
Investment Type | | Level 1
Unadjusted
quoted
prices
(000) | | Level 2
Other
significant
observable
inputs
(000) | | Level 3
Significant
unobservable
inputs
(000) | | Total
(000) | |
Assets: | |
Common Stocks | |
Air Freight & Logistics | | $ | 4,916 | | | $ | — | | | $ | — | | | $ | 4,916 | | |
Airlines | | | 19,242 | | | | — | | | | — | | | | 19,242 | | |
Automobiles | | | 5,015 | | | | — | | | | — | | | | 5,015 | | |
Banks | | | 278,176 | | | | — | | | | — | | | | 278,176 | | |
Beverages | | | 31,756 | | | | — | | | | — | | | | 31,756 | | |
Capital Markets | | | 8,426 | | | | — | | | | — | | | | 8,426 | | |
Construction Materials | | | 53,521 | | | | — | | | | — | | | | 53,521 | | |
Diversified Financial
Services | | | 5,626 | | | | — | | | | — | | | | 5,626 | | |
Electric Utilities | | | 23,727 | | | | — | | | | — | | | | 23,727 | | |
Electrical Equipment | | | 10,435 | | | | — | | | | — | | | | 10,435 | | |
Food Products | | | 64,253 | | | | — | | | | — | | | | 64,253 | | |
Health Care Providers &
Services | | | 16,167 | | | | — | | | | — | | | | 16,167 | | |
Hotels, Restaurants &
Leisure | | | 6,329 | | | | — | | | | — | | | | 6,329 | | |
Internet Software &
Services | | | 11,014 | | | | — | | | | — | | | | 11,014 | | |
Oil, Gas & Consumable
Fuels | | | 29,300 | | | | — | | | | — | | | | 29,300 | | |
Pharmaceuticals | | | 10,994 | | | | — | | | | — | | | | 10,994 | | |
Real Estate
Management &
Development | | | 6,857 | | | | — | | | | — | | | | 6,857 | | |
Software | | | 11,284 | | | | — | | | | — | | | | 11,284 | | |
Transportation
Infrastructure | | | 6,984 | | | | — | | | | — | | | | 6,984 | | |
Wireless
Telecommunication
Services | | | 25,135 | | | | — | | | | — | | | | 25,135 | | |
Total Common Stocks | | | 629,157 | | | | — | | | | — | | | | 629,157 | | |
Participation Note | | | — | | | | 1,254 | | | | — | | | | 1,254 | | |
Short-Term Investment | |
Investment Company | | | 4,479 | | | | — | | | | — | | | | 4,479 | | |
Total Assets | | $ | 633,636 | | | $ | 1,254 | | | $ | — | | | $ | 634,890 | | |
Transfers between investment levels may occur as the markets fluctuate and/or the availability of data used in an investment's valuation changes. The Portfolio recognizes transfers between the levels as of the end of the period. As of December 31, 2016, securities with a total value of approximately $433,895,000 transferred from Level 2 to Level 1. Securities that were valued using other significant observable inputs at December 31, 2015 were valued using unadjusted quoted prices at December 31, 2016. At December 31, 2015, the fair value of certain securities were adjusted due to developments which occurred between the time of the close of the foreign markets on
which they trade and the close of business on the NYSE which resulted in their Level 2 classification.
3. Foreign Currency Translation and Foreign Investments: The books and records of the Portfolio are maintained in U.S. dollars. Foreign currency amounts are translated into U.S. dollars as follows:
– investments, other assets and liabilities at the prevailing rate of exchange on the valuation date;
– investment transactions and investment income at the prevailing rates of exchange on the dates of such transactions.
Although the net assets of the Portfolio are presented at the foreign exchange rates and market values at the close of the period, the Portfolio does not isolate that portion of the results of operations arising as a result of changes in the foreign exchange rates from the fluctuations arising from changes in the market prices of securities held at period end. Similarly, the Portfolio does not isolate the effect of changes in foreign exchange rates from the fluctuations arising from changes in the market prices of securities sold during the period. Accordingly, realized and unrealized foreign currency gains (losses) on investments in securities are included in the reported net realized and unrealized gains (losses) on investment transactions and balances. However, pursuant to U.S. federal income tax regulations, gains and losses from certain foreign currency transactions and the foreign currency portion of gains and losses realized on sales and maturities of foreign denominated debt securities are treated as ordinary income for U.S. federal income tax purposes.
Net realized gains (losses) on foreign currency transactions represent net foreign exchange gains (losses) from foreign currency forward exchange contracts, disposition of foreign currencies, currency gains (losses) realized between the trade and settlement dates on securities transactions, and the difference between the amount of investment income and foreign withholding taxes recorded on the Portfolio's books and the U.S. dollar equivalent amounts actually received or paid. Net unrealized currency gains (losses) from valuing foreign currency denominated assets and liabilities at period end exchange rates are reflected as a component of unrealized appreciation (depreciation) in the Statement of Assets and Liabilities. The change in unrealized currency
21
Morgan Stanley Institutional Fund, Inc.
Annual Report — December 31, 2016
Notes to Financial Statements (cont'd)
gains (losses) on foreign currency translations for the period is reflected in the Statement of Operations.
A significant portion of the Portfolio's net assets consist of securities of issuers located in emerging markets, which are denominated in foreign currencies. Such securities may be concentrated in a limited number of countries and regions and may vary throughout the year. Changes in currency exchange rates will affect the value of and investment income from foreign currency denominated securities. Emerging market securities are often subject to greater price volatility, limited capitalization and liquidity, and higher rates of inflation than securities of companies based in the U.S. In addition, emerging market issuers may be subject to substantial governmental involvement in the economy and greater social, economic and political uncertainty.
Governmental approval for foreign investments may be required in advance of making an investment under certain circumstances in some countries, and the extent of foreign investments in domestic companies may be subject to limitation in other countries. Foreign ownership limitations also may be imposed by the charters of individual companies to prevent, among other concerns, violations of foreign investment limitations. As a result, an additional class of shares (identified as "Foreign" in the Portfolio of Investments) may be created and offered for investment. The "local" and "foreign shares" market values may differ. In the absence of trading of the foreign shares in such markets, the Portfolio values the foreign shares at the closing exchange price of the local shares.
4. Structured Investments: The Portfolio invested a portion of its assets in structured investments. A structured investment is a derivative security designed to offer a return linked to a particular underlying security, currency, commodity or market. Structured investments may come in various forms including notes (such as exchange-traded notes), warrants and options to purchase securities. The Portfolio will typically use structured investments to gain exposure to a permitted underlying security, currency, commodity or market when direct access to a market is limited or inefficient from a tax or cost standpoint. There can be no assurance that structured investments will trade at the same price or have the same value as the underlying security, currency, commodity or market. Investments in structured investments involve risks including issuer risk,
counterparty risk and market risk. Holders of structured investments bear risks of the underlying investment and are subject to issuer or counterparty risk because the Portfolio is relying on the creditworthiness of such issuer or counterparty and has no rights with respect to the underlying investment. Certain structured investments may be thinly traded or have a limited trading market and may have the effect of increasing the Portfolio's illiquidity to the extent that the Portfolio, at a particular time, may be unable to find qualified buyers for these securities.
5. Redemption Fees: The Portfolio will assess a 2% redemption fee on Class I shares, Class A shares, Class L shares, Class C shares and Class IS shares, which is paid directly to the Portfolio, for shares redeemed or exchanged within thirty days of purchase, subject to certain exceptions. The redemption fee is designed to protect the Portfolio and its remaining shareholders from the effects of short-term trading. These fees, if any, are included in the Statements of Changes in Net Assets.
6. Indemnifications: The Fund enters into contracts that contain a variety of indemnifications. The Fund's maximum exposure under these arrangements is unknown. However, the Fund has not had prior claims or losses pursuant to these contracts and expects the risk of loss to be remote.
7. Dividends and Distributions to Shareholders: Dividend income and distributions to shareholders are recorded on the ex-dividend date. Dividends from net investment income, if any, are declared and paid annually. Net realized capital gains, if any, are distributed at least annually.
8. Security Transactions, Income and Expenses: Security transactions are accounted for on the trade date (date the order to buy or sell is executed). Realized gains and losses on the sale of investment securities are determined on the specific identified cost method. Dividend income and other distributions are recorded on the ex-dividend date (except for certain foreign dividends which may be recorded as soon as the Portfolio is informed of such dividends) net of applicable withholding taxes. Interest income is recognized on the accrual basis except where collection is in doubt. Discounts are accreted and premiums are amortized over the life of the respective securities. Most expenses of the Fund can be directly attributed to a particular Portfolio. Expenses which cannot be directly attributed are
22
Morgan Stanley Institutional Fund, Inc.
Annual Report — December 31, 2016
Notes to Financial Statements (cont'd)
apportioned among the Portfolios based upon relative net assets or other appropriate methods. Income, expenses (other than class specific expenses — distribution and shareholder services, transfer agency and sub transfer agency fees) and realized and unrealized gains or losses are allocated to each class of shares based upon their relative net assets.
B. Advisory Fees: The Adviser, a wholly-owned subsidiary of Morgan Stanley, provides the Portfolio with advisory services under the terms of an Investment Advisory Agreement, paid quarterly, at an annual rate of 1.25% of the daily net assets of the Portfolio.
The Adviser has agreed to reduce its advisory fee and/or reimburse the Portfolio so that total annual portfolio operating expenses, excluding certain investment related expenses, taxes, interest and other extraordinary expenses (including litigation), will not exceed 1.85% for Class I shares, 2.20% for Class A shares, 2.70% for Class L shares, 2.95% for Class C shares and 1.80% for Class IS shares. The fee waivers and/or expense reimbursements will continue for at least one year from the date of the Portfolio's prospectus or until such time as the Directors act to discontinue all or a portion of such waivers and/or reimbursements when they deem such action is appropriate. For the year ended December 31, 2016, approximately $3,000 of other expenses were reimbursed by the Adviser pursuant to this arrangement.
C. Administration Fees: The Adviser also serves as Administrator to the Fund and provides administrative services pursuant to an Administration Agreement for an annual fee, accrued daily and paid monthly, of 0.08% of the Portfolio's average daily net assets.
Under a Sub-Administration Agreement between the Administrator and State Street Bank and Trust Company ("State Street"), State Street provides certain administrative services to the Fund. For such services, the Administrator pays State Street a portion of the fee the Administrator receives from the Portfolio.
D. Distribution and Shareholder Services Fees: Morgan Stanley Distribution, Inc. ("MSDI" or the "Distributor"), a wholly-owned subsidiary of the Adviser and an indirect subsidiary of Morgan Stanley, serves as the Fund's Distributor of Portfolio shares pursuant to a Distribution Agreement. The Fund has adopted a Shareholder Services Plan with respect to Class A shares pursuant to Rule 12b-1 under the Act. Under the Shareholder Services Plan, the Portfolio pays the Distributor a shareholder services fee, accrued daily and paid monthly,
at an annual rate of 0.25% of the Portfolio's average daily net assets attributable to Class A shares.
The Fund has adopted a Distribution and Shareholder Services Plan with respect to Class L shares pursuant to Rule 12b-1 under the Act. Under the Distribution and Shareholder Services Plan, the Portfolio pays the Distributor a distribution fee, accrued daily and paid monthly, at an annual rate of 0.50% and a shareholder services fee, accrued daily and paid monthly, at an annual rate of 0.25% of the Portfolio's average daily net assets attributable to Class L shares.
The Fund has adopted a Distribution and Shareholder Services Plan with respect to Class C shares pursuant to Rule 12b-1 under the Act. Under the Distribution and Shareholder Services Plan, the Portfolio pays the Distributor a distribution fee, accrued daily and paid monthly, at an annual rate of 0.75% and a shareholder services fee, accrued daily and paid monthly, at an annual rate of 0.25% of the Portfolio's average daily net assets attributable to Class C shares.
The distribution and shareholder services fees are used to support the expenses associated with servicing and maintaining accounts. The Distributor may compensate other parties for providing shareholder support services to investors who purchase Class A, Class L and Class C shares.
E. Dividend Disbursing and Transfer Agent: The Fund's dividend disbursing and transfer agent is Boston Financial Data Services, Inc. ("BFDS"). Pursuant to a Transfer Agency Agreement, the Fund pays BFDS a fee based on the number of classes, accounts and transactions relating to the Portfolios of the Fund.
F. Custodian Fees: State Street (the "Custodian") serves as Custodian for the Fund in accordance with a Custodian Agreement. The Custodian holds cash, securities, and other assets of the Fund as required by the Act. Custody fees are payable monthly based on assets held in custody, investment purchases and sales activity and account maintenance fees, plus reimbursement for certain out-of-pocket expenses.
In December 2015, the Fund's Custodian announced that it had identified inconsistencies in the way in which clients were invoiced for out-of-pocket expenses from 1998 until November 2015. The dollar amount difference between what was charged and what should have been charged, plus interest, was paid back to the Portfolio in September 2016 as a reimbursement. The Custodian reimbursed the Portfolio directly, which was recognized as a change in accounting estimate and
23
Morgan Stanley Institutional Fund, Inc.
Annual Report — December 31, 2016
Notes to Financial Statements (cont'd)
was reflected as "Reimbursement of Custodian Fees" in the Statement of Operations. Pursuant to the expense limitations described in Note B, the Portfolio has experienced expenses reimbursed by the Adviser during the current period. Accordingly, the reimbursement of out-of-pocket custodian expenses in the current period resulted in the reduction in the current period expenses reimbursed by the Adviser.
G. Security Transactions and Transactions with Affiliates: For the year ended December 31, 2016, purchases and sales of investment securities for the Portfolio, other than long-term U.S. Government securities and short-term investments, were approximately $187,661,000 and $196,706,000, respectively. There were no purchases and sales of long-term U.S. Government securities for the year ended December 31, 2016.
The Portfolio invests in the Institutional Class of the Morgan Stanley Institutional Liquidity Funds (the "Liquidity Funds"), an open-end management investment company managed by the Adviser. Advisory fees paid by the Portfolio are reduced by an amount equal to its pro-rata share of the advisory and administration fees paid by the Portfolio due to its investment in the Liquidity Funds. For the year ended December 31, 2016, advisory fees paid were reduced by approximately $16,000 relating to the Portfolio's investment in the Liquidity Funds.
A summary of the Portfolio's transactions in shares of the Liquidity Funds during the year ended December 31, 2016 is as follows:
Value
December 31,
2015
(000) | | Purchases
at Cost
(000) | | Sales
(000) | | Dividend
Income
(000) | | Value
December 31,
2016
(000) | |
| $ | 16,114 | | | $ | 175,453 | | | $ | 187,088 | | | $ | 40 | | | $ | 4,479 | | |
The Portfolio is permitted to purchase and sell securities ("cross-trade") from and to other Morgan Stanley Funds as well as other funds and client accounts for which the Adviser or an affiliate of the Adviser serves as investment adviser, pursuant to procedures approved by the Directors in compliance with Rule 17a-7 under the Act (the "Rule"). Each cross-trade is executed at the current market price in compliance with provisions of the Rule. For the year ended December 31, 2016, the Portfolio did not engage in any cross-trade transactions.
The Portfolio has an unfunded Deferred Compensation Plan (the "Compensation Plan"), which allows each independent Director to defer payment of all, or a portion, of the fees he or she receives for serving on the Board of Directors. Each eligible Director generally may elect to have the deferred amounts credited with a return equal to the total return on one or more
of the Morgan Stanley funds that are offered as investment options under the Compensation Plan. Appreciation/depreciation and distributions received from these investments are recorded with an offsetting increase/decrease in the deferred compensation obligation and do not affect the NAV of the Portfolio.
H. Federal Income Taxes It is the Portfolio's intention to continue to qualify as a regulated investment company and distribute all of its taxable and tax-exempt income. Accordingly, no provision for federal income taxes is required in the financial statements.
The Portfolio may be subject to taxes imposed by countries in which it invests. Such taxes are generally based on income and/or capital gains earned or repatriated. Taxes are accrued based on net investment income, net realized gains and net unrealized appreciation as such income and/or gains are earned. Taxes may also be based on transactions in foreign currency and are accrued based on the value of investments denominated in such currency.
FASB ASC 740-10, "Income Taxes — Overall", sets forth a minimum threshold for financial statement recognition of the benefit of a tax position taken or expected to be taken in a tax return. Management has concluded there are no significant uncertain tax positions that would require recognition in the financial statements. If applicable, the Portfolio recognizes interest accrued related to unrecognized tax benefits in "Interest Expense" and penalties in "Other Expenses" in the Statement of Operations. The Portfolio files tax returns with the U.S. Internal Revenue Service, New York and various states. Generally, each of the tax years in the four-year period ended December 31, 2016, remains subject to examination by taxing authorities.
The tax character of distributions paid may differ from the character of distributions shown in the Statements of Changes in Net Assets due to short-term capital gains being treated as ordinary income for tax purposes. The tax character of distributions paid during fiscal years 2016 and 2015 was as follows:
2016
Distributions
Paid From: | | 2015
Distributions
Paid From: | |
Ordinary
Income
(000) | | Long-Term
Capital Gain
(000) | | Paid-in
Capital
(000) | | Ordinary
Income
(000) | | Long-Term
Capital Gain
(000) | | Paid-in-
Capital
(000) | |
| $ | 7,980 | | | $ | — | | | $ | 160 | | | $ | 4,967 | | | $ | — | | | $ | 232 | | |
The amount and character of income and gains to be distributed are determined in accordance with income tax regulations which may differ from GAAP. These book/tax differences are either considered temporary or permanent in nature.
24
Morgan Stanley Institutional Fund, Inc.
Annual Report — December 31, 2016
Notes to Financial Statements (cont'd)
Temporary differences are primarily due to differing book and tax treatments for the timing of the recognition of gains (losses) on certain investment transactions and the timing of the deductibility of certain expenses.
Permanent differences, primarily due to differing treatments of gains (losses) related to foreign currency transactions and an expired capital loss carryforward resulted in the following reclassifications among the components of net assets at December 31, 2016:
Distributions
in Excess of Net
Investment
Income
(000) | | Accumulated
Net Realized
Loss
(000) | | Paid-in-
Capital
(000) | |
| $ | (3,286 | ) | | $ | 23,296 | | | $ | (20,010 | ) | |
At December 31, 2016, the Portfolio had no distributable earnings on a tax basis.
At December 31, 2016, the Portfolio had available for federal income tax purposes unused short term and long term capital losses of approximately $49,958,000 and $77,987,000 respectively, that do not have an expiration date.
In addition, at December 31, 2016, the Portfolio had available for federal income tax purposes unused capital losses which will expire on the indicated dates:
| Amount (000) | | Expiration | |
| $ | 4,191 | | | December 31, 2017 | |
During the year ended December 31, 2016, capital loss carryforwards of approximately $20,010,000 expired for federal income tax purposes.
To the extent that capital loss carryforwards are used to offset any future capital gains realized during the carryover period as provided by U.S. federal income tax regulations, no capital gains tax liability will be incurred by the Portfolio for gains realized and not distributed. To the extent that capital gains are offset, such gains will not be distributed to the shareholders.
Qualified late year losses are capital losses and specified ordinary losses, including currency losses, incurred after October 31 but within the taxable year that, if elected, are deemed to arise on the first day of the Portfolio's next taxable year. These also include non-specified ordinary losses incurred after December 31 but within the same taxable year. For the year ended December 31, 2016, the Portfolio deferred to January 1, 2017 for U.S. federal income tax purposes the following losses:
Qualified Late
Year Ordinary
Losses
(000) | | Post-October
Capital Losses
(000) | |
| $ | 242 | | | $ | — | | |
I. Credit Facility: As of April 4, 2016, the Fund and other Morgan Stanley funds participated in a $150,000,000 committed, unsecured revolving line of credit facility (the "facility") with State Street. This facility is to be used for temporary emergency purposes or funding of shareholder redemption requests. The interest rate on borrowings is based on the federal funds rate or one month libor rate plus a spread. The facility also has a commitment fee of 0.25% per annum based on the unused portion of the facility. During the year ended December 31, 2016, the Portfolio did not have any borrowings under the facility.
J. Other: At December 31, 2016, the Portfolio had record owners of 10% or greater. Investment activities of these shareholders could have a material impact on the Portfolio. The aggregate percentage of such owners was 54.6%.
K. Accounting Pronouncements: In December 2016, FASB issued Accounting Standards update 2016-19 — Technical Corrections and Improvements ("ASU 2016-19"), which is effective for interim periods for all entities beginning after December 15, 2016. ASU 2016-19 includes an amendment to Topic 820, Fair Value Measurement, which clarifies the difference between a valuation approach and a valuation technique when applying the guidance in that Topic. That amendment also requires an entity to disclose when there has been a change in either or both a valuation approach and/or a valuation technique. The transition guidance for the amendment must be applied prospectively because it could potentially involve the use of hindsight that includes fair value measurements. Although still evaluating the potential impacts of ASU 2016-19 to the Portfolio, management expects that the impact of the Portfolio's adoption will be limited to additional financial statement disclosures.
In October 2016, the Securities and Exchange Commission ("SEC") issued a new rule, Investment Company Reporting Modernization, which, among other provisions, amends Regulation S-X to require standardized, enhanced disclosures, particularly related to derivatives, in investment company financial statements. Compliance with the guidance is effective for financial statements filed with the SEC on or after August 1, 2017; adoption will have no effect on the Portfolio's net assets or results of operations. Although still evaluating the potential impacts of the Investment Company Reporting Modernization to the Portfolio, management expects that the impact of the Portfolio's adoption will be limited to additional financial statement disclosures.
25
Morgan Stanley Institutional Fund, Inc.
Annual Report — December 31, 2016
Report of Independent Registered Public Accounting Firm
To the Shareholders and Board of Directors of
Morgan Stanley Institutional Fund, Inc. —
Frontier Emerging Markets Portfolio
We have audited the accompanying statement of assets and liabilities, including the portfolio of investments, of Frontier Emerging Markets Portfolio (one of the portfolios constituting Morgan Stanley Institutional Fund, Inc.) (the "Portfolio") as of December 31, 2016, and the related statement of operations for the year then ended, the statements of changes in net assets for each of the two years in the period then ended and the financial highlights for each of the years or periods indicated therein. These financial statements and financial highlights are the responsibility of the Portfolio's management. Our responsibility is to express an opinion on these financial statements and financial highlights based on our audits.
We conducted our audits in accordance with the standards of the Public Company Accounting Oversight Board (United States). Those standards require that we plan and perform the audit to obtain reasonable assurance about whether the financial statements and financial highlights are free of material misstatement. We were not engaged to perform an audit of the Portfolio's internal control over financial reporting. Our audits included consideration of internal control over financial reporting as a basis for designing audit procedures that are appropriate in the circumstances, but not for the purpose of expressing an opinion on the effectiveness of the Portfolio's internal control over financial reporting. Accordingly, we express no such opinion. An audit also includes examining, on a test basis, evidence supporting the amounts and disclosures in the financial statements and financial highlights, assessing the accounting principles used and significant estimates made by management, and evaluating the overall financial statement presentation. Our procedures included confirmation of securities owned as of December 31, 2016, by correspondence with the custodian and others or by other appropriate auditing procedures where replies from others were not received. We believe that our audits provide a reasonable basis for our opinion.
In our opinion, the financial statements and financial highlights referred to above present fairly, in all material respects, the financial position of Frontier Emerging Markets Portfolio (one of the portfolios constituting Morgan Stanley Institutional Fund, Inc.) at December 31, 2016, the results of its operations for the year then ended, the changes in its net assets for each of the two years in the period then ended and the financial highlights for each of the years or periods indicated therein, in conformity with U.S. generally accepted accounting principles.

Boston, Massachusetts
February 28, 2017
26
Morgan Stanley Institutional Fund, Inc.
Annual Report — December 31, 2016
Federal Tax Notice (unaudited)
For federal income tax purposes, the following information is furnished with respect to the distributions paid by the Portfolio during its taxable year ended December 31, 2016. For corporate shareholders 0.66% of the dividends qualified for the dividends received deduction.
For federal income tax purposes, the following information is furnished with respect to the Portfolio's earnings for its taxable year ended December 31, 2016. When distributed, certain earnings may be subject to a maximum tax rate of 15% as provided for by the Jobs and Growth Tax Relief Reconciliation Act of 2003. The Portfolio designated up to a maximum of approximately $10,635,000 as taxable at this lower rate.
The Portfolio intends to pass through foreign tax credits of approximately $2,495,000 and has derived net income from sources within foreign countries amounting to approximately $24,299,000.
In January, the Portfolio provides tax information to shareholders for the preceding calendar year.
27
Morgan Stanley Institutional Fund, Inc.
Annual Report — December 31, 2016
Privacy Notice (unaudited)
MORGAN STANLEY INVESTMENT MANAGEMENT INC.
AN IMPORTANT NOTICE CONCERNING OUR U.S. PRIVACY POLICY
We are required by federal law to provide you with a copy of our privacy policy annually. This policy applies to current and former individual investors in funds managed or sponsored by Morgan Stanley Investment Management Inc. ("MSIM") as well as current and former individual clients of MSIM. This policy is not applicable to partnerships, corporations, trusts or other non-individual clients or investors. Please note that we may amend this policy at any time, and will inform you of any changes as required by law.
WE RESPECT YOUR PRIVACY
We appreciate that you have provided us with your personal financial information. We strive to maintain the privacy of such information while we help you achieve your financial objectives. This Notice describes what non-public personal information we collect about you, why we collect it, when we may share it with others and how certain others may use it. It discusses the steps you may take to limit our sharing of certain information about you to affiliated companies in the Morgan Stanley family of companies ("other Morgan Stanley companies"). It also discloses how you may limit use of certain shared information for marketing purposes by other Morgan Stanley branded companies. Throughout this policy, we refer to the non-public information that personally identifies you or your accounts as "personal information.''
1. WHAT PERSONAL INFORMATION DO WE COLLECT ABOUT YOU?
We obtain personal information from applications and other forms you submit to us, from your dealings with us, from consumer reporting agencies, from our Web sites and from third parties and other sources.
For example:
• We may collect information such as your name, address, e-mail address, telephone/fax numbers, assets, income and investment objectives through subscription documents, applications and other forms you submit to us.
• We may obtain information about account balances, your use of account(s) and the types of products and services you prefer to receive from us through your dealings and transactions with us and other sources.
• We may obtain information about your creditworthiness and credit history from consumer reporting agencies.
• We may collect background information from and through third-party vendors to verify representations you have made and to comply with various regulatory requirements.
• If you interact with us through our public and private Web sites, we may collect information that you provide directly through online communications (such as an e-mail address). We may also collect information about your Internet service provider, your domain name, your computer's operating system and Web browser, your use of our Web sites and your product and service preferences, through the use of "cookies." Please consult the Terms of Use of these sites for more details.
2. WHEN DO WE DISCLOSE PERSONAL INFORMATION WE COLLECT ABOUT YOU?
We may disclose personal information we collect about you to other Morgan Stanley companies and to non-affiliated third parties.
a. Information We Disclose to Other Morgan Stanley Companies.
We may disclose personal information to other Morgan Stanley companies for a variety of reasons, including to manage your account(s) effectively, to service and process your transactions, to let you know about products and services offered by us and other Morgan Stanley companies, to manage our business, and as otherwise required or permitted by law. Offers for products and services from other Morgan Stanley companies are developed under conditions designed to safeguard your personal information.
28
Morgan Stanley Institutional Fund, Inc.
Annual Report — December 31, 2016
Privacy Notice (unaudited) (cont'd)
b. Information We Disclose to Non-affiliated Third Parties.
We do not disclose personal information that we collect about you to non-affiliated third parties except to those who provide marketing services on our behalf, to financial institutions with whom we have joint marketing agreements, and as otherwise required or permitted by law. For example, we may disclose personal information to nonaffiliated third parties for servicing and processing transactions, to offer our own products and services, to protect against fraud, for institutional risk control, to respond to judicial process or to perform services on our behalf. When we share personal information with a non-affiliated third party, they are required to limit their use of personal information to the particular purpose for which it was shared and they are not allowed to share personal information with others except to fulfill that limited purpose or as may be permitted or required by law.
3. HOW DO WE PROTECT THE SECURITY AND CONFIDENTIALITY OF PERSONAL INFORMATION WE COLLECT ABOUT YOU?
We maintain physical, electronic and procedural security measures to help safeguard the personal information we collect about you. We have internal policies governing the proper handling of client information. Third parties that provide support or marketing services on our behalf may also receive personal information, and we require them to adhere to confidentiality standards with respect to such information.
4. HOW CAN YOU LIMIT THE SHARING OF CERTAIN TYPES OF PERSONAL INFORMATION WITH OTHER MORGAN STANLEY COMPANIES?
We offer you choices as to whether we share with other Morgan Stanley companies the personal information that was collected to determine your eligibility for products and services you request ("eligibility information"). Eligibility information does not include your identification information or personal information pertaining to our transactions or experiences with you. Please note that, even if you direct us not to share eligibility information with other Morgan Stanley companies ("opt-out"), we may still share personal information, including eligibility information, with those companies in circumstances excluded from the opt-out under applicable law, such as to process transactions or to service your account.
5. HOW CAN YOU LIMIT THE USE OF CERTAIN TYPES OF PERSONAL INFORMATION BY OTHER MORGAN STANLEY COMPANIES FOR MARKETING?
By following the opt-out instructions in Section 6 below, you may limit other Morgan Stanley branded companies from marketing their products or services to you based on personal information we disclose to them. This information may include, for example, your income and account history with us. Please note that, even if you choose to limit Other Morgan Stanley Companies from using personal information about you that we may share with them for marketing their products and services to you, Other Morgan Stanley Companies may use your personal information that they obtain from us to market to you in circumstances permitted by law, such as if the Other Morgan Stanley Company has its own relationship with you.
6. HOW CAN YOU SEND US AN OPT-OUT INSTRUCTION?
If you wish to limit our sharing of eligibility information about you with other Morgan Stanley companies or other Morgan Stanley companies' use of personal information for marketing purposes, as described in this notice, you may do so by:
• Calling us at (800) 548-7786
Monday–Friday between 8a.m. and 6p.m.(EST)
• Writing to us at the following address:
Boston Financial Data Services, Inc.
c/o Privacy Coordinator
P.O. Box 219804
Kansas City, Missouri 64121
29
Morgan Stanley Institutional Fund, Inc.
Annual Report — December 31, 2016
Privacy Notice (unaudited) (cont'd)
Your written request should include your name, address, telephone number and account number(s) to which the opt-out applies and whether you are opting out with respect to sharing of eligibility information (Section 4 above), or if information used for Marketing (Section 5 above) or both. Written opt-out requests should not be sent with any other correspondence. In order to process your request, we require that the request be provided by you directly and not through a third party.
Your opt-out preference will remain in effect with respect to this policy (as it may be amended) until you notify us otherwise. If you have a joint account, your direction for us not to share this information with other Morgan Stanley companies and for those other Morgan Stanley companies not to use your personal information for marketing will be applied to all account holders on that account. Please understand that if you limit our sharing or our affiliated companies' use of personal information, you and any joint account holder(s) may not receive information about Morgan Stanley products and services, including products or services that could help you manage your financial resources and achieve your investment objectives.
7. WHAT IF AN AFFILIATED COMPANY BECOMES A NON-AFFILIATED THIRD PARTY?
If, at any time in the future, an affiliated company becomes a non-affiliated third party, further disclosures of personal information made to the former affiliated company will be limited to those described in Section 2(b) above relating to non-affiliated third parties. If you elected under Section 6 to limit disclosures we make to affiliated companies, or use of personal information by affiliated companies, your election will not apply to use by any former affiliated company of your personal information in their possession once it becomes a non-affiliated third party.
SPECIAL NOTICE TO RESIDENTS OF VERMONT
The following section supplements our policy with respect to our individual clients who have a Vermont address and supersedes anything to the contrary in the above policy with respect to those clients only.
The state of Vermont requires financial institutions to obtain your consent prior to sharing personal information that they collect about you with affiliated companies and non-affiliated third parties other than in certain limited circumstances. Except as permitted by law, we will not share personal information we collect about you with non-affiliated third parties or other Morgan Stanley companies unless you provide us with your written consent to share such information ("opt-in").
If you wish to receive offers for investment products and services offered by or through other Morgan Stanley companies, please notify us in writing at the following address:
Boston Financial Data Services, Inc.
c/o Privacy Coordinator
P.O. Box 219804
Kansas City, Missouri 64121
Your authorization should include your name, address, telephone number and account number(s) to which the opt-in applies and should not be sent with any other correspondence. In order to process your authorization, we require that the authorization be provided by you directly and not through a third party.
SPECIAL NOTICE TO RESIDENTS OF CALIFORNIA
The following section supplements our policy with respect to our individual clients who have a California address and supersedes anything to the contrary in the above policy with respect to those clients only.
In response to a California law, if your account has a California home address, your personal information will not be disclosed to nonaffiliated third parties except as permitted by applicable California law, and we will limit sharing such information with our affiliates to comply with California privacy laws that apply to us.
30
Morgan Stanley Institutional Fund, Inc.
Annual Report — December 31, 2016
Director and Officer Information (unaudited)
Independent Directors:
Name, Age and Address of
Independent Director | | Position(s)
Held with
Registrant | | Length of Time
Served* | | Principal Occupation(s) During Past 5 Years
and Other Relevant Professional Experience | | Number of
Overseen by
Independent
Director** | | Portfolios in
Fund Complex
Other Directorships
Held by Independent
Director*** | |
Frank L. Bowman (72)
c/o Perkins Coie LLP
Counsel to the Independent
Directors
30 Rockefeller Plaza
New York, NY 10112 | | Director | | Since
August
2006 | | President, Strategic Decisions, LLC (consulting) (since February 2009); Director or Trustee of various Morgan Stanley Funds (since August 2006); Chairperson of the Compliance and Insurance Committee (since October 2015); formerly, Chairperson of the Insurance Sub-Committee of the Compliance and Insurance Committee (2007-2015); served as President and Chief Executive Officer of the Nuclear Energy Institute (policy organization) (February 2005-November 2008); retired as Admiral, U.S. Navy after serving over 38 years on active duty including 8 years as Director of the Naval Nuclear Propulsion Program in the Department of the Navy and the U.S. Department of Energy (1996-2004); served as Chief of Naval Personnel (July 1994-September 1996) and on the Joint Staff as Director of Political Military Affairs (June 1992-July 1994); knighted as Honorary Knight Commander of the Most Excellent Order of the British Empire; awarded the Officier de l'Orde National du Mérite by the French Government; elected to the National Academy of Engineering (2009). | | | 90 | | | Director of BP p.l.c.; Director of Naval and Nuclear Technologies LLP; Director Emeritus of the Armed Services YMCA; Director of the U.S. Naval Submarine League; Member of the National Security Advisory Council of the Center for U.S. Global Engagement and a member of the CNA Military Advisory Board; Chairman of the charity J Street Cup Golf; Trustee of Fairhaven United Methodist Church; and Director of other various non-profit organizations. | |
Kathleen A. Dennis (63)
c/o Perkins Coie LLP
Counsel to the Independent Directors
30 Rockefeller Plaza
New York, NY 10112 | | Director | | Since
August
2006 | | President, Cedarwood Associates (mutual fund and investment management consulting) (since July 2006); Chairperson of the Liquidity and Alternatives Sub-Committee of the Investment Committee (since October 2006) and Director or Trustee of various Morgan Stanley Funds (since August 2006); formerly, Senior Managing Director of Victory Capital Management (1993-2006). | | | 91 | | | Director of various non-profit organizations. | |
Nancy C. Everett (61)
c/o Perkins Coie LLP
Counsel to the Independent Directors
30 Rockefeller Plaza
New York, NY 10112 | | Director | | Since
January
2015 | | Chief Executive Officer, Virginia Commonwealth University Investment Company (since November 2015); Owner, OBIR, LLC (institutional investment management consulting) (since June 2014); formerly, Managing Director, BlackRock Inc. (February 2011-December 2013); and Chief Executive Officer, General Motors Asset Management (a/k/a Promark Global Advisors, Inc.) (June 2005-May 2010). | | | 91 | | | Member of Virginia Commonwealth University School of Business Foundation; formerly, Member of Virginia Commonwealth University Board of Visitors (2013-2015); Member of Committee on Directors for Emerging Markets Growth Fund, Inc. (2007-2010); Chairperson of Performance Equity Management, LLC (2006-2010); and Chairperson, GMAM Absolute Return Strategies Fund, LLC (2006-2010). | |
31
Morgan Stanley Institutional Fund, Inc.
Annual Report — December 31, 2016
Director and Officer Information (unaudited) (cont'd)
Independent Directors: (cont'd)
Name, Age and Address of
Independent Director | | Position(s)
Held with
Registrant | | Length of Time
Served* | | Principal Occupation(s) During Past 5 Years
and Other Relevant Professional Experience | | Number of
Overseen by
Independent
Director** | | Portfolios in
Fund Complex
Other Directorships
Held by Independent
Director*** | |
Jakki L. Haussler (59)
c/o Perkins Coie LLP
Counsel to the Independent Directors
30 Rockefeller Plaza
New York, NY 10112 | | Director | | Since
January
2015 | | Chairman and Chief Executive Officer, Opus Capital Group (since January 1996); formerly, Director, Capvest Venture Fund, LP (May 2000-December 2011); Partner, Adena Ventures, LP (July 1999-December 2010); Director, The Victory Funds (February 2005-July 2008). | | | 91 | | | Director of Cincinnati Bell Inc. and Member, Audit Committee and Compensation Committee; Director of Northern Kentucky University Foundation and Member, Investment Committee; Member of Chase College of Law Transactional Law Practice Center Board of Advisors; Director of Best Transport; Director of Chase College of Law Board of Visitors; formerly, Member, University of Cincinnati Foundation Investment Committee; Member, Miami University Board of Visitors (2008-2011); Trustee of Victory Funds (2005-2008) and Chairman, Investment Committee (2007-2008) and Member, Service Provider Committee (2005-2008). | |
Dr. Manuel H. Johnson (67)
c/o Johnson Smick
International, Inc.
220 I Street, N.E. — Suite 200
Washington, D.C. 20002 | | Director | | Since
July
1991 | | Senior Partner, Johnson Smick International, Inc. (consulting firm); Chairperson of the Investment Committee (since October 2006) and Director or Trustee of various Morgan Stanley Funds (since July 1991); Co-Chairman and a founder of the Group of Seven Council (G7C) (international economic commission); formerly, Chairperson of the Audit Committee (July 1991-September 2006), Vice Chairman of the Board of Governors of the Federal Reserve System and Assistant Secretary of the U.S. Treasury. | | | 91 | | | Director of NVR, Inc. (home construction). | |
Joseph J. Kearns (74)
c/o Kearns & Associates LLC
46 E Peninsula Center #385
Rolling Hills Estates, CA
90274-3712 | | Director | | Since
August
1994 | | President, Kearns & Associates LLC (investment consulting); Chairperson of the Audit Committee (since October 2006) and Director or Trustee of various Morgan Stanley Funds (since August 1994); formerly, Deputy Chairperson of the Audit Committee (July 2003-September 2006) and Chairperson of the Audit Committee of various Morgan Stanley Funds (since August 1994); CFO of the J. Paul Getty Trust. | | | 93 | | | Director of Electro Rent Corporation (equipment leasing). Prior to December 31, 2013, Director of The Ford Family Foundation. | |
32
Morgan Stanley Institutional Fund, Inc.
Annual Report — December 31, 2016
Director and Officer Information (unaudited) (cont'd)
Independent Directors: (cont'd)
Name, Age and Address of
Independent Director | | Position(s)
Held with
Registrant | | Length of Time
Served* | | Principal Occupation(s) During Past 5 Years
and Other Relevant Professional Experience | | Number of
Overseen by
Independent
Director** | | Portfolios in
Fund Complex
Other Directorships
Held by Independent
Director*** | |
Michael F. Klein (58)
c/o Perkins Coie LLP
Counsel to the Independent Directors
30 Rockefeller Plaza
New York, NY 10112 | | Director | | Since
August
2006 | | Managing Director, Aetos Capital, LLC (since March 2000); Co-President, Aetos Alternatives Management, LLC (since January 2004) and Co-Chief Executive Officer of Aetos Capital LLC (since August 2013); Chairperson of the Fixed Income Sub-Committee of the Investment Committee (since October 2006) and Director or Trustee of various Morgan Stanley Funds (since August 2006); formerly, Managing Director, Morgan Stanley & Co. Inc. and Morgan Stanley Dean Witter Investment Management, President, various Morgan Stanley Funds (June 1998-March 2000) and Principal, Morgan Stanley & Co. Inc. and Morgan Stanley Dean Witter Investment Management (August 1997-December 1999). | | | 90 | | | Director of certain investment funds managed or sponsored by Aetos Capital, LLC; Director of Sanitized AG and Sanitized Marketing AG (specialty chemicals). | |
Patricia Maleski (56)
c/o Perkins Coie LLP
Counsel to the Independent Directors
30 Rockefeller Plaza
New York, NY 10112 | | Director | | Since
January
2017 | | Management Director, JPMorgan Asset Management (2013-2016); President, JPMorgan Funds (2010-2013), Chief Administrative Officer, JPMorgan Funds (2004-2010), Treasurer, JPMorgan Funds (2003-2004, 2008-2010), and Vice President and Board Liaison, JPMorgan Funds (2001-2004); Managing Director, J.P. Morgan Investment Management Inc. (2001-2013); Vice President of Finance, Pierpont Group (1996-2001); Vice President, Bank of New York (1995-1996); Senior Audit Manager, Price Waterhouse, LLP (1982-1995). | | | 91 | | | None. | |
Michael E. Nugent (80)
522 Fifth Avenue
New York, NY 10036 | | Chair of the Board and Director | | Chair of the Boards since July 2006 and Director since July 1991 | | Chair of the Boards of various Morgan Stanley Funds (since July 2006); Chairperson of the Closed-End Fund Committee (since June 2012) and Director or Trustee of various Morgan Stanley Funds (since July 1991); formerly, Chairperson of the Insurance Committee (until July 2006); General Partner, Triumph Capital, L.P. (private investment partnership) (1988-2013). | | | 92 | | | None. | |
W. Allen Reed (69)
c/o Perkins Coie LLP
Counsel to the Independent Directors
30 Rockefeller Plaza
New York, NY 10112 | | Director | | Since
August
2006 | | Chairperson of the Equity Sub-Committee of the Investment Committee (since October 2006) and Director or Trustee of various Morgan Stanley Funds (since August 2006); formerly, President and CEO of General Motors Asset Management; Chairman and Chief Executive Officer of the GM Trust Bank and Corporate Vice President of General Motors Corporation (August 1994-December 2005). | | | 91 | | | Director of Legg Mason, Inc.; formerly, Director of the Auburn University Foundation (2010-2015). | |
Fergus Reid (84)
c/o Joe Pietryka, Inc.
85 Charles Colman Blvd.
Pawling, NY 12564 | | Director | | Since
June
1992 | | Chairman, Joe Pietryka, Inc.; Chairperson of the Governance Committee and Director or Trustee of various Morgan Stanley Funds (since June 1992). | | | 92 | | | Formerly, Trustee and Director of certain investment companies in the JP Morgan Fund Complex managed by JP Morgan Investment Management Inc. (1987-2012). | |
* This is the earliest date the Director began serving the Morgan Stanley Funds. Each Director serves an indefinite term, until his or her successor is elected.
** The Fund Complex includes (as of December 31, 2016) all open-end and closed-end funds (including all of their portfolios) advised by Morgan Stanley Investment Management Inc. (the "Adviser") and any funds that have an adviser that is an affiliated person of the Adviser (including, but not limited to, Morgan Stanley AIP GP LP).
*** This includes any directorships at public companies and registered investment companies held by the Director at any time during the past five years.
33
Morgan Stanley Institutional Fund, Inc.
Annual Report — December 31, 2016
Director and Officer Information (unaudited) (cont'd)
Executive Officers:
Name, Age and Address of Executive Officer | | Position(s) Held
with
Registrant | | Length of Time
Served* | | Principal Occupation(s) During Past 5 Years | |
John H. Gernon (53)
522 Fifth Avenue
New York, NY 10036 | | President and Principal Executive Officer | | Since
September
2013 | | President and Principal Executive Officer of the Equity and Fixed Income Funds and the Morgan Stanley AIP Funds (since September 2013) and the Liquidity Funds and various money market funds (since May 2014) in the Fund Complex; Managing Director of the Adviser; Head of Product (since 2006). | |
Timothy J. Knierim (58)
522 Fifth Avenue
New York, NY 10036 | | Chief Compliance Officer | | Since
December
2016 | | Managing Director of the Adviser and various entities affiliated with the Adviser; Chief Compliance Officer of various Morgan Stanley Funds and the Adviser (since December 2016) and Chief Compliance Officer of Morgan Stanley AIP GP LP (since 2014). Formerly, Managing Director and Deputy Chief Compliance Officer of the Adviser (2014-2016); and formerly, Chief Compliance Officer of Prudential Investment Management, Inc. (2007-2014). | |
Francis J. Smith (51)
522 Fifth Avenue
New York, NY 10036 | | Treasurer and Principal Financial Officer | | Treasurer since July 2003 and Principal Financial Officer since September 2002 | | Managing Director of the Adviser and various entities affiliated with the Adviser; Treasurer (since July 2003) and Principal Financial Officer of various Morgan Stanley Funds (since September 2002). | |
Mary E. Mullin (49)
522 Fifth Avenue
New York, NY 10036 | | Secretary | | Since
June
1999 | | Executive Director of the Adviser; Secretary of various Morgan Stanley Funds (since June 1999). | |
* This is the earliest date the officer began serving the Morgan Stanley Funds. Each officer serves a one-year term, until his or her successor is elected and qualifies.
34
Morgan Stanley Institutional Fund, Inc.
Annual Report — December 31, 2016
Adviser and Administrator
Morgan Stanley Investment Management Inc.
522 Fifth Avenue
New York, New York 10036
Distributor
Morgan Stanley Distribution, Inc.
522 Fifth Avenue
New York, New York 10036
Dividend Disbursing and Transfer Agent
Boston Financial Data Services, Inc.
2000 Crown Colony Drive
Quincy, Massachusetts 02169
Custodian
State Street Bank and Trust Company
One Lincoln Street
Boston, Massachusetts 02111
Legal Counsel
Dechert LLP
1095 Avenue of the Americas
New York, New York 10036
Counsel to the Independent Directors
Perkins Coie LLP
30 Rockefeller Plaza
New York, New York 10112
Independent Registered Public Accounting Firm
Ernst & Young LLP
200 Clarendon Street
Boston, Massachusetts 02116
Reporting to Shareholders
Each Morgan Stanley fund provides a complete schedule of portfolio holdings in its semi-annual and annual reports within 60 days of the end of the fund's second and fourth fiscal quarters. The semi-annual and annual reports are filed electronically with the Securities and Exchange Commission (SEC) on Form N-CSRS and Form N-CSR, respectively. Morgan Stanley also delivers the semi-annual and annual reports to fund shareholders and makes these reports available on its public website, www.morganstanley.com/im. Each Morgan Stanley fund also files a complete schedule of portfolio holdings with the SEC for the fund's first and third fiscal quarters on Form N-Q. Morgan Stanley does not deliver the reports for the first and third fiscal quarters to shareholders, nor are the reports posted to the Morgan Stanley public website. You may, however, obtain the Form N-Q filings (as well as the Form N-CSR and N-CSRS filings) by accessing the SEC's website, www.sec.gov. You may also review and copy them at the SEC's Public Reference Room in Washington, DC. Information on the operation of the SEC's Public Reference Room may be obtained by calling the SEC toll free at 1 (800) SEC-0330. You can also request copies of these materials, upon payment of a duplicating fee, by electronic request at the SEC's email address (publicinfo@sec.gov) or by writing the Public Reference Room of the SEC, 100 F Street, NE, Washington, DC 20549-0102.
Proxy Voting Policies and Procedures and Proxy Voting Record
You may obtain a copy of the Fund's Proxy Voting Policy and Procedures and information regarding how the Fund voted proxies relating to portfolio securities during the most recent twelve-month period ended June 30, without charge, upon request, by calling toll free 1 (800) 548-7786 or by visiting our website at www.morganstanley.com/im. This information is also available on the SEC's website at www.sec.gov.
This report is authorized for distribution only when preceded or accompanied by a prospectus or summary prospectus of the applicable Portfolio of Morgan Stanley Institutional Fund, Inc., which describes in detail the Portfolio's investment policies, risks, fees and expenses. Please read the prospectus carefully before you invest or send money. For additional information, including information regarding the investments comprising the Portfolio, please visit our website at www.morganstanley.com/im or call toll free 1 (800) 548-7786.
35
(This Page has been left blank intentionally.)
(This Page has been left blank intentionally.)
Printed in U.S.A.
This Report has been prepared for shareholders and may be distributed to others only if preceded or accompanied by a current prospectus.
Morgan Stanley Investment Management Inc.
522 Fifth Avenue
New York, New York 10036
© 2017 Morgan Stanley. Morgan Stanley Distribution, Inc.

IFIFEMANN
1707956 EXP. 02.28.18

Morgan Stanley Institutional Fund, Inc.
Global Advantage Portfolio
Annual Report
December 31, 2016

Morgan Stanley Institutional Fund, Inc.
Annual Report — December 31, 2016
Shareholders' Letter | | | 2 | | |
Expense Example | | | 3 | | |
Investment Overview | | | 4 | | |
Portfolio of Investments | | | 6 | | |
Statement of Assets and Liabilities | | | 7 | | |
Statement of Operations | | | 9 | | |
Statements of Changes in Net Assets | | | 10 | | |
Financial Highlights | | | 12 | | |
Notes to Financial Statements | | | 16 | | |
Report of Independent Registered Public Accounting Firm | | | 25 | | |
Federal Tax Notice | | | 26 | | |
Privacy Notice | | | 27 | | |
Director and Officer Information | | | 30 | | |
This report is authorized for distribution only when preceded or accompanied by a prospectus or summary prospectus of the applicable Portfolio of Morgan Stanley Institutional Fund, Inc. To receive a prospectus and/or statement of additional information (SAI), which contains more complete information such as investment objectives, charges, expenses, policies for voting proxies, risk considerations, and describes in detail each of the Portfolio's investment policies to the prospective investor, please call toll free 1 (800) 548-7786. Please read the prospectuses carefully before you invest or send money.
Additionally, you can access information about the Portfolio, including performance, characteristics, and investment team commentary, through Morgan Stanley Investment Management's website: www.morganstanley.com/im.
Market forecasts provided in this report may not necessarily come to pass. There is no guarantee that any sectors mentioned will continue to perform as discussed herein or that securities in such sectors will be held by the Portfolio in the future. There is no assurance that a Portfolio will achieve its investment objective. Portfolios are subject to market risk, which is the possibility that market values of securities owned by the Portfolio will decline and, therefore, the value of the Portfolio's shares may be less than what you paid for them. Accordingly, you can lose money investing in this Portfolio. Please see the prospectus for more complete information on investment risks.
1
Morgan Stanley Institutional Fund, Inc.
Annual Report — December 31, 2016
Shareholders' Letter (unaudited)
Dear Shareholders,
We are pleased to provide this Annual report, in which you will learn how your investment in Global Advantage Portfolio (the "Portfolio") performed during the latest twelve-month period.
Morgan Stanley Investment Management is a client-centric, investor-led organization. Our global presence, intellectual capital, and breadth of products and services enable us to partner with investors to meet the evolving challenges of today's financial markets. We aim to deliver superior investment service and to empower our clients to make the informed decisions that help them reach their investment goals.
As always, we thank you for selecting Morgan Stanley Investment Management, and look forward to working with you in the months and years ahead.
Sincerely,

John H. Gernon
President and Principal Executive Officer
January 2017
2
Morgan Stanley Institutional Fund, Inc.
Annual Report — December 31, 2016
Expense Example (unaudited)
Global Advantage Portfolio
As a shareholder of the Portfolio, you incur two types of costs: (1) transactional costs; and (2) ongoing costs, which may include advisory fees, administration fees, distribution and shareholder services fees and other Portfolio expenses. This example is intended to help you understand your ongoing costs (in dollars) of investing in the Portfolio and to compare these costs with the ongoing costs of investing in other mutual funds.
This example is based on an investment of $1,000 invested at the beginning of the six-month period ended December 31, 2016 and held for the entire six-month period.
Actual Expenses
The table below provides information about actual account values and actual expenses. You may use the information in this table, together with the amount you invested, to estimate the expenses that you paid over the period. Simply divide your account value by $1,000 (for example, an $8,600 account value divided by $1,000 = 8.6), then multiply the result by the number in the table under the heading entitled "Actual Expenses Paid During Period" to estimate the expenses you paid on your account during this period.
Hypothetical Example for Comparison Purposes
The table below provides information about hypothetical account values and hypothetical expenses based on the Portfolio's actual expense ratio and an assumed rate of return of 5% per year before expenses, which is not the Portfolio's actual return. The hypothetical account values and expenses may not be used to estimate the actual ending account balance or expenses you paid for the period. You may use this information to compare the ongoing costs of investing in the Portfolio and other funds. To do so, compare this 5% hypothetical example with the 5% hypothetical examples that appear in the shareholder reports of the other funds.
Please note that the expenses shown in the table are meant to highlight your ongoing costs only and do not reflect any transactional costs, such as sales charges (loads). Therefore, the information for each class in the table is useful in comparing ongoing costs only, and will not help you determine the relative total costs of owning different funds. In addition, if these transactional costs were included, your costs would have been higher.
| | | Beginning
Account
Value
7/1/16 | | Actual Ending
Account
Value
12/31/16 | | Hypothetical
Ending Account
Value | | Actual
Expenses
Paid
During
Period* | | Hypothetical
Expenses Paid
During Period* | | Net
Expense
Ratio
During
Period** | |
Global Advantage Portfolio Class I | | $ | 1,000.00 | | | $ | 1,033.10 | | | $ | 1,019.66 | | | $ | 5.57 | | | $ | 5.53 | | | | 1.09 | %*** | |
Global Advantage Portfolio Class A | | | 1,000.00 | | | | 1,031.60 | | | | 1,017.75 | | | | 7.51 | | | | 7.46 | | | | 1.47 | *** | |
Global Advantage Portfolio Class L | | | 1,000.00 | | | | 1,028.80 | | | | 1,015.38 | | | | 9.89 | | | | 9.83 | | | | 1.94 | *** | |
Global Advantage Portfolio Class C | | | 1,000.00 | | | | 1,028.10 | | | | 1,014.13 | | | | 11.16 | | | | 11.09 | | | | 2.19 | *** | |
* Expenses are calculated using each Portfolio Class' annualized net expense ratio (as disclosed), multiplied by the average account value over the period, and multiplied by 184/366 (to reflect the most recent one-half year period).
** Annualized.
*** Refer to Note F in the Notes to Financial Statements for discussion of prior period custodian out-of-pocket expenses that were reimbursed in the current period.
3
Morgan Stanley Institutional Fund, Inc.
Annual Report — December 31, 2016
Investment Overview (unaudited)
Global Advantage Portfolio
The Portfolio seeks long-term capital appreciation.
Performance
For the year ended December 31, 2016, the Portfolio's Class I shares had a total return based on net asset value and reinvestment of distributions per share of 0.21%, net of fees. The Portfolio's Class I shares underperformed the Portfolio's benchmark, the MSCI All Country World Index (the "Index"), which returned 7.86%.
Factors Affecting Performance
• Global equities rose 7.86% for the 12-month period, as measured by the Index. The Index was led by strong performance from the U.S. and emerging markets, while Japan and Europe lagged. Early in the year, worries about weak global growth and disinflation drove share prices lower. However, sentiment brightened as commodity prices bottomed, China's economy stabilized, the U.S. economy strengthened and global central banks remained accommodative. In the second half of the year, equity markets largely shrugged off the Brexit referendum's surprise outcome and the U.S., in particular, rallied strongly following the unexpected election of Donald Trump on anticipation of pro-growth, reflationary policy from the new administration.
• The long-term investment horizon and conviction-weighted investment approach embraced by the team since 1998 can result in periods of performance deviation from the benchmark and peers. In this reporting period, the Portfolio's relative underperformance was mostly driven by unfavorable stock selection. Sector allocation detracted to a lesser extent.
• Stock selection was the weakest in the information technology and consumer staples sectors. Overweight allocations to both sectors contributed a modest gain, but didn't offset the negative impact of stock selection.
• An underweight allocation to the energy sector also detracted from relative performance, as the sector was Index's top performer for the period.
• The health care sector was the largest positive contributor. Both an underweight allocation and stock selection in the sector were advantageous.
• Stock selection in the consumer discretionary sector was positive, but the negative impact of the overweight to the sector diminished relative gains.
• The Portfolio held no exposure to the real estate sector, which was beneficial to relative performance.
Management Strategies
• There were no changes to our bottom-up investment process during the period. We continued to look for franchises with strong name recognition and sustainable competitive advantages. We typically favor companies with rising returns on invested capital, above average business visibility, strong free cash flow generation and an attractive risk/reward profile. Our emphasis is on secular growth, and as a result short-term market events are not as meaningful in the stock selection process.

* Minimum Investment for Class I shares
** Commenced Operations on December 28, 2010.
In accordance with SEC regulations, the Portfolio's performance shown assumes that all recurring fees (including management fees) were deducted and all dividends and distributions were reinvested. The performance of Class A, L and C shares will vary from the performance of Class I shares based upon their different inception dates and will be negatively impacted by additional fees assessed to those classes.
4
Morgan Stanley Institutional Fund, Inc.
Annual Report — December 31, 2016
Investment Overview (unaudited) (cont'd)
Global Advantage Portfolio
Performance Compared to the MSCI All Country World Index(1) and the Lipper Global Multi-Cap Growth Funds Index(2)
| | | Period Ended December 31, 2016
Total Returns(3) | |
| | | | | Average Annual | |
| | | One
Year | | Five
Years | | Ten
Years | | Since
Inception(6) | |
Portfolio — Class I Shares
w/o sales charges(4) | | | 0.21 | % | | | 10.83 | % | | | — | | | | 9.01 | % | |
Portfolio — Class A Shares
w/o sales charges(4) | | | –0.11 | | | | 10.47 | | | | — | | | | 8.67 | | |
Portfolio — Class A Shares with
maximum 5.25% sales charges(4) | | | –5.35 | | | | 9.29 | | | | — | | | | 7.70 | | |
Portfolio — Class L Shares
w/o sales charges(4) | | | –0.70 | | | | 9.91 | | | | — | | | | 8.12 | | |
Portfolio — Class C Shares
w/o sales charges(5) | | | –0.95 | | | | — | | | | — | | | | –2.33 | | |
Portfolio — Class C Shares with
maximum 1.00% deferred
sales charges(5) | | | –1.92 | | | | — | | | | — | | | | –2.33 | | |
MSCI All Country World Index | | | 7.86 | | | | 9.36 | | | | — | | | | 6.48 | | |
Lipper Global Multi-Cap Growth
Funds Index | | | 2.90 | | | | 9.26 | | | | — | | | | 5.51 | | |
Performance data quoted represents past performance, which is no guarantee of future results, and current performance may be lower or higher than the figures shown. Performance assumes that all dividends and distributions, if any, were reinvested. For the most recent month-end performance figures, please visit www.morganstanley.com/im. Investment return and principal value will fluctuate so that Portfolio shares, when redeemed, may be worth more or less than their original cost. Total returns do not reflect the deduction of taxes that a shareholder would pay on Portfolio distributions or the redemption of Portfolio shares. Performance of share classes will vary due to difference in expenses.
(1) The MSCI All Country World Index (ACWI) is a free float-adjusted market capitalization weighted index designed to measure the equity market performance of developed and emerging markets. The term "free float" represents the portion of shares outstanding that are deemed to be available for purchase in the public equity markets by investors. It is not possible to invest directly in an index. The Index is unmanaged and its returns do not include any sales charges or fees. Such costs would lower performance. It is not possible to invest directly in an index.
(2) The Lipper Global Multi-Cap Growth Funds Index is an equally weighted performance index of the largest qualifying funds (based on net assets) in the Lipper Global Multi-Cap Growth Funds classification. The Index, which is adjusted for capital gains distributions and income dividends, is unmanaged and should not be considered an investment. There are currently 30 funds represented in this Index. As of the date of this report, the Portfolio is in the Lipper Global Multi-Cap Growth Funds classification.
(3) Total returns for the Portfolio reflect fees waived and expenses reimbursed, if applicable, by the Adviser. Without such waivers and reimbursements, total returns would have been lower.
(4) Commenced operations on December 28, 2010.
(5) Commenced offering on April 30, 2015.
(6) For comparative purposes, average annual since inception returns listed for the Indexes refer to the inception date of Class I of the Portfolio, not the inception of the Index.
5
Morgan Stanley Institutional Fund, Inc.
Annual Report — December 31, 2016
Portfolio of Investments
Global Advantage Portfolio
| | | Shares | | Value
(000) | |
Common Stocks (98.7%) | |
Brazil (1.9%) | |
MercadoLibre, Inc. | | | 778 | | | $ | 122 | | |
China (7.7%) | |
Alibaba Group Holding Ltd. ADR (a) | | | 2,758 | | | | 242 | | |
Tencent Holdings Ltd. (b) | | | 9,900 | | | | 243 | | |
| | | | 485 | | |
France (13.2%) | |
Christian Dior SE | | | 2,804 | | | | 588 | | |
Hermes International | | | 585 | | | | 240 | | |
| | | | 828 | | |
Germany (1.1%) | |
ThyssenKrupp AG | | | 2,742 | | | | 65 | | |
Italy (1.1%) | |
Brunello Cucinelli SpA | | | 3,286 | | | | 70 | | |
Japan (2.7%) | |
Calbee, Inc. | | | 5,400 | | | | 169 | | |
Netherlands (1.5%) | |
Priceline Group, Inc. (The) (a) | | | 62 | | | | 91 | | |
Spain (2.5%) | |
Industria de Diseno Textil SA | | | 4,631 | | | | 158 | | |
Switzerland (5.0%) | |
Nestle SA ADR | | | 4,325 | | | | 310 | | |
United Kingdom (6.9%) | |
BBA Aviation PLC | | | 20,761 | | | | 72 | | |
Intertek Group PLC | | | 2,352 | | | | 101 | | |
Reckitt Benckiser Group PLC | | | 1,834 | | | | 156 | | |
Whitbread PLC | | | 2,167 | | | | 101 | | |
| | | | 430 | | |
United States (55.1%) | |
Alphabet, Inc., Class C (a) | | | 400 | | | | 309 | | |
Amazon.com, Inc. (a) | | | 632 | | | | 474 | | |
Berkshire Hathaway, Inc., Class B (a) | | | 1,489 | | | | 243 | | |
Dollar Tree, Inc. (a) | | | 1,044 | | | | 81 | | |
Dunkin' Brands Group, Inc. | | | 1,735 | | | | 91 | | |
Facebook, Inc., Class A (a) | | | 4,021 | | | | 463 | | |
IHS Markit Ltd. (a) | | | 4,500 | | | | 159 | | |
Marriott International, Inc., Class A | | | 1,506 | | | | 124 | | |
Mastercard, Inc., Class A | | | 2,161 | | | | 223 | | |
MSCI, Inc. | | | 1,174 | | | | 92 | | |
S&P Global, Inc. | | | 1,884 | | | | 203 | | |
Salesforce.com, Inc. (a) | | | 2,138 | | | | 146 | | |
TJX Cos., Inc. (The) | | | 1,326 | | | | 100 | | |
TransDigm Group, Inc. | | | 393 | | | | 98 | | |
Twitter, Inc. (a) | | | 5,281 | | | | 86 | | |
United Technologies Corp. | | | 2,249 | | | | 246 | | |
Verisk Analytics, Inc. (a) | | | 1,124 | | | | 91 | | |
Visa, Inc., Class A | | | 1,576 | | | | 123 | | |
Zoetis, Inc. | | | 1,920 | | | | 103 | | |
| | | | 3,455 | | |
Total Common Stocks (Cost $5,535) | | | 6,183 | | |
| | | Notional
Amount
(000) | | Value
(000) | |
Call Option Purchased (0.0%) | |
Foreign Currency Option (0.0%) | |
USD/CNY May 2017 @ CNY 7.90,
Royal Bank of Scotland (Cost $3) | | | 800 | | | $ | 3 | | |
| | | Shares | | | |
Short-Term Investment (0.5%) | |
Investment Company (0.5%) | |
Morgan Stanley Institutional Liquidity
Funds — Treasury Securities Portfolio —
Institutional Class (See Note G)
(Cost $29) | | | 29,454 | | | | 29 | | |
Total Investments (99.2%) (Cost $5,567) (c) | | | 6,215 | | |
Other Assets in Excess of Liabilities (0.8%) | | | 51 | | |
Net Assets (100.0%) | | $ | 6,266 | | |
Country assignments and aggregations are based generally on third party vendor classifications and information, and may be different from the assignments and aggregations under the policies set forth in the Portfolio's prospectus and/or statement of additional information relating to geographic classifications.
(a) Non-income producing security.
(b) Security trades on the Hong Kong exchange.
(c) At December 31, 2016, the aggregate cost for federal income tax purposes is approximately $5,602,000. The aggregate gross unrealized appreciation is approximately $820,000 and the aggregate gross unrealized depreciation is approximately $207,000, resulting in net unrealized appreciation of approximately $613,000.
ADR American Depositary Receipt.
CNY — Chinese Yuan Renminbi
USD — United States Dollar
Portfolio Composition
Classification | | Percentage of
Total Investments | |
Internet Software & Services | | | 23.6 | % | |
Other* | | | 23.3 | | |
Textiles, Apparel & Luxury Goods | | | 14.5 | | |
Internet & Direct Marketing Retail | | | 9.1 | | |
Food Products | | | 7.7 | | |
Professional Services | | | 5.6 | | |
Information Technology Services | | | 5.6 | | |
Aerospace & Defense | | | 5.5 | | |
Hotels, Restaurants & Leisure | | | 5.1 | | |
Total Investments | | | 100.0 | % | |
* Industries and/or investment types representing less than 5% of total investments.
The accompanying notes are an integral part of the financial statements.
6
Morgan Stanley Institutional Fund, Inc.
Annual Report — December 31, 2016
Global Advantage Portfolio
Statement of Assets and Liabilities | | December 31, 2016
(000) | |
Assets: | |
Investments in Securities of Unaffiliated Issuers, at Value (Cost $5,538) | | $ | 6,186 | | |
Investment in Security of Affiliated Issuer, at Value (Cost $29) | | | 29 | | |
Total Investments in Securities, at Value (Cost $5,567) | | | 6,215 | | |
Foreign Currency, at Value (Cost —@) | | | — | @ | |
Receivable for Portfolio Shares Sold | | | 79 | | |
Due from Adviser | | | 2 | �� | |
Dividends Receivable | | | — | @ | |
Receivable from Affiliate | | | — | @ | |
Other Assets | | | 34 | | |
Total Assets | | | 6,330 | | |
Liabilities: | |
Payable for Professional Fees | | | 47 | | |
Payable for Custodian Fees | | | 5 | | |
Payable for Transfer Agency Fees — Class I | | | — | @ | |
Payable for Transfer Agency Fees — Class A | | | 1 | | |
Payable for Transfer Agency Fees — Class L | | | — | @ | |
Payable for Transfer Agency Fees — Class C | | | — | @ | |
Payable for Shareholder Services Fees — Class A | | | 1 | | |
Payable for Distribution and Shareholder Services Fees — Class L | | | — | @ | |
Payable for Distribution and Shareholder Services Fees — Class C | | | — | @ | |
Payable for Sub Transfer Agency Fees — Class I | | | — | @ | |
Payable for Sub Transfer Agency Fees — Class A | | | 1 | | |
Payable for Sub Transfer Agency Fees — Class L | | | — | @ | |
Payable for Sub Transfer Agency Fees — Class C | | | — | @ | |
Bank Overdraft | | | — | @ | |
Payable for Administration Fees | | | — | @ | |
Other Liabilities | | | 9 | | |
Total Liabilities | | | 64 | | |
Net Assets | | $ | 6,266 | | |
Net Assets Consist Of: | |
Paid-in-Capital | | $ | 5,662 | | |
Accumulated Net Investment Loss | | | (3 | ) | |
Distributions in Excess of Net Realized Gain | | | (41 | ) | |
Unrealized Appreciation (Depreciation) on: | |
Investments | | | 648 | | |
Foreign Currency Translations | | | (— | @) | |
Net Assets | | $ | 6,266 | | |
The accompanying notes are an integral part of the financial statements.
7
Morgan Stanley Institutional Fund, Inc.
Annual Report — December 31, 2016
Global Advantage Portfolio
Statement of Assets and Liabilities (cont'd) | | December 31, 2016
(000) | |
CLASS I: | |
Net Assets | | $ | 3,229 | | |
| Shares Outstanding $0.001 par value shares of beneficial interest (unlimited shares authorized) (not in 000's) | | | 266,329 | | |
Net Asset Value, Offering and Redemption Price Per Share | | $ | 12.12 | | |
CLASS A: | |
Net Assets | | $ | 2,640 | | |
| Shares Outstanding $0.001 par value shares of beneficial interest (unlimited shares authorized) (not in 000's) | | | 219,917 | | |
Net Asset Value, Redemption Price Per Share | | $ | 12.01 | | |
Maximum Sales Load | | | 5.25 | % | |
Maximum Sales Charge | | $ | 0.67 | | |
Maximum Offering Price Per Share | | $ | 12.68 | | |
CLASS L: | |
Net Assets | | $ | 217 | | |
| Shares Outstanding $0.001 par value shares of beneficial interest (unlimited shares authorized) (not in 000's) | | | 18,471 | | |
Net Asset Value, Offering and Redemption Price Per Share | | $ | 11.74 | | |
CLASS C: | |
Net Assets | | $ | 180 | | |
| Shares Outstanding $0.001 par value shares of beneficial interest (unlimited shares authorized) (not in 000's) | | | 15,477 | | |
Net Asset Value, Offering and Redemption Price Per Share | | $ | 11.66 | | |
@ Amount is less than $500.
The accompanying notes are an integral part of the financial statements.
8
Morgan Stanley Institutional Fund, Inc.
Annual Report — December 31, 2016
Global Advantage Portfolio
Statement of Operations | | Year Ended
December 31, 2016
(000) | |
Investment Income: | |
Dividends from Securities of Unaffiliated Issuers (Net of $5 of Foreign Taxes Withheld) | | $ | 72 | | |
Dividends from Security of Affiliated Issuer (Note G) | | | 1 | | |
Total Investment Income | | | 73 | | |
Expenses: | |
Professional Fees | | | 96 | | |
Advisory Fees (Note B) | | | 54 | | |
Registration Fees | | | 50 | | |
Shareholder Services Fees — Class A (Note D) | | | 10 | | |
Distribution and Shareholder Services Fees — Class L (Note D) | | | 2 | | |
Distribution and Shareholder Services Fees — Class C (Note D) | | | 2 | | |
Shareholder Reporting Fees | | | 9 | | |
Transfer Agency Fees — Class I (Note E) | | | 2 | | |
Transfer Agency Fees — Class A (Note E) | | | 2 | | |
Transfer Agency Fees — Class L (Note E) | | | 2 | | |
Transfer Agency Fees — Class C (Note E) | | | 2 | | |
Custodian Fees (Note F) | | | 6 | | |
Administration Fees (Note C) | | | 5 | | |
Pricing Fees | | | 5 | | |
Sub Transfer Agency Fees — Class I | | | — | @ | |
Sub Transfer Agency Fees — Class A | | | 2 | | |
Sub Transfer Agency Fees — Class L | | | — | @ | |
Sub Transfer Agency Fees — Class C | | | — | @ | |
Directors' Fees and Expenses | | | 2 | | |
Other Expenses | | | 23 | | |
Total Expenses | | | 274 | | |
Expenses Reimbursed by Adviser (Note B) | | | (90 | ) | |
Waiver of Advisory Fees (Note B) | | | (54 | ) | |
Reimbursement of Class Specific Expenses — Class I (Note B) | | | (2 | ) | |
Reimbursement of Class Specific Expenses — Class A (Note B) | | | (1 | ) | |
Reimbursement of Class Specific Expenses — Class L (Note B) | | | (2 | ) | |
Reimbursement of Class Specific Expenses — Class C (Note B) | | | (2 | ) | |
Rebate from Morgan Stanley Affiliate (Note G) | | | (— | @) | |
Reimbursement of Custodian Fees (Note F) | | | (32 | ) | |
Net Expenses | | | 91 | | |
Net Investment Loss | | | (18 | ) | |
Realized Gain: | |
Investments Sold | | | 46 | | |
Foreign Currency Transactions | | | — | @ | |
Net Realized Gain | | | 46 | | |
Change in Unrealized Appreciation (Depreciation): | |
Investments | | | 110 | | |
Foreign Currency Translations | | | — | @ | |
Net Change in Unrealized Appreciation (Depreciation) | | | 110 | | |
Net Realized Gain and Change in Unrealized Appreciation (Depreciation) | | | 156 | | |
Net Increase in Net Assets Resulting from Operations | | $ | 138 | | |
@ Amount is less than $500.
The accompanying notes are an integral part of the financial statements.
9
Morgan Stanley Institutional Fund, Inc.
Annual Report — December 31, 2016
Global Advantage Portfolio
Statements of Changes in Net Assets | | Year Ended
December 31, 2016
(000) | | Year Ended
December 31, 2015
(000) | |
Increase (Decrease) in Net Assets: | |
Operations: | |
Net Investment Income (Loss) | | $ | (18 | ) | | $ | 1 | | |
Net Realized Gain | | | 46 | | | | 323 | | |
Net Change in Unrealized Appreciation (Depreciation) | | | 110 | | | | (27 | ) | |
Net Increase in Net Assets Resulting from Operations | | | 138 | | | | 297 | | |
Distributions from and/or in Excess of: | |
Class I: | |
Net Investment Income | | | — | | | | (7 | ) | |
Net Realized Gain | | | (61 | ) | | | (148 | ) | |
Class A: | |
Net Realized Gain | | | (74 | ) | | | (172 | ) | |
Class L: | |
Net Realized Gain | | | (6 | ) | | | (27 | ) | |
Class C: | |
Net Investment Income | | | — | | | | (— | @) | |
Net Realized Gain | | | (5 | ) | | | (3 | ) | |
Total Distributions | | | (146 | ) | | | (357 | ) | |
Capital Share Transactions:(1) | |
Class I: | |
Subscribed | | | 2,106 | | | | 497 | | |
Distributions Reinvested | | | 58 | | | | 131 | | |
Redeemed | | | (671 | ) | | | (2,065 | ) | |
Class A: | |
Subscribed | | | 1,326 | | | | 2,665 | | |
Distributions Reinvested | | | 71 | | | | 155 | | |
Redeemed | | | (2,218 | ) | | | (116 | ) | |
Class L: | |
Exchanged | | | 21 | | | | — | | |
Subscribed | | | — | | | | 128 | | |
Distributions Reinvested | | | 4 | | | | 18 | | |
Redeemed | | | (183 | ) | | | (86 | ) | |
Class C: | |
Subscribed | | | 223 | | | | 62 | * | |
Distributions Reinvested | | | 5 | | | | 2 | * | |
Redeemed | | | (108 | ) | | | (— | @)* | |
Net Increase in Net Assets Resulting from Capital Share Transactions | | | 634 | | | | 1,391 | | |
Total Increase in Net Assets | | | 626 | | | | 1,331 | | |
Net Assets: | |
Beginning of Period | | | 5,640 | | | | 4,309 | | |
End of Period (Including Accumulated Net Investment Loss of $(3) and $(4)) | | $ | 6,266 | | | $ | 5,640 | | |
The accompanying notes are an integral part of the financial statements.
10
Morgan Stanley Institutional Fund, Inc.
Annual Report — December 31, 2016
Global Advantage Portfolio
Statements of Changes in Net Assets (cont'd) | | Year Ended
December 31, 2016
(000) | | Year Ended
December 31, 2015
(000) | |
(1) Capital Share Transactions: | |
Class I: | |
Shares Subscribed | | | 171 | | | | 37 | | |
Shares Issued on Distributions Reinvested | | | 5 | | | | 10 | | |
Shares Redeemed | | | (54 | ) | | | (152 | ) | |
Net Increase (Decrease) in Class I Shares Outstanding | | | 122 | | | | (105 | ) | |
Class A: | |
Shares Subscribed | | | 114 | | | | 212 | | |
Shares Issued on Distributions Reinvested | | | 6 | | | | 12 | | |
Shares Redeemed | | | (178 | ) | | | (9 | ) | |
Net Increase (Decrease) in Class A Shares Outstanding | | | (58 | ) | | | 215 | | |
Class L: | |
Shares Exchanged | | | 2 | | | | — | | |
Shares Subscribed | | | — | | | | 10 | | |
Shares Issued on Distributions Reinvested | | | — | @@ | | | 1 | | |
Shares Redeemed | | | (15 | ) | | | (6 | ) | |
Net Increase (Decrease) in Class L Shares Outstanding | | | (13 | ) | | | 5 | | |
Class C: | |
Shares Subscribed | | | 20 | | | | 5 | * | |
Shares Issued on Distributions Reinvested | | | — | @@ | | | — | @@* | |
Shares Redeemed | | | (9 | ) | | | (— | @@)* | |
Net Increase in Class C Shares Outstanding | | | 11 | | | | 5 | | |
@ Amount is less than $500.
@@ Amount is less than 500 shares.
* For the period April 30, 2015 through December 31, 2015.
The accompanying notes are an integral part of the financial statements.
11
Morgan Stanley Institutional Fund, Inc.
Annual Report — December 31, 2016
Financial Highlights
Global Advantage Portfolio
| | | Class I | |
| | | Year Ended December 31, | |
Selected Per Share Data and Ratios | | 2016(1) | | 2015 | | 2014 | | 2013 | | 2012 | |
Net Asset Value, Beginning of Period | | $ | 12.36 | | | $ | 12.74 | | | $ | 13.57 | | | $ | 11.37 | | | $ | 9.97 | | |
Income from Investment Operations: | |
Net Investment Income (2) | | | 0.00 | (3) | | | 0.05 | | | | 0.05 | | | | 0.04 | | | | 0.16 | | |
Net Realized and Unrealized Gain | | | 0.02 | | | | 0.46 | | | | 0.04 | | | | 3.27 | | | | 2.12 | | |
Total from Investment Operations | | | 0.02 | | | | 0.51 | | | | 0.09 | | | | 3.31 | | | | 2.28 | | |
Distributions from and/or in Excess of: | |
Net Investment Income | | | — | | | | (0.03 | ) | | | (0.01 | ) | | | (0.08 | ) | | | (0.12 | ) | |
Net Realized Gain | | | (0.26 | ) | | | (0.86 | ) | | | (0.91 | ) | | | (1.03 | ) | | | (0.76 | ) | |
Total Distributions | | | (0.26 | ) | | | (0.89 | ) | | | (0.92 | ) | | | (1.11 | ) | | | (0.88 | ) | |
Net Asset Value, End of Period | | $ | 12.12 | | | $ | 12.36 | | | $ | 12.74 | | | $ | 13.57 | | | $ | 11.37 | | |
Total Return (4) | | | 0.21 | % | | | 3.85 | % | | | 0.83 | % | | | 29.71 | % | | | 22.83 | % | |
Ratios and Supplemental Data: | |
Net Assets, End of Period (Thousands) | | $ | 3,229 | | | $ | 1,785 | | | $ | 3,181 | | | $ | 2,868 | | | $ | 1,129 | | |
Ratio of Expenses to Average Net Assets (8) | | | 1.09 | %(5) | | | 1.11 | %(5)(6) | | | 1.30 | %(5) | | | 1.29 | %(5) | | | 1.30 | %(5) | |
Ratio of Net Investment Income to Average Net Assets (8) | | | 0.04 | %(5) | | | 0.37 | %(5) | | | 0.40 | %(5) | | | 0.29 | %(5) | | | 1.39 | %(5) | |
Ratio of Rebate from Morgan Stanley Affiliates to Average Net Assets | | | 0.01 | % | | | 0.00 | %(7) | | | 0.00 | %(7) | | | 0.01 | % | | | 0.00 | %(7) | |
Portfolio Turnover Rate | | | 90 | % | | | 90 | % | | | 46 | % | | | 57 | % | | | 63 | % | |
(8) Supplemental Information on the Ratios to Average Net Assets: | |
Ratios Before Expense Limitation: | |
Expenses to Average Net Assets | | | 3.82 | % | | | 5.38 | % | | | 5.31 | % | | | 8.07 | % | | | 7.28 | % | |
Net Investment Loss to Average Net Assets | | | (2.69 | )% | | | (3.90 | )% | | | (3.61 | )% | | | (6.49 | )% | | | (4.59 | )% | |
(1) Refer to Note F in the Notes to Financial Statements for discussion of prior period custodian out-of-pocket expenses that were reimbursed in the current period. The amount of the reimbursement was immaterial on a per share basis and did not impact the total return of Class I shares. The Ratio of Expenses to Average Net Assets and the Ratio of Net Investment Income to Average Net Assets would be unchanged as the reimbursement of custodian fees was offset against current period expense waivers/reimbursements with no impact to net expenses or net investment income.
(2) Per share amount is based on average shares outstanding.
(3) Amount is less than $0.005 per share.
(4) Calculated based on the net asset value as of the last business day of the period.
(5) The Ratios of Expenses and Net Investment Income reflect the rebate of certain Portfolio expenses in connection with the investments in Morgan Stanley affiliates during the period. The effect of the rebate on the ratios is disclosed in the above table as "Ratio of Rebate from Morgan Stanley Affiliates to Average Net Assets."
(6) Effective January 23, 2015, the Adviser has agreed to limit the ratio of expenses to average net assets to the maximum ratio of 1.10% for Class I shares. Prior to January 23, 2015, the maximum ratio was 1.30% for Class I shares.
(7) Amount is less than 0.005%.
The accompanying notes are an integral part of the financial statements.
12
Morgan Stanley Institutional Fund, Inc.
Annual Report — December 31, 2016
Financial Highlights
Global Advantage Portfolio
| | | Class A | |
| | | Year Ended December 31, | |
Selected Per Share Data and Ratios | | 2016(1) | | 2015 | | 2014 | | 2013 | | 2012 | |
Net Asset Value, Beginning of Period | | $ | 12.29 | | | $ | 12.70 | | | $ | 13.57 | | | $ | 11.36 | | | $ | 9.97 | | |
Income (Loss) from Investment Operations: | |
Net Investment Income (Loss) (2) | | | (0.05 | ) | | | (0.04 | ) | | | 0.01 | | | | (0.04 | ) | | | 0.13 | | |
Net Realized and Unrealized Gain | | | 0.03 | | | | 0.49 | | | | 0.04 | | | | 3.31 | | | | 2.11 | | |
Total from Investment Operations | | | (0.02 | ) | | | 0.45 | | | | 0.05 | | | | 3.27 | | | | 2.24 | | |
Distributions from and/or in Excess of: | |
Net Investment Income | | | — | | | | — | | | | (0.01 | ) | | | (0.03 | ) | | | (0.09 | ) | |
Net Realized Gain | | | (0.26 | ) | | | (0.86 | ) | | | (0.91 | ) | | | (1.03 | ) | | | (0.76 | ) | |
Total Distributions | | | (0.26 | ) | | | (0.86 | ) | | | (0.92 | ) | | | (1.06 | ) | | | (0.85 | ) | |
Net Asset Value, End of Period | | $ | 12.01 | | | $ | 12.29 | | | $ | 12.70 | | | $ | 13.57 | | | $ | 11.36 | | |
Total Return (3) | | | (0.11 | )% | | | 3.40 | % | | | 0.46 | % | | | 29.48 | % | | | 22.44 | % | |
Ratios and Supplemental Data: | |
Net Assets, End of Period (Thousands) | | $ | 2,640 | | | $ | 3,414 | | | $ | 790 | | | $ | 681 | | | $ | 114 | | |
Ratio of Expenses to Average Net Assets (8) | | | 1.44 | %(4) | | | 1.45 | %(4)(6) | | | 1.65 | %(4) | | | 1.60 | %(4)(5) | | | 1.55 | %(4) | |
Ratio of Net Investment Income (Loss) to Average Net Assets (8) | | | (0.38 | )%(4) | | | (0.34 | )%(4) | | | 0.05 | %(4) | | | (0.35 | )%(4) | | | 1.14 | %(4) | |
Ratio of Rebate from Morgan Stanley Affiliates to Average Net Assets | | | 0.01 | % | | | 0.01 | % | | | 0.00 | %(7) | | | 0.01 | % | | | 0.00 | %(7) | |
Portfolio Turnover Rate | | | 90 | % | | | 90 | % | | | 46 | % | | | 57 | % | | | 63 | % | |
(8) Supplemental Information on the Ratios to Average Net Assets: | |
Ratios Before Expense Limitation: | |
Expenses to Average Net Assets | | | 4.09 | % | | | 5.92 | % | | | 5.79 | % | | | 8.43 | % | | | 7.53 | % | |
Net Investment Loss to Average Net Assets | | | (3.03 | )% | | | (4.81 | )% | | | (4.09 | )% | | | (7.18 | )% | | | (4.84 | )% | |
(1) Refer to Note F in the Notes to Financial Statements for discussion of prior period custodian out-of-pocket expenses that were reimbursed in the current period. The amount of the reimbursement was immaterial on a per share basis and did not impact the total return of Class A shares. The Ratio of Expenses to Average Net Assets and the Ratio of Net Investment Loss to Average Net Assets would be unchanged as the reimbursement of custodian fees was offset against current period expense waivers/reimbursements with no impact to net expenses or net investment loss.
(2) Per share amount is based on average shares outstanding.
(3) Calculated based on the net asset value which does not reflect sales charges, if applicable, as of the last business day of the period.
(4) The Ratios of Expenses and Net Investment Income (Loss) reflect the rebate of certain Portfolio expenses in connection with the investments in Morgan Stanley affiliates during the period. The effect of the rebate on the ratios is disclosed in the above table as "Ratio of Rebate from Morgan Stanley Affiliates to Average Net Assets."
(5) Effective September 16, 2013, the Adviser has agreed to limit the ratio of expenses to average net assets to the maximum ratios of 1.65% for Class A shares. Prior to September 16, 2013, the maximum ratio was 1.55% for Class A shares.
(6) Effective January 23, 2015, the Adviser has agreed to limit the ratio of expenses to average net assets to the maximum ratio of 1.45% for Class A shares. Prior to January 23, 2015, the maximum ratio was 1.65% for Class A shares.
(7) Amount is less than 0.005%.
The accompanying notes are an integral part of the financial statements.
13
Morgan Stanley Institutional Fund, Inc.
Annual Report — December 31, 2016
Financial Highlights
Global Advantage Portfolio
| | | Class L | |
| | | Year Ended December 31, | |
Selected Per Share Data and Ratios | | 2016(1) | | 2015 | | 2014 | | 2013 | | 2012 | |
Net Asset Value, Beginning of Period | | $ | 12.09 | | | $ | 12.56 | | | $ | 13.50 | | | $ | 11.35 | | | $ | 9.96 | | |
Income (Loss) from Investment Operations: | |
Net Investment Income (Loss) (2) | | | (0.10 | ) | | | (0.08 | ) | | | (0.06 | ) | | | (0.09 | ) | | | 0.07 | | |
Net Realized and Unrealized Gain | | | 0.01 | | | | 0.47 | | | | 0.04 | | | | 3.28 | | | | 2.11 | | |
Total from Investment Operations | | | (0.09 | ) | | | 0.39 | | | | (0.02 | ) | | | 3.19 | | | | 2.18 | | |
Distributions from and/or in Excess of: | |
Net Investment Income | | | — | | | | — | | | | (0.01 | ) | | | (0.01 | ) | | | (0.03 | ) | |
Net Realized Gain | | | (0.26 | ) | | | (0.86 | ) | | | (0.91 | ) | | | (1.03 | ) | | | (0.76 | ) | |
Total Distributions | | | (0.26 | ) | | | (0.86 | ) | | | (0.92 | ) | | | (1.04 | ) | | | (0.79 | ) | |
Net Asset Value, End of Period | | $ | 11.74 | | | $ | 12.09 | | | $ | 12.56 | | | $ | 13.50 | | | $ | 11.35 | | |
Total Return (3) | | | (0.70 | )% | | | 2.96 | % | | | (0.07 | )% | | | 28.78 | % | | | 21.89 | % | |
Ratios and Supplemental Data: | |
Net Assets, End of Period (Thousands) | | $ | 217 | | | $ | 382 | | | $ | 338 | | | $ | 254 | | | $ | 113 | | |
Ratio of Expenses to Average Net Assets (8) | | | 1.94 | %(4) | | | 1.96 | %(4)(6) | | | 2.15 | %(4) | | | 2.09 | %(4)(5) | | | 2.05 | %(4) | |
Ratio of Net Investment Income (Loss) to Average Net Assets (8) | | | (0.86 | )%(4) | | | (0.60 | )%(4) | | | (0.45 | )%(4) | | | (0.71 | )%(4) | | | 0.64 | %(4) | |
Ratio of Rebate from Morgan Stanley Affiliates to Average Net Assets | | | 0.01 | % | | | 0.00 | %(7) | | | 0.00 | %(7) | | | 0.01 | % | | | 0.00 | %(7) | |
Portfolio Turnover Rate | | | 90 | % | | | 90 | % | | | 46 | % | | | 57 | % | | | 63 | % | |
(8) Supplemental Information on the Ratios to Average Net Assets: | |
Ratios Before Expense Limitation: | |
Expenses to Average Net Assets | | | 5.12 | % | | | 6.58 | % | | | 6.55 | % | | | 9.07 | % | | | 8.03 | % | |
Net Investment Loss to Average Net Assets | | | (4.04 | )% | | | (5.22 | )% | | | (4.85 | )% | | | (7.69 | )% | | | (5.34 | )% | |
(1) Refer to Note F in the Notes to Financial Statements for discussion of prior period custodian out-of-pocket expenses that were reimbursed in the current period. The amount of the reimbursement was immaterial on a per share basis and did not impact the total return of Class L shares. The Ratio of Expenses to Average Net Assets and the Ratio of Net Investment Loss to Average Net Assets would be unchanged as the reimbursement of custodian fees was offset against current period expense waivers/reimbursements with no impact to net expenses or net investment loss.
(2) Per share amount is based on average shares outstanding.
(3) Calculated based on the net asset value as of the last business day of the period.
(4) The Ratios of Expenses and Net Investment Income (Loss) reflect the rebate of certain Portfolio expenses in connection with the investments in Morgan Stanley affiliates during the period. The effect of the rebate on the ratios is disclosed in the above table as "Ratio of Rebate from Morgan Stanley Affiliates to Average Net Assets."
(5) Effective September 16, 2013, the Adviser has agreed to limit the ratio of expenses to average net assets to the maximum ratio of 2.15% for Class L shares. Prior to September 16, 2013, the maximum ratio was 2.05% for Class L shares.
(6) Effective January 23, 2015, the Adviser has agreed to limit the ratio of expenses to average net assets to the maximum ratio of 1.95% for Class L shares. Prior to January 23, 2015, the maximum ratio was 2.15% for Class L shares.
(7) Amount is less than 0.005%.
The accompanying notes are an integral part of the financial statements.
14
Morgan Stanley Institutional Fund, Inc.
Annual Report — December 31, 2016
Financial Highlights
Global Advantage Portfolio
| | | Class C | |
Selected Per Share Data and Ratios | | Year Ended
December 31, 2016(1) | | Period from
April 30, 2015(2) to
December 31, 2015 | |
Net Asset Value, Beginning of Period | | $ | 12.04 | | | $ | 13.30 | | |
Income (Loss) from Investment Operations: | |
Net Investment Loss (3) | | | (0.13 | ) | | | (0.11 | ) | |
Net Realized and Unrealized Gain (Loss) | | | 0.01 | | | | (0.26 | ) | |
Total from Investment Operations | | | (0.12 | ) | | | (0.37 | ) | |
Distributions from and/or in Excess of: | |
Net Investment Income | | | — | | | | (0.03 | ) | |
Net Realized Gain | | | (0.26 | ) | | | (0.86 | ) | |
Total Distributions | | | (0.26 | ) | | | (0.89 | ) | |
Net Asset Value, End of Period | | $ | 11.66 | | | $ | 12.04 | | |
Total Return (4) | | | (0.95 | )% | | | (2.94 | )%(7) | |
Ratios and Supplemental Data: | |
Net Assets, End of Period (Thousands) | | $ | 180 | | | $ | 59 | | |
Ratio of Expenses to Average Net Assets (9) | | | 2.19 | %(5) | | | 2.20 | %(5)(8) | |
Ratio of Net Investment Loss to Average Net Assets (9) | | | (1.12 | )%(5) | | | (1.33 | )%(5)(8) | |
Ratio of Rebate from Morgan Stanley Affiliates to Average Net Assets | | | 0.01 | % | | | 0.00 | %(6)(8) | |
Portfolio Turnover Rate | | | 90 | % | | | 90 | % | |
(9) Supplemental Information on the Ratios to Average Net Assets: | |
Ratios Before Expense Limitation: | |
Expense to Average Net Assets | | | 6.12 | % | | | 12.84 | %(8) | |
Net Investment Loss to Average Net Assets | | | (5.05 | )% | | | (11.97 | )%(8) | |
(1) Refer to Note F in the Notes to Financial Statements for discussion of prior period custodian out-of-pocket expenses that were reimbursed in the current period. The amount of the reimbursement was immaterial on a per share basis and did not impact the total return of Class C shares. The Ratio of Expenses to Average Net Assets and the Ratio of Net Investment Loss to Average Net Assets would be unchanged as the reimbursement of custodian fees was offset against current period expense waivers/reimbursements with no impact to net expenses or net investment loss.
(2) Commencement of Offering.
(3) Per share amount is based on average shares outstanding.
(4) Calculated based on the net asset value which does not reflect sales charges, if applicable, as of the last business day of the period.
(5) The Ratios of Expenses and Net Investment Loss reflect the rebate of certain Portfolio expenses in connection with the investments in Morgan Stanley affiliates during the period. The effect of the rebate on the ratios is disclosed in the above table as "Ratio of Rebate from Morgan Stanley Affiliates to Average Net Assets."
(6) Amount is less than 0.005%.
(7) Not Annualized.
(8) Annualized.
The accompanying notes are an integral part of the financial statements.
15
Morgan Stanley Institutional Fund, Inc.
Annual Report — December 31, 2016
Notes to Financial Statements
Morgan Stanley Institutional Fund, Inc. (the "Fund") is registered under the Investment Company Act of 1940, as amended (the "Act"), as an open-end management investment company. The Fund is comprised of twenty-nine separate, active, diversified and non-diversified portfolios (individually referred to as a "Portfolio", collectively as the "Portfolios"). The Fund applies investment company accounting and reporting guidance.
The accompanying financial statements relate to the Global Advantage Portfolio. The Portfolio seeks long-term capital appreciation.
The Portfolio offers four classes of shares — Class I, Class A, Class L and Class C. On April 30, 2015, the Portfolio suspended offering Class L shares. Existing Class L shareholders may invest through reinvestment of dividends and distributions.
A. Significant Accounting Policies: The following significant accounting policies are in conformity with U.S. generally accepted accounting principles ("GAAP"). Such policies are consistently followed by the Fund in the preparation of its financial statements. GAAP may require management to make estimates and assumptions that affect the reported amounts and disclosures in the financial statements. Actual results may differ from those estimates.
1. Security Valuation: (1) An equity portfolio security listed or traded on an exchange is valued at its latest reported sales price (or at the exchange official closing price if such exchange reports an official closing price), and if there were no sales on a given day and if there is no official exchange closing price for that day, the security is valued at the mean between the last reported bid and asked prices if such bid and asked prices are available on the relevant exchanges; (2) all other equity portfolio securities for which over-the-counter ("OTC") market quotations are readily available are valued at the latest reported sales price (or at the market official closing price if such market reports an official closing price), and if there was no trading in the security on a given day and if there is no official closing price from relevant markets for that day, the security is valued at the mean between the last reported bid and asked prices if such bid and asked prices are available on the relevant markets. Listed equity securities not traded on the valuation date with no reported bid and asked prices available on the exchange are valued at the mean between the current bid and asked prices obtained from one or more reputable brokers or dealers. An unlisted equity security that does not trade on the valuation date and for
which bid and asked prices from the relevant markets are unavailable is valued at the mean between the current bid and asked prices obtained from one or more reputable brokers or dealers. In cases where a security is traded on more than one exchange, the security is valued on the exchange designated as the primary market; (3) Listed options are valued at the last reported sales price on the exchange on which they are listed (or at the exchange official closing price if such exchange reports an official closing price). If an official closing price or last reported sale price is unavailable, the listed option should be fair valued at the mean between its latest bid and ask prices. Unlisted options are valued at the mean between their latest bid and ask prices from a broker/dealer or valued by a pricing service/vendor; (4) certain portfolio securities may be valued by an outside pricing service/vendor approved by the Fund's Board of Directors (the "Directors"). The pricing service/vendor may employ a pricing model that takes into account, among other things, bids, yield spreads, and/or other market data and specific security characteristics. Alternatively, if a valuation is not available from an outside pricing service/vendor, and the security trades on an exchange, the security may be valued at its latest reported sale price (or at the exchange official closing price if such exchange reports an official closing price), prior to the time when assets are valued. If there are no sales on a given day and if there is no official exchange closing price for that day, the security is valued at the mean between the last reported bid and asked prices if such bid and asked prices are available in the relevant exchanges; (5) when market quotations are not readily available, including circumstances under which Morgan Stanley Investment Management Inc. (the "Adviser") determines that the closing price, last sale price or the mean between the last reported bid and asked prices are not reflective of a security's market value, portfolio securities are valued at their fair value as determined in good faith under procedures established by and under the general supervision of the Directors. Occasionally, developments affecting the closing prices of securities and other assets may occur between the times at which valuations of such securities are determined (that is, close of the foreign market on which the securities trade) and the close of business of the New York Stock Exchange ("NYSE"). If developments occur during such periods that are expected to materially affect the value of such securities, such valuations may be adjusted to reflect the estimated fair value of such securities as of the close of
16
Morgan Stanley Institutional Fund, Inc.
Annual Report — December 31, 2016
Notes to Financial Statements (cont'd)
the NYSE, as determined in good faith by the Directors or by the Adviser using a pricing service and/or procedures approved by the Directors; (6) quotations of foreign portfolio securities, other assets and liabilities and forward contracts stated in foreign currency are translated into U.S. dollar equivalents at the prevailing market rates prior to the close of the NYSE; and (7) investments in mutual funds, including the Morgan Stanley Institutional Liquidity Funds, are valued at the net asset value ("NAV") as of the close of each business day.
The Directors have responsibility for determining in good faith the fair value of the investments, and the Directors may appoint others, such as the Fund's Adviser or a valuation committee, to assist the Directors in determining fair value and to make the actual calculations pursuant to the fair valuation methodologies previously approved by the Directors. Under procedures approved by the Directors, the Fund's Adviser has formed a Valuation Committee whose members are approved by the Directors. The Valuation Committee provides administration and oversight of the Fund's valuation policies and procedures, which are reviewed at least annually by the Directors. These procedures allow the Fund to utilize independent pricing services, quotations from securities and financial instrument dealers, and other market sources to determine fair value.
The Fund has procedures to determine the fair value of securities and other financial instruments for which market prices are not readily available. Under these procedures, the Valuation Committee convenes on a regular and ad hoc basis to review such securities and considers a number of factors, including valuation methodologies and significant unobservable valuation inputs, when arriving at fair value. The Valuation Committee may employ a market-based approach which may use related or comparable assets or liabilities, recent transactions, market multiples, book values, and other relevant information for the investment to determine the fair value of the investment. An income-based valuation approach may also be used in which the anticipated future cash flows of the investment are discounted to calculate fair value. Discounts may also be applied due to the nature or duration of any restrictions on the disposition of the investments. Due to the inherent uncertainty of valuations of such investments, the fair values may differ significantly from the values that would have been used had an
active market existed. The Valuation Committee employs various methods for calibrating these valuation approaches including a regular review of valuation methodologies, key inputs and assumptions, transactional back-testing or disposition analysis, and reviews of any related market activity.
2. Fair Value Measurement: Financial Accounting Standards Board ("FASB") Accounting Standards CodificationTM ("ASC") 820, "Fair Value Measurement" ("ASC 820"), defines fair value as the value that the Fund would receive to sell an investment or pay to transfer a liability in a timely transaction with an independent buyer in the principal market, or in the absence of a principal market, the most advantageous market for the investment or liability. ASC 820 establishes a three-tier hierarchy to distinguish between (1) inputs that reflect the assumptions market participants would use in valuing an asset or liability developed based on market data obtained from sources independent of the reporting entity (observable inputs) and (2) inputs that reflect the reporting entity's own assumptions about the assumptions market participants would use in valuing an asset or liability developed based on the best information available in the circumstances (unobservable inputs) and to establish classification of fair value measurements for disclosure purposes. Various inputs are used in determining the value of the Fund's investments. The inputs are summarized in the three broad levels listed below.
• Level 1 – unadjusted quoted prices in active markets for identical investments
• Level 2 – other significant observable inputs (including quoted prices for similar investments, interest rates, prepayment speeds, credit risk, etc.)
• Level 3 – significant unobservable inputs including the Fund's own assumptions in determining the fair value of investments. Factors considered in making this determination may include, but are not limited to, information obtained by contacting the issuer, analysts, or the appropriate stock exchange (for exchange-traded securities), analysis of the issuer's financial statements or other available documents and, if necessary, available
17
Morgan Stanley Institutional Fund, Inc.
Annual Report — December 31, 2016
Notes to Financial Statements (cont'd)
information concerning other securities in similar circumstances
The inputs or methodology used for valuing securities are not necessarily an indication of the risk associated with investing in those securities and the determination of the significance of a particular input to the fair value measurement in its entirety requires judgment and considers factors specific to each security.
The following is a summary of the inputs used to value the Portfolio's investments as of December 31, 2016.
Investment Type | | Level 1
Unadjusted
quoted
prices
(000) | | Level 2
Other
significant
observable
inputs
(000) | | Level 3
Significant
unobservable
inputs
(000) | | Total
(000) | |
Assets: | |
Common Stocks | |
Aerospace & Defense | | $ | 344 | | | $ | — | | | $ | — | | | $ | 344 | | |
Capital Markets | | | 295 | | | | — | | | | — | | | | 295 | | |
Diversified Financial
Services | | | 243 | | | | — | | | | — | | | | 243 | | |
Food Products | | | 479 | | | | — | | | | — | | | | 479 | | |
Hotels, Restaurants &
Leisure | | | 316 | | | | — | | | | — | | | | 316 | | |
Household Products | | | 156 | | | | — | | | | — | | | | 156 | | |
Information Technology
Services | | | 346 | | | �� | — | | | | — | | | | 346 | | |
Internet & Direct
Marketing Retail | | | 565 | | | | — | | | | — | | | | 565 | | |
Internet Software &
Services | | | 1,465 | | | | — | | | | — | | | | 1,465 | | |
Metals & Mining | | | 65 | | | | — | | | | — | | | | 65 | | |
Multi-line Retail | | | 81 | | | | — | | | | — | | | | 81 | | |
Pharmaceuticals | | | 103 | | | | — | | | | — | | | | 103 | | |
Professional Services | | | 351 | | | | — | | | | — | | | | 351 | | |
Software | | | 146 | | | | — | | | | — | | | | 146 | | |
Specialty Retail | | | 258 | | | | — | | | | — | | | | 258 | | |
Textiles, Apparel &
Luxury Goods | | | 898 | | | | — | | | | — | | | | 898 | | |
Transportation
Infrastructure | | | 72 | | | | — | | | | — | | | | 72 | | |
Total Common Stocks | | | 6,183 | | | | — | | | | — | | | | 6,183 | | |
Call Option Purchased | | | — | | | | 3 | | | | — | | | | 3 | | |
Short-Term Investment | |
Investment Company | | | 29 | | | | — | | | | — | | | | 29 | | |
Total Assets | | $ | 6,212 | | | $ | 3 | | | $ | — | | | $ | 6,215 | | |
Transfers between investment levels may occur as the markets fluctuate and/or the availability of data used in an investment's valuation changes. The Portfolio recognizes transfers between the levels as of the end of the period. As of December 31, 2016, securities with a total value of approximately $1,244,000 transferred from Level 2 to Level 1. Securities that were valued using other significant observable inputs at December 31, 2015 were valued using unadjusted quoted prices at December 31, 2016. At
December 31, 2015, the fair value of certain securities were adjusted due to developments which occurred between the time of the close of the foreign markets on which they trade and the close of business on the NYSE which resulted in their Level 2 classification.
3. Foreign Currency Translation and Foreign Investments: The books and records of the Portfolio are maintained in U.S. dollars. Foreign currency amounts are translated into U.S. dollars as follows:
– investments, other assets and liabilities at the prevailing rate of exchange on the valuation date;
– investment transactions and investment income at the prevailing rates of exchange on the dates of such transactions.
Although the net assets of the Portfolio are presented at the foreign exchange rates and market values at the close of the period, the Portfolio does not isolate that portion of the results of operations arising as a result of changes in the foreign exchange rates from the fluctuations arising from changes in the market prices of securities held at period end. Similarly, the Portfolio does not isolate the effect of changes in foreign exchange rates from the fluctuations arising from changes in the market prices of securities sold during the period. Accordingly, realized and unrealized foreign currency gains (losses) on investments in securities are included in the reported net realized and unrealized gains (losses) on investment transactions and balances. However, pursuant to U.S. federal income tax regulations, gains and losses from certain foreign currency transactions and the foreign currency portion of gains and losses realized on sales and maturities of foreign denominated debt securities are treated as ordinary income for U.S. federal income tax purposes.
Net realized gains (losses) on foreign currency transactions represent net foreign exchange gains (losses) from foreign currency forward exchange contracts, disposition of foreign currencies, currency gains (losses) realized between the trade and settlement dates on securities transactions, and the difference between the amount of investment income and foreign withholding taxes recorded on the Portfolio's books and the U.S. dollar equivalent amounts actually received or paid. Net unrealized currency gains (losses) from valuing foreign currency denominated assets and liabilities at period end exchange rates are reflected as a component of
18
Morgan Stanley Institutional Fund, Inc.
Annual Report — December 31, 2016
Notes to Financial Statements (cont'd)
unrealized appreciation (depreciation) in the Statement of Assets and Liabilities. The change in unrealized currency gains (losses) on foreign currency translations for the period is reflected in the Statement of Operations.
Foreign security and currency transactions may involve certain considerations and risks not typically associated with those of U.S. dollar denominated transactions as a result of, among other factors, fluctuations of exchange rates in relation to the U.S. dollar, the possibility of lower levels of governmental supervision and regulation of foreign securities markets and the possibility of political or economic instability.
Governmental approval for foreign investments may be required in advance of making an investment under certain circumstances in some countries, and the extent of foreign investments in domestic companies may be subject to limitation in other countries. Foreign ownership limitations also may be imposed by the charters of individual companies to prevent, among other concerns, violations of foreign investment limitations. As a result, an additional class of shares (identified as "Foreign" in the Portfolio of Investments) may be created and offered for investment. The "local" and "foreign shares" market values may differ. In the absence of trading of the foreign shares in such markets, the Portfolio values the foreign shares at the closing exchange price of the local shares.
4. Derivatives: The Portfolio may, but is not required to, use derivative instruments for a variety of purposes, including hedging, risk management, portfolio management or to earn income. Derivatives are financial instruments whose value is based, in part, on the value of an underlying asset, interest rate, index or financial instrument. Prevailing interest rates and volatility levels, among other things, also affect the value of derivative instruments. A derivative instrument often has risks similar to its underlying asset and may have additional risks, including imperfect correlation between the value of the derivative and the underlying asset, risks of default by the counterparty to certain transactions, magnification of losses incurred due to changes in the market value of the securities, instruments, indices or interest rates to which the derivative instrument relates, risks that the transactions may not be liquid and risks arising from margin requirements. The use of derivatives involves risks that are different from, and possibly greater than, the risks associated with other
portfolio investments. Derivatives may involve the use of highly specialized instruments that require investment techniques and risk analyses different from those associated with other portfolio investments. All of the Portfolio's holdings, including derivative instruments, are marked-to-market each day with the change in value reflected in unrealized appreciation (depreciation). Upon disposition, a realized gain or loss is recognized.
Certain derivative transactions may give rise to a form of leverage. Leverage magnifies the potential for gain and the risk of loss. Leverage associated with derivative transactions may cause the Portfolio to liquidate portfolio positions when it may not be advantageous to do so to satisfy its obligations or to meet earmarking or segregation requirements, pursuant to applicable Securities and Exchange Commission rules and regulations, or may cause the Portfolio to be more volatile than if the Portfolio had not been leveraged. Although the Adviser seeks to use derivatives to further the Portfolio's investment objectives, there is no assurance that the use of derivatives will achieve this result.
Following is a description of the derivative instruments and techniques that the Portfolio used during the period and their associated risks:
Options: With respect to options, the Portfolio is subject to equity risk, interest rate risk and foreign currency exchange risk in the normal course of pursuing its investment objectives. If the Portfolio buys an option, it buys a legal contract giving it the right to buy or sell a specific amount of the underlying instrument or foreign currency, or futures contract on the underlying instrument or foreign currency, at an agreed-upon price typically in exchange for a premium paid by the Portfolio. The Portfolio may purchase and/or sell put and call options. Purchasing call options tends to increase the Portfolio's exposure to the underlying (or similar) instrument. Purchasing put options tends to decrease the Portfolio's exposure to the underlying (or similar) instrument. When entering into purchased option contracts, the Portfolio bears the risk of interest or exchange rates or securities prices moving unexpectedly, in which case, the Portfolio may not achieve the anticipated benefits of the purchased option contracts; however the risk of loss is limited to the premium paid. Purchased options are reported as part of "Total Investments in Securities" in the Statement of Assets and Liabilities.
19
Morgan Stanley Institutional Fund, Inc.
Annual Report — December 31, 2016
Notes to Financial Statements (cont'd)
Premium paid for purchasing options which expired are treated as realized losses. If the Portfolio sells an option, it sells to another party the right to buy from or sell to the Portfolio a specific amount of the underlying instrument or foreign currency, or futures contract on the underlying instrument or foreign currency, at an agreed-upon price typically in exchange for a premium received by the Portfolio. When options are purchased OTC, the Portfolio bears the risk that the counterparty that wrote the option will be unable or unwilling to perform its obligations under the option contract. Options may also be illiquid and the Portfolio may have difficulty closing out its position. A decision as to whether, when and how to use options involves the exercise of skill and judgment and even a well-conceived option transaction may be unsuccessful because of market behavior or unexpected events. The prices of options can be highly volatile and the use of options can lower total returns.
FASB ASC 815, "Derivatives and Hedging" ("ASC 815"), is intended to improve financial reporting about derivative instruments by requiring enhanced disclosures to enable investors to better understand how and why the Portfolio uses derivative instruments, how these derivative instruments are accounted for and their effects on the Portfolio's financial position and results of operations.
The following table sets forth the fair value of the Portfolio's derivative contracts by primary risk exposure as of December 31, 2016.
| | | Asset Derivatives
Statement of Assets and
Liabilities Location | | Primary Risk
Exposure | | Value
(000) | |
Option Purchased
| | Investments, at Value
(Option Purchased) | | Currency Risk | | $ | 3 | (a) | |
(a) Amounts are included in Investments in Securities in the Statement of Assets and Liabilities.
The following tables set forth by primary risk exposure the Portfolio's realized gains (losses) and change in unrealized appreciation (depreciation) by type of derivative contract for the year ended December 31, 2016 in accordance with ASC 815.
Realized Gain (Loss) | |
Primary Risk Exposure | | Derivative Type | | Value
(000) | |
Currency Risk
| | Investments
(Options Purchased) | | $ | (6 | )(b) | |
(b) Amounts are included in Investments Sold in the Statement of Operations.
Change in Unrealized Appreciation (Depreciation) | |
Primary Risk Exposure | | Derivative Type | | Value
(000) | |
Currency Risk
| | Investments
(Options Purchased) | | $ | (9 | )(c) | |
(c) Amounts are included in Investments in the Statement of Operations.
At December 31, 2016, the Portfolio's derivative assets and liabilities are as follows:
Gross Amounts of Assets and Liabilities Presented in the
Statement of Assets and Liabilities | |
Derivatives | | Assets(d)
(000) | | Liabilities(d)
(000) | |
Option Purchased | | $ | 3 | (a) | | $ | — | | |
(a) Amounts are included in Investments in Securities in the Statement of Assets and Liabilities.
(d) Absent an event of default or early termination, OTC derivative assets and liabilities are presented gross and not offset in the Statement of Assets and Liabilities.
The Portfolio typically enters into International Swaps and Derivatives Association, Inc. Master Agreements ("ISDA Master Agreements") or similar master agreements (collectively, "Master Agreements") with its contract counterparties for certain OTC derivatives in order to, among other things, reduce its credit risk to counterparties. ISDA Master Agreements include provisions for general obligations, representations, collateral and events of default or termination. Under an ISDA Master Agreement, the Portfolio typically may offset with the counterparty certain OTC derivative financial instruments' payables and/or receivables with collateral held and/or posted and create one single net payment (close-out netting) in the event of default, termination and/or potential deterioration in the credit quality of the counterparty. Various Master Agreements govern the terms of certain transactions with counterparties, including transactions such as swap, forward, repurchase and reverse repurchase agreements. These Master Agreements typically attempt to reduce the counterparty risk associated with such transactions by specifying credit protection mechanisms and providing standardization that improves legal certainty. Cross-termination provisions under Master Agreements typically provide that a default in connection with one transaction between the Portfolio and a counterparty gives the non-defaulting party the right to terminate any other transactions in place with the defaulting party to create one single net payment due to/due from the defaulting party and may be a feature in certain Master Agreements. In the event the Portfolio exercises its right to terminate a Master
20
Morgan Stanley Institutional Fund, Inc.
Annual Report — December 31, 2016
Notes to Financial Statements (cont'd)
Agreement after a counterparty experiences a termination event as defined in the Master Agreement, the return of collateral with market value in excess of the Portfolio's net liability may be delayed or denied.
The following table presents derivative financial instruments that are subject to enforceable netting arrangements as of December 31, 2016.
Gross Amounts Not Offset in the Statement of Assets and Liabilities | |
Counterparty | | Gross Asset
Derivatives
Presented in
Statement of
Assets and
Liabilities
(000) | | Financial
Instrument
(000) | | Collateral
Received
(000) | | Net Amount
(not less
than $0)
(000) | |
Royal Bank of Scotland | | $ | 3 | | | $ | — | | | $ | — | | | $ | 3 | | |
For the year ended December 31, 2016, the approximate average monthly amount outstanding for each derivative type is as follows:
Options Purchased: | |
Average monthly notional amount | | | 828,000 | | |
5. Indemnifications: The Fund enters into contracts that contain a variety of indemnifications. The Fund's maximum exposure under these arrangements is unknown. However, the Fund has not had prior claims or losses pursuant to these contracts and expects the risk of loss to be remote.
6. Dividends and Distributions to Shareholders: Dividend income and distributions to shareholders are recorded on the ex-dividend date. Dividends from net investment income, if any, are declared and paid annually. Net realized capital gains, if any, are distributed at least annually.
7. Security Transactions, Income and Expenses: Security transactions are accounted for on the trade date (date the order to buy or sell is executed). Realized gains and losses on the sale of investment securities are determined on the specific identified cost method. Dividend income and other distributions are recorded on the ex-dividend date (except for certain foreign dividends which may be recorded as soon as the Portfolio is informed of such dividends) net of applicable withholding taxes. Interest income is recognized on the accrual basis except where collection is in doubt. Discounts are accreted and premiums are amortized over the life of the respective securities. Most expenses of the Fund can be directly attributed to a particular Portfolio. Expenses which cannot be directly attributed are apportioned among the Portfolios based
upon relative net assets or other appropriate methods. Income, expenses (other than class specific expenses — distribution and shareholder services, transfer agency and sub transfer agency fees) and realized and unrealized gains or losses are allocated to each class of shares based upon their relative net assets.
B. Advisory Fees: The Adviser, a wholly-owned subsidiary of Morgan Stanley, provides the Portfolio with advisory services under the terms of an Investment Advisory Agreement, paid quarterly, at the annual rate based on the daily net assets as follows:
First $1
billion | | Over $1
billion | |
| | 0.80 | % | | | 0.75 | % | |
For the year ended December 31, 2016, the advisory fee rate (net of waivers/rebate) was equivalent to an annual effective rate of 0.00% of the Portfolio's average daily net assets.
The Adviser has agreed to reduce its advisory fee and/or reimburse the Portfolio so that total annual portfolio operating expenses, excluding certain investment related expenses, taxes, interest and other extraordinary expenses (including litigation), will not exceed 1.10% for Class I shares, 1.45% for Class A shares, 1.95% for Class L shares and 2.20% for Class C shares. The fee waivers and/or expense reimbursements will continue for at least one year from the date of the Portfolio's prospectus or until such time as the Directors act to discontinue all or a portion of such waivers and/or reimbursements when they deem such action is appropriate. For the year ended December 31, 2016, approximately $54,000 of advisory fees were waived and approximately $97,000 of other expenses were reimbursed by the Adviser pursuant to this arrangement.
C. Administration Fees: The Adviser also serves as Administrator to the Fund and provides administrative services pursuant to an Administration Agreement for an annual fee, accrued daily and paid monthly, of 0.08% of the Portfolio's average daily net assets.
Under a Sub-Administration Agreement between the Administrator and State Street Bank and Trust Company ("State Street"), State Street provides certain administrative services to the Fund. For such services, the Administrator pays State Street a portion of the fee the Administrator receives from the Portfolio.
D. Distribution and Shareholder Services Fees: Morgan Stanley Distribution, Inc. ("MSDI" or the "Distributor"), a wholly-owned subsidiary of the Adviser and an indirect subsidiary of Morgan Stanley, serves as the Fund's Distributor of Portfolio shares pursuant to a Distribution Agreement. The
21
Morgan Stanley Institutional Fund, Inc.
Annual Report — December 31, 2016
Notes to Financial Statements (cont'd)
Fund has adopted a Shareholder Services Plan with respect to Class A shares pursuant to Rule 12b-1 under the Act. Under the Shareholder Services Plan, the Portfolio pays the Distributor a shareholder services fee, accrued daily and paid monthly, at an annual rate of 0.25% of the Portfolio's average daily net assets attributable to Class A shares.
The Fund has adopted a Distribution and Shareholder Services Plan with respect to Class L shares pursuant to Rule 12b-1 under the Act. Under the Distribution and Shareholder Services Plan, the Portfolio pays the Distributor a distribution fee, accrued daily and paid monthly, at an annual rate of 0.50% and a shareholder services fee, accrued daily and paid monthly, at an annual rate of 0.25% of the Portfolio's average daily net assets attributable to Class L shares.
The Fund has adopted a Distribution and Shareholder Services Plan with respect to Class C shares pursuant to Rule 12b-1 under the Act. Under the Distribution and Shareholder Services Plan, the Portfolio pays the Distributor a distribution fee, accrued daily and paid monthly, at an annual rate of 0.75% and a shareholder services fee, accrued daily and paid monthly, at an annual rate of 0.25% of the Portfolio's average daily net assets attributable to Class C shares.
The distribution and shareholder services fees are used to support the expenses associated with servicing and maintaining accounts. The Distributor may compensate other parties for providing shareholder support services to investors who purchase Class A, Class L and Class C shares.
E. Dividend Disbursing and Transfer Agent: The Fund's dividend disbursing and transfer agent is Boston Financial Data Services, Inc. ("BFDS"). Pursuant to a Transfer Agency Agreement, the Fund pays BFDS a fee based on the number of classes, accounts and transactions relating to the Portfolios of the Fund.
F. Custodian Fees: State Street (the "Custodian") serves as Custodian for the Fund in accordance with a Custodian Agreement. The Custodian holds cash, securities, and other assets of the Fund as required by the Act. Custody fees are payable monthly based on assets held in custody, investment purchases and sales activity and account maintenance fees, plus reimbursement for certain out-of-pocket expenses.
In December 2015, the Fund's Custodian announced that it had identified inconsistencies in the way in which clients were invoiced for out-of-pocket expenses from 1998 until November 2015. The dollar amount difference between what was charged and what should have been charged, plus interest, was
paid back to the Portfolio in September 2016 as a reimbursement. The Custodian reimbursed the Portfolio directly, which was recognized as a change in accounting estimate and was reflected as "Reimbursement of Custodian Fees" in the Statement of Operations. Pursuant to the expense limitations described in Note B, the Portfolio has experienced waiver of advisory fees and expenses reimbursed by the Adviser during the current period. Accordingly, the reimbursement of out-of-pocket custodian expenses in the current period resulted in the reduction in the current period expenses reimbursed by the Adviser.
G. Security Transactions and Transactions with Affiliates: For the year ended December 31, 2016, purchases and sales of investment securities for the Portfolio, other than long-term U.S. Government securities and short-term investments, were approximately $6,389,000 and $5,735,000, respectively. There were no purchases and sales of long-term U.S. Government securities for the year ended December 31, 2016.
The Portfolio invests in the Institutional Class of the Morgan Stanley Institutional Liquidity Funds (the "Liquidity Funds"), an open-end management investment company managed by the Adviser. Advisory fees paid by the Portfolio are reduced by an amount equal to its pro-rata share of the advisory and administration fees paid by the Portfolio due to its investment in the Liquidity Funds. For the year ended December 31, 2016, advisory fees paid were reduced by less than $500 relating to the Portfolio's investment in the Liquidity Funds.
A summary of the Portfolio's transactions in shares of the Liquidity Funds during the year ended December 31, 2016 is as follows:
Value
December 31,
2015
(000) | | Purchases
at Cost
(000) | | Sales
(000) | | Dividend
Income
(000) | | Value
December 31,
2016
(000) | |
| $ | 222 | | | $ | 3,839 | | | $ | 4,032 | | | $ | 1 | | | $ | 29 | | |
The Portfolio is permitted to purchase and sell securities ("cross-trade") from and to other Morgan Stanley Funds as well as other funds and client accounts for which the Adviser or an affiliate of the Adviser serves as investment adviser, pursuant to procedures approved by the Directors in compliance with Rule 17a-7 under the Act (the "Rule"). Each cross-trade is executed at the current market price in compliance with provisions of the Rule. For the year ended December 31, 2016, the Portfolio did not engage in any cross-trade transactions.
The Portfolio has an unfunded Deferred Compensation Plan (the "Compensation Plan"), which allows each independent Director to defer payment of all, or a portion, of the fees he or
22
Morgan Stanley Institutional Fund, Inc.
Annual Report — December 31, 2016
Notes to Financial Statements (cont'd)
she receives for serving on the Board of Directors. Each eligible Director generally may elect to have the deferred amounts credited with a return equal to the total return on one or more of the Morgan Stanley funds that are offered as investment options under the Compensation Plan. Appreciation/depreciation and distributions received from these investments are recorded with an offsetting increase/decrease in the deferred compensation obligation and do not affect the NAV of the Portfolio.
H. Federal Income Taxes: It is the Portfolio's intention to continue to qualify as a regulated investment company and distribute all of its taxable and tax-exempt income. Accordingly, no provision for federal income taxes is required in the financial statements.
The Portfolio may be subject to taxes imposed by countries in which it invests. Such taxes are generally based on income and/or capital gains earned or repatriated. Taxes are accrued based on net investment income, net realized gains and net unrealized appreciation as such income and/or gains are earned. Taxes may also be based on transactions in foreign currency and are accrued based on the value of investments denominated in such currency.
FASB ASC 740-10, "Income Taxes — Overall", sets forth a minimum threshold for financial statement recognition of the benefit of a tax position taken or expected to be taken in a tax return. Management has concluded that there are no significant uncertain tax positions that would require recognition in the financial statements. If applicable, the Portfolio recognizes interest accrued related to unrecognized tax benefits in "Interest Expense" and penalties in "Other Expenses" in the Statement of Operations. The Portfolio files tax returns with the U.S. Internal Revenue Service, New York and various states. Generally, each of the tax years in the four-year period ended December 31, 2016, remains subject to examination by taxing authorities.
The tax character of distributions paid may differ from the character of distributions shown in the Statements of Changes in Net Assets due to short-term capital gains being treated as ordinary income for tax purposes. The tax character of distributions paid during fiscal years 2016 and 2015 was as follows:
2016
Distributions
Paid From: | | 2015
Distributions
Paid From: | |
Ordinary
Income
(000) | | Long-Term
Capital Gain
(000) | | Ordinary
Income
(000) | | Long-Term
Capital Gain
(000) | |
| $ | — | | | $ | 146 | | | $ | 7 | | | $ | 350 | | |
The amount and character of income and gains to be distributed are determined in accordance with income tax regulations which may differ from GAAP. These book/tax differences are either considered temporary or permanent in nature.
Temporary differences are primarily due to differing book and tax treatments in the timing of the recognition of gains (losses) on certain investment transactions and the timing of the deductibility of certain expenses.
Permanent differences, primarily due to differing treatments of gains (losses) related to foreign currency transactions, and a net operating loss, resulted in the following reclassifications among the components of net assets at December 31, 2016:
Accumulated
Net Investment
Loss
(000) | | Distributions in
Excess of
Net Realized
Gain
(000) | | Paid-in-
Capital
(000) | |
| $ | 19 | | | $ | 5 | | | $ | (24 | ) | |
At December 31, 2016, the Portfolio had no distributable earnings on a tax basis.
Qualified late year losses are capital losses, including currency losses, incurred after October 31 but within the taxable year that, if elected, are deemed to arise on the first day of the Portfolio's next taxable year. For the year ended December 31, 2016, the Portfolio deferred to January 1, 2017 for U.S. federal income tax purposes the following losses:
Qualified Late
Year Ordinary
Losses
(000) | | Post-October
Capital Losses
(000) | |
| $ | 3 | | | $ | 6 | | |
I. Credit Facility: As of April 4, 2016, the Fund and other Morgan Stanley funds participated in a $150,000,000 committed, unsecured revolving line of credit facility (the "facility") with State Street. This facility is to be used for temporary emergency purposes or funding of shareholder redemption requests. The interest rate on borrowings is based on the federal funds rate or one month libor rate plus a spread. The facility also has a commitment fee of 0.25% per annum based on the unused portion of the facility. During the year ended December 31, 2016, the Portfolio did not have any borrowings under the facility.
J. Other: At December 31, 2016, the Portfolio had record owners of 10% or greater. Investment activities of these shareholders could have a material impact on the Portfolio. The aggregate percentage of such owners was 81.3%.
K. Accounting Pronouncements: In December 2016, FASB issued Accounting Standards update 2016-19 —
23
Morgan Stanley Institutional Fund, Inc.
Annual Report — December 31, 2016
Notes to Financial Statements (cont'd)
Technical Corrections and Improvements ("ASU 2016-19"), which is effective for interim periods for all entities beginning after December 15, 2016. ASU 2016-19 includes an amendment to Topic 820, Fair Value Measurement, which clarifies the difference between a valuation approach and a valuation technique when applying the guidance in that Topic. That amendment also requires an entity to disclose when there has been a change in either or both a valuation approach and/or a valuation technique. The transition guidance for the amendment must be applied prospectively because it could potentially involve the use of hindsight that includes fair value measurements. Although still evaluating the potential impacts of ASU 2016-19 to the Portfolio, management expects that the impact of the Portfolio's adoption will be limited to additional financial statement disclosures.
In October 2016, the Securities and Exchange Commission ("SEC") issued a new rule, Investment Company Reporting Modernization, which, among other provisions, amends Regulation S-X to require standardized, enhanced disclosures, particularly related to derivatives, in investment company financial statements. Compliance with the guidance is effective for financial statements filed with the SEC on or after August 1, 2017; adoption will have no effect on the Portfolio's net assets or results of operations. Although still evaluating the potential impacts of the Investment Company Reporting Modernization to the Portfolio, management expects that the impact of the Portfolio's adoption will be limited to additional financial statement disclosures.
24
Morgan Stanley Institutional Fund, Inc.
Annual Report — December 31, 2016
Report of Independent Registered Public Accounting Firm
To the Shareholders and Board of Directors of
Morgan Stanley Institutional Fund, Inc. —
Global Advantage Portfolio
We have audited the accompanying statement of assets and liabilities, including the portfolio of investments, of Global Advantage Portfolio (one of the portfolios constituting Morgan Stanley Institutional Fund, Inc.) (the "Portfolio") as of December 31, 2016, and the related statement of operations for the year then ended, the statements of changes in net assets for each of the two years in the period then ended and the financial highlights for each of the years or periods indicated therein. These financial statements and financial highlights are the responsibility of the Portfolio's management. Our responsibility is to express an opinion on these financial statements and financial highlights based on our audits.
We conducted our audits in accordance with the standards of the Public Company Accounting Oversight Board (United States). Those standards require that we plan and perform the audit to obtain reasonable assurance about whether the financial statements and financial highlights are free of material misstatement. We were not engaged to perform an audit of the Portfolio's internal control over financial reporting. Our audits included consideration of internal control over financial reporting as a basis for designing audit procedures that are appropriate in the circumstances, but not for the purpose of expressing an opinion on the effectiveness of the Portfolio's internal control over financial reporting. Accordingly, we express no such opinion. An audit also includes examining, on a test basis, evidence supporting the amounts and disclosures in the financial statements and financial highlights, assessing the accounting principles used and significant estimates made by management, and evaluating the overall financial statement presentation. Our procedures included confirmation of securities owned as of December 31, 2016, by correspondence with the custodian and others or by other appropriate auditing procedures where replies from others were not received. We believe that our audits provide a reasonable basis for our opinion.
In our opinion, the financial statements and financial highlights referred to above present fairly, in all material respects, the financial position of Global Advantage Portfolio (one of the portfolios constituting Morgan Stanley Institutional Fund, Inc.) at December 31, 2016, the results of its operations for the year then ended, the changes in its net assets for each of the two years in the period then ended and the financial highlights for each of the years or periods indicated therein, in conformity with U.S. generally accepted accounting principles.

Boston, Massachusetts
February 28, 2017
25
Morgan Stanley Institutional Fund, Inc.
Annual Report — December 31, 2016
Federal Tax Notice (unaudited)
For federal income tax purposes, the following information is furnished with respect to the distributions paid by the Portfolio during its taxable year ended December 31, 2016. The Portfolio designated and paid approximately $146,000 as a long-term capital gain distribution.
For federal income tax purposes, the following information is furnished with respect to the Portfolio's earnings for its taxable year ended December 31, 2016. When distributed, certain earnings may be subject to a maximum tax rate of 15% as provided for the Jobs and Growth Tax Relief Reconciliation Act of 2003. The Portfolio designated up to a maximum of approximately $75,000 as taxable at this lower rate.
In January, the Portfolio provides tax information to shareholders for the preceding calendar year.
26
Morgan Stanley Institutional Fund, Inc.
Annual Report — December 31, 2016
Privacy Notice (unaudited)
MORGAN STANLEY INVESTMENT MANAGEMENT INC.
AN IMPORTANT NOTICE CONCERNING OUR U.S. PRIVACY POLICY
We are required by federal law to provide you with a copy of our privacy policy annually. This policy applies to current and former individual investors in funds managed or sponsored by Morgan Stanley Investment Management Inc. ("MSIM") as well as current and former individual clients of MSIM. This policy is not applicable to partnerships, corporations, trusts or other non-individual clients or investors. Please note that we may amend this policy at any time, and will inform you of any changes as required by law.
WE RESPECT YOUR PRIVACY
We appreciate that you have provided us with your personal financial information. We strive to maintain the privacy of such information while we help you achieve your financial objectives. This Notice describes what non-public personal information we collect about you, why we collect it, when we may share it with others and how certain others may use it. It discusses the steps you may take to limit our sharing of certain information about you to affiliated companies in the Morgan Stanley family of companies ("other Morgan Stanley companies"). It also discloses how you may limit use of certain shared information for marketing purposes by other Morgan Stanley branded companies. Throughout this policy, we refer to the non-public information that personally identifies you or your accounts as "personal information.''
1. WHAT PERSONAL INFORMATION DO WE COLLECT ABOUT YOU?
We obtain personal information from applications and other forms you submit to us, from your dealings with us, from consumer reporting agencies, from our Web sites and from third parties and other sources.
For example:
• We may collect information such as your name, address, e-mail address, telephone/fax numbers, assets, income and investment objectives through subscription documents, applications and other forms you submit to us.
• We may obtain information about account balances, your use of account(s) and the types of products and services you prefer to receive from us through your dealings and transactions with us and other sources.
• We may obtain information about your creditworthiness and credit history from consumer reporting agencies.
• We may collect background information from and through third-party vendors to verify representations you have made and to comply with various regulatory requirements.
• If you interact with us through our public and private Web sites, we may collect information that you provide directly through online communications (such as an e-mail address). We may also collect information about your Internet service provider, your domain name, your computer's operating system and Web browser, your use of our Web sites and your product and service preferences, through the use of "cookies." Please consult the Terms of Use of these sites for more details.
2. WHEN DO WE DISCLOSE PERSONAL INFORMATION WE COLLECT ABOUT YOU?
We may disclose personal information we collect about you to other Morgan Stanley companies and to non-affiliated third parties.
a. Information We Disclose to Other Morgan Stanley Companies.
We may disclose personal information to other Morgan Stanley companies for a variety of reasons, including to manage your account(s) effectively, to service and process your transactions, to let you know about products and services offered by us and other Morgan Stanley companies, to manage our business, and as otherwise required or permitted by law. Offers for products and services from other Morgan Stanley companies are developed under conditions designed to safeguard your personal information.
27
Morgan Stanley Institutional Fund, Inc.
Annual Report — December 31, 2016
Privacy Notice (unaudited) (cont'd)
b. Information We Disclose to Non-affiliated Third Parties.
We do not disclose personal information that we collect about you to non-affiliated third parties except to those who provide marketing services on our behalf, to financial institutions with whom we have joint marketing agreements, and as otherwise required or permitted by law. For example, we may disclose personal information to nonaffiliated third parties for servicing and processing transactions, to offer our own products and services, to protect against fraud, for institutional risk control, to respond to judicial process or to perform services on our behalf. When we share personal information with a non-affiliated third party, they are required to limit their use of personal information to the particular purpose for which it was shared and they are not allowed to share personal information with others except to fulfill that limited purpose or as may be permitted or required by law.
3. HOW DO WE PROTECT THE SECURITY AND CONFIDENTIALITY OF PERSONAL INFORMATION WE COLLECT ABOUT YOU?
We maintain physical, electronic and procedural security measures to help safeguard the personal information we collect about you. We have internal policies governing the proper handling of client information. Third parties that provide support or marketing services on our behalf may also receive personal information, and we require them to adhere to confidentiality standards with respect to such information.
4. HOW CAN YOU LIMIT THE SHARING OF CERTAIN TYPES OF PERSONAL INFORMATION WITH OTHER MORGAN STANLEY COMPANIES?
We offer you choices as to whether we share with other Morgan Stanley companies the personal information that was collected to determine your eligibility for products and services you request ("eligibility information"). Eligibility information does not include your identification information or personal information pertaining to our transactions or experiences with you. Please note that, even if you direct us not to share eligibility information with other Morgan Stanley companies ("opt-out"), we may still share personal information, including eligibility information, with those companies in circumstances excluded from the opt-out under applicable law, such as to process transactions or to service your account.
5. HOW CAN YOU LIMIT THE USE OF CERTAIN TYPES OF PERSONAL INFORMATION BY OTHER MORGAN STANLEY COMPANIES FOR MARKETING?
By following the opt-out instructions in Section 6 below, you may limit other Morgan Stanley branded companies from marketing their products or services to you based on personal information we disclose to them. This information may include, for example, your income and account history with us. Please note that, even if you choose to limit Other Morgan Stanley Companies from using personal information about you that we may share with them for marketing their products and services to you, Other Morgan Stanley Companies may use your personal information that they obtain from us to market to you in circumstances permitted by law, such as if the Other Morgan Stanley Company has its own relationship with you.
6. HOW CAN YOU SEND US AN OPT-OUT INSTRUCTION?
If you wish to limit our sharing of eligibility information about you with other Morgan Stanley companies or other Morgan Stanley companies' use of personal information for marketing purposes, as described in this notice, you may do so by:
• Calling us at (800) 548-7786
Monday–Friday between 8a.m. and 6p.m.(EST)
• Writing to us at the following address:
Boston Financial Data Services, Inc.
c/o Privacy Coordinator
P.O. Box 219804
Kansas City, Missouri 64121
28
Morgan Stanley Institutional Fund, Inc.
Annual Report — December 31, 2016
Privacy Notice (unaudited) (cont'd)
Your written request should include your name, address, telephone number and account number(s) to which the opt-out applies and whether you are opting out with respect to sharing of eligibility information (Section 4 above), or if information used for Marketing (Section 5 above) or both. Written opt-out requests should not be sent with any other correspondence. In order to process your request, we require that the request be provided by you directly and not through a third party.
Your opt-out preference will remain in effect with respect to this policy (as it may be amended) until you notify us otherwise. If you have a joint account, your direction for us not to share this information with other Morgan Stanley companies and for those other Morgan Stanley companies not to use your personal information for marketing will be applied to all account holders on that account. Please understand that if you limit our sharing or our affiliated companies' use of personal information, you and any joint account holder(s) may not receive information about Morgan Stanley products and services, including products or services that could help you manage your financial resources and achieve your investment objectives.
7. WHAT IF AN AFFILIATED COMPANY BECOMES A NON-AFFILIATED THIRD PARTY?
If, at any time in the future, an affiliated company becomes a non-affiliated third party, further disclosures of personal information made to the former affiliated company will be limited to those described in Section 2(b) above relating to non-affiliated third parties. If you elected under Section 6 to limit disclosures we make to affiliated companies, or use of personal information by affiliated companies, your election will not apply to use by any former affiliated company of your personal information in their possession once it becomes a non-affiliated third party.
SPECIAL NOTICE TO RESIDENTS OF VERMONT
The following section supplements our policy with respect to our individual clients who have a Vermont address and supersedes anything to the contrary in the above policy with respect to those clients only.
The state of Vermont requires financial institutions to obtain your consent prior to sharing personal information that they collect about you with affiliated companies and non-affiliated third parties other than in certain limited circumstances. Except as permitted by law, we will not share personal information we collect about you with non-affiliated third parties or other Morgan Stanley companies unless you provide us with your written consent to share such information ("opt-in").
If you wish to receive offers for investment products and services offered by or through other Morgan Stanley companies, please notify us in writing at the following address:
Boston Financial Data Services, Inc.
c/o Privacy Coordinator
P.O. Box 219804
Kansas City, Missouri 64121
Your authorization should include your name, address, telephone number and account number(s) to which the opt-in applies and should not be sent with any other correspondence. In order to process your authorization, we require that the authorization be provided by you directly and not through a third party.
SPECIAL NOTICE TO RESIDENTS OF CALIFORNIA
The following section supplements our policy with respect to our individual clients who have a California address and supersedes anything to the contrary in the above policy with respect to those clients only.
In response to a California law, if your account has a California home address, your personal information will not be disclosed to nonaffiliated third parties except as permitted by applicable California law, and we will limit sharing such information with our affiliates to comply with California privacy laws that apply to us.
29
Morgan Stanley Institutional Fund, Inc.
Annual Report — December 31, 2016
Director and Officer Information (unaudited)
Independent Directors:
Name, Age and Address of
Independent Director | | Position(s)
Held with
Registrant | | Length of Time
Served* | | Principal Occupation(s) During Past 5 Years
and Other Relevant Professional Experience | | Number of
Overseen by
Independent
Director** | | Portfolios in
Fund Complex
Other Directorships
Held by Independent
Director*** | |
Frank L. Bowman (72)
c/o Perkins Coie LLP
Counsel to the Independent
Directors
30 Rockefeller Plaza
New York, NY 10112 | | Director | | Since
August
2006 | | President, Strategic Decisions, LLC (consulting) (since February 2009); Director or Trustee of various Morgan Stanley Funds (since August 2006); Chairperson of the Compliance and Insurance Committee (since October 2015); formerly, Chairperson of the Insurance Sub-Committee of the Compliance and Insurance Committee (2007-2015); served as President and Chief Executive Officer of the Nuclear Energy Institute (policy organization) (February 2005-November 2008); retired as Admiral, U.S. Navy after serving over 38 years on active duty including 8 years as Director of the Naval Nuclear Propulsion Program in the Department of the Navy and the U.S. Department of Energy (1996-2004); served as Chief of Naval Personnel (July 1994-September 1996) and on the Joint Staff as Director of Political Military Affairs (June 1992-July 1994); knighted as Honorary Knight Commander of the Most Excellent Order of the British Empire; awarded the Officier de l'Orde National du Mérite by the French Government; elected to the National Academy of Engineering (2009). | | | 90 | | | Director of BP p.l.c.; Director of Naval and Nuclear Technologies LLP; Director Emeritus of the Armed Services YMCA; Director of the U.S. Naval Submarine League; Member of the National Security Advisory Council of the Center for U.S. Global Engagement and a member of the CNA Military Advisory Board; Chairman of the charity J Street Cup Golf; Trustee of Fairhaven United Methodist Church; and Director of other various non-profit organizations. | |
Kathleen A. Dennis (63)
c/o Perkins Coie LLP
Counsel to the Independent Directors
30 Rockefeller Plaza
New York, NY 10112 | | Director | | Since
August
2006 | | President, Cedarwood Associates (mutual fund and investment management consulting) (since July 2006); Chairperson of the Liquidity and Alternatives Sub-Committee of the Investment Committee (since October 2006) and Director or Trustee of various Morgan Stanley Funds (since August 2006); formerly, Senior Managing Director of Victory Capital Management (1993-2006). | | | 91 | | | Director of various non-profit organizations. | |
Nancy C. Everett (61)
c/o Perkins Coie LLP
Counsel to the Independent Directors
30 Rockefeller Plaza
New York, NY 10112 | | Director | | Since
January
2015 | | Chief Executive Officer, Virginia Commonwealth University Investment Company (since November 2015); Owner, OBIR, LLC (institutional investment management consulting) (since June 2014); formerly, Managing Director, BlackRock Inc. (February 2011-December 2013); and Chief Executive Officer, General Motors Asset Management (a/k/a Promark Global Advisors, Inc.) (June 2005-May 2010). | | | 91 | | | Member of Virginia Commonwealth University School of Business Foundation; formerly, Member of Virginia Commonwealth University Board of Visitors (2013-2015); Member of Committee on Directors for Emerging Markets Growth Fund, Inc. (2007-2010); Chairperson of Performance Equity Management, LLC (2006-2010); and Chairperson, GMAM Absolute Return Strategies Fund, LLC (2006-2010). | |
30
Morgan Stanley Institutional Fund, Inc.
Annual Report — December 31, 2016
Director and Officer Information (unaudited) (cont'd)
Independent Directors: (cont'd)
Name, Age and Address of
Independent Director | | Position(s)
Held with
Registrant | | Length of Time
Served* | | Principal Occupation(s) During Past 5 Years
and Other Relevant Professional Experience | | Number of
Overseen by
Independent
Director** | | Portfolios in
Fund Complex
Other Directorships
Held by Independent
Director*** | |
Jakki L. Haussler (59)
c/o Perkins Coie LLP
Counsel to the Independent Directors
30 Rockefeller Plaza
New York, NY 10112 | | Director | | Since
January
2015 | | Chairman and Chief Executive Officer, Opus Capital Group (since January 1996); formerly, Director, Capvest Venture Fund, LP (May 2000-December 2011); Partner, Adena Ventures, LP (July 1999-December 2010); Director, The Victory Funds (February 2005-July 2008). | | | 91 | | | Director of Cincinnati Bell Inc. and Member, Audit Committee and Compensation Committee; Director of Northern Kentucky University Foundation and Member, Investment Committee; Member of Chase College of Law Transactional Law Practice Center Board of Advisors; Director of Best Transport; Director of Chase College of Law Board of Visitors; formerly, Member, University of Cincinnati Foundation Investment Committee; Member, Miami University Board of Visitors (2008-2011); Trustee of Victory Funds (2005-2008) and Chairman, Investment Committee (2007-2008) and Member, Service Provider Committee (2005-2008). | |
Dr. Manuel H. Johnson (67)
c/o Johnson Smick
International, Inc.
220 I Street, N.E. — Suite 200
Washington, D.C. 20002 | | Director | | Since
July
1991 | | Senior Partner, Johnson Smick International, Inc. (consulting firm); Chairperson of the Investment Committee (since October 2006) and Director or Trustee of various Morgan Stanley Funds (since July 1991); Co-Chairman and a founder of the Group of Seven Council (G7C) (international economic commission); formerly, Chairperson of the Audit Committee (July 1991-September 2006), Vice Chairman of the Board of Governors of the Federal Reserve System and Assistant Secretary of the U.S. Treasury. | | | 91 | | | Director of NVR, Inc. (home construction). | |
Joseph J. Kearns (74)
c/o Kearns & Associates LLC
46 E Peninsula Center #385
Rolling Hills Estates, CA 90274-3712 | | Director | | Since
August
1994 | | President, Kearns & Associates LLC (investment consulting); Chairperson of the Audit Committee (since October 2006) and Director or Trustee of various Morgan Stanley Funds (since August 1994); formerly, Deputy Chairperson of the Audit Committee (July 2003-September 2006) and Chairperson of the Audit Committee of various Morgan Stanley Funds (since August 1994); CFO of the J. Paul Getty Trust. | | | 93 | | | Director of Electro Rent Corporation (equipment leasing). Prior to December 31, 2013, Director of The Ford Family Foundation. | |
31
Morgan Stanley Institutional Fund, Inc.
Annual Report — December 31, 2016
Director and Officer Information (unaudited) (cont'd)
Independent Directors: (cont'd)
Name, Age and Address of
Independent Director | | Position(s)
Held with
Registrant | | Length of Time
Served* | | Principal Occupation(s) During Past 5 Years
and Other Relevant Professional Experience | | Number of
Portfolios in
Fund Complex
Overseen by
Independent
Director** | | Other Directorships
Held by Independent
Director*** | |
Michael F. Klein (58)
c/o Perkins Coie LLP
Counsel to the Independent Directors
30 Rockefeller Plaza
New York, NY 10112 | | Director | | Since
August
2006 | | Managing Director, Aetos Capital, LLC (since March 2000); Co-President, Aetos Alternatives Management, LLC (since January 2004) and Co-Chief Executive Officer of Aetos Capital LLC (since August 2013); Chairperson of the Fixed Income Sub-Committee of the Investment Committee (since October 2006) and Director or Trustee of various Morgan Stanley Funds (since August 2006); formerly, Managing Director, Morgan Stanley & Co. Inc. and Morgan Stanley Dean Witter Investment Management, President, various Morgan Stanley Funds (June 1998-March 2000) and Principal, Morgan Stanley & Co. Inc. and Morgan Stanley Dean Witter Investment Management (August 1997-December 1999). | | | 90 | | | Director of certain investment funds managed or sponsored by Aetos Capital, LLC; Director of Sanitized AG and Sanitized Marketing AG (specialty chemicals). | |
Patricia Maleski (56)
c/o Perkins Coie LLP
Counsel to the Independent Directors
30 Rockefeller Plaza
New York, NY 10112 | | Director | | Since
January
2017 | | Management Director, JPMorgan Asset Management (2013-2016); President, JPMorgan Funds (2010-2013), Chief Administrative Officer, JPMorgan Funds (2004-2010), Treasurer, JPMorgan Funds (2003-2004, 2008-2010), and Vice President and Board Liaison, JPMorgan Funds (2001-2004); Managing Director, J.P. Morgan Investment Management Inc. (2001-2013); Vice President of Finance, Pierpont Group (1996-2001); Vice President, Bank of New York (1995-1996); Senior Audit Manager, Price Waterhouse, LLP (1982-1995). | | | 91 | | | None. | |
Michael E. Nugent (80)
522 Fifth Avenue
New York, NY 10036 | | Chair of the Board and Director | | Chair of the Boards since July 2006 and Director since July 1991 | | Chair of the Boards of various Morgan Stanley Funds (since July 2006); Chairperson of the Closed-End Fund Committee (since June 2012) and Director or Trustee of various Morgan Stanley Funds (since July 1991); formerly, Chairperson of the Insurance Committee (until July 2006); General Partner, Triumph Capital, L.P. (private investment partnership) (1988-2013). | | | 92 | | | None. | |
W. Allen Reed (69)
c/o Perkins Coie LLP
Counsel to the Independent Directors
30 Rockefeller Plaza
New York, NY 10112 | | Director | | Since
August
2006 | | Chairperson of the Equity Sub-Committee of the Investment Committee (since October 2006) and Director or Trustee of various Morgan Stanley Funds (since August 2006); formerly, President and CEO of General Motors Asset Management; Chairman and Chief Executive Officer of the GM Trust Bank and Corporate Vice President of General Motors Corporation (August 1994-December 2005). | | | 91 | | | Director of Legg Mason, Inc.; formerly, Director of the Auburn University Foundation (2010-2015). | |
Fergus Reid (84)
c/o Joe Pietryka, Inc.
85 Charles Colman Blvd.
Pawling, NY 12564 | | Director | | Since
June
1992 | | Chairman, Joe Pietryka, Inc.; Chairperson of the Governance Committee and Director or Trustee of various Morgan Stanley Funds (since June 1992). | | | 92 | | | Formerly, Trustee and Director of certain investment companies in the JP Morgan Fund Complex managed by JP Morgan Investment Management Inc. (1987-2012). | |
* This is the earliest date the Director began serving the Morgan Stanley Funds. Each Director serves an indefinite term, until his or her successor is elected.
** The Fund Complex includes (as of December 31, 2016) all open-end and closed-end funds (including all of their portfolios) advised by Morgan Stanley Investment Management Inc. (the "Adviser") and any funds that have an adviser that is an affiliated person of the Adviser (including, but not limited to, Morgan Stanley AIP GP LP).
*** This includes any directorships at public companies and registered investment companies held by the Director at any time during the past five years.
32
Morgan Stanley Institutional Fund, Inc.
Annual Report — December 31, 2016
Director and Officer Information (unaudited) (cont'd)
Executive Officers:
Name, Age and Address of Executive Officer | | Position(s) Held
with
Registrant | | Length of Time
Served* | | Principal Occupation(s) During Past 5 Years | |
John H. Gernon (53)
522 Fifth Avenue
New York, NY 10036 | | President and Principal Executive Officer | | Since
September
2013 | | President and Principal Executive Officer of the Equity and Fixed Income Funds and the Morgan Stanley AIP Funds (since September 2013) and the Liquidity Funds and various money market funds (since May 2014) in the Fund Complex; Managing Director of the Adviser; Head of Product (since 2006). | |
Timothy J. Knierim (58)
522 Fifth Avenue
New York, NY 10036 | | Chief Compliance Officer | | Since
December
2016 | | Managing Director of the Adviser and various entities affiliated with the Adviser; Chief Compliance Officer of various Morgan Stanley Funds and the Adviser (since December 2016) and Chief Compliance Officer of Morgan Stanley AIP GP LP (since 2014). Formerly, Managing Director and Deputy Chief Compliance Officer of the Adviser (2014-2016); and formerly, Chief Compliance Officer of Prudential Investment Management, Inc. (2007-2014). | |
Francis J. Smith (51)
522 Fifth Avenue
New York, NY 10036 | | Treasurer and Principal Financial Officer | | Treasurer since July 2003 and Principal Financial Officer since September 2002 | | Managing Director of the Adviser and various entities affiliated with the Adviser; Treasurer (since July 2003) and Principal Financial Officer of various Morgan Stanley Funds (since September 2002). | |
Mary E. Mullin (49)
522 Fifth Avenue
New York, NY 10036 | | Secretary | | Since
June
1999 | | Executive Director of the Adviser; Secretary of various Morgan Stanley Funds (since June 1999). | |
* This is the earliest date the officer began serving the Morgan Stanley Funds. Each officer serves a one-year term, until his or her successor is elected and qualifies.
33
Morgan Stanley Institutional Fund, Inc.
Annual Report — December 31, 2016
Adviser and Administrator
Morgan Stanley Investment Management Inc.
522 Fifth Avenue
New York, New York 10036
Distributor
Morgan Stanley Distribution, Inc.
522 Fifth Avenue
New York, New York 10036
Dividend Disbursing and Transfer Agent
Boston Financial Data Services, Inc.
2000 Crown Colony Drive
Quincy, Massachusetts 02169
Custodian
State Street Bank and Trust Company
One Lincoln Street
Boston, Massachusetts 02111
Legal Counsel
Dechert LLP
1095 Avenue of the Americas
New York, New York 10036
Counsel to the Independent Directors
Perkins Coie LLP
30 Rockefeller Plaza
New York, New York 10112
Independent Registered Public Accounting Firm
Ernst & Young LLP
200 Clarendon Street
Boston, Massachusetts 02116
Reporting to Shareholders
Each Morgan Stanley fund provides a complete schedule of portfolio holdings in its semi-annual and annual reports within 60 days of the end of the fund's second and fourth fiscal quarters. The semi-annual and annual reports are filed electronically with the Securities and Exchange Commission (SEC) on Form N-CSRS and Form N-CSR, respectively. Morgan Stanley also delivers the semi-annual and annual reports to fund shareholders and makes these reports available on its public website, www.morganstanley.com/im. Each Morgan Stanley fund also files a complete schedule of portfolio holdings with the SEC for the fund's first and third fiscal quarters on Form N-Q. Morgan Stanley does not deliver the reports for the first and third fiscal quarters to shareholders, nor are the reports posted to the Morgan Stanley public website. You may, however, obtain the Form N-Q filings (as well as the Form N-CSR and N-CSRS filings) by accessing the SEC's website, www.sec.gov. You may also review and copy them at the SEC's Public Reference Room in Washington, DC. Information on the operation of the SEC's Public Reference Room may be obtained by calling the SEC toll free at 1 (800) SEC-0330. You can also request copies of these materials, upon payment of a duplicating fee, by electronic request at the SEC's email address (publicinfo@sec.gov) or by writing the Public Reference Room of the SEC, 100 F Street, NE, Washington, DC 20549-0102.
Proxy Voting Policies and Procedures and Proxy Voting Record
You may obtain a copy of the Fund's Proxy Voting Policy and Procedures and information regarding how the Fund voted proxies relating to portfolio securities during the most recent twelve-month period ended June 30, without charge, upon request, by calling toll free 1 (800) 548-7786 or by visiting our website at www.morganstanley.com/im. This information is also available on the SEC's website at www.sec.gov.
This report is authorized for distribution only when preceded or accompanied by a prospectus or summary prospectus of the applicable Portfolio of Morgan Stanley Institutional Fund, Inc., which describes in detail the Portfolio's investment policies, risks, fees and expenses. Please read the prospectus carefully before you invest or send money. For additional information, including information regarding the investments comprising the Portfolio, please visit our website at www.morganstanley.com/im or call toll free 1 (800) 548-7786.
34
(This Page has been left blank intentionally.)
(This Page has been left blank intentionally.)
(This Page has been left blank intentionally.)
Printed in U.S.A.
This Report has been prepared for shareholders and may be distributed to others only if preceded or accompanied by a current prospectus.
Morgan Stanley Investment Management Inc.
522 Fifth Avenue
New York, New York 10036
© 2017 Morgan Stanley. Morgan Stanley Distribution, Inc.

IFIGAANN
1695718 EXP. 02.28.18

Morgan Stanley Institutional Fund, Inc.
Global Concentrated Portfolio
Annual Report
December 31, 2016

Morgan Stanley Institutional Fund, Inc.
Annual Report — December 31, 2016
Shareholders' Letter | | | 2 | | |
Expense Example | | | 3 | | |
Investment Overview | | | 4 | | |
Portfolio of Investments | | | 6 | | |
Statement of Assets and Liabilities | | | 7 | | |
Statement of Operations | | | 8 | | |
Statement of Changes in Net Assets | | | 9 | | |
Financial Highlights | | | 10 | | |
Notes to Financial Statements | | | 14 | | |
Report of Independent Registered Public Accounting Firm | | | 19 | | |
Federal Tax Notice | | | 20 | | |
Privacy Notice | | | 21 | | |
Director and Officer Information | | | 24 | | |
This report is authorized for distribution only when preceded or accompanied by a prospectus or summary prospectus of the applicable Portfolio of Morgan Stanley Institutional Fund, Inc. To receive a prospectus and/or statement of additional information (SAI), which contains more complete information such as investment objectives, charges, expenses, policies for voting proxies, risk considerations, and describes in detail each of the Portfolio's investment policies to the prospective investor, please call toll free 1 (800) 548-7786. Please read the prospectuses carefully before you invest or send money.
Additionally, you can access information about the Portfolio, including performance, characteristics, and investment team commentary, through Morgan Stanley Investment Management's website: www.morganstanley.com/im.
Market forecasts provided in this report may not necessarily come to pass. There is no guarantee that any sectors mentioned will continue to perform as discussed herein or that securities in such sectors will be held by the Portfolio in the future. There is no assurance that a Portfolio will achieve its investment objective. Portfolios are subject to market risk, which is the possibility that market values of securities owned by the Portfolio will decline and, therefore, the value of the Portfolio's shares may be less than what you paid for them. Accordingly, you can lose money investing in this Portfolio. Please see the prospectus for more complete information on investment risks.
1
Morgan Stanley Institutional Fund, Inc.
Annual Report — December 31, 2016
Shareholders' Letter (unaudited)
Dear Shareholders,
We are pleased to provide this Annual report, in which you will learn how your investment in Global Concentrated Portfolio (the "Portfolio") performed during the period beginning May 27, 2016 (when the Portfolio launched) and ended December 31, 2016.
Morgan Stanley Investment Management is a client-centric, investor-led organization. Our global presence, intellectual capital, and breadth of products and services enable us to partner with investors to meet the evolving challenges of today's financial markets. We aim to deliver superior investment service and to empower our clients to make the informed decisions that help them reach their investment goals.
As always, we thank you for selecting Morgan Stanley Investment Management, and look forward to working with you in the months and years ahead.
Sincerely,

John H. Gernon
President and Principal Executive Officer
January 2017
2
Morgan Stanley Institutional Fund, Inc.
Annual Report — December 31, 2016
Expense Example (unaudited)
Global Concentrated Portfolio
As a shareholder of the Portfolio, you incur two types of costs: (1) transactional costs; and (2) ongoing costs, which may include advisory fees, administration fees, distribution and shareholder services fees and other Portfolio expenses. This example is intended to help you understand your ongoing costs (in dollars) of investing in the Portfolio and to compare these costs with the ongoing costs of investing in other mutual funds.
This example is based on an investment of $1,000 invested at the beginning of the six-month period ended December 31, 2016 and held for the entire six-month period.
Actual Expenses
The table below provides information about actual account values and actual expenses. You may use the information in this table, together with the amount you invested, to estimate the expenses that you paid over the period. Simply divide your account value by $1,000 (for example, an $8,600 account value divided by $1,000 = 8.6), then multiply the result by the number in the table under the heading entitled "Actual Expenses Paid During Period" to estimate the expenses you paid on your account during this period.
Hypothetical Example for Comparison Purposes
The table below provides information about hypothetical account values and hypothetical expenses based on the Portfolio's actual expense ratio and an assumed rate of return of 5% per year before expenses, which is not the Portfolio's actual return. The hypothetical account values and expenses may not be used to estimate the actual ending account balance or expenses you paid for the period. You may use this information to compare the ongoing costs of investing in the Portfolio and other funds. To do so, compare this 5% hypothetical example with the 5% hypothetical examples that appear in the shareholder reports of the other funds.
Please note that the expenses shown in the table are meant to highlight your ongoing costs only and do not reflect any transactional costs, such as sales charges (loads). Therefore, the information for each class in the table is useful in comparing ongoing costs only, and will not help you determine the relative total costs of owning different funds. In addition, if these transactional costs were included, your costs would have been higher.
| | | Beginning
Account
Value
7/1/16 | | Actual Ending
Account
Value
12/31/16 | | Hypothetical
Ending Account
Value | | Actual
Expenses
Paid
During
Period* | | Hypothetical
Expenses Paid
During Period* | | Net
Expense
Ratio
During
Period** | |
Global Concentrated Portfolio Class I | | $ | 1,000.00 | | | $ | 1,047.50 | | | $ | 1,020.26 | | | $ | 4.99 | | | $ | 4.93 | | | | 0.97 | % | |
Global Concentrated Portfolio Class A | | | 1,000.00 | | | | 1,045.20 | | | | 1,018.35 | | | | 6.94 | | | | 6.85 | | | | 1.35 | | |
Global Concentrated Portfolio Class C | | | 1,000.00 | | | | 1,043.00 | | | | 1,014.58 | | | | 10.78 | | | | 10.63 | | | | 2.10 | | |
Global Concentrated Portfolio Class IS | | | 1,000.00 | | | | 1,047.70 | | | | 1,020.36 | | | | 4.89 | | | | 4.82 | | | | 0.95 | | |
* Expenses are calculated using each Portfolio Class' annualized net expense ratio (as disclosed), multiplied by the average account value over the period, and multiplied by 184/366 (to reflect the most recent one-half year period).
** Annualized.
3
Morgan Stanley Institutional Fund, Inc.
Annual Report — December 31, 2016
Investment Overview (unaudited)
Global Concentrated Portfolio
The Portfolio seeks long-term capital appreciation.
Performance
For the period from inception on May 27, 2016 through December 31, 2016, the Portfolio's Class I shares had a total return based on net asset value and reinvestment of distributions per share of 2.24%, net of fees. The Portfolio's Class I shares underperformed the Portfolio's benchmark, the MSCI World Net Index (the "Index"), which returned 5.53% for the same period.
Factors Affecting Performance
• The reporting period proved to be a volatile time for the equity market, beginning with the spillover effects going into and following the Brexit vote, anticipation of the next Federal Reserve rate hike, and reactions to the U.S. presidential election campaign as well as its ultimate result. Within the U.S. region, earnings projections for 2016 were roughly flat compared to 2015, and since prior to the election, earnings growth expectations for 2017 were in the low double-digits. However, it was not until immediately following the election that the market began to price in the better earnings projections for 2017. Positive economic data such as gross domestic product growth, wage growth, low unemployment, moderate inflation, and increased consumer confidence contributed to investor enthusiasm. The European region continued to experience spillover from uncertainty surrounding the Brexit vote at the end of June, meaningfully underperforming the U.S.(i) Emerging market stocks had underperformed other regions for over five years, but rallied in 2016.(ii)
• The greatest strength within the Index over the reporting period came from within the U.S. and specifically the cyclical sectors that had experienced an earnings recession going into 2016: financials, energy, and industrials. The worst performers were European stocks in relatively low volatility sectors such as telecommunication services, utilities and consumer staples.
• The Portfolio benefited during the period from its regional allocation, in particular an underweight to Europe. From a sector allocation standpoint, an allocation to Asia ex-Japan information technology stocks was the single biggest positive contributor. In addition, the underweight to European consumer
staples, financials and telecommunication services added to gains.
• Within stock selection, the largest detractors for the period were two U.S. health care stocks. Within health care, the pharmaceuticals subsector had the greatest decline, as pricing concerns weighed on share prices since August. European industrials negatively impacted by the Brexit vote also contributed to Portfolio underperformance for the period.
• The Portfolio benefited from a position in a Taiwan-based global semiconductor manufacturer that sells its chips into major manufacturers of mobile devices and internet connectivity devices. Other top contributors to performance for the period were a U.S.-based digital communications company and an industrial products and equipment manufacturer, both of which had been deeply oversold and then rebounded during the period.
Management Strategies
• There have been no changes to our investment process during the period. Statistically, the majority of a portfolio's annual return can be explained by its common factor exposures (which we categorize as growth, value, quality, and risk). The tilting of these exposures is highly correlated to alpha generation (that is, a portfolio's excess return over a benchmark). Therefore, the team begins with a quantitative process to identify the common factors we believe are likely to prevail in each region of the world going forward. The rest of a portfolio's annual returns is explained by its company-specific results, meaning that stock selection is also a key determinant to alpha generation. We employ a bottom-up fundamental stock selection process in an effort to capture idiosyncratic returns. The result is a highly active portfolio of fundamentally attractive stocks which we believe could benefit from what we have identified to be quantitative investment styles likely to outperform in each region.
• As we move into 2017, the Portfolio is positioned with a modestly higher weighting in value stocks over growth stocks in the U.S. In that region, we remain underweight in historically low volatility, higher dividend yielding sectors that remain expensive relative to their historic valuations. We
(i) Source: Factset
(ii) Source: Bloomberg
4
Morgan Stanley Institutional Fund, Inc.
Annual Report — December 31, 2016
Investment Overview (unaudited) (cont'd)
Global Concentrated Portfolio
believe that the financial sector in particular could benefit in an environment of rising interest rates following a decade of underperformance. Despite the underweight to European stocks, we are seeing indications that European value stocks are poised to do well going into 2017. Additionally, we continue to have some exposure to emerging markets, where we see selective opportunities offering inexpensive valuations, and we remain underweight Japan.
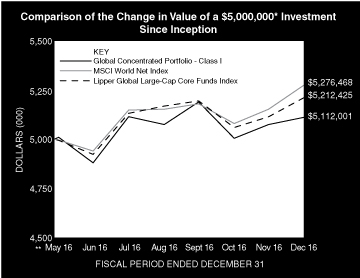
* Minimum Investment for Class I shares
** Commenced Operations on May 27, 2016.
In accordance with SEC regulations, the Portfolio's performance shown assumes that all recurring fees (including management fees) were deducted and all dividends and distributions were reinvested. The performance of Class A, C and IS shares will vary from the performance of Class I shares and will be impacted by additional fees assessed to those classes (if applicable).
Performance Compared to the MSCI World Net Index(1) and the Lipper Global Large-Cap Core Funds Index(2)
| | | Period Ended December 31, 2016
Total Returns(3) | |
| | | One
Year | | Five
Years | | Ten
Years | | Since
Inception(5) | |
Portfolio — Class I Shares
w/o sales charges(4) | | | — | | | | — | | | | — | | | | 2.24 | % | |
Portfolio — Class A Shares
w/o sales charges(4) | | | — | | | | — | | | | — | | | | 2.02 | | |
Portfolio — Class A Shares with
maximum 5.25% sales charges(4) | | | — | | | | — | | | | — | | | | –3.30 | | |
Portfolio — Class C Shares
w/o sales charges(4) | | | — | | | | — | | | | — | | | | 1.69 | | |
Portfolio — Class C Shares with
maximum 1.00% deferred
sales charges(4) | | | — | | | | — | | | | — | | | | 0.69 | | |
Portfolio — Class IS Shares
w/o sales charges(4) | | | — | | | | — | | | | — | | | | 2.25 | | |
MSCI World Net Index | | | — | | | | — | | | | — | | | | 5.53 | | |
Lipper Global Large-Cap
Core Funds Index | | | — | | | | — | | | | — | | | | 4.25 | | |
Performance data quoted represents past performance, which is no guarantee of future results, and current performance may be lower or higher than the figures shown. Performance assumes that all dividends and distributions, if any, were reinvested. For the most recent month-end performance figures, please visit www.morganstanley.com/im. Investment return and principal value will fluctuate so that Portfolio shares, when redeemed, may be worth more or less than their original cost. Total returns do not reflect the deduction of taxes that a shareholder would pay on Portfolio distributions or the redemption of Portfolio shares. Returns for periods less than one year are not annualized. Performance of share classes will vary due to difference in expenses.
(1) The MSCI World Net Index is a free float-adjusted market capitalization weighted index designed to measure the equity market performance of developed markets. The term "free float" represents the portion of shares outstanding that are deemed to be available for purchase in the public equity markets by investors. The MSCI World Net Index currently consists of 23 developed market country indices. The performance of the Index is listed in US dollars and assumes reinvestment of net dividends. The Index is unmanaged and its returns do not include any sales charges or fees. Such costs would lower performance. It is not possible to invest directly in an index.
(2) The Lipper Global Large-Cap Core Funds Index is an equally weighted performance index of the largest qualifying funds (based on net assets) in the Lipper Global Large-Cap Core Funds classification. The Index, which is adjusted for capital gains distributions and income dividends, is unmanaged and should not be considered an investment. There are currently 10 funds represented in this Index. As of the date of this report, the Portfolio is in the Lipper Global Large-Cap Core Funds classification.
(3) Total returns for the Portfolio reflect fees waived and expenses reimbursed, if applicable, by the Adviser. Without such waivers and reimbursements, total returns would have been lower.
(4) Commenced operations on May 27, 2016.
(5) For comparative purposes, average annual since inception returns listed for the Indexes refer to the inception date of the Portfolio, not the inception of the Index.
5
Morgan Stanley Institutional Fund, Inc.
Annual Report — December 31, 2016
Portfolio of Investments
Global Concentrated Portfolio
| | | Shares | | Value
(000) | |
Common Stocks (98.3%) | |
Canada (2.3%) | |
Agnico-Eagle Mines Ltd. | | | 4,647 | | | $ | 195 | | |
China (6.2%) | |
Tencent Holdings Ltd. ADR | | | 21,903 | | | | 531 | | |
Ireland (5.5%) | |
Ryanair Holdings PLC ADR (a) | | | 5,701 | | | | 475 | | |
Japan (7.1%) | |
Nippon Telegraph & Telephone Corp. ADR | | | 14,519 | | | | 611 | | |
Netherlands (5.8%) | |
Priceline Group, Inc. (The) (a) | | | 339 | | | | 497 | | |
Switzerland (5.6%) | |
UBS Group AG (Registered) (a) | | | 30,494 | | | | 478 | | |
Taiwan (5.8%) | |
Taiwan Semiconductor Manufacturing Co., Ltd. ADR | | | 17,496 | | | | 503 | | |
United Kingdom (5.2%) | |
Shire PLC ADR | | | 2,635 | | | | 449 | | |
United States (54.8%) | |
Allergan PLC (a) | | | 2,211 | | | | 464 | | |
Alphabet, Inc., Class A (a) | | | 936 | | | | 742 | | |
AmTrust Financial Services, Inc. | | | 5,015 | | | | 137 | | |
Comcast Corp., Class A | | | 5,010 | | | | 346 | | |
CVS Health Corp. | | | 3,644 | | | | 288 | | |
Emerson Electric Co. | | | 4,794 | | | | 267 | | |
Franklin Resources, Inc. | | | 11,844 | | | | 469 | | |
Illinois Tool Works, Inc. | | | 2,752 | | | | 337 | | |
JPMorgan Chase & Co. | | | 2,920 | | | | 252 | | |
National Oilwell Varco, Inc. | | | 4,887 | | | | 183 | | |
QUALCOMM, Inc. | | | 8,196 | | | | 534 | | |
Schlumberger Ltd. | | | 5,870 | | | | 493 | | |
Synchrony Financial | | | 5,353 | | | | 194 | | |
| | | | 4,706 | | |
Total Common Stocks (Cost $8,173) | | | 8,445 | | |
Short-Term Investment (1.2%) | |
Investment Company (1.2%) | |
Morgan Stanley Institutional Liquidity
Funds — Treasury Securities Portfolio —
Institutional Class (See Note G)
(Cost $107) | | | 107,385 | | | | 107 | | |
Total Investments (99.5%) (Cost $8,280) (b) | | | 8,552 | | |
Other Assets in Excess of Liabilities (0.5%) | | | 39 | | |
Net Assets (100.0%) | | $ | 8,591 | | |
Country assignments and aggregations are based generally on third party vendor classifications and information, and may be different from the assignments and aggregations under the policies set forth in the Portfolio's prospectus and/or statement of additional information relating to geographic classifications.
(a) Non-income producing security.
(b) At December 31, 2016, the aggregate cost for federal income tax purposes is approximately $8,344,000. The aggregate gross unrealized appreciation is approximately $442,000 and the aggregate gross unrealized depreciation is approximately $234,000, resulting in net unrealized appreciation of approximately $208,000.
ADR American Depositary Receipt.
Portfolio Composition
Classification | | Percentage of
Total Investments | |
Other* | | | 24.8 | % | |
Internet Software & Services | | | 14.9 | | |
Semiconductors & Semiconductor Equipment | | | 12.1 | | |
Capital Markets | | | 11.1 | | |
Energy Equipment & Services | | | 7.9 | | |
Diversified Telecommunication Services | | | 7.1 | | |
Internet & Direct Marketing Retail | | | 5.8 | | |
Airlines | | | 5.6 | | |
Pharmaceuticals | | | 5.4 | | |
Biotechnology | | | 5.3 | | |
Total Investments | | | 100.0 | % | |
* Industries and/or investment types representing less than 5% of total investments.
The accompanying notes are an integral part of the financial statements.
6
Morgan Stanley Institutional Fund, Inc.
Annual Report — December 31, 2016
Global Concentrated Portfolio
Statement of Assets and Liabilities | | December 31, 2016
(000) | |
Assets: | |
Investments in Securities of Unaffiliated Issuers, at Value (Cost $8,173) | | $ | 8,445 | | |
Investment in Security of Affiliated Issuer, at Value (Cost $107) | | | 107 | | |
Total Investments in Securities, at Value (Cost $8,280) | | | 8,552 | | |
Prepaid Offering Costs | | | 40 | | |
Due from Adviser | �� | | 33 | | |
Receivable for Portfolio Shares Sold | | | 10 | | |
Dividends Receivable | | | 9 | | |
Receivable from Affiliate | | | — | @ | |
Other Assets | | | 1 | | |
Total Assets | | | 8,645 | | |
Liabilities: | |
Payable for Professional Fees | | | 25 | | |
Payable for Offering Costs | | | 18 | | |
Payable for Custodian Fees | | | 2 | | |
Payable for Shareholder Services Fees — Class A | | | — | @ | |
Payable for Distribution and Shareholder Services Fees — Class C | | | 1 | | |
Payable for Administration Fees | | | 1 | | |
Payable for Transfer Agency Fees — Class I | | | — | @ | |
Payable for Transfer Agency Fees — Class A | | | — | @ | |
Payable for Transfer Agency Fees — Class C | | | — | @ | |
Payable for Portfolio Shares Redeemed | | | — | @ | |
Other Liabilities | | | 7 | | |
Total Liabilities | | | 54 | | |
Net Assets | | $ | 8,591 | | |
Net Assets Consist Of: | |
Paid-in-Capital | | $ | 8,536 | | |
Distributions in Excess of Net Investment Income | | | (32 | ) | |
Accumulated Net Realized Loss | | | (185 | ) | |
Unrealized Appreciation (Depreciation) on: | |
Investments | | | 272 | | |
Net Assets | | $ | 8,591 | | |
CLASS I: | |
Net Assets | | $ | 6,922 | | |
| Shares Outstanding $0.001 par value shares of beneficial interest (unlimited shares authorized) (not in 000's) | | | 680,947 | | |
Net Asset Value, Offering and Redemption Price Per Share | | $ | 10.16 | | |
CLASS A: | |
Net Assets | | $ | 782 | | |
| Shares Outstanding $0.001 par value shares of beneficial interest (unlimited shares authorized) (not in 000's) | | | 77,047 | | |
Net Asset Value, Redemption Price Per Share | | $ | 10.15 | | |
Maximum Sales Load | | | 5.25 | % | |
Maximum Sales Charge | | $ | 0.56 | | |
Maximum Offering Price Per Share | | $ | 10.71 | | |
CLASS C: | |
Net Assets | | $ | 877 | | |
| Shares Outstanding $0.001 par value shares of beneficial interest (unlimited shares authorized) (not in 000's) | | | 86,454 | | |
Net Asset Value, Offering and Redemption Price Per Share | | $ | 10.15 | | |
CLASS IS: | |
Net Assets | | $ | 10 | | |
| Shares Outstanding $0.001 par value shares of beneficial interest (unlimited shares authorized) (not in 000's) | | | 1,000 | | |
Net Asset Value, Offering and Redemption Price Per Share | | $ | 10.16 | | |
@ Amount is less than $500.
The accompanying notes are an integral part of the financial statements.
7
Morgan Stanley Institutional Fund, Inc.
Annual Report — December 31, 2016
Global Concentrated Portfolio
Statement of Operations | | Period from
May 27, 2016^ to
December 31, 2016
(000) | |
Investment Income: | |
Dividends from Securities of Unaffiliated Issuers (Net of $4 of Foreign Taxes Withheld) | | $ | 66 | | |
Dividends from Security of Affiliated Issuer (Note G) | | | — | @ | |
Total Investment Income | | | 66 | | |
Expenses: | |
Offering Costs | | | 57 | | |
Professional Fees | | | 53 | | |
Advisory Fees (Note B) | | | 34 | | |
Shareholder Reporting Fees | | | 7 | | |
Shareholder Services Fees — Class A (Note D) | | | 1 | | |
Distribution and Shareholder Services Fees — Class C (Note D) | | | 3 | | |
Administration Fees (Note C) | | | 4 | | |
Transfer Agency Fees — Class I (Note E) | | | 1 | | |
Transfer Agency Fees — Class A (Note E) | | | 1 | | |
Transfer Agency Fees — Class C (Note E) | | | 1 | | |
Transfer Agency Fees — Class IS (Note E) | | | 1 | | |
Custodian Fees (Note F) | | | 3 | | |
Pricing Fees | | | 3 | | |
Sub Transfer Agency Fees — Class A | | | — | @ | |
Sub Transfer Agency Fees — Class C | | | — | @ | |
Directors' Fees and Expenses | | | — | @ | |
Registration Fees | | | — | @ | |
Other Expenses | | | — | @ | |
Total Expenses | | | 169 | | |
Expenses Reimbursed by Adviser (Note B) | | | (84 | ) | |
Waiver of Advisory Fees (Note B) | | | (34 | ) | |
Reimbursement of Class Specific Expenses — Class A (Note B) | | | (1 | ) | |
Reimbursement of Class Specific Expenses — Class C (Note B) | | | (— | @) | |
Reimbursement of Class Specific Expenses — Class IS (Note B) | | | (1 | ) | |
Rebate from Morgan Stanley Affiliate (Note G) | | | (— | @) | |
Net Expenses | | | 49 | | |
Net Investment Income | | | 17 | | |
Realized Loss: | |
Investments Sold | | | (185 | ) | |
Change in Unrealized Appreciation (Depreciation): | |
Investments | | | 272 | | |
Net Realized Loss and Change in Unrealized Appreciation (Depreciation) | | | 87 | | |
Net Increase in Net Assets Resulting from Operations | | $ | 104 | | |
^ Commencement of Operations.
@ Amount is less than $500.
The accompanying notes are an integral part of the financial statements.
8
Morgan Stanley Institutional Fund, Inc.
Annual Report — December 31, 2016
Global Concentrated Portfolio
Statement of Changes in Net Assets | | Period from
May 27, 2016^ to
December 31, 2016
(000) | |
Increase (Decrease) in Net Assets: | |
Operations: | |
Net Investment Income | | $ | 17 | | |
Net Realized Loss | | | (185 | ) | |
Net Change in Unrealized Appreciation (Depreciation) | | | 272 | | |
Net Increase in Net Assets Resulting from Operations | | | 104 | | |
Distributions from and/or in Excess of: | |
Class I: | |
Net Investment Income | | | (43 | ) | |
Class A: | |
Net Investment Income | | | (4 | ) | |
Class C: | |
Net Investment Income | | | (2 | ) | |
Class IS: | |
Net Investment Income | | | (— | @) | |
Total Distributions | | | (49 | ) | |
Capital Share Transactions:(1) | |
Class I: | |
Subscribed | | | 8,440 | | |
Distributions Reinvested | | | 11 | | |
Redeemed | | | (1,574 | ) | |
Class A: | |
Subscribed | | | 789 | | |
Distributions Reinvested | | | 4 | | |
Redeemed | | | (12 | ) | |
Class C: | |
Subscribed | | | 870 | | |
Distributions Reinvested | | | 2 | | |
Redeemed | | | (4 | ) | |
Class IS: | |
Subscribed | | | 10 | | |
Net Increase in Net Assets Resulting from Capital Share Transactions | | | 8,536 | | |
Total Increase in Net Assets | | | 8,591 | | |
Net Assets: | |
Beginning of Period | | | — | | |
End of Period (Including Distributions in Excess of Net Investment Income of $(32)). | | $ | 8,591 | | |
(1) Capital Share Transactions: | |
Class I: | |
Shares Subscribed | | | 837 | | |
Shares Issued on Distributions Reinvested | | | 1 | | |
Shares Redeemed | | | (157 | ) | |
Net Increase in Class I Shares Outstanding | | | 681 | | |
Class A: | |
Shares Subscribed | | | 78 | | |
Shares Issued on Distributions Reinvested | | | — | @@ | |
Shares Redeemed | | | (1 | ) | |
Net Increase in Class A Shares Outstanding | | | 77 | | |
Class C: | |
Shares Subscribed | | | 86 | | |
Shares Issued on Distributions Reinvested | | | — | @@ | |
Shares Redeemed | | | (— | @@) | |
Net Increase in Class C Shares Outstanding | | | 86 | | |
Class IS: | |
Shares Subscribed | | | 1 | | |
^ Commencement of Operations.
@ Amount is less than $500.
@@ Amount is less than 500 shares.
The accompanying notes are an integral part of the financial statements.
9
Morgan Stanley Institutional Fund, Inc.
Annual Report — December 31, 2016
Financial Highlights
Global Concentrated Portfolio
| | | Class I | |
Selected Per Share Data and Ratios | | Period from
May 27, 2016(1)
to December 31, 2016 | |
Net Asset Value, Beginning of Period | | $ | 10.00 | | |
Income from Investment Operations: | |
Net Investment Income (2) | | | 0.03 | | |
Net Realized and Unrealized Gain | | | 0.19 | | |
Total from Investment Operations | | | 0.22 | | |
Distributions from and/or in Excess of: | |
Net Investment Income | | | (0.06 | ) | |
Net Asset Value, End of Period | | $ | 10.16 | | |
Total Return (3) | | | 2.24 | %(6) | |
Ratios and Supplemental Data: | |
Net Assets, End of Period (Thousands) | | $ | 6,922 | | |
Ratio of Expenses to Average Net Assets (8) | | | 0.97 | %(4)(7) | |
Ratio of Net Investment Income to Average Net Assets (8) | | | 0.48 | %(4)(7) | |
Ratio of Rebate from Morgan Stanley Affiliates to Average Net Assets | | | 0.00 | %(5)(7) | |
Portfolio Turnover Rate | | | 44 | %(6) | |
(8) Supplemental Information on the Ratios to Average Net Assets: | |
Ratios Before Expense Limitation: | |
Expenses to Average Net Assets | | | 3.57 | %(7) | |
Net Investment Loss to Average Net Assets | | | (2.12 | )%(7) | |
(1) Commencement of Operations.
(2) Per share amount is based on average shares outstanding.
(3) Calculated based on the net asset value as of the last business day of the period.
(4) The Ratios of Expenses and Net Investment Income reflect the rebate of certain Portfolio expenses in connection with the investments in Morgan Stanley affiliates during the period. The effect of the rebate on the ratios is disclosed in the above table as "Ratio of Rebate from Morgan Stanley Affiliates to Average Net Assets."
(5) Amount is less than 0.005%.
(6) Not Annualized.
(7) Annualized.
The accompanying notes are an integral part of the financial statements.
10
Morgan Stanley Institutional Fund, Inc.
Annual Report — December 31, 2016
Financial Highlights
Global Concentrated Portfolio
| | | Class A | |
Selected Per Share Data and Ratios | | Period from
May 27, 2016(1)
to December 31, 2016 | |
Net Asset Value, Beginning of Period | | $ | 10.00 | | |
Income from Investment Operations: | |
Net Investment Income (2) | | | 0.01 | | |
Net Realized and Unrealized Gain | | | 0.19 | | |
Total from Investment Operations | | | 0.20 | | |
Distributions from and/or in Excess of: | |
Net Investment Income | | | (0.05 | ) | |
Net Asset Value, End of Period | | $ | 10.15 | | |
Total Return (3) | | | 2.02 | %(6) | |
Ratios and Supplemental Data: | |
Net Assets, End of Period (Thousands) | | $ | 782 | | |
Ratio of Expenses to Average Net Assets (8) | | | 1.35 | %(4)(7) | |
Ratio of Net Investment Income to Average Net Assets (8) | | | 0.16 | %(4)(7) | |
Ratio of Rebate from Morgan Stanley Affiliates to Average Net Assets | | | 0.00 | %(5)(7) | |
Portfolio Turnover Rate | | | 44 | %(6) | |
(8) Supplemental Information on the Ratios to Average Net Assets: | |
Ratios Before Expense Limitation: | |
Expenses to Average Net Assets | | | 4.23 | %(7) | |
Net Investment Loss to Average Net Assets | | | (2.72 | )%(7) | |
(1) Commencement of Operations.
(2) Per share amount is based on average shares outstanding.
(3) Calculated based on the net asset value which does not reflect sales charges, if applicable, as of the last business day of the period.
(4) The Ratios of Expenses and Net Investment Income reflect the rebate of certain Portfolio expenses in connection with the investments in Morgan Stanley affiliates during the period. The effect of the rebate on the ratios is disclosed in the above table as "Ratio of Rebate from Morgan Stanley Affiliates to Average Net Assets."
(5) Amount is less than 0.005%.
(6) Not Annualized.
(7) Annualized.
The accompanying notes are an integral part of the financial statements.
11
Morgan Stanley Institutional Fund, Inc.
Annual Report — December 31, 2016
Financial Highlights
Global Concentrated Portfolio
| | | Class C | |
Selected Per Share Data and Ratios | | Period from
May 27, 2016(1)
to December 31, 2016 | |
Net Asset Value, Beginning of Period | | $ | 10.00 | | |
Income (Loss) from Investment Operations: | |
Net Investment Loss (2) | | | (0.04 | ) | |
Net Realized and Unrealized Gain | | | 0.21 | | |
Total from Investment Operations | | | 0.17 | | |
Distributions from and/or in Excess of: | |
Net Investment Income | | | (0.02 | ) | |
Net Asset Value, End of Period | | $ | 10.15 | | |
Total Return (3) | | | 1.69 | %(6) | |
Ratios and Supplemental Data: | |
Net Assets, End of Period (Thousands) | | $ | 877 | | |
Ratio of Expenses to Average Net Assets (8) | | | 2.10 | %(4)(7) | |
Ratio of Net Investment Loss to Average Net Assets (8) | | | (0.69 | )%(4)(7) | |
Ratio of Rebate from Morgan Stanley Affiliates to Average Net Assets | | | 0.00 | %(5)(7) | |
Portfolio Turnover Rate | | | 44 | %(6) | |
(8) Supplemental Information on the Ratios to Average Net Assets: | |
Ratios Before Expense Limitation: | |
Expense to Average Net Assets | | | 4.81 | %(7) | |
Net Investment Loss to Average Net Assets | | | (3.40 | )%(7) | |
(1) Commencement of Operations.
(2) Per share amount is based on average shares outstanding.
(3) Calculated based on the net asset value which does not reflect sales charges, if applicable, as of the last business day of the period.
(4) The Ratios of Expenses and Net Investment Loss reflect the rebate of certain Portfolio expenses in connection with the investments in Morgan Stanley affiliates during the period. The effect of the rebate on the ratios is disclosed in the above table as "Ratio of Rebate from Morgan Stanley Affiliates to Average Net Assets."
(5) Amount is less than 0.005%.
(6) Not Annualized.
(7) Annualized.
The accompanying notes are an integral part of the financial statements.
12
Morgan Stanley Institutional Fund, Inc.
Annual Report — December 31, 2016
Financial Highlights
Global Concentrated Portfolio
| | | Class IS | |
Selected Per Share Data and Ratios | | Period from
May 27, 2016(1)
to December 31, 2016 | |
Net Asset Value, Beginning of Period | | $ | 10.00 | | |
Income from Investment Operations: | |
Net Investment Income (2) | | | 0.03 | | |
Net Realized and Unrealized Gain | | | 0.20 | | |
Total from Investment Operations | | | 0.23 | | |
Distribution from and/or in Excess of | |
Net Investment Income | | | (0.07 | ) | |
Net Asset Value, End of Period | | $ | 10.16 | | |
Total Return (3) | | | 2.25 | %(6) | |
Ratios and Supplemental Data: | |
Net Assets, End of Period (Thousands) | | $ | 10 | | |
Ratio of Expenses to Average Net Assets (8) | | | 0.95 | %(4)(7) | |
Ratio of Net Investment Income to Average Net Assets (8) | | | 0.56 | %(4)(7) | |
Ratio of Rebate from Morgan Stanley Affiliates to Average Net Assets | | | 0.00 | %(5)(7) | |
Portfolio Turnover Rate | | | 44 | %(6) | |
(8) Supplemental Information on the Ratios to Average Net Assets: | |
Ratios Before Expense Limitation: | |
Expenses to Average Net Assets | | | 19.43 | %(7) | |
Net Investment Loss to Average Net Assets | | | (17.92 | )%(7) | |
(1) Commencement of Operations.
(2) Per share amount is based on average shares outstanding.
(3) Calculated based on the net asset value as of the last business day of the period.
(4) The Ratios of Expenses and Net Investment Income reflect the rebate of certain Portfolio expenses in connection with the investments in Morgan Stanley affiliates during the period. The effect of the rebate on the ratios is disclosed in the above table as "Ratio of Rebate from Morgan Stanley Affiliates to Average Net Assets."
(5) Amount is less than 0.005%.
(6) Not Annualized.
(7) Annualized.
The accompanying notes are an integral part of the financial statements.
13
Morgan Stanley Institutional Fund, Inc.
Annual Report — December 31, 2016
Notes to Financial Statements
Morgan Stanley Institutional Fund, Inc. (the "Fund") is registered under the Investment Company Act of 1940, as amended (the "Act"), as an open-end management investment company. The Fund is comprised of twenty-nine separate, active, diversified and non-diversified portfolios (individually referred to as a "Portfolio", collectively as the "Portfolios"). The Fund applies investment company accounting and reporting guidance.
The accompanying financial statements relate to the Global Concentrated Portfolio. The Portfolio seeks long-term capital appreciation.
The Portfolio commenced operations on May 27, 2016, and offers four classes of shares — Class I, Class A, Class C and Class IS.
A. Significant Accounting Policies: The following significant accounting policies are in conformity with U.S. generally accepted accounting principles ("GAAP"). Such policies are consistently followed by the Fund in the preparation of its financial statements. GAAP may require management to make estimates and assumptions that affect the reported amounts and disclosures in the financial statements. Actual results may differ from those estimates.
1. Security Valuation: (1) An equity portfolio security listed or traded on an exchange is valued at its latest reported sales price (or at the exchange official closing price if such exchange reports an official closing price), and if there were no sales on a given day and if there is no official exchange closing price for that day, the security is valued at the mean between the last reported bid and asked prices if such bid and asked prices are available on the relevant exchanges; (2) all other equity portfolio securities for which over-the-counter ("OTC") market quotations are readily available are valued at the latest reported sales price (or at the market official closing price if such market reports an official closing price), and if there was no trading in the security on a given day and if there is no official closing price from relevant markets for that day, the security is valued at the mean between the last reported bid and asked prices if such bid and asked prices are available on the relevant markets. Listed equity securities not traded on the valuation date with no reported bid and asked prices available on the exchange are valued at the mean between the current bid and asked prices obtained from one or more reputable brokers or dealers. An unlisted equity security that does not trade on the valuation date and for
which bid and asked prices from the relevant markets are unavailable is valued at the mean between the current bid and asked prices obtained from one or more reputable brokers or dealers. In cases where a security is traded on more than one exchange, the security is valued on the exchange designated as the primary market; (3) certain portfolio securities may be valued by an outside pricing service/vendor approved by the Fund's Board of Directors (the "Directors"). The pricing service/vendor may employ a pricing model that takes into account, among other things, bids, yield spreads, and/or other market data and specific security characteristics. Alternatively, if a valuation is not available from an outside pricing service/vendor, and the security trades on an exchange, the security may be valued at its latest reported sale price (or at the exchange official closing price if such exchange reports an official closing price), prior to the time when assets are valued. If there are no sales on a given day and if there is no official exchange closing price for that day, the security is valued at the mean between the last reported bid and asked prices if such bid and asked prices are available in the relevant exchanges; (4) when market quotations are not readily available, including circumstances under which Morgan Stanley Investment Management Inc. (the "Adviser") determines that the closing price, last sale price or the mean between the last reported bid and asked prices are not reflective of a security's market value, portfolio securities are valued at their fair value as determined in good faith under procedures established by and under the general supervision of the Directors. Occasionally, developments affecting the closing prices of securities and other assets may occur between the times at which valuations of such securities are determined (that is, close of the foreign market on which the securities trade) and the close of business of the New York Stock Exchange ("NYSE"). If developments occur during such periods that are expected to materially affect the value of such securities, such valuations may be adjusted to reflect the estimated fair value of such securities as of the close of the NYSE, as determined in good faith by the Directors or by the Adviser using a pricing service and/or procedures approved by the Directors; and (5) investments in mutual funds, including the Morgan Stanley Institutional Liquidity Funds, are valued at the net asset value ("NAV") as of the close of each business day.
The Directors have responsibility for determining in good faith the fair value of the investments, and the
14
Morgan Stanley Institutional Fund, Inc.
Annual Report — December 31, 2016
Notes to Financial Statements (cont'd)
Directors may appoint others, such as the Fund's Adviser or a valuation committee, to assist the Directors in determining fair value and to make the actual calculations pursuant to the fair valuation methodologies previously approved by the Directors. Under procedures approved by the Directors, the Fund's Adviser has formed a Valuation Committee whose members are approved by the Directors. The Valuation Committee provides administration and oversight of the Fund's valuation policies and procedures, which are reviewed at least annually by the Directors. These procedures allow the Fund to utilize independent pricing services, quotations from securities and financial instrument dealers, and other market sources to determine fair value.
The Fund has procedures to determine the fair value of securities and other financial instruments for which market prices are not readily available. Under these procedures, the Valuation Committee convenes on a regular and ad hoc basis to review such securities and considers a number of factors, including valuation methodologies and significant unobservable valuation inputs, when arriving at fair value. The Valuation Committee may employ a market-based approach which may use related or comparable assets or liabilities, recent transactions, market multiples, book values, and other relevant information for the investment to determine the fair value of the investment. An income-based valuation approach may also be used in which the anticipated future cash flows of the investment are discounted to calculate fair value. Discounts may also be applied due to the nature or duration of any restrictions on the disposition of the investments. Due to the inherent uncertainty of valuations of such investments, the fair values may differ significantly from the values that would have been used had an active market existed. The Valuation Committee employs various methods for calibrating these valuation approaches including a regular review of valuation methodologies, key inputs and assumptions, transactional back-testing or disposition analysis, and reviews of any related market activity.
2. Fair Value Measurement: Financial Accounting Standards Board ("FASB") Accounting Standards CodificationTM ("ASC") 820, "Fair Value Measurement" ("ASC 820"), defines fair value as the value that the Fund would receive to sell an investment or pay to transfer a
liability in a timely transaction with an independent buyer in the principal market, or in the absence of a principal market, the most advantageous market for the investment or liability. ASC 820 establishes a three-tier hierarchy to distinguish between (1) inputs that reflect the assumptions market participants would use in valuing an asset or liability developed based on market data obtained from sources independent of the reporting entity (observable inputs) and (2) inputs that reflect the reporting entity's own assumptions about the assumptions market participants would use in valuing an asset or liability developed based on the best information available in the circumstances (unobservable inputs) and to establish classification of fair value measurements for disclosure purposes. Various inputs are used in determining the value of the Fund's investments. The inputs are summarized in the three broad levels listed below.
• Level 1 – unadjusted quoted prices in active markets for identical investments
• Level 2 – other significant observable inputs (including quoted prices for similar investments, interest rates, prepayment speeds, credit risk, etc.)
• Level 3 – significant unobservable inputs including the Fund's own assumptions in determining the fair value of investments. Factors considered in making this determination may include, but are not limited to, information obtained by contacting the issuer, analysts, or the appropriate stock exchange (for exchange-traded securities), analysis of the issuer's financial statements or other available documents and, if necessary, available information concerning other securities in similar circumstances
The inputs or methodology used for valuing securities are not necessarily an indication of the risk associated with investing in those securities and the determination of the significance of a particular input to the fair value measurement in its entirety requires judgment and considers factors specific to each security.
15
Morgan Stanley Institutional Fund, Inc.
Annual Report — December 31, 2016
Notes to Financial Statements (cont'd)
The following is a summary of the inputs used to value the Portfolio's investments as of December 31, 2016.
Investment Type | | Level 1
Unadjusted
quoted
prices
(000) | | Level 2
Other
significant
observable
inputs
(000) | | Level 3
Significant
unobservable
inputs
(000) | | Total
(000) | |
Assets: | |
Common Stocks | |
Airlines | | $ | 475 | | | $ | — | | | $ | — | | | $ | 475 | | |
Banks | | | 252 | | | | — | | | | — | | | | 252 | | |
Biotechnology | | | 449 | | | | — | | | | — | | | | 449 | | |
Capital Markets | | | 947 | | | | — | | | | — | | | | 947 | | |
Consumer Finance | | | 194 | | | | — | | | | — | | | | 194 | | |
Diversified Telecommunication
Services | | | 611 | | | | — | | | | — | | | | 611 | | |
Electrical Equipment | | | 267 | | | | — | | | | — | | | | 267 | | |
Energy Equipment & Services | | | 676 | | | | — | | | | — | | | | 676 | | |
Food & Staples Retailing | | | 288 | | | | — | | | | — | | | | 288 | | |
Insurance | | | 137 | | | | — | | | | — | | | | 137 | | |
Internet & Direct Marketing
Retail | | | 497 | | | | — | | | | — | | | | 497 | | |
Internet Software & Services | | | 1,273 | | | | — | | | | — | | | | 1,273 | | |
Machinery | | | 337 | | | | — | | | | — | | | | 337 | | |
Media | | | 346 | | | | — | | | | — | | | | 346 | | |
Metals & Mining | | | 195 | | | | — | | | | — | | | | 195 | | |
Pharmaceuticals | | | 464 | | | | — | | | | — | | | | 464 | | |
Semiconductors &
Semiconductor Equipment | | | 1,037 | | | | — | | | | — | | | | 1,037 | | |
Total Common Stocks | | | 8,445 | | | | — | | | | — | | | | 8,445 | | |
Short-Term Investment | |
Investment Company | | | 107 | | | | — | | | | — | | | | 107 | | |
Total Assets | | $ | 8,552 | | | $ | — | | | $ | — | | | $ | 8,552 | | |
Transfers between investment levels may occur as the markets fluctuate and/or the availability of data used in an investment's valuation changes. The Portfolio recognizes transfers between the levels as of the end of the period.
3. Indemnifications: The Fund enters into contracts that contain a variety of indemnifications. The Fund's maximum exposure under these arrangements is unknown. However, the Fund has not had prior claims or losses pursuant to these contracts and expects the risk of loss to be remote.
4. Dividends and Distributions to Shareholders: Dividend income and distributions to shareholders are recorded on the ex-dividend date. Dividends from net investment income, if any, are declared and paid annually. Net realized capital gains, if any, are distributed at least annually.
5. Security Transactions, Income and Expenses: Security transactions are accounted for on the trade date (date the order to buy or sell is executed). Realized gains and losses on the sale of investment securities are
determined on the specific identified cost method. Dividend income and other distributions are recorded on the ex-dividend date (except for certain foreign dividends which may be recorded as soon as the Portfolio is informed of such dividends) net of applicable withholding taxes. Interest income is recognized on the accrual basis except where collection is in doubt. Discounts are accreted and premiums are amortized over the life of the respective securities. Most expenses of the Fund can be directly attributed to a particular Portfolio. Expenses which cannot be directly attributed are apportioned among the Portfolios based upon relative net assets or other appropriate methods. Income, expenses (other than class specific expenses — distribution and shareholder services, transfer agency and sub transfer agency fees) and realized and unrealized gains or losses are allocated to each class of shares based upon their relative net assets.
B. Advisory Fees: The Adviser, a wholly-owned subsidiary of Morgan Stanley, provides the Portfolio with advisory services under the terms of an Investment Advisory Agreement, paid quarterly, at the annual rate based on the daily net assets as follows:
First $750
million | | Next $750
million | | Over $1.5
billion | |
| | 0.75 | % | | | 0.70 | % | | | 0.65 | % | |
For the period ended December 31, 2016, the advisory fee rate (net of waivers/rebate) was equivalent to an annual effective rate of 0.00% of the Portfolio's average daily net assets.
The Adviser has agreed to reduce its advisory fee and/or reimburse the Portfolio so that total annual portfolio operating expenses, excluding certain investment related expenses, taxes, interest and other extraordinary expenses (including litigation), will not exceed 1.00% for Class I shares, 1.35% for Class A shares, 2.10% for Class C shares and 0.95% for Class IS shares. The fee waivers and/or expense reimbursements will continue for at least one year from the date of the Portfolio's prospectus or until such time as the Directors act to discontinue all or a portion of such waivers and/or reimbursements when they deem such action is appropriate. For the period ended December 31, 2016, approximately $34,000 of advisory fees were waived and approximately $86,000 of other expenses were reimbursed by the Adviser pursuant to this arrangement.
C. Administration Fees: The Adviser also serves as Administrator to the Fund and provides administrative services pursuant to an Administration Agreement for an annual fee, accrued daily and paid monthly, of 0.08% of the Portfolio's average daily net assets.
16
Morgan Stanley Institutional Fund, Inc.
Annual Report — December 31, 2016
Notes to Financial Statements (cont'd)
Under a Sub-Administration Agreement between the Administrator and State Street Bank and Trust Company ("State Street"), State Street provides certain administrative services to the Fund. For such services, the Administrator pays State Street a portion of the fee the Administrator receives from the Portfolio.
D. Distribution and Shareholder Services Fees: Morgan Stanley Distribution, Inc. ("MSDI" or the "Distributor"), a wholly-owned subsidiary of the Adviser and an indirect subsidiary of Morgan Stanley, serves as the Fund's Distributor of Portfolio shares pursuant to a Distribution Agreement. The Fund has adopted a Shareholder Services Plan with respect to Class A shares pursuant to Rule 12b-1 under the Act. Under the Shareholder Services Plan, the Portfolio pays the Distributor a shareholder services fee, accrued daily and paid monthly, at an annual rate of 0.25% of the Portfolio's average daily net assets attributable to Class A shares.
The Fund has adopted a Distribution and Shareholder Services Plan with respect to Class C shares pursuant to Rule 12b-1 under the Act. Under the Distribution and Shareholder Services Plan, the Portfolio pays the Distributor a distribution fee, accrued daily and paid monthly, at an annual rate of 0.75% and a shareholder services fee, accrued daily and paid monthly, at an annual rate of 0.25% of the Portfolio's average daily net assets attributable to Class C shares.
The distribution and shareholder services fees are used to support the expenses associated with servicing and maintaining accounts. The Distributor may compensate other parties for providing shareholder support services to investors who purchase Class A and Class C shares.
E. Dividend Disbursing and Transfer Agent: The Fund's dividend disbursing and transfer agent is Boston Financial Data Services, Inc. ("BFDS"). Pursuant to a Transfer Agency Agreement, the Fund pays BFDS a fee based on the number of classes, accounts and transactions relating to the Portfolios of the Fund.
F. Custodian Fees: State Street (the "Custodian") serves as Custodian for the Fund in accordance with a Custodian Agreement. The Custodian holds cash, securities, and other assets of the Fund as required by the Act. Custody fees are payable monthly based on assets held in custody, investment purchases and sales activity and account maintenance fees, plus reimbursement for certain out-of-pocket expenses.
G. Security Transactions and Transactions with Affiliates: For the period ended December 31, 2016, purchases and sales of investment securities for the Portfolio, other than
long-term U.S. Government securities and short-term investments, were approximately $11,622,000 and $3,265,000, respectively. There were no purchases and sales of long-term U.S. Government securities for the period ended December 31, 2016.
The Portfolio invests in the Institutional Class of the Morgan Stanley Institutional Liquidity Funds — Treasury Securities Portfolio (the "Liquidity Funds"), an open-end management investment company managed by the Adviser. Advisory fees paid by the Portfolio are reduced by an amount equal to its pro-rata share of the advisory and administration fees paid by the Portfolio due to its investment in the Liquidity Funds. For the period ended December 31, 2016, advisory fees paid were reduced by less than $500 relating to the Portfolio's investment in the Liquidity Funds.
A summary of the Portfolio's transactions in shares of the Liquidity Funds during the period ended December 31, 2016 is as follows:
Purchases
at Cost
(000) | | Sales
(000) | | Dividend
Income
(000) | | Value
December 31,
2016
(000) | |
| $ | 8,872 | | | $ | 8,765 | | | $ | — | @ | | $ | 107 | | |
@ Amount is less than $500.
The Portfolio is permitted to purchase and sell securities ("cross-trade") from and to other Morgan Stanley Funds as well as other funds and client accounts for which the Adviser or an affiliate of the Adviser serves as investment adviser, pursuant to procedures approved by the Directors in compliance with Rule 17a-7 under the Act (the "Rule"). Each cross-trade is executed at the current market price in compliance with provisions of the Rule. For the period ended December 31, 2016, the Portfolio did not engage in any cross-trade transactions.
The Portfolio has an unfunded Deferred Compensation Plan (the "Compensation Plan"), which allows each independent Director to defer payment of all, or a portion, of the fees he or she receives for serving on the Board of Directors. Each eligible Director generally may elect to have the deferred amounts credited with a return equal to the total return on one or more of the Morgan Stanley funds that are offered as investment options under the Compensation Plan. Appreciation/depreciation and distributions received from these investments are recorded with an offsetting increase/decrease in the deferred compensation obligation and do not affect the NAV of the Portfolio.
H. Federal Income Taxes: It is the Portfolio's intention to continue to qualify as a regulated investment company and distribute all of its taxable and tax-exempt income. Accordingly,
17
Morgan Stanley Institutional Fund, Inc.
Annual Report — December 31, 2016
Notes to Financial Statements (cont'd)
no provision for federal income taxes is required in the financial statements.
The Portfolio may be subject to taxes imposed by countries in which it invests. Such taxes are generally based on income and/or capital gains earned or repatriated. Taxes are accrued based on net investment income, net realized gains and net unrealized appreciation as such income and/or gains are earned. Taxes may also be based on transactions in foreign currency and are accrued based on the value of investments denominated in such currency.
FASB ASC 740-10, "Income Taxes — Overall", sets forth a minimum threshold for financial statement recognition of the benefit of a tax position taken or expected to be taken in a tax return. Management has concluded there are no significant uncertain tax positions that would require recognition in the financial statements. If applicable, the Portfolio recognizes interest accrued related to unrecognized tax benefits in "Interest Expense" and penalties in "Other Expenses" in the Statement of Operations. The Portfolio files tax returns with the U.S. Internal Revenue Service, New York and various states. The tax period ended December 31, 2016, remains subject to examination by taxing authorities.
The tax character of distributions paid may differ from the character of distributions shown in the Statement of Changes in Net Assets due to short-term capital gains being treated as ordinary income for tax purposes. The tax character of distributions paid during fiscal year 2016 was as follows:
| 2016 Distributions Paid From: | |
Ordinary
Income
(000) | |
| $ | 49 | | |
The amount and character of income and gains to be distributed are determined in accordance with income tax regulations which may differ from GAAP. These book/tax differences are either considered temporary or permanent in nature.
Temporary differences are primarily due to differing book and tax treatments for the timing of the recognition of gains (losses) on certain investment transactions and the timing of the deductibility of certain expenses.
At December 31, 2016, the components of distributable earnings for the Portfolio on a tax basis were as follows:
Undistributed
Ordinary
Income
(000) | | Undistributed
Long-Term
Capital Gain
(000) | |
| $ | 23 | | | $ | — | | |
At December 31, 2016, the Portfolio had available for federal income tax purposes unused short-term capital losses of approximately $121,000 that do not have an expiration date.
To the extent that capital loss carryforwards are used to offset any future capital gains realized during the carryover period as provided by U.S. federal income tax regulations, no capital gains tax liability will be incurred by the Portfolio for gains realized and not distributed. To the extent that capital gains are offset, such gains will not be distributed to the shareholders.
I. Other: At December 31, 2016, the Portfolio had record owners of 10% or greater. Investment activities of these shareholders could have a material impact on the Portfolio. The aggregate percentage of such owners was 31.8%.
J. Accounting Pronouncements: In December 2016, FASB issued Accounting Standards update 2016-19 — Technical Corrections and Improvements ("ASU 2016-19"), which is effective for interim periods for all entities beginning after December 15, 2016. ASU 2016-19 includes an amendment to Topic 820, Fair Value Measurement, which clarifies the difference between a valuation approach and a valuation technique when applying the guidance in that Topic. That amendment also requires an entity to disclose when there has been a change in either or both a valuation approach and/or a valuation technique. The transition guidance for the amendment must be applied prospectively because it could potentially involve the use of hindsight that includes fair value measurements. Although still evaluating the potential impacts of ASU 2016-19 to the Portfolio, management expects that the impact of the Portfolio's adoption will be limited to additional financial statement disclosures.
In October 2016, the Securities and Exchange Commission ("SEC") issued a new rule, Investment Company Reporting Modernization, which, among other provisions, amends Regulation S-X to require standardized, enhanced disclosures, particularly related to derivatives, in investment company financial statements. Compliance with the guidance is effective for financial statements filed with the SEC on or after August 1, 2017; adoption will have no effect on the Portfolio's net assets or results of operations. Although still evaluating the potential impacts of the Investment Company Reporting Modernization to the Portfolio, management expects that the impact of the Portfolio's adoption will be limited to additional financial statement disclosures.
18
Morgan Stanley Institutional Fund, Inc.
Annual Report — December 31, 2016
Report of Independent Registered Public Accounting Firm
To the Shareholders and Board of Directors of
Morgan Stanley Institutional Fund, Inc. —
Global Concentrated Portfolio
We have audited the accompanying statement of assets and liabilities, including the portfolio of investments, of Global Concentrated Portfolio (one of the portfolios constituting Morgan Stanley Institutional Fund, Inc.) (the "Portfolio") as of December 31, 2016, and the related statements of operations and changes in net assets and the financial highlights for the period from May 27, 2016 (commencement of operations) to December 31, 2016. These financial statements and financial highlights are the responsibility of the Portfolio's management. Our responsibility is to express an opinion on these financial statements and financial highlights based on our audit.
We conducted our audit in accordance with the standards of the Public Company Accounting Oversight Board (United States). Those standards require that we plan and perform the audit to obtain reasonable assurance about whether the financial statements and financial highlights are free of material misstatement. We were not engaged to perform an audit of the Portfolio's internal control over financial reporting. Our audit included consideration of internal control over financial reporting as a basis for designing audit procedures that are appropriate in the circumstances, but not for the purpose of expressing an opinion on the effectiveness of the Portfolio's internal control over financial reporting. Accordingly, we express no such opinion. An audit also includes examining, on a test basis, evidence supporting the amounts and disclosures in the financial statements and financial highlights, assessing the accounting principles used and significant estimates made by management, and evaluating the overall financial statement presentation. Our procedures included confirmation of securities owned as of December 31, 2016, by correspondence with the custodian and others or by other appropriate auditing procedures where replies from others were not received. We believe that our audit provides a reasonable basis for our opinion.
In our opinion, the financial statements and financial highlights referred to above present fairly, in all material respects, the financial position of Global Concentrated Portfolio (one of the portfolios constituting Morgan Stanley Institutional Fund, Inc.) at December 31, 2016, the results of its operations, the changes in its net assets and the financial highlights for the period from May 27, 2016 (commencement of operations) to December 31, 2016, in conformity with U.S. generally accepted accounting principles.

Boston, Massachusetts
February 28, 2017
19
Morgan Stanley Institutional Fund, Inc.
Annual Report — December 31, 2016
Federal Tax Notice (unaudited)
For federal income tax purposes, the following information is furnished with respect to the distributions paid by the Portfolio during its taxable year ended December 31, 2016. For corporate shareholders 45.52% of the dividends qualified for the dividends received deduction.
For federal income tax purposes, the following information is furnished with respect to the Portfolio's earnings for its taxable year ended December 31, 2016. When distributed, certain earnings may be subject to a maximum tax rate of 15% as provided for by the Jobs and Growth Tax Relief Reconciliation Act of 2003. The Portfolio designated up to a maximum of approximately $49,000 as taxable at this lower rate.
In January, the Portfolio provides tax information to shareholders for the preceding calendar year.
20
Morgan Stanley Institutional Fund, Inc.
Annual Report — December 31, 2016
Privacy Notice (unaudited)
MORGAN STANLEY INVESTMENT MANAGEMENT INC.
AN IMPORTANT NOTICE CONCERNING OUR U.S. PRIVACY POLICY
We are required by federal law to provide you with a copy of our privacy policy annually. This policy applies to current and former individual investors in funds managed or sponsored by Morgan Stanley Investment Management Inc. ("MSIM") as well as current and former individual clients of MSIM. This policy is not applicable to partnerships, corporations, trusts or other non-individual clients or investors. Please note that we may amend this policy at any time, and will inform you of any changes as required by law.
WE RESPECT YOUR PRIVACY
We appreciate that you have provided us with your personal financial information. We strive to maintain the privacy of such information while we help you achieve your financial objectives. This Notice describes what non-public personal information we collect about you, why we collect it, when we may share it with others and how certain others may use it. It discusses the steps you may take to limit our sharing of certain information about you to affiliated companies in the Morgan Stanley family of companies ("other Morgan Stanley companies"). It also discloses how you may limit use of certain shared information for marketing purposes by other Morgan Stanley branded companies. Throughout this policy, we refer to the non-public information that personally identifies you or your accounts as "personal information."
1. WHAT PERSONAL INFORMATION DO WE COLLECT ABOUT YOU?
We obtain personal information from applications and other forms you submit to us, from your dealings with us, from consumer reporting agencies, from our Web sites and from third parties and other sources.
For example:
• We may collect information such as your name, address, e-mail address, telephone/fax numbers, assets, income and investment objectives through subscription documents, applications and other forms you submit to us.
• We may obtain information about account balances, your use of account(s) and the types of products and services you prefer to receive from us through your dealings and transactions with us and other sources.
• We may obtain information about your creditworthiness and credit history from consumer reporting agencies.
• We may collect background information from and through third-party vendors to verify representations you have made and to comply with various regulatory requirements.
• If you interact with us through our public and private Web sites, we may collect information that you provide directly through online communications (such as an e-mail address). We may also collect information about your Internet service provider, your domain name, your computer's operating system and Web browser, your use of our Web sites and your product and service preferences, through the use of "cookies." Please consult the Terms of Use of these sites for more details.
2. WHEN DO WE DISCLOSE PERSONAL INFORMATION WE COLLECT ABOUT YOU?
We may disclose personal information we collect about you to other Morgan Stanley companies and to non-affiliated third parties.
a. Information We Disclose to Other Morgan Stanley Companies.
We may disclose personal information to other Morgan Stanley companies for a variety of reasons, including to manage your account(s) effectively, to service and process your transactions, to let you know about products and services offered by us and other Morgan Stanley companies, to manage our business, and as otherwise required or permitted by law. Offers for products and services from other Morgan Stanley companies are developed under conditions designed to safeguard your personal information.
21
Morgan Stanley Institutional Fund, Inc.
Annual Report — December 31, 2016
Privacy Notice (unaudited) (cont'd)
b. Information We Disclose to Non-affiliated Third Parties.
We do not disclose personal information that we collect about you to non-affiliated third parties except to those who provide marketing services on our behalf, to financial institutions with whom we have joint marketing agreements, and as otherwise required or permitted by law. For example, we may disclose personal information to nonaffiliated third parties for servicing and processing transactions, to offer our own products and services, to protect against fraud, for institutional risk control, to respond to judicial process or to perform services on our behalf. When we share personal information with a non-affiliated third party, they are required to limit their use of personal information to the particular purpose for which it was shared and they are not allowed to share personal information with others except to fulfill that limited purpose or as may be permitted or required by law.
3. HOW DO WE PROTECT THE SECURITY AND CONFIDENTIALITY OF PERSONAL INFORMATION WE COLLECT ABOUT YOU?
We maintain physical, electronic and procedural security measures to help safeguard the personal information we collect about you. We have internal policies governing the proper handling of client information. Third parties that provide support or marketing services on our behalf may also receive personal information, and we require them to adhere to confidentiality standards with respect to such information.
4. HOW CAN YOU LIMIT THE SHARING OF CERTAIN TYPES OF PERSONAL INFORMATION WITH OTHER MORGAN STANLEY COMPANIES?
We offer you choices as to whether we share with other Morgan Stanley companies the personal information that was collected to determine your eligibility for products and services you request ("eligibility information"). Eligibility information does not include your identification information or personal information pertaining to our transactions or experiences with you. Please note that, even if you direct us not to share eligibility information with other Morgan Stanley companies ("opt-out"), we may still share personal information, including eligibility information, with those companies in circumstances excluded from the opt-out under applicable law, such as to process transactions or to service your account.
5. HOW CAN YOU LIMIT THE USE OF CERTAIN TYPES OF PERSONAL INFORMATION BY OTHER MORGAN STANLEY COMPANIES FOR MARKETING?
By following the opt-out instructions in Section 6 below, you may limit other Morgan Stanley branded companies from marketing their products or services to you based on personal information we disclose to them. This information may include, for example, your income and account history with us. Please note that, even if you choose to limit Other Morgan Stanley Companies from using personal information about you that we may share with them for marketing their products and services to you, Other Morgan Stanley Companies may use your personal information that they obtain from us to market to you in circumstances permitted by law, such as if the Other Morgan Stanley Company has its own relationship with you.
6. HOW CAN YOU SEND US AN OPT-OUT INSTRUCTION?
If you wish to limit our sharing of eligibility information about you with other Morgan Stanley companies or other Morgan Stanley companies' use of personal information for marketing purposes, as described in this notice, you may do so by:
• Calling us at (800) 548-7786
Monday–Friday between 8a.m. and 6p.m.(EST)
• Writing to us at the following address:
Boston Financial Data Services, Inc.
c/o Privacy Coordinator
P.O. Box 219804
Kansas City, Missouri 64121
22
Morgan Stanley Institutional Fund, Inc.
Annual Report — December 31, 2016
Privacy Notice (unaudited) (cont'd)
Your written request should include your name, address, telephone number and account number(s) to which the opt-out applies and whether you are opting out with respect to sharing of eligibility information (Section 4 above), or if information used for Marketing (Section 5 above) or both. Written opt-out requests should not be sent with any other correspondence. In order to process your request, we require that the request be provided by you directly and not through a third party.
Your opt-out preference will remain in effect with respect to this policy (as it may be amended) until you notify us otherwise. If you have a joint account, your direction for us not to share this information with other Morgan Stanley companies and for those other Morgan Stanley companies not to use your personal information for marketing will be applied to all account holders on that account. Please understand that if you limit our sharing or our affiliated companies' use of personal information, you and any joint account holder(s) may not receive information about Morgan Stanley products and services, including products or services that could help you manage your financial resources and achieve your investment objectives.
7. WHAT IF AN AFFILIATED COMPANY BECOMES A NON-AFFILIATED THIRD PARTY?
If, at any time in the future, an affiliated company becomes a non-affiliated third party, further disclosures of personal information made to the former affiliated company will be limited to those described in Section 2(b) above relating to non-affiliated third parties. If you elected under Section 6 to limit disclosures we make to affiliated companies, or use of personal information by affiliated companies, your election will not apply to use by any former affiliated company of your personal information in their possession once it becomes a non-affiliated third party.
SPECIAL NOTICE TO RESIDENTS OF VERMONT
The following section supplements our policy with respect to our individual clients who have a Vermont address and supersedes anything to the contrary in the above policy with respect to those clients only.
The state of Vermont requires financial institutions to obtain your consent prior to sharing personal information that they collect about you with affiliated companies and non-affiliated third parties other than in certain limited circumstances. Except as permitted by law, we will not share personal information we collect about you with non-affiliated third parties or other Morgan Stanley companies unless you provide us with your written consent to share such information ("opt-in").
If you wish to receive offers for investment products and services offered by or through other Morgan Stanley companies, please notify us in writing at the following address:
Boston Financial Data Services, Inc.
c/o Privacy Coordinator
P.O. Box 219804
Kansas City, Missouri 64121
Your authorization should include your name, address, telephone number and account number(s) to which the opt-in applies and should not be sent with any other correspondence. In order to process your authorization, we require that the authorization be provided by you directly and not through a third party.
SPECIAL NOTICE TO RESIDENTS OF CALIFORNIA
The following section supplements our policy with respect to our individual clients who have a California address and supersedes anything to the contrary in the above policy with respect to those clients only.
In response to a California law, if your account has a California home address, your personal information will not be disclosed to nonaffiliated third parties except as permitted by applicable California law, and we will limit sharing such information with our affiliates to comply with California privacy laws that apply to us.
23
Morgan Stanley Institutional Fund, Inc.
Annual Report — December 31, 2016
Director and Officer Information (unaudited)
Independent Directors:
Name, Age and Address of
Independent Director | | Position(s)
Held with
Registrant | | Length of Time
Served* | | Principal Occupation(s) During Past 5 Years
and Other Relevant Professional Experience | | Number of
Portfolios in
Fund Complex
Overseen by
Independent
Director** | | Other Directorships
Held by Independent
Director*** | |
Frank L. Bowman (72)
c/o Perkins Coie LLP
Counsel to the Independent
Directors
30 Rockefeller Plaza
New York, NY 10112 | | Director | | Since
August
2006 | | President, Strategic Decisions, LLC (consulting) (since February 2009); Director or Trustee of various Morgan Stanley Funds (since August 2006); Chairperson of the Compliance and Insurance Committee (since October 2015); formerly, Chairperson of the Insurance Sub-Committee of the Compliance and Insurance Committee (2007-2015); served as President and Chief Executive Officer of the Nuclear Energy Institute (policy organization) (February 2005-November 2008); retired as Admiral, U.S. Navy after serving over 38 years on active duty including 8 years as Director of the Naval Nuclear Propulsion Program in the Department of the Navy and the U.S. Department of Energy (1996-2004); served as Chief of Naval Personnel (July 1994-September 1996) and on the Joint Staff as Director of Political Military Affairs (June 1992-July 1994); knighted as Honorary Knight Commander of the Most Excellent Order of the British Empire; awarded the Officier de l'Orde National du Mérite by the French Government; elected to the National Academy of Engineering (2009). | | | 90 | | | Director of BP p.l.c.; Director of Naval and Nuclear Technologies LLP; Director Emeritus of the Armed Services YMCA; Director of the U.S. Naval Submarine League; Member of the National Security Advisory Council of the Center for U.S. Global Engagement and a member of the CNA Military Advisory Board; Chairman of the charity J Street Cup Golf; Trustee of Fairhaven United Methodist Church; and Director of other various non-profit organizations. | |
Kathleen A. Dennis (63)
c/o Perkins Coie LLP
Counsel to the Independent Directors
30 Rockefeller Plaza
New York, NY 10112 | | Director | | Since
August
2006 | | President, Cedarwood Associates (mutual fund and investment management consulting) (since July 2006); Chairperson of the Liquidity and Alternatives Sub-Committee of the Investment Committee (since October 2006) and Director or Trustee of various Morgan Stanley Funds (since August 2006); formerly, Senior Managing Director of Victory Capital Management (1993-2006). | | | 91 | | | Director of various non-profit organizations. | |
Nancy C. Everett (61)
c/o Perkins Coie LLP
Counsel to the Independent Directors
30 Rockefeller Plaza
New York, NY 10112 | | Director | | Since
January
2015 | | Chief Executive Officer, Virginia Commonwealth University Investment Company (since November 2015); Owner, OBIR, LLC (institutional investment management consulting) (since June 2014); formerly, Managing Director, BlackRock Inc. (February 2011-December 2013); and Chief Executive Officer, General Motors Asset Management (a/k/a Promark Global Advisors, Inc.) (June 2005-May 2010). | | | 91 | | | Member of Virginia Commonwealth University School of Business Foundation; formerly, Member of Virginia Commonwealth University Board of Visitors (2013-2015); Member of Committee on Directors for Emerging Markets Growth Fund, Inc. (2007-2010); Chairperson of Performance Equity Management, LLC (2006-2010); and Chairperson, GMAM Absolute Return Strategies Fund, LLC (2006-2010). | |
24
Morgan Stanley Institutional Fund, Inc.
Annual Report — December 31, 2016
Director and Officer Information (unaudited) (cont'd)
Independent Directors: (cont'd)
Name, Age and Address of
Independent Director | | Position(s)
Held with
Registrant | | Length of Time
Served* | | Principal Occupation(s) During Past 5 Years
and Other Relevant Professional Experience | | Number of
Portfolios in
Fund Complex
Overseen by
Independent
Director** | | Other Directorships
Held by Independent
Director*** | |
Jakki L. Haussler (59)
c/o Perkins Coie LLP
Counsel to the Independent Directors
30 Rockefeller Plaza
New York, NY 10112 | | Director | | Since
January
2015 | | Chairman and Chief Executive Officer, Opus Capital Group (since January 1996); formerly, Director, Capvest Venture Fund, LP (May 2000-December 2011); Partner, Adena Ventures, LP (July 1999-December 2010); Director, The Victory Funds (February 2005-July 2008). | | | 91 | | | Director of Cincinnati Bell Inc. and Member, Audit Committee and Compensation Committee; Director of Northern Kentucky University Foundation and Member, Investment Committee; Member of Chase College of Law Transactional Law Practice Center Board of Advisors; Director of Best Transport; Director of Chase College of Law Board of Visitors; formerly, Member, University of Cincinnati Foundation Investment Committee; Member, Miami University Board of Visitors (2008-2011); Trustee of Victory Funds (2005-2008) and Chairman, Investment Committee (2007-2008) and Member, Service Provider Committee (2005-2008). | |
Dr. Manuel H. Johnson (67)
c/o Johnson Smick
International, Inc.
220 I Street, N.E. — Suite 200
Washington, D.C. 20002 | | Director | | Since
July
1991 | | Senior Partner, Johnson Smick International, Inc. (consulting firm); Chairperson of the Investment Committee (since October 2006) and Director or Trustee of various Morgan Stanley Funds (since July 1991); Co-Chairman and a founder of the Group of Seven Council (G7C) (international economic commission); formerly, Chairperson of the Audit Committee (July 1991-September 2006), Vice Chairman of the Board of Governors of the Federal Reserve System and Assistant Secretary of the U.S. Treasury. | | | 91 | | | Director of NVR, Inc. (home construction). | |
Joseph J. Kearns (74)
c/o Kearns & Associates LLC
46 E Peninsula Center #385
Rolling Hills Estates, CA 90274-3712 | | Director | | Since
August
1994 | | President, Kearns & Associates LLC (investment consulting); Chairperson of the Audit Committee (since October 2006) and Director or Trustee of various Morgan Stanley Funds (since August 1994); formerly, Deputy Chairperson of the Audit Committee (July 2003-September 2006) and Chairperson of the Audit Committee of various Morgan Stanley Funds (since August 1994); CFO of the J. Paul Getty Trust. | | | 93 | | | Director of Electro Rent Corporation (equipment leasing). Prior to December 31, 2013, Director of The Ford Family Foundation. | |
25
Morgan Stanley Institutional Fund, Inc.
Annual Report — December 31, 2016
Director and Officer Information (unaudited) (cont'd)
Independent Directors: (cont'd)
Name, Age and Address of
Independent Director | | Position(s)
Held with
Registrant | | Length of Time
Served* | | Principal Occupation(s) During Past 5 Years
and Other Relevant Professional Experience | | Number of
Portfolios in
Fund Complex
Overseen by
Independent
Director** | | Other Directorships
Held by Independent
Director*** | |
Michael F. Klein (58)
c/o Perkins Coie LLP
Counsel to the Independent Directors
30 Rockefeller Plaza
New York, NY 10112 | | Director | | Since
August
2006 | | Managing Director, Aetos Capital, LLC (since March 2000); Co-President, Aetos Alternatives Management, LLC (since January 2004) and Co-Chief Executive Officer of Aetos Capital LLC (since August 2013); Chairperson of the Fixed Income Sub-Committee of the Investment Committee (since October 2006) and Director or Trustee of various Morgan Stanley Funds (since August 2006); formerly, Managing Director, Morgan Stanley & Co. Inc. and Morgan Stanley Dean Witter Investment Management, President, various Morgan Stanley Funds (June 1998-March 2000) and Principal, Morgan Stanley & Co. Inc. and Morgan Stanley Dean Witter Investment Management (August 1997-December 1999). | | | 90 | | | Director of certain investment funds managed or sponsored by Aetos Capital, LLC; Director of Sanitized AG and Sanitized Marketing AG (specialty chemicals). | |
Patricia Maleski (56)
c/o Perkins Coie LLP
Counsel to the Independent Directors
30 Rockefeller Plaza
New York, NY 10112 | | Director | | Since
January
2017 | | Management Director, JPMorgan Asset Management (2013-2016); President, JPMorgan Funds (2010-2013), Chief Administrative Officer, JPMorgan Funds (2004-2010), Treasurer, JPMorgan Funds (2003-2004, 2008-2010), and Vice President and Board Liaison, JPMorgan Funds (2001-2004); Managing Director, J.P. Morgan Investment Management Inc. (2001-2013); Vice President of Finance, Pierpont Group (1996-2001); Vice President, Bank of New York (1995-1996); Senior Audit Manager, Price Waterhouse, LLP (1982-1995). | | | 91 | | | None. | |
Michael E. Nugent (80)
522 Fifth Avenue
New York, NY 10036 | | Chair of the Board and Director | | Chair of the Boards since July 2006 and Director since July 1991 | | Chair of the Boards of various Morgan Stanley Funds (since July 2006); Chairperson of the Closed-End Fund Committee (since June 2012) and Director or Trustee of various Morgan Stanley Funds (since July 1991); formerly, Chairperson of the Insurance Committee (until July 2006); General Partner, Triumph Capital, L.P. (private investment partnership) (1988-2013). | | | 92 | | | None. | |
W. Allen Reed (69)
c/o Perkins Coie LLP
Counsel to the Independent Directors
30 Rockefeller Plaza
New York, NY 10112 | | Director | | Since
August
2006 | | Chairperson of the Equity Sub-Committee of the Investment Committee (since October 2006) and Director or Trustee of various Morgan Stanley Funds (since August 2006); formerly, President and CEO of General Motors Asset Management; Chairman and Chief Executive Officer of the GM Trust Bank and Corporate Vice President of General Motors Corporation (August 1994-December 2005). | | | 91 | | | Director of Legg Mason, Inc.; formerly, Director of the Auburn University Foundation (2010-2015). | |
Fergus Reid (84)
c/o Joe Pietryka, Inc.
85 Charles Colman Blvd.
Pawling, NY 12564 | | Director | | Since
June
1992 | | Chairman, Joe Pietryka, Inc.; Chairperson of the Governance Committee and Director or Trustee of various Morgan Stanley Funds (since June 1992). | | | 92 | | | Formerly, Trustee and Director of certain investment companies in the JP Morgan Fund Complex managed by JP Morgan Investment Management Inc. (1987-2012). | |
* This is the earliest date the Director began serving the Morgan Stanley Funds. Each Director serves an indefinite term, until his or her successor is elected.
** The Fund Complex includes (as of December 31, 2016) all open-end and closed-end funds (including all of their portfolios) advised by Morgan Stanley Investment Management Inc. (the "Adviser") and any funds that have an adviser that is an affiliated person of the Adviser (including, but not limited to, Morgan Stanley AIP GP LP).
*** This includes any directorships at public companies and registered investment companies held by the Director at any time during the past five years.
26
Morgan Stanley Institutional Fund, Inc.
Annual Report — December 31, 2016
Director and Officer Information (unaudited) (cont'd)
Executive Officers:
Name, Age and Address of Executive Officer | | Position(s) Held
with
Registrant | | Length of Time
Served* | | Principal Occupation(s) During Past 5 Years | |
John H. Gernon (53)
522 Fifth Avenue
New York, NY 10036 | | President and Principal Executive Officer | | Since
September
2013 | | President and Principal Executive Officer of the Equity and Fixed Income Funds and the Morgan Stanley AIP Funds (since September 2013) and the Liquidity Funds and various money market funds (since May 2014) in the Fund Complex; Managing Director of the Adviser; Head of Product (since 2006). | |
Timothy J. Knierim (58)
522 Fifth Avenue
New York, NY 10036 | | Chief Compliance Officer | | Since
December
2016 | | Managing Director of the Adviser and various entities affiliated with the Adviser; Chief Compliance Officer of various Morgan Stanley Funds and the Adviser (since December 2016) and Chief Compliance Officer of Morgan Stanley AIP GP LP (since 2014). Formerly, Managing Director and Deputy Chief Compliance Officer of the Adviser (2014-2016); and formerly, Chief Compliance Officer of Prudential Investment Management, Inc. (2007-2014). | |
Francis J. Smith (51)
522 Fifth Avenue
New York, NY 10036 | | Treasurer and Principal Financial Officer | | Treasurer since July 2003 and Principal Financial Officer since September 2002 | | Managing Director of the Adviser and various entities affiliated with the Adviser; Treasurer (since July 2003) and Principal Financial Officer of various Morgan Stanley Funds (since September 2002). | |
Mary E. Mullin (49)
522 Fifth Avenue
New York, NY 10036 | | Secretary | | Since
June
1999 | | Executive Director of the Adviser; Secretary of various Morgan Stanley Funds (since June 1999). | |
* This is the earliest date the officer began serving the Morgan Stanley Funds. Each officer serves a one-year term, until his or her successor is elected and qualifies.
27
Morgan Stanley Institutional Fund, Inc.
Annual Report — December 31, 2016
Adviser and Administrator
Morgan Stanley Investment Management Inc.
522 Fifth Avenue
New York, New York 10036
Distributor
Morgan Stanley Distribution, Inc.
522 Fifth Avenue
New York, New York 10036
Dividend Disbursing and Transfer Agent
Boston Financial Data Services, Inc.
2000 Crown Colony Drive
Quincy, Massachusetts 02169
Custodian
State Street Bank and Trust Company
One Lincoln Street
Boston, Massachusetts 02111
Legal Counsel
Dechert LLP
1095 Avenue of the Americas
New York, New York 10036
Counsel to the Independent Directors
Perkins Coie LLP
30 Rockefeller Plaza
New York, New York 10112
Independent Registered Public Accounting Firm
Ernst & Young LLP
200 Clarendon Street
Boston, Massachusetts 02116
Reporting to Shareholders
Each Morgan Stanley fund provides a complete schedule of portfolio holdings in its semi-annual and annual reports within 60 days of the end of the fund's second and fourth fiscal quarters. The semi-annual and annual reports are filed electronically with the Securities and Exchange Commission (SEC) on Form N-CSRS and Form N-CSR, respectively. Morgan Stanley also delivers the semi-annual and annual reports to fund shareholders and makes these reports available on its public website, www.morganstanley.com/im. Each Morgan Stanley fund also files a complete schedule of portfolio holdings with the SEC for the fund's first and third fiscal quarters on Form N-Q. Morgan Stanley does not deliver the reports for the first and third fiscal quarters to shareholders, nor are the reports posted to the Morgan Stanley public website. You may, however, obtain the Form N-Q filings (as well as the Form N-CSR and N-CSRS filings) by accessing the SEC's website, www.sec.gov. You may also review and copy them at the SEC's Public Reference Room in Washington, DC. Information on the operation of the SEC's Public Reference Room may be obtained by calling the SEC toll free at 1 (800) SEC-0330. You can also request copies of these materials, upon payment of a duplicating fee, by electronic request at the SEC's email address (publicinfo@sec.gov) or by writing the Public Reference Room of the SEC, 100 F Street, NE, Washington, DC 20549-0102.
Proxy Voting Policies and Procedures and Proxy Voting Record
You may obtain a copy of the Fund's Proxy Voting Policy and Procedures and information regarding how the Fund voted proxies relating to portfolio securities during the most recent period ended June 30, without charge, upon request, by calling toll free 1 (800) 548-7786 or by visiting our website at www.morganstanley.com/im. This information is also available on the SEC's website at www.sec.gov.
This report is authorized for distribution only when preceded or accompanied by a prospectus or summary prospectus of the applicable Portfolio of Morgan Stanley Institutional Fund, Inc., which describes in detail the Portfolio's investment policies, risks, fees and expenses. Please read the prospectus carefully before you invest or send money. For additional information, including information regarding the investments comprising the Portfolio, please visit our website at www.morganstanley.com/im or call toll free 1 (800) 548-7786.
28
(This Page has been left blank intentionally.)
Printed in U.S.A.
This Report has been prepared for shareholders and may be distributed to others only if preceded or accompanied by a current prospectus.
Morgan Stanley Investment Management Inc.
522 Fifth Avenue
New York, New York 10036
© 2017 Morgan Stanley. Morgan Stanley Distribution, Inc.

IFIGCNPANN
1698146 EXP. 02.28.18

Morgan Stanley Institutional Fund, Inc.
Global Core Portfolio
Annual Report
December 31, 2016

Morgan Stanley Institutional Fund, Inc.
Annual Report — December 31, 2016
Shareholders' Letter | | | 2 | | |
Expense Example | | | 3 | | |
Investment Overview | | | 4 | | |
Portfolio of Investments | | | 6 | | |
Statement of Assets and Liabilities | | | 7 | | |
Statement of Operations | | | 8 | | |
Statement of Changes in Net Assets | | | 9 | | |
Financial Highlights | | | 10 | | |
Notes to Financial Statements | | | 14 | | |
Report of Independent Registered Public Accounting Firm | | | 20 | | |
Federal Tax Notice | | | 21 | | |
Privacy Notice | | | 22 | | |
Director and Officer Information | | | 25 | | |
This report is authorized for distribution only when preceded or accompanied by a prospectus or summary prospectus of the applicable Portfolio of Morgan Stanley Institutional Fund, Inc. To receive a prospectus and/or statement of additional information (SAI), which contains more complete information such as investment objectives, charges, expenses, policies for voting proxies, risk considerations, and describes in detail each of the Portfolio's investment policies to the prospective investor, please call toll free 1 (800) 548-7786. Please read the prospectuses carefully before you invest or send money.
Additionally, you can access information about the Portfolio, including performance, characteristics, and investment team commentary, through Morgan Stanley Investment Management's website: www.morganstanley.com/im.
Market forecasts provided in this report may not necessarily come to pass. There is no guarantee that any sectors mentioned will continue to perform as discussed herein or that securities in such sectors will be held by the Portfolio in the future. There is no assurance that a Portfolio will achieve its investment objective. Portfolios are subject to market risk, which is the possibility that market values of securities owned by the Portfolio will decline and, therefore, the value of the Portfolio's shares may be less than what you paid for them. Accordingly, you can lose money investing in this Portfolio. Please see the prospectus for more complete information on investment risks.
1
Morgan Stanley Institutional Fund, Inc.
Annual Report — December 31, 2016
Shareholders' Letter (unaudited)
Dear Shareholders,
We are pleased to provide this Annual report, in which you will learn how your investment in Global Core Portfolio (the "Portfolio") performed during the period beginning May 27, 2016 (when the Portfolio launched) and ended December 31, 2016.
Morgan Stanley Investment Management is a client-centric, investor-led organization. Our global presence, intellectual capital, and breadth of products and services enable us to partner with investors to meet the evolving challenges of today's financial markets. We aim to deliver superior investment service and to empower our clients to make the informed decisions that help them reach their investment goals.
As always, we thank you for selecting Morgan Stanley Investment Management, and look forward to working with you in the months and years ahead.
Sincerely,

John H. Gernon
President and Principal Executive Officer
January 2017
2
Morgan Stanley Institutional Fund, Inc.
Annual Report — December 31, 2016
Expense Example (unaudited)
Global Core Portfolio
As a shareholder of the Portfolio, you incur two types of costs: (1) transactional costs; and (2) ongoing costs, which may include advisory fees, administration fees, distribution and shareholder services fees and other Portfolio expenses. This example is intended to help you understand your ongoing costs (in dollars) of investing in the Portfolio and to compare these costs with the ongoing costs of investing in other mutual funds.
This example is based on an investment of $1,000 invested at the beginning of the six-month period ended December 31, 2016 and held for the entire six-month period.
Actual Expenses
The table below provides information about actual account values and actual expenses. You may use the information in this table, together with the amount you invested, to estimate the expenses that you paid over the period. Simply divide your account value by $1,000 (for example, an $8,600 account value divided by $1,000 = 8.6), then multiply the result by the number in the table under the heading entitled "Actual Expenses Paid During Period" to estimate the expenses you paid on your account during this period.
Hypothetical Example for Comparison Purposes
The table below provides information about hypothetical account values and hypothetical expenses based on the Portfolio's actual expense ratio and an assumed rate of return of 5% per year before expenses, which is not the Portfolio's actual return. The hypothetical account values and expenses may not be used to estimate the actual ending account balance or expenses you paid for the period. You may use this information to compare the ongoing costs of investing in the Portfolio and other funds. To do so, compare this 5% hypothetical example with the 5% hypothetical examples that appear in the shareholder reports of the other funds.
Please note that the expenses shown in the table are meant to highlight your ongoing costs only and do not reflect any transactional costs, such as sales charges (loads). Therefore, the information for each class in the table is useful in comparing ongoing costs only, and will not help you determine the relative total costs of owning different funds. In addition, if these transactional costs were included, your costs would have been higher.
| | | Beginning
Account
Value
7/1/16 | | Actual Ending
Account
Value
12/31/16 | | Hypothetical
Ending Account
Value | | Actual
Expenses
Paid
During
Period* | | Hypothetical
Expenses Paid
During Period* | | Net
Expense
Ratio
During
Period** | |
Global Core Portfolio Class I | | $ | 1,000.00 | | | $ | 1,038.90 | | | $ | 1,020.21 | | | $ | 5.02 | | | $ | 4.98 | | | | 0.98 | % | |
Global Core Portfolio Class A | | | 1,000.00 | | | | 1,037.40 | | | | 1,018.35 | | | | 6.91 | | | | 6.85 | | | | 1.35 | | |
Global Core Portfolio Class C | | | 1,000.00 | | | | 1,033.00 | | | | 1,014.58 | | | | 10.73 | | | | 10.63 | | | | 2.10 | | |
Global Core Portfolio Class IS | | | 1,000.00 | | | | 1,039.00 | | | | 1,020.36 | | | | 4.87 | | | | 4.82 | | | | 0.95 | | |
* Expenses are calculated using each Portfolio Class' annualized net expense ratio (as disclosed), multiplied by the average account value over the period, and multiplied by 184/366 (to reflect the most recent one-half year period).
** Annualized.
3
Morgan Stanley Institutional Fund, Inc.
Annual Report — December 31, 2016
Investment Overview (unaudited)
Global Core Portfolio
The Portfolio seeks long-term capital appreciation.
Performance
For the period from inception on May 27, 2016 through December 31, 2016, the Portfolio's Class I shares had a total return based on net asset value and reinvestment of distributions per share of 1.08%, net of fees. The Portfolio's Class I shares underperformed the Portfolio's benchmark, the MSCI World Net Index (the "Index"), which returned 5.53% for the same period.
Factors Affecting Performance
• The reporting period proved to be a volatile time for the equity market, beginning with the spillover effects going into and following the Brexit vote, anticipation of the next Federal Reserve rate hike, and reactions to the U.S. presidential election campaign as well as its ultimate result. Within the U.S. region, earnings projections for 2016 were roughly flat compared to 2015, and since prior to the election, earnings growth expectations for 2017 were in the low double-digits. However, it was not until immediately following the election that the market began to price in better earnings projections for 2017. Positive economic data such as gross domestic product growth, wage growth, low unemployment, moderate inflation, and increased consumer confidence contributed to investor enthusiasm. The European region continued to experience spillover from uncertainty surrounding the Brexit vote at the end of June, meaningfully underperforming the U.S.(i) Emerging market stocks had underperformed other regions for over five years, but rallied in 2016.(ii)
• The greatest strength within the Index over the reporting period came from within the U.S. and specifically the cyclical sectors that had experienced an earnings recession going into 2016: financials, energy, and industrials. The worst performers were European stocks in relatively low volatility sectors such as telecommunication services, utilities and consumer staples.
• The Portfolio benefited during the period from its regional allocation, in particular an underweight to Europe. From a sector allocation standpoint, an overweight to European telecommunication services was the largest detractor, while an allocation to Asia
ex-Japan information technology stocks was the single biggest contributor.
• For stock selection, the largest detractor for the period was a British communications services company that was hurt by the Brexit vote. In addition, two U.S. stocks affiliated with the health care sector contributed to Portfolio underperformance. Within health care, the pharmaceuticals subsector had the greatest decline, as pricing concerns weighed on share prices since August.
• The Portfolio benefited from a position in a Taiwan-based global semiconductor manufacturer that sells its chips into major manufacturers of mobile devices and internet connectivity devices. Another top contributor to performance for the period was a global property, casualty and specialty insurance company that in December agreed to be acquired.
Management Strategies
• There have been no changes to our investment process during the period. Statistically, the majority of a portfolio's annual return can be explained by its common factor exposures (which we categorize as growth, value, quality, and risk). The tilting of these exposures is highly correlated to alpha generation (that is, a portfolio's excess return over a benchmark). Therefore, the team begins with a quantitative process to identify the common factors we believe are likely to prevail in each region of the world going forward. The rest of a portfolio's annual returns is explained by its company-specific results, meaning that stock selection is also a key determinant to alpha generation. We employ a bottom-up fundamental stock selection process in an effort to capture idiosyncratic returns. The result is a highly active portfolio of fundamentally attractive stocks which we believe could benefit from what we have identified to be quantitative investment styles likely to outperform in each region.
• As we move into 2017, the Portfolio is positioned with a modestly higher weighting in value stocks over growth stocks in the U.S. In that region, we remain underweight in historically low volatility, higher dividend yielding sectors that continue to
(i) Source: Factset
(ii) Source: Bloomberg
4
Morgan Stanley Institutional Fund, Inc.
Annual Report — December 31, 2016
Investment Overview (unaudited) (cont'd)
Global Core Portfolio
seem expensive relative to their historic valuations. We believe that the financial sector in particular could benefit in an environment of rising interest rates following a decade of being the worst-performing sector. Although the underweight to European stocks benefited the Portfolio during 2016, we are seeing indications that European value stocks are poised to do well going into 2017. Additionally, we continue to have some exposure to emerging markets, where we see selective opportunities offering inexpensive valuations, and we remain underweight Japan.

* Minimum Investment for Class I shares
** Commenced Operations on May 27, 2016.
In accordance with SEC regulations, the Portfolio's performance shown assumes that all recurring fees (including management fees) were deducted and all dividends and distributions were reinvested. The performance of Class A, C and IS shares will vary from the performance of Class I shares and will be impacted by additional fees assessed to those classes (if applicable).
Performance Compared to the MSCI World Net Index(1) and the Lipper Global Large-Cap Core Funds Index(2)
| | | Period Ended December 31, 2016
Total Returns(3) | |
| | | One
Year | | Five
Years | | Ten
Years | | Since
Inception(5) | |
Portfolio — Class I Shares w/o
sales charges(4) | | | — | | | | — | | | | — | | | | 1.08 | % | |
Portfolio — Class A Shares w/o
sales charges(4) | | | — | | | | — | | | | — | | | | 0.83 | | |
Portfolio — Class A Shares with
maximum 5.25% sales charges(4) | | | — | | | | — | | | | — | | | | –4.42 | | |
Portfolio — Class C Shares w/o
sales charges(4) | | | — | | | | — | | | | — | | | | 0.41 | | |
Portfolio — Class C Shares with
maximum 1.00% deferred
sales charges(4) | | | — | | | | — | | | | — | | | | –0.59 | | |
Portfolio — Class IS Shares w/o
sales charges(4) | | | — | | | | — | | | | — | | | | 1.10 | | |
MSCI World Net Index | | | — | | | | — | | | | — | | | | 5.53 | | |
Lipper Global Large-Cap Core
Funds Index | | | — | | | | — | | | | — | | | | 4.25 | | |
Performance data quoted represents past performance, which is no guarantee of future results, and current performance may be lower or higher than the figures shown. Performance assumes that all dividends and distributions, if any, were reinvested. For the most recent month-end performance figures, please visit www.morganstanley.com/im. Investment return and principal value will fluctuate so that Portfolio shares, when redeemed, may be worth more or less than their original cost. Total returns do not reflect the deduction of taxes that a shareholder would pay on Portfolio distributions or the redemption of Portfolio shares. Returns for periods less than one year are not annualized. Performance of share classes will vary due to difference in expenses.
(1) The MSCI World Net Index is a free float-adjusted market capitalization weighted index designed to measure the equity market performance of developed markets. The term "free float" represents the portion of shares outstanding that are deemed to be available for purchase in the public equity markets by investors. The MSCI World Net Index currently consists of 23 developed market country indices. The performance of the Index is listed in US dollars and assumes reinvestment of net dividends. The Index is unmanaged and its returns do not include any sales charges or fees. Such costs would lower performance. It is not possible to invest directly in an index.
(2) The Lipper Global Large-Cap Core Funds Index is an equally weighted performance index of the largest qualifying funds (based on net assets) in the Lipper Global Large-Cap Core Funds classification. The Index, which is adjusted for capital gains distributions and income dividends, is unmanaged and should not be considered an investment. There are 10 funds represented in this Index. As of the date of this report, the Portfolio is in the Lipper Global Large-Cap Core Funds classification.
(3) Total returns for the Portfolio reflect fees waived and expenses reimbursed, if applicable, by the Adviser. Without such waivers and reimbursements, total returns would have been lower.
(4) Commenced operations on May 27, 2016.
(5) For comparative purposes, average annual since inception returns listed for the Indexes refer to the inception date of the Portfolio, not the inception of the Index.
5
Morgan Stanley Institutional Fund, Inc.
Annual Report — December 31, 2016
Portfolio of Investments
Global Core Portfolio
| | | Shares | | Value
(000) | |
Common Stocks (98.7%) | |
Canada (2.5%) | |
Agnico-Eagle Mines Ltd. | | | 5,269 | | | $ | 221 | | |
China (3.3%) | |
Tencent Holdings Ltd. ADR | | | 11,813 | | | | 286 | | |
Ireland (3.8%) | |
Ryanair Holdings PLC ADR (a) | | | 4,011 | | | | 334 | | |
Japan (5.6%) | |
Nippon Telegraph & Telephone Corp. ADR | | | 9,257 | | | | 390 | | |
Toyota Motor Corp. ADR | | | 818 | | | | 96 | | |
| | | | 486 | | |
Netherlands (4.1%) | |
Priceline Group, Inc. (The) (a) | | | 240 | | | | 352 | | |
Switzerland (6.0%) | |
ABB Ltd. ADR (a) | | | 6,190 | | | | 131 | | |
UBS Group AG (Registered) (a) | | | 25,156 | | | | 394 | | |
| | | | 525 | | |
Taiwan (3.6%) | |
Taiwan Semiconductor Manufacturing Co., Ltd. ADR | | | 10,749 | | | | 309 | | |
United Kingdom (8.6%) | |
British American Tobacco PLC ADR | | | 1,284 | | | | 145 | | |
BT Group PLC ADR | | | 10,908 | | | | 251 | | |
Shire PLC ADR | | | 2,074 | | | | 353 | | |
| | | | 749 | | |
United States (61.2%) | |
AerCap Holdings N.V. (a) | | | 4,708 | | | | 196 | | |
Allergan PLC (a) | | | 1,605 | | | | 337 | | |
Allied World Assurance Co. Holdings AG | | | 4,875 | | | | 262 | | |
Alphabet, Inc., Class A (a) | | | 421 | | | | 334 | | |
Amgen, Inc. | | | 1,182 | | | | 173 | | |
AmTrust Financial Services, Inc. | | | 3,354 | | | | 92 | | |
Apple, Inc. | | | 3,201 | | | | 371 | | |
Broadcom Ltd. | | | 625 | | | | 110 | | |
Comcast Corp., Class A | | | 4,911 | | | | 339 | | |
CVS Health Corp. | | | 2,665 | | | | 210 | | |
Danaher Corp. | | | 2,719 | | | | 212 | | |
Emerson Electric Co. | | | 3,983 | | | | 222 | | |
Franklin Resources, Inc. | | | 8,782 | | | | 347 | | |
Illinois Tool Works, Inc. | | | 2,342 | | | | 287 | | |
Invesco Ltd. | | | 6,188 | | | | 188 | | |
JPMorgan Chase & Co. | | | 1,390 | | | | 120 | | |
Mastercard, Inc., Class A | | | 1,505 | | | | 155 | | |
National Oilwell Varco, Inc. | | | 5,255 | | | | 197 | | |
Newell Brands, Inc. | | | 5,454 | | | | 243 | | |
Northrop Grumman Corp. | | | 1,032 | | | | 240 | | |
QUALCOMM, Inc. | | | 3,840 | | | | 250 | | |
Schlumberger Ltd. | | | 3,391 | | | | 285 | | |
Verizon Communications, Inc. | | | 2,750 | | | | 147 | | |
| | | | 5,317 | | |
Total Common Stocks (Cost $8,443) | | | 8,579 | | |
| | | Shares | | Value
(000) | |
Short-Term Investment (0.7%) | |
Investment Company (0.7%) | |
Morgan Stanley Institutional Liquidity
Funds — Treasury Securities Portfolio —
Institutional Class (See Note G)
(Cost $61) | | | 61,232 | | | $ | 61 | | |
Total Investments (99.4%) (Cost $8,504) (b) | | | 8,640 | | |
Other Assets in Excess of Liabilities (0.6%) | | | 51 | | |
Net Assets (100.0%) | | $ | 8,691 | | |
Country assignments and aggregations are based generally on third party vendor classifications and information, and may be different from the assignments and aggregations under the policies set forth in the Portfolio's prospectus and/or statement of additional information relating to geographic classifications.
(a) Non-income producing security.
(b) At December 31, 2016, the aggregate cost for federal income tax purposes is approximately $8,543,000. The aggregate gross unrealized appreciation is approximately $410,000 and the aggregate gross unrealized depreciation is approximately $313,000, resulting in net unrealized appreciation of approximately $97,000.
ADR American Depositary Receipt.
Portfolio Composition
Classification | | Percentage of
Total Investments | |
Other* | | | 53.5 | % | |
Capital Markets | | | 10.8 | | |
Diversified Telecommunication Services | | | 9.1 | | |
Semiconductors & Semiconductor Equipment | | | 7.7 | | |
Internet Software & Services | | | 7.2 | | |
Biotechnology | | | 6.1 | | |
Energy Equipment & Services | | | 5.6 | | |
Total Investments | | | 100.0 | % | |
* Industries and/or investment types representing less than 5% of total investments.
The accompanying notes are an integral part of the financial statements.
6
Morgan Stanley Institutional Fund, Inc.
Annual Report — December 31, 2016
Statement of Assets and Liabilities | | December 31, 2016
(000) | |
Assets: | |
Investments in Securities of Unaffiliated Issuers, at Value (Cost $8,443) | | $ | 8,579 | | |
Investment in Security of Affiliated Issuer, at Value (Cost $61) | | | 61 | | |
Total Investments in Securities, at Value (Cost $8,504) | | | 8,640 | | |
Prepaid Offering Costs | | | 40 | | |
Due from Adviser | | | 33 | | |
Receivable for Portfolio Shares Sold | | | 19 | | |
Dividends Receivable | | | 10 | | |
Receivable from Affiliate | | | — | @ | |
Other Assets | | | 2 | | |
Total Assets | | | 8,744 | | |
Liabilities: | |
Payable for Professional Fees | | | 25 | | |
Payable for Offering Costs | | | 18 | | |
Payable for Custodian Fees | | | 2 | | |
Payable for Transfer Agency Fees — Class I | | | — | @ | |
Payable for Transfer Agency Fees — Class A | | | — | @ | |
Payable for Transfer Agency Fees — Class C | | | — | @ | |
Payable for Administration Fees | | | 1 | | |
Payable for Shareholder Services Fees — Class A | | | — | @ | |
Payable for Distribution and Shareholder Services Fees — Class C | | | 1 | | |
Other Liabilities | | | 6 | | |
Total Liabilities | | | 53 | | |
Net Assets | | $ | 8,691 | | |
Net Assets Consist Of: | |
Paid-in-Capital | | $ | 8,693 | | |
Distributions in Excess of Net Investment Income | | | (34 | ) | |
Accumulated Net Realized Loss | | | (104 | ) | |
Unrealized Appreciation (Depreciation) on: | |
Investments | | | 136 | | |
Net Assets | | $ | 8,691 | | |
CLASS I: | |
Net Assets | | $ | 6,517 | | |
| Shares Outstanding $0.001 par value shares of beneficial interest (unlimited shares authorized) (not in 000's) | | | 649,946 | | |
Net Asset Value, Offering and Redemption Price Per Share | | $ | 10.03 | | |
CLASS A: | |
Net Assets | | $ | 1,263 | | |
| Shares Outstanding $0.001 par value shares of beneficial interest (unlimited shares authorized) (not in 000's) | | | 126,044 | | |
Net Asset Value, Redemption Price Per Share | | $ | 10.02 | | |
Maximum Sales Load | | | 5.25 | % | |
Maximum Sales Charge | | $ | 0.56 | | |
Maximum Offering Price Per Share | | $ | 10.58 | | |
CLASS C: | |
Net Assets | | $ | 901 | | |
| Shares Outstanding $0.001 par value shares of beneficial interest (unlimited shares authorized) (not in 000's) | | | 90,121 | | |
Net Asset Value, Offering and Redemption Price Per Share | | $ | 10.00 | | |
CLASS IS: | |
Net Assets | | $ | 10 | | |
| Shares Outstanding $0.001 par value shares of beneficial interest (unlimited shares authorized) (not in 000's) | | | 1,000 | | |
Net Asset Value, Offering and Redemption Price Per Share | | $ | 10.03 | | |
@ Amount is less than $500.
The accompanying notes are an integral part of the financial statements.
7
Morgan Stanley Institutional Fund, Inc.
Annual Report — December 31, 2016
Statement of Operations | | Period from
May 27, 2016^ to
December 31, 2016
(000) | |
Investment Income: | |
Dividends from Securities of Unaffiliated Issuers (Net of $3 of Foreign Taxes Withheld) | | $ | 75 | | |
Dividends from Security of Affiliated Issuer (Note G) | | | — | @ | |
Total Investment Income | | | 75 | | |
Expenses: | |
Offering Costs | | | 57 | | |
Professional Fees | | | 53 | | |
Advisory Fees (Note B) | | | 32 | | |
Shareholder Reporting Fees | | | 7 | | |
Shareholder Services Fees — Class A (Note D) | | | 1 | | |
Distribution and Shareholder Services Fees — Class C (Note D) | | | 3 | | |
Transfer Agency Fees — Class I (Note E) | | | 1 | | |
Transfer Agency Fees — Class A (Note E) | | | 1 | | |
Transfer Agency Fees — Class C (Note E) | | | 1 | | |
Transfer Agency Fees — Class IS (Note E) | | | 1 | | |
Custodian Fees (Note F) | | | 4 | | |
Administration Fees (Note C) | | | 3 | | |
Pricing Fees | | | 1 | | |
Sub Transfer Agency Fees — Class A | | | — | @ | |
Sub Transfer Agency Fees — Class C | | | — | @ | |
Directors' Fees and Expenses | | | — | @ | |
Registration Fees | | | — | @ | |
Other Expenses | | | — | @ | |
Total Expenses | | | 165 | | |
Expenses Reimbursed by Adviser (Note B) | | | (84 | ) | |
Waiver of Advisory Fees (Note B) | | | (32 | ) | |
Reimbursement of Class Specific Expenses — Class A (Note B) | | | (— | @) | |
Reimbursement of Class Specific Expenses — Class C (Note B) | | | (1 | ) | |
Reimbursement of Class Specific Expenses — Class IS (Note B) | | | (1 | ) | |
Rebate from Morgan Stanley Affiliate (Note G) | | | (— | @) | |
Net Expenses | | | 47 | | |
Net Investment Income | | | 28 | | |
Realized Loss: | |
Investments Sold | | | (104 | ) | |
Change in Unrealized Appreciation (Depreciation): | |
Investments | | | 136 | | |
Net Realized Loss and Change in Unrealized Appreciation (Depreciation) | | | 32 | | |
Net Increase in Net Assets Resulting from Operations | | $ | 60 | | |
^ Commencement of Operations.
@ Amount is less than $500.
The accompanying notes are an integral part of the financial statements.
8
Morgan Stanley Institutional Fund, Inc.
Annual Report — December 31, 2016
Statement of Changes in Net Assets | | Period from
May 27, 2016^ to
December 31, 2016
(000) | |
Increase (Decrease) in Net Assets: | |
Operations: | |
Net Investment Income | | $ | 28 | | |
Net Realized Loss | | | (104 | ) | |
Net Change in Unrealized Appreciation (Depreciation) | | | 136 | | |
Net Increase in Net Assets Resulting from Operations | | | 60 | | |
Distributions from and/or in Excess of: | |
Class I: | |
Net Investment Income | | | (50 | ) | |
Class A: | |
Net Investment Income | | | (8 | ) | |
Class C: | |
Net Investment Income | | | (4 | ) | |
Class IS: | |
Net Investment Income | | | (— | @) | |
Total Distributions | | | (62 | ) | |
Capital Share Transactions:(1) | |
Class I: | |
Subscribed | | | 6,525 | | |
Distributions Reinvested | | | 11 | | |
Redeemed | | | (31 | ) | |
Class A: | |
Subscribed | | | 1,365 | | |
Distributions Reinvested | | | 8 | | |
Redeemed | | | (102 | ) | |
Class C: | |
Subscribed | | | 904 | | |
Distributions Reinvested | | | 4 | | |
Redeemed | | | (1 | ) | |
Class IS: | |
Subscribed | | | 10 | | |
Net Increase in Net Assets Resulting from Capital Share Transactions | | | 8,693 | | |
Total Increase in Net Assets | | | 8,691 | | |
Net Assets: | |
Beginning of Period | | | — | | |
End of Period (Including Distributions in Excess of Net Investment Income $(34)) | | $ | 8,691 | | |
(1) Capital Share Transactions: | |
Class I: | |
Shares Subscribed | | | 652 | | |
Shares Issued on Distributions Reinvested | | | 1 | | |
Shares Redeemed | | | (3 | ) | |
Net Increase in Class I Shares Outstanding | | | 650 | | |
Class A: | |
Shares Subscribed | | | 135 | | |
Shares Issued on Distributions Reinvested | | | 1 | | |
Shares Redeemed | | | (10 | ) | |
Net Increase in Class A Shares Outstanding | | | 126 | | |
Class C: | |
Shares Subscribed | | | 90 | | |
Shares Issued on Distributions Reinvested | | | — | @@ | |
Shares Redeemed | | | (— | @@) | |
Net Increase in Class C Shares Outstanding | | | 90 | | |
Class IS: | |
Shares Subscribed | | | 1 | | |
^ Commencement of Operations.
@ Amount is less than $500.
@@ Amount is less than 500 shares.
The accompanying notes are an integral part of the financial statements.
9
Morgan Stanley Institutional Fund, Inc.
Annual Report — December 31, 2016
Financial Highlights
Global Core Portfolio
| | | Class I | |
Selected Per Share Data and Ratios | | Period from
May 27, 2016(1)
to December 31, 2016 | |
Net Asset Value, Beginning of Period | | $ | 10.00 | | |
Income from Investment Operations: | |
Net Investment Income (2) | | | 0.05 | | |
Net Realized and Unrealized Gain | | | 0.06 | | |
Total from Investment Operations | | | 0.11 | | |
Distributions from and/or in Excess of: | |
Net Investment Income | | | (0.08 | ) | |
Net Asset Value, End of Period | | $ | 10.03 | | |
Total Return (3) | | | 1.08 | %(5) | |
Ratios and Supplemental Data: | |
Net Assets, End of Period (Thousands) | | $ | 6,517 | | |
Ratio of Expenses to Average Net Assets (7) | | | 0.98 | %(4)(6) | |
Ratio of Net Investment Income to Average Net Assets (7) | | | 0.82 | %(4)(6) | |
Ratio of Rebate from Morgan Stanley Affiliates to Average Net Assets | | | 0.01 | %(6) | |
Portfolio Turnover Rate | | | 22 | %(5) | |
(7) Supplemental Information on the Ratios to Average Net Assets: | |
Ratios Before Expense Limitation: | |
Expenses to Average Net Assets | | | 3.73 | %(6) | |
Net Investment Loss to Average Net Assets | | | (1.93 | )%(6) | |
(1) Commencement of Operations.
(2) Per share amount is based on average shares outstanding.
(3) Calculated based on the net asset value as of the last business day of the period.
(4) The Ratios of Expenses and Net Investment Income reflect the rebate of certain Portfolio expenses in connection with the investments in Morgan Stanley affiliates during the period. The effect of the rebate on the ratios is disclosed in the above table as "Ratio of Rebate from Morgan Stanley Affiliates to Average Net Assets."
(5) Not Annualized.
(6) Annualized.
The accompanying notes are an integral part of the financial statements.
10
Morgan Stanley Institutional Fund, Inc.
Annual Report — December 31, 2016
Financial Highlights
Global Core Portfolio
| | | Class A | |
Selected Per Share Data and Ratios | | Period from
May 27, 2016(1)
to December 31, 2016 | |
Net Asset Value, Beginning of Period | | $ | 10.00 | | |
Income from Investment Operations: | |
Net Investment Income (2) | | | 0.02 | | |
Net Realized and Unrealized Gain | | | 0.06 | | |
Total from Investment Operations | | | 0.08 | | |
Distributions from and/or in Excess of: | |
Net Investment Income | | | (0.06 | ) | |
Net Asset Value, End of Period | | $ | 10.02 | | |
Total Return (3) | | | 0.83 | %(6) | |
Ratios and Supplemental Data: | |
Net Assets, End of Period (Thousands) | | $ | 1,263 | | |
Ratio of Expenses to Average Net Assets (8) | | | 1.35 | %(4)(7) | |
Ratio of Net Investment Income to Average Net Assets (8) | | | 0.39 | %(4)(7) | |
Ratio of Rebate from Morgan Stanley Affiliates to Average Net Assets | | | 0.00 | %(5)(7) | |
Portfolio Turnover Rate | | | 22 | %(6) | |
(8) Supplemental Information on the Ratios to Average Net Assets: | |
Ratios Before Expense Limitation: | |
Expenses to Average Net Assets | | | 4.16 | %(7) | |
Net Investment Loss to Average Net Assets | | | (2.42 | )%(7) | |
(1) Commencement of Operations.
(2) Per share amount is based on average shares outstanding.
(3) Calculated based on the net asset value, which does not reflect sales charges, if applicable, as of the last business day of the period.
(4) The Ratios of Expenses and Net Investment Income reflect the rebate of certain Portfolio expenses in connection with the investments in Morgan Stanley affiliates during the period. The effect of the rebate on the ratios is disclosed in the above table as "Ratio of Rebate from Morgan Stanley Affiliates to Average Net Assets."
(5) Amount is less than 0.005%.
(6) Not Annualized.
(7) Annualized.
The accompanying notes are an integral part of the financial statements.
11
Morgan Stanley Institutional Fund, Inc.
Annual Report — December 31, 2016
Financial Highlights
Global Core Portfolio
| | | Class C | |
Selected Per Share Data and Ratios | | Period from
May 27, 2016(1)
to December 31, 2016 | |
Net Asset Value, Beginning of Period | | $ | 10.00 | | |
Income (Loss) from Investment Operations: | |
Net Investment Loss (2) | | | (0.02 | ) | |
Net Realized and Unrealized Gain | | | 0.06 | | |
Total from Investment Operations | | | 0.04 | | |
Distributions from and/or in Excess of: | |
Net Investment Income | | | (0.04 | ) | |
Net Asset Value, End of Period | | $ | 10.00 | | |
Total Return (3) | | | 0.41 | %(6) | |
Ratios and Supplemental Data: | |
Net Assets, End of Period (Thousands) | | $ | 901 | | |
Ratio of Expenses to Average Net Assets (8) | | | 2.10 | %(4)(7) | |
Ratio of Net Investment Loss to Average Net Assets (8) | | | (0.36 | )%(4)(7) | |
Ratio of Rebate from Morgan Stanley Affiliates to Average Net Assets | | | 0.00 | %(5)(7) | |
Portfolio Turnover Rate | | | 22 | %(6) | |
(8) Supplemental Information on the Ratios to Average Net Assets: | |
Ratios Before Expense Limitation: | |
Expense to Average Net Assets | | | 5.02 | %(7) | |
Net Investment Loss to Average Net Assets | | | (3.28 | )%(7) | |
(1) Commencement of Operations.
(2) Per share amount is based on average shares outstanding.
(3) Calculated based on the net asset value which does not reflect sales charges, if applicable, as of the last business day of the period.
(4) The Ratios of Expenses and Net Investment Loss reflect the rebate of certain Portfolio expenses in connection with the investments in Morgan Stanley affiliates during the period. The effect of the rebate on the ratios is disclosed in the above table as "Ratio of Rebate from Morgan Stanley Affiliates to Average Net Assets."
(5) Amount is less than 0.005%.
(6) Not Annualized.
(7) Annualized.
The accompanying notes are an integral part of the financial statements.
12
Morgan Stanley Institutional Fund, Inc.
Annual Report — December 31, 2016
Financial Highlights
Global Core Portfolio
| | | Class IS | |
Selected Per Share Data and Ratios | | Period from
May 27, 2016(1)
to December 31, 2016 | |
Net Asset Value, Beginning of Period | | $ | 10.00 | | |
Income from Investment Operations: | |
Net Investment Income (2) | | | 0.05 | | |
Net Realized and Unrealized Gain | | | 0.06 | | |
Total from Investment Operations | | | 0.11 | | |
Distributions from and/or in Excess of: | |
Net Investment Income | | | (0.08 | ) | |
Net Asset Value, End of Period | | $ | 10.03 | | |
Total Return (3) | | | 1.10 | %(6) | |
Ratios and Supplemental Data: | |
Net Assets, End of Period (Thousands) | | $ | 10 | | |
Ratio of Expenses to Average Net Assets (8) | | | 0.95 | %(4)(7) | |
Ratio of Net Investment Income to Average Net Assets (8) | | | 0.84 | %(4)(7) | |
Ratio of Rebate from Morgan Stanley Affiliates to Average Net Assets | | | 0.00 | %(5)(7) | |
Portfolio Turnover Rate | | | 22 | %(6) | |
(8) Supplemental Information on the Ratios to Average Net Assets: | |
Ratios Before Expense Limitation: | |
Expenses to Average Net Assets | | | 19.70 | %(7) | |
Net Investment Loss to Average Net Assets | | | (17.91 | )%(7) | |
(1) Commencement of Operations.
(2) Per share amount is based on average shares outstanding.
(3) Calculated based on the net asset value as of the last business day of the period.
(4) The Ratios of Expenses and Net Investment Income reflect the rebate of certain Portfolio expenses in connection with the investments in Morgan Stanley affiliates during the period. The effect of the rebate on the ratios is disclosed in the above table as "Ratio of Rebate from Morgan Stanley Affiliates to Average Net Assets."
(5) Amount is less than 0.005%.
(6) Not Annualized.
(7) Annualized.
The accompanying notes are an integral part of the financial statements.
13
Morgan Stanley Institutional Fund, Inc.
Annual Report — December 31, 2016
Notes to Financial Statements
Morgan Stanley Institutional Fund, Inc. (the "Fund") is registered under the Investment Company Act of 1940, as amended (the "Act"), as an open-end management investment company. The Fund is comprised of twenty-nine separate, active, diversified and non-diversified portfolios (individually referred to as a "Portfolio," collectively as the "Portfolios"). The Fund applies investment company accounting and reporting guidance.
The accompanying financial statements relate to the Global Core Portfolio. The Portfolio seeks long-term capital appreciation.
The Portfolio commenced operations on May 27, 2016, and offers four classes of shares — Class I, Class A, Class C and Class IS.
A. Significant Accounting Policies: The following significant accounting policies are in conformity with U.S. generally accepted accounting principles ("GAAP"). Such policies are consistently followed by the Fund in the preparation of its financial statements. GAAP may require management to make estimates and assumptions that affect the reported amounts and disclosures in the financial statements. Actual results may differ from those estimates.
1. Security Valuation: (1) An equity portfolio security listed or traded on an exchange is valued at its latest reported sales price (or at the exchange official closing price if such exchange reports an official closing price), and if there were no sales on a given day and if there is no official exchange closing price for that day, the security is valued at the mean between the last reported bid and asked prices if such bid and asked prices are available on the relevant exchanges; (2) all other equity portfolio securities for which over-the-counter ("OTC") market quotations are readily available are valued at the latest reported sales price (or at the market official closing price if such market reports an official closing price), and if there was no trading in the security on a given day and if there is no official closing price from relevant markets for that day, the security is valued at the mean between the last reported bid and asked prices if such bid and asked prices are available on the relevant markets. Listed equity securities not traded on the valuation date with no reported bid and asked prices available on the exchange are valued at the mean between the current bid and asked prices obtained from one or more reputable brokers or dealers. An unlisted equity security that does not trade on the valuation date and for which
bid and asked prices from the relevant markets are unavailable is valued at the mean between the current bid and asked prices obtained from one or more reputable brokers or dealers. In cases where a security is traded on more than one exchange, the security is valued on the exchange designated as the primary market; (3) certain portfolio securities may be valued by an outside pricing service/vendor approved by the Fund's Board of Directors (the "Directors"). The pricing service/vendor may employ a pricing model that takes into account, among other things, bids, yield spreads, and/or other market data and specific security characteristics. Alternatively, if a valuation is not available from an outside pricing service/vendor, and the security trades on an exchange, the security may be valued at its latest reported sale price (or at the exchange official closing price if such exchange reports an official closing price), prior to the time when assets are valued. If there are no sales on a given day and if there is no official exchange closing price for that day, the security is valued at the mean between the last reported bid and asked prices if such bid and asked prices are available in the relevant exchanges; (4) when market quotations are not readily available, including circumstances under which Morgan Stanley Investment Management Inc. (the "Adviser") determines that the closing price, last sale price or the mean between the last reported bid and asked prices are not reflective of a security's market value, portfolio securities are valued at their fair value as determined in good faith under procedures established by and under the general supervision of the Directors. Occasionally, developments affecting the closing prices of securities and other assets may occur between the times at which valuations of such securities are determined (that is, close of the foreign market on which the securities trade) and the close of business of the New York Stock Exchange ("NYSE"). If developments occur during such periods that are expected to materially affect the value of such securities, such valuations may be adjusted to reflect the estimated fair value of such securities as of the close of the NYSE, as determined in good faith by the Directors or by the Adviser using a pricing service and/or procedures approved by the Directors; and (5) investments in mutual funds, including the Morgan Stanley Institutional Liquidity Funds, are valued at the net asset value ("NAV") as of the close of each business day.
The Directors have responsibility for determining in good faith the fair value of the investments, and the
14
Morgan Stanley Institutional Fund, Inc.
Annual Report — December 31, 2016
Notes to Financial Statements (cont'd)
Directors may appoint others, such as the Fund's Adviser or a valuation committee, to assist the Directors in determining fair value and to make the actual calculations pursuant to the fair valuation methodologies previously approved by the Directors. Under procedures approved by the Directors, the Fund's Adviser has formed a Valuation Committee whose members are approved by the Directors. The Valuation Committee provides administration and oversight of the Fund's valuation policies and procedures, which are reviewed at least annually by the Directors. These procedures allow the Fund to utilize independent pricing services, quotations from securities and financial instrument dealers, and other market sources to determine fair value.
The Fund has procedures to determine the fair value of securities and other financial instruments for which market prices are not readily available. Under these procedures, the Valuation Committee convenes on a regular and ad hoc basis to review such securities and considers a number of factors, including valuation methodologies and significant unobservable valuation inputs, when arriving at fair value. The Valuation Committee may employ a market-based approach which may use related or comparable assets or liabilities, recent transactions, market multiples, book values, and other relevant information for the investment to determine the fair value of the investment. An income-based valuation approach may also be used in which the anticipated future cash flows of the investment are discounted to calculate fair value. Discounts may also be applied due to the nature or duration of any restrictions on the disposition of the investments. Due to the inherent uncertainty of valuations of such investments, the fair values may differ significantly from the values that would have been used had an active market existed. The Valuation Committee employs various methods for calibrating these valuation approaches including a regular review of valuation methodologies, key inputs and assumptions, transactional back-testing or disposition analysis, and reviews of any related market activity.
2. Fair Value Measurement: Financial Accounting Standards Board ("FASB") Accounting Standards CodificationTM ("ASC") 820, "Fair Value Measurement" ("ASC 820"), defines fair value as the value that the Fund
would receive to sell an investment or pay to transfer a liability in a timely transaction with an independent buyer in the principal market, or in the absence of a principal market, the most advantageous market for the investment or liability. ASC 820 establishes a three-tier hierarchy to distinguish between (1) inputs that reflect the assumptions market participants would use in valuing an asset or liability developed based on market data obtained from sources independent of the reporting entity (observable inputs) and (2) inputs that reflect the reporting entity's own assumptions about the assumptions market participants would use in valuing an asset or liability developed based on the best information available in the circumstances (unobservable inputs) and to establish classification of fair value measurements for disclosure purposes. Various inputs are used in determining the value of the Fund's investments. The inputs are summarized in the three broad levels listed below.
• Level 1 – unadjusted quoted prices in active markets for identical investments
• Level 2 – other significant observable inputs (including quoted prices for similar investments, interest rates, prepayment speeds, credit risk, etc.)
• Level 3 – significant unobservable inputs including the Fund's own assumptions in determining the fair value of investments. Factors considered in making this determination may include, but are not limited to, information obtained by contacting the issuer, analysts, or the appropriate stock exchange (for exchange-traded securities), analysis of the issuer's financial statements or other available documents and, if necessary, available information concerning other securities in similar circumstances
The inputs or methodology used for valuing securities are not necessarily an indication of the risk associated with investing in those securities and the determination of the significance of a particular input to the fair value measurement in its entirety requires judgment and considers factors specific to each security.
15
Morgan Stanley Institutional Fund, Inc.
Annual Report — December 31, 2016
Notes to Financial Statements (cont'd)
The following is a summary of the inputs used to value the Portfolio's investments as of December 31, 2016.
Investment Type | | Level 1
Unadjusted
quoted
prices
(000) | | Level 2
Other
significant
observable
inputs
(000) | | Level 3
Significant
unobservable
inputs
(000) | | Total
(000) | |
Assets: | |
Common Stocks | |
Aerospace & Defense | | $ | 240 | | | $ | — | | | $ | — | | | $ | 240 | | |
Airlines | | | 334 | | | | — | | | | — | | | | 334 | | |
Automobiles | | | 96 | | | | — | | | | — | | | | 96 | | |
Banks | | | 120 | | | | — | | | | — | | | | 120 | | |
Biotechnology | | | 526 | | | | — | | | | — | | | | 526 | | |
Capital Markets | | | 929 | | | | — | | | | — | | | | 929 | | |
Diversified
Telecommunication
Services | | | 788 | | | | — | | | | — | | | | 788 | | |
Electrical Equipment | | | 353 | | | | — | | | | — | | | | 353 | | |
Energy Equipment &
Services | | | 482 | | | | — | | | | — | | | | 482 | | |
Food & Staples Retailing | | | 210 | | | | — | | | | — | | | | 210 | | |
Health Care
Equipment &
Supplies | | | 212 | | | | — | | | | — | | | | 212 | | |
Household Durables | | | 243 | | | | — | | | | — | | | | 243 | | |
Information Technology
Services | | | 155 | | | | — | | | | — | | | | 155 | | |
Insurance | | | 354 | | | | — | | | | — | | | | 354 | | |
Internet & Direct
Marketing Retail | | | 352 | | | | — | | | | — | | | | 352 | | |
Internet Software &
Services | | | 620 | | | | — | | | | — | | | | 620 | | |
Machinery | | | 287 | | | | — | | | | — | | | | 287 | | |
Media | | | 339 | | | | — | | | | — | | | | 339 | | |
Metals & Mining | | | 221 | | | | — | | | | — | | | | 221 | | |
Pharmaceuticals | | | 337 | | | | — | | | | — | | | | 337 | | |
Semiconductors &
Semiconductor
Equipment | | | 669 | | | | — | | | | — | | | | 669 | | |
Tech Hardware,
Storage & Peripherals | | | 371 | | | | — | | | | — | | | | 371 | | |
Tobacco | | | 145 | | | | — | | | | — | | | | 145 | | |
Trading Companies &
Distributors | | | 196 | | | | — | | | | — | | | | 196 | | |
Total Common Stocks | | | 8,579 | | | | — | | | | — | | | | 8,579 | | |
Short-Term Investment | |
Investment Company | | | 61 | | | | — | | | | — | | | | 61 | | |
Total Assets | | $ | 8,640 | | | $ | — | | | $ | — | | | $ | 8,640 | | |
Transfers between investment levels may occur as the markets fluctuate and/or the availability of data used in an investment's valuation changes. The Portfolio recognizes transfers between the levels as of the end of the period.
3. Indemnifications: The Fund enters into contracts that contain a variety of indemnifications. The Fund's maximum exposure under these arrangements is unknown. However, the Fund has not had prior claims or losses
pursuant to these contracts and expects the risk of loss to be remote.
4. Dividends and Distributions to Shareholders: Dividend income and distributions to shareholders are recorded on the ex-dividend date. Dividends from net investment income, if any, are declared and paid annually. Net realized capital gains, if any, are distributed at least annually.
5. Security Transactions, Income and Expenses: Security transactions are accounted for on the trade date (date the order to buy or sell is executed). Realized gains and losses on the sale of investment securities are determined on the specific identified cost method. Dividend income and other distributions are recorded on the ex-dividend date (except for certain foreign dividends which may be recorded as soon as the Portfolio is informed of such dividends) net of applicable withholding taxes. Interest income is recognized on the accrual basis except where collection is in doubt. Discounts are accreted and premiums are amortized over the life of the respective securities. Most expenses of the Fund can be directly attributed to a particular Portfolio. Expenses which cannot be directly attributed are apportioned among the Portfolios based upon relative net assets or other appropriate methods. Income, expenses (other than class specific expenses — distribution and shareholder services, transfer agency and sub transfer agency fees) and realized and unrealized gains or losses are allocated to each class of shares based upon their relative net assets.
B. Advisory Fees: The Adviser, a wholly-owned subsidiary of Morgan Stanley, provides the Portfolio with advisory services under the terms of an Investment Advisory Agreement, paid quarterly, at the annual rate based on the daily net assets as follows:
First $750
million | | Next $750
million | | Over $1.5
billion | |
| | 0.75 | % | | | 0.70 | % | | | 0.65 | % | |
For the period ended December 31, 2016, the advisory fee rate (net of waivers/rebate) was equivalent to an annual effective rate of 0.00% of the Portfolio's average daily net assets.
The Adviser has agreed to reduce its advisory fee and/or reimburse the Portfolio so that total annual portfolio operating expenses, excluding certain investment related expenses, taxes, interest and other extraordinary expenses (including litigation), will not exceed 1.00% for Class I shares, 1.35% for Class A shares, 2.10% for Class C shares and 0.95% for Class IS
16
Morgan Stanley Institutional Fund, Inc.
Annual Report — December 31, 2016
Notes to Financial Statements (cont'd)
shares. The fee waivers and/or expense reimbursements will continue for at least one year from the date of the Portfolio's prospectus or until such time as the Directors act to discontinue all or a portion of such waivers and/or reimbursements when they deem such action is appropriate. For the period ended December 31, 2016, approximately $32,000 of advisory fees were waived and approximately $86,000 of other expenses were reimbursed by the Adviser pursuant to this arrangement.
C. Administration Fees: The Adviser also serves as Administrator to the Fund and provides administrative services pursuant to an Administration Agreement for an annual fee, accrued daily and paid monthly, of 0.08% of the Portfolio's average daily net assets.
Under a Sub-Administration Agreement between the Administrator and State Street Bank and Trust Company ("State Street"), State Street provides certain administrative services to the Fund. For such services, the Administrator pays State Street a portion of the fee the Administrator receives from the Portfolio.
D. Distribution and Shareholder Services Fees: Morgan Stanley Distribution, Inc. ("MSDI" or the "Distributor"), a wholly-owned subsidiary of the Adviser and an indirect subsidiary of Morgan Stanley, serves as the Fund's Distributor of Portfolio shares pursuant to a Distribution Agreement. The Fund has adopted a Shareholder Services Plan with respect to Class A shares pursuant to Rule 12b-1 under the Act. Under the Shareholder Services Plan, the Portfolio pays the Distributor a shareholder services fee, accrued daily and paid monthly, at an annual rate of 0.25% of the Portfolio's average daily net assets attributable to Class A shares.
The Fund has adopted a Distribution and Shareholder Services Plan with respect to Class C shares pursuant to Rule 12b-1 under the Act. Under the Distribution and Shareholder Services Plan, the Portfolio pays the Distributor a distribution fee, accrued daily and paid monthly, at an annual rate of 0.75% and a shareholder services fee, accrued daily and paid monthly, at an annual rate of 0.25% of the Portfolio's average daily net assets attributable to Class C shares.
The distribution and shareholder services fees are used to support the expenses associated with servicing and maintaining accounts. The Distributor may compensate other parties for providing shareholder support services to investors who purchase Class A and Class C shares.
E. Dividend Disbursing and Transfer Agent: The Fund's dividend disbursing and transfer agent is Boston Financial Data Services, Inc. ("BFDS"). Pursuant to a Transfer Agency Agreement, the Fund pays BFDS a fee based on the number of classes, accounts and transactions relating to the Portfolios of the Fund.
F. Custodian Fees: State Street (the "Custodian") serves as Custodian for the Fund in accordance with a Custodian Agreement. The Custodian holds cash, securities, and other assets of the Fund as required by the Act. Custody fees are payable monthly based on assets held in custody, investment purchases and sales activity and account maintenance fees, plus reimbursement for certain out-of-pocket expenses.
G. Security Transactions and Transactions with Affiliates: For the period ended December 31, 2016, purchases and sales of investment securities for the Portfolio, other than long-term U.S. Government securities and short-term investments, were approximately $10,101,000 and $1,554,000, respectively. There were no purchases and sales of long-term U.S. Government securities for the period ended December 31, 2016.
The Portfolio invests in the Institutional Class of the Morgan Stanley Institutional Liquidity Funds — Treasury Securities Portfolio (the "Liquidity Funds"), an open-end management investment company managed by the Adviser. Advisory fees paid by the Portfolio are reduced by an amount equal to its pro-rata share of the advisory and administration fees paid by the Portfolio due to its investment in the Liquidity Funds. For the period ended December 31, 2016, advisory fees paid were reduced by less than $500 relating to the Portfolio's investment in the Liquidity Funds.
A summary of the Portfolio's transactions in shares of the Liquidity Funds during the period ended December 31, 2016 is as follows:
Purchases
at Cost
(000) | | Sales
(000) | | Dividend
Income
(000) | | Value
December 31,
2016
(000) | |
| $ | 7,917 | | | $ | 7,856 | | | $ | — | @ | | $ | 61 | | |
@ Amount is less than $500.
The Portfolio is permitted to purchase and sell securities ("cross-trade") from and to other Morgan Stanley Funds as well as other funds and client accounts for which the Adviser or an affiliate of the Adviser serves as investment adviser, pursuant to procedures approved by the Directors in compliance with
17
Morgan Stanley Institutional Fund, Inc.
Annual Report — December 31, 2016
Notes to Financial Statements (cont'd)
Rule 17a-7 under the Act (the "Rule"). Each cross-trade is executed at the current market price in compliance with provisions of the Rule. For the period ended December 31, 2016, the Portfolio did not engage in any cross-trade transactions.
The Portfolio has an unfunded Deferred Compensation Plan (the "Compensation Plan"), which allows each independent Director to defer payment of all, or a portion, of the fees he or she receives for serving on the Board of Directors. Each eligible Director generally may elect to have the deferred amounts credited with a return equal to the total return on one or more of the Morgan Stanley funds that are offered as investment options under the Compensation Plan. Appreciation/depreciation and distributions received from these investments are recorded with an offsetting increase/decrease in the deferred compensation obligation and do not affect the NAV of the Portfolio.
H. Federal Income Taxes: It is the Portfolio's intention to continue to qualify as a regulated investment company and distribute all of its taxable and tax-exempt income. Accordingly, no provision for federal income taxes is required in the financial statements.
The Portfolio may be subject to taxes imposed by countries in which it invests. Such taxes are generally based on income and/or capital gains earned or repatriated. Taxes are accrued based on net investment income, net realized gains and net unrealized appreciation as such income and/or gains are earned. Taxes may also be based on transactions in foreign currency and are accrued based on the value of investments denominated in such currency.
FASB ASC 740-10, "Income Taxes — Overall", sets forth a minimum threshold for financial statement recognition of the benefit of a tax position taken or expected to be taken in a tax return. Management has concluded there are no significant uncertain tax positions that would require recognition in the financial statements. If applicable, the Portfolio recognizes interest accrued related to unrecognized tax benefits in "Interest Expense" and penalties in "Other Expenses" in the Statement of Operations. The Portfolio files tax returns with the U.S. Internal Revenue Service, New York and various states. The tax period ended December 31, 2016, remains subject to examination by taxing authorities.
The tax character of distributions paid may differ from the character of distributions shown in the Statement of Changes in Net Assets due to short-term capital gains being treated as
ordinary income for tax purposes. The tax character of distributions paid during fiscal year 2016 was as follows:
| 2016 Distributions Paid From: | |
Ordinary
Income
(000) | |
| $ | 62 | | |
The amount and character of income and gains to be distributed are determined in accordance with income tax regulations which may differ from GAAP. These book/tax differences are either considered temporary or permanent in nature.
Temporary differences are primarily due to differing book and tax treatments for the timing of the recognition of gains (losses) on certain investment transactions and the timing of the deductibility of certain expenses.
At December 31, 2016, the components of distributable earnings for the Portfolio on a tax basis were as follows:
Undistributed
Ordinary
Income
(000) | | Undistributed
Long-Term
Capital Gain
(000) | |
| $ | 12 | | | $ | — | | |
At December 31, 2016, the Portfolio had available for federal income tax purposes unused short-term capital losses of approximately $65,000 that do not have an expiration date.
To the extent that capital loss carryforwards are used to offset any future capital gains realized during the carryover period as provided by U.S. federal income tax regulations, no capital gains tax liability will be incurred by the Portfolio for gains realized and not distributed. To the extent that capital gains are offset, such gains will not be distributed to the shareholders.
I. Other: At December 31, 2016, the Portfolio had record owners of 10% or greater. Investment activities of these shareholders could have a material impact on the Portfolio. The aggregate percentage of such owners was 42.1%.
J. Accounting Pronouncements: In December 2016, FASB issued Accounting Standards update 2016-19 — Technical Corrections and Improvements ("ASU 2016-19"), which is effective for interim periods for all entities beginning after December 15, 2016. ASU 2016-19 includes an amendment to Topic 820, Fair Value Measurement, which clarifies the difference between a valuation approach and a valuation technique when applying the guidance in that Topic. That amendment also requires an entity to disclose when there has been a change
18
Morgan Stanley Institutional Fund, Inc.
Annual Report — December 31, 2016
Notes to Financial Statements (cont'd)
in either or both a valuation approach and/or a valuation technique. The transition guidance for the amendment must be applied prospectively because it could potentially involve the use of hindsight that includes fair value measurements. Although still evaluating the potential impacts of ASU 2016-19 to the Portfolio, management expects that the impact of the Portfolio's adoption will be limited to additional financial statement disclosures.
In October 2016, the Securities and Exchange Commission ("SEC") issued a new rule, Investment Company Reporting Modernization, which, among other provisions, amends Regulation S-X to require standardized, enhanced disclosures, particularly related to derivatives, in investment company financial statements. Compliance with the guidance is effective for financial statements filed with the SEC on or after August 1, 2017; adoption will have no effect on the Portfolio's net assets or results of operations. Although still evaluating the potential impacts of the Investment Company Reporting Modernization to the Portfolio, management expects that the impact of the Portfolio's adoption will be limited to additional financial statement disclosures.
19
Morgan Stanley Institutional Fund, Inc.
Annual Report — December 31, 2016
Report of Independent Registered Public Accounting Firm
To the Shareholders and Board of Directors of
Morgan Stanley Institutional Fund, Inc. —
Global Core Portfolio
We have audited the accompanying statement of assets and liabilities, including the portfolio of investments, of Global Core Portfolio (one of the portfolios constituting Morgan Stanley Institutional Fund, Inc.) (the "Portfolio") as of December 31, 2016, and the related statements of operations and changes in net assets and the financial highlights for the period from May 27, 2016 (commencement of operations) to December 31, 2016. These financial statements and financial highlights are the responsibility of the Portfolio's management. Our responsibility is to express an opinion on these financial statements and financial highlights based on our audit.
We conducted our audit in accordance with the standards of the Public Company Accounting Oversight Board (United States). Those standards require that we plan and perform the audit to obtain reasonable assurance about whether the financial statements and financial highlights are free of material misstatement. We were not engaged to perform an audit of the Portfolio's internal control over financial reporting. Our audit included consideration of internal control over financial reporting as a basis for designing audit procedures that are appropriate in the circumstances, but not for the purpose of expressing an opinion on the effectiveness of the Portfolio's internal control over financial reporting. Accordingly, we express no such opinion. An audit also includes examining, on a test basis, evidence supporting the amounts and disclosures in the financial statements and financial highlights, assessing the accounting principles used and significant estimates made by management, and evaluating the overall financial statement presentation. Our procedures included confirmation of securities owned as of December 31, 2016, by correspondence with the custodian and others or by other appropriate auditing procedures where replies from others were not received. We believe that our audit provides a reasonable basis for our opinion.
In our opinion, the financial statements and financial highlights referred to above present fairly, in all material respects, the financial position of Global Core Portfolio (one of the portfolios constituting Morgan Stanley Institutional Fund, Inc.) at December 31, 2016, the results of its operations, the changes in its net assets and the financial highlights for the period from May 27, 2016 (commencement of operations) to December 31, 2016, in conformity with U.S. generally accepted accounting principles.

Boston, Massachusetts
February 28, 2017
20
Morgan Stanley Institutional Fund, Inc.
Annual Report — December 31, 2016
Federal Tax Notice (unaudited)
For federal income tax purposes, the following information is furnished with respect to the distributions paid by the Portfolio during its taxable year ended December 31, 2016. For corporate shareholders 46.81% of the dividends qualified for the dividends received deduction.
For federal income tax purposes, the following information is furnished with respect to the Portfolio's earnings for its taxable year ended December 31, 2016. When distributed, certain earnings may be subject to a maximum tax rate of 15% as provided for by the Jobs and Growth Tax Relief Reconciliation Act of 2003. The Portfolio designated up to a maximum of approximately $62,000 as taxable at this lower rate.
In January, the Portfolio provides tax information to shareholders for the preceding calendar year.
21
Morgan Stanley Institutional Fund, Inc.
Annual Report — December 31, 2016
Privacy Notice (unaudited)
MORGAN STANLEY INVESTMENT MANAGEMENT INC.
AN IMPORTANT NOTICE CONCERNING OUR U.S. PRIVACY POLICY
We are required by federal law to provide you with a copy of our privacy policy annually. This policy applies to current and former individual investors in funds managed or sponsored by Morgan Stanley Investment Management Inc. ("MSIM") as well as current and former individual clients of MSIM. This policy is not applicable to partnerships, corporations, trusts or other non-individual clients or investors. Please note that we may amend this policy at any time, and will inform you of any changes as required by law.
WE RESPECT YOUR PRIVACY
We appreciate that you have provided us with your personal financial information. We strive to maintain the privacy of such information while we help you achieve your financial objectives. This Notice describes what non-public personal information we collect about you, why we collect it, when we may share it with others and how certain others may use it. It discusses the steps you may take to limit our sharing of certain information about you to affiliated companies in the Morgan Stanley family of companies ("other Morgan Stanley companies"). It also discloses how you may limit use of certain shared information for marketing purposes by other Morgan Stanley branded companies. Throughout this policy, we refer to the non-public information that personally identifies you or your accounts as "personal information.''
1. WHAT PERSONAL INFORMATION DO WE COLLECT ABOUT YOU?
We obtain personal information from applications and other forms you submit to us, from your dealings with us, from consumer reporting agencies, from our Web sites and from third parties and other sources.
For example:
• We may collect information such as your name, address, e-mail address, telephone/fax numbers, assets, income and investment objectives through subscription documents, applications and other forms you submit to us.
• We may obtain information about account balances, your use of account(s) and the types of products and services you prefer to receive from us through your dealings and transactions with us and other sources.
• We may obtain information about your creditworthiness and credit history from consumer reporting agencies.
• We may collect background information from and through third-party vendors to verify representations you have made and to comply with various regulatory requirements.
• If you interact with us through our public and private Web sites, we may collect information that you provide directly through online communications (such as an e-mail address). We may also collect information about your Internet service provider, your domain name, your computer's operating system and Web browser, your use of our Web sites and your product and service preferences, through the use of "cookies.'' Please consult the Terms of Use of these sites for more details.
2. WHEN DO WE DISCLOSE PERSONAL INFORMATION WE COLLECT ABOUT YOU?
We may disclose personal information we collect about you to other Morgan Stanley companies and to non-affiliated third parties.
a. Information We Disclose to Other Morgan Stanley Companies.
We may disclose personal information to other Morgan Stanley companies for a variety of reasons, including to manage your account(s) effectively, to service and process your transactions, to let you know about products and services offered by us and other Morgan Stanley companies, to manage our business, and as otherwise required or permitted by law. Offers for products and services from other Morgan Stanley companies are developed under conditions designed to safeguard your personal information.
22
Morgan Stanley Institutional Fund, Inc.
Annual Report — December 31, 2016
Privacy Notice (unaudited) (cont'd)
b. Information We Disclose to Non-affiliated Third Parties.
We do not disclose personal information that we collect about you to non-affiliated third parties except to those who provide marketing services on our behalf, to financial institutions with whom we have joint marketing agreements, and as otherwise required or permitted by law. For example, we may disclose personal information to nonaffiliated third parties for servicing and processing transactions, to offer our own products and services, to protect against fraud, for institutional risk control, to respond to judicial process or to perform services on our behalf. When we share personal information with a non-affiliated third party, they are required to limit their use of personal information to the particular purpose for which it was shared and they are not allowed to share personal information with others except to fulfill that limited purpose or as may be permitted or required by law.
3. HOW DO WE PROTECT THE SECURITY AND CONFIDENTIALITY OF PERSONAL INFORMATION WE COLLECT ABOUT YOU?
We maintain physical, electronic and procedural security measures to help safeguard the personal information we collect about you. We have internal policies governing the proper handling of client information. Third parties that provide support or marketing services on our behalf may also receive personal information, and we require them to adhere to confidentiality standards with respect to such information.
4. HOW CAN YOU LIMIT THE SHARING OF CERTAIN TYPES OF PERSONAL INFORMATION WITH OTHER MORGAN STANLEY COMPANIES?
We offer you choices as to whether we share with other Morgan Stanley companies the personal information that was collected to determine your eligibility for products and services you request ("eligibility information"). Eligibility information does not include your identification information or personal information pertaining to our transactions or experiences with you. Please note that, even if you direct us not to share eligibility information with other Morgan Stanley companies ("opt-out"), we may still share personal information, including eligibility information, with those companies in circumstances excluded from the opt-out under applicable law, such as to process transactions or to service your account.
5. HOW CAN YOU LIMIT THE USE OF CERTAIN TYPES OF PERSONAL INFORMATION BY OTHER MORGAN STANLEY COMPANIES FOR MARKETING?
By following the opt-out instructions in Section 6 below, you may limit other Morgan Stanley branded companies from marketing their products or services to you based on personal information we disclose to them. This information may include, for example, your income and account history with us. Please note that, even if you choose to limit Other Morgan Stanley Companies from using personal information about you that we may share with them for marketing their products and services to you, Other Morgan Stanley Companies may use your personal information that they obtain from us to market to you in circumstances permitted by law, such as if the Other Morgan Stanley Company has its own relationship with you.
6. HOW CAN YOU SEND US AN OPT-OUT INSTRUCTION?
If you wish to limit our sharing of eligibility information about you with other Morgan Stanley companies or other Morgan Stanley companies' use of personal information for marketing purposes, as described in this notice, you may do so by:
• Calling us at (800) 548-7786
Monday–Friday between 8a.m. and 6p.m.(EST)
• Writing to us at the following address:
Boston Financial Data Services, Inc.
c/o Privacy Coordinator
P.O. Box 219804
Kansas City, Missouri 64121
23
Morgan Stanley Institutional Fund, Inc.
Annual Report — December 31, 2016
Privacy Notice (unaudited) (cont'd)
Your written request should include your name, address, telephone number and account number(s) to which the opt-out applies and whether you are opting out with respect to sharing of eligibility information (Section 4 above), or if information used for Marketing (Section 5 above) or both. Written opt-out requests should not be sent with any other correspondence. In order to process your request, we require that the request be provided by you directly and not through a third party.
Your opt-out preference will remain in effect with respect to this policy (as it may be amended) until you notify us otherwise. If you have a joint account, your direction for us not to share this information with other Morgan Stanley companies and for those other Morgan Stanley companies not to use your personal information for marketing will be applied to all account holders on that account. Please understand that if you limit our sharing or our affiliated companies' use of personal information, you and any joint account holder(s) may not receive information about Morgan Stanley products and services, including products or services that could help you manage your financial resources and achieve your investment objectives.
7. WHAT IF AN AFFILIATED COMPANY BECOMES A NON-AFFILIATED THIRD PARTY?
If, at any time in the future, an affiliated company becomes a non-affiliated third party, further disclosures of personal information made to the former affiliated company will be limited to those described in Section 2(b) above relating to non-affiliated third parties. If you elected under Section 6 to limit disclosures we make to affiliated companies, or use of personal information by affiliated companies, your election will not apply to use by any former affiliated company of your personal information in their possession once it becomes a non-affiliated third party.
SPECIAL NOTICE TO RESIDENTS OF VERMONT
The following section supplements our policy with respect to our individual clients who have a Vermont address and supersedes anything to the contrary in the above policy with respect to those clients only.
The state of Vermont requires financial institutions to obtain your consent prior to sharing personal information that they collect about you with affiliated companies and non-affiliated third parties other than in certain limited circumstances. Except as permitted by law, we will not share personal information we collect about you with non-affiliated third parties or other Morgan Stanley companies unless you provide us with your written consent to share such information ("opt-in").
If you wish to receive offers for investment products and services offered by or through other Morgan Stanley companies, please notify us in writing at the following address:
Boston Financial Data Services, Inc.
c/o Privacy Coordinator
P.O. Box 219804
Kansas City, Missouri 64121
Your authorization should include your name, address, telephone number and account number(s) to which the opt-in applies and should not be sent with any other correspondence. In order to process your authorization, we require that the authorization be provided by you directly and not through a third party.
SPECIAL NOTICE TO RESIDENTS OF CALIFORNIA
The following section supplements our policy with respect to our individual clients who have a California address and supersedes anything to the contrary in the above policy with respect to those clients only.
In response to a California law, if your account has a California home address, your personal information will not be disclosed to nonaffiliated third parties except as permitted by applicable California law, and we will limit sharing such information with our affiliates to comply with California privacy laws that apply to us.
24
Morgan Stanley Institutional Fund, Inc.
Annual Report — December 31, 2016
Director and Officer Information (unaudited)
Independent Directors:
Name, Age and Address of
Independent Director | | Position(s)
Held with
Registrant | | Length of Time
Served* | | Principal Occupation(s) During Past 5 Years
and Other Relevant Professional Experience | | Number of
Portfolios in
Fund Complex
Overseen by
Independent
Director** | | Other Directorships
Held by Independent
Director*** | |
Frank L. Bowman (72)
c/o Perkins Coie LLP
Counsel to the Independent
Directors
30 Rockefeller Plaza
New York, NY 10112 | | Director | | Since
August
2006 | | President, Strategic Decisions, LLC (consulting) (since February 2009); Director or Trustee of various Morgan Stanley Funds (since August 2006); Chairperson of the Compliance and Insurance Committee (since October 2015); formerly, Chairperson of the Insurance Sub-Committee of the Compliance and Insurance Committee (2007-2015); served as President and Chief Executive Officer of the Nuclear Energy Institute (policy organization) (February 2005-November 2008); retired as Admiral, U.S. Navy after serving over 38 years on active duty including 8 years as Director of the Naval Nuclear Propulsion Program in the Department of the Navy and the U.S. Department of Energy (1996-2004); served as Chief of Naval Personnel (July 1994-September 1996) and on the Joint Staff as Director of Political Military Affairs (June 1992-July 1994); knighted as Honorary Knight Commander of the Most Excellent Order of the British Empire; awarded the Officier de l'Orde National du Mérite by the French Government; elected to the National Academy of Engineering (2009). | | | 90 | | | Director of BP p.l.c.; Director of Naval and Nuclear Technologies LLP; Director Emeritus of the Armed Services YMCA; Director of the U.S. Naval Submarine League; Member of the National Security Advisory Council of the Center for U.S. Global Engagement and a member of the CNA Military Advisory Board; Chairman of the charity J Street Cup Golf; Trustee of Fairhaven United Methodist Church; and Director of other various non-profit organizations. | |
Kathleen A. Dennis (63)
c/o Perkins Coie LLP
Counsel to the Independent Directors
30 Rockefeller Plaza
New York, NY 10112 | | Director | | Since
August
2006 | | President, Cedarwood Associates (mutual fund and investment management consulting) (since July 2006); Chairperson of the Liquidity and Alternatives Sub-Committee of the Investment Committee (since October 2006) and Director or Trustee of various Morgan Stanley Funds (since August 2006); formerly, Senior Managing Director of Victory Capital Management (1993-2006). | | | 91 | | | Director of various non-profit organizations. | |
Nancy C. Everett (61)
c/o Perkins Coie LLP
Counsel to the Independent Directors
30 Rockefeller Plaza
New York, NY 10112 | | Director | | Since
January
2015 | | Chief Executive Officer, Virginia Commonwealth University Investment Company (since November 2015); Owner, OBIR, LLC (institutional investment management consulting) (since June 2014); formerly, Managing Director, BlackRock Inc. (February 2011-December 2013); and Chief Executive Officer, General Motors Asset Management (a/k/a Promark Global Advisors, Inc.) (June 2005-May 2010). | | | 91 | | | Member of Virginia Commonwealth University School of Business Foundation; formerly, Member of Virginia Commonwealth University Board of Visitors (2013-2015); Member of Committee on Directors for Emerging Markets Growth Fund, Inc. (2007-2010); Chairperson of Performance Equity Management, LLC (2006-2010); and Chairperson, GMAM Absolute Return Strategies Fund, LLC (2006-2010). | |
25
Morgan Stanley Institutional Fund, Inc.
Annual Report — December 31, 2016
Director and Officer Information (unaudited) (cont'd)
Independent Directors: (cont'd)
Name, Age and Address of
Independent Director | | Position(s)
Held with
Registrant | | Length of Time
Served* | | Principal Occupation(s) During Past 5 Years
and Other Relevant Professional Experience | | Number of
Portfolios in
Fund Complex
Overseen by
Independent
Director** | | Other Directorships
Held by Independent
Director*** | |
Jakki L. Haussler (59)
c/o Perkins Coie LLP
Counsel to the Independent Directors
30 Rockefeller Plaza
New York, NY 10112 | | Director | | Since
January
2015 | | Chairman and Chief Executive Officer, Opus Capital Group (since January 1996); formerly, Director, Capvest Venture Fund, LP (May 2000-December 2011); Partner, Adena Ventures, LP (July 1999-December 2010); Director, The Victory Funds (February 2005-July 2008). | | | 91 | | | Director of Cincinnati Bell Inc. and Member, Audit Committee and Compensation Committee; Director of Northern Kentucky University Foundation and Member, Investment Committee; Member of Chase College of Law Transactional Law Practice Center Board of Advisors; Director of Best Transport; Director of Chase College of Law Board of Visitors; formerly, Member, University of Cincinnati Foundation Investment Committee; Member, Miami University Board of Visitors (2008-2011); Trustee of Victory Funds (2005-2008) and Chairman, Investment Committee (2007-2008) and Member, Service Provider Committee (2005-2008). | |
Dr. Manuel H. Johnson (67)
c/o Johnson Smick
International, Inc.
220 I Street, N.E. — Suite 200
Washington, D.C. 20002 | | Director | | Since
July
1991 | | Senior Partner, Johnson Smick International, Inc. (consulting firm); Chairperson of the Investment Committee (since October 2006) and Director or Trustee of various Morgan Stanley Funds (since July 1991); Co-Chairman and a founder of the Group of Seven Council (G7C) (international economic commission); formerly, Chairperson of the Audit Committee (July 1991-September 2006), Vice Chairman of the Board of Governors of the Federal Reserve System and Assistant Secretary of the U.S. Treasury. | | | 91 | | | Director of NVR, Inc. (home construction). | |
Joseph J. Kearns (74)
c/o Kearns & Associates LLC
46 E Peninsula Center #385
Rolling Hills Estates, CA 90274-3712 | | Director | | Since
August
1994 | | President, Kearns & Associates LLC (investment consulting); Chairperson of the Audit Committee (since October 2006) and Director or Trustee of various Morgan Stanley Funds (since August 1994); formerly, Deputy Chairperson of the Audit Committee (July 2003-September 2006) and Chairperson of the Audit Committee of various Morgan Stanley Funds (since August 1994); CFO of the J. Paul Getty Trust. | | | 93 | | | Director of Electro Rent Corporation (equipment leasing). Prior to December 31, 2013, Director of The Ford Family Foundation. | |
26
Morgan Stanley Institutional Fund, Inc.
Annual Report — December 31, 2016
Director and Officer Information (unaudited) (cont'd)
Independent Directors: (cont'd)
Name, Age and Address of
Independent Director | | Position(s)
Held with
Registrant | | Length of Time
Served* | | Principal Occupation(s) During Past 5 Years
and Other Relevant Professional Experience | | Number of
Portfolios in
Fund Complex
Overseen by
Independent
Director** | | Other Directorships
Held by Independent
Director*** | |
Michael F. Klein (58)
c/o Perkins Coie LLP
Counsel to the Independent Directors
30 Rockefeller Plaza
New York, NY 10112 | | Director | | Since
August
2006 | | Managing Director, Aetos Capital, LLC (since March 2000); Co-President, Aetos Alternatives Management, LLC (since January 2004) and Co-Chief Executive Officer of Aetos Capital LLC (since August 2013); Chairperson of the Fixed Income Sub-Committee of the Investment Committee (since October 2006) and Director or Trustee of various Morgan Stanley Funds (since August 2006); formerly, Managing Director, Morgan Stanley & Co. Inc. and Morgan Stanley Dean Witter Investment Management, President, various Morgan Stanley Funds (June 1998-March 2000) and Principal, Morgan Stanley & Co. Inc. and Morgan Stanley Dean Witter Investment Management (August 1997-December 1999). | | | 90 | | | Director of certain investment funds managed or sponsored by Aetos Capital, LLC; Director of Sanitized AG and Sanitized Marketing AG (specialty chemicals). | |
Patricia Maleski (56)
c/o Perkins Coie LLP
Counsel to the Independent Directors
30 Rockefeller Plaza
New York, NY 10112 | | Director | | Since
January
2017 | | Management Director, JPMorgan Asset Management (2013-2016); President, JPMorgan Funds (2010-2013), Chief Administrative Officer, JPMorgan Funds (2004-2010), Treasurer, JPMorgan Funds (2003-2004, 2008-2010), and Vice President and Board Liaison, JPMorgan Funds (2001-2004); Managing Director, J.P. Morgan Investment Management Inc. (2001-2013); Vice President of Finance, Pierpont Group (1996-2001); Vice President, Bank of New York (1995-1996); Senior Audit Manager, Price Waterhouse, LLP (1982-1995). | | | 91 | | | None. | |
Michael E. Nugent (80)
522 Fifth Avenue
New York, NY 10036 | | Chair of the Board and Director | | Chair of the Boards since July 2006 and Director since July 1991 | | Chair of the Boards of various Morgan Stanley Funds (since July 2006); Chairperson of the Closed-End Fund Committee (since June 2012) and Director or Trustee of various Morgan Stanley Funds (since July 1991); formerly, Chairperson of the Insurance Committee (until July 2006); General Partner, Triumph Capital, L.P. (private investment partnership) (1988-2013). | | | 92 | | | None. | |
W. Allen Reed (69)
c/o Perkins Coie LLP
Counsel to the Independent Directors
30 Rockefeller Plaza
New York, NY 10112 | | Director | | Since
August
2006 | | Chairperson of the Equity Sub-Committee of the Investment Committee (since October 2006) and Director or Trustee of various Morgan Stanley Funds (since August 2006); formerly, President and CEO of General Motors Asset Management; Chairman and Chief Executive Officer of the GM Trust Bank and Corporate Vice President of General Motors Corporation (August 1994-December 2005). | | | 91 | | | Director of Legg Mason, Inc.; formerly, Director of the Auburn University Foundation (2010-2015). | |
Fergus Reid (84)
c/o Joe Pietryka, Inc.
85 Charles Colman Blvd.
Pawling, NY 12564 | | Director | | Since
June
1992 | | Chairman, Joe Pietryka, Inc.; Chairperson of the Governance Committee and Director or Trustee of various Morgan Stanley Funds (since June 1992). | | | 92 | | | Formerly, Trustee and Director of certain investment companies in the JP Morgan Fund Complex managed by JP Morgan Investment Management Inc. (1987-2012). | |
* This is the earliest date the Director began serving the Morgan Stanley Funds. Each Director serves an indefinite term, until his or her successor is elected.
** The Fund Complex includes (as of December 31, 2016) all open-end and closed-end funds (including all of their portfolios) advised by Morgan Stanley Investment Management Inc. (the "Adviser") and any funds that have an adviser that is an affiliated person of the Adviser (including, but not limited to, Morgan Stanley AIP GP LP).
*** This includes any directorships at public companies and registered investment companies held by the Director at any time during the past five years.
27
Morgan Stanley Institutional Fund, Inc.
Annual Report — December 31, 2016
Director and Officer Information (unaudited) (cont'd)
Executive Officers:
Name, Age and Address of Executive Officer | | Position(s) Held
with
Registrant | | Length of Time
Served* | | Principal Occupation(s) During Past 5 Years | |
John H. Gernon (53)
522 Fifth Avenue
New York, NY 10036 | | President and Principal Executive Officer | | Since
September
2013 | | President and Principal Executive Officer of the Equity and Fixed Income Funds and the Morgan Stanley AIP Funds (since September 2013) and the Liquidity Funds and various money market funds (since May 2014) in the Fund Complex; Managing Director of the Adviser; Head of Product (since 2006). | |
Timothy J. Knierim (58)
522 Fifth Avenue
New York, NY 10036 | | Chief Compliance Officer | | Since
December
2016 | | Managing Director of the Adviser and various entities affiliated with the Adviser; Chief Compliance Officer of various Morgan Stanley Funds and the Adviser (since December 2016) and Chief Compliance Officer of Morgan Stanley AIP GP LP (since 2014). Formerly, Managing Director and Deputy Chief Compliance Officer of the Adviser (2014-2016); and formerly, Chief Compliance Officer of Prudential Investment Management, Inc. (2007-2014). | |
Francis J. Smith (51)
522 Fifth Avenue
New York, NY 10036 | | Treasurer and Principal Financial Officer | | Treasurer since July 2003 and Principal Financial Officer since September 2002 | | Managing Director of the Adviser and various entities affiliated with the Adviser; Treasurer (since July 2003) and Principal Financial Officer of various Morgan Stanley Funds (since September 2002). | |
Mary E. Mullin (49)
522 Fifth Avenue
New York, NY 10036 | | Secretary | | Since
June
1999 | | Executive Director of the Adviser; Secretary of various Morgan Stanley Funds (since June 1999). | |
* This is the earliest date the officer began serving the Morgan Stanley Funds. Each officer serves a one-year term, until his or her successor is elected and qualifies.
28
Morgan Stanley Institutional Fund, Inc.
Annual Report — December 31, 2016
Adviser and Administrator
Morgan Stanley Investment Management Inc.
522 Fifth Avenue
New York, New York 10036
Distributor
Morgan Stanley Distribution, Inc.
522 Fifth Avenue
New York, New York 10036
Dividend Disbursing and Transfer Agent
Boston Financial Data Services, Inc.
2000 Crown Colony Drive
Quincy, Massachusetts 02169
Custodian
State Street Bank and Trust Company
One Lincoln Street
Boston, Massachusetts 02111
Legal Counsel
Dechert LLP
1095 Avenue of the Americas
New York, New York 10036
Counsel to the Independent Directors
Perkins Coie LLP
30 Rockefeller Plaza
New York, New York 10112
Independent Registered Public Accounting Firm
Ernst & Young LLP
200 Clarendon Street
Boston, Massachusetts 02116
Reporting to Shareholders
Each Morgan Stanley fund provides a complete schedule of portfolio holdings in its semi-annual and annual reports within 60 days of the end of the fund's second and fourth fiscal quarters. The semi-annual and annual reports are filed electronically with the Securities and Exchange Commission (SEC) on Form N-CSRS and Form N-CSR, respectively. Morgan Stanley also delivers the semi-annual and annual reports to fund shareholders and makes these reports available on its public website, www.morganstanley.com/im. Each Morgan Stanley fund also files a complete schedule of portfolio holdings with the SEC for the fund's first and third fiscal quarters on Form N-Q. Morgan Stanley does not deliver the reports for the first and third fiscal quarters to shareholders, nor are the reports posted to the Morgan Stanley public website. You may, however, obtain the Form N-Q filings (as well as the Form N-CSR and N-CSRS filings) by accessing the SEC's website, www.sec.gov. You may also review and copy them at the SEC's Public Reference Room in Washington, DC. Information on the operation of the SEC's Public Reference Room may be obtained by calling the SEC toll free at 1 (800) SEC-0330. You can also request copies of these materials, upon payment of a duplicating fee, by electronic request at the SEC's email address (publicinfo@sec.gov) or by writing the Public Reference Room of the SEC, 100 F Street, NE, Washington, DC 20549-0102.
Proxy Voting Policies and Procedures and Proxy Voting Record
You may obtain a copy of the Fund's Proxy Voting Policy and Procedures and information regarding how the Fund voted proxies relating to portfolio securities during the most recent period ended June 30, without charge, upon request, by calling toll free 1 (800) 548-7786 or by visiting our website at www.morganstanley.com/im. This information is also available on the SEC's website at www.sec.gov.
This report is authorized for distribution only when preceded or accompanied by a prospectus or summary prospectus of the applicable Portfolio of Morgan Stanley Institutional Fund, Inc., which describes in detail the Portfolio's investment policies, risks, fees and expenses. Please read the prospectus carefully before you invest or send money. For additional information, including information regarding the investments comprising the Portfolio, please visit our website at www.morganstanley.com/im or call toll free 1 (800) 548-7786.
29
Printed in U.S.A.
This Report has been prepared for shareholders and may be distributed to others only if preceded or accompanied by a current prospectus.
Morgan Stanley Investment Management Inc.
522 Fifth Avenue
New York, New York 10036
© 2017 Morgan Stanley. Morgan Stanley Distribution, Inc.

IFIGCPANN
1698241 EXP. 02.28.18

Morgan Stanley Institutional Fund, Inc.
Global Discovery Portfolio
Annual Report
December 31, 2016

Morgan Stanley Institutional Fund, Inc.
Annual Report — December 31, 2016
Shareholders' Letter | | | 2 | | |
Expense Example | | | 3 | | |
Investment Overview | | | 4 | | |
Portfolio of Investments | | | 6 | | |
Statement of Assets and Liabilities | | | 9 | | |
Statement of Operations | | | 11 | | |
Statements of Changes in Net Assets | | | 12 | | |
Financial Highlights | | | 14 | | |
Notes to Financial Statements | | | 18 | | |
Report of Independent Registered Public Accounting Firm | | | 31 | | |
Federal Tax Notice | | | 32 | | |
Privacy Notice | | | 33 | | |
Director and Officer Information | | | 36 | | |
This report is authorized for distribution only when preceded or accompanied by a prospectus or summary prospectus of the applicable Portfolio of Morgan Stanley Institutional Fund, Inc. To receive a prospectus and/or statement of additional information (SAI), which contains more complete information such as investment objectives, charges, expenses, policies for voting proxies, risk considerations, and describes in detail each of the Portfolio's investment policies to the prospective investor, please call toll free 1 (800) 548-7786. Please read the prospectuses carefully before you invest or send money.
Additionally, you can access information about the Portfolio, including performance, characteristics, and investment team commentary, through Morgan Stanley Investment Management's website: www.morganstanley.com/im.
Market forecasts provided in this report may not necessarily come to pass. There is no guarantee that any sectors mentioned will continue to perform as discussed herein or that securities in such sectors will be held by the Portfolio in the future. There is no assurance that a Portfolio will achieve its investment objective. Portfolios are subject to market risk, which is the possibility that market values of securities owned by the Portfolio will decline and, therefore, the value of the Portfolio's shares may be less than what you paid for them. Accordingly, you can lose money investing in this Portfolio. Please see the prospectus for more complete information on investment risks.
1
Morgan Stanley Institutional Fund, Inc.
Annual Report — December 31, 2016
Shareholders' Letter (unaudited)
Dear Shareholders,
We are pleased to provide this Annual report, in which you will learn how your investment in Global Discovery Portfolio (the "Portfolio") performed during the latest twelve-month period.
Morgan Stanley Investment Management is a client-centric, investor-led organization. Our global presence, intellectual capital, and breadth of products and services enable us to partner with investors to meet the evolving challenges of today's financial markets. We aim to deliver superior investment service and to empower our clients to make the informed decisions that help them reach their investment goals.
As always, we thank you for selecting Morgan Stanley Investment Management, and look forward to working with you in the months and years ahead.
Sincerely,

John H. Gernon
President and Principal Executive Officer
January 2017
2
Morgan Stanley Institutional Fund, Inc.
Annual Report — December 31, 2016
Expense Example (unaudited)
Global Discovery Portfolio
As a shareholder of the Portfolio, you incur two types of costs: (1) transactional costs; and (2) ongoing costs, which may include advisory fees, administration fees, distribution and shareholder services fees and other Portfolio expenses. This example is intended to help you understand your ongoing costs (in dollars) of investing in the Portfolio and to compare these costs with the ongoing costs of investing in other mutual funds.
This example is based on an investment of $1,000 invested at the beginning of the six-month period ended December 31, 2016 and held for the entire six-month period.
Actual Expenses
The table below provides information about actual account values and actual expenses. You may use the information in this table, together with the amount you invested, to estimate the expenses that you paid over the period. Simply divide your account value by $1,000 (for example, an $8,600 account value divided by $1,000 = 8.6), then multiply the result by the number in the table under the heading entitled "Actual Expenses Paid During Period" to estimate the expenses you paid on your account during this period.
Hypothetical Example for Comparison Purposes
The table below provides information about hypothetical account values and hypothetical expenses based on the Portfolio's actual expense ratio and an assumed rate of return of 5% per year before expenses, which is not the Portfolio's actual return. The hypothetical account values and expenses may not be used to estimate the actual ending account balance or expenses you paid for the period. You may use this information to compare the ongoing costs of investing in the Portfolio and other funds. To do so, compare this 5% hypothetical example with the 5% hypothetical examples that appear in the shareholder reports of the other funds.
Please note that the expenses shown in the table are meant to highlight your ongoing costs only and do not reflect any transactional costs, such as sales charges (loads). Therefore, the information for each class in the table is useful in comparing ongoing costs only, and will not help you determine the relative total costs of owning different funds. In addition, if these transactional costs were included, your costs would have been higher.
| | | Beginning
Account
Value
7/1/16 | | Actual Ending
Account
Value
12/31/16 | | Hypothetical
Ending Account
Value | | Actual
Expenses
Paid
During
Period* | | Hypothetical
Expenses Paid
During Period* | | Net
Expense
Ratio
During
Period** | |
Global Discovery Portfolio Class I | | $ | 1,000.00 | | | $ | 1,223.50 | | | $ | 1,018.45 | | | $ | 7.43 | | | $ | 6.75 | | | | 1.33 | %*** | |
Global Discovery Portfolio Class A | | | 1,000.00 | | | | 1,221.30 | | | | 1,016.69 | | | | 9.38 | | | | 8.52 | | | | 1.68 | *** | |
Global Discovery Portfolio Class L | | | 1,000.00 | | | | 1,218.40 | | | | 1,014.18 | | | | 12.16 | | | | 11.04 | | | | 2.18 | *** | |
Global Discovery Portfolio Class C | | | 1,000.00 | | | | 1,216.60 | | | | 1,012.92 | | | | 13.54 | | | | 12.30 | | | | 2.43 | *** | |
* Expenses are calculated using each Portfolio Class' annualized net expense ratio (as disclosed), multiplied by the average account value over the period, and multiplied by 184/366 (to reflect the most recent one-half year period).
** Annualized.
*** Refer to Note F in the Notes to Financial Statements for discussion of prior period custodian out-of-pocket expenses that were reimbursed in the current period.
3
Morgan Stanley Institutional Fund, Inc.
Annual Report — December 31, 2016
Investment Overview (unaudited)
Global Discovery Portfolio
The Portfolio seeks long-term capital appreciation.
Performance
For the year ended December 31, 2016, the Portfolio's Class I shares had a total return based on net asset value and reinvestment of distributions per share of 36.51%, net of fees. The Portfolio's Class I shares outperformed the Portfolio's benchmark, the MSCI All Country World Index (the "Index"), which returned 7.86%. Please keep in mind that high double-digit returns are highly unusual and cannot be sustained.
Factors Affecting Performance
• Global equities rose 7.86% for the 12-month period, as measured by the Index. The Index was led by strong performance from the U.S. and emerging markets, while Japan and Europe lagged. Early in the year, worries about weak global growth and disinflation drove share prices lower. However, sentiment brightened as commodity prices bottomed, China's economy stabilized, the U.S. economy strengthened and global central banks remained accommodative. In the second half of the year, equity markets largely shrugged off the Brexit referendum's surprise outcome and the U.S., in particular, rallied strongly following the unexpected election of Donald Trump on anticipation of pro-growth, reflationary policy from the new administration.
• The long-term investment horizon and conviction-weighted investment approach embraced by the team since 1998 can result in periods of performance deviation from the benchmark and peers. In this reporting period, stock selection drove most of the Portfolio's relative outperformance. Sector allocation also contributed positively, to a lesser extent.
• The industrials sector was, by far, the largest contributor to relative performance, due to both stock selection and a significant overweight in the sector. In fact, six of the top 10 contributing holdings for the Portfolio overall came from the industrials sector. Moreover, these six industrials stocks were not represented in the Index.
• Stock selection in the consumer discretionary sector delivered strong relative gains, although the Portfolio's overweight allocation in the sector was somewhat detrimental to performance.
• The Portfolio's health care position outperformed, due to both favorable stock selection and a beneficial underweight allocation.
• The materials sector was the primary detractor from relative performance, driven by an unfavorable underweight to the sector.
• Underweight allocations to the information technology and energy sectors were a drag on relative performance in the period. However, favorable stock selection in both sectors more than compensated for the relative weakness from the sector allocations.
Management Strategies
• There were no changes to our bottom-up investment process during the period. We continued to look for franchises with sustainable competitive advantages. We typically favor companies with strong cash generation, attractive returns on capital, hard-to-replicate assets and a favorable risk/reward profile. Our emphasis is on secular growth, and as a result short-term market events are not as meaningful in the stock selection process.
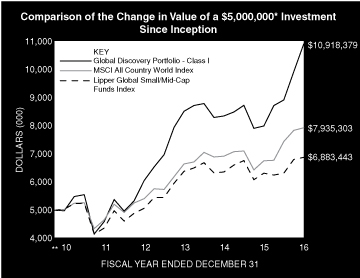
* Minimum Investment for Class I shares
** Commenced Operations on December 28, 2010.
In accordance with SEC regulations, the Portfolio's performance shown assumes that all recurring fees (including management fees) were deducted and all dividends and distributions were reinvested. The performance of Class A, L and C shares will vary from the performance of Class I shares upon their different inception dates and will be impacted by additional fees assessed to those classes.
4
Morgan Stanley Institutional Fund, Inc.
Annual Report — December 31, 2016
Investment Overview (unaudited) (cont'd)
Global Discovery Portfolio
Performance Compared to the MSCI All Country World Index(1) and the Lipper Global Small/Mid-Cap Funds Index(2)
| | | Period Ended December 31, 2016
Total Returns(3) | |
| | | | | Average Annual | |
| | | One
Year | | Five
Years | | Ten
Years | | Since
Inception(6) | |
Portfolio — Class I Shares
w/o sales charges(4) | | | 36.51 | % | | | 18.87 | % | | | — | | | | 13.88 | % | |
Portfolio — Class A Shares
w/o sales charges(4) | | | 36.04 | | | | 18.53 | | | | — | | | | 13.56 | | |
Portfolio — Class A Shares with
maximum 5.25% sales charges(4) | | | 28.95 | | | | 17.26 | | | | — | | | | 12.55 | | |
Portfolio — Class L Shares
w/o sales charges(4) | | | 35.38 | | | | 17.91 | | | | — | | | | 12.98 | | |
Portfolio — Class C Shares
w/o sales charges(5) | | | 35.03 | | | | — | | | | — | | | | 12.91 | | |
Portfolio — Class C Shares with
maximum 1.00% deferred
sales charges(5) | | | 34.03 | | | | — | | | | — | | | | 12.91 | | |
MSCI All Country World Index | | | 7.86 | | | | 9.36 | | | | — | | | | 6.48 | | |
Lipper Global Small/Mid-Cap
Funds Index | | | 8.93 | | | | 9.52 | | | | — | | | | 5.46 | | |
Performance data quoted represents past performance, which is no guarantee of future results, and current performance may be lower or higher than the figures shown. Performance assumes that all dividends and distributions, if any, were reinvested. For the most recent month-end performance figures, please visit www.morganstanley.com/im. Investment return and principal value will fluctuate so that Portfolio shares, when redeemed, may be worth more or less than their original cost. Total returns do not reflect the deduction of taxes that a shareholder would pay on Portfolio distributions or the redemption of Portfolio shares. Performance of share classes will vary due to difference in expenses.
(1) The MSCI All Country World Index (ACWI) is a free float-adjusted market capitalization weighted index designed to measure the equity market performance of developed and emerging markets. The term "free float" represents the portion of shares outstanding that are deemed to be available for purchase in the public equity markets by investors. The Index is unmanaged and its returns do not include any sales charges or fees. Such costs would lower performance. It is not possible to invest directly in an index.
(2) The Lipper Global Small/Mid-Cap Funds Index is an equally weighted performance index of the largest qualifying funds (based on net assets) in the Lipper Global Small/Mid-Cap Funds classification. The Index, which is adjusted for capital gains distributions and income dividends, is unmanaged and should not be considered an investment. There are currently 30 funds represented in this Index. As of the date of this report, the Portfolio is in the Lipper Global Small/Mid-Cap Funds classification.
(3) Total returns for the Portfolio reflect fees waived and expenses reimbursed, if applicable, by the Adviser. Without such waivers and reimbursements, total returns would have been lower.
(4) Commenced operations on December 28, 2010.
(5) Commenced offering on April 30, 2015.
(6) For comparative purposes, average annual since inception returns listed for the Indexes refer to the inception date of Class I of the Portfolio, not the inception of the Index.
5
Morgan Stanley Institutional Fund, Inc.
Annual Report — December 31, 2016
Portfolio of Investments
Global Discovery Portfolio
| | | Shares | | Value
(000) | |
Common Stocks (83.3%) | |
Australia (0.5%) | |
Kathmandu Holdings Ltd. | | | 129,499 | | | $ | 175 | | |
Brazil (3.3%) | |
GAEC Educacao SA | | | 55,994 | | | | 235 | | |
JHSF Participacoes SA (a) | | | 529,600 | | | | 229 | | |
Porto Seguro SA | | | 90,976 | | | | 752 | | |
| | | | 1,216 | | |
Canada (0.2%) | |
Second Cup Ltd. (The) (a) | | | 56,670 | | | | 90 | | |
China (0.2%) | |
Jumei International Holding Ltd. ADR (a) | | | 14,461 | | | | 73 | | |
France (19.3%) | |
Christian Dior SE | | | 19,264 | | | | 4,041 | | |
Criteo SA ADR (a) | | | 29,779 | | | | 1,223 | | |
Edenred | | | 70,456 | | | | 1,397 | | |
Eurazeo SA | | | 6,090 | | | | 356 | | |
| | | | 7,017 | | |
Germany (2.0%) | |
ThyssenKrupp AG | | | 29,623 | | | | 706 | | |
windeln.de SE (a)(b)(c) | | | 4,852 | | | | 15 | | |
| | | | 721 | | |
Italy (1.0%) | |
Tamburi Investment Partners SpA | | | 91,654 | | | | 347 | | |
Netherlands (1.4%) | |
Koninklijke Philips N.V. | | | 17,264 | | | | 527 | | |
Spain (1.5%) | |
Mapfre SA | | | 173,137 | | | | 529 | | |
United Kingdom (9.0%) | |
BBA Aviation PLC | | | 405,495 | | | | 1,416 | | |
Clarkson PLC | | | 20,530 | | | | 550 | | |
Howden Joinery Group PLC | | | 125,867 | | | | 595 | | |
Whitbread PLC | | | 15,286 | | | | 711 | | |
| | | | 3,272 | | |
United States (44.9%) | |
Ashland Global Holdings, Inc. | | | 12,508 | | | | 1,367 | | |
BJ's Restaurants, Inc. (a) | | | 11,448 | | | | 450 | | |
Bojangles', Inc. (a) | | | 4,359 | | | | 81 | | |
BWX Technologies, Inc. | | | 26,367 | | | | 1,047 | | |
Container Store Group, Inc. (The) (a)(c) | | | 12,014 | | | | 76 | | |
Cosan Ltd., Class A | | | 52,691 | | | | 396 | | |
Donnelley Financial Solutions, Inc. (a) | | | 25,238 | | | | 580 | | |
Dril-Quip, Inc. (a) | | | 11,227 | | | | 674 | | |
Dropbox, Inc. (a)(d)(e)(f)
(acquisition cost — $25; acquired 5/1/12) | | | 2,743 | | | | 24 | | |
eBay, Inc. (a) | | | 23,484 | | | | 697 | | |
El Pollo Loco Holdings, Inc. (a) | | | 29,659 | | | | 365 | | |
Fiesta Restaurant Group, Inc. (a) | | | 18,541 | | | | 554 | | |
Habit Restaurants, Inc. (The) (a) | | | 4,964 | | | | 86 | | |
Harley-Davidson, Inc. | | | 14,679 | | | | 856 | | |
Intuitive Surgical, Inc. (a) | | | 1,084 | | | | 687 | | |
| | | Shares | | Value
(000) | |
Joy Global, Inc. | | | 28,986 | | | $ | 812 | | |
Manitowoc Foodservice, Inc. (a) | | | 153,549 | | | | 2,968 | | |
Papa Murphy's Holdings, Inc. (a)(c) | | | 18,713 | | | | 79 | | |
RenaissanceRe Holdings Ltd. | | | 3,753 | | | | 511 | | |
Terex Corp. | | | 38,675 | | | | 1,219 | | |
Time Warner, Inc. | | | 28,711 | | | | 2,772 | | |
| | | | 16,301 | | |
Total Common Stocks (Cost $27,263) | | | 30,268 | | |
Preferred Stocks (1.2%) | |
India (0.3%) | |
Flipkart Online Services Pvt Ltd. Series D (a)(d)(e)(f)
(acquisition cost — $44; acquired 10/4/13) | | | 1,910 | | | | 96 | | |
United States (0.9%) | |
Airbnb, Inc. Series D (a)(d)(e)(f)
(acquisition cost — $78; acquired 4/16/14) | | | 1,917 | | | | 202 | | |
Blue Bottle Coffee, Inc. Series B (a)(d)(e)(f)
(acquisition cost — $56; acquirred 1/24/14) | | | 3,945 | | | | 65 | | |
DOMO, Inc. (a)(d)(e)(f)
(acquisition cost — $37;
acquired 1/31/14 — 2/7/14) | | | 9,082 | | | | 33 | | |
Lookout, Inc. Series F (a)(d)(e)(f)
(acquisition cost — $73; acquired 6/17/14) | | | 6,374 | | | | 20 | | |
Palantir Technologies, Inc. Series G (a)(d)(e)(f)
(acquisition cost — $9; acquired 7/19/12) | | | 2,935 | | | | 12 | | |
Palantir Technologies, Inc. Series H (a)(d)(e)(f)
(acquisition cost — $6; acquired 10/25/13) | | | 1,572 | | | | 6 | | |
Palantir Technologies, Inc. Series H1 (a)(d)(e)(f)
(acquisition cost — $6; acquired 10/25/13) | | | 1,572 | | | | 6 | | |
| | | | 344 | | |
Total Preferred Stocks (Cost $309) | | | 440 | | |
Convertible Preferred Stock (0.0%) | |
United States (0.0%) | |
Dropbox, Inc. Series A (a)(d)(e)(f)
(acquisition cost — $3; acquired 5/25/12)
(Cost $3) | | | 277 | | | | 2 | | |
Participation Note (0.0%) | |
Italy (0.0%) | |
Tamburi Investment Partners SpA,
Equity Linked Notes, expires 6/30/20 (a)
(Cost $4) | | | 10,390 | | | | 4 | | |
| | | Notional
Amount
(000) | | | |
Call Options Purchased (1.4%) | |
United States (1.4%) | |
Harley-Davidson, Inc. January 2019 @ $45,
UBS Securities, LLC (g) | | | — | @ | | | 413 | | |
United Technologies Corp. January 2017 @ $110,
UBS Securities, LLC (g) | | | — | @ | | | 23 | | |
United Technologies Corp. January 2018 @ $120,
UBS Securities, LLC (g) | | | — | @ | | | 58 | | |
Total Call Options Purchased (Cost $553) | | | 494 | | |
The accompanying notes are an integral part of the financial statements.
6
Morgan Stanley Institutional Fund, Inc.
Annual Report — December 31, 2016
Portfolio of Investments (cont'd)
Global Discovery Portfolio
| | | Shares | | Value
(000) | |
Short-Term Investments (13.5%) | |
Securities held as Collateral on Loaned Securities (0.2%) | |
Investment Company (0.2%) | |
Morgan Stanley Institutional Liquidity
Funds — Treasury Securities Portfolio —
Institutional Class (See Note G) | | | 58,746 | | | $ | 59 | | |
| | | Face
Amount
(000) | | | |
Repurchase Agreements (0.0%) | |
Merrill Lynch & Co., Inc., (0.50%, dated
12/30/16, due 1/3/17; proceeds $1;
fully collateralized by a U.S. Government
obligation; 1.88% due 8/31/22;
valued at $1) | | $ | 1 | | | | 1 | | |
Merrill Lynch & Co., Inc., (0.50%, dated
12/30/16, due 1/3/17; proceeds $6;
fully collateralized by U.S. Government
agency securities; 2.88% - 4.60%
due 11/20/65 - 11/20/66; valued at $6) | | | 6 | | | | 6 | | |
Merrill Lynch & Co., Inc., (0.81%, dated
12/30/16, due 1/3/17; proceeds $8;
fully collateralized by Exchange Traded
Funds; valued at $9) | | | 8 | | | | 8 | | |
| | | | 15 | | |
Total Securities held as Collateral on Loaned
Securities (Cost $74) | | | 74 | | |
| | | Shares | | | |
Investment Company (13.3%) | |
Morgan Stanley Institutional Liquidity
Funds — Treasury Securities Portfolio —
Institutional Class (See Note G)
(Cost $4,827) | | | 4,826,930 | | | | 4,827 | | |
Total Short-Term Investments (Cost $4,901) | | | 4,901 | | |
Total Investments (99.4%) (Cost $33,033)
Including $84 of Securities Loaned (h)(i) | | | 36,109 | | |
Other Assets in Excess of Liabilities (0.6%) | | | 209 | | |
Net Assets (100.0%) | | $ | 36,318 | | |
Country assignments and aggregations are based generally on third party vendor classifications and information, and may be different from the assignments and aggregations under the policies set forth in the Portfolio's prospectus and/or statement of additional information relating to geographic classifications.
(a) Non-income producing security.
(b) 144A security — Certain conditions for public sale may exist. Unless otherwise noted, these securities are deemed to be liquid.
(c) All or a portion of this security was on loan at December 31, 2016.
(d) Security has been deemed illiquid at December 31, 2016.
(e) Security cannot be offered for public resale without first being registered under the Securities Act of 1933 and related rules ("restricted security"). Acquisition date represents the day on which an enforceable right to acquire such security is obtained and is presented along with related cost in the security description. The Portfolio has registration rights for certain restricted securities. Any costs related to such registration are borne by the issuer. The aggregate value of restricted securities (excluding 144A holdings) at December 31, 2016, amounts to approximately $466,000 and represents 1.3% of net assets.
(f) At December 31, 2016, the Portfolio held fair valued securities valued at approximately $466,000, representing 1.3% of net assets. These securities have been fair valued as determined in good faith under procedures established by and under the general supervision of the Fund's Directors.
(g) Centrally cleared option.
(h) Securities are available for collateral in connection with open foreign currency forward exchange contracts.
(i) At December 31, 2016, the aggregate cost for federal income tax purposes is approximately $33,180,000. The aggregate gross unrealized appreciation is approximately $3,535,000 and the aggregate gross unrealized depreciation is approximately $606,000, resulting in net unrealized appreciation of approximately $2,929,000.
@ Amount is less than 500.
ADR American Depositary Receipt.
The accompanying notes are an integral part of the financial statements.
7
Morgan Stanley Institutional Fund, Inc.
Annual Report — December 31, 2016
Portfolio of Investments (cont'd)
Global Discovery Portfolio
Foreign Currency Forward Exchange Contracts:
The Portfolio had the following foreign currency forward exchange contracts open at December 31, 2016:
Counterparty | | Contracts to
Deliver
(000) | | In Exchange
For
(000) | | Delivery
Date | | Unrealized
Appreciation
(000) | |
UBS AG | | EUR | 601 | | | $ | 673 | | | 1/13/17 | | $ | 40 | | |
UBS AG | | EUR | 106 | | | $ | 120 | | | 2/24/17 | | | 9 | | |
UBS AG | | EUR | 340 | | | $ | 367 | | | 5/15/17 | | | 7 | | |
UBS AG | | KRW | 765,055 | | | $ | 676 | | | 1/13/17 | | | 42 | | |
UBS AG | | KRW | 133,872 | | | $ | 119 | | | 2/24/17 | | | 9 | | |
UBS AG | | KRW | 418,670 | | | $ | 357 | | | 5/15/17 | | | 10 | | |
| | | | | | | | | $ | 117 | | |
EUR — Euro
KRW — South Korean Won
Portfolio Composition*
Classification | | Percentage of
Total Investments | |
Other** | | | 36.5 | % | |
Machinery | | | 13.9 | | |
Short-Term Investment | | | 13.4 | | |
Textiles, Apparel & Luxury Goods | | | 11.2 | | |
Media | | | 7.7 | | |
Hotels, Restaurants & Leisure | | | 6.9 | | |
Internet Software & Services | | | 5.4 | | |
Insurance | | | 5.0 | | |
Total Investments | | | 100.0 | %*** | |
* Percentages indicated are based upon total investments (excluding Securities held as Collateral on Loaned Securities) as of December 31, 2016.
** Industries and/or investment types representing less than 5% of total investments.
*** Does not include open foreign currency forward exchange contracts with total unrealized appreciation of approximately $117,000.
The accompanying notes are an integral part of the financial statements.
8
Morgan Stanley Institutional Fund, Inc.
Annual Report — December 31, 2016
Global Discovery Portfolio
Statement of Assets and Liabilities | | December 31, 2016
(000) | |
Assets: | |
Investments in Securities of Unaffiliated Issuers, at Value(1) (Cost $28,147) | | $ | 31,223 | | |
Investment in Security of Affiliated Issuer, at Value (Cost $4,886) | | | 4,886 | | |
Total Investments in Securities, at Value (Cost $33,033) | | | 36,109 | | |
Foreign Currency, at Value (Cost $28) | | | 28 | | |
Receivable for Investments Sold | | | 541 | | |
Receivable for Portfolio Shares Sold | | | 471 | | |
Unrealized Appreciation on Foreign Currency Forward Exchange Contracts | | | 117 | | |
Dividends Receivable | | | 12 | | |
Receivable from Affiliate | | | 1 | | |
Tax Reclaim Receivable | | | — | @ | |
Other Assets | | | 37 | | |
Total Assets | | | 37,316 | | |
Liabilities: | |
Payable for Investments Purchased | | | 795 | | |
Collateral on Securities Loaned, at Value | | | 74 | | |
Payable for Professional Fees | | | 51 | | |
Payable for Advisory Fees | | | 42 | | |
Payable for Shareholder Services Fees — Class A | | | 3 | | |
Payable for Distribution and Shareholder Services Fees — Class L | | | — | @ | |
Payable for Distribution and Shareholder Services Fees — Class C | | | 4 | | |
Payable for Custodian Fees | | | 6 | | |
Payable for Portfolio Shares Redeemed | | | 6 | | |
Payable for Transfer Agency Fees — Class I | | | 1 | | |
Payable for Transfer Agency Fees — Class A | | | 1 | | |
Payable for Transfer Agency Fees — Class L | | | — | @ | |
Payable for Transfer Agency Fees — Class C | | | 1 | | |
Payable for Administration Fees | | | 2 | | |
Payable for Sub Transfer Agency Fees — Class A | | | — | @ | |
Payable for Sub Transfer Agency Fees — Class L | | | — | @ | |
Payable for Sub Transfer Agency Fees — Class C | | | — | @ | |
Other Liabilities | | | 12 | | |
Total Liabilities | | | 998 | | |
Net Assets | | $ | 36,318 | | |
Net Assets Consist Of: | |
Paid-in-Capital | | $ | 32,848 | | |
Distributions in Excess of Net Investment Income | | | (46 | ) | |
Accumulated Net Realized Gain | | | 323 | | |
Unrealized Appreciation (Depreciation) on: | |
Investments | | | 3,076 | | |
Foreign Currency Forward Exchange Contracts | | | 117 | | |
Foreign Currency Translations | | | (— | @) | |
Net Assets | | $ | 36,318 | | |
The accompanying notes are an integral part of the financial statements.
9
Morgan Stanley Institutional Fund, Inc.
Annual Report — December 31, 2016
Global Discovery Portfolio
Statement of Assets and Liabilities (cont'd) | | December 31, 2016
(000) | |
CLASS I: | |
Net Assets | | $ | 12,802 | | |
| Shares Outstanding $0.001 par value shares of beneficial interest (unlimited shares authorized) (not in 000's) | | | 954,248 | | |
Net Asset Value, Offering and Redemption Price Per Share | | $ | 13.42 | | |
CLASS A: | |
Net Assets | | $ | 18,574 | | |
| Shares Outstanding $0.001 par value shares of beneficial interest (unlimited shares authorized) (not in 000's) | | | 1,389,651 | | |
Net Asset Value, Redemption Price Per Share | | $ | 13.37 | | |
Maximum Sales Load | | | 5.25 | % | |
Maximum Sales Charge | | $ | 0.74 | | |
Maximum Offering Price Per Share | | $ | 14.11 | | |
CLASS L: | |
Net Assets | | $ | 233 | | |
| Shares Outstanding $0.001 par value shares of beneficial interest (unlimited shares authorized) (not in 000's) | | | 17,510 | | |
Net Asset Value, Offering and Redemption Price Per Share | | $ | 13.28 | | |
CLASS C: | |
Net Assets | | $ | 4,709 | | |
| Shares Outstanding $0.001 par value shares of beneficial interest (unlimited shares authorized) (not in 000's) | | | 358,168 | | |
Net Asset Value, Offering and Redemption Price Per Share | | $ | 13.15 | | |
(1) Including:
Securities on Loan, at Value: | | $ | 84 | | |
@ Amount is less than $500.
The accompanying notes are an integral part of the financial statements.
10
Morgan Stanley Institutional Fund, Inc.
Annual Report — December 31, 2016
Global Discovery Portfolio
Statement of Operations | | Year Ended
December 31, 2016
(000) | |
Investment Income: | |
Dividends from Securities of Unaffiliated Issuers (Net of $16 of Foreign Taxes Withheld) | | $ | 219 | | |
Dividends from Securities of Affiliated Issuer (Note G) | | | 3 | | |
Income from Securities Loaned — Net | | | 3 | | |
Total Investment Income | | | 225 | | |
Expenses: | |
Advisory Fees (Note B) | | | 138 | | |
Professional Fees | | | 107 | | |
Registration Fees | | | 51 | | |
Shareholder Services Fees — Class A (Note D) | | | 17 | | |
Distribution and Shareholder Services Fees — Class L (Note D) | | | 2 | | |
Distribution and Shareholder Services Fees — Class C (Note D) | | | 12 | | |
Administration Fees (Note C) | | | 12 | | |
Shareholder Reporting Fees | | | 11 | | |
Transfer Agency Fees — Class I (Note E) | | | 3 | | |
Transfer Agency Fees — Class A (Note E) | | | 2 | | |
Transfer Agency Fees — Class L (Note E) | | | 2 | | |
Transfer Agency Fees — Class C (Note E) | | | 2 | | |
Custodian Fees (Note F) | | | 9 | | |
Sub Transfer Agency Fees — Class I | | | 2 | | |
Sub Transfer Agency Fees — Class A | | | 5 | | |
Sub Transfer Agency Fees — Class L | | | — | @ | |
Sub Transfer Agency Fees — Class C | | | — | @ | |
Pricing Fees | | | 6 | | |
Directors' Fees and Expenses | | | 2 | | |
Other Expenses | | | 18 | | |
Total Expenses | | | 401 | | |
Waiver of Advisory Fees (Note B) | | | (120 | ) | |
Reimbursement of Class Specific Expenses — Class I (Note B) | | | (5 | ) | |
Reimbursement of Class Specific Expenses — Class A (Note B) | | | (1 | ) | |
Reimbursement of Class Specific Expenses — Class L (Note B) | | | (2 | ) | |
Reimbursement of Class Specific Expenses — Class C (Note B) | | | (1 | ) | |
Rebate from Morgan Stanley Affiliate (Note G) | | | (2 | ) | |
Reimbursement of Custodian Fees (Note F) | | | (28 | ) | |
Net Expenses | | | 242 | | |
Net Investment Loss | | | (17 | ) | |
Realized Gain: | |
Investments Sold | | | 1,064 | | |
Foreign Currency Transactions | | | 4 | | |
Net Realized Gain | | | 1,068 | | |
Change in Unrealized Appreciation (Depreciation): | |
Investments | | | 3,559 | | |
Foreign Currency Forward Exchange Contracts | | | 117 | | |
Foreign Currency Translations | | | — | @ | |
Net Change in Unrealized Appreciation (Depreciation) | | | 3,676 | | |
Net Realized Gain and Change in Unrealized Appreciation (Depreciation) | | | 4,744 | | |
Net Increase in Net Assets Resulting from Operations | | $ | 4,727 | | |
@ Amount is less than $500.
The accompanying notes are an integral part of the financial statements.
11
Morgan Stanley Institutional Fund, Inc.
Annual Report — December 31, 2016
Global Discovery Portfolio
Statements of Changes in Net Assets | | Year Ended
December 31, 2016
(000) | | Year Ended
December 31, 2015
(000) | |
Increase (Decrease) in Net Assets: | |
Operations: | |
Net Investment Income (Loss) | | $ | (17 | ) | | $ | 51 | | |
Net Realized Gain | | | 1,068 | | | | 198 | | |
Net Change in Unrealized Appreciation (Depreciation) | | | 3,676 | | | | (498 | ) | |
Net Increase (Decrease) in Net Assets Resulting from Operations | | | 4,727 | | | | (249 | ) | |
Distributions from and/or in Excess of: | |
Class I: | |
Net Investment Income | | | (21 | ) | | | (55 | ) | |
Net Realized Gain | | | (204 | ) | | | — | | |
Class A: | |
Net Investment Income | | | (3 | ) | | | (66 | ) | |
Net Realized Gain | | | (265 | ) | | | — | | |
Class L: | |
Net Investment Income | | | — | | | | (2 | ) | |
Net Realized Gain | | | (4 | ) | | | — | | |
Class C: | |
Net Investment Income | | | — | | | | (5 | )* | |
Net Realized Gain | | | (82 | ) | | | — | | |
Total Distributions | | | (579 | ) | | | (128 | ) | |
Capital Share Transactions:(1) | |
Class I: | |
Subscribed | | | 8,858 | | | | 2,778 | | |
Distributions Reinvested | | | 224 | | | | 45 | | |
Redeemed | | | (2,138 | ) | | | (5,353 | ) | |
Class A: | |
Subscribed | | | 15,954 | | | | 3,385 | | |
Distributions Reinvested | | | 269 | | | | 63 | | |
Redeemed | | | (4,793 | ) | | | (729 | ) | |
Class L: | |
Exchanged | | | 7 | | | | — | | |
Subscribed | | | — | | | | 108 | | |
Distributions Reinvested | | | 4 | | | | 1 | | |
Redeemed | | | (115 | ) | | | (61 | ) | |
Class C: | |
Subscribed | | | 3,903 | | | | 467 | * | |
Distributions Reinvested | | | 82 | | | | 5 | * | |
Redeemed | | | (29 | ) | | | (— | @)* | |
Net Increase in Net Assets Resulting from Capital Share Transactions | | | 22,226 | | | | 709 | | |
Total Increase in Net Assets | | | 26,374 | | | | 332 | | |
Net Assets: | |
Beginning of Period | | | 9,944 | | | | 9,612 | | |
End of Period (Including Distributions in Excess of Net Investment Income of $(46) and $(10)) | | $ | 36,318 | | | $ | 9,944 | | |
The accompanying notes are an integral part of the financial statements.
12
Morgan Stanley Institutional Fund, Inc.
Annual Report — December 31, 2016
Global Discovery Portfolio
Statements of Changes in Net Assets (cont'd) | | Year Ended
December 31, 2016
(000) | | Year Ended
December 31, 2015
(000) | |
(1) Capital Share Transactions: | |
Class I: | |
Shares Subscribed | | | 731 | | | | 260 | | |
Shares Issued on Distributions Reinvested | | | 17 | | | | 5 | | |
Shares Redeemed | | | (180 | ) | | | (484 | ) | |
Net Increase (Decrease) in Class I Shares Outstanding | | | 568 | | | | (219 | ) | |
Class A: | |
Shares Subscribed | | | 1,277 | | | | 321 | | |
Shares Issued on Distributions Reinvested | | | 20 | | | | 6 | | |
Shares Redeemed | | | (444 | ) | | | (69 | ) | |
Net Increase in Class A Shares Outstanding | | | 853 | | | | 258 | | |
Class L: | |
Shares Exchanged | | | 1 | | | | — | | |
Shares Subscribed | | | — | | | | 11 | | |
Shares Issued on Distributions Reinvested | | | — | @@ | | | — | @@ | |
Shares Redeemed | | | (9 | ) | | | (6 | ) | |
Net Increase (Decrease) in Class L Shares Outstanding | | | (8 | ) | | | 5 | | |
Class C: | |
Shares Subscribed | | | 309 | | | | 44 | * | |
Shares Issued on Distributions Reinvested | | | 6 | | | | 1 | * | |
Shares Redeemed | | | (2 | ) | | | (— | @@)* | |
Net Increase in Class C Shares Outstanding | | | 313 | | | | 45 | | |
* For the period April 30, 2015 through December 31, 2015.
@ Amount is less than $500.
@@ Amount is less than 500 shares.
The accompanying notes are an integral part of the financial statements.
13
Morgan Stanley Institutional Fund, Inc.
Annual Report — December 31, 2016
Financial Highlights
Global Discovery Portfolio
| | | Class I | |
| | | Year Ended December 31, | |
Selected Per Share Data and Ratios | | 2016(1) | | 2015 | | 2014 | | 2013 | | 2012 | |
Net Asset Value, Beginning of Period | | $ | 10.02 | | | $ | 10.62 | | | $ | 13.70 | | | $ | 11.11 | | | $ | 9.06 | | |
Income (Loss) from Investment Operations: | |
Net Investment Income (Loss) (2) | | | 0.02 | | | | 0.10 | | | | 0.48 | | | | (0.01 | ) | | | 0.25 | | |
Net Realized and Unrealized Gain (Loss) | | | 3.64 | | | | (0.55 | ) | | | (0.77 | ) | | | 4.43 | | | | 2.62 | | |
Total from Investment Operations | | | 3.66 | | | | (0.45 | ) | | | (0.29 | ) | | | 4.42 | | | | 2.87 | | |
Distributions from and/or in Excess of: | |
Net Investment Income | | | (0.02 | ) | | | (0.15 | ) | | | (0.55 | ) | | | (0.07 | ) | | | (0.30 | ) | |
Net Realized Gain | | | (0.24 | ) | | | — | | | | (1.95 | ) | | | (1.76 | ) | | | (0.52 | ) | |
Paid-in-Capital | | | — | | | | — | | | | (0.29 | ) | | | — | | | | — | | |
Total Distributions | | | (0.26 | ) | | | (0.15 | ) | | | (2.79 | ) | | | (1.83 | ) | | | (0.82 | ) | |
Net Asset Value, End of Period | | $ | 13.42 | | | $ | 10.02 | | | $ | 10.62 | | | $ | 13.70 | | | $ | 11.11 | | |
Total Return (3) | | | 36.51 | % | | | (4.27 | )% | | | (1.96 | )% | | | 40.72 | % | | | 31.64 | % | |
Ratios and Supplemental Data: | |
Net Assets, End of Period (Thousands) | | $ | 12,802 | | | $ | 3,867 | | | $ | 6,421 | | | $ | 8,493 | | | $ | 3,432 | | |
Ratio of Expenses to Average Net Assets (6) | | | 1.34 | %(4) | | | 1.34 | %(4) | | | 1.34 | %(4) | | | 1.34 | %(4) | | | 1.35 | %(4) | |
Ratio of Net Investment Income (Loss) to Average Net Assets (6) | | | 0.17 | %(4) | | | 0.88 | %(4) | | | 3.70 | %(4) | | | (0.07 | )%(4) | | | 2.41 | %(4) | |
Ratio of Rebate from Morgan Stanley Affiliates to Average Net Assets | | | 0.01 | % | | | 0.01 | % | | | 0.01 | % | | | 0.01 | % | | | 0.00 | %(5) | |
Portfolio Turnover Rate | | | 64 | % | | | 118 | % | | | 84 | % | | | 100 | % | | | 96 | % | |
(6) Supplemental Information on the Ratios to Average Net Assets: | |
Ratios Before Expense Limitation: | |
Expenses to Average Net Assets | | | 2.38 | % | | | 3.09 | % | | | 2.65 | % | | | 3.65 | % | | | 4.33 | % | |
Net Investment Income (Loss) to Average Net Assets | | | (0.87 | )% | | | (0.87 | )% | | | 2.39 | % | | | (2.38 | )% | | | (0.57 | )% | |
(1) Refer to Note F in the Notes to Financial Statements for discussion of prior period custodian out-of-pocket expenses that were reimbursed in the current period. The amount of the reimbursement was immaterial on a per share basis and did not impact the total return of Class I shares. The Ratio of Expenses to Average Net Assets and the Ratio of Net Investment Income to Average Net Assets would be unchanged as the reimbursement of custodian fees was offset against current period expense waivers/reimbursements with no impact to net expenses or net investment income.
(2) Per share amount is based on average shares outstanding.
(3) Calculated based on the net asset value as of the last business day of the period.
(4) The Ratios of Expenses and Net Investment Income (Loss) reflect the rebate of certain Portfolio expenses in connection with the investments in Morgan Stanley affiliates during the period. The effect of the rebate on the ratios is disclosed in the above table as "Ratio of Rebate from Morgan Stanley Affiliates to Average Net Assets."
(5) Amount is less than 0.005%.
The accompanying notes are an integral part of the financial statements.
14
Morgan Stanley Institutional Fund, Inc.
Annual Report — December 31, 2016
Financial Highlights
Global Discovery Portfolio
| | | Class A | |
| | | Year Ended December 31, | |
Selected Per Share Data and Ratios | | 2016(1) | | 2015 | | 2014 | | 2013 | | 2012 | |
Net Asset Value, Beginning of Period | | $ | 10.01 | | | $ | 10.62 | | | $ | 13.69 | | | $ | 11.11 | | | $ | 9.07 | | |
Income (Loss) from Investment Operations: | |
Net Investment Income (Loss) (2) | | | (0.03 | ) | | | 0.02 | | | | 0.44 | | | | (0.09 | ) | | | 0.22 | | |
Net Realized and Unrealized Gain (Loss) | | | 3.63 | | | | (0.51 | ) | | | (0.76 | ) | | | 4.47 | | | | 2.62 | | |
Total from Investment Operations | | | 3.60 | | | | (0.49 | ) | | | (0.32 | ) | | | 4.38 | | | | 2.84 | | |
Distributions from and/or in Excess of: | |
Net Investment Income | | | (0.00 | )(3) | | | (0.12 | ) | | | (0.51 | ) | | | (0.04 | ) | | | (0.28 | ) | |
Net Realized Gain | | | (0.24 | ) | | | — | | | | (1.95 | ) | | | (1.76 | ) | | | (0.52 | ) | |
Paid-in-Capital | | | — | | | | — | | | | (0.29 | ) | | | — | | | | — | | |
Total Distributions | | | (0.24 | ) | | | (0.12 | ) | | | (2.75 | ) | | | (1.80 | ) | | | (0.80 | ) | |
Net Asset Value, End of Period | | $ | 13.37 | | | $ | 10.01 | | | $ | 10.62 | | | $ | 13.69 | | | $ | 11.11 | | |
Total Return (4) | | | 36.04 | % | | | (4.59 | )% | | | (2.25 | )% | | | 40.33 | % | | | 31.40 | % | |
Ratios and Supplemental Data: | |
Net Assets, End of Period (Thousands) | | $ | 18,574 | | | $ | 5,375 | | | $ | 2,965 | | | $ | 1,455 | | | $ | 137 | | |
Ratio of Expenses to Average Net Assets (8) | | | 1.69 | %(5) | | | 1.69 | %(5) | | | 1.69 | %(5) | | | 1.65 | %(5)(6) | | | 1.60 | %(5) | |
Ratio of Net Investment Income (Loss) to Average Net Assets (8) | | | (0.28 | )%(5) | | | 0.16 | %(5) | | | 3.35 | %(5) | | | (0.66 | )%(5) | | | 2.16 | %(5) | |
Ratio of Rebate from Morgan Stanley Affiliates to Average Net Assets | | | 0.01 | % | | | 0.01 | % | | | 0.01 | % | | | 0.01 | % | | | 0.00 | %(7) | |
Portfolio Turnover Rate | | | 64 | % | | | 118 | % | | | 84 | % | | | 100 | % | | | 96 | % | |
(8) Supplemental Information on the Ratios to Average Net Assets: | |
Ratios Before Expense Limitation: | |
Expenses to Average Net Assets | | | 2.67 | % | | | 3.52 | % | | | 3.02 | % | | | 3.87 | % | | | 4.58 | % | |
Net Investment Income (Loss) to Average Net Assets | | | (1.26 | )% | | | (1.67 | )% | | | 2.02 | % | | | (2.88 | )% | | | (0.82 | )% | |
(1) Refer to Note F in the Notes to Financial Statements for discussion of prior period custodian out-of-pocket expenses that were reimbursed in the current period. The amount of the reimbursement was immaterial on a per share basis and did not impact the total return of Class A shares. The Ratio of Expenses to Average Net Assets and the Ratio of Net Investment Loss to Average Net Assets would be unchanged as the reimbursement of custodian fees was offset against current period expense waivers/reimbursements with no impact to net expenses or net investment loss.
(2) Per share amount is based on average shares outstanding.
(3) Amount is less than $0.005 per share.
(4) Calculated based on the net asset value which does not reflect sales charges, if applicable, as of the last business day of the period.
(5) The Ratios of Expenses and Net Investment Income (Loss) reflect the rebate of certain Portfolio expenses in connection with the investments in Morgan Stanley affiliates during the period. The effect of the rebate on the ratios is disclosed in the above table as "Ratio of Rebate from Morgan Stanley Affiliates to Average Net Assets."
(6) Effective September 16, 2013, the Adviser has agreed to limit the ratio of expenses to average net assets to the maximum ratio of 1.70% for Class A shares. Prior to September 16, 2013, the maximum ratio was 1.60% for Class A shares.
(7) Amount is less than 0.005%.
The accompanying notes are an integral part of the financial statements.
15
Morgan Stanley Institutional Fund, Inc.
Annual Report — December 31, 2016
Financial Highlights
Global Discovery Portfolio
| | | Class L | |
| | | Year Ended December 31, | |
Selected Per Share Data and Ratios | | 2016(1) | | 2015 | | 2014 | | 2013 | | 2012 | |
Net Asset Value, Beginning of Period | | $ | 9.99 | | | $ | 10.59 | | | $ | 13.64 | | | $ | 11.11 | | | $ | 9.07 | | |
Income (Loss) from Investment Operations: | |
Net Investment Income (Loss) (2) | | | (0.09 | ) | | | (0.03 | ) | | | 0.37 | | | | (0.14 | ) | | | 0.17 | | |
Net Realized and Unrealized Gain (Loss) | | | 3.62 | | | | (0.51 | ) | | | (0.76 | ) | | | 4.45 | | | | 2.61 | | |
Total from Investment Operations | | | 3.53 | | | | (0.54 | ) | | | (0.39 | ) | | | 4.31 | | | | 2.78 | | |
Distributions from and/or in Excess of: | |
Net Investment Income | | | — | | | | (0.06 | ) | | | (0.42 | ) | | | (0.02 | ) | | | (0.22 | ) | |
Net Realized Gain | | | (0.24 | ) | | | — | | | | (1.95 | ) | | | (1.76 | ) | | | (0.52 | ) | |
Paid-in-Capital | | | — | | | | — | | | | (0.29 | ) | | | — | | | | — | | |
Total Distributions | | | (0.24 | ) | | | (0.06 | ) | | | (2.66 | ) | | | (1.78 | ) | | | (0.74 | ) | |
Net Asset Value, End of Period | | $ | 13.28 | | | $ | 9.99 | | | $ | 10.59 | | | $ | 13.64 | | | $ | 11.11 | | |
Total Return (3) | | | 35.38 | % | | | (5.05 | )% | | | (2.81 | )% | | | 39.68 | % | | | 30.62 | % | |
Ratios and Supplemental Data: | |
Net Assets, End of Period (Thousands) | | $ | 233 | | | $ | 259 | | | $ | 226 | | | $ | 269 | | | $ | 111 | | |
Ratio of Expenses to Average Net Assets (7) | | | 2.19 | %(4) | | | 2.19 | %(4) | | | 2.19 | %(4) | | | 2.13 | %(4)(5) | | | 2.10 | %(4) | |
Ratio of Net Investment Income (Loss) to Average Net Assets (7) | | | (0.80 | )%(4) | | | (0.26 | )%(4) | | | 2.85 | %(4) | | | (1.05 | )%(4) | | | 1.66 | %(4) | |
Ratio of Rebate from Morgan Stanley Affiliates to Average Net Assets | | | 0.01 | % | | | 0.01 | % | | | 0.01 | % | | | 0.01 | % | | | 0.00 | %(6) | |
Portfolio Turnover Rate | | | 64 | % | | | 118 | % | | | 84 | % | | | 100 | % | | | 96 | % | |
(7) Supplemental Information on the Ratios to Average Net Assets: | |
Ratios Before Expense Limitation: | |
Expenses to Average Net Assets | | | 3.81 | % | | | 4.55 | % | | | 4.08 | % | | | 4.62 | % | | | 5.08 | % | |
Net Investment Income (Loss) to Average Net Assets | | | (2.42 | )% | | | (2.62 | )% | | | 0.96 | % | | | (3.54 | )% | | | (1.32 | )% | |
(1) Refer to Note F in the Notes to Financial Statements for discussion of prior period custodian out-of-pocket expenses that were reimbursed in the current period. The amount of the reimbursement was immaterial on a per share basis and did not impact the total return of Class L shares. The Ratio of Expenses to Average Net Assets and the Ratio of Net Investment Loss to Average Net Assets would be unchanged as the reimbursement of custodian fees was offset against current period expense waivers/reimbursements with no impact to net expenses or net investment loss.
(2) Per share amount is based on average shares outstanding.
(3) Calculated based on the net asset value as of the last business day of the period.
(4) The Ratios of Expenses and Net Investment Income (Loss) reflect the rebate of certain Portfolio expenses in connection with the investments in Morgan Stanley affiliates during the period. The effect of the rebate on the ratios is disclosed in the above table as "Ratio of Rebate from Morgan Stanley Affiliates to Average Net Assets."
(5) Effective September 16, 2013, the Adviser has agreed to limit the ratio of expenses to average net assets to the maximum ratio of 2.20% for Class L shares. Prior to September 16, 2013, the maximum ratio was 2.10% for Class L shares.
(6) Amount is less than 0.005%.
The accompanying notes are an integral part of the financial statements.
16
Morgan Stanley Institutional Fund, Inc.
Annual Report — December 31, 2016
Financial Highlights
Global Discovery Portfolio
| | | Class C | |
Selected Per Share Data and Ratios | | Year Ended
December 31, 2016(1) | | Period from
April 30, 2015(2) to
December 31, 2015 | |
Net Asset Value, Beginning of Period | | $ | 9.92 | | | $ | 11.07 | | |
Income (Loss) from Investment Operations: | |
Net Investment Loss (3) | | | (0.10 | ) | | | (0.08 | ) | |
Net Realized and Unrealized Gain(Loss) | | | 3.57 | | | | (0.95 | ) | |
Total from Investment Operations | | | 3.47 | | | | (1.03 | ) | |
Distributions from and/or in Excess of: | |
Net Investment Income | | | — | | | | (0.12 | ) | |
Net Realized Gain | | | (0.24 | ) | | | — | | |
Total Distributions | | | (0.24 | ) | | | (0.12 | ) | |
Net Asset Value, End of Period | | $ | 13.15 | | | $ | 9.92 | | |
Total Return (4) | | | 35.03 | % | | | (9.28 | )%(7) | |
Ratios and Supplemental Data: | |
Net Assets, End of Period (Thousands) | | $ | 4,709 | | | $ | 443 | | |
Ratio of Expenses to Average Net Assets (9) | | | 2.43 | %(5) | | | 2.45 | %(5)(8) | |
Ratio of Net Investment Loss to Average Net Assets (9) | | | (0.83 | )%(5) | | | (1.21 | )%(5)(8) | |
Ratio of Rebate from Morgan Stanley Affiliates to Average Net Assets | | | 0.02 | % | | | 0.00 | %(6)(8) | |
Portfolio Turnover Rate | | | 64 | % | | | 118 | % | |
(9) Supplemental Information on the Ratios to Average Net Assets: | |
Ratios Before Expense Limitation: | |
Expense to Average Net Assets | | | 3.53 | % | | | 5.66 | %(8) | |
Net Investment Loss to Average Net Assets | | | (1.93 | )% | | | (4.42 | )%(8) | |
(1) Refer to Note F in the Notes to Financial Statements for discussion of prior period custodian out-of-pocket expenses that were reimbursed in the current period. The amount of the reimbursement was immaterial on a per share basis and did not impact the total return of Class C shares. The Ratio of Expenses to Average Net Assets and the Ratio of Net Investment Loss to Average Net Assets would be unchanged as the reimbursement of custodian fees was offset against current period expense waivers/reimbursements with no impact to net expenses or net investment loss.
(2) Commencement of Offering.
(3) Per share amount is based on average shares outstanding.
(4) Calculated based on the net asset value which does not reflect sales charges, if applicable, as of the last business day of the period.
(5) The Ratios of Expenses and Net Investment Loss reflect the rebate of certain Portfolio expenses in connection with the investments in Morgan Stanley affiliates during the period. The effect of the rebate on the ratios is disclosed in the above table as "Ratio of Rebate from Morgan Stanley Affiliates to Average Net Assets."
(6) Amount is less than 0.005%.
(7) Not Annualized.
(8) Annualized.
The accompanying notes are an integral part of the financial statements.
17
Morgan Stanley Institutional Fund, Inc.
Annual Report — December 31, 2016
Notes to Financial Statements
Morgan Stanley Institutional Fund, Inc. (the "Fund") is registered under the Investment Company Act of 1940, as amended (the "Act"), as an open-end management investment company. The Fund is comprised of twenty-nine separate, active, diversified and non-diversified portfolios (individually referred to as a "Portfolio", collectively as the "Portfolios"). The Fund applies investment company accounting and reporting guidance.
The accompanying financial statements relate to the Global Discovery Portfolio. The Portfolio seeks long-term capital appreciation.
The Portfolio offers four classes of shares — Class I, Class A, Class L and Class C. On April 30, 2015, the Portfolio suspended offering Class L shares. Existing Class L shareholders may invest through reinvestment of dividends and distributions.
A. Significant Accounting Policies: The following significant accounting policies are in conformity with U.S. generally accepted accounting principles ("GAAP"). Such policies are consistently followed by the Fund in the preparation of its financial statements. GAAP may require management to make estimates and assumptions that affect the reported amounts and disclosures in the financial statements. Actual results may differ from those estimates.
1. Security Valuation: (1) An equity portfolio security listed or traded on an exchange is valued at its latest reported sales price (or at the exchange official closing price if such exchange reports an official closing price), and if there were no sales on a given day and if there is no official exchange closing price for that day, the security is valued at the mean between the last reported bid and asked prices if such bid and asked prices are available on the relevant exchanges; (2) all other equity portfolio securities for which over-the-counter ("OTC") market quotations are readily available are valued at the latest reported sales price (or at the market official closing price if such market reports an official closing price), and if there was no trading in the security on a given day and if there is no official closing price from relevant markets for that day, the security is valued at the mean between the last reported bid and asked prices if such bid and asked prices are available on the relevant markets. Listed equity securities not traded on the valuation date with no reported bid and asked prices available on the exchange are valued at the mean between the current bid and asked prices obtained from one
or more reputable brokers or dealers. An unlisted equity security that does not trade on the valuation date and for which bid and asked prices from the relevant markets are unavailable is valued at the mean between the current bid and asked prices obtained from one or more reputable brokers or dealers. In cases where a security is traded on more than one exchange, the security is valued on the exchange designated as the primary market; (3) Listed options are valued at the last reported sales price on the exchange on which they are listed (or at the exchange official closing price if such exchange reports an official closing price). If an official closing price or last reported sale price is unavailable, the listed option should be fair valued at the mean between its latest bid and ask prices. Unlisted options are valued at the mean between their latest bid and ask prices from a broker/dealer or valued by a pricing service/vendor; (4) certain portfolio securities may be valued by an outside pricing service/vendor approved by the Fund's Board of Directors (the "Directors"). The pricing service/vendor may employ a pricing model that takes into account, among other things, bids, yield spreads, and/or other market data and specific security characteristics. Alternatively, if a valuation is not available from an outside pricing service/vendor, and the security trades on an exchange, the security may be valued at its latest reported sale price (or at the exchange official closing price if such exchange reports an official closing price), prior to the time when assets are valued. If there are no sales on a given day and if there is no official exchange closing price for that day, the security is valued at the mean between the last reported bid and asked prices if such bid and asked prices are available in the relevant exchanges; (5) when market quotations are not readily available, including circumstances under which Morgan Stanley Investment Management Inc. (the "Adviser") determines that the closing price, last sale price or the mean between the last reported bid and asked prices are not reflective of a security's market value, portfolio securities are valued at their fair value as determined in good faith under procedures established by and under the general supervision of the Directors. Occasionally, developments affecting the closing prices of securities and other assets may occur between the times at which valuations of such securities are determined (that is, close of the foreign market on which the securities trade) and the close of business of the New York Stock Exchange ("NYSE"). If developments occur during such periods that are expected to materially affect the
18
Morgan Stanley Institutional Fund, Inc.
Annual Report — December 31, 2016
Notes to Financial Statements (cont'd)
value of such securities, such valuations may be adjusted to reflect the estimated fair value of such securities as of the close of the NYSE, as determined in good faith by the Directors or by the Adviser using a pricing service and/or procedures approved by the Directors; (6) quotations of foreign portfolio securities, other assets and liabilities and forward contracts stated in foreign currency are translated into U.S. dollar equivalents at the prevailing market rates prior to the close of the NYSE; and (7) investments in mutual funds, including the Morgan Stanley Institutional Liquidity Funds, are valued at the net asset value ("NAV") as of the close of each business day.
The Directors have responsibility for determining in good faith the fair value of the investments, and the Directors may appoint others, such as the Fund's Adviser or a valuation committee, to assist the Directors in determining fair value and to make the actual calculations pursuant to the fair valuation methodologies previously approved by the Directors. Under procedures approved by the Directors, the Fund's Adviser has formed a Valuation Committee whose members are approved by the Directors. The Valuation Committee provides administration and oversight of the Fund's valuation policies and procedures, which are reviewed at least annually by the Directors. These procedures allow the Fund to utilize independent pricing services, quotations from securities and financial instrument dealers, and other market sources to determine fair value.
The Fund has procedures to determine the fair value of securities and other financial instruments for which market prices are not readily available. Under these procedures, the Valuation Committee convenes on a regular and ad hoc basis to review such securities and considers a number of factors, including valuation methodologies and significant unobservable valuation inputs, when arriving at fair value. The Valuation Committee may employ a market-based approach which may use related or comparable assets or liabilities, recent transactions, market multiples, book values, and other relevant information for the investment to determine the fair value of the investment. An income-based valuation approach may also be used in which the anticipated future cash flows of the investment are discounted to calculate fair value. Discounts may also be applied due to the nature or duration of any restrictions on the disposition of the investments. Due to the inherent uncertainty of valuations of such investments, the fair values may differ
significantly from the values that would have been used had an active market existed. The Valuation Committee employs various methods for calibrating these valuation approaches including a regular review of valuation methodologies, key inputs and assumptions, transactional back-testing or disposition analysis, and reviews of any related market activity.
2. Fair Value Measurement: Financial Accounting Standards Board ("FASB") Accounting Standards CodificationTM ("ASC") 820, "Fair Value Measurement" ("ASC 820"), defines fair value as the value that the Fund would receive to sell an investment or pay to transfer a liability in a timely transaction with an independent buyer in the principal market, or in the absence of a principal market, the most advantageous market for the investment or liability. ASC 820 establishes a three-tier hierarchy to distinguish between (1) inputs that reflect the assumptions market participants would use in valuing an asset or liability developed based on market data obtained from sources independent of the reporting entity (observable inputs) and (2) inputs that reflect the reporting entity's own assumptions about the assumptions market participants would use in valuing an asset or liability developed based on the best information available in the circumstances (unobservable inputs) and to establish classification of fair value measurements for disclosure purposes. Various inputs are used in determining the value of the Fund's investments. The inputs are summarized in the three broad levels listed below.
• Level 1 – unadjusted quoted prices in active markets for identical investments
• Level 2 – other significant observable inputs (including quoted prices for similar investments, interest rates, prepayment speeds, credit risk, etc.)
• Level 3 – significant unobservable inputs including the Fund's own assumptions in determining the fair value of investments. Factors considered in making this determination may include, but are not limited to, information obtained by contacting the issuer, analysts, or the appropriate stock exchange (for exchange-traded securities), analysis of the issuer's financial statements or other available documents and, if necessary, available
19
Morgan Stanley Institutional Fund, Inc.
Annual Report — December 31, 2016
Notes to Financial Statements (cont'd)
information concerning other securities in similar circumstances
The inputs or methodology used for valuing securities are not necessarily an indication of the risk associated with investing in those securities and the determination of the significance of a particular input to the fair value measurement in its entirety requires judgment and considers factors specific to each security.
The following is a summary of the inputs used to value the Portfolio's investments as of December 31, 2016.
Investment Type | | Level 1
Unadjusted
quoted
prices
(000) | | Level 2
Other
significant
observable
inputs
(000) | | Level 3
Significant
unobservable
inputs
(000) | | Total
(000) | |
Assets: | |
Common Stocks | |
Aerospace & Defense | | $ | 1,047 | | | $ | — | | | $ | — | | | $ | 1,047 | | |
Automobiles | | | 856 | | | | — | | | | — | | | | 856 | | |
Capital Markets | | | 927 | | | | — | | | | — | | | | 927 | | |
Chemicals | | | 1,367 | | | | — | | | | — | | | | 1,367 | | |
Commercial Services &
Supplies | | | 1,397 | | | | — | | | | — | | | | 1,397 | | |
Diversified Consumer
Services | | | 235 | | | | — | | | | — | | | | 235 | | |
Diversified Financial
Services | | | 356 | | | | — | | | | — | | | | 356 | | |
Energy Equipment &
Services | | | 674 | | | | — | | | | — | | | | 674 | | |
Health Care Equipment &
Supplies | | | 687 | | | | — | | | | — | | | | 687 | | |
Hotels, Restaurants &
Leisure | | | 2,416 | | | | — | | | | — | | | | 2,416 | | |
Industrial Conglomerates | | | 527 | | | | — | | | | — | | | | 527 | | |
Insurance | | | 1,792 | | | | — | | | | — | | | | 1,792 | | |
Internet & Direct
Marketing Retail | | | 88 | | | | — | | | | — | | | | 88 | | |
Internet Software &
Services | | | 1,920 | | | | — | | | | 24 | | | | 1,944 | | |
Machinery | | | 4,999 | | | | — | | | | — | | | | 4,999 | | |
Marine | | | 550 | | | | — | | | | — | | | | 550 | | |
Media | | | 2,772 | | | | — | | | | — | | | | 2,772 | | |
Metals & Mining | | | 706 | | | | — | | | | — | | | | 706 | | |
Oil, Gas & Consumable
Fuels | | | 396 | | | | — | | | | — | | | | 396 | | |
Real Estate Management &
Development | | | 229 | | | | — | | | | — | | | | 229 | | |
Specialty Retail | | | 251 | | | | — | | | | — | | | | 251 | | |
Textiles, Apparel &
Luxury Goods | | | 4,041 | | | | — | | | | — | | | | 4,041 | | |
Trading Companies &
Distributors | | | 595 | | | | — | | | | — | | | | 595 | | |
Transportation
Infrastructure | | | 1,416 | | | | — | | | | — | | | | 1,416 | | |
Total Common Stocks | | | 30,244 | | | | — | | | | 24 | | | | 30,268 | | |
Preferred Stocks | | | — | | | | — | | | | 440 | | | | 440 | | |
Convertible Preferred
Stock | | | — | | | | — | | | | 2 | | | | 2 | | |
Participation Note | | | 4 | | | | — | | | | — | | | | 4 | | |
Call Options Purchased | | | 494 | | | | — | | | | — | | | | 494 | | |
Investment Type | | Level 1
Unadjusted
quoted
prices
(000) | | Level 2
Other
significant
observable
inputs
(000) | | Level 3
Significant
unobservable
inputs
(000) | | Total
(000) | |
Short-Term Investments | |
Investment Company | | $ | 4,886 | | | $ | — | | | $ | — | | | $ | 4,886 | | |
Repurchase Agreements | | | — | | | | 15 | | | | — | | | | 15 | | |
Total Short-Term
Investments | | | 4,886 | | | | 15 | | | | — | | | | 4,901 | | |
Foreign Currency Forward
Exchange Contracts | | | — | | | | 117 | | | | — | | | | 117 | | |
Total Assets | | $ | 35,628 | | | $ | 132 | | | $ | 466 | | | $ | 36,226 | | |
Transfers between investment levels may occur as the markets fluctuate and/or the availability of data used in an investment's valuation changes. The Portfolio recognizes transfers between the levels as of the end of the period. As of December 31, 2016, securities with a total value of approximately $8,563,000 transferred from Level 2 to Level 1. Securities that were valued using other significant observable inputs at December 31, 2015 were valued using unadjusted quoted prices at December 31, 2016. At December 31, 2015, the fair value of certain securities were adjusted due to developments which occurred between the time of the close of the foreign markets on which they trade and the close of business on the NYSE which resulted in their Level 2 classification.
Following is a reconciliation of investments in which significant unobservable inputs (Level 3) were used in determining fair value.
| | | Common
Stock
(000) | | Preferred
Stocks
(000) | | Convertible
Preferred
Stock
(000) | |
Beginning Balance | | $ | 39 | | | $ | 578 | | | $ | 4 | | |
Purchases | | | — | | | | — | | | | — | | |
Sales | | | — | | | | — | | | | — | | |
Amortization of discount | | | — | | | | — | | | | — | | |
Transfers in | | | — | | | | — | | | | — | | |
Transfers out | | | — | | | | — | | | | — | | |
Corporate actions | | | — | | | | — | | | | — | | |
Change in unrealized appreciation
(depreciation) | | | (15 | ) | | | (138 | ) | | | (2 | ) | |
Realized gains (losses) | | | — | | | | — | | | | — | | |
Ending Balance | | $ | 24 | | | $ | 440 | | | $ | 2 | | |
Net change in unrealized appreciation
(depreciation) from investments still
held as of December 31, 2016 | | $ | (15 | ) | | $ | (138 | ) | | $ | (2 | ) | |
20
Morgan Stanley Institutional Fund, Inc.
Annual Report — December 31, 2016
Notes to Financial Statements (cont'd)
The following table presents additional information about valuation techniques and inputs used for investments that are measured at fair value and categorized within Level 3 as of December 31, 2016. Various valuation techniques were used in the valuation of certain investments and weighted based on the level of significance.
| | | Fair Value at
December 31, 2016
(000) | | Valuation
Technique | | Unobservable
Input | | Range | | Selected
Value | | Impact to
Valuation from an
Increase in Input | |
Hotels, Restaurants & Leisure | |
Preferred Stock | | $ | 65 | | | Discounted Cash Flow | | Weighted Average
Cost of Capital | | | 20.0 | % | | | 22.0 | % | | | 21.0 | % | | Decrease | |
| | | | | | | Perpetual Growth Rate | | | 2.5 | % | | | 3.5 | % | | | 3.0 | % | | Increase | |
| | | | | Market Comparable
Companies | | Enterprise Value/
Revenue | | | 1.9 | x | | | 5.5 | x | | | 3.2 | x | | Increase | |
| | | | | | | Discount for Lack of
Marketability | | | 20.0 | % | | | 20.0 | % | | | 20.0 | % | | Decrease | |
Internet & Direct Marketing Retail | |
Preferred Stocks | | $ | 202 | | | Market Transaction
Method | | Precedent Transaction | | $ | 105.00 | | | $ | 105.00 | | | $ | 105.00 | | | Increase | |
| | | | | Discounted Cash Flow | | Weighted Average
Cost of Capital | | | 15.5 | % | | | 17.5 | % | | | 16.5 | % | | Decrease | |
| | | | | | | Perpetual Growth Rate | | | 3.0 | % | | | 4.0 | % | | | 3.5 | % | | Increase | |
| | | | | Market Comparable
Companies | | Enterprise Value/
Revenue | | | 9.8 | x | | | 16.2 | x | | | 12.8 | x | | Increase | |
| | | | | | | Discount for Lack of
Marketability | | | 20.0 | % | | | 20.0 | % | | | 20.0 | % | | Decrease | |
| | | $ | 96 | | | Discounted Cash Flow | | Weighted Average
Cost of Capital | | | 17.5 | % | | | 19.5 | % | | | 18.5 | % | | Decrease | |
| | | | | | | Perpetual Growth Rate | | | 3.5 | % | | | 4.5 | % | | | 4.0 | % | | Increase | |
| | | | | Market Comparable
Companies | | Enterprise Value/
Revenue | | | 1.1 | x | | | 2.8 | x | | | 2.2 | x | | Increase | |
| | | | | | | Discount for Lack of
Marketability | | | 20.0 | % | | | 20.0 | % | | | 20.0 | % | | Decrease | |
Internet Software & Services | |
Common Stock | | $ | 24 | | | Discounted Cash Flow | | Weighted Average
Cost of Capital | | | 18.0 | % | | | 20.0 | % | | | 19.0 | % | | Decrease | |
| | | | | | | Perpetual Growth Rate | | | 2.5 | % | | | 3.5 | % | | | 3.0 | % | | Increase | |
Convertible
Preferred Stock | | $ | 2 | | | Market Comparable
Companies | | Enterprise Value/
Revenue | | | 4.1 | x | | | 11.2 | x | | | 5.5 | x | | Increase | |
| | | | | | | Discount for Lack of
Marketability | | | 20.0 | % | | | 20.0 | % | | | 20.0 | % | | Decrease | |
21
Morgan Stanley Institutional Fund, Inc.
Annual Report — December 31, 2016
Notes to Financial Statements (cont'd)
| | | Fair Value at
December 31, 2016
(000) | | Valuation
Technique | | Unobservable
Input | | Range | | Selected
Value | | Impact to
Valuation from an
Increase in Input | |
Software | |
Preferred Stocks | | $ | 33 | | | Discounted Cash Flow | | Weighted Average
Cost of Capital | | | 19.0 | % | | | 21.0 | % | | | 20.0 | % | | Decrease | |
| | | | | | | Perpetual Growth Rate | | | 3.0 | % | | | 4.0 | % | | | 3.5 | % | | Increase | |
| | | | | Market Comparable
Companies | | Enterprise Value/
Revenue | | | 2.9 | x | | | 5.6 | x | | | 2.9 | x | | Increase | |
| | | | | | | Discount for Lack of
Marketability | | | 20.0 | % | | | 20.0 | % | | | 20.0 | % | | Decrease | |
| | | $ | 20 | | | Discounted Cash Flow | | Weighted Average
Cost of Capital | | | 19.0 | % | | | 21.0 | % | | | 20.0 | % | | Decrease | |
| | | | | | | Perpetual Growth Rate | | | 3.0 | % | | | 4.0 | % | | | 3.5 | % | | Increase | |
| | | | | Market Comparable
Companies | | Enterprise Value/
Revenue | | | 4.8 | x | | | 6.6 | x | | | 5.0 | x | | Increase | |
| | | | | | | Discount for Lack of
Marketability | | | 20.0 | % | | | 20.0 | % | | | 20.0 | % | | Decrease | |
| | | $ | 24 | | | Discounted Cash Flow | | Weighted Average
Cost of Capital | | | 15.5 | % | | | 17.5 | % | | | 16.5 | % | | Decrease | |
| | | | | | | Perpetual Growth Rate | | | 2.5 | % | | | 3.5 | % | | | 3.0 | % | | Increase | |
| | | | | Market Comparable
Companies | | Enterprise Value/
Revenue | | | 7.5 | x | | | 10.1 | x | | | 8.3 | x | | Increase | |
| | | | | | | Discount for Lack of
Marketability | | | 20.0 | % | | | 20.0 | % | | | 20.0 | % | | Decrease | |
3. Repurchase Agreements: The Portfolio may enter into repurchase agreements under which the Portfolio lends cash and takes possession of securities with an agreement that the counterparty will repurchase such securities. In connection with transactions in repurchase agreements, a bank as custodian for the Portfolio takes possession of the underlying securities which are held as collateral, with a market value at least equal to the amount of the repurchase transaction, including principal and accrued interest. To the extent that any repurchase transaction exceeds one business day, the value of the collateral is marked-to-market on a daily basis to determine that the value of the collateral does not decrease below the repurchase price plus accrued interest as earned. If such a decrease occurs, additional collateral will be requested and, when received, will be added to the account to maintain full collateralization. In the event of default on the obligation to repurchase, the Portfolio has the right to liquidate the collateral and apply the proceeds in satisfaction of the obligation. In the event of default or bankruptcy by the counterparty to the agreement, realization of the collateral proceeds may be subject to cost and delays. The Portfolio, along with other affiliated investment companies, may utilize a joint trading account for the purpose of entering into repurchase agreements.
4. Foreign Currency Translation and Foreign Investments: The books and records of the Portfolio are maintained in U.S. dollars. Foreign currency amounts are translated into U.S. dollars as follows:
– investments, other assets and liabilities at the prevailing rate of exchange on the valuation date;
– investment transactions and investment income at the prevailing rates of exchange on the dates of such transactions.
Although the net assets of the Portfolio are presented at the foreign exchange rates and market values at the close of the period, the Portfolio does not isolate that portion of the results of operations arising as a result of changes in the foreign exchange rates from the fluctuations arising from changes in the market prices of securities held at period end. Similarly, the Portfolio does not isolate the effect of changes in foreign exchange rates from the fluctuations arising from changes in the market prices of securities sold during the period. Accordingly, realized and unrealized foreign currency gains (losses) on investments in securities are included in the reported net realized and unrealized gains (losses) on investment transactions and balances. However, pursuant to U.S. federal income tax regulations, gains and losses from
22
Morgan Stanley Institutional Fund, Inc.
Annual Report — December 31, 2016
Notes to Financial Statements (cont'd)
certain foreign currency transactions and the foreign currency portion of gains and losses realized on sales and maturities of foreign denominated debt securities are treated as ordinary income for U.S. federal income tax purposes.
Net realized gains (losses) on foreign currency transactions represent net foreign exchange gains (losses) from foreign currency forward exchange contracts, disposition of foreign currencies, currency gains (losses) realized between the trade and settlement dates on securities transactions, and the difference between the amount of investment income and foreign withholding taxes recorded on the Portfolio's books and the U.S. dollar equivalent amounts actually received or paid. Net unrealized currency gains (losses) from valuing foreign currency denominated assets and liabilities at period end exchange rates are reflected as a component of unrealized appreciation (depreciation) in the Statement of Assets and Liabilities. The change in unrealized currency gains (losses) on foreign currency translations for the period is reflected in the Statement of Operations.
Foreign security and currency transactions may involve certain considerations and risks not typically associated with those of U.S. dollar denominated transactions as a result of, among other factors, fluctuations of exchange rates in relation to the U.S. dollar, the possibility of lower levels of governmental supervision and regulation of foreign securities markets and the possibility of political or economic instability.
Governmental approval for foreign investments may be required in advance of making an investment under certain circumstances in some countries, and the extent of foreign investments in domestic companies may be subject to limitation in other countries. Foreign ownership limitations also may be imposed by the charters of individual companies to prevent, among other concerns, violations of foreign investment limitations. As a result, an additional class of shares (identified as "Foreign" in the Portfolio of Investments) may be created and offered for investment. The "local" and "foreign shares" market values may differ. In the absence of trading of the foreign shares in such markets, the Portfolio values the foreign shares at the closing exchange price of the local shares.
5. Derivatives: The Portfolio may, but is not required to, use derivative instruments for a variety of purposes, including hedging, risk management, portfolio management
or to earn income. Derivatives are financial instruments whose value is based, in part, on the value of an underlying asset, interest rate, index or financial instrument. Prevailing interest rates and volatility levels, among other things, also affect the value of derivative instruments. A derivative instrument often has risks similar to its underlying asset and may have additional risks, including imperfect correlation between the value of the derivative and the underlying asset, risks of default by the counterparty to certain transactions, magnification of losses incurred due to changes in the market value of the securities, instruments, indices or interest rates to which the derivative instrument relates, risks that the transactions may not be liquid and risks arising from margin requirements. The use of derivatives involves risks that are different from, and possibly greater than, the risks associated with other portfolio investments. Derivatives may involve the use of highly specialized instruments that require investment techniques and risk analyses different from those associated with other portfolio investments. All of the Portfolio's holdings, including derivative instruments, are marked-to-market each day with the change in value reflected in unrealized appreciation (depreciation). Upon disposition, a realized gain or loss is recognized.
Certain derivative transactions may give rise to a form of leverage. Leverage magnifies the potential for gain and the risk of loss. Leverage associated with derivative transactions may cause the Portfolio to liquidate portfolio positions when it may not be advantageous to do so to satisfy its obligations or to meet earmarking or segregation requirements, pursuant to applicable Securities and Exchange Commission rules and regulations, or may cause the Portfolio to be more volatile than if the Portfolio had not been leveraged. Although the Adviser seeks to use derivatives to further the Portfolio's investment objectives, there is no assurance that the use of derivatives will achieve this result.
Following is a description of the derivative instruments and techniques that the Portfolio used during the period and their associated risks:
Foreign Currency Forward Exchange Contracts: In connection with its investments in foreign securities, the Portfolio also entered into contracts with banks, brokers or dealers to purchase or sell securities or foreign currencies at a future date. A foreign currency forward exchange contract ("currency contract") is a negotiated
23
Morgan Stanley Institutional Fund, Inc.
Annual Report — December 31, 2016
Notes to Financial Statements (cont'd)
agreement between the contracting parties to exchange a specified amount of currency at a specified future time at a specified rate. The rate can be higher or lower than the spot rate between the currencies that are the subject of the contract. Currency contracts may be used to protect against uncertainty in the level of future foreign currency exchange rates or to gain or modify exposure to a particular currency. To the extent hedged by the use of currency contracts, the precise matching of the currency contract amounts and the value of the securities involved will not generally be possible because the future value of such securities in foreign currencies will change as a consequence of market movements in the value of those securities between the date on which the contract is entered into and the date it matures. Furthermore, such transactions may reduce or preclude the opportunity for gain if the value of the currency should move in the direction opposite to the position taken. There is additional risk to the extent that currency contracts create exposure to currencies in which the Portfolio's securities are not denominated. Unanticipated changes in currency prices may result in poorer overall performance for the Portfolio than if it had not entered into such contracts. The use of currency contracts involves the risk of loss from the insolvency or bankruptcy of the counterparty to the contract or the failure of the counterparty to make payments or otherwise comply with the terms of the contract. A currency contract is marked-to-market daily and the change in market value is recorded by the Portfolio as unrealized gain or loss. The Portfolio records realized gains (losses) when the currency contract is closed equal to the difference between the value of the currency contract at the time it was opened and the value at the time it was closed.
Options: With respect to options, the Portfolio is subject to equity risk, interest rate risk and foreign currency exchange risk in the normal course of pursuing its investment objectives. If the Portfolio buys an option, it buys a legal contract giving it the right to buy or sell a specific amount of the underlying instrument or foreign currency, or futures contract on the underlying instrument or foreign currency, at an agreed-upon price typically in exchange for a premium paid by the Portfolio. The Portfolio may purchase and/or sell put and call options. Purchasing call options tends to increase the Portfolio's exposure to the underlying (or similar) instrument. Purchasing put options tends to decrease the Portfolio's
exposure to the underlying (or similar) instrument. When entering into purchased option contracts, the Portfolio bears the risk of interest or exchange rates or securities prices moving unexpectedly, in which case, the Portfolio may not achieve the anticipated benefits of the purchased option contracts; however the risk of loss is limited to the premium paid. Purchased options are reported as part of "Total Investments in Securities" in the Statement of Assets and Liabilities. Premium paid for purchasing options which expired are treated as realized losses. If the Portfolio sells an option, it sells to another party the right to buy from or sell to the Portfolio a specific amount of the underlying instrument or foreign currency, or futures contract on the underlying instrument or foreign currency, at an agreed-upon price typically in exchange for a premium received by the Portfolio. When options are purchased OTC, the Portfolio bears the risk that the counterparty that wrote the option will be unable or unwilling to perform its obligations under the option contract. Options may also be illiquid and the Portfolio may have difficulty closing out its position. A decision as to whether, when and how to use options involves the exercise of skill and judgment and even a well-conceived option transaction may be unsuccessful because of market behavior or unexpected events. The prices of options can be highly volatile and the use of options can lower total returns.
FASB ASC 815, "Derivatives and Hedging" ("ASC 815"), is intended to improve financial reporting about derivative instruments by requiring enhanced disclosures to enable investors to better understand how and why the Portfolio uses derivative instruments, how these derivative instruments are accounted for and their effects on the Portfolio's financial position and results of operations.
The following table sets forth the fair value of the Portfolio's derivative contracts by primary risk exposure as of December 31, 2016.
| | | Asset Derivatives
Statement of Assets and
Liabilities Location | | Primary Risk
Exposure | | Value
(000) | |
Options Purchased | | Investments, at Value
(Options Purchased) | |
Equity Risk | | $ | 494 | (a) | |
Foreign Currency Forward
Exchange Contracts | | Unrealized Appreciation on
Foreign Currency Forward
Exchange Contracts | |
Currency Risk | | | 117 | | |
Total | | | | | | $ | 611 | | |
(a) Amounts are included in Investments in Securities in the Statement of Assets and Liabilities.
24
Morgan Stanley Institutional Fund, Inc.
Annual Report — December 31, 2016
Notes to Financial Statements (cont'd)
The following table sets forth by primary risk exposure the Portfolio's change in unrealized appreciation (depreciation) by type of derivative contract for the year ended December 31, 2016 in accordance with ASC 815.
Change in Unrealized Appreciation (Depreciation) | |
Primary Risk Exposure | | Derivative Type | | Value
(000) | |
Equity Risk | | Investments
(Options Purchased) | | $ | (90 | )(b) | |
Currency Risk | | Foreign Currency Forward
Exchange Contracts | | | 117 | | |
| | | Total | | $ | 27 | | |
(b) Amounts are included in Investments in the Statement of Operations.
At December 31, 2016, the Portfolio's derivative assets and liabilities are as follows:
Gross Amounts of Assets and Liabilities Presented in the
Statement of Assets and Liabilities | |
Derivatives(c) | | Assets(d)
(000) | | Liabilities(d)
(000) | |
Foreign Currency Forward Exchange Contracts | | $ | 117 | | | $ | — | | |
(c) Excludes exchange traded derivatives.
(d) Absent an event of default or early termination, OTC derivative assets and liabilities are presented gross and not offset in the Statement of Assets and Liabilities.
The Portfolio typically enters into International Swaps and Derivatives Association, Inc. Master Agreements ("ISDA Master Agreements") or similar master agreements (collectively, "Master Agreements") with its contract counterparties for certain OTC derivatives in order to, among other things, reduce its credit risk to counterparties. ISDA Master Agreements include provisions for general obligations, representations, collateral and events of default or termination. Under an ISDA Master Agreement, the Portfolio typically may offset with the counterparty certain OTC derivative financial instruments' payables and/or receivables with collateral held and/or posted and create one single net payment (close-out netting) in the event of default, termination and/or potential deterioration in the credit quality of the counterparty. Various Master Agreements govern the terms of certain transactions with counterparties, including transactions such as swap, forward, repurchase and reverse repurchase agreements. These Master Agreements typically attempt to reduce the counterparty risk associated with such transactions by specifying credit protection mechanisms and providing standardization that improves legal certainty. Cross-termination provisions under Master Agreements typically provide that a default in connection with one transaction between the
Portfolio and a counterparty gives the non-defaulting party the right to terminate any other transactions in place with the defaulting party to create one single net payment due to/due from the defaulting party and may be a feature in certain Master Agreements. In the event the Portfolio exercises its right to terminate a Master Agreement after a counterparty experiences a termination event as defined in the Master Agreement, the return of collateral with market value in excess of the Portfolio's net liability may be delayed or denied.
The following table presents derivative financial instruments that are subject to enforceable netting arrangements as of December 31, 2016.
Gross Amounts Not Offset in the Statement of Assets and Liabilities | |
Counterparty | | Gross Asset
Derivatives
Presented in
Statement of
Assets and
Liabilities
(000) | | Financial
Instrument
(000) | | Collateral
Received
(000) | | Net Amount
(not less
than $0)
(000) | |
UBS AG | | $ | 117 | | | $ | — | | | $ | — | | | $ | 117 | | |
For the year ended December 31, 2016, the approximate average monthly amount outstanding for each derivative type is as follows:
Foreign Currency Forward Exchange Contracts: | |
Average monthly principal amount | | $ | 895,000 | | |
Options Purchased: | |
| Average monthly notional amount | | | 25,000 | | |
6. Securities Lending: The Portfolio lends securities to qualified financial institutions, such as broker-dealers, to earn additional income. Any increase or decrease in the fair value of the securities loaned that might occur and any interest earned or dividends declared on those securities during the term of the loan would remain in the Portfolio. The Portfolio would receive cash or securities as collateral in an amount equal to or exceeding 100% of the current fair value of the loaned securities. The collateral is marked-to-market daily by State Street Bank and Trust Company ("State Street"), the securities lending agent, to ensure that a minimum of 100% collateral coverage is maintained.
Based on pre-established guidelines, the securities lending agent invests any cash collateral that is received in an affiliated money market portfolio and repurchase agreements. Securities lending income is generated from the earnings on the invested collateral and borrowing fees,
25
Morgan Stanley Institutional Fund, Inc.
Annual Report — December 31, 2016
Notes to Financial Statements (cont'd)
less any rebates owed to the borrowers and compensation to the lending agent, and is recorded as "Income from Securities Loaned — Net" in the Portfolio's Statement of Operations. Risks in securities lending transactions are that a borrower may not provide additional collateral when required or return the securities when due, and that the value of the short-term investments will be less than the amount of cash collateral plus any rebate that is required to be returned to the borrower.
The Portfolio has the right under the lending agreement to recover the securities from the borrower on demand.
The following table presents financial instruments that are subject to enforceable netting arrangements as of December 31, 2016.
Gross Amounts Not Offset in the Statement of Assets and Liabilities | |
Gross Asset
Amounts
Presented in
Statement of
Assets and
Liabilities
(000) | | Financial
Instrument
(000) | | Collateral
Received
(000) | | Net Amount
(not less
than $0)
(000) | |
| $ | 84 | (e) | | $ | — | | | $ | (84 | )(f)(g) | | $ | 0 | | |
(e) Represents market value of loaned securities at period end.
(f) The Portfolio received cash collateral of approximately $74,000, which was subsequently invested in Repurchase Agreements and Morgan Stanley Institutional Liquidity Funds as reported in the Portfolio of Investments. As of December 31, 2016, there was uninvested cash of less than $500, which is not reflected in the Portfolio of Investments. In addition, the Portfolio received non-cash collateral of approximately $15,000 in the form of U.S. Government obligations, which the Portfolio cannot sell or repledge, and accordingly are not reflected in the Portfolio of Investments.
(g) The actual collateral received is greater than the amount shown here due to overcollateralization.
FASB Accounting Standards Update No. 2014-11 ("ASU No. 2014-11"), "Transfers & Servicing (Topic 860): Repurchase-to-Maturity Transactions, Repurchase Financings, and Disclosures", is intended to provide increased transparency about the types of collateral pledged in securities lending transactions and other similar transactions that are accounted for as secured borrowing.
The following table displays a breakdown of transactions accounted for as secured borrowings, the gross obligations by class of collateral pledged, and the remaining contractual maturity of those transactions as of December 31, 2016.
Remaining Contractual Maturity of the Agreements | |
| | | Overnight and
Continuous
(000) | | <30 days
(000) | | Between
30 &
90 days
(000) | | >90 days
(000) | | Total
(000) | |
Securities Lending
Transactions | |
Common Stocks | | $ | 74 | | | $ | — | | | $ | — | | | $ | — | | | $ | 74 | | |
Total Borrowings | | $ | 74 | | | $ | — | | | $ | — | | | $ | — | | | $ | 74 | | |
Gross amount of
recognized liabilities
for securities lending
transactions | | | | | | | | | | $ | 74 | | |
7. Restricted Securities: The Portfolio invests in unregistered or otherwise restricted securities. The term "restricted securities" refers to securities that are unregistered or are held by control persons of the issuer and securities that are subject to contractual restrictions on their resale. As a result, restricted securities may be more difficult to value and the Portfolio may have difficulty disposing of such assets either in a timely manner or for a reasonable price. In order to dispose of an unregistered security, the Portfolio, where it has contractual rights to do so, may have to cause such security to be registered. A considerable period may elapse between the time the decision is made to sell the security and the time the security is registered so that the Portfolio could sell it. Contractual restrictions on the resale of securities vary in length and scope and are generally the result of a negotiation between the issuer and acquirer of the securities. The Portfolio would, in either case, bear market risks during that period. Restricted securities are identified in the Portfolio of Investments.
8. Structured Investments: The Portfolio invested a portion of its assets in structured investments. A structured investment is a derivative security designed to offer a return linked to a particular underlying security, currency, commodity or market. Structured investments may come in various forms including notes (such as exchange-traded notes), warrants and options to purchase securities. The Portfolio will typically use structured investments to gain exposure to a permitted underlying security, currency, commodity or market when direct access to a market is limited or inefficient from a tax or cost standpoint. There can be no assurance that structured investments will trade at the same price or have the same value as the underlying security, currency, commodity or market. Investments in structured investments involve risks including issuer risk, counterparty risk and market risk. Holders of structured investments bear risks of the underlying investment and
26
Morgan Stanley Institutional Fund, Inc.
Annual Report — December 31, 2016
Notes to Financial Statements (cont'd)
are subject to issuer or counterparty risk because the Portfolio is relying on the creditworthiness of such issuer or counterparty and has no rights with respect to the underlying investment. Certain structured investments may be thinly traded or have a limited trading market and may have the effect of increasing the Portfolio's illiquidity to the extent that the Portfolio, at a particular time, may be unable to find qualified buyers for these securities.
9. Indemnifications: The Fund enters into contracts that contain a variety of indemnifications. The Fund's maximum exposure under these arrangements is unknown. However, the Fund has not had prior claims or losses pursuant to these contracts and expects the risk of loss to be remote.
10. Dividends and Distributions to Shareholders: Dividend income and distributions to shareholders are recorded on the ex-dividend date. Dividends from net investment income, if any, are declared and paid annually. Net realized capital gains, if any, are distributed at least annually.
11. Security Transactions, Income and Expenses: Security transactions are accounted for on the trade date (date the order to buy or sell is executed). Realized gains and losses on the sale of investment securities are determined on the specific identified cost method. Dividend income and other distributions are recorded on the ex-dividend date (except for certain foreign dividends which may be recorded as soon as the Portfolio is informed of such dividends) net of applicable withholding taxes. Interest income is recognized on the accrual basis except where collection is in doubt. Discounts are accreted and premiums are amortized over the life of the respective securities. Most expenses of the Fund can be directly attributed to a particular Portfolio. Expenses which cannot be directly attributed are apportioned among the Portfolios based upon relative net assets or other appropriate methods. Income, expenses (other than class specific expenses — distribution and shareholder services, transfer agency and sub transfer agency fees) and realized and unrealized gains or losses are allocated to each class of shares based upon their relative net assets.
B. Advisory Fees: The Adviser, a wholly-owned subsidiary of Morgan Stanley, provides the Portfolio with advisory services under the terms of an Investment Advisory Agreement,
paid quarterly, at the annual rate based on the daily net assets as follows:
First $1
billion | | Over $1
billion | |
| | 0.90 | % | | | 0.85 | % | |
For the year ended December 31, 2016, the advisory fee rate (net of waivers/rebate) was equivalent to an annual effective rate of 0.11% of the Portfolio's average daily net assets.
The Adviser has agreed to reduce its advisory fee and/or reimburse the Portfolio so that total annual portfolio operating expenses, excluding certain investment related expenses, taxes, interest and other extraordinary expenses (including litigation), will not exceed 1.35% for Class I shares, 1.70% for Class A shares, 2.20% for Class L shares and 2.45% for Class C shares. The fee waivers and/or expense reimbursements will continue for at least one year from the date of the Portfolio's prospectus or until such time as the Directors act to discontinue all or a portion of such waivers and/or reimbursements when they deem such action is appropriate. For the year ended December 31, 2016, approximately $120,000 of advisory fees were waived and approximately $9,000 of other expenses were reimbursed by the Adviser pursuant to this arrangement.
C. Administration Fees: The Adviser also serves as Administrator to the Fund and provides administrative services pursuant to an Administration Agreement for an annual fee, accrued daily and paid monthly, of 0.08% of the Portfolio's average daily net assets.
Under a Sub-Administration Agreement between the Administrator and State Street, State Street provides certain administrative services to the Fund. For such services, the Administrator pays State Street a portion of the fee the Administrator receives from the Portfolio.
D. Distribution and Shareholder Services Fees: Morgan Stanley Distribution, Inc. ("MSDI" or the "Distributor"), a wholly-owned subsidiary of the Adviser and an indirect subsidiary of Morgan Stanley, serves as the Fund's Distributor of Portfolio the Portfolio pays the Distributor a shareholder services fee, accrued daily and paid monthly, at an annual rate of 0.25% of the Portfolio's average daily net assets attributable to shares pursuant to a Distribution Agreement. The Fund has adopted a Shareholder Services Plan with respect to Class A shares pursuant to Rule 12b-1 under the Act. Under the Shareholder Services Plan, Class A shares.
The Fund has adopted a Distribution and Shareholder Services Plan with respect to Class L shares pursuant to Rule 12b-1
27
Morgan Stanley Institutional Fund, Inc.
Annual Report — December 31, 2016
Notes to Financial Statements (cont'd)
under the Act. Under the Distribution and Shareholder Services Plan, the Portfolio pays the Distributor a distribution fee, accrued daily and paid monthly, at an annual rate of 0.50% and a shareholder services fee, accrued daily and paid monthly, at an annual rate of 0.25% of the Portfolio's average daily net assets attributable to Class L shares.
The Fund has adopted a Distribution and Shareholder Services Plan with respect to Class C shares pursuant to Rule 12b-1 under the Act. Under the Distribution and Shareholder Services Plan, the Portfolio pays the Distributor a distribution fee, accrued daily and paid monthly, at an annual rate of 0.75% and a shareholder services fee, accrued daily and paid monthly, at an annual rate of 0.25% of the Portfolio's average daily net assets attributable to Class C shares.
The distribution and shareholder services fees are used to support the expenses associated with servicing and maintaining accounts. The Distributor may compensate other parties for providing shareholder support services to investors who purchase Class A, Class L and Class C shares.
E. Dividend Disbursing and Transfer Agent: The Fund's dividend disbursing and transfer agent is Boston Financial Data Services, Inc. ("BFDS"). Pursuant to a Transfer Agency Agreement, the Fund pays BFDS a fee based on the number of classes, accounts and transactions relating to the Portfolios of the Fund.
F. Custodian Fees: State Street (the "Custodian") serves as Custodian for the Fund in accordance with a Custodian Agreement. The Custodian holds cash, securities, and other assets of the Fund as required by the Act. Custody fees are payable monthly based on assets held in custody, investment purchases and sales activity and account maintenance fees, plus reimbursement for certain out-of-pocket expenses.
In December 2015, the Fund's Custodian announced that it had identified inconsistencies in the way in which clients were invoiced for out-of-pocket expenses from 1998 until November 2015. The dollar amount difference between what was charged and what should have been charged, plus interest, was paid back to the Portfolio in September 2016 as a reimbursement. The Custodian reimbursed the Portfolio directly, which was recognized as a change in accounting estimate and was reflected as "Reimbursement of Custodian Fees" in the Statement of Operations. Pursuant to the expense limitations described in Note B, the Portfolio has experienced waiver of advisory fees during the current period. Accordingly, the reimbursement of out-of-pocket custodian expenses in the current
period resulted in the reduction in the current period waiver of advisory fees.
G. Security Transactions and Transactions with Affiliates: For the year ended December 31, 2016, purchases and sales of investment securities for the Portfolio, other than long-term U.S. Government securities and short-term investments, were approximately $26,389,000 and $9,577,000, respectively. There were no purchases and sales of long-term U.S. Government securities for the year ended December 31, 2016.
The Portfolio invests in the Institutional Class of the Morgan Stanley Institutional Liquidity Funds (the "Liquidity Funds"), an open-end management investment company managed by the Adviser, both directly and as a portion of the securities held as collateral on loaned securities. Advisory fees paid by the Portfolio are reduced by an amount equal to its pro-rata share of the advisory and administration fees paid by the Portfolio due to its investment in the Liquidity Funds. For the year ended December 31, 2016, advisory fees paid were reduced by approximately $2,000 relating to the Portfolio's investment in the Liquidity Funds.
A summary of the Portfolio's transactions in shares of the Liquidity Funds during the year ended December 31, 2016 is as follows:
Value
December 31,
2015
(000) | | Purchases
at Cost
(000) | | Sales
(000) | | Dividend
Income
(000) | | Value
December 31,
2016
(000) | |
| $ | 403 | | | $ | 23,383 | | | $ | 18,900 | | | $ | 3 | | | $ | 4,886 | | |
The Portfolio is permitted to purchase and sell securities ("cross-trade") from and to other Morgan Stanley Funds as well as other funds and client accounts for which the Adviser or an affiliate of the Adviser serves as investment adviser, pursuant to procedures approved by the Directors in compliance with Rule 17a-7 under the Act (the "Rule"). Each cross-trade is executed at the current market price in compliance with provisions of the Rule. For the year ended December 31, 2016, the Portfolio did not engage in any cross-trade transactions.
The Portfolio has an unfunded Deferred Compensation Plan (the "Compensation Plan"), which allows each independent Director to defer payment of all, or a portion, of the fees he or she receives for serving on the Board of Directors. Each eligible Director generally may elect to have the deferred amounts credited with a return equal to the total return on one or more of the Morgan Stanley funds that are offered as investment options under the Compensation Plan. Appreciation/depreciation
28
Morgan Stanley Institutional Fund, Inc.
Annual Report — December 31, 2016
Notes to Financial Statements (cont'd)
and distributions received from these investments are recorded with an offsetting increase/decrease in the deferred compensation obligation and do not affect the NAV of the Portfolio.
H. Federal Income Taxes: It is the Portfolio's intention to continue to qualify as a regulated investment company and distribute all of its taxable and tax-exempt income. Accordingly, no provision for federal income taxes is required in the financial statements.
The Portfolio may be subject to taxes imposed by countries in which it invests. Such taxes are generally based on income and/or capital gains earned or repatriated. Taxes are accrued based on net investment income, net realized gains and net unrealized appreciation as such income and/or gains are earned. Taxes may also be based on transactions in foreign currency and are accrued based on the value of investments denominated in such currency.
FASB ASC 740-10, "Income Taxes — Overall", sets forth a minimum threshold for financial statement recognition of the benefit of a tax position taken or expected to be taken in a tax return. Management has concluded that there are no significant uncertain tax positions that would require recognition in the financial statements. If applicable, the Portfolio recognizes interest accrued related to unrecognized tax benefits in "Interest Expense" and penalties in "Other Expenses" in the Statement of Operations. The Portfolio files tax returns with the U.S. Internal Revenue Service, New York and various states. Generally, each of the tax years in the four-year period ended December 31, 2016, remains subject to examination by taxing authorities.
The tax character of distributions paid may differ from the character of distributions shown in the Statements of Changes in Net Assets due to short-term capital gains being treated as ordinary income for tax purposes. The tax character of distributions paid during fiscal years 2016 and 2015 was as follows:
2016
Distributions
Paid From: | | 2015
Distributions
Paid From: | |
Ordinary
Income
(000) | | Long-Term
Capital Gain
(000) | | Ordinary
Income
(000) | | Long-Term
Capital Gain
(000) | |
| $ | 377 | | | $ | 202 | | | $ | 128 | | | $ | — | | |
The amount and character of income and gains to be distributed are determined in accordance with income tax regulations which may differ from GAAP. These book/tax differences are either considered temporary or permanent in nature.
Temporary differences are primarily due to differing book and tax treatments in the timing of the recognition of gains (losses) on certain investment transactions and the timing of the deductibility of certain expenses.
Permanent differences, primarily due to differing treatments of gains (losses) related to foreign currency transactions and basis adjustments on certain equity securities designated as passive foreign investment companies, resulted in the following reclassifications among the components of net assets at December 31, 2016:
Distributions
in Excess of Net
Investment
Income
(000) | | Accumulated
Net Realized
Gain
(000) | | Paid-in-
Capital
(000) | |
| $ | 5 | | | $ | (4 | ) | | $ | (1 | ) | |
At December 31, 2016, the components of distributable earnings for the Portfolio on a tax basis were as follows:
Undistributed
Ordinary
Income
(000) | | Undistributed
Long-Term
Capital Gain
(000) | |
| $ | 320 | | | $ | 222 | | |
During the year ended December 31, 2016, the Portfolio utilized capital loss carryforwards for U.S. federal income tax purposes of approximately $84,000.
I. Credit Facility: As of April 4, 2016, the Fund and other Morgan Stanley funds participated in a $150,000,000 committed, unsecured revolving line of credit facility (the "facility") with State Street. This facility is to be used for temporary emergency purposes or funding of shareholder redemption requests. The interest rate on borrowings is based on the federal funds rate or one month libor rate plus a spread. The facility also has a commitment fee of 0.25% per annum based on the unused portion of the facility. During the year ended December 31, 2016, the Portfolio did not have any borrowings under the facility.
J. Other: At December 31, 2016, the Portfolio had record owners of 10% or greater. Investment activities of these shareholders could have a material impact on the Portfolio. The aggregate percentage of such owners was 51.4%.
K. Accounting Pronouncements: In December 2016, FASB issued Accounting Standards update 2016-19 — Technical Corrections and Improvements ("ASU 2016-19"), which is effective for interim periods for all entities beginning after December 15, 2016. ASU 2016-19 includes an amendment to Topic 820, Fair Value Measurement, which clarifies the difference between a valuation approach and a valuation technique
29
Morgan Stanley Institutional Fund, Inc.
Annual Report — December 31, 2016
Notes to Financial Statements (cont'd)
when applying the guidance in that Topic. That amendment also requires an entity to disclose when there has been a change in either or both a valuation approach and/or a valuation technique. The transition guidance for the amendment must be applied prospectively because it could potentially involve the use of hindsight that includes fair value measurements. Although still evaluating the potential impacts of ASU 2016-19 to the Portfolio, management expects that the impact of the Portfolio's adoption will be limited to additional financial statement disclosures.
In October 2016, the Securities and Exchange Commission ("SEC") issued a new rule, Investment Company Reporting Modernization, which, among other provisions, amends Regulation S-X to require standardized, enhanced disclosures, particularly related to derivatives, in investment company financial statements. Compliance with the guidance is effective for financial statements filed with the SEC on or after August 1, 2017; adoption will have no effect on the Portfolio's net assets or results of operations. Although still evaluating the potential impacts of the Investment Company Reporting Modernization to the Portfolio, management expects that the impact of the Portfolio's adoption will be limited to additional financial statement disclosures.
30
Morgan Stanley Institutional Fund, Inc.
Annual Report — December 31, 2016
Report of Independent Registered Public Accounting Firm
To the Shareholders and Board of Directors of
Morgan Stanley Institutional Fund, Inc. —
Global Discovery Portfolio
We have audited the accompanying statement of assets and liabilities, including the portfolio of investments, of Global Discovery Portfolio (one of the portfolios constituting Morgan Stanley Institutional Fund, Inc.) (the "Portfolio") as of December 31, 2016, and the related statement of operations for the year then ended, the statements of changes in net assets for each of the two years in the period then ended and the financial highlights for each of the years or periods indicated therein. These financial statements and financial highlights are the responsibility of the Portfolio's management. Our responsibility is to express an opinion on these financial statements and financial highlights based on our audits.
We conducted our audits in accordance with the standards of the Public Company Accounting Oversight Board (United States). Those standards require that we plan and perform the audit to obtain reasonable assurance about whether the financial statements and financial highlights are free of material misstatement. We were not engaged to perform an audit of the Portfolio's internal control over financial reporting. Our audits included consideration of internal control over financial reporting as a basis for designing audit procedures that are appropriate in the circumstances, but not for the purpose of expressing an opinion on the effectiveness of the Portfolio's internal control over financial reporting. Accordingly, we express no such opinion. An audit also includes examining, on a test basis, evidence supporting the amounts and disclosures in the financial statements and financial highlights, assessing the accounting principles used and significant estimates made by management, and evaluating the overall financial statement presentation. Our procedures included confirmation of securities owned as of December 31, 2016, by correspondence with the custodian and others or by other appropriate auditing procedures where replies from others were not received. We believe that our audits provide a reasonable basis for our opinion.
In our opinion, the financial statements and financial highlights referred to above present fairly, in all material respects, the financial position of Global Discovery Portfolio (one of the portfolios constituting Morgan Stanley Institutional Fund, Inc.) at December 31, 2016, the results of its operations for the year then ended, the changes in its net assets for each of the two years in the period then ended and the financial highlights for each of the years or periods indicated therein, in conformity with U.S. generally accepted accounting principles.

Boston, Massachusetts
February 28, 2017
31
Morgan Stanley Institutional Fund, Inc.
Annual Report — December 31, 2016
Federal Tax Notice (unaudited)
For federal income tax purposes, the following information is furnished with respect to the distributions paid by the Portfolio during its taxable year ended December 31, 2016. For corporate shareholders, 11.0% of the dividends qualified for the dividends received deduction.
The Portfolio designated and paid approximately $202,000 as a long-term capital gain distribution.
For federal income tax purposes, the following information is furnished with respect to the Portfolio's earnings for its taxable year ended December 31, 2016. When distributed, certain earnings may be subject to a maximum tax rate of 15% as provided for the Jobs and Growth Tax Relief Reconciliation Act of 2003. The Portfolio designated up to a maximum of approximately $198,000 as taxable at this lower rate.
In January, the Portfolio provides tax information to shareholders for the preceding calendar year.
32
Morgan Stanley Institutional Fund, Inc.
Annual Report — December 31, 2016
Privacy Notice (unaudited)
MORGAN STANLEY INVESTMENT MANAGEMENT INC.
AN IMPORTANT NOTICE CONCERNING OUR U.S. PRIVACY POLICY
We are required by federal law to provide you with a copy of our privacy policy annually. This policy applies to current and former individual investors in funds managed or sponsored by Morgan Stanley Investment Management Inc. ("MSIM") as well as current and former individual clients of MSIM. This policy is not applicable to partnerships, corporations, trusts or other non-individual clients or investors. Please note that we may amend this policy at any time, and will inform you of any changes as required by law.
WE RESPECT YOUR PRIVACY
We appreciate that you have provided us with your personal financial information. We strive to maintain the privacy of such information while we help you achieve your financial objectives. This Notice describes what non-public personal information we collect about you, why we collect it, when we may share it with others and how certain others may use it. It discusses the steps you may take to limit our sharing of certain information about you to affiliated companies in the Morgan Stanley family of companies ("other Morgan Stanley companies"). It also discloses how you may limit use of certain shared information for marketing purposes by other Morgan Stanley branded companies. Throughout this policy, we refer to the non-public information that personally identifies you or your accounts as "personal information."
1. WHAT PERSONAL INFORMATION DO WE COLLECT ABOUT YOU?
We obtain personal information from applications and other forms you submit to us, from your dealings with us, from consumer reporting agencies, from our Web sites and from third parties and other sources.
For example:
• We may collect information such as your name, address, e-mail address, telephone/fax numbers, assets, income and investment objectives through subscription documents, applications and other forms you submit to us.
• We may obtain information about account balances, your use of account(s) and the types of products and services you prefer to receive from us through your dealings and transactions with us and other sources.
• We may obtain information about your creditworthiness and credit history from consumer reporting agencies.
• We may collect background information from and through third-party vendors to verify representations you have made and to comply with various regulatory requirements.
• If you interact with us through our public and private Web sites, we may collect information that you provide directly through online communications (such as an e-mail address). We may also collect information about your Internet service provider, your domain name, your computer's operating system and Web browser, your use of our Web sites and your product and service preferences, through the use of "cookies." Please consult the Terms of Use of these sites for more details.
2. WHEN DO WE DISCLOSE PERSONAL INFORMATION WE COLLECT ABOUT YOU?
We may disclose personal information we collect about you to other Morgan Stanley companies and to non-affiliated third parties.
a. Information We Disclose to Other Morgan Stanley Companies.
We may disclose personal information to other Morgan Stanley companies for a variety of reasons, including to manage your account(s) effectively, to service and process your transactions, to let you know about products and services offered by us and other Morgan Stanley companies, to manage our business, and as otherwise required or permitted by law. Offers for products and services from other Morgan Stanley companies are developed under conditions designed to safeguard your personal information.
33
Morgan Stanley Institutional Fund, Inc.
Annual Report — December 31, 2016
Privacy Notice (unaudited) (cont'd)
b. Information We Disclose to Non-affiliated Third Parties.
We do not disclose personal information that we collect about you to non-affiliated third parties except to those who provide marketing services on our behalf, to financial institutions with whom we have joint marketing agreements, and as otherwise required or permitted by law. For example, we may disclose personal information to nonaffiliated third parties for servicing and processing transactions, to offer our own products and services, to protect against fraud, for institutional risk control, to respond to judicial process or to perform services on our behalf. When we share personal information with a non-affiliated third party, they are required to limit their use of personal information to the particular purpose for which it was shared and they are not allowed to share personal information with others except to fulfill that limited purpose or as may be permitted or required by law.
3. HOW DO WE PROTECT THE SECURITY AND CONFIDENTIALITY OF PERSONAL INFORMATION WE COLLECT ABOUT YOU?
We maintain physical, electronic and procedural security measures to help safeguard the personal information we collect about you. We have internal policies governing the proper handling of client information. Third parties that provide support or marketing services on our behalf may also receive personal information, and we require them to adhere to confidentiality standards with respect to such information.
4. HOW CAN YOU LIMIT THE SHARING OF CERTAIN TYPES OF PERSONAL INFORMATION WITH OTHER MORGAN STANLEY COMPANIES?
We offer you choices as to whether we share with other Morgan Stanley companies the personal information that was collected to determine your eligibility for products and services you request ("eligibility information"). Eligibility information does not include your identification information or personal information pertaining to our transactions or experiences with you. Please note that, even if you direct us not to share eligibility information with other Morgan Stanley companies ("opt-out"), we may still share personal information, including eligibility information, with those companies in circumstances excluded from the opt-out under applicable law, such as to process transactions or to service your account.
5. HOW CAN YOU LIMIT THE USE OF CERTAIN TYPES OF PERSONAL INFORMATION BY OTHER MORGAN STANLEY COMPANIES FOR MARKETING?
By following the opt-out instructions in Section 6 below, you may limit other Morgan Stanley branded companies from marketing their products or services to you based on personal information we disclose to them. This information may include, for example, your income and account history with us. Please note that, even if you choose to limit Other Morgan Stanley Companies from using personal information about you that we may share with them for marketing their products and services to you, Other Morgan Stanley Companies may use your personal information that they obtain from us to market to you in circumstances permitted by law, such as if the Other Morgan Stanley Company has its own relationship with you.
6. HOW CAN YOU SEND US AN OPT-OUT INSTRUCTION?
If you wish to limit our sharing of eligibility information about you with other Morgan Stanley companies or other Morgan Stanley companies' use of personal information for marketing purposes, as described in this notice, you may do so by:
• Calling us at (800) 548-7786
Monday–Friday between 8a.m. and 6p.m.(EST)
• Writing to us at the following address:
Boston Financial Data Services, Inc.
c/o Privacy Coordinator
P.O. Box 219804
Kansas City, Missouri 64121
34
Morgan Stanley Institutional Fund, Inc.
Annual Report — December 31, 2016
Privacy Notice (unaudited) (cont'd)
Your written request should include your name, address, telephone number and account number(s) to which the opt-out applies and whether you are opting out with respect to sharing of eligibility information (Section 4 above), or if information used for Marketing (Section 5 above) or both. Written opt-out requests should not be sent with any other correspondence. In order to process your request, we require that the request be provided by you directly and not through a third party.
Your opt-out preference will remain in effect with respect to this policy (as it may be amended) until you notify us otherwise. If you have a joint account, your direction for us not to share this information with other Morgan Stanley companies and for those other Morgan Stanley companies not to use your personal information for marketing will be applied to all account holders on that account. Please understand that if you limit our sharing or our affiliated companies' use of personal information, you and any joint account holder(s) may not receive information about Morgan Stanley products and services, including products or services that could help you manage your financial resources and achieve your investment objectives.
7. WHAT IF AN AFFILIATED COMPANY BECOMES A NON-AFFILIATED THIRD PARTY?
If, at any time in the future, an affiliated company becomes a non-affiliated third party, further disclosures of personal information made to the former affiliated company will be limited to those described in Section 2(b) above relating to non-affiliated third parties. If you elected under Section 6 to limit disclosures we make to affiliated companies, or use of personal information by affiliated companies, your election will not apply to use by any former affiliated company of your personal information in their possession once it becomes a non-affiliated third party.
SPECIAL NOTICE TO RESIDENTS OF VERMONT
The following section supplements our policy with respect to our individual clients who have a Vermont address and supersedes anything to the contrary in the above policy with respect to those clients only.
The state of Vermont requires financial institutions to obtain your consent prior to sharing personal information that they collect about you with affiliated companies and non-affiliated third parties other than in certain limited circumstances. Except as permitted by law, we will not share personal information we collect about you with non-affiliated third parties or other Morgan Stanley companies unless you provide us with your written consent to share such information ("opt-in").
If you wish to receive offers for investment products and services offered by or through other Morgan Stanley companies, please notify us in writing at the following address:
Boston Financial Data Services, Inc.
c/o Privacy Coordinator
P.O. Box 219804
Kansas City, Missouri 64121
Your authorization should include your name, address, telephone number and account number(s) to which the opt-in applies and should not be sent with any other correspondence. In order to process your authorization, we require that the authorization be provided by you directly and not through a third party.
SPECIAL NOTICE TO RESIDENTS OF CALIFORNIA
The following section supplements our policy with respect to our individual clients who have a California address and supersedes anything to the contrary in the above policy with respect to those clients only.
In response to a California law, if your account has a California home address, your personal information will not be disclosed to nonaffiliated third parties except as permitted by applicable California law, and we will limit sharing such information with our affiliates to comply with California privacy laws that apply to us.
35
Morgan Stanley Institutional Fund, Inc.
Annual Report — December 31, 2016
Director and Officer Information (unaudited)
Independent Directors:
Name, Age and Address of
Independent Director | | Position(s)
Held with
Registrant | | Length of Time
Served* | | Principal Occupation(s) During Past 5 Years
and Other Relevant Professional Experience | | Number of
Portfolios in
Fund Complex
Overseen by
Independent
Director** | | Other Directorships
Held by Independent
Director*** | |
Frank L. Bowman (72)
c/o Perkins Coie LLP
Counsel to the Independent
Directors
30 Rockefeller Plaza
New York, NY 10112 | | Director | | Since
August
2006 | | President, Strategic Decisions, LLC (consulting) (since February 2009); Director or Trustee of various Morgan Stanley Funds (since August 2006); Chairperson of the Compliance and Insurance Committee (since October 2015); formerly, Chairperson of the Insurance Sub-Committee of the Compliance and Insurance Committee (2007-2015); served as President and Chief Executive Officer of the Nuclear Energy Institute (policy organization) (February 2005-November 2008); retired as Admiral, U.S. Navy after serving over 38 years on active duty including 8 years as Director of the Naval Nuclear Propulsion Program in the Department of the Navy and the U.S. Department of Energy (1996-2004); served as Chief of Naval Personnel (July 1994-September 1996) and on the Joint Staff as Director of Political Military Affairs (June 1992-July 1994); knighted as Honorary Knight Commander of the Most Excellent Order of the British Empire; awarded the Officier de l'Orde National du Mérite by the French Government; elected to the National Academy of Engineering (2009). | | | 90 | | | Director of BP p.l.c.; Director of Naval and Nuclear Technologies LLP; Director Emeritus of the Armed Services YMCA; Director of the U.S. Naval Submarine League; Member of the National Security Advisory Council of the Center for U.S. Global Engagement and a member of the CNA Military Advisory Board; Chairman of the charity J Street Cup Golf; Trustee of Fairhaven United Methodist Church; and Director of other various non-profit organizations. | |
Kathleen A. Dennis (63)
c/o Perkins Coie LLP
Counsel to the Independent Directors
30 Rockefeller Plaza
New York, NY 10112 | | Director | | Since
August
2006 | | President, Cedarwood Associates (mutual fund and investment management consulting) (since July 2006); Chairperson of the Liquidity and Alternatives Sub-Committee of the Investment Committee (since October 2006) and Director or Trustee of various Morgan Stanley Funds (since August 2006); formerly, Senior Managing Director of Victory Capital Management (1993-2006). | | | 91 | | | Director of various non-profit organizations. | |
Nancy C. Everett (61)
c/o Perkins Coie LLP
Counsel to the Independent Directors
30 Rockefeller Plaza
New York, NY 10112 | | Director | | Since
January
2015 | | Chief Executive Officer, Virginia Commonwealth University Investment Company (since November 2015); Owner, OBIR, LLC (institutional investment management consulting) (since June 2014); formerly, Managing Director, BlackRock Inc. (February 2011-December 2013); and Chief Executive Officer, General Motors Asset Management (a/k/a Promark Global Advisors, Inc.) (June 2005-May 2010). | | | 91 | | | Member of Virginia Commonwealth University School of Business Foundation; formerly, Member of Virginia Commonwealth University Board of Visitors (2013-2015); Member of Committee on Directors for Emerging Markets Growth Fund, Inc. (2007-2010); Chairperson of Performance Equity Management, LLC (2006-2010); and Chairperson, GMAM Absolute Return Strategies Fund, LLC (2006-2010). | |
36
Morgan Stanley Institutional Fund, Inc.
Annual Report — December 31, 2016
Director and Officer Information (unaudited) (cont'd)
Independent Directors: (cont'd)
Name, Age and Address of
Independent Director | | Position(s)
Held with
Registrant | | Length of Time
Served* | | Principal Occupation(s) During Past 5 Years
and Other Relevant Professional Experience | | Number of
Portfolios in
Fund Complex
Overseen by
Independent
Director** | | Other Directorships
Held by Independent
Director*** | |
Jakki L. Haussler (59)
c/o Perkins Coie LLP
Counsel to the Independent Directors
30 Rockefeller Plaza
New York, NY 10112 | | Director | | Since
January
2015 | | Chairman and Chief Executive Officer, Opus Capital Group (since January 1996); formerly, Director, Capvest Venture Fund, LP (May 2000-December 2011); Partner, Adena Ventures, LP (July 1999-December 2010); Director, The Victory Funds (February 2005-July 2008). | | | 91 | | | Director of Cincinnati Bell Inc. and Member, Audit Committee and Compensation Committee; Director of Northern Kentucky University Foundation and Member, Investment Committee; Member of Chase College of Law Transactional Law Practice Center Board of Advisors; Director of Best Transport; Director of Chase College of Law Board of Visitors; formerly, Member, University of Cincinnati Foundation Investment Committee; Member, Miami University Board of Visitors (2008-2011); Trustee of Victory Funds (2005-2008) and Chairman, Investment Committee (2007-2008) and Member, Service Provider Committee (2005-2008). | |
Dr. Manuel H. Johnson (67)
c/o Johnson Smick
International, Inc.
220 I Street, N.E. — Suite 200
Washington, D.C. 20002 | | Director | | Since
July
1991 | | Senior Partner, Johnson Smick International, Inc. (consulting firm); Chairperson of the Investment Committee (since October 2006) and Director or Trustee of various Morgan Stanley Funds (since July 1991); Co-Chairman and a founder of the Group of Seven Council (G7C) (international economic commission); formerly, Chairperson of the Audit Committee (July 1991-September 2006), Vice Chairman of the Board of Governors of the Federal Reserve System and Assistant Secretary of the U.S. Treasury. | | | 91 | | | Director of NVR, Inc. (home construction). | |
Joseph J. Kearns (74)
c/o Kearns & Associates LLC
46 E Peninsula Center #385
Rolling Hills Estates, CA 90274-3712 | | Director | | Since
August
1994 | | President, Kearns & Associates LLC (investment consulting); Chairperson of the Audit Committee (since October 2006) and Director or Trustee of various Morgan Stanley Funds (since August 1994); formerly, Deputy Chairperson of the Audit Committee (July 2003-September 2006) and Chairperson of the Audit Committee of various Morgan Stanley Funds (since August 1994); CFO of the J. Paul Getty Trust. | | | 93 | | | Director of Electro Rent Corporation (equipment leasing). Prior to December 31, 2013, Director of The Ford Family Foundation. | |
37
Morgan Stanley Institutional Fund, Inc.
Annual Report — December 31, 2016
Director and Officer Information (unaudited) (cont'd)
Independent Directors: (cont'd)
Name, Age and Address of
Independent Director | | Position(s)
Held with
Registrant | | Length of Time
Served* | | Principal Occupation(s) During Past 5 Years
and Other Relevant Professional Experience | | Number of
Portfolios in
Fund Complex
Overseen by
Independent
Director** | | Other Directorships
Held by Independent
Director*** | |
Michael F. Klein (58)
c/o Perkins Coie LLP
Counsel to the Independent Directors
30 Rockefeller Plaza
New York, NY 10112 | | Director | | Since
August
2006 | | Managing Director, Aetos Capital, LLC (since March 2000); Co-President, Aetos Alternatives Management, LLC (since January 2004) and Co-Chief Executive Officer of Aetos Capital LLC (since August 2013); Chairperson of the Fixed Income Sub-Committee of the Investment Committee (since October 2006) and Director or Trustee of various Morgan Stanley Funds (since August 2006); formerly, Managing Director, Morgan Stanley & Co. Inc. and Morgan Stanley Dean Witter Investment Management, President, various Morgan Stanley Funds (June 1998-March 2000) and Principal, Morgan Stanley & Co. Inc. and Morgan Stanley Dean Witter Investment Management (August 1997-December 1999). | | | 90 | | | Director of certain investment funds managed or sponsored by Aetos Capital, LLC; Director of Sanitized AG and Sanitized Marketing AG (specialty chemicals). | |
Patricia Maleski (56)
c/o Perkins Coie LLP
Counsel to the Independent Directors
30 Rockefeller Plaza
New York, NY 10112 | | Director | | Since
January
2017 | | Management Director, JPMorgan Asset Management (2013-2016); President, JPMorgan Funds (2010-2013), Chief Administrative Officer, JPMorgan Funds (2004-2010), Treasurer, JPMorgan Funds (2003-2004, 2008-2010), and Vice President and Board Liaison, JPMorgan Funds (2001-2004); Managing Director, J.P. Morgan Investment Management Inc. (2001-2013); Vice President of Finance, Pierpont Group (1996-2001); Vice President, Bank of New York (1995-1996); Senior Audit Manager, Price Waterhouse, LLP (1982-1995). | | | 91 | | | None. | |
Michael E. Nugent (80)
522 Fifth Avenue
New York, NY 10036 | | Chair of the Board and Director | | Chair of the Boards since July 2006 and Director since July 1991 | | Chair of the Boards of various Morgan Stanley Funds (since July 2006); Chairperson of the Closed-End Fund Committee (since June 2012) and Director or Trustee of various Morgan Stanley Funds (since July 1991); formerly, Chairperson of the Insurance Committee (until July 2006); General Partner, Triumph Capital, L.P. (private investment partnership) (1988-2013). | | | 92 | | | None. | |
W. Allen Reed (69)
c/o Perkins Coie LLP
Counsel to the Independent Directors
30 Rockefeller Plaza
New York, NY 10112 | | Director | | Since
August
2006 | | Chairperson of the Equity Sub-Committee of the Investment Committee (since October 2006) and Director or Trustee of various Morgan Stanley Funds (since August 2006); formerly, President and CEO of General Motors Asset Management; Chairman and Chief Executive Officer of the GM Trust Bank and Corporate Vice President of General Motors Corporation (August 1994-December 2005). | | | 91 | | | Director of Legg Mason, Inc.; formerly, Director of the Auburn University Foundation (2010-2015). | |
Fergus Reid (84)
c/o Joe Pietryka, Inc.
85 Charles Colman Blvd.
Pawling, NY 12564 | | Director | | Since
June
1992 | | Chairman, Joe Pietryka, Inc.; Chairperson of the Governance Committee and Director or Trustee of various Morgan Stanley Funds (since June 1992). | | | 92 | | | Formerly, Trustee and Director of certain investment companies in the JP Morgan Fund Complex managed by JP Morgan Investment Management Inc. (1987-2012). | |
* This is the earliest date the Director began serving the Morgan Stanley Funds. Each Director serves an indefinite term, until his or her successor is elected.
** The Fund Complex includes (as of December 31, 2016) all open-end and closed-end funds (including all of their portfolios) advised by Morgan Stanley Investment Management Inc. (the "Adviser") and any funds that have an adviser that is an affiliated person of the Adviser (including, but not limited to, Morgan Stanley AIP GP LP).
*** This includes any directorships at public companies and registered investment companies held by the Director at any time during the past five years.
38
Morgan Stanley Institutional Fund, Inc.
Annual Report — December 31, 2016
Director and Officer Information (unaudited) (cont'd)
Executive Officers:
Name, Age and Address of Executive Officer | | Position(s) Held
with
Registrant | | Length of Time
Served* | | Principal Occupation(s) During Past 5 Years | |
John H. Gernon (53)
522 Fifth Avenue
New York, NY 10036 | | President and Principal Executive Officer | | Since
September
2013 | | President and Principal Executive Officer of the Equity and Fixed Income Funds and the Morgan Stanley AIP Funds (since September 2013) and the Liquidity Funds and various money market funds (since May 2014) in the Fund Complex; Managing Director of the Adviser; Head of Product (since 2006). | |
Timothy J. Knierim (58)
522 Fifth Avenue
New York, NY 10036 | | Chief Compliance Officer | | Since
December
2016 | | Managing Director of the Adviser and various entities affiliated with the Adviser; Chief Compliance Officer of various Morgan Stanley Funds and the Adviser (since December 2016) and Chief Compliance Officer of Morgan Stanley AIP GP LP (since 2014). Formerly, Managing Director and Deputy Chief Compliance Officer of the Adviser (2014-2016); and formerly, Chief Compliance Officer of Prudential Investment Management, Inc. (2007-2014). | |
Francis J. Smith (51)
522 Fifth Avenue
New York, NY 10036 | | Treasurer and Principal Financial Officer | | Treasurer since July 2003 and Principal Financial Officer since September 2002 | | Managing Director of the Adviser and various entities affiliated with the Adviser; Treasurer (since July 2003) and Principal Financial Officer of various Morgan Stanley Funds (since September 2002). | |
Mary E. Mullin (49)
522 Fifth Avenue
New York, NY 10036 | | Secretary | | Since
June
1999 | | Executive Director of the Adviser; Secretary of various Morgan Stanley Funds (since June 1999). | |
* This is the earliest date the officer began serving the Morgan Stanley Funds. Each officer serves a one-year term, until his or her successor is elected and qualifies.
39
Morgan Stanley Institutional Fund, Inc.
Annual Report — December 31, 2016
Adviser and Administrator
Morgan Stanley Investment Management Inc.
522 Fifth Avenue
New York, New York 10036
Distributor
Morgan Stanley Distribution, Inc.
522 Fifth Avenue
New York, New York 10036
Dividend Disbursing and Transfer Agent
Boston Financial Data Services, Inc.
2000 Crown Colony Drive
Quincy, Massachusetts 02169
Custodian
State Street Bank and Trust Company
One Lincoln Street
Boston, Massachusetts 02111
Legal Counsel
Dechert LLP
1095 Avenue of the Americas
New York, New York 10036
Counsel to the Independent Directors
Perkins Coie LLP
30 Rockefeller Plaza
New York, New York 10112
Independent Registered Public Accounting Firm
Ernst & Young LLP
200 Clarendon Street
Boston, Massachusetts 02116
Reporting to Shareholders
Each Morgan Stanley fund provides a complete schedule of portfolio holdings in its semi-annual and annual reports within 60 days of the end of the fund's second and fourth fiscal quarters. The semi-annual and annual reports are filed electronically with the Securities and Exchange Commission (SEC) on Form N-CSRS and Form N-CSR, respectively. Morgan Stanley also delivers the semi-annual and annual reports to fund shareholders and makes these reports available on its public website, www.morganstanley.com/im. Each Morgan Stanley fund also files a complete schedule of portfolio holdings with the SEC for the fund's first and third fiscal quarters on Form N-Q. Morgan Stanley does not deliver the reports for the first and third fiscal quarters to shareholders, nor are the reports posted to the Morgan Stanley public website. You may, however, obtain the Form N-Q filings (as well as the Form N-CSR and N-CSRS filings) by accessing the SEC's website, www.sec.gov. You may also review and copy them at the SEC's Public Reference Room in Washington, DC. Information on the operation of the SEC's Public Reference Room may be obtained by calling the SEC toll free at 1 (800) SEC-0330. You can also request copies of these materials, upon payment of a duplicating fee, by electronic request at the SEC's email address (publicinfo@sec.gov) or by writing the Public Reference Room of the SEC, 100 F Street, NE, Washington, DC 20549-0102.
Proxy Voting Policies and Procedures and Proxy Voting Record
You may obtain a copy of the Fund's Proxy Voting Policy and Procedures and information regarding how the Fund voted proxies relating to portfolio securities during the most recent twelve-month period ended June 30, without charge, upon request, by calling toll free 1 (800) 548-7786 or by visiting our website at www.morganstanley.com/im. This information is also available on the SEC's website at www.sec.gov.
This report is authorized for distribution only when preceded or accompanied by a prospectus or summary prospectus of the applicable Portfolio of Morgan Stanley Institutional Fund, Inc., which describes in detail the Portfolio's investment policies, risks, fees and expenses. Please read the prospectus carefully before you invest or send money. For additional information, including information regarding the investments comprising the Portfolio, please visit our website at www.morganstanley.com/im or call toll free 1 (800) 548-7786.
40
(This Page has been left blank intentionally.)
Printed in U.S.A.
This Report has been prepared for shareholders and may be distributed to others only if preceded or accompanied by a current prospectus.
Morgan Stanley Investment Management Inc.
522 Fifth Avenue
New York, New York 10036
© 2017 Morgan Stanley. Morgan Stanley Distribution, Inc.

IFIGDANN
1695708 EXP. 02.28.18

Morgan Stanley Institutional Fund, Inc.
Global Franchise Portfolio
Annual Report
December 31, 2016

Morgan Stanley Institutional Fund, Inc.
Annual Report — December 31, 2016
Shareholders' Letter | | | 2 | | |
Expense Example | | | 3 | | |
Investment Overview | | | 4 | | |
Portfolio of Investments | | | 8 | | |
Statement of Assets and Liabilities | | | 9 | | |
Statement of Operations | | | 11 | | |
Statements of Changes in Net Assets | | | 12 | | |
Financial Highlights | | | 14 | | |
Notes to Financial Statements | | | 19 | | |
Report of Independent Registered Public Accounting Firm | | | 26 | | |
Federal Tax Notice | | | 27 | | |
Privacy Notice | | | 28 | | |
Director and Officer Information | | | 31 | | |
This report is authorized for distribution only when preceded or accompanied by a prospectus or summary prospectus of the applicable Portfolio of Morgan Stanley Institutional Fund, Inc. To receive a prospectus and/or statement of additional information (SAI), which contains more complete information such as investment objectives, charges, expenses, policies for voting proxies, risk considerations, and describes in detail each of the Portfolio's investment policies to the prospective investor, please call toll free 1 (800) 548-7786. Please read the prospectuses carefully before you invest or send money.
Additionally, you can access information about the Portfolio, including performance, characteristics, and investment team commentary, through Morgan Stanley Investment Management's website: www.morganstanley.com/im.
Market forecasts provided in this report may not necessarily come to pass. There is no guarantee that any sectors mentioned will continue to perform as discussed herein or that securities in such sectors will be held by the Portfolio in the future. There is no assurance that a Portfolio will achieve its investment objective. Portfolios are subject to market risk, which is the possibility that market values of securities owned by the Portfolio will decline and, therefore, the value of the Portfolio's shares may be less than what you paid for them. Accordingly, you can lose money investing in this Portfolio. Please see the prospectus for more complete information on investment risks.
1
Morgan Stanley Institutional Fund, Inc.
Annual Report — December 31, 2016
Shareholders' Letter (unaudited)
Dear Shareholders,
We are pleased to provide this Annual report, in which you will learn how your investment in Global Franchise Portfolio (the "Portfolio") performed during the latest twelve-month period.
Morgan Stanley Investment Management is a client-centric, investor-led organization. Our global presence, intellectual capital, and breadth of products and services enable us to partner with investors to meet the evolving challenges of today's financial markets. We aim to deliver superior investment service and to empower our clients to make the informed decisions that help them reach their investment goals.
As always, we thank you for selecting Morgan Stanley Investment Management, and look forward to working with you in the months and years ahead.
Sincerely,

John H. Gernon
President and Principal Executive Officer
January 2017
2
Morgan Stanley Institutional Fund, Inc.
Annual Report — December 31, 2016
Expense Example (unaudited)
Global Franchise Portfolio
As a shareholder of the Portfolio, you incur two types of costs: (1) transactional costs; and (2) ongoing costs, which may include advisory fees, administration fees, distribution and shareholder services fees and other Portfolio expenses. This example is intended to help you understand your ongoing costs (in dollars) of investing in the Portfolio and to compare these costs with the ongoing costs of investing in other mutual funds.
This example is based on an investment of $1,000 invested at the beginning of the six-month period ended December 31, 2016 and held for the entire six-month period.
Actual Expenses
The table below provides information about actual account values and actual expenses. You may use the information in this table, together with the amount you invested, to estimate the expenses that you paid over the period. Simply divide your account value by $1,000 (for example, an $8,600 account value divided by $1,000 = 8.6), then multiply the result by the number in the table under the heading entitled "Actual Expenses Paid During Period" to estimate the expenses you paid on your account during this period.
Hypothetical Example for Comparison Purposes
The table below provides information about hypothetical account values and hypothetical expenses based on the Portfolio's actual expense ratio and an assumed rate of return of 5% per year before expenses, which is not the Portfolio's actual return. The hypothetical account values and expenses may not be used to estimate the actual ending account balance or expenses you paid for the period. You may use this information to compare the ongoing costs of investing in the Portfolio and other funds. To do so, compare this 5% hypothetical example with the 5% hypothetical examples that appear in the shareholder reports of the other funds.
Please note that the expenses shown in the table are meant to highlight your ongoing costs only and do not reflect any transactional costs, such as sales charges (loads). Therefore, the information for each class in the table is useful in comparing ongoing costs only, and will not help you determine the relative total costs of owning different funds. In addition, if these transactional costs were included, your costs would have been higher.
| | | Beginning
Account
Value
7/1/16 | | Actual Ending
Account
Value
12/31/16 | | Hypothetical
Ending Account
Value | | Actual
Expenses
Paid
During
Period* | | Hypothetical
Expenses Paid
During Period* | | Net
Expense
Ratio
During
Period** | |
Global Franchise Portfolio Class I | | $ | 1,000.00 | | | $ | 988.80 | | | $ | 1,020.21 | | | $ | 4.90 | | | $ | 4.98 | | | | 0.98 | %*** | |
Global Franchise Portfolio Class A | | | 1,000.00 | | | | 987.80 | | | | 1,018.95 | | | | 6.15 | | | | 6.24 | | | | 1.23 | *** | |
Global Franchise Portfolio Class L | | | 1,000.00 | | | | 984.90 | | | | 1,016.54 | | | | 8.53 | | | | 8.67 | | | | 1.71 | *** | |
Global Franchise Portfolio Class C | | | 1,000.00 | | | | 983.50 | | | | 1,014.98 | | | | 10.07 | | | | 10.23 | | | | 2.02 | *** | |
Global Franchise Portfolio Class IS | | | 1,000.00 | | | | 988.90 | | | | 1,020.51 | | | | 4.60 | | | | 4.67 | | | | 0.92 | *** | |
* Expenses are calculated using each Portfolio Class' annualized net expense ratio (as disclosed), multiplied by the average account value over the period, and multiplied by 184/366 (to reflect the most recent one-half year period).
** Annualized.
*** Refer to Note F in the Notes to Financial Statements for discussion of prior period custodian out-of-pocket expenses that were reimbursed in the current period.
3
Morgan Stanley Institutional Fund, Inc.
Annual Report — December 31, 2016
Investment Overview (unaudited)
Global Franchise Portfolio
The Portfolio seeks long-term capital appreciation.
Performance
For the year ended December 31, 2016, the Portfolio's Class I shares had a total return based on net asset value and reinvestment of distributions per share of 5.64%, net of fees. The Portfolio's Class I shares underperformed against the Portfolio's benchmark, the MSCI World Index (the "Index"), which returned 7.51%.
Factors Affecting Performance
• After all was said and done, the Index ended the year up 7.5% in U.S. dollar ("USD") terms (+9.0% local). The commodity markets fared best in 2016, with Canada up 25% in USD, Norway gaining 13% and Australia 11%.(i) The U.S. was also comfortably ahead of the Index (+11%). Core Europe was only up mildly, with France and the Netherlands each up +5% in USD and 8% in euros. Japan was up 2% in USD but down 1% in yen, while the U.K. was flat in dollars, but up a mighty 19% in wilting sterling. Peripheral Europe lagged the Index, with Spain off 1%, Ireland down 7% and Italy down 10% in USD despite a late-year rally. It was a decent year for emerging markets, up 11% in USD and 10% in local currency, as measured by the MSCI Emerging Markets Index. The stars were Brazil (up 66%) and Russia (up 55%).
• Overall, 2016 saw the commodity complex doing best, with energy up +27% and materials up +22%, and the cyclical industrials (+13%), financials (+12%) and information technology (+11%) also beating the Index.(i) Consumer discretionary lagged a little, up only 3%, but the other strugglers were the defensives. Utilities and telecommunications (both +6%) were close to the overall Index performance, but consumer staples was only up 2% and health care actually fell 7%. The real story was that it was a year of two very different halves, with, what we consider high quality ruling the first half and lower quality dominating the second half. Consumer staples was 8% ahead of the market in the first half but 13% behind in the second half, while financials was 9% behind in the first half but 15% ahead in the second half.
• For the Portfolio, for 2016 as a whole, sector allocation was significantly negative, thanks to the major overweight in consumer staples, the absence from the energy sector and the near absence from financials only partly mitigated by the lack of health care. Stock selection was a distinct positive, thanks to outperformance in consumer staples, consumer discretionary and information technology, but it was not enough to match the sector effect.
• Top absolute contributors for the year were Reynolds American, Time Warner and Microsoft. Top absolute detractors for the period were Reckitt Benckiser, Nike and Unilever.(ii)
Management Strategies
• The defining feature of the second half of 2016 has been the massive rally in value stocks (and a balancing de-rating of defensives) given an extra boost in the fourth quarter by the election of President-elect Trump. Executing an effortless hand-brake turn, it appears that the market has effectively reassessed the global outlook from one of sluggish growth and disinflation to one of reflation and rising growth. We believe the market is clearly hoping that fiscal policy will now drive reflation (i.e., growth and inflation) after monetary policy failed to do so. After years of deadlock, America now seems to be getting an executive that can likely get laws through Congress (for better or worse) as Trump and the Republican establishment decide that on balance they probably despise each other less than they hate the Democrats. This means that the U.S. may use fiscal policy where it previously over-used monetary policy in the face of political gridlock. Whether it works or not or has the desired outcomes is of course another question.
• We believe low expectations may well help Trump and should not obscure his biggest potential long-term opportunity — to sort out the U.S. taxation system, which has incentivized U.S. companies to invest outside America.
(i) Country, region and sector performance data from FactSet
(ii) The information contained in this overview regarding specific securities is for informational purposes only and should not be construed as a recommendation to purchase or sell the securities mentioned.
4
Morgan Stanley Institutional Fund, Inc.
Annual Report — December 31, 2016
Investment Overview (unaudited) (cont'd)
Global Franchise Portfolio
• Cutting personal and corporate tax rates should provide a stimulus to the economy, and in the case of some domestically focused U.S. companies, could significantly boost post-tax earnings. However, there are a series of provisos. Many U.S. corporates already have a tax rate well below the headline 35% rate,(iii) either because of foreign income or assorted loopholes, while the proposed border adjustment tax brings risks of trade wars. The hopes of a resultant capital expenditure surge may be overstated in the short term, particularly in the case of the piles of overseas cash held by tech companies, as they are not exactly cash-constrained at present. However, longer term, a border adjustment tax, if actually implemented, could be a game changer if the rest of the world, and particularly China, puts up with the U.S. joining the global tax arbitrage game rather than risking hard tariffs.
• Looking at the macro side, the personal tax cuts seem to be heavily skewed to higher earners (as opposed to those on lower incomes who reportedly helped put Trump in the White House), which may limit the macro impact given the wealthy's higher propensity to save rather than spend. However, the state of the economic cycle may be more of a problem. U.S. unemployment is already under 5%,(iv) and rising wages, while positive for demand, could well put significant pressures on corporate margins, potentially wiping out the taxation gains in many cases where companies lack pricing power. It could well also push the Federal Reserve to tighten faster than expected.
• The market assumption that there will be reflation via fiscal policy outside the U.S. looks particularly dangerous. In Europe, the Germans are critical of the European Union agreeing to use fiscal policy (or at least, relax current fiscal constraints on individual countries) to reflate and we see next to no chance of a significant move in 2017. Mrs. Merkel wants to be re-elected in September 2017 and may therefore be extremely reluctant to give further ammunition to the euro-skeptic German AfD (Alternative for
German) party, which has seen substantial state election gains in 2016 following Merkel's unpopular refugee policy. In Japan, there has been a history of reflation via fiscal policy, but the government has yet to cross the Rubicon of the Bank of Japan backing effectively unlimited government fiscal expenditure rather than merely tethering bond yields to circa 0%. Of all developed countries, Japan is probably closest to crossing this Rubicon due to its dire government debt situation, but will probably be cautious about doing so as it would almost certainly blow up the yen.
• Overall, we do not yet see a significant inflationary threat. The rise in commodity prices is likely to feed through over the next year, and there are the classic late-cycle pressures in the U.S. through increasing labor costs. However, there are still substantial deflationary forces in the system, given the enormous overhang of debt in the world and the impacts of technology. There has already been a transfer of $3 trillion of value from the bond market to the equity market,(v) and Trump has not always been a friend of debt holders during his business career, but a severe bond rout looks unlikely.
• We do worry that the market is too sanguine on political risk. The biggest single worry is Trump doing something crazy (via executive order or tweet) on foreign policy or trade. The next biggest worry is European politics. In 2017, Europe is facing elections in the Netherlands, France and Germany and a potential early election in Italy. Each of these has potential existential risk for the eurozone if they follow the political playbook of Brexit or Trump. While it is likely that the status quo will just about scrape by in each country, it is far from clear that it will manage a clean sweep. If any one of these elections creates existential threats for Europe, we expect stock market fireworks in 2017. At a more fundamental level, it is far from clear that the sustained global howl of rage at the financial and political elites should be positive for asset prices.
(iii) Source: U.S. Government Accountability Office Report to the Ranking Member, Committee on the Budget, U.S. Senate, "Corporate Income Tax: Most Large Profitable U.S. Corporations Paid Tax but Effective Tax Rates Differed Significantly from the Statutory Rate," GAO-16-363, March 2016.
(iv) Source: Bureau of Labor Statistics, December 2016
(v) Source: Deutsche Bank Research, December 20, 2016
5
Morgan Stanley Institutional Fund, Inc.
Annual Report — December 31, 2016
Investment Overview (unaudited) (cont'd)
Global Franchise Portfolio
• Any update from us these days would not be complete without a moan about valuations. The Index is trading at over 16x estimated 2017 earnings, which are themselves assumed to be up a healthy 13% on the 2016 earnings, with the U.S. more than a turn higher than that.(vi) This does not seem to offer a sufficient margin of safety given the myriad risks we have mentioned above, even before considering how the "adjusted" earnings are inflated versus the official GAAP/IFRS (Generally Accepted Accounting Principles/International Financial Reporting Standards) numbers these days. The Schiller Price-Earnings (P/E), which attempts to control for the business cycle by using a 10-year average for earnings, is now at 28x for the U.S., only beaten during the Tech-Media-Telecom boom and the late 1920s bubble.(vi)
• While the overall level of valuation is demanding, the sector rotation over the last six months has left the two highest-quality sectors, consumer staples and health care, looking attractive in relative terms. The consumer staples premium to the Index has halved over the period form 31% to 15%, and is lower still than that in free cash flow terms, while health care, very unusually, is trading at a 10% discount to the market, although the threat of significant drug pricing reform in the U.S., had Clinton won, has been replaced by the threat of occasional threatening tweets under Trump.(vi) While it is very possible that the Trump rally and rotation has further to run, these two sectors look reasonably priced in absolute terms, and attractive in relative returns given their historically defensive stability and high returns on capital.
(vi) Source: FactSet, December 31, 2016
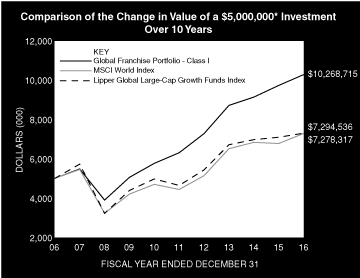
* Minimum Investment for Class I shares
In accordance with SEC regulations, the Portfolio's performance shown assumes that all recurring fees (including management fees) were deducted and all dividends and distributions were reinvested. The performance of Class A, L , C and IS shares will vary from the performance of Class I shares based upon their different inception dates and will be negatively impacted by additional fees assessed to those classes (if applicable).
6
Morgan Stanley Institutional Fund, Inc.
Annual Report — December 31, 2016
Investment Overview (unaudited) (cont'd)
Global Franchise Portfolio
Performance Compared to the MSCI World Index(1) and the Lipper Global Large-Cap Growth Funds Index(2)
| | | Period Ended December 31, 2016
Total Returns(3) | |
| | | | | Average Annual | |
| | | One
Year | | Five
Years | | Ten
Years | | Since
Inception(8) | |
Portfolio — Class I Shares
w/o sales charges(4) | | | 5.64 | % | | | 10.25 | % | | | 7.46 | % | | | 10.65 | % | |
Portfolio — Class A Shares
w/o sales charges(4) | | | 5.36 | | | | 9.96 | | | | 7.18 | | | | 10.35 | | |
Portfolio — Class A Shares
with maximum 5.25%
sales charges(4) | | | –0.19 | | | | 8.78 | | | | 6.60 | | | | 9.96 | | |
Portfolio — Class L Shares
w/o sales charges(5) | | | 4.82 | | | | — | | | | — | | | | 7.25 | | |
Portfolio — Class C Shares
w/o sales charges(7) | | | 4.58 | | | | — | | | | — | | | | 7.85 | | |
Portfolio — Class C Shares
with maximum 1.00%
deferred sales charges(7) | | | 3.58 | | | | — | | | | — | | | | 7.85 | | |
Portfolio — Class IS Shares
w/o sales charges(6) | | | 5.70 | | | | — | | | | — | | | | 3.84 | | |
MSCI World Index | | | 7.51 | | | | 10.41 | | | | 3.83 | | | | 5.92 | | |
Lipper Global Large-Cap
Growth Funds Index | | | 2.91 | | | | 9.47 | | | | 3.85 | | | | 5.23 | | |
Performance data quoted represents past performance, which is no guarantee of future results, and current performance may be lower or higher than the figures shown. Performance assumes that all dividends and distributions, if any, were reinvested. For the most recent month-end performance figures, please visit www.morganstanley.com/im. Investment return and principal value will fluctuate so that Portfolio shares, when redeemed, may be worth more or less than their original cost. Total returns do not reflect the deduction of taxes that a shareholder would pay on Portfolio distributions or the redemption of Portfolio shares. Performance of share classes will vary due to difference in expenses.
(1) The MSCI World Index is a free float-adjusted market capitalization weighted index that is designed to measure the global equity market performance of developed markets. The term "free float" represents the portion of shares outstanding that are deemed to be available for purchase in the public equity markets by investors. The MSCI World Index currently consists of 23 developed market country indices. The performance of the Index is listed in U.S. dollars and assumes reinvestment of net dividends. The Index is unmanaged and its returns do not include any sales charges or fees. Such costs would lower performance. It is not possible to invest directly in an index.
(2) The Lipper Global Large-Cap Growth Funds Index is an equally weighted performance index of the largest qualifying funds (based on net assets) in the Lipper Global Large-Cap Growth Funds classification. The Index, which is adjusted for capital gains distributions and income dividends, is unmanaged and should not be considered an investment. There are currently 10 funds represented in this Index. As of the date of this report, the Portfolio is in the Lipper Global Large-Cap Growth Funds classification.
(3) Total returns for the Portfolio reflect fees waived and expenses reimbursed, if applicable, by the Adviser. Without such waivers and reimbursements, total returns would have been lower.
(4) Commenced operations on November 28, 2001.
(5) Commenced offering on April 27, 2012.
(6) Commenced offering on May 29, 2015.
(7) Commenced offering on September 30, 2015.
(8) For comparative purposes, average annual since inception returns listed for the Indexes refer to the inception date of Class I of the Portfolio, not the inception of the Index.
7
Morgan Stanley Institutional Fund, Inc.
Annual Report — December 31, 2016
Portfolio of Investments
Global Franchise Portfolio
| | | Shares | | Value
(000) | |
Common Stocks (98.1%) | |
France (10.7%) | |
L'Oreal SA | | | 306,316 | | | $ | 55,911 | | |
Pernod Ricard SA | | | 235,376 | | | | 25,508 | | |
| | | | 81,419 | | |
Germany (3.5%) | |
SAP SE | | | 304,311 | | | | 26,527 | | |
Italy (1.3%) | |
Davide Campari-Milano SpA | | | 1,007,824 | | | | 9,856 | | |
Netherlands (0.8%) | |
RELX N.V. | | | 395,116 | | | | 6,650 | | |
Switzerland (3.7%) | |
Nestle SA (Registered) | | | 395,314 | | | | 28,359 | | |
United Kingdom (25.5%) | |
British American Tobacco PLC | | | 833,302 | | | | 47,461 | | |
Experian PLC | | | 819,443 | | | | 15,896 | | |
Reckitt Benckiser Group PLC | | | 798,832 | | | | 67,791 | | |
RELX PLC | | | 571,918 | | | | 10,213 | | |
Unilever PLC | | | 1,304,492 | | | | 52,932 | | |
| | | | 194,293 | | |
United States (52.6%) | |
Accenture PLC, Class A | | | 295,579 | | | | 34,621 | | |
Altria Group, Inc. | | | 545,793 | | | | 36,907 | | |
Automatic Data Processing, Inc. | | | 266,831 | | | | 27,425 | | |
Coca-Cola Co. | | | 359,282 | | | | 14,896 | | |
International Flavors & Fragrances, Inc. | | | 117,311 | | | | 13,823 | | |
Intuit, Inc. | | | 90,755 | | | | 10,401 | | |
Microsoft Corp. | | | 977,981 | | | | 60,772 | | |
Moody's Corp. | | | 73,993 | | | | 6,975 | | |
NIKE, Inc., Class B | | | 496,104 | | | | 25,217 | | |
Philip Morris International, Inc. | | | 299,480 | | | | 27,399 | | |
Reynolds American, Inc. | | | 536,567 | | | | 30,069 | | |
Time Warner, Inc. | | | 175,120 | | | | 16,904 | | |
Twenty-First Century Fox, Inc., Class A | | | 631,219 | | | | 17,699 | | |
Twenty-First Century Fox, Inc., Class B | | | 633,897 | | | | 17,274 | | |
Visa, Inc., Class A | | | 388,934 | | | | 30,345 | | |
Walt Disney Co. (The) | | | 288,852 | | | | 30,104 | | |
| | | | 400,831 | | |
Total Common Stocks (Cost $631,168) | | | 747,935 | | |
| | | Shares | | Value
(000) | |
Short-Term Investment (2.0%) | |
Investment Company (2.0%) | |
Morgan Stanley Institutional Liquidity
Funds — Treasury Securities Portfolio —
Institutional Class (See Note G)
(Cost $14,913) | | | 14,912,598 | | | $ | 14,913 | | |
Total Investments (100.1%) (Cost $646,081) (a) | | | 762,848 | | |
Liabilities in Excess of Other Assets (–0.1%) | | | (769 | ) | |
Net Assets (100.0%) | | $ | 762,079 | | |
Country assignments and aggregations are based generally on third party vendor classifications and information, and may be different from the assignments and aggregations under the policies set forth in the Portfolio's prospectus and/or statement of additional information relating to geographic classifications.
(a) At December 31, 2016, the aggregate cost for federal income tax purposes is approximately $649,979,000. The aggregate gross unrealized appreciation is approximately $119,031,000 and the aggregate gross unrealized depreciation is approximately $6,162,000, resulting in net unrealized appreciation of approximately $112,869,000.
Portfolio Composition
Classification | | Percentage of
Total Investments | |
Tobacco | | | 18.6 | % | |
Other* | | | 16.0 | | |
Personal Products | | | 14.3 | | |
Software | | | 12.8 | | |
Information Technology Services | | | 12.1 | | |
Media | | | 10.7 | | |
Household Products | | | 8.9 | | |
Beverages | | | 6.6 | | |
Total Investments | | | 100.0 | % | |
* Industries and/or investment types representing less than 5% of total investments.
The accompanying notes are an integral part of the financial statements.
8
Morgan Stanley Institutional Fund, Inc.
Annual Report — December 31, 2016
Global Franchise Portfolio
Statement of Assets and Liabilities | | December 31, 2016
(000) | |
Assets: | |
Investments in Securities of Unaffiliated Issuers, at Value (Cost $631,168) | | $ | 747,935 | | |
Investment in Security of Affiliated Issuer, at Value (Cost $14,913) | | | 14,913 | | |
Total Investments in Securities, at Value (Cost $646,081) | | | 762,848 | | |
Dividends Receivable | | | 1,548 | | |
Tax Reclaim Receivable | | | 853 | | |
Receivable for Portfolio Shares Sold | | | 695 | | |
Receivable from Affiliate | | | 4 | | |
Other Assets | | | 67 | | |
Total Assets | | | 766,015 | | |
Liabilities: | |
Payable for Portfolio Shares Redeemed | | | 2,118 | | |
Payable for Advisory Fees | | | 1,498 | | |
Payable for Sub Transfer Agency Fees — Class I | | | 70 | | |
Payable for Sub Transfer Agency Fees — Class A | | | 9 | | |
Payable for Sub Transfer Agency Fees — Class L | | | — | @ | |
Payable for Sub Transfer Agency Fees — Class C | | | 2 | | |
Payable for Professional Fees | | | 54 | | |
Payable for Shareholder Services Fees — Class A | | | 22 | | |
Payable for Distribution and Shareholder Services Fees — Class L | | | 5 | | |
Payable for Distribution and Shareholder Services Fees — Class C | | | 25 | | |
Payable for Administration Fees | | | 51 | | |
Payable for Custodian Fees | | | 26 | | |
Payable for Directors' Fees and Expenses | | | 11 | | |
Payable for Transfer Agency Fees — Class I | | | 5 | | |
Payable for Transfer Agency Fees — Class A | | | 1 | | |
Payable for Transfer Agency Fees — Class L | | | — | @ | |
Payable for Transfer Agency Fees — Class C | | | 1 | | |
Payable for Transfer Agency Fees — Class IS | | | — | @ | |
Other Liabilities | | | 38 | | |
Total Liabilities | | | 3,936 | | |
Net Assets | | $ | 762,079 | | |
Net Assets Consist Of: | |
Paid-in-Capital | | $ | 648,116 | | |
Accumulated Undistributed Net Investment Income | | | 26 | | |
Distributions in Excess of Net Realized Gain | | | (2,743 | ) | |
Unrealized Appreciation (Depreciation) on: | |
Investments | | | 116,767 | | |
Foreign Currency Translations | | | (87 | ) | |
Net Assets | | $ | 762,079 | | |
The accompanying notes are an integral part of the financial statements.
9
Morgan Stanley Institutional Fund, Inc.
Annual Report — December 31, 2016
Global Franchise Portfolio
Statement of Assets and Liabilities (cont'd) | | December 31, 2016
(000) | |
CLASS I: | |
Net Assets | | $ | 601,340 | | |
| Shares Outstanding $0.001 par value shares of beneficial interest (unlimited shares authorized) (not in 000's) | | | 29,249,788 | | |
Net Asset Value, Offering and Redemption Price Per Share | | $ | 20.56 | | |
CLASS A: | |
Net Assets | | $ | 104,306 | | |
| Shares Outstanding $0.001 par value shares of beneficial interest (unlimited shares authorized) (not in 000's) | | | 5,174,499 | | |
Net Asset Value, Redemption Price Per Share | | $ | 20.16 | | |
Maximum Sales Load | | | 5.25 | % | |
Maximum Sales Charge | | $ | 1.12 | | |
Maximum Offering Price Per Share | | $ | 21.28 | | |
CLASS L: | |
Net Assets | | $ | 7,449 | | |
| Shares Outstanding $0.001 par value shares of beneficial interest (unlimited shares authorized) (not in 000's) | | | 369,993 | | |
Net Asset Value, Offering and Redemption Price Per Share | | $ | 20.13 | | |
CLASS C: | |
Net Assets | | $ | 29,650 | | |
| Shares Outstanding $0.001 par value shares of beneficial interest (unlimited shares authorized) (not in 000's) | | | 1,491,397 | | |
Net Asset Value, Offering and Redemption Price Per Share | | $ | 19.88 | | |
CLASS IS: | |
Net Assets | | $ | 19,334 | | |
| Shares Outstanding $0.001 par value shares of beneficial interest (unlimited shares authorized) (not in 000's) | | | 940,682 | | |
Net Asset Value, Offering and Redemption Price Per Share | | $ | 20.55 | | |
@ Amount is less than $500.
The accompanying notes are an integral part of the financial statements.
10
Morgan Stanley Institutional Fund, Inc.
Annual Report — December 31, 2016
Global Franchise Portfolio
Statement of Operations | | Year Ended
December 31, 2016
(000) | |
Investment Income: | |
Dividends from Securities of Unaffiliated Issuers (Net of $550 of Foreign Taxes Withheld) | | $ | 17,058 | | |
Dividends from Security of Affiliated Issuer (Note G) | | | 32 | | |
Total Investment Income | | | 17,090 | | |
Expenses: | |
Advisory Fees (Note B) | | | 5,672 | | |
Administration Fees (Note C) | | | 578 | | |
Shareholder Services Fees — Class A (Note D) | | | 239 | | |
Distribution and Shareholder Services Fees — Class L (Note D) | | | 64 | | |
Distribution and Shareholder Services Fees — Class C (Note D) | | | 208 | | |
Sub Transfer Agency Fees — Class I | | | 365 | | |
Sub Transfer Agency Fees — Class A | | | 60 | | |
Sub Transfer Agency Fees — Class L | | | 2 | | |
Sub Transfer Agency Fees — Class C | | | 13 | | |
Professional Fees | | | 112 | | |
Registration Fees | | | 106 | | |
Custodian Fees (Note F) | | | 75 | | |
Transfer Agency Fees — Class I (Note E) | | | 18 | | |
Transfer Agency Fees — Class A (Note E) | | | 4 | | |
Transfer Agency Fees — Class L (Note E) | | | 2 | | |
Transfer Agency Fees — Class C (Note E) | | | 5 | | |
Transfer Agency Fees — Class IS (Note E) | | | 2 | | |
Shareholder Reporting Fees | | | 26 | | |
Directors' Fees and Expenses | | | 18 | | |
Pricing Fees | | | 5 | | |
Other Expenses | | | 42 | | |
Total Expenses | | | 7,616 | | |
Rebate from Morgan Stanley Affiliate (Note G) | | | (29 | ) | |
Reimbursement of Class Specific Expenses — Class IS (Note B) | | | (1 | ) | |
Reimbursement of Custodian Fees (Note F) | | | (41 | ) | |
Net Expenses | | | 7,545 | | |
Net Investment Income | | | 9,545 | | |
Realized Gain (Loss): | |
Investments Sold | | | 19,931 | | |
Foreign Currency Transactions | | | (174 | ) | |
Net Realized Gain | | | 19,757 | | |
Change in Unrealized Appreciation (Depreciation): | |
Investments | | | 8,603 | | |
Foreign Currency Translations | | | (26 | ) | |
Net Change in Unrealized Appreciation (Depreciation) | | | 8,577 | | |
Net Realized Gain and Change in Unrealized Appreciation (Depreciation) | | | 28,334 | | |
Net Increase in Net Assets Resulting from Operations | | $ | 37,879 | | |
The accompanying notes are an integral part of the financial statements.
11
Morgan Stanley Institutional Fund, Inc.
Annual Report — December 31, 2016
Global Franchise Portfolio
Statements of Changes in Net Assets | | Year Ended
December 31, 2016
(000) | | Year Ended
December 31, 2015
(000) | |
Increase (Decrease) in Net Assets: | |
Operations: | |
Net Investment Income | | $ | 9,545 | | | $ | 7,944 | | |
Net Realized Gain | | | 19,757 | | | | 24,379 | | |
Net Change in Unrealized Appreciation (Depreciation) | | | 8,577 | | | | 3,732 | | |
Net Increase in Net Assets Resulting from Operations | | | 37,879 | | | | 36,055 | | |
Distributions from and/or in Excess of: | |
Class I: | |
Net Investment Income | | | (7,868 | ) | | | (7,968 | ) | |
Net Realized Gain | | | (18,038 | ) | | | (20,632 | ) | |
Class A: | |
Net Investment Income | | | (1,154 | ) | | | (1,064 | ) | |
Net Realized Gain | | | (3,160 | ) | | | (3,228 | ) | |
Class L: | |
Net Investment Income | | | (37 | ) | | | (84 | ) | |
Net Realized Gain | | | (234 | ) | | | (397 | ) | |
Class C: | |
Net Investment Income | | | (198 | ) | | | (52 | ) | |
Net Realized Gain | | | (898 | ) | | | (148 | ) | |
Class IS: | |
Net Investment Income | | | (255 | ) | | | (— | @) | |
Net Realized Gain | | | (495 | ) | | | (— | @) | |
Total Distributions | | | (32,337 | ) | | | (33,573 | ) | |
Capital Share Transactions:(1) | |
Class I: | |
Subscribed | | | 202,282 | | | | 92,850 | | |
Distributions Reinvested | | | 24,953 | | | | 27,499 | | |
Redeemed | | | (137,931 | ) | | | (133,336 | ) | |
Class A: | |
Subscribed | | | 52,962 | | | | 18,018 | | |
Distributions Reinvested | | | 4,282 | | | | 4,251 | | |
Redeemed | | | (28,456 | ) | | | (10,970 | ) | |
Class L: | |
Subscribed | | | 348 | | | | 216 | | |
Distributions Reinvested | | | 271 | | | | 480 | | |
Redeemed | | | (2,167 | ) | | | (1,167 | ) | |
Class C: | |
Subscribed | | | 27,106 | | | | 7,443 | * | |
Distributions Reinvested | | | 1,094 | | | | 199 | * | |
Redeemed | | | (3,734 | ) | | | (1,527 | )* | |
Class IS: | |
Subscribed | | | 19,487 | | | | 10 | ** | |
Distributions Reinvested | | | 750 | | | | — | | |
Redeemed | | | (— | @) | | | — | | |
Net Increase in Net Assets Resulting from Capital Share Transactions | | | 161,247 | | | | 3,966 | | |
Total Increase in Net Assets | | | 166,789 | | | | 6,448 | | |
Net Assets: | |
Beginning of Period | | | 595,290 | | | | 588,842 | | |
End of Period (Including Accumulated Undistributed Net Investment Income of $26 and $207) | | $ | 762,079 | | | $ | 595,290 | | |
The accompanying notes are an integral part of the financial statements.
12
Morgan Stanley Institutional Fund, Inc.
Annual Report — December 31, 2016
Global Franchise Portfolio
Statements of Changes in Net Assets (cont'd) | | Year Ended
December 31, 2016
(000) | | Year Ended
December 31, 2015
(000) | |
(1) Capital Share Transactions: | |
Class I: | |
Shares Subscribed | | | 9,702 | | | | 4,439 | | |
Shares Issued on Distributions Reinvested | | | 1,219 | | | | 1,330 | | |
Shares Redeemed | | | (6,525 | ) | | | (6,324 | ) | |
Net Increase (Decrease) in Class I Shares Outstanding | | | 4,396 | | | | (555 | ) | |
Class A: | |
Shares Subscribed | | | 2,566 | | | | 858 | | |
Shares Issued on Distributions Reinvested | | | 213 | | | | 209 | | |
Shares Redeemed | | | (1,378 | ) | | | (532 | ) | |
Net Increase in Class A Shares Outstanding | | | 1,401 | | | | 535 | | |
Class L: | |
Shares Subscribed | | | 17 | | | | 11 | | |
Shares Issued on Distributions Reinvested | | | 13 | | | | 24 | | |
Shares Redeemed | | | (107 | ) | | | (57 | ) | |
Net Decrease in Class L Shares Outstanding | | | (77 | ) | | | (22 | ) | |
Class C: | |
Shares Subscribed | | | 1,330 | | | | 353 | * | |
Shares Issued on Distributions Reinvested | | | 55 | | | | 10 | * | |
Shares Redeemed | | | (185 | ) | | | (71 | )* | |
Net Increase in Class C Shares Outstanding | | | 1,200 | | | | 292 | | |
Class IS: | |
Shares Subscribed | | | 903 | | | | — | @@** | |
Shares Issued on Distributions Reinvested | | | 37 | | | | — | | |
Shares Redeemed | | | (— | @@) | | | — | | |
Net Increase in Class IS Shares Outstanding | | | 940 | | | | — | @@ | |
@ Amount is less than $500.
@@ Amount is less than 500 shares.
* For the period September 30, 2015 through December 31, 2015.
** For the period May 29, 2015 through December 31, 2015.
The accompanying notes are an integral part of the financial statements.
13
Morgan Stanley Institutional Fund, Inc.
Annual Report — December 31, 2016
Financial Highlights
Global Franchise Portfolio
| | | Class I | |
| | | Year Ended December 31, | |
Selected Per Share Data and Ratios | | 2016(1) | | 2015 | | 2014 | | 2013 | | 2012 | |
Net Asset Value, Beginning of Period | | $ | 20.33 | | | $ | 20.27 | | | $ | 20.77 | | | $ | 18.13 | | | $ | 16.24 | | |
Income from Investment Operations: | |
Net Investment Income (2) | | | 0.30 | | | | 0.31 | | | | 0.41 | | | | 0.36 | | | | 0.40 | | |
Net Realized and Unrealized Gain | | | 0.84 | | | | 1.02 | | | | 0.57 | | | | 3.17 | | | | 2.11 | | |
Total from Investment Operations | | | 1.14 | | | | 1.33 | | | | 0.98 | | | | 3.53 | | | | 2.51 | | |
Distributions from and/or in Excess of: | |
Net Investment Income | | | (0.28 | ) | | | (0.35 | ) | | | (0.37 | ) | | | (0.35 | ) | | | (0.32 | ) | |
Net Realized Gain | | | (0.63 | ) | | | (0.92 | ) | | | (1.11 | ) | | | (0.54 | ) | | | (0.30 | ) | |
Total Distributions | | | (0.91 | ) | | | (1.27 | ) | | | (1.48 | ) | | | (0.89 | ) | | | (0.62 | ) | |
Net Asset Value, End of Period | | $ | 20.56 | | | $ | 20.33 | | | $ | 20.27 | | | $ | 20.77 | | | $ | 18.13 | | |
Total Return (3) | | | 5.64 | % | | | 6.50 | % | | | 4.82 | % | | | 19.71 | % | | | 15.38 | % | |
Ratios and Supplemental Data: | |
Net Assets, End of Period (Thousands) | | $ | 601,340 | | | $ | 505,321 | | | $ | 515,012 | | | $ | 570,261 | | | $ | 404,762 | | |
Ratio of Expenses to Average Net Assets (6) | | | 0.97 | %(4) | | | 0.98 | %(4) | | | 0.97 | %(4) | | | 0.95 | %(4) | | | 0.98 | %(4) | |
Ratio of Net Investment Income to Average Net Assets (6) | | | 1.40 | %(4) | | | 1.46 | %(4) | | | 1.94 | %(4) | | | 1.79 | %(4) | | | 2.21 | %(4) | |
Ratio of Rebate from Morgan Stanley Affiliates to Average Net Assets | | | 0.00 | %(5) | | | 0.00 | %(5) | | | 0.00 | %(5) | | | 0.00 | %(5) | | | 0.01 | % | |
Portfolio Turnover Rate | | | 30 | % | | | 37 | % | | | 33 | % | | | 24 | % | | | 34 | % | |
(6) Supplemental Information on the Ratios to Average Net Assets: | |
Ratios Before Expense Limitation: | |
Expenses to Average Net Assets | | | 0.98 | % | | | 0.99 | % | | | N/A | | | | N/A | | | | N/A | | |
Net Investment Income to Average Net Assets | | | 1.39 | % | | | 1.45 | % | | | N/A | | | | N/A | | | | N/A | | |
(1) Refer to Note F in the Notes to Financial Statements for discussion of prior period custodian out-of-pocket expenses that were reimbursed in the current period. The amount of the reimbursement was immaterial on a per share basis and did not impact the total return of Class I shares. The Ratio of Expenses to Average Net Assets would have been 0.01% higher and the Ratio of Net Investment Income to Average Net Assets would have been 0.01% lower had the custodian not reimbursed the Portfolio.
(2) Per share amount is based on average shares outstanding.
(3) Calculated based on the net asset value as of the last business day of the period.
(4) The Ratios of Expenses and Net Investment Income reflect the rebate of certain Portfolio expenses in connection with the investments in Morgan Stanley affiliates during the period. The effect of the rebate on the ratios is disclosed in the above table as "Ratio of Rebate from Morgan Stanley Affiliates to Average Net Assets."
(5) Amount is less than 0.005%.
The accompanying notes are an integral part of the financial statements.
14
Morgan Stanley Institutional Fund, Inc.
Annual Report — December 31, 2016
Financial Highlights
Global Franchise Portfolio
| | | Class A | |
| | | Year Ended December 31, | |
Selected Per Share Data and Ratios | | 2016(1) | | 2015 | | 2014 | | 2013 | | 2012 | |
Net Asset Value, Beginning of Period | | $ | 19.96 | | | $ | 19.92 | | | $ | 20.44 | | | $ | 17.86 | | | $ | 16.01 | | |
Income from Investment Operations: | |
Net Investment Income (2) | | | 0.23 | | | | 0.24 | | | | 0.34 | | | | 0.28 | | | | 0.35 | | |
Net Realized and Unrealized Gain | | | 0.83 | | | | 1.02 | | | | 0.55 | | | | 3.14 | | | | 2.09 | | |
Total from Investment Operations | | | 1.06 | | | | 1.26 | | | | 0.89 | | | | 3.42 | | | | 2.44 | | |
Distributions from and/or in Excess of: | |
Net Investment Income | | | (0.23 | ) | | | (0.30 | ) | | | (0.30 | ) | | | (0.30 | ) | | | (0.29 | ) | |
Net Realized Gain | | | (0.63 | ) | | | (0.92 | ) | | | (1.11 | ) | | | (0.54 | ) | | | (0.30 | ) | |
Total Distributions | | | (0.86 | ) | | | (1.22 | ) | | | (1.41 | ) | | | (0.84 | ) | | | (0.59 | ) | |
Net Asset Value, End of Period | | $ | 20.16 | | | $ | 19.96 | | | $ | 19.92 | | | $ | 20.44 | | | $ | 17.86 | | |
Total Return (3) | | | 5.36 | % | | | 6.25 | % | | | 4.45 | % | | | 19.42 | % | | | 15.14 | % | |
Ratios and Supplemental Data: | |
Net Assets, End of Period (Thousands) | | $ | 104,306 | | | $ | 75,297 | | | $ | 64,515 | | | $ | 83,135 | | | $ | 35,901 | | |
Ratio of Expenses to Average Net Assets (7) | | | 1.22 | %(4) | | | 1.25 | %(4) | | | 1.27 | %(4) | | | 1.20 | %(4)(5) | | | 1.23 | %(4) | |
Ratio of Net Investment Income to Average Net Assets (7) | | | 1.13 | %(4) | | | 1.15 | %(4) | | | 1.64 | %(4) | | | 1.42 | % | | | 1.99 | %(4) | |
Ratio of Rebate from Morgan Stanley Affiliates to Average Net Assets | | | 0.00 | %(6) | | | 0.00 | %(6) | | | 0.00 | %(6) | | | 0.00 | %(6) | | | 0.01 | % | |
Portfolio Turnover Rate | | | 30 | % | | | 37 | % | | | 33 | % | | | 24 | % | | | 34 | % | |
(7) Supplemental Information on the Ratios to Average Net Assets: | |
Ratios Before Expense Limitation: | |
Expenses to Average Net Assets | | | 1.23 | % | | | 1.25 | % | | | N/A | | | | N/A | | | | N/A | | |
Net Investment Income to Average Net Assets | | | 1.12 | % | | | 1.15 | % | | | N/A | | | | N/A | | | | N/A | | |
(1) Refer to Note F in the Notes to Financial Statements for discussion of prior period custodian out-of-pocket expenses that were reimbursed in the current period. The amount of the reimbursement was immaterial on a per share basis and did not impact the total return of Class A shares. The Ratio of Expenses to Average Net Assets would have been 0.01% higher and the Ratio of Net Investment Income to Average Net Assets would have been 0.01% lower had the custodian not reimbursed the Portfolio.
(2) Per share amount is based on average shares outstanding.
(3) Calculated based on the net asset value which does not reflect sales charges, if applicable, as of the last business day of the period.
(4) The Ratios of Expenses and Net Investment Income reflect the rebate of certain Portfolio expenses in connection with the investments in Morgan Stanley affiliates during the period. The effect of the rebate on the ratios is disclosed in the above table as "Ratio of Rebate from Morgan Stanley Affiliates to Average Net Assets."
(5) Effective September 16, 2013, the Adviser has agreed to limit the ratio of expenses to average net assets to the maximum ratio of 1.35% for Class A shares. Prior to September 16, 2013, the maximum ratio was 1.25% for Class A shares.
(6) Amount is less than 0.005%.
The accompanying notes are an integral part of the financial statements.
15
Morgan Stanley Institutional Fund, Inc.
Annual Report — December 31, 2016
Financial Highlights
Global Franchise Portfolio
| | | Class L | |
| | | Year Ended December 31, | | Period from
April 27, 2012(2) to | |
Selected Per Share Data and Ratios | | 2016(1) | | 2015 | | 2014 | | 2013 | | December 31, 2012 | |
Net Asset Value, Beginning of Period | | $ | 19.91 | | | $ | 19.87 | | | $ | 20.39 | | | $ | 17.83 | | | $ | 18.13 | | |
Income from Investment Operations: | |
Net Investment Income (3) | | | 0.13 | | | | 0.15 | | | | 0.25 | | | | 0.20 | | | | 0.10 | | |
Net Realized and Unrealized Gain | | | 0.82 | | | | 1.00 | | | | 0.55 | | | | 3.11 | | | | 0.16 | | |
Total from Investment Operations | | | 0.95 | | | | 1.15 | | | | 0.80 | | | | 3.31 | | | | 0.26 | | |
Distributions from and/or in Excess of: | |
Net Investment Income | | | (0.10 | ) | | | (0.19 | ) | | | (0.21 | ) | | | (0.21 | ) | | | (0.26 | ) | |
Net Realized Gain | | | (0.63 | ) | | | (0.92 | ) | | | (1.11 | ) | | | (0.54 | ) | | | (0.30 | ) | |
Total Distributions | | | (0.73 | ) | | | (1.11 | ) | | | (1.32 | ) | | | (0.75 | ) | | | (0.56 | ) | |
Net Asset Value, End of Period | | $ | 20.13 | | | $ | 19.91 | | | $ | 19.87 | | | $ | 20.39 | | | $ | 17.83 | | |
| Total Return (4) | | | 4.82 | % | | | 5.72 | % | | | 4.00 | % | | | 18.78 | % | | | 1.36 | %(8) | |
Ratios and Supplemental Data: | |
Net Assets, End of Period (Thousands) | | $ | 7,449 | | | $ | 8,898 | | | $ | 9,315 | | | $ | 9,112 | | | $ | 4,525 | | |
Ratio of Expenses to Average Net Assets (10) | | | 1.71 | %(5) | | | 1.72 | %(5) | | | 1.72 | %(5) | | | 1.70 | %(5)(6) | | | 1.73 | %(5)(9) | |
Ratio of Net Investment Income to Average Net Assets (10) | | | 0.65 | %(5) | | | 0.72 | %(5) | | | 1.19 | %(5) | | | 1.03 | %(5) | | | 0.84 | %(5)(9) | |
Ratio of Rebate from Morgan Stanley Affiliates to Average Net Assets | | | 0.00 | %(7) | | | 0.00 | %(7) | | | 0.00 | %(7) | | | 0.00 | %(7) | | | 0.01 | %(9) | |
Portfolio Turnover Rate | | | 30 | % | | | 37 | % | | | 33 | % | | | 24 | % | | | 34 | %(8) | |
(10) Supplemental Information on the Ratios to Average Net Assets: | |
Ratios Before Expense Limitation: | |
Expenses to Average Net Assets | | | 1.72 | % | | | 1.73 | % | | | N/A | | | | N/A | | | | N/A | | |
Net Investment Income to Average Net Assets | | | 0.64 | % | | | 0.71 | % | | | N/A | | | | N/A | | | | N/A | | |
(1) Refer to Note F in the Notes to Financial Statements for discussion of prior period custodian out-of-pocket expenses that were reimbursed in the current period. The amount of the reimbursement was immaterial on a per share basis and did not impact the total return of Class L shares. The Ratio of Expenses to Average Net Assets would have been 0.01% higher and the Ratio of Net Investment Income to Average Net Assets would have been 0.01% lower had the custodian not reimbursed the Portfolio.
(2) Commencement of Offering.
(3) Per share amount is based on average shares outstanding.
(4) Calculated based on the net asset value as of the last business day of the period.
(5) The Ratios of Expenses and Net Investment Income reflect the rebate of certain Portfolio expenses in connection with the investments in Morgan Stanley affiliates during the period. The effect of the rebate on the ratios is disclosed in the above table as "Ratio of Rebate from Morgan Stanley Affiliates to Average Net Assets."
(6) Effective September 16, 2013, the Adviser has agreed to limit the ratio of expenses to average net assets to the maximum ratio of 1.85% for Class L shares. Prior to September 16, 2013, the maximum ratio was 1.75% for Class L shares.
(7) Amount is less than 0.005%.
(8) Not Annualized.
(9) Annualized.
The accompanying notes are an integral part of the financial statements.
16
Morgan Stanley Institutional Fund, Inc.
Annual Report — December 31, 2016
Financial Highlights
Global Franchise Portfolio
| | | Class C | |
Selected Per Share Data and Ratios | | Year Ended
December 31, 2016(1) | | Period from
September 30, 2015(2) to
December 31, 2015 | |
Net Asset Value, Beginning of Period | | $ | 19.75 | | | $ | 19.79 | | |
Income from Investment Operations: | |
Net Investment Income (3) | | | 0.06 | | | | 0.01 | | |
Net Realized and Unrealized Gain | | | 0.84 | | | | 1.02 | | |
Total from Investment Operations | | | 0.90 | | | | 1.03 | | |
Distributions from and/or in Excess of: | |
Net Investment Income | | | (0.14 | ) | | | (0.28 | ) | |
Net Realized Gain | | | (0.63 | ) | | | (0.79 | ) | |
Total Distributions | | | (0.77 | ) | | | (1.07 | ) | |
Net Asset Value, End of Period | | $ | 19.88 | | | $ | 19.75 | | |
Total Return (4) | | | 4.58 | % | | | 5.11 | %(7) | |
Ratios and Supplemental Data: | |
Net Assets, End of Period (Thousands) | | $ | 29,650 | | | $ | 5,765 | | |
Ratio of Expenses to Average Net Assets (9) | | | 1.99 | %(5) | | | 2.03 | %(5)(8) | |
Ratio of Net Investment Income to Average Net Assets (9) | | | 0.29 | %(5) | | | 0.11 | %(5)(8) | |
Ratio of Rebate from Morgan Stanley Affiliates to Average Net Assets | | | 0.00 | %(6) | | | 0.00 | %(6)(8) | |
Portfolio Turnover Rate | | | 30 | % | | | 37 | % | |
(9) Supplemental Information on the Ratios to Average Net Assets: | |
Ratios Before Expense Limitation: | |
Expense to Average Net Assets | | | 2.00 | % | | | N/A | | |
Net Investment Income to Average Net Assets | | | 0.28 | % | | | N/A | | |
(1) Refer to Note F in the Notes to Financial Statements for discussion of prior period custodian out-of-pocket expenses that were reimbursed in the current period. The amount of the reimbursement was immaterial on a per share basis and did not impact the total return of Class C shares. The Ratio of Expenses to Average Net Assets would have been 0.01% higher and the Ratio of Net Investment Income to Average Net Assets would have been 0.01% lower had the custodian not reimbursed the Portfolio.
(2) Commencement of Offering.
(3) Per share amount is based on average shares outstanding.
(4) Calculated based on the net asset value which does not reflect sales charges, if applicable, as of the last business day of the period.
(5) The Ratios of Expenses and Net Investment Income reflect the rebate of certain Portfolio expenses in connection with the investments in Morgan Stanley affiliates during the period. The effect of the rebate on the ratios is disclosed in the above table as "Ratio of Rebate from Morgan Stanley Affiliates to Average Net Assets."
(6) Amount is less than 0.005%.
(7) Not Annualized.
(8) Annualized.
The accompanying notes are an integral part of the financial statements.
17
Morgan Stanley Institutional Fund, Inc.
Annual Report — December 31, 2016
Financial Highlights
Global Franchise Portfolio
| | | Class IS | |
Selected Per Share Data and Ratios | | Year Ended
December 31, 2016(1) | | Period from
May 29, 2015(2) to
December 31, 2015 | |
Net Asset Value, Beginning of Period | | $ | 20.33 | | | $ | 21.49 | | |
Income (Loss) from Investment Operations: | |
Net Investment Income (3) | | | 0.21 | | | | 0.12 | | |
Net Realized and Unrealized Gain | | | 0.93 | | | | 0.00 | (4) | |
Total from Investment Operations | | | 1.14 | | | | 0.12 | | |
Distributions from and/or in Excess of: | |
Net Investment Income | | | (0.29 | ) | | | (0.36 | ) | |
Net Realized Gain | | | (0.63 | ) | | | (0.92 | ) | |
Total Distributions | | | (0.92 | ) | | | (1.28 | ) | |
Net Asset Value, End of Period | | $ | 20.55 | | | $ | 20.33 | | |
Total Return (5) | | | 5.70 | % | | | 0.45 | %(8) | |
Ratios and Supplemental Data: | |
Net Assets, End of Period (Thousands) | | $ | 19,334 | | | $ | 9 | | |
Ratio of Expenses to Average Net Assets (10) | | | 0.92 | %(6) | | | 0.94 | %(6)(9) | |
Ratio of Net Investment Income to Average Net Assets (10) | | | 0.99 | %(6) | | | 0.95 | %(6)(9) | |
Ratio of Rebate from Morgan Stanley Affiliates to Average Net Assets | | | 0.00 | %(7) | | | 0.00 | %(7)(9) | |
Portfolio Turnover Rate | | | 30 | % | | | 37 | % | |
(10) Supplemental Information on the Ratios to Average Net Assets: | |
Ratios Before Expense Limitation: | |
Expenses to Average Net Assets | | | 0.94 | % | | | 16.54 | %(9) | |
Net Investment Income (Loss) to Average Net Assets | | | 0.97 | % | | | (14.65 | )%(9) | |
(1) Refer to Note F in the Notes to Financial Statements for discussion of prior period custodian out-of-pocket expenses that were reimbursed in the current period. The amount of the reimbursement was immaterial on a per share basis and did not impact the total return of Class IS shares. The Ratio of Expenses to Average Net Assets would have been 0.01% higher and the Ratio of Net Investment Income to Average Net Assets would have been 0.01% lower had the custodian not reimbursed the Portfolio.
(2) Commencement of Offering.
(3) Per share amount is based on average shares outstanding.
(4) Amount is less than $0.005 per share.
(5) Calculated based on the net asset value as of the last business day of the period.
(6) The Ratios of Expenses and Net Investment Income reflect the rebate of certain Portfolio expenses in connection with the investments in Morgan Stanley affiliates during the period. The effect of the rebate on the ratios is disclosed in the above table as "Ratio of Rebate from Morgan Stanley Affiliates to Average Net Assets."
(7) Amount is less than 0.005%.
(8) Not Annualized.
(9) Annualized.
The accompanying notes are an integral part of the financial statements.
18
Morgan Stanley Institutional Fund, Inc.
Annual Report — December 31, 2016
Notes to Financial Statements
Morgan Stanley Institutional Fund, Inc. (the "Fund") is registered under the Investment Company Act of 1940, as amended (the "Act"), as an open-end management investment company. The Fund is comprised of twenty-nine separate, active, diversified and non-diversified portfolios (individually referred to as a "Portfolio", collectively as the "Portfolios"). The Fund applies investment company accounting and reporting guidance.
The accompanying financial statements relate to the Global Franchise Portfolio. The Portfolio seeks long-term capital appreciation.
The Portfolio offers five classes of shares — Class I, Class A, Class L, Class C and Class IS. On April 30, 2015, the Portfolio suspended offering of Class L shares. Existing Class L shareholders may invest through reinvestment of dividends and distributions.
A. Significant Accounting Policies: The following significant accounting policies are in conformity with U.S. generally accepted accounting principles ("GAAP"). Such policies are consistently followed by the Fund in the preparation of its financial statements. GAAP may require management to make estimates and assumptions that affect the reported amounts and disclosures in the financial statements. Actual results may differ from those estimates.
1. Security Valuation: (1) An equity portfolio security listed or traded on an exchange is valued at its latest reported sales price (or at the exchange official closing price if such exchange reports an official closing price), and if there were no sales on a given day and if there is no official exchange closing price for that day, the security is valued at the mean between the last reported bid and asked prices if such bid and asked prices are available on the relevant exchanges; (2) all other equity portfolio securities for which over-the-counter ("OTC") market quotations are readily available are valued at the latest reported sales price (or at the market official closing price if such market reports an official closing price), and if there was no trading in the security on a given day and if there is no official closing price from relevant markets for that day, the security is valued at the mean between the last reported bid and asked prices if such bid and asked prices are available on the relevant markets. Listed equity securities not traded on the valuation date with no reported bid and asked prices available on the exchange are valued at the mean between the current bid and asked prices obtained from one or more reputable brokers or dealers. An unlisted equity
security that does not trade on the valuation date and for which bid and asked prices from the relevant markets are unavailable is valued at the mean between the current bid and asked prices obtained from one or more reputable brokers or dealers. In cases where a security is traded on more than one exchange, the security is valued on the exchange designated as the primary market; (3) certain portfolio securities may be valued by an outside pricing service/vendor approved by the Fund's Board of Directors (the "Directors"). The pricing service/vendor may employ a pricing model that takes into account, among other things, bids, yield spreads, and/or other market data and specific security characteristics. Alternatively, if a valuation is not available from an outside pricing service/vendor, and the security trades on an exchange, the security may be valued at its latest reported sale price (or at the exchange official closing price if such exchange reports an official closing price), prior to the time when assets are valued. If there are no sales on a given day and if there is no official exchange closing price for that day, the security is valued at the mean between the last reported bid and asked prices if such bid and asked prices are available in the relevant exchanges; (4) when market quotations are not readily available, including circumstances under which Morgan Stanley Investment Management Inc. (the "Adviser") or Morgan Stanley Investment Management Limited ("MSIM Limited") and Morgan Stanley Investment Management Company ("MSIM Company") (together, the "Sub-Advisers"), each a wholly owned subsidiary of Morgan Stanley, determine that the closing price, last sale price or the mean between the last reported bid and asked prices are not reflective of a security's market value, portfolio securities are valued at their fair value as determined in good faith under procedures established by and under the general supervision of the Directors. Occasionally, developments affecting the closing prices of securities and other assets may occur between the times at which valuations of such securities are determined (that is, close of the foreign market on which the securities trade) and the close of business of the New York Stock Exchange ("NYSE"). If developments occur during such periods that are expected to materially affect the value of such securities, such valuations may be adjusted to reflect the estimated fair value of such securities as of the close of the NYSE, as determined in good faith by the Directors or by the Adviser using a pricing service and/or procedures approved by the Directors; (5) quotations of foreign portfolio securities,
19
Morgan Stanley Institutional Fund, Inc.
Annual Report — December 31, 2016
Notes to Financial Statements (cont'd)
other assets and liabilities and forward contracts stated in foreign currency are translated into U.S. dollar equivalents at the prevailing market rates prior to the close of the NYSE; and (6) investments in mutual funds, including the Morgan Stanley Institutional Liquidity Funds, are valued at the net asset value ("NAV") as of the close of each business day.
The Directors have responsibility for determining in good faith the fair value of the investments, and the Directors may appoint others, such as the Fund's Adviser or a valuation committee, to assist the Directors in determining fair value and to make the actual calculations pursuant to the fair valuation methodologies previously approved by the Directors. Under procedures approved by the Directors, the Fund's Adviser has formed a Valuation Committee whose members are approved by the Directors. The Valuation Committee provides administration and oversight of the Fund's valuation policies and procedures, which are reviewed at least annually by the Directors. These procedures allow the Fund to utilize independent pricing services, quotations from securities and financial instrument dealers, and other market sources to determine fair value.
The Fund has procedures to determine the fair value of securities and other financial instruments for which market prices are not readily available. Under these procedures, the Valuation Committee convenes on a regular and ad hoc basis to review such securities and considers a number of factors, including valuation methodologies and significant unobservable valuation inputs, when arriving at fair value. The Valuation Committee may employ a market-based approach which may use related or comparable assets or liabilities, recent transactions, market multiples, book values, and other relevant information for the investment to determine the fair value of the investment. An income-based valuation approach may also be used in which the anticipated future cash flows of the investment are discounted to calculate fair value. Discounts may also be applied due to the nature or duration of any restrictions on the disposition of the investments. Due to the inherent uncertainty of valuations of such investments, the fair values may differ significantly from the values that would have been used had an active market existed. The Valuation Committee employs various methods for calibrating these valuation approaches including a regular review of valuation
methodologies, key inputs and assumptions, transactional back-testing or disposition analysis, and reviews of any related market activity.
2. Fair Value Measurement: Financial Accounting Standards Board ("FASB") Accounting Standards CodificationTM ("ASC") 820, "Fair Value Measurement" ("ASC 820"), defines fair value as the value that the Fund would receive to sell an investment or pay to transfer a liability in a timely transaction with an independent buyer in the principal market, or in the absence of a principal market, the most advantageous market for the investment or liability. ASC 820 establishes a three-tier hierarchy to distinguish between (1) inputs that reflect the assumptions market participants would use in valuing an asset or liability developed based on market data obtained from sources independent of the reporting entity (observable inputs) and (2) inputs that reflect the reporting entity's own assumptions about the assumptions market participants would use in valuing an asset or liability developed based on the best information available in the circumstances (unobservable inputs) and to establish classification of fair value measurements for disclosure purposes. Various inputs are used in determining the value of the Fund's investments. The inputs are summarized in the three broad levels listed below.
• Level 1 – unadjusted quoted prices in active markets for identical investments
• Level 2 – other significant observable inputs (including quoted prices for similar investments, interest rates, prepayment speeds, credit risk, etc.)
• Level 3 – significant unobservable inputs including the Fund's own assumptions in determining the fair value of investments. Factors considered in making this determination may include, but are not limited to, information obtained by contacting the issuer, analysts, or the appropriate stock exchange (for exchange-traded securities), analysis of the issuer's financial statements or other available documents and, if necessary, available information concerning other securities in similar circumstances
The inputs or methodology used for valuing securities are not necessarily an indication of the risk associated with investing in those securities and the determination of the
20
Morgan Stanley Institutional Fund, Inc.
Annual Report — December 31, 2016
Notes to Financial Statements (cont'd)
significance of a particular input to the fair value measurement in its entirety requires judgment and considers factors specific to each security.
The following is a summary of the inputs used to value the Portfolio's investments as of December 31, 2016.
Investment Type | | Level 1
Unadjusted
quoted
prices
(000) | | Level 2
Other
significant
observable
inputs
(000) | | Level 3
Significant
unobservable
inputs
(000) | | Total
(000) | |
Assets: | |
Common Stocks | |
Beverages | | $ | 50,260 | | | $ | — | | | $ | — | | | $ | 50,260 | | |
Capital Markets | | | 6,975 | | | | — | | | | — | | | | 6,975 | | |
Chemicals | | | 13,823 | | | | — | | | | — | | | | 13,823 | | |
Food Products | | | 28,359 | | | | — | | | | — | | | | 28,359 | | |
Household Products | | | 67,791 | | | | — | | | | — | | | | 67,791 | | |
Information Technology
Services | | | 92,391 | | | | — | | | | — | | | | 92,391 | | |
Media | | | 81,981 | | | | — | | | | — | | | | 81,981 | | |
Personal Products | | | 108,843 | | | | — | | | | — | | | | 108,843 | | |
Professional Services | | | 32,759 | | | | — | | | | — | | | | 32,759 | | |
Software | | | 97,700 | | | | — | | | | — | | | | 97,700 | | |
Textiles, Apparel &
Luxury Goods | | | 25,217 | | | | — | | | | — | | | | 25,217 | | |
Tobacco | | | 141,836 | | | | — | | | | — | | | | 141,836 | | |
Total Common Stocks | | | 747,935 | | | | — | | | | — | | | | 747,935 | | |
Short-Term Investment | |
Investment Company | | | 14,913 | | | | — | | | | — | | | | 14,913 | | |
Total Assets | | $ | 762,848 | | | $ | — | | | $ | — | | | $ | 762,848 | | |
Transfers between investment levels may occur as the markets fluctuate and/or the availability of data used in an investment's valuation changes. The Portfolio recognizes transfers between the levels as of the end of the period. As of December 31, 2016, securities with a total value of approximately $347,104,000 transferred from Level 2 to Level 1. Securities that were valued using other significant observable inputs at December 31, 2015 were valued using unadjusted quoted prices at December 31, 2016. At December 31, 2015, the fair value of certain securities were adjusted due to developments which occurred between the time of the close of the foreign markets on which they trade and the close of business on the NYSE which resulted in their Level 2 classification.
3. Foreign Currency Translation and Foreign Investments: The books and records of the Portfolio are maintained in U.S. dollars. Foreign currency amounts are translated into U.S. dollars as follows:
– investments, other assets and liabilities at the prevailing rate of exchange on the valuation date;
– investment transactions and investment income at the prevailing rates of exchange on the dates of such transactions.
Although the net assets of the Portfolio are presented at the foreign exchange rates and market values at the close of the period, the Portfolio does not isolate that portion of the results of operations arising as a result of changes in the foreign exchange rates from the fluctuations arising from changes in the market prices of securities held at period end. Similarly, the Portfolio does not isolate the effect of changes in foreign exchange rates from the fluctuations arising from changes in the market prices of securities sold during the period. Accordingly, realized and unrealized foreign currency gains (losses) on investments in securities are included in the reported net realized and unrealized gains (losses) on investment transactions and balances. However, pursuant to U.S. federal income tax regulations, gains and losses from certain foreign currency transactions and the foreign currency portion of gains and losses realized on sales and maturities of foreign denominated debt securities are treated as ordinary income for U.S. federal income tax purposes.
Net realized gains (losses) on foreign currency transactions represent net foreign exchange gains (losses) from foreign currency forward exchange contracts, disposition of foreign currencies, currency gains (losses) realized between the trade and settlement dates on securities transactions, and the difference between the amount of investment income and foreign withholding taxes recorded on the Portfolio's books and the U.S. dollar equivalent amounts actually received or paid. Net unrealized currency gains (losses) from valuing foreign currency denominated assets and liabilities at period end exchange rates are reflected as a component of unrealized appreciation (depreciation) in the Statement of Assets and Liabilities. The change in unrealized currency gains (losses) on foreign currency translations for the period is reflected in the Statement of Operations.
Foreign security and currency transactions may involve certain considerations and risks not typically associated with those of U.S. dollar denominated transactions as a result of, among other factors, fluctuations of exchange rates in relation to the U.S. dollar, the possibility of lower levels of governmental supervision and regulation of foreign securities markets and the possibility of political or economic instability.
21
Morgan Stanley Institutional Fund, Inc.
Annual Report — December 31, 2016
Notes to Financial Statements (cont'd)
Governmental approval for foreign investments may be required in advance of making an investment under certain circumstances in some countries, and the extent of foreign investments in domestic companies may be subject to limitation in other countries. Foreign ownership limitations also may be imposed by the charters of individual companies to prevent, among other concerns, violations of foreign investment limitations. As a result, an additional class of shares (identified as "Foreign" in the Portfolio of Investments) may be created and offered for investment. The "local" and "foreign shares" market values may differ. In the absence of trading of the foreign shares in such markets, the Portfolio values the foreign shares at the closing exchange price of the local shares.
4. Indemnifications: The Fund enters into contracts that contain a variety of indemnifications. The Fund's maximum exposure under these arrangements is unknown. However, the Fund has not had prior claims or losses pursuant to these contracts and expects the risk of loss to be remote.
5. Dividends and Distributions to Shareholders: Dividend income and distributions to shareholders are recorded on the ex-dividend date. Dividends from net investment income, if any, are declared and paid annually. Net realized capital gains, if any, are distributed at least annually.
6. Security Transactions, Income and Expenses: Security transactions are accounted for on the trade date (date the order to buy or sell is executed). Realized gains and losses on the sale of investment securities are determined on the specific identified cost method. Dividend income and other distributions are recorded on the ex-dividend date (except for certain foreign dividends which may be recorded as soon as the Portfolio is informed of such dividends) net of applicable withholding taxes. Interest income is recognized on the accrual basis except where collection is in doubt. Discounts are accreted and premiums are amortized over the life of the respective securities. Most expenses of the Fund can be directly attributed to a particular Portfolio. Expenses which cannot be directly attributed are apportioned among the Portfolios based upon relative net assets or other appropriate methods. Income, expenses (other than class specific expenses — distribution and shareholder services, transfer agency and sub transfer agency fees) and realized and unrealized gains or losses are
allocated to each class of shares based upon their relative net assets.
B. Advisory/Sub-Advisory Fees: The Adviser, a wholly-owned subsidiary of Morgan Stanley, provides the Portfolio with advisory services under the terms of an Investment Advisory Agreement, paid quarterly, at the annual rate based on the daily net assets as follows:
First $500
million | | Next $500
million | | Over $1
billion | |
| | 0.80 | % | | | 0.75 | % | | | 0.70 | % | |
For the year ended December 31, 2016, the advisory fee rate (net of rebate) was equivalent to an annual effective rate of 0.78% of the Portfolio's average daily net assets.
The Adviser has agreed to reduce its advisory fee and/or reimburse the Portfolio so that total annual portfolio operating expenses, excluding certain investment related expenses, taxes, interest and other extraordinary expenses (including litigation), will not exceed 1.00% for Class I shares, 1.35% for Class A shares, 1.85% for Class L shares, 2.10% for Class C shares and 0.95% for Class IS shares. The fee waivers and/or expense reimbursements will continue for at least one year from the date of the Portfolio's prospectus or until such time as the Directors act to discontinue all or a portion of such waivers and/or reimbursements when they deem such action is appropriate. For the year ended December 31, 2016, approximately $1,000 of advisory fees were waived pursuant to this arrangement.
The Adviser has entered into a Sub-Advisory Agreement with the Sub-Advisers, each a wholly-owned subsidiary of Morgan Stanley. The Sub-Advisers provide the Portfolio with advisory services subject to the overall supervision of the Adviser and the Fund's Officers and Directors. The Adviser pays the Sub-Advisers on a monthly basis a portion of the net advisory fees the Adviser receives from the Portfolio.
C. Administration Fees: The Adviser also serves as Administrator to the Fund and provides administrative services pursuant to an Administration Agreement for an annual fee, accrued daily and paid monthly, of 0.08% of the Portfolio's average daily net assets.
Under a Sub-Administration Agreement between the Administrator and State Street Bank and Trust Company ("State Street"), State Street provides certain administrative services to the Fund. For such services, the Administrator pays State Street a portion of the fee the Administrator receives from the Portfolio.
D. Distribution and Shareholder Services Fees: Morgan Stanley Distribution, Inc. ("MSDI" or the
22
Morgan Stanley Institutional Fund, Inc.
Annual Report — December 31, 2016
Notes to Financial Statements (cont'd)
"Distributor"), a wholly-owned subsidiary of the Adviser and Sub-Advisers and an indirect subsidiary of Morgan Stanley, serves as the Fund's Distributor of Portfolio shares pursuant to a Distribution Agreement. The Fund has adopted a Shareholder Services Plan with respect to Class A shares pursuant to Rule 12b-1 under the Act. Under the Shareholder Services Plan, the Portfolio pays the Distributor a shareholder services fee, accrued daily and paid monthly, at an annual rate of 0.25% of the Portfolio's average daily net assets attributable to Class A shares.
The Fund has adopted a Distribution and Shareholder Services Plan with respect to Class L shares pursuant to Rule 12b-1 under the Act. Under the Distribution and Shareholder Services Plan, the Portfolio pays the Distributor a distribution fee, accrued daily and paid monthly, at an annual rate of 0.50% and a shareholder services fee, accrued daily and paid monthly, at an annual rate of 0.25% of the Portfolio's average daily net assets attributable to Class L shares.
The Fund has adopted a Distribution and Shareholder Services Plan with respect to Class C shares pursuant to Rule 12b-1 under the Act. Under the Distribution and Shareholder Services Plan, the Portfolio pays the Distributor a distribution fee, accrued daily and paid monthly, at an annual rate of 0.75% and a shareholder services fee, accrued daily and paid monthly, at an annual rate of 0.25% of the Portfolio's average daily net assets attributable to Class C shares.
The distribution and shareholder services fees are used to support the expenses associated with servicing and maintaining accounts. The Distributor may compensate other parties for providing shareholder support services to investors who purchase Class A, Class L and Class C shares.
E. Dividend Disbursing and Transfer Agent: The Fund's dividend disbursing and transfer agent is Boston Financial Data Services, Inc. ("BFDS"). Pursuant to a Transfer Agency Agreement, the Fund pays BFDS a fee based on the number of classes, accounts and transactions relating to the Portfolios of the Fund.
F. Custodian Fees: State Street (the "Custodian") serves as Custodian for the Fund in accordance with a Custodian Agreement. The Custodian holds cash, securities, and other assets of the Fund as required by the Act. Custody fees are payable monthly based on assets held in custody, investment purchases and sales activity and account maintenance fees, plus reimbursement for certain out-of-pocket expenses.
In December 2015, the Fund's Custodian announced that it had identified inconsistencies in the way in which clients were
invoiced for out-of-pocket expenses from 1998 until November 2015. The dollar amount difference between what was charged and what should have been charged, plus interest, was paid back to the Portfolio in September 2016 as a reimbursement. The Custodian reimbursed the Portfolio directly, which was recognized as a change in accounting estimate and was reflected as "Reimbursement of Custodian Fees" in the Statement of Operations.
G. Security Transactions and Transactions with Affiliates: For the year ended December 31, 2016, purchases and sales of investment securities for the Portfolio, other than long-term U.S. Government securities and short-term investments, were approximately $361,349,000 and $212,043,000, respectively. There were no purchases and sales of long-term U.S. Government securities for the year ended December 31, 2016.
The Portfolio invests in the Institutional Class of the Morgan Stanley Institutional Liquidity Funds — Treasury Securities Portfolio (the "Liquidity Funds"), an open-end management investment company managed by the Adviser. Advisory fees paid by the Portfolio are reduced by an amount equal to its pro-rata share of the advisory and administration fees paid by the Portfolio due to its investment in the Liquidity Funds. For the year ended December 31, 2016, advisory fees paid were reduced by approximately $29,000 relating to the Portfolio's investment in the Liquidity Funds.
A summary of the Portfolio's transactions in shares of the Liquidity Funds during the year ended December 31, 2016 is as follows:
Value
December 31,
2015
(000) | | Purchases
at Cost
(000) | | Sales
(000) | | Dividend
Income
(000) | | Value
December 31,
2016
(000) | |
| $ | 20,401 | | | $ | 207,608 | | | $ | 213,096 | | | $ | 32 | | | $ | 14,913 | | |
The Portfolio is permitted to purchase and sell securities ("cross-trade") from and to other Morgan Stanley Funds as well as other funds and client accounts for which the Adviser or an affiliate of the Adviser serves as investment adviser, pursuant to procedures approved by the Directors in compliance with Rule 17a-7 under the Act (the "Rule"). Each cross-trade is executed at the current market price in compliance with provisions of the Rule. For the year ended December 31, 2016, the Portfolio did not engage in any cross-trade transactions.
The Portfolio has an unfunded Deferred Compensation Plan (the "Compensation Plan"), which allows each independent Director to defer payment of all, or a portion, of the fees he or
23
Morgan Stanley Institutional Fund, Inc.
Annual Report — December 31, 2016
Notes to Financial Statements (cont'd)
she receives for serving on the Board of Directors. Each eligible Director generally may elect to have the deferred amounts credited with a return equal to the total return on one or more of the Morgan Stanley funds that are offered as investment options under the Compensation Plan. Appreciation/depreciation and distributions received from these investments are recorded with an offsetting increase/decrease in the deferred compensation obligation and do not affect the NAV of the Portfolio.
H. Federal Income Taxes: It is the Portfolio's intention to continue to qualify as a regulated investment company and distribute all of its taxable and tax-exempt income. Accordingly, no provision for federal income taxes is required in the financial statements.
The Portfolio may be subject to taxes imposed by countries in which it invests. Such taxes are generally based on income and/or capital gains earned or repatriated. Taxes are accrued based on net investment income, net realized gains and net unrealized appreciation as such income and/or gains are earned. Taxes may also be based on transactions in foreign currency and are accrued based on the value of investments denominated in such currency.
FASB ASC 740-10, "Income Taxes — Overall", sets forth a minimum threshold for financial statement recognition of the benefit of a tax position taken or expected to be taken in a tax return. Management has concluded that there are no significant uncertain tax positions that would require recognition in the financial statements. If applicable, the Portfolio recognizes interest accrued related to unrecognized tax benefits in "Interest Expense" and penalties in "Other Expenses" in the Statement of Operations. The Portfolio files tax returns with the U.S. Internal Revenue Service, New York and various states. Generally, each of the tax years in the four-year period ended December 31, 2016, remains subject to examination by taxing authorities.
The tax character of distributions paid may differ from the character of distributions shown in the Statements of Changes in Net Assets due to short-term capital gains being treated as ordinary income for tax purposes. The tax character of distributions paid during fiscal years 2016 and 2015 was as follows:
2016
Distributions
Paid From: | | 2015
Distributions
Paid From: | |
Ordinary
Income
(000) | | Long-Term
Capital Gain
(000) | | Ordinary
Income
(000) | | Long-Term
Capital Gain
(000) | |
| $ | 9,564 | | | $ | 22,773 | | | $ | 9,168 | | | $ | 24,405 | | |
The amount and character of income and gains to be distributed are determined in accordance with income tax regulations which may differ from GAAP. These book/tax differences are either considered temporary or permanent in nature.
Temporary differences are primarily due to differing book and tax treatments in the timing of the recognition of gains (losses) on certain investment transactions and the timing of the deductibility of certain expenses.
Permanent differences, primarily due to differing treatments of gains (losses) related to foreign currency transactions and a dividend redesignation, resulted in the following reclassifications among the components of net assets at December 31, 2016:
Accumulated
Undistributed
Net Investment
Income
(000) | | Distributions
in Excess of
Net Realized
Gain
(000) | | Paid-in-
Capital
(000) | |
| $ | (214 | ) | | $ | 214 | | | $ | — | | |
At December 31, 2016, the components of distributable earnings for the Portfolio on a tax basis were as follows:
Undistributed
Ordinary
Income
(000) | | Undistributed
Long-Term
Capital Gain
(000) | |
| $ | 37 | | | $ | 1,156 | | |
I. Credit Facility: As of April 4, 2016, the Fund and other Morgan Stanley funds participated in a $150,000,000 committed, unsecured revolving line of credit facility (the "facility") with State Street. This facility is to be used for temporary emergency purposes or funding of shareholder redemption requests. The interest rate on borrowings is based on the federal funds rate or one month libor rate plus a spread. The facility also has a commitment fee of 0.25% per annum based on the unused portion of the facility. During the year ended December 31, 2016, the Portfolio did not have any borrowings under the facility.
J. Other: At December 31, 2016, the Portfolio had record owners of 10% or greater. Investment activities of these shareholders could have a material impact on the Portfolio. The aggregate percentage of such owners was 20.2%.
K. Accounting Pronouncements: In December 2016, FASB issued Accounting Standards update 2016-19 — Technical Corrections and Improvements ("ASU 2016-19"), which is effective for interim periods for all entities beginning after December 15, 2016. ASU 2016-19 includes an amendment to Topic 820, Fair Value Measurement, which clarifies the difference between a valuation approach and a valuation technique when applying the guidance in that Topic. That amendment
24
Morgan Stanley Institutional Fund, Inc.
Annual Report — December 31, 2016
Notes to Financial Statements (cont'd)
also requires an entity to disclose when there has been a change in either or both a valuation approach and/or a valuation technique. The transition guidance for the amendment must be applied prospectively because it could potentially involve the use of hindsight that includes fair value measurements. Although still evaluating the potential impacts of ASU 2016-19 to the Portfolio, management expects that the impact of the Portfolio's adoption will be limited to additional financial statement disclosures.
In October 2016, the Securities and Exchange Commission ("SEC") issued a new rule, Investment Company Reporting Modernization, which, among other provisions, amends Regulation S-X to require standardized, enhanced disclosures, particularly related to derivatives, in investment company financial statements. Compliance with the guidance is effective for financial statements filed with the SEC on or after August 1, 2017; adoption will have no effect on the Portfolio's net assets or results of operations. Although still evaluating the potential impacts of the Investment Company Reporting Modernization to the Portfolio, management expects that the impact of the Portfolio's adoption will be limited to additional financial statement disclosures.
25
Morgan Stanley Institutional Fund, Inc.
Annual Report — December 31, 2016
Report of Independent Registered Public Accounting Firm
To the Shareholders and Board of Directors of
Morgan Stanley Institutional Fund, Inc. —
Global Franchise Portfolio
We have audited the accompanying statement of assets and liabilities, including the portfolio of investments, of Global Franchise Portfolio (one of the portfolios constituting Morgan Stanley Institutional Fund, Inc.) (the "Portfolio") as of December 31, 2016, and the related statement of operations for the year then ended, the statements of changes in net assets for each of the two years in the period then ended and the financial highlights for each of the years or periods indicated therein. These financial statements and financial highlights are the responsibility of the Portfolio's management. Our responsibility is to express an opinion on these financial statements and financial highlights based on our audits.
We conducted our audits in accordance with the standards of the Public Company Accounting Oversight Board (United States). Those standards require that we plan and perform the audit to obtain reasonable assurance about whether the financial statements and financial highlights are free of material misstatement. We were not engaged to perform an audit of the Portfolio's internal control over financial reporting. Our audits included consideration of internal control over financial reporting as a basis for designing audit procedures that are appropriate in the circumstances, but not for the purpose of expressing an opinion on the effectiveness of the Portfolio's internal control over financial reporting. Accordingly, we express no such opinion. An audit also includes examining, on a test basis, evidence supporting the amounts and disclosures in the financial statements and financial highlights, assessing the accounting principles used and significant estimates made by management, and evaluating the overall financial statement presentation. Our procedures included confirmation of securities owned as of December 31, 2016, by correspondence with the custodian and others or by other appropriate auditing procedures where replies from others were not received. We believe that our audits provide a reasonable basis for our opinion.
In our opinion, the financial statements and financial highlights referred to above present fairly, in all material respects, the financial position of Global Franchise Portfolio (one of the portfolios constituting Morgan Stanley Institutional Fund, Inc.) at December 31, 2016, the results of its operations for the year then ended, the changes in its net assets for each of the two years in the period then ended and the financial highlights for each of the years or periods indicated therein, in conformity with U.S. generally accepted accounting principles.

Boston, Massachusetts
February 28, 2017
26
Morgan Stanley Institutional Fund, Inc.
Annual Report — December 31, 2016
Federal Tax Notice (unaudited)
For federal income tax purposes, the following information is furnished with respect to the distributions paid by the Portfolio during its taxable year ended December 31, 2016. For corporate shareholders, 76.3% of the dividends qualified for the dividends received deduction.
The Portfolio designated and paid approximately $22,773,000 as a long-term capital gain distribution.
For federal income tax purposes, the following information is furnished with respect to the Portfolio's earnings for its taxable year ended December 31, 2016. When distributed, certain earnings may be subject to a maximum tax rate of 15% as provided for the Jobs and Growth Tax Relief Reconciliation Act of 2003. The Portfolio designated up to a maximum of approximately $10,115,000 as taxable at this lower rate.
The Portfolio intends to pass through foreign tax credits of approximately $550,000 and has derived net income from sources within foreign countries amounting to approximately $9,571,000.
In January, the Portfolio provides tax information to shareholders for the preceding calendar year.
27
Morgan Stanley Institutional Fund, Inc.
Annual Report — December 31, 2016
Privacy Notice (unaudited)
MORGAN STANLEY INVESTMENT MANAGEMENT INC.
AN IMPORTANT NOTICE CONCERNING OUR U.S. PRIVACY POLICY
We are required by federal law to provide you with a copy of our privacy policy annually. This policy applies to current and former individual investors in funds managed or sponsored by Morgan Stanley Investment Management Inc. ("MSIM") as well as current and former individual clients of MSIM. This policy is not applicable to partnerships, corporations, trusts or other non-individual clients or investors. Please note that we may amend this policy at any time, and will inform you of any changes as required by law.
WE RESPECT YOUR PRIVACY
We appreciate that you have provided us with your personal financial information. We strive to maintain the privacy of such information while we help you achieve your financial objectives. This Notice describes what non-public personal information we collect about you, why we collect it, when we may share it with others and how certain others may use it. It discusses the steps you may take to limit our sharing of certain information about you to affiliated companies in the Morgan Stanley family of companies ("other Morgan Stanley companies"). It also discloses how you may limit use of certain shared information for marketing purposes by other Morgan Stanley branded companies. Throughout this policy, we refer to the non-public information that personally identifies you or your accounts as "personal information.''
1. WHAT PERSONAL INFORMATION DO WE COLLECT ABOUT YOU?
We obtain personal information from applications and other forms you submit to us, from your dealings with us, from consumer reporting agencies, from our Web sites and from third parties and other sources.
For example:
• We may collect information such as your name, address, e-mail address, telephone/fax numbers, assets, income and investment objectives through subscription documents, applications and other forms you submit to us.
• We may obtain information about account balances, your use of account(s) and the types of products and services you prefer to receive from us through your dealings and transactions with us and other sources.
• We may obtain information about your creditworthiness and credit history from consumer reporting agencies.
• We may collect background information from and through third-party vendors to verify representations you have made and to comply with various regulatory requirements.
• If you interact with us through our public and private Web sites, we may collect information that you provide directly through online communications (such as an e-mail address). We may also collect information about your Internet service provider, your domain name, your computer's operating system and Web browser, your use of our Web sites and your product and service preferences, through the use of "cookies." Please consult the Terms of Use of these sites for more details.
2. WHEN DO WE DISCLOSE PERSONAL INFORMATION WE COLLECT ABOUT YOU?
We may disclose personal information we collect about you to other Morgan Stanley companies and to non-affiliated third parties.
a. Information We Disclose to Other Morgan Stanley Companies.
We may disclose personal information to other Morgan Stanley companies for a variety of reasons, including to manage your account(s) effectively, to service and process your transactions, to let you know about products and services offered by us and other Morgan Stanley companies, to manage our business, and as otherwise required or permitted by law. Offers for products and services from other Morgan Stanley companies are developed under conditions designed to safeguard your personal information.
28
Morgan Stanley Institutional Fund, Inc.
Annual Report — December 31, 2016
Privacy Notice (unaudited) (cont'd)
b. Information We Disclose to Non-affiliated Third Parties.
We do not disclose personal information that we collect about you to non-affiliated third parties except to those who provide marketing services on our behalf, to financial institutions with whom we have joint marketing agreements, and as otherwise required or permitted by law. For example, we may disclose personal information to nonaffiliated third parties for servicing and processing transactions, to offer our own products and services, to protect against fraud, for institutional risk control, to respond to judicial process or to perform services on our behalf. When we share personal information with a non-affiliated third party, they are required to limit their use of personal information to the particular purpose for which it was shared and they are not allowed to share personal information with others except to fulfill that limited purpose or as may be permitted or required by law.
3. HOW DO WE PROTECT THE SECURITY AND CONFIDENTIALITY OF PERSONAL INFORMATION WE COLLECT ABOUT YOU?
We maintain physical, electronic and procedural security measures to help safeguard the personal information we collect about you. We have internal policies governing the proper handling of client information. Third parties that provide support or marketing services on our behalf may also receive personal information, and we require them to adhere to confidentiality standards with respect to such information.
4. HOW CAN YOU LIMIT THE SHARING OF CERTAIN TYPES OF PERSONAL INFORMATION WITH OTHER MORGAN STANLEY COMPANIES?
We offer you choices as to whether we share with other Morgan Stanley companies the personal information that was collected to determine your eligibility for products and services you request ("eligibility information"). Eligibility information does not include your identification information or personal information pertaining to our transactions or experiences with you. Please note that, even if you direct us not to share eligibility information with other Morgan Stanley companies ("opt-out"), we may still share personal information, including eligibility information, with those companies in circumstances excluded from the opt-out under applicable law, such as to process transactions or to service your account.
5. HOW CAN YOU LIMIT THE USE OF CERTAIN TYPES OF PERSONAL INFORMATION BY OTHER MORGAN STANLEY COMPANIES FOR MARKETING?
By following the opt-out instructions in Section 6 below, you may limit other Morgan Stanley branded companies from marketing their products or services to you based on personal information we disclose to them. This information may include, for example, your income and account history with us. Please note that, even if you choose to limit Other Morgan Stanley Companies from using personal information about you that we may share with them for marketing their products and services to you, Other Morgan Stanley Companies may use your personal information that they obtain from us to market to you in circumstances permitted by law, such as if the Other Morgan Stanley Company has its own relationship with you.
6. HOW CAN YOU SEND US AN OPT-OUT INSTRUCTION?
If you wish to limit our sharing of eligibility information about you with other Morgan Stanley companies or other Morgan Stanley companies' use of personal information for marketing purposes, as described in this notice, you may do so by:
• Calling us at (800) 548-7786
Monday–Friday between 8a.m. and 6p.m.(EST)
• Writing to us at the following address:
Boston Financial Data Services, Inc.
c/o Privacy Coordinator
P.O. Box 219804
Kansas City, Missouri 64121
29
Morgan Stanley Institutional Fund, Inc.
Annual Report — December 31, 2016
Privacy Notice (unaudited) (cont'd)
Your written request should include your name, address, telephone number and account number(s) to which the opt-out applies and whether you are opting out with respect to sharing of eligibility information (Section 4 above), or if information used for Marketing (Section 5 above) or both. Written opt-out requests should not be sent with any other correspondence. In order to process your request, we require that the request be provided by you directly and not through a third party.
Your opt-out preference will remain in effect with respect to this policy (as it may be amended) until you notify us otherwise. If you have a joint account, your direction for us not to share this information with other Morgan Stanley companies and for those other Morgan Stanley companies not to use your personal information for marketing will be applied to all account holders on that account. Please understand that if you limit our sharing or our affiliated companies' use of personal information, you and any joint account holder(s) may not receive information about Morgan Stanley products and services, including products or services that could help you manage your financial resources and achieve your investment objectives.
7. WHAT IF AN AFFILIATED COMPANY BECOMES A NON-AFFILIATED THIRD PARTY?
If, at any time in the future, an affiliated company becomes a non-affiliated third party, further disclosures of personal information made to the former affiliated company will be limited to those described in Section 2(b) above relating to non-affiliated third parties. If you elected under Section 6 to limit disclosures we make to affiliated companies, or use of personal information by affiliated companies, your election will not apply to use by any former affiliated company of your personal information in their possession once it becomes a non-affiliated third party.
SPECIAL NOTICE TO RESIDENTS OF VERMONT
The following section supplements our policy with respect to our individual clients who have a Vermont address and supersedes anything to the contrary in the above policy with respect to those clients only.
The state of Vermont requires financial institutions to obtain your consent prior to sharing personal information that they collect about you with affiliated companies and non-affiliated third parties other than in certain limited circumstances. Except as permitted by law, we will not share personal information we collect about you with non-affiliated third parties or other Morgan Stanley companies unless you provide us with your written consent to share such information ("opt-in").
If you wish to receive offers for investment products and services offered by or through other Morgan Stanley companies, please notify us in writing at the following address:
Boston Financial Data Services, Inc.
c/o Privacy Coordinator
P.O. Box 219804
Kansas City, Missouri 64121
Your authorization should include your name, address, telephone number and account number(s) to which the opt-in applies and should not be sent with any other correspondence. In order to process your authorization, we require that the authorization be provided by you directly and not through a third party.
SPECIAL NOTICE TO RESIDENTS OF CALIFORNIA
The following section supplements our policy with respect to our individual clients who have a California address and supersedes anything to the contrary in the above policy with respect to those clients only.
In response to a California law, if your account has a California home address, your personal information will not be disclosed to nonaffiliated third parties except as permitted by applicable California law, and we will limit sharing such information with our affiliates to comply with California privacy laws that apply to us.
30
Morgan Stanley Institutional Fund, Inc.
Annual Report — December 31, 2016
Director and Officer Information (unaudited)
Independent Directors:
Name, Age and Address of
Independent Director | | Position(s)
Held with
Registrant | | Length of Time
Served* | | Principal Occupation(s) During Past 5 Years
and Other Relevant Professional Experience | | Number of
Portfolios in
Fund Complex
Overseen by
Independent
Director** | | Other Directorships
Held by Independent
Director*** | |
Frank L. Bowman (72)
c/o Perkins Coie LLP
Counsel to the Independent
Directors
30 Rockefeller Plaza
New York, NY 10112 | | Director | | Since
August
2006 | | President, Strategic Decisions, LLC (consulting) (since February 2009); Director or Trustee of various Morgan Stanley Funds (since August 2006); Chairperson of the Compliance and Insurance Committee (since October 2015); formerly, Chairperson of the Insurance Sub-Committee of the Compliance and Insurance Committee (2007-2015); served as President and Chief Executive Officer of the Nuclear Energy Institute (policy organization) (February 2005-November 2008); retired as Admiral, U.S. Navy after serving over 38 years on active duty including 8 years as Director of the Naval Nuclear Propulsion Program in the Department of the Navy and the U.S. Department of Energy (1996-2004); served as Chief of Naval Personnel (July 1994-September 1996) and on the Joint Staff as Director of Political Military Affairs (June 1992-July 1994); knighted as Honorary Knight Commander of the Most Excellent Order of the British Empire; awarded the Officier de l'Orde National du Mérite by the French Government; elected to the National Academy of Engineering (2009). | | | 90 | | | Director of BP p.l.c.; Director of Naval and Nuclear Technologies LLP; Director Emeritus of the Armed Services YMCA; Director of the U.S. Naval Submarine League; Member of the National Security Advisory Council of the Center for U.S. Global Engagement and a member of the CNA Military Advisory Board; Chairman of the charity J Street Cup Golf; Trustee of Fairhaven United Methodist Church; and Director of other various non-profit organizations. | |
Kathleen A. Dennis (63)
c/o Perkins Coie LLP
Counsel to the Independent Directors
30 Rockefeller Plaza
New York, NY 10112 | | Director | | Since
August
2006 | | President, Cedarwood Associates (mutual fund and investment management consulting) (since July 2006); Chairperson of the Liquidity and Alternatives Sub-Committee of the Investment Committee (since October 2006) and Director or Trustee of various Morgan Stanley Funds (since August 2006); formerly, Senior Managing Director of Victory Capital Management (1993-2006). | | | 91 | | | Director of various non-profit organizations. | |
Nancy C. Everett (61)
c/o Perkins Coie LLP
Counsel to the Independent Directors
30 Rockefeller Plaza
New York, NY 10112 | | Director | | Since
January
2015 | | Chief Executive Officer, Virginia Commonwealth University Investment Company (since November 2015); Owner, OBIR, LLC (institutional investment management consulting) (since June 2014); formerly, Managing Director, BlackRock Inc. (February 2011-December 2013); and Chief Executive Officer, General Motors Asset Management (a/k/a Promark Global Advisors, Inc.) (June 2005-May 2010). | | | 91 | | | Member of Virginia Commonwealth University School of Business Foundation; formerly, Member of Virginia Commonwealth University Board of Visitors (2013-2015); Member of Committee on Directors for Emerging Markets Growth Fund, Inc. (2007-2010); Chairperson of Performance Equity Management, LLC (2006-2010); and Chairperson, GMAM Absolute Return Strategies Fund, LLC (2006-2010). | |
31
Morgan Stanley Institutional Fund, Inc.
Annual Report — December 31, 2016
Director and Officer Information (unaudited) (cont'd)
Independent Directors: (cont'd)
Name, Age and Address of
Independent Director | | Position(s)
Held with
Registrant | | Length of Time
Served* | | Principal Occupation(s) During Past 5 Years
and Other Relevant Professional Experience | | Number of
Portfolios in
Fund Complex
Overseen by
Independent
Director** | | Other Directorships
Held by Independent
Director*** | |
Jakki L. Haussler (59)
c/o Perkins Coie LLP
Counsel to the Independent Directors
30 Rockefeller Plaza
New York, NY 10112 | | Director | | Since
January
2015 | | Chairman and Chief Executive Officer, Opus Capital Group (since January 1996); formerly, Director, Capvest Venture Fund, LP (May 2000-December 2011); Partner, Adena Ventures, LP (July 1999-December 2010); Director, The Victory Funds (February 2005-July 2008). | | | 91 | | | Director of Cincinnati Bell Inc. and Member, Audit Committee and Compensation Committee; Director of Northern Kentucky University Foundation and Member, Investment Committee; Member of Chase College of Law Transactional Law Practice Center Board of Advisors; Director of Best Transport; Director of Chase College of Law Board of Visitors; formerly, Member, University of Cincinnati Foundation Investment Committee; Member, Miami University Board of Visitors (2008-2011); Trustee of Victory Funds (2005-2008) and Chairman, Investment Committee (2007-2008) and Member, Service Provider Committee (2005-2008). | |
Dr. Manuel H. Johnson (67)
c/o Johnson Smick
International, Inc.
220 I Street, N.E. — Suite 200
Washington, D.C. 20002 | | Director | | Since
July
1991 | | Senior Partner, Johnson Smick International, Inc. (consulting firm); Chairperson of the Investment Committee (since October 2006) and Director or Trustee of various Morgan Stanley Funds (since July 1991); Co-Chairman and a founder of the Group of Seven Council (G7C) (international economic commission); formerly, Chairperson of the Audit Committee (July 1991-September 2006), Vice Chairman of the Board of Governors of the Federal Reserve System and Assistant Secretary of the U.S. Treasury. | | | 91 | | | Director of NVR, Inc. (home construction). | |
Joseph J. Kearns (74)
c/o Kearns & Associates LLC
46 E Peninsula Center #385
Rolling Hills Estates, CA 90274-3712 | | Director | | Since
August
1994 | | President, Kearns & Associates LLC (investment consulting); Chairperson of the Audit Committee (since October 2006) and Director or Trustee of various Morgan Stanley Funds (since August 1994); formerly, Deputy Chairperson of the Audit Committee (July 2003-September 2006) and Chairperson of the Audit Committee of various Morgan Stanley Funds (since August 1994); CFO of the J. Paul Getty Trust. | | | 93 | | | Director of Electro Rent Corporation (equipment leasing). Prior to December 31, 2013, Director of The Ford Family Foundation. | |
32
Morgan Stanley Institutional Fund, Inc.
Annual Report — December 31, 2016
Director and Officer Information (unaudited) (cont'd)
Independent Directors: (cont'd)
Name, Age and Address of
Independent Director | | Position(s)
Held with
Registrant | | Length of Time
Served* | | Principal Occupation(s) During Past 5 Years
and Other Relevant Professional Experience | | Number of
Portfolios in
Fund Complex
Overseen by
Independent
Director** | | Other Directorships
Held by Independent
Director*** | |
Michael F. Klein (58)
c/o Perkins Coie LLP
Counsel to the Independent Directors
30 Rockefeller Plaza
New York, NY 10112 | | Director | | Since
August
2006 | | Managing Director, Aetos Capital, LLC (since March 2000); Co-President, Aetos Alternatives Management, LLC (since January 2004) and Co-Chief Executive Officer of Aetos Capital LLC (since August 2013); Chairperson of the Fixed Income Sub-Committee of the Investment Committee (since October 2006) and Director or Trustee of various Morgan Stanley Funds (since August 2006); formerly, Managing Director, Morgan Stanley & Co. Inc. and Morgan Stanley Dean Witter Investment Management, President, various Morgan Stanley Funds (June 1998-March 2000) and Principal, Morgan Stanley & Co. Inc. and Morgan Stanley Dean Witter Investment Management (August 1997-December 1999). | | | 90 | | | Director of certain investment funds managed or sponsored by Aetos Capital, LLC; Director of Sanitized AG and Sanitized Marketing AG (specialty chemicals). | |
Patricia Maleski (56)
c/o Perkins Coie LLP
Counsel to the Independent Directors
30 Rockefeller Plaza
New York, NY 10112 | | Director | | Since
January
2017 | | Management Director, JPMorgan Asset Management (2013-2016); President, JPMorgan Funds (2010-2013), Chief Administrative Officer, JPMorgan Funds (2004-2010), Treasurer, JPMorgan Funds (2003-2004, 2008-2010), and Vice President and Board Liaison, JPMorgan Funds (2001-2004); Managing Director, J.P. Morgan Investment Management Inc. (2001-2013); Vice President of Finance, Pierpont Group (1996-2001); Vice President, Bank of New York (1995-1996); Senior Audit Manager, Price Waterhouse, LLP (1982-1995). | | | 91 | | | None. | |
Michael E. Nugent (80)
522 Fifth Avenue
New York, NY 10036 | | Chair of the Board and Director | | Chair of the Boards since July 2006 and Director since July 1991 | | Chair of the Boards of various Morgan Stanley Funds (since July 2006); Chairperson of the Closed-End Fund Committee (since June 2012) and Director or Trustee of various Morgan Stanley Funds (since July 1991); formerly, Chairperson of the Insurance Committee (until July 2006); General Partner, Triumph Capital, L.P. (private investment partnership) (1988-2013). | | | 92 | | | None. | |
W. Allen Reed (69)
c/o Perkins Coie LLP
Counsel to the Independent Directors
30 Rockefeller Plaza
New York, NY 10112 | | Director | | Since
August
2006 | | Chairperson of the Equity Sub-Committee of the Investment Committee (since October 2006) and Director or Trustee of various Morgan Stanley Funds (since August 2006); formerly, President and CEO of General Motors Asset Management; Chairman and Chief Executive Officer of the GM Trust Bank and Corporate Vice President of General Motors Corporation (August 1994-December 2005). | | | 91 | | | Director of Legg Mason, Inc.; formerly, Director of the Auburn University Foundation (2010-2015). | |
Fergus Reid (84)
c/o Joe Pietryka, Inc.
85 Charles Colman Blvd.
Pawling, NY 12564 | | Director | | Since
June
1992 | | Chairman, Joe Pietryka, Inc.; Chairperson of the Governance Committee and Director or Trustee of various Morgan Stanley Funds (since June 1992). | | | 92 | | | Formerly, Trustee and Director of certain investment companies in the JP Morgan Fund Complex managed by JP Morgan Investment Management Inc. (1987-2012). | |
* This is the earliest date the Director began serving the Morgan Stanley Funds. Each Director serves an indefinite term, until his or her successor is elected.
** The Fund Complex includes (as of December 31, 2016) all open-end and closed-end funds (including all of their portfolios) advised by Morgan Stanley Investment Management Inc. (the "Adviser") and any funds that have an adviser that is an affiliated person of the Adviser (including, but not limited to, Morgan Stanley AIP GP LP).
*** This includes any directorships at public companies and registered investment companies held by the Director at any time during the past five years.
33
Morgan Stanley Institutional Fund, Inc.
Annual Report — December 31, 2016
Director and Officer Information (unaudited) (cont'd)
Executive Officers:
Name, Age and Address of Executive Officer | | Position(s) Held
with
Registrant | | Length of Time
Served* | | Principal Occupation(s) During Past 5 Years | |
John H. Gernon (53)
522 Fifth Avenue
New York, NY 10036 | | President and Principal Executive Officer | | Since
September
2013 | | President and Principal Executive Officer of the Equity and Fixed Income Funds and the Morgan Stanley AIP Funds (since September 2013) and the Liquidity Funds and various money market funds (since May 2014) in the Fund Complex; Managing Director of the Adviser; Head of Product (since 2006). | |
Timothy J. Knierim (58)
522 Fifth Avenue
New York, NY 10036 | | Chief Compliance Officer | | Since
December
2016 | | Managing Director of the Adviser and various entities affiliated with the Adviser; Chief Compliance Officer of various Morgan Stanley Funds and the Adviser (since December 2016) and Chief Compliance Officer of Morgan Stanley AIP GP LP (since 2014). Formerly, Managing Director and Deputy Chief Compliance Officer of the Adviser (2014-2016); and formerly, Chief Compliance Officer of Prudential Investment Management, Inc. (2007-2014). | |
Francis J. Smith (51)
522 Fifth Avenue
New York, NY 10036 | | Treasurer and Principal Financial Officer | | Treasurer since July 2003 and Principal Financial Officer since September 2002 | | Managing Director of the Adviser and various entities affiliated with the Adviser; Treasurer (since July 2003) and Principal Financial Officer of various Morgan Stanley Funds (since September 2002). | |
Mary E. Mullin (49)
522 Fifth Avenue
New York, NY 10036 | | Secretary | | Since
June
1999 | | Executive Director of the Adviser; Secretary of various Morgan Stanley Funds (since June 1999). | |
* This is the earliest date the officer began serving the Morgan Stanley Funds. Each officer serves a one-year term, until his or her successor is elected and qualifies.
34
Morgan Stanley Institutional Fund, Inc.
Annual Report — December 31, 2016
Adviser and Administrator
Morgan Stanley Investment Management Inc.
522 Fifth Avenue
New York, New York 10036
Sub-Advisers
Morgan Stanley Investment Management Limited
25 Cabot Square, Canary Wharf
London, E14 4QA, England
Morgan Stanley Investment Management Company
23 Church Street
16-01 Capital Square, Singapore 049481
Distributor
Morgan Stanley Distribution, Inc.
522 Fifth Avenue
New York, New York 10036
Dividend Disbursing and Transfer Agent
Boston Financial Data Services, Inc.
2000 Crown Colony Drive
Quincy, Massachusetts 02169
Custodian
State Street Bank and Trust Company
One Lincoln Street
Boston, Massachusetts 02111
Legal Counsel
Dechert LLP
1095 Avenue of the Americas
New York, New York 10036
Counsel to the Independent Directors
Perkins Coie LLP
30 Rockefeller Plaza
New York, New York 10112
Independent Registered Public Accounting Firm
Ernst & Young LLP
200 Clarendon Street
Boston, Massachusetts 02116
Reporting to Shareholders
Each Morgan Stanley fund provides a complete schedule of portfolio holdings in its semi-annual and annual reports within 60 days of the end of the fund's second and fourth fiscal quarters. The semi-annual and annual reports are filed electronically with the Securities and Exchange Commission (SEC) on Form N-CSRS and Form N-CSR, respectively. Morgan Stanley also delivers the semi-annual and annual reports to fund shareholders and makes these reports available on its public website, www.morganstanley.com/im. Each Morgan Stanley fund also files a complete schedule of portfolio holdings with the SEC for the fund's first and third fiscal quarters on Form N-Q. Morgan Stanley does not deliver the reports for the first and third fiscal quarters to shareholders, nor are the reports posted to the Morgan Stanley public website. You may, however, obtain the Form N-Q filings (as well as the Form N-CSR and N-CSRS filings) by accessing the SEC's website, www.sec.gov. You may also review and copy them at the SEC's Public Reference Room in Washington, DC. Information on the operation of the SEC's Public Reference Room may be obtained by calling the SEC toll free at 1 (800) SEC-0330. You can also request copies of these materials, upon payment of a duplicating fee, by electronic request at the SEC's email address (publicinfo@sec.gov) or by writing the Public Reference Room of the SEC, 100 F Street, NE, Washington, DC 20549-0102.
Proxy Voting Policies and Procedures and Proxy Voting Record
You may obtain a copy of the Fund's Proxy Voting Policy and Procedures and information regarding how the Fund voted proxies relating to portfolio securities during the most recent twelve-month period ended June 30, without charge, upon request, by calling toll free 1 (800) 548-7786 or by visiting our website at www.morganstanley.com/im. This information is also available on the SEC's website at www.sec.gov.
This report is authorized for distribution only when preceded or accompanied by a prospectus or summary prospectus of the applicable Portfolio of Morgan Stanley Institutional Fund, Inc., which describes in detail the Portfolio's investment policies, risks, fees and expenses. Please read the prospectus carefully before you invest or send money. For additional information, including information regarding the investments comprising the Portfolio, please visit our website at www.morganstanley.com/im or call toll free 1 (800) 548-7786.
35
(This Page has been left blank intentionally.)
(This Page has been left blank intentionally.)
Printed in U.S.A.
This Report has been prepared for shareholders and may be distributed to others only if preceded or accompanied by a current prospectus.
Morgan Stanley Investment Management Inc.
522 Fifth Avenue
New York, New York 10036
© 2017 Morgan Stanley. Morgan Stanley Distribution, Inc.

IFIGFANN
1696271 EXP. 02.28.18

Morgan Stanley Institutional Fund, Inc.
Global Infrastructure Portfolio
Annual Report
December 31, 2016

Morgan Stanley Institutional Fund, Inc.
Annual Report — December 31, 2016
Shareholders' Letter | | | 2 | | |
Expense Example | | | 3 | | |
Investment Overview | | | 4 | | |
Portfolio of Investments | | | 6 | | |
Statement of Assets and Liabilities | | | 8 | | |
Statement of Operations | | | 10 | | |
Statements of Changes in Net Assets | | | 11 | | |
Financial Highlights | | | 13 | | |
Notes to Financial Statements | | | 18 | | |
Report of Independent Registered Public Accounting Firm | | | 27 | | |
Federal Tax Notice | | | 28 | | |
Privacy Notice | | | 29 | | |
Director and Officer Information | | | 32 | | |
This report is authorized for distribution only when preceded or accompanied by a prospectus or summary prospectus of the applicable Portfolio of Morgan Stanley Institutional Fund, Inc. To receive a prospectus and/or statement of additional information (SAI), which contains more complete information such as investment objectives, charges, expenses, policies for voting proxies, risk considerations, and describes in detail each of the Portfolio's investment policies to the prospective investor, please call toll free 1 (800) 548-7786. Please read the prospectuses carefully before you invest or send money.
Additionally, you can access information about the Portfolio, including performance, characteristics, and investment team commentary, through Morgan Stanley Investment Management's website: www.morganstanley.com/im.
Market forecasts provided in this report may not necessarily come to pass. There is no guarantee that any sectors mentioned will continue to perform as discussed herein or that securities in such sectors will be held by the Portfolio in the future. There is no assurance that a Portfolio will achieve its investment objective. Portfolios are subject to market risk, which is the possibility that market values of securities owned by the Portfolio will decline and, therefore, the value of the Portfolio's shares may be less than what you paid for them. Accordingly, you can lose money investing in this Portfolio. Please see the prospectus for more complete information on investment risks.
1
Morgan Stanley Institutional Fund, Inc.
Annual Report — December 31, 2016
Shareholders' Letter (unaudited)
Dear Shareholders,
We are pleased to provide this Annual report, in which you will learn how your investment in Global Infrastructure Portfolio (the "Portfolio") performed during the latest twelve-month period.
Morgan Stanley Investment Management is a client-centric, investor-led organization. Our global presence, intellectual capital, and breadth of products and services enable us to partner with investors to meet the evolving challenges of today's financial markets. We aim to deliver superior investment service and to empower our clients to make the informed decisions that help them reach their investment goals.
As always, we thank you for selecting Morgan Stanley Investment Management, and look forward to working with you in the months and years ahead.
Sincerely,

John H. Gernon
President and Principal Executive Officer
January 2017
2
Morgan Stanley Institutional Fund, Inc.
Annual Report — December 31, 2016
Expense Example (unaudited)
Global Infrastructure Portfolio
As a shareholder of the Portfolio, you incur two types of costs: (1) transactional costs; and (2) ongoing costs, which may include advisory fees, administration fees, distribution and shareholder services fees and other Portfolio expenses. This example is intended to help you understand your ongoing costs (in dollars) of investing in the Portfolio and to compare these costs with the ongoing costs of investing in other mutual funds.
This example is based on an investment of $1,000 invested at the beginning of the six-month period ended December 31, 2016 and held for the entire six-month period.
Actual Expenses
The table below provides information about actual account values and actual expenses. You may use the information in this table, together with the amount you invested, to estimate the expenses that you paid over the period. Simply divide your account value by $1,000 (for example, an $8,600 account value divided by $1,000 = 8.6), then multiply the result by the number in the table under the heading entitled "Actual Expenses Paid During Period" to estimate the expenses you paid on your account during this period.
Hypothetical Example for Comparison Purposes
The table below provides information about hypothetical account values and hypothetical expenses based on the Portfolio's actual expense ratio and an assumed rate of return of 5% per year before expenses, which is not the Portfolio's actual return. The hypothetical account values and expenses may not be used to estimate the actual ending account balance or expenses you paid for the period. You may use this information to compare the ongoing costs of investing in the Portfolio and other funds. To do so, compare this 5% hypothetical example with the 5% hypothetical examples that appear in the shareholder reports of the other funds.
Please note that the expenses shown in the table are meant to highlight your ongoing costs only and do not reflect any transactional costs, such as sales charges (loads). Therefore, the information for each class in the table is useful in comparing ongoing costs only, and will not help you determine the relative total costs of owning different funds. In addition, if these transactional costs were included, your costs would have been higher.
| | | Beginning
Account
Value
7/1/16 | | Actual Ending
Account
Value
12/31/16 | | Hypothetical
Ending Account
Value | | Actual
Expenses
Paid
During
Period* | | Hypothetical
Expenses Paid
During Period* | | Net
Expense
Ratio
During
Period** | |
Global Infrastructure Portfolio Class I | | $ | 1,000.00 | | | $ | 981.60 | | | $ | 1,020.86 | | | $ | 4.23 | | | $ | 4.32 | | | | 0.85 | %*** | |
Global Infrastructure Portfolio Class A | | | 1,000.00 | | | | 980.40 | | | | 1,019.61 | | | | 5.48 | | | | 5.58 | | | | 1.10 | *** | |
Global Infrastructure Portfolio Class L | | | 1,000.00 | | | | 977.20 | | | | 1,016.74 | | | | 8.30 | | | | 8.47 | | | | 1.67 | *** | |
Global Infrastructure Portfolio Class C | | | 1,000.00 | | | | 976.00 | | | | 1,015.28 | | | | 9.74 | | | | 9.93 | | | | 1.96 | *** | |
Global Infrastructure Portfolio Class IS | | | 1,000.00 | | | | 981.80 | | | | 1,020.96 | | | | 4.13 | | | | 4.22 | | | | 0.83 | *** | |
* Expenses are calculated using each Portfolio Class' annualized net expense ratio (as disclosed), multiplied by the average account value over the period, and multiplied by 184/366 (to reflect the most recent one-half year period).
** Annualized.
*** Refer to Note F in the Notes to Financial Statements for discussion of prior period custodian out-of-pocket expenses that were reimbursed in the current period.
3
Morgan Stanley Institutional Fund, Inc.
Annual Report — December 31, 2016
Investment Overview (unaudited)
Global Infrastructure Portfolio
The Portfolio seeks to provide both capital appreciation and income.
Performance
For the year ended December 31, 2016, the Portfolio's Class I shares had a total return based on net asset value and reinvestment of distributions per share of 15.55%, net of fees. The Portfolio's Class I shares outperformed the Portfolio's benchmark, the Dow Jones Brookfield Global Infrastructure IndexSM (the "Index"), which returned 12.52%, and the S&P Global BMI Index, a proxy for global equities, which returned 8.84%.
Factors Affecting Performance
• Infrastructure shares appreciated 12.52% during the period, as measured by the Index. Among the major infrastructure sectors, gas midstream, pipeline companies, and electricity transmission & distribution outperformed the Index, while European regulated utilities, toll roads, communications, and gas distribution utilities underperformed the Index. Among sectors with more modest benchmark weightings, water outperformed, while the ports, airports, and diversified sectors underperformed.
• Following a difficult year for the asset class in 2015, infrastructure securities rebounded nicely in 2016 with strong absolute performance. This was primarily driven by a reversal in energy infrastructure (i.e., gas midstream and pipeline companies), which posted gains of 42.7% on the year as commodity prices recovered and companies' share prices generally began to better reflect underlying fundamentals.(i) We would observe that favorable performance was not limited to energy infrastructure, as performance was positive in most sectors, with only European regulated utilities, toll roads, and ports delivering negative absolute performance on the year.
• Though a strong year for the asset class overall, infrastructure did end the year with a decline of 5.25% in the fourth quarter. Despite a potentially more accommodative macro backdrop near term following the lapsing of several volatility-inducing events (most notably the U.S. presidential election and Italian constitutional referendum, as well as the
Organization of the Petroleum Exporting Countries, or OPEC, November 30 meeting in Vienna), some have questioned whether the thesis for investing in infrastructure remains intact. We continue to believe that there are attractive companies in which to invest in the current climate and would again note that, despite the pullback in the fourth quarter, infrastructure shares ended the year up 12.52% (with the Portfolio up more meaningfully), representing a satisfactory year of performance, in our view.
• For the reporting period, the Portfolio realized significant outperformance, almost entirely from bottom-up stock selection. The impact of top-down positioning was largely neutral. From a bottom-up perspective, the Portfolio benefited from favorable stock selection in the pipeline companies, toll roads, gas distribution utilities, communications, and airports sectors, which was only modestly offset by the relative losses from stock selection in the water, gas midstream, and European regulated utilities sectors. From a top-down perspective, the Portfolio benefited from an overweight to pipeline companies and underweights to the network utilities (primarily European regulated utilities and gas distribution utilities). This was offset by the relative disadvantage of an underweight to gas midstream and overweights to toll roads and power purchase agreement ("PPA")-contracted renewables.
Management Strategies
• We remain committed to our core investment philosophy as an infrastructure value investor. As value-oriented, bottom-up driven investors, our investment perspective is that over the medium and long term, the key factor in determining the performance of infrastructure securities will be underlying infrastructure asset values. Given the large and growing private infrastructure market, we believe that there are limits as to the level of premium or discount at which the public sector should trade relative to its underlying private infrastructure value. These limits can be viewed as the point at which the arbitrage opportunity between owning infrastructure in the private versus public markets becomes compelling. In aiming to achieve core infrastructure exposure in a cost
(i) Source: Dow Jones Brookfield Global Infrastructure Index. Data as of December 31, 2016.
4
Morgan Stanley Institutional Fund, Inc.
Annual Report — December 31, 2016
Investment Overview (unaudited) (cont'd)
Global Infrastructure Portfolio
effective manner, we invest in equity securities of publicly listed infrastructure companies we believe offer the best value relative to their underlying infrastructure value and net asset value growth prospects.
• Our research currently leads us to an overweighting in the Portfolio to a group of companies in the pipeline companies, toll roads, and diversified sectors, and an underweighting to companies in the gas midstream, electricity transmission & distribution, European regulated utilities, gas distribution utilities, communications, airports, ports, and water sectors. With regard to out-of-benchmark positions, we continue to have positions in both PPA-contracted renewables and railroads, with PPA-contracted renewables representing the largest industry "overweight" currently in the Portfolio (although technically not a "sector" as this represents an out-of-benchmark set of companies).

* Minimum Investment for Class I shares
** Commenced Operations on September 20, 2010.
In accordance with SEC regulations, the Portfolio's performance shown assumes that all recurring fees (including management fees) were deducted and all dividends and distributions were reinvested. The performance of Class A, L, C and IS shares will vary from the performance of Class I shares based on their different inception dates and will be impacted by additional fees assessed to those classes (if applicable).
Performance Compared to the Dow Jones Brookfield Global Infrastructure IndexSM(1) and the S&P Global BMI Index(2)
| | | Period Ended December 31, 2016
Total Returns(3) | |
| | | | | Average Annual | |
| | | One
Year | | Five
Years | | Ten
Years | | Since
Inception(7) | |
Portfolio — Class I Shares
w/o sales charges(4) | | | 15.55 | % | | | 9.86 | % | | | — | | | | 11.19 | % | |
Portfolio — Class A Shares
w/o sales charges(4) | | | 15.29 | | | | 9.57 | | | | — | | | | 10.91 | | |
Portfolio — Class A Shares with
maximum 5.25% sales charges(4) | | | 9.21 | | | | 8.39 | | | | — | | | | 9.96 | | |
Portfolio — Class L Shares
w/o sales charges(4) | | | 14.57 | | | | 8.94 | | | | — | | | | 10.29 | | |
Portfolio — Class C Shares
w/o sales charges(6) | | | 14.35 | | | | — | | | | — | | | | –3.51 | | |
Portfolio — Class C Shares with
maximum 1.00% deferred
sales charges(6) | | | 13.35 | | | | — | | | | — | | | | –3.51 | | |
Portfolio — Class IS Shares
w/o sales charges(5) | | | 15.66 | | | | — | | | | — | | | | 7.22 | | |
Dow Jones Brookfield Global
Infrastructure IndexSM | | | 12.52 | | | | 8.54 | | | | — | | | | 9.98 | | |
S&P Global BMI Index | | | 8.84 | | | | 10.20 | | | | — | | | | 8.43 | | |
Performance data quoted represents past performance, which is no guarantee of future results, and current performance may be lower or higher than the figures shown. Performance assumes that all dividends and distributions, if any, were reinvested. For the most recent month-end performance figures, please visit www.morganstanley.com/im. Investment return and principal value will fluctuate so that Portfolio shares, when redeemed, may be worth more or less than their original cost. Total returns do not reflect the deduction of taxes that a shareholder would pay on Portfolio distributions or the redemption of Portfolio shares. Performance of share classes will vary due to difference in sales charges and expenses.
(1) The Dow Jones Brookfield Global Infrastructure IndexSM is a float-adjusted market capitalization weighted index that measures the stock performance of companies that exhibit strong infrastructure characteristics. The Index intends to measure all sectors of the infrastructure market. The Index is unmanaged and its returns do not include any sales charges or fees. Such costs would lower performance. It is not possible to invest directly in an index.
(2) The Standard & Poor's Global BMI Index (S&P Global BMI Index) is a broad market index designed to capture exposure to equities in all countries in the world that meet minimum size and liquidity requirements. As of the date of this Report, there are approximately 11,500 index members representing 25 developed and 22 emerging market countries. The Index is unmanaged and its returns do not include any sales charges or fees. Such costs would lower performance. It is not possible to invest directly in an index.
(3) Total returns for the Portfolio reflect fees waived and expenses reimbursed, if applicable, by the Adviser. Without such waivers and reimbursements, total returns would have been lower.
(4) Commenced operations on September 20, 2010.
(5) Commenced offering on September 13, 2013.
(6) Commenced offering on April 30, 2015.
(7) For comparative purposes, average annual since inception returns listed for the Indexes refer to the inception date of Class I of the Portfolio, not the inception of the Index.
5
Morgan Stanley Institutional Fund, Inc.
Annual Report — December 31, 2016
Portfolio of Investments
Global Infrastructure Portfolio
| | | Shares | | Value
(000) | |
Common Stocks (95.1%) | |
Australia (4.5%) | |
APA Group | | | 287,325 | | | $ | 1,777 | | |
Macquarie Atlas Roads Group | | | 1,089,435 | | | | 3,970 | | |
Spark Infrastructure Group | | | 523,044 | | | | 898 | | |
Sydney Airport | | | 612,745 | | | | 2,649 | | |
Transurban Group | | | 867,868 | | | | 6,464 | | |
| | | | 15,758 | | |
Canada (9.8%) | |
Enbridge, Inc. (a) | | | 317,515 | | | | 13,361 | | |
Inter Pipeline Ltd. | | | 215,458 | | | | 4,757 | | |
Pembina Pipeline Corp. (a) | | | 137,411 | | | | 4,294 | | |
TransCanada Corp. (a) | | | 260,279 | | | | 11,736 | | |
| | | | 34,148 | | |
China (5.6%) | |
Guangdong Investment Ltd. (b) | | | 5,672,000 | | | | 7,490 | | |
Hopewell Highway Infrastructure Ltd. (b) | | | 22,704,000 | | | | 11,916 | | |
| | | | 19,406 | | |
France (4.5%) | |
Aeroports de Paris | | | 20,520 | | | | 2,199 | | |
Eutelsat Communications SA | | | 29,611 | | | | 573 | | |
Groupe Eurotunnel SE | | | 365,520 | | | | 3,476 | | |
SES SA | | | 158,901 | | | | 3,500 | | |
Vinci SA | | | 83,790 | | | | 5,707 | | |
| | | | 15,455 | | |
India (0.8%) | |
Azure Power Global Ltd. (c) | | | 156,821 | | | | 2,666 | | |
Italy (2.4%) | |
Atlantia SpA | | | 174,146 | | | | 4,080 | | |
Infrastrutture Wireless Italiane SpA (d) | | | 730,880 | | | | 3,387 | | |
Italgas SpA (c) | | | 204,598 | | | | 805 | | |
| | | | 8,272 | | |
Japan (2.2%) | |
East Japan Railway Co. | | | 19,800 | | | | 1,711 | | |
Japan Airport Terminal Co., Ltd. (a) | | | 64,400 | | | | 2,328 | | |
Tokyo Gas Co., Ltd. | | | 788,000 | | | | 3,566 | | |
| | | | 7,605 | | |
Mexico (0.6%) | |
OHL Mexico SAB de CV | | | 2,087,424 | | | | 2,053 | | |
Spain (9.8%) | |
Abertis Infraestructuras SA | | | 146,299 | | | | 2,048 | | |
Atlantica Yield PLC | | | 672,356 | | | | 13,010 | | |
EDP Renovaveis SA | | | 68,050 | | | | 432 | | |
Ferrovial SA | | | 287,125 | | | | 5,137 | | |
Saeta Yield SA | | | 1,545,711 | | | | 13,230 | | |
| | | | 33,857 | | |
Switzerland (1.4%) | |
Flughafen Zuerich AG (Registered) | | | 25,445 | | | | 4,720 | | |
United Kingdom (10.6%) | |
John Laing Group PLC (d) | | | 4,848,017 | | | | 16,179 | | |
National Grid PLC | | | 1,002,519 | | | | 11,757 | | |
| | | Shares | | Value
(000) | |
Pennon Group PLC | | | 239,991 | | | $ | 2,446 | | |
Severn Trent PLC | | | 101,810 | | | | 2,788 | | |
United Utilities Group PLC | | | 318,532 | | | | 3,537 | | |
| | | | 36,707 | | |
United States (42.9%) | |
American Tower Corp. REIT | | | 124,680 | | | | 13,176 | | |
American Water Works Co., Inc. | | | 47,850 | | | | 3,462 | | |
Atmos Energy Corp. | | | 56,812 | | | | 4,213 | | |
Crown Castle International Corp. REIT | | | 133,422 | | | | 11,577 | | |
Enbridge Energy Management LLC (c) | | | 1,421,311 | | | | 36,812 | | |
Eversource Energy | | | 96,961 | | | | 5,355 | | |
Kinder Morgan, Inc. | | | 641,640 | | | | 13,288 | | |
NiSource, Inc. | | | 71,768 | | | | 1,589 | | |
Norfolk Southern Corp. | | | 15,384 | | | | 1,663 | | |
Pattern Energy Group, Inc. | | | 890,035 | | | | 16,902 | | |
PG&E Corp. | | | 223,456 | | | | 13,579 | | |
SBA Communications Corp., Class A (c) | | | 40,750 | | | | 4,208 | | |
Sempra Energy | | | 114,516 | | | | 11,525 | | |
Spectra Energy Corp. | | | 106,252 | | | | 4,366 | | |
Union Pacific Corp. | | | 33,160 | | | | 3,438 | | |
Williams Cos., Inc. (The) | | | 112,283 | | | | 3,497 | | |
| | | | 148,650 | | |
Total Common Stocks (Cost $277,705) | | | 329,297 | | |
Short-Term Investments (9.3%) | |
Securities held as Collateral on Loaned Securities (3.3%) | |
Investment Company (2.6%) | |
Morgan Stanley Institutional Liquidity
Funds — Treasury Securities Portfolio —
Institutional Class (See Note G) | | | 9,179,905 | | | | 9,180 | | |
| | | Face
Amount
(000) | | | |
Repurchase Agreements (0.7%) | |
Merrill Lynch & Co., Inc., (0.50%,
dated 12/30/16, due 1/3/17;
proceeds $173; fully collateralized by
a U.S. Government obligation;
1.88% due 8/31/22; valued at $177) | | $ | 173 | | | | 173 | | |
Merrill Lynch & Co., Inc., (0.50%,
dated 12/30/16, due 1/3/17;
proceeds $865; fully collateralized by
U.S. Government agency securities;
2.88% - 4.60% due 11/20/65 - 11/20/66;
valued at $883) | | | 865 | | | | 865 | | |
Merrill Lynch & Co., Inc., (0.81%,
dated 12/30/16, due 1/3/17;
proceeds $1,298; fully collateralized by
Exchange Traded Funds; valued at $1,428) | | | 1,298 | | | | 1,298 | | |
| | | | 2,336 | | |
Total Securities held as Collateral on Loaned
Securities (Cost $11,516) | | | 11,516 | | |
The accompanying notes are an integral part of the financial statements.
6
Morgan Stanley Institutional Fund, Inc.
Annual Report — December 31, 2016
Portfolio of Investments (cont'd)
Global Infrastructure Portfolio
| | | Shares | | Value
(000) | |
Investment Company (6.0%) | |
Morgan Stanley Institutional Liquidity
Funds — Treasury Portfolio —
Institutional Class (See Note G)
(Cost $20,777) | | | 20,776,584 | | | $ | 20,777 | | |
Total Short-Term Investments (Cost $32,293) | | | 32,293 | | |
Total Investments (104.4%) (Cost $309,998)
Including $15,739 of Securities Loaned (e) | | | 361,590 | | |
Liabilities in Excess of Other Assets (–4.4%) | | | (15,076 | ) | |
Net Assets (100.0%) | | $ | 346,514 | | |
Country assignments and aggregations are based generally on third party vendor classifications and information, and may be different from the assignments and aggregations under the policies set forth in the Portfolio's prospectus and/or statement of additional information relating to geographic classifications.
(a) All or a portion of this security was on loan at December 31, 2016.
(b) Security trades on the Hong Kong exchange.
(c) Non-income producing security.
(d) 144A security — Certain conditions for public sale may exist. Unless otherwise noted, these securities are deemed to be liquid.
(e) At December 31, 2016, the aggregate cost for federal income tax purposes is approximately $317,225,000. The aggregate gross unrealized appreciation is approximately $53,160,000 and the aggregate gross unrealized depreciation is approximately $8,795,000, resulting in net unrealized appreciation of approximately $44,365,000.
REIT Real Estate Investment Trust.
Portfolio Composition*
Classification | | Percentage of
Total Investments | |
Oil & Gas Storage & Transportation | | | 33.0 | % | |
PPA Contracted Renewables | | | 13.2 | | |
Toll Roads | | | 11.4 | | |
Communications | | | 10.4 | | |
Electricity Transmission & Distribution | | | 9.0 | | |
Diversified | | | 6.1 | | |
Short-Term Investments | | | 5.9 | | |
Water | | | 5.6 | | |
Other** | | | 5.4 | | |
Total Investments | | | 100.0 | % | |
* Percentages indicated are based upon total investments (excluding Securities held as Collateral on Loaned Securities) as of December 31, 2016.
** Industries and/or investment types representing less than 5% of total investments.
The accompanying notes are an integral part of the financial statements.
7
Morgan Stanley Institutional Fund, Inc.
Annual Report — December 31, 2016
Global Infrastructure Portfolio
Statement of Assets and Liabilities | | December 31, 2016
(000) | |
Assets: | |
Investments in Securities of Unaffiliated Issuers, at Value(1) (Cost $280,041) | | $ | 331,633 | | |
Investment in Securities of Affiliated Issuer, at Value (Cost $29,957) | | | 29,957 | | |
Total Investments in Securities, at Value (Cost $309,998) | | | 361,590 | | |
Foreign Currency, at Value (Cost $670) | | | 674 | | |
Cash | | | 19 | | |
Receivable for Portfolio Shares Sold | | | 1,281 | | |
Dividends Receivable | | | 1,146 | | |
Receivable for Investments Sold | | | 765 | | |
Tax Reclaim Receivable | | | 46 | | |
Receivable from Affiliate | | | 4 | | |
Other Assets | | | 54 | | |
Total Assets | | | 365,579 | | |
Liabilities: | |
Collateral on Securities Loaned, at Value | | | 11,535 | | |
Payable for Investments Purchased | | | 5,205 | | |
Payable for Portfolio Shares Redeemed | | | 1,411 | | |
Payable for Advisory Fees | | | 600 | | |
Payable for Shareholder Services Fees — Class A | | | 58 | | |
Payable for Distribution and Shareholder Services Fees — Class L | | | 3 | | |
Payable for Distribution and Shareholder Services Fees — Class C | | | 1 | | |
Payable for Sub Transfer Agency Fees — Class I | | | — | @ | |
Payable for Sub Transfer Agency Fees — Class A | | | 53 | | |
Payable for Sub Transfer Agency Fees — Class L | | | 2 | | |
Payable for Sub Transfer Agency Fees — Class C | | | — | @ | |
Payable for Directors' Fees and Expenses | | | 55 | | |
Payable for Professional Fees | | | 41 | | |
Payable for Custodian Fees | | | 24 | | |
Payable for Administration Fees | | | 23 | | |
Payable for Transfer Agency Fees — Class I | | | 1 | | |
Payable for Transfer Agency Fees — Class A | | | 18 | | |
Payable for Transfer Agency Fees — Class L | | | 1 | | |
Payable for Transfer Agency Fees — Class C | | | — | @ | |
Payable for Transfer Agency Fees — Class IS | | | 1 | | |
Other Liabilities | | | 33 | | |
Total Liabilities | | | 19,065 | | |
Net Assets | | $ | 346,514 | | |
Net Assets Consist Of: | |
Paid-in-Capital | | $ | 299,060 | | |
Accumulated Undistributed Net Investment Income | | | 483 | | |
Accumulated Net Realized Loss | | | (4,616 | ) | |
Unrealized Appreciation (Depreciation) on: | |
Investments | | | 51,592 | | |
Foreign Currency Translations | | | (5 | ) | |
Net Assets | | $ | 346,514 | | |
The accompanying notes are an integral part of the financial statements.
8
Morgan Stanley Institutional Fund, Inc.
Annual Report — December 31, 2016
Global Infrastructure Portfolio
Statement of Assets and Liabilities (cont'd) | | December 31, 2016
(000) | |
CLASS I: | |
Net Assets | | $ | 58,794 | | |
| Shares Outstanding $0.001 par value shares of beneficial interest (unlimited shares authorized) (not in 000's) | | | 4,192,969 | | |
Net Asset Value, Offering and Redemption Price Per Share | | $ | 14.02 | | |
CLASS A: | |
Net Assets | | $ | 275,481 | | |
| Shares Outstanding $0.001 par value shares of beneficial interest (unlimited shares authorized) (not in 000's) | | | 19,693,644 | | |
Net Asset Value, Redemption Price Per Share | | $ | 13.99 | | |
Maximum Sales Load | | | 5.25 | % | |
Maximum Sales Charge | | $ | 0.78 | | |
Maximum Offering Price Per Share | | $ | 14.77 | | |
CLASS L: | |
Net Assets | | $ | 5,534 | | |
| Shares Outstanding $0.001 par value shares of beneficial interest (unlimited shares authorized) (not in 000's) | | | 396,955 | | |
Net Asset Value, Offering and Redemption Price Per Share | | $ | 13.94 | | |
CLASS C: | |
Net Assets | | $ | 784 | | |
| Shares Outstanding $0.001 par value shares of beneficial interest (unlimited shares authorized) (not in 000's) | | | 56,762 | | |
Net Asset Value, Offering and Redemption Price Per Share | | $ | 13.81 | | |
CLASS IS: | |
Net Assets | | $ | 5,921 | | |
| Shares Outstanding $0.001 par value shares of beneficial interest (unlimited shares authorized) (not in 000's) | | | 422,475 | | |
Net Asset Value, Offering and Redemption Price Per Share | | $ | 14.02 | | |
(1) Including:
Securities on Loan, at Value: | | $ | 15,739 | | |
@ Amount is less than $500.
The accompanying notes are an integral part of the financial statements.
9
Morgan Stanley Institutional Fund, Inc.
Annual Report — December 31, 2016
Global Infrastructure Portfolio
Statement of Operations | | Year Ended
December 31, 2016
(000) | |
Investment Income: | |
Dividends from Securities of Unaffiliated Issuers (Net of $466 of Foreign Taxes Withheld) | | $ | 12,018 | | |
Income from Securities Loaned — Net | | | 156 | | |
Dividends from Security of Affiliated Issuer (Note G) | | | 34 | | |
Total Investment Income | | | 12,208 | | |
Expenses: | |
Advisory Fees (Note B) | | | 2,800 | | |
Shareholder Services Fees — Class A (Note D) | | | 690 | | |
Distribution and Shareholder Services Fees — Class L (Note D) | | | 43 | | |
Distribution and Shareholder Services Fees — Class C (Note D) | | | 4 | | |
Administration Fees (Note C) | | | 264 | | |
Sub Transfer Agency Fees — Class I | | | 5 | | |
Sub Transfer Agency Fees — Class A | | | 211 | | |
Sub Transfer Agency Fees — Class L | | | 7 | | |
Sub Transfer Agency Fees — Class C | | | — | @ | |
Professional Fees | | | 82 | | |
Transfer Agency Fees — Class I (Note E) | | | 3 | | |
Transfer Agency Fees — Class A (Note E) | | | 69 | | |
Transfer Agency Fees — Class L (Note E) | | | 3 | | |
Transfer Agency Fees — Class C (Note E) | | | 2 | | |
Transfer Agency Fees — Class IS (Note E) | | | 2 | | |
Registration Fees | | | 72 | | |
Custodian Fees (Note F) | | | 57 | | |
Shareholder Reporting Fees | | | 46 | | |
Directors' Fees and Expenses | | | 6 | | |
Pricing Fees | | | 6 | | |
Other Expenses | | | 22 | | |
Total Expenses | | | 4,394 | | |
Waiver of Advisory Fees (Note B) | | | (478 | ) | |
Reimbursement of Class Specific Expenses — Class A (Note B) | | | (224 | ) | |
Reimbursement of Class Specific Expenses — Class L (Note B) | | | (5 | ) | |
Reimbursement of Class Specific Expenses — Class C (Note B) | | | (2 | ) | |
Reimbursement of Class Specific Expenses — Class IS (Note B) | | | (2 | ) | |
Rebate from Morgan Stanley Affiliate (Note G) | | | (24 | ) | |
Reimbursement of Custodian Fees (Note F) | | | (110 | ) | |
Net Expenses | | | 3,549 | | |
Net Investment Income | | | 8,659 | | |
Realized Gain: | |
Investments Sold | | | 8,540 | | |
Foreign Currency Transactions | | | 108 | | |
Net Realized Gain | | | 8,648 | | |
Change in Unrealized Appreciation (Depreciation): | |
Investments | | | 29,557 | | |
Foreign Currency Translations | | | 13 | | |
Net Change in Unrealized Appreciation (Depreciation) | | | 29,570 | | |
Net Realized Gain and Change in Unrealized Appreciation (Depreciation) | | | 38,218 | | |
Net Increase in Net Assets Resulting from Operations | | $ | 46,877 | | |
@ Amount is less than $500.
The accompanying notes are an integral part of the financial statements.
10
Morgan Stanley Institutional Fund, Inc.
Annual Report — December 31, 2016
Global Infrastructure Portfolio
Statements of Changes in Net Assets | | Year Ended
December 31, 2016
(000) | | Year Ended
December 31, 2015
(000) | |
Increase (Decrease) in Net Assets: | |
Operations: | |
Net Investment Income | | $ | 8,659 | | | $ | 8,128 | | |
Net Realized Gain (Loss) | | | 8,648 | | | | (1,595 | ) | |
Net Change in Unrealized Appreciation (Depreciation) | | | 29,570 | | | | (64,033 | ) | |
Net Increase (Decrease) in Net Assets Resulting from Operations | | | 46,877 | | | | (57,500 | ) | |
Distributions from and/or in Excess of: | |
Class I: | |
Net Investment Income | | | (1,321 | ) | | | (1,297 | ) | |
Net Realized Gain | | | (551 | ) | | | (1,192 | ) | |
Paid-in-Capital | | | — | | | | (18 | ) | |
Class A: | |
Net Investment Income | | | (6,424 | ) | | | (6,564 | ) | |
Net Realized Gain | | | (2,972 | ) | | | (6,710 | ) | |
Paid-in-Capital | | | — | | | | (101 | ) | |
Class L: | |
Net Investment Income | | | (96 | ) | | | (110 | ) | |
Net Realized Gain | | | (60 | ) | | | (145 | ) | |
Paid-in-Capital | | | — | | | | (2 | ) | |
Class C: | |
Net Investment Income | | | (15 | ) | | | (16 | ) | |
Net Realized Gain | | | (8 | ) | | | (16 | ) | |
Paid-in-Capital | | | — | | | | (— | @) | |
Class IS: | |
Net Investment Income | | | (144 | ) | | | (49 | ) | |
Net Realized Gain | | | (60 | ) | | | (39 | ) | |
Paid-in-Capital | | | — | | | | (1 | ) | |
Total Distributions | | | (11,651 | ) | | | (16,260 | ) | |
Capital Share Transactions:(1) | |
Class I: | |
Subscribed | | | 25,459 | | | | 24,423 | | |
Issued due to a Tax-free Reorganization | | | — | | | | 4,898 | | |
Distributions Reinvested | | | 1,850 | | | | 1,825 | | |
Redeemed | | | (21,028 | ) | | | (13,168 | ) | |
Class A: | |
Subscribed | | | 14,084 | | | | 4,487 | | |
Issued due to a Tax-free Reorganization | | | — | | | | 340,098 | | |
Distributions Reinvested | | | 9,192 | | | | 13,073 | | |
Redeemed | | | (41,210 | ) | | | (53,249 | ) | |
Class L: | |
Subscribed | | | 28 | | | | 234 | | |
Issued due to a Tax-free Reorganization | | | — | | | | 6,284 | | |
Distributions Reinvested | | | 151 | | | | 243 | | |
Redeemed | | | (802 | ) | | | (1,039 | ) | |
Class C: | |
Subscribed | | | 493 | | | | 844 | * | |
Distributions Reinvested | | | 23 | | | | 31 | * | |
Redeemed | | | (261 | ) | | | (220 | )* | |
Class IS: | |
Subscribed | | | 4,333 | | | | 2,328 | | |
Distributions Reinvested | | | 203 | | | | 89 | | |
Redeemed | | | (1,019 | ) | | | (47 | ) | |
Net Increase (Decrease) in Net Assets Resulting from Capital Share Transactions | | | (8,504 | ) | | | 331,134 | | |
Total Increase in Net Assets | | | 26,722 | | | | 257,374 | | |
Net Assets: | |
Beginning of Period | | | 319,792 | | | | 62,418 | | |
End of Period (Including Accumulated Undistributed Net Investment Income and
Distributions in Excess of Net Investment Income of $483 and $(190), respectively) | | $ | 346,514 | | | $ | 319,792 | | |
The accompanying notes are an integral part of the financial statements.
11
Morgan Stanley Institutional Fund, Inc.
Annual Report — December 31, 2016
Global Infrastructure Portfolio
Statements of Changes in Net Assets (cont'd) | | Year Ended
December 31, 2016
(000) | | Year Ended
December 31, 2015
(000) | |
(1) Capital Share Transactions: | |
Class I: | |
Shares Subscribed | | | 1,792 | | | | 1,627 | | |
Shares Issued due to a Tax-free Reorganization | | | — | | | | 316 | | |
Shares Issued on Distributions Reinvested | | | 132 | | | | 144 | | |
Shares Redeemed | | | (1,534 | ) | | | (911 | ) | |
Net Increase in Class I Shares Outstanding | | | 390 | | | | 1,176 | | |
Class A: | |
Shares Subscribed | | | 993 | | | | 293 | | |
Shares Issued due to a Tax-free Reorganization | | | — | | | | 22,027 | | |
Shares Issued on Distributions Reinvested | | | 659 | | | | 1,031 | | |
Shares Redeemed | | | (2,953 | ) | | | (3,710 | ) | |
Net Increase (Decrease) in Class A Shares Outstanding | | | (1,301 | ) | | | 19,641 | | |
Class L: | |
Shares Subscribed | | | 2 | | | | 15 | | |
Shares Issued due to a Tax-free Reorganization | | | — | | | | 409 | | |
Shares Issued on Distributions Reinvested | | | 11 | | | | 19 | | |
Shares Redeemed | | | (58 | ) | | | (74 | ) | |
Net Increase (Decrease) in Class L Shares Outstanding | | | (45 | ) | | | 369 | | |
Class C: | |
Shares Subscribed | | | 35 | | | | 57 | * | |
Shares Issued on Distributions Reinvested | | | 2 | | | | 2 | * | |
Shares Redeemed | | | (22 | ) | | | (18 | )* | |
Net Increase in Class C Shares Outstanding | | | 15 | | | | 41 | | |
Class IS: | |
Shares Subscribed | | | 307 | | | | 168 | | |
Shares Issued on Distributions Reinvested | | | 15 | | | | 7 | | |
Shares Redeemed | | | (72 | ) | | | (3 | ) | |
Net Increase in Class IS Shares Outstanding | | | 250 | | | | 172 | | |
@ Amount is less than $500.
* For the period April 30, 2015 through December 31, 2015.
The accompanying notes are an integral part of the financial statements.
12
Morgan Stanley Institutional Fund, Inc.
Annual Report — December 31, 2016
Financial Highlights
Global Infrastructure Portfolio
| | | Class I | |
| | | Year Ended December 31, | |
Selected Per Share Data and Ratios | | 2016(1) | | 2015 | | 2014 | | 2013 | | 2012 | |
Net Asset Value, Beginning of Period | | $ | 12.59 | | | $ | 15.41 | | | $ | 14.26 | | | $ | 12.91 | | | $ | 11.50 | | |
Income (Loss) from Investment Operations: | |
Net Investment Income (2) | | | 0.40 | | | | 0.40 | | | | 0.28 | | | | 0.26 | | | | 0.27 | | |
Net Realized and Unrealized Gain (Loss) | | | 1.55 | | | | (2.54 | ) | | | 1.87 | | | | 2.00 | | | | 1.82 | | |
Total from Investment Operations | | | 1.95 | | | | (2.14 | ) | | | 2.15 | | | | 2.26 | | | | 2.09 | | |
Distributions from and/or in Excess of: | |
Net Investment Income | | | (0.37 | ) | | | (0.35 | ) | | | (0.22 | ) | | | (0.25 | ) | | | (0.26 | ) | |
Net Realized Gain | | | (0.15 | ) | | | (0.32 | ) | | | (0.78 | ) | | | (0.66 | ) | | | (0.42 | ) | |
Paid-in-Capital | | | — | | | | (0.01 | ) | | | — | | | | — | | | | — | | |
Total Distributions | | | (0.52 | ) | | | (0.68 | ) | | | (1.00 | ) | | | (0.91 | ) | | | (0.68 | ) | |
Net Asset Value, End of Period | | $ | 14.02 | | | $ | 12.59 | | | $ | 15.41 | | | $ | 14.26 | | | $ | 12.91 | | |
Total Return (3) | | | 15.55 | % | | | (13.90 | )% | | | 15.38 | % | | | 17.91 | % | | | 18.21 | % | |
Ratios and Supplemental Data: | |
Net Assets, End of Period (Thousands) | | $ | 58,794 | | | $ | 47,878 | | | $ | 40,477 | | | $ | 26,428 | | | $ | 15,707 | | |
Ratio of Expenses to Average Net Assets (7) | | | 0.85 | %(4) | | | 0.88 | %(4)(5) | | | 1.08 | %(4) | | | 1.12 | %(4) | | | 1.15 | %(4) | |
Ratio of Net Investment Income to Average Net Assets (7) | | | 2.85 | %(4) | | | 2.70 | %(4) | | | 1.82 | %(4) | | | 1.87 | %(4) | | | 2.18 | %(4) | |
Ratio of Rebate from Morgan Stanley Affiliates to Average Net Assets | | | 0.01 | % | | | 0.00 | %(6) | | | 0.00 | %(6) | | | 0.01 | % | | | 0.00 | %(6) | |
Portfolio Turnover Rate | | | 48 | % | | | 48 | % | | | 40 | % | | | 30 | % | | | 33 | % | |
(7) Supplemental Information on the Ratios to Average Net Assets: | |
Ratios Before Expense Limitation: | |
Expenses to Average Net Assets | | | 1.04 | % | | | 1.10 | % | | | 1.42 | % | | | 2.04 | % | | | 2.39 | % | |
Net Investment Income to Average Net Assets | | | 2.66 | % | | | 2.48 | % | | | 1.48 | % | | | 0.95 | % | | | 0.94 | % | |
(1) Refer to Note F in the Notes to Financial Statements for discussion of prior period custodian out-of-pocket expenses that were reimbursed in the current period. The amount of the reimbursement was immaterial on a per share basis and did not impact the total return of Class I shares. The Ratio of Expenses to Average Net Assets and the Ratio of Net Investment Income to Average Net Assets would be unchanged as the reimbursement of custodian fees was offset against current period expense waivers/reimbursements with no impact to net expenses or net investment income.
(2) Per share amount is based on average shares outstanding.
(3) Calculated based on the net asset value as of the last business day of the period.
(4) The Ratios of Expenses and Net Investment Income reflect the rebate of certain Portfolio expenses in connection with the investments in Morgan Stanley affiliates during the period. The effect of the rebate on the ratios is disclosed in the above table as "Ratio of Rebate from Morgan Stanley Affiliates to Average Net Assets."
(5) Effective March 30, 2015, the Adviser has agreed to limit the ratio of expenses to average net assets to the maximum ratio of 0.87% for Class I shares. Prior to March 30, 2015, the maximum ratio was 1.15% for Class I share.
(6) Amount is less than 0.005%.
The accompanying notes are an integral part of the financial statements.
13
Morgan Stanley Institutional Fund, Inc.
Annual Report — December 31, 2016
Financial Highlights
Global Infrastructure Portfolio
| | | Class A | |
| | | Year Ended December 31, | |
Selected Per Share Data and Ratios | | 2016(1) | | 2015 | | 2014 | | 2013 | | 2012 | |
Net Asset Value, Beginning of Period | | $ | 12.56 | | | $ | 15.38 | | | $ | 14.25 | | | $ | 12.90 | | | $ | 11.50 | | |
Income (Loss) from Investment Operations: | |
Net Investment Income (2) | | | 0.36 | | | | 0.39 | | | | 0.24 | | | | 0.26 | | | | 0.24 | | |
Net Realized and Unrealized Gain (Loss) | | | 1.55 | | | | (2.56 | ) | | | 1.86 | | | | 1.97 | | | | 1.80 | | |
Total from Investment Operations | | | 1.91 | | | | (2.17 | ) | | | 2.10 | | | | 2.23 | | | | 2.04 | | |
Distributions from and/or in Excess of: | |
Net Investment Income | | | (0.33 | ) | | | (0.32 | ) | | | (0.19 | ) | | | (0.22 | ) | | | (0.22 | ) | |
Net Realized Gain | | | (0.15 | ) | | | (0.32 | ) | | | (0.78 | ) | | | (0.66 | ) | | | (0.42 | ) | |
Paid-in-Capital | | | — | | | | (0.01 | ) | | | — | | | | — | | | | — | | |
Total Distributions | | | (0.48 | ) | | | (0.65 | ) | | | (0.97 | ) | | | (0.88 | ) | | | (0.64 | ) | |
Net Asset Value, End of Period | | $ | 13.99 | | | $ | 12.56 | | | $ | 15.38 | | | $ | 14.25 | | | $ | 12.90 | | |
Total Return (3) | | | 15.29 | % | | | (14.08 | )% | | | 14.94 | % | | | 17.69 | % | | | 17.85 | % | |
Ratios and Supplemental Data: | |
Net Assets, End of Period (Thousands) | | $ | 275,481 | | | $ | 263,702 | | | $ | 20,815 | | | $ | 3,706 | | | $ | 129 | | |
Ratio of Expenses to Average Net Assets (8) | | | 1.10 | %(4) | | | 1.12 | %(4)(6) | | | 1.42 | %(4) | | | 1.37 | %(4)(5) | | | 1.40 | %(4) | |
Ratio of Net Investment Income to Average Net Assets (8) | | | 2.60 | %(4) | | | 2.67 | %(4) | | | 1.53 | %(4) | | | 1.81 | %(4) | | | 1.93 | %(4) | |
Ratio of Rebate from Morgan Stanley Affiliates to Average Net Assets | | | 0.01 | % | | | 0.00 | %(7) | | | 0.00 | %(7) | | | 0.01 | % | | | 0.00 | %(7) | |
Portfolio Turnover Rate | | | 48 | % | | | 48 | % | | | 40 | % | | | 30 | % | | | 33 | % | |
(8) Supplemental Information on the Ratios to Average Net Assets: | |
Ratios Before Expense Limitation: | |
Expenses to Average Net Assets | | | 1.37 | % | | | 1.35 | % | | | 1.76 | % | | | 2.43 | % | | | 2.64 | % | |
Net Investment Income to Average Net Assets | | | 2.33 | % | | | 2.44 | % | | | 1.19 | % | | | 0.75 | % | | | 0.69 | % | |
(1) Refer to Note F in the Notes to Financial Statements for discussion of prior period custodian out-of-pocket expenses that were reimbursed in the current period. The amount of the reimbursement was immaterial on a per share basis and did not impact the total return of Class I shares. The Ratio of Expenses to Average Net Assets and the Ratio of Net Investment Income to Average Net Assets would be unchanged as the reimbursement of custodian fees was offset against current period expense waivers/reimbursements with no impact to net expenses or net investment income.
(2) Per share amount is based on average shares outstanding.
(3) Calculated based on the net asset value which does not reflect sales charges, if applicable, as of the last business day of the period.
(4) The Ratios of Expenses and Net Investment Income reflect the rebate of certain Portfolio expenses in connection with the investments in Morgan Stanley affiliates during the period. The effect of the rebate on the ratios is disclosed in the above table as "Ratio of Rebate from Morgan Stanley Affiliates to Average Net Assets."
(5) Effective September 16, 2013, the Adviser has agreed to limit the ratio of expenses to average net assets to the maximum ratio of 1.50% for Class A shares. Prior to September 16, 2013, the maximum ratio was 1.40% for Class A shares.
(6) Effective March 30, 2015, the Adviser has agreed to limit the ratio of expenses to average net assets to the maximum ratio of 1.11% for Class A shares. Prior to March 30, 2015, the maximum ratio was 1.50% for Class A share.
(7) Amount is less than 0.005%.
The accompanying notes are an integral part of the financial statements.
14
Morgan Stanley Institutional Fund, Inc.
Annual Report — December 31, 2016
Financial Highlights
Global Infrastructure Portfolio
| | | Class L | |
| | | Year Ended December 31, | |
Selected Per Share Data and Ratios | | 2016(1) | | 2015 | | 2014 | | 2013 | | 2012 | |
Net Asset Value, Beginning of Period | | $ | 12.52 | | | $ | 15.34 | | | $ | 14.22 | | | $ | 12.90 | | | $ | 11.50 | | |
Income (Loss) from Investment Operations: | |
Net Investment Income (2) | | | 0.28 | | | | 0.30 | | | | 0.14 | | | | 0.16 | | | | 0.18 | | |
Net Realized and Unrealized Gain (Loss) | | | 1.54 | | | | (2.55 | ) | | | 1.87 | | | | 1.98 | | | | 1.80 | | |
Total from Investment Operations | | | 1.82 | | | | (2.25 | ) | | | 2.01 | | | | 2.14 | | | | 1.98 | | |
Distributions from and/or in Excess of: | |
Net Investment Income | | | (0.25 | ) | | | (0.24 | ) | | | (0.11 | ) | | | (0.16 | ) | | | (0.16 | ) | |
Net Realized Gain | | | (0.15 | ) | | | (0.32 | ) | | | (0.78 | ) | | | (0.66 | ) | | | (0.42 | ) | |
Paid-in-Capital | | | — | | | | (0.01 | ) | | | — | | | | — | | | | — | | |
Total Distributions | | | (0.40 | ) | | | (0.57 | ) | | | (0.89 | ) | | | (0.82 | ) | | | (0.58 | ) | |
Net Asset Value, End of Period | | $ | 13.94 | | | $ | 12.52 | | | $ | 15.34 | | | $ | 14.22 | | | $ | 12.90 | | |
Total Return (3) | | | 14.57 | % | | | (14.64 | )% | | | 14.35 | % | | | 16.98 | % | | | 17.31 | % | |
Ratios and Supplemental Data: | |
Net Assets, End of Period (Thousands) | | $ | 5,534 | | | $ | 5,529 | | | $ | 1,115 | | | $ | 573 | | | $ | 129 | | |
Ratio of Expenses to Average Net Assets (8) | | | 1.67 | %(4) | | | 1.69 | %(4)(6) | | | 2.00 | %(4) | | | 1.93 | %(4)(5) | | | 1.90 | %(4) | |
Ratio of Net Investment Income to Average Net Assets (8) | | | 2.03 | %(4) | | | 2.06 | %(4) | | | 0.91 | %(4) | | | 1.16 | %(4) | | | 1.43 | %(4) | |
Ratio of Rebate from Morgan Stanley Affiliates to Average Net Assets | | | 0.01 | % | | | 0.00 | %(7) | | | 0.00 | %(7) | | | 0.00 | %(7) | | | 0.00 | %(7) | |
Portfolio Turnover Rate | | | 48 | % | | | 48 | % | | | 40 | % | | | 30 | % | | | 33 | % | |
(8) Supplemental Information on the Ratios to Average Net Assets: | |
Ratios Before Expense Limitation: | |
Expenses to Average Net Assets | | | 1.95 | % | | | 1.95 | % | | | 2.41 | % | | | 2.86 | % | | | 3.14 | % | |
Net Investment Income to Average Net Assets | | | 1.75 | % | | | 1.80 | % | | | 0.50 | % | | | 0.23 | % | | | 0.19 | % | |
(1) Refer to Note F in the Notes to Financial Statements for discussion of prior period custodian out-of-pocket expenses that were reimbursed in the current period. The amount of the reimbursement was immaterial on a per share basis and did not impact the total return of Class L shares. The Ratio of Expenses to Average Net Assets and the Ratio of Net Investment Income to Average Net Assets would be unchanged as the reimbursement of custodian fees was offset against current period expense waivers/reimbursements with no impact to net expenses or net investment income.
(2) Per share amount is based on average shares outstanding.
(3) Calculated based on the net asset value as of the last business day of the period.
(4) The Ratios of Expenses and Net Investment Income reflect the rebate of certain Portfolio expenses in connection with the investments in Morgan Stanley affiliates during the period. The effect of the rebate on the ratios is disclosed in the above table as "Ratio of Rebate from Morgan Stanley Affiliates to Average Net Assets."
(5) Effective September 16, 2013, the Adviser has agreed to limit the ratio of expenses to average net assets to the maximum ratio of 2.00% for Class L shares. Prior to September 16, 2013, the maximum ratio was 1.90% for Class L shares.
(6) Effective March 30, 2015, the Adviser has agreed to limit the ratio of expenses to average net assets to the maximum ratio of 1.68% for Class L shares. Prior to March 30, 2015, the maximum ratio was 2.00% for Class L share.
(7) Amount is less than 0.005%.
The accompanying notes are an integral part of the financial statements.
15
Morgan Stanley Institutional Fund, Inc.
Annual Report — December 31, 2016
Financial Highlights
Global Infrastructure Portfolio
| | | Class C | |
Selected Per Share Data and Ratios | | Year Ended
December 31, 2016(1) | | Period from
April 30, 2015(2) to
December 31, 2015 | |
Net Asset Value, Beginning of Period | | $ | 12.47 | | | $ | 15.87 | | |
Income (Loss) from Investment Operations: | |
Net Investment Income (3) | | | 0.26 | | | | 0.17 | | |
Net Realized and Unrealized Gain (Loss) | | | 1.52 | | | | (2.97 | ) | |
Total from Investment Operations | | | 1.78 | | | | (2.80 | ) | |
Distributions from and/or in Excess of: | |
Net Investment Income | | | (0.29 | ) | | | (0.27 | ) | |
Net Realized Gain | | | (0.15 | ) | | | (0.32 | ) | |
Paid-in-Capital | | | — | | | | (0.01 | ) | |
Total Distributions | | | (0.44 | ) | | | (0.60 | ) | |
Net Asset Value, End of Period | | $ | 13.81 | | | $ | 12.47 | | |
Total Return (4) | | | 14.35 | % | | | (17.62 | )%(7) | |
Ratios and Supplemental Data: | |
Net Assets, End of Period (Thousands) | | $ | 784 | | | $ | 516 | | |
Ratio of Expenses to Average Net Assets (9) | | | 1.96 | %(5) | | | 1.97 | %(5)(8) | |
Ratio of Net Investment Income to Average Net Assets (9) | | | 1.90 | %(5) | | | 1.81 | %(5)(8) | |
Ratio of Rebate from Morgan Stanley Affiliates to Average Net Assets | | | 0.01 | % | | | 0.00 | %(6)(8) | |
Portfolio Turnover Rate | | | 48 | % | | | 48 | % | |
(9) Supplemental Information on the Ratios to Average Net Assets: | |
Ratios Before Expense Limitation: | |
Expense to Average Net Assets | | | 2.69 | % | | | 2.34 | %(8) | |
Net Investment Income to Average Net Assets | | | 1.17 | % | | | 1.44 | %(8) | |
(1) Refer to Note F in the Notes to Financial Statements for discussion of prior period custodian out-of-pocket expenses that were reimbursed in the current period. The amount of the reimbursement was immaterial on a per share basis and did not impact the total return of Class C shares. The Ratio of Expenses to Average Net Assets and the Ratio of Net Investment Income to Average Net Assets would be unchanged as the reimbursement of custodian fees was offset against current period expense waivers/reimbursements with no impact to net expenses or net investment income.
(2) Commencement of Offering.
(3) Per share amount is based on average shares outstanding.
(4) Calculated based on the net asset value which does not reflect sales charges, if applicable, as of the last business day of the period.
(5) The Ratios of Expenses and Net Investment Income reflect the rebate of certain Portfolio expenses in connection with the investments in Morgan Stanley affiliates during the period. The effect of the rebate on the ratios is disclosed in the above table as "Ratio of Rebate from Morgan Stanley Affiliates to Average Net Assets."
(6) Amount is less than 0.005%.
(7) Not Annualized.
(8) Annualized.
The accompanying notes are an integral part of the financial statements.
16
Morgan Stanley Institutional Fund, Inc.
Annual Report — December 31, 2016
Financial Highlights
Global Infrastructure Portfolio
| | | Class IS | |
| | | Year Ended December 31, | | Period from
September 13, 2013(2) to | |
Selected Per Share Data and Ratios | | 2016(1) | | 2015 | | 2014 | | December 31, 2013 | |
Net Asset Value, Beginning of Period | | $ | 12.58 | | | $ | 15.41 | | | $ | 14.26 | | | $ | 13.73 | | |
Income (Loss) from Investment Operations: | |
Net Investment Income (3) | | | 0.43 | | | | 0.53 | | | | 0.28 | | | | 0.09 | | |
Net Realized and Unrealized Gain (Loss) | | | 1.53 | | | | (2.68 | ) | | | 1.87 | | | | 1.20 | | |
Total from Investment Operations | | | 1.96 | | | | (2.15 | ) | | | 2.15 | | | | 1.29 | | |
Distributions from and/or in Excess of: | |
Net Investment Income | | | (0.37 | ) | | | (0.35 | ) | | | (0.22 | ) | | | (0.25 | ) | |
Net Realized Gain | | | (0.15 | ) | | | (0.32 | ) | | | (0.78 | ) | | | (0.51 | ) | |
Paid-in-Capital | | | — | | | | (0.01 | ) | | | — | | | | — | | |
Total Distributions | | | (0.52 | ) | | | (0.68 | ) | | | (1.00 | ) | | | (0.76 | ) | |
Net Asset Value, End of Period | | $ | 14.02 | | | $ | 12.58 | | | $ | 15.41 | | | $ | 14.26 | | |
Total Return (4) | | | 15.66 | % | | | (13.96 | )% | | | 15.38 | % | | | 9.60 | %(9) | |
Ratios and Supplemental Data: | |
Net Assets, End of Period (Thousands) | | $ | 5,921 | | | $ | 2,167 | | | $ | 11 | | | $ | 10 | | |
Ratio of Expenses to Average Net Assets (11) | | | 0.83 | %(5) | | | 0.84 | %(5)(7) | | | 1.08 | %(5) | | | 1.07 | %(5)(6)(10) | |
Ratio of Net Investment Income to Average Net Assets (11) | | | 3.02 | %(5) | | | 3.91 | %(5) | | | 1.79 | %(5) | | | 2.13 | %(5)(10) | |
Ratio of Rebate from Morgan Stanley Affiliates to Average Net Assets | | | 0.01 | % | | | 0.00 | %(8) | | | 0.00 | %(8) | | | 0.01 | %(10) | |
Portfolio Turnover Rate | | | 48 | % | | | 48 | % | | | 40 | % | | | 30 | % | |
(11) Supplemental Information on the Ratios to Average Net Assets: | |
Ratios Before Expense Limitation: | |
Expenses to Average Net Assets | | | 1.08 | % | | | 1.41 | % | | | 18.56 | % | | | 7.27 | %(10) | |
Net Investment Income (Loss) to Average Net Assets | | | 2.77 | % | | | 3.33 | % | | | (15.69 | )% | | | (4.07 | )%(10) | |
(1) Refer to Note F in the Notes to Financial Statements for discussion of prior period custodian out-of-pocket expenses that were reimbursed in the current period. The amount of the reimbursement was immaterial on a per share basis and did not impact the total return of Class I shares. The Ratio of Expenses to Average Net Assets and the Ratio of Net Investment Income to Average Net Assets would be unchanged as the reimbursement of custodian fees was offset against current period expense waivers/reimbursements with no impact to net expenses or net investment income.
(2) Commencement of Offering.
(3) Per share amount is based on average shares outstanding.
(4) Calculated based on the net asset value as of the last business day of the period.
(5) The Ratios of Expenses and Net Investment Income reflect the rebate of certain Portfolio expenses in connection with the investments in Morgan Stanley affiliates during the period. The effect of the rebate on the ratios is disclosed in the above table as "Ratio of Rebate from Morgan Stanley Affiliates to Average Net Assets."
(6) Effective September 16, 2013, the Adviser has agreed to limit the ratio of expenses to average net assets to the maximum ratio of 1.08% for Class IS shares.
(7) Effective March 30, 2015, the Adviser has agreed to limit the ratio of expenses to average net assets to the maximum ratio of 0.84% for Class IS shares. Prior to March 30, 2015, the maximum ratio was 1.08% for Class IS share.
(8) Amount is less than 0.005%.
(9) Not Annualized.
(10) Annualized.
The accompanying notes are an integral part of the financial statements.
17
Morgan Stanley Institutional Fund, Inc.
Annual Report — December 31, 2016
Notes to Financial Statements
Morgan Stanley Institutional Fund, Inc. (the "Fund") is registered under the Investment Company Act of 1940, as amended (the "Act"), as an open-end management investment company. The Fund is comprised of twenty-nine separate, active, diversified and non-diversified portfolios (individually referred to as a "Portfolio," collectively as the "Portfolios"). The Fund applies investment company accounting and reporting guidance.
The accompanying financial statements relate to the Global Infrastructure Portfolio. The Portfolio seeks to provide both capital appreciation and income.
The Portfolio offers five classes of shares — Class I, Class A, Class L, Class C and Class IS. On April 30, 2015, the Portfolio suspended offering of Class L shares. Existing Class L shareholders may invest through reinvestment of dividends and distributions.
On March 30, 2015, the Portfolio acquired the net assets of Morgan Stanley Global Infrastructure Fund ("Global Infrastructure Fund"), an open-end investment company, based on the respective valuations as of the close of business on March 27, 2015, pursuant to a Plan of Reorganization approved by the shareholders of Global Infrastructure Fund on February 27, 2015 ("Reorganization"). The purpose of the transaction was to combine two portfolios managed by the Adviser with comparable investment objectives and strategies. The acquisition was accomplished by a tax-free exchange of 316,431 Class I shares of the Portfolio at a net asset value of $15.48 for 679,771 Class I shares of Global Infrastructure Fund; 22,027,075 Class A shares of the Portfolio at a net asset value of $15.44 for 12,300,653 Class A shares, 152,892 Class B shares and 33,435,791 Class Q shares of Global Infrastructure Fund; 408,846 Class L shares of the Portfolio at a net asset value of $15.37 for 848,685 Class L shares of Global Infrastructure Fund; The net assets of Global Infrastructure Fund before the Reorganization were approximately $351,280,000, including unrealized appreciation of approximately $79,957,000 at March 27, 2015. The investment portfolio of Global Infrastructure Fund, with a fair value of approximately $350,947,000 and identified cost of approximately $270,989,000 on March 27, 2015, was the principal asset acquired by the Portfolio. For financial reporting purposes, assets received and shares issued by the Portfolio were recorded at fair value; however, the cost basis of the investments received from Global Infrastructure Fund was carried forward to align ongoing reporting of the Portfolio's realized and unrealized gains and losses with amounts distributable to
shareholders for tax purposes. Immediately prior to the Reorganization, the net assets of the Portfolio were approximately $67,309,000. Immediately after the Reorganization, the net assets of the Portfolio were approximately $418,700,000.
Upon closing of the Reorganization, shareholders of Global Infrastructure Fund received shares of the Portfolio as follows:
Global
Infrastructure Fund | | MSIF Global
Infrastructure Portfolio | |
| Class I | | Class I | |
| Class A | | Class A | |
| Class B | | Class A | |
| Class Q | | Class A | |
| Class L | | Class L | |
Assuming the acquisition had been completed on January 1, 2015, the beginning of the annual reporting period of the Portfolio, the Portfolio's pro forma results of operations for the period ended December 31, 2015, are as follows:
Net investment income(1) | | $ | 11,286,000 | | |
Net realized gain and unrealized gain/loss(2) | | $ | (52,825,000 | ) | |
Net increase (decrease) in net assets resulting from operations | | $ | 41,539,000 | | |
(1) Approximately $8,128,000 as reported, plus approximately $2,099,000 Global Infrastructure Fund prior to the Reorganization, plus approximately $1,059,000 of estimated pro-forma eliminated expenses.
(2) Approximately $(65,628,000) as reported, plus approximately $12,803,000 Global Infrastructure Fund prior to the Reorganization.
Because the combined investment portfolios have been managed as a single integrated portfolio since the acquisition was completed, it is not practicable to separate the amounts of revenue and earnings of Global Infrastructure Fund that have been included in the Portfolio's Statement of Operations since March 30, 2015.
A. Significant Accounting Policies: The following significant accounting policies are in conformity with U.S. generally accepted accounting principles ("GAAP"). Such policies are consistently followed by the Fund in the preparation of its financial statements. GAAP may require management to make estimates and assumptions that affect the reported amounts and disclosures in the financial statements. Actual results may differ from those estimates.
1. Security Valuation: (1) An equity portfolio security listed or traded on an exchange is valued at its latest reported sales price (or at the exchange official closing price if such exchange reports an official closing price), and if there were no sales on a given day and if there is no official exchange closing price for that day, the security is valued at the mean between the last reported bid and asked prices if such bid and asked prices are available on the relevant exchanges; (2) all other equity portfolio securities for
18
Morgan Stanley Institutional Fund, Inc.
Annual Report — December 31, 2016
Notes to Financial Statements (cont'd)
which over-the-counter ("OTC") market quotations are readily available are valued at the latest reported sales price (or at the market official closing price if such market reports an official closing price), and if there was no trading in the security on a given day and if there is no official closing price from relevant markets for that day, the security is valued at the mean between the last reported bid and asked prices if such bid and asked prices are available on the relevant markets. Listed equity securities not traded on the valuation date with no reported bid and asked prices available on the exchange are valued at the mean between the current bid and asked prices obtained from one or more reputable brokers or dealers. An unlisted equity security that does not trade on the valuation date and for which bid and asked prices from the relevant markets are unavailable is valued at the mean between the current bid and asked prices obtained from one or more reputable brokers or dealers. In cases where a security is traded on more than one exchange, the security is valued on the exchange designated as the primary market; (3) certain portfolio securities may be valued by an outside pricing service/vendor approved by the Fund's Board of Directors (the "Directors"). The pricing service/vendor may employ a pricing model that takes into account, among other things, bids, yield spreads, and/or other market data and specific security characteristics. Alternatively, if a valuation is not available from an outside pricing service/vendor, and the security trades on an exchange, the security may be valued at its latest reported sale price (or at the exchange official closing price if such exchange reports an official closing price), prior to the time when assets are valued. If there are no sales on a given day and if there is no official exchange closing price for that day, the security is valued at the mean between the last reported bid and asked prices if such bid and asked prices are available in the relevant exchanges; (4) when market quotations are not readily available, including circumstances under which Morgan Stanley Investment Management Inc. (the "Adviser") or Morgan Stanley Investment Management Limited ("MSIM Limited") and Morgan Stanley Investment Management Company ("MSIM Company") (together, the "Sub-Advisers"), each a whole owned subsidiary of Morgan Stanley, determine that the closing price, last sale price or the mean between the last reported bid and asked prices are not reflective of a security's market value, portfolio securities are valued at their fair value as determined in good faith under procedures established
by and under the general supervision of the Directors. Occasionally, developments affecting the closing prices of securities and other assets may occur between the times at which valuations of such securities are determined (that is, close of the foreign market on which the securities trade) and the close of business of the New York Stock Exchange ("NYSE"). If developments occur during such periods that are expected to materially affect the value of such securities, such valuations may be adjusted to reflect the estimated fair value of such securities as of the close of the NYSE, as determined in good faith by the Directors or by the Adviser using a pricing service and/or procedures approved by the Directors; (5) quotations of foreign portfolio securities, other assets and liabilities and forward contracts stated in foreign currency are translated into U.S. dollar equivalents at the prevailing market rates prior to the close of the NYSE; and (6) investments in mutual funds, including the Morgan Stanley Institutional Liquidity Funds, are valued at the net asset value ("NAV") as of the close of each business day.
The Directors have responsibility for determining in good faith the fair value of the investments, and the Directors may appoint others, such as the Fund's Adviser or a valuation committee, to assist the Directors in determining fair value and to make the actual calculations pursuant to the fair valuation methodologies previously approved by the Directors. Under procedures approved by the Directors, the Fund's Adviser has formed a Valuation Committee whose members are approved by the Directors. The Valuation Committee provides administration and oversight of the Fund's valuation policies and procedures, which are reviewed at least annually by the Directors. These procedures allow the Fund to utilize independent pricing services, quotations from securities and financial instrument dealers, and other market sources to determine fair value.
The Fund has procedures to determine the fair value of securities and other financial instruments for which market prices are not readily available. Under these procedures, the Valuation Committee convenes on a regular and ad hoc basis to review such securities and considers a number of factors, including valuation methodologies and significant unobservable valuation inputs, when arriving at fair value. The Valuation Committee may employ a market-based approach which may use related or comparable assets or liabilities, recent transactions,
19
Morgan Stanley Institutional Fund, Inc.
Annual Report — December 31, 2016
Notes to Financial Statements (cont'd)
market multiples, book values, and other relevant information for the investment to determine the fair value of the investment. An income-based valuation approach may also be used in which the anticipated future cash flows of the investment are discounted to calculate fair value. Discounts may also be applied due to the nature or duration of any restrictions on the disposition of the investments. Due to the inherent uncertainty of valuations of such investments, the fair values may differ significantly from the values that would have been used had an active market existed. The Valuation Committee employs various methods for calibrating these valuation approaches including a regular review of valuation methodologies, key inputs and assumptions, transactional back-testing or disposition analysis, and reviews of any related market activity.
2. Fair Value Measurement: Financial Accounting Standards Board ("FASB") Accounting Standards CodificationTM ("ASC") 820, "Fair Value Measurement" ("ASC 820"), defines fair value as the value that the Fund would receive to sell an investment or pay to transfer a liability in a timely transaction with an independent buyer in the principal market, or in the absence of a principal market, the most advantageous market for the investment or liability. ASC 820 establishes a three-tier hierarchy to distinguish between (1) inputs that reflect the assumptions market participants would use in valuing an asset or liability developed based on market data obtained from sources independent of the reporting entity (observable inputs) and (2) inputs that reflect the reporting entity's own assumptions about the assumptions market participants would use in valuing an asset or liability developed based on the best information available in the circumstances (unobservable inputs) and to establish classification of fair value measurements for disclosure purposes. Various inputs are used in determining the value of the Fund's investments. The inputs are summarized in the three broad levels listed below.
• Level 1 – unadjusted quoted prices in active markets for identical investments
• Level 2 – other significant observable inputs (including quoted prices for similar investments, interest rates, prepayment speeds, credit risk, etc.)
• Level 3 – significant unobservable inputs including the Fund's own assumptions in determining the fair value of investments. Factors considered in making this determination may include, but are not limited to, information obtained by contacting the issuer, analysts, or the appropriate stock exchange (for exchange-traded securities), analysis of the issuer's financial statements or other available documents and, if necessary, available information concerning other securities in similar circumstances
The inputs or methodology used for valuing securities are not necessarily an indication of the risk associated with investing in those securities and the determination of the significance of a particular input to the fair value measurement in its entirety requires judgment and considers factors specific to each security.
The following is a summary of the inputs used to value the Portfolio's investments as of December 31, 2016.
Investment Type | | Level 1
Unadjusted
quoted
prices
(000) | | Level 2
Other
significant
observable
inputs
(000) | | Level 3
Significant
unobservable
inputs
(000) | | Total
(000) | |
Assets: | |
Common Stocks | |
Airports | | $ | 11,896 | | | $ | — | | | $ | — | | | $ | 11,896 | | |
Communications | | | 36,421 | | | | — | | | | — | | | | 36,421 | | |
Diversified | | | 21,316 | | | | — | | | | — | | | | 21,316 | | |
Electricity
Transmission & | |
Distribution | | | 31,589 | | | | — | | | | — | | | | 31,589 | | |
Oil & Gas Storage &
Transportation | | | 115,586 | | | | — | | | | — | | | | 115,586 | | |
PPA Contracted
Renewables | | | 46,240 | | | | — | | | | — | | | | 46,240 | | |
Railroads | | | 6,812 | | | | — | | | | — | | | | 6,812 | | |
Toll Roads | | | 39,714 | | | | — | | | | — | | | | 39,714 | | |
Water | | | 19,723 | | | | — | | | | — | | | | 19,723 | | |
Total Common Stocks | | | 329,297 | | | | — | | | | — | | | | 329,297 | | |
Short-Term Investments | |
Investment Companies | | | 29,957 | | | | — | | | | — | | | | 29,957 | | |
Repurchase Agreements | | | — | | | | 2,336 | | | | — | | | | 2,336 | | |
Total Short-Term
Investments | | | 29,957 | | | | 2,336 | | | | — | | | | 32,293 | | |
Total Assets | | $ | 359,254 | | | $ | 2,336 | | | $ | — | | | $ | 361,590 | | |
Transfers between investment levels may occur as the markets fluctuate and/or the availability of data used in an investment's valuation changes. The Portfolio recognizes transfers between the levels as of the end of the period. As of December 31, 2016, securities with a total value of
20
Morgan Stanley Institutional Fund, Inc.
Annual Report — December 31, 2016
Notes to Financial Statements (cont'd)
approximately $112,712,000 transferred from Level 2 to Level 1. Securities that were valued using other significant observable inputs at December 31, 2015 were valued using unadjusted quoted prices at December 31, 2016. At December 31, 2015, the fair value of certain securities were adjusted due to developments which occurred between the time of the close of the foreign markets on which they trade and the close of business on the NYSE which resulted in their Level 2 classification.
3. Repurchase Agreements: The Portfolio may enter into repurchase agreements under which the Portfolio lends cash and takes possession of securities with an agreement that the counterparty will repurchase such securities. In connection with transactions in repurchase agreements, a bank as custodian for the Portfolio takes possession of the underlying securities which are held as collateral, with a market value at least equal to the amount of the repurchase transaction, including principal and accrued interest. To the extent that any repurchase transaction exceeds one business day, the value of the collateral is marked-to-market on a daily basis to determine that the value of the collateral does not decrease below the repurchase price plus accrued interest as earned. If such a decrease occurs, additional collateral will be requested and, when received, will be added to the account to maintain full collateralization. In the event of default on the obligation to repurchase, the Portfolio has the right to liquidate the collateral and apply the proceeds in satisfaction of the obligation. In the event of default or bankruptcy by the counterparty to the agreement, realization of the collateral proceeds may be subject to cost and delays. The Portfolio, along with other affiliated investment companies, may utilize a joint trading account for the purpose of entering into repurchase agreements.
4. Foreign Currency Translation and Foreign Investments: The books and records of the Portfolio are maintained in U.S. dollars. Foreign currency amounts are translated into U.S. dollars as follows:
– investments, other assets and liabilities at the prevailing rate of exchange on the valuation date;
– investment transactions and investment income at the prevailing rates of exchange on the dates of such transactions.
Although the net assets of the Portfolio are presented at the foreign exchange rates and market values at the close
of the period, the Portfolio does not isolate that portion of the results of operations arising as a result of changes in the foreign exchange rates from the fluctuations arising from changes in the market prices of securities held at period end. Similarly, the Portfolio does not isolate the effect of changes in foreign exchange rates from the fluctuations arising from changes in the market prices of securities sold during the period. Accordingly, realized and unrealized foreign currency gains (losses) on investments in securities are included in the reported net realized and unrealized gains (losses) on investment transactions and balances. However, pursuant to U.S. federal income tax regulations, gains and losses from certain foreign currency transactions and the foreign currency portion of gains and losses realized on sales and maturities of foreign denominated debt securities are treated as ordinary income for U.S. federal income tax purposes.
Net realized gains (losses) on foreign currency transactions represent net foreign exchange gains (losses) from foreign currency forward exchange contracts, disposition of foreign currencies, currency gains (losses) realized between the trade and settlement dates on securities transactions, and the difference between the amount of investment income and foreign withholding taxes recorded on the Portfolio's books and the U.S. dollar equivalent amounts actually received or paid. Net unrealized currency gains (losses) from valuing foreign currency denominated assets and liabilities at period end exchange rates are reflected as a component of unrealized appreciation (depreciation) in the Statement of Assets and Liabilities. The change in unrealized currency gains (losses) on foreign currency translations for the period is reflected in the Statement of Operations.
Foreign security and currency transactions may involve certain considerations and risks not typically associated with those of U.S. dollar denominated transactions as a result of, among other factors, fluctuations of exchange rates in relation to the U.S. dollar, the possibility of lower levels of governmental supervision and regulation of foreign securities markets and the possibility of political or economic instability.
Governmental approval for foreign investments may be required in advance of making an investment under certain circumstances in some countries, and the extent of foreign investments in domestic companies may be
21
Morgan Stanley Institutional Fund, Inc.
Annual Report — December 31, 2016
Notes to Financial Statements (cont'd)
subject to limitation in other countries. Foreign ownership limitations also may be imposed by the charters of individual companies to prevent, among other concerns, violations of foreign investment limitations. As a result, an additional class of shares (identified as "Foreign" in the Portfolio of Investments) may be created and offered for investment. The "local" and "foreign shares" market values may differ. In the absence of trading of the foreign shares in such markets, the Portfolio values the foreign shares at the closing exchange price of the local shares.
5. Securities Lending: The Portfolio lends securities to qualified financial institutions, such as broker-dealers, to earn additional income. Any increase or decrease in the fair value of the securities loaned that might occur and any interest earned or dividends declared on those securities during the term of the loan would remain in the Portfolio. The Portfolio would receive cash or securities as collateral in an amount equal to or exceeding 100% of the current fair value of the loaned securities. The collateral is marked-to-market daily by State Street Bank and Trust Company ("State Street"), the securities lending agent, to ensure that a minimum of 100% collateral coverage is maintained.
Based on pre-established guidelines, the securities lending agent invests any cash collateral that is received in an affiliated money market portfolio and repurchase agreements. Securities lending income is generated from the earnings on the invested collateral and borrowing fees, less any rebates owed to the borrowers and compensation to the lending agent, and is recorded as "Income from Securities Loaned — Net" in the Portfolio's Statement of Operations. Risks in securities lending transactions are that a borrower may not provide additional collateral when required or return the securities when due, and that the value of the short-term investments will be less than the amount of cash collateral plus any rebate that is required to be returned to the borrower.
The Portfolio has the right under the lending agreement to recover the securities from the borrower on demand.
The following table presents financial instruments that are subject to enforceable netting arrangements as of December 31, 2016.
Gross Amounts Not Offset in the Statement of Assets and Liabilities | |
Gross Asset
Amounts
Presented in
Statement of
Assets and
Liabilities
(000) | | Financial
Instrument
(000) | | Collateral
Received
(000) | | Net Amount
(not less
than $0)
(000) | |
| $ | 15,739 | (a) | | $ | — | | | $ | (15,739 | )(b)(c) | | $ | 0 | | |
(a) Represents market value of loaned securities at period end.
(b) The Portfolio received cash collateral of approximately $11,535,000, of which approximately $11,516,000 was subsequently invested in a Repurchase Agreement and Morgan Stanley Institutional Liquidity Funds as reported in the Portfolio of Investments. As of December 31, 2016, there was uninvested cash of approximately $19,000, which is not reflected in the Portfolio of Investments. In addition, the Portfolio received non-cash collateral of approximately $5,092,000 in the form of U.S. Government obligations, which the Portfolio cannot sell or repledge, and accordingly are not reflected in the Portfolio of Investments.
(c) The actual collateral received is greater than the amount shown here due to overcollateralization.
FASB Accounting Standards Update No. 2014-11 ("ASU No. 2014-11"), "Transfers & Servicing (Topic 860): Repurchase-to-Maturity Transactions, Repurchase Financings, and Disclosures", is intended to provide increased transparency about the types of collateral pledged in securities lending transactions and other similar transactions that are accounted for as secured borrowing.
The following table displays a breakdown of transactions accounted for as secured borrowings, the gross obligations by class of collateral pledged, and the remaining contractual maturity of those transactions as of December 31, 2016.
Remaining Contractual Maturity of the Agreements | |
| | | Overnight and
Continuous | | <30 days | | Between
30 &
90 days | | >90 days | | Total | |
Securities Lending
Transactions | |
Common Stocks | | $ | 11,535 | | | $ | — | | | $ | — | | | $ | — | | | $ | 11,535 | | |
Total Borrowings | | $ | 11,535 | | | $ | — | | | $ | — | | | $ | — | | | $ | 11,535 | | |
Gross amount of
recognized liabilities
for securities lending
transactions | | | | | | | | | | $ | 11,535 | | |
6. Indemnifications: The Fund enters into contracts that contain a variety of indemnifications. The Fund's maximum exposure under these arrangements is unknown. However, the Fund has not had prior claims or losses pursuant to these contracts and expects the risk of loss to be remote.
7. Dividends and Distributions to Shareholders: Dividend income and distributions to shareholders are recorded on the ex-dividend date. Dividends from net
22
Morgan Stanley Institutional Fund, Inc.
Annual Report — December 31, 2016
Notes to Financial Statements (cont'd)
investment income, if any, are declared and paid annually. Net realized capital gains, if any, are distributed at least annually.
8. Security Transactions, Income and Expenses: Security transactions are accounted for on the trade date (date the order to buy or sell is executed). Realized gains and losses on the sale of investment securities are determined on the specific identified cost method. Dividend income and other distributions are recorded on the ex-dividend date (except for certain foreign dividends which may be recorded as soon as the Portfolio is informed of such dividends) net of applicable withholding taxes. Interest income is recognized on the accrual basis except where collection is in doubt. Discounts are accreted and premiums are amortized over the life of the respective securities. Most expenses of the Fund can be directly attributed to a particular Portfolio. Expenses which cannot be directly attributed are apportioned among the Portfolios based upon relative net assets or other appropriate methods. Income, expenses (other than class specific expenses — distribution and shareholder services, transfer agency and sub transfer agency fees) and realized and unrealized gains or losses are allocated to each class of shares based upon their relative net assets.
The Portfolio owns shares of real estate investment trusts ("REITs") which report information on the source of their distributions annually in the following calendar year. A portion of distributions received from REITs during the year is estimated to be a return of capital and is recorded as a reduction of their cost.
B. Advisory/Sub-Advisory Fees: The Adviser, a wholly-owned subsidiary of Morgan Stanley, provides the Portfolio with advisory services under the terms of an Investment Advisory Agreement, paid quarterly, at an annual rate of 0.85% of the average daily net assets of the Portfolio.
The Adviser has agreed to reduce its advisory fee and/or reimburse the Portfolio so that total annual portfolio operating expenses, excluding certain investment related expenses, taxes, interest and other extraordinary expenses (including litigation), will not exceed 0.87% for Class I shares, 1.11% for Class A shares, 1.68% for Class L shares, 1.97% for Class C shares and 0.84% for Class IS shares. The fee waivers and/or expense reimbursements will continue for at least one year from the date of the Portfolio's prospectus or until such time as the Directors act to discontinue all or a portion of such waivers
and/or reimbursements when they deem such action is appropriate. For the year ended December 31, 2016, approximately $478,000 of advisory fees were waived and approximately $233,000 of other expenses were reimbursed by the Adviser pursuant to this arrangement.
The Adviser has entered into a Sub-Advisory Agreement with the Sub-Advisers, each a wholly-owned subsidiary of Morgan Stanley. The Sub-Advisers provide the Portfolio with advisory services subject to the overall supervision of the Adviser and the Fund's Officers and Directors. The Adviser pays the Sub-Advisers on a monthly basis a portion of the net advisory fees the Adviser receives from the Portfolio.
C. Administration Fees: The Adviser also serves as Administrator to the Fund and provides administrative services pursuant to an Administration Agreement for an annual fee, accrued daily and paid monthly, of 0.08% of the Portfolio's average daily net assets.
Under a Sub-Administration Agreement between the Administrator and State Street, State Street provides certain administrative services to the Fund. For such services, the Administrator pays State Street a portion of the fee the Administrator receives from the Portfolio.
D. Distribution and Shareholder Services Fees: Morgan Stanley Distribution, Inc. ("MSDI" or the "Distributor"), a wholly-owned subsidiary of the Adviser and Sub-Advisers and an indirect subsidiary of Morgan Stanley, serves as the Fund's Distributor of Portfolio shares pursuant to a Distribution Agreement. The Fund has adopted a Shareholder Services Plan with respect to Class A shares pursuant to Rule 12b-1 under the Act. Under the Shareholder Services Plan, the Portfolio pays the Distributor a shareholder services fee, accrued daily and paid monthly, at an annual rate of 0.25% of the Portfolio's average daily net assets attributable to Class A shares.
The Fund has adopted a Distribution and Shareholder Services Plan with respect to Class L shares pursuant to Rule 12b-1 under the Act. Under the Distribution and Shareholder Services Plan, the Portfolio pays the Distributor a distribution fee, accrued daily and paid monthly, at an annual rate of 0.50% and a shareholder services fee, accrued daily and paid monthly, at an annual rate of 0.25% of the Portfolio's average daily net assets attributable to Class L shares.
The Fund has adopted a Distribution and Shareholder Services Plan with respect to Class C shares pursuant to Rule 12b-1
23
Morgan Stanley Institutional Fund, Inc.
Annual Report — December 31, 2016
Notes to Financial Statements (cont'd)
under the Act. Under the Distribution and Shareholder Services Plan, the Portfolio pays the Distributor a distribution fee, accrued daily and paid monthly, at an annual rate of 0.75% and a shareholder services fee, accrued daily and paid monthly, at an annual rate of 0.25% of the Portfolio's average daily net assets attributable to Class C shares.
The distribution and shareholder services fees are used to support the expenses associated with servicing and maintaining accounts. The Distributor may compensate other parties for providing shareholder support services to investors who purchase Class A, Class L and Class C shares.
E. Dividend Disbursing and Transfer Agent: The Fund's dividend disbursing and transfer agent is Boston Financial Data Services, Inc. ("BFDS"). Pursuant to a Transfer Agency Agreement, the Fund pays BFDS a fee based on the number of classes, accounts and transactions relating to the Portfolios of the Fund.
F. Custodian Fees: State Street (the "Custodian") serves as Custodian for the Fund in accordance with a Custodian Agreement. The Custodian holds cash, securities, and other assets of the Fund as required by the Act. Custody fees are payable monthly based on assets held in custody, investment purchases and sales activity and account maintenance fees, plus reimbursement for certain out-of-pocket expenses.
In December 2015, the Fund's Custodian announced that it had identified inconsistencies in the way in which clients were invoiced for out-of-pocket expenses from 1998 until November 2015. The dollar amount difference between what was charged and what should have been charged, plus interest, was paid back to the Portfolio in September 2016 as a reimbursement. The Custodian reimbursed the Portfolio directly, which was recognized as a change in accounting estimate and was reflected as "Reimbursement of Custodian Fees" in the Statement of Operations. Pursuant to the expense limitations described in Note B, the Portfolio has experienced waiver of advisory fees and expenses reimbursed by the Adviser during the current period. Accordingly, the reimbursement of out-of-pocket custodian expenses in the current period resulted in the reduction in the current period waiver of advisory fees.
G. Security Transactions and Transactions with Affiliates: For the year ended December 31, 2016, purchases and sales of investment securities for the Portfolio, other than long-term U.S. Government securities and short-term investments, were approximately $152,291,000 and $170,932,000, respectively. There were no purchases and sales
of long-term U.S. Government securities for the year ended December 31, 2016.
The Portfolio invests in the Institutional Class of the Morgan Stanley Institutional Liquidity Funds (the "Liquidity Funds"), an open-end management investment company managed by the Adviser, both directly and as a portion of the securities held as collateral on loaned securities. Advisory fees paid by the Portfolio are reduced by an amount equal to its pro-rata share of the advisory and administration fees paid by the Portfolio due to its investment in the Liquidity Funds. For the year ended December 31, 2016, advisory fees paid were reduced by approximately $24,000 relating to the Portfolio's investment in the Liquidity Funds.
A summary of the Portfolio's transactions in shares of the Liquidity Funds during the year ended December 31, 2016 is as follows:
Value
December 31,
2015
(000) | | Purchases
at Cost
(000) | | Sales
(000) | | Dividend
Income
(000) | | Value
December 31,
2016
(000) | |
| $ | 28,162 | | | $ | 133,895 | | | $ | 132,100 | | | $ | 34 | | | $ | 29,957 | | |
During the year ended December 31, 2016, the Portfolio incurred approximately $9,000 in brokerage commissions with Morgan Stanley & Co., LLC, an affiliate of the Adviser/Administrator, Sub-Advisers and Distributor, for portfolio transactions executed on behalf of the Portfolio.
The Portfolio is permitted to purchase and sell securities ("cross-trade") from and to other Morgan Stanley Funds as well as other funds and client accounts for which the Adviser or an affiliate of the Adviser serves as investment adviser, pursuant to procedures approved by the Directors in compliance with Rule 17a-7 under the Act (the "Rule"). Each cross-trade is executed at the current market price in compliance with provisions of the Rule. For the year ended December 31, 2016, the Portfolio did not engage in any cross-trade transactions.
The Portfolio has an unfunded Deferred Compensation Plan (the "Compensation Plan"), which allows each independent Director to defer payment of all, or a portion, of the fees he or she receives for serving on the Board of Directors. Each eligible Director generally may elect to have the deferred amounts credited with a return equal to the total return on one or more of the Morgan Stanley funds that are offered as investment options under the Compensation Plan. Appreciation/depreciation and distributions received from these investments are recorded with an offsetting increase/decrease in the deferred compensation obligation and do not affect the NAV of the Portfolio.
24
Morgan Stanley Institutional Fund, Inc.
Annual Report — December 31, 2016
Notes to Financial Statements (cont'd)
H. Federal Income Taxes: It is the Portfolio's intention to continue to qualify as a regulated investment company and distribute all of its taxable and tax-exempt income. Accordingly, no provision for federal income taxes is required in the financial statements.
The Portfolio may be subject to taxes imposed by countries in which it invests. Such taxes are generally based on income and/or capital gains earned or repatriated. Taxes are accrued based on net investment income, net realized gains and net unrealized appreciation as such income and/or gains are earned. Taxes may also be based on transactions in foreign currency and are accrued based on the value of investments denominated in such currency.
FASB ASC 740-10, "Income Taxes — Overall", sets forth a minimum threshold for financial statement recognition of the benefit of a tax position taken or expected to be taken in a tax return. Management has concluded there are no significant uncertain tax positions that would require recognition in the financial statements. If applicable, the Portfolio recognizes interest accrued related to unrecognized tax benefits in "Interest Expense" and penalties in "Other Expenses" in the Statement of Operations. The Portfolio files tax returns with the U.S. Internal Revenue Service, New York and various states. Generally, each of the tax years in the four-year period ended December 31, 2016, remains subject to examination by taxing authorities.
The tax character of distributions paid may differ from the character of distributions shown in the Statements of Changes in Net Assets due to short-term capital gains being treated as ordinary income for tax purposes. The tax character of distributions paid during fiscal years 2016 and 2015 was as follows:
2016
Distributions
Paid From: | | 2015
Distributions
Paid From: | |
Ordinary
Income
(000) | | Long-Term
Capital Gain
(000) | | Ordinary
Income
(000) | | Long-Term
Capital Gain
(000) | | Paid-in-
Capital
(000) | |
| $ | 8,000 | | | $ | 3,651 | | | $ | 7,533 | | | $ | 8,605 | | | $ | 122 | | |
The amount and character of income and gains to be distributed are determined in accordance with income tax regulations which may differ from GAAP. These book/tax differences are either considered temporary or permanent in nature.
Temporary differences are primarily due to differing book and tax treatments for the timing of the recognition of gains (losses) on certain investment transactions and the timing of the deductibility of certain expenses.
Permanent differences, primarily due to differing treatments of gains (losses) related to foreign currency transactions and capital gain distributions from real estate investment trusts, resulted in the following reclassifications among the components of net assets at December 31, 2016:
Accumulated
Undistributed
Net Investment
Income
(000) | | Accumulated
Net Realized
Loss
(000) | | Paid-in-
Capital
(000) | |
| $ | 14 | | | $ | 712 | | | $ | (726 | ) | |
At December 31, 2016, the components of distributable earnings for the Portfolio on a tax basis were as follows:
Undistributed
Ordinary
Income
(000) | | Undistributed
Long-Term
Capital Gain
(000) | |
| $ | 552 | | | $ | 2,613 | | |
I. Credit Facility: As of April 4, 2016, the Fund and other Morgan Stanley funds participated in a $150,000,000 committed, unsecured revolving line of credit facility (the "facility") with State Street. This facility is to be used for temporary emergency purposes or funding of shareholder redemption requests. The interest rate on borrowings is based on the federal funds rate or one month libor rate plus a spread. The facility also has a commitment fee of 0.25% per annum based on the unused portion of the facility. During the year ended December 31, 2016, the Portfolio did not have any borrowings under the facility.
J. Other: At December 31, 2016, the Portfolio had record owners of 10% or greater. Investment activities of these shareholders could have a material impact on the Portfolio. The aggregate percentage of such owners was 56.2%.
K. Accounting Pronouncements: In December 2016, FASB issued Accounting Standards update 2016-19 — Technical Corrections and Improvements ("ASU 2016-19"), which is effective for interim periods for all entities beginning after December 15, 2016. ASU 2016-19 includes an amendment to Topic 820, Fair Value Measurement, which clarifies the difference between a valuation approach and a valuation technique when applying the guidance in that Topic. That amendment also requires an entity to disclose when there has been a change in either or both a valuation approach and/or a valuation technique. The transition guidance for the amendment must be applied prospectively because it could potentially involve the use of hindsight that includes fair value measurements. Although still evaluating the potential impacts of ASU 2016-19 to the Portfolio, management expects that the impact of the
25
Morgan Stanley Institutional Fund, Inc.
Annual Report — December 31, 2016
Notes to Financial Statements (cont'd)
Portfolio's adoption will be limited to additional financial statement disclosures.
In October 2016, the Securities and Exchange Commission ("SEC") issued a new rule, Investment Company Reporting Modernization, which, among other provisions, amends Regulation S-X to require standardized, enhanced disclosures, particularly related to derivatives, in investment company financial statements. Compliance with the guidance is effective for financial statements filed with the SEC on or after August 1, 2017; adoption will have no effect on the Portfolio's net assets or results of operations. Although still evaluating the potential impacts of the Investment Company Reporting Modernization to the Portfolio, management expects that the impact of the Portfolio's adoption will be limited to additional financial statement disclosures.
26
Morgan Stanley Institutional Fund, Inc.
Annual Report — December 31, 2016
Report of Independent Registered Public Accounting Firm
To the Shareholders and Board of Directors of
Morgan Stanley Institutional Fund, Inc. —
Global Infrastructure Portfolio
We have audited the accompanying statement of assets and liabilities, including the portfolio of investments, of Global Infrastructure Portfolio (one of the portfolios constituting Morgan Stanley Institutional Fund, Inc.) (the "Portfolio") as of December 31, 2016, and the related statement of operations for the year then ended, the statements of changes in net assets for each of the two years in the period then ended and the financial highlights for each of the years or periods indicated therein. These financial statements and financial highlights are the responsibility of the Portfolio's management. Our responsibility is to express an opinion on these financial statements and financial highlights based on our audits.
We conducted our audits in accordance with the standards of the Public Company Accounting Oversight Board (United States). Those standards require that we plan and perform the audit to obtain reasonable assurance about whether the financial statements and financial highlights are free of material misstatement. We were not engaged to perform an audit of the Portfolio's internal control over financial reporting. Our audits included consideration of internal control over financial reporting as a basis for designing audit procedures that are appropriate in the circumstances, but not for the purpose of expressing an opinion on the effectiveness of the Portfolio's internal control over financial reporting. Accordingly, we express no such opinion. An audit also includes examining, on a test basis, evidence supporting the amounts and disclosures in the financial statements and financial highlights, assessing the accounting principles used and significant estimates made by management, and evaluating the overall financial statement presentation. Our procedures included confirmation of securities owned as of December 31, 2016, by correspondence with the custodian and others or by other appropriate auditing procedures where replies from others were not received. We believe that our audits provide a reasonable basis for our opinion.
In our opinion, the financial statements and financial highlights referred to above present fairly, in all material respects, the financial position of Global Infrastructure Portfolio (one of the portfolios constituting Morgan Stanley Institutional Fund, Inc.) at December 31, 2016, the results of its operations for the year then ended, the changes in its net assets for each of the two years in the period then ended and the financial highlights for each of the years or periods indicated therein, in conformity with U.S. generally accepted accounting principles.

Boston, Massachusetts
February 28, 2017
27
Morgan Stanley Institutional Fund, Inc.
Annual Report — December 31, 2016
Federal Tax Notice (unaudited)
For federal income tax purposes, the following information is furnished with respect to the distributions paid by the Portfolio during its taxable year ended December 31, 2016. For corporate shareholders 30.53% of the dividends qualified for the dividends received deduction.
The Portfolio designated and paid approximately $3,651,000 as a long-term capital gain distribution.
For federal income tax purposes, the following information is furnished with respect to the Portfolio's earnings for its taxable year ended December 31, 2016. When distributed, certain earnings may be subject to a maximum tax rate of 15% as provided for by the Jobs and Growth Tax Relief Reconciliation Act of 2003. The Portfolio designated up to a maximum of approximately $6,914,000 as taxable at this lower rate.
The Portfolio intends to pass through foreign tax credits of approximately $157,000 and has derived net income from sources within foreign countries amounting to approximately $7,810,000.
In January, the Portfolio provides tax information to shareholders for the preceding calendar year.
28
Morgan Stanley Institutional Fund, Inc.
Annual Report — December 31, 2016
Privacy Notice (unaudited)
MORGAN STANLEY INVESTMENT MANAGEMENT INC.
AN IMPORTANT NOTICE CONCERNING OUR U.S. PRIVACY POLICY
We are required by federal law to provide you with a copy of our privacy policy annually. This policy applies to current and former individual investors in funds managed or sponsored by Morgan Stanley Investment Management Inc. ("MSIM") as well as current and former individual clients of MSIM. This policy is not applicable to partnerships, corporations, trusts or other non-individual clients or investors. Please note that we may amend this policy at any time, and will inform you of any changes as required by law.
WE RESPECT YOUR PRIVACY
We appreciate that you have provided us with your personal financial information. We strive to maintain the privacy of such information while we help you achieve your financial objectives. This Notice describes what non-public personal information we collect about you, why we collect it, when we may share it with others and how certain others may use it. It discusses the steps you may take to limit our sharing of certain information about you to affiliated companies in the Morgan Stanley family of companies ("other Morgan Stanley companies"). It also discloses how you may limit use of certain shared information for marketing purposes by other Morgan Stanley branded companies. Throughout this policy, we refer to the non-public information that personally identifies you or your accounts as "personal information."
1. WHAT PERSONAL INFORMATION DO WE COLLECT ABOUT YOU?
We obtain personal information from applications and other forms you submit to us, from your dealings with us, from consumer reporting agencies, from our Web sites and from third parties and other sources.
For example:
• We may collect information such as your name, address, e-mail address, telephone/fax numbers, assets, income and investment objectives through subscription documents, applications and other forms you submit to us.
• We may obtain information about account balances, your use of account(s) and the types of products and services you prefer to receive from us through your dealings and transactions with us and other sources.
• We may obtain information about your creditworthiness and credit history from consumer reporting agencies.
• We may collect background information from and through third-party vendors to verify representations you have made and to comply with various regulatory requirements.
• If you interact with us through our public and private Web sites, we may collect information that you provide directly through online communications (such as an e-mail address). We may also collect information about your Internet service provider, your domain name, your computer's operating system and Web browser, your use of our Web sites and your product and service preferences, through the use of "cookies." Please consult the Terms of Use of these sites for more details.
2. WHEN DO WE DISCLOSE PERSONAL INFORMATION WE COLLECT ABOUT YOU?
We may disclose personal information we collect about you to other Morgan Stanley companies and to non-affiliated third parties.
a. Information We Disclose to Other Morgan Stanley Companies.
We may disclose personal information to other Morgan Stanley companies for a variety of reasons, including to manage your account(s) effectively, to service and process your transactions, to let you know about products and services offered by us and other Morgan Stanley companies, to manage our business, and as otherwise required or permitted by law. Offers for products and services from other Morgan Stanley companies are developed under conditions designed to safeguard your personal information.
29
Morgan Stanley Institutional Fund, Inc.
Annual Report — December 31, 2016
Privacy Notice (unaudited) (cont'd)
b. Information We Disclose to Non-affiliated Third Parties.
We do not disclose personal information that we collect about you to non-affiliated third parties except to those who provide marketing services on our behalf, to financial institutions with whom we have joint marketing agreements, and as otherwise required or permitted by law. For example, we may disclose personal information to nonaffiliated third parties for servicing and processing transactions, to offer our own products and services, to protect against fraud, for institutional risk control, to respond to judicial process or to perform services on our behalf. When we share personal information with a non-affiliated third party, they are required to limit their use of personal information to the particular purpose for which it was shared and they are not allowed to share personal information with others except to fulfill that limited purpose or as may be permitted or required by law.
3. HOW DO WE PROTECT THE SECURITY AND CONFIDENTIALITY OF PERSONAL INFORMATION WE COLLECT ABOUT YOU?
We maintain physical, electronic and procedural security measures to help safeguard the personal information we collect about you. We have internal policies governing the proper handling of client information. Third parties that provide support or marketing services on our behalf may also receive personal information, and we require them to adhere to confidentiality standards with respect to such information.
4. HOW CAN YOU LIMIT THE SHARING OF CERTAIN TYPES OF PERSONAL INFORMATION WITH OTHER MORGAN STANLEY COMPANIES?
We offer you choices as to whether we share with other Morgan Stanley companies the personal information that was collected to determine your eligibility for products and services you request ("eligibility information"). Eligibility information does not include your identification information or personal information pertaining to our transactions or experiences with you. Please note that, even if you direct us not to share eligibility information with other Morgan Stanley companies ("opt-out"), we may still share personal information, including eligibility information, with those companies in circumstances excluded from the opt-out under applicable law, such as to process transactions or to service your account.
5. HOW CAN YOU LIMIT THE USE OF CERTAIN TYPES OF PERSONAL INFORMATION BY OTHER MORGAN STANLEY COMPANIES FOR MARKETING?
By following the opt-out instructions in Section 6 below, you may limit other Morgan Stanley branded companies from marketing their products or services to you based on personal information we disclose to them. This information may include, for example, your income and account history with us. Please note that, even if you choose to limit Other Morgan Stanley Companies from using personal information about you that we may share with them for marketing their products and services to you, Other Morgan Stanley Companies may use your personal information that they obtain from us to market to you in circumstances permitted by law, such as if the Other Morgan Stanley Company has its own relationship with you.
6. HOW CAN YOU SEND US AN OPT-OUT INSTRUCTION?
If you wish to limit our sharing of eligibility information about you with other Morgan Stanley companies or other Morgan Stanley companies' use of personal information for marketing purposes, as described in this notice, you may do so by:
• Calling us at (800) 548-7786
Monday–Friday between 8a.m. and 6p.m.(EST)
• Writing to us at the following address:
Boston Financial Data Services, Inc.
c/o Privacy Coordinator
P.O. Box 219804
Kansas City, Missouri 64121
30
Morgan Stanley Institutional Fund, Inc.
Annual Report — December 31, 2016
Privacy Notice (unaudited) (cont'd)
Your written request should include your name, address, telephone number and account number(s) to which the opt-out applies and whether you are opting out with respect to sharing of eligibility information (Section 4 above), or if information used for Marketing (Section 5 above) or both. Written opt-out requests should not be sent with any other correspondence. In order to process your request, we require that the request be provided by you directly and not through a third party.
Your opt-out preference will remain in effect with respect to this policy (as it may be amended) until you notify us otherwise. If you have a joint account, your direction for us not to share this information with other Morgan Stanley companies and for those other Morgan Stanley companies not to use your personal information for marketing will be applied to all account holders on that account. Please understand that if you limit our sharing or our affiliated companies' use of personal information, you and any joint account holder(s) may not receive information about Morgan Stanley products and services, including products or services that could help you manage your financial resources and achieve your investment objectives.
7. WHAT IF AN AFFILIATED COMPANY BECOMES A NON-AFFILIATED THIRD PARTY?
If, at any time in the future, an affiliated company becomes a non-affiliated third party, further disclosures of personal information made to the former affiliated company will be limited to those described in Section 2(b) above relating to non-affiliated third parties. If you elected under Section 6 to limit disclosures we make to affiliated companies, or use of personal information by affiliated companies, your election will not apply to use by any former affiliated company of your personal information in their possession once it becomes a non-affiliated third party.
SPECIAL NOTICE TO RESIDENTS OF VERMONT
The following section supplements our policy with respect to our individual clients who have a Vermont address and supersedes anything to the contrary in the above policy with respect to those clients only.
The state of Vermont requires financial institutions to obtain your consent prior to sharing personal information that they collect about you with affiliated companies and non-affiliated third parties other than in certain limited circumstances. Except as permitted by law, we will not share personal information we collect about you with non-affiliated third parties or other Morgan Stanley companies unless you provide us with your written consent to share such information ("opt-in").
If you wish to receive offers for investment products and services offered by or through other Morgan Stanley companies, please notify us in writing at the following address:
Boston Financial Data Services, Inc.
c/o Privacy Coordinator
P.O. Box 219804
Kansas City, Missouri 64121
Your authorization should include your name, address, telephone number and account number(s) to which the opt-in applies and should not be sent with any other correspondence. In order to process your authorization, we require that the authorization be provided by you directly and not through a third party.
SPECIAL NOTICE TO RESIDENTS OF CALIFORNIA
The following section supplements our policy with respect to our individual clients who have a California address and supersedes anything to the contrary in the above policy with respect to those clients only.
In response to a California law, if your account has a California home address, your personal information will not be disclosed to nonaffiliated third parties except as permitted by applicable California law, and we will limit sharing such information with our affiliates to comply with California privacy laws that apply to us.
31
Morgan Stanley Institutional Fund, Inc.
Annual Report — December 31, 2016
Director and Officer Information (unaudited)
Independent Directors:
Name, Age and Address of
Independent Director | | Position(s)
Held with
Registrant | | Length of Time
Served* | | Principal Occupation(s) During Past 5 Years
and Other Relevant Professional Experience | | Number of
Overseen by
Independent
Director** | | Portfolios in
Fund Complex
Other Directorships
Held by Independent
Director*** | |
Frank L. Bowman (72)
c/o Perkins Coie LLP
Counsel to the Independent
Directors
30 Rockefeller Plaza
New York, NY 10112 | | Director | | Since
August
2006 | | President, Strategic Decisions, LLC (consulting) (since February 2009); Director or Trustee of various Morgan Stanley Funds (since August 2006); Chairperson of the Compliance and Insurance Committee (since October 2015); formerly, Chairperson of the Insurance Sub-Committee of the Compliance and Insurance Committee (2007-2015); served as President and Chief Executive Officer of the Nuclear Energy Institute (policy organization) (February 2005-November 2008); retired as Admiral, U.S. Navy after serving over 38 years on active duty including 8 years as Director of the Naval Nuclear Propulsion Program in the Department of the Navy and the U.S. Department of Energy (1996-2004); served as Chief of Naval Personnel (July 1994-September 1996) and on the Joint Staff as Director of Political Military Affairs (June 1992-July 1994); knighted as Honorary Knight Commander of the Most Excellent Order of the British Empire; awarded the Officier de l'Orde National du Mérite by the French Government; elected to the National Academy of Engineering (2009). | | | 90 | | | Director of BP p.l.c.; Director of Naval and Nuclear Technologies LLP; Director Emeritus of the Armed Services YMCA; Director of the U.S. Naval Submarine League; Member of the National Security Advisory Council of the Center for U.S. Global Engagement and a member of the CNA Military Advisory Board; Chairman of the charity J Street Cup Golf; Trustee of Fairhaven United Methodist Church; and Director of other various non-profit organizations. | |
Kathleen A. Dennis (63)
c/o Perkins Coie LLP
Counsel to the Independent Directors
30 Rockefeller Plaza
New York, NY 10112 | | Director | | Since
August
2006 | | President, Cedarwood Associates (mutual fund and investment management consulting) (since July 2006); Chairperson of the Liquidity and Alternatives Sub-Committee of the Investment Committee (since October 2006) and Director or Trustee of various Morgan Stanley Funds (since August 2006); formerly, Senior Managing Director of Victory Capital Management (1993-2006). | | | 91 | | | Director of various non-profit organizations. | |
Nancy C. Everett (61)
c/o Perkins Coie LLP
Counsel to the Independent Directors
30 Rockefeller Plaza
New York, NY 10112 | | Director | | Since
January
2015 | | Chief Executive Officer, Virginia Commonwealth University Investment Company (since November 2015); Owner, OBIR, LLC (institutional investment management consulting) (since June 2014); formerly, Managing Director, BlackRock Inc. (February 2011-December 2013); and Chief Executive Officer, General Motors Asset Management (a/k/a Promark Global Advisors, Inc.) (June 2005-May 2010). | | | 91 | | | Member of Virginia Commonwealth University School of Business Foundation; formerly, Member of Virginia Commonwealth University Board of Visitors (2013-2015); Member of Committee on Directors for Emerging Markets Growth Fund, Inc. (2007-2010); Chairperson of Performance Equity Management, LLC (2006-2010); and Chairperson, GMAM Absolute Return Strategies Fund, LLC (2006-2010). | |
32
Morgan Stanley Institutional Fund, Inc.
Annual Report — December 31, 2016
Director and Officer Information (unaudited) (cont'd)
Independent Directors: (cont'd)
Name, Age and Address of
Independent Director | | Position(s)
Held with
Registrant | | Length of Time
Served* | | Principal Occupation(s) During Past 5 Years
and Other Relevant Professional Experience | | Number of
Overseen by
Independent
Director** | | Portfolios in
Fund Complex
Other Directorships
Held by Independent
Director*** | |
Jakki L. Haussler (59)
c/o Perkins Coie LLP
Counsel to the Independent Directors
30 Rockefeller Plaza
New York, NY 10112 | | Director | | Since
January
2015 | | Chairman and Chief Executive Officer, Opus Capital Group (since January 1996); formerly, Director, Capvest Venture Fund, LP (May 2000-December 2011); Partner, Adena Ventures, LP (July 1999-December 2010); Director, The Victory Funds (February 2005-July 2008). | | | 91 | | | Director of Cincinnati Bell Inc. and Member, Audit Committee and Compensation Committee; Director of Northern Kentucky University Foundation and Member, Investment Committee; Member of Chase College of Law Transactional Law Practice Center Board of Advisors; Director of Best Transport; Director of Chase College of Law Board of Visitors; formerly, Member, University of Cincinnati Foundation Investment Committee; Member, Miami University Board of Visitors (2008-2011); Trustee of Victory Funds (2005-2008) and Chairman, Investment Committee (2007-2008) and Member, Service Provider Committee (2005-2008). | |
Dr. Manuel H. Johnson (67)
c/o Johnson Smick
International, Inc.
220 I Street, N.E. — Suite 200
Washington, D.C. 20002 | | Director | | Since
July
1991 | | Senior Partner, Johnson Smick International, Inc. (consulting firm); Chairperson of the Investment Committee (since October 2006) and Director or Trustee of various Morgan Stanley Funds (since July 1991); Co-Chairman and a founder of the Group of Seven Council (G7C) (international economic commission); formerly, Chairperson of the Audit Committee (July 1991-September 2006), Vice Chairman of the Board of Governors of the Federal Reserve System and Assistant Secretary of the U.S. Treasury. | | | 91 | | | Director of NVR, Inc. (home construction). | |
Joseph J. Kearns (74)
c/o Kearns & Associates LLC
46 E Peninsula Center #385
Rolling Hills Estates, CA 90274-3712 | | Director | | Since
August
1994 | | President, Kearns & Associates LLC (investment consulting); Chairperson of the Audit Committee (since October 2006) and Director or Trustee of various Morgan Stanley Funds (since August 1994); formerly, Deputy Chairperson of the Audit Committee (July 2003-September 2006) and Chairperson of the Audit Committee of various Morgan Stanley Funds (since August 1994); CFO of the J. Paul Getty Trust. | | | 93 | | | Director of Electro Rent Corporation (equipment leasing). Prior to December 31, 2013, Director of The Ford Family Foundation. | |
33
Morgan Stanley Institutional Fund, Inc.
Annual Report — December 31, 2016
Director and Officer Information (unaudited) (cont'd)
Independent Directors: (cont'd)
Name, Age and Address of
Independent Director | | Position(s)
Held with
Registrant | | Length of Time
Served* | | Principal Occupation(s) During Past 5 Years
and Other Relevant Professional Experience | | Number of
Overseen by
Independent
Director** | | Portfolios in
Fund Complex
Other Directorships
Held by Independent
Director*** | |
Michael F. Klein (58)
c/o Perkins Coie LLP
Counsel to the Independent Directors
30 Rockefeller Plaza
New York, NY 10112 | | Director | | Since
August
2006 | | Managing Director, Aetos Capital, LLC (since March 2000); Co-President, Aetos Alternatives Management, LLC (since January 2004) and Co-Chief Executive Officer of Aetos Capital LLC (since August 2013); Chairperson of the Fixed Income Sub-Committee of the Investment Committee (since October 2006) and Director or Trustee of various Morgan Stanley Funds (since August 2006); formerly, Managing Director, Morgan Stanley & Co. Inc. and Morgan Stanley Dean Witter Investment Management, President, various Morgan Stanley Funds (June 1998-March 2000) and Principal, Morgan Stanley & Co. Inc. and Morgan Stanley Dean Witter Investment Management (August 1997-December 1999). | | | 90 | | | Director of certain investment funds managed or sponsored by Aetos Capital, LLC; Director of Sanitized AG and Sanitized Marketing AG (specialty chemicals). | |
Patricia Maleski (56)
c/o Perkins Coie LLP
Counsel to the Independent Directors
30 Rockefeller Plaza
New York, NY 10112 | | Director | | Since
January
2017 | | Management Director, JPMorgan Asset Management (2013-2016); President, JPMorgan Funds (2010-2013), Chief Administrative Officer, JPMorgan Funds (2004-2010), Treasurer, JPMorgan Funds (2003-2004, 2008-2010), and Vice President and Board Liaison, JPMorgan Funds (2001-2004); Managing Director, J.P. Morgan Investment Management Inc. (2001-2013); Vice President of Finance, Pierpont Group (1996-2001); Vice President, Bank of New York (1995-1996); Senior Audit Manager, Price Waterhouse, LLP (1982-1995). | | | 91 | | | None. | |
Michael E. Nugent (80)
522 Fifth Avenue
New York, NY 10036 | | Chair of the Board and Director | | Chair of the Boards since July 2006 and Director since July 1991 | | Chair of the Boards of various Morgan Stanley Funds (since July 2006); Chairperson of the Closed-End Fund Committee (since June 2012) and Director or Trustee of various Morgan Stanley Funds (since July 1991); formerly, Chairperson of the Insurance Committee (until July 2006); General Partner, Triumph Capital, L.P. (private investment partnership) (1988-2013). | | | 92 | | | None. | |
W. Allen Reed (69)
c/o Perkins Coie LLP
Counsel to the Independent Directors
30 Rockefeller Plaza
New York, NY 10112 | | Director | | Since
August
2006 | | Chairperson of the Equity Sub-Committee of the Investment Committee (since October 2006) and Director or Trustee of various Morgan Stanley Funds (since August 2006); formerly, President and CEO of General Motors Asset Management; Chairman and Chief Executive Officer of the GM Trust Bank and Corporate Vice President of General Motors Corporation (August 1994-December 2005). | | | 91 | | | Director of Legg Mason, Inc.; formerly, Director of the Auburn University Foundation (2010-2015). | |
Fergus Reid (84)
c/o Joe Pietryka, Inc.
85 Charles Colman Blvd.
Pawling, NY 12564 | | Director | | Since
June
1992 | | Chairman, Joe Pietryka, Inc.; Chairperson of the Governance Committee and Director or Trustee of various Morgan Stanley Funds (since June 1992). | | | 92 | | | Formerly, Trustee and Director of certain investment companies in the JP Morgan Fund Complex managed by JP Morgan Investment Management Inc. (1987-2012). | |
* This is the earliest date the Director began serving the Morgan Stanley Funds. Each Director serves an indefinite term, until his or her successor is elected.
** The Fund Complex includes (as of December 31, 2016) all open-end and closed-end funds (including all of their portfolios) advised by Morgan Stanley Investment Management Inc. (the "Adviser") and any funds that have an adviser that is an affiliated person of the Adviser (including, but not limited to, Morgan Stanley AIP GP LP).
*** This includes any directorships at public companies and registered investment companies held by the Director at any time during the past five years.
34
Morgan Stanley Institutional Fund, Inc.
Annual Report — December 31, 2016
Director and Officer Information (unaudited) (cont'd)
Executive Officers:
Name, Age and Address of Executive Officer | | Position(s) Held
with
Registrant | | Length of Time
Served* | | Principal Occupation(s) During Past 5 Years | |
John H. Gernon (53)
522 Fifth Avenue
New York, NY 10036 | | President and Principal Executive Officer | | Since
September
2013 | | President and Principal Executive Officer of the Equity and Fixed Income Funds and the Morgan Stanley AIP Funds (since September 2013) and the Liquidity Funds and various money market funds (since May 2014) in the Fund Complex; Managing Director of the Adviser; Head of Product (since 2006). | |
Timothy J. Knierim (58)
522 Fifth Avenue
New York, NY 10036 | | Chief Compliance Officer | | Since
December
2016 | | Managing Director of the Adviser and various entities affiliated with the Adviser; Chief Compliance Officer of various Morgan Stanley Funds and the Adviser (since December 2016) and Chief Compliance Officer of Morgan Stanley AIP GP LP (since 2014). Formerly, Managing Director and Deputy Chief Compliance Officer of the Adviser (2014-2016); and formerly, Chief Compliance Officer of Prudential Investment Management, Inc. (2007-2014). | |
Francis J. Smith (51)
522 Fifth Avenue
New York, NY 10036 | | Treasurer and Principal Financial Officer | | Treasurer since July 2003 and Principal Financial Officer since September 2002 | | Managing Director of the Adviser and various entities affiliated with the Adviser; Treasurer (since July 2003) and Principal Financial Officer of various Morgan Stanley Funds (since September 2002). | |
Mary E. Mullin (49)
522 Fifth Avenue
New York, NY 10036 | | Secretary | | Since
June
1999 | | Executive Director of the Adviser; Secretary of various Morgan Stanley Funds (since June 1999). | |
* This is the earliest date the officer began serving the Morgan Stanley Funds. Each officer serves a one-year term, until his or her successor is elected and qualifies.
35
Morgan Stanley Institutional Fund, Inc.
Annual Report — December 31, 2016
Adviser and Administrator
Morgan Stanley Investment Management Inc.
522 Fifth Avenue
New York, New York 10036
Sub-Advisers
Morgan Stanley Investment Management Limited
25 Cabot Square, Canary Wharf
London, E14 4QA, England
Morgan Stanley Investment Management Company
23 Church Street
16-01 Capital Square, Singapore 049481
Distributor
Morgan Stanley Distribution, Inc.
522 Fifth Avenue
New York, New York 10036
Dividend Disbursing and Transfer Agent
Boston Financial Data Services, Inc.
2000 Crown Colony Drive
Quincy, Massachusetts 02169
Custodian
State Street Bank and Trust Company
One Lincoln Street
Boston, Massachusetts 02111
Legal Counsel
Dechert LLP
1095 Avenue of the Americas
New York, New York 10036
Counsel to the Independent Directors
Perkins Coie LLP
30 Rockefeller Plaza
New York, New York 10112
Independent Registered Public Accounting Firm
Ernst & Young LLP
200 Clarendon Street
Boston, Massachusetts 02116
Reporting to Shareholders
Each Morgan Stanley fund provides a complete schedule of portfolio holdings in its semi-annual and annual reports within 60 days of the end of the fund's second and fourth fiscal quarters. The semi-annual and annual reports are filed electronically with the Securities and Exchange Commission (SEC) on Form N-CSRS and Form N-CSR, respectively. Morgan Stanley also delivers the semi-annual and annual reports to fund shareholders and makes these reports available on its public website, www.morganstanley.com/im. Each Morgan Stanley fund also files a complete schedule of portfolio holdings with the SEC for the fund's first and third fiscal quarters on Form N-Q. Morgan Stanley does not deliver the reports for the first and third fiscal quarters to shareholders, nor are the reports posted to the Morgan Stanley public website. You may, however, obtain the Form N-Q filings (as well as the Form N-CSR and N-CSRS filings) by accessing the SEC's website, www.sec.gov. You may also review and copy them at the SEC's Public Reference Room in Washington, DC. Information on the operation of the SEC's Public Reference Room may be obtained by calling the SEC toll free at 1 (800) SEC-0330. You can also request copies of these materials, upon payment of a duplicating fee, by electronic request at the SEC's email address (publicinfo@sec.gov) or by writing the Public Reference Room of the SEC, 100 F Street, NE, Washington, DC 20549-0102.
Proxy Voting Policies and Procedures and Proxy Voting Record
You may obtain a copy of the Fund's Proxy Voting Policy and Procedures and information regarding how the Fund voted proxies relating to portfolio securities during the most recent twelve-month period ended June 30, without charge, upon request, by calling toll free 1 (800) 548-7786 or by visiting our website at www.morganstanley.com/im. This information is also available on the SEC's website at www.sec.gov.
This report is authorized for distribution only when preceded or accompanied by a prospectus or summary prospectus of the applicable Portfolio of Morgan Stanley Institutional Fund, Inc., which describes in detail the Portfolio's investment policies, risks, fees and expenses. Please read the prospectus carefully before you invest or send money. For additional information, including information regarding the investments comprising the Portfolio, please visit our website at www.morganstanley.com/im or call toll free 1 (800) 548-7786.
36
(This Page has been left blank intentionally.)
Printed in U.S.A.
This Report has been prepared for shareholders and may be distributed to others only if preceded or accompanied by a current prospectus.
Morgan Stanley Investment Management Inc.
522 Fifth Avenue
New York, New York 10036
© 2017 Morgan Stanley. Morgan Stanley Distribution, Inc.

IFISGIANN
1696400 EXP. 02.28.18

Morgan Stanley Institutional Fund, Inc.
Global Insight Portfolio
Annual Report
December 31, 2016

Morgan Stanley Institutional Fund, Inc.
Annual Report — December 31, 2016
Shareholders' Letter | | | 2 | | |
Expense Example | | | 3 | | |
Investment Overview | | | 4 | | |
Portfolio of Investments | | | 6 | | |
Statement of Assets and Liabilities | | | 8 | | |
Statement of Operations | | | 10 | | |
Statements of Changes in Net Assets | | | 11 | | |
Financial Highlights | | | 13 | | |
Notes to Financial Statements | | | 17 | | |
Report of Independent Registered Public Accounting Firm | | | 25 | | |
Federal Tax Notice | | | 26 | | |
Privacy Notice | | | 27 | | |
Director and Officer Information | | | 30 | | |
This report is authorized for distribution only when preceded or accompanied by a prospectus or summary prospectus of the applicable Portfolio of Morgan Stanley Institutional Fund, Inc. To receive a prospectus and/or statement of additional information (SAI), which contains more complete information such as investment objectives, charges, expenses, policies for voting proxies, risk considerations, and describes in detail each of the Portfolio's investment policies to the prospective investor, please call toll free 1 (800) 548-7786. Please read the prospectuses carefully before you invest or send money.
Additionally, you can access information about the Portfolio, including performance, characteristics, and investment team commentary, through Morgan Stanley Investment Management's website: www.morganstanley.com/im.
Market forecasts provided in this report may not necessarily come to pass. There is no guarantee that any sectors mentioned will continue to perform as discussed herein or that securities in such sectors will be held by the Portfolio in the future. There is no assurance that a Portfolio will achieve its investment objective. Portfolios are subject to market risk, which is the possibility that market values of securities owned by the Portfolio will decline and, therefore, the value of the Portfolio's shares may be less than what you paid for them. Accordingly, you can lose money investing in this Portfolio. Please see the prospectus for more complete information on investment risks.
1
Morgan Stanley Institutional Fund, Inc.
Annual Report — December 31, 2016
Shareholders' Letter (unaudited)
Dear Shareholders,
We are pleased to provide this Annual report, in which you will learn how your investment in Global Insight Portfolio (the "Portfolio") performed during the latest twelve-month period.
Morgan Stanley Investment Management is a client-centric, investor-led organization. Our global presence, intellectual capital, and breadth of products and services enable us to partner with investors to meet the evolving challenges of today's financial markets. We aim to deliver superior investment service and to empower our clients to make the informed decisions that help them reach their investment goals.
As always, we thank you for selecting Morgan Stanley Investment Management, and look forward to working with you in the months and years ahead.
Sincerely,

John H. Gernon
President and Principal Executive Officer
January 2017
2
Morgan Stanley Institutional Fund, Inc.
Annual Report — December 31, 2016
Expense Example (unaudited)
Global Insight Portfolio
As a shareholder of the Portfolio, you incur two types of costs: (1) transactional costs; and (2) ongoing costs, which may include advisory fees, administration fees, distribution and shareholder services fees and other Portfolio expenses. This example is intended to help you understand your ongoing costs (in dollars) of investing in the Portfolio and to compare these costs with the ongoing costs of investing in other mutual funds.
This example is based on an investment of $1,000 invested at the beginning of the six-month period ended December 31, 2016 and held for the entire six-month period.
Actual Expenses
The table below provides information about actual account values and actual expenses. You may use the information in this table, together with the amount you invested, to estimate the expenses that you paid over the period. Simply divide your account value by $1,000 (for example, an $8,600 account value divided by $1,000 = 8.6), then multiply the result by the number in the table under the heading entitled "Actual Expenses Paid During Period" to estimate the expenses you paid on your account during this period.
Hypothetical Example for Comparison Purposes
The table below provides information about hypothetical account values and hypothetical expenses based on the Portfolio's actual expense ratio and an assumed rate of return of 5% per year before expenses, which is not the Portfolio's actual return. The hypothetical account values and expenses may not be used to estimate the actual ending account balance or expenses you paid for the period. You may use this information to compare the ongoing costs of investing in the Portfolio and other funds. To do so, compare this 5% hypothetical example with the 5% hypothetical examples that appear in the shareholder reports of the other funds.
Please note that the expenses shown in the table are meant to highlight your ongoing costs only and do not reflect any transactional costs, such as sales charges (loads). Therefore, the information for each class in the table is useful in comparing ongoing costs only, and will not help you determine the relative total costs of owning different funds. In addition, if these transactional costs were included, your costs would have been higher.
| | | Beginning
Account
Value
7/1/16 | | Actual Ending
Account
Value
12/31/16 | | Hypothetical
Ending Account
Value | | Actual
Expenses
Paid
During
Period* | | Hypothetical
Expenses Paid
During Period* | | Net
Expense
Ratio
During
Period** | |
Global Insight Portfolio Class I | | $ | 1,000.00 | | | $ | 1,193.90 | | | $ | 1,018.40 | | | $ | 7.39 | | | $ | 6.80 | | | | 1.34 | %*** | |
Global Insight Portfolio Class A | | | 1,000.00 | | | | 1,191.90 | | | | 1,016.64 | | | | 9.31 | | | | 8.57 | | | | 1.69 | *** | |
Global Insight Portfolio Class L | | | 1,000.00 | | | | 1,189.60 | | | | 1,014.13 | | | | 12.05 | | | | 11.09 | | | | 2.19 | *** | |
Global Insight Portfolio Class C | | | 1,000.00 | | | | 1,188.40 | | | | 1,012.87 | | | | 13.42 | | | | 12.35 | | | | 2.44 | *** | |
* Expenses are calculated using each Portfolio Class' annualized net expense ratio (as disclosed), multiplied by the average account value over the period, and multiplied by 184/366 (to reflect the most recent one-half year period).
** Annualized.
*** Refer to Note F in the Notes to Financial Statements for discussion of prior period custodian out-of-pocket expenses that were reimbursed in the current period.
3
Morgan Stanley Institutional Fund, Inc.
Annual Report — December 31, 2016
Investment Overview (unaudited)
Global Insight Portfolio
The Portfolio seeks long-term capital appreciation.
Performance
For the year ended December 31, 2016, the Portfolio's Class I shares had a total return based on net asset value and reinvestment of distributions per share of 29.83%, net of fees. The Portfolio's Class I shares outperformed against the Portfolio's benchmark, the MSCI All Country World Index (the "Index"), which returned 7.86%. Please keep in mind that high double-digit returns are highly unusual and cannot be sustained.
Factors Affecting Performance
• Global equities rose 7.86% for the 12-month period, as measured by the Index. The Index was led by strong performance from the U.S. and emerging markets, while Japan and Europe lagged. Early in the year, worries about weak global growth and disinflation drove share prices lower. However, sentiment brightened as commodity prices bottomed, China's economy stabilized, the U.S. economy strengthened and global central banks remained accommodative. In the second half of the year, equity markets largely shrugged off the Brexit referendum's surprise outcome and the U.S., in particular, rallied strongly following the unexpected election of Donald Trump on anticipation of pro-growth, reflationary policy from the new administration.
• The long-term investment horizon and conviction-weighted investment approach embraced by the team since 1998 can result in periods of performance deviation from the benchmark and peers. In this reporting period, stock selection drove most of the Portfolio's relative outperformance. Sector allocation also contributed positively, to a lesser extent.
• The industrials sector was, by far, the largest contributor to relative performance, due to both stock selection and a significant overweight in the sector. In fact, six of the top 10 contributing holdings for the Portfolio overall came from the industrials sector. Moreover, five of these six industrials stocks were not represented in the Index.
• Stock selection in the consumer discretionary sector delivered strong relative gains, although the Portfolio's overweight allocation in the sector was somewhat detrimental to performance.
• The Portfolio's health care position outperformed, due to both favorable stock selection and a beneficial underweight allocation.
• The main detractor from relative performance was the energy sector. The Portfolio's underweight allocation to energy diminished relative returns, despite the strong stock selection within the sector.
• Stock selection in the consumer staples sector was modestly disadvantageous. However, the relative loss was more than offset by the benefit of the Portfolio's underweight allocation in the sector.
• In the information technology sector, the Portfolio's underweight allocation diminished relative performance, but the positive contribution from stock selection exceeded the sector allocation's negative impact.
Management Strategies
• There were no changes to our bottom-up investment process during the period. We seek to invest primarily in established and cyclical franchise companies that we believe have strong name recognition, sustainable competitive advantages, and ample growth prospects, and are trading at an attractive discount to future cash flow generation capacity or asset value. We typically favor companies with the ability to generate attractive free cash flow yields. We utilize a bottom-up stock selection process, seeking attractive investments on an individual company basis. Our emphasis is on secular growth, and as a result short-term market events are not as meaningful in the stock selection process.
4
Morgan Stanley Institutional Fund, Inc.
Annual Report — December 31, 2016
Investment Overview (unaudited) (cont'd)
Global Insight Portfolio

* Minimum Investment for Class I shares
** Commenced Operations on December 28, 2011.
In accordance with SEC regulations the Portfolio's performance shown assumes that all recurring fees (including management fees) were deducted and all dividends and distributions were reinvested. The performance of Class A, L and C shares will vary from the performance of Class I shares based upon their different inception dates and will be impacted by additional fees assessed to those classes.
Performance Compared to the MSCI All Country World Index(1) and the Lipper Global Small/Mid-Cap Funds Index(2)
| | | Period Ended December 31, 2016
Total Returns(3) | |
| | | | | Average Annual | |
| | | One
Year | | Five
Years | | Ten
Years | | Since
Inception(6) | |
Portfolio — Class I Shares
w/o sales charges(4) | | | 29.83 | % | | | 15.05 | % | | | — | | | | 15.19 | % | |
Portfolio — Class A Shares
w/o sales charges(4) | | | 29.34 | | | | 14.70 | | | | — | | | | 14.84 | | |
Portfolio — Class A Shares with
maximum 5.25% sales charges(4) | | | 22.54 | | | | 13.47 | | | | — | | | | 13.62 | | |
Portfolio — Class L Shares
w/o sales charges(4) | | | 28.70 | | | | 14.10 | | | | — | | | | 14.24 | | |
Portfolio — Class C Shares
w/o sales charges(5) | | | 28.49 | | | | — | | | | — | | | | 8.60 | | |
Portfolio — Class C Shares with
maximum 1.00% deferred
sales charges(5) | | | 27.49 | | | | — | | | | — | | | | 8.60 | | |
MSCI All Country World Index | | | 7.86 | | | | 9.36 | | | | — | | | | 9.60 | | |
Lipper Global Small/Mid-Cap
Funds Index | | | 8.93 | | | | 9.52 | | | | — | | | | 9.76 | | |
Performance data quoted represents past performance, which is no guarantee of future results, and current performance may be lower or higher than the figures shown. Performance assumes that all dividends and distributions, if any, were reinvested. For the most recent month-end performance figures, please visit www.morganstanley.com/im. Investment return and principal value will fluctuate so that Portfolio shares, when redeemed, may be worth more or less than their original cost. Total returns do not reflect the deduction of taxes that a shareholder would pay on Portfolio distributions or the redemption of Portfolio shares. Performance of share classes will vary due to difference in expenses.
(1) The MSCI All Country World Index (ACWI) is a free float-adjusted market capitalization weighted index designed to measure the equity market performance of developed and emerging markets. The term "free float" represents the portion of shares outstanding that are deemed to be available for purchase in the public equity markets by investors. The Index is unmanaged and its returns do not include any sales charges or fees. Such costs would lower performance. It is not possible to invest directly in an index.
(2) The Lipper Global Small/Mid-Cap Funds Index is an equally weighted performance index of the largest qualifying funds (based on net assets) in the Lipper Global Small/Mid-Cap Funds classification. The Index, which is adjusted for capital gains distributions and income dividends, is unmanaged and should not be considered an investment. There are currently 30 funds represented in this Index. As of the date of this report, the Portfolio is in the Lipper Global Small/Mid-Cap Funds classification.
(3) Total returns for the Portfolio reflect fees waived and expenses reimbursed, if applicable, by the Adviser. Without such waivers and reimbursements, total returns would have been lower.
(4) Commenced operations on December 28, 2011.
(5) Commenced offering on April 30, 2015.
(6) For comparative purposes, average annual since inception returns listed for the Indexes refer to the inception date of Class I of the Portfolio, not the inception of the Index.
5
Morgan Stanley Institutional Fund, Inc.
Annual Report — December 31, 2016
Portfolio of Investments
Global Insight Portfolio
| | | Shares | | Value
(000) | |
Common Stocks (95.8%) | |
Australia (0.8%) | |
Kathmandu Holdings Ltd. | | | 48,532 | | | $ | 66 | | |
Brazil (3.9%) | |
GAEC Educacao SA | | | 27,353 | | | | 114 | | |
JHSF Participacoes SA (a) | | | 82,266 | | | | 36 | | |
Porto Seguro SA | | | 21,039 | | | | 174 | | |
| | | | 324 | | |
Canada (0.9%) | |
Dominion Diamond Corp. | | | 8,308 | | | | 80 | | |
China (0.3%) | |
Jumei International Holding Ltd. ADR (a) | | | 5,231 | | | | 26 | | |
France (19.0%) | |
Christian Dior SE | | | 4,977 | | | | 1,044 | | |
Criteo SA ADR (a) | | | 3,962 | | | | 163 | | |
Edenred | | | 11,814 | | | | 234 | | |
Eurazeo SA | | | 2,571 | | | | 150 | | |
| | | | 1,591 | | |
Germany (3.3%) | |
ThyssenKrupp AG | | | 9,848 | | | | 235 | | |
windeln.de SE (a)(b)(c) | | | 1,673 | | | | 5 | | |
Zalando SE (a)(b) | | | 913 | | | | 35 | | |
| | | | 275 | | |
Hong Kong (0.8%) | |
L'Occitane International SA | | | 34,500 | | | | 65 | | |
Italy (1.6%) | |
Brunello Cucinelli SpA | | | 3,169 | | | | 68 | | |
Tamburi Investment Partners SpA | | | 16,675 | | | | 63 | | |
| | | | 131 | | |
Netherlands (3.6%) | |
Koninklijke Philips N.V. | | | 9,867 | | | | 301 | | |
Spain (2.6%) | |
Baron de Ley (a) | | | 438 | | | | 55 | | |
Mapfre SA | | | 53,368 | | | | 163 | | |
| | | | 218 | | |
Switzerland (1.8%) | |
Nestle SA (Registered) | | | 2,139 | | | | 154 | | |
United Kingdom (14.5%) | |
BBA Aviation PLC | | | 206,492 | | | | 721 | | |
Clarkson PLC | | | 4,318 | | | | 116 | | |
Howden Joinery Group PLC | | | 34,791 | | | | 165 | | |
IP Group PLC (a) | | | 14,056 | | | | 31 | | |
Just Eat PLC (a) | | | 8,553 | | | | 61 | | |
Whitbread PLC | | | 2,690 | | | | 125 | | |
| | | | 1,219 | | |
| | | Shares | | Value
(000) | |
United States (42.7%) | |
Ashland Global Holdings, Inc. | | | 2,223 | | | $ | 243 | | |
BWX Technologies, Inc. | | | 7,178 | | | | 285 | | |
Castlight Health, Inc., Class B (a) | | | 3,004 | | | | 15 | | |
Cosan Ltd., Class A | | | 17,717 | | | | 133 | | |
eBay, Inc. (a) | | | 8,150 | | | | 242 | | |
Harley-Davidson, Inc. | | | 6,335 | | | | 370 | | |
Intuitive Surgical, Inc. (a) | | | 426 | | | | 270 | | |
Joy Global, Inc. | | | 2,580 | | | | 72 | | |
Manitowoc Foodservice, Inc. (a) | | | 20,976 | | | | 406 | | |
Mosaic Co. (The) | | | 2,888 | | | | 85 | | |
RenaissanceRe Holdings Ltd. | | | 2,792 | | | | 380 | | |
Terex Corp. | | | 10,474 | | | | 330 | | |
Time Warner, Inc. | | | 4,030 | | | | 389 | | |
United Technologies Corp. | | | 3,267 | | | | 358 | | |
| | | | 3,578 | | |
Total Common Stocks (Cost $7,357) | | | 8,028 | | |
Participation Note (0.0%) | |
Italy (0.0%) | |
Tamburi Investment Partners SpA,
Equity Linked Notes, expires 6/30/20 (a)
(Cost $1) | | | 2,095 | | | | 1 | | |
Short-Term Investment (3.4%) | |
Investment Company (3.4%) | |
Morgan Stanley Institutional Liquidity
Funds — Treasury Securities Portfolio —
Institutional Class (See Note G)
(Cost $286) | | | 286,266 | | | | 286 | | |
Total Investments (99.2%) (Cost $7,644)
Including $5 of Securities Loaned (d) | | | 8,315 | | |
Other Assets in Excess of Liabilities (0.8%) | | | 69 | | |
Net Assets (100.0%) | | $ | 8,384 | | |
Country assignments and aggregations are based generally on third party vendor classifications and information, and may be different from the assignments and aggregations under the policies set forth in the Portfolio's prospectus and/or statement of additional information relating to geographic classifications.
(a) Non-income producing security.
(b) 144A security — Certain conditions for public sale may exist. Unless otherwise noted, these securities are deemed to be liquid.
(c) All or a portion of this security was on loan at December 31, 2016.
(d) At December 31, 2016, the aggregate cost for federal income tax purposes is approximately $7,735,000. The aggregate gross unrealized appreciation is approximately $650,000 and the aggregate gross unrealized depreciation is approximately $70,000, resulting in net unrealized appreciation of approximately $580,000.
ADR American Depositary Receipt.
The accompanying notes are an integral part of the financial statements.
6
Morgan Stanley Institutional Fund, Inc.
Annual Report — December 31, 2016
Portfolio of Investments (cont'd)
Global Insight Portfolio
Portfolio Composition
Classification | | Percentage of
Total Investments | |
Other** | | | 46.3 | % | |
Textiles, Apparel & Luxury Goods | | | 13.4 | | |
Machinery | | | 9.7 | | |
Transportation Infrastructure | | | 8.7 | | |
Insurance | | | 8.6 | | |
Aerospace & Defense | | | 7.7 | | |
Internet Software & Services | | | 5.6 | | |
Total Investments | | | 100.0 | % | |
** Industries and/or investment types representing less than 5% of total investments.
The accompanying notes are an integral part of the financial statements.
7
Morgan Stanley Institutional Fund, Inc.
Annual Report — December 31, 2016
Statement of Assets and Liabilities | | December 31, 2016
(000) | |
Assets: | |
Investments in Securities of Unaffiliated Issuers, at Value(1) (Cost $7,358) | | $ | 8,029 | | |
Investment in Security of Affiliated Issuer, at Value (Cost $286) | | | 286 | | |
Total Investments in Securities, at Value (Cost $7,644) | | | 8,315 | | |
Foreign Currency, at Value (Cost —@) | | | — | @ | |
Receivable for Portfolio Shares Sold | | | 79 | | |
Due from Adviser | | | 13 | | |
Dividends Receivable | | | 2 | | |
Tax Reclaim Receivable | | | 2 | | |
Receivable from Affiliate | | | — | @ | |
Other Assets | | | 33 | | |
Total Assets | | | 8,444 | | |
Liabilities: | |
Payable for Professional Fees | | | 43 | | |
Payable for Custodian Fees | | | 7 | | |
Payable for Transfer Agency Fees — Class I | | | — | @ | |
Payable for Transfer Agency Fees — Class A | | | 1 | | |
Payable for Transfer Agency Fees — Class L | | | — | @ | |
Payable for Transfer Agency Fees — Class C | | | — | @ | |
Bank Overdraft | | | 1 | | |
Payable for Administration Fees | | | 1 | | |
Payable for Shareholder Services Fees- Class A | | | — | @ | |
Payable for Distribution and Shareholder Services Fees — Class L | | | — | @ | |
Payable for Distribution and Shareholder Services Fees — Class C | | | — | @ | |
Payable for Sub Transfer Agency Fees — Class A | | | — | @ | |
Payable for Sub Transfer Agency Fees — Class L | | | — | @ | |
Other Liabilities | | | 7 | | |
Total Liabilities | | | 60 | | |
Net Assets | | $ | 8,384 | | |
Net Assets Consist Of: | |
Paid-in-Capital | | $ | 7,763 | | |
Distributions in Excess of Net Investment Income | | | (13 | ) | |
Distributions in Excess of Net Realized Gain | | | (37 | ) | |
Unrealized Appreciation (Depreciation) on: | |
Investments | | | 671 | | |
Foreign Currency Translations | | | (— | @) | |
Net Assets | | $ | 8,384 | | |
The accompanying notes are an integral part of the financial statements.
8
Morgan Stanley Institutional Fund, Inc.
Annual Report — December 31, 2016
Statement of Assets and Liabilities (cont'd) | | December 31, 2016
(000) | |
CLASS I: | |
Net Assets | | $ | 7,676 | | |
| Shares Outstanding $0.001 par value shares of beneficial interest (unlimited shares authorized) (not in 000's) | | | 595,654 | | |
Net Asset Value, Offering and Redemption Price Per Share | | $ | 12.89 | | |
CLASS A: | |
Net Assets | | $ | 535 | | |
| Shares Outstanding $0.001 par value shares of beneficial interest (unlimited shares authorized) (not in 000's) | | | 41,410 | | |
Net Asset Value, Redemption Price Per Share | | $ | 12.91 | | |
Maximum Sales Load | | | 5.25 | % | |
Maximum Sales Charge | | $ | 0.72 | | |
Maximum Offering Price Per Share | | $ | 13.63 | | |
CLASS L: | |
Net Assets | | $ | 72 | | |
| Shares Outstanding $0.001 par value shares of beneficial interest (unlimited shares authorized) (not in 000's) | | | 5,671 | | |
Net Asset Value, Offering and Redemption Price Per Share | | $ | 12.73 | | |
CLASS C: | |
Net Assets | | $ | 101 | | |
| Shares Outstanding $0.001 par value shares of beneficial interest (unlimited shares authorized) (not in 000's) | | | 8,006 | | |
Net Asset Value, Offering and Redemption Price Per Share | | $ | 12.67 | | |
(1) Including:
Securities on Loan, at Value: | | $ | 5 | | |
@ Amount is less than $500.
The accompanying notes are an integral part of the financial statements.
9
Morgan Stanley Institutional Fund, Inc.
Annual Report — December 31, 2016
Statement of Operations | | Year Ended
December 31, 2016
(000) | |
Investment Income: | |
Dividends from Securities of Unaffiliated Issuers (Net of $5 of Foreign Taxes Withheld) | | $ | 57 | | |
Dividends from Security of Affiliated Issuer (Note G) | | | — | @ | |
Income from Securities Loaned — Net | | | — | @ | |
Total Investment Income | | | 57 | | |
Expenses: | |
Professional Fees | | | 103 | | |
Registration Fees | | | 54 | | |
Advisory Fees (Note B) | | | 31 | | |
Shareholder Reporting Fees | | | 10 | | |
Custodian Fees (Note F) | | | 9 | | |
Transfer Agency Fees — Class I (Note E) | | | 2 | | |
Transfer Agency Fees — Class A (Note E) | | | 2 | | |
Transfer Agency Fees — Class L (Note E) | | | 2 | | |
Transfer Agency Fees — Class C (Note E) | | | 2 | | |
Pricing Fees | | | 6 | | |
Shareholder Services Fees — Class A (Note D) | | | 1 | | |
Distribution and Shareholder Services Fees — Class L (Note D) | | | — | @ | |
Distribution and Shareholder Services Fees — Class C (Note D) | | | 1 | | |
Administration Fees (Note C) | | | 2 | | |
Directors' Fees and Expenses | | | 2 | | |
Sub Transfer Agency Fees — Class I | | | — | @ | |
Sub Transfer Agency Fees — Class A | | | — | @ | |
Sub Transfer Agency Fees — Class L | | | — | @ | |
Sub Transfer Agency Fees — Class C | | | — | @ | |
Other Expenses | | | 15 | | |
Total Expenses | | | 242 | | |
Expenses Reimbursed by Adviser (Note B) | | | (131 | ) | |
Waiver of Advisory Fees (Note B) | | | (31 | ) | |
Reimbursement of Class Specific Expenses — Class I (Note B) | | | (2 | ) | |
Reimbursement of Class Specific Expenses — Class A (Note B) | | | (2 | ) | |
Reimbursement of Class Specific Expenses — Class L (Note B) | | | (2 | ) | |
Reimbursement of Class Specific Expenses — Class C (Note B) | | | (2 | ) | |
Rebate from Morgan Stanley Affiliate (Note G) | | | (— | @) | |
Reimbursement of Custodian Fees (Note F) | | | (29 | ) | |
Net Expenses | | | 43 | | |
Net Investment Income | | | 14 | | |
Realized Gain: | |
Investments Sold | | | 84 | | |
Foreign Currency Transactions | | | 4 | | |
Net Realized Gain | | | 88 | | |
Change in Unrealized Appreciation (Depreciation): | |
Investments | | | 842 | | |
Foreign Currency Translations | | | (— | @) | |
Net Change in Unrealized Appreciation (Depreciation) | | | 842 | | |
Net Realized Gain and Change in Unrealized Appreciation (Depreciation) | | | 930 | | |
Net Increase in Net Assets Resulting from Operations | | $ | 944 | | |
@ Amount is less than $500.
The accompanying notes are an integral part of the financial statements.
10
Morgan Stanley Institutional Fund, Inc.
Annual Report — December 31, 2016
Statements of Changes in Net Assets | | Year Ended
December 31, 2016
(000) | | Year Ended
December 31, 2015
(000) | |
Increase (Decrease) in Net Assets: | |
Operations: | |
Net Investment Income | | $ | 14 | | | $ | 10 | | |
Net Realized Gain | | | 88 | | | | 93 | | |
Net Change in Unrealized Appreciation (Depreciation) | | | 842 | | | | (219 | ) | |
Net Increase (Decrease) in Net Assets Resulting from Operations | | | 944 | | | | (116 | ) | |
Distributions from and/or in Excess of: | |
Class I: | |
Net Investment Income | | | (17 | ) | | | (27 | ) | |
Net Realized Gain | | | (85 | ) | | | (107 | ) | |
Class A: | |
Net Investment Income | | | — | | | | (4 | ) | |
Net Realized Gain | | | (6 | ) | | | (23 | ) | |
Class L: | |
Net Investment Income | | | — | | | | (— | @) | |
Net Realized Gain | | | (1 | ) | | | (2 | ) | |
Class C: | |
Net Investment Income | | | — | | | | (— | @) | |
Net Realized Gain | | | (1 | ) | | | (1 | ) | |
Total Distributions | | | (110 | ) | | | (164 | ) | |
Capital Share Transactions:(1) | |
Class I: | |
Subscribed | | | 5,646 | | | | 170 | | |
Distributions Reinvested | | | 102 | | | | 131 | | |
Redeemed | | | (308 | ) | | | (13 | ) | |
Class A: | |
Subscribed | | | 958 | | | | 187 | | |
Distributions Reinvested | | | 6 | | | | 27 | | |
Redeemed | | | (901 | ) | | | (24 | ) | |
Class L: | |
Subscribed | | | 23 | | | | 63 | | |
Distributions Reinvested | | | 1 | | | | 1 | | |
Redeemed | | | (48 | ) | | | — | | |
Class C: | |
Subscribed | | | 225 | | | | 19 | * | |
Distributions Reinvested | | | 1 | | | | 1 | * | |
Redeemed | | | (152 | ) | | | — | | |
Net Increase in Net Assets Resulting from Capital Share Transactions | | | 5,553 | | | | 562 | | |
Total Increase in Net Assets | | | 6,387 | | | | 282 | | |
Net Assets: | |
Beginning of Period | | | 1,997 | | | | 1,715 | | |
End of Period (Including Distributions in Excess of Net Investment Income of $(13) and $(21)) | | $ | 8,384 | | | $ | 1,997 | | |
The accompanying notes are an integral part of the financial statements.
11
Morgan Stanley Institutional Fund, Inc.
Annual Report — December 31, 2016
Statements of Changes in Net Assets (cont'd) | | Year Ended
December 31, 2016
(000) | | Year Ended
December 31, 2015
(000) | |
(1) Capital Share Transactions: | |
Class I: | |
Shares Subscribed | | | 457 | | | | 14 | | |
Shares Issued on Distributions Reinvested | | | 8 | | | | 13 | | |
Shares Redeemed | | | (24 | ) | | | (1 | ) | |
Net Increase in Class I Shares Outstanding | | | 441 | | | | 26 | | |
Class A: | |
Shares Subscribed | | | 85 | | | | 15 | | |
Shares Issued on Distributions Reinvested | | | 1 | | | | 3 | | |
Shares Redeemed | | | (78 | ) | | | (2 | ) | |
Net Increase in Class A Shares Outstanding | | | 8 | | | | 16 | | |
Class L: | |
Shares Subscribed | | | 2 | | | | 6 | | |
Shares Issued on Distributions Reinvested | | | — | @@ | | | — | @@ | |
Shares Redeemed | | | (5 | ) | | | — | | |
Net Increase (Decrease) in Class L Shares Outstanding | | | (3 | ) | | | 6 | | |
Class C: | |
Shares Subscribed | | | 19 | | | | 2 | * | |
Shares Issued on Distributions Reinvested | | | — | @@ | | | — | @@* | |
Shares Redeemed | | | (13 | ) | | | — | | |
Net Increase in Class C Shares Outstanding | | | 6 | | | | 2 | | |
@ Amount is less than $500.
@@ Amount is less than 500 shares.
* For the period April 30, 2015 through December 31, 2015.
The accompanying notes are an integral part of the financial statements.
12
Morgan Stanley Institutional Fund, Inc.
Annual Report — December 31, 2016
Financial Highlights
Global Insight Portfolio
| | | Class I | |
| | | Year Ended December 31, | |
Selected Per Share Data and Ratios | | 2016(1) | | 2015 | | 2014 | | 2013 | | 2012 | |
Net Asset Value, Beginning of Period | | $ | 10.07 | | | $ | 11.55 | | | $ | 13.42 | | | $ | 11.99 | | | $ | 10.07 | | |
Income (Loss) from Investment Operations: | |
Net Investment Income (2) | | | 0.06 | | | | 0.07 | | | | 0.20 | | | | 0.30 | | | | 0.31 | | |
Net Realized and Unrealized Gain (Loss) | | | 2.94 | | | | (0.62 | ) | | | (0.56 | ) | | | 3.32 | | | | 2.53 | | |
Total from Investment Operations | | | 3.00 | | | | (0.55 | ) | | | (0.36 | ) | | | 3.62 | | | | 2.84 | | |
Distributions from and/or in Excess of: | |
Net Investment Income | | | (0.03 | ) | | | (0.18 | ) | | | (0.11 | ) | | | (0.45 | ) | | | (0.49 | ) | |
Net Realized Gain | | | (0.15 | ) | | | (0.75 | ) | | | (1.40 | ) | | | (1.74 | ) | | | (0.43 | ) | |
Total Distributions | | | (0.18 | ) | | | (0.93 | ) | | | (1.51 | ) | | | (2.19 | ) | | | (0.92 | ) | |
Net Asset Value, End of Period | | $ | 12.89 | | | $ | 10.07 | | | $ | 11.55 | | | $ | 13.42 | | | $ | 11.99 | | |
Total Return (3) | | | 29.83 | % | | | (5.02 | )% | | | (2.65 | )% | | | 30.89 | % | | | 28.31 | % | |
Ratios and Supplemental Data: | |
Net Assets, End of Period (Thousands) | | $ | 7,676 | | | $ | 1,560 | | | $ | 1,490 | | | $ | 1,397 | | | $ | 12 | | |
Ratio of Expenses to Average Net Assets (6) | | | 1.34 | %(4) | | | 1.35 | %(4) | | | 1.35 | %(4) | | | 1.35 | %(4) | | | 1.35 | %(4) | |
Ratio of Net Investment Income to Average Net Assets (6) | | | 0.56 | %(4) | | | 0.58 | %(4) | | | 1.49 | %(4) | | | 2.17 | %(4) | | | 2.74 | %(4) | |
Ratio of Rebate from Morgan Stanley Affiliates to Average Net Assets | | | 0.01 | % | | | 0.00 | %(5) | | | 0.00 | %(5) | | | 0.00 | %(5) | | | 0.00 | %(5) | |
Portfolio Turnover Rate | | | 54 | % | | | 62 | % | | | 67 | % | | | 59 | % | | | 41 | % | |
(6) Supplemental Information on the Ratios to Average Net Assets: | |
Ratios Before Expense Limitation: | |
Expenses to Average Net Assets | | | 7.58 | % | | | 10.84 | % | | | 10.82 | % | | | 14.22 | % | | | 16.10 | % | |
Net Investment Loss to Average Net Assets | | | (5.68 | )% | | | (8.91 | )% | | | (7.98 | )% | | | (10.70 | )% | | | (12.01 | )% | |
(1) Refer to Note F in the Notes to Financial Statements for discussion of prior period custodian out-of-pocket expenses that were reimbursed in the current period. The amount of the reimbursement was immaterial on a per share basis and did not impact the total return of Class I shares. The Ratio of Expenses to Average Net Assets and the Ratio of Net Investment Income to Average Net Assets would be unchanged as the reimbursement of custodian fees was offset against current period expense waivers/reimbursements with no impact to net expenses or net investment income.
(2) Per share amount is based on average shares outstanding.
(3) Calculated based on the net asset value as of the last business day of the period.
(4) The Ratios of Expenses and Net Investment Income reflect the rebate of certain Portfolio expenses in connection with the investments in Morgan Stanley affiliates during the period. The effect of the rebate on the ratios is disclosed in the above table as "Ratio of Rebate from Morgan Stanley Affiliates to Average Net Assets."
(5) Amount is less than 0.005%.
The accompanying notes are an integral part of the financial statements.
13
Morgan Stanley Institutional Fund, Inc.
Annual Report — December 31, 2016
Financial Highlights
Global Insight Portfolio
| | | Class A | |
| | | Year Ended December 31, | |
Selected Per Share Data and Ratios | | 2016(1) | | 2015 | | 2014 | | 2013 | | 2012 | |
Net Asset Value, Beginning of Period | | $ | 10.10 | | | $ | 11.58 | | | $ | 13.45 | | | $ | 11.99 | | | $ | 10.07 | | |
Income (Loss) from Investment Operations: | |
Net Investment Income (Loss) (2) | | | (0.01 | ) | | | 0.02 | | | | 0.15 | | | | 0.01 | | | | 0.28 | | |
Net Realized and Unrealized Gain (Loss) | | | 2.97 | | | | (0.61 | ) | | | (0.55 | ) | | | 3.56 | | | | 2.53 | | |
Total from Investment Operations | | | 2.96 | | | | (0.59 | ) | | | (0.40 | ) | | | 3.57 | | | | 2.81 | | |
Distributions from and/or in Excess of: | |
Net Investment Income | | | — | | | | (0.14 | ) | | | (0.07 | ) | | | (0.37 | ) | | | (0.46 | ) | |
Net Realized Gain | | | (0.15 | ) | | | (0.75 | ) | | | (1.40 | ) | | | (1.74 | ) | | | (0.43 | ) | |
Total Distributions | | | (0.15 | ) | | | (0.89 | ) | | | (1.47 | ) | | | (2.11 | ) | | | (0.89 | ) | |
Net Asset Value, End of Period | | $ | 12.91 | | | $ | 10.10 | | | $ | 11.58 | | | $ | 13.45 | | | $ | 11.99 | | |
Total Return (3) | | | 29.34 | % | | | (5.32 | )% | | | (2.97 | )% | | | 30.52 | % | | | 28.04 | % | |
Ratios and Supplemental Data: | |
Net Assets, End of Period (Thousands) | | $ | 535 | | | $ | 335 | | | $ | 199 | | | $ | 189 | | | $ | 1,151 | | |
Ratio of Expenses to Average Net Assets (7) | | | 1.69 | %(4) | | | 1.70 | %(4) | | | 1.70 | %(4) | | | 1.60 | %(4)(5) | | | 1.60 | %(4) | |
Ratio of Net Investment Income (Loss) to Average Net Assets (7) | | | (0.05 | )%(4) | | | 0.17 | %(4) | | | 1.14 | %(4) | | | 0.07 | %(4) | | | 2.49 | %(4) | |
Ratio of Rebate from Morgan Stanley Affiliates to Average Net Assets | | | 0.01 | % | | | 0.00 | %(6) | | | 0.00 | %(6) | | | 0.01 | % | | | 0.00 | %(6) | |
Portfolio Turnover Rate | | | 54 | % | | | 62 | % | | | 67 | % | | | 59 | % | | | 41 | % | |
(7) Supplemental Information on the Ratios to Average Net Assets: | |
Ratios Before Expense Limitation: | |
Expenses to Average Net Assets | | | 8.39 | % | | | 11.74 | % | | | 12.14 | % | | | 13.62 | % | | | 16.35 | % | |
Net Investment Loss to Average Net Assets | | | (6.75 | )% | | | (9.87 | )% | | | (9.30 | )% | | | (11.95 | )% | | | (12.26 | )% | |
(1) Refer to Note F in the Notes to Financial Statements for discussion of prior period custodian out-of-pocket expenses that were reimbursed in the current period. The amount of the reimbursement was immaterial on a per share basis and did not impact the total return of Class A shares. The Ratio of Expenses to Average Net Assets and the Ratio of Net Investment Loss to Average Net Assets would be unchanged as the reimbursement of custodian fees was offset against current period expense waivers/reimbursements with no impact to net expenses or net investment loss.
(2) Per share amount is based on average shares outstanding.
(3) Calculated based on the net asset value which does not reflect sales charges, if applicable, as of the last business day of the period.
(4) The Ratios of Expenses and Net Investment Income (Loss) reflect the rebate of certain Portfolio expenses in connection with the investments in Morgan Stanley affiliates during the period. The effect of the rebate on the ratios is disclosed in the above table as "Ratio of Rebate from Morgan Stanley Affiliates to Average Net Assets."
(5) Effective September 16, 2013, the Adviser has agreed to limit the ratio of expenses to average net assets to the maximum ratio of 1.70% for Class A shares. Prior to September 16, 2013, the maximum ratio was 1.60% for Class A shares.
(6) Amount is less than 0.005%.
The accompanying notes are an integral part of the financial statements.
14
Morgan Stanley Institutional Fund, Inc.
Annual Report — December 31, 2016
Financial Highlights
Global Insight Portfolio
| | | Class L | |
| | | Year Ended December 31, | |
Selected Per Share Data and Ratios | | 2016(1) | | 2015 | | 2014 | | 2013 | | 2012 | |
Net Asset Value, Beginning of Period | | $ | 10.01 | | | $ | 11.49 | | | $ | 13.39 | | | $ | 11.98 | | | $ | 10.07 | | |
Income (Loss) from Investment Operations: | |
Net Investment Income (Loss) (2) | | | (0.05 | ) | | | (0.03 | ) | | | 0.08 | | | | 0.12 | | | | 0.23 | | |
Net Realized and Unrealized Gain (Loss) | | | 2.92 | | | | (0.61 | ) | | | (0.54 | ) | | | 3.37 | | | | 2.51 | | |
Total from Investment Operations | | | 2.87 | | | | (0.64 | ) | | | (0.46 | ) | | | 3.49 | | | | 2.74 | | |
Distributions from and/or in Excess of: | |
Net Investment Income | | | — | | | | (0.09 | ) | | | (0.04 | ) | | | (0.34 | ) | | | (0.40 | ) | |
Net Realized Gain | | | (0.15 | ) | | | (0.75 | ) | | | (1.40 | ) | | | (1.74 | ) | | | (0.43 | ) | |
Total Distributions | | | (0.15 | ) | | | (0.84 | ) | | | (1.44 | ) | | | (2.08 | ) | | | (0.83 | ) | |
Net Asset Value, End of Period | | $ | 12.73 | | | $ | 10.01 | | | $ | 11.49 | | | $ | 13.39 | | | $ | 11.98 | | |
Total Return (3) | | | 28.70 | % | | | (5.87 | )% | | | (3.43 | )% | | | 29.82 | % | | | 27.36 | % | |
Ratios and Supplemental Data: | |
Net Assets, End of Period (Thousands) | | $ | 72 | | | $ | 86 | | | $ | 26 | | | $ | 13 | | | $ | 12 | | |
Ratio of Expenses to Average Net Assets (7) | | | 2.19 | %(4) | | | 2.20 | %(4) | | | 2.20 | %(4) | | | 2.13 | %(4),(5) | | | 2.10 | %(4) | |
Ratio of Net Investment Income (Loss) to Average Net Assets (7) | | | (0.43 | )%(4) | | | (0.26 | )%(4) | | | 0.64 | %(4) | | | 0.93 | %(4) | | | 1.99 | %(4) | |
Ratio of Rebate from Morgan Stanley Affiliates to Average Net Assets | | | 0.01 | % | | | 0.00 | %(6) | | | 0.00 | %(6) | | | 0.00 | %(6) | | | 0.00 | %(6) | |
Portfolio Turnover Rate | | | 54 | % | | | 62 | % | | | 67 | % | | | 59 | % | | | 41 | % | |
(7) Supplemental Information on the Ratios to Average Net Assets: | |
Ratios Before Expense Limitation: | |
Expenses to Average Net Assets | | | 11.57 | % | | | 17.24 | % | | | 20.95 | % | | | 17.73 | % | | | 16.85 | % | |
Net Investment Loss to Average Net Assets | | | (9.81 | )% | | | (15.30 | )% | | | (18.11 | )% | | | (14.67 | )% | | | (12.76 | )% | |
(1) Refer to Note F in the Notes to Financial Statements for discussion of prior period custodian out-of-pocket expenses that were reimbursed in the current period. The amount of the reimbursement was immaterial on a per share basis and did not impact the total return of Class L shares. The Ratio of Expenses to Average Net Assets and the Ratio of Net Investment Loss to Average Net Assets would be unchanged as the reimbursement of custodian fees was offset against current period expense waivers/reimbursements with no impact to net expenses or net investment loss.
(2) Per share amount is based on average shares outstanding.
(3) Calculated based on the net asset value as of the last business day of the period.
(4) The Ratios of Expenses and Net Investment Income (Loss) reflect the rebate of certain Portfolio expenses in connection with the investments in Morgan Stanley affiliates during the period. The effect of the rebate on the ratios is disclosed in the above table as "Ratio of Rebate from Morgan Stanley Affiliates to Average Net Assets."
(5) Effective September 16, 2013, the Adviser has agreed to limit the ratio of expenses to average net assets to the maximum ratio of 2.20% for Class L shares. Prior to September 16, 2013, the maximum ratio was 2.10% for Class L shares.
(6) Amount is less than 0.005%.
The accompanying notes are an integral part of the financial statements.
15
Morgan Stanley Institutional Fund, Inc.
Annual Report — December 31, 2016
Financial Highlights
Global Insight Portfolio
| | | Class C | |
Selected Per Share Data and Ratios | | Year Ended
December 31, 2016(1) | | Period from
April 30, 2015(2) to
December 31, 2015 | |
Net Asset Value, Beginning of Period | | $ | 9.99 | | | $ | 12.10 | | |
Income (Loss) from Investment Operations: | |
Net Investment Loss (3) | | | (0.11 | ) | | | (0.07 | ) | |
Net Realized and Unrealized Gain (Loss) | | | 2.94 | | | | (1.19 | ) | |
Total from Investment Operations | | | 2.83 | | | | (1.26 | ) | |
Distributions from and/or in Excess of: | |
Net Investment Income | | | — | | | | (0.10 | ) | |
Net Realized Gain | | | (0.15 | ) | | | (0.75 | ) | |
Total Distributions | | | (0.15 | ) | | | (0.85 | ) | |
Net Asset Value, End of Period | | $ | 12.67 | | | $ | 9.99 | | |
Total Return (4) | | | 28.49 | % | | | (10.67 | )%(7) | |
Ratios and Supplemental Data: | |
Net Assets, End of Period (Thousands) | | $ | 101 | | | $ | 16 | | |
Ratio of Expenses to Average Net Assets (9) | | | 2.44 | %(5) | | | 2.45 | %(5)(8) | |
Ratio of Net Investment Loss to Average Net Assets (9) | | | (0.89 | )%(5) | | | (0.94 | )%(5)(8) | |
Ratio of Rebate from Morgan Stanley Affiliates to Average Net Assets | | | 0.01 | % | | | 0.00 | %(6)(8) | |
Portfolio Turnover Rate | | | 54 | % | | | 62 | % | |
(9) Supplemental Information on the Ratios to Average Net Assets: | |
Ratios Before Expense Limitation: | |
Expense to Average Net Assets | | | 12.17 | % | | | 23.24 | %(8) | |
Net Investment Loss to Average Net Assets | | | (10.62 | )% | | | (21.73 | )%(8) | |
(1) Refer to Note F in the Notes to Financial Statements for discussion of prior period custodian out-of-pocket expenses that were reimbursed in the current period. The amount of the reimbursement was immaterial on a per share basis and did not impact the total return of Class C shares. The Ratio of Expenses to Average Net Assets and the Ratio of Net Investment Loss to Average Net Assets would be unchanged as the reimbursement of custodian fees was offset against current period expense waivers/reimbursements with no impact to net expenses or net investment loss.
(2) Commencement of Offering.
(3) Per share amount is based on average shares outstanding.
(4) Calculated based on the net asset value which does not reflect sales charges, if applicable, as of the last business day of the period.
(5) The Ratios of Expenses and Net Investment Loss reflect the rebate of certain Portfolio expenses in connection with the investments in Morgan Stanley affiliates during the period. The effect of the rebate on the ratios is disclosed in the above table as "Ratio of Rebate from Morgan Stanley Affiliates to Average Net Assets."
(6) Amount is less than 0.005%.
(7) Not Annualized.
(8) Annualized.
The accompanying notes are an integral part of the financial statements.
16
Morgan Stanley Institutional Fund, Inc.
Annual Report — December 31, 2016
Notes to Financial Statements
Morgan Stanley Institutional Fund, Inc. (the "Fund") is registered under the Investment Company Act of 1940, as amended (the "Act"), as an open-end management investment company. The Fund is comprised of twenty-nine separate, active, diversified and non-diversified portfolios (individually referred to as a "Portfolio", collectively as the "Portfolios"). The Fund applies investment company accounting and reporting guidance.
The accompanying financial statements relate to the Global Insight Portfolio. The Portfolio seeks long-term capital appreciation.
The Portfolio offers four classes of shares — Class I, Class A, Class L and Class C. On April 30, 2015, the Portfolio suspended offering of Class L shares. Existing Class L shareholders may invest through reinvestment of dividends and distributions.
A. Significant Accounting Policies: The following significant accounting policies are in conformity with U.S. generally accepted accounting principles ("GAAP"). Such policies are consistently followed by the Fund in the preparation of its financial statements. GAAP may require management to make estimates and assumptions that affect the reported amounts and disclosures in the financial statements. Actual results may differ from those estimates.
1. Security Valuation: (1) An equity portfolio security listed or traded on an exchange is valued at its latest reported sales price (or at the exchange official closing price if such exchange reports an official closing price), and if there were no sales on a given day and if there is no official exchange closing price for that day, the security is valued at the mean between the last reported bid and asked prices if such bid and asked prices are available on the relevant exchanges; (2) all other equity portfolio securities for which over-the-counter ("OTC") market quotations are readily available are valued at the latest reported sales price (or at the market official closing price if such market reports an official closing price), and if there was no trading in the security on a given day and if there is no official closing price from relevant markets for that day, the security is valued at the mean between the last reported bid and asked prices if such bid and asked prices are available on the relevant markets. Listed equity securities not traded on the valuation date with no reported bid and asked prices available on the exchange are valued at the mean between the current bid and asked prices obtained from one or more reputable brokers or
dealers. An unlisted equity security that does not trade on the valuation date and for which bid and asked prices from the relevant markets are unavailable is valued at the mean between the current bid and asked prices obtained from one or more reputable brokers or dealers. In cases where a security is traded on more than one exchange, the security is valued on the exchange designated as the primary market; (3) certain portfolio securities may be valued by an outside pricing service/vendor approved by the Fund's Board of Directors (the "Directors"). The pricing service/vendor may employ a pricing model that takes into account, among other things, bids, yield spreads, and/or other market data and specific security characteristics. Alternatively, if a valuation is not available from an outside pricing service/vendor, and the security trades on an exchange, the security may be valued at its latest reported sale price (or at the exchange official closing price if such exchange reports an official closing price), prior to the time when assets are valued. If there are no sales on a given day and if there is no official exchange closing price for that day, the security is valued at the mean between the last reported bid and asked prices if such bid and asked prices are available in the relevant exchanges; (4) when market quotations are not readily available, including circumstances under which Morgan Stanley Investment Management Inc. (the "Adviser") determines that the closing price, last sale price or the mean between the last reported bid and asked prices are not reflective of a security's market value, portfolio securities are valued at their fair value as determined in good faith under procedures established by and under the general supervision of the Directors. Occasionally, developments affecting the closing prices of securities and other assets may occur between the times at which valuations of such securities are determined (that is, close of the foreign market on which the securities trade) and the close of business of the New York Stock Exchange ("NYSE"). If developments occur during such periods that are expected to materially affect the value of such securities, such valuations may be adjusted to reflect the estimated fair value of such securities as of the close of the NYSE, as determined in good faith by the Directors or by the Adviser using a pricing service and/or procedures approved by the Directors; (5) quotations of foreign portfolio securities, other assets and liabilities and forward contracts stated in foreign currency are translated into U.S. dollar equivalents at the prevailing market rates prior to the close of the NYSE; and (6) investments in
17
Morgan Stanley Institutional Fund, Inc.
Annual Report — December 31, 2016
Notes to Financial Statements (cont'd)
mutual funds, including the Morgan Stanley Institutional Liquidity Funds, are valued at the net asset value ("NAV") as of the close of each business day.
The Directors have responsibility for determining in good faith the fair value of the investments, and the Directors may appoint others, such as the Fund's Adviser or a valuation committee, to assist the Directors in determining fair value and to make the actual calculations pursuant to the fair valuation methodologies previously approved by the Directors. Under procedures approved by the Directors, the Fund's Adviser has formed a Valuation Committee whose members are approved by the Directors. The Valuation Committee provides administration and oversight of the Fund's valuation policies and procedures, which are reviewed at least annually by the Directors. These procedures allow the Fund to utilize independent pricing services, quotations from securities and financial instrument dealers, and other market sources to determine fair value.
The Fund has procedures to determine the fair value of securities and other financial instruments for which market prices are not readily available. Under these procedures, the Valuation Committee convenes on a regular and ad hoc basis to review such securities and considers a number of factors, including valuation methodologies and significant unobservable valuation inputs, when arriving at fair value. The Valuation Committee may employ a market-based approach which may use related or comparable assets or liabilities, recent transactions, market multiples, book values, and other relevant information for the investment to determine the fair value of the investment. An income-based valuation approach may also be used in which the anticipated future cash flows of the investment are discounted to calculate fair value. Discounts may also be applied due to the nature or duration of any restrictions on the disposition of the investments. Due to the inherent uncertainty of valuations of such investments, the fair values may differ significantly from the values that would have been used had an active market existed. The Valuation Committee employs various methods for calibrating these valuation approaches including a regular review of valuation methodologies, key inputs and assumptions, transactional back-testing or disposition analysis, and reviews of any related market activity.
2. Fair Value Measurement: Financial Accounting Standards Board ("FASB") Accounting Standards CodificationTM ("ASC") 820, "Fair Value Measurement" ("ASC 820"), defines fair value as the value that the Fund would receive to sell an investment or pay to transfer a liability in a timely transaction with an independent buyer in the principal market, or in the absence of a principal market, the most advantageous market for the investment or liability. ASC 820 establishes a three-tier hierarchy to distinguish between (1) inputs that reflect the assumptions market participants would use in valuing an asset or liability developed based on market data obtained from sources independent of the reporting entity (observable inputs) and (2) inputs that reflect the reporting entity's own assumptions about the assumptions market participants would use in valuing an asset or liability developed based on the best information available in the circumstances (unobservable inputs) and to establish classification of fair value measurements for disclosure purposes. Various inputs are used in determining the value of the Fund's investments. The inputs are summarized in the three broad levels listed below.
• Level 1 – unadjusted quoted prices in active markets for identical investments
• Level 2 – other significant observable inputs (including quoted prices for similar investments, interest rates, prepayment speeds, credit risk, etc.)
• Level 3 – significant unobservable inputs including the Fund's own assumptions in determining the fair value of investments. Factors considered in making this determination may include, but are not limited to, information obtained by contacting the issuer, analysts, or the appropriate stock exchange (for exchange-traded securities), analysis of the issuer's financial statements or other available documents and, if necessary, available information concerning other securities in similar circumstances
The inputs or methodology used for valuing securities are not necessarily an indication of the risk associated with investing in those securities and the determination of the significance of a particular input to the fair value
18
Morgan Stanley Institutional Fund, Inc.
Annual Report — December 31, 2016
Notes to Financial Statements (cont'd)
measurement in its entirety requires judgment and considers factors specific to each security.
The following is a summary of the inputs used to value the Portfolio's investments as of December 31, 2016.
Investment Type | | Level 1
Unadjusted
quoted
prices
(000) | | Level 2
Other
significant
observable
inputs
(000) | | Level 3
Significant
unobservable
inputs
(000) | | Total
(000) | |
Assets: | |
Common Stocks | |
Aerospace & Defense | | $ | 643 | | | $ | — | | | $ | — | | | $ | 643 | | |
Automobiles | | | 370 | | | | — | | | | — | | | | 370 | | |
Beverages | | | 55 | | | | — | | | | — | | | | 55 | | |
Capital Markets | | | 94 | | | | — | | | | — | | | | 94 | | |
Chemicals | | | 328 | | | | — | | | | — | | | | 328 | | |
Commercial Services &
Supplies | | | 234 | | | | — | | | | — | | | | 234 | | |
Diversified Consumer
Services | | | 114 | | | | — | | | | — | | | | 114 | | |
Diversified Financial
Services | | | 150 | | | | — | | | | — | | | | 150 | | |
Food Products | | | 154 | | | | — | | | | — | | | | 154 | | |
Health Care Equipment &
Supplies | | | 270 | | | | — | | | | — | | | | 270 | | |
Health Care Technology | | | 15 | | | | — | | | | — | | | | 15 | | |
Hotels, Restaurants &
Leisure | | | 125 | | | | — | | | | — | | | | 125 | | |
Industrial Conglomerates | | | 301 | | | | — | | | | — | | | | 301 | | |
Insurance | | | 717 | | | | — | | | | — | | | | 717 | | |
Internet & Direct
Marketing Retail | | | 66 | | | | — | | | | — | | | | 66 | | |
Internet Software &
Services | | | 466 | | | | — | | | | — | | | | 466 | | |
Machinery | | | 808 | | | | — | | | | — | | | | 808 | | |
Marine | | | 116 | | | | — | | | | — | | | | 116 | | |
Media | | | 389 | | | | — | | | | — | | | | 389 | | |
Metals & Mining | | | 315 | | | | — | | | | — | | | | 315 | | |
Oil, Gas & Consumable
Fuels | | | 133 | | | | — | | | | — | | | | 133 | | |
Real Estate Management &
Development | | | 36 | | | | — | | | | — | | | | 36 | | |
Specialty Retail | | | 131 | | | | — | | | | — | | | | 131 | | |
Textiles, Apparel & Luxury
Goods | | | 1,112 | | | | — | | | | — | | | | 1,112 | | |
Trading Companies &
Distributors | | | 165 | | | | — | | | | — | | | | 165 | | |
Transportation
Infrastructure | | | 721 | | | | — | | | | — | | | | 721 | | |
Total Common Stocks | | | 8,028 | | | | — | | | | — | | | | 8,028 | | |
Participation Notes | | | 1 | | | | — | | | | — | | | | 1 | | |
Short-Term Investment | |
Investment Company | | | 286 | | | | — | | | | — | | | | 286 | | |
Total Assets | | $ | 8,315 | | | $ | — | | | $ | — | | | $ | 8,315 | | |
Transfers between investment levels may occur as the markets fluctuate and/or the availability of data used in an investment's valuation changes. The Portfolio recognizes transfers between the levels as of the end of the period. As of December 31, 2016, securities with a total value of approximately $3,108,000 transferred from Level 2 to
Level 1. Securities that were valued using other significant observable inputs at December 31, 2015 were valued using unadjusted quoted prices at December 31, 2016. At December 31 2015, the fair value of certain securities were adjusted due to developments which occurred between the time of the close of the foreign markets on which they trade and the close of business on the NYSE which resulted in their Level 2 classification.
3. Foreign Currency Translation and Foreign Investments: The books and records of the Portfolio are maintained in U.S. dollars. Foreign currency amounts are translated into U.S. dollars as follows:
– investments, other assets and liabilities at the prevailing rate of exchange on the valuation date;
– investment transactions and investment income at the prevailing rates of exchange on the dates of such transactions.
Although the net assets of the Portfolio are presented at the foreign exchange rates and market values at the close of the period, the Portfolio does not isolate that portion of the results of operations arising as a result of changes in the foreign exchange rates from the fluctuations arising from changes in the market prices of securities held at period end. Similarly, the Portfolio does not isolate the effect of changes in foreign exchange rates from the fluctuations arising from changes in the market prices of securities sold during the period. Accordingly, realized and unrealized foreign currency gains (losses) on investments in securities are included in the reported net realized and unrealized gains (losses) on investment transactions and balances. However, pursuant to U.S. federal income tax regulations, gains and losses from certain foreign currency transactions and the foreign currency portion of gains and losses realized on sales and maturities of foreign denominated debt securities are treated as ordinary income for U.S. federal income tax purposes.
Net realized gains (losses) on foreign currency transactions represent net foreign exchange gains (losses) from foreign currency forward exchange contracts, disposition of foreign currencies, currency gains (losses) realized between the trade and settlement dates on securities transactions, and the difference between the amount of investment income and foreign withholding taxes recorded on the Portfolio's books and the U.S. dollar equivalent amounts actually received or paid. Net
19
Morgan Stanley Institutional Fund, Inc.
Annual Report — December 31, 2016
Notes to Financial Statements (cont'd)
unrealized currency gains (losses) from valuing foreign currency denominated assets and liabilities at period end exchange rates are reflected as a component of unrealized appreciation (depreciation) in the Statement of Assets and Liabilities. The change in unrealized currency gains (losses) on foreign currency translations for the period is reflected in the Statement of Operations.
Foreign security and currency transactions may involve certain considerations and risks not typically associated with those of U.S. dollar denominated transactions as a result of, among other factors, fluctuations of exchange rates in relation to the U.S. dollar, the possibility of lower levels of governmental supervision and regulation of foreign securities markets and the possibility of political or economic instability.
Governmental approval for foreign investments may be required in advance of making an investment under certain circumstances in some countries, and the extent of foreign investments in domestic companies may be subject to limitation in other countries. Foreign ownership limitations also may be imposed by the charters of individual companies to prevent, among other concerns, violations of foreign investment limitations. As a result, an additional class of shares (identified as "Foreign" in the Portfolio of Investments) may be created and offered for investment. The "local" and "foreign shares" market values may differ. In the absence of trading of the foreign shares in such markets, the Portfolio values the foreign shares at the closing exchange price of the local shares.
4. Securities Lending: The Portfolio lends securities to qualified financial institutions, such as broker-dealers, to earn additional income. Any increase or decrease in the fair value of the securities loaned that might occur and any interest earned or dividends declared on those securities during the term of the loan would remain in the Portfolio. The Portfolio would receive cash or securities as collateral in an amount equal to or exceeding 100% of the current fair value of the loaned securities. The collateral is marked-to-market daily by State Street Bank and Trust Company ("State Street"), the securities lending agent, to ensure that a minimum of 100% collateral coverage is maintained.
Based on pre-established guidelines, the securities lending agent invests any cash collateral that is received in an affiliated money market portfolio and repurchase agreements. Securities lending income is generated from the earnings on the invested collateral and borrowing fees,
less any rebates owed to the borrowers and compensation to the lending agent, and is recorded as "Income from Securities Loaned — Net" in the Portfolio's Statement of Operations. Risks in securities lending transactions are that a borrower may not provide additional collateral when required or return the securities when due, and that the value of the short-term investments will be less than the amount of cash collateral plus any rebate that is required to be returned to the borrower.
The Portfolio has the right under the lending agreement to recover the securities from the borrower on demand.
The following table presents financial instruments that are subject to enforceable netting arrangements as of December 31, 2016.
Gross Amounts Not Offset in the Statement of Assets and Liabilities | |
Gross Asset
Amounts
Presented in
Statement of
Assets and
Liabilities
(000) | | Financial
Instrument
(000) | | Collateral
Received
(000) | | Net Amount
(not less
than $0)
(000) | |
| $ | 5 | (a) | | $ | — | | | $ | (5 | )(b) | | $ | 0 | | |
(a) Represents market value of loaned securities at period end.
(b) The Portfolio received non-cash collateral of approximately $5,000 in the form of U.S. Government obligations, which the Portfolio cannot sell or repledge, and accordingly are not reflected in the Portfolio of Investments.
5. Structured Investments: The Portfolio invested a portion of its assets in structured investments. A structured investment is a derivative security designed to offer a return linked to a particular underlying security, currency, commodity or market. Structured investments may come in various forms including notes (such as exchange-traded notes), warrants and options to purchase securities. The Portfolio will typically use structured investments to gain exposure to a permitted underlying security, currency, commodity or market when direct access to a market is limited or inefficient from a tax or cost standpoint. There can be no assurance that structured investments will trade at the same price or have the same value as the underlying security, currency, commodity or market. Investments in structured investments involve risks including issuer risk, counterparty risk and market risk. Holders of structured investments bear risks of the underlying investment and are subject to issuer or counterparty risk because the Portfolio is relying on the creditworthiness of such issuer or counterparty and has no rights with respect to the underlying investment. Certain structured investments may be thinly traded or have a limited trading market and may
20
Morgan Stanley Institutional Fund, Inc.
Annual Report — December 31, 2016
Notes to Financial Statements (cont'd)
have the effect of increasing the Portfolio's illiquidity to the extent that the Portfolio, at a particular time, may be unable to find qualified buyers for these securities.
6. Indemnifications: The Fund enters into contracts that contain a variety of indemnifications. The Fund's maximum exposure under these arrangements is unknown. However, the Fund has not had prior claims or losses pursuant to these contracts and expects the risk of loss to be remote.
7. Dividends and Distributions to Shareholders: Dividend income and distributions to shareholders are recorded on the ex-dividend date. Dividends from net investment income, if any, are declared and paid annually. Net realized capital gains, if any, are distributed at least annually.
8. Security Transactions, Income and Expenses: Security transactions are accounted for on the trade date (date the order to buy or sell is executed). Realized gains and losses on the sale of investment securities are determined on the specific identified cost method. Dividend income and other distributions are recorded on the ex-dividend date (except for certain foreign dividends which may be recorded as soon as the Portfolio is informed of such dividends) net of applicable withholding taxes. Interest income is recognized on the accrual basis except where collection is in doubt. Discounts are accreted and premiums are amortized over the life of the respective securities. Most expenses of the Fund can be directly attributed to a particular Portfolio. Expenses which cannot be directly attributed are apportioned among the Portfolios based upon relative net assets or other appropriate methods. Income, expenses (other than class specific expenses — distribution and shareholder services, transfer agency and sub transfer agency fees) and realized and unrealized gains or losses are allocated to each class of shares based upon their relative net assets.
B. Advisory Fees: The Adviser, a wholly-owned subsidiary of Morgan Stanley, provides the Portfolio with advisory services under the terms of an Investment Advisory Agreement, paid quarterly, at the annual rate based on the daily net assets as follows:
First $1
billion | | Over $1
billion | |
| | 1.00 | % | | | 0.95 | % | |
For the year ended December 31, 2016, the advisory fee rate (net of waivers/rebate) was equivalent to an annual effective rate of 0.00% of the Portfolio's average daily net assets.
The Adviser has agreed to reduce its advisory fee and/or reimburse the Portfolio so that total annual portfolio operating expenses, excluding certain investment related expenses, taxes, interest and other extraordinary expenses (including litigation), will not exceed 1.35% for Class I shares, 1.70% for Class A shares, 2.20% for Class L shares and 2.45% for Class C shares. The fee waivers and/or expense reimbursements will continue for at least one year from the date of the Portfolio's prospectus or until such time as the Directors act to discontinue all or a portion of such waivers and/or reimbursements when they deem such action is appropriate. For the year ended December 31, 2016, approximately $31,000 of advisory fees were waived and approximately $139,000 of other expenses were reimbursed by the Adviser pursuant to this arrangement.
C. Administration Fees: The Adviser also serves as Administrator to the Fund and provides administrative services pursuant to an Administration Agreement for an annual fee, accrued daily and paid monthly, of 0.08% of the Portfolio's average daily net assets.
Under a Sub-Administration Agreement between the Administrator and State Street, State Street provides certain administrative services to the Fund. For such services, the Administrator pays State Street a portion of the fee the Administrator receives from the Portfolio.
D. Distribution and Shareholder Services Fees: Morgan Stanley Distribution, Inc. ("MSDI" or the "Distributor"), a wholly-owned subsidiary of the Adviser and an indirect subsidiary of Morgan Stanley, serves as the Fund's Distributor of Portfolio shares pursuant to a Distribution Agreement. The Fund has adopted a Shareholder Services Plan with respect to Class A shares pursuant to Rule 12b-1 under the Act. Under the Shareholder Services Plan, the Portfolio pays the Distributor a shareholder services fee, accrued daily and paid monthly, at an annual rate of 0.25% of the Portfolio's average daily net assets attributable to Class A shares.
The Fund has adopted a Distribution and Shareholder Services Plan with respect to Class L shares pursuant to Rule 12b-1 under the Act. Under the Distribution and Shareholder Services Plan, the Portfolio pays the Distributor a distribution fee, accrued daily and paid monthly, at an annual rate of 0.50% and a shareholder services fee, accrued daily and paid monthly, at
21
Morgan Stanley Institutional Fund, Inc.
Annual Report — December 31, 2016
Notes to Financial Statements (cont'd)
an annual rate of 0.25% of the Portfolio's average daily net assets attributable to Class L shares.
The Fund has adopted a Distribution and Shareholder Services Plan with respect to Class C shares pursuant to Rule 12b-1 under the Act. Under the Distribution and Shareholder Services Plan, the Portfolio pays the Distributor a distribution fee, accrued daily and paid monthly, at an annual rate of 0.75% and a shareholder services fee, accrued daily and paid monthly, at an annual rate of 0.25% of the Portfolio's average daily net assets attributable to Class C shares.
The distribution and shareholder services fees are used to support the expenses associated with servicing and maintaining accounts. The Distributor may compensate other parties for providing shareholder support services to investors who purchase Class A, Class L and Class C shares.
E. Dividend Disbursing and Transfer Agent: The Fund's dividend disbursing and transfer agent is Boston Financial Data Services, Inc. ("BFDS"). Pursuant to a Transfer Agency Agreement, the Fund pays BFDS a fee based on the number of classes, accounts and transactions relating to the Portfolios of the Fund.
F. Custodian Fees: State Street (the "Custodian") serves as Custodian for the Fund in accordance with a Custodian Agreement. The Custodian holds cash, securities, and other assets of the Fund as required by the Act. Custody fees are payable monthly based on assets held in custody, investment purchases and sales activity and account maintenance fees, plus reimbursement for certain out-of-pocket expenses.
In December 2015, the Fund's Custodian announced that it had identified inconsistencies in the way in which clients were invoiced for out-of-pocket expenses from 1998 until November 2015. The dollar amount difference between what was charged and what should have been charged, plus interest, was paid back to the Portfolio in September 2016 as a reimbursement. The Custodian reimbursed the Portfolio directly, which was recognized as a change in accounting estimate and was reflected as "Reimbursement of Custodian Fees" in the Statement of Operations. Pursuant to the expense limitations described in Note B, the Portfolio has experienced waiver of advisory fees and expenses reimbursed by the Adviser during the current period. Accordingly, the reimbursement of out-of-pocket custodian expenses in the current period resulted in the reduction in the current period expenses reimbursed by the Adviser.
G. Security Transactions and Transactions with Affiliates: For the year ended December 31, 2016, purchases and sales of investment securities for the Portfolio, other than long-term U.S. Government securities and short-term investments, were approximately $6,876,000 and $1,637,000, respectively. There were no purchases and sales of long-term U.S. Government securities for the year ended December 31, 2016.
The Portfolio invests in the Institutional Class of the Morgan Stanley Institutional Liquidity Funds (the "Liquidity Funds"), an open-end management investment company managed by the Adviser, both directly and as a portion of the securities held as collateral on loaned securities. Advisory fees paid by the Portfolio are reduced by an amount equal to its pro-rata share of the advisory and administration fees paid by the Portfolio due to its investment in the Liquidity Funds. For the year ended December 31, 2016, advisory fees paid were reduced by less than $500 relating to the Portfolio's investment in the Liquidity Funds.
A summary of the Portfolio's transactions in shares of the Liquidity Funds during the year ended December 31, 2016 is as follows:
Value
December 31,
2015
(000) | | Purchases
at Cost
(000) | | Sales
(000) | | Dividend
Income
(000) | | Value
December 31,
2016
(000) | |
| $ | 8 | | | $ | 4,783 | | | $ | 4,505 | | | $ | — | @ | | $ | 286 | | |
@ Amount is less than $500.
The Portfolio is permitted to purchase and sell securities ("cross-trade") from and to other Morgan Stanley Funds as well as other funds and client accounts for which the Adviser or an affiliate of the Adviser serves as investment adviser, pursuant to procedures approved by the Directors in compliance with Rule 17a-7 under the Act (the "Rule"). Each cross-trade is executed at the current market price in compliance with provisions of the Rule. For the year ended December 31, 2016, the Portfolio did not engage in any cross-trade transactions.
The Portfolio has an unfunded Deferred Compensation Plan (the "Compensation Plan"), which allows each independent Director to defer payment of all, or a portion, of the fees he or she receives for serving on the Board of Directors. Each eligible Director generally may elect to have the deferred amounts credited with a return equal to the total return on one or more of the Morgan Stanley funds that are offered as investment options under the Compensation Plan. Appreciation/depreciation and distributions received from these investments are recorded
22
Morgan Stanley Institutional Fund, Inc.
Annual Report — December 31, 2016
Notes to Financial Statements (cont'd)
with an offsetting increase/decrease in the deferred compensation obligation and do not affect the NAV of the Portfolio.
H. Federal Income Taxes: It is the Portfolio's intention to continue to qualify as a regulated investment company and distribute all of its taxable and tax-exempt income. Accordingly, no provision for federal income taxes is required in the financial statements.
The Portfolio may be subject to taxes imposed by countries in which it invests. Such taxes are generally based on income and/or capital gains earned or repatriated. Taxes are accrued based on net investment income, net realized gains and net unrealized appreciation as such income and/or gains are earned. Taxes may also be based on transactions in foreign currency and are accrued based on the value of investments denominated in such currency.
FASB ASC 740-10, "Income Taxes — Overall", sets forth a minimum threshold for financial statement recognition of the benefit of a tax position taken or expected to be taken in a tax return. Management has concluded that there are no significant uncertain tax positions that would require recognition in the financial statements. If applicable, the Portfolio recognizes interest accrued related to unrecognized tax benefits in "Interest Expense" and penalties in "Other Expenses" in the Statement of Operations. The Portfolio files tax returns with the U.S. Internal Revenue Service, New York and various states. Generally, each of the tax years in the four-year period ended December 31, 2016, remains subject to examination by taxing authorities.
The tax character of distributions paid may differ from the character of distributions shown in the Statements of Changes in Net Assets due to short-term capital gains being treated as ordinary income for tax purposes. The tax character of distributions paid during fiscal years 2016 and 2015 was as follows:
2016
Distributions
Paid From: | | 2015
Distributions
Paid From: | |
Ordinary
Income
(000) | | Long-Term
Capital Gain
(000) | | Ordinary
Income
(000) | | Long-Term
Capital Gain
(000) | |
| $ | 101 | | | $ | 9 | | | $ | 110 | | | $ | 54 | | |
The amount and character of income and gains to be distributed are determined in accordance with income tax regulations which may differ from GAAP. These book/tax differences are either considered temporary or permanent in nature.
Temporary differences are primarily due to differing book and tax treatments in the timing of the recognition of gains (losses) on certain investment transactions and the timing of the deductibility of certain expenses.
Permanent differences, primarily due to differing treatments of gains (losses) related to foreign currency transactions and basis adjustments on certain equity securities designated as passive foreign investment companies, resulted in the following reclassifications among the components of net assets at December 31, 2016:
Distributions
in Excess of Net
Investment
Income
(000) | | Distributions
in Excess of
Net Realized
Gain
(000) | | Paid-in-
Capital
(000) | |
| $ | 11 | | | $ | (11 | ) | | $ | (— | @) | |
At December 31, 2016, the components of distributable earnings for the Portfolio on a tax basis were as follows:
Undistributed
Ordinary
Income
(000) | | Undistributed
Long-Term
Capital Gain
(000) | |
| $ | 6 | | | $ | 35 | | |
I. Credit Facility: As of April 4, 2016, the Fund and other Morgan Stanley funds participated in a $150,000,000 committed, unsecured revolving line of credit facility (the "facility") with State Street. This facility is to be used for temporary emergency purposes or funding of shareholder redemption requests. The interest rate on borrowings is based on the federal funds rate or one month libor rate plus a spread. The facility also has a commitment fee of 0.25% per annum based on the unused portion of the facility. During the year ended December 31, 2016, the Portfolio did not have any borrowings under the facility.
J. Other: At December 31, 2016, the Portfolio had record owners of 10% or greater. Investment activities of these shareholders could have a material impact on the Portfolio. The aggregate percentage of such owners was 82.9%.
K. Accounting Pronouncements: In December 2016, FASB issued Accounting Standards update 2016-19 — Technical Corrections and Improvements ("ASU 2016-19"), which is effective for interim periods for all entities beginning after December 15, 2016. ASU 2016-19 includes an amendment to Topic 820, Fair Value Measurement, which clarifies the difference between a valuation approach and a valuation technique when applying the guidance in that Topic. That amendment also requires an entity to disclose when there has been a change in either or both a valuation approach and/or a valuation technique. The transition guidance for the amendment must be applied prospectively because it could potentially involve the use of hindsight that includes fair value measurements. Although still evaluating the potential impacts of ASU 2016-19 to the Portfolio, management expects that the impact of the
23
Morgan Stanley Institutional Fund, Inc.
Annual Report — December 31, 2016
Notes to Financial Statements (cont'd)
Portfolio's adoption will be limited to additional financial statement disclosures.
In October 2016, the Securities and Exchange Commission ("SEC") issued a new rule, Investment Company Reporting Modernization, which, among other provisions, amends Regulation S-X to require standardized, enhanced disclosures, particularly related to derivatives, in investment company financial statements. Compliance with the guidance is effective for financial statements filed with the SEC on or after August 1, 2017; adoption will have no effect on the Portfolio's net assets or results of operations. Although still evaluating the potential impacts of the Investment Company Reporting Modernization to the Portfolio, management expects that the impact of the Portfolio's adoption will be limited to additional financial statement disclosures.
24
Morgan Stanley Institutional Fund, Inc.
Annual Report — December 31, 2016
Report of Independent Registered Public Accounting Firm
To the Shareholders and Board of Directors of
Morgan Stanley Institutional Fund, Inc. —
Global Insight Portfolio
We have audited the accompanying statement of assets and liabilities, including the portfolio of investments, of Global Insight Portfolio (one of the portfolios constituting Morgan Stanley Institutional Fund, Inc.) (the "Portfolio") as of December 31, 2016, and the related statement of operations for the year then ended, the statements of changes in net assets for each of the two years in the period then ended and the financial highlights for each of the years or periods indicated therein. These financial statements and financial highlights are the responsibility of the Portfolio's management. Our responsibility is to express an opinion on these financial statements and financial highlights based on our audits.
We conducted our audits in accordance with the standards of the Public Company Accounting Oversight Board (United States). Those standards require that we plan and perform the audit to obtain reasonable assurance about whether the financial statements and financial highlights are free of material misstatement. We were not engaged to perform an audit of the Portfolio's internal control over financial reporting. Our audits included consideration of internal control over financial reporting as a basis for designing audit procedures that are appropriate in the circumstances, but not for the purpose of expressing an opinion on the effectiveness of the Portfolio's internal control over financial reporting. Accordingly, we express no such opinion. An audit also includes examining, on a test basis, evidence supporting the amounts and disclosures in the financial statements and financial highlights, assessing the accounting principles used and significant estimates made by management, and evaluating the overall financial statement presentation. Our procedures included confirmation of securities owned as of December 31, 2016, by correspondence with the custodian and others or by other appropriate auditing procedures where replies from others were not received. We believe that our audits provide a reasonable basis for our opinion.
In our opinion, the financial statements and financial highlights referred to above present fairly, in all material respects, the financial position of Global Insight Portfolio (one of the portfolios constituting Morgan Stanley Institutional Fund, Inc.) at December 31, 2016, the results of its operations for the year then ended, the changes in its net assets for each of the two years in the period then ended and the financial highlights for each of the years or periods indicated therein, in conformity with U.S. generally accepted accounting principles.

Boston, Massachusetts
February 28, 2017
25
Morgan Stanley Institutional Fund, Inc.
Annual Report — December 31, 2016
Federal Tax Notice (unaudited)
For federal income tax purposes, the following information is furnished with respect to the distributions paid by the Portfolio during its taxable year ended December 31, 2016. For corporate shareholders, 19.2% of the dividends qualified for the dividends received deduction.
The Portfolio designated and paid approximately $9,000 as a long-term capital gain distribution.
For federal income tax purposes, the following information is furnished with respect to the Portfolio's earnings for its taxable year ended December 31, 2016. When distributed, certain earnings may be subject to a maximum tax rate of 15% as provided for the Jobs and Growth Tax Relief Reconciliation Act of 2003. The Portfolio designated up to a maximum of approximately $53,000 as taxable at this lower rate.
In January, the Portfolio provides tax information to shareholders for the preceding calendar year.
26
Morgan Stanley Institutional Fund, Inc.
Annual Report — December 31, 2016
Privacy Notice (unaudited)
MORGAN STANLEY INVESTMENT MANAGEMENT INC.
AN IMPORTANT NOTICE CONCERNING OUR U.S. PRIVACY POLICY
We are required by federal law to provide you with a copy of our privacy policy annually. This policy applies to current and former individual investors in funds managed or sponsored by Morgan Stanley Investment Management Inc. ("MSIM") as well as current and former individual clients of MSIM. This policy is not applicable to partnerships, corporations, trusts or other non-individual clients or investors. Please note that we may amend this policy at any time, and will inform you of any changes as required by law.
WE RESPECT YOUR PRIVACY
We appreciate that you have provided us with your personal financial information. We strive to maintain the privacy of such information while we help you achieve your financial objectives. This Notice describes what non-public personal information we collect about you, why we collect it, when we may share it with others and how certain others may use it. It discusses the steps you may take to limit our sharing of certain information about you to affiliated companies in the Morgan Stanley family of companies ("other Morgan Stanley companies"). It also discloses how you may limit use of certain shared information for marketing purposes by other Morgan Stanley branded companies. Throughout this policy, we refer to the non-public information that personally identifies you or your accounts as "personal information.''
1. WHAT PERSONAL INFORMATION DO WE COLLECT ABOUT YOU?
We obtain personal information from applications and other forms you submit to us, from your dealings with us, from consumer reporting agencies, from our Web sites and from third parties and other sources.
For example:
• We may collect information such as your name, address, e-mail address, telephone/fax numbers, assets, income and investment objectives through subscription documents, applications and other forms you submit to us.
• We may obtain information about account balances, your use of account(s) and the types of products and services you prefer to receive from us through your dealings and transactions with us and other sources.
• We may obtain information about your creditworthiness and credit history from consumer reporting agencies.
• We may collect background information from and through third-party vendors to verify representations you have made and to comply with various regulatory requirements.
• If you interact with us through our public and private Web sites, we may collect information that you provide directly through online communications (such as an e-mail address). We may also collect information about your Internet service provider, your domain name, your computer's operating system and Web browser, your use of our Web sites and your product and service preferences, through the use of "cookies." Please consult the Terms of Use of these sites for more details.
2. WHEN DO WE DISCLOSE PERSONAL INFORMATION WE COLLECT ABOUT YOU?
We may disclose personal information we collect about you to other Morgan Stanley companies and to non-affiliated third parties.
a. Information We Disclose to Other Morgan Stanley Companies.
We may disclose personal information to other Morgan Stanley companies for a variety of reasons, including to manage your account(s) effectively, to service and process your transactions, to let you know about products and services offered by us and other Morgan Stanley companies, to manage our business, and as otherwise required or permitted by law. Offers for products and services from other Morgan Stanley companies are developed under conditions designed to safeguard your personal information.
27
Morgan Stanley Institutional Fund, Inc.
Annual Report — December 31, 2016
Privacy Notice (unaudited) (cont'd)
b. Information We Disclose to Non-affiliated Third Parties.
We do not disclose personal information that we collect about you to non-affiliated third parties except to those who provide marketing services on our behalf, to financial institutions with whom we have joint marketing agreements, and as otherwise required or permitted by law. For example, we may disclose personal information to nonaffiliated third parties for servicing and processing transactions, to offer our own products and services, to protect against fraud, for institutional risk control, to respond to judicial process or to perform services on our behalf. When we share personal information with a non-affiliated third party, they are required to limit their use of personal information to the particular purpose for which it was shared and they are not allowed to share personal information with others except to fulfill that limited purpose or as may be permitted or required by law.
3. HOW DO WE PROTECT THE SECURITY AND CONFIDENTIALITY OF PERSONAL INFORMATION WE COLLECT ABOUT YOU?
We maintain physical, electronic and procedural security measures to help safeguard the personal information we collect about you. We have internal policies governing the proper handling of client information. Third parties that provide support or marketing services on our behalf may also receive personal information, and we require them to adhere to confidentiality standards with respect to such information.
4. HOW CAN YOU LIMIT THE SHARING OF CERTAIN TYPES OF PERSONAL INFORMATION WITH OTHER MORGAN STANLEY COMPANIES?
We offer you choices as to whether we share with other Morgan Stanley companies the personal information that was collected to determine your eligibility for products and services you request ("eligibility information"). Eligibility information does not include your identification information or personal information pertaining to our transactions or experiences with you. Please note that, even if you direct us not to share eligibility information with other Morgan Stanley companies ("opt-out"), we may still share personal information, including eligibility information, with those companies in circumstances excluded from the opt-out under applicable law, such as to process transactions or to service your account.
5. HOW CAN YOU LIMIT THE USE OF CERTAIN TYPES OF PERSONAL INFORMATION BY OTHER MORGAN STANLEY COMPANIES FOR MARKETING?
By following the opt-out instructions in Section 6 below, you may limit other Morgan Stanley branded companies from marketing their products or services to you based on personal information we disclose to them. This information may include, for example, your income and account history with us. Please note that, even if you choose to limit Other Morgan Stanley Companies from using personal information about you that we may share with them for marketing their products and services to you, Other Morgan Stanley Companies may use your personal information that they obtain from us to market to you in circumstances permitted by law, such as if the Other Morgan Stanley Company has its own relationship with you.
6. HOW CAN YOU SEND US AN OPT-OUT INSTRUCTION?
If you wish to limit our sharing of eligibility information about you with other Morgan Stanley companies or other Morgan Stanley companies' use of personal information for marketing purposes, as described in this notice, you may do so by:
• Calling us at (800) 548-7786
Monday–Friday between 8a.m. and 6p.m.(EST)
• Writing to us at the following address:
Boston Financial Data Services, Inc.
c/o Privacy Coordinator
P.O. Box 219804
Kansas City, Missouri 64121
28
Morgan Stanley Institutional Fund, Inc.
Annual Report — December 31, 2016
Privacy Notice (unaudited) (cont'd)
Your written request should include your name, address, telephone number and account number(s) to which the opt-out applies and whether you are opting out with respect to sharing of eligibility information (Section 4 above), or if information used for Marketing (Section 5 above) or both. Written opt-out requests should not be sent with any other correspondence. In order to process your request, we require that the request be provided by you directly and not through a third party.
Your opt-out preference will remain in effect with respect to this policy (as it may be amended) until you notify us otherwise. If you have a joint account, your direction for us not to share this information with other Morgan Stanley companies and for those other Morgan Stanley companies not to use your personal information for marketing will be applied to all account holders on that account. Please understand that if you limit our sharing or our affiliated companies' use of personal information, you and any joint account holder(s) may not receive information about Morgan Stanley products and services, including products or services that could help you manage your financial resources and achieve your investment objectives.
7. WHAT IF AN AFFILIATED COMPANY BECOMES A NON-AFFILIATED THIRD PARTY?
If, at any time in the future, an affiliated company becomes a non-affiliated third party, further disclosures of personal information made to the former affiliated company will be limited to those described in Section 2(b) above relating to non-affiliated third parties. If you elected under Section 6 to limit disclosures we make to affiliated companies, or use of personal information by affiliated companies, your election will not apply to use by any former affiliated company of your personal information in their possession once it becomes a non-affiliated third party.
SPECIAL NOTICE TO RESIDENTS OF VERMONT
The following section supplements our policy with respect to our individual clients who have a Vermont address and supersedes anything to the contrary in the above policy with respect to those clients only.
The state of Vermont requires financial institutions to obtain your consent prior to sharing personal information that they collect about you with affiliated companies and non-affiliated third parties other than in certain limited circumstances. Except as permitted by law, we will not share personal information we collect about you with non-affiliated third parties or other Morgan Stanley companies unless you provide us with your written consent to share such information ("opt-in").
If you wish to receive offers for investment products and services offered by or through other Morgan Stanley companies, please notify us in writing at the following address:
Boston Financial Data Services, Inc.
c/o Privacy Coordinator
P.O. Box 219804
Kansas City, Missouri 64121
Your authorization should include your name, address, telephone number and account number(s) to which the opt-in applies and should not be sent with any other correspondence. In order to process your authorization, we require that the authorization be provided by you directly and not through a third party.
SPECIAL NOTICE TO RESIDENTS OF CALIFORNIA
The following section supplements our policy with respect to our individual clients who have a California address and supersedes anything to the contrary in the above policy with respect to those clients only.
In response to a California law, if your account has a California home address, your personal information will not be disclosed to nonaffiliated third parties except as permitted by applicable California law, and we will limit sharing such information with our affiliates to comply with California privacy laws that apply to us.
29
Morgan Stanley Institutional Fund, Inc.
Annual Report — December 31, 2016
Director and Officer Information (unaudited)
Independent Directors:
Name, Age and Address of
Independent Director | | Position(s)
Held with
Registrant | | Length of Time
Served* | | Principal Occupation(s) During Past 5 Years
and Other Relevant Professional Experience | | Number of
Portfolios in
Fund Complex
Overseen by
Independent
Director** | | Other Directorships
Held by Independent
Director*** | |
Frank L. Bowman (72)
c/o Perkins Coie LLP
Counsel to the Independent
Directors
30 Rockefeller Plaza
New York, NY 10112 | | Director | | Since
August
2006 | | President, Strategic Decisions, LLC (consulting) (since February 2009); Director or Trustee of various Morgan Stanley Funds (since August 2006); Chairperson of the Compliance and Insurance Committee (since October 2015); formerly, Chairperson of the Insurance Sub-Committee of the Compliance and Insurance Committee (2007-2015); served as President and Chief Executive Officer of the Nuclear Energy Institute (policy organization) (February 2005-November 2008); retired as Admiral, U.S. Navy after serving over 38 years on active duty including 8 years as Director of the Naval Nuclear Propulsion Program in the Department of the Navy and the U.S. Department of Energy (1996-2004); served as Chief of Naval Personnel (July 1994-September 1996) and on the Joint Staff as Director of Political Military Affairs (June 1992-July 1994); knighted as Honorary Knight Commander of the Most Excellent Order of the British Empire; awarded the Officier de l'Orde National du Mérite by the French Government; elected to the National Academy of Engineering (2009). | | | 90 | | | Director of BP p.l.c.; Director of Naval and Nuclear Technologies LLP; Director Emeritus of the Armed Services YMCA; Director of the U.S. Naval Submarine League; Member of the National Security Advisory Council of the Center for U.S. Global Engagement and a member of the CNA Military Advisory Board; Chairman of the charity J Street Cup Golf; Trustee of Fairhaven United Methodist Church; and Director of other various non-profit organizations. | |
Kathleen A. Dennis (63)
c/o Perkins Coie LLP
Counsel to the Independent Directors
30 Rockefeller Plaza
New York, NY 10112 | | Director | | Since
August
2006 | | President, Cedarwood Associates (mutual fund and investment management consulting) (since July 2006); Chairperson of the Liquidity and Alternatives Sub-Committee of the Investment Committee (since October 2006) and Director or Trustee of various Morgan Stanley Funds (since August 2006); formerly, Senior Managing Director of Victory Capital Management (1993-2006). | | | 91 | | | Director of various non-profit organizations. | |
Nancy C. Everett (61)
c/o Perkins Coie LLP
Counsel to the Independent Directors
30 Rockefeller Plaza
New York, NY 10112 | | Director | | Since
January
2015 | | Chief Executive Officer, Virginia Commonwealth University Investment Company (since November 2015); Owner, OBIR, LLC (institutional investment management consulting) (since June 2014); formerly, Managing Director, BlackRock Inc. (February 2011-December 2013); and Chief Executive Officer, General Motors Asset Management (a/k/a Promark Global Advisors, Inc.) (June 2005-May 2010). | | | 91 | | | Member of Virginia Commonwealth University School of Business Foundation; formerly, Member of Virginia Commonwealth University Board of Visitors (2013-2015); Member of Committee on Directors for Emerging Markets Growth Fund, Inc. (2007-2010); Chairperson of Performance Equity Management, LLC (2006-2010); and Chairperson, GMAM Absolute Return Strategies Fund, LLC (2006-2010). | |
30
Morgan Stanley Institutional Fund, Inc.
Annual Report — December 31, 2016
Director and Officer Information (unaudited) (cont'd)
Independent Directors: (cont'd)
Name, Age and Address of
Independent Director | | Position(s)
Held with
Registrant | | Length of Time
Served* | | Principal Occupation(s) During Past 5 Years
and Other Relevant Professional Experience | | Number of
Portfolios in
Fund Complex
Overseen by
Independent
Director** | | Other Directorships
Held by Independent
Director*** | |
Jakki L. Haussler (59)
c/o Perkins Coie LLP
Counsel to the Independent Directors
30 Rockefeller Plaza
New York, NY 10112 | | Director | | Since
January
2015 | | Chairman and Chief Executive Officer, Opus Capital Group (since January 1996); formerly, Director, Capvest Venture Fund, LP (May 2000-December 2011); Partner, Adena Ventures, LP (July 1999-December 2010); Director, The Victory Funds (February 2005-July 2008). | | | 91 | | | Director of Cincinnati Bell Inc. and Member, Audit Committee and Compensation Committee; Director of Northern Kentucky University Foundation and Member, Investment Committee; Member of Chase College of Law Transactional Law Practice Center Board of Advisors; Director of Best Transport; Director of Chase College of Law Board of Visitors; formerly, Member, University of Cincinnati Foundation Investment Committee; Member, Miami University Board of Visitors (2008-2011); Trustee of Victory Funds (2005-2008) and Chairman, Investment Committee (2007-2008) and Member, Service Provider Committee (2005-2008). | |
Dr. Manuel H. Johnson (67)
c/o Johnson Smick
International, Inc.
220 I Street, N.E. — Suite 200
Washington, D.C. 20002 | | Director | | Since
July
1991 | | Senior Partner, Johnson Smick International, Inc. (consulting firm); Chairperson of the Investment Committee (since October 2006) and Director or Trustee of various Morgan Stanley Funds (since July 1991); Co-Chairman and a founder of the Group of Seven Council (G7C) (international economic commission); formerly, Chairperson of the Audit Committee (July 1991-September 2006), Vice Chairman of the Board of Governors of the Federal Reserve System and Assistant Secretary of the U.S. Treasury. | | | 91 | | | Director of NVR, Inc. (home construction). | |
Joseph J. Kearns (74)
c/o Kearns & Associates LLC
46 E Peninsula Center #385
Rolling Hills Estates, CA 90274-3712 | | Director | | Since
August
1994 | | President, Kearns & Associates LLC (investment consulting); Chairperson of the Audit Committee (since October 2006) and Director or Trustee of various Morgan Stanley Funds (since August 1994); formerly, Deputy Chairperson of the Audit Committee (July 2003-September 2006) and Chairperson of the Audit Committee of various Morgan Stanley Funds (since August 1994); CFO of the J. Paul Getty Trust. | | | 93 | | | Director of Electro Rent Corporation (equipment leasing). Prior to December 31, 2013, Director of The Ford Family Foundation. | |
31
Morgan Stanley Institutional Fund, Inc.
Annual Report — December 31, 2016
Director and Officer Information (unaudited) (cont'd)
Independent Directors: (cont'd)
Name, Age and Address of
Independent Director | | Position(s)
Held with
Registrant | | Length of Time
Served* | | Principal Occupation(s) During Past 5 Years
and Other Relevant Professional Experience | | Number of
Portfolios in
Fund Complex
Overseen by
Independent
Director** | | Other Directorships
Held by Independent
Director*** | |
Michael F. Klein (58)
c/o Perkins Coie LLP
Counsel to the Independent Directors
30 Rockefeller Plaza
New York, NY 10112 | | Director | | Since
August
2006 | | Managing Director, Aetos Capital, LLC (since March 2000); Co-President, Aetos Alternatives Management, LLC (since January 2004) and Co-Chief Executive Officer of Aetos Capital LLC (since August 2013); Chairperson of the Fixed Income Sub-Committee of the Investment Committee (since October 2006) and Director or Trustee of various Morgan Stanley Funds (since August 2006); formerly, Managing Director, Morgan Stanley & Co. Inc. and Morgan Stanley Dean Witter Investment Management, President, various Morgan Stanley Funds (June 1998-March 2000) and Principal, Morgan Stanley & Co. Inc. and Morgan Stanley Dean Witter Investment Management (August 1997-December 1999). | | | 90 | | | Director of certain investment funds managed or sponsored by Aetos Capital, LLC; Director of Sanitized AG and Sanitized Marketing AG (specialty chemicals). | |
Patricia Maleski (56)
c/o Perkins Coie LLP
Counsel to the Independent Directors
30 Rockefeller Plaza
New York, NY 10112 | | Director | | Since
January
2017 | | Management Director, JPMorgan Asset Management (2013-2016); President, JPMorgan Funds (2010-2013), Chief Administrative Officer, JPMorgan Funds (2004-2010), Treasurer, JPMorgan Funds (2003-2004, 2008-2010), and Vice President and Board Liaison, JPMorgan Funds (2001-2004); Managing Director, J.P. Morgan Investment Management Inc. (2001-2013); Vice President of Finance, Pierpont Group (1996-2001); Vice President, Bank of New York (1995-1996); Senior Audit Manager, Price Waterhouse, LLP (1982-1995). | | | 91 | | | None. | |
Michael E. Nugent (80)
522 Fifth Avenue
New York, NY 10036 | | Chair of the Board and Director | | Chair of the Boards since July 2006 and Director since July 1991 | | Chair of the Boards of various Morgan Stanley Funds (since July 2006); Chairperson of the Closed-End Fund Committee (since June 2012) and Director or Trustee of various Morgan Stanley Funds (since July 1991); formerly, Chairperson of the Insurance Committee (until July 2006); General Partner, Triumph Capital, L.P. (private investment partnership) (1988-2013). | | | 92 | | | None. | |
W. Allen Reed (69)
c/o Perkins Coie LLP
Counsel to the Independent Directors
30 Rockefeller Plaza
New York, NY 10112 | | Director | | Since
August
2006 | | Chairperson of the Equity Sub-Committee of the Investment Committee (since October 2006) and Director or Trustee of various Morgan Stanley Funds (since August 2006); formerly, President and CEO of General Motors Asset Management; Chairman and Chief Executive Officer of the GM Trust Bank and Corporate Vice President of General Motors Corporation (August 1994-December 2005). | | | 91 | | | Director of Legg Mason, Inc.; formerly, Director of the Auburn University Foundation (2010-2015). | |
Fergus Reid (84)
c/o Joe Pietryka, Inc.
85 Charles Colman Blvd.
Pawling, NY 12564 | | Director | | Since
June
1992 | | Chairman, Joe Pietryka, Inc.; Chairperson of the Governance Committee and Director or Trustee of various Morgan Stanley Funds (since June 1992). | | | 92 | | | Formerly, Trustee and Director of certain investment companies in the JP Morgan Fund Complex managed by JP Morgan Investment Management Inc. (1987-2012). | |
* This is the earliest date the Director began serving the Morgan Stanley Funds. Each Director serves an indefinite term, until his or her successor is elected.
** The Fund Complex includes (as of December 31, 2016) all open-end and closed-end funds (including all of their portfolios) advised by Morgan Stanley Investment Management Inc. (the "Adviser") and any funds that have an adviser that is an affiliated person of the Adviser (including, but not limited to, Morgan Stanley AIP GP LP).
*** This includes any directorships at public companies and registered investment companies held by the Director at any time during the past five years.
32
Morgan Stanley Institutional Fund, Inc.
Annual Report — December 31, 2016
Director and Officer Information (unaudited) (cont'd)
Executive Officers:
Name, Age and Address of Executive Officer | | Position(s) Held
with
Registrant | | Length of Time
Served* | | Principal Occupation(s) During Past 5 Years | |
John H. Gernon (53)
522 Fifth Avenue
New York, NY 10036 | | President and Principal Executive Officer | | Since
September
2013 | | President and Principal Executive Officer of the Equity and Fixed Income Funds and the Morgan Stanley AIP Funds (since September 2013) and the Liquidity Funds and various money market funds (since May 2014) in the Fund Complex; Managing Director of the Adviser; Head of Product (since 2006). | |
Timothy J. Knierim (58)
522 Fifth Avenue
New York, NY 10036 | | Chief Compliance Officer | | Since
December
2016 | | Managing Director of the Adviser and various entities affiliated with the Adviser; Chief Compliance Officer of various Morgan Stanley Funds and the Adviser (since December 2016) and Chief Compliance Officer of Morgan Stanley AIP GP LP (since 2014). Formerly, Managing Director and Deputy Chief Compliance Officer of the Adviser (2014-2016); and formerly, Chief Compliance Officer of Prudential Investment Management, Inc. (2007-2014). | |
Francis J. Smith (51)
522 Fifth Avenue
New York, NY 10036 | | Treasurer and Principal Financial Officer | | Treasurer since July 2003 and Principal Financial Officer since September 2002 | | Managing Director of the Adviser and various entities affiliated with the Adviser; Treasurer (since July 2003) and Principal Financial Officer of various Morgan Stanley Funds (since September 2002). | |
Mary E. Mullin (49)
522 Fifth Avenue
New York, NY 10036 | | Secretary | | Since
June
1999 | | Executive Director of the Adviser; Secretary of various Morgan Stanley Funds (since June 1999). | |
* This is the earliest date the officer began serving the Morgan Stanley Funds. Each officer serves a one-year term, until his or her successor is elected and qualifies.
33
Morgan Stanley Institutional Fund, Inc.
Annual Report — December 31, 2016
Adviser and Administrator
Morgan Stanley Investment Management Inc.
522 Fifth Avenue
New York, New York 10036
Distributor
Morgan Stanley Distribution, Inc.
522 Fifth Avenue
New York, New York 10036
Dividend Disbursing and Transfer Agent
Boston Financial Data Services, Inc.
2000 Crown Colony Drive
Quincy, Massachusetts 02169
Custodian
State Street Bank and Trust Company
One Lincoln Street
Boston, Massachusetts 02111
Legal Counsel
Dechert LLP
1095 Avenue of the Americas
New York, New York 10036
Counsel to the Independent Directors
Perkins Coie LLP
30 Rockefeller Plaza
New York, New York 10112
Independent Registered Public Accounting Firm
Ernst & Young LLP
200 Clarendon Street
Boston, Massachusetts 02116
Reporting to Shareholders
Each Morgan Stanley fund provides a complete schedule of portfolio holdings in its semi-annual and annual reports within 60 days of the end of the fund's second and fourth fiscal quarters. The semi-annual and annual reports are filed electronically with the Securities and Exchange Commission (SEC) on Form N-CSRS and Form N-CSR, respectively. Morgan Stanley also delivers the semi-annual and annual reports to fund shareholders and makes these reports available on its public website, www.morganstanley.com/im. Each Morgan Stanley fund also files a complete schedule of portfolio holdings with the SEC for the fund's first and third fiscal quarters on Form N-Q. Morgan Stanley does not deliver the reports for the first and third fiscal quarters to shareholders, nor are the reports posted to the Morgan Stanley public website. You may, however, obtain the Form N-Q filings (as well as the Form N-CSR and N-CSRS filings) by accessing the SEC's website, www.sec.gov. You may also review and copy them at the SEC's Public Reference Room in Washington, DC. Information on the operation of the SEC's Public Reference Room may be obtained by calling the SEC toll free at 1 (800) SEC-0330. You can also request copies of these materials, upon payment of a duplicating fee, by electronic request at the SEC's email address (publicinfo@sec.gov) or by writing the Public Reference Room of the SEC, 100 F Street, NE, Washington, DC 20549-0102.
Proxy Voting Policies and Procedures and Proxy Voting Record
You may obtain a copy of the Fund's Proxy Voting Policy and Procedures and information regarding how the Fund voted proxies relating to portfolio securities during the most recent twelve-month period ended June 30, without charge, upon request, by calling toll free 1 (800) 548-7786 or by visiting our website at www.morganstanley.com/im. This information is also available on the SEC's website at www.sec.gov.
This report is authorized for distribution only when preceded or accompanied by a prospectus or summary prospectus of the applicable Portfolio of Morgan Stanley Institutional Fund, Inc., which describes in detail the Portfolio's investment policies, risks, fees and expenses. Please read the prospectus carefully before you invest or send money. For additional information, including information regarding the investments comprising the Portfolio, please visit our website at www.morganstanley.com/im or call toll free 1 (800) 548-7786.
34
(This Page has been left blank intentionally.)
(This Page has been left blank intentionally.)
(This Page has been left blank intentionally.)
Printed in U.S.A.
This Report has been prepared for shareholders and may be distributed to others only if preceded or accompanied by a current prospectus.
Morgan Stanley Investment Management Inc.
522 Fifth Avenue
New York, New York 10036
© 2017 Morgan Stanley. Morgan Stanley Distribution, Inc.

IFIGIANN
1696453 EXP. 02.28.18

Morgan Stanley Institutional Fund, Inc.
Global Opportunity Portfolio
Annual Report
December 31, 2016

Morgan Stanley Institutional Fund, Inc.
Annual Report — December 31, 2016
Shareholders' Letter | | | 2 | | |
Expense Example | | | 3 | | |
Investment Overview | | | 4 | | |
Portfolio of Investments | | | 6 | | |
Statement of Assets and Liabilities | | | 8 | | |
Statement of Operations | | | 10 | | |
Statements of Changes in Net Assets | | | 11 | | |
Financial Highlights | | | 13 | | |
Notes to Financial Statements | | | 18 | | |
Report of Independent Registered Public Accounting Firm | | | 29 | | |
Federal Tax Notice | | | 30 | | |
Privacy Notice | | | 31 | | |
Director and Officer Information | | | 34 | | |
This report is authorized for distribution only when preceded or accompanied by a prospectus or summary prospectus of the applicable Portfolio of Morgan Stanley Institutional Fund, Inc. To receive a prospectus and/or statement of additional information (SAI), which contains more complete information such as investment objectives, charges, expenses, policies for voting proxies, risk considerations, and describes in detail each of the Portfolio's investment policies to the prospective investor, please call toll free 1 (800) 548-7786. Please read the prospectuses carefully before you invest or send money.
Additionally, you can access information about the Portfolio, including performance, characteristics, and investment team commentary, through Morgan Stanley Investment Management's website: www.morganstanley.com/im.
Market forecasts provided in this report may not necessarily come to pass. There is no guarantee that any sectors mentioned will continue to perform as discussed herein or that securities in such sectors will be held by the Portfolio in the future. There is no assurance that a Portfolio will achieve its investment objective. Portfolios are subject to market risk, which is the possibility that market values of securities owned by the Portfolio will decline and, therefore, the value of the Portfolio's shares may be less than what you paid for them. Accordingly, you can lose money investing in this Portfolio. Please see the prospectus for more complete information on investment risks.
1
Morgan Stanley Institutional Fund, Inc.
Annual Report — December 31, 2016
Shareholders' Letter (unaudited)
Dear Shareholders,
We are pleased to provide this Annual report, in which you will learn how your investment in Global Opportunity Portfolio (the "Portfolio") performed during the latest twelve-month period.
Morgan Stanley Investment Management is a client-centric, investor-led organization. Our global presence, intellectual capital, and breadth of products and services enable us to partner with investors to meet the evolving challenges of today's financial markets. We aim to deliver superior investment service and to empower our clients to make the informed decisions that help them reach their investment goals.
As always, we thank you for selecting Morgan Stanley Investment Management, and look forward to working with you in the months and years ahead.
Sincerely,

John H. Gernon
President and Principal Executive Officer
January 2017
2
Morgan Stanley Institutional Fund, Inc.
Annual Report — December 31, 2016
Expense Example (unaudited)
Global Opportunity Portfolio
As a shareholder of the Portfolio, you incur two types of costs: (1) transactional costs; and (2) ongoing costs, which may include advisory fees, administration fees, distribution and shareholder services fees and other Portfolio expenses. This example is intended to help you understand your ongoing costs (in dollars) of investing in the Portfolio and to compare these costs with the ongoing costs of investing in other mutual funds.
This example is based on an investment of $1,000 invested at the beginning of the six-month period ended December 31, 2016 and held for the entire six-month period.
Actual Expenses
The table below provides information about actual account values and actual expenses. You may use the information in this table, together with the amount you invested, to estimate the expenses that you paid over the period. Simply divide your account value by $1,000 (for example, an $8,600 account value divided by $1,000 = 8.6), then multiply the result by the number in the table under the heading entitled "Actual Expenses Paid During Period" to estimate the expenses you paid on your account during this period.
Hypothetical Example for Comparison Purposes
The table below provides information about hypothetical account values and hypothetical expenses based on the Portfolio's actual expense ratio and an assumed rate of return of 5% per year before expenses, which is not the Portfolio's actual return. The hypothetical account values and expenses may not be used to estimate the actual ending account balance or expenses you paid for the period. You may use this information to compare the ongoing costs of investing in the Portfolio and other funds. To do so, compare this 5% hypothetical example with the 5% hypothetical examples that appear in the shareholder reports of the other funds.
Please note that the expenses shown in the table are meant to highlight your ongoing costs only and do not reflect any transactional costs, such as sales charges (loads). Therefore, the information for each class in the table is useful in comparing ongoing costs only, and will not help you determine the relative total costs of owning different funds. In addition, if these transactional costs were included, your costs would have been higher.
| | | Beginning
Account
Value
7/1/16 | | Actual Ending
Account
Value
12/31/16 | | Hypothetical
Ending Account
Value | | Actual
Expenses
Paid
During
Period* | | Hypothetical
Expenses Paid
During Period* | | Net
Expense
Ratio
During
Period** | |
Global Opportunity Portfolio Class I | | $ | 1,000.00 | | | $ | 1,032.60 | | | $ | 1,021.01 | | | $ | 4.19 | | | $ | 4.17 | | | | 0.82 | %*** | |
Global Opportunity Portfolio Class A | | | 1,000.00 | | | | 1,030.70 | | | | 1,019.15 | | | | 6.07 | | | | 6.04 | | | | 1.19 | *** | |
Global Opportunity Portfolio Class L | | | 1,000.00 | | | | 1,030.30 | | | | 1,018.90 | | | | 6.33 | | | | 6.29 | | | | 1.24 | *** | |
Global Opportunity Portfolio Class C | | | 1,000.00 | | | | 1,027.80 | | | | 1,015.69 | | | | 9.58 | | | | 9.53 | | | | 1.88 | *** | |
Global Opportunity Portfolio Class IS | | | 1,000.00 | | | | 1,033.20 | | | | 1,021.57 | | | | 3.63 | | | | 3.61 | | | | 0.71 | *** | |
* Expenses are calculated using each Portfolio Class' annualized net expense ratio (as disclosed), multiplied by the average account value over the period, and multiplied by 184/366 (to reflect the most recent one-half year period).
** Annualized.
*** Refer to Note F in the Notes to Financial Statements for discussion of prior period custodian out-of-pocket expenses that were reimbursed in the current period.
3
Morgan Stanley Institutional Fund, Inc.
Annual Report — December 31, 2016
Investment Overview (unaudited)
Global Opportunity Portfolio
The Portfolio seeks long-term capital appreciation.
Performance
For the year ended December 31, 2016, the Portfolio's Class I shares had a total return based on net asset value and reinvestment of distributions per share of 1.05%, net of fees. The Portfolio's Class I shares underperformed the Portfolio's benchmark, the MSCI All Country World Index (the "Index"), which returned 7.86%.
Factors Affecting Performance
• Global equities rose 7.86% for the 12-month period, as measured by the Index. The Index was led by strong performance from the U.S. and emerging markets, while Japan and Europe lagged. Early in the year, worries about weak global growth and disinflation drove share prices lower. However, sentiment brightened as commodity prices bottomed, China's economy stabilized, the U.S. economy strengthened and global central banks remained accommodative. In the second half of the year, equity markets largely shrugged off the Brexit referendum's surprise outcome and the U.S., in particular, rallied strongly following the unexpected election of Donald Trump on anticipation of pro-growth, reflationary policy from the new administration.
• For the period, the Portfolio underperformed the Index due to unfavorable stock selection and sector allocation.
• Detractors from relative returns included our stock selection in the information technology, consumer staples, health care and industrials sectors. An underweight to the energy sector was also disadvantageous to performance.
• Stock selection in the consumer discretionary sector contributed positively to relative performance, as did an overweight to information technology and underweight allocations to health care, utilities and real estate.
Management Strategies
• There were no changes to our bottom-up investment process during the period. The Growth Team seeks high quality companies, which we define primarily as those with sustainable competitive advantages. Our team continues to
focus on bottom-up stock selection and the long-term outlook for companies owned in the Portfolio; accordingly, we have had very limited turnover in the Portfolio to date, as our ongoing work reaffirms our assessment of quality and competitive advantage in the names we own.
• At the close of the period, information technology represented the largest sector weight in the Portfolio, followed by consumer discretionary and consumer staples. The team's bottom-up investment process resulted in sector overweight positions in information technology, consumer discretionary and consumer staples, and underweight positions in financials, energy, health care, industrials, materials, telecommunication services, utilities and real estate.

* Minimum Investment for Class I shares
** Commenced Operations on May 30, 2008.
In accordance with SEC regulations, the Portfolio's performance shown assumes that all recurring fees (including management fees) were deducted and all dividends and distributions were reinvested. The performance of Class A, L , C and IS shares will vary from the performance of Class I shares based upon their different inception dates and will be impacted by additional fees assessed to those classes (if applicable).
4
Morgan Stanley Institutional Fund, Inc.
Annual Report — December 31, 2016
Investment Overview (unaudited) (cont'd)
Global Opportunity Portfolio
Performance Compared to the MSCI All Country World Index(1) and the Lipper Global Multi-Cap Growth Funds Index(2)
| | | Period Ended December 31, 2016
Total Returns(3) | |
| | | | | Average Annual | |
| | | One
Year | | Five
Years | | Ten
Years | | Since
Inception(7) | |
Portfolio — Class I Shares
w/o sales charges(4) | | | 1.05 | % | | | 15.01 | % | | | — | | | | 9.76 | % | |
Portfolio — Class A Shares
w/o sales charges(4) | | | 0.62 | | | | 14.62 | | | | — | | | | 14.97 | | |
Portfolio — Class A Shares
with maximum 5.25%
sales charges(4) | | | –4.67 | | | | 13.38 | | | | — | | | | 14.03 | | |
Portfolio — Class L Shares
w/o sales charges(4) | | | 0.56 | | | | 14.55 | | | | — | | | | 9.36 | | |
Portfolio — Class C Shares
w/o sales charges(6) | | | 0.05 | | | | — | | | | — | | | | 2.96 | | |
Portfolio — Class C Shares
with maximum 1.00%
deferred sales charges(6) | | | –0.88 | | | | — | | | | — | | | | 2.96 | | |
Portfolio — Class IS Shares
w/o sales charges(5) | | | 1.11 | | | | — | | | | — | | | | 14.14 | | |
MSCI All Country World Index | | | 7.86 | | | | 9.36 | | | | — | | | | 3.16 | | |
Lipper Global Multi-Cap Growth
Funds Index | | | 2.90 | | | | 9.26 | | | | — | | | | 3.56 | | |
Performance data quoted represents past performance, which is no guarantee of future results, and current performance may be lower or higher than the figures shown. Performance assumes that all dividends and distributions, if any, were reinvested. For the most recent month-end performance figures, please visit www.morganstanley.com/im. Investment return and principal value will fluctuate so that Portfolio shares, when redeemed, may be worth more or less than their original cost. Total returns do not reflect the deduction of taxes that a shareholder would pay on Portfolio distributions or the redemption of Portfolio shares. Performance of share classes will vary due to difference in sales charges and expenses.
(1) The MSCI All Country World Index (ACWI) is a free float-adjusted market capitalization weighted index designed to measure the equity market performance of developed and emerging markets. The term "free float" represents the portion of shares outstanding that are deemed to be available for purchase in the public equity markets by investors. The Index is unmanaged and its returns do not include any sales charges or fees. Such costs would lower performance. It is not possible to invest directly in an index.
(2) The Lipper Global Multi-Cap Growth Funds Index is an equally weighted performance index of the largest qualifying funds (based on net assets) in the Lipper Global Multi-Cap Growth Funds classification. The Index, which is adjusted for capital gains distributions and income dividends, is unmanaged and should not be considered an investment. There are currently 30 funds represented in this Index. As of the date of this report, the Portfolio is in the Lipper Global Multi-Cap Growth Funds classification.
(3) Total returns for the Portfolio reflect fees waived and expenses reimbursed, if applicable, by the Adviser. Without such waivers and reimbursements, total returns would have been lower.
(4) On May 21, 2010 Class C and Class I shares of Van Kampen Global Growth Fund ("the Predecessor Fund") were reorganized into Class L and Class I shares of Morgan Stanley Global Growth Portfolio ("the Portfolio"), respectively. Class L and Class I shares' returns of the Portfolio will differ from the Predecessor Fund as they have different expenses. Performance shown for the Portfolio's Class I and Class L shares reflects the performance of the shares of the Predecessor Fund for periods prior to May 21, 2010. The Class C and I shares of the Predecessor Fund commenced operations on May 30, 2008. Class P shares, which were renamed Class A shares effective September 9, 2013, commenced operations on May 21, 2010. In October 2010, the Morgan Stanley Global Growth Portfolio changed its name to the Morgan Stanley Global Opportunity Portfolio.
(5) Commenced offering on September 13, 2013.
(6) Commenced offering on April 30, 2015.
(7) For comparative purposes, average annual since inception returns listed for the Indexes refer to the inception date of Class I of the Portfolio, not the inception of the Index.
5
Morgan Stanley Institutional Fund, Inc.
Annual Report — December 31, 2016
Portfolio of Investments
Global Opportunity Portfolio
| | | Shares | | Value
(000) | |
Common Stocks (92.8%) | |
Australia (0.0%) | |
AET&D Holdings No. 1 Ltd. (a)(b)(c) | | | 36,846 | | | $ | — | | |
Belgium (1.4%) | |
Anheuser-Busch InBev N.V. | | | 89,945 | | | | 9,520 | | |
China (15.1%) | |
China Resources Beer Holdings
Company Ltd. (a)(d) | | | 7,649,333 | | | | 15,191 | | |
Foshan Haitian Flavouring &
Food Co., Ltd., Class A | | | 2,924,674 | | | | 12,343 | | |
Jiangsu Hengrui Medicine Co., Ltd., Class A | | | 2,558,023 | | | | 16,748 | | |
TAL Education Group ADR (a) | | | 492,185 | | | | 34,527 | | |
Tencent Holdings Ltd. (d) | | | 848,600 | | | | 20,760 | | |
| | | | 99,569 | | |
Denmark (4.9%) | |
DSV A/S | | | 730,591 | | | | 32,503 | | |
France (5.9%) | |
Christian Dior SE | | | 73,141 | | | | 15,340 | | |
Hermes International | | | 57,527 | | | | 23,617 | | |
| | | | 38,957 | | |
India (0.2%) | |
Monsanto India Ltd. | | | 33,194 | | | | 1,097 | | |
Japan (3.8%) | |
Calbee, Inc. | | | 492,100 | | | | 15,410 | | |
Keyence Corp. | | | 13,700 | | | | 9,401 | | |
| | | | 24,811 | | |
Korea, Republic of (4.0%) | |
Amorepacific Corp. | | | 46,747 | | | | 12,444 | | |
Loen Entertainment, Inc. (a) | | | 101,430 | | | | 6,374 | | |
Medy-Tox, Inc. | | | 26,703 | | | | 7,884 | | |
| | | | 26,702 | | |
Netherlands (5.3%) | |
Priceline Group, Inc. (The) (a) | | | 23,613 | | | | 34,618 | | |
South Africa (2.8%) | |
Naspers Ltd., Class N | | | 125,499 | | | | 18,405 | | |
United Kingdom (5.1%) | |
Burberry Group PLC | | | 606,549 | | | | 11,190 | | |
Fevertree Drinks PLC | | | 578,192 | | | | 8,116 | | |
Reckitt Benckiser Group PLC | | | 168,441 | | | | 14,295 | | |
| | | | 33,601 | | |
United States (44.3%) | |
Alphabet, Inc., Class C (a) | | | 29,829 | | | | 23,023 | | |
Amazon.com, Inc. (a) | | | 53,858 | | | | 40,386 | | |
Cognizant Technology Solutions Corp.,
Class A (a) | | | 527,682 | | | | 29,566 | | |
EPAM Systems, Inc. (a) | | | 567,992 | | | | 36,528 | | |
Facebook, Inc., Class A (a) | | | 500,971 | | | | 57,637 | | |
Globant SA (a) | | | 235,208 | | | | 7,844 | | |
Luxoft Holding, Inc. (a) | | | 546,696 | | | | 30,724 | | |
Mastercard, Inc., Class A | | | 293,508 | | | | 30,305 | | |
| | | Shares | | Value
(000) | |
Visa, Inc., Class A | | | 360,090 | | | $ | 28,094 | | |
WisdomTree Investments, Inc. | | | 698,067 | | | | 7,776 | | |
| | | | 291,883 | | |
Total Common Stocks (Cost $499,206) | | | 611,666 | | |
Preferred Stocks (2.3%) | |
India (0.0%) | |
Flipkart Online Services Pvt Ltd. Series D (a)(b)(c)(e)
(acquisition cost — $52; acquired 10/4/13) | | | 2,242 | | | | 113 | | |
United States (2.3%) | |
Airbnb, Inc. Series D (a)(b)(c)(e)
(acquisition cost — $1,594;
acquired 4/16/14) | | | 39,153 | | | | 4,115 | | |
Magic Leap Series C (a)(b)(c)(e)
(acquisition cost — $3,175;
acquired 12/22/15) | | | 137,829 | | | | 3,085 | | |
Uber Technologies Series G (a)(b)(c)(e)
(acquisition cost — $8,232;
acquired 12/3/15) | | | 168,793 | | | | 8,232 | | |
| | | | 15,432 | | |
Total Preferred Stocks (Cost $13,053) | | | 15,545 | | |
Participation Note (2.7%) | |
China (2.7%) | |
Jiangsu Yanghe Brewery, Class A, Equity Linked
Notes, expires 1/23/17 (a) (Cost $17,282) | | | 1,726,004 | | | | 17,534 | | |
| | | Notional
Amount
(000) | | | |
Call Options Purchased (0.0%) | |
Foreign Currency Option (0.0%) | |
USD/CNY May 2017 @ CNY 7.90,
Royal Bank of Scotland (Cost $357) | | | 87,226 | | | | 326 | | |
| | | Shares | | | |
Short-Term Investment (2.8%) | |
Investment Company (2.8%) | |
Morgan Stanley Institutional Liquidity
Funds — Treasury Securities Portfolio —
Institutional Class (See Note G)
(Cost $18,397) | | | 18,396,705 | | | | 18,397 | | |
Total Investments (100.6%)
(Cost $548,295) (f) | | | 663,468 | | |
Liabilities in Excess of Other Assets (–0.6%) | | | (4,232 | ) | |
Net Assets (100.0%) | | $ | 659,236 | | |
Country assignments and aggregations are based generally on third party vendor classifications and information, and may be different from the assignments and aggregations under the policies set forth in the Portfolio's prospectus and/or statement of additional information relating to geographic classifications.
(a) Non-income producing security.
(b) Security has been deemed illiquid at December 31, 2016.
(c) At December 31, 2016, the Portfolio held fair valued securities valued at approximately $15,545,000, representing 2.4% of net assets. These securities have been fair valued as determined in good faith under procedures established by and under the general supervision of the Fund's Directors.
The accompanying notes are an integral part of the financial statements.
6
Morgan Stanley Institutional Fund, Inc.
Annual Report — December 31, 2016
Portfolio of Investments (cont'd)
Global Opportunity Portfolio
(d) Security trades on the Hong Kong exchange.
(e) Security cannot be offered for public resale without first being registered under the Securities Act of 1933 and related rules ("restricted security"). Acquisition date represents the day on which an enforceable right to acquire such security is obtained and is presented along with related cost in the security description. The Portfolio has registration rights for certain restricted securities. Any costs related to such registration are borne by the issuer. The aggregate value of restricted securities (excluding 144A holdings) at December 31, 2016, amounts to approximately $15,545,000 and represents 2.4% of net assets.
(f) At December 31, 2016, the aggregate cost for federal income tax purposes is approximately $551,233,000. The aggregate gross unrealized appreciation is approximately $132,981,000 and the aggregate gross unrealized depreciation is approximately $20,746,000, resulting in net unrealized appreciation of approximately $112,235,000.
ADR American Depositary Receipt.
CNY Chinese Yuan Renminbi
USD United States Dollar.
Portfolio Composition
Classification | | Percentage of
Total Investments | |
Other* | | | 27.8 | % | |
Information Technology Services | | | 23.4 | | |
Internet Software & Services | | | 15.3 | | |
Internet & Direct Marketing Retail | | | 13.2 | | |
Beverages | | | 7.6 | | |
Textiles, Apparel & Luxury Goods | | | 7.5 | | |
Diversified Consumer Services | | | 5.2 | | |
Total Investments | | | 100.0 | % | |
* Industries and/or investment types representing less than 5% of total investments.
The accompanying notes are an integral part of the financial statements.
7
Morgan Stanley Institutional Fund, Inc.
Annual Report — December 31, 2016
Global Opportunity Portfolio
Statement of Assets and Liabilities | | December 31, 2016
(000) | |
Assets: | |
Investments in Securities of Unaffiliated Issuers, at Value (Cost $529,898) | | $ | 645,071 | | |
Investment in Security of Affiliated Issuer, at Value (Cost $18,397) | | | 18,397 | | |
Total Investments in Securities, at Value (Cost $548,295) | | | 663,468 | | |
Foreign Currency, at Value (Cost $58) | | | 58 | | |
Receivable for Portfolio Shares Sold | | | 732 | | |
Dividends Receivable | | | 103 | | |
Tax Reclaim Receivable | | | 65 | | |
Receivable for Investments Sold | | | 11 | | |
Receivable from Affiliate | | | 4 | | |
Other Assets | | | 57 | | |
Total Assets | | | 664,498 | | |
Liabilities: | |
Payable for Portfolio Shares Redeemed | | | 3,474 | | |
Payable for Advisory Fees | | | 1,019 | | |
Due to Broker | | | 280 | | |
Payable for Shareholder Services Fees — Class A | | | 73 | | |
Payable for Distribution and Shareholder Services Fees — Class L | | | 8 | | |
Payable for Distribution and Shareholder Services Fees — Class C | | | 29 | | |
Payable for Transfer Agency Fees — Class I | | | 3 | | |
Payable for Transfer Agency Fees — Class A | | | 88 | | |
Payable for Transfer Agency Fees — Class L | | | 12 | | |
Payable for Transfer Agency Fees — Class C | | | 2 | | |
Payable for Transfer Agency Fees — Class IS | | | — | @ | |
Payable for Sub Transfer Agency Fees — Class I | | | 39 | | |
Payable for Sub Transfer Agency Fees — Class A | | | 51 | | |
Payable for Sub Transfer Agency Fees — Class L | | | 5 | | |
Payable for Sub Transfer Agency Fees — Class C | | | 2 | | |
Payable for Professional Fees | | | 52 | | |
Payable for Administration Fees | | | 46 | | |
Payable for Custodian Fees | | | 40 | | |
Other Liabilities | | | 39 | | |
Total Liabilities | | | 5,262 | | |
Net Assets | | $ | 659,236 | | |
Net Assets Consist Of: | |
Paid-in-Capital | | $ | 548,743 | | |
Accumulated Net Investment Loss | | | (356 | ) | |
Accumulated Net Realized Loss | | | (4,324 | ) | |
Unrealized Appreciation (Depreciation) on: | |
Investments | | | 115,173 | | |
Foreign Currency Translations | | | — | @ | |
Net Assets | | $ | 659,236 | | |
The accompanying notes are an integral part of the financial statements.
8
Morgan Stanley Institutional Fund, Inc.
Annual Report — December 31, 2016
Global Opportunity Portfolio
Statement of Assets and Liabilities (cont'd) | | December 31, 2016
(000) | |
CLASS I: | |
Net Assets | | $ | 255,187 | | |
| Shares Outstanding $0.001 par value shares of beneficial interest (unlimited shares authorized) (not in 000's) | | | 16,559,340 | | |
Net Asset Value, Offering and Redemption Price Per Share | | $ | 15.41 | | |
CLASS A: | |
Net Assets | | $ | 340,092 | | |
| Shares Outstanding $0.001 par value shares of beneficial interest (unlimited shares authorized) (not in 000's) | | | 22,650,625 | | |
Net Asset Value, Redemption Price Per Share | | $ | 15.01 | | |
Maximum Sales Load | | | 5.25 | % | |
Maximum Sales Charge | | $ | 0.83 | | |
Maximum Offering Price Per Share | | $ | 15.84 | | |
CLASS L: | |
Net Assets | | $ | 30,133 | | |
| Shares Outstanding $0.001 par value shares of beneficial interest (unlimited shares authorized) (not in 000's) | | | 2,029,960 | | |
Net Asset Value, Offering and Redemption Price Per Share | | $ | 14.84 | | |
CLASS C: | |
Net Assets | | $ | 33,801 | | |
| Shares Outstanding $0.001 par value shares of beneficial interest (unlimited shares authorized) (not in 000's) | | | 2,301,483 | | |
Net Asset Value, Offering and Redemption Price Per Share | | $ | 14.69 | | |
CLASS IS: | |
Net Assets | | $ | 23 | | |
| Shares Outstanding $0.001 par value shares of beneficial interest (unlimited shares authorized) (not in 000's) | | | 1,497 | | |
Net Asset Value, Offering and Redemption Price Per Share | | $ | 15.44 | | |
@ Amount is less than $500.
The accompanying notes are an integral part of the financial statements.
9
Morgan Stanley Institutional Fund, Inc.
Annual Report — December 31, 2016
Global Opportunity Portfolio
Statement of Operations | | Year Ended
December 31, 2016
(000) | |
Investment Income: | |
Dividends from Securities of Unaffiliated Issuers (Net of $200 of Foreign Taxes Withheld) | | $ | 3,013 | | |
Dividends from Security of Affiliated Issuer (Note G) | | | 70 | | |
Total Investment Income | | | 3,083 | | |
Expenses: | |
Advisory Fees (Note B) | | | 5,291 | | |
Shareholder Services Fees — Class A (Note D) | | | 872 | | |
Distribution and Shareholder Services Fees — Class L (Note D) | | | 239 | | |
Distribution and Shareholder Services Fees — Class C (Note D) | | | 307 | | |
Sub Transfer Agency Fees — Class I | | | 293 | | |
Sub Transfer Agency Fees — Class A | | | 373 | | |
Sub Transfer Agency Fees — Class L | | | 29 | | |
Sub Transfer Agency Fees — Class C | | | 31 | | |
Administration Fees (Note C) | | | 529 | | |
Transfer Agency Fees — Class I (Note E) | | | 12 | | |
Transfer Agency Fees — Class A (Note E) | | | 352 | | |
Transfer Agency Fees — Class L (Note E) | | | 45 | | |
Transfer Agency Fees — Class C (Note E) | | | 9 | | |
Transfer Agency Fees — Class IS (Note E) | | | 2 | | |
Registration Fees | | | 129 | | |
Custodian Fees (Note F) | | | 125 | | |
Professional Fees | | | 91 | | |
Shareholder Reporting Fees | | | 87 | | |
Directors' Fees and Expenses | | | 14 | | |
Pricing Fees | | | 5 | | |
Other Expenses | | | 22 | | |
Total Expenses | | | 8,857 | | |
Waiver of Advisory Fees (Note B) | | | (1,421 | ) | |
Distribution Fees — Class L Shares Waived (Note D) | | | (144 | ) | |
Reimbursement of Class Specific Expenses — Class I (Note B) | | | (80 | ) | |
Reimbursement of Class Specific Expenses — Class IS (Note B) | | | (2 | ) | |
Rebate from Morgan Stanley Affiliate (Note G) | | | (42 | ) | |
Reimbursement of Custodian Fees (Note F) | | | (110 | ) | |
Net Expenses | | | 7,058 | | |
Net Investment Loss | | | (3,975 | ) | |
Realized Gain (Loss): | |
Investments Sold | | | 1,534 | | |
Foreign Currency Transactions | | | (389 | ) | |
Net Realized Gain | | | 1,145 | | |
Change in Unrealized Appreciation (Depreciation): | |
Investments | | | 4,474 | | |
Foreign Currency Translations | | | 7 | | |
Net Change in Unrealized Appreciation (Depreciation) | | | 4,481 | | |
Net Realized Gain and Change in Unrealized Appreciation (Depreciation) | | | 5,626 | | |
Net Increase in Net Assets Resulting from Operations | | $ | 1,651 | | |
The accompanying notes are an integral part of the financial statements.
10
Morgan Stanley Institutional Fund, Inc.
Annual Report — December 31, 2016
Global Opportunity Portfolio
Statements of Changes in Net Assets | | Year Ended
December 31, 2016
(000) | | Year Ended
December 31, 2015
(000) | |
Increase (Decrease) in Net Assets: | |
Operations: | |
Net Investment Loss | | $ | (3,975 | ) | | $ | (671 | ) | |
Net Realized Gain | | | 1,145 | | | | 40,641 | | |
Net Change in Unrealized Appreciation (Depreciation) | | | 4,481 | | | | (35,586 | ) | |
Net Increase in Net Assets Resulting from Operations | | | 1,651 | | | | 4,384 | | |
Distributions from and/or in Excess of: | |
Class I: | |
Net Realized Gain | | | (16,271 | ) | | | (1,177 | ) | |
Class A: | |
Net Realized Gain | | | (24,570 | ) | | | (910 | ) | |
Class L: | |
Net Realized Gain | | | (2,200 | ) | | | (40 | ) | |
Class C: | |
Net Realized Gain | | | (2,241 | ) | | | (123 | ) | |
Class IS: | |
Net Realized Gain | | | (1 | ) | | | (— | @) | |
Total Distributions | | | (45,283 | ) | | | (2,250 | ) | |
Capital Share Transactions:(1) | |
Class I: | |
Subscribed | | | 211,096 | | | | 163,052 | | |
Issued due to a Tax-free Reorganization | | | — | | | | 77,071 | | |
Distributions Reinvested | | | 16,238 | | | | 1,081 | | |
Redeemed | | | (193,977 | ) | | | (16,394 | ) | |
Class A: | |
Subscribed | | | 141,333 | | | | 113,695 | | |
Issued due to a Tax-free Reorganization | | | — | | | | 235,675 | | |
Distributions Reinvested | | | 24,039 | | | | 906 | | |
Redeemed | | | (150,389 | ) | | | (14,930 | ) | |
Class L: | |
Exchanged | | | 14 | | | | — | | |
Subscribed | | | — | | | | 2,004 | | |
Issued due to a Tax-free Reorganization | | | — | | | | 32,385 | | |
Distributions Reinvested | | | 2,026 | | | | 38 | | |
Redeemed | | | (4,432 | ) | | | (558 | ) | |
Class C: | |
Subscribed | | | 21,727 | | | | 21,201 | * | |
Distributions Reinvested | | | 2,240 | | | | 122 | * | |
Redeemed | | | (8,851 | ) | | | (869 | )* | |
Class IS: | |
Subscribed | | | 39 | | | | 7 | | |
Issued due to a Tax-free Reorganization | | | — | | | | 799 | | |
Distributions Reinvested | | | 1 | | | | — | | |
Redeemed | | | (746 | ) | | | — | | |
Net Increase in Net Assets Resulting from Capital Share Transactions | | | 60,358 | | | | 615,285 | | |
Total Increase in Net Assets | | | 16,726 | | | | 617,419 | | |
Net Assets: | |
Beginning of Period | | | 642,510 | | | | 25,091 | | |
End of Period (Including Accumulated Net Investment Loss of $(356) and $(9)) | | $ | 659,236 | | | $ | 642,510 | | |
The accompanying notes are an integral part of the financial statements.
11
Morgan Stanley Institutional Fund, Inc.
Annual Report — December 31, 2016
Global Opportunity Portfolio
Statements of Changes in Net Assets (cont'd) | | Year Ended
December 31, 2016
(000) | | Year Ended
December 31, 2015
(000) | |
(1) Capital Share Transactions: | |
Class I: | |
Shares Subscribed | | | 13,488 | | | | 10,166 | | |
Shares Issued due to a Tax-free Reorganization | | | — | | | | 4,618 | | |
Shares Issued on Distributions Reinvested | | | 1,084 | | | | 65 | | |
Shares Redeemed | | | (12,614 | ) | | | (1,038 | ) | |
Net Increase in Class I Shares Outstanding | | | 1,958 | | | | 13,811 | | |
Class A: | |
Shares Subscribed | | | 9,197 | | | | 7,220 | | |
Shares Issued due to a Tax-free Reorganization | | | — | | | | 14,414 | | |
Shares Issued on Distributions Reinvested | | | 1,646 | | | | 56 | | |
Shares Redeemed | | | (9,883 | ) | | | (941 | ) | |
Net Increase in Class A Shares Outstanding | | | 960 | | | | 20,749 | | |
Class L: | |
Shares Exchanged | | | 1 | | | | — | | |
Shares Subscribed | | | — | | | | 136 | | |
Shares Issued due to a Tax-free Reorganization | | | — | | | | 2,000 | | |
Shares Issued on Distributions Reinvested | | | 140 | | | | 2 | | |
Shares Redeemed | | | (293 | ) | | | (36 | ) | |
Net Increase (Decrease) in Class L Shares Outstanding | | | (152 | ) | | | 2,102 | | |
Class C: | |
Shares Subscribed | | | 1,439 | | | | 1,345 | * | |
Shares Issued on Distributions Reinvested | | | 156 | | | | 8 | * | |
Shares Redeemed | | | (589 | ) | | | (57 | )* | |
Net Increase in Class C Shares Outstanding | | | 1,006 | | | | 1,296 | | |
Class IS: | |
Shares Subscribed | | | 3 | | | | — | @@ | |
Shares Issued due to a Tax-free Reorganization | | | — | | | | 48 | | |
Shares Issued on Distributions Reinvested | | | — | @@ | | | — | | |
Shares Redeemed | | | (51 | ) | | | — | | |
Net Increase (Decrease) in Class IS Shares Outstanding | | | (48 | ) | | | 48 | | |
* For the period April 30, 2015 through December 31, 2015.
@ Amount is less than $500.
@@ Amount is less than 500 shares.
The accompanying notes are an integral part of the financial statements.
12
Morgan Stanley Institutional Fund, Inc.
Annual Report — December 31, 2016
Financial Highlights
Global Opportunity Portfolio
| | | Class I | |
| | | Year Ended December 31, | |
Selected Per Share Data and Ratios | | 2016(1) | | 2015 | | 2014 | | 2013 | | 2012 | |
Net Asset Value, Beginning of Period | | $ | 16.36 | | | $ | 13.98 | | | $ | 13.65 | | | $ | 10.84 | | | $ | 10.26 | | |
Income (Loss) from Investment Operations: | |
Net Investment Income (Loss) (2) | | | (0.05 | ) | | | (0.05 | ) | | | (0.06 | ) | | | (0.02 | ) | | | 0.01 | | |
Net Realized and Unrealized Gain | | | 0.18 | | | | 2.64 | | | | 1.26 | | | | 4.21 | | | | 1.01 | | |
Total from Investment Operations | | | 0.13 | | | | 2.59 | | | | 1.20 | | | | 4.19 | | | | 1.02 | | |
Distributions from and/or in Excess of: | |
Net Realized Gain | | | (1.08 | ) | | | (0.21 | ) | | | (0.87 | ) | | | (1.38 | ) | | | (0.44 | ) | |
Net Asset Value, End of Period | | $ | 15.41 | | | $ | 16.36 | | | $ | 13.98 | | | $ | 13.65 | | | $ | 10.84 | | |
Total Return (3) | | | 1.05 | % | | | 18.50 | % | | | 9.04 | % | | | 40.12 | % | | | 9.99 | % | |
Ratios and Supplemental Data: | |
Net Assets, End of Period (Thousands) | | $ | 255,187 | | | $ | 238,920 | | | $ | 11,037 | | | $ | 7,293 | | | $ | 5,069 | | |
Ratio of Expenses to Average Net Assets (7) | | | 0.80 | %(4) | | | 0.98 | %(4)(5) | | | 1.17 | %(4) | | | 1.24 | %(4) | | | 1.25 | %(4) | |
Ratio of Net Investment Income (Loss) to Average Net Assets (7) | | | (0.34 | )%(4) | | | (0.33 | )%(4) | | | (0.42 | )%(4) | | | (0.21 | )%(4) | | | 0.06 | %(4) | |
Ratio of Rebate from Morgan Stanley Affiliates to Average Net Assets | | | 0.01 | % | | | 0.01 | % | | | 0.01 | % | | | 0.00 | %(6) | | | 0.00 | %(6) | |
Portfolio Turnover Rate | | | 37 | % | | | 115 | % | | | 29 | % | | | 38 | % | | | 33 | % | |
(7) Supplemental Information on the Ratios to Average Net Assets: | |
Ratios Before Expense Limitation: | |
Expenses to Average Net Assets | | | 1.07 | % | | | 1.20 | % | | | 2.47 | % | | | 3.36 | % | | | 2.57 | % | |
Net Investment Loss to Average Net Assets | | | (0.61 | )% | | | (0.55 | )% | | | (1.72 | )% | | | (2.33 | )% | | | (1.26 | )% | |
(1) Refer to Note F in the Notes to Financial Statements for discussion of prior period custodian out-of-pocket expenses that were reimbursed in the current period. The amount of the reimbursement was immaterial on a per share basis and did not impact the total return of Class I shares. The Ratio of Expenses to Average Net Assets and the Ratio of Net Investment Loss to Average Net Assets would be unchanged as the reimbursement of custodian fees was offset against current period expense waivers/reimbursements with no impact to net expenses or net investment loss.
(2) Per share amount is based on average shares outstanding.
(3) Calculated based on the net asset value as of the last business day of the period.
(4) The Ratios of Expenses and Net Investment Income (Loss) reflect the rebate of certain Portfolio expenses in connection with the investments in Morgan Stanley affiliates during the period. The effect of the rebate on the ratios is disclosed in the above table as "Ratio of Rebate from Morgan Stanley Affiliates to Average Net Assets."
(5) Effective December 7, 2015, the Adviser has agreed to limit the ratio of expenses to average net assets to the maximum ratio of 0.81% for Class I shares. Prior to December 7, 2015, the maximum ratio was 1.10% for Class I shares. Prior to January 23, 2015, the maximum ratio was 1.25% for Class I shares.
(6) Amount is less than 0.005%.
The accompanying notes are an integral part of the financial statements.
13
Morgan Stanley Institutional Fund, Inc.
Annual Report — December 31, 2016
Financial Highlights
Global Opportunity Portfolio
| | | Class A | |
| | | Year Ended December 31, | |
Selected Per Share Data and Ratios | | 2016(1) | | 2015 | | 2014 | | 2013 | | 2012 | |
Net Asset Value, Beginning of Period | | $ | 16.03 | | | $ | 13.75 | | | $ | 13.48 | | | $ | 10.75 | | | $ | 10.21 | | |
Income (Loss) from Investment Operations: | |
Net Investment Loss (2) | | | (0.11 | ) | | | (0.10 | ) | | | (0.11 | ) | | | (0.15 | ) | | | (0.02 | ) | |
Net Realized and Unrealized Gain | | | 0.17 | | | | 2.59 | | | | 1.25 | | | | 4.26 | | | | 1.00 | | |
Total from Investment Operations | | | 0.06 | | | | 2.49 | | | | 1.14 | | | | 4.11 | | | | 0.98 | | |
Distributions from and/or in Excess of: | |
Net Realized Gain | | | (1.08 | ) | | | (0.21 | ) | | | (0.87 | ) | | | (1.38 | ) | | | (0.44 | ) | |
Net Asset Value, End of Period | | $ | 15.01 | | | $ | 16.03 | | | $ | 13.75 | | | $ | 13.48 | | | $ | 10.75 | | |
Total Return (3) | | | 0.62 | % | | | 18.16 | % | | | 8.55 | % | | | 39.80 | % | | | 9.65 | % | |
Ratios and Supplemental Data: | |
Net Assets, End of Period (Thousands) | | $ | 340,092 | | | $ | 347,683 | | | $ | 12,952 | | | $ | 4,057 | | | $ | 87 | | |
Ratio of Expenses to Average Net Assets (8) | | | 1.17 | %(4) | | | 1.25 | %(4)(6) | | | 1.56 | %(4) | | | 1.59 | %(4)(5) | | | 1.50 | %(4) | |
Ratio of Net Investment Loss to Average Net Assets (8) | | | (0.70 | )%(4) | | | (0.64 | )%(4) | | | (0.82 | )%(4) | | | (1.15 | )%(4) | | | (0.19 | )%(4) | |
Ratio of Rebate from Morgan Stanley Affiliates to Average Net Assets | | | 0.01 | % | | | 0.01 | % | | | 0.01 | % | | | 0.00 | %(7) | | | 0.00 | %(7) | |
Portfolio Turnover Rate | | | 37 | % | | | 115 | % | | | 29 | % | | | 38 | % | | | 33 | % | |
(8) Supplemental Information on the Ratios to Average Net Assets: | |
Ratios Before Expense Limitation: | |
Expenses to Average Net Assets | | | 1.41 | % | | | 1.50 | % | | | 2.86 | % | | | 3.93 | % | | | 2.82 | % | |
Net Investment Loss to Average Net Assets | | | (0.94 | )% | | | (0.89 | )% | | | (2.12 | )% | | | (3.49 | )% | | | (1.51 | )% | |
(1) Refer to Note F in the Notes to Financial Statements for discussion of prior period custodian out-of-pocket expenses that were reimbursed in the current period. The amount of the reimbursement was immaterial on a per share basis and did not impact the total return of Class A shares. The Ratio of Expenses to Average Net Assets and the Ratio of Net Investment Loss to Average Net Assets would be unchanged as the reimbursement of custodian fees was offset against current period expense waivers/reimbursements with no impact to net expenses or net investment loss.
(2) Per share amount is based on average shares outstanding.
(3) Calculated based on the net asset value which does not reflect sales charges, if applicable, as of the last business day of the period.
(4) The Ratios of Expenses and Net Investment Loss reflect the rebate of certain Portfolio expenses in connection with the investments in Morgan Stanley affiliates during the period. The effect of the rebate on the ratios is disclosed in the above table as "Ratio of Rebate from Morgan Stanley Affiliates to Average Net Assets."
(5) Effective September 16, 2013, the Adviser has agreed to limit the ratio of expenses to average net assets to the maximum ratio of 1.60% for Class A shares. Prior to September 16, 2013, the maximum ratio was 1.50% for Class A shares.
(6) Effective December 7, 2015, the Adviser has agreed to limit the ratio of expenses to average net assets to the maximum ratio of 1.23% for Class A shares. Prior to December 7, 2015, the maximum ratio was 1.45% for Class A shares. Prior to January 23, 2015, the maximum ratio was 1.60% for Class A shares.
(7) Amount is less than 0.005%.
The accompanying notes are an integral part of the financial statements.
14
Morgan Stanley Institutional Fund, Inc.
Annual Report — December 31, 2016
Financial Highlights
Global Opportunity Portfolio
| | | Class L | |
| | | Year Ended December 31, | |
Selected Per Share Data and Ratios | | 2016(1) | | 2015 | | 2014 | | 2013 | | 2012 | |
Net Asset Value, Beginning of Period | | $ | 15.87 | | | $ | 13.62 | | | $ | 13.38 | | | $ | 10.68 | | | $ | 10.15 | | |
Income (Loss) from Investment Operations: | |
Net Investment Loss (2) | | | (0.12 | ) | | | (0.11 | ) | | | (0.12 | ) | | | (0.07 | ) | | | (0.03 | ) | |
Net Realized and Unrealized Gain | | | 0.17 | | | | 2.57 | | | | 1.23 | | | | 4.15 | | | | 1.00 | | |
Total from Investment Operations | | | 0.05 | | | | 2.46 | | | | 1.11 | | | | 4.08 | | | | 0.97 | | |
Distributions from and/or in Excess of: | |
Net Realized Gain | | | (1.08 | ) | | | (0.21 | ) | | | (0.87 | ) | | | (1.38 | ) | | | (0.44 | ) | |
Net Asset Value, End of Period | | $ | 14.84 | | | $ | 15.87 | | | $ | 13.62 | | | $ | 13.38 | | | $ | 10.68 | | |
Total Return (3) | | | 0.56 | % | | | 18.03 | % | | | 8.46 | % | | | 39.79 | % | | | 9.61 | % | |
Ratios and Supplemental Data: | |
Net Assets, End of Period (Thousands) | | $ | 30,133 | | | $ | 34,628 | | | $ | 1,091 | | | $ | 527 | | | $ | 396 | | |
Ratio of Expenses to Average Net Assets (8) | | | 1.25 | %(4) | | | 1.30 | %(4)(6) | | | 1.64 | %(4) | | | 1.58 | %(4)(5) | | | 1.55 | %(4) | |
Ratio of Net Investment Loss to Average Net Assets (8) | | | (0.79 | )%(4) | | | (0.70 | )%(4) | | | (0.87 | )%(4) | | | (0.57 | )%(4) | | | (0.24 | )%(4) | |
Ratio of Rebate from Morgan Stanley Affiliates to Average Net Assets | | | 0.01 | % | | | 0.01 | % | | | 0.01 | % | | | 0.00 | %(7) | | | 0.00 | %(7) | |
Portfolio Turnover Rate | | | 37 | % | | | 115 | % | | | 29 | % | | | 38 | % | | | 33 | % | |
(8) Supplemental Information on the Ratios to Average Net Assets: | |
Ratios Before Expense Limitation: | |
Expenses to Average Net Assets | | | 1.93 | % | | | 2.03 | % | | | 3.52 | % | | | 4.23 | % | | | 3.32 | % | |
Net Investment Loss to Average Net Assets | | | (1.47 | )% | | | (1.43 | )% | | | (2.75 | )% | | | (3.22 | )% | | | (2.01 | )% | |
(1) Refer to Note F in the Notes to Financial Statements for discussion of prior period custodian out-of-pocket expenses that were reimbursed in the current period. The amount of the reimbursement was immaterial on a per share basis and did not impact the total return of Class L shares. The Ratio of Expenses to Average Net Assets and the Ratio of Net Investment Loss to Average Net Assets would be unchanged as the reimbursement of custodian fees was offset against current period expense waivers/reimbursements with no impact to net expenses or net investment loss.
(2) Per share amount is based on average shares outstanding.
(3) Calculated based on the net asset value as of the last business day of the period.
(4) The Ratios of Expenses and Net Investment Loss reflect the rebate of certain Portfolio expenses in connection with the investments in Morgan Stanley affiliates during the period. The effect of the rebate on the ratios is disclosed in the above table as "Ratio of Rebate from Morgan Stanley Affiliates to Average Net Assets."
(5) Effective September 16, 2013, the Adviser has agreed to limit the ratio of expenses to average net assets to the maximum ratio of 1.65% for Class L shares. Prior to September 16, 2013, the maximum ratio was 1.55% for Class L shares.
(6) Effective January 23, 2015, the Adviser has agreed to limit the ratio of expenses to average net assets to the maximum ratio of 1.50% for Class L shares. Prior to January 23, 2015, the maximum ratio was 1.65% for Class L shares.
(7) Amount is less than 0.005%.
The accompanying notes are an integral part of the financial statements.
15
Morgan Stanley Institutional Fund, Inc.
Annual Report — December 31, 2016
Financial Highlights
Global Opportunity Portfolio
| | | Class C | |
Selected Per Share Data and Ratios | | Year Ended
December 31, 2016(1) | | Period from
April 30, 2015(2) to
December 31, 2015 | |
Net Asset Value, Beginning of Period | | $ | 15.80 | | | $ | 15.25 | | |
Income (Loss) from Investment Operations: | |
Net Investment Loss (3) | | | (0.21 | ) | | | (0.15 | ) | |
Net Realized and Unrealized Gain | | | 0.18 | | | | 0.91 | | |
Total from Investment Operations | | | (0.03 | ) | | | 0.76 | | |
Distributions from and/or in Excess of: | |
Net Realized Gain | | | (1.08 | ) | | | (0.21 | ) | |
Net Asset Value, End of Period | | $ | 14.69 | | | $ | 15.80 | | |
Total Return (4) | | | 0.05 | % | | | 4.95 | %(6) | |
Ratios and Supplemental Data: | |
Net Assets, End of Period (Thousands) | | $ | 33,801 | | | $ | 20,475 | | |
Ratio of Expenses to Average Net Assets (8) | | | 1.84 | %(5) | | | 2.03 | %(5)(7) | |
Ratio of Net Investment Loss to Average Net Assets (8) | | | (1.38 | )%(5) | | | (1.40 | )%(5)(7) | |
Ratio of Rebate from Morgan Stanley Affiliates to Average Net Assets | | | 0.01 | % | | | 0.01 | %(7) | |
Portfolio Turnover Rate | | | 37 | % | | | 115 | % | |
(8) Supplemental Information on the Ratios to Average Net Assets: | |
Ratios Before Expense Limitation: | |
Expense to Average Net Assets | | | 2.08 | % | | | 2.22 | %(7) | |
Net Investment Loss to Average Net Assets | | | (1.62 | )% | | | (1.59 | )%(7) | |
(1) Refer to Note F in the Notes to Financial Statements for discussion of prior period custodian out-of-pocket expenses that were reimbursed in the current period. The amount of the reimbursement was immaterial on a per share basis and did not impact the total return of Class C shares. The Ratio of Expenses to Average Net Assets and the Ratio of Net Investment Loss to Average Net Assets would be unchanged as the reimbursement of custodian fees was offset against current period expense waivers/reimbursements with no impact to net expenses or net investment loss.
(2) Commencement of Offering.
(3) Per share amount is based on average shares outstanding.
(4) Calculated based on the net asset value which does not reflect sales charges, if applicable, as of the last business day of the period.
(5) The Ratios of Expenses and Net Investment Loss reflect the rebate of certain Portfolio expenses in connection with the investments in Morgan Stanley affiliates during the period. The effect of the rebate on the ratios is disclosed in the above table as "Ratio of Rebate from Morgan Stanley Affiliates to Average Net Assets."
(6) Not Annualized.
(7) Annualized.
The accompanying notes are an integral part of the financial statements.
16
Morgan Stanley Institutional Fund, Inc.
Annual Report — December 31, 2016
Financial Highlights
Global Opportunity Portfolio
| | | Class IS | |
| | | Year Ended December 31, | | Period from
September 13, 2013(2) to | |
Selected Per Share Data and Ratios | | 2016(1) | | 2015 | | 2014 | | December 31, 2013 | |
Net Asset Value, Beginning of Period | | $ | 16.38 | | | $ | 13.99 | | | $ | 13.65 | | | $ | 12.43 | | |
Income (Loss) from Investment Operations: | |
Net Investment Loss (3) | | | (0.06 | ) | | | (0.05 | ) | | | (0.06 | ) | | | (0.03 | ) | |
Net Realized and Unrealized Gain | | | 0.20 | | | | 2.65 | | | | 1.27 | | | | 2.27 | | |
Total from Investment Operations | | | 0.14 | | | | 2.60 | | | | 1.21 | | | | 2.24 | | |
Distributions from and/or in Excess of: | |
Net Realized Gain | | | (1.08 | ) | | | (0.21 | ) | | | (0.87 | ) | | | (1.02 | ) | |
Net Asset Value, End of Period | | $ | 15.44 | | | $ | 16.38 | | | $ | 13.99 | | | $ | 13.65 | | |
Total Return (4) | | | 1.11 | % | | | 18.64 | % | | | 8.96 | % | | | 18.35 | %(9) | |
Ratios and Supplemental Data: | |
Net Assets, End of Period (Thousands) | | $ | 23 | | | $ | 804 | | | $ | 11 | | | $ | 11 | | |
Ratio of Expenses to Average Net Assets (11) | | | 0.71 | %(5) | | | 0.77 | %(5)(7) | | | 1.17 | %(5) | | | 1.18 | %(5)(6)(10) | |
Ratio of Net Investment Loss to Average Net Assets (11) | | | (0.41 | )%(5) | | | (0.28 | )%(5) | | | (0.42 | )%(5) | | | (0.74 | )%(5)(10) | |
Ratio of Rebate from Morgan Stanley Affiliates to Average Net Assets | | | 0.01 | % | | | 0.01 | % | | | 0.01 | % | | | 0.00 | %(8)(10) | |
Portfolio Turnover Rate | | | 37 | % | | | 115 | % | | | 29 | % | | | 38 | %(9) | |
(11) Supplemental Information on the Ratios to Average Net Assets: | |
Ratios Before Expense Limitation: | |
Expenses to Average Net Assets | | | 3.82 | % | | | 3.56 | % | | | 19.50 | % | | | 8.44 | %(10) | |
Net Investment Loss to Average Net Assets | | | (3.52 | )% | | | (3.07 | )% | | | (18.75 | )% | | | (8.00 | )%(10) | |
(1) Refer to Note F in the Notes to Financial Statements for discussion of prior period custodian out-of-pocket expenses that were reimbursed in the current period. The amount of the reimbursement was immaterial on a per share basis and did not impact the total return of Class IS shares. The Ratio of Expenses to Average Net Assets and the Ratio of Net Investment Loss to Average Net Assets would be unchanged as the reimbursement of custodian fees was offset against current period expense waivers/reimbursements with no impact to net expenses or net investment loss.
(2) Commencement of Offering.
(3) Per share amount is based on average shares outstanding.
(4) Calculated based on the net asset value as of the last business day of the period.
(5) The Ratios of Expenses and Net Investment Loss reflect the rebate of certain Portfolio expenses in connection with the investments in Morgan Stanley affiliates during the period. The effect of the rebate on the ratios is disclosed in the above table as "Ratio of Rebate from Morgan Stanley Affiliates to Average Net Assets."
(6) Effective September 16, 2013, the Adviser has agreed to limit the ratio of expenses to average net assets to the maximum ratio of 1.18% for Class IS shares.
(7) Effective December 7, 2015, the Adviser has agreed to limit the ratio of expenses to average net assets to the maximum ratio of 0.72% for Class IS shares. Prior to December 7, 2015, the maximum ratio was 1.03% for Class IS shares. Prior to January 23, 2015, the maximum ratio was 1.18% for Class IS shares.
(8) Amount is less than 0.005%.
(9) Not Annualized.
(10) Annualized.
The accompanying notes are an integral part of the financial statements.
17
Morgan Stanley Institutional Fund, Inc.
Annual Report — December 31, 2016
Notes to Financial Statements
Morgan Stanley Institutional Fund, Inc. (the "Fund") is registered under the Investment Company Act of 1940, as amended (the "Act"), as an open-end management investment company. The Fund is comprised of twenty-nine separate, active, diversified and non-diversified portfolios (individually referred to as a "Portfolio", collectively as the "Portfolios"). The Fund applies investment company accounting and reporting guidance.
The accompanying financial statements relate to the Global Opportunity Portfolio. The Portfolio seeks long-term capital appreciation.
The Portfolio offers five classes of shares — Class I, Class A, Class L, Class C and Class IS. On April 30, 2015, the Portfolio suspended offering of Class L shares. Existing Class L shareholders may invest through reinvestment of dividends and distributions.
On December 7, 2015, the Portfolio acquired the net assets of the Fund's Opportunity Portfolio ("Opportunity Portfolio"), an open-end investment company. Based on the respective valuations as of the close of business on December 4, 2015, pursuant to a Plan of Reorganization approved by the shareholders of Opportunity Portfolio on November 6, 2015 ("Reorganization"). The purpose of the transaction was to combine two portfolios managed by Morgan Stanley Investment Management Inc., ("the Adviser") with comparable investment objectives and strategies. The acquisition was accomplished by a tax-free exchange of 4,617,804 Class I shares of the Portfolio at a net asset value of $16.69 for 3,034,694 Class I shares of Opportunity Portfolio; 14,415,387 Class A shares of the Portfolio at a net asset value of $16.35 for 9,470,228 Class A shares of Opportunity Portfolio; 2,000,306 Class L shares of the Portfolio at a net asset value of $16.19 for 1,518,730 Class L shares of Opportunity Portfolio; 47,839 Class IS shares of the Portfolio at a net asset value of $16.70 for 31,397 Class IS shares of Opportunity Portfolio. The net assets of Opportunity Portfolio before the Reorganization were approximately $345,930,000, including unrealized appreciation of approximately $141,511,000 at December 4, 2015. The investment portfolio of Opportunity Portfolio, with a fair value of approximately $346,957,000 and identified cost of approximately $205,446,000 on December 4, 2015, was the principal asset acquired by the Portfolio. For financial reporting purposes, assets received and shares issued by the Portfolio were recorded at fair value; however, the cost basis of the investments received from Opportunity Portfolio was carried forward to align ongoing reporting of the Portfolio's realized and unrealized gains
and losses with amounts distributable to shareholders for tax purposes. Immediately prior to the Reorganization, the net assets of the Portfolio were approximately $246,567,000. Immediately after the Reorganization, the net assets of the Portfolio were approximately $592,513,000.
Upon closing of the Reorganization, shareholders of Opportunity Portfolio received shares of the Portfolio as follows:
Opportunity
Portfolio | | Global Opportunity
Portfolio | |
| Class I | | Class I | |
| Class A | | Class A | |
| Class L | | Class L | |
| Class IS | | Class IS | |
Assuming the acquisition had been completed on January 1, 2015, the beginning of the annual reporting period of the Portfolio, the Portfolio's pro forma results of operations for the year ended December 31, 2015, are as follows:
Net investment loss(1) | | $ | 3,760,000 | | |
Net realized gain and unrealized gain(2) | | $ | 61,642,000 | | |
Net increase (decrease) in net assets resulting
from operations | | $ | 65,402,000 | | |
(1) Approximately $(671,000) as reported, plus approximately $1,533,000 Opportunity Portfolio prior to the Reorganization, plus approximately $2,898,000 of estimated pro-forma eliminated expenses.
(2) Approximately $40,641,000 as reported, plus approximately $21,001,000 Opportunity Portfolio prior to the Reorganization.
Because the combined investment portfolios have been managed as a single integrated portfolio since the acquisition was completed, it is not practicable to separate the amounts of revenue and earnings of Opportunity Portfolio that have been included in the Portfolio's Statement of Operations since December 7, 2015.
A. Significant Accounting Policies: The following significant accounting policies are in conformity with U.S. generally accepted accounting principles ("GAAP"). Such policies are consistently followed by the Fund in the preparation of its financial statements. GAAP may require management to make estimates and assumptions that affect the reported amounts and disclosures in the financial statements. Actual results may differ from those estimates.
1. Security Valuation: (1) An equity portfolio security listed or traded on an exchange is valued at its latest reported sales price (or at the exchange official closing price if such exchange reports an official closing price), and if there were no sales on a given day and if there is no official exchange closing price for that day, the security is valued at the mean between the last reported bid and asked prices if
18
Morgan Stanley Institutional Fund, Inc.
Annual Report — December 31, 2016
Notes to Financial Statements (cont'd)
such bid and asked prices are available on the relevant exchanges; (2) all other equity portfolio securities for which over-the-counter ("OTC") market quotations are readily available are valued at the latest reported sales price (or at the market official closing price if such market reports an official closing price), and if there was no trading in the security on a given day and if there is no official closing price from relevant markets for that day, the security is valued at the mean between the last reported bid and asked prices if such bid and asked prices are available on the relevant markets. Listed equity securities not traded on the valuation date with no reported bid and asked prices available on the exchange are valued at the mean between the current bid and asked prices obtained from one or more reputable brokers or dealers. An unlisted equity security that does not trade on the valuation date and for which bid and asked prices from the relevant markets are unavailable is valued at the mean between the current bid and asked prices obtained from one or more reputable brokers or dealers. In cases where a security is traded on more than one exchange, the security is valued on the exchange designated as the primary market; (3) certain portfolio securities may be valued by an outside pricing service/vendor approved by the Fund's Board of Directors (the "Directors"). The pricing service/vendor may employ a pricing model that takes into account, among other things, bids, yield spreads, and/or other market data and specific security characteristics. Alternatively, if a valuation is not available from an outside pricing service/vendor, and the security trades on an exchange, the security may be valued at its latest reported sale price (or at the exchange official closing price if such exchange reports an official closing price), prior to the time when assets are valued. If there are no sales on a given day and if there is no official exchange closing price for that day, the security is valued at the mean between the last reported bid and asked prices if such bid and asked prices are available in the relevant exchanges; (4) Listed options are valued at the last reported sales price on the exchange on which they are listed (or at the exchange official closing price if such exchange reports an official closing price). If an official closing price or last reported sale price is unavailable, the listed option should be fair valued at the mean between its latest bid and ask prices. Unlisted options are valued at the mean between their latest bid and ask prices from a broker/dealer or valued by a pricing service/vendor; (5) when market quotations are not readily available, including circumstances under which the Adviser determines that the
closing price, last sale price or the mean between the last reported bid and asked prices are not reflective of a security's market value, portfolio securities are valued at their fair value as determined in good faith under procedures established by and under the general supervision of the Directors. Occasionally, developments affecting the closing prices of securities and other assets may occur between the times at which valuations of such securities are determined (that is, close of the foreign market on which the securities trade) and the close of business of the New York Stock Exchange ("NYSE"). If developments occur during such periods that are expected to materially affect the value of such securities, such valuations may be adjusted to reflect the estimated fair value of such securities as of the close of the NYSE, as determined in good faith by the Directors or by the Adviser using a pricing service and/or procedures approved by the Directors; (6) quotations of foreign portfolio securities, other assets and liabilities and forward contracts stated in foreign currency are translated into U.S. dollar equivalents at the prevailing market rates prior to the close of the NYSE; and (7) investments in mutual funds, including the Morgan Stanley Institutional Liquidity Funds, are valued at the net asset value ("NAV") as of the close of each business day.
The Directors have responsibility for determining in good faith the fair value of the investments, and the Directors may appoint others, such as the Fund's Adviser or a valuation committee, to assist the Directors in determining fair value and to make the actual calculations pursuant to the fair valuation methodologies previously approved by the Directors. Under procedures approved by the Directors, the Fund's Adviser has formed a Valuation Committee whose members are approved by the Directors. The Valuation Committee provides administration and oversight of the Fund's valuation policies and procedures, which are reviewed at least annually by the Directors. These procedures allow the Fund to utilize independent pricing services, quotations from securities and financial instrument dealers, and other market sources to determine fair value.
The Fund has procedures to determine the fair value of securities and other financial instruments for which market prices are not readily available. Under these procedures, the Valuation Committee convenes on a regular and ad hoc basis to review such securities and considers a number of factors, including valuation methodologies and significant unobservable valuation inputs, when
19
Morgan Stanley Institutional Fund, Inc.
Annual Report — December 31, 2016
Notes to Financial Statements (cont'd)
arriving at fair value. The Valuation Committee may employ a market-based approach which may use related or comparable assets or liabilities, recent transactions, market multiples, book values, and other relevant information for the investment to determine the fair value of the investment. An income-based valuation approach may also be used in which the anticipated future cash flows of the investment are discounted to calculate fair value. Discounts may also be applied due to the nature or duration of any restrictions on the disposition of the investments. Due to the inherent uncertainty of valuations of such investments, the fair values may differ significantly from the values that would have been used had an active market existed. The Valuation Committee employs various methods for calibrating these valuation approaches including a regular review of valuation methodologies, key inputs and assumptions, transactional back-testing or disposition analysis, and reviews of any related market activity.
2. Fair Value Measurement: Financial Accounting Standards Board ("FASB") Accounting Standards CodificationTM ("ASC") 820, "Fair Value Measurement" ("ASC 820"), defines fair value as the value that the Fund would receive to sell an investment or pay to transfer a liability in a timely transaction with an independent buyer in the principal market, or in the absence of a principal market, the most advantageous market for the investment or liability. ASC 820 establishes a three-tier hierarchy to distinguish between (1) inputs that reflect the assumptions market participants would use in valuing an asset or liability developed based on market data obtained from sources independent of the reporting entity (observable inputs) and (2) inputs that reflect the reporting entity's own assumptions about the assumptions market participants would use in valuing an asset or liability developed based on the best information available in the circumstances (unobservable inputs) and to establish classification of fair value measurements for disclosure purposes. Various inputs are used in determining the value of the Fund's investments. The inputs are summarized in the three broad levels listed below.
• Level 1 – unadjusted quoted prices in active markets for identical investments
• Level 2 – other significant observable inputs (including quoted prices for similar investments, interest rates, prepayment speeds, credit risk, etc.)
• Level 3 – significant unobservable inputs including the Fund's own assumptions in determining
the fair value of investments. Factors considered in making this determination may include, but are not limited to, information obtained by contacting the issuer, analysts, or the appropriate stock exchange (for exchange-traded securities), analysis of the issuer's financial statements or other available documents and, if necessary, available information concerning other securities in similar circumstances
The inputs or methodology used for valuing securities are not necessarily an indication of the risk associated with investing in those securities and the determination of the significance of a particular input to the fair value measurement in its entirety requires judgment and considers factors specific to each security.
The following is a summary of the inputs used to value the Portfolio's investments as of December 31, 2016.
Investment Type | | Level 1
Unadjusted
quoted
prices
(000) | | Level 2
Other
significant
observable
inputs
(000) | | Level 3
Significant
unobservable
inputs
(000) | | Total
(000) | |
Assets: | |
Common Stocks | |
Beverages | | $ | 32,827 | | | $ | — | | | $ | — | | | $ | 32,827 | | |
Biotechnology | | | 7,884 | | | | — | | | | — | | | | 7,884 | | |
Capital Markets | | | 7,776 | | | | — | | | | — | | | | 7,776 | | |
Chemicals | | | 1,097 | | | | — | | | | — | | | | 1,097 | | |
Diversified Consumer
Services | | | 34,527 | | | | — | | | | — | | | | 34,527 | | |
Electronic Equipment,
Instruments &
Components | | | 9,401 | | | | — | | | | — | | | | 9,401 | | |
Food Products | | | 27,753 | | | | — | | | | — | | | | 27,753 | | |
Household Products | | | 14,295 | | | | — | | | | — | | | | 14,295 | | |
Information Technology
Services | | | 155,217 | | | | — | | | | — | | | | 155,217 | | |
Internet & Direct
Marketing Retail | | | 75,004 | | | | — | | | | — | | | | 75,004 | | |
Internet Software &
Services | | | 101,420 | | | | — | | | | — | | | | 101,420 | | |
Media | | | 24,779 | | | | — | | | | — | | | | 24,779 | | |
Multi-Utilities | | | — | | | | — | | | | — | † | | | — | † | |
Personal Products | | | 12,444 | | | | — | | | | — | | | | 12,444 | | |
Pharmaceuticals | | | 16,748 | | | | — | | | | — | | | | 16,748 | | |
Road & Rail | | | 32,503 | | | | — | | | | — | | | | 32,503 | | |
Software | | | 7,844 | | | | — | | | | — | | | | 7,844 | | |
Textiles, Apparel &
Luxury Goods | | | 50,147 | | | | — | | | | — | | | | 50,147 | | |
Total Common Stocks | | | 611,666 | | | | — | | | | — | † | | | 611,666 | † | |
20
Morgan Stanley Institutional Fund, Inc.
Annual Report — December 31, 2016
Notes to Financial Statements (cont'd)
Investment Type | | Level 1
Unadjusted
quoted
prices
(000) | | Level 2
Other
significant
observable
inputs
(000) | | Level 3
Significant
unobservable
inputs
(000) | | Total
(000) | |
Preferred Stocks | | $ | — | | | $ | — | | | $ | 15,545 | | | $ | 15,545 | | |
Participation Note | | | — | | | | 17,534 | | | | — | | | | 17,534 | | |
Call Option Purchased | | | — | | | | 326 | | | | — | | | | 326 | | |
Short-Term Investment | |
Investment Company | | | 18,397 | | | | — | | | | — | | | | 18,397 | | |
Total Assets | | $ | 630,063 | | | $ | 17,860 | | | $ | 15,545 | † | | $ | 663,468 | † | |
† Includes one security which is valued at zero.
Transfers between investment levels may occur as the markets fluctuate and/or the availability of data used in an investment's valuation changes. The Portfolio recognizes transfers between the levels as of the end of the period. As of December 31, 2016, securities with a total value of approximately $161,295,000 transferred from Level 2 to Level 1. Securities that were valued using other significant observable inputs at December 31, 2015 were valued using unadjusted quoted prices at December 31, 2016. At December 31, 2015, the fair value of certain securities were adjusted due to developments which occurred
between the time of the close of the foreign markets on which they trade and the close of business on the NYSE which resulted in their Level 2 classification.
Following is a reconciliation of investments in which significant unobservable inputs (Level 3) were used in determining fair value.
| | | Common
Stock
(000) | | Preferred
Stocks
(000) | |
Beginning Balance | | $ | — | † | | $ | 14,915 | | |
Purchases | | | — | | | | — | | |
Sales | | | — | | | | — | | |
Amortization of discount | | | — | | | | — | | |
Transfers in | | | — | | | | — | | |
Transfers out | | | — | | | | — | | |
Corporate actions | | | — | | | | — | | |
Change in unrealized appreciation
(depreciation) | | | — | | | | 630 | | |
Realized gains (losses) | | | — | | | | — | | |
Ending Balance | | $ | — | † | | $ | 15,545 | | |
Net change in unrealized appreciation
(depreciation) from investments still
held as of December 31, 2016 | | $ | — | | | $ | 630 | | |
† Includes one security which is valued at zero.
The following table presents additional information about valuation techniques and inputs used for investments that are measured at fair value and categorized within Level 3 as of December 31, 2016. Various valuation techniques were used in the valuation of certain investments and weighted based on the level of significance.
| | | Fair Value at
December 31, 2016
(000) | | Valuation
Technique | | Unobservable
Input | | Range | | Selected
Value | | Impact to
Valuation from an
Increase in Input | |
Electronic Equipment, Instuments & Components | |
Preferred Stock | | $ | 3,085 | | | Discounted Cash Flow | | Weighted Average
Cost of Capital | | | 25.0 | % | | | 27.0 | % | | | 26.0 | % | | Decrease | |
| | | | | | | Perpetual Growth Rate | | | 3.0 | % | | | 4.0 | % | | | 3.5 | % | | Increase | |
| | | | | Market Comparable
Companies | | Enterprise Value/
Revenue | | | 10.6 | x | | | 24.7 | x | | | 19.4 | x | | Increase | |
| | | | | | | Discount for Lack
of Marketability | | | 20.0 | % | | | 20.0 | % | | | 20.0 | % | | Decrease | |
Internet & Direct Marketing Retail | |
Preferred Stocks | | $ | 4,115 | | | Market Transaction
Method | | Precedent Transaction | | $ | 105.00 | | | $ | 105.00 | | | $ | 105.00 | | | Increase | |
| | | | | Discounted Cash
Flow | | Weighted Average
Cost of Capital | | | 15.5 | % | | | 17.5 | % | | | 16.5 | % | | Decrease | |
| | | | | | | Perpetual Growth Rate | | | 3.0 | % | | | 4.0 | % | | | 3.5 | % | | Increase | |
| | | | | Market Comparable
Companies | | Enterprise Value/
Revenue | | | 9.8 | x | | | 16.2 | x | | | 12.8 | x | | Increase | |
| | | | | | | Discount for Lack
of Marketability | | | 20.0 | % | | | 20.0 | % | | | 20.0 | % | | Decrease | |
21
Morgan Stanley Institutional Fund, Inc.
Annual Report — December 31, 2016
Notes to Financial Statements (cont'd)
| | | Fair Value at
December 31, 2016
(000) | | Valuation
Technique | | Unobservable
Input | | Range | | Selected
Value | | Impact to
Valuation from an
Increase in Input | |
Internet & Direct Marketing Retail (cont'd) | |
| | $ | 113 | | | Discounted Cash Flow | | Weighted Average
Cost of Capital | | | 17.5 | % | | | 19.5 | % | | | 18.5 | % | | Decrease | |
| | | | | | | Perpetual Growth Rate | | | 3.5 | % | | | 4.5 | % | | | 4.0 | % | | Increase | |
| | | | | Market Comparable
Companies | | Enterprise Value/
Revenue | | | 1.1 | x | | | 2.8 | x | | | 2.2 | x | | Increase | |
| | | | | | | Discount for Lack
of Marketability | | | 20.0 | % | | | 20.0 | % | | | 20.0 | % | | Decrease | |
| | | $ | 8,232 | | | Market Transaction
Method | | Precedent Transaction | | $ | 48.77 | | | $ | 48.77 | | | $ | 48.77 | | | Increase | |
3. Foreign Currency Translation and Foreign Investments: The books and records of the Portfolio are maintained in U.S. dollars. Foreign currency amounts are translated into U.S. dollars as follows:
– investments, other assets and liabilities at the prevailing rate of exchange on the valuation date;
– investment transactions and investment income at the prevailing rates of exchange on the dates of such transactions.
Although the net assets of the Portfolio are presented at the foreign exchange rates and market values at the close of the period, the Portfolio does not isolate that portion of the results of operations arising as a result of changes in the foreign exchange rates from the fluctuations arising from changes in the market prices of securities held at period end. Similarly, the Portfolio does not isolate the effect of changes in foreign exchange rates from the fluctuations arising from changes in the market prices of securities sold during the period. Accordingly, realized and unrealized foreign currency gains (losses) on investments in securities are included in the reported net realized and unrealized gains (losses) on investment transactions and balances. However, pursuant to U.S. federal income tax regulations, gains and losses from certain foreign currency transactions and the foreign currency portion of gains and losses realized on sales and maturities of foreign denominated debt securities are treated as ordinary income for U.S. federal income tax purposes.
Net realized gains (losses) on foreign currency transactions represent net foreign exchange gains (losses) from foreign currency forward exchange contracts, disposition of foreign currencies, currency gains (losses) realized between the trade and settlement dates on securities
transactions, and the difference between the amount of investment income and foreign withholding taxes recorded on the Portfolio's books and the U.S. dollar equivalent amounts actually received or paid. Net unrealized currency gains (losses) from valuing foreign currency denominated assets and liabilities at period end exchange rates are reflected as a component of unrealized appreciation (depreciation) in the Statement of Assets and Liabilities. The change in unrealized currency gains (losses) on foreign currency translations for the period is reflected in the Statement of Operations.
Foreign security and currency transactions may involve certain considerations and risks not typically associated with those of U.S. dollar denominated transactions as a result of, among other factors, fluctuations of exchange rates in relation to the U.S. dollar, the possibility of lower levels of governmental supervision and regulation of foreign securities markets and the possibility of political or economic instability.
Governmental approval for foreign investments may be required in advance of making an investment under certain circumstances in some countries, and the extent of foreign investments in domestic companies may be subject to limitation in other countries. Foreign ownership limitations also may be imposed by the charters of individual companies to prevent, among other concerns, violations of foreign investment limitations. As a result, an additional class of shares (identified as "Foreign" in the Portfolio of Investments) may be created and offered for investment. The "local" and "foreign shares" market values may differ. In the absence of trading of the foreign shares in such markets, the Portfolio values the foreign shares at the closing exchange price of the local shares.
22
Morgan Stanley Institutional Fund, Inc.
Annual Report — December 31, 2016
Notes to Financial Statements (cont'd)
4. Derivatives: The Portfolio may, but is not required to, use derivative instruments for a variety of purposes, including hedging, risk management, portfolio management or to earn income. Derivatives are financial instruments whose value is based, in part, on the value of an underlying asset, interest rate, index or financial instrument. Prevailing interest rates and volatility levels, among other things, also affect the value of derivative instruments. A derivative instrument often has risks similar to its underlying asset and may have additional risks, including imperfect correlation between the value of the derivative and the underlying asset, risks of default by the counterparty to certain transactions, magnification of losses incurred due to changes in the market value of the securities, instruments, indices or interest rates to which the derivative instrument relates, risks that the transactions may not be liquid and risks arising from margin requirements. The use of derivatives involves risks that are different from, and possibly greater than, the risks associated with other portfolio investments. Derivatives may involve the use of highly specialized instruments that require investment techniques and risk analyses different from those associated with other portfolio investments. All of the Portfolio's holdings, including derivative instruments, are marked-to-market each day with the change in value reflected in unrealized appreciation (depreciation). Upon disposition, a realized gain or loss is recognized.
Certain derivative transactions may give rise to a form of leverage. Leverage magnifies the potential for gain and the risk of loss. Leverage associated with derivative transactions may cause the Portfolio to liquidate portfolio positions when it may not be advantageous to do so to satisfy its obligations or to meet earmarking or segregation requirements, pursuant to applicable Securities and Exchange Commission rules and regulations, or may cause the Portfolio to be more volatile than if the Portfolio had not been leveraged. Although the Adviser seeks to use derivatives to further the Portfolio's investment objectives, there is no assurance that the use of derivatives will achieve this result.
Following is a description of the derivative instruments and techniques that the Portfolio used during the period and their associated risks:
Options: With respect to options, the Portfolio is subject to equity risk, interest rate risk and foreign
currency exchange risk in the normal course of pursuing its investment objectives. If the Portfolio buys an option, it buys a legal contract giving it the right to buy or sell a specific amount of the underlying instrument or foreign currency, or futures contract on the underlying instrument or foreign currency, at an agreed-upon price typically in exchange for a premium paid by the Portfolio. The Portfolio may purchase and/or sell put and call options. Purchasing call options tends to increase the Portfolio's exposure to the underlying (or similar) instrument. Purchasing put options tends to decrease the Portfolio's exposure to the underlying (or similar) instrument. When entering into purchased option contracts, the Portfolio bears the risk of interest or exchange rates or securities prices moving unexpectedly, in which case, the Portfolio may not achieve the anticipated benefits of the purchased option contracts; however the risk of loss is limited to the premium paid. Purchased options are reported as part of "Total Investments in Securities" in the Statement of Assets and Liabilities. Premium paid for purchasing options which expired are treated as realized losses. If the Portfolio sells an option, it sells to another party the right to buy from or sell to the Portfolio a specific amount of the underlying instrument or foreign currency, or futures contract on the underlying instrument or foreign currency, at an agreed-upon price typically in exchange for a premium received by the Portfolio. When options are purchased OTC, the Portfolio bears the risk that the counterparty that wrote the option will be unable or unwilling to perform its obligations under the option contract. Options may also be illiquid and the Portfolio may have difficulty closing out its position. A decision as to whether, when and how to use options involves the exercise of skill and judgment and even a well-conceived option transaction may be unsuccessful because of market behavior or unexpected events. The prices of options can be highly volatile and the use of options can lower total returns.
FASB ASC 815, "Derivatives and Hedging" ("ASC 815"), is intended to improve financial reporting about derivative instruments by requiring enhanced disclosures to enable investors to better understand how and why the Portfolio uses derivative instruments, how these derivative instruments are accounted for and their effects on the Portfolio's financial position and results of operations.
23
Morgan Stanley Institutional Fund, Inc.
Annual Report — December 31, 2016
Notes to Financial Statements (cont'd)
The following table sets forth the fair value of the Portfolio's derivative contracts by primary risk exposure as of December 31, 2016.
| | | Asset Derivatives
Statement of Assets and
Liabilities Location | | Primary Risk
Exposure | | Value
(000) | |
Option Purchased
| | Investments, at Value
(Option Purchased) | | Currency Risk | | $ | 326 | (a) | |
(a) Amounts are included in Investments in Securities in the Statement of Assets and Liabilities.
The following tables set forth by primary risk exposure the Portfolio's realized gains (losses) and change in unrealized appreciation (depreciation) by type of derivative contract for the year ended December 31, 2016 in accordance with ASC 815.
Realized Gain (Loss) | |
Primary Risk Exposure | | Derivative Type | | Value
(000) | |
Currency Risk
| | Investments
(Option Purchased) | | $ | (478 | )(b) | |
(b) Amounts are included in Investments Sold in the Statement of Operations.
Change in Unrealized Appreciation (Depreciation) | |
Primary Risk Exposure | | Derivative Type | | Value
(000) | |
Currency Risk
| | Investments
(Options Purchased) | | $ | (552 | )(c) | |
(c) Amounts are included in Investments in the Statement of Operations.
At December 31, 2016, the Portfolio's derivative assets and liabilities are as follows:
Gross Amounts of Assets and Liabilities Presented in the
Statement of Assets and Liabilities | |
Derivatives | | Assets(d)
(000) | | Liabilities(d)
(000) | |
Option Purchased | | $ | 326 | (a) | | $ | — | | |
(a) Amounts are included in Investments in Securities in the Statement of Assets and Liabilities.
(d) Absent an event of default or early termination, OTC derivative assets and liabilities are presented gross and not offset in the Statement of Assets and Liabilities.
The Portfolio typically enters into International Swaps and Derivatives Association, Inc. Master Agreements ("ISDA Master Agreements") or similar master agreements (collectively, "Master Agreements") with its contract counterparties for certain OTC derivatives in order to, among other things, reduce its credit risk to counterparties. ISDA Master Agreements include provisions for general obligations, representations, collateral and events of default or termination. Under an ISDA Master Agreement, the Portfolio typically may offset with the counterparty certain OTC derivative financial instruments' payables and/or receivables
with collateral held and/or posted and create one single net payment (close-out netting) in the event of default, termination and/or potential deterioration in the credit quality of the counterparty. Various Master Agreements govern the terms of certain transactions with counterparties, including transactions such as swap, forward, repurchase and reverse repurchase agreements. These Master Agreements typically attempt to reduce the counterparty risk associated with such transactions by specifying credit protection mechanisms and providing standardization that improves legal certainty. Cross-termination provisions under Master Agreements typically provide that a default in connection with one transaction between the Portfolio and a counterparty gives the non-defaulting party the right to terminate any other transactions in place with the defaulting party to create one single net payment due to/due from the defaulting party and may be a feature in certain Master Agreements. In the event the Portfolio exercises its right to terminate a Master Agreement after a counterparty experiences a termination event as defined in the Master Agreement, the return of collateral with market value in excess of the Portfolio's net liability may be delayed or denied.
The following table presents derivative financial instruments that are subject to enforceable netting arrangements as of December 31, 2016.
Gross Amounts Not Offset in the Statement of Assets and Liabilities | |
Counterparty | | Gross Asset
Derivatives
Presented in
Statement of
Assets and
Liabilities
(000) | | Financial
Instrument
(000) | | Collateral
Received
(000) | | Net Amount
(not less
than $0)
(000) | |
Royal Bank of Scotland | | $ | 326 | | | $ | — | | | $ | (280 | ) | | $ | 46 | | |
For the year ended December 31, 2016, the approximate average monthly amount outstanding for each derivative type is as follows:
Options Purchased: | |
Average monthly notional amount | | | 71,927,000 | | |
5. Structured Investments: The Portfolio invested a portion of its assets in structured investments. A structured investment is a derivative security designed to offer a return linked to a particular underlying security, currency, commodity or market. Structured investments may come in various forms including notes (such as exchange-traded notes), warrants and options to purchase securities. The Portfolio will typically use structured investments to gain exposure to a permitted underlying security, currency,
24
Morgan Stanley Institutional Fund, Inc.
Annual Report — December 31, 2016
Notes to Financial Statements (cont'd)
commodity or market when direct access to a market is limited or inefficient from a tax or cost standpoint. There can be no assurance that structured investments will trade at the same price or have the same value as the underlying security, currency, commodity or market. Investments in structured investments involve risks including issuer risk, counterparty risk and market risk. Holders of structured investments bear risks of the underlying investment and are subject to issuer or counterparty risk because the Portfolio is relying on the creditworthiness of such issuer or counterparty and has no rights with respect to the underlying investment. Certain structured investments may be thinly traded or have a limited trading market and may have the effect of increasing the Portfolio's illiquidity to the extent that the Portfolio, at a particular time, may be unable to find qualified buyers for these securities.
6. Restricted Securities: The Portfolio invests in unregistered or otherwise restricted securities. The term "restricted securities" refers to securities that are unregistered or are held by control persons of the issuer and securities that are subject to contractual restrictions on their resale. As a result, restricted securities may be more difficult to value and the Portfolio may have difficulty disposing of such assets either in a timely manner or for a reasonable price. In order to dispose of an unregistered security, the Portfolio, where it has contractual rights to do so, may have to cause such security to be registered. A considerable period may elapse between the time the decision is made to sell the security and the time the security is registered so that the Portfolio could sell it. Contractual restrictions on the resale of securities vary in length and scope and are generally the result of a negotiation between the issuer and acquirer of the securities. The Portfolio would, in either case, bear market risks during that period. Restricted securities are identified in the Portfolio of Investments.
7. Indemnifications: The Fund enters into contracts that contain a variety of indemnifications. The Fund's maximum exposure under these arrangements is unknown. However, the Fund has not had prior claims or losses pursuant to these contracts and expects the risk of loss to be remote.
8. Dividends and Distributions to Shareholders: Dividend income and distributions to shareholders are recorded on the ex-dividend date. Dividends from net investment income, if any, are declared and paid annually. Net realized capital gains, if any, are distributed at least annually.
9. Security Transactions, Income and Expenses: Security transactions are accounted for on the trade date (date the order to buy or sell is executed). Realized gains and losses on the sale of investment securities are determined on the specific identified cost method. Dividend income and other distributions are recorded on the ex-dividend date (except for certain foreign dividends which may be recorded as soon as the Portfolio is informed of such dividends) net of applicable withholding taxes. Interest income is recognized on the accrual basis except where collection is in doubt. Discounts are accreted and premiums are amortized over the life of the respective securities. Most expenses of the Fund can be directly attributed to a particular Portfolio. Expenses which cannot be directly attributed are apportioned among the Portfolios based upon relative net assets or other appropriate methods. Income, expenses (other than class specific expenses — distribution and shareholder services, transfer agency and sub transfer agency fees) and realized and unrealized gains or losses are allocated to each class of shares based upon their relative net assets.
B. Advisory Fees: The Adviser, a wholly-owned subsidiary of Morgan Stanley, provides the Portfolio with advisory services under the terms of an Investment Advisory Agreement, paid quarterly, at the annual rate based on the daily net assets as follows:
First $750
million | | Next $750
million | | Over $1.5
billion | |
| | 0.80 | % | | | 0.75 | % | | | 0.70 | % | |
For the year ended December 31, 2016, the advisory fee rate (net of waivers/rebate) was equivalent to an annual effective rate of 0.58% of the Portfolio's average daily net assets.
The Adviser has agreed to reduce its advisory fee and/or reimburse the Portfolio so that total annual portfolio operating expenses, excluding certain investment related expenses, taxes, interest and other extraordinary expenses (including litigation), will not exceed 0.81% for Class I shares, 1.23% for Class A shares, 1.50% for Class L shares, 2.20% for Class C shares and 0.72% for Class IS shares. The fee waivers and/or expense reimbursements will continue for at least one year from the date of the Portfolio's prospectus or until such time as the Directors act to discontinue all or a portion of such waivers and/or reimbursements when they deem such action is appropriate. For the year ended December 31, 2016, approximately $1,421,000 of advisory fees were waived and approximately
25
Morgan Stanley Institutional Fund, Inc.
Annual Report — December 31, 2016
Notes to Financial Statements (cont'd)
$82,000 of other expenses were reimbursed by the Adviser pursuant to this arrangement.
C. Administration Fees: The Adviser also serves as Administrator to the Fund and provides administrative services pursuant to an Administration Agreement for an annual fee, accrued daily and paid monthly, of 0.08% of the Portfolio's average daily net assets.
Under a Sub-Administration Agreement between the Administrator and State Street Bank and Trust Company ("State Street"), State Street provides certain administrative services to the Fund. For such services, the Administrator pays State Street a portion of the fee the Administrator receives from the Portfolio.
D. Distribution and Shareholder Services Fees: Morgan Stanley Distribution, Inc. ("MSDI" or the "Distributor"), a wholly-owned subsidiary of the Adviser and an indirect subsidiary of Morgan Stanley, serves as the Fund's Distributor of Portfolio shares pursuant to a Distribution Agreement. The Fund has adopted a Shareholder Services Plan with respect to Class A shares pursuant to Rule 12b-1 under the Act. Under the Shareholder Services Plan, the Portfolio pays the Distributor a shareholder services fee, accrued daily and paid monthly, at an annual rate of 0.25% of the Portfolio's average daily net assets attributable to Class A shares.
The Fund has adopted a Distribution and Shareholder Services Plan with respect to Class L shares pursuant to Rule 12b-1 under the Act. Under the Distribution and Shareholder Services Plan, the Portfolio pays the Distributor a distribution fee, accrued daily and paid monthly, at an annual rate of 0.50% and a shareholder services fee, accrued daily and paid monthly, at an annual rate of 0.25% of the Portfolio's average daily net assets attributable to Class L shares. The Distributor has agreed to waive for at least one year from the date of the Portfolio's prospectus, the 12b-1 fees on Class L shares of the Portfolio to the extent it exceeds 0.30% of the average daily net assets of such shares on an annualized basis. For the year ended December 31, 2016, this waiver amounted to approximately $144,000.
The Fund has adopted a Distribution and Shareholder Services Plan with respect to Class C shares pursuant to Rule 12b-1 under the Act. Under the Distribution and Shareholder Services Plan, the Portfolio pays the Distributor a distribution fee, accrued daily and paid monthly, at an annual rate of 0.75% and a shareholder services fee, accrued daily and paid monthly, at an annual rate of 0.25% of the Portfolio's average daily net assets attributable to Class C shares.
The distribution and shareholder services fees are used to support the expenses associated with servicing and maintaining accounts. The Distributor may compensate other parties for providing shareholder support services to investors who purchase Class A, Class L and Class C shares.
E. Dividend Disbursing and Transfer Agent: The Fund's dividend disbursing and transfer agent is Boston Financial Data Services, Inc. ("BFDS"). Pursuant to a Transfer Agency Agreement, the Fund pays BFDS a fee based on the number of classes, accounts and transactions relating to the Portfolios of the Fund.
F. Custodian Fees: State Street (the "Custodian") serves as Custodian for the Fund in accordance with a Custodian Agreement. The Custodian holds cash, securities, and other assets of the Fund as required by the Act. Custody fees are payable monthly based on assets held in custody, investment purchases and sales activity and account maintenance fees, plus reimbursement for certain out-of-pocket expenses.
In December 2015, the Fund's Custodian announced that it had identified inconsistencies in the way in which clients were invoiced for out-of-pocket expenses from 1998 until November 2015. The dollar amount difference between what was charged and what should have been charged, plus interest, was paid back to the Portfolio in September 2016 as a reimbursement. The Custodian reimbursed the Portfolio directly, which was recognized as a change in accounting estimate and was reflected as "Reimbursement of Custodian Fees" in the Statement of Operations. Pursuant to the expense limitations described in Note B, the Portfolio has experienced waiver of advisory fees during the current period. Accordingly, the reimbursement of out-of-pocket custodian expenses in the current period resulted in the reduction in the current period waiver of advisory fees.
G. Security Transactions and Transactions with Affiliates: For the year ended December 31, 2016, purchases and sales of investment securities for the Portfolio, other than long-term U.S. Government securities and short-term investments, were approximately $285,174,000 and $234,397,000, respectively. There were no purchases and sales of long-term U.S. Government securities for the year ended December 31, 2016.
The Portfolio invests in the Institutional Class of the Morgan Stanley Institutional Liquidity Funds (the "Liquidity Funds"), an open-end management investment company managed by the Adviser. Advisory fees paid by the Portfolio are reduced by an amount equal to its pro-rata share of the advisory and
26
Morgan Stanley Institutional Fund, Inc.
Annual Report — December 31, 2016
Notes to Financial Statements (cont'd)
administration fees paid by the Liquidity Funds. Portfolio due to its investment in the For the year ended December 31, 2016, advisory fees paid were reduced by approximately $42,000 relating to the Portfolio's investment in the Liquidity Funds.
A summary of the Portfolio's transactions in shares of the Liquidity Funds during the year ended December 31, 2016 is as follows:
Value
December 31,
2015
(000) | | Purchases
at Cost
(000) | | Sales
(000) | | Dividend
Income
(000) | | Value
December 31,
2016
(000) | |
| $ | 33,417 | | | $ | 287,033 | | | $ | 302,053 | | | $ | 70 | | | $ | 18,397 | | |
During the year ended December 31, 2016, the Portfolio incurred approximately $3,000 in brokerage commissions with Morgan Stanley & Co., LLC, an affiliate of the Adviser/Administrator and Distributor, for portfolio transactions executed on behalf of the Portfolio.
The Portfolio is permitted to purchase and sell securities ("cross-trade") from and to other Morgan Stanley Funds as well as other funds and client accounts for which the Adviser or an affiliate of the Adviser serves as investment adviser, pursuant to procedures approved by the Directors in compliance with Rule 17a-7 under the Act (the "Rule"). Each cross-trade is executed at the current market price in compliance with provisions of the Rule. For the year ended December 31, 2016, the Portfolio did not engage in any cross-trade transactions.
The Portfolio has an unfunded Deferred Compensation Plan (the "Compensation Plan"), which allows each independent Director to defer payment of all, or a portion, of the fees he or she receives for serving on the Board of Directors. Each eligible Director generally may elect to have the deferred amounts credited with a return equal to the total return on one or more of the Morgan Stanley funds that are offered as investment options under the Compensation Plan. Appreciation/depreciation and distributions received from these investments are recorded with an offsetting increase/decrease in the deferred compensation obligation and do not affect the NAV of the Portfolio.
H. Federal Income Taxes: It is the Portfolio's intention to continue to qualify as a regulated investment company and distribute all of its taxable and tax-exempt income. Accordingly, no provision for federal income taxes is required in the financial statements.
The Portfolio may be subject to taxes imposed by countries in which it invests. Such taxes are generally based on income and/or capital gains earned or repatriated. Taxes are accrued
based on net investment income, net realized gains and net unrealized appreciation as such income and/or gains are earned. Taxes may also be based on transactions in foreign currency and are accrued based on the value of investments denominated in such currency.
FASB ASC 740-10, "Income Taxes — Overall", sets forth a minimum threshold for financial statement recognition of the benefit of a tax position taken or expected to be taken in a tax return. Management has concluded there are no significant uncertain tax positions that would require recognition in the financial statements. If applicable, the Portfolio recognizes interest accrued related to unrecognized tax benefits in "Interest Expense" and penalties in "Other Expenses" in the Statement of Operations. The Portfolio files tax returns with the U.S. Internal Revenue Service, New York and various states. Generally, each of the tax years in the four-year period ended December 31, 2016, remains subject to examination by taxing authorities.
The tax character of distributions paid may differ from the character of distributions shown in the Statements of Changes in Net Assets due to short-term capital gains being treated as ordinary income for tax purposes. The tax character of distributions paid during fiscal years 2016 and 2015 was as follows:
2016
Distributions
Paid From: | | 2015
Distributions
Paid From: | |
Ordinary
Income
(000) | | Long-Term
Capital Gain
(000) | | Ordinary
Income
(000) | | Long-Term
Capital Gain
(000) | |
| $ | — | | | $ | 45,283 | | | $ | 3 | | | $ | 2,247 | | |
The amount and character of income and gains to be distributed are determined in accordance with income tax regulations which may differ from GAAP. These book/tax differences are either considered temporary or permanent in nature.
Temporary differences are primarily due to differing book and tax treatments for the timing of the recognition of gains (losses) on certain investment transactions and the timing of the deductibility of certain expenses.
Permanent differences, primarily due to differing treatments of gains (losses) related to foreign currency transactions and a net operating loss, resulted in the following reclassifications among the components of net assets at December 31, 2016:
Accumulated
Net Investment
Loss
(000) | | Accumulated
Net Realized
Loss
(000) | | Paid-in-
Capital
(000) | |
| $ | 3,628 | | | $ | 889 | | | $ | (4,517 | ) | |
27
Morgan Stanley Institutional Fund, Inc.
Annual Report — December 31, 2016
Notes to Financial Statements (cont'd)
At December 31, 2016, the Portfolio had no distributable earnings on a tax basis.
Qualified late year losses are capital losses and specified ordinary losses, including currency losses, incurred after October 31 but within the taxable year that, if elected, are deemed to arise on the first day of the Portfolio's next taxable year. These also include non-specified ordinary losses incurred after December 31 but within the same taxable year. For the year ended December 31, 2016, the Portfolio deferred to January 1, 2017 for U.S. federal income tax purposes the following losses:
Qualified Late
Year Ordinary
Losses
(000) | | Post-October
Capital Losses
(000) | |
| $ | 347 | | | $ | 1,387 | | |
I. Credit Facility: As of April 4, 2016, the Fund and other Morgan Stanley funds participated in a $150,000,000 committed, unsecured revolving line of credit facility (the "facility") with State Street. This facility is to be used for temporary emergency purposes or funding of shareholder redemption requests. The interest rate on borrowings is based on the federal funds rate or one month libor rate plus a spread. The facility also has a commitment fee of 0.25% per annum based on the unused portion of the facility. During the year ended December 31, 2016, the Portfolio did not have any borrowings under the facility.
J. Other: At December 31, 2016, the Portfolio had record owners of 10% or greater. Investment activities of these shareholders could have a material impact on the Portfolio. The aggregate percentage of such owners was 15.4%.
K. Accounting Pronouncements: In December 2016, FASB issued Accounting Standards update 2016-19 — Technical Corrections and Improvements ("ASU 2016-19"), which is effective for interim periods for all entities beginning after December 15, 2016. ASU 2016-19 includes an amendment to Topic 820, Fair Value Measurement, which clarifies the difference between a valuation approach and a valuation technique when applying the guidance in that Topic. That amendment also requires an entity to disclose when there has been a change in either or both a valuation approach and/or a valuation technique. The transition guidance for the amendment must be applied prospectively because it could potentially involve the use of hindsight that includes fair value measurements. Although still evaluating the potential impacts of ASU 2016-19 to the Portfolio, management expects that the impact of the Portfolio's adoption will be limited to additional financial statement disclosures.
In October 2016, the Securities and Exchange Commission ("SEC") issued a new rule, Investment Company Reporting Modernization, which, among other provisions, amends Regulation S-X to require standardized, enhanced disclosures, particularly related to derivatives, in investment company financial statements. Compliance with the guidance is effective for financial statements filed with the SEC on or after August 1, 2017; adoption will have no effect on the Portfolio's net assets or results of operations. Although still evaluating the potential impacts of the Investment Company Reporting Modernization to the Portfolio, management expects that the impact of the Portfolio's adoption will be limited to additional financial statement disclosures.
28
Morgan Stanley Institutional Fund, Inc.
Annual Report — December 31, 2016
Report of Independent Registered Public Accounting Firm
To the Shareholders and Board of Directors of
Morgan Stanley Institutional Fund, Inc. —
Global Opportunity Portfolio
We have audited the accompanying statement of assets and liabilities, including the portfolio of investments, of Global Opportunity Portfolio (one of the portfolios constituting Morgan Stanley Institutional Fund, Inc.) (the "Portfolio") as of December 31, 2016, and the related statement of operations for the year then ended, the statements of changes in net assets for each of the two years in the period then ended and the financial highlights for each of the years or periods indicated therein. These financial statements and financial highlights are the responsibility of the Portfolio's management. Our responsibility is to express an opinion on these financial statements and financial highlights based on our audits.
We conducted our audits in accordance with the standards of the Public Company Accounting Oversight Board (United States). Those standards require that we plan and perform the audit to obtain reasonable assurance about whether the financial statements and financial highlights are free of material misstatement. We were not engaged to perform an audit of the Portfolio's internal control over financial reporting. Our audits included consideration of internal control over financial reporting as a basis for designing audit procedures that are appropriate in the circumstances, but not for the purpose of expressing an opinion on the effectiveness of the Portfolio's internal control over financial reporting. Accordingly, we express no such opinion. An audit also includes examining, on a test basis, evidence supporting the amounts and disclosures in the financial statements and financial highlights, assessing the accounting principles used and significant estimates made by management, and evaluating the overall financial statement presentation. Our procedures included confirmation of securities owned as of December 31, 2016, by correspondence with the custodian and others or by other appropriate auditing procedures where replies from others were not received. We believe that our audits provide a reasonable basis for our opinion.
In our opinion, the financial statements and financial highlights referred to above present fairly, in all material respects, the financial position of Global Opportunity Portfolio (one of the portfolios constituting Morgan Stanley Institutional Fund, Inc.) at December 31, 2016, the results of its operations for the year then ended, the changes in its net assets for each of the two years in the period then ended and the financial highlights for each of the years or periods indicated therein, in conformity with U.S. generally accepted accounting principles.

Boston, Massachusetts
February 28, 2016
29
Morgan Stanley Institutional Fund, Inc.
Annual Report — December 31, 2016
Federal Tax Notice (unaudited)
For federal income tax purposes, the following information is furnished with respect to the distributions paid by the Portfolio during its taxable year ended December 31, 2016.
The Portfolio designated and paid approximately $45,283,000 as a long-term capital gain distribution.
In January, the Portfolio provides tax information to shareholders for the preceding calendar year.
30
Morgan Stanley Institutional Fund, Inc.
Annual Report — December 31, 2016
Privacy Notice (unaudited)
MORGAN STANLEY INVESTMENT MANAGEMENT INC.
AN IMPORTANT NOTICE CONCERNING OUR U.S. PRIVACY POLICY
We are required by federal law to provide you with a copy of our privacy policy annually. This policy applies to current and former individual investors in funds managed or sponsored by Morgan Stanley Investment Management Inc. ("MSIM") as well as current and former individual clients of MSIM. This policy is not applicable to partnerships, corporations, trusts or other non-individual clients or investors. Please note that we may amend this policy at any time, and will inform you of any changes as required by law.
WE RESPECT YOUR PRIVACY
We appreciate that you have provided us with your personal financial information. We strive to maintain the privacy of such information while we help you achieve your financial objectives. This Notice describes what non-public personal information we collect about you, why we collect it, when we may share it with others and how certain others may use it. It discusses the steps you may take to limit our sharing of certain information about you to affiliated companies in the Morgan Stanley family of companies ("other Morgan Stanley companies"). It also discloses how you may limit use of certain shared information for marketing purposes by other Morgan Stanley branded companies. Throughout this policy, we refer to the non-public information that personally identifies you or your accounts as "personal information."
1. WHAT PERSONAL INFORMATION DO WE COLLECT ABOUT YOU?
We obtain personal information from applications and other forms you submit to us, from your dealings with us, from consumer reporting agencies, from our Web sites and from third parties and other sources.
For example:
• We may collect information such as your name, address, e-mail address, telephone/fax numbers, assets, income and investment objectives through subscription documents, applications and other forms you submit to us.
• We may obtain information about account balances, your use of account(s) and the types of products and services you prefer to receive from us through your dealings and transactions with us and other sources.
• We may obtain information about your creditworthiness and credit history from consumer reporting agencies.
• We may collect background information from and through third-party vendors to verify representations you have made and to comply with various regulatory requirements.
• If you interact with us through our public and private Web sites, we may collect information that you provide directly through online communications (such as an e-mail address). We may also collect information about your Internet service provider, your domain name, your computer's operating system and Web browser, your use of our Web sites and your product and service preferences, through the use of "cookies." Please consult the Terms of Use of these sites for more details.
2. WHEN DO WE DISCLOSE PERSONAL INFORMATION WE COLLECT ABOUT YOU?
We may disclose personal information we collect about you to other Morgan Stanley companies and to non-affiliated third parties.
a. Information We Disclose to Other Morgan Stanley Companies.
We may disclose personal information to other Morgan Stanley companies for a variety of reasons, including to manage your account(s) effectively, to service and process your transactions, to let you know about products and services offered by us and other Morgan Stanley companies, to manage our business, and as otherwise required or permitted by law. Offers for products and services from other Morgan Stanley companies are developed under conditions designed to safeguard your personal information.
31
Morgan Stanley Institutional Fund, Inc.
Annual Report — December 31, 2016
Privacy Notice (unaudited) (cont'd)
b. Information We Disclose to Non-affiliated Third Parties.
We do not disclose personal information that we collect about you to non-affiliated third parties except to those who provide marketing services on our behalf, to financial institutions with whom we have joint marketing agreements, and as otherwise required or permitted by law. For example, we may disclose personal information to nonaffiliated third parties for servicing and processing transactions, to offer our own products and services, to protect against fraud, for institutional risk control, to respond to judicial process or to perform services on our behalf. When we share personal information with a non-affiliated third party, they are required to limit their use of personal information to the particular purpose for which it was shared and they are not allowed to share personal information with others except to fulfill that limited purpose or as may be permitted or required by law.
3. HOW DO WE PROTECT THE SECURITY AND CONFIDENTIALITY OF PERSONAL INFORMATION WE COLLECT ABOUT YOU?
We maintain physical, electronic and procedural security measures to help safeguard the personal information we collect about you. We have internal policies governing the proper handling of client information. Third parties that provide support or marketing services on our behalf may also receive personal information, and we require them to adhere to confidentiality standards with respect to such information.
4. HOW CAN YOU LIMIT THE SHARING OF CERTAIN TYPES OF PERSONAL INFORMATION WITH OTHER MORGAN STANLEY COMPANIES?
We offer you choices as to whether we share with other Morgan Stanley companies the personal information that was collected to determine your eligibility for products and services you request ("eligibility information"). Eligibility information does not include your identification information or personal information pertaining to our transactions or experiences with you. Please note that, even if you direct us not to share eligibility information with other Morgan Stanley companies ("opt-out"), we may still share personal information, including eligibility information, with those companies in circumstances excluded from the opt-out under applicable law, such as to process transactions or to service your account.
5. HOW CAN YOU LIMIT THE USE OF CERTAIN TYPES OF PERSONAL INFORMATION BY OTHER MORGAN STANLEY COMPANIES FOR MARKETING?
By following the opt-out instructions in Section 6 below, you may limit other Morgan Stanley branded companies from marketing their products or services to you based on personal information we disclose to them. This information may include, for example, your income and account history with us. Please note that, even if you choose to limit Other Morgan Stanley Companies from using personal information about you that we may share with them for marketing their products and services to you, Other Morgan Stanley Companies may use your personal information that they obtain from us to market to you in circumstances permitted by law, such as if the Other Morgan Stanley Company has its own relationship with you.
6. HOW CAN YOU SEND US AN OPT-OUT INSTRUCTION?
If you wish to limit our sharing of eligibility information about you with other Morgan Stanley companies or other Morgan Stanley companies' use of personal information for marketing purposes, as described in this notice, you may do so by:
• Calling us at (800) 548-7786
Monday–Friday between 8a.m. and 6p.m.(EST)
• Writing to us at the following address:
Boston Financial Data Services, Inc.
c/o Privacy Coordinator
P.O. Box 219804
Kansas City, Missouri 64121
32
Morgan Stanley Institutional Fund, Inc.
Annual Report — December 31, 2016
Privacy Notice (unaudited) (cont'd)
Your written request should include your name, address, telephone number and account number(s) to which the opt-out applies and whether you are opting out with respect to sharing of eligibility information (Section 4 above), or if information used for Marketing (Section 5 above) or both. Written opt-out requests should not be sent with any other correspondence. In order to process your request, we require that the request be provided by you directly and not through a third party.
Your opt-out preference will remain in effect with respect to this policy (as it may be amended) until you notify us otherwise. If you have a joint account, your direction for us not to share this information with other Morgan Stanley companies and for those other Morgan Stanley companies not to use your personal information for marketing will be applied to all account holders on that account. Please understand that if you limit our sharing or our affiliated companies' use of personal information, you and any joint account holder(s) may not receive information about Morgan Stanley products and services, including products or services that could help you manage your financial resources and achieve your investment objectives.
7. WHAT IF AN AFFILIATED COMPANY BECOMES A NON-AFFILIATED THIRD PARTY?
If, at any time in the future, an affiliated company becomes a non-affiliated third party, further disclosures of personal information made to the former affiliated company will be limited to those described in Section 2(b) above relating to non-affiliated third parties. If you elected under Section 6 to limit disclosures we make to affiliated companies, or use of personal information by affiliated companies, your election will not apply to use by any former affiliated company of your personal information in their possession once it becomes a non-affiliated third party.
SPECIAL NOTICE TO RESIDENTS OF VERMONT
The following section supplements our policy with respect to our individual clients who have a Vermont address and supersedes anything to the contrary in the above policy with respect to those clients only.
The state of Vermont requires financial institutions to obtain your consent prior to sharing personal information that they collect about you with affiliated companies and non-affiliated third parties other than in certain limited circumstances. Except as permitted by law, we will not share personal information we collect about you with non-affiliated third parties or other Morgan Stanley companies unless you provide us with your written consent to share such information ("opt-in").
If you wish to receive offers for investment products and services offered by or through other Morgan Stanley companies, please notify us in writing at the following address:
Boston Financial Data Services, Inc.
c/o Privacy Coordinator
P.O. Box 219804
Kansas City, Missouri 64121
Your authorization should include your name, address, telephone number and account number(s) to which the opt-in applies and should not be sent with any other correspondence. In order to process your authorization, we require that the authorization be provided by you directly and not through a third party.
SPECIAL NOTICE TO RESIDENTS OF CALIFORNIA
The following section supplements our policy with respect to our individual clients who have a California address and supersedes anything to the contrary in the above policy with respect to those clients only.
In response to a California law, if your account has a California home address, your personal information will not be disclosed to nonaffiliated third parties except as permitted by applicable California law, and we will limit sharing such information with our affiliates to comply with California privacy laws that apply to us.
33
Morgan Stanley Institutional Fund, Inc.
Annual Report — December 31, 2016
Director and Officer Information (unaudited)
Independent Directors:
Name, Age and Address of
Independent Director | | Position(s)
Held with
Registrant | | Length of Time
Served* | | Principal Occupation(s) During Past 5 Years
and Other Relevant Professional Experience | | Number of
Portfolios in
Fund Complex
Overseen by
Independent
Director** | | Other Directorships
Held by Independent
Director*** | |
Frank L. Bowman (72)
c/o Perkins Coie LLP
Counsel to the Independent
Directors
30 Rockefeller Plaza
New York, NY 10112 | | Director | | Since
August
2006 | | President, Strategic Decisions, LLC (consulting) (since February 2009); Director or Trustee of various Morgan Stanley Funds (since August 2006); Chairperson of the Compliance and Insurance Committee (since October 2015); formerly, Chairperson of the Insurance Sub-Committee of the Compliance and Insurance Committee (2007-2015); served as President and Chief Executive Officer of the Nuclear Energy Institute (policy organization) (February 2005-November 2008); retired as Admiral, U.S. Navy after serving over 38 years on active duty including 8 years as Director of the Naval Nuclear Propulsion Program in the Department of the Navy and the U.S. Department of Energy (1996-2004); served as Chief of Naval Personnel (July 1994-September 1996) and on the Joint Staff as Director of Political Military Affairs (June 1992-July 1994); knighted as Honorary Knight Commander of the Most Excellent Order of the British Empire; awarded the Officier de l'Orde National du Mérite by the French Government; elected to the National Academy of Engineering (2009). | | | 90 | | | Director of BP p.l.c.; Director of Naval and Nuclear Technologies LLP; Director Emeritus of the Armed Services YMCA; Director of the U.S. Naval Submarine League; Member of the National Security Advisory Council of the Center for U.S. Global Engagement and a member of the CNA Military Advisory Board; Chairman of the charity J Street Cup Golf; Trustee of Fairhaven United Methodist Church; and Director of other various non-profit organizations. | |
Kathleen A. Dennis (63)
c/o Perkins Coie LLP
Counsel to the Independent Directors
30 Rockefeller Plaza
New York, NY 10112 | | Director | | Since
August
2006 | | President, Cedarwood Associates (mutual fund and investment management consulting) (since July 2006); Chairperson of the Liquidity and Alternatives Sub-Committee of the Investment Committee (since October 2006) and Director or Trustee of various Morgan Stanley Funds (since August 2006); formerly, Senior Managing Director of Victory Capital Management (1993-2006). | | | 91 | | | Director of various non-profit organizations. | |
Nancy C. Everett (61)
c/o Perkins Coie LLP
Counsel to the Independent Directors
30 Rockefeller Plaza
New York, NY 10112 | | Director | | Since
January
2015 | | Chief Executive Officer, Virginia Commonwealth University Investment Company (since November 2015); Owner, OBIR, LLC (institutional investment management consulting) (since June 2014); formerly, Managing Director, BlackRock Inc. (February 2011-December 2013); and Chief Executive Officer, General Motors Asset Management (a/k/a Promark Global Advisors, Inc.) (June 2005-May 2010). | | | 91 | | | Member of Virginia Commonwealth University School of Business Foundation; formerly, Member of Virginia Commonwealth University Board of Visitors (2013-2015); Member of Committee on Directors for Emerging Markets Growth Fund, Inc. (2007-2010); Chairperson of Performance Equity Management, LLC (2006-2010); and Chairperson, GMAM Absolute Return Strategies Fund, LLC (2006-2010). | |
34
Morgan Stanley Institutional Fund, Inc.
Annual Report — December 31, 2016
Director and Officer Information (unaudited) (cont'd)
Independent Directors: (cont'd)
Name, Age and Address of
Independent Director | | Position(s)
Held with
Registrant | | Length of Time
Served* | | Principal Occupation(s) During Past 5 Years
and Other Relevant Professional Experience | | Number of
Portfolios in
Fund Complex
Overseen by
Independent
Director** | | Other Directorships
Held by Independent
Director*** | |
Jakki L. Haussler (59)
c/o Perkins Coie LLP
Counsel to the Independent Directors
30 Rockefeller Plaza
New York, NY 10112 | | Director | | Since
January
2015 | | Chairman and Chief Executive Officer, Opus Capital Group (since January 1996); formerly, Director, Capvest Venture Fund, LP (May 2000-December 2011); Partner, Adena Ventures, LP (July 1999-December 2010); Director, The Victory Funds (February 2005-July 2008). | | | 91 | | | Director of Cincinnati Bell Inc. and Member, Audit Committee and Compensation Committee; Director of Northern Kentucky University Foundation and Member, Investment Committee; Member of Chase College of Law Transactional Law Practice Center Board of Advisors; Director of Best Transport; Director of Chase College of Law Board of Visitors; formerly, Member, University of Cincinnati Foundation Investment Committee; Member, Miami University Board of Visitors (2008-2011); Trustee of Victory Funds (2005-2008) and Chairman, Investment Committee (2007-2008) and Member, Service Provider Committee (2005-2008). | |
Dr. Manuel H. Johnson (67)
c/o Johnson Smick
International, Inc.
220 I Street, N.E. — Suite 200
Washington, D.C. 20002 | | Director | | Since
July
1991 | | Senior Partner, Johnson Smick International, Inc. (consulting firm); Chairperson of the Investment Committee (since October 2006) and Director or Trustee of various Morgan Stanley Funds (since July 1991); Co-Chairman and a founder of the Group of Seven Council (G7C) (international economic commission); formerly, Chairperson of the Audit Committee (July 1991-September 2006), Vice Chairman of the Board of Governors of the Federal Reserve System and Assistant Secretary of the U.S. Treasury. | | | 91 | | | Director of NVR, Inc. (home construction). | |
Joseph J. Kearns (74)
c/o Kearns & Associates LLC
46 E Peninsula Center #385
Rolling Hills Estates, CA 90274-3712 | | Director | | Since
August
1994 | | President, Kearns & Associates LLC (investment consulting); Chairperson of the Audit Committee (since October 2006) and Director or Trustee of various Morgan Stanley Funds (since August 1994); formerly, Deputy Chairperson of the Audit Committee (July 2003-September 2006) and Chairperson of the Audit Committee of various Morgan Stanley Funds (since August 1994); CFO of the J. Paul Getty Trust. | | | 93 | | | Director of Electro Rent Corporation (equipment leasing). Prior to December 31, 2013, Director of The Ford Family Foundation. | |
35
Morgan Stanley Institutional Fund, Inc.
Annual Report — December 31, 2016
Director and Officer Information (unaudited) (cont'd)
Independent Directors: (cont'd)
Name, Age and Address of
Independent Director | | Position(s)
Held with
Registrant | | Length of Time
Served* | | Principal Occupation(s) During Past 5 Years
and Other Relevant Professional Experience | | Number of
Portfolios in
Fund Complex
Overseen by
Independent
Director** | | Other Directorships
Held by Independent
Director*** | |
Michael F. Klein (58)
c/o Perkins Coie LLP
Counsel to the Independent Directors
30 Rockefeller Plaza
New York, NY 10112 | | Director | | Since
August
2006 | | Managing Director, Aetos Capital, LLC (since March 2000); Co-President, Aetos Alternatives Management, LLC (since January 2004) and Co-Chief Executive Officer of Aetos Capital LLC (since August 2013); Chairperson of the Fixed Income Sub-Committee of the Investment Committee (since October 2006) and Director or Trustee of various Morgan Stanley Funds (since August 2006); formerly, Managing Director, Morgan Stanley & Co. Inc. and Morgan Stanley Dean Witter Investment Management, President, various Morgan Stanley Funds (June 1998-March 2000) and Principal, Morgan Stanley & Co. Inc. and Morgan Stanley Dean Witter Investment Management (August 1997-December 1999). | | | 90 | | | Director of certain investment funds managed or sponsored by Aetos Capital, LLC; Director of Sanitized AG and Sanitized Marketing AG (specialty chemicals). | |
Patricia Maleski (56)
c/o Perkins Coie LLP
Counsel to the Independent Directors
30 Rockefeller Plaza
New York, NY 10112 | | Director | | Since
January
2017 | | Management Director, JPMorgan Asset Management (2013-2016); President, JPMorgan Funds (2010-2013), Chief Administrative Officer, JPMorgan Funds (2004-2010), Treasurer, JPMorgan Funds (2003-2004, 2008-2010), and Vice President and Board Liaison, JPMorgan Funds (2001-2004); Managing Director, J.P. Morgan Investment Management Inc. (2001-2013); Vice President of Finance, Pierpont Group (1996-2001); Vice President, Bank of New York (1995-1996); Senior Audit Manager, Price Waterhouse, LLP (1982-1995). | | | 91 | | | None. | |
Michael E. Nugent (80)
522 Fifth Avenue
New York, NY 10036 | | Chair of the Board and Director | | Chair of the Boards since July 2006 and Director since July 1991 | | Chair of the Boards of various Morgan Stanley Funds (since July 2006); Chairperson of the Closed-End Fund Committee (since June 2012) and Director or Trustee of various Morgan Stanley Funds (since July 1991); formerly, Chairperson of the Insurance Committee (until July 2006); General Partner, Triumph Capital, L.P. (private investment partnership) (1988-2013). | | | 92 | | | None. | |
W. Allen Reed (69)
c/o Perkins Coie LLP
Counsel to the Independent Directors
30 Rockefeller Plaza
New York, NY 10112 | | Director | | Since
August
2006 | | Chairperson of the Equity Sub-Committee of the Investment Committee (since October 2006) and Director or Trustee of various Morgan Stanley Funds (since August 2006); formerly, President and CEO of General Motors Asset Management; Chairman and Chief Executive Officer of the GM Trust Bank and Corporate Vice President of General Motors Corporation (August 1994-December 2005). | | | 91 | | | Director of Legg Mason, Inc.; formerly, Director of the Auburn University Foundation (2010-2015). | |
Fergus Reid (84)
c/o Joe Pietryka, Inc.
85 Charles Colman Blvd.
Pawling, NY 12564 | | Director | | Since
June
1992 | | Chairman, Joe Pietryka, Inc.; Chairperson of the Governance Committee and Director or Trustee of various Morgan Stanley Funds (since June 1992). | | | 92 | | | Formerly, Trustee and Director of certain investment companies in the JP Morgan Fund Complex managed by JP Morgan Investment Management Inc. (1987-2012). | |
* This is the earliest date the Director began serving the Morgan Stanley Funds. Each Director serves an indefinite term, until his or her successor is elected.
** The Fund Complex includes (as of December 31, 2016) all open-end and closed-end funds (including all of their portfolios) advised by Morgan Stanley Investment Management Inc. (the "Adviser") and any funds that have an adviser that is an affiliated person of the Adviser (including, but not limited to, Morgan Stanley AIP GP LP).
*** This includes any directorships at public companies and registered investment companies held by the Director at any time during the past five years.
36
Morgan Stanley Institutional Fund, Inc.
Annual Report — December 31, 2016
Director and Officer Information (unaudited) (cont'd)
Executive Officers:
Name, Age and Address of Executive Officer | | Position(s) Held
with
Registrant | | Length of Time
Served* | | Principal Occupation(s) During Past 5 Years | |
John H. Gernon (53)
522 Fifth Avenue
New York, NY 10036 | | President and Principal Executive Officer | | Since
September
2013 | | President and Principal Executive Officer of the Equity and Fixed Income Funds and the Morgan Stanley AIP Funds (since September 2013) and the Liquidity Funds and various money market funds (since May 2014) in the Fund Complex; Managing Director of the Adviser; Head of Product (since 2006). | |
Timothy J. Knierim (58)
522 Fifth Avenue
New York, NY 10036 | | Chief Compliance Officer | | Since
December
2016 | | Managing Director of the Adviser and various entities affiliated with the Adviser; Chief Compliance Officer of various Morgan Stanley Funds and the Adviser (since December 2016) and Chief Compliance Officer of Morgan Stanley AIP GP LP (since 2014). Formerly, Managing Director and Deputy Chief Compliance Officer of the Adviser (2014-2016); and formerly, Chief Compliance Officer of Prudential Investment Management, Inc. (2007-2014). | |
Francis J. Smith (51)
522 Fifth Avenue
New York, NY 10036 | | Treasurer and Principal Financial Officer | | Treasurer since July 2003 and Principal Financial Officer since September 2002 | | Managing Director of the Adviser and various entities affiliated with the Adviser; Treasurer (since July 2003) and Principal Financial Officer of various Morgan Stanley Funds (since September 2002). | |
Mary E. Mullin (49)
522 Fifth Avenue
New York, NY 10036 | | Secretary | | Since
June
1999 | | Executive Director of the Adviser; Secretary of various Morgan Stanley Funds (since June 1999). | |
* This is the earliest date the officer began serving the Morgan Stanley Funds. Each officer serves a one-year term, until his or her successor is elected and qualifies.
37
Morgan Stanley Institutional Fund, Inc.
Annual Report — December 31, 2016
Adviser and Administrator
Morgan Stanley Investment Management Inc.
522 Fifth Avenue
New York, New York 10036
Distributor
Morgan Stanley Distribution, Inc.
522 Fifth Avenue
New York, New York 10036
Dividend Disbursing and Transfer Agent
Boston Financial Data Services, Inc.
2000 Crown Colony Drive
Quincy, Massachusetts 02169
Custodian
State Street Bank and Trust Company
One Lincoln Street
Boston, Massachusetts 02111
Legal Counsel
Dechert LLP
1095 Avenue of the Americas
New York, New York 10036
Counsel to the Independent Directors
Perkins Coie LLP
30 Rockefeller Plaza
New York, New York 10112
Independent Registered Public Accounting Firm
Ernst & Young LLP
200 Clarendon Street
Boston, Massachusetts 02116
Reporting to Shareholders
Each Morgan Stanley fund provides a complete schedule of portfolio holdings in its semi-annual and annual reports within 60 days of the end of the fund's second and fourth fiscal quarters. The semi-annual and annual reports are filed electronically with the Securities and Exchange Commission (SEC) on Form N-CSRS and Form N-CSR, respectively. Morgan Stanley also delivers the semi-annual and annual reports to fund shareholders and makes these reports available on its public website, www.morganstanley.com/im. Each Morgan Stanley fund also files a complete schedule of portfolio holdings with the SEC for the fund's first and third fiscal quarters on Form N-Q. Morgan Stanley does not deliver the reports for the first and third fiscal quarters to shareholders, nor are the reports posted to the Morgan Stanley public website. You may, however, obtain the Form N-Q filings (as well as the Form N-CSR and N-CSRS filings) by accessing the SEC's website, www.sec.gov. You may also review and copy them at the SEC's Public Reference Room in Washington, DC. Information on the operation of the SEC's Public Reference Room may be obtained by calling the SEC toll free at 1 (800) SEC-0330. You can also request copies of these materials, upon payment of a duplicating fee, by electronic request at the SEC's email address (publicinfo@sec.gov) or by writing the Public Reference Room of the SEC, 100 F Street, NE, Washington, DC 20549-0102.
Proxy Voting Policies and Procedures and Proxy Voting Record
You may obtain a copy of the Fund's Proxy Voting Policy and Procedures and information regarding how the Fund voted proxies relating to portfolio securities during the most recent twelve-month period ended June 30, without charge, upon request, by calling toll free 1 (800) 548-7786 or by visiting our website at www.morganstanley.com/im. This information is also available on the SEC's website at www.sec.gov.
This report is authorized for distribution only when preceded or accompanied by a prospectus or summary prospectus of the applicable Portfolio of Morgan Stanley Institutional Fund, Inc., which describes in detail the Portfolio's investment policies, risks, fees and expenses. Please read the prospectus carefully before you invest or send money. For additional information, including information regarding the investments comprising the Portfolio, please visit our website at www.morganstanley.com/im or call toll free 1 (800) 548-7786.
38
(This Page has been left blank intentionally.)
(This Page has been left blank intentionally.)
(This Page has been left blank intentionally.)
Printed in U.S.A.
This Report has been prepared for shareholders and may be distributed to others only if preceded or accompanied by a current prospectus.
Morgan Stanley Investment Management Inc.
522 Fifth Avenue
New York, New York 10036
© 2017 Morgan Stanley. Morgan Stanley Distribution, Inc.

IFIGOANN
1698208 EXP. 02.28.18

Morgan Stanley Institutional Fund, Inc.
Global Quality Portfolio
Annual Report
December 31, 2016

Morgan Stanley Institutional Fund, Inc.
Annual Report — December 31, 2016
Shareholders' Letter | | | 2 | | |
Expense Example | | | 3 | | |
Investment Overview | | | 4 | | |
Portfolio of Investments | | | 8 | | |
Statement of Assets and Liabilities | | | 9 | | |
Statement of Operations | | | 11 | | |
Statements of Changes in Net Assets | | | 12 | | |
Financial Highlights | | | 14 | | |
Notes to Financial Statements | | | 19 | | |
Report of Independent Registered Public Accounting Firm | | | 26 | | |
Federal Tax Notice | | | 27 | | |
Privacy Notice | | | 28 | | |
Director and Officer Information | | | 31 | | |
This report is authorized for distribution only when preceded or accompanied by a prospectus or summary prospectus of the applicable Portfolio of Morgan Stanley Institutional Fund, Inc. To receive a prospectus and/or statement of additional information (SAI), which contains more complete information such as investment objectives, charges, expenses, policies for voting proxies, risk considerations, and describes in detail each of the Portfolio's investment policies to the prospective investor, please call toll free 1 (800) 548-7786. Please read the prospectuses carefully before you invest or send money.
Additionally, you can access information about the Portfolio, including performance, characteristics, and investment team commentary, through Morgan Stanley Investment Management's website: www.morganstanley.com/im.
Market forecasts provided in this report may not necessarily come to pass. There is no guarantee that any sectors mentioned will continue to perform as discussed herein or that securities in such sectors will be held by the Portfolio in the future. There is no assurance that a Portfolio will achieve its investment objective. Portfolios are subject to market risk, which is the possibility that market values of securities owned by the Portfolio will decline and, therefore, the value of the Portfolio's shares may be less than what you paid for them. Accordingly, you can lose money investing in this Portfolio. Please see the prospectus for more complete information on investment risks.
1
Morgan Stanley Institutional Fund, Inc.
Annual Report — December 31, 2016
Shareholders' Letter (unaudited)
Dear Shareholders,
We are pleased to provide this Annual report, in which you will learn how your investment in Global Quality Portfolio (the "Portfolio") performed during the latest twelve-month period.
Morgan Stanley Investment Management is a client-centric, investor-led organization. Our global presence, intellectual capital, and breadth of products and services enable us to partner with investors to meet the evolving challenges of today's financial markets. We aim to deliver superior investment service and to empower our clients to make the informed decisions that help them reach their investment goals.
As always, we thank you for selecting Morgan Stanley Investment Management, and look forward to working with you in the months and years ahead.
Sincerely,

John H. Gernon
President and Principal Executive Officer
January 2017
2
Morgan Stanley Institutional Fund, Inc.
Annual Report — December 31, 2016
Expense Example (unaudited)
Global Quality Portfolio
As a shareholder of the Portfolio, you incur two types of costs: (1) transactional costs; and (2) ongoing costs, which may include advisory fees, administration fees, distribution and shareholder services fees and other Portfolio expenses. This example is intended to help you understand your ongoing costs (in dollars) of investing in the Portfolio and to compare these costs with the ongoing costs of investing in other mutual funds.
This example is based on an investment of $1,000 invested at the beginning of the six-month period ended December 31, 2016 and held for the entire six-month period.
Actual Expenses
The table below provides information about actual account values and actual expenses. You may use the information in this table, together with the amount you invested, to estimate the expenses that you paid over the period. Simply divide your account value by $1,000 (for example, an $8,600 account value divided by $1,000 = 8.6), then multiply the result by the number in the table under the heading entitled "Actual Expenses Paid During Period" to estimate the expenses you paid on your account during this period.
Hypothetical Example for Comparison Purposes
The table below provides information about hypothetical account values and hypothetical expenses based on the Portfolio's actual expense ratio and an assumed rate of return of 5% per year before expenses, which is not the Portfolio's actual return. The hypothetical account values and expenses may not be used to estimate the actual ending account balance or expenses you paid for the period. You may use this information to compare the ongoing costs of investing in the Portfolio and other funds. To do so, compare this 5% hypothetical example with the 5% hypothetical examples that appear in the shareholder reports of the other funds.
Please note that the expenses shown in the table are meant to highlight your ongoing costs only and do not reflect any transactional costs, such as sales charges (loads). Therefore, the information for each class in the table is useful in comparing ongoing costs only, and will not help you determine the relative total costs of owning different funds. In addition, if these transactional costs were included, your costs would have been higher.
| | | Beginning
Account
Value
7/1/16 | | Actual Ending
Account
Value
12/31/16 | | Hypothetical
Ending Account
Value | | Actual
Expenses
Paid
During
Period* | | Hypothetical
Expenses Paid
During Period* | | Net
Expense
Ratio
During
Period** | |
Global Quality Portfolio Class I | | $ | 1,000.00 | | | $ | 995.80 | | | $ | 1,020.11 | | | $ | 5.02 | | | $ | 5.08 | | | | 1.00 | %*** | |
Global Quality Portfolio Class A | | | 1,000.00 | | | | 993.80 | | | | 1,018.35 | | | | 6.77 | | | | 6.85 | | | | 1.35 | *** | |
Global Quality Portfolio Class L | | | 1,000.00 | | | | 992.10 | | | | 1,015.94 | | | | 9.16 | | | | 9.27 | | | | 1.83 | *** | |
Global Quality Portfolio Class C | | | 1,000.00 | | | | 990.30 | | | | 1,014.58 | | | | 10.51 | | | | 10.63 | | | | 2.10 | *** | |
Global Quality Portfolio Class IS | | | 1,000.00 | | | | 995.60 | | | | 1,020.36 | | | | 4.77 | | | | 4.82 | | | | 0.95 | *** | |
* Expenses are calculated using each Portfolio Class' annualized net expense ratio (as disclosed), multiplied by the average account value over the period, and multiplied by 184/366 (to reflect the most recent one-half year period).
** Annualized.
*** Refer to Note F in the Notes to Financial Statements for discussion of prior period custodian out-of-pocket expenses that were reimbursed in the current period.
3
Morgan Stanley Institutional Fund, Inc.
Annual Report — December 31, 2016
Investment Overview (unaudited)
Global Quality Portfolio
The Portfolio seeks long-term capital appreciation.
Performance
For the year ended December 31, 2016, the Portfolio's Class I shares had a total return based on net asset value and reinvestment of distributions per share of 4.20%, net of fees. The Portfolio's Class I shares underperformed the Portfolio's benchmark, the MSCI World Index (the "Index"), which returned 7.51%.
Factors Affecting Performance
• After all was said and done, the MSCI World Index ended the year up 7.5% in U.S. dollar ("USD") terms (+9.0% local). The commodity markets fared best, with Canada up 25% in USD, Norway gaining 13% and Australia 11%.(i) The U.S. was also comfortably ahead of the index (+11%). Core Europe was only up mildly, with France and the Netherlands each up +5% in USD and 8% in euros. Japan was up 2% in USD but down 1% in yen, while the U.K. was flat in dollars, but up a mighty 19% in wilting sterling. Peripheral Europe lagged the Index, with Spain off 1%, Ireland down 7% and Italy down 10% in USD despite a late-year rally. It was a decent year for emerging markets, up 11% in USD and 10% in local currency, as measured by the MSCI Emerging Markets Index. The stars were Brazil (up 66%) and Russia (up 55%).
• Overall 2016 saw the commodity complex doing best, with energy up +27% and materials up +22%, and the cyclical industrials (+13%), financials (+12%) and information technology (+11%) also beating the Index. Consumer discretionary lagged a little, up only 3%, but the other strugglers were the defensives. Utilities and telecommunications (both +6%) were close to the overall Index performance, but consumer staples was only up 2% and health care actually fell 7%. The real story was that it was a year of two very different halves, with, what we consider, high quality ruling the first half and lower quality dominating the second half. Consumer staples was 8% ahead of the market in the first half but 13% behind in the second half, while financials was 9% behind in the first half, but 15% ahead in second half.
• For the Portfolio, for 2016 as a whole, sector allocation was significantly negative, thanks to the major overweight in the consumer staples sector, the absence from the energy sector and minimal holdings in the materials sector. Stock selection was a positive, thanks to outperformance in consumer staples, information technology and health care, but it was not enough to match the sector effect.
• Top absolute contributors to the Portfolio's performance for the year were Reynolds American, Altria Group and Microsoft. Top absolute detractors for the period were Novartis, Roche Holding and Nike.(ii)
Management Strategies
• The defining feature of the second half of 2016 has been the massive rally in value stocks (and a balancing de-rating of defensives) given an extra boost in the fourth quarter by the election of President-elect Trump. Executing an effortless hand-brake turn, it appears that the market has effectively reassessed the global outlook from one of sluggish growth and disinflation to one of reflation and rising growth. We believe the market is clearly hoping that fiscal policy will now drive reflation (i.e., growth and inflation) after monetary policy failed to do so. After years of deadlock, America now seems to be getting an executive that can likely get laws through Congress (for better or worse) as Trump and the Republican establishment decide that on balance they probably despise each other less than they hate the Democrats. This means that the U.S. may use fiscal policy where it previously over-used monetary policy in the face of political gridlock. Whether it works or not or has the desired outcomes is of course another question.
• We believe low expectations may well help Trump and should not obscure his biggest potential long-term opportunity — to sort out the U.S. taxation system, which has incentivized U.S. companies to invest outside America.
• Cutting personal and corporate tax rates should provide a stimulus to the economy, and in the case
(i) Country, region and sector performance data from FactSet.
(ii) The information contained in this overview regarding specific securities is for informational purposes only and should not be construed as a recommendation to purchase or sell the securities mentioned.
4
Morgan Stanley Institutional Fund, Inc.
Annual Report — December 31, 2016
Investment Overview (unaudited) (cont'd)
Global Quality Portfolio
of some domestically focused U.S. companies, could significantly boost post-tax earnings. However, there are a series of provisos. Many U.S. corporates already have a tax rate well below the headline 35% rate,(iii) either because of foreign income or assorted loopholes, while the proposed border adjustment tax brings risks of trade wars. The hopes of a resultant capital expenditure surge may be overstated in the short term, particularly in the case of the piles of overseas cash held by tech companies, as they are not exactly cash-constrained at present. However, longer-term, a border adjustment tax, if actually implemented, could be a game changer if the rest of the world, and particularly China, puts up with the U.S. joining the global tax arbitrage game rather than risking hard tariffs.
• Looking at the macro side, the personal tax cuts seem to be heavily skewed to higher earners (as opposed to those on lower incomes who put reportedly helped Trump in the White House), which may limit the macro impact given the wealthy's higher propensity to save rather than spend. However, the state of the economic cycle may be more of a problem. U.S. unemployment is already under 5%,(iv) and rising wages, while positive for demand, could well put significant pressures on corporate margins, potentially wiping out the taxation gains in many cases where companies lack pricing power. It could well also push the Federal Reserve to tighten faster than expected.
• The market assumption that there will be reflation via fiscal policy outside the U.S. looks particularly dangerous. In Europe, the Germans are critical of the European Union agreeing to use fiscal policy (or at least, relax current fiscal constraints on individual countries) to reflate and we see next to no chance of a significant move in 2017. Mrs. Merkel wants to be re-elected in September 2017 and may therefore be extremely reluctant to give further ammunition to the euro-skeptic German AfD (Alternative for Germany) party, which has seen substantial state
election gains in 2016 following Merkel's unpopular refugee policy. In Japan, there has been a history of reflation via fiscal policy, but the government has yet to cross the Rubicon of the Bank of Japan backing effectively unlimited government fiscal expenditure rather than merely tethering bond yields to circa 0%. Of all developed countries, Japan is probably closest to crossing this Rubicon due to its dire government debt situation, but will probably be cautious about doing so as it would almost certainly blow up the yen.
• Overall, we do not yet see a significant inflationary threat. The rise in commodity prices is likely to feed through over the next year, and there are the classic late-cycle pressures in the U.S. through increasing labor costs. However, there are still substantial deflationary forces in the system, given the enormous overhang of debt in the world and the impacts of technology. There has already been a transfer of $3 trillion of value from the bond market to the equity market,(v) and Trump has not always been a friend of debt holders during his business career, but a severe bond rout looks unlikely.
• We do worry that the market is too sanguine on political risk. The biggest single worry is Trump doing something crazy (via executive order or tweet) on foreign policy or trade. The next biggest worry is European politics. In 2017, Europe is facing elections in the Netherlands, France and Germany and a potential early election in Italy. Each of these has potential existential risk for the eurozone if they follow the political playbook of Brexit or Trump. While it is likely that the status quo will just about scrape by in each country, it is far from clear that it will manage a clean sweep. If any one of these elections creates existential threats for Europe, we expect stock market fireworks in 2017. At a more fundamental level, it is far from clear that the sustained global howl of rage at the financial and political elites should be positive for asset prices.
(iii) Source: U.S. Government Accountability Office Report to the Ranking Member, Committee on the Budget, U.S. Senate, "Corporate Income Tax: Most Large Profitable U.S. Corporations Paid Tax but Effective Tax Rates Differed Significantly from the Statutory Rate," GAO-16-363, March 2016.
(iv) Source: Bureau of Labor Statistics, December 2016
(v) Source: Deutsche Bank Research, December 20, 2016
5
Morgan Stanley Institutional Fund, Inc.
Annual Report — December 31, 2016
Investment Overview (unaudited) (cont'd)
Global Quality Portfolio
• Any update from us these days would not be complete without a moan about valuations. The MSCI World Index is trading at over 16x estimated 2017 earnings, which are themselves assumed to be up a healthy 13% on the 2016 earnings, with the U.S. more than a turn higher than that.(vi) This does not seem to offer a sufficient margin of safety given the myriad risks we have mentioned above, even before considering how the "adjusted" earnings are inflated versus the official GAAP/IFRS (Generally Accepted Accounting Principles/International Financial Reporting Standards) numbers these days. The Schiller Price-Earnings (P/E), which attempts to control for the business cycle by using a 10-year average for earnings, is now at 28x for the U.S., only beaten during the Tech-Media-Telecom boom and the late 1920s bubble.(vi)
• While the overall level of valuations is demanding, the sector rotation over the last six months has left the two highest-quality sectors, consumer staples and health care, looking attractive in relative terms. The consumer staples premium to MSCI World Index has halved over the period from 31% to 15%, and is lower still than that in free cash flow terms, while health care, very unusually, is trading at a 10% discount to the market, although, in our view, the threat of significant drug pricing reform in the U.S., had Clinton won, has been replaced by the threat of occasional threatening tweets under Trump.(vi) While it is very possible that the Trump rally and rotation has further to run, these two sectors look reasonably priced in absolute terms, and attractive in relative returns given their historically defensive stability and high returns on capital.
(vi) Source: FactSet, December 31, 2016

* Minimum Investment for Class I shares
** Commenced Operations on August 30, 2013.
In accordance with SEC regulations, the Portfolio's performance shown assumes that all recurring fees (including management fees) were deducted and all dividends and distributions were reinvested. The performance of Class A, L, C and IS shares will vary from the performance of Class I shares based upon their different inception dates and will be impacted by additional fees assessed to those classes (if applicable).
Performance Compared to the MSCI World Index(1) and the Lipper Global Large-Cap Growth Funds Index(2)
| | | Period Ended December 31, 2016
Total Returns(3) | |
| | | | Average Annual | |
| | | One
Year | | Five
Years | | Ten
Years | | Since
Inception(7) | |
Portfolio — Class I Shares
w/o sales charges(4) | | | 4.20 | % | | | — | | | | — | | | | 7.43 | % | |
Portfolio — Class A Shares
w/o sales charges(4) | | | 3.83 | | | | — | | | | — | | | | 7.08 | | |
Portfolio — Class A Shares with
maximum 5.25% sales charges(4) | | | –1.61 | | | | — | | | | — | | | | 5.37 | | |
Portfolio — Class L Shares
w/o sales charges(4) | | | 3.31 | | | | — | | | | — | | | | 6.54 | | |
Portfolio — Class C Shares
w/o sales charges(6) | | | 3.06 | | | | — | | | | — | | | | 1.74 | | |
Portfolio — Class C Shares with
maximum 1.00% deferred sales
charges(6) | | | 2.12 | | | | — | | | | — | | | | 1.74 | | |
Portfolio — Class IS Shares
w/o sales charges(5) | | | 4.17 | | | | — | | | | — | | | | 6.65 | | |
MSCI World Index | | | 7.51 | | | | — | | | | — | | | | 7.38 | | |
Lipper Global Large-Cap Growth
Funds Index | | | 2.91 | | | | — | | | | — | | | | 6.40 | | |
6
Morgan Stanley Institutional Fund, Inc.
Annual Report — December 31, 2016
Investment Overview (unaudited) (cont'd)
Global Quality Portfolio
Performance data quoted represents past performance, which is no guarantee of future results, and current performance may be lower or higher than the figures shown. Performance assumes that all dividends and distributions, if any, were reinvested. For the most recent month-end performance figures, please visit www.morganstanley.com/im. Investment return and principal value will fluctuate so that Portfolio shares, when redeemed, may be worth more or less than their original cost. Total returns do not reflect the deduction of taxes that a shareholder would pay on Portfolio distributions or the redemption of Portfolio shares. Performance of share classes will vary due to difference in expenses.
(1) The MSCI World Index is a free float-adjusted market capitalization weighted index designed to measure the equity market performance of developed markets. The term "free float" represents the portion of shares outstanding that are deemed to be available for purchase in the public equity markets by investors. The MSCI World Index currently consists of 23 developed market country indices. The performance of the Index is listed in US dollars and assumes reinvestment of net dividends. The Index is unmanaged and its returns do not include any sales charges or fees. Such costs would lower performance. It is not possible to invest directly in an index.
(2) The Lipper Global Large-Cap Growth Funds Index is an equally weighted performance index of the largest qualifying funds (based on net assets) in the Lipper Global Large-Cap Growth Funds classification. The Index, which is adjusted for capital gains distributions and income dividends, is unmanaged and should not be considered an investment. There are currently 10 funds represented in this Index. As of the date of this report, the Portfolio is in the Lipper Global Large-Cap Growth Funds classification.
(3) Total returns for the Portfolio reflect fees waived and expenses reimbursed, if applicable, by the Adviser. Without such waivers and reimbursements, total returns would have been lower.
(4) Commenced operations on August 30, 2013.
(5) Commenced offering on September 13, 2013.
(6) Commenced offering on April 30, 2015.
(7) For comparative purposes, average annual since inception returns listed for the Indexes refer to the inception date of Class I of the Portfolio, not the inception of the Index.
7
Morgan Stanley Institutional Fund, Inc.
Annual Report — December 31, 2016
Portfolio of Investments
Global Quality Portfolio
| | | Shares | | Value
(000) | |
Common Stocks (99.1%) | |
France (8.6%) | |
L'Oreal SA | | | 2,577 | | | $ | 470 | | |
Pernod Ricard SA | | | 1,842 | | | | 200 | | |
Sanofi | | | 1,493 | | | | 121 | | |
| | | | 791 | | |
Germany (4.9%) | |
Bayer AG (Registered) | | | 1,613 | | | | 169 | | |
SAP SE | | | 3,284 | | | | 286 | | |
| | | | 455 | | |
Hong Kong (1.0%) | |
AIA Group Ltd. | | | 16,200 | | | | 91 | | |
Netherlands (2.9%) | |
Priceline Group, Inc. (The) (a) | | | 132 | | | | 194 | | |
RELX N.V. | | | 4,535 | | | | 76 | | |
| | | | 270 | | |
Switzerland (8.6%) | |
Nestle SA (Registered) | | | 2,801 | | | | 201 | | |
Novartis AG (Registered) | | | 4,939 | | | | 359 | | |
Roche Holding AG (Genusschein) | | | 998 | | | | 228 | | |
| | | | 788 | | |
United Kingdom (20.7%) | |
British American Tobacco PLC | | | 5,103 | | | | 291 | | |
Experian PLC | | | 2,917 | | | | 56 | | |
GlaxoSmithKline PLC | | | 17,299 | | | | 333 | | |
Prudential PLC | | | 7,041 | | | | 141 | | |
Reckitt Benckiser Group PLC | | | 6,902 | | | | 586 | | |
RELX PLC | | | 6,594 | | | | 118 | | |
Unilever PLC | | | 9,215 | | | | 374 | | |
| | | | 1,899 | | |
United States (52.4%) | |
Accenture PLC, Class A | | | 3,185 | | | | 373 | | |
Alphabet, Inc., Class A (a) | | | 573 | | | | 454 | | |
Altria Group, Inc. | | | 5,147 | | | | 348 | | |
Automatic Data Processing, Inc. | | | 2,474 | | | | 254 | | |
Coca-Cola Co. | | | 2,975 | | | | 123 | | |
Danaher Corp. | | | 1,534 | | | | 119 | | |
International Flavors & Fragrances, Inc. | | | 785 | | | | 93 | | |
Intuit, Inc. | | | 510 | | | | 58 | | |
Johnson & Johnson | | | 2,289 | | | | 264 | | |
Microsoft Corp. | | | 8,997 | | | | 559 | | |
Moody's Corp. | | | 480 | | | | 45 | | |
Nielsen Holdings PLC | | | 4,411 | | | | 185 | | |
NIKE, Inc., Class B | | | 5,938 | | | | 302 | | |
Philip Morris International, Inc. | | | 2,011 | | | | 184 | | |
Reynolds American, Inc. | | | 6,011 | | | | 337 | | |
Time Warner, Inc. | | | 1,062 | | | | 103 | | |
Twenty-First Century Fox, Inc., Class A | | | 8,027 | | | | 225 | | |
Twenty-First Century Fox, Inc., Class B | | | 7,647 | | | | 208 | | |
| | | Shares | | Value
(000) | |
Visa, Inc., Class A | | | 3,878 | | | $ | 303 | | |
Walt Disney Co. (The) | | | 2,725 | | | | 284 | | |
| | | | 4,821 | | |
Total Common Stocks (Cost $8,265) | | | 9,115 | | |
Short-Term Investment (0.5%) | |
Investment Company (0.5%) | |
Morgan Stanley Institutional Liquidity
Funds — Treasury Securities Portfolio —
Institutional Class (See Note G)
(Cost $46) | | | 46,192 | | | | 46 | | |
Total Investments (99.6%) (Cost $8,311) (b) | | | 9,161 | | |
Other Assets in Excess of Liabilities (0.4%) | | | 38 | | |
Net Assets (100.0%) | | $ | 9,199 | | |
Country assignments and aggregations are based generally on third party vendor classifications and information, and may be different from the assignments and aggregations under the policies set forth in the Portfolio's prospectus and/or statement of additional information relating to geographic classifications.
(a) Non-income producing security.
(b) At December 31, 2016, the aggregate cost for federal income tax purposes is approximately $8,525,000. The aggregate gross unrealized appreciation is approximately $805,000 and the aggregate gross unrealized depreciation is approximately $169,000, resulting in net unrealized appreciation of approximately $636,000.
Portfolio Composition
Classification | | Percentage of
Total Investments | |
Other* | | | 21.7 | % | |
Pharmaceuticals | | | 16.1 | | |
Tobacco | | | 12.7 | | |
Information Technology Services | | | 10.1 | | |
Software | | | 9.9 | | |
Personal Products | | | 9.2 | | |
Media | | | 8.9 | | |
Household Products | | | 6.4 | | |
Internet Software & Services | | | 5.0 | | |
Total Investments | | | 100.0 | % | |
* Industries and/or investment types representing less than 5% of total investments.
The accompanying notes are an integral part of the financial statements.
8
Morgan Stanley Institutional Fund, Inc.
Annual Report — December 31, 2016
Statement of Assets and Liabilities | | December 31, 2016
(000) | |
Assets: | |
Investments in Securities of Unaffiliated Issuers, at Value (Cost $8,265) | | $ | 9,115 | | |
Investment in Security of Affiliated Issuer, at Value (Cost $46) | | | 46 | | |
Total Investments in Securities, at Value (Cost $8,311) | | | 9,161 | | |
Foreign Currency, at Value (Cost $14) | | | 14 | | |
Receivable for Investments Sold | | | 124 | | |
Receivable for Portfolio Shares Sold | | | 98 | | |
Tax Reclaim Receivable | | | 32 | | |
Dividends Receivable | | | 17 | | |
Due from Adviser | | | 13 | | |
Receivable from Affiliate | | | — | @ | |
Other Assets | | | 32 | | |
Total Assets | | | 9,491 | | |
Liabilities: | |
Payable for Portfolio Shares Redeemed | | | 133 | | |
Payable for Investments Purchased | | | 98 | | |
Payable for Professional Fees | | | 40 | | |
Payable for Custodian Fees | | | 9 | | |
Payable for Shareholder Services Fees — Class A | | | — | @ | |
Payable for Distribution and Shareholder Services Fees — Class L | | | 1 | | |
Payable for Distribution and Shareholder Services Fees — Class C | | | 1 | | |
Payable for Transfer Agency Fees — Class I | | | — | @ | |
Payable for Transfer Agency Fees — Class A | | | 1 | | |
Payable for Transfer Agency Fees — Class L | | | — | @ | |
Payable for Transfer Agency Fees — Class C | | | — | @ | |
Payable for Transfer Agency Fees — Class IS | | | — | @ | |
Payable for Administration Fees | | | 1 | | |
Payable for Sub Transfer Agency Fees — Class I | | | — | @ | |
Payable for Sub Transfer Agency Fees — Class A | | | — | @ | |
Payable for Sub Transfer Agency Fees — Class L | | | — | @ | |
Payable for Sub Transfer Agency Fees — Class C | | | — | @ | |
Other Liabilities | | | 8 | | |
Total Liabilities | | | 292 | | |
Net Assets | | $ | 9,199 | | |
Net Assets Consist of: | |
Paid-in-Capital | | $ | 8,526 | | |
Accumulated Undistributed Net Investment Income | | | 4 | | |
Distributions in Excess of Net Realized Gain | | | (178 | ) | |
Unrealized Appreciation (Depreciation) on: | |
Investments | | | 850 | | |
Foreign Currency Translations | | | (3 | ) | |
Net Assets | | $ | 9,199 | | |
The accompanying notes are an integral part of the financial statements.
9
Morgan Stanley Institutional Fund, Inc.
Annual Report — December 31, 2016
Statement of Assets and Liabilities (cont'd) | | December 31, 2016
(000) | |
CLASS I: | |
Net Assets | | $ | 3,993 | | |
| Shares Outstanding $0.001 par value shares of beneficial interest (unlimited shares authorized) (not in 000's) | | | 369,300 | | |
Net Asset Value, Offering and Redemption Price Per Share | | $ | 10.81 | | |
CLASS A: | |
Net Assets | | $ | 2,182 | | |
| Shares Outstanding $0.001 par value shares of beneficial interest (unlimited shares authorized) (not in 000's) | | | 202,206 | | |
Net Asset Value, Redemption Price Per Share | | $ | 10.79 | | |
Maximum Sales Load | | | 5.25 | % | |
Maximum Sales Charge | | $ | 0.60 | | |
Maximum Offering Price Per Share | | $ | 11.39 | | |
CLASS L: | |
Net Assets | | $ | 2,194 | | |
| Shares Outstanding $0.001 par value shares of beneficial interest (unlimited shares authorized) (not in 000's) | | | 203,983 | | |
Net Asset Value, Offering and Redemption Price Per Share | | $ | 10.76 | | |
CLASS C: | |
Net Assets | | $ | 819 | | |
| Shares Outstanding $0.001 par value shares of beneficial interest (unlimited shares authorized) (not in 000's) | | | 76,798 | | |
Net Asset Value, Offering and Redemption Price Per Share | | $ | 10.67 | | |
CLASS IS: | |
Net Assets | | $ | 11 | | |
| Shares Outstanding $0.001 par value shares of beneficial interest (unlimited shares authorized) (not in 000's) | | | 973 | | |
Net Asset Value, Offering and Redemption Price Per Share | | $ | 10.81 | | |
@ Amount is less than $500.
The accompanying notes are an integral part of the financial statements.
10
Morgan Stanley Institutional Fund, Inc.
Annual Report — December 31, 2016
Statement of Operations | | Year Ended
December 31, 2016
(000) | |
Investment Income: | |
Dividends from Securities of Unaffiliated Issuers (Net of $14 of Foreign Taxes Withheld) | | $ | 303 | | |
Dividends from Security of Affiliated Issuer (Note G) | | | — | @ | |
Total Investment Income | | | 303 | | |
Expenses: | |
Advisory Fees (Note B) | | | 102 | | |
Professional Fees | | | 84 | | |
Registration Fees | | | 65 | | |
Shareholder Services Fees — Class A (Note D) | | | 6 | | |
Distribution and Shareholder Services Fees — Class L (Note D) | | | 18 | | |
Distribution and Shareholder Services Fees — Class C (Note D) | | | 8 | | |
Custodian Fees (Note F) | | | 18 | | |
Transfer Agency Fees — Class I (Note E) | | | 2 | | |
Transfer Agency Fees — Class A (Note E) | | | 2 | | |
Transfer Agency Fees — Class L (Note E) | | | 2 | | |
Transfer Agency Fees — Class C (Note E) | | | 2 | | |
Transfer Agency Fees — Class IS (Note E) | | | 2 | | |
Administration Fees (Note C) | | | 10 | | |
Shareholder Reporting Fees | | | 9 | | |
Pricing Fees | | | 6 | | |
Directors' Fees and Expenses | | | 3 | | |
Sub Transfer Agency Fees — Class I | | | 1 | | |
Sub Transfer Agency Fees — Class A | | | 1 | | |
Sub Transfer Agency Fees — Class L | | | 1 | | |
Sub Transfer Agency Fees — Class C | | | — | @ | |
Other Expenses | | | 12 | | |
Total Expenses | | | 354 | | |
Waiver of Advisory Fees (Note B) | | | (102 | ) | |
Expenses Reimbursed by Adviser (Note B) | | | (65 | ) | |
Reimbursement of Class Specific Expenses — Class C (Note B) | | | (1 | ) | |
Reimbursement of Class Specific Expenses — Class IS (Note B) | | | (2 | ) | |
Rebate from Morgan Stanley Affiliate (Note G) | | | (— | @) | |
Reimbursement of Custodian Fees (Note F) | | | (23 | ) | |
Net Expenses | | | 161 | | |
Net Investment Income | | | 142 | | |
Realized Gain (Loss): | |
Investments Sold | | | 570 | | |
Foreign Currency Transactions | | | (9 | ) | |
Net Realized Gain | | | 561 | | |
Change in Unrealized Appreciation (Depreciation): | |
Investments | | | (79 | ) | |
Foreign Currency Translations | | | 1 | | |
Net Change in Unrealized Appreciation (Depreciation) | | | (78 | ) | |
Net Realized Gain and Change in Unrealized Appreciation (Depreciation) | | | 483 | | |
Net Increase in Net Assets Resulting from Operations | | $ | 625 | | |
@ Amount is less than $500.
The accompanying notes are an integral part of the financial statements.
11
Morgan Stanley Institutional Fund, Inc.
Annual Report — December 31, 2016
Statements of Changes in Net Assets | | Year Ended
December 31, 2016
(000) | | Year Ended
December 31, 2015
(000) | |
Increase (Decrease) in Net Assets: | |
Operations: | |
Net Investment Income | | $ | 142 | | | $ | 215 | | |
Net Realized Gain | | | 561 | | | | 614 | | |
Net Change in Unrealized Appreciation (Depreciation) | | | (78 | ) | | | 250 | | |
Net Increase in Net Assets Resulting from Operations | | | 625 | | | | 1,079 | | |
Distributions from and/or in Excess of: | |
Class I: | |
Net Investment Income | | | (80 | ) | | | (172 | ) | |
Net Realized Gain | | | (397 | ) | | | (324 | ) | |
Class A: | |
Net Investment Income | | | (29 | ) | | | (39 | ) | |
Net Realized Gain | | | (164 | ) | | | (95 | ) | |
Class L: | |
Net Investment Income | | | (20 | ) | | | (19 | ) | |
Net Realized Gain | | | (174 | ) | | | (84 | ) | |
Class C: | |
Net Investment Income | | | (7 | ) | | | (6 | ) | |
Net Realized Gain | | | (66 | ) | | | (19 | ) | |
Class IS: | |
Net Investment Income | | | (— | @) | | | (— | @) | |
Net Realized Gain | | | (1 | ) | | | (— | @) | |
Total Distributions | | | (938 | ) | | | (758 | ) | |
Capital Share Transactions:(1) | |
Class I: | |
Subscribed | | | 1,322 | | | | 6,500 | | |
Distributions Reinvested | | | 281 | | | | 392 | | |
Redeemed | | | (6,116 | ) | | | (13,182 | ) | |
Class A: | |
Subscribed | | | 222 | | | | 715 | | |
Distributions Reinvested | | | 182 | | | | 129 | | |
Redeemed | | | (1,345 | ) | | | (2,004 | ) | |
Class L: | |
Exchanged | | | 13 | | | | — | | |
Subscribed | | | — | | | | 281 | | |
Distributions Reinvested | | | 184 | | | | 99 | | |
Redeemed | | | (733 | ) | | | (281 | ) | |
Class C: | |
Subscribed | | | 251 | | | | 661 | * | |
Distributions Reinvested | | | 72 | | | | 25 | * | |
Redeemed | | | (105 | ) | | | (16 | )* | |
Net Decrease in Net Assets Resulting from Capital Share Transactions | | | (5,772 | ) | | | (6,681 | ) | |
Total Decrease in Net Assets | | | (6,085 | ) | | | (6,360 | ) | |
Net Assets: | |
Beginning of Period | | | 15,284 | | | | 21,644 | | |
End of Period (Including Accumulated Undistributed Net Investment Income of $4 and $7) | | $ | 9,199 | | | $ | 15,284 | | |
The accompanying notes are an integral part of the financial statements.
12
Morgan Stanley Institutional Fund, Inc.
Annual Report — December 31, 2016
Statements of Changes in Net Assets (cont'd) | | Year Ended
December 31, 2016
(000) | | Year Ended
December 31, 2015
(000) | |
(1) Capital Share Transactions: | |
Class I: | |
Shares Subscribed | | | 114 | | | | 551 | | |
Shares Issued on Distributions Reinvested | | | 25 | | | | 34 | | |
Shares Redeemed | | | (516 | ) | | | (1,124 | ) | |
Net Decrease in Class I Shares Outstanding | | | (377 | ) | | | (539 | ) | |
Class A: | |
Shares Subscribed | | | 20 | | | | 61 | | |
Shares Issued on Distributions Reinvested | | | 16 | | | | 11 | | |
Shares Redeemed | | | (118 | ) | | | (170 | ) | |
Net Decrease in Class A Shares Outstanding | | | (82 | ) | | | (98 | ) | |
Class L: | |
Shares Exchanged | | | 1 | | | | — | | |
Shares Subscribed | | | — | | | | 25 | | |
Shares Issued on Distributions Reinvested | | | 17 | | | | 8 | | |
Shares Redeemed | | | (65 | ) | | | (24 | ) | |
Net Increase (Decrease) in Class L Shares Outstanding | | | (47 | ) | | | 9 | | |
Class C: | |
Shares Subscribed | | | 22 | | | | 56 | * | |
Shares Issued on Distributions Reinvested | | | 7 | | | | 2 | * | |
Shares Redeemed | | | (10 | ) | | | (1 | )* | |
Net Increase in Class C Shares Outstanding | | | 19 | | | | 57 | | |
@ Amount is less than $500.
* For the period April 30, 2015 through December 31, 2015.
The accompanying notes are an integral part of the financial statements.
13
Morgan Stanley Institutional Fund, Inc.
Annual Report — December 31, 2016
Financial Highlights
Global Quality Portfolio
| | | Class I | |
| | | Year Ended December 31, | | Period from
August 30, 2013(2) to | |
Selected Per Share Data and Ratios: | | 2016(1) | | 2015 | | 2014 | | December 31, 2013 | |
Net Asset Value, Beginning of Period | | $ | 11.43 | | | $ | 11.34 | | | $ | 11.28 | | | $ | 10.00 | | |
Income (Loss) from Investment Operations: | |
Net Investment Income (Loss) (3) | | | 0.17 | | | | 0.15 | | | | 0.17 | | | | (0.00 | )(4) | |
Net Realized and Unrealized Gain | | | 0.29 | | | | 0.46 | | | | 0.13 | | | | 1.28 | | |
Total from Investment Operations | | | 0.46 | | | | 0.61 | | | | 0.30 | | | | 1.28 | | |
Distributions from and/or in Excess of: | |
Net Investment Income | | | (0.20 | ) | | | (0.18 | ) | | | (0.13 | ) | | | — | | |
Net Realized Gain | | | (0.88 | ) | | | (0.34 | ) | | | (0.11 | ) | | | — | | |
Total Distributions | | | (1.08 | ) | | | (0.52 | ) | | | (0.24 | ) | | | — | | |
Net Asset Value, End of Period | | $ | 10.81 | | | $ | 11.43 | | | $ | 11.34 | | | $ | 11.28 | | |
Total Return (5) | | | 4.20 | % | | | 5.27 | % | | | 2.66 | % | | | 12.80 | %(9) | |
Ratios and Supplemental Data: | |
Net Assets, End of Period (Thousands) | | $ | 3,993 | | | $ | 8,531 | | | $ | 14,579 | | | $ | 7,440 | | |
Ratio of Expenses to Average Net Assets (11) | | | 0.99 | %(6) | | | 0.97 | %(6) | | | 1.11 | %(6)(7) | | | 1.19 | %(6)(10) | |
Ratio of Net Investment Income (Loss) to Average Net Assets (11) | | | 1.46 | %(6) | | | 1.26 | %(6) | | | 1.49 | %(6) | | | (0.12 | )%(6)(10) | |
Ratio of Rebate from Morgan Stanley Affiliates to Average Net Assets | | | 0.00 | %(8) | | | 0.00 | %(8) | | | 0.00 | %(8) | | | 0.01 | %(10) | |
Portfolio Turnover Rate | | | 35 | % | | | 61 | % | | | 31 | % | | | 8 | %(9) | |
(11) Supplemental Information on the Ratios to Average Net Assets: | |
Ratios Before Expense Limitation: | |
Expenses to Average Net Assets | | | 2.45 | % | | | 2.21 | % | | | 2.34 | % | | | 4.86 | %(10) | |
Net Investment Income (Loss) to Average Net Assets | | | (0.00 | )%(8) | | | 0.02 | % | | | 0.26 | % | | | (3.79 | )%(10) | |
(1) Refer to Note F in the Notes to Financial Statements for discussion of prior period custodian out-of-pocket expenses that were reimbursed in the current period. The amount of the reimbursement was immaterial on a per share basis and did not impact the total return of Class I shares. The Ratio of Expenses to Average Net Assets and the Ratio of Net Investment Income to Average Net Assets would be unchanged as the reimbursement of custodian fees was offset against current period expense waivers/reimbursements with no impact to net expenses or net investment income.
(2) Commencement of Operations.
(3) Per share amount is based on average shares outstanding.
(4) Amount is less than $0.005 per share.
(5) Calculated based on the net asset value as of the last business day of the period.
(6) The Ratios of Expenses and Net Investment Income (Loss) reflect the rebate of certain Portfolio expenses in connection with the investments in Morgan Stanley affiliates during the period. The effect of the rebate on the ratios is disclosed in the above table as "Ratio of Rebate from Morgan Stanley Affiliates to Average Net Assets."
(7) Effective October 1, 2014, the Adviser has agreed to limit the ratio of expenses to average net assets to the maximum ratio of 1.00% for Class I shares. Prior to October 1, 2014, the maximum ratio was 1.20% for Class I shares.
(8) Amount is less than 0.005%.
(9) Not Annualized.
(10) Annualized.
The accompanying notes are an integral part of the financial statements.
14
Morgan Stanley Institutional Fund, Inc.
Annual Report — December 31, 2016
Financial Highlights
Global Quality Portfolio
| | | Class A | |
| | | Year Ended December 31, | | Period from
August 30, 2013(2) to | |
Selected Per Share Data and Ratios | | 2016(1) | | 2015 | | 2014 | | December 31, 2013 | |
Net Asset Value, Beginning of Period | | $ | 11.40 | | | $ | 11.32 | | | $ | 11.27 | | | $ | 10.00 | | |
Income (Loss) from Investment Operations: | |
Net Investment Income (Loss) (3) | | | 0.11 | | | | 0.11 | | | | 0.12 | | | | (0.02 | ) | |
Net Realized and Unrealized Gain | | | 0.32 | | | | 0.45 | | | | 0.14 | | | | 1.29 | | |
Total from Investment Operations | | | 0.43 | | | | 0.56 | | | | 0.26 | | | | 1.27 | | |
Distributions from and/or in Excess of: | |
Net Investment Income | | | (0.16 | ) | | | (0.14 | ) | | | (0.10 | ) | | | — | | |
Net Realized Gain | | | (0.88 | ) | | | (0.34 | ) | | | (0.11 | ) | | | — | | |
Total Distributions | | | (1.04 | ) | | | (0.48 | ) | | | (0.21 | ) | | | — | | |
Net Asset Value, End of Period | | $ | 10.79 | | | $ | 11.40 | | | $ | 11.32 | | | $ | 11.27 | | |
Total Return (4) | | | 3.83 | % | | | 4.91 | % | | | 2.34 | % | | | 12.70 | %(8) | |
Ratios and Supplemental Data: | |
Net Assets, End of Period (Thousands) | | $ | 2,182 | | | $ | 3,246 | | | $ | 4,331 | | | $ | 1,612 | | |
Ratio of Expenses to Average Net Assets (10) | | | 1.33 | %(5) | | | 1.30 | %(5) | | | 1.40 | %(5)(6) | | | 1.54 | %(5)(9) | |
Ratio of Net Investment Income (Loss) to Average Net Assets (10) | | | 0.98 | %(5) | | | 0.98 | %(5) | | | 1.03 | %(5) | | | (0.45 | )%(5)(9) | |
Ratio of Rebate from Morgan Stanley Affiliates to Average Net Assets | | | 0.00 | %(7) | | | 0.00 | %(7) | | | 0.00 | %(7) | | | 0.01 | %(9) | |
Portfolio Turnover Rate | | | 35 | % | | | 61 | % | | | 31 | % | | | 8 | %(8) | |
(10) Supplemental Information on the Ratios to Average Net Assets: | |
Ratios Before Expense Limitation: | |
Expenses to Average Net Assets | | | 2.85 | % | | | 2.52 | % | | | 2.62 | % | | | 5.00 | %(9) | |
Net Investment Loss to Average Net Assets | | | (0.54 | )% | | | (0.24 | )% | | | (0.19 | )% | | | (3.91 | )%(9) | |
(1) Refer to Note F in the Notes to Financial Statements for discussion of prior period custodian out-of-pocket expenses that were reimbursed in the current period. The amount of the reimbursement was immaterial on a per share basis and did not impact the total return of Class A shares. The Ratio of Expenses to Average Net Assets and the Ratio of Net Investment Income to Average Net Assets would be unchanged as the reimbursement of custodian fees was offset against current period expense waivers/reimbursements with no impact to net expenses or net investment income.
(2) Commencement of Operations.
(3) Per share amount is based on average shares outstanding.
(4) Calculated based on the net asset value which does not reflect sales charges, if applicable, as of the last business day of the period.
(5) The Ratios of Expenses and Net Investment Income (Loss) reflect the rebate of certain Portfolio expenses in connection with the investments in Morgan Stanley affiliates during the period. The effect of the rebate on the ratios is disclosed in the above table as "Ratio of Rebate from Morgan Stanley Affiliates to Average Net Assets."
(6) Effective October 1, 2014, the Adviser has agreed to limit the ratio of expenses to average net assets to the maximum ratios of 1.35% for Class A shares. Prior to October 1, 2014, the maximum ratio was 1.55% for Class A shares.
(7) Amount is less than 0.005%.
(8) Not Annualized.
(9) Annualized.
The accompanying notes are an integral part of the financial statements.
15
Morgan Stanley Institutional Fund, Inc.
Annual Report — December 31, 2016
Financial Highlights
Global Quality Portfolio
| | | Class L | |
| | | Year Ended December 31, | | Period from
August 30, 2013(2) to | |
Selected Per Share Data and Ratios | | 2016(1) | | 2015 | | 2014 | | December 31, 2013 | |
Net Asset Value, Beginning of Period | | $ | 11.37 | | | $ | 11.29 | | | $ | 11.25 | | | $ | 10.00 | | |
Income (Loss) from Investment Operations: | |
Net Investment Income (Loss) (3) | | | 0.06 | | | | 0.05 | | | | 0.06 | | | | (0.03 | ) | |
Net Realized and Unrealized Gain | | | 0.31 | | | | 0.45 | | | | 0.14 | | | | 1.28 | | |
Total from Investment Operations | | | 0.37 | | | | 0.50 | | | | 0.20 | | | | 1.25 | | |
Distributions from and/or in Excess of: | |
Net Investment Income | | | (0.10 | ) | | | (0.08 | ) | | | (0.05 | ) | | | — | | |
Net Realized Gain | | | (0.88 | ) | | | (0.34 | ) | | | (0.11 | ) | | | — | | |
Total Distributions | | | (0.98 | ) | | | (0.42 | ) | | | (0.16 | ) | | | — | | |
Net Asset Value, End of Period | | $ | 10.76 | | | $ | 11.37 | | | $ | 11.29 | | | $ | 11.25 | | |
Total Return (4) | | | 3.31 | % | | | 4.49 | % | | | 1.74 | % | | | 12.50 | %(8) | |
Ratios and Supplemental Data: | |
Net Assets, End of Period (Thousands) | | $ | 2,194 | | | $ | 2,848 | | | $ | 2,723 | | | $ | 962 | | |
Ratio of Expenses to Average Net Assets (10) | | | 1.81 | %(5) | | | 1.81 | %5) | | | 1.93 | %(5)(6) | | | 2.04 | %(5)(9) | |
Ratio of Net Investment Income (Loss) to Average Net Assets (10) | | | 0.52 | %(5) | | | 0.46 | %(5) | | | 0.55 | %(5) | | | (0.80 | )%(5)(9) | |
Ratio of Rebate from Morgan Stanley Affiliates to Average Net Assets | | | 0.00 | %(7) | | | 0.00 | %(7) | | | 0.00 | %(7) | | | 0.01 | %(9) | |
Portfolio Turnover Rate | | | 35 | % | | | 61 | % | | | 31 | % | | | 8 | %(8) | |
(10) Supplemental Information on the Ratios to Average Net Assets: | |
Ratios Before Expense Limitation: | |
Expenses to Average Net Assets | | | 3.35 | % | | | 3.06 | % | | | 3.15 | % | | | 6.27 | %(9) | |
Net Investment Loss to Average Net Assets | | | (1.02 | )% | | | (0.79 | )% | | | (0.67 | )% | | | (5.03 | )%(9) | |
(1) Refer to Note F in the Notes to Financial Statements for discussion of prior period custodian out-of-pocket expenses that were reimbursed in the current period. The amount of the reimbursement was immaterial on a per share basis and did not impact the total return of Class L shares. The Ratio of Expenses to Average Net Assets and the Ratio of Net Investment Income to Average Net Assets would be unchanged as the reimbursement of custodian fees was offset against current period expense waivers/reimbursements with no impact to net expenses or net investment income.
(2) Commencement of Operations.
(3) Per share amount is based on average shares outstanding.
(4) Calculated based on the net asset value as of the last business day of the period.
(5) The Ratios of Expenses and Net Investment Income (Loss) reflect the rebate of certain Portfolio expenses in connection with the investments in Morgan Stanley affiliates during the period. The effect of the rebate on the ratios is disclosed in the above table as "Ratio of Rebate from Morgan Stanley Affiliates to Average Net Assets."
(6) Effective October 1, 2014, the Adviser has agreed to limit the ratio of expenses to average net assets to the maximum ratios of 1.85% for Class L shares. Prior to October 1, 2014, the maximum ratio was 2.05% for Class L shares.
(7) Amount is less than 0.005%.
(8) Not Annualized.
(9) Annualized.
The accompanying notes are an integral part of the financial statements.
16
Morgan Stanley Institutional Fund, Inc.
Annual Report — December 31, 2016
Financial Highlights
Global Quality Portfolio
| | | Class C | |
Selected Per Share Data and Ratios | | Year Ended
December 31, 2016(1) | | Period from
April 30, 2015(2) to
December 31, 2015 | |
Net Asset Value, Beginning of Period | | $ | 11.30 | | | $ | 11.77 | | |
Income (Loss) from Investment Operations: | |
Net Investment Income (Loss) (3) | | | 0.02 | | | | (0.03 | ) | |
Net Realized and Unrealized Gain | | | 0.32 | | | | 0.02 | | |
Total from Investment Operations | | | 0.34 | | | | (0.01 | ) | |
Distributions from and/or in Excess of: | |
Net Investment Income | | | (0.09 | ) | | | (0.12 | ) | |
Net Realized Gain | | | (0.88 | ) | | | (0.34 | ) | |
Total Distributions | | | (0.97 | ) | | | (0.46 | ) | |
Net Asset Value, End of Period | | $ | 10.67 | | | $ | 11.30 | | |
Total Return (4) | | | 3.06 | % | | | (0.13 | )%(8) | |
Ratios and Supplemental Data: | |
Net Assets, End of Period (Thousands) | | $ | 819 | | | $ | 648 | | |
Ratio of Expenses to Average Net Assets (9) | | | 2.10 | %(5) | | | 2.10 | %(5)(7) | |
Ratio of Net Investment Income (Loss) to Average Net Assets (9) | | | 0.17 | %(5) | | | (0.39 | )%(5)(7) | |
Ratio of Rebate from Morgan Stanley Affiliates to Average Net Assets | | | 0.00 | %(7) | | | 0.00 | %(6)(7) | |
Portfolio Turnover Rate | | | 35 | % | | | 61 | % | |
(9) Supplemental Information on the Ratios to Average Net Assets: | |
Ratios Before Expense Limitation: | |
Expense to Average Net Assets | | | 3.83 | % | | | 3.80 | %(7) | |
Net Investment Loss to Average Net Assets | | | (1.56 | )% | | | (2.09 | )%(7) | |
(1) Refer to Note F in the Notes to Financial Statements for discussion of prior period custodian out-of-pocket expenses that were reimbursed in the current period. The amount of the reimbursement was immaterial on a per share basis and did not impact the total return of Class C shares. The Ratio of Expenses to Average Net Assets and the Ratio of Net Investment Income to Average Net Assets would be unchanged as the reimbursement of custodian fees was offset against current period expense waivers/reimbursements with no impact to net expenses or net investment income.
(2) Commencement of Offering.
(3) Per share amount is based on average shares outstanding.
(4) Calculated based on the net asset value which does not reflect sales charges, if applicable, as of the last business day of the period.
(5) The Ratios of Expenses and Net Investment Income (Loss) reflect the rebate of certain Portfolio expenses in connection with the investments in Morgan Stanley affiliates during the period. The effect of the rebate on the ratios is disclosed in the above table as "Ratio of Rebate from Morgan Stanley Affiliates to Average Net Assets."
(6) Amount is less than 0.005%.
(7) Annualized.
(8) Not Annualized.
The accompanying notes are an integral part of the financial statements.
17
Morgan Stanley Institutional Fund, Inc.
Annual Report — December 31, 2016
Financial Highlights
Global Quality Portfolio
| | | Class IS | |
| | | Year Ended December 31, | | Period from
September 13, 2013(2) to | |
Selected Per Share Data and Ratios | | 2016(1) | | 2015 | | 2014 | | December 31, 2013 | |
Net Asset Value, Beginning of Period | | $ | 11.43 | | | $ | 11.34 | | | $ | 11.28 | | | $ | 10.28 | | |
Income (Loss) from Investment Operations: | |
Net Investment Income (Loss) (3) | | | 0.16 | | | | 0.16 | | | | 0.17 | | | | (0.00 | )(4) | |
Net Realized and Unrealized Gain | | | 0.31 | | | | 0.45 | | | | 0.13 | | | | 1.00 | | |
Total from Investment Operations | | | 0.47 | | | | 0.61 | | | | 0.30 | | | | 1.00 | | |
Distributions from and/or in Excess of: | |
Net Investment Income | | | (0.21 | ) | | | (0.18 | ) | | | (0.13 | ) | | | — | | |
Net Realized Gain | | | (0.88 | ) | | | (0.34 | ) | | | (0.11 | ) | | | — | | |
Total Distributions | | | (1.09 | ) | | | (0.52 | ) | | | (0.24 | ) | | | — | | |
Net Asset Value, End of Period | | $ | 10.81 | | | $ | 11.43 | | | $ | 11.34 | | | $ | 11.28 | | |
Total Return (5) | | | 4.17 | % | | | 5.38 | % | | | 2.67 | % | | | 9.73 | %(9) | |
Ratios and Supplemental Data: | |
Net Assets, End of Period (Thousands) | | $ | 11 | | | $ | 11 | | | $ | 11 | | | $ | 11 | | |
Ratio of Expenses to Average Net Assets (11) | | | 0.95 | %(6) | | | 0.95 | %(6) | | | 1.10 | %(6)(7) | | | 1.15 | %(6)(10) | |
Ratio of Net Investment Income (Loss) to Average Net Assets (11) | | | 1.35 | %(6) | | | 1.31 | %(6) | | | 1.51 | %(6) | | | (0.10 | )%(6)(10) | |
Ratio of Rebate from Morgan Stanley Affiliates to Average Net Assets | | | 0.00 | %(8) | | | 0.00 | %(8) | | | 0.00 | %(8) | | | 0.00 | %(8)(10) | |
Portfolio Turnover Rate | | | 35 | % | | | 61 | % | | | 31 | % | | | 8 | %(8) | |
(11) Supplemental Information on the Ratios to Average Net Assets: | |
Ratios Before Expense Limitation: | |
Expenses to Average Net Assets | | | 19.36 | % | | | 16.35 | % | | | 19.72 | % | | | 9.57 | %(10) | |
Net Investment Loss to Average Net Assets | | | (17.06 | )% | | | (14.09 | )% | | | (17.11 | )% | | | (8.52 | )%(10) | |
(1) Refer to Note F in the Notes to Financial Statements for discussion of prior period custodian out-of-pocket expenses that were reimbursed in the current period. The amount of the reimbursement was immaterial on a per share basis and did not impact the total return of Class IS shares. The Ratio of Expenses to Average Net Assets and the Ratio of Net Investment Income to Average Net Assets would be unchanged as the reimbursement of custodian fees was offset against current period expense waivers/reimbursements with no impact to net expenses or net investment income.
(2) Commencement of Offering.
(3) Per share amount is based on average shares outstanding.
(4) Amount is less than $0.005 per share.
(5) Calculated based on the net asset value as of the last business day of the period.
(6) The Ratios of Expenses and Net Investment Income (Loss) reflect the rebate of certain Portfolio expenses in connection with the investments in Morgan Stanley affiliates during the period. The effect of the rebate on the ratios is disclosed in the above table as "Ratio of Rebate from Morgan Stanley Affiliates to Average Net Assets."
(7) Effective October 1, 2014, the Adviser has agreed to limit the ratio of expenses to average net assets to the maximum ratio of 0.95% for Class IS shares. Prior to October 1, 2014, the maximum ratio was 1.15% for Class IS shares.
(8) Amount is less than 0.005%.
(9) Not Annualized.
(10) Annualized.
The accompanying notes are an integral part of the financial statements.
18
Morgan Stanley Institutional Fund, Inc.
Annual Report — December 31, 2016
Notes to Financial Statements
Morgan Stanley Institutional Fund, Inc. (the "Fund") is registered under the Investment Company Act of 1940, as amended (the "Act"), as an open-end management investment company. The Fund is comprised of twenty-nine separate, active, diversified and non-diversified portfolios (individually referred to as a "Portfolio", collectively as the "Portfolios"). The Fund applies investment company accounting and reporting guidance.
The accompanying financial statements relate to the Global Quality Portfolio. The Portfolio seeks long-term capital appreciation.
The Portfolio offers five classes of shares — Class I, Class A, Class L, Class C and Class IS. On April 30, 2015, the Portfolio suspended offering of Class L shares. Existing Class L shareholders may invest through reinvestment of dividends and distributions.
A. Significant Accounting Policies: The following significant accounting policies are in conformity with U.S. generally accepted accounting principles ("GAAP"). Such policies are consistently followed by the Fund in the preparation of its financial statements. GAAP may require management to make estimates and assumptions that affect the reported amounts and disclosures in the financial statements. Actual results may differ from those estimates.
1. Security Valuation: (1) An equity portfolio security listed or traded on an exchange is valued at its latest reported sales price (or at the exchange official closing price if such exchange reports an official closing price), and if there were no sales on a given day and if there is no official exchange closing price for that day, the security is valued at the mean between the last reported bid and asked prices if such bid and asked prices are available on the relevant exchanges; (2) all other equity portfolio securities for which over-the-counter ("OTC") market quotations are readily available are valued at the latest reported sales price (or at the market official closing price if such market reports an official closing price), and if there was no trading in the security on a given day and if there is no official closing price from relevant markets for that day, the security is valued at the mean between the last reported bid and asked prices if such bid and asked prices are available on the relevant markets. Listed equity securities not traded on the valuation date with no reported bid and asked prices available on the exchange are valued at the mean between the current bid and asked prices obtained from one
or more reputable brokers or dealers. An unlisted equity security that does not trade on the valuation date and for which bid and asked prices from the relevant markets are unavailable is valued at the mean between the current bid and asked prices obtained from one or more reputable brokers or dealers. In cases where a security is traded on more than one exchange, the security is valued on the exchange designated as the primary market; (3) certain portfolio securities may be valued by an outside pricing service/vendor approved by the Fund's Board of Directors (the "Directors"). The pricing service/vendor may employ a pricing model that takes into account, among other things, bids, yield spreads, and/or other market data and specific security characteristics. Alternatively, if a valuation is not available from an outside pricing service/vendor, and the security trades on an exchange, the security may be valued at its latest reported sale price (or at the exchange official closing price if such exchange reports an official closing price), prior to the time when assets are valued. If there are no sales on a given day and if there is no official exchange closing price for that day, the security is valued at the mean between the last reported bid and asked prices if such bid and asked prices are available in the relevant exchanges; (4) when market quotations are not readily available, including circumstances under which Morgan Stanley Investment Management Inc. (the "Adviser") or Morgan Stanley Investment Management Limited ("MSIM Limited") and Morgan Stanley Investment Management Company ("MSIM Company") (together, the "Sub-Advisers"), each a whole owned subsidiary of Morgan Stanley, determine that the closing price, last sale price or the mean between the last reported bid and asked prices are not reflective of a security's market value, portfolio securities are valued at their fair value as determined in good faith under procedures established by and under the general supervision of the Directors. Occasionally, developments affecting the closing prices of securities and other assets may occur between the times at which valuations of such securities are determined (that is, close of the foreign market on which the securities trade) and the close of business of the New York Stock Exchange ("NYSE"). If developments occur during such periods that are expected to materially affect the value of such securities, such valuations may be adjusted to reflect the estimated fair value of such securities as of the close of the NYSE, as determined in good faith by the Directors or by the Adviser using a pricing service and/or procedures approved by the
19
Morgan Stanley Institutional Fund, Inc.
Annual Report — December 31, 2016
Notes to Financial Statements (cont'd)
Directors; (5) quotations of foreign portfolio securities, other assets and liabilities and forward contracts stated in foreign currency are translated into U.S. dollar equivalents at the prevailing market rates prior to the close of the NYSE; and (6) investments in mutual funds, including the Morgan Stanley Institutional Liquidity Funds, are valued at the net asset value ("NAV") as of the close of each business day.
The Directors have responsibility for determining in good faith the fair value of the investments, and the Directors may appoint others, such as the Fund's Adviser or a valuation committee, to assist the Directors in determining fair value and to make the actual calculations pursuant to the fair valuation methodologies previously approved by the Directors. Under procedures approved by the Directors, the Fund's Adviser has formed a Valuation Committee whose members are approved by the Directors. The Valuation Committee provides administration and oversight of the Fund's valuation policies and procedures, which are reviewed at least annually by the Directors. These procedures allow the Fund to utilize independent pricing services, quotations from securities and financial instrument dealers, and other market sources to determine fair value.
The Fund has procedures to determine the fair value of securities and other financial instruments for which market prices are not readily available. Under these procedures, the Valuation Committee convenes on a regular and ad hoc basis to review such securities and considers a number of factors, including valuation methodologies and significant unobservable valuation inputs, when arriving at fair value. The Valuation Committee may employ a market-based approach which may use related or comparable assets or liabilities, recent transactions, market multiples, book values, and other relevant information for the investment to determine the fair value of the investment. An income-based valuation approach may also be used in which the anticipated future cash flows of the investment are discounted to calculate fair value. Discounts may also be applied due to the nature or duration of any restrictions on the disposition of the investments. Due to the inherent uncertainty of valuations of such investments, the fair values may differ significantly from the values that would have been used had an active market existed. The Valuation Committee employs various methods for calibrating these valuation
approaches including a regular review of valuation methodologies, key inputs and assumptions, transactional back-testing or disposition analysis, and reviews of any related market activity.
2. Fair Value Measurement: Financial Accounting Standards Board ("FASB") Accounting Standards CodificationTM ("ASC") 820, "Fair Value Measurement" ("ASC 820"), defines fair value as the value that the Fund would receive to sell an investment or pay to transfer a liability in a timely transaction with an independent buyer in the principal market, or in the absence of a principal market, the most advantageous market for the investment or liability. ASC 820 establishes a three-tier hierarchy to distinguish between (1) inputs that reflect the assumptions market participants would use in valuing an asset or liability developed based on market data obtained from sources independent of the reporting entity (observable inputs) and (2) inputs that reflect the reporting entity's own assumptions about the assumptions market participants would use in valuing an asset or liability developed based on the best information available in the circumstances (unobservable inputs) and to establish classification of fair value measurements for disclosure purposes. Various inputs are used in determining the value of the Fund's investments. The inputs are summarized in the three broad levels listed below.
• Level 1 – unadjusted quoted prices in active markets for identical investments
• Level 2 – other significant observable inputs (including quoted prices for similar investments, interest rates, prepayment speeds, credit risk, etc.)
• Level 3 – significant unobservable inputs including the Fund's own assumptions in determining the fair value of investments. Factors considered in making this determination may include, but are not limited to, information obtained by contacting the issuer, analysts, or the appropriate stock exchange (for exchange-traded securities), analysis of the issuer's financial statements or other available documents and, if necessary, available information concerning other securities in similar circumstances
20
Morgan Stanley Institutional Fund, Inc.
Annual Report — December 31, 2016
Notes to Financial Statements (cont'd)
The inputs or methodology used for valuing securities are not necessarily an indication of the risk associated with investing in those securities and the determination of the significance of a particular input to the fair value measurement in its entirety requires judgment and considers factors specific to each security.
The following is a summary of the inputs used to value the Portfolio's investments as of December 31, 2016.
Investment Type | | Level 1
Unadjusted
quoted
prices
(000) | | Level 2
Other
significant
observable
inputs
(000) | | Level 3
Significant
unobservable
inputs
(000) | | Total
(000) | |
Assets: | |
Common Stocks | |
Beverages | | $ | 323 | | | $ | — | | | $ | — | | | $ | 323 | | |
Capital Markets | | | 45 | | | | — | | | | — | | | | 45 | | |
Chemicals | | | 93 | | | | — | | | | — | | | | 93 | | |
Food Products | | | 201 | | | | — | | | | — | | | | 201 | | |
Health Care Equipment &
Supplies | | | 119 | | | | — | | | | — | | | | 119 | | |
Household Products | | | 586 | | | | — | | | | — | | | | 586 | | |
Information Technology
Services | | | 930 | | | | — | | | | — | | | | 930 | | |
Insurance | | | 232 | | | | — | | | | — | | | | 232 | | |
Internet & Direct
Marketing Retail | | | 194 | | | | — | | | | — | | | | 194 | | |
Internet Software &
Services | | | 454 | | | | — | | | | — | | | | 454 | | |
Media | | | 820 | | | | — | | | | — | | | | 820 | | |
Personal Products | | | 844 | | | | — | | | | — | | | | 844 | | |
Pharmaceuticals | | | 1,474 | | | | — | | | | — | | | | 1,474 | | |
Professional Services | | | 435 | | | | — | | | | — | | | | 435 | | |
Software | | | 903 | | | | — | | | | — | | | | 903 | | |
Textiles, Apparel &
Luxury Goods | | | 302 | | | | — | | | | — | | | | 302 | | |
Tobacco | | | 1,160 | | | | — | | | | — | | | | 1,160 | | |
Total Common Stocks | | | 9,115 | | | | — | | | | — | | | | 9,115 | | |
Short-Term Investment | |
Investment Company | | | 46 | | | | — | | | | — | | | | 46 | | |
Total Assets | | $ | 9,161 | | | $ | — | | | $ | — | | | $ | 9,161 | | |
Transfers between investment levels may occur as the markets fluctuate and/or the availability of data used in an investment's valuation changes. The Portfolio recognizes transfers between the levels as of the end of the period. As of December 31, 2016, securities with a total value of approximately $4,009,000 transferred from Level 2 to Level 1. Securities that were valued using other significant observable inputs at December 31, 2015 were valued using unadjusted quoted prices at December 31, 2016. At December 31, 2015, the fair value of certain securities were adjusted due to developments which occurred between the time of the close of the foreign markets on
which they trade and the close of business on the NYSE which resulted in their Level 2 classification.
3. Foreign Currency Translation and Foreign Investments: The books and records of the Portfolio are maintained in U.S. dollars. Foreign currency amounts are translated into U.S. dollars as follows:
— investments, other assets and liabilities at the prevailing rate of exchange on the valuation date;
— investment transactions and investment income at the prevailing rates of exchange on the dates of such transactions.
Although the net assets of the Portfolio are presented at the foreign exchange rates and market values at the close of the period, the Portfolio does not isolate that portion of the results of operations arising as a result of changes in the foreign exchange rates from the fluctuations arising from changes in the market prices of securities held at period end. Similarly, the Portfolio does not isolate the effect of changes in foreign exchange rates from the fluctuations arising from changes in the market prices of securities sold during the period. Accordingly, realized and unrealized foreign currency gains (losses) on investments in securities are included in the reported net realized and unrealized gains (losses) on investment transactions and balances. However, pursuant to U.S. federal income tax regulations, gains and losses from certain foreign currency transactions and the foreign currency portion of gains and losses realized on sales and maturities of foreign denominated debt securities are treated as ordinary income for U.S. federal income tax purposes.
Net realized gains (losses) on foreign currency transactions represent net foreign exchange gains (losses) from foreign currency forward exchange contracts, disposition of foreign currencies, currency gains (losses) realized between the trade and settlement dates on securities transactions, and the difference between the amount of investment income and foreign withholding taxes recorded on the Portfolio's books and the U.S. dollar equivalent amounts actually received or paid. Net unrealized currency gains (losses) from valuing foreign currency denominated assets and liabilities at period end exchange rates are reflected as a component of unrealized appreciation (depreciation) in the Statement of Assets and Liabilities. The change in unrealized currency
21
Morgan Stanley Institutional Fund, Inc.
Annual Report — December 31, 2016
Notes to Financial Statements (cont'd)
gains (losses) on foreign currency translations for the period is reflected in the Statement of Operations.
Foreign security and currency transactions may involve certain considerations and risks not typically associated with those of U.S. dollar denominated transactions as a result of, among other factors, fluctuations of exchange rates in relation to the U.S. dollar, the possibility of lower levels of governmental supervision and regulation of foreign securities markets and the possibility of political or economic instability.
Governmental approval for foreign investments may be required in advance of making an investment under certain circumstances in some countries, and the extent of foreign investments in domestic companies may be subject to limitation in other countries. Foreign ownership limitations also may be imposed by the charters of individual companies to prevent, among other concerns, violations of foreign investment limitations. As a result, an additional class of shares (identified as "Foreign" in the Portfolio of Investments) may be created and offered for investment. The "local" and "foreign shares" market values may differ. In the absence of trading of the foreign shares in such markets, the Portfolio values the foreign shares at the closing exchange price of the local shares.
4. Indemnifications: The Fund enters into contracts that contain a variety of indemnifications. The Fund's maximum exposure under these arrangements is unknown. However, the Fund has not had prior claims or losses pursuant to these contracts and expects the risk of loss to be remote.
5. Dividends and Distributions to Shareholders: Dividend income and distributions to shareholders are recorded on the ex-dividend date. Dividends from net investment income, if any, are declared and paid annually. Net realized capital gains, if any, are distributed at least annually.
6. Security Transactions, Income and Expenses: Security transactions are accounted for on the trade date (date the order to buy or sell is executed). Realized gains and losses on the sale of investment securities are determined on the specific identified cost method. Dividend income and other distributions are recorded on the ex-dividend date (except for certain foreign dividends which may be recorded as soon as the Portfolio is informed of
such dividends) net of applicable withholding taxes. Interest income is recognized on the accrual basis except where collection is in doubt. Discounts are accreted and premiums are amortized over the life of the respective securities. Most expenses of the Fund can be directly attributed to a particular Portfolio. Expenses which cannot be directly attributed are apportioned among the Portfolios based upon relative net assets or other appropriate methods. Income, expenses (other than class specific expenses — distribution and shareholder services, transfer agency and sub transfer agency fees) and realized and unrealized gains or losses are allocated to each class of shares based upon their relative net assets.
B. Advisory/Sub-Advisory Fees: The Adviser, a wholly-owned subsidiary of Morgan Stanley, provides the Portfolio with advisory services under the terms of an Investment Advisory Agreement, paid quarterly, at the annual rate based on the daily net assets as follows:
First $500
million | | Next $500
million | | Over $1
billion | |
| | 0.80 | % | | | 0.75 | % | | | 0.70 | % | |
For the year ended December 31, 2016, the advisory fee rate (net of waivers/rebate) was equivalent to an annual effective rate of 0.00% of the Portfolio's average daily net assets.
The Adviser has agreed to reduce its advisory fee and/or reimburse the Portfolio so that total annual portfolio operating expenses, excluding certain investment related expenses, taxes, interest and other extraordinary expenses (including litigation), will not exceed 1.00% for Class I shares, 1.35% for Class A shares, 1.85% for Class L shares, 2.10% for Class C shares and 0.95% for Class IS shares. The fee waivers and/or expense reimbursements will continue for at least one year from the date of the Portfolio's prospectus or until such time as the Directors act to discontinue all or a portion of such waivers and/or reimbursements when they deem such action is appropriate. For the year ended December 31, 2016, approximately $102,000 of advisory fees were waived and approximately $68,000 of other expenses were reimbursed by the Adviser pursuant to this arrangement.
The Adviser has entered into a Sub-Advisory Agreement with the Sub-Advisers, each a wholly-owned subsidiary of Morgan Stanley. The Sub-Advisers provide the Portfolio with advisory services subject to the overall supervision of the Adviser and the Fund's Officers and Directors. The Adviser pays the Sub-Advisers on a monthly basis a portion of the net advisory fees the Adviser receives from the Portfolio.
22
Morgan Stanley Institutional Fund, Inc.
Annual Report — December 31, 2016
Notes to Financial Statements (cont'd)
C. Administration Fees: The Adviser also serves as Administrator to the Fund and provides administrative services pursuant to an Administration Agreement for an annual fee, accrued daily and paid monthly, of 0.08% of the Portfolio's average daily net assets.
Under a Sub-Administration Agreement between the Administrator and State Street, State Street provides certain administrative services to the Fund. For such services, the Administrator pays State Street a portion of the fee the Administrator receives from the Portfolio.
D. Distribution and Shareholder Services Fees: Morgan Stanley Distribution, Inc. ("MSDI" or the "Distributor"), a wholly-owned subsidiary of the Adviser and Sub-Advisers and an indirect subsidiary of Morgan Stanley, serves as the Fund's Distributor of Portfolio shares pursuant to a Distribution Agreement. The Fund has adopted a Shareholder Services Plan with respect to Class A shares pursuant to Rule 12b-1 under the Act. Under the Shareholder Services Plan, the Portfolio pays the Distributor a shareholder services fee, accrued daily and paid monthly, at an annual rate of 0.25% of the Portfolio's average daily net assets attributable to Class A shares.
The Fund has adopted a Distribution and Shareholder Services Plan with respect to Class L shares pursuant to Rule 12b-1 under the Act. Under the Distribution and Shareholder Services Plan, the Portfolio pays the Distributor a distribution fee, accrued daily and paid monthly, at an annual rate of 0.50% and a shareholder services fee, accrued daily and paid monthly, at an annual rate of 0.25% of the Portfolio's average daily net assets attributable to Class L shares.
The Fund has adopted a Distribution and Shareholder Services Plan with respect to Class C shares pursuant to Rule 12b-1 under the Act. Under the Distribution and Shareholder Services Plan, the Portfolio pays the Distributor a distribution fee, accrued daily and paid monthly, at an annual rate of 0.75% and a shareholder services fee, accrued daily and paid monthly, at an annual rate of 0.25% of the Portfolio's average daily net assets attributable to Class C shares.
The distribution and shareholder services fees are used to support the expenses associated with servicing and maintaining accounts. The Distributor may compensate other parties for providing shareholder support services to investors who purchase Class A, Class L and Class C shares.
E. Dividend Disbursing and Transfer Agent: The Fund's dividend disbursing and transfer agent is Boston Financial Data Services, Inc. ("BFDS"). Pursuant to a Transfer Agency Agreement, the Fund pays BFDS a fee based on the number of classes, accounts and transactions relating to the Portfolios of the Fund.
F. Custodian Fees: State Street (the "Custodian") serves as Custodian for the Fund in accordance with a Custodian Agreement. The Custodian holds cash, securities, and other assets of the Fund as required by the Act. Custody fees are payable monthly based on assets held in custody, investment purchases and sales activity and account maintenance fees, plus reimbursement for certain out-of-pocket expenses.
In December 2015, the Fund's Custodian announced that it had identified inconsistencies in the way in which clients were invoiced for out-of-pocket expenses from 1998 until November 2015. The dollar amount difference between what was charged and what should have been charged, plus interest, was paid back to the Portfolio in September 2016 as a reimbursement. The Custodian reimbursed the Portfolio directly, which was recognized as a change in accounting estimate and was reflected as "Reimbursement of Custodian Fees" in the Statement of Operations. Pursuant to the expense limitations described in Note B, the Portfolio has experienced waiver of advisory fees during the current period. Accordingly, the reimbursement of out-of-pocket custodian expenses in the current period resulted in the reduction in the current period expenses reimbursed by Adviser.
G. Security Transactions and Transactions with Affiliates: For the year ended December 31, 2016, purchases and sales of investment securities for the Portfolio, other than long-term U.S. Government securities and short-term investments, were approximately $4,320,000 and $10,356,000, respectively. There were no purchases and sales of long-term U.S. Government securities for the year ended December 31, 2016.
The Portfolio invests in the Institutional Class of the Morgan Stanley Institutional Liquidity Funds — Treasury Securities Portfolio (the "Liquidity Funds"), an open-end management investment company managed by the Adviser. Advisory fees paid by the Portfolio are reduced by an amount equal to its pro-rata share of the advisory and administration fees paid by the Portfolio due to its investment in the Liquidity Funds. For the year ended December 31, 2016, advisory fees paid were
23
Morgan Stanley Institutional Fund, Inc.
Annual Report — December 31, 2016
Notes to Financial Statements (cont'd)
reduced by less than $500 relating to the Portfolio's investment in the Liquidity Funds.
A summary of the Portfolio's transactions in shares of the Liquidity Funds during the year ended December 31, 2016 is as follows:
Value
December 31,
2015
(000) | | Purchases
at Cost
(000) | | Sales
(000) | | Dividend
Income
(000) | | Value
December 31,
2016
(000) | |
| $ | 309 | | | $ | 4,921 | | | $ | 5,184 | | | $ | — | @ | | $ | 46 | | |
@ Amount is less than $500.
The Portfolio is permitted to purchase and sell securities ("cross-trade") from and to other Morgan Stanley Funds as well as other funds and client accounts for which the Adviser or an affiliate of the Adviser serves as investment adviser, pursuant to procedures approved by the Directors in compliance with Rule 17a-7 under the Act (the "Rule"). Each cross-trade is executed at the current market price in compliance with provisions of the Rule. For the year ended December 31, 2016, the Portfolio did not engage in any cross-trade transactions.
The Portfolio has an unfunded Deferred Compensation Plan (the "Compensation Plan"), which allows each independent Director to defer payment of all, or a portion, of the fees he or she receives for serving on the Board of Directors. Each eligible Director generally may elect to have the deferred amounts credited with a return equal to the total return on one or more of the Morgan Stanley funds that are offered as investment options under the Compensation Plan. Appreciation/depreciation and distributions received from these investments are recorded with an offsetting increase/decrease in the deferred compensation obligation and do not affect the NAV of the Portfolio.
H. Federal Income Taxes: It is the Portfolio's intention to continue to qualify as a regulated investment company and distribute all of its taxable and tax-exempt income. Accordingly, no provision for federal income taxes is required in the financial statements.
The Portfolio may be subject to taxes imposed by countries in which it invests. Such taxes are generally based on income and/or capital gains earned or repatriated. Taxes are accrued based on net investment income, net realized gains and net unrealized appreciation as such income and/or gains are earned. Taxes may also be based on transactions in foreign currency and are accrued based on the value of investments denominated in such currency.
FASB ASC 740-10, "Income Taxes — Overall", sets forth a minimum threshold for financial statement recognition of the benefit of a tax position taken or expected to be taken in a tax return. Management has concluded that there are no significant uncertain tax positions that would require recognition in the financial statements. If applicable, the Portfolio recognizes interest accrued related to unrecognized tax benefits in "Interest Expense" and penalties in "Other Expenses" in the Statement of Operations. The Portfolio files tax returns with the U.S. Internal Revenue Service, New York and various states. Generally, each of the tax years in the four-year period ended December 31, 2016, remains subject to examination by taxing authorities.
The tax character of distributions paid may differ from the character of distributions shown in the Statements of Changes in Net Assets due to short-term capital gains being treated as ordinary income for tax purposes. The tax character of distributions paid during fiscal years 2016 and 2015 was as follows:
2016
Distributions
Paid From: | | 2015
Distributions
Paid From: | |
Ordinary
Income
(000) | | Long-Term
Capital Gain
(000) | | Ordinary
Income
(000) | | Long-Term
Capital Gain
(000) | |
| $ | 281 | | | $ | 655 | | | $ | 237 | | | $ | 522 | | |
The amount and character of income and gains to be distributed are determined in accordance with income tax regulations which may differ from GAAP. These book/tax differences are either considered temporary or permanent in nature.
Temporary differences are attributable to differing book and tax treatments for the timing of the recognition of gains (losses) on certain investment transactions and the timing of the deductibility of certain expenses.
Permanent differences, primarily due to differing treatments of gains (losses) related to foreign currency transactions, resulted in the following reclassifications among the components of net assets at December 31, 2016:
Accumulated
Undistributed
Net Investment
Income
(000) | | Distributions
in Excess of
Net Realized
Gain
(000) | | Paid-in-
Capital
(000) | |
| $ | (9 | ) | | $ | 9 | | | $ | — | | |
24
Morgan Stanley Institutional Fund, Inc.
Annual Report — December 31, 2016
Notes to Financial Statements (cont'd)
At December 31, 2016, the components of distributable earnings for the Portfolio on a tax basis were as follows:
Undistributed
Ordinary
Income
(000) | | Undistributed
Long-Term
Capital Gain
(000) | |
| $ | 4 | | | $ | 36 | | |
Qualified late year losses are capital losses, including currency losses, incurred after October 31 but within the taxable year that, if elected, are deemed to arise on the first day of the Portfolio's next taxable year. For the year ended December 31, 2016, the Portfolio deferred to January 1, 2017 for U.S. federal income tax purposes the following losses:
Qualified Late
Year Ordinary
Losses
(000) | | Post-October
Capital Losses
(000) | |
| $ | — | | | $ | — | @ | |
@ Amount is less than $500.
I. Credit Facility: As of April 4, 2016, the Fund and other Morgan Stanley funds participated in a $150,000,000 committed, unsecured revolving line of credit facility (the "facility") with State Street. This facility is to be used for temporary emergency purposes or funding of shareholder redemption requests. The interest rate on borrowings is based on the federal funds rate or one month libor rate plus a spread. The facility also has a commitment fee of 0.25% per annum based on the unused portion of the facility. During the year ended December 31, 2016, the Portfolio did not have any borrowings under the facility.
J. Other: At December 31, 2016, the Portfolio had record owners of 10% or greater. Investment activities of these shareholders could have a material impact on the Portfolio. The aggregate percentage of such owners was 32.0%.
K. Accounting Pronouncements: In December 2016, FASB issued Accounting Standards update 2016-19 — Technical Corrections and Improvements ("ASU 2016-19"), which is effective for interim periods for all entities beginning after December 15, 2016. ASU 2016-19 includes an amendment to Topic 820, Fair Value Measurement, which clarifies the difference between a valuation approach and a valuation technique when applying the guidance in that Topic. That amendment also requires an entity to disclose when there has been a change in either or both a valuation approach and/or a valuation technique. The transition guidance for the amendment must be applied prospectively because it could potentially involve the use of hindsight that includes fair value
measurements. Although still evaluating the potential impacts of ASU 2016-19 to the Portfolio, management expects that the impact of the Portfolio's adoption will be limited to additional financial statement disclosures.
In October 2016, the Securities and Exchange Commission ("SEC") issued a new rule, Investment Company Reporting Modernization, which, among other provisions, amends Regulation S-X to require standardized, enhanced disclosures, particularly related to derivatives, in investment company financial statements. Compliance with the guidance is effective for financial statements filed with the SEC on or after August 1, 2017; adoption will have no effect on the Portfolio's net assets or results of operations. Although still evaluating the potential impacts of the Investment Company Reporting Modernization to the Portfolio, management expects that the impact of the Portfolio's adoption will be limited to additional financial statement disclosures.
25
Morgan Stanley Institutional Fund, Inc.
Annual Report — December 31, 2016
Report of Independent Registered Public Accounting Firm
To the Shareholders and Board of Directors of
Morgan Stanley Institutional Fund, Inc. —
Global Quality Portfolio
We have audited the accompanying statement of assets and liabilities, including the portfolio of investments, of Global Quality Portfolio (one of the portfolios constituting Morgan Stanley Institutional Fund, Inc.) (the "Portfolio") as of December 31, 2016, the related statement of operations for the year then ended, the statements of changes in net assets for each of the two years in the period then ended and the financial highlights for each of the years or periods indicated therein. These financial statements and financial highlights are the responsibility of the Portfolio's management. Our responsibility is to express an opinion on these financial statements and financial highlights based on our audits.
We conducted our audits in accordance with the standards of the Public Company Accounting Oversight Board (United States). Those standards require that we plan and perform the audit to obtain reasonable assurance about whether the financial statements and financial highlights are free of material misstatement. We were not engaged to perform an audit of the Portfolio's internal control over financial reporting. Our audits included consideration of internal control over financial reporting as a basis for designing audit procedures that are appropriate in the circumstances, but not for the purpose of expressing an opinion on the effectiveness of the Portfolio's internal control over financial reporting. Accordingly, we express no such opinion. An audit also includes examining, on a test basis, evidence supporting the amounts and disclosures in the financial statements and financial highlights, assessing the accounting principles used and significant estimates made by management, and evaluating the overall financial statement presentation. Our procedures included confirmation of securities owned as of December 31, 2016, by correspondence with the custodian and others or by other appropriate auditing procedures where replies from others were not received. We believe that our audits provide a reasonable basis for our opinion.
In our opinion, the financial statements and financial highlights referred to above present fairly, in all material respects, the financial position of the Global Quality Portfolio (one of the portfolios constituting Morgan Stanley Institutional Fund, Inc.) at December 31, 2016, the results of its operations for the year then ended, the changes in its net assets for each of the two years in the period then ended and the financial highlights for each of the years or periods indicated therein, in conformity with U.S. generally accepted accounting principles.

Boston, Massachusetts
February 28, 2017
26
Morgan Stanley Institutional Fund, Inc.
Annual Report — December 31, 2016
Federal Tax Notice (unaudited)
For federal income tax purposes, the following information is furnished with respect to the distributions paid by the Portfolio during its taxable year ended December 31, 2016. For corporate shareholders, 38.9% of the dividends qualified for the dividends received deduction.
The Portfolio designated and paid approximately $655,000 as a long-term capital gain distribution.
For federal income tax purposes, the following information is furnished with respect to the Portfolio's earnings for its taxable year ended December 31, 2016. When distributed, certain earnings may be subject to a maximum tax rate of 15% as provided for the Jobs and Growth Tax Relief Reconciliation Act of 2003. The Portfolio designated up to a maximum of approximately $295,000 as taxable at this lower rate.
In January, the Portfolio provides tax information to shareholders for the preceding calendar year.
27
Morgan Stanley Institutional Fund, Inc.
Annual Report — December 31, 2016
Privacy Notice (unaudited)
MORGAN STANLEY INVESTMENT MANAGEMENT INC.
AN IMPORTANT NOTICE CONCERNING OUR U.S. PRIVACY POLICY
We are required by federal law to provide you with a copy of our privacy policy annually. This policy applies to current and former individual investors in funds managed or sponsored by Morgan Stanley Investment Management Inc. ("MSIM") as well as current and former individual clients of MSIM. This policy is not applicable to partnerships, corporations, trusts or other non-individual clients or investors. Please note that we may amend this policy at any time, and will inform you of any changes as required by law.
WE RESPECT YOUR PRIVACY
We appreciate that you have provided us with your personal financial information. We strive to maintain the privacy of such information while we help you achieve your financial objectives. This Notice describes what non-public personal information we collect about you, why we collect it, when we may share it with others and how certain others may use it. It discusses the steps you may take to limit our sharing of certain information about you to affiliated companies in the Morgan Stanley family of companies ("other Morgan Stanley companies"). It also discloses how you may limit use of certain shared information for marketing purposes by other Morgan Stanley branded companies. Throughout this policy, we refer to the non-public information that personally identifies you or your accounts as "personal information.''
1. WHAT PERSONAL INFORMATION DO WE COLLECT ABOUT YOU?
We obtain personal information from applications and other forms you submit to us, from your dealings with us, from consumer reporting agencies, from our Web sites and from third parties and other sources.
For example:
• We may collect information such as your name, address, e-mail address, telephone/fax numbers, assets, income and investment objectives through subscription documents, applications and other forms you submit to us.
• We may obtain information about account balances, your use of account(s) and the types of products and services you prefer to receive from us through your dealings and transactions with us and other sources.
• We may obtain information about your creditworthiness and credit history from consumer reporting agencies.
• We may collect background information from and through third-party vendors to verify representations you have made and to comply with various regulatory requirements.
• If you interact with us through our public and private Web sites, we may collect information that you provide directly through online communications (such as an e-mail address). We may also collect information about your Internet service provider, your domain name, your computer's operating system and Web browser, your use of our Web sites and your product and service preferences, through the use of "cookies." Please consult the Terms of Use of these sites for more details.
2. WHEN DO WE DISCLOSE PERSONAL INFORMATION WE COLLECT ABOUT YOU?
We may disclose personal information we collect about you to other Morgan Stanley companies and to non-affiliated third parties.
a. Information We Disclose to Other Morgan Stanley Companies.
We may disclose personal information to other Morgan Stanley companies for a variety of reasons, including to manage your account(s) effectively, to service and process your transactions, to let you know about products and services offered by us and other Morgan Stanley companies, to manage our business, and as otherwise required or permitted by law. Offers for products and services from other Morgan Stanley companies are developed under conditions designed to safeguard your personal information.
28
Morgan Stanley Institutional Fund, Inc.
Annual Report — December 31, 2016
Privacy Notice (unaudited) (cont'd)
b. Information We Disclose to Non-affiliated Third Parties.
We do not disclose personal information that we collect about you to non-affiliated third parties except to those who provide marketing services on our behalf, to financial institutions with whom we have joint marketing agreements, and as otherwise required or permitted by law. For example, we may disclose personal information to nonaffiliated third parties for servicing and processing transactions, to offer our own products and services, to protect against fraud, for institutional risk control, to respond to judicial process or to perform services on our behalf. When we share personal information with a non-affiliated third party, they are required to limit their use of personal information to the particular purpose for which it was shared and they are not allowed to share personal information with others except to fulfill that limited purpose or as may be permitted or required by law.
3. HOW DO WE PROTECT THE SECURITY AND CONFIDENTIALITY OF PERSONAL INFORMATION WE COLLECT ABOUT YOU?
We maintain physical, electronic and procedural security measures to help safeguard the personal information we collect about you. We have internal policies governing the proper handling of client information. Third parties that provide support or marketing services on our behalf may also receive personal information, and we require them to adhere to confidentiality standards with respect to such information.
4. HOW CAN YOU LIMIT THE SHARING OF CERTAIN TYPES OF PERSONAL INFORMATION WITH OTHER MORGAN STANLEY COMPANIES?
We offer you choices as to whether we share with other Morgan Stanley companies the personal information that was collected to determine your eligibility for products and services you request ("eligibility information"). Eligibility information does not include your identification information or personal information pertaining to our transactions or experiences with you. Please note that, even if you direct us not to share eligibility information with other Morgan Stanley companies ("opt-out"), we may still share personal information, including eligibility information, with those companies in circumstances excluded from the opt-out under applicable law, such as to process transactions or to service your account.
5. HOW CAN YOU LIMIT THE USE OF CERTAIN TYPES OF PERSONAL INFORMATION BY OTHER MORGAN STANLEY COMPANIES FOR MARKETING?
By following the opt-out instructions in Section 6 below, you may limit other Morgan Stanley branded companies from marketing their products or services to you based on personal information we disclose to them. This information may include, for example, your income and account history with us. Please note that, even if you choose to limit Other Morgan Stanley Companies from using personal information about you that we may share with them for marketing their products and services to you, Other Morgan Stanley Companies may use your personal information that they obtain from us to market to you in circumstances permitted by law, such as if the Other Morgan Stanley Company has its own relationship with you.
6. HOW CAN YOU SEND US AN OPT-OUT INSTRUCTION?
If you wish to limit our sharing of eligibility information about you with other Morgan Stanley companies or other Morgan Stanley companies' use of personal information for marketing purposes, as described in this notice, you may do so by:
• Calling us at (800) 548-7786
Monday-Friday between 8a.m. and 6p.m.(EST)
• Writing to us at the following address:
Boston Financial Data Services, Inc.
c/o Privacy Coordinator
P.O. Box 219804
Kansas City, Missouri 64121
29
Morgan Stanley Institutional Fund, Inc.
Annual Report — December 31, 2016
Privacy Notice (unaudited) (cont'd)
Your written request should include your name, address, telephone number and account number(s) to which the opt-out applies and whether you are opting out with respect to sharing of eligibility information (Section 4 above), or if information used for Marketing (Section 5 above) or both. Written opt-out requests should not be sent with any other correspondence. In order to process your request, we require that the request be provided by you directly and not through a third party.
Your opt-out preference will remain in effect with respect to this policy (as it may be amended) until you notify us otherwise. If you have a joint account, your direction for us not to share this information with other Morgan Stanley companies and for those other Morgan Stanley companies not to use your personal information for marketing will be applied to all account holders on that account. Please understand that if you limit our sharing or our affiliated companies' use of personal information, you and any joint account holder(s) may not receive information about Morgan Stanley products and services, including products or services that could help you manage your financial resources and achieve your investment objectives.
7. WHAT IF AN AFFILIATED COMPANY BECOMES A NON-AFFILIATED THIRD PARTY?
If, at any time in the future, an affiliated company becomes a non-affiliated third party, further disclosures of personal information made to the former affiliated company will be limited to those described in Section 2(b) above relating to non-affiliated third parties. If you elected under Section 6 to limit disclosures we make to affiliated companies, or use of personal information by affiliated companies, your election will not apply to use by any former affiliated company of your personal information in their possession once it becomes a non-affiliated third party.
SPECIAL NOTICE TO RESIDENTS OF VERMONT
The following section supplements our policy with respect to our individual clients who have a Vermont address and supersedes anything to the contrary in the above policy with respect to those clients only.
The state of Vermont requires financial institutions to obtain your consent prior to sharing personal information that they collect about you with affiliated companies and non-affiliated third parties other than in certain limited circumstances. Except as permitted by law, we will not share personal information we collect about you with non-affiliated third parties or other Morgan Stanley companies unless you provide us with your written consent to share such information ("opt-in").
If you wish to receive offers for investment products and services offered by or through other Morgan Stanley companies, please notify us in writing at the following address:
Boston Financial Data Services, Inc.
c/o Privacy Coordinator
P.O. Box 219804
Kansas City, Missouri 64121
Your authorization should include your name, address, telephone number and account number(s) to which the opt-in applies and should not be sent with any other correspondence. In order to process your authorization, we require that the authorization be provided by you directly and not through a third party.
SPECIAL NOTICE TO RESIDENTS OF CALIFORNIA
The following section supplements our policy with respect to our individual clients who have a California address and supersedes anything to the contrary in
the above policy with respect to those clients only.
In response to a California law, if your account has a California home address, your personal information will not be disclosed to nonaffiliated third parties except as permitted by applicable California law, and we will limit sharing such information with our affiliates to comply with California privacy laws that apply to us.
30
Morgan Stanley Institutional Fund, Inc.
Annual Report — December 31, 2016
Director and Officer Information (unaudited)
Independent Directors:
Name, Age and Address of
Independent Director | | Position(s)
Held with
Registrant | | Length of Time
Served* | | Principal Occupation(s) During Past 5 Years
and Other Relevant Professional Experience | | Number of
Portfolios in
Fund Complex
Overseen by
Independent
Director** | | Other Directorships
Held by Independent
Director*** | |
Frank L. Bowman (72)
c/o Perkins Coie LLP
Counsel to the Independent
Directors
30 Rockefeller Plaza
New York, NY 10112 | | Director | | Since
August
2006 | | President, Strategic Decisions, LLC (consulting) (since February 2009); Director or Trustee of various Morgan Stanley Funds (since August 2006); Chairperson of the Compliance and Insurance Committee (since October 2015); formerly, Chairperson of the Insurance Sub-Committee of the Compliance and Insurance Committee (2007-2015); served as President and Chief Executive Officer of the Nuclear Energy Institute (policy organization) (February 2005-November 2008); retired as Admiral, U.S. Navy after serving over 38 years on active duty including 8 years as Director of the Naval Nuclear Propulsion Program in the Department of the Navy and the U.S. Department of Energy (1996-2004); served as Chief of Naval Personnel (July 1994-September 1996) and on the Joint Staff as Director of Political Military Affairs (June 1992-July 1994); knighted as Honorary Knight Commander of the Most Excellent Order of the British Empire; awarded the Officier de l'Orde National du Mérite by the French Government; elected to the National Academy of Engineering (2009). | | | 90 | | | Director of BP p.l.c.; Director of Naval and Nuclear Technologies LLP; Director Emeritus of the Armed Services YMCA; Director of the U.S. Naval Submarine League; Member of the National Security Advisory Council of the Center for U.S. Global Engagement and a member of the CNA Military Advisory Board; Chairman of the charity J Street Cup Golf; Trustee of Fairhaven United Methodist Church; and Director of other various non-profit organizations. | |
Kathleen A. Dennis (63)
c/o Perkins Coie LLP
Counsel to the Independent
Directors
30 Rockefeller Plaza
New York, NY 10112 | | Director | | Since
August
2006 | | President, Cedarwood Associates (mutual fund and investment management consulting) (since July 2006); Chairperson of the Liquidity and Alternatives Sub-Committee of the Investment Committee (since October 2006) and Director or Trustee of various Morgan Stanley Funds (since August 2006); formerly, Senior Managing Director of Victory Capital Management (1993-2006). | | | 91 | | | Director of various non-profit organizations. | |
Nancy C. Everett (61)
c/o Perkins Coie LLP
Counsel to the Independent
Directors
30 Rockefeller Plaza
New York, NY 10112 | | Director | | Since
January
2015 | | Chief Executive Officer, Virginia Commonwealth University Investment Company (since November 2015); Owner, OBIR, LLC (institutional investment management consulting) (since June 2014); formerly, Managing Director, BlackRock Inc. (February 2011-December 2013); and Chief Executive Officer, General Motors Asset Management (a/k/a Promark Global Advisors, Inc.) (June 2005-May 2010). | | | 91 | | | Member of Virginia Commonwealth University School of Business Foundation; formerly, Member of Virginia Commonwealth University Board of Visitors (2013-2015); Member of Committee on Directors for Emerging Markets Growth Fund, Inc. (2007-2010); Chairperson of Performance Equity Management, LLC (2006-2010); and Chairperson, GMAM Absolute Return Strategies Fund, LLC (2006-2010). | |
31
Morgan Stanley Institutional Fund, Inc.
Annual Report — December 31, 2016
Director and Officer Information (unaudited) (cont'd)
Independent Directors: (cont'd)
Name, Age and Address of
Independent Director | | Position(s)
Held with
Registrant | | Length of Time
Served* | | Principal Occupation(s) During Past 5 Years
and Other Relevant Professional Experience | | Number of
Portfolios in
Fund Complex
Overseen by
Independent
Director** | | Other Directorships
Held by Independent
Director*** | |
Jakki L. Haussler (59)
c/o Perkins Coie LLP
Counsel to the Independent
Directors
30 Rockefeller Plaza
New York, NY 10112 | | Director | | Since
January
2015 | | Chairman and Chief Executive Officer, Opus Capital Group (since January 1996); formerly, Director, Capvest Venture Fund, LP (May 2000-December 2011); Partner, Adena Ventures, LP (July 1999-December 2010); Director, The Victory Funds (February 2005-July 2008). | | | 91 | | | Director of Cincinnati Bell Inc. and Member, Audit Committee and Compensation Committee; Director of Northern Kentucky University Foundation and Member, Investment Committee; Member of Chase College of Law Transactional Law Practice Center Board of Advisors; Director of Best Transport; Director of Chase College of Law Board of Visitors; formerly, Member, University of Cincinnati Foundation Investment Committee; Member, Miami University Board of Visitors (2008-2011); Trustee of Victory Funds (2005-2008) and Chairman, Investment Committee (2007-2008) and Member, Service Provider Committee (2005-2008). | |
Dr. Manuel H. Johnson (67)
c/o Johnson Smick
International, Inc.
220 I Street, N.E. —
Suite 200
Washington, D.C. 20002 | | Director | | Since
July
1991 | | Senior Partner, Johnson Smick International, Inc. (consulting firm); Chairperson of the Investment Committee (since October 2006) and Director or Trustee of various Morgan Stanley Funds (since July 1991); Co-Chairman and a founder of the Group of Seven Council (G7C) (international economic commission); formerly, Chairperson of the Audit Committee (July 1991-September 2006), Vice Chairman of the Board of Governors of the Federal Reserve System and Assistant Secretary of the U.S. Treasury. | | | 91 | | | Director of NVR, Inc. (home construction). | |
Joseph J. Kearns (74)
c/o Kearns & Associates LLC
46 E Peninsula Center #385
Rolling Hills Estates, CA
90274-3712 | | Director | | Since
August
1994 | | President, Kearns & Associates LLC (investment consulting); Chairperson of the Audit Committee (since October 2006) and Director or Trustee of various Morgan Stanley Funds (since August 1994); formerly, Deputy Chairperson of the Audit Committee (July 2003-September 2006) and Chairperson of the Audit Committee of various Morgan Stanley Funds (since August 1994); CFO of the J. Paul Getty Trust. | | | 93 | | | Director of Electro Rent Corporation (equipment leasing). Prior to December 31, 2013, Director of The Ford Family Foundation. | |
32
Morgan Stanley Institutional Fund, Inc.
Annual Report — December 31, 2016
Director and Officer Information (unaudited) (cont'd)
Independent Directors: (cont'd)
Name, Age and Address of
Independent Director | | Position(s)
Held with
Registrant | | Length of Time
Served* | | Principal Occupation(s) During Past 5 Years
and Other Relevant Professional Experience | | Number of
Portfolios in
Fund Complex
Overseen by
Independent
Director** | | Other Directorships
Held by Independent
Director*** | |
Michael F. Klein (58)
c/o Perkins Coie LLP
Counsel to the Independent
Directors
30 Rockefeller Plaza
New York, NY 10112 | | Director | | Since
August
2006 | | Managing Director, Aetos Capital, LLC (since March 2000); Co-President, Aetos Alternatives Management, LLC (since January 2004) and Co-Chief Executive Officer of Aetos Capital LLC (since August 2013); Chairperson of the Fixed Income Sub- Committee of the Investment Committee (since October 2006) and Director or Trustee of various Morgan Stanley Funds (since August 2006); formerly, Managing Director, Morgan Stanley & Co. Inc. and Morgan Stanley Dean Witter Investment Management, President, various Morgan Stanley Funds (June 1998-March 2000) and Principal, Morgan Stanley & Co. Inc. and Morgan Stanley Dean Witter Investment Management (August 1997-December 1999). | | | 90 | | | Director of certain investment funds managed or sponsored by Aetos Capital, LLC; Director of Sanitized AG and Sanitized Marketing AG (specialty chemicals). | |
Patricia Maleski (56)
c/o Perkins Coie LLP
Counsel to the Independent
Directors
30 Rockefeller Plaza
New York, NY 10112 | | Director | | Since
January
2017 | | Management Director, JPMorgan Asset Management (2013-2016); President, JPMorgan Funds (2010-2013), Chief Administrative Officer, JPMorgan Funds (2004-2010), Treasurer, JPMorgan Funds (2003-2004, 2008-2010), and Vice President and Board Liaison, JPMorgan Funds (2001-2004); Managing Director, J.P. Morgan Investment Management Inc. (2001-2013); Vice President of Finance, Pierpont Group (1996-2001); Vice President, Bank of New York (1995-1996); Senior Audit Manager, Price Waterhouse, LLP (1982-1995). | | | 91 | | | None. | |
Michael E. Nugent (80)
522 Fifth Avenue
New York, NY 10036 | | Chair of the
Board and
Director | | Chair of the Boards since July 2006 and Director since July 1991 | | Chair of the Boards of various Morgan Stanley Funds (since July 2006); Chairperson of the Closed-End Fund Committee (since June 2012) and Director or Trustee of various Morgan Stanley Funds (since July 1991); formerly, Chairperson of the Insurance Committee (until July 2006); General Partner, Triumph Capital, L.P. (private investment partnership) (1988-2013). | | | 92 | | | None. | |
W. Allen Reed (69)
c/o Perkins Coie LLP
Counsel to the Independent
Directors
30 Rockefeller Plaza
New York, NY 10112 | | Director | | Since
August
2006 | | Chairperson of the Equity Sub-Committee of the Investment Committee (since October 2006) and Director or Trustee of various Morgan Stanley Funds (since August 2006); formerly, President and CEO of General Motors Asset Management; Chairman and Chief Executive Officer of the GM Trust Bank and Corporate Vice President of General Motors Corporation (August 1994-December 2005). | | | 91 | | | Director of Legg Mason, Inc.; formerly, Director of the Auburn University Foundation (2010-2015). | |
Fergus Reid (84)
c/o Joe Pietryka, Inc.
85 Charles Colman Blvd.
Pawling, NY 12564 | | Director | | Since
June
1992 | | Chairman, Joe Pietryka, Inc.; Chairperson of the Governance Committee and Director or Trustee of various Morgan Stanley Funds (since June 1992). | | | 92 | | | Formerly, Trustee and Director of certain investment companies in the JP Morgan Fund Complex managed by JP Morgan Investment Management Inc. (1987-2012). | |
* This is the earliest date the Director began serving the Morgan Stanley Funds. Each Director serves an indefinite term, until his or her successor is elected.
** The Fund Complex includes (as of December 31, 2016) all open-end and closed-end funds (including all of their portfolios) advised by Morgan Stanley Investment Management Inc. (the "Adviser") and any funds that have an adviser that is an affiliated person of the Adviser (including, but not limited to, Morgan Stanley AIP GP LP).
*** This includes any directorships at public companies and registered investment companies held by the Director at any time during the past five years.
33
Morgan Stanley Institutional Fund, Inc.
Annual Report — December 31, 2016
Director and Officer Information (unaudited) (cont'd)
Executive Officers:
Name, Age and Address of Executive Officer | | Position(s) Held
with
Registrant | | Length of
Time Served* | | Principal Occupation(s) During Past 5 Years | |
John H. Gernon (53)
522 Fifth Avenue
New York, NY 10036 | | President and
Principal
Executive
Officer | | Since
September
2013 | | President and Principal Executive Officer of the Equity and Fixed Income Funds and the Morgan Stanley AIP Funds (since September 2013) and the Liquidity Funds and various money market funds (since May 2014) in the Fund Complex; Managing Director of the Adviser; Head of Product (since 2006). | |
Timothy J. Knierim (58)
522 Fifth Avenue
New York, NY 10036 | | Chief
Compliance
Officer | | Since
December
2016 | | Managing Director of the Adviser and various entities affiliated with the Adviser; Chief Compliance Officer of various Morgan Stanley Funds and the Adviser (since December 2016) and Chief Compliance Officer of Morgan Stanley AIP GP LP (since 2014). Formerly, Managing Director and Deputy Chief Compliance Officer of the Adviser (2014-2016); and formerly, Chief Compliance Officer of Prudential Investment Management, Inc. (2007-2014). | |
Francis J. Smith (51)
522 Fifth Avenue
New York, NY 10036 | | Treasurer and
Principal
Financial Officer | | Treasurer
since July
2003 and
Principal
Financial
Officer since
September
2002 | | Managing Director of the Adviser and various entities affiliated with the Adviser; Treasurer (since July 2003) and Principal Financial Officer of various Morgan Stanley Funds (since September 2002). | |
Mary E. Mullin (49)
522 Fifth Avenue
New York, NY 10036 | | Secretary | | Since
June
1999 | | Executive Director of the Adviser; Secretary of various Morgan Stanley Funds (since June 1999). | |
* This is the earliest date the officer began serving the Morgan Stanley Funds. Each officer serves a one-year term, until his or her successor is elected and qualifies.
34
Morgan Stanley Institutional Fund, Inc.
Annual Report — December 31, 2016
Adviser and Administrator
Morgan Stanley Investment Management Inc.
522 Fifth Avenue
New York, New York 10036
Sub-Advisers
Morgan Stanley Investment Management Limited
25 Cabot Square, Canary Wharf
London, E14 4QA, England
Morgan Stanley Investment Management Company
23 Church Street
16-01 Capital Square, Singapore 049481
Distributor
Morgan Stanley Distribution, Inc.
522 Fifth Avenue
New York, New York 10036
Dividend Disbursing and Transfer Agent
Boston Financial Data Services, Inc.
2000 Crown Colony Drive
Quincy, Massachusetts 02169
Custodian
State Street Bank and Trust Company
One Lincoln Street
Boston, Massachusetts 02111
Legal Counsel
Dechert LLP
1095 Avenue of the Americas
New York, New York 10036
Counsel to the Independent Directors
Perkins Coie LLP
30 Rockefeller Plaza
New York, New York 10112
Independent Registered Public Accounting Firm
Ernst & Young LLP
200 Clarendon Street
Boston, Massachusetts 02116
Reporting to Shareholders
Each Morgan Stanley fund provides a complete schedule of portfolio holdings in its semi-annual and annual reports within 60 days of the end of the fund's second and fourth fiscal quarters. The semi-annual and annual reports are filed electronically with the Securities and Exchange Commission (SEC) on Form N-CSRS and Form N-CSR, respectively. Morgan Stanley also delivers the semi-annual and annual reports to fund shareholders and makes these reports available on its public website, www.morganstanley.com/im. Each Morgan Stanley fund also files a complete schedule of portfolio holdings with the SEC for the fund's first and third fiscal quarters on Form N-Q. Morgan Stanley does not deliver the reports for the first and third fiscal quarters to shareholders, nor are the reports posted to the Morgan Stanley public website. You may, however, obtain the Form N-Q filings (as well as the Form N-CSR and N-CSRS filings) by accessing the SEC's website, www.sec.gov. You may also review and copy them at the SEC's Public Reference Room in Washington, DC. Information on the operation of the SEC's Public Reference Room may be obtained by calling the SEC toll free at 1 (800) SEC-0330. You can also request copies of these materials, upon payment of a duplicating fee, by electronic request at the SEC's email address (publicinfo@sec.gov) or by writing the Public Reference Room of the SEC, 100 F Street, NE, Washington, DC 20549-0102.
Proxy Voting Policies and Procedures and Proxy Voting Record
You may obtain a copy of the Fund's Proxy Voting Policy and Procedures and information regarding how the Fund voted proxies relating to portfolio securities during the most recent twelve-month period ended June 30, without charge, upon request, by calling toll free 1 (800) 548-7786 or by visiting our website at www.morganstanley.com/im. This information is also available on the SEC's website at www.sec.gov.
This report is authorized for distribution only when preceded or accompanied by a prospectus or summary prospectus of the applicable Portfolio of Morgan Stanley Institutional Fund, Inc., which describes in detail the Portfolio's investment policies, risks, fees and expenses. Please read the prospectus carefully before you invest or send money. For additional information, including information regarding the investments comprising the Portfolio, please visit our website at www.morganstanley.com/im or call toll free 1 (800) 548-7786.
35
(This Page has been left blank intentionally.)
(This Page has been left blank intentionally.)
Printed in U.S.A.
This Report has been prepared for shareholders and may be distributed to others only if preceded or accompanied by a current prospectus.
Morgan Stanley Investment Management Inc.
522 Fifth Avenue
New York, New York 10036
© 2017 Morgan Stanley. Morgan Stanley Distribution, Inc.

IFIGQANN
1695736 EXP. 02.28.18

Morgan Stanley Institutional Fund, Inc.
Global Real Estate Portfolio
Annual Report
December 31, 2016

Morgan Stanley Institutional Fund, Inc.
Annual Report — December 31, 2016
Shareholders' Letter | | | 2 | | |
Expense Example | | | 3 | | |
Investment Overview | | | 4 | | |
Portfolio of Investments | | | 8 | | |
Statement of Assets and Liabilities | | | 11 | | |
Statement of Operations | | | 13 | | |
Statements of Changes in Net Assets | | | 14 | | |
Financial Highlights | | | 16 | | |
Notes to Financial Statements | | | 21 | | |
Report of Independent Registered Public Accounting Firm | | | 29 | | |
Federal Tax Notice | | | 30 | | |
Privacy Notice | | | 31 | | |
Director and Officer Information | | | 34 | | |
This report is authorized for distribution only when preceded or accompanied by a prospectus or summary prospectus of the applicable Portfolio of Morgan Stanley Institutional Fund, Inc. To receive a prospectus and/or statement of additional information (SAI), which contains more complete information such as investment objectives, charges, expenses, policies for voting proxies, risk considerations, and describes in detail each of the Portfolio's investment policies to the prospective investor, please call toll free 1 (800) 548-7786. Please read the prospectuses carefully before you invest or send money.
Additionally, you can access information about the Portfolio, including performance, characteristics, and investment team commentary, through Morgan Stanley Investment Management's website: www.morganstanley.com/im.
Market forecasts provided in this report may not necessarily come to pass. There is no guarantee that any sectors mentioned will continue to perform as discussed herein or that securities in such sectors will be held by the Portfolio in the future. There is no assurance that a Portfolio will achieve its investment objective. Portfolios are subject to market risk, which is the possibility that market values of securities owned by the Portfolio will decline and, therefore, the value of the Portfolio's shares may be less than what you paid for them. Accordingly, you can lose money investing in this Portfolio. Please see the prospectus for more complete information on investment risks.
1
Morgan Stanley Institutional Fund, Inc.
Annual Report — December 31, 2016
Shareholders' Letter (unaudited)
Dear Shareholders,
We are pleased to provide this Annual report, in which you will learn how your investment in Global Real Estate Portfolio (the "Portfolio") performed during the latest twelve-month period.
Morgan Stanley Investment Management is a client-centric, investor-led organization. Our global presence, intellectual capital, and breadth of products and services enable us to partner with investors to meet the evolving challenges of today's financial markets. We aim to deliver superior investment service and to empower our clients to make the informed decisions that help them reach their investment goals.
As always, we thank you for selecting Morgan Stanley Investment Management, and look forward to working with you in the months and years ahead.
Sincerely,

John H. Gernon
President and Principal Executive Officer
January 2017
2
Morgan Stanley Institutional Fund, Inc.
Annual Report — December 31, 2016
Expense Example (unaudited)
Global Real Estate Portfolio
As a shareholder of the Portfolio, you incur two types of costs: (1) transactional costs; and (2) ongoing costs, which may include advisory fees, administration fees, distribution and shareholder services fees and other Portfolio expenses. This example is intended to help you understand your ongoing costs (in dollars) of investing in the Portfolio and to compare these costs with the ongoing costs of investing in other mutual funds.
This example is based on an investment of $1,000 invested at the beginning of the six-month period ended December 31, 2016 and held for the entire six-month period.
Actual Expenses
The table below provides information about actual account values and actual expenses. You may use the information in this table, together with the amount you invested, to estimate the expenses that you paid over the period. Simply divide your account value by $1,000 (for example, an $8,600 account value divided by $1,000 = 8.6), then multiply the result by the number in the table under the heading entitled "Actual Expenses Paid During Period" to estimate the expenses you paid on your account during this period.
Hypothetical Example for Comparison Purposes
The table below provides information about hypothetical account values and hypothetical expenses based on the Portfolio's actual expense ratio and an assumed rate of return of 5% per year before expenses, which is not the Portfolio's actual return. The hypothetical account values and expenses may not be used to estimate the actual ending account balance or expenses you paid for the period. You may use this information to compare the ongoing costs of investing in the Portfolio and other funds. To do so, compare this 5% hypothetical example with the 5% hypothetical examples that appear in the shareholder reports of the other funds.
Please note that the expenses shown in the table are meant to highlight your ongoing costs only and do not reflect any transactional costs, such as sales charges (loads). Therefore, the information for each class in the table is useful in comparing ongoing costs only, and will not help you determine the relative total costs of owning different funds. In addition, if these transactional costs were included, your costs would have been higher.
| | | Beginning
Account
Value
7/1/16 | | Actual Ending
Account
Value
12/31/16 | | Hypothetical
Ending Account
Value | | Actual
Expenses
Paid
During
Period* | | Hypothetical
Expenses Paid
During Period* | | Net
Expense
Ratio
During
Period** | |
Global Real Estate Portfolio Class I | | $ | 1,000.00 | | | $ | 967.90 | | | $ | 1,019.96 | | | $ | 5.10 | | | $ | 5.23 | | | | 1.03 | %*** | |
Global Real Estate Portfolio Class A | | | 1,000.00 | | | | 967.30 | | | | 1,018.25 | | | | 6.77 | | | | 6.95 | | | | 1.37 | *** | |
Global Real Estate Portfolio Class L | | | 1,000.00 | | | | 964.70 | | | | 1,015.84 | | | | 9.14 | | | | 9.37 | | | | 1.85 | *** | |
Global Real Estate Portfolio Class C | | | 1,000.00 | | | | 962.90 | | | | 1,014.33 | | | | 10.61 | | | | 10.89 | | | | 2.15 | *** | |
Global Real Estate Portfolio Class IS | | | 1,000.00 | | | | 969.10 | | | | 1,020.31 | | | | 4.75 | | | | 4.88 | | | | 0.96 | *** | |
* Expenses are calculated using each Portfolio Class' annualized net expense ratio (as disclosed), multiplied by the average account value over the period, and multiplied by 184/366 (to reflect the most recent one-half year period).
** Annualized.
*** Refer to Note F in the Notes to Financial Statements for discussion of prior period custodian out-of-pocket expenses that were reimbursed in the current period.
3
Morgan Stanley Institutional Fund, Inc.
Annual Report — December 31, 2016
Investment Overview (unaudited)
Global Real Estate Portfolio
The Portfolio seeks to provide current income and capital appreciation.
Performance
For the year ended December 31, 2016, the Portfolio's Class I shares had a total return based on net asset value and reinvestment of distributions per share of 3.42%, net of fees. The Portfolio's Class I shares underperformed against the Portfolio's benchmark, the FTSE EPRA/NAREIT Developed Real Estate Index — Net Total Return to U.S. Investors (the "Index"), which returned 4.67%, and underperformed the MSCI World Net Index, which returned 7.51%.
Factors Affecting Performance
• The global real estate securities market gained 4.7% during the 12-month period ending December 31, 2016, as measured by the Index. North America and Asia outperformed the global average, and Europe significantly underperformed the global average.
• Property stocks in the U.S., measured by the FTSE EPRA/NAREIT U.S. Index, experienced the strongest gains over the period with a U.S. dollar ("USD") return of 7.6%,(i) as the sector has been a beneficiary of the low interest rate environment for most of the year. There was a partial reversal of the lower-for-longer investment theme toward the end of the period following the U.S. election in November, but the sector rallied in December amid building enthusiasm for better economic growth. Property stocks in Asia, measured by the FTSE EPRA/NAREIT Developed Asia Index, gained 6.1% in USD terms,(i) driven by particular strength in the Asian real estate investment trust ("REIT") markets, which benefited from strong investor demand for yield investments. Property stocks in Europe declined 7.3% in USD terms as measured by the FTSE EPRA/NAREIT Developed Europe Index(1) primarily driven by significant weakness in the U.K. due to the outcome of the Brexit vote and resultant prolonged period of uncertainty, as well as the associated depreciation of the pound.
• The Portfolio underperformed during the year primarily due to performance during the first half of 2016, where there was investor preference for yield-oriented stocks and/or market segments with
perceived defensive characteristics, irrespective of underlying valuations (which included the Japan REIT sector, U.S. net lease and health care sectors, German residential sector, Australia and Canada). Investors also appeared to rotate away from segments where cash flows were viewed as more economically sensitive despite trading at very attractive discounted valuations (which included the U.S. apartment and lodging sectors and Hong Kong, Tokyo and New York office markets). The overweight to the U.K. prior to Brexit was also a significant detractor from full-year performance due to the outcome of the vote.
• The Portfolio outperformed in the second half of 2016 amid a partial reversal of the lower-for-longer investment theme that dominated the market in the first half of 2016, though this was not sufficient to offset the underperformance in the first half of the year.
• Performance within the Asian and European regional portfolios detracted from relative performance. Top-down global allocation modestly contributed, due to the underweight to Europe. In Asia, stock selection in Japan (overweight to Japan real estate operating companies, or REOCs, and underweight to Japan REITs) and Hong Kong detracted from the Portfolio's relative performance. In Europe, the Portfolio benefited from the overweight to Norway and stock selection in Sweden; but this was more than offset by the negative effect of the overweight to the U.K. and underweight to Germany. In the U.S., the Portfolio benefited from the overweight to and stock selection within the hotel sector and stock selection in the health care sector; this was offset by relative losses from the overweight to the mall sector and underweight to the net lease, data center and industrial sectors.
Management Strategies
• The global portfolio is comprised of three regional portfolios with a global allocation which weights each of the three major regions (North America, Europe and Asia) relative to the Index based on our view of the relative attractiveness of each region in terms of underlying real estate fundamentals and public market valuations. Moreover, each of the
4
Morgan Stanley Institutional Fund, Inc.
Annual Report — December 31, 2016
Investment Overview (unaudited) (cont'd)
Global Real Estate Portfolio
regional portfolios reflects our core investment philosophy as a real estate value investor, which results in the ownership of stocks that we believe provide the best valuation relative to their underlying real estate values, while maintaining portfolio diversification. Our company-specific research leads us to specific preferences for sub-segments within each of the property sectors and countries. For the period ended December 31, 2016, the Portfolio was overweight the Asian listed property sector, relatively neutral to the North American listed property sector, and underweight the European listed property sector.
• In Asia, the Hong Kong REOCs continue to represent the most significant overweight, as we believe the stocks offer highly attractive value and trade at the widest discrepancy between private and public valuations among public listed global property markets. The companies traded at an average 46% discount to net asset values ("NAVs"),(ii) as share prices continued to reflect the various risks that could potentially impact operating fundamentals and did not reflect the solid recurring cash flows and asset values in the private market. The discounted valuations are further accentuated as the Hong Kong REOCs maintained very modest leverage levels. There has been strength in office market fundamentals, but continued concerns with regard to retail and residential. Commercial asset transaction activity at peak pricing has been elevated. Sentiment, which continues to be a significant driver of share price movements, became even more cautious due to macro concerns regarding China and additional residential tightening measures in Hong Kong. The Japan REOCs ended the period trading at an average 22% discount to NAVs,(ii) as currency volatility weighed on sentiment and investors remained cautious after a volatile year of policy changes. In wide contrast, the Japan REITs continued to trade at a premium of 15%,(ii) with premium valuations driven by domestic investor attraction to yield, purchases by the Bank of Japan ("BOJ") and optimism towards the success of quantitative easing measures by the BOJ. As a result, we believe the Japan REOCs offer value versus the Japan REITs and we remain overweight to the REOCs and underweight the REITs within Japan. The Portfolio was underweight Singapore and Australia on relative valuation.
• In Europe, property stocks in the U.K. ended the period trading at an 11% discount to NAVs, with the U.K. Majors trading at a 20% discount and the London office specialists trading at a 16% discount.(ii) These discounts appear to be well in excess of expected asset value declines and reflect concerns over a prolonged period of uncertainty in the wake of the Brexit vote. To date, transaction and leasing activity have indicated these declines may be more modest than initially expected. Property stocks on the Continent ended the period trading at a 3% premium to NAVs.(ii) Share prices have been supported by monetary easing measures by the European Central Bank ("ECB") despite lackluster operating fundamentals. The Portfolio remains overweight the U.K., in particular the U.K. Majors and London office specialists, which trade at attractive discounts, and underweight the Continent due to the disparity in valuations.
• With asset values for high-quality assets having fully recovered and now, on average, approximately 20% in excess of peak levels achieved in 2007, the U.S. ended the period trading at around par to NAVs.(ii) We see attractive value in several key property sectors with malls and New York City office trading at the most significant discounts to NAVs. However, there is a disparity in valuations as sectors with perceived defensive characteristics and/or providing higher dividends (e.g., health care, net lease) trading at significant premiums to NAVs. Excluding the health care and net lease stocks, the U.S. ended the period trading at a 4% discount to NAVs.(ii) Within the U.S., our company-specific research leads us to an overweighting in the Portfolio to a group of companies that are focused in the ownership of high quality malls, primary central business district ("CBD") office assets, apartments, and a number of out-of-favor companies and an underweighting to companies concentrated in the ownership of net lease, health care, industrial, and secondary CBD/suburban office assets. The Portfolio is underweight Canada given less attractive valuations relative to the quality and cash flow growth prospects of the companies' portfolios and relative to several key property sectors in the U.S.
• Investment values for prime real estate assets have improved due to investors' widespread acceptance
(ii) Source: Morgan Stanley Investment Management, as of December 31, 2016
5
Morgan Stanley Institutional Fund, Inc.
Annual Report — December 31, 2016
Investment Overview (unaudited) (cont'd)
Global Real Estate Portfolio
of low expected returns from real estate in today's low return environment, coupled with continued credit availability and low borrowing rates. Very strong capital flows to the sector have driven asset pricing to new peak levels in most prime markets. In Western markets, valuations for prime assets have largely recovered back to or in excess of peak levels achieved in 2007. In Asian markets, Hong Kong has witnessed an unusually active investment market at peak pricing due to both improved cash flows and cap rate compression whereas in Japan and Australia, asset value improvements have largely been due to cap rate compression with a modest recovery in fundamentals.
• In Western markets, prime assets feature strong occupancy levels and rents continue to exhibit growth, although there is a trend toward decelerating rental growth in most sectors. In the U.S., operating results from various sectors demonstrated still healthy but decelerating cash flow growth, driven by modest economic growth and supply deliveries that are generally in equilibrium with tenant demand. In Europe, markets on the Continent have shown lackluster rental growth; in the U.K., there will likely be a prolonged period of uncertainty in the wake of the Brexit vote. In Asia, there has been continued strength in the Hong Kong office market featuring low vacancy levels and continued demand from Mainland Chinese financial service tenants. In contrast, the Singapore office market featured a continuation of weak rental levels due to recent new supply. In Tokyo, the office market features high occupancy levels but there is still only modest improvements in office rents. There has been an apparent stabilization in Hong Kong retail sales, which had been impaired primarily by reduced Chinese tourism spending, particularly for luxury items, which thus far resulted in relatively flattish rents in 2016 for Hong Kong malls. Operating fundamentals in the Australian retail sector have been stable.

* Minimum Investment for Class I shares
In accordance with SEC regulations, the Portfolio's performance shown assumes that all recurring fees (including management fees) were deducted and all dividends and distributions were reinvested. The performance of Class A, L, C and IS shares will vary from the performance of Class I shares based upon their different inception dates and will be negatively impacted by additional fees assessed to those classes (if applicable).
6
Morgan Stanley Institutional Fund, Inc.
Annual Report — December 31, 2016
Investment Overview (unaudited) (cont'd)
Global Real Estate Portfolio
Performance Compared to the FTSE EPRA/NAREIT Developed Real Estate Index — Net Total Return to U.S. Investors(1), the MSCI World Net Index(2) and the Lipper Global Real Estate Funds Average(3)
| | | Period Ended December 31, 2016
Total Returns(4) | |
| | | Average Annual | |
| | | One
Year | | Five
Years | | Ten
Years | | Since
Inception(9) | |
Portfolio — Class I Shares
w/o sales charges(5) | | | 3.42 | % | | | 9.52 | % | | | 2.03 | % | | | 3.54 | % | |
Portfolio — Class A Shares
w/o sales charges(5) | | | 3.12 | | | | 9.23 | | | | 1.75 | | | | 3.26 | | |
Portfolio — Class A Shares with
maximum 5.25% sales charges(5) | | | –2.34 | | | | 8.05 | | | | 1.21 | | | | 2.73 | | |
Portfolio — Class L Shares
w/o sales charges(6) | | | 2.65 | | | | 8.71 | | | | — | | | | 3.19 | | |
Portfolio — Class C Shares
w/o sales charges(8) | | | 2.31 | | | | — | | | | — | | | | –1.51 | | |
Portfolio — Class C Shares with
maximum 1.00% deferred
sales charges(8) | | | 1.32 | | | | — | | | | — | | | | –1.51 | | |
Portfolio — Class IS Shares
w/o sales charges(7) | | | 3.45 | | | | — | | | | — | | | | 5.27 | | |
FTSE EPRA/NAREIT Developed Real
Estate Index — Net Total Return
to U.S. Investors | | | 4.67 | | | | 10.10 | | | | 1.95 | | | | 3.44 | | |
MSCI World Net Index | | | 7.51 | | | | 10.41 | | | | 3.83 | | | | 4.63 | | |
Lipper Global Real Estate
Funds Average | | | 2.78 | | | | 9.03 | | | | 1.24 | | | | 2.48 | | |
Performance data quoted represents past performance, which is no guarantee of future results, and current performance may be lower or higher than the figures shown. Performance assumes that all dividends and distributions, if any, were reinvested. For the most recent month-end performance figures, please visit www.morganstanley.com/im. Investment return and principal value will fluctuate so that Portfolio shares, when redeemed, may be worth more or less than their original cost. Total returns do not reflect the deduction of taxes that a shareholder would pay on Portfolio distributions or the redemption of Portfolio shares. Performance of share classes will vary due to difference in expenses.
(1) The FTSE EPRA/NAREIT Developed Real Estate Index — Net Total Return to U.S. Investors is a market capitalization weighted index designed to reflect the stock performance of companies engaged in the North American, European and Asian real estate markets. The performance of the Index is listed in U.S. dollars and assumes reinvestment of net dividends. "Net Total Return to U.S. investors" reflects a reduction in total returns after taking into account the withholding tax on dividends by certain foreign countries represented in the Index for periods after 1/31/05 (gross returns used prior to 1/31/05). The Index is unmanaged and its returns do not include any sales charges or fees. Such costs would lower performance. It is not possible to invest directly in an index.
(2) The MSCI World Net Index is a free float-adjusted market capitalization weighted index that is designed to measure the global equity market performance of developed markets. The term "free float" represents the portion of shares outstanding that are deemed to be available for purchase in the public equity markets by investors. The MSCI World Net Index currently consists of 23 developed market country indices. The performance of the Index is listed in U.S. dollars and assumes reinvestment of net dividends. The Index is unmanaged and its returns do not include any sales charges or fees. Such costs would lower performance. It is not possible to invest directly in an index.
(3) The Lipper Global Real Estate Funds Average tracks the performance of all funds in the Lipper Global Real Estate Funds classification. The Average, which is adjusted for capital gains distributions and income dividends, is unmanaged and should not be considered an investment. As of the date of this report, the Portfolio was in the Lipper Global Real Estate Funds classification.
(4) Total returns for the Portfolio reflect fees waived and expenses reimbursed, if applicable, by the Adviser. Without such waivers and reimbursements, total returns would have been lower.
(5) Commenced operations on August 30, 2006.
(6) Commenced offering on June 16, 2008.
(7) Commenced offering September 13, 2013.
(8) Commenced offering on April 30, 2015.
(9) For comparative purposes, average annual since inception returns listed for the Indexes refer to the inception date of Class I of the Portfolio, not the inception of the Index.
7
Morgan Stanley Institutional Fund, Inc.
Annual Report — December 31, 2016
Portfolio of Investments
Global Real Estate Portfolio
| | | Shares | | Value
(000) | |
Common Stocks (98.7%) | |
Australia (5.0%) | |
Dexus Property Group REIT | | | 747,075 | | | $ | 5,187 | | |
Goodman Group REIT | | | 2,578,799 | | | | 13,269 | | |
GPT Group REIT | | | 2,798,460 | | | | 10,158 | | |
Investa Office Fund REIT | | | 850,987 | | | | 2,899 | | |
Mirvac Group REIT | | | 3,367,496 | | | | 5,176 | | |
Scentre Group REIT | | | 6,710,894 | | | | 22,471 | | |
Shopping Centres Australasia Property Group REIT | | | 345,310 | | | | 551 | | |
Stockland REIT | | | 2,278,891 | | | | 7,532 | | |
Vicinity Centres REIT | | | 1,953,484 | | | | 4,215 | | |
Westfield Corp. REIT | | | 2,892,739 | | | | 19,581 | | |
| | | | 91,039 | | |
Austria (0.2%) | |
Atrium European Real Estate Ltd. | | | 360,574 | | | | 1,492 | | |
BUWOG AG (a) | | | 90,925 | | | | 2,114 | | |
| | | | 3,606 | | |
Brazil (0.0%) | |
| BR Properties SA | | | 107,590 | | | | 248 | | |
Canada (2.0%) | |
Boardwalk REIT | | | 146,311 | | | | 5,302 | | |
Brookfield Canada Office Properties REIT | | | 257,507 | | | | 5,031 | | |
Crombie Real Estate Investment Trust REIT | | | 260,838 | | | | 2,638 | | |
Dream Office Real Estate Investment Trust REIT | | | 115,370 | | | | 1,680 | | |
Extendicare, Inc. | | | 149,497 | | | | 1,100 | | |
First Capital Realty, Inc. | | | 466,392 | | | | 7,180 | | |
H&R Real Estate Investment Trust REIT | | | 58,169 | | | | 969 | | |
RioCan Real Estate Investment Trust REIT | | | 526,422 | | | | 10,441 | | |
Smart Real Estate Investment Trust REIT | | | 76,632 | | | | 1,843 | | |
| | | | 36,184 | | |
China (0.3%) | |
China Overseas Land & Investment Ltd. (b) | | | 1,164,000 | | | | 3,085 | | |
China Resources Land Ltd. (b) | | | 332,000 | | | | 747 | | |
Global Logistic Properties Ltd. | | | 1,607,100 | | | | 2,441 | | |
| | | | 6,273 | | |
Finland (0.3%) | |
Citycon Oyj | | | 2,324,857 | | | | 5,722 | | |
France (3.0%) | |
Fonciere Des Regions REIT | | | 27,472 | | | | 2,398 | | |
Gecina SA REIT | | | 65,885 | | | | 9,117 | | |
ICADE REIT | | | 93,216 | | | | 6,652 | | |
Klepierre REIT | | | 243,578 | | | | 9,575 | | |
Mercialys SA REIT | | | 56,689 | | | | 1,148 | | |
Unibail-Rodamco SE REIT | | | 107,788 | | | | 25,728 | | |
| | | | 54,618 | | |
Germany (1.5%) | |
ADO Properties SA (c) | | | 73,736 | | | | 2,485 | | |
Deutsche Wohnen AG | | | 309,967 | | | | 9,736 | | |
LEG Immobilien AG (a) | | | 16,856 | | | | 1,309 | | |
Vonovia SE | | | 408,425 | | | | 13,287 | | |
| | | | 26,817 | | |
| | | Shares | | Value
(000) | |
Hong Kong (9.9%) | |
Cheung Kong Property Holdings Ltd. | | | 3,860,500 | | | $ | 23,672 | | |
Hang Lung Properties Ltd. | | | 884,000 | | | | 1,874 | | |
Henderson Land Development Co., Ltd. | | | 1,488,602 | | | | 7,919 | | |
Hongkong Land Holdings Ltd. | | | 5,413,200 | | | | 34,266 | | |
Hysan Development Co., Ltd. | | | 3,956,014 | | | | 16,351 | | |
Link REIT | | | 2,672,775 | | | | 17,372 | | |
New World Development Co., Ltd. | | | 5,990,109 | | | | 6,334 | | |
Sino Land Co., Ltd. | | | 895,637 | | | | 1,342 | | |
Sun Hung Kai Properties Ltd. | | | 3,162,367 | | | | 39,965 | | |
Swire Properties Ltd. | | | 7,419,600 | | | | 20,476 | | |
Wharf Holdings Ltd. (The) | | | 1,507,763 | | | | 10,023 | | |
| | | | 179,594 | | |
Ireland (0.6%) | |
Green REIT PLC | | | 3,502,343 | | | | 5,058 | | |
Hibernia REIT PLC | | | 4,416,271 | | | | 5,723 | | |
| | | | 10,781 | | |
Italy (0.0%) | |
Beni Stabili SpA REIT (a) | | | 1,267,389 | | | | 724 | | |
Japan (11.0%) | |
Activia Properties, Inc. REIT | | | 1,357 | | | | 6,397 | | |
Advance Residence Investment Corp. REIT | | | 1,003 | | | | 2,652 | | |
Daiwa Office Investment Corp. REIT | | | 593 | | | | 2,994 | | |
GLP J-REIT | | | 4,085 | | | | 4,705 | | |
Hulic Co., Ltd. | | | 216,600 | | | | 1,926 | | |
Invincible Investment Corp. REIT | | | 14,093 | | | | 6,355 | | |
Japan Hotel REIT Investment Corp. REIT | | | 2,920 | | | | 1,964 | | |
Japan Real Estate Investment Corp. REIT | | | 1,878 | | | | 10,236 | | |
Japan Rental Housing Investments, Inc. REIT | | | 1,437 | | | | 964 | | |
Japan Retail Fund Investment Corp. REIT | | | 2,849 | | | | 5,767 | | |
Kenedix Office Investment Corp. REIT | | | 315 | | | | 1,811 | | |
Mitsubishi Estate Co., Ltd. | | | 2,298,000 | | | | 45,763 | | |
Mitsui Fudosan Co., Ltd. | | | 1,878,000 | | | | 43,465 | | |
Mori Hills Investment Corp. REIT | | | 1,605 | | | | 2,168 | | |
Mori Trust Sogo Reit, Inc. REIT | | | 2,854 | | | | 4,503 | | |
Nippon Building Fund, Inc. REIT | | | 2,371 | | | | 13,125 | | |
Nippon Prologis, Inc. REIT | | | 2,326 | | | | 4,754 | | |
Nomura Real Estate Master Fund, Inc. REIT | | | 7,156 | | | | 10,825 | | |
Orix, Inc. J-REIT | | | 2,398 | | | | 3,785 | | |
Sumitomo Realty & Development Co., Ltd. | | | 711,000 | | | | 18,895 | | |
Tokyu, Inc. REIT | | | 208 | | | | 264 | | |
United Urban Investment Corp. REIT | | | 5,033 | | | | 7,661 | | |
| | | | 200,979 | | |
Malta (0.0%) | |
BGP Holdings PLC (a)(d)(e) | | | 12,867,024 | | | | 413 | | |
Netherlands (0.6%) | |
Eurocommercial Properties N.V. CVA REIT | | | 155,540 | | | | 5,990 | | |
Vastned Retail N.V. REIT | | | 37,629 | | | | 1,460 | | |
Wereldhave N.V. REIT | | | 78,964 | | | | 3,554 | | |
| | | | 11,004 | | |
The accompanying notes are an integral part of the financial statements.
8
Morgan Stanley Institutional Fund, Inc.
Annual Report — December 31, 2016
Portfolio of Investments (cont'd)
Global Real Estate Portfolio
| | | Shares | | Value
(000) | |
Norway (0.4%) | |
Entra ASA (c) | | | 640,466 | | | $ | 6,360 | | |
Norwegian Property ASA | | | 800,692 | | | | 926 | | |
| | | | 7,286 | | |
Singapore (1.0%) | |
Ascendas Real Estate Investment Trust REIT | | | 2,149,800 | | | | 3,370 | | |
CapitaLand Commercial Trust Ltd. REIT | | | 2,153,000 | | | | 2,200 | | |
CapitaLand Ltd. | | | 1,391,300 | | | | 2,901 | | |
CapitaLand Mall Trust REIT | | | 2,495,300 | | | | 3,248 | | |
CDL Hospitality Trusts REIT | | | 291,100 | | | | 269 | | |
City Developments Ltd. | | | 43,900 | | | | 251 | | |
EC World Real Estate Investment Trust Unit | | | 836,000 | | | | 420 | | |
Mapletree Commercial Trust REIT | | | 1,317,300 | | | | 1,269 | | |
Mapletree Logistics Trust REIT | | | 645,389 | | | | 455 | | |
Suntec REIT | | | 521,500 | | | | 594 | | |
UOL Group Ltd. | | | 677,293 | | | | 2,802 | | |
| | | | 17,779 | | |
Spain (0.5%) | |
Hispania Activos Inmobiliarios SAU REIT | | | 147,806 | | | | 1,742 | | |
Inmobiliaria Colonial SA | | | 516,781 | | | | 3,581 | | |
Merlin Properties Socimi SA REIT | | | 371,016 | | | | 4,034 | | |
| | | | 9,357 | | |
Sweden (0.6%) | |
Atrium Ljungberg AB, Class B | | | 161,783 | | | | 2,527 | | |
Castellum AB | | | 275,184 | | | | 3,773 | | |
Hufvudstaden AB, Class A | | | 315,008 | | | | 4,975 | | |
Wihlborgs Fastigheter AB | | | 13,484 | | | | 251 | | |
| | | | 11,526 | | |
Switzerland (0.6%) | |
PSP Swiss Property AG (Registered) | | | 118,123 | | | | 10,208 | | |
Swiss Prime Site AG (Registered) (a) | | | 11,756 | | | | 962 | | |
| | | | 11,170 | | |
United Kingdom (5.9%) | |
British Land Co., PLC REIT | | | 2,845,128 | | | | 22,073 | | |
Capital & Regional PLC REIT | | | 1,801,650 | | | | 1,221 | | |
Derwent London PLC REIT | | | 394,743 | | | | 13,485 | | |
Great Portland Estates PLC REIT | | | 1,485,836 | | | | 12,241 | | |
Hammerson PLC REIT | | | 1,012,417 | | | | 7,149 | | |
Intu Properties PLC REIT | | | 1,026,717 | | | | 3,559 | | |
Kennedy Wilson Europe Real Estate PLC | | | 134,721 | | | | 1,592 | | |
Land Securities Group PLC REIT | | | 2,139,237 | | | | 28,104 | | |
LXB Retail Properties PLC (a) | | | 3,172,353 | | | | 1,437 | | |
Segro PLC REIT | | | 781,070 | | | | 4,410 | | |
Shaftesbury PLC REIT | | | 21,550 | | | | 242 | | |
St. Modwen Properties PLC | | | 1,078,387 | | | | 4,039 | | |
Unite Group PLC | | | 224,005 | | | | 1,673 | | |
Urban & Civic PLC | | | 1,451,258 | | | | 4,038 | | |
Workspace Group PLC REIT | | | 142,953 | | | | 1,395 | | |
| | | | 106,658 | | |
| | | Shares | | Value
(000) | |
United States (55.3%) | |
Acadia Realty Trust REIT | | | 46,650 | | | $ | 1,524 | | |
American Homes 4 Rent, Class A REIT | | | 91,300 | | | | 1,915 | | |
Apartment Investment & Management Co.,
Class A REIT | | | 219,542 | | | | 9,978 | | |
AvalonBay Communities, Inc. REIT | | | 317,592 | | | | 56,261 | | |
Boston Properties, Inc. REIT | | | 465,690 | | | | 58,574 | | |
Brixmor Property Group, Inc. REIT | | | 224,684 | | | | 5,487 | | |
Camden Property Trust REIT | | | 272,169 | | | | 22,881 | | |
CBL & Associates Properties, Inc. REIT | | | 42,342 | | | | 487 | | |
Chesapeake Lodging Trust REIT | | | 283,776 | | | | 7,338 | | |
Columbia Property Trust, Inc. REIT | | | 177,315 | | | | 3,830 | | |
Corporate Office Properties Trust REIT | | | 119,883 | | | | 3,743 | | |
Cousins Properties, Inc. REIT | | | 615,808 | | | | 5,241 | | |
CubeSmart REIT | | | 186,766 | | | | 5,000 | | |
DDR Corp. REIT | | | 156,014 | | | | 2,382 | | |
Digital Realty Trust, Inc. REIT | | | 84,560 | | | | 8,309 | | |
Douglas Emmett, Inc. REIT | | | 247,889 | | | | 9,063 | | |
Duke Realty Corp. REIT | | | 396,120 | | | | 10,521 | | |
Equity Lifestyle Properties, Inc. REIT | | | 48,027 | | | | 3,463 | | |
Equity One, Inc. REIT | | | 274,650 | | | | 8,429 | | |
Equity Residential REIT | | | 1,226,302 | | | | 78,925 | | |
Essex Property Trust, Inc. REIT | | | 124,395 | | | | 28,922 | | |
Exeter Industrial Value Fund, LP REIT
(See Note A-4) (a)(d)(e)(f) | | | 1,860,000 | | | | 539 | | |
Federal Realty Investment Trust REIT | | | 30,572 | | | | 4,345 | | |
Gaming and Leisure Properties, Inc. REIT | | | 216,278 | | | | 6,622 | | |
General Growth Properties, Inc. REIT | | | 1,739,059 | | | | 43,442 | | |
Healthcare Realty Trust, Inc. REIT | | | 217,406 | | | | 6,592 | | |
Hilton Worldwide Holdings, Inc. | | | 724,911 | | | | 19,718 | | |
Host Hotels & Resorts, Inc. REIT | | | 1,778,814 | | | | 33,513 | | |
Hudson Pacific Properties, Inc. REIT | | | 411,355 | | | | 14,307 | | |
Kimco Realty Corp. REIT | | | 436,992 | | | | 10,995 | | |
LaSalle Hotel Properties REIT | | | 614,201 | | | | 18,715 | | |
Liberty Property Trust REIT | | | 102,805 | | | | 4,061 | | |
Life Storage, Inc. REIT | | | 146,287 | | | | 12,472 | | |
Macerich Co. (The) REIT | | | 3,879 | | | | 275 | | |
Mack-Cali Realty Corp. REIT | | | 31,784 | | | | 922 | | |
MedEquities Realty Trust, Inc. REIT | | | 151,097 | | | | 1,677 | | |
Mid-America Apartment Communities, Inc. REIT | | | 13,487 | | | | 1,321 | | |
Monogram Residential Trust, Inc. REIT | | | 26,538 | | | | 287 | | |
National Retail Properties, Inc. REIT | | | 326,778 | | | | 14,444 | | |
Paramount Group, Inc. REIT | | | 741,364 | | | | 11,854 | | |
Parkway, Inc. REIT (a) | | | 151,116 | | | | 3,362 | | |
ProLogis, Inc. REIT | | | 433,657 | | | | 22,893 | | |
Public Storage REIT | | | 257,391 | | | | 57,527 | | |
QTS Realty Trust, Inc., Class A REIT | | | 207,722 | | | | 10,313 | | |
Regency Centers Corp. REIT | | | 471,477 | | | | 32,508 | | |
Rexford Industrial Realty, Inc. REIT | | | 300,695 | | | | 6,973 | | |
Senior Housing Properties Trust REIT | | | 401,348 | | | | 7,597 | | |
Simon Property Group, Inc. REIT | | | 761,686 | | | | 135,329 | | |
SL Green Realty Corp. REIT | | | 43,900 | | | | 4,721 | | |
Spirit Realty Capital, Inc. REIT | | | 194,380 | | | | 2,111 | | |
The accompanying notes are an integral part of the financial statements.
9
Morgan Stanley Institutional Fund, Inc.
Annual Report — December 31, 2016
Portfolio of Investments (cont'd)
Global Real Estate Portfolio
| | | Shares | | Value
(000) | |
United States (cont'd) | |
STORE Capital Corp. REIT | | | 277,174 | | | $ | 6,849 | | |
Tanger Factory Outlet Centers, Inc. REIT | | | 592,611 | | | | 21,204 | | |
Taubman Centers, Inc. REIT | | | 54,205 | | | | 4,007 | | |
Ventas, Inc. REIT | | | 554,536 | | | | 34,670 | | |
Vornado Realty Trust REIT | | | 760,161 | | | | 79,338 | | |
Welltower, Inc. REIT | | | 510,665 | | | | 34,179 | | |
Xenia Hotels & Resorts, Inc. REIT | | | 242,615 | | | | 4,712 | | |
| | | | 1,006,667 | | |
Total Common Stocks (Cost $1,499,606) | | | 1,798,445 | | |
Short-Term Investment (0.3%) | |
Investment Company (0.3%) | |
Morgan Stanley Institutional Liquidity
Funds — Treasury Portfolio —
Institutional Class (See Note G)
(Cost $5,762) | | | 5,761,795 | | | | 5,762 | | |
Total Investments (99.0%) (Cost $1,505,368) (g) | | | 1,804,207 | | |
Other Assets in Excess of Liabilities (1.0%) | | | 17,599 | | |
Net Assets (100.0%) | | $ | 1,821,806 | | |
Country assignments and aggregations are based generally on third party vendor classifications and information, and may be different from the assignments and aggregations under the policies set forth in the Portfolio's prospectus and/or statement of additional information relating to geographic classifications.
(a) Non-income producing security.
(b) Security trades on the Hong Kong exchange.
(c) 144A security — Certain conditions for public sale may exist. Unless otherwise noted, these securities are deemed to be liquid.
(d) At December 31, 2016, the Portfolio held fair valued securities valued at approximately $952,000, representing 0.1% of net assets. These securities have been fair valued as determined in good faith under procedures established by and under the general supervision of the Fund's Directors.
(e) Security has been deemed illiquid at December 31, 2016.
(f) Restricted security valued at fair value and not registered under the Securities Act of 1933, Exeter Industrial Value Fund, LP was acquired between 11/07 - 4/11 and has a current cost basis of approximately $58,000. At December 31, 2016, this security had an aggregate market value of approximately $539,000, representing less than 0.05% of net assets.
(g) At December 31, 2016, the aggregate cost for federal income tax purposes is approximately $1,571,532,000. The aggregate gross unrealized appreciation is approximately $268,595,000 and the aggregate gross unrealized depreciation is approximately $35,920,000, resulting in net unrealized appreciation of approximately $232,675,000.
CVA Certificaten Van Aandelen.
REIT Real Estate Investment Trust.
Portfolio Composition
Classification | | Percentage of
Total Investments | |
Diversified | | | 29.0 | % | |
Retail | | | 25.3 | | |
Other* | | | 18.7 | | |
Residential | | | 13.7 | | |
Office | | | 13.3 | | |
Total Investments | | | 100.0 | % | |
* Industries and/or investment types representing less than 5% of total investments.
The accompanying notes are an integral part of the financial statements.
10
Morgan Stanley Institutional Fund, Inc.
Annual Report — December 31, 2016
Global Real Estate Portfolio
Statement of Assets and Liabilities | | December 31, 2016
(000) | |
Assets: | |
Investments in Securities of Unaffiliated Issuers, at Value (Cost $1,499,606) | | $ | 1,798,445 | | |
Investment in Security of Affiliated Issuer, at Value (Cost $5,762) | | | 5,762 | | |
Total Investments in Securities, at Value (Cost $1,505,368) | | | 1,804,207 | | |
Foreign Currency, at Value (Cost $4,094) | | | 4,128 | | |
Receivable for Investments Sold | | | 13,074 | | |
Receivable for Portfolio Shares Sold | | | 6,684 | | |
Dividends Receivable | | | 6,283 | | |
Tax Reclaim Receivable | | | 418 | | |
Receivable from Affiliate | | | 2 | | |
Other Assets | | | 121 | | |
Total Assets | | | 1,834,917 | | |
Liabilities: | |
Payable for Portfolio Shares Redeemed | | | 6,667 | | |
Payable for Advisory Fees | | | 4,041 | | |
Payable for Investments Purchased | | | 1,789 | | |
Payable for Sub Transfer Agency Fees — Class I | | | 167 | | |
Payable for Sub Transfer Agency Fees — Class A | | | 20 | | |
Payable for Sub Transfer Agency Fees — Class L | | | — | @ | |
Payable for Sub Transfer Agency Fees — Class C | | | — | @ | |
Payable for Administration Fees | | | 124 | | |
Payable for Custodian Fees | | | 99 | | |
Payable for Professional Fees | | | 62 | | |
Payable for Shareholder Services Fees — Class A | | | 23 | | |
Payable for Distribution and Shareholder Services Fees — Class L | | | 1 | | |
Payable for Distribution and Shareholder Services Fees — Class C | | | — | @ | |
Payable for Transfer Agency Fees — Class I | | | 4 | | |
Payable for Transfer Agency Fees — Class A | | | 2 | | |
Payable for Transfer Agency Fees — Class L | | | — | @ | |
Payable for Transfer Agency Fees — Class C | | | — | @ | |
Payable for Transfer Agency Fees — Class IS | | | 3 | | |
Other Liabilities | | | 109 | | |
Total Liabilities | | | 13,111 | | |
Net Assets | | $ | 1,821,806 | | |
Net Assets Consist Of: | |
Paid-in-Capital | | $ | 1,595,256 | | |
Distributions in Excess of Net Investment Income | | | (27,921 | ) | |
Distributions in Excess of Net Realized Gain | | | (44,306 | ) | |
Unrealized Appreciation (Depreciation) on: | |
Investments | | | 298,839 | | |
Foreign Currency Translations | | | (62 | ) | |
Net Assets | | $ | 1,821,806 | | |
The accompanying notes are an integral part of the financial statements.
11
Morgan Stanley Institutional Fund, Inc.
Annual Report — December 31, 2016
Global Real Estate Portfolio
Statement of Assets and Liabilities (cont'd) | | December 31, 2016
(000) | |
CLASS I: | |
Net Assets | | $ | 471,790 | | |
| Shares Outstanding $0.001 par value shares of beneficial interest (unlimited shares authorized) (not in 000's) | | | 43,833,840 | | |
Net Asset Value, Offering and Redemption Price Per Share | | $ | 10.76 | | |
CLASS A: | |
Net Assets | | $ | 92,730 | | |
| Shares Outstanding $0.001 par value shares of beneficial interest (unlimited shares authorized) (not in 000's) | | | 8,659,446 | | |
Net Asset Value, Redemption Price Per Share | | $ | 10.71 | | |
Maximum Sales Load | | | 5.25 | % | |
Maximum Sales Charge | | $ | 0.59 | | |
Maximum Offering Price Per Share | | $ | 11.30 | | |
CLASS L: | |
Net Assets | | $ | 1,483 | | |
| Shares Outstanding $0.001 par value shares of beneficial interest (unlimited shares authorized) (not in 000's) | | | 139,306 | | |
Net Asset Value, Offering and Redemption Price Per Share | | $ | 10.64 | | |
CLASS C: | |
Net Assets | | $ | 305 | | |
| Shares Outstanding $0.001 par value shares of beneficial interest (unlimited shares authorized) (not in 000's) | | | 29,096 | | |
Net Asset Value, Offering and Redemption Price Per Share | | $ | 10.49 | | |
CLASS IS: | |
Net Assets | | $ | 1,255,498 | | |
| Shares Outstanding $0.001 par value shares of beneficial interest (unlimited shares authorized) (not in 000's) | | | 116,656,703 | | |
Net Asset Value, Offering and Redemption Price Per Share | | $ | 10.76 | | |
@ Amount is less than $500.
The accompanying notes are an integral part of the financial statements.
12
Morgan Stanley Institutional Fund, Inc.
Annual Report — December 31, 2016
Global Real Estate Portfolio
Statement of Operations | | Year Ended
December 31, 2016
(000) | |
Investment Income: | |
Dividends from Securities of Unaffiliated Issuers (Net of $2,647 of Foreign Taxes Withheld) | | $ | 62,690 | | |
Dividends from Security of Affiliated Issuer (Note G) | | | 78 | | |
Total Investment Income | | | 62,768 | | |
Expenses: | |
Advisory Fees (Note B) | | | 18,139 | | |
Administration Fees (Note C) | | | 1,708 | | |
Sub Transfer Agency Fees — Class I | | | 559 | | |
Sub Transfer Agency Fees — Class A | | | 200 | | |
Sub Transfer Agency Fees — Class L | | | 1 | | |
Sub Transfer Agency Fees — Class C | | | — | @ | |
Shareholder Services Fees — Class A (Note D) | | | 357 | | |
Distribution and Shareholder Services Fees — Class L (Note D) | | | 21 | | |
Distribution and Shareholder Services Fees — Class C (Note D) | | | 3 | | |
Custodian Fees (Note F) | | | 256 | | |
Shareholder Reporting Fees | | | 148 | | |
Professional Fees | | | 126 | | |
Registration Fees | | | 111 | | |
Directors' Fees and Expenses | | | 51 | | |
Transfer Agency Fees — Class I (Note E) | | | 16 | | |
Transfer Agency Fees — Class A (Note E) | | | 10 | | |
Transfer Agency Fees — Class L (Note E) | | | 2 | | |
Transfer Agency Fees — Class C (Note E) | | | 2 | | |
Transfer Agency Fees — Class IS (Note E) | | | 11 | | |
Pricing Fees | | | 15 | | |
Other Expenses | | | 82 | | |
Total Expenses | | | 21,818 | | |
Rebate from Morgan Stanley Affiliate (Note G) | | | (59 | ) | |
Reimbursement of Class Specific Expenses — Class C (Note B) | | | (2 | ) | |
Reimbursement of Custodian Fees (Note F) | | | (119 | ) | |
Net Expenses | | | 21,638 | | |
Net Investment Income | | | 41,130 | | |
Realized Gain: | |
Investments Sold | | | 19,844 | | |
Foreign Currency Transactions | | | 247 | | |
Net Realized Gain | | | 20,091 | | |
Change in Unrealized Appreciation (Depreciation): | |
Investments | | | 12,825 | | |
Foreign Currency Translations | | | (4 | ) | |
Net Change in Unrealized Appreciation (Depreciation) | | | 12,821 | | |
Net Realized Gain and Change in Unrealized Appreciation (Depreciation) | | | 32,912 | | |
Net Increase in Net Assets Resulting from Operations | | $ | 74,042 | | |
@ Amount is less than $500.
The accompanying notes are an integral part of the financial statements.
13
Morgan Stanley Institutional Fund, Inc.
Annual Report — December 31, 2016
Global Real Estate Portfolio
Statements of Changes in Net Assets | | Year Ended
December 31, 2016
(000) | | Year Ended
December 31, 2015
(000) | |
Increase (Decrease) in Net Assets: | |
Operations: | |
Net Investment Income | | $ | 41,130 | | | $ | 40,749 | | |
Net Realized Gain | | | 20,091 | | | | 41,627 | | |
Net Change in Unrealized Appreciation (Depreciation) | | | 12,821 | | | | (106,276 | ) | |
Net Increase (Decrease) in Net Assets Resulting from Operations | | | 74,042 | | | | (23,900 | ) | |
Distributions from and/or in Excess of: | |
Class I: | |
Net Investment Income | | | (14,704 | ) | | | (21,346 | ) | |
Net Realized Gain | | | (1,849 | ) | | | — | | |
Paid-in-Capital | | | (725 | ) | | | — | | |
Class A: | |
Net Investment Income | | | (2,970 | ) | | | (2,184 | ) | |
Net Realized Gain | | | (429 | ) | | | — | | |
Paid-in-Capital | | | (168 | ) | | | — | | |
Class L: | |
Net Investment Income | | | (27 | ) | | | (48 | ) | |
Net Realized Gain | | | (6 | ) | | | — | | |
Paid-in-Capital | | | (2 | ) | | | — | | |
Class C: | |
Net Investment Income | | | (7 | ) | | | (3 | ) | |
Net Realized Gain | | | (1 | ) | | | — | | |
Paid-in-Capital | | | (1 | ) | | | — | | |
Class IS: | |
Net Investment Income | | | (40,319 | ) | | | (18,420 | ) | |
Net Realized Gain | | | (4,880 | ) | | | — | | |
Paid-in-Capital | | | (1,912 | ) | | | — | | |
Total Distributions | | | (68,000 | ) | | | (42,001 | ) | |
Capital Share Transactions:(1) | |
Class I: | |
Subscribed | | | 114,459 | | | | 271,674 | | |
Distributions Reinvested | | | 15,837 | | | | 20,026 | | |
Redeemed | | | (862,678 | ) | | | (900,616 | ) | |
Class A: | |
Subscribed | | | 94,427 | | | | 75,282 | | |
Distributions Reinvested | | | 3,558 | | | | 2,164 | | |
Redeemed | | | (138,133 | ) | | | (44,823 | ) | |
Class L: | |
Subscribed | | | — | | | | 392 | | |
Distributions Reinvested | | | 35 | | | | 48 | | |
Redeemed | | | (3,106 | ) | | | (554 | ) | |
Class C: | |
Subscribed | | | 115 | | | | 195 | * | |
Distributions Reinvested | | | 8 | | | | 2 | * | |
Redeemed | | | (5 | ) | | | — | | |
Class IS: | |
Subscribed | | | 791,778 | | | | 611,395 | | |
Distributions Reinvested | | | 40,976 | | | | 16,673 | | |
Redeemed | | | (587,231 | ) | | | (165,921 | ) | |
Net Decrease in Net Assets Resulting from Capital Share Transactions | | | (529,960 | ) | | | (114,063 | ) | |
Total Decrease in Net Assets | | | (523,918 | ) | | | (179,964 | ) | |
Net Assets: | |
Beginning of Period | | | 2,345,724 | | | | 2,525,688 | | |
End of Period (Including Distributions in Excess of Net Investment Income of $(27,921) and $(17,148)) | | $ | 1,821,806 | | | $ | 2,345,724 | | |
The accompanying notes are an integral part of the financial statements.
14
Morgan Stanley Institutional Fund, Inc.
Annual Report — December 31, 2016
Global Real Estate Portfolio
Statements of Changes in Net Assets (cont'd) | | Year Ended
December 31, 2016
(000) | | Year Ended
December 31, 2015
(000) | |
(1) Capital Share Transactions: | |
Class I: | |
Shares Subscribed | | | 10,334 | | | | 24,005 | | |
Shares Issued on Distributions Reinvested | | | 1,491 | | | | 1,847 | | |
Shares Redeemed | | | (78,399 | ) | | | (80,137 | ) | |
Net Decrease in Class I Shares Outstanding | | | (66,574 | ) | | | (54,285 | ) | |
Class A: | |
Shares Subscribed | | | 8,746 | | | | 6,969 | | |
Shares Issued on Distributions Reinvested | | | 337 | | | | 201 | | |
Shares Redeemed | | | (13,041 | ) | | | (4,125 | ) | |
Net Increase (Decrease) in Class A Shares Outstanding | | | (3,958 | ) | | | 3,045 | | |
Class L: | |
Shares Subscribed | | | — | | | | 34 | | |
Shares Issued on Distributions Reinvested | | | 3 | | | | 5 | | |
Shares Redeemed | | | (289 | ) | | | (50 | ) | |
Net Decrease in Class L Shares Outstanding | | | (286 | ) | | | (11 | ) | |
Class C: | |
Shares Subscribed | | | 10 | | | | 18 | * | |
Shares Issued on Distributions Reinvested | | | 1 | | | | — | @@* | |
Shares Redeemed | | | (— | @@) | | | — | | |
Net Increase in Class C Shares Outstanding | | | 11 | | | | 18 | | |
Class IS: | |
Shares Subscribed | | | 72,096 | | | | 54,250 | | |
Shares Issued on Distributions Reinvested | | | 3,858 | | | | 1,537 | | |
Shares Redeemed | | | (53,032 | ) | | | (14,851 | ) | |
Net Increase in Class IS Shares Outstanding | | | 22,922 | | | | 40,936 | | |
* For the period April 30, 2015 through December 31, 2015.
@@ Amount is less than 500 shares.
The accompanying notes are an integral part of the financial statements.
15
Morgan Stanley Institutional Fund, Inc.
Annual Report — December 31, 2016
Financial Highlights
Global Real Estate Portfolio
| | | Class I | |
| | | Year Ended December 31, | |
Selected Per Share Data and Ratios | | 2016(1) | | 2015 | | 2014 | | 2013 | | 2012 | |
Net Asset Value, Beginning of Period | | $ | 10.80 | | | $ | 11.10 | | | $ | 9.91 | | | $ | 9.77 | | | $ | 7.77 | | |
Income (Loss) from Investment Operations: | |
Net Investment Income (2) | | | 0.21 | | | | 0.18 | | | | 0.20 | | | | 0.18 | | | | 0.17 | | |
Net Realized and Unrealized Gain (Loss) | | | 0.15 | | | | (0.28 | ) | | | 1.19 | | | | 0.16 | | | | 2.17 | | |
Total from Investment Operations | | | 0.36 | | | | (0.10 | ) | | | 1.39 | | | | 0.34 | | | | 2.34 | | |
Distributions from and/or in Excess of: | |
Net Investment Income | | | (0.34 | ) | | | (0.20 | ) | | | (0.20 | ) | | | (0.20 | ) | | | (0.34 | ) | |
Net Realized Gain | | | (0.04 | ) | | | — | | | | — | | | | — | | | | — | | |
Paid-in-Capital | | | (0.02 | ) | | | — | | | | — | | | | — | | | | — | | |
Total Distributions | | | (0.40 | ) | | | (0.20 | ) | | | (0.20 | ) | | | (0.20 | ) | | | (0.34 | ) | |
Net Asset Value, End of Period | | $ | 10.76 | | | $ | 10.80 | | | $ | 11.10 | | | $ | 9.91 | | | $ | 9.77 | | |
Total Return (3) | | | 3.42 | % | | | (0.94 | )% | | | 14.08 | % | | | 3.55 | % | | | 30.19 | % | |
Ratios and Supplemental Data: | |
Net Assets, End of Period (Thousands) | | $ | 471,790 | | | $ | 1,192,624 | | | $ | 1,828,656 | | | $ | 1,793,614 | | | $ | 1,880,999 | | |
Ratio of Expenses to Average Net Assets (6) | | | 1.04 | %(4) | | | 1.05 | %(4) | | | 1.05 | %(4) | | | 1.02 | %(4) | | | 1.02 | %(4) | |
Ratio of Expenses to Average Net Assets Excluding Non Operating Expenses | | | N/A | | | | 1.05 | %(4) | | | N/A | | | | 1.02 | %(4) | | | N/A | | |
Ratio of Net Investment Income to Average Net Assets (6) | | | 1.88 | %(4) | | | 1.65 | %(4) | | | 1.85 | %(4) | | | 1.77 | %(4) | | | 2.42 | %(4) | |
Ratio of Rebate from Morgan Stanley Affiliates to Average Net Assets | | | 0.00 | %(5) | | | 0.00 | %(5) | | | 0.00 | %(5) | | | 0.00 | %(5) | | | 0.00 | %(5) | |
Portfolio Turnover Rate | | | 26 | % | | | 29 | % | | | 32 | % | | | 33 | % | | | 29 | % | |
(6) Supplemental Information on the Ratios to Average Net Assets: | |
Ratios Before Expense Limitation: | |
Expenses to Average Net Assets | | | 1.04 | % | | | 1.05 | % | | | 1.05 | % | | | N/A | | | | N/A | | |
Net Investment Income to Average Net Assets | | | 1.88 | % | | | 1.65 | % | | | 1.85 | % | | | N/A | | | | N/A | | |
(1) Refer to Note F in the Notes to Financial Statements for discussion of prior period custodian out-of pocket expenses that were reimbursed in the current period. The amount of the reimbursement was immaterial on a per share basis and did not impact the total return of Class I shares. The Ratio of Expenses to Average Net Assets would have been smaller than 0.005% higher and the Ratio of Net Investment Income to Average Net Assets would have been smaller than 0.005% lower had the custodian not reimbursed the Portfolio.
(2) Per share amount is based on average shares outstanding.
(3) Calculated based on the net asset value as of the last business day of the period.
(4) The Ratios of Expenses and Net Investment Income reflect the rebate of certain Portfolio expenses in connection with the investments in Morgan Stanley affiliates during the period. The effect of the rebate on the ratios is disclosed in the above table as "Ratio of Rebate from Morgan Stanley Affiliates to Average Net Assets."
(5) Amount is less than 0.005%.
The accompanying notes are an integral part of the financial statements.
16
Morgan Stanley Institutional Fund, Inc.
Annual Report — December 31, 2016
Financial Highlights
Global Real Estate Portfolio
| | | Class A | |
| | | Year Ended December 31, | |
Selected Per Share Data and Ratios | | 2016(1) | | 2015 | | 2014 | | 2013 | | 2012 | |
Net Asset Value, Beginning of Period | | $ | 10.74 | | | $ | 11.05 | | | $ | 9.86 | | | $ | 9.72 | | | $ | 7.73 | | |
Income (Loss) from Investment Operations: | |
Net Investment Income (2) | | | 0.17 | | | | 0.16 | | | | 0.17 | | | | 0.15 | | | | 0.15 | | |
Net Realized and Unrealized Gain (Loss) | | | 0.16 | | | | (0.30 | ) | | | 1.19 | | | | 0.15 | | | | 2.16 | | |
Total from Investment Operations | | | 0.33 | | | | (0.14 | ) | | | 1.36 | | | | 0.30 | | | | 2.31 | | |
Distributions from and/or in Excess of: | |
Net Investment Income | | | (0.30 | ) | | | (0.17 | ) | | | (0.17 | ) | | | (0.16 | ) | | | (0.32 | ) | |
Net Realized Gain | | | (0.04 | ) | | | — | | | | — | | | | — | | | | — | | |
Paid-in-Capital | | | (0.02 | ) | | | — | | | | — | | | | — | | | | — | | |
Total Distributions | | | (0.36 | ) | | | (0.17 | ) | | | (0.17 | ) | | | (0.16 | ) | | | (0.32 | ) | |
Net Asset Value, End of Period | | $ | 10.71 | | | $ | 10.74 | | | $ | 11.05 | | | $ | 9.86 | | | $ | 9.72 | | |
Total Return (3) | | | 3.12 | % | | | (1.25 | )% | | | 13.88 | % | | | 3.18 | % | | | 29.93 | % | |
Ratios and Supplemental Data: | |
Net Assets, End of Period (Thousands) | | $ | 92,730 | | | $ | 135,517 | | | $ | 105,766 | | | $ | 96,046 | | | $ | 171,413 | | |
Ratio of Expenses to Average Net Assets (7) | | | 1.35 | %(4) | | | 1.34 | %(4) | | | 1.31 | %(4) | | | 1.30 | %(4)(5) | | | 1.27 | %(4) | |
Ratio of Expenses to Average Net Assets Excluding Non Operating Expenses | | | N/A | | | | 1.34 | %(4) | | | N/A | | | | 1.30 | %(4)(5) | | | N/A | | |
Ratio of Net Investment Income to Average Net Assets (7) | | | 1.51 | %(4) | | | 1.47 | %(4) | | | 1.60 | %(4) | | | 1.43 | %(4) | | | 2.17 | %(4) | |
Ratio of Rebate from Morgan Stanley Affiliates to Average Net Assets | | | 0.00 | %(6) | | | 0.00 | %(6) | | | 0.00 | %(6) | | | 0.00 | %(6) | | | 0.00 | %(6) | |
Portfolio Turnover Rate | | | 26 | % | | | 29 | % | | | 32 | % | | | 33 | % | | | 29 | % | |
(7) Supplemental Information on the Ratios to Average Net Assets: | |
Ratios Before Expense Limitation: | |
Expenses to Average Net Assets | | | 1.36 | % | | | N/A | | | | N/A | | | | 1.32 | % | | | N/A | | |
Net Investment Income to Average Net Assets | | | 1.50 | % | | | N/A | | | | N/A | | | | 1.41 | % | | | N/A | | |
(1) Refer to Note F in the Notes to Financial Statements for discussion of prior period custodian out-of pocket expenses that were reimbursed in the current period. The amount of the reimbursement was immaterial on a per share basis and did not impact the total return of Class A shares. The Ratio of Expenses to Average Net Assets would have been 0.01% higher and the Ratio of Net Investment Income to Average Net Assets would have been 0.01% lower had the custodian not reimbursed the Portfolio.
(2) Per share amount is based on average shares outstanding.
(3) Calculated based on the net asset value which does not reflect sales charges, if applicable, as of the last business day of the period.
(4) The Ratios of Expenses and Net Investment Income reflect the rebate of certain Portfolio expenses in connection with the investments in Morgan Stanley affiliates during the period. The effect of the rebate on the ratios is disclosed in the above table as "Ratio of Rebate from Morgan Stanley Affiliates to Average Net Assets."
(5) Effective September 16, 2013, the Adviser has agreed to limit the ratio of expenses to average net assets to the maximum ratio of 1.40% for Class A shares. Prior to September 16, 2013, the maximum ratio was 1.30% for Class A shares.
(6) Amount is less than 0.005%.
The accompanying notes are an integral part of the financial statements.
17
Morgan Stanley Institutional Fund, Inc.
Annual Report — December 31, 2016
Financial Highlights
Global Real Estate Portfolio
| | | Class L | |
| | | Year Ended December 31, | |
Selected Per Share Data and Ratios | | 2016(1) | | 2015 | | 2014 | | 2013 | | 2012 | |
Net Asset Value, Beginning of Period | | $ | 10.61 | | | $ | 10.91 | | | $ | 9.74 | | | $ | 9.59 | | | $ | 7.63 | | |
Income (Loss) from Investment Operations: | |
Net Investment Income (2) | | | 0.12 | | | | 0.12 | | | | 0.12 | | | | 0.10 | | | | 0.10 | | |
Net Realized and Unrealized Gain (Loss) | | | 0.16 | | | | (0.31 | ) | | | 1.17 | | | | 0.16 | | | | 2.13 | | |
Total from Investment Operations | | | 0.28 | | | | (0.19 | ) | | | 1.29 | | | | 0.26 | | | | 2.23 | | |
Distributions from and/or in Excess of: | |
Net Investment Income | | | (0.19 | ) | | | (0.11 | ) | | | (0.12 | ) | | | (0.11 | ) | | | (0.27 | ) | |
Net Realized Gain | | | (0.04 | ) | | | — | | | | — | | | | — | | | | — | | |
Paid-in-Capital | | | (0.02 | ) | | | — | | | | — | | | | — | | | | — | | |
Total Distributions | | | (0.25 | ) | | | (0.11 | ) | | | (0.12 | ) | | | (0.11 | ) | | | (0.27 | ) | |
Net Asset Value, End of Period | | $ | 10.64 | | | $ | 10.61 | | | $ | 10.91 | | | $ | 9.74 | | | $ | 9.59 | | |
Total Return (3) | | | 2.65 | % | | | (1.71 | )% | | | 13.27 | % | | | 2.77 | % | | | 29.26 | % | |
Ratios and Supplemental Data: | |
Net Assets, End of Period (Thousands) | | $ | 1,483 | | | $ | 4,509 | | | $ | 4,755 | | | $ | 5,844 | | | $ | 7,050 | | |
Ratio of Expenses to Average Net Assets (7) | | | 1.82 | %(4) | | | 1.78 | %(4) | | | 1.79 | %(4) | | | 1.77 | %(4)(5) | | | 1.77 | %(4) | |
Ratio of Expenses to Average Net Assets Excluding Non Operating Expenses | | | N/A | | | | 1.77 | %(4) | | | N/A | | | | 1.77 | %(4)(5) | | | N/A | | |
Ratio of Net Investment Income to Average Net Assets (7) | | | 1.07 | %(4) | | | 1.12 | %(4) | | | 1.08 | %(4) | | | 0.98 | %(4) | | | 1.67 | %(4) | |
Ratio of Rebate from Morgan Stanley Affiliates to Average Net Assets | | | 0.00 | %(6) | | | 0.00 | %(6) | | | 0.00 | %(6) | | | 0.00 | %(6) | | | 0.00 | %(6) | |
Portfolio Turnover Rate | | | 26 | % | | | 29 | % | | | 32 | % | | | 33 | % | | | 29 | % | |
(7) Supplemental Information on the Ratios to Average Net Assets: | |
Ratios Before Expense Limitation: | |
Expenses to Average Net Assets | | | 1.82 | % | | | N/A | | | | N/A | | | | N/A | | | | N/A | | |
Net Investment Income to Average Net Assets | | | 1.07 | % | | | N/A | | | | N/A | | | | N/A | | | | N/A | | |
(1) Refer to Note F in the Notes to Financial Statements for discussion of prior period custodian out-of pocket expenses that were reimbursed in the current period. The amount of the reimbursement was immaterial on a per share basis and did not impact the total return of Class L shares. The Ratio of Expenses to Average Net Assets would have been smaller than 0.005% higher and the Ratio of Net Investment Income to Average Net Assets would have been smaller than 0.005% lower had the custodian not reimbursed the Portfolio.
(2) Per share amount is based on average shares outstanding.
(3) Calculated based on the net asset value as of the last business day of the period.
(4) The Ratios of Expenses and Net Investment Income reflect the rebate of certain Portfolio expenses in connection with the investments in Morgan Stanley affiliates during the period. The effect of the rebate on the ratios is disclosed in the above table as "Ratio of Rebate from Morgan Stanley Affiliates to Average Net Assets."
(5) Effective September 16, 2013, the Adviser has agreed to limit the ratio of expenses to average net assets to the maximum ratio of 1.90% for Class L shares. Prior to September 16, 2013, the maximum ratio was 1.80% for Class L shares.
(6) Amount is less than 0.005%.
The accompanying notes are an integral part of the financial statements.
18
Morgan Stanley Institutional Fund, Inc.
Annual Report — December 31, 2016
Financial Highlights
Global Real Estate Portfolio
| | | Class C | |
Selected Per Share Data and Ratios | | Year Ended
December 31, 2016(1) | | Period from
April 30, 2015(2) to
December 31, 2015 | |
Net Asset Value, Beginning of Period | | $ | 10.56 | | | $ | 11.23 | | |
Income (Loss) from Investment Operations: | |
Net Investment Income (3) | | | 0.08 | | | | 0.07 | | |
Net Realized and Unrealized Gain/(Loss) | | | 0.16 | | | | (0.60 | ) | |
Total from Investment Operations | | | 0.24 | | | | (0.53 | ) | |
Distributions from and/or in Excess of: | |
Net Investment Income | | | (0.25 | ) | | | (0.14 | ) | |
Net Realized Gain | | | (0.04 | ) | | | — | | |
Paid-in-Capital | | | (0.02 | ) | | | — | | |
Total Distributions | | | (0.31 | ) | | | (0.14 | ) | |
Net Asset Value, End of Period | | $ | 10.49 | | | $ | 10.56 | | |
Total Return (4) | | | 2.31 | % | | | (4.71 | )%(7) | |
Ratios and Supplemental Data: | |
Net Assets, End of Period (Thousands) | | $ | 305 | | | $ | 191 | | |
Ratio of Expenses to Average Net Assets (9) | | | 2.15 | %(5) | | | 2.15 | %(5)(8) | |
Ratio of Expenses to Average Net Assets Excluding Non Operating Expenses | | | N/A | | | | 2.15 | %(5)(8) | |
Ratio of Net Investment Income to Average Net Assets (9) | | | 0.75 | %(5) | | | 1.01 | %(5)(8) | |
Ratio of Rebate from Morgan Stanley Affiliates to Average Net Assets | | | 0.00 | %(6) | | | 0.00 | %(6)(8) | |
Portfolio Turnover Rate | | | 26 | % | | | 29 | % | |
(9) Supplemental Information on the Ratios to Average Net Assets: | |
Ratios Before Expense Limitation: | |
Expense to Average Net Assets | | | 2.86 | % | | | 3.25 | %(8) | |
Net Investment Income (Loss) to Average Net Assets | | | 0.04 | % | | | (0.09 | )%(8) | |
(1) Refer to Note F in the Notes to Financial Statements for discussion of prior period custodian out-of pocket expenses that were reimbursed in the current period. The amount of the reimbursement was immaterial on a per share basis and did not impact the total return of Class C shares. The Ratio of Expenses to Average Net Assets and the Ratio of Net Investment Income to Average Net Assets be unchanged as the reimbursement of custodian fees was offset against current period expense waivers/reimbursements with no impact to net expenses or net investment income.
(2) Commencement of Offering.
(3) Per share amount is based on average shares outstanding.
(4) Calculated based on the net asset value which does not reflect sales charges, if applicable, as of the last business day of the period.
(5) The Ratios of Expenses and Net Investment Income reflect the rebate of certain Portfolio expenses in connection with the investments in Morgan Stanley affiliates during the period. The effect of the rebate on the ratios is disclosed in the above table as "Ratio of Rebate from Morgan Stanley Affiliates to Average Net Assets."
(6) Amount is less than 0.005%.
(7) Not Annualized.
(8) Annualized.
The accompanying notes are an integral part of the financial statements.
19
Morgan Stanley Institutional Fund, Inc.
Annual Report — December 31, 2016
Financial Highlights
Global Real Estate Portfolio
| | | Class IS | |
| | | Year Ended December 31, | | Period from
September 13, 2013(2) to | |
Selected Per Share Data and Ratios | | 2016(1) | | 2015 | | 2014 | | December 31, 2013 | |
Net Asset Value, Beginning of Period | | $ | 10.81 | | | $ | 11.11 | | | $ | 9.91 | | | $ | 10.01 | | |
Income (Loss) from Investment Operations: | |
Net Investment Income (3) | | | 0.22 | | | | 0.20 | | | | 0.22 | | | | 0.08 | | |
Net Realized and Unrealized Gain (Loss) | | | 0.15 | | | | (0.29 | ) | | | 1.19 | | | | 0.02 | | |
Total from Investment Operations | | | 0.37 | | | | (0.09 | ) | | | 1.41 | | | | 0.10 | | |
Distributions from and/or in Excess of: | |
Net Investment Income | | | (0.36 | ) | | | (0.21 | ) | | | (0.21 | ) | | | (0.20 | ) | |
Net Realized Gain | | | (0.04 | ) | | | — | | | | — | | | | — | | |
Paid-in-Capital | | | (0.02 | ) | | | — | | | | — | | | | — | | |
Total Distributions | | | (0.42 | ) | | | (0.21 | ) | | | (0.21 | ) | | | (0.20 | ) | |
Net Asset Value, End of Period | | $ | 10.76 | | | $ | 10.81 | | | $ | 11.11 | | | $ | 9.91 | | |
Total Return (4) | | | 3.45 | % | | | (0.84 | )% | | | 14.27 | % | | | 1.08 | %(8) | |
Ratios and Supplemental Data: | |
Net Assets, End of Period (Thousands) | | $ | 1,255,498 | | | $ | 1,012,883 | | | $ | 586,511 | | | $ | 206,757 | | |
Ratio of Expenses to Average Net Assets (10) | | | 0.96 | %(5) | | | 0.97 | %(5) | | | 0.96 | %(5) | | | 0.96 | %(5)(6)(9) | |
Ratio of Expenses to Average Net Assets Excluding Non Operating Expenses | | | N/A | | | | 0.97 | %(5) | | | N/A | | | | N/A | | |
Ratio of Net Investment Income to Average Net Assets (10) | | | 2.01 | %(5) | | | 1.78 | %(5) | | | 2.01 | %(5) | | | 2.88 | %(5)(9) | |
Ratio of Rebate from Morgan Stanley Affiliates to Average Net Assets | | | 0.00 | %(7) | | | 0.00 | %(7) | | | 0.00 | %(7) | | | 0.00 | %(7)(9) | |
Portfolio Turnover Rate | | | 26 | % | | | 29 | % | | | 32 | % | | | 33 | % | |
(10) Supplemental Information on the Ratios to Average Net Assets: | |
Ratios Before Expense Limitation: | |
Expenses to Average Net Assets | | | 0.97 | % | | | N/A | | | | 0.96 | % | | | 0.97 | %(9) | |
Net Investment Income to Average Net Assets | | | 2.00 | % | | | N/A | | | | 2.01 | % | | | 2.87 | %(9) | |
(1) Refer to Note F in the Notes to Financial Statements for discussion of prior period custodian out-of pocket expenses that were reimbursed in the current period. The amount of the reimbursement was immaterial on a per share basis and did not impact the total return of Class IS shares. The Ratio of Expenses to Average Net Assets would have been 0.01% higher and the Ratio of Net Investment Income to Average Net Assets would have been 0.01% lower had the custodian not reimbursed the Portfolio.
(2) Commencement of Offering.
(3) Per share amount is based on average shares outstanding.
(4) Calculated based on the net asset value as of the last business day of the period.
(5) The Ratios of Expenses and Net Investment Income reflect the rebate of certain Portfolio expenses in connection with the investments in Morgan Stanley affiliates during the period. The effect of the rebate on the ratios is disclosed in the above table as "Ratio of Rebate from Morgan Stanley Affiliates to Average Net Assets."
(6) Effective September 16, 2013, the Adviser has agreed to limit the ratio of expenses to average net assets to the maximum ratio of 0.99% for Class IS shares.
(7) Amount is less than 0.005%.
(8) Not Annualized.
(9) Annualized.
The accompanying notes are an integral part of the financial statements.
20
Morgan Stanley Institutional Fund, Inc.
Annual Report — December 31, 2016
Notes to Financial Statements
Morgan Stanley Institutional Fund, Inc. (the "Fund") is registered under the Investment Company Act of 1940, as amended (the "Act"), as an open-end management investment company. The Fund is comprised of twenty-nine separate, active, diversified and non-diversified portfolios (individually referred to as a "Portfolio", collectively as the "Portfolios"). The Fund applies investment company accounting and reporting guidance.
The accompanying financial statements relate to the Global Real Estate Portfolio. The Portfolio seeks to provide current income and capital appreciation. The Portfolio has capital subscription commitments to an investee company for this same purpose, the details of which are disclosed in the Unfunded Commitments note.
The Portfolio offers five classes of shares — Class I, Class A, Class L, Class C and Class IS. On April 30, 2015, the Portfolio suspended offering of Class L shares. Existing Class L shareholders may invest through reinvestment of dividends and distributions.
A. Significant Accounting Policies: The following significant accounting policies are in conformity with U.S. generally accepted accounting principles ("GAAP"). Such policies are consistently followed by the Fund in the preparation of its financial statements. GAAP may require management to make estimates and assumptions that affect the reported amounts and disclosures in the financial statements. Actual results may differ from those estimates.
1. Security Valuation: (1) An equity portfolio security listed or traded on an exchange is valued at its latest reported sales price (or at the exchange official closing price if such exchange reports an official closing price), and if there were no sales on a given day and if there is no official exchange closing price for that day, the security is valued at the mean between the last reported bid and asked prices if such bid and asked prices are available on the relevant exchanges; (2) all other equity portfolio securities for which over-the-counter ("OTC") market quotations are readily available are valued at the latest reported sales price (or at the market official closing price if such market reports an official closing price), and if there was no trading in the security on a given day and if there is no official closing price from relevant markets for that day, the security is valued at the mean between the last reported bid and asked prices if such bid and asked prices are available on the relevant markets. Listed equity securities not traded on the valuation date with no reported bid and asked
prices available on the exchange are valued at the mean between the current bid and asked prices obtained from one or more reputable brokers or dealers. An unlisted equity security that does not trade on the valuation date and for which bid and asked prices from the relevant markets are unavailable is valued at the mean between the current bid and asked prices obtained from one or more reputable brokers or dealers. In cases where a security is traded on more than one exchange, the security is valued on the exchange designated as the primary market; (3) certain portfolio securities may be valued by an outside pricing service/vendor approved by the Fund's Board of Directors (the "Directors"). The pricing service/vendor may employ a pricing model that takes into account, among other things, bids, yield spreads, and/or other market data and specific security characteristics. Alternatively, if a valuation is not available from an outside pricing service/vendor, and the security trades on an exchange, the security may be valued at its latest reported sale price (or at the exchange official closing price if such exchange reports an official closing price), prior to the time when assets are valued. If there are no sales on a given day and if there is no official exchange closing price for that day, the security is valued at the mean between the last reported bid and asked prices if such bid and asked prices are available in the relevant exchanges; (4) when market quotations are not readily available, including circumstances under which Morgan Stanley Investment Management Inc. (the "Adviser") or Morgan Stanley Investment Management Limited ("MSIM Limited") and Morgan Stanley Investment Management Company ("MSIM Company") (together, the "Sub-Advisers"), each a whole owned subsidiary of Morgan Stanley. determine that the closing price, last sale price or the mean between the last reported bid and asked prices are not reflective of a security's market value, portfolio securities are valued at their fair value as determined in good faith under procedures established by and under the general supervision of the Directors. Occasionally, developments affecting the closing prices of securities and other assets may occur between the times at which valuations of such securities are determined (that is, close of the foreign market on which the securities trade) and the close of business of the New York Stock Exchange ("NYSE"). If developments occur during such periods that are expected to materially affect the value of such securities, such valuations may be adjusted to reflect the estimated fair value of such securities as of the close of the
21
Morgan Stanley Institutional Fund, Inc.
Annual Report — December 31, 2016
Notes to Financial Statements (cont'd)
NYSE, as determined in good faith by the Directors or by the Adviser using a pricing service and/or procedures approved by the Directors; (5) quotations of foreign portfolio securities, other assets and liabilities and forward contracts stated in foreign currency are translated into U.S. dollar equivalents at the prevailing market rates prior to the close of the NYSE; and (6) investments in mutual funds, including the Morgan Stanley Institutional Liquidity Funds, are valued at the net asset value ("NAV") as of the close of each business day.
The Directors have responsibility for determining in good faith the fair value of the investments, and the Directors may appoint others, such as the Fund's Adviser or a valuation committee, to assist the Directors in determining fair value and to make the actual calculations pursuant to the fair valuation methodologies previously approved by the Directors. Under procedures approved by the Directors, the Fund's Adviser has formed a Valuation Committee whose members are approved by the Directors. The Valuation Committee provides administration and oversight of the Fund's valuation policies and procedures, which are reviewed at least annually by the Directors. These procedures allow the Fund to utilize independent pricing services, quotations from securities and financial instrument dealers, and other market sources to determine fair value.
The Fund has procedures to determine the fair value of securities and other financial instruments for which market prices are not readily available. Under these procedures, the Valuation Committee convenes on a regular and ad hoc basis to review such securities and considers a number of factors, including valuation methodologies and significant unobservable valuation inputs, when arriving at fair value. The Valuation Committee may employ a market-based approach which may use related or comparable assets or liabilities, recent transactions, market multiples, book values, and other relevant information for the investment to determine the fair value of the investment. An income-based valuation approach may also be used in which the anticipated future cash flows of the investment are discounted to calculate fair value. Discounts may also be applied due to the nature or duration of any restrictions on the disposition of the investments. Due to the inherent uncertainty of valuations of such investments, the fair values may differ significantly from the values that would have been used had an active market existed. The
Valuation Committee employs various methods for calibrating these valuation approaches including a regular review of valuation methodologies, key inputs and assumptions, transactional back-testing or disposition analysis, and reviews of any related market activity.
The Portfolio invests a significant portion of its assets in securities of real estate investment trusts ("REITs"). The market's perception of prospective declines in private real estate values and other financial assets may result in increased volatility of market prices that can negatively impact the valuation of certain issuers held by the Portfolio.
2. Fair Value Measurement: Financial Accounting Standards Board ("FASB") Accounting Standards CodificationTM ("ASC") 820, "Fair Value Measurement" ("ASC 820"), defines fair value as the value that the Fund would receive to sell an investment or pay to transfer a liability in a timely transaction with an independent buyer in the principal market, or in the absence of a principal market, the most advantageous market for the investment or liability. ASC 820 establishes a three-tier hierarchy to distinguish between (1) inputs that reflect the assumptions market participants would use in valuing an asset or liability developed based on market data obtained from sources independent of the reporting entity (observable inputs) and (2) inputs that reflect the reporting entity's own assumptions about the assumptions market participants would use in valuing an asset or liability developed based on the best information available in the circumstances (unobservable inputs) and to establish classification of fair value measurements for disclosure purposes. Various inputs are used in determining the value of the Fund's investments. The inputs are summarized in the three broad levels listed below.
• Level 1 – unadjusted quoted prices in active markets for identical investments
• Level 2 – other significant observable inputs (including quoted prices for similar investments, interest rates, prepayment speeds, credit risk, etc.)
• Level 3 – significant unobservable inputs including the Fund's own assumptions in determining the fair value of investments. Factors considered in making this determination may include, but are not limited to, information obtained by contacting the issuer, analysts, or the appropriate stock exchange (for
22
Morgan Stanley Institutional Fund, Inc.
Annual Report — December 31, 2016
Notes to Financial Statements (cont'd)
exchange-traded securities), analysis of the issuer's financial statements or other available documents and, if necessary, available information concerning other securities in similar circumstances
The inputs or methodology used for valuing securities are not necessarily an indication of the risk associated with investing in those securities and the determination of the significance of a particular input to the fair value measurement in its entirety requires judgment and considers factors specific to each security.
The following is a summary of the inputs used to value the Portfolio's investments as of December 31, 2016.
Investment Type | | Level 1
Unadjusted
quoted
prices
(000) | | Level 2
Other
significant
observable
inputs
(000) | | Level 3
Significant
unobservable
inputs
(000) | | Total
(000) | |
Assets: | |
Common Stocks | |
Diversified | | $ | 522,789 | | | $ | — | | | $ | 413 | | | $ | 523,202 | | |
Health Care | | | 85,815 | | | | — | | | | — | | | | 85,815 | | |
Industrial | | | 63,690 | | | | — | | | | 539 | | | | 64,229 | | |
Lodging/Resorts | | | 86,229 | | | | — | | | | — | | | | 86,229 | | |
Mixed Industrial/Office | | | 20,017 | | | | — | | | | — | | | | 20,017 | | |
Office | | | 239,487 | | | | — | | | | — | | | | 239,487 | | |
Residential | | | 247,307 | | | | — | | | | — | | | | 247,307 | | |
Retail | | | 457,160 | | | | — | | | | — | | | | 457,160 | | |
Self Storage | | | 74,999 | | | | — | | | | — | | | | 74,999 | | |
Total Common Stocks | | | 1,797,493 | | | | — | | | | 952 | | | | 1,798,445 | | |
Short-Term
Investment | |
Investment Company | | | 5,762 | | | | — | | | | — | | | | 5,762 | | |
Total Assets | | $ | 1,803,255 | | | $ | — | | | $ | 952 | | | $ | 1,804,207 | | |
Transfers between investment levels may occur as the markets fluctuate and/or the availability of data used in an investment's valuation changes. The Portfolio recognizes transfers between the levels as of the end of the period. As of December 31, 2016, securities with a total value of approximately $723,363,000 transferred from Level 2 to Level 1. Securities that were valued using other significant observable inputs at December 31, 2015 were valued using unadjusted quoted prices at December 31, 2016. At December 31, 2015, the fair value of certain securities were adjusted due to developments which occurred between the time of the close of the foreign markets on which they trade and the close of business on the NYSE which resulted in their Level 2 classification.
Following is a reconciliation of investments in which significant unobservable inputs (Level 3) were used in determining fair value.
| | | Common
Stocks
(000) | |
| Beginning Balance $603 | | | † | | |
Purchases | | | 22 | | |
Sales | | | — | | |
Amortization of discount | | | — | | |
Transfers in | | | — | | |
Transfers out | | | — | | |
Corporate actions | | | (52 | ) | |
Change in unrealized appreciation (depreciation) | | | 379 | | |
Realized gains (losses) | | | — | | |
Ending Balance | | $ | 952 | | |
Net change in unrealized appreciation (depreciation) from investments
still held as of December 31, 2016 | | $ | 379 | | |
† Includes one security which is valued at zero.
The following table presents additional information about valuation techniques and inputs used for investments that are measured at fair value and categorized within Level 3 as of December 31, 2016.
| | Fair Value at
December 31, 2016
(000) | | Valuation
Technique | | Unobservable
Input | | Range | | Selected
Value | | Impact to
Valuation from an
Increase in Input | |
Diversified | |
Common Stock | | $ | 413 | | | Market Transaction
Method | | Transaction Valuation | | $ | 0.03 | | | $ | 0.03 | | | $ | 0.03 | | | Increase | |
| | | | | | Discount for Lack of
Marketability | | | 50.0 | % | | | 50.0 | % | | | 50.0 | % | | Decrease | |
Industrial | |
Common Stock | | $ | 539 | | | Reported Capital Balance,
Adjusted for Subsequent
Capital Calls, Return of
Capital and Significant
Market Changes between
last Capital Statement and
Valuation Date | | Adjusted Capital
Balance | | | | | | | | | |
23
Morgan Stanley Institutional Fund, Inc.
Annual Report — December 31, 2016
Notes to Financial Statements (cont'd)
3. Foreign Currency Translation and Foreign Investments: The books and records of the Portfolio are maintained in U.S. dollars. Foreign currency amounts are translated into U.S. dollars as follows:
– investments, other assets and liabilities at the prevailing rate of exchange on the valuation date;
– investment transactions and investment income at the prevailing rates of exchange on the dates of such transactions.
Although the net assets of the Portfolio are presented at the foreign exchange rates and market values at the close of the period, the Portfolio does not isolate that portion of the results of operations arising as a result of changes in the foreign exchange rates from the fluctuations arising from changes in the market prices of securities held at period end. Similarly, the Portfolio does not isolate the effect of changes in foreign exchange rates from the fluctuations arising from changes in the market prices of securities sold during the period. Accordingly, realized and unrealized foreign currency gains (losses) on investments in securities are included in the reported net realized and unrealized gains (losses) on investment transactions and balances. However, pursuant to U.S. federal income tax regulations, gains and losses from certain foreign currency transactions and the foreign currency portion of gains and losses realized on sales and maturities of foreign denominated debt securities are treated as ordinary income for U.S. federal income tax purposes.
Net realized gains (losses) on foreign currency transactions represent net foreign exchange gains (losses) from foreign currency forward exchange contracts, disposition of foreign currencies, currency gains (losses) realized between the trade and settlement dates on securities transactions, and the difference between the amount of investment income and foreign withholding taxes recorded on the Portfolio's books and the U.S. dollar equivalent amounts actually received or paid. Net unrealized currency gains (losses) from valuing foreign currency denominated assets and liabilities at period end exchange rates are reflected as a component of unrealized appreciation (depreciation) in the Statement of Assets and Liabilities. The change in unrealized currency gains (losses) on foreign currency translations for the period is reflected in the Statement of Operations.
Foreign security and currency transactions may involve certain considerations and risks not typically associated with those of U.S. dollar denominated transactions as a result of, among other factors, fluctuations of exchange rates in relation to the U.S. dollar, the possibility of lower levels of governmental supervision and regulation of foreign securities markets and the possibility of political or economic instability.
Governmental approval for foreign investments may be required in advance of making an investment under certain circumstances in some countries, and the extent of foreign investments in domestic companies may be subject to limitation in other countries. Foreign ownership limitations also may be imposed by the charters of individual companies to prevent, among other concerns, violations of foreign investment limitations. As a result, an additional class of shares (identified as "Foreign" in the Portfolio of Investments) may be created and offered for investment. The "local" and "foreign shares" market values may differ. In the absence of trading of the foreign shares in such markets, the Portfolio values the foreign shares at the closing exchange price of the local shares.
4. Unfunded Commitments: Subject to the terms of a Subscription Agreement between the Portfolio and Exeter Industrial Value Fund LP, the Portfolio has made a subscription commitment of $2,000,000 for which it will receive 2,000,000 shares of common stock. As of December 31, 2016, Exeter Industrial Value Fund LP has drawn down approximately $1,860,000 which represents 93.0% of the commitment.
5. Restricted Securities: The Portfolio invests in unregistered or otherwise restricted securities. The term "restricted securities" refers to securities that are unregistered or are held by control persons of the issuer and securities that are subject to contractual restrictions on their resale. As a result, restricted securities may be more difficult to value and the Portfolio may have difficulty disposing of such assets either in a timely manner or for a reasonable price. In order to dispose of an unregistered security, the Portfolio, where it has contractual rights to do so, may have to cause such security to be registered. A considerable period may elapse between the time the decision is made to sell the security and the time the security is registered so that the Portfolio could sell it. Contractual restrictions on the resale of securities vary in length and scope and are
24
Morgan Stanley Institutional Fund, Inc.
Annual Report — December 31, 2016
Notes to Financial Statements (cont'd)
generally the result of a negotiation between the issuer and acquirer of the securities. The Portfolio would, in either case, bear market risks during that period. Restricted securities are identified in the Portfolio of Investments.
6. Indemnifications: The Fund enters into contracts that contain a variety of indemnifications. The Fund's maximum exposure under these arrangements is unknown. However, the Fund has not had prior claims or losses pursuant to these contracts and expects the risk of loss to be remote.
7. Dividends and Distributions to Shareholders: Dividend income and distributions to shareholders are recorded on the ex-dividend date. Dividends from net investment income, if any, are declared and paid annually. Net realized capital gains, if any, are distributed at least annually.
8. Security Transactions, Income and Expenses: Security transactions are accounted for on the trade date (date the order to buy or sell is executed). Realized gains and losses on the sale of investment securities are determined on the specific identified cost method. Dividend income and other distributions are recorded on the ex-dividend date (except for certain foreign dividends which may be recorded as soon as the Portfolio is informed of such dividends) net of applicable withholding taxes. Interest income is recognized on the accrual basis except where collection is in doubt. Discounts are accreted and premiums are amortized over the life of the respective securities. Most expenses of the Fund can be directly attributed to a particular Portfolio. Expenses which cannot be directly attributed are apportioned among the Portfolios based upon relative net assets or other appropriate methods. Income, expenses (other than class specific expenses — distribution and shareholder services, transfer agency and sub transfer agency fees) and realized and unrealized gains or losses are allocated to each class of shares based upon their relative net assets.
The Portfolio owns shares of REITs which report information on the source of their distributions annually in the following calendar year. A portion of distributions received from REITs during the year is estimated to be a return of capital and is recorded as a reduction of their cost.
B. Advisory/Sub-Advisory Fees: The Adviser, a wholly-owned subsidiary of Morgan Stanley, provides the Portfolio with advisory services under the terms of an Investment
Advisory Agreement, paid quarterly, at the annual rate based on the daily net assets as follows:
First $2.5
billion | | Over $2.5
billion | |
| | 0.85 | % | | | 0.80 | % | |
Effective July 1, 2016, the Portfolio's annual rate based on the daily net assets was reduced and is as follows:
First $2
billion | | Over $2
billion | |
| | 0.85 | % | | | 0.80 | % | |
For the year ended December 31, 2016, the advisory fee rate (net of rebate) was equivalent to an annual effective rate of 0.85% of the Portfolio's average daily net assets.
The Adviser has agreed to reduce its advisory fee and/or reimburse the Portfolio so that total annual portfolio operating expenses, excluding certain investment related expenses, taxes, interest and other extraordinary expenses (including litigation), will not exceed 1.05% for Class I shares, 1.40% for Class A shares, 1.90% for Class L shares, 2.15% for Class C shares and 0.99% for Class IS shares. The fee waivers and/or expense reimbursements will continue for at least one year from the date of the Portfolio's prospectus or until such time that the Directors act to discontinue all or a portion of such waivers or reimbursements when they deem such action is appropriate. For the year ended December 31, 2016, approximately $2,000 of other expenses were reimbursed by the Adviser pursuant to this arrangement.
The Adviser has entered into a Sub-Advisory Agreement with the Sub-Advisers, each a wholly-owned subsidiary of Morgan Stanley. The Sub-Advisers provide the Portfolio with advisory services subject to the overall supervision of the Adviser and the Fund's Officers and Directors. The Adviser pays the Sub-Advisers on a monthly basis a portion of the net advisory fees the Adviser receives from the Portfolio.
C. Administration Fees: The Adviser also serves as Administrator to the Fund and provides administrative services pursuant to an Administration Agreement for an annual fee, accrued daily and paid monthly, of 0.08% of the Portfolio's average daily net assets.
Under a Sub-Administration Agreement between the Administrator and State Street Bank and Trust Company ("State Street"), State Street provides certain administrative services to the Fund. For such services, the Administrator pays State Street a portion of the fee the Administrator receives from the Portfolio.
25
Morgan Stanley Institutional Fund, Inc.
Annual Report — December 31, 2016
Notes to Financial Statements (cont'd)
D. Distribution and Shareholder Services Fees: Morgan Stanley Distribution, Inc. ("MSDI" or the "Distributor"), a wholly-owned subsidiary of the Adviser and Sub-Advisers and an indirect subsidiary of Morgan Stanley, serves as the Fund's Distributor of Portfolio shares pursuant to a Distribution Agreement. The Fund has adopted a Shareholder Services Plan with respect to Class A shares pursuant to Rule 12b-1 under the Act. Under the Shareholder Services Plan, the Portfolio pays the Distributor a shareholder services fee, accrued daily and paid monthly, at an annual rate of 0.25% of the Portfolio's average daily net assets attributable to Class A shares.
The Fund has adopted a Distribution and Shareholder Services Plan with respect to Class L shares pursuant to Rule 12b-1 under the Act. Under the Distribution and Shareholder Services Plan, the Portfolio pays the Distributor a distribution fee, accrued daily and paid monthly, at an annual rate of 0.50% and a shareholder services fee, accrued daily and paid monthly, at an annual rate of 0.25% of the Portfolio's average daily net assets attributable to Class L shares.
The Fund has adopted a Distribution and Shareholder Services Plan with respect to Class C shares pursuant to Rule 12b-1 under the Act. Under the Distribution and Shareholder Services Plan, the Portfolio pays the Distributor a distribution fee, accrued daily and paid monthly, at an annual rate of 0.75% and a shareholder services fee, accrued daily and paid monthly, at an annual rate of 0.25% of the Portfolio's average daily net assets attributable to Class C shares.
The distribution and shareholder services fees are used to support the expenses associated with servicing and maintaining accounts. The Distributor may compensate other parties for providing shareholder support services to investors who purchase Class A, Class L and Class C shares.
E. Dividend Disbursing and Transfer Agent: The Fund's dividend disbursing and transfer agent is Boston Financial Data Services, Inc. ("BFDS"). Pursuant to a Transfer Agency Agreement, the Fund pays BFDS a fee based on the number of classes, accounts and transactions relating to the Portfolios of the Fund.
F. Custodian Fees: State Street (the "Custodian") serves as Custodian for the Fund in accordance with a Custodian Agreement. The Custodian holds cash, securities, and other assets of the Fund as required by the Act. Custody fees are payable monthly based on assets held in custody, investment purchases
and sales activity and account maintenance fees, plus reimbursement for certain out-of-pocket expenses.
In December 2015, the Fund's Custodian announced that it had identified inconsistencies in the way in which clients were invoiced for out-of-pocket expenses from 1998 until November 2015. The dollar amount difference between what was charged and what should have been charged, plus interest, was paid back to the Portfolio in September 2016 as a reimbursement. The Custodian reimbursed the Portfolio directly, which was recognized as a change in accounting estimate and was reflected as "Reimbursement of Custodian Fees" in the Statement of Operations. Pursuant to the expense limitations described in Note B, the Portfolio has experienced expenses reimbursed by the Adviser during the current period. Accordingly, the reimbursement of out-of-pocket custodian expenses in the current period resulted in the reduction in the current period expenses reimbursed by the Adviser.
G. Security Transactions and Transactions with Affiliates: For the year ended December 31, 2016, purchases and sales of investment securities for the Portfolio, other than long-term U.S. Government securities and short-term investments, were approximately $550,371,000 and $1,037,514,000, respectively. There were no purchases and sales of long-term U.S. Government securities for the year ended December 31, 2016.
The Portfolio invests in the Institutional Class of the Morgan Stanley Institutional Liquidity Funds — Treasury Portfolio (the "Liquidity Funds"), an open-end management investment company managed by the Adviser. Advisory fees paid by the Portfolio are reduced by an amount equal to its pro-rata share of the advisory and administration fees paid by the Portfolio due to its investment in the Liquidity Funds. For the year ended December 31, 2016, advisory fees paid were reduced by approximately $59,000 relating to the Portfolio's investment in the Liquidity Funds.
A summary of the Portfolio's transactions in shares of the Liquidity Funds during the year ended December 31, 2016 is as follows:
Value
December 31,
2015
(000) | | Purchases
at Cost
(000) | | Sales
(000) | | Dividend
Income
(000) | | Value
December 31,
2016
(000) | |
| $ | 24,444 | | | $ | 406,763 | | | $ | 425,445 | | | $ | 78 | | | $ | 5,762 | | |
The Portfolio is permitted to purchase and sell securities ("cross-trade") from and to other Morgan Stanley Funds as well as other
26
Morgan Stanley Institutional Fund, Inc.
Annual Report — December 31, 2016
Notes to Financial Statements (cont'd)
funds and client accounts for which the Adviser or an affiliate of the Adviser serves as investment adviser, pursuant to procedures approved by the Directors in compliance with Rule 17a-7 under the Act (the "Rule"). Each cross-trade is executed at the current market price in compliance with provisions of the Rule. For the year ended December 31, 2016, the Portfolio engaged in cross-trade sales of approximately $220,000 which resulted in net realized losses of approximately $9,000.
The Portfolio has an unfunded Deferred Compensation Plan (the "Compensation Plan"), which allows each independent Director to defer payment of all, or a portion, of the fees he or she receives for serving on the Board of Directors. Each eligible Director generally may elect to have the deferred amounts credited with a return equal to the total return on one or more of the Morgan Stanley funds that are offered as investment options under the Compensation Plan. Appreciation/depreciation and distributions received from these investments are recorded with an offsetting increase/decrease in the deferred compensation obligation and do not affect the NAV of the Portfolio.
H. Federal Income Taxes: It is the Portfolio's intention to continue to qualify as a regulated investment company and distribute all of its taxable and tax-exempt income. Accordingly, no provision for federal income taxes is required in the financial statements.
The Portfolio may be subject to taxes imposed by countries in which it invests. Such taxes are generally based on income and/or capital gains earned or repatriated. Taxes are accrued based on net investment income, net realized gains and net unrealized appreciation as such income and/or gains are earned. Taxes may also be based on transactions in foreign currency and are accrued based on the value of investments denominated in such currency.
FASB ASC 740-10, "Income Taxes — Overall", sets forth a minimum threshold for financial statement recognition of the benefit of a tax position taken or expected to be taken in a tax return. Management has concluded that there are no significant uncertain tax positions that would require recognition in the financial statements. If applicable, the Portfolio recognizes interest accrued related to unrecognized tax benefits in "Interest Expense" and penalties in "Other Expenses" in the Statement of Operations. The Portfolio files tax returns with the U.S. Internal Revenue Service, New York and various states. Generally, each of the tax years in the four-year period ended December 31, 2016, remains subject to examination by taxing authorities.
The tax character of distributions paid may differ from the character of distributions shown in the Statements of Changes
in Net Assets due to short-term capital gains being treated as ordinary income for tax purposes. The tax character of distributions paid during fiscal years 2016 and 2015 was as follows:
2016
Distributions
Paid From: | | 2015
Distributions
Paid From: | |
Ordinary
Income
(000) | | Long-Term
Capital Gain
(000) | | Paid-in-
Capital
(000) | | Ordinary
Income
(000) | | Long-Term
Capital Gain
(000) | |
| $ | 58,027 | | | $ | 7,165 | | | $ | 2,808 | | | $ | 42,001 | | | $ | — | | |
The amount and character of income and gains to be distributed are determined in accordance with income tax regulations which may differ from GAAP. These book/tax differences are either considered temporary or permanent in nature.
Temporary differences are primarily due to differing book and tax treatments in the timing of the recognition of gains (losses) on certain investment transactions and the timing of the deductibility of certain expenses.
Permanent differences, primarily due to differing treatments of gains (losses) related to foreign currency transactions, REIT adjustments and basis adjustments on certain equity securities designated as passive foreign investment companies, resulted in the following reclassifications among the components of net assets at December 31, 2016:
Distributions
in Excess of Net
Investment
Income
(000) | | Distributions
in Excess of
Net Realized
Gain
(000) | | Paid-in-
Capital
(000) | |
| $ | 6,124 | | | $ | (6,122 | ) | | $ | (2 | ) | |
At December 31, 2016, the Portfolio had no distributable earnings on a tax basis.
During the year ended December 31, 2016, the Portfolio utilized capital loss carryforwards for U.S. federal income tax purposes of approximately $5,549,000.
Qualified late year losses are capital losses and specified ordinary losses, including currency losses, incurred after October 31 but within the taxable year that, if elected, are deemed to arise on the first day of the Portfolio's next taxable year. For the year ended December 31, 2016, the Portfolio deferred to January 1, 2017 for U.S. federal income tax purposes the following losses:
Qualified
Late Year
Ordinary
Losses
(000) | | Post-October
Capital Losses
(000) | |
| $ | 4,815 | | | $ | — | | |
27
Morgan Stanley Institutional Fund, Inc.
Annual Report — December 31, 2016
Notes to Financial Statements (cont'd)
I. Credit Facility: As of April 4, 2016, the Fund and other Morgan Stanley funds participated in a $150,000,000 committed, unsecured revolving line of credit facility (the "facility") with State Street. This facility is to be used for temporary emergency purposes or funding of shareholder redemption requests. The interest rate on borrowings is based on the federal funds rate or one month libor rate plus a spread. The facility also has a commitment fee of 0.25% per annum based on the unused portion of the facility. During the year ended December 31, 2016, the Portfolio did not have any borrowings under the facility.
J. Other: At December 31, 2016, the Portfolio did not have record owners of 10% or greater.
K. Accounting Pronouncements: In December 2016, FASB issued Accounting Standards update 2016-19 — Technical Corrections and Improvements ("ASU 2016-19"), which is effective for interim periods for all entities beginning after December 15, 2016. ASU 2016-19 includes an amendment to Topic 820, Fair Value Measurement, which clarifies the difference between a valuation approach and a valuation technique when applying the guidance in that Topic. That amendment also requires an entity to disclose when there has been a change in either or both a valuation approach and/or a valuation technique. The transition guidance for the amendment must be applied prospectively because it could potentially involve the use of hindsight that includes fair value measurements. Although still evaluating the potential impacts of ASU 2016-19 to the Portfolio, management expects that the impact of the Portfolio's adoption will be limited to additional financial statement disclosures.
In October 2016, the Securities and Exchange Commission ("SEC") issued a new rule, Investment Company Reporting Modernization, which, among other provisions, amends Regulation S-X to require standardized, enhanced disclosures, particularly related to derivatives, in investment company financial statements. Compliance with the guidance is effective for financial statements filed with the SEC on or after August 1, 2017; adoption will have no effect on the Portfolio's net assets or results of operations. Although still evaluating the potential impacts of the Investment Company Reporting Modernization to the Portfolio, management expects that the impact of the Portfolio's adoption will be limited to additional financial statement disclosures.
28
Morgan Stanley Institutional Fund, Inc.
Annual Report — December 31, 2016
Report of Independent Registered Public Accounting Firm
To the Shareholders and Board of Directors of
Morgan Stanley Institutional Fund, Inc. —
Global Real Estate Portfolio
We have audited the accompanying statement of assets and liabilities, including the portfolio of investments, of Global Real Estate Portfolio (one of the portfolios constituting Morgan Stanley Institutional Fund, Inc.) (the "Portfolio") as of December 31, 2016, and the related statement of operations for the year then ended, the statements of changes in net assets for each of the two years in the period then ended and the financial highlights for each of the years or periods indicated therein. These financial statements and financial highlights are the responsibility of the Portfolio's management. Our responsibility is to express an opinion on these financial statements and financial highlights based on our audits.
We conducted our audits in accordance with the standards of the Public Company Accounting Oversight Board (United States). Those standards require that we plan and perform the audit to obtain reasonable assurance about whether the financial statements and financial highlights are free of material misstatement. We were not engaged to perform an audit of the Portfolio's internal control over financial reporting. Our audits included consideration of internal control over financial reporting as a basis for designing audit procedures that are appropriate in the circumstances, but not for the purpose of expressing an opinion on the effectiveness of the Portfolio's internal control over financial reporting. Accordingly, we express no such opinion. An audit also includes examining, on a test basis, evidence supporting the amounts and disclosures in the financial statements and financial highlights, assessing the accounting principles used and significant estimates made by management, and evaluating the overall financial statement presentation. Our procedures included confirmation of securities owned as of December 31, 2016, by correspondence with the custodian and others or by other appropriate auditing procedures where replies from others were not received. We believe that our audits provide a reasonable basis for our opinion.
In our opinion, the financial statements and financial highlights referred to above present fairly, in all material respects, the financial position of Global Real Estate Portfolio (one of the portfolios constituting Morgan Stanley Institutional Fund, Inc.) at December 31, 2016, the results of its operations for the year then ended, the changes in its net assets for each of the two years in the period then ended and the financial highlights for each of the years or periods indicated therein, in conformity with U.S. generally accepted accounting principles.

Boston, Massachusetts
February 28, 2017
29
Morgan Stanley Institutional Fund, Inc.
Annual Report — December 31, 2016
Federal Tax Notice (unaudited)
For federal income tax purposes, the following information is furnished with respect to the distributions paid by the Portfolio during its taxable year ended December 31, 2016. For corporate shareholders, 0.5% of the dividends qualified for the dividends received deduction.
The Portfolio designated and paid approximately $7,165,000 as a long-term capital gain distribution.
For federal income tax purposes, the following information is furnished with respect to the Portfolio's earnings for its taxable year ended December 31, 2016. When distributed, certain earnings may be subject to a maximum tax rate of 15% as provided for the Jobs and Growth Tax Relief Reconciliation Act of 2003. The Portfolio designated up to a maximum of approximately $14,100,000 as taxable at this lower rate.
In January, the Portfolio provides tax information to shareholders for the preceding calendar year.
30
Morgan Stanley Institutional Fund, Inc.
Annual Report — December 31, 2016
Privacy Notice (unaudited)
MORGAN STANLEY INVESTMENT MANAGEMENT INC.
AN IMPORTANT NOTICE CONCERNING OUR U.S. PRIVACY POLICY
We are required by federal law to provide you with a copy of our privacy policy annually. This policy applies to current and former individual investors in funds managed or sponsored by Morgan Stanley Investment Management Inc. ("MSIM") as well as current and former individual clients of MSIM. This policy is not applicable to partnerships, corporations, trusts or other non-individual clients or investors. Please note that we may amend this policy at any time, and will inform you of any changes as required by law.
WE RESPECT YOUR PRIVACY
We appreciate that you have provided us with your personal financial information. We strive to maintain the privacy of such information while we help you achieve your financial objectives. This Notice describes what non-public personal information we collect about you, why we collect it, when we may share it with others and how certain others may use it. It discusses the steps you may take to limit our sharing of certain information about you to affiliated companies in the Morgan Stanley family of companies ("other Morgan Stanley companies"). It also discloses how you may limit use of certain shared information for marketing purposes by other Morgan Stanley branded companies. Throughout this policy, we refer to the non-public information that personally identifies you or your accounts as "personal information."
1. WHAT PERSONAL INFORMATION DO WE COLLECT ABOUT YOU?
We obtain personal information from applications and other forms you submit to us, from your dealings with us, from consumer reporting agencies, from our Web sites and from third parties and other sources.
For example:
• We may collect information such as your name, address, e-mail address, telephone/fax numbers, assets, income and investment objectives through subscription documents, applications and other forms you submit to us.
• We may obtain information about account balances, your use of account(s) and the types of products and services you prefer to receive from us through your dealings and transactions with us and other sources.
• We may obtain information about your creditworthiness and credit history from consumer reporting agencies.
• We may collect background information from and through third-party vendors to verify representations you have made and to comply with various regulatory requirements.
• If you interact with us through our public and private Web sites, we may collect information that you provide directly through online communications (such as an e-mail address). We may also collect information about your Internet service provider, your domain name, your computer's operating system and Web browser, your use of our Web sites and your product and service preferences, through the use of "cookies." Please consult the Terms of Use of these sites for more details.
2. WHEN DO WE DISCLOSE PERSONAL INFORMATION WE COLLECT ABOUT YOU?
We may disclose personal information we collect about you to other Morgan Stanley companies and to non-affiliated third parties.
a. Information We Disclose to Other Morgan Stanley Companies.
We may disclose personal information to other Morgan Stanley companies for a variety of reasons, including to manage your account(s) effectively, to service and process your transactions, to let you know about products and services offered by us and other Morgan Stanley companies, to manage our business, and as otherwise required or permitted by law. Offers for products and services from other Morgan Stanley companies are developed under conditions designed to safeguard your personal information.
31
Morgan Stanley Institutional Fund, Inc.
Annual Report — December 31, 2016
Privacy Notice (unaudited) (cont'd)
b. Information We Disclose to Non-affiliated Third Parties.
We do not disclose personal information that we collect about you to non-affiliated third parties except to those who provide marketing services on our behalf, to financial institutions with whom we have joint marketing agreements, and as otherwise required or permitted by law. For example, we may disclose personal information to nonaffiliated third parties for servicing and processing transactions, to offer our own products and services, to protect against fraud, for institutional risk control, to respond to judicial process or to perform services on our behalf. When we share personal information with a non-affiliated third party, they are required to limit their use of personal information to the particular purpose for which it was shared and they are not allowed to share personal information with others except to fulfill that limited purpose or as may be permitted or required by law.
3. HOW DO WE PROTECT THE SECURITY AND CONFIDENTIALITY OF PERSONAL INFORMATION WE COLLECT ABOUT YOU?
We maintain physical, electronic and procedural security measures to help safeguard the personal information we collect about you. We have internal policies governing the proper handling of client information. Third parties that provide support or marketing services on our behalf may also receive personal information, and we require them to adhere to confidentiality standards with respect to such information.
4. HOW CAN YOU LIMIT THE SHARING OF CERTAIN TYPES OF PERSONAL INFORMATION WITH OTHER MORGAN STANLEY COMPANIES?
We offer you choices as to whether we share with other Morgan Stanley companies the personal information that was collected to determine your eligibility for products and services you request ("eligibility information"). Eligibility information does not include your identification information or personal information pertaining to our transactions or experiences with you. Please note that, even if you direct us not to share eligibility information with other Morgan Stanley companies ("opt-out"), we may still share personal information, including eligibility information, with those companies in circumstances excluded from the opt-out under applicable law, such as to process transactions or to service your account.
5. HOW CAN YOU LIMIT THE USE OF CERTAIN TYPES OF PERSONAL INFORMATION BY OTHER MORGAN STANLEY COMPANIES FOR MARKETING?
By following the opt-out instructions in Section 6 below, you may limit other Morgan Stanley branded companies from marketing their products or services to you based on personal information we disclose to them. This information may include, for example, your income and account history with us. Please note that, even if you choose to limit Other Morgan Stanley Companies from using personal information about you that we may share with them for marketing their products and services to you, Other Morgan Stanley Companies may use your personal information that they obtain from us to market to you in circumstances permitted by law, such as if the Other Morgan Stanley Company has its own relationship with you.
6. HOW CAN YOU SEND US AN OPT-OUT INSTRUCTION?
If you wish to limit our sharing of eligibility information about you with other Morgan Stanley companies or other Morgan Stanley companies' use of personal information for marketing purposes, as described in this notice, you may do so by:
• Calling us at (800) 548-7786
Monday–Friday between 8a.m. and 6p.m.(EST)
• Writing to us at the following address:
Boston Financial Data Services, Inc.
c/o Privacy Coordinator
P.O. Box 219804
Kansas City, Missouri 64121
32
Morgan Stanley Institutional Fund, Inc.
Annual Report — December 31, 2016
Privacy Notice (unaudited) (cont'd)
Your written request should include your name, address, telephone number and account number(s) to which the opt-out applies and whether you are opting out with respect to sharing of eligibility information (Section 4 above), or if information used for Marketing (Section 5 above) or both. Written opt-out requests should not be sent with any other correspondence. In order to process your request, we require that the request be provided by you directly and not through a third party.
Your opt-out preference will remain in effect with respect to this policy (as it may be amended) until you notify us otherwise. If you have a joint account, your direction for us not to share this information with other Morgan Stanley companies and for those other Morgan Stanley companies not to use your personal information for marketing will be applied to all account holders on that account. Please understand that if you limit our sharing or our affiliated companies' use of personal information, you and any joint account holder(s) may not receive information about Morgan Stanley products and services, including products or services that could help you manage your financial resources and achieve your investment objectives.
7. WHAT IF AN AFFILIATED COMPANY BECOMES A NON-AFFILIATED THIRD PARTY?
If, at any time in the future, an affiliated company becomes a non-affiliated third party, further disclosures of personal information made to the former affiliated company will be limited to those described in Section 2(b) above relating to non-affiliated third parties. If you elected under Section 6 to limit disclosures we make to affiliated companies, or use of personal information by affiliated companies, your election will not apply to use by any former affiliated company of your personal information in their possession once it becomes a non-affiliated third party.
SPECIAL NOTICE TO RESIDENTS OF VERMONT
The following section supplements our policy with respect to our individual clients who have a Vermont address and supersedes anything to the contrary in the above policy with respect to those clients only.
The state of Vermont requires financial institutions to obtain your consent prior to sharing personal information that they collect about you with affiliated companies and non-affiliated third parties other than in certain limited circumstances. Except as permitted by law, we will not share personal information we collect about you with non-affiliated third parties or other Morgan Stanley companies unless you provide us with your written consent to share such information ("opt-in").
If you wish to receive offers for investment products and services offered by or through other Morgan Stanley companies, please notify us in writing at the following address:
Boston Financial Data Services, Inc.
c/o Privacy Coordinator
P.O. Box 219804
Kansas City, Missouri 64121
Your authorization should include your name, address, telephone number and account number(s) to which the opt-in applies and should not be sent with any other correspondence. In order to process your authorization, we require that the authorization be provided by you directly and not through a third party.
SPECIAL NOTICE TO RESIDENTS OF CALIFORNIA
The following section supplements our policy with respect to our individual clients who have a California address and supersedes anything to the contrary in the above policy with respect to those clients only.
In response to a California law, if your account has a California home address, your personal information will not be disclosed to nonaffiliated third parties except as permitted by applicable California law, and we will limit sharing such information with our affiliates to comply with California privacy laws that apply to us.
33
Morgan Stanley Institutional Fund, Inc.
Annual Report — December 31, 2016
Director and Officer Information (unaudited)
Independent Directors:
Name, Age and Address of
Independent Director | | Position(s)
Held with
Registrant | | Length of Time
Served* | | Principal Occupation(s) During Past 5 Years
and Other Relevant Professional Experience | | Number of
Overseen by
Independent
Director** | | Portfolios in
Fund Complex
Other Directorships
Held by Independent
Director*** | |
Frank L. Bowman (72)
c/o Perkins Coie LLP
Counsel to the Independent
Directors
30 Rockefeller Plaza
New York, NY 10112 | | Director | | Since
August
2006 | | President, Strategic Decisions, LLC (consulting) (since February 2009); Director or Trustee of various Morgan Stanley Funds (since August 2006); Chairperson of the Compliance and Insurance Committee (since October 2015); formerly, Chairperson of the Insurance Sub-Committee of the Compliance and Insurance Committee (2007-2015); served as President and Chief Executive Officer of the Nuclear Energy Institute (policy organization) (February 2005-November 2008); retired as Admiral, U.S. Navy after serving over 38 years on active duty including 8 years as Director of the Naval Nuclear Propulsion Program in the Department of the Navy and the U.S. Department of Energy (1996-2004); served as Chief of Naval Personnel (July 1994-September 1996) and on the Joint Staff as Director of Political Military Affairs (June 1992-July 1994); knighted as Honorary Knight Commander of the Most Excellent Order of the British Empire; awarded the Officier de l'Orde National du Mérite by the French Government; elected to the National Academy of Engineering (2009). | | | 90 | | | Director of BP p.l.c.; Director of Naval and Nuclear Technologies LLP; Director Emeritus of the Armed Services YMCA; Director of the U.S. Naval Submarine League; Member of the National Security Advisory Council of the Center for U.S. Global Engagement and a member of the CNA Military Advisory Board; Chairman of the charity J Street Cup Golf; Trustee of Fairhaven United Methodist Church; and Director of other various non-profit organizations. | |
Kathleen A. Dennis (63)
c/o Perkins Coie LLP
Counsel to the Independent Directors
30 Rockefeller Plaza
New York, NY 10112 | | Director | | Since
August
2006 | | President, Cedarwood Associates (mutual fund and investment management consulting) (since July 2006); Chairperson of the Liquidity and Alternatives Sub-Committee of the Investment Committee (since October 2006) and Director or Trustee of various Morgan Stanley Funds (since August 2006); formerly, Senior Managing Director of Victory Capital Management (1993-2006). | | | 91 | | | Director of various non-profit organizations. | |
Nancy C. Everett (61)
c/o Perkins Coie LLP
Counsel to the Independent Directors
30 Rockefeller Plaza
New York, NY 10112 | | Director | | Since
January
2015 | | Chief Executive Officer, Virginia Commonwealth University Investment Company (since November 2015); Owner, OBIR, LLC (institutional investment management consulting) (since June 2014); formerly, Managing Director, BlackRock Inc. (February 2011-December 2013); and Chief Executive Officer, General Motors Asset Management (a/k/a Promark Global Advisors, Inc.) (June 2005-May 2010). | | | 91 | | | Member of Virginia Commonwealth University School of Business Foundation; formerly, Member of Virginia Commonwealth University Board of Visitors (2013-2015); Member of Committee on Directors for Emerging Markets Growth Fund, Inc. (2007-2010); Chairperson of Performance Equity Management, LLC (2006-2010); and Chairperson, GMAM Absolute Return Strategies Fund, LLC (2006-2010). | |
34
Morgan Stanley Institutional Fund, Inc.
Annual Report — December 31, 2016
Director and Officer Information (unaudited) (cont'd)
Independent Directors: (cont'd)
Name, Age and Address of
Independent Director | | Position(s)
Held with
Registrant | | Length of Time
Served* | | Principal Occupation(s) During Past 5 Years
and Other Relevant Professional Experience | | Number of
Overseen by
Independent
Director** | | Portfolios in
Fund Complex
Other Directorships
Held by Independent
Director*** | |
Jakki L. Haussler (59)
c/o Perkins Coie LLP
Counsel to the Independent Directors
30 Rockefeller Plaza
New York, NY 10112 | | Director | | Since
January
2015 | | Chairman and Chief Executive Officer, Opus Capital Group (since January 1996); formerly, Director, Capvest Venture Fund, LP (May 2000-December 2011); Partner, Adena Ventures, LP (July 1999-December 2010); Director, The Victory Funds (February 2005-July 2008). | | | 91 | | | Director of Cincinnati Bell Inc. and Member, Audit Committee and Compensation Committee; Director of Northern Kentucky University Foundation and Member, Investment Committee; Member of Chase College of Law Transactional Law Practice Center Board of Advisors; Director of Best Transport; Director of Chase College of Law Board of Visitors; formerly, Member, University of Cincinnati Foundation Investment Committee; Member, Miami University Board of Visitors (2008-2011); Trustee of Victory Funds (2005-2008) and Chairman, Investment Committee (2007-2008) and Member, Service Provider Committee (2005-2008). | |
Dr. Manuel H. Johnson (67)
c/o Johnson Smick
International, Inc.
220 I Street, N.E. — Suite 200
Washington, D.C. 20002 | | Director | | Since
July
1991 | | Senior Partner, Johnson Smick International, Inc. (consulting firm); Chairperson of the Investment Committee (since October 2006) and Director or Trustee of various Morgan Stanley Funds (since July 1991); Co-Chairman and a founder of the Group of Seven Council (G7C) (international economic commission); formerly, Chairperson of the Audit Committee (July 1991-September 2006), Vice Chairman of the Board of Governors of the Federal Reserve System and Assistant Secretary of the U.S. Treasury. | | | 91 | | | Director of NVR, Inc. (home construction). | |
Joseph J. Kearns (74)
c/o Kearns & Associates LLC
46 E Peninsula Center #385
Rolling Hills Estates, CA 90274-3712 | | Director | | Since
August
1994 | | President, Kearns & Associates LLC (investment consulting); Chairperson of the Audit Committee (since October 2006) and Director or Trustee of various Morgan Stanley Funds (since August 1994); formerly, Deputy Chairperson of the Audit Committee (July 2003-September 2006) and Chairperson of the Audit Committee of various Morgan Stanley Funds (since August 1994); CFO of the J. Paul Getty Trust. | | | 93 | | | Director of Electro Rent Corporation (equipment leasing). Prior to December 31, 2013, Director of The Ford Family Foundation. | |
35
Morgan Stanley Institutional Fund, Inc.
Annual Report — December 31, 2016
Director and Officer Information (unaudited) (cont'd)
Independent Directors: (cont'd)
Name, Age and Address of
Independent Director | | Position(s)
Held with
Registrant | | Length of Time
Served* | | Principal Occupation(s) During Past 5 Years
and Other Relevant Professional Experience | | Number of
Overseen by
Independent
Director** | | Portfolios in
Fund Complex
Other Directorships
Held by Independent
Director*** | |
Michael F. Klein (58)
c/o Perkins Coie LLP
Counsel to the Independent Directors
30 Rockefeller Plaza
New York, NY 10112 | | Director | | Since
August
2006 | | Managing Director, Aetos Capital, LLC (since March 2000); Co-President, Aetos Alternatives Management, LLC (since January 2004) and Co-Chief Executive Officer of Aetos Capital LLC (since August 2013); Chairperson of the Fixed Income Sub-Committee of the Investment Committee (since October 2006) and Director or Trustee of various Morgan Stanley Funds (since August 2006); formerly, Managing Director, Morgan Stanley & Co. Inc. and Morgan Stanley Dean Witter Investment Management, President, various Morgan Stanley Funds (June 1998-March 2000) and Principal, Morgan Stanley & Co. Inc. and Morgan Stanley Dean Witter Investment Management (August 1997-December 1999). | | | 90 | | | Director of certain investment funds managed or sponsored by Aetos Capital, LLC; Director of Sanitized AG and Sanitized Marketing AG (specialty chemicals). | |
Patricia Maleski (56)
c/o Perkins Coie LLP
Counsel to the Independent Directors
30 Rockefeller Plaza
New York, NY 10112 | | Director | | Since
January
2017 | | Management Director, JPMorgan Asset Management (2013-2016); President, JPMorgan Funds (2010-2013), Chief Administrative Officer, JPMorgan Funds (2004-2010), Treasurer, JPMorgan Funds (2003-2004, 2008-2010), and Vice President and Board Liaison, JPMorgan Funds (2001-2004); Managing Director, J.P. Morgan Investment Management Inc. (2001-2013); Vice President of Finance, Pierpont Group (1996-2001); Vice President, Bank of New York (1995-1996); Senior Audit Manager, Price Waterhouse, LLP (1982-1995). | | | 91 | | | None. | |
Michael E. Nugent (80)
522 Fifth Avenue
New York, NY 10036 | | Chair of the Board and Director | | Chair of the Boards since July 2006 and Director since July 1991 | | Chair of the Boards of various Morgan Stanley Funds (since July 2006); Chairperson of the Closed-End Fund Committee (since June 2012) and Director or Trustee of various Morgan Stanley Funds (since July 1991); formerly, Chairperson of the Insurance Committee (until July 2006); General Partner, Triumph Capital, L.P. (private investment partnership) (1988-2013). | | | 92 | | | None. | |
W. Allen Reed (69)
c/o Perkins Coie LLP
Counsel to the Independent Directors
30 Rockefeller Plaza
New York, NY 10112 | | Director | | Since
August
2006 | | Chairperson of the Equity Sub-Committee of the Investment Committee (since October 2006) and Director or Trustee of various Morgan Stanley Funds (since August 2006); formerly, President and CEO of General Motors Asset Management; Chairman and Chief Executive Officer of the GM Trust Bank and Corporate Vice President of General Motors Corporation (August 1994-December 2005). | | | 91 | | | Director of Legg Mason, Inc.; formerly, Director of the Auburn University Foundation (2010-2015). | |
Fergus Reid (84)
c/o Joe Pietryka, Inc.
85 Charles Colman Blvd.
Pawling, NY 12564 | | Director | | Since
June
1992 | | Chairman, Joe Pietryka, Inc.; Chairperson of the Governance Committee and Director or Trustee of various Morgan Stanley Funds (since June 1992). | | | 92 | | | Formerly, Trustee and Director of certain investment companies in the JP Morgan Fund Complex managed by JP Morgan Investment Management Inc. (1987-2012). | |
* This is the earliest date the Director began serving the Morgan Stanley Funds. Each Director serves an indefinite term, until his or her successor is elected.
** The Fund Complex includes (as of December 31, 2016) all open-end and closed-end funds (including all of their portfolios) advised by Morgan Stanley Investment Management Inc. (the "Adviser") and any funds that have an adviser that is an affiliated person of the Adviser (including, but not limited to, Morgan Stanley AIP GP LP).
*** This includes any directorships at public companies and registered investment companies held by the Director at any time during the past five years.
36
Morgan Stanley Institutional Fund, Inc.
Annual Report — December 31, 2016
Director and Officer Information (unaudited) (cont'd)
Executive Officers:
Name, Age and Address of Executive Officer | | Position(s) Held
with
Registrant | | Length of Time
Served* | | Principal Occupation(s) During Past 5 Years | |
John H. Gernon (53)
522 Fifth Avenue
New York, NY 10036 | | President and Principal Executive Officer | | Since
September
2013 | | President and Principal Executive Officer of the Equity and Fixed Income Funds and the Morgan Stanley AIP Funds (since September 2013) and the Liquidity Funds and various money market funds (since May 2014) in the Fund Complex; Managing Director of the Adviser; Head of Product (since 2006). | |
Timothy J. Knierim (58)
522 Fifth Avenue
New York, NY 10036 | | Chief Compliance Officer | | Since
December
2016 | | Managing Director of the Adviser and various entities affiliated with the Adviser; Chief Compliance Officer of various Morgan Stanley Funds and the Adviser (since December 2016) and Chief Compliance Officer of Morgan Stanley AIP GP LP (since 2014). Formerly, Managing Director and Deputy Chief Compliance Officer of the Adviser (2014-2016); and formerly, Chief Compliance Officer of Prudential Investment Management, Inc. (2007-2014). | |
Francis J. Smith (51)
522 Fifth Avenue
New York, NY 10036 | | Treasurer and Principal Financial Officer | | Treasurer since July 2003 and Principal Financial Officer since September 2002 | | Managing Director of the Adviser and various entities affiliated with the Adviser; Treasurer (since July 2003) and Principal Financial Officer of various Morgan Stanley Funds (since September 2002). | |
Mary E. Mullin (49)
522 Fifth Avenue
New York, NY 10036 | | Secretary | | Since
June
1999 | | Executive Director of the Adviser; Secretary of various Morgan Stanley Funds (since June 1999). | |
* This is the earliest date the officer began serving the Morgan Stanley Funds. Each officer serves a one-year term, until his or her successor is elected and qualifies.
37
Morgan Stanley Institutional Fund, Inc.
Annual Report — December 31, 2016
Adviser and Administrator
Morgan Stanley Investment Management Inc.
522 Fifth Avenue
New York, New York 10036
Sub-Advisers
Morgan Stanley Investment Management Limited
25 Cabot Square, Canary Wharf
London, E14 4QA, England
Morgan Stanley Investment Management Company
23 Church Street
16-01 Capital Square, Singapore 049481
Distributor
Morgan Stanley Distribution, Inc.
522 Fifth Avenue
New York, New York 10036
Dividend Disbursing and Transfer Agent
Boston Financial Data Services, Inc.
2000 Crown Colony Drive
Quincy, Massachusetts 02169
Custodian
State Street Bank and Trust Company
One Lincoln Street
Boston, Massachusetts 02111
Legal Counsel
Dechert LLP
1095 Avenue of the Americas
New York, New York 10036
Counsel to the Independent Directors
Perkins Coie LLP
30 Rockefeller Plaza
New York, New York 10112
Independent Registered Public Accounting Firm
Ernst & Young LLP
200 Clarendon Street
Boston, Massachusetts 02116
Reporting to Shareholders
Each Morgan Stanley fund provides a complete schedule of portfolio holdings in its semi-annual and annual reports within 60 days of the end of the fund's second and fourth fiscal quarters. The semi-annual and annual reports are filed electronically with the Securities and Exchange Commission (SEC) on Form N-CSRS and Form N-CSR, respectively. Morgan Stanley also delivers the semi-annual and annual reports to fund shareholders and makes these reports available on its public website, www.morganstanley.com/im. Each Morgan Stanley fund also files a complete schedule of portfolio holdings with the SEC for the fund's first and third fiscal quarters on Form N-Q. Morgan Stanley does not deliver the reports for the first and third fiscal quarters to shareholders, nor are the reports posted to the Morgan Stanley public website. You may, however, obtain the Form N-Q filings (as well as the Form N-CSR and N-CSRS filings) by accessing the SEC's website, www.sec.gov. You may also review and copy them at the SEC's Public Reference Room in Washington, DC. Information on the operation of the SEC's Public Reference Room may be obtained by calling the SEC toll free at 1 (800) SEC-0330. You can also request copies of these materials, upon payment of a duplicating fee, by electronic request at the SEC's email address (publicinfo@sec.gov) or by writing the Public Reference Room of the SEC, 100 F Street, NE, Washington, DC 20549-0102.
Proxy Voting Policies and Procedures and Proxy Voting Record
You may obtain a copy of the Fund's Proxy Voting Policy and Procedures and information regarding how the Fund voted proxies relating to portfolio securities during the most recent twelve-month period ended June 30, without charge, upon request, by calling toll free 1 (800) 548-7786 or by visiting our website at www.morganstanley.com/im. This information is also available on the SEC's website at www.sec.gov.
This report is authorized for distribution only when preceded or accompanied by a prospectus or summary prospectus of the applicable Portfolio of Morgan Stanley Institutional Fund, Inc., which describes in detail the Portfolio's investment policies, risks, fees and expenses. Please read the prospectus carefully before you invest or send money. For additional information, including information regarding the investments comprising the Portfolio, please visit our website at www.morganstanley.com/im or call toll free 1 (800) 548-7786.
38
(This Page has been left blank intentionally.)
(This Page has been left blank intentionally.)
(This Page has been left blank intentionally.)
Printed in U.S.A.
This Report has been prepared for shareholders and may be distributed to others only if preceded or accompanied by a current prospectus.
Morgan Stanley Investment Management Inc.
522 Fifth Avenue
New York, New York 10036
© 2017 Morgan Stanley. Morgan Stanley Distribution, Inc.

IFIGREANN
1698174 EXP. 02.28.18

Morgan Stanley Institutional Fund, Inc.
Growth Portfolio
Annual Report
December 31, 2016

Morgan Stanley Institutional Fund, Inc.
Annual Report — December 31, 2016
Shareholders' Letter | | | 2 | | |
Expense Example | | | 3 | | |
Investment Overview | | | 4 | | |
Portfolio of Investments | | | 6 | | |
Statement of Assets and Liabilities | | | 8 | | |
Statement of Operations | | | 10 | | |
Statements of Changes in Net Assets | | | 11 | | |
Financial Highlights | | | 13 | | |
Notes to Financial Statements | | | 18 | | |
Report of Independent Registered Public Accounting Firm | | | 29 | | |
Federal Tax Notice | | | 30 | | |
Privacy Notice | | | 31 | | |
Director and Officer Information | | | 34 | | |
This report is authorized for distribution only when preceded or accompanied by a prospectus or summary prospectus of the applicable Portfolio of Morgan Stanley Institutional Fund, Inc. To receive a prospectus and/or statement of additional information (SAI), which contains more complete information such as investment objectives, charges, expenses, policies for voting proxies, risk considerations, and describes in detail each of the Portfolio's investment policies to the prospective investor, please call toll free 1 (800) 548-7786. Please read the prospectuses carefully before you invest or send money.
Additionally, you can access information about the Portfolio, including performance, characteristics, and investment team commentary, through Morgan Stanley Investment Management's website: www.morganstanley.com/im.
Market forecasts provided in this report may not necessarily come to pass. There is no guarantee that any sectors mentioned will continue to perform as discussed herein or that securities in such sectors will be held by the Portfolio in the future. There is no assurance that a Portfolio will achieve its investment objective. Portfolios are subject to market risk, which is the possibility that market values of securities owned by the Portfolio will decline and, therefore, the value of the Portfolio's shares may be less than what you paid for them. Accordingly, you can lose money investing in this Portfolio. Please see the prospectus for more complete information on investment risks.
1
Morgan Stanley Institutional Fund, Inc.
Annual Report — December 31, 2016
Shareholders' Letter (unaudited)
Dear Shareholders,
We are pleased to provide this Annual report, in which you will learn how your investment in Growth Portfolio (the "Portfolio") performed during the latest twelve-month period.
Morgan Stanley Investment Management is a client-centric, investor-led organization. Our global presence, intellectual capital, and breadth of products and services enable us to partner with investors to meet the evolving challenges of today's financial markets. We aim to deliver superior investment service and to empower our clients to make the informed decisions that help them reach their investment goals.
As always, we thank you for selecting Morgan Stanley Investment Management, and look forward to working with you in the months and years ahead.
Sincerely,

John H. Gernon
President and Principal Executive Officer
January 2017
2
Morgan Stanley Institutional Fund, Inc.
Annual Report — December 31, 2016
Expense Example (unaudited)
Growth Portfolio
As a shareholder of the Portfolio, you incur two types of costs: (1) transactional costs; and (2) ongoing costs, which may include advisory fees, administration fees, distribution and shareholder services fees and other Portfolio expenses. This example is intended to help you understand your ongoing costs (in dollars) of investing in the Portfolio and to compare these costs with the ongoing costs of investing in other mutual funds.
This example is based on an investment of $1,000 invested at the beginning of the six-month period ended December 31, 2016 and held for the entire six-month period.
Actual Expenses
The table below provides information about actual account values and actual expenses. You may use the information in this table, together with the amount you invested, to estimate the expenses that you paid over the period. Simply divide your account value by $1,000 (for example, an $8,600 account value divided by $1,000 = 8.6), then multiply the result by the number in the table under the heading entitled "Actual Expenses Paid During Period" to estimate the expenses you paid on your account during this period.
Hypothetical Example for Comparison Purposes
The table below provides information about hypothetical account values and hypothetical expenses based on the Portfolio's actual expense ratio and an assumed rate of return of 5% per year before expenses, which is not the Portfolio's actual return. The hypothetical account values and expenses may not be used to estimate the actual ending account balance or expenses you paid for the period. You may use this information to compare the ongoing costs of investing in the Portfolio and other funds. To do so, compare this 5% hypothetical example with the 5% hypothetical examples that appear in the shareholder reports of the other funds.
Please note that the expenses shown in the table are meant to highlight your ongoing costs only and do not reflect any transactional costs, such as sales charges (loads). Therefore, the information for each class in the table is useful in comparing ongoing costs only, and will not help you determine the relative total costs of owning different funds. In addition, if these transactional costs were included, your costs would have been higher.
| | | Beginning
Account
Value
7/1/16 | | Actual Ending
Account
Value
12/31/16 | | Hypothetical
Ending Account
Value | | Actual
Expenses
Paid
During
Period* | | Hypothetical
Expenses Paid
During Period* | | Net
Expense
Ratio
During
Period** | |
Growth Portfolio Class I | | $ | 1,000.00 | | | $ | 1,021.80 | | | $ | 1,021.97 | | | $ | 3.20 | | | $ | 3.20 | | | | 0.63 | %*** | |
Growth Portfolio Class A | | | 1,000.00 | | | | 1,020.20 | | | | 1,020.51 | | | | 4.67 | | | | 4.67 | | | | 0.92 | *** | |
Growth Portfolio Class L | | | 1,000.00 | | | | 1,017.60 | | | | 1,017.90 | | | | 7.30 | | | | 7.30 | | | | 1.44 | *** | |
Growth Portfolio Class C | | | 1,000.00 | | | | 1,016.20 | | | | 1,016.34 | | | | 8.87 | | | | 8.87 | | | | 1.75 | *** | |
Growth Portfolio Class IS | | | 1,000.00 | | | | 1,022.30 | | | | 1,022.42 | | | | 2.75 | | | | 2.75 | | | | 0.54 | *** | |
* Expenses are calculated using each Portfolio Class' annualized net expense ratio (as disclosed), multiplied by the average account value over the period, and multiplied by 184/366 (to reflect the most recent one-half year period).
** Annualized.
*** Refer to Note F in the Notes to Financial Statements for discussion of prior period custodian out-of-pocket expenses that were reimbursed in the current period.
3
Morgan Stanley Institutional Fund, Inc.
Annual Report — December 31, 2016
Investment Overview (unaudited)
Growth Portfolio
The Portfolio seeks long-term capital appreciation by investing primarily in growth-oriented equity securities of large capitalization companies.
Performance
For the year ended December 31, 2016, the Portfolio's Class I shares had a total return based on net asset value and reinvestment of distributions per share of –1.91%, net of fees. The Portfolio's Class I shares underperformed the Portfolio's benchmark, the Russell 1000® Growth Index (the "Index"), which returned 7.08%.
Factors Affecting Performance
• The U.S. stock market was overwhelmed by negative news early in 2016 but staged a turnaround over the remainder of the year. Concerns about China's economy, falling oil prices and U.S. Federal Reserve ("Fed") monetary policy weighed heavily on the markets from January through mid-February. From there, oil prices stabilized, economic growth improved, corporate earnings recovered and the Fed refrained from raising interest rates (until its December 2016 meeting), which provided upside to stock prices. Two major political events, the U.K.'s "Brexit" referendum and the election of Donald Trump, were initially viewed as negative surprises, but volatility subsided fairly quickly. Anticipation of pro-growth fiscal policy from the new administration drove share prices sharply higher in the final weeks of the year.
• Large-cap growth stocks, as represented by the Index, were led by the telecommunication services, energy and industrials sectors. Health care (which had a negative return for the period), real estate and consumer staples were the weakest-performing sectors.
• The long-term investment horizon and conviction-weighted investment approach embraced by the team since 1998 can result in periods of performance deviation from the benchmark and peers. In this reporting period, all of the Portfolio's underperformance was driven by stock selection, while sector allocation had a neutral impact.
• The information technology ("IT") sector was the biggest drag on relative returns. Stock selection in IT detracted from performance, with the negative results only slightly offset by the benefit of an
overweight allocation to the sector. Adverse performance from the industrials sector was driven by both weak stock selection and an underweight position. The health care sector also disappointed, largely due to unfavorable stock selection.
• The Portfolio's relative sector weightings in IT, health care, financials and consumer staples modestly contributed to relative performance, as did the lack of exposure to the real estate sector.
Management Strategies
• There were no changes to our bottom-up investment process during the period. We continued to look for high-quality growth companies that we believe have these attributes: sustainable competitive advantages, above-average business visibility, rising return on invested capital, strong free cash flow generation and a favorable risk/reward profile. We find these companies through intense fundamental research. Our emphasis is on secular growth, and as a result short-term market events are not as meaningful in the stock selection process.
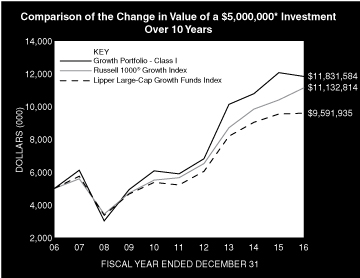
* Minimum Investment for Class I shares
In accordance with SEC regulations, the Portfolio's performance shown assumes that all recurring fees (including management fees) were deducted and all dividends and distributions were reinvested. The performance of Class A, L, C and IS shares will vary from the performance of Class I shares based upon their different inception dates and will be negatively impacted by additional fees assessed to those classes (if applicable).
4
Morgan Stanley Institutional Fund, Inc.
Annual Report — December 31, 2016
Investment Overview (unaudited) (cont'd)
Growth Portfolio
Performance Compared to the Russell 1000® Growth Index(1) and the Lipper Large-Cap Growth Funds Index(2)
| | | Period Ended December 31, 2016
Total Returns(3) | |
| | | | | Average Annual | |
| | | One
Year | | Five
Years | | Ten
Years | | Since
Inception(9) | |
Portfolio — Class I Shares
w/o sales charges(4) | | | –1.91 | % | | | 14.96 | % | | | 9.00 | % | | | 9.91 | % | |
Portfolio — Class A Shares
w/o sales charges(5) | | | –2.21 | | | | 14.66 | | | | 8.72 | | | | 8.64 | | |
Portfolio — Class A Shares with
maximum 5.25% sales charges(5) | | | –7.34 | | | | 13.42 | | | | 8.13 | | | | 8.36 | | |
Portfolio — Class L Shares
w/o sales charges(6) | | | –2.72 | | | | — | | | | — | | | | 10.74 | | |
Portfolio — Class C Shares
w/o sales charges(8) | | | –2.93 | | | | — | | | | — | | | | –0.18 | | |
Portfolio — Class C Shares with
maximum 1.00% deferred
sales charges(8) | | | –3.79 | | | | — | | | | — | | | | –0.18 | | |
Portfolio — Class IS Shares
w/o sales charges(7) | | | –1.83 | | | | — | | | | — | | | | 9.81 | | |
Russell 1000® Growth Index | | | 7.08 | | | | 14.50 | | | | 8.33 | | | | 8.58 | | |
Lipper Large-Cap Growth Funds Index | | | 0.54 | | | | 12.96 | | | | 6.73 | | | | 7.68 | | |
Performance data quoted represents past performance, which is no guarantee of future results, and current performance may be lower or higher than the figures shown. Performance assumes that all dividends and distributions, if any, were reinvested. For the most recent month-end performance figures, please visit www.morganstanley.com/im. Investment return and principal value will fluctuate so that Portfolio shares, when redeemed, may be worth more or less than their original cost. Total returns do not reflect the deduction of taxes that a shareholder would pay on Portfolio distributions or the redemption of Portfolio shares. Performance of share classes will vary due to difference in sales charges and expenses.
(1) The Russell 1000® Growth Index measures the performance of the large-cap growth segment of the U.S. equity universe. It includes those Russell 1000® Index companies with higher price-to-book ratios and higher forecasted growth values. The Russell 1000® Index is an index of approximately 1,000 of the largest U.S. companies based on a combination of market capitalization and current index membership. The Index is unmanaged and its returns do not include any sales charges or fees. Such costs would lower performance. It is not possible to invest directly in an index.
(2) The Lipper Large-Cap Growth Funds Index is an equally weighted performance index of the largest qualifying funds (based on net assets) in the Lipper Large-Cap Growth Funds classification. The Index, which is adjusted for capital gains distributions and income dividends, is unmanaged and should not be considered an investment. There are currently 30 funds represented in this Index. As of the date of this report, the Portfolio is in the Lipper Large-Cap Growth Funds classification.
(3) Total returns for the Portfolio reflect fees waived and expenses reimbursed, if applicable, by the Adviser. Without such waivers and reimbursements, total returns would have been lower.
(4) Commenced operations on April 2, 1991.
(5) Commenced offering on January 2, 1996.
(6) Commenced offering on April 27, 2012.
(7) Commenced offering on September 13, 2013.
(8) Commenced offering on April 30, 2015.
(9) For comparative purposes, average annual since inception returns listed for the Indexes refer to the inception date of Class I of the Portfolio, not the inception of the Index.
5
Morgan Stanley Institutional Fund, Inc.
Annual Report — December 31, 2016
Portfolio of Investments
Growth Portfolio
| | | Shares | | Value
(000) | |
Common Stocks (93.9%) | |
Aerospace & Defense (3.5%) | |
United Technologies Corp. | | | 971,874 | | | $ | 106,537 | | |
Automobiles (5.5%) | |
Tesla Motors, Inc. (a)(b) | | | 786,886 | | | | 168,150 | | |
Biotechnology (0.7%) | |
Alnylam Pharmaceuticals, Inc. (b) | | | 169,928 | | | | 6,362 | | |
Intrexon Corp. (a)(b) | | | 412,552 | | | | 10,025 | | |
Juno Therapeutics, Inc. (a)(b) | | | 210,243 | | | | 3,963 | | |
| | | | 20,350 | | |
Capital Markets (4.4%) | |
S&P Global, Inc. | | | 1,267,753 | | | | 136,334 | | |
Diversified Financial Services (1.5%) | |
Berkshire Hathaway, Inc., Class B (b) | | | 281,576 | | | | 45,891 | | |
Health Care Equipment & Supplies (5.8%) | |
DexCom, Inc. (b) | | | 514,923 | | | | 30,741 | | |
Intuitive Surgical, Inc. (b) | | | 230,371 | | | | 146,094 | | |
| | | | 176,835 | | |
Health Care Technology (2.8%) | |
athenahealth, Inc. (b) | | | 825,395 | | | | 86,807 | | |
Hotels, Restaurants & Leisure (2.6%) | |
Chipotle Mexican Grill, Inc. (b) | | | 78,750 | | | | 29,714 | | |
Starbucks Corp. | | | 879,165 | | | | 48,811 | | |
| | | | 78,525 | | |
Information Technology Services (7.9%) | |
Mastercard, Inc., Class A | | | 1,455,063 | | | | 150,235 | | |
Visa, Inc., Class A | | | 1,182,849 | | | | 92,286 | | |
| | | | 242,521 | | |
Internet & Direct Marketing Retail (13.7%) | |
Amazon.com, Inc. (b) | | | 378,450 | | | | 283,788 | | |
Netflix, Inc. (b) | | | 252,718 | | | | 31,286 | | |
Priceline Group, Inc. (The) (Netherlands) (b) | | | 71,655 | | | | 105,051 | | |
| | | | 420,125 | | |
Internet Software & Services (20.1%) | |
Alibaba Group Holding Ltd. ADR (China) (b) | | | 509,933 | | | | 44,777 | | |
Alphabet, Inc., Class C (b) | | | 262,506 | | | | 202,608 | | |
Facebook, Inc., Class A (b) | | | 2,232,489 | | | | 256,848 | | |
Tencent Holdings Ltd. (China) (c) | | | 1,827,400 | | | | 44,704 | | |
Twitter, Inc. (b) | | | 4,267,683 | | | | 69,563 | | |
| | | | 618,500 | | |
Life Sciences Tools & Services (5.0%) | |
Illumina, Inc. (b) | | | 1,198,925 | | | | 153,510 | | |
Semiconductors & Semiconductor Equipment (3.8%) | |
NVIDIA Corp. | | | 1,107,606 | | | | 118,226 | | |
| | | Shares | | Value
(000) | |
Software (13.9%) | |
Activision Blizzard, Inc. | | | 805,820 | | | $ | 29,098 | | |
Mobileye N.V. (b) | | | 424,473 | | | | 16,181 | | |
Salesforce.com, Inc. (b) | | | 2,064,424 | | | | 141,331 | | |
ServiceNow, Inc. (b) | | | 591,435 | | | | 43,967 | | |
Splunk, Inc. (b) | | | 805,517 | | | | 41,202 | | |
Workday, Inc., Class A (b) | | | 2,344,347 | | | | 154,938 | | |
| | | | 426,717 | | |
Textiles, Apparel & Luxury Goods (2.7%) | |
Michael Kors Holdings Ltd. (b) | | | 1,288,293 | | | | 55,371 | | |
Under Armour, Inc., Class A (a)(b) | | | 975,203 | | | | 28,330 | | |
| | | | 83,701 | | |
Total Common Stocks (Cost $1,918,594) | | | 2,882,729 | | |
Preferred Stocks (4.5%) | |
Electronic Equipment, Instruments & Components (0.6%) | |
Magic Leap Series C (b)(d)(e)(f)
(acquisition cost — $18,812;
acquired 12/22/15) | | | 816,725 | | | | 18,278 | | |
Internet & Direct Marketing Retail (3.8%) | |
Airbnb, Inc. Series D (b)(d)(e)(f)
(acquisition cost — $20,638;
acquired 4/16/14) | | | 506,928 | | | | 53,273 | | |
Flipkart Online Services Pvt Ltd.
Series F (b)(d)(e)(f) (acquisition
cost — $15,000; acquired 8/18/14) | | | 207,900 | | | | 10,501 | | |
Uber Technologies Series G (b)(d)(e)(f)
(acquisition cost — $54,173;
acquired 12/3/15) | | | 1,110,729 | | | | 54,173 | | |
| | | | 117,947 | | |
Internet Software & Services (0.1%) | |
Dropbox, Inc. Series C (b)(d)(e)(f)
(acquisition cost — $7,182;
acquired 1/30/14) | | | 375,979 | | | | 3,305 | | |
Total Preferred Stocks (Cost $115,805) | | | 139,530 | | |
| | | Notional
Amount
(000) | | | |
Call Option Purchased (0.1%) | |
Foreign Currency Option (0.1%) | |
USD/CNY May 2017 @ CNY 7.90,
Royal Bank of Scotland (Cost $1,674) | | | 409,039 | | | | 1,527 | | |
| | | Shares | | | |
Short-Term Investments (8.8%) | |
Securities held as Collateral on Loaned Securities (4.5%) | |
Investment Company (3.6%) | |
Morgan Stanley Institutional Liquidity
Funds — Treasury Securities Portfolio —
Institutional Class (See Note G) | | | 109,210,075 | | | | 109,210 | | |
The accompanying notes are an integral part of the financial statements.
6
Morgan Stanley Institutional Fund, Inc.
Annual Report — December 31, 2016
Portfolio of Investments (cont'd)
Growth Portfolio
| | | Face
Amount
(000) | | Value
(000) | |
Repurchase Agreements (0.9%) | |
Merrill Lynch & Co., Inc., (0.50%,
dated 12/30/16, due 1/3/17; proceeds
$10,295; fully collateralized by
U.S. Government agency securities;
2.88% — 4.60% due 11/20/65 —
11/20/66; valued at $10,501) | | $ | 10,295 | | | $ | 10,295 | | |
Merrill Lynch & Co., Inc., (0.50%,
dated 12/30/16, due 1/3/17; proceeds
$2,059; fully collateralized by a
U.S. Government obligation; 1.88%
due 8/31/22; valued at $2,100) | | | 2,059 | | | | 2,059 | | |
Merrill Lynch & Co., Inc., (0.81%,
dated 12/30/16, due 1/3/17; proceeds
$15,443; fully collateralized by Exchange
Traded Funds; valued at $16,987) | | | 15,443 | | | | 15,443 | | |
| | | | 27,797 | | |
Total Securities held as Collateral on Loaned
Securities (Cost $137,007) | | | 137,007 | | |
| | | Shares | | | |
Investment Company (4.3%) | |
Morgan Stanley Institutional Liquidity
Funds — Treasury Securities Portfolio —
Institutional Class (See Note G)
(Cost $131,772) | | | 131,772,006 | | | | 131,772 | | |
Total Short-Term Investments (Cost $268,779) | | | 268,779 | | |
Total Investments (107.3%) (Cost $2,304,852)
Including $170,195 of Securities Loaned (g) | | | 3,292,565 | | |
Liabilities in Excess of Other Assets (–7.3%) | | | (222,984 | ) | |
Net Assets (100.0%) | | $ | 3,069,581 | | |
(a) All or a portion of this security was on loan at December 31, 2016.
(b) Non-income producing security.
(c) Security trades on the Hong Kong exchange.
(d) Security has been deemed illiquid at December 31, 2016.
(e) At December 31, 2016, the Portfolio held fair valued securities valued at approximately $139,530,000, representing 4.5% of net assets. These securities have been fair valued as determined in good faith under procedures established by and under the general supervision of the Fund's Directors.
(f) Security cannot be offered for public resale without first being registered under the Securities Act of 1933 and related rules ("restricted security"). Acquisition date represents the day on which an enforceable right to acquire such security is obtained and is presented along with related cost in the security description. The Portfolio has registration rights for certain restricted securities. Any costs related to such registration are borne by the issuer. The aggregate value of restricted securities (excluding 144A holdings) at December 31, 2016, amounts to approximately $139,530,000 and represents 4.5% of net assets.
(g) At December 31, 2016, the aggregate cost for federal income tax purposes is approximately $2,316,815,000. The aggregate gross unrealized appreciation is approximately $1,187,042,000 and the aggregate gross unrealized depreciation is approximately $211,292,000, resulting in net unrealized appreciation of approximately $975,750,000.
ADR American Depositary Receipt.
CNY Chinese Yuan Renminbi
USD United States Dollar
Portfolio Composition*
Classification | | Percentage of
Total Investments | |
Other** | | | 31.1 | % | |
Internet Software & Services | | | 19.7 | | |
Internet & Direct Marketing Retail | | | 17.1 | | |
Software | | | 13.5 | | |
Information Technology Services | | | 7.7 | | |
Health Care Equipment & Supplies | | | 5.6 | | |
Automobiles | | | 5.3 | | |
Total Investments | | | 100.0 | % | |
* Percentages indicated are based upon total investments (excluding Securities held as Collateral on Loaned Securities) as of December 31, 2016.
** Industries and/or investment types representing less than 5% of total investments.
The accompanying notes are an integral part of the financial statements.
7
Morgan Stanley Institutional Fund, Inc.
Annual Report — December 31, 2016
Statement of Assets and Liabilities | | December 31, 2016
(000) | |
Assets: | |
Investments in Securities of Unaffiliated Issuers, at Value(1) (Cost $2,063,870) | | $ | 3,051,583 | | |
Investment in Security of Affiliated Issuer, at Value (Cost $240,982) | | | 240,982 | | |
Total Investments in Securities, at Value (Cost $2,304,852) | | | 3,292,565 | | |
Cash | | | 218 | | |
Receivable for Portfolio Shares Sold | | | 4,396 | | |
Dividends Receivable | | | 679 | | |
Tax Reclaim Receivable | | | 493 | | |
Receivable from Affiliate | | | 20 | | |
Other Assets | | | 159 | | |
Total Assets | | | 3,298,530 | | |
Liabilities: | |
Collateral on Securities Loaned, at Value | | | 137,225 | | |
Payable for Portfolio Shares Redeemed | | | 84,151 | | |
Payable for Advisory Fees | | | 3,643 | | |
Due to Broker | | | 1,370 | | |
Payable for Investments Purchased | | | 1,034 | | |
Payable for Sub Transfer Agency Fees — Class I | | | 110 | | |
Payable for Sub Transfer Agency Fees — Class A | | | 318 | | |
Payable for Sub Transfer Agency Fees — Class L | | | 26 | | |
Payable for Sub Transfer Agency Fees — Class C | | | 3 | | |
Payable for Shareholder Services Fees — Class A | | | 299 | | |
Payable for Distribution and Shareholder Services Fees — Class L | | | 48 | | |
Payable for Distribution and Shareholder Services Fees — Class C | | | 15 | | |
Payable for Administration Fees | | | 218 | | |
Payable for Directors' Fees and Expenses | | | 122 | | |
Payable for Transfer Agency Fees — Class I | | | 13 | | |
Payable for Transfer Agency Fees — Class A | | | 67 | | |
Payable for Transfer Agency Fees — Class L | | | 6 | | |
Payable for Transfer Agency Fees — Class C | | | 1 | | |
Payable for Transfer Agency Fees — Class IS | | | 1 | | |
Payable for Professional Fees | | | 60 | | |
Payable for Custodian Fees | | | 34 | | |
Other Liabilities | | | 185 | | |
Total Liabilities | | | 228,949 | | |
Net Assets | | $ | 3,069,581 | | |
Net Assets Consist Of: | |
Paid-in-Capital | | $ | 2,007,776 | | |
Accumulated Net Investment Loss | | | (1,960 | ) | |
Accumulated Net Realized Gain | | | 76,052 | | |
Unrealized Appreciation (Depreciation) on: | |
Investments | | | 987,713 | | |
Net Assets | | $ | 3,069,581 | | |
The accompanying notes are an integral part of the financial statements.
8
Morgan Stanley Institutional Fund, Inc.
Annual Report — December 31, 2016
Statement of Assets and Liabilities (cont'd) | | December 31, 2016
(000) | |
CLASS I: | |
Net Assets | | $ | 726,787 | | |
| Shares Outstanding $0.001 par value shares of beneficial interest (unlimited shares authorized) (not in 000's) | | | 20,655,074 | | |
Net Asset Value, Offering and Redemption Price Per Share | | $ | 35.19 | | |
CLASS A: | |
Net Assets | | $ | 1,376,836 | | |
| Shares Outstanding $0.001 par value shares of beneficial interest (unlimited shares authorized) (not in 000's) | | | 40,529,492 | | |
Net Asset Value, Redemption Price Per Share | | $ | 33.97 | | |
Maximum Sales Load | | | 5.25 | % | |
Maximum Sales Charge | | $ | 1.88 | | |
Maximum Offering Price Per Share | | $ | 35.85 | | |
CLASS L: | |
Net Assets | | $ | 74,324 | | |
| Shares Outstanding $0.001 par value shares of beneficial interest (unlimited shares authorized) (not in 000's) | | | 2,258,993 | | |
Net Asset Value, Offering and Redemption Price Per Share | | $ | 32.90 | | |
CLASS C: | |
Net Assets | | $ | 16,613 | | |
| Shares Outstanding $0.001 par value shares of beneficial interest (unlimited shares authorized) (not in 000's) | | | 506,349 | | |
Net Asset Value, Offering and Redemption Price Per Share | | $ | 32.81 | | |
CLASS IS: | |
Net Assets | | $ | 875,021 | | |
| Shares Outstanding $0.001 par value shares of beneficial interest (unlimited shares authorized) (not in 000's) | | | 24,772,037 | | |
Net Asset Value, Offering and Redemption Price Per Share | | $ | 35.32 | | |
(1) Including:
Securities on Loan, at Value: | | $ | 170,195 | | |
The accompanying notes are an integral part of the financial statements.
9
Morgan Stanley Institutional Fund, Inc.
Annual Report — December 31, 2016
Statement of Operations | | Year Ended
December 31, 2016
(000) | |
Investment Income: | |
Dividends from Securities of Unaffiliated Issuers | | $ | 13,194 | | |
Income from Securities Loaned — Net | | | 8,917 | | |
Dividends from Securities of Affiliated Issuer (Note G) | | | 246 | | |
Total Investment Income | | | 22,357 | | |
Expenses: | |
Advisory Fees (Note B) | | | 14,863 | | |
Shareholder Services Fees — Class A (Note D) | | | 3,792 | | |
Distribution and Shareholder Services Fees — Class L (Note D) | | | 604 | | |
Distribution and Shareholder Services Fees — Class C (Note D) | | | 161 | | |
Administration Fees (Note C) | | | 2,712 | | |
Sub Transfer Agency Fees — Class I | | | 697 | | |
Sub Transfer Agency Fees — Class A | | | 1,711 | | |
Sub Transfer Agency Fees — Class L | | | 110 | | |
Sub Transfer Agency Fees — Class C | | | 20 | | |
Transfer Agency Fees — Class I (Note E) | | | 57 | | |
Transfer Agency Fees — Class A (Note E) | | | 261 | | |
Transfer Agency Fees — Class L (Note E) | | | 21 | | |
Transfer Agency Fees — Class C (Note E) | | | 6 | | |
Transfer Agency Fees — Class IS (Note E) | | | 4 | | |
Shareholder Reporting Fees | | | 290 | | |
Registration Fees | | | 164 | | |
Custodian Fees (Note F) | | | 129 | | |
Professional Fees | | | 129 | | |
Directors' Fees and Expenses | | | 50 | | |
Pricing Fees | | | 3 | | |
Other Expenses | | | 99 | | |
Total Expenses | | | 25,883 | | |
Rebate from Morgan Stanley Affiliate (Note G) | | | (98 | ) | |
Reimbursement of Custodian Fees (Note F) | | | (53 | ) | |
Net Expenses | | | 25,732 | | |
Net Investment Loss | | | (3,375 | ) | |
Realized Gain: | |
Investments Sold | | | 267,162 | | |
Foreign Currency Transactions | | | 76 | | |
Net Realized Gain | | | 267,238 | | |
Change in Unrealized Appreciation (Depreciation): | |
Investments | | | (327,432 | ) | |
Net Realized Gain and Change in Unrealized Appreciation (Depreciation) | | | (60,194 | ) | |
Net Decrease in Net Assets Resulting from Operations | | $ | (63,569 | ) | |
The accompanying notes are an integral part of the financial statements.
10
Morgan Stanley Institutional Fund, Inc.
Annual Report — December 31, 2016
Statements of Changes in Net Assets | | Year Ended
December 31, 2016
(000) | | Year Ended
December 31, 2015
(000) | |
Increase (Decrease) in Net Assets: | |
Operations: | |
Net Investment Loss | | $ | (3,375 | ) | | $ | (12,030 | ) | |
Net Realized Gain | | | 267,238 | | | | 440,001 | | |
Net Change in Unrealized Appreciation (Depreciation) | | | (327,432 | ) | | | (38,092 | ) | |
Net Increase (Decrease) in Net Assets Resulting from Operations | | | (63,569 | ) | | | 389,879 | | |
Distributions from and/or in Excess of: | |
Class I: | |
Net Realized Gain | | | (93,975 | ) | | | (62,204 | ) | |
Class A: | |
Net Realized Gain | | | (177,189 | ) | | | (119,469 | ) | |
Class L: | |
Net Realized Gain | | | (9,653 | ) | | | (6,732 | ) | |
Class C: | |
Net Realized Gain | | | (2,102 | ) | | | (797 | ) | |
Class IS: | |
Net Realized Gain | | | (108,125 | ) | | | (72,693 | ) | |
Total Distributions | | | (391,044 | ) | | | (261,895 | ) | |
Capital Share Transactions:(1) | |
Class I: | |
Subscribed | | | 245,890 | | | | 191,278 | | |
Distributions Reinvested | | | 90,086 | | | | 60,112 | | |
Redeemed | | | (373,817 | ) | | | (200,306 | ) | |
Class A: | |
Subscribed | | | 129,312 | | | | 180,513 | | |
Distributions Reinvested | | | 171,522 | | | | 115,656 | | |
Redeemed | | | (348,180 | ) | | | (269,270 | ) | |
Class L: | |
Exchanged | | | 179 | | | | — | | |
Subscribed | | | — | | | | 2,348 | | |
Distributions Reinvested | | | 9,458 | | | | 6,581 | | |
Redeemed | | | (12,432 | ) | | | (12,246 | ) | |
Class C: | |
Subscribed | | | 8,747 | | | | 13,781 | * | |
Distributions Reinvested | | | 1,791 | | | | 677 | * | |
Redeemed | | | (5,168 | ) | | | (484 | )* | |
Class IS: | |
Subscribed | | | 115,188 | | | | 127,805 | | |
Distributions Reinvested | | | 103,631 | | | | 68,414 | | |
Redeemed | | | (241,921 | ) | | | (181,658 | ) | |
Net Increase (Decrease) in Net Assets Resulting from Capital Share Transactions | | | (105,714 | ) | | | 103,201 | | |
Total Increase (Decrease) in Net Assets | | | (560,327 | ) | | | 231,185 | | |
Net Assets: | |
Beginning of Period | | | 3,629,908 | | | | 3,398,723 | | |
End of Period (Including Accumulated Net Investment Loss of $(1,960) and $(671)) | | $ | 3,069,581 | | | $ | 3,629,908 | | |
The accompanying notes are an integral part of the financial statements.
11
Morgan Stanley Institutional Fund, Inc.
Annual Report — December 31, 2016
Statements of Changes in Net Assets (cont'd) | | Year Ended
December 31, 2016
(000) | | Year Ended
December 31, 2015
(000) | |
(1) Capital Share Transactions: | |
Class I: | |
Shares Subscribed | | | 6,488 | | | | 4,598 | | |
Shares Issued on Distributions Reinvested | | | 2,487 | | | | 1,464 | | |
Shares Redeemed | | | (10,000 | ) | | | (4,832 | ) | |
Net Increase (Decrease) in Class I Shares Outstanding | | | (1,025 | ) | | | 1,230 | | |
Class A: | |
Shares Subscribed | | | 3,580 | | | | 4,418 | | |
Shares Issued on Distributions Reinvested | | | 4,892 | | | | 2,896 | | |
Shares Redeemed | | | (9,425 | ) | | | (6,635 | ) | |
Net Increase (Decrease) in Class A Shares Outstanding | | | (953 | ) | | | 679 | | |
Class L: | |
Exchanged | | | 5 | | | | — | | |
Shares Subscribed | | | — | | | | 59 | | |
Shares Issued on Distributions Reinvested | | | 278 | | | | 168 | | |
Shares Redeemed | | | (348 | ) | | | (306 | ) | |
Net Decrease in Class L Shares Outstanding | | | (65 | ) | | | (79 | ) | |
Class C: | |
Shares Subscribed | | | 246 | | | | 348 | * | |
Shares Issued on Distributions Reinvested | | | 53 | | | | 17 | * | |
Shares Redeemed | | | (145 | ) | | | (12 | )* | |
Net Increase in Class C Shares Outstanding | | | 154 | | | | 353 | | |
Class IS: | |
Shares Subscribed | | | 3,101 | | | | 3,094 | | |
Shares Issued on Distributions Reinvested | | | 2,849 | | | | 1,662 | | |
Shares Redeemed | | | (6,336 | ) | | | (4,375 | ) | |
Net Increase (Decrease) in Class IS Shares Outstanding | | | (386 | ) | | | 381 | | |
* For the period April 30, 2015 through December 31, 2015.
The accompanying notes are an integral part of the financial statements.
12
Morgan Stanley Institutional Fund, Inc.
Annual Report — December 31, 2016
Financial Highlights
Growth Portfolio
| | | Class I | |
| | | Year Ended December 31, | |
Selected Per Share Data and Ratios | | 2016(1) | | 2015 | | 2014 | | 2013 | | 2012 | |
Net Asset Value, Beginning of Period | | $ | 40.44 | | | $ | 38.86 | | | $ | 38.38 | | | $ | 27.05 | | | $ | 23.46 | | |
Income (Loss) from Investment Operations: | |
Net Investment Income (Loss) (2) | | | 0.01 | | | | (0.07 | ) | | | (0.03 | ) | | | 0.02 | | | | 0.16 | | |
Net Realized and Unrealized Gain (Loss) | | | (0.79 | ) | | | 4.70 | | | | 2.43 | | | | 13.02 | | | | 3.52 | | |
Total from Investment Operations | | | (0.78 | ) | | | 4.63 | | | | 2.40 | | | | 13.04 | | | | 3.68 | | |
Distributions from and/or in Excess of: | |
Net Investment Income | | | — | | | | — | | | | (0.00 | )(3) | | | (0.13 | ) | | | (0.05 | ) | |
Net Realized Gain | | | (4.47 | ) | | | (3.05 | ) | | | (1.92 | ) | | | (1.58 | ) | | | (0.04 | ) | |
Total Distributions | | | (4.47 | ) | | | (3.05 | ) | | | (1.92 | ) | | | (1.71 | ) | | | (0.09 | ) | |
Net Asset Value, End of Period | | $ | 35.19 | | | $ | 40.44 | | | $ | 38.86 | | | $ | 38.38 | | | $ | 27.05 | | |
Total Return (4) | | | (1.91 | )% | | | 11.91 | % | | | 6.42 | % | | | 48.60 | % | | | 15.66 | % | |
Ratios and Supplemental Data: | |
Net Assets, End of Period (Thousands) | | $ | 726,787 | | | $ | 876,660 | | | $ | 794,648 | | | $ | 989,649 | | | $ | 661,073 | | |
Ratio of Expenses to Average Net Assets (8) | | | 0.63 | %(5) | | | 0.61 | %(5) | | | 0.69 | %(5)(6) | | | 0.70 | %(5) | | | 0.72 | %(5) | |
Ratio of Net Investment Income (Loss) to Average Net Assets (8) | | | 0.02 | %(5) | | | (0.18 | )%(5) | | | (0.08 | )%(5) | | | 0.08 | %(5) | | | 0.59 | %(5) | |
Ratio of Rebate from Morgan Stanley Affiliates to Average Net Assets | | | 0.00 | %(7) | | | 0.00 | %(7) | | | 0.01 | % | | | 0.01 | % | | | 0.00 | %(7) | |
Portfolio Turnover Rate | | | 39 | % | | | 34 | % | | | 44 | % | | | 31 | % | | | 49 | % | |
(8) Supplemental Information on the Ratios to Average Net Assets: | |
Ratios Before Expense Limitation: | |
Expenses to Average Net Assets | | | 0.63 | % | | | N/A | | | | N/A | | | | 0.71 | % | | | N/A | | |
Net Investment Income to Average Net Assets | | | 0.02 | % | | | N/A | | | | N/A | | | | 0.07 | % | | | N/A | | |
(1) Refer to Note F in the Notes to Financial Statements for discussion of prior period custodian out-of pocket expenses that were reimbursed in the current period. The amount of the reimbursement was immaterial on a per share basis and did not impact the total return of Class I shares. The Ratio of Expenses to Average Net Assets would have been less than 0.005% higher and the Ratio of Net Investment Income to Average Net Assets would have been less than 0.005% lower had the custodian not reimbursed the Portfolio.
(2) Per share amount is based on average shares outstanding.
(3) Amount is less than $0.005 per share.
(4) Calculated based on the net asset value as of the last business day of the period.
(5) The Ratios of Expenses and Net Investment Income (Loss) reflect the rebate of certain Portfolio expenses in connection with the investments in Morgan Stanley affiliates during the period. The effect of the rebate on the ratios is disclosed in the above table as "Ratio of Rebate from Morgan Stanley Affiliates to Average Net Assets."
(6) Effective April 7, 2014, the Adviser has agreed to limit the ratio of expenses to average net assets to the maximum ratio of 0.70% for Class I shares. Prior to April 7, 2014, the maximum ratio was 0.80% for Class I shares.
(7) Amount is less than 0.005%.
The accompanying notes are an integral part of the financial statements.
13
Morgan Stanley Institutional Fund, Inc.
Annual Report — December 31, 2016
Financial Highlights
Growth Portfolio
| | | Class A | |
| | | Year Ended December 31, | |
Selected Per Share Data and Ratios | | 2016(1) | | 2015 | | 2014 | | 2013 | | 2012 | |
Net Asset Value, Beginning of Period | | $ | 39.31 | | | $ | 37.98 | | | $ | 37.61 | | | $ | 26.53 | | | $ | 23.03 | | |
Income (Loss) from Investment Operations: | |
Net Investment Income (Loss) (2) | | | (0.10 | ) | | | (0.21 | ) | | | (0.13 | ) | | | (0.06 | ) | | | 0.09 | | |
Net Realized and Unrealized Gain (Loss) | | | (0.77 | ) | | | 4.59 | | | | 2.42 | | | | 12.78 | | | | 3.45 | | |
Total from Investment Operations | | | (0.87 | ) | | | 4.38 | | | | 2.29 | | | | 12.72 | | | | 3.54 | | |
Distributions from and/or in Excess of: | |
Net Investment Income | | | — | | | | — | | | | — | | | | (0.06 | ) | | | — | | |
Net Realized Gain | | | (4.47 | ) | | | (3.05 | ) | | | (1.92 | ) | | | (1.58 | ) | | | (0.04 | ) | |
Total Distributions | | | (4.47 | ) | | | (3.05 | ) | | | (1.92 | ) | | | (1.64 | ) | | | (0.04 | ) | |
Net Asset Value, End of Period | | $ | 33.97 | | | $ | 39.31 | | | $ | 37.98 | | | $ | 37.61 | | | $ | 26.53 | | |
Total Return (3) | | | (2.21 | )% | | | 11.53 | % | | | 6.25 | % | | | 48.22 | % | | | 15.36 | % | |
Ratios and Supplemental Data: | |
Net Assets, End of Period (Thousands) | | $ | 1,376,836 | | | $ | 1,630,538 | | | $ | 1,549,756 | | | $ | 205,286 | | | $ | 138,416 | | |
Ratio of Expenses to Average Net Assets (7) | | | 0.92 | %(4) | | | 0.96 | %(4) | | | 0.83 | %(4)(5) | | | 0.95 | %(4)(5) | | | 0.97 | %(4) | |
Ratio of Net Investment Income (Loss) to Average Net Assets (7) | | | (0.26 | )%(4) | | | (0.52 | )%(4) | | | (0.34 | )%(4) | | | (0.18 | )%(4) | | | 0.34 | %(4) | |
Ratio of Rebate from Morgan Stanley Affiliates to Average Net Assets | | | 0.00 | %(6) | | | 0.00 | %(6) | | | 0.00 | %(6) | | | 0.01 | % | | | 0.00 | %(6) | |
Portfolio Turnover Rate | | | 39 | % | | | 34 | % | | | 44 | % | | | 31 | % | | | 49 | % | |
(7) Supplemental Information on the Ratios to Average Net Assets: | |
Ratios Before Expense Limitation: | |
Expenses to Average Net Assets | | | 0.92 | % | | | 0.96 | % | | | N/A | | | | 0.96 | % | | | N/A | | |
Net Investment Loss to Average Net Assets | | | (0.26 | )% | | | (0.52 | )% | | | N/A | | | | (0.19 | )% | | | N/A | | |
(1) Refer to Note F in the Notes to Financial Statements for discussion of prior period custodian out-of pocket expenses that were reimbursed in the current period. The amount of the reimbursement was immaterial on a per share basis and did not impact the total return of Class I shares. The Ratio of Expenses to Average Net Assets would have been less than 0.005% higher and the Ratio of Net Investment Loss to Average Net Assets would have been less than 0.005% lower had the custodian not reimbursed the Portfolio.
(2) Per share amount is based on average shares outstanding.
(3) Calculated based on the net asset value which does not reflect sales charges, if applicable, as of the last business day of the period.
(4) The Ratios of Expenses and Net Investment Income (Loss) reflect the rebate of certain Portfolio expenses in connection with the investments in Morgan Stanley affiliates during the period. The effect of the rebate on the ratios is disclosed in the above table as "Ratio of Rebate from Morgan Stanley Affiliates to Average Net Assets."
(5) Effective April 7, 2014, the Adviser has agreed to limit the ratio of expenses to average net assets to the maximum ratios of 1.05% for Class A shares. Prior to April 7, 2014, the maximum ratio was 1.15% for Class A shares. Prior to September 16, 2013, the maximum ratio was 1.05% for Class A shares.
(6) Amount is less than 0.005%.
The accompanying notes are an integral part of the financial statements.
14
Morgan Stanley Institutional Fund, Inc.
Annual Report — December 31, 2016
Financial Highlights
Growth Portfolio
| | | Class L | |
| | | Year Ended December 31, | | Period from
April 27, 2012(2) to | |
Selected Per Share Data and Ratios | | 2016(1) | | 2015 | | 2014 | | 2013 | | December 31, 2012 | |
Net Asset Value, Beginning of Period | | $ | 38.41 | | | $ | 37.40 | | | $ | 37.26 | | | $ | 26.43 | | | $ | 27.60 | | |
Income (Loss) from Investment Operations: | |
Net Investment Income (Loss) (3) | | | (0.29 | ) | | | (0.44 | ) | | | (0.31 | ) | | | (0.38 | ) | | | 0.03 | | |
Net Realized and Unrealized Gain (Loss) | | | (0.75 | ) | | | 4.50 | | | | 2.38 | | | | 12.84 | | | | (1.16 | ) | |
Total from Investment Operations | | | (1.04 | ) | | | 4.06 | | | | 2.07 | | | | 12.46 | | | | (1.13 | ) | |
Distributions from and/or in Excess of: | |
Net Investment Income | | | — | | | | — | | | | (0.01 | ) | | | (0.05 | ) | | | (0.00 | )(4) | |
Net Realized Gain | | | (4.47 | ) | | | (3.05 | ) | | | (1.92 | ) | | | (1.58 | ) | | | (0.04 | ) | |
Total Distributions | | | (4.47 | ) | | | (3.05 | ) | | | (1.93 | ) | | | (1.63 | ) | | | (0.04 | ) | |
Net Asset Value, End of Period | | $ | 32.90 | | | $ | 38.41 | | | $ | 37.40 | | | $ | 37.26 | | | $ | 26.43 | | |
Total Return (5) | | | (2.72 | )% | | | 10.85 | % | | | 5.72 | % | | | 47.44 | % | | | (4.10 | )%(9) | |
Ratios and Supplemental Data: | |
Net Assets, End of Period (Thousands) | | $ | 74,324 | | | $ | 89,277 | | | $ | 89,854 | | | $ | 528 | | | $ | 10 | | |
Ratio of Expenses to Average Net Assets (11) | | | 1.45 | %(6) | | | 1.55 | %(6) | | | 1.29 | %(6)(7) | | | 1.60 | %(6)(7) | | | 1.51 | %(6)(10) | |
Ratio of Net Investment Income (Loss) to Average Net Assets (11) | | | (0.79 | )%(6) | | | (1.11 | )%(6) | | | (0.82 | )%(6) | | | (1.09 | )%(6) | | | 0.20 | %(6)(10) | |
Ratio of Rebate from Morgan Stanley Affiliates to Average Net Assets | | | 0.00 | %(8) | | | 0.00 | %(8) | | | 0.00 | %(8) | | | 0.01 | % | | | 0.00 | %(8)(10) | |
Portfolio Turnover Rate | | | 39 | % | | | 34 | % | | | 44 | % | | | 31 | % | | | 49 | %(9) | |
(11) Supplemental Information on the Ratios to Average Net Assets: | |
Ratios Before Expense Limitation: | |
Expenses to Average Net Assets | | | 1.45 | % | | | 1.57 | % | | | N/A | | | | 1.72 | % | | | N/A | | |
Net Investment Loss to Average Net Assets | | | (0.79 | )% | | | (1.13 | )% | | | N/A | | | | (1.21 | )% | | | N/A | | |
(1) Refer to Note F in the Notes to Financial Statements for discussion of prior period custodian out-of pocket expenses that were reimbursed in the current period. The amount of the reimbursement was immaterial on a per share basis and did not impact the total return of Class I shares. The Ratio of Expenses to Average Net Assets would have been less than 0.005% higher and the Ratio of Net Investment Loss to Average Net Assets would have been less than 0.005% lower had the custodian not reimbursed the Portfolio.
(2) Commencement of Offering.
(3) Per share amount is based on average shares outstanding.
(4) Amount is less than $0.005 per share.
(5) Calculated based on the net asset value as of the last business day of the period.
(6) The Ratios of Expenses and Net Investment Income (Loss) reflect the rebate of certain Portfolio expenses in connection with the investments in Morgan Stanley affiliates during the period. The effect of the rebate on the ratios is disclosed in the above table as "Ratio of Rebate from Morgan Stanley Affiliates to Average Net Assets."
(7) Effective April 7, 2014, the Adviser has agreed to limit the ratio of expenses to average net assets to the maximum ratio of 1.55% for Class L shares. Prior to April 7, 2014, the maximum ratio was 1.65% for Class L shares. Prior to September 16, 2013, the maximum ratio was 1.55% for Class L shares.
(8) Amount is less than 0.005%.
(9) Not Annualized.
(10) Annualized.
The accompanying notes are an integral part of the financial statements.
15
Morgan Stanley Institutional Fund, Inc.
Annual Report — December 31, 2016
Financial Highlights
Growth Portfolio
| | | Class C | |
Selected Per Share Data and Ratios | | Year Ended
December 31, 2016(1) | | Period from
April 30, 2015(2) to
December 31, 2015 | |
Net Asset Value, Beginning of Period | | $ | 38.40 | | | $ | 40.33 | | |
Income (Loss) from Investment Operations: | |
Net Investment Loss (3) | | | (0.38 | ) | | | (0.35 | ) | |
Net Realized and Unrealized Gain (Loss) | | | (0.74 | ) | | | 1.47 | | |
Total from Investment Operations | | | (1.12 | ) | | | 1.12 | | |
Distributions from and/or in Excess of: | |
Net Realized Gain | | | (4.47 | ) | | | (3.05 | ) | |
Net Asset Value, End of Period | | $ | 32.81 | | | $ | 38.40 | | |
Total Return (4) | | | (2.93 | )% | | | 2.71 | %(7) | |
Ratios and Supplemental Data: | |
Net Assets, End of Period (Thousands) | | $ | 16,613 | | | $ | 13,544 | | |
Ratio of Expenses to Average Net Assets (9) | | | 1.70 | %(5) | | | 1.62 | %(5)(8) | |
Ratio of Net Investment Loss to Average Net Assets (Loss) (9) | | | (1.04 | )%(5) | | | (1.29 | )%(5)(8) | |
Ratio of Rebate from Morgan Stanley Affiliates to Average Net Assets | | | 0.00 | %(6) | | | 0.00 | %(6)(8) | |
Portfolio Turnover Rate | | | 39 | % | | | 34 | % | |
(9) Supplemental Information on the Ratios to Average Net Assets: | |
Ratios Before Expense Limitation: | |
Expenses to Average Net Assets | | | 1.70 | % | | | N/A | | |
Net Investment Loss to Average Net Assets | | | (1.04 | )% | | | N/A | | |
(1) Refer to Note F in the Notes to Financial Statements for discussion of prior period custodian out-of pocket expenses that were reimbursed in the current period. The amount of the reimbursement was immaterial on a per share basis and did not impact the total return of Class I shares. The Ratio of Expenses to Average Net Assets would have been less than 0.005% higher and the Ratio of Net Investment Loss to Average Net Assets would have been less than 0.005% lower had the custodian not reimbursed the Portfolio.
(2) Commencement of Offering.
(3) Per share amount is based on average shares outstanding.
(4) Calculated based on the net asset value which does not reflect sales charges, if applicable, as of the last business day of the period.
(5) The Ratios of Expenses and Net Investment Loss reflect the rebate of certain Portfolio expenses in connection with the investments in Morgan Stanley affiliates during the period. The effect of the rebate on the ratios is disclosed in the above table as "Ratio of Rebate from Morgan Stanley Affiliates to Average Net Assets."
(6) Amount is less than 0.005%.
(7) Not Annualized.
(8) Annualized.
The accompanying notes are an integral part of the financial statements.
16
Morgan Stanley Institutional Fund, Inc.
Annual Report — December 31, 2016
Financial Highlights
Growth Portfolio
| | | Class IS | |
| | | Year Ended December 31, | | Period from
September 13, 2013(2) to | |
Selected Per Share Data and Ratios | | 2016(1) | | 2015 | | 2014 | | December 31, 2013 | |
Net Asset Value, Beginning of Period | | $ | 40.54 | | | $ | 38.92 | | | $ | 38.40 | | | $ | 34.45 | | |
Income (Loss) from Investment Operations: | |
Net Investment Income (Loss) (3) | | | 0.05 | | | | (0.04 | ) | | | (0.05 | ) | | | (0.02 | ) | |
Net Realized and Unrealized Gain (Loss) | | | (0.80 | ) | | | 4.71 | | | | 2.50 | | | | 5.55 | | |
Total from Investment Operations | | | (0.75 | ) | | | 4.67 | | | | 2.45 | | | | 5.53 | | |
Distributions from and/or in Excess of: | |
Net Investment Income | | | — | | | | — | | | | (0.01 | ) | | | — | | |
Net Realized Gain | | | (4.47 | ) | | | (3.05 | ) | | | (1.92 | ) | | | (1.58 | ) | |
Total Distributions | | | (4.47 | ) | | | (3.05 | ) | | | (1.93 | ) | | | (1.58 | ) | |
Net Asset Value, End of Period | | $ | 35.32 | | | $ | 40.54 | | | $ | 38.92 | | | $ | 38.40 | | |
Total Return (4) | | | (1.83 | )% | | | 11.97 | % | | | 6.60 | % | | | 16.20 | %(8) | |
Ratios and Supplemental Data: | |
Net Assets, End of Period (Thousands) | | $ | 875,021 | | | $ | 1,019,889 | | | $ | 964,465 | | | $ | 11 | | |
Ratio of Expenses to Average Net Assets (10) | | | 0.54 | %(5) | | | 0.54 | %(5) | | | 0.54 | %(5)(6) | | | 0.60 | %(5)(9) | |
Ratio of Net Investment Income (Loss) to Average Net Assets (10) | | | 0.12 | %(5) | | | (0.10 | )%(5) | | | (0.12 | )%(5) | | | (0.16 | )%(5)(9) | |
Ratio of Rebate from Morgan Stanley Affiliates to Average Net Assets | | | 0.00 | %(7) | | | 0.00 | %(7) | | | 0.01 | % | | | 0.01 | %(9) | |
Portfolio Turnover Rate | | | 39 | % | | | 34 | % | | | 44 | % | | | 31 | %(8) | |
(10) Supplemental Information on the Ratios to Average Net Assets: | |
Ratios Before Expense Limitation: | |
Expenses to Average Net Assets | | | 0.54 | % | | | N/A | | | | 0.55 | % | | | 5.60 | %(9) | |
Net Investment Loss to Average Net Assets | | | 0.12 | % | | | N/A | | | | (0.13 | )% | | | (5.16 | )%(9) | |
(1) Refer to Note F in the Notes to Financial Statements for discussion of prior period custodian out-of pocket expenses that were reimbursed in the current period. The amount of the reimbursement was immaterial on a per share basis and did not impact the total return of Class I shares. The Ratio of Expenses to Average Net Assets would have been less than 0.005% higher and the Ratio of Net Investment Income to Average Net Assets would have been less than 0.005% lower had the custodian not reimbursed the Portfolio.
(2) Commencement of Offering.
(3) Per share amount is based on average shares outstanding.
(4) Calculated based on the net asset value as of the last business day of the period.
(5) The Ratios of Expenses and Net Investment Income (Loss) reflect the rebate of certain Portfolio expenses in connection with the investments in Morgan Stanley affiliates during the period. The effect of the rebate on the ratios is disclosed in the above table as "Ratio of Rebate from Morgan Stanley Affiliates to Average Net Assets."
(6) Effective April 7, 2014, the Adviser has agreed to limit the ratio of expenses to average net assets to the maximum ratio of 0.67% for Class IS shares. Prior to April 7, 2014, the maximum ratio was 0.73% for Class IS shares.
(7) Amount is less than 0.005%.
(8) Not Annualized.
(9) Annualized.
The accompanying notes are an integral part of the financial statements.
17
Morgan Stanley Institutional Fund, Inc.
Annual Report — December 31, 2016
Notes to Financial Statements
Morgan Stanley Institutional Fund, Inc. (the "Fund") is registered under the Investment Company Act of 1940, as amended (the "Act"), as an open-end management investment company. The Fund is comprised of twenty-nine separate, active, diversified and non-diversified portfolios (individually referred to as a "Portfolio", collectively as the "Portfolios"). The Fund applies investment company accounting and reporting guidance.
The accompanying financial statements relate to the Growth Portfolio. The Portfolio seeks long-term capital appreciation by investing primarily in growth oriented equity securities of large capitalization companies.
The Portfolio offers five classes of shares — Class I, Class A, Class L, Class C and Class IS. On April 30, 2015, the Portfolio suspended offering of Class L shares. Existing Class L shareholders may invest through reinvestment of dividends and distributions.
A. Significant Accounting Policies: The following significant accounting policies are in conformity with U.S. generally accepted accounting principles ("GAAP"). Such policies are consistently followed by the Fund in the preparation of its financial statements. GAAP may require management to make estimates and assumptions that affect the reported amounts and disclosures in the financial statements. Actual results may differ from those estimates.
1. Security Valuation: (1) An equity portfolio security listed or traded on an exchange is valued at its latest reported sales price (or at the exchange official closing price if such exchange reports an official closing price), and if there were no sales on a given day and if there is no official exchange closing price for that day, the security is valued at the mean between the last reported bid and asked prices if such bid and asked prices are available on the relevant exchanges; (2) all other equity portfolio securities for which over-the-counter ("OTC") market quotations are readily available are valued at the latest reported sales price (or at the market official closing price if such market reports an official closing price), and if there was no trading in the security on a given day and if there is no official closing price from relevant markets for that day, the security is valued at the mean between the last reported bid and asked prices if such bid and asked prices are available on the relevant markets. Listed equity securities not traded on the valuation date with no reported bid and asked prices available on the exchange are valued at the mean
between the current bid and asked prices obtained from one or more reputable brokers or dealers. An unlisted equity security that does not trade on the valuation date and for which bid and asked prices from the relevant markets are unavailable is valued at the mean between the current bid and asked prices obtained from one or more reputable brokers or dealers. In cases where a security is traded on more than one exchange, the security is valued on the exchange designated as the primary market; (3) certain portfolio securities may be valued by an outside pricing service/vendor approved by the Fund's Board of Directors (the "Directors"). The pricing service/vendor may employ a pricing model that takes into account, among other things, bids, yield spreads, and/or other market data and specific security characteristics. Alternatively, if a valuation is not available from an outside pricing service/vendor, and the security trades on an exchange, the security may be valued at its latest reported sale price (or at the exchange official closing price if such exchange reports an official closing price), prior to the time when assets are valued. If there are no sales on a given day and if there is no official exchange closing price for that day, the security is valued at the mean between the last reported bid and asked prices if such bid and asked prices are available in the relevant exchanges; (4) Listed options are valued at the last reported sales price on the exchange on which they are listed (or at the exchange official closing price if such exchange reports an official closing price). If an official closing price or last reported sale price is unavailable, the listed option should be fair valued at the mean between its latest bid and ask prices. Unlisted options are valued at the mean between their latest bid and ask prices from a broker/dealer or valued by a pricing service/vendor; (5) when market quotations are not readily available, including circumstances under which Morgan Stanley Investment Management Inc. (the "Adviser") determines that the closing price, last sale price or the mean between the last reported bid and asked prices are not reflective of a security's market value, portfolio securities are valued at their fair value as determined in good faith under procedures established by and under the general supervision of the Directors. Occasionally, developments affecting the closing prices of securities and other assets may occur between the times at which valuations of such securities are determined (that is, close of the foreign market on which the securities trade) and the close of business of the New York Stock Exchange ("NYSE"). If developments occur during such periods that
18
Morgan Stanley Institutional Fund, Inc.
Annual Report — December 31, 2016
Notes to Financial Statements (cont'd)
are expected to materially affect the value of such securities, such valuations may be adjusted to reflect the estimated fair value of such securities as of the close of the NYSE, as determined in good faith by the Directors or by the Adviser using a pricing service and/or procedures approved by the Directors; (6) quotations of foreign portfolio securities, other assets and liabilities and forward contracts stated in foreign currency are translated into U.S. dollar equivalents at the prevailing market rates prior to the close of the NYSE; and (7) investments in mutual funds, including the Morgan Stanley Institutional Liquidity Funds, are valued at the net asset value ("NAV") as of the close of each business day.
The Directors have responsibility for determining in good faith the fair value of the investments, and the Directors may appoint others, such as the Fund's Adviser or a valuation committee, to assist the Directors in determining fair value and to make the actual calculations pursuant to the fair valuation methodologies previously approved by the Directors. Under procedures approved by the Directors, the Fund's Adviser has formed a Valuation Committee whose members are approved by the Directors. The Valuation Committee provides administration and oversight of the Fund's valuation policies and procedures, which are reviewed at least annually by the Directors. These procedures allow the Fund to utilize independent pricing services, quotations from securities and financial instrument dealers, and other market sources to determine fair value.
The Fund has procedures to determine the fair value of securities and other financial instruments for which market prices are not readily available. Under these procedures, the Valuation Committee convenes on a regular and ad hoc basis to review such securities and considers a number of factors, including valuation methodologies and significant unobservable valuation inputs, when arriving at fair value. The Valuation Committee may employ a market-based approach which may use related or comparable assets or liabilities, recent transactions, market multiples, book values, and other relevant information for the investment to determine the fair value of the investment. An income-based valuation approach may also be used in which the anticipated future cash flows of the investment are discounted to calculate fair value. Discounts may also be applied due to the nature or duration of any restrictions on the disposition of the
investments. Due to the inherent uncertainty of valuations of such investments, the fair values may differ significantly from the values that would have been used had an active market existed. The Valuation Committee employs various methods for calibrating these valuation approaches including a regular review of valuation methodologies, key inputs and assumptions, transactional back-testing or disposition analysis, and reviews of any related market activity.
2. Fair Value Measurement: Financial Accounting Standards Board ("FASB") Accounting Standards CodificationTM ("ASC") 820, "Fair Value Measurement" ("ASC 820"), defines fair value as the value that the Fund would receive to sell an investment or pay to transfer a liability in a timely transaction with an independent buyer in the principal market, or in the absence of a principal market, the most advantageous market for the investment or liability. ASC 820 establishes a three-tier hierarchy to distinguish between (1) inputs that reflect the assumptions market participants would use in valuing an asset or liability developed based on market data obtained from sources independent of the reporting entity (observable inputs) and (2) inputs that reflect the reporting entity's own assumptions about the assumptions market participants would use in valuing an asset or liability developed based on the best information available in the circumstances (unobservable inputs) and to establish classification of fair value measurements for disclosure purposes. Various inputs are used in determining the value of the Fund's investments. The inputs are summarized in the three broad levels listed below.
• Level 1 – unadjusted quoted prices in active markets for identical investments
• Level 2 – other significant observable inputs (including quoted prices for similar investments, interest rates, prepayment speeds, credit risk, etc.)
• Level 3 – significant unobservable inputs including the Fund's own assumptions in determining the fair value of investments. Factors considered in making this determination may include, but are not limited to, information obtained by contacting the issuer, analysts, or the appropriate stock exchange (for exchange-traded securities), analysis of the
19
Morgan Stanley Institutional Fund, Inc.
Annual Report — December 31, 2016
Notes to Financial Statements (cont'd)
issuer's financial statements or other available documents and, if necessary, available information concerning other securities in similar circumstances
The inputs or methodology used for valuing securities are not necessarily an indication of the risk associated with investing in those securities and the determination of the significance of a particular input to the fair value measurement in its entirety requires judgment and considers factors specific to each security.
The following is a summary of the inputs used to value the Portfolio's investments as of December 31, 2016.
Investment Type | | Level 1
Unadjusted
quoted
prices
(000) | | Level 2
Other
significant
observable
inputs
(000) | | Level 3
Significant
unobservable
inputs
(000) | | Total
(000) | |
Assets: | |
Common Stocks | |
Aerospace &
Defense | | $ | 106,537 | | | $ | — | | | $ | — | | | $ | 106,537 | | |
Automobiles | | | 168,150 | | | | — | | | | — | | | | 168,150 | | |
Biotechnology | | | 20,350 | | | | — | | | | — | | | | 20,350 | | |
Capital Markets | | | 136,334 | | | | — | | | | — | | | | 136,334 | | |
Diversified Financial
Services | | | 45,891 | | | | — | | | | — | | | | 45,891 | | |
Health Care
Equipment &
Supplies | | | 176,835 | | | | — | | | | — | | | | 176,835 | | |
Health Care
Technology | | | 86,807 | | | | — | | | | — | | | | 86,807 | | |
Hotels, Restaurants &
Leisure | | | 78,525 | | | | — | | | | — | | | | 78,525 | | |
Information
Technology
Services | | | 242,521 | | | | — | | | | — | | | | 242,521 | | |
Internet & Direct
Marketing Retail | | | 420,125 | | | | — | | | | — | | | | 420,125 | | |
Internet Software &
Services | | | 618,500 | | | | — | | | | — | | | | 618,500 | | |
Life Sciences Tools &
Services | | | 153,510 | | | | — | | | | — | | | | 153,510 | | |
Semiconductors &
Semiconductor
Equipment | | | 118,226 | | | | — | | | | — | | | | 118,226 | | |
Software | | | 426,717 | | | | — | | | | — | | | | 426,717 | | |
Textiles, Apparel &
Luxury Goods | | | 83,701 | | | | — | | | | — | | | | 83,701 | | |
Total Common Stocks | | | 2,882,729 | | | | — | | | | — | | | | 2,882,729 | | |
Investment Type | | Level 1
Unadjusted
quoted
prices
(000) | | Level 2
Other
significant
observable
inputs
(000) | | Level 3
Significant
unobservable
inputs
(000) | | Total
(000) | |
Preferred Stocks | | $ | — | | | $ | — | | | $ | 139,530 | | | $ | 139,530 | | |
Call Option Purchased | | | — | | | | 1,527 | | | | — | | | | 1,527 | | |
Short-Term
Investments | |
Investment Company | | | 240,982 | | | | — | | | | — | | | | 240,982 | | |
Repurchase
Agreements | | | — | | | | 27,797 | | | | — | | | | 27,797 | | |
Total Short-Term
Investments | | | 240,982 | | | | 27,797 | | | | — | | | | 268,779 | | |
Total Assets | | $ | 3,123,711 | | | $ | 29,324 | | | $ | 139,530 | | | $ | 3,292,565 | | |
Transfers between investment levels may occur as the markets fluctuate and/or the availability of data used in an investment's valuation changes. The Portfolio recognizes transfers between the levels as of the end of the period. As of December 31, 2016, the Portfolio did not have any investments transfer between investment levels.
Following is a reconciliation of investments in which significant unobservable inputs (Level 3) were used in determining fair value.
| | | Common
Stock
(000) | | Preferred
Stocks
(000) | |
Beginning Balance | | $ | 13,688 | | | $ | 142,388 | | |
Purchases | | | — | | | | — | | |
Sales | | | (16,333 | ) | | | — | | |
Amortization of discount | | | — | | | | — | | |
Transfers in | | | — | | | | — | | |
Transfers out | | | — | | | | — | | |
Corporate actions | | | — | | | | — | | |
Change in unrealized appreciation (depreciation) | | | 7,093 | | | | (2,858 | ) | |
Realized gains (losses) | | | (4,448 | ) | | | — | | |
Ending Balance | | $ | — | | | $ | 139,530 | | |
Net change in unrealized appreciation
(depreciation) from investments still
held as of December 31, 2016 | | $ | — | | | $ | (2,858 | ) | |
20
Morgan Stanley Institutional Fund, Inc.
Annual Report — December 31, 2016
Notes to Financial Statements (cont'd)
The following table presents additional information about valuation techniques and inputs used for investments that are measured at fair value and categorized within Level 3 as of December 31, 2016. Various valuation techniques were used in the valuation of certain investments and weighted based on the level of significance.
| | | Fair Value at
December 31, 2016
(000) | | Valuation
Technique | | Unobservable
Input | | Range | | Selected
Value | | Impact to
Valuation from an
Increase in Input | |
Electronic Equipment, Instuments & Components | |
Preferred Stock | | $ | 18,278 | | | Discounted Cash Flow | | Weighted Average
Cost of Capital | | | 25.0 | % | | | 27.0 | % | | | 26.0 | % | | Decrease | |
| | | | | | | Perpetual Growth Rate | | | 3.0 | % | | | 4.0 | % | | | 3.5 | % | | Increase | |
| | | | | Market Comparable
Companies | | Enterprise Value/
Revenue | | | 10.6x | | | | 24.7 | x | | | 19.4 | x | | Increase | |
| | | | | Discount for Lack of | | Marketability | | | 20.0 | % | | | 20.0 | % | | | 20.0 | % | | Decrease | |
Internet & Direct Marketing Retail | |
Preferred Stocks | | $ | 53,273 | | | Market Transaction
Method | | Precedent Transaction | | $ | 105.00 | | | $ | 105.00 | | | $ | 105.00 | | | Increase | |
| | | | | Discounted Cash Flow | | Weighted Average
Cost of Capital | | | 15.5 | % | | | 17.5 | % | | | 16.5 | % | | Decrease | |
| | | | | | | Perpetual Growth Rate | | | 3.0 | % | | | 4.0 | % | | | 3.5 | % | | Increase | |
| | | | | Market Comparable
Companies | | Enterprise Value/
Revenue | | | 9.8 | x | | | 16.2 | x | | | 12.8 | x | | Increase | |
| | | | | Discount for Lack of | | Marketability | | | 20.0 | % | | | 20.0 | % | | | 20.0 | % | | Decrease | |
| | | $ | 10,501 | | | Discounted Cash Flow | | Weighted Average
Cost of Capital | | | 17.5 | % | | | 19.5 | % | | | 18.5 | % | | Decrease | |
| | | | | | | Perpetual Growth Rate | | | 3.5 | % | | | 4.5 | % | | | 4.0 | % | | Increase | |
| | | | | Market Comparable
Companies | | Enterprise Value/
Revenue | | | 1.1x | | | | 2.8 | x | | | 2.2 | x | | Increase | |
| | | | | | | Discount for Lack of
Marketability | | | 20.0 | % | | | 20.0 | % | | | 20.0 | % | | Decrease | |
| | | $ | 54,173 | | | Market Transaction
Method | | Precedent Transaction | | | $48.77 | | | $ | 48.77 | | | | $48.77 | | | Increase | |
Internet Software & Services | |
Preferred Stock | | $ | 3,305 | | | Discounted Cash Flow | | Weighted Average
Cost of Capital | | | 18.0 | % | | | 20.0 | % | | | 19.0 | % | | Decrease | |
| | | | | | | Perpetual Growth Rate | | | 2.5 | % | | | 3.5 | % | | | 3.0 | % | | Increase | |
| | | | | Market Comparable
Companies | | Enterprise Value/
Revenue | | | 4.1 | x | | | 11.2 | x | | | 5.5 | x | | Increase | |
| | | | | | | Discount for Lack of
Marketability | | | 20.0 | % | | | 20.0 | % | | | 20.0 | % | | Decrease | |
3. Repurchase Agreements: The Portfolio may enter into repurchase agreements under which the Portfolio lends cash and takes possession of securities with an agreement that the counterparty will repurchase such securities. In connection with transactions in repurchase agreements, a bank as custodian for the Portfolio takes possession of the underlying securities which are held as collateral, with a market value at least equal to the amount of the
repurchase transaction, including principal and accrued interest. To the extent that any repurchase transaction exceeds one business day, the value of the collateral is marked-to-market on a daily basis to determine that the value of the collateral does not decrease below the repurchase price plus accrued interest as earned. If such a decrease occurs, additional collateral will be requested and, when received, will be added to the account to maintain
21
Morgan Stanley Institutional Fund, Inc.
Annual Report — December 31, 2016
Notes to Financial Statements (cont'd)
full collateralization. In the event of default on the obligation to repurchase, the Portfolio has the right to liquidate the collateral and apply the proceeds in satisfaction of the obligation. In the event of default or bankruptcy by the counterparty to the agreement, realization of the collateral proceeds may be subject to cost and delays. The Portfolio, along with other affiliated investment companies, may utilize a joint trading account for the purpose of entering into repurchase agreements.
4. Foreign Currency Translation and Foreign Investments: The books and records of the Portfolio are maintained in U.S. dollars. Foreign currency amounts are translated into U.S. dollars as follows:
– investments, other assets and liabilities at the prevailing rate of exchange on the valuation date;
– investment transactions and investment income at the prevailing rates of exchange on the dates of such transactions.
Although the net assets of the Portfolio are presented at the foreign exchange rates and market values at the close of the period, the Portfolio does not isolate that portion of the results of operations arising as a result of changes in the foreign exchange rates from the fluctuations arising from changes in the market prices of securities held at period end. Similarly, the Portfolio does not isolate the effect of changes in foreign exchange rates from the fluctuations arising from changes in the market prices of securities sold during the period. Accordingly, realized and unrealized foreign currency gains (losses) on investments in securities are included in the reported net realized and unrealized gains (losses) on investment transactions and balances. However, pursuant to U.S. federal income tax regulations, gains and losses from certain foreign currency transactions and the foreign currency portion of gains and losses realized on sales and maturities of foreign denominated debt securities are treated as ordinary income for U.S. federal income tax purposes.
Net realized gains (losses) on foreign currency transactions represent net foreign exchange gains (losses) from foreign currency forward exchange contracts, disposition of foreign currencies, currency gains (losses) realized between the trade and settlement dates on securities transactions, and the difference between the amount of investment income and foreign withholding taxes
recorded on the Portfolio's books and the U.S. dollar equivalent amounts actually received or paid. Net unrealized currency gains (losses) from valuing foreign currency denominated assets and liabilities at period end exchange rates are reflected as a component of unrealized appreciation (depreciation) in the Statement of Assets and Liabilities. The change in unrealized currency gains (losses) on foreign currency translations for the period is reflected in the Statement of Operations.
Foreign security and currency transactions may involve certain considerations and risks not typically associated with those of U.S. dollar denominated transactions as a result of, among other factors, fluctuations of exchange rates in relation to the U.S. dollar, the possibility of lower levels of governmental supervision and regulation of foreign securities markets and the possibility of political or economic instability.
Governmental approval for foreign investments may be required in advance of making an investment under certain circumstances in some countries, and the extent of foreign investments in domestic companies may be subject to limitation in other countries. Foreign ownership limitations also may be imposed by the charters of individual companies to prevent, among other concerns, violations of foreign investment limitations. As a result, an additional class of shares (identified as "Foreign" in the Portfolio of Investments) may be created and offered for investment. The "local" and "foreign shares" market values may differ. In the absence of trading of the foreign shares in such markets, the Portfolio values the foreign shares at the closing exchange price of the local shares.
5. Derivatives: The Portfolio may, but is not required to, use derivative instruments for a variety of purposes, including hedging, risk management, portfolio management or to earn income. Derivatives are financial instruments whose value is based, in part, on the value of an underlying asset, interest rate, index or financial instrument. Prevailing interest rates and volatility levels, among other things, also affect the value of derivative instruments. A derivative instrument often has risks similar to its underlying asset and may have additional risks, including imperfect correlation between the value of the derivative and the underlying asset, risks of default by the counterparty to certain transactions, magnification of losses incurred due to changes in the market value of the securities, instruments, indices or interest rates to which the derivative
22
Morgan Stanley Institutional Fund, Inc.
Annual Report — December 31, 2016
Notes to Financial Statements (cont'd)
instrument relates, risks that the transactions may not be liquid and risks arising from margin requirements. The use of derivatives involves risks that are different from, and possibly greater than, the risks associated with other portfolio investments. Derivatives may involve the use of highly specialized instruments that require investment techniques and risk analyses different from those associated with other portfolio investments. All of the Portfolio's holdings, including derivative instruments, are marked-to-market each day with the change in value reflected in unrealized appreciation (depreciation). Upon disposition, a realized gain or loss is recognized.
Certain derivative transactions may give rise to a form of leverage. Leverage magnifies the potential for gain and the risk of loss. Leverage associated with derivative transactions may cause the Portfolio to liquidate portfolio positions when it may not be advantageous to do so to satisfy its obligations or to meet earmarking or segregation requirements, pursuant to applicable Securities and Exchange Commission rules and regulations, or may cause the Portfolio to be more volatile than if the Portfolio had not been leveraged. Although the Adviser seeks to use derivatives to further the Portfolio's investment objectives, there is no assurance that the use of derivatives will achieve this result.
Following is a description of the derivative instruments and techniques that the Portfolio used during the period and their associated risks:
Options: With respect to options, the Portfolio is subject to equity risk, interest rate risk and foreign currency exchange risk in the normal course of pursuing its investment objectives. If the Portfolio buys an option, it buys a legal contract giving it the right to buy or sell a specific amount of the underlying instrument or foreign currency, or futures contract on the underlying instrument or foreign currency, at an agreed-upon price typically in exchange for a premium paid by the Portfolio. The Portfolio may purchase and/or sell put and call options. Purchasing call options tends to increase the Portfolio's exposure to the underlying (or similar) instrument. Purchasing put options tends to decrease the Portfolio's exposure to the underlying (or similar) instrument. When entering into purchased option contracts, the Portfolio bears the risk of interest or exchange
rates or securities prices moving unexpectedly, in which case, the Portfolio may not achieve the anticipated benefits of the purchased option contracts; however the risk of loss is limited to the premium paid. Purchased options are reported as part of "Total Investments in Securities" in the Statement of Assets and Liabilities. Premium paid for purchasing options which expired are treated as realized losses. If the Portfolio sells an option, it sells to another party the right to buy from or sell to the Portfolio a specific amount of the underlying instrument or foreign currency, or futures contract on the underlying instrument or foreign currency, at an agreed-upon price typically in exchange for a premium received by the Portfolio. When options are purchased OTC, the Portfolio bears the risk that the counterparty that wrote the option will be unable or unwilling to perform its obligations under the option contract. Options may also be illiquid and the Portfolio may have difficulty closing out its position. A decision as to whether, when and how to use options involves the exercise of skill and judgment and even a well-conceived option transaction may be unsuccessful because of market behavior or unexpected events. The prices of options can be highly volatile and the use of options can lower total returns.
FASB ASC 815, "Derivatives and Hedging" ("ASC 815"), is intended to improve financial reporting about derivative instruments by requiring enhanced disclosures to enable investors to better understand how and why the Portfolio uses derivative instruments, how these derivative instruments are accounted for and their effects on the Portfolio's financial position and results of operations.
The following table sets forth the fair value of the Portfolio's derivative contracts by primary risk exposure as of December 31, 2016.
| | | Asset Derivatives
Statement of Assets and
Liabilities Location | | Primary Risk
Exposure | | Value
(000) | |
Options Purchased
| | Investments, at Value
(Options Purchased) | | Currency Risk | | $ | 1,527 | (a) | |
(a) Amounts are included in Investments in Securities in the Statement of Assets and Liabilities.
The following tables set forth by primary risk exposure the Portfolio's realized gains (losses) and change in unrealized appreciation (depreciation) by type of derivative contract
23
Morgan Stanley Institutional Fund, Inc.
Annual Report — December 31, 2016
Notes to Financial Statements (cont'd)
for the year ended December 31, 2016 in accordance with ASC 815.
Realized Gain (Loss) | |
Primary Risk Exposure | | Derivative Type | | Value
(000) | |
Currency Risk
| | Investments
(Options Purchased) | | $ | (3,651 | )(b) | |
(b) Amounts are included in Investments Sold in the Statement of Operations.
Change in Unrealized Appreciation (Depreciation) | |
Primary Risk Exposure | | Derivative Type | | Value
(000) | |
Currency Risk
| | Investments
(Options Purchased) | | $ | (6,516 | )(c) | |
(c) Amounts are included in Investments in the Statement of Operations.
At December 31, 2016, the Portfolio's derivative assets and liabilities are as follows:
Gross Amounts of Assets and Liabilities Presented in the
Statement of Assets and Liabilities | |
Derivatives | | Assets(d)
(000) | | Liabilities(d)
(000) | |
Options Purchased | | $ | 1,527 | (a) | | $ | — | | |
(a) Amounts are included in Investments in Securities in the Statement of Assets and Liabilities.
(d) Absent an event of default or early termination, OTC derivative assets and liabilities are presented gross and not offset in the Statement of Assets and Liabilities.
The Portfolio typically enters into International Swaps and Derivatives Association, Inc. Master Agreements ("ISDA Master Agreements") or similar master agreements (collectively, "Master Agreements") with its contract counterparties for certain OTC derivatives in order to, among other things, reduce its credit risk to counterparties. ISDA Master Agreements include provisions for general obligations, representations, collateral and events of default or termination. Under an ISDA Master Agreement, the Portfolio typically may offset with the counterparty certain OTC derivative financial instruments' payables and/or receivables with collateral held and/or posted and create one single net payment (close-out netting) in the event of default, termination and/or potential deterioration in the credit quality of the counterparty. Various Master Agreements govern the terms of certain transactions with counterparties, including transactions such as swap, forward, repurchase and reverse repurchase agreements. These Master Agreements typically attempt to reduce the counterparty risk associated with such transactions by specifying credit protection mechanisms and providing standardization that improves legal certainty. Cross-termination provisions under Master Agreements typically provide that a default in connection
with one transaction between the Portfolio and a counterparty gives the non-defaulting party the right to terminate any other transactions in place with the defaulting party to create one single net payment due to/due from the defaulting party and may be a feature in certain Master Agreements. In the event the Portfolio exercises its right to terminate a Master Agreement after a counterparty experiences a termination event as defined in the Master Agreement, the return of collateral with market value in excess of the Portfolio's net liability may be delayed or denied.
The following table presents derivative financial instruments that are subject to enforceable netting arrangements as of December 31, 2016.
Gross Amounts Not Offset in the Statement of Assets and Liabilities | |
Counterparty | | Gross Asset
Derivatives
Presented in
Statement of
Assets and
Liabilities
(000) | | Financial
Instrument
(000) | | Collateral
Received
(000) | | Net Amount
(not less
than $0)
(000) | |
Royal Bank of Scotland | | $ | 1,527 | | | $ | — | | | $ | (1,370 | ) | | $ | 157 | | |
For the year ended December 31, 2016, the approximate average monthly amount outstanding for each derivative type is as follows:
Options Purchased: | |
Average monthly notional amount | | | 493,280,000 | | |
6. Securities Lending: The Portfolio lends securities to qualified financial institutions, such as broker-dealers, to earn additional income. Any increase or decrease in the fair value of the securities loaned that might occur and any interest earned or dividends declared on those securities during the term of the loan would remain in the Portfolio. The Portfolio would receive cash or securities as collateral in an amount equal to or exceeding 100% of the current fair value of the loaned securities. The collateral is marked-to-market daily by State Street Bank and Trust Company ("State Street"), the securities lending agent, to ensure that a minimum of 100% collateral coverage is maintained.
Based on pre-established guidelines, the securities lending agent invests any cash collateral that is received in an affiliated money market portfolio and repurchase agreements. Securities lending income is generated from the earnings on the invested collateral and borrowing fees, less any rebates owed to the borrowers and compensation to the lending agent, and is recorded as "Income from Securities Loaned — Net" in the Portfolio's Statement of Operations. Risks in securities lending
24
Morgan Stanley Institutional Fund, Inc.
Annual Report — December 31, 2016
Notes to Financial Statements (cont'd)
transactions are that a borrower may not provide additional collateral when required or return the securities when due, and that the value of the short-term investments will be less than the amount of cash collateral plus any rebate that is required to be returned to the borrower.
The Portfolio has the right under the lending agreement to recover the securities from the borrower on demand.
The following table presents financial instruments that are subject to enforceable netting arrangements as of December 31, 2016.
Gross Amounts Not Offset in the Statement of Assets and Liabilities | |
Gross Asset
Amounts
Presented in
Statement of
Assets and
Liabilities
(000) | | Financial
Instrument
(000) | | Collateral
Received
(000) | | Net Amount
(not less
than $0)
(000) | |
| $ | 170,195 | (e) | | $ | — | | | $ | (170,195 | )(f)(g) | | $ | 0 | | |
(e) Represents market value of loaned securities at period end.
(f) The Portfolio received cash collateral of approximately $137,225,000, of which approximately $137,007,000 was subsequently invested in a Repurchase Agreement and Morgan Stanley Institutional Liquidity Funds as reported in the Portfolio of Investments. As of December 31, 2016, there was uninvested cash of approximately $218,000, which is not reflected in the Portfolio of Investments. In addition, the Portfolio received non-cash collateral of approximately $37,686,000 in the form of U.S. Government obligations, which the Portfolio cannot sell or repledge, and accordingly are not reflected in the Portfolio of Investments.
(g) The actual collateral received is greater than the amount shown here due to overcollateralization.
FASB Accounting Standards Update No. 2014-11 ("ASU No. 2014-11"), "Transfers & Servicing (Topic 860): Repurchase-to-Maturity Transactions, Repurchase Financings, and Disclosures", is intended to provide increased transparency about the types of collateral pledged in securities lending transactions and other similar transactions that are accounted for as secured borrowing.
The following table displays a breakdown of transactions accounted for as secured borrowings, the gross obligations by class of collateral pledged, and the remaining contractual maturity of those transactions as of December 31, 2016.
| | | Remaining Contractual Maturity of the Agreements | |
| | | Overnight and
Continuous
(000) | | <30 days
(000) | | Between
30 &
90 days
(000) | | >90 days
(000) | | Total
(000) | |
Securities Lending
Transactions | |
Common Stocks | | $ | 137,225 | | | $ | — | | | $ | — | | | $ | — | | | $ | 137,225 | | |
Total Borrowings | | $ | 137,225 | | | $ | — | | | $ | — | | | $ | — | | | $ | 137,225 | | |
Gross amount of
recognized liabilities
for securities lending
transactions | | | | | | | | | | $ | 137,225 | | |
7. Restricted Securities: The Portfolio invests in unregistered or otherwise restricted securities. The term "restricted securities" refers to securities that are unregistered or are held by control persons of the issuer and securities that are subject to contractual restrictions on their resale. As a result, restricted securities may be more difficult to value and the Portfolio may have difficulty disposing of such assets either in a timely manner or for a reasonable price. In order to dispose of an unregistered security, the Portfolio, where it has contractual rights to do so, may have to cause such security to be registered. A considerable period may elapse between the time the decision is made to sell the security and the time the security is registered so that the Portfolio could sell it. Contractual restrictions on the resale of securities vary in length and scope and are generally the result of a negotiation between the issuer and acquirer of the securities. The Portfolio would, in either case, bear market risks during that period. Restricted securities are identified in the Portfolio of Investments.
8. Indemnifications: The Fund enters into contracts that contain a variety of indemnifications. The Fund's maximum exposure under these arrangements is unknown. However, the Fund has not had prior claims or losses pursuant to these contracts and expects the risk of loss to be remote.
9. Dividends and Distributions to Shareholders: Dividend income and distributions to shareholders are recorded on the ex-dividend date. Dividends from net investment income, if any, are declared and paid annually. Net realized capital gains, if any, are distributed at least annually.
10. Security Transactions, Income and Expenses: Security transactions are accounted for on the trade date (date the order to buy or sell is executed). Realized gains and losses on the sale of investment securities are determined on the specific identified cost method. Dividend
25
Morgan Stanley Institutional Fund, Inc.
Annual Report — December 31, 2016
Notes to Financial Statements (cont'd)
income and other distributions are recorded on the ex-dividend date (except for certain foreign dividends which may be recorded as soon as the Portfolio is informed of such dividends) net of applicable withholding taxes. Interest income is recognized on the accrual basis except where collection is in doubt. Discounts are accreted and premiums are amortized over the life of the respective securities. Most expenses of the Fund can be directly attributed to a particular Portfolio. Expenses which cannot be directly attributed are apportioned among the Portfolios based upon relative net assets or other appropriate methods. Income, expenses (other than class specific expenses — distribution and shareholder services, transfer agency and sub transfer agency fees) and realized and unrealized gains or losses are allocated to each class of shares based upon their relative net assets.
B. Advisory Fees: The Adviser, a wholly-owned subsidiary of Morgan Stanley, provides the Portfolio with advisory services under the terms of an Investment Advisory Agreement, paid quarterly, at the annual rate based on the daily net assets as follows:
First $1
billion | | Next $1
billion | | Next $1
billion | | Over $3
billion | |
| | 0.50 | % | | | 0.45 | % | | | 0.40 | % | | | 0.35 | % | |
For the year ended December 31, 2016, the advisory fee rate (net of rebate) was equivalent to an annual effective rate of 0.44% of the Portfolio's average daily net assets.
The Adviser has agreed to reduce its advisory fee and/or reimburse the Portfolio so that total annual portfolio operating expenses, excluding certain investment related expenses, taxes, interest and other extraordinary expenses (including litigation), will not exceed 0.70% for Class I shares, 1.05% for Class A shares, 1.55% for Class L shares, 1.80% for Class C shares and 0.67% for Class IS shares. In addition, the Adviser has agreed to reimburse 0.01% of expenses of the Class A shares to the extent that total annual operating expenses of the Class A shares exceed 0.96%. Effective April 07, 2016, Adviser has agreed to reduce its advisory fee and/or reimburse the Portfolio so that total annual operating expenses, will not exceed 0.80% for Class I shares, 1.15% for Class A shares, 1.65% for Class L shares, 1.90% for Class C shares and 0.73% for Class IS shares. The fee waivers and/or expense reimbursements will continue for at least one year from the date of the Portfolio's prospectus or until such time as the Directors act to discontinue all or a portion of such waivers and/or reimbursements when they deem such action is appropriate. This arrangement had no effect during the most recent reporting period.
C. Administration Fees: The Adviser also serves as Administrator to the Fund and provides administrative services pursuant to an Administration Agreement for an annual fee, accrued daily and paid monthly, of 0.08% of the Portfolio's average daily net assets.
Under a Sub-Administration Agreement between the Administrator and State Street, State Street provides certain administrative services to the Fund. For such services, the Administrator pays State Street a portion of the fee the Administrator receives from the Portfolio.
D. Distribution and Shareholder Services Fees: Morgan Stanley Distribution, Inc. ("MSDI" or the "Distributor"), a wholly-owned subsidiary of the Adviser and an indirect subsidiary of Morgan Stanley, serves as the Fund's Distributor of Portfolio shares pursuant to a Distribution Agreement. The Fund has adopted a Shareholder Services Plan with respect to Class A shares pursuant to Rule 12b-1 under the Act. Under the Shareholder Services Plan, the Portfolio pays the Distributor a shareholder services fee, accrued daily and paid monthly, at an annual rate of 0.25% of the Portfolio's average daily net assets attributable to Class A shares.
The Fund has adopted a Distribution and Shareholder Services Plan with respect to Class L shares pursuant to Rule 12b-1 under the Act. Under the Distribution and Shareholder Services Plan, the Portfolio pays the Distributor a distribution fee, accrued daily and paid monthly, at an annual rate of 0.50% and a shareholder services fee, accrued daily and paid monthly, at an annual rate of 0.25% of the Portfolio's average daily net assets attributable to Class L shares.
The Fund has adopted a Distribution and Shareholder Services Plan with respect to Class C shares pursuant to Rule 12b-1 under the Act. Under the Distribution and Shareholder Services Plan, the Portfolio pays the Distributor a distribution fee, accrued daily and paid monthly, at an annual rate of 0.75% and a shareholder services fee, accrued daily and paid monthly, at an annual rate of 0.25% of the Portfolio's average daily net assets attributable to Class C shares.
The distribution and shareholder services fees are used to support the expenses associated with servicing and maintaining accounts. The Distributor may compensate other parties for providing shareholder support services to investors who purchase Class A, Class L and Class C shares.
E. Dividend Disbursing and Transfer Agent: The Fund's dividend disbursing and transfer agent is Boston Financial Data Services, Inc. ("BFDS"). Pursuant to a Transfer
26
Morgan Stanley Institutional Fund, Inc.
Annual Report — December 31, 2016
Notes to Financial Statements (cont'd)
Agency Agreement, the Fund pays BFDS a fee based on the number of classes, accounts and transactions relating to the Portfolios of the Fund.
F. Custodian Fees: State Street (the "Custodian") serves as Custodian for the Fund in accordance with a Custodian Agreement. The Custodian holds cash, securities, and other assets of the Fund as required by the Act. Custody fees are payable monthly based on assets held in custody, investment purchases and sales activity and account maintenance fees, plus reimbursement for certain out-of-pocket expenses.
In December 2015, the Fund's Custodian announced that it had identified inconsistencies in the way in which clients were invoiced for out-of-pocket expenses from 1998 until November 2015. The dollar amount difference between what was charged and what should have been charged, plus interest, was paid back to the Portfolio in September 2016 as a reimbursement. The Custodian reimbursed the Portfolio directly, which was recognized as a change in accounting estimate and was reflected as "Reimbursement of Custodian Fees" in the Statement of Operations.
G. Security Transactions and Transactions with Affiliates: For the year ended December 31, 2016, purchases and sales of investment securities for the Portfolio, other than long-term U.S. Government securities and short-term investments, were approximately $1,284,244,000 and $1,688,280,000, respectively. There were no purchases and sales of long-term U.S. Government securities for the year ended December 31, 2016.
The Portfolio invests in the Institutional Class of the Morgan Stanley Institutional Liquidity Funds (the "Liquidity Funds"), an open-end management investment company managed by the Adviser, both directly and as a portion of the securities held as collateral on loaned securities. Advisory fees paid by the Portfolio are reduced by an amount equal to its pro-rata share of the advisory and administration fees paid by the Portfolio due to its investment in the Liquidity Funds. For the year ended December 31, 2016, advisory fees paid were reduced by approximately $98,000 relating to the Portfolio's investment in the Liquidity Funds.
A summary of the Portfolio's transactions in shares of the Liquidity Funds during the year ended December 31, 2016 is as follows:
Value
December 31,
2015
(000) | | Purchases
at Cost
(000) | | Sales
(000) | | Dividend
Income
(000) | | Value
December 31,
2016
(000) | |
| $ | 302,829 | | | $ | 1,201,519 | | | $ | 1,263,366 | | | $ | 246 | | | $ | 240,982 | | |
The Portfolio is permitted to purchase and sell securities ("cross-trade") from and to other Morgan Stanley Funds as well as other funds and client accounts for which the Adviser or an affiliate of the Adviser serves as investment adviser, pursuant to procedures approved by the Directors in compliance with Rule 17a-7 under the Act (the "Rule"). Each cross-trade is executed at the current market price in compliance with provisions of the Rule. For the year ended December 31, 2016, the Portfolio did not engage in any cross-trade transactions.
The Portfolio has an unfunded Deferred Compensation Plan (the "Compensation Plan"), which allows each independent Director to defer payment of all, or a portion, of the fees he or she receives for serving on the Board of Directors. Each eligible Director generally may elect to have the deferred amounts credited with a return equal to the total return on one or more of the Morgan Stanley funds that are offered as investment options under the Compensation Plan. Appreciation/depreciation and distributions received from these investments are recorded with an offsetting increase/decrease in the deferred compensation obligation and do not affect the NAV of the Portfolio.
H. Federal Income Taxes: It is the Portfolio's intention to continue to qualify as a regulated investment company and distribute all of its taxable and tax-exempt income. Accordingly, no provision for federal income taxes is required in the financial statements.
The Portfolio may be subject to taxes imposed by countries in which it invests. Such taxes are generally based on income and/or capital gains earned or repatriated. Taxes are accrued based on net investment income, net realized gains and net unrealized appreciation as such income and/or gains are earned. Taxes may also be based on transactions in foreign currency and are accrued based on the value of investments denominated in such currency.
FASB ASC 740-10, "Income Taxes — Overall", sets forth a minimum threshold for financial statement recognition of the benefit of a tax position taken or expected to be taken in a tax return. Management has concluded that there are no significant uncertain tax positions that would require recognition in the financial statements. If applicable, the Portfolio recognizes interest accrued related to unrecognized tax benefits in "Interest Expense" and penalties in "Other Expenses" in the Statement of Operations. The Portfolio files tax returns with the U.S. Internal Revenue Service, New York and various states. Generally, each of the tax years in the four-year period ended December 31, 2016, remains subject to examination by taxing authorities.
27
Morgan Stanley Institutional Fund, Inc.
Annual Report — December 31, 2016
Notes to Financial Statements (cont'd)
The tax character of distributions paid may differ from the character of distributions shown in the Statements of Changes in Net Assets due to short-term capital gains being treated as ordinary income for tax purposes. The tax character of distributions paid during fiscal years 2016 and 2015 was as follows:
2016
Distributions
Paid From: | | 2015
Distributions
Paid From: | |
Ordinary
Income
(000) | | Long-Term
Capital Gain
(000) | | Ordinary
Income
(000) | | Long-Term
Capital Gain
(000) | |
| $ | — | | | $ | 391,044 | | | $ | 5,086 | | | $ | 256,809 | | |
The amount and character of income and gains to be distributed are determined in accordance with income tax regulations which may differ from GAAP. These book/tax differences are either considered temporary or permanent in nature.
Temporary differences are primarily due to differing book and tax treatments in the timing of the recognition of gains (losses) on certain investment transactions and the timing of the deductibility of certain expenses.
Permanent differences, primarily due to differing treatments of gains (losses) related to foreign currency transactions, a net operating loss and basis adjustments on partnerships, resulted in the following reclassifications among the components of net assets at December 31, 2016:
Accumulated
Net Investment
Loss
(000) | | Accumulated
Net Realized
Gain
(000) | | Paid-in-
Capital
(000) | |
| $ | 2,086 | | | $ | 5,897 | | | $ | (7,983 | ) | |
At December 31, 2016, the components of distributable earnings for the Portfolio on a tax basis were as follows:
Undistributed
Ordinary
Income
(000) | | Undistributed
Long-Term
Capital Gain
(000) | |
| $ | — | | | $ | 88,015 | | |
Qualified late year losses are capital losses and specified ordinary losses, including currency losses, incurred after October 31 but within the taxable year that, if elected, are deemed to arise on the first day of the Portfolio's next taxable year. For the year ended December 31, 2016, the Portfolio deferred to January 1, 2017 for U.S. federal income tax purposes the following losses:
Qualified Late
Year Ordinary
Losses
(000) | | Post-October
Capital Losses
(000) | |
| $ | 1,794 | | | $ | — | | |
I. Credit Facility: As of April 4, 2016, the Fund and other Morgan Stanley funds participated in a $150,000,000 committed, unsecured revolving line of credit facility (the "facility") with State Street. This facility is to be used for temporary emergency purposes or funding of shareholder redemption requests. The interest rate on borrowings is based on the federal funds rate or one month libor rate plus a spread. The facility also has a commitment fee of 0.25% per annum based on the unused portion of the facility. During the year ended December 31, 2016, the Portfolio did not have any borrowings under the facility.
J. Other: At December 31, 2016, the Portfolio had record owners of 10% or greater. Investment activities of these shareholders could have a material impact on the Portfolio. The aggregate percentage of such owners was 58.9%.
K. Accounting Pronouncements: In December 2016, FASB issued Accounting Standards update 2016-19 — Technical Corrections and Improvements ("ASU 2016-19"), which is effective for interim periods for all entities beginning after December 15, 2016. ASU 2016-19 includes an amendment to Topic 820, Fair Value Measurement, which clarifies the difference between a valuation approach and a valuation technique when applying the guidance in that Topic. That amendment also requires an entity to disclose when there has been a change in either or both a valuation approach and/or a valuation technique. The transition guidance for the amendment must be applied prospectively because it could potentially involve the use of hindsight that includes fair value measurements. Although still evaluating the potential impacts of ASU 2016-19 to the Portfolio, management expects that the impact of the Portfolio's adoption will be limited to additional financial statement disclosures.
In October 2016, the Securities and Exchange Commission ("SEC") issued a new rule, Investment Company Reporting Modernization, which, among other provisions, amends Regulation S-X to require standardized, enhanced disclosures, particularly related to derivatives, in investment company financial statements. Compliance with the guidance is effective for financial statements filed with the SEC on or after August 1, 2017; adoption will have no effect on the Portfolio's net assets or results of operations. Although still evaluating the potential impacts of the Investment Company Reporting Modernization to the Portfolio, management expects that the impact of the Portfolio's adoption will be limited to additional financial statement disclosures.
28
Morgan Stanley Institutional Fund, Inc.
Annual Report — December 31, 2016
Report of Independent Registered Public Accounting Firm
To the Shareholders and Board of Directors of
Morgan Stanley Institutional Fund, Inc. —
Growth Portfolio
We have audited the accompanying statement of assets and liabilities, including the portfolio of investments, of Growth Portfolio (one of the portfolios constituting Morgan Stanley Institutional Fund, Inc.) (the "Portfolio") as of December 31, 2016, and the related statement of operations for the year then ended, the statements of changes in net assets for each of the two years in the period then ended and the financial highlights for each of the years or periods indicated therein. These financial statements and financial highlights are the responsibility of the Portfolio's management. Our responsibility is to express an opinion on these financial statements and financial highlights based on our audits.
We conducted our audits in accordance with the standards of the Public Company Accounting Oversight Board (United States). Those standards require that we plan and perform the audit to obtain reasonable assurance about whether the financial statements and financial highlights are free of material misstatement. We were not engaged to perform an audit of the Portfolio's internal control over financial reporting. Our audits included consideration of internal control over financial reporting as a basis for designing audit procedures that are appropriate in the circumstances, but not for the purpose of expressing an opinion on the effectiveness of the Portfolio's internal control over financial reporting. Accordingly, we express no such opinion. An audit also includes examining, on a test basis, evidence supporting the amounts and disclosures in the financial statements and financial highlights, assessing the accounting principles used and significant estimates made by management, and evaluating the overall financial statement presentation. Our procedures included confirmation of securities owned as of December 31, 2016, by correspondence with the custodian and others or by other appropriate auditing procedures where replies from others were not received. We believe that our audits provide a reasonable basis for our opinion.
In our opinion, the financial statements and financial highlights referred to above present fairly, in all material respects, the financial position of Growth Portfolio (one of the portfolios constituting Morgan Stanley Institutional Fund, Inc.) December 31, 2016, the results of its operations for the year then ended, the changes in its net assets for each of the two years in the period then ended and the financial highlights for each of the years or periods indicated therein, in conformity with U.S. generally accepted accounting principles.

Boston, Massachusetts
February 28, 2017
29
Morgan Stanley Institutional Fund, Inc.
Annual Report — December 31, 2016
Federal Tax Notice (unaudited)
For federal income tax purposes, the following information is furnished with respect to the distributions paid by the Portfolio during its taxable year ended December 31, 2016.
The Portfolio designated and paid approximately $391,044,000 as a long-term capital gain distribution.
In January, the Portfolio provides tax information to shareholders for the preceding calendar year.
30
Morgan Stanley Institutional Fund, Inc.
Annual Report — December 31, 2016
Privacy Notice (unaudited)
MORGAN STANLEY INVESTMENT MANAGEMENT INC.
AN IMPORTANT NOTICE CONCERNING OUR U.S. PRIVACY POLICY
We are required by federal law to provide you with a copy of our privacy policy annually. This policy applies to current and former individual investors in funds managed or sponsored by Morgan Stanley Investment Management Inc. ("MSIM") as well as current and former individual clients of MSIM. This policy is not applicable to partnerships, corporations, trusts or other non-individual clients or investors. Please note that we may amend this policy at any time, and will inform you of any changes as required by law.
WE RESPECT YOUR PRIVACY
We appreciate that you have provided us with your personal financial information. We strive to maintain the privacy of such information while we help you achieve your financial objectives. This Notice describes what non-public personal information we collect about you, why we collect it, when we may share it with others and how certain others may use it. It discusses the steps you may take to limit our sharing of certain information about you to affiliated companies in the Morgan Stanley family of companies ("other Morgan Stanley companies"). It also discloses how you may limit use of certain shared information for marketing purposes by other Morgan Stanley branded companies. Throughout this policy, we refer to the non-public information that personally identifies you or your accounts as "personal information.''
1. WHAT PERSONAL INFORMATION DO WE COLLECT ABOUT YOU?
We obtain personal information from applications and other forms you submit to us, from your dealings with us, from consumer reporting agencies, from our Web sites and from third parties and other sources.
For example:
• We may collect information such as your name, address, e-mail address, telephone/fax numbers, assets, income and investment objectives through subscription documents, applications and other forms you submit to us.
• We may obtain information about account balances, your use of account(s) and the types of products and services you prefer to receive from us through your dealings and transactions with us and other sources.
• We may obtain information about your creditworthiness and credit history from consumer reporting agencies.
• We may collect background information from and through third-party vendors to verify representations you have made and to comply with various regulatory requirements.
• If you interact with us through our public and private Web sites, we may collect information that you provide directly through online communications (such as an e-mail address). We may also collect information about your Internet service provider, your domain name, your computer's operating system and Web browser, your use of our Web sites and your product and service preferences, through the use of "cookies." Please consult the Terms of Use of these sites for more details.
2. WHEN DO WE DISCLOSE PERSONAL INFORMATION WE COLLECT ABOUT YOU?
We may disclose personal information we collect about you to other Morgan Stanley companies and to non-affiliated third parties.
a. Information We Disclose to Other Morgan Stanley Companies.
We may disclose personal information to other Morgan Stanley companies for a variety of reasons, including to manage your account(s) effectively, to service and process your transactions, to let you know about products and services offered by us and other Morgan Stanley companies, to manage our business, and as otherwise required or permitted by law. Offers for products and services from other Morgan Stanley companies are developed under conditions designed to safeguard your personal information.
31
Morgan Stanley Institutional Fund, Inc.
Annual Report — December 31, 2016
Privacy Notice (unaudited) (cont'd)
b. Information We Disclose to Non-affiliated Third Parties.
We do not disclose personal information that we collect about you to non-affiliated third parties except to those who provide marketing services on our behalf, to financial institutions with whom we have joint marketing agreements, and as otherwise required or permitted by law. For example, we may disclose personal information to nonaffiliated third parties for servicing and processing transactions, to offer our own products and services, to protect against fraud, for institutional risk control, to respond to judicial process or to perform services on our behalf. When we share personal information with a non-affiliated third party, they are required to limit their use of personal information to the particular purpose for which it was shared and they are not allowed to share personal information with others except to fulfill that limited purpose or as may be permitted or required by law.
3. HOW DO WE PROTECT THE SECURITY AND CONFIDENTIALITY OF PERSONAL INFORMATION WE COLLECT ABOUT YOU?
We maintain physical, electronic and procedural security measures to help safeguard the personal information we collect about you. We have internal policies governing the proper handling of client information. Third parties that provide support or marketing services on our behalf may also receive personal information, and we require them to adhere to confidentiality standards with respect to such information.
4. HOW CAN YOU LIMIT THE SHARING OF CERTAIN TYPES OF PERSONAL INFORMATION WITH OTHER MORGAN STANLEY COMPANIES?
We offer you choices as to whether we share with other Morgan Stanley companies the personal information that was collected to determine your eligibility for products and services you request ("eligibility information"). Eligibility information does not include your identification information or personal information pertaining to our transactions or experiences with you. Please note that, even if you direct us not to share eligibility information with other Morgan Stanley companies ("opt-out"), we may still share personal information, including eligibility information, with those companies in circumstances excluded from the opt-out under applicable law, such as to process transactions or to service your account.
5. HOW CAN YOU LIMIT THE USE OF CERTAIN TYPES OF PERSONAL INFORMATION BY OTHER MORGAN STANLEY COMPANIES FOR MARKETING?
By following the opt-out instructions in Section 6 below, you may limit other Morgan Stanley branded companies from marketing their products or services to you based on personal information we disclose to them. This information may include, for example, your income and account history with us. Please note that, even if you choose to limit Other Morgan Stanley Companies from using personal information about you that we may share with them for marketing their products and services to you, Other Morgan Stanley Companies may use your personal information that they obtain from us to market to you in circumstances permitted by law, such as if the Other Morgan Stanley Company has its own relationship with you.
6. HOW CAN YOU SEND US AN OPT-OUT INSTRUCTION?
If you wish to limit our sharing of eligibility information about you with other Morgan Stanley companies or other Morgan Stanley companies' use of personal information for marketing purposes, as described in this notice, you may do so by:
• Calling us at (800) 548-7786
Monday–Friday between 8a.m. and 6p.m.(EST)
• Writing to us at the following address:
Boston Financial Data Services, Inc.
c/o Privacy Coordinator
P.O. Box 219804
Kansas City, Missouri 64121
32
Morgan Stanley Institutional Fund, Inc.
Annual Report — December 31, 2016
Privacy Notice (unaudited) (cont'd)
Your written request should include your name, address, telephone number and account number(s) to which the opt-out applies and whether you are opting out with respect to sharing of eligibility information (Section 4 above), or if information used for Marketing (Section 5 above) or both. Written opt-out requests should not be sent with any other correspondence. In order to process your request, we require that the request be provided by you directly and not through a third party.
Your opt-out preference will remain in effect with respect to this policy (as it may be amended) until you notify us otherwise. If you have a joint account, your direction for us not to share this information with other Morgan Stanley companies and for those other Morgan Stanley companies not to use your personal information for marketing will be applied to all account holders on that account. Please understand that if you limit our sharing or our affiliated companies' use of personal information, you and any joint account holder(s) may not receive information about Morgan Stanley products and services, including products or services that could help you manage your financial resources and achieve your investment objectives.
7. WHAT IF AN AFFILIATED COMPANY BECOMES A NON-AFFILIATED THIRD PARTY?
If, at any time in the future, an affiliated company becomes a non-affiliated third party, further disclosures of personal information made to the former affiliated company will be limited to those described in Section 2(b) above relating to non-affiliated third parties. If you elected under Section 6 to limit disclosures we make to affiliated companies, or use of personal information by affiliated companies, your election will not apply to use by any former affiliated company of your personal information in their possession once it becomes a non-affiliated third party.
SPECIAL NOTICE TO RESIDENTS OF VERMONT
The following section supplements our policy with respect to our individual clients who have a Vermont address and supersedes anything to the contrary in the above policy with respect to those clients only.
The state of Vermont requires financial institutions to obtain your consent prior to sharing personal information that they collect about you with affiliated companies and non-affiliated third parties other than in certain limited circumstances. Except as permitted by law, we will not share personal information we collect about you with non-affiliated third parties or other Morgan Stanley companies unless you provide us with your written consent to share such information ("opt-in").
If you wish to receive offers for investment products and services offered by or through other Morgan Stanley companies, please notify us in writing at the following address:
Boston Financial Data Services, Inc.
c/o Privacy Coordinator
P.O. Box 219804
Kansas City, Missouri 64121
Your authorization should include your name, address, telephone number and account number(s) to which the opt-in applies and should not be sent with any other correspondence. In order to process your authorization, we require that the authorization be provided by you directly and not through a third party.
SPECIAL NOTICE TO RESIDENTS OF CALIFORNIA
The following section supplements our policy with respect to our individual clients who have a California address and supersedes anything to the contrary in the above policy with respect to those clients only.
In response to a California law, if your account has a California home address, your personal information will not be disclosed to nonaffiliated third parties except as permitted by applicable California law, and we will limit sharing such information with our affiliates to comply with California privacy laws that apply to us.
33
Morgan Stanley Institutional Fund, Inc.
Annual Report — December 31, 2016
Director and Officer Information (unaudited)
Independent Directors:
Name, Age and Address of
Independent Director | | Position(s)
Held with
Registrant | | Length of Time
Served* | | Principal Occupation(s) During Past 5 Years
and Other Relevant Professional Experience | | Number of
Portfolios in
Fund Complex
Overseen by
Independent
Director** | | Other Directorships
Held by Independent
Director*** | |
Frank L. Bowman (72)
c/o Perkins Coie LLP
Counsel to the Independent
Directors
30 Rockefeller Plaza
New York, NY 10112 | | Director | | Since
August
2006 | | President, Strategic Decisions, LLC (consulting) (since February 2009); Director or Trustee of various Morgan Stanley Funds (since August 2006); Chairperson of the Compliance and Insurance Committee (since October 2015); formerly, Chairperson of the Insurance Sub-Committee of the Compliance and Insurance Committee (2007-2015); served as President and Chief Executive Officer of the Nuclear Energy Institute (policy organization) (February 2005-November 2008); retired as Admiral, U.S. Navy after serving over 38 years on active duty including 8 years as Director of the Naval Nuclear Propulsion Program in the Department of the Navy and the U.S. Department of Energy (1996-2004); served as Chief of Naval Personnel (July 1994-September 1996) and on the Joint Staff as Director of Political Military Affairs (June 1992-July 1994); knighted as Honorary Knight Commander of the Most Excellent Order of the British Empire; awarded the Officier de l'Orde National du Mérite by the French Government; elected to the National Academy of Engineering (2009). | | | 90 | | | Director of BP p.l.c.; Director of Naval and Nuclear Technologies LLP; Director Emeritus of the Armed Services YMCA; Director of the U.S. Naval Submarine League; Member of the National Security Advisory Council of the Center for U.S. Global Engagement and a member of the CNA Military Advisory Board; Chairman of the charity J Street Cup Golf; Trustee of Fairhaven United Methodist Church; and Director of other various non-profit organizations. | |
Kathleen A. Dennis (63)
c/o Perkins Coie LLP
Counsel to the Independent Directors
30 Rockefeller Plaza
New York, NY 10112 | | Director | | Since
August
2006 | | President, Cedarwood Associates (mutual fund and investment management consulting) (since July 2006); Chairperson of the Liquidity and Alternatives Sub-Committee of the Investment Committee (since October 2006) and Director or Trustee of various Morgan Stanley Funds (since August 2006); formerly, Senior Managing Director of Victory Capital Management (1993-2006). | | | 91 | | | Director of various non-profit organizations. | |
Nancy C. Everett (61)
c/o Perkins Coie LLP
Counsel to the Independent Directors
30 Rockefeller Plaza
New York, NY 10112 | | Director | | Since
January
2015 | | Chief Executive Officer, Virginia Commonwealth University Investment Company (since November 2015); Owner, OBIR, LLC (institutional investment management consulting) (since June 2014); formerly, Managing Director, BlackRock Inc. (February 2011-December 2013); and Chief Executive Officer, General Motors Asset Management (a/k/a Promark Global Advisors, Inc.) (June 2005-May 2010). | | | 91 | | | Member of Virginia Commonwealth University School of Business Foundation; formerly, Member of Virginia Commonwealth University Board of Visitors (2013-2015); Member of Committee on Directors for Emerging Markets Growth Fund, Inc. (2007-2010); Chairperson of Performance Equity Management, LLC (2006-2010); and Chairperson, GMAM Absolute Return Strategies Fund, LLC (2006-2010). | |
34
Morgan Stanley Institutional Fund, Inc.
Annual Report — December 31, 2016
Director and Officer Information (unaudited) (cont'd)
Independent Directors: (cont'd)
Name, Age and Address of
Independent Director | | Position(s)
Held with
Registrant | | Length of Time
Served* | | Principal Occupation(s) During Past 5 Years
and Other Relevant Professional Experience | | Number of
Portfolios in
Fund Complex
Overseen by
Independent
Director** | | Other Directorships
Held by Independent
Director*** | |
Jakki L. Haussler (59)
c/o Perkins Coie LLP
Counsel to the Independent Directors
30 Rockefeller Plaza
New York, NY 10112 | | Director | | Since
January
2015 | | Chairman and Chief Executive Officer, Opus Capital Group (since January 1996); formerly, Director, Capvest Venture Fund, LP (May 2000-December 2011); Partner, Adena Ventures, LP (July 1999-December 2010); Director, The Victory Funds (February 2005-July 2008). | | | 91 | | | Director of Cincinnati Bell Inc. and Member, Audit Committee and Compensation Committee; Director of Northern Kentucky University Foundation and Member, Investment Committee; Member of Chase College of Law Transactional Law Practice Center Board of Advisors; Director of Best Transport; Director of Chase College of Law Board of Visitors; formerly, Member, University of Cincinnati Foundation Investment Committee; Member, Miami University Board of Visitors (2008-2011); Trustee of Victory Funds (2005-2008) and Chairman, Investment Committee (2007-2008) and Member, Service Provider Committee (2005-2008). | |
Dr. Manuel H. Johnson (67)
c/o Johnson Smick
International, Inc.
220 I Street, N.E. — Suite 200
Washington, D.C. 20002 | | Director | | Since
July
1991 | | Senior Partner, Johnson Smick International, Inc. (consulting firm); Chairperson of the Investment Committee (since October 2006) and Director or Trustee of various Morgan Stanley Funds (since July 1991); Co-Chairman and a founder of the Group of Seven Council (G7C) (international economic commission); formerly, Chairperson of the Audit Committee (July 1991-September 2006), Vice Chairman of the Board of Governors of the Federal Reserve System and Assistant Secretary of the U.S. Treasury. | | | 91 | | | Director of NVR, Inc. (home construction). | |
Joseph J. Kearns (74)
c/o Kearns & Associates LLC
46 E Peninsula Center #385
Rolling Hills Estates, CA 90274-3712 | | Director | | Since
August
1994 | | President, Kearns & Associates LLC (investment consulting); Chairperson of the Audit Committee (since October 2006) and Director or Trustee of various Morgan Stanley Funds (since August 1994); formerly, Deputy Chairperson of the Audit Committee (July 2003-September 2006) and Chairperson of the Audit Committee of various Morgan Stanley Funds (since August 1994); CFO of the J. Paul Getty Trust. | | | 93 | | | Director of Electro Rent Corporation (equipment leasing). Prior to December 31, 2013, Director of The Ford Family Foundation. | |
35
Morgan Stanley Institutional Fund, Inc.
Annual Report — December 31, 2016
Director and Officer Information (unaudited) (cont'd)
Independent Directors: (cont'd)
Name, Age and Address of
Independent Director | | Position(s)
Held with
Registrant | | Length of Time
Served* | | Principal Occupation(s) During Past 5 Years
and Other Relevant Professional Experience | | Number of
Portfolios in
Fund Complex
Overseen by
Independent
Director** | | Other Directorships
Held by Independent
Director*** | |
Michael F. Klein (58)
c/o Perkins Coie LLP
Counsel to the Independent Directors
30 Rockefeller Plaza
New York, NY 10112 | | Director | | Since
August
2006 | | Managing Director, Aetos Capital, LLC (since March 2000); Co-President, Aetos Alternatives Management, LLC (since January 2004) and Co-Chief Executive Officer of Aetos Capital LLC (since August 2013); Chairperson of the Fixed Income Sub-Committee of the Investment Committee (since October 2006) and Director or Trustee of various Morgan Stanley Funds (since August 2006); formerly, Managing Director, Morgan Stanley & Co. Inc. and Morgan Stanley Dean Witter Investment Management, President, various Morgan Stanley Funds (June 1998-March 2000) and Principal, Morgan Stanley & Co. Inc. and Morgan Stanley Dean Witter Investment Management (August 1997-December 1999). | | | 90 | | | Director of certain investment funds managed or sponsored by Aetos Capital, LLC; Director of Sanitized AG and Sanitized Marketing AG (specialty chemicals). | |
Patricia Maleski (56)
c/o Perkins Coie LLP
Counsel to the Independent Directors
30 Rockefeller Plaza
New York, NY 10112 | | Director | | Since
January
2017 | | Management Director, JPMorgan Asset Management (2013-2016); President, JPMorgan Funds (2010-2013), Chief Administrative Officer, JPMorgan Funds (2004-2010), Treasurer, JPMorgan Funds (2003-2004, 2008-2010), and Vice President and Board Liaison, JPMorgan Funds (2001-2004); Managing Director, J.P. Morgan Investment Management Inc. (2001-2013); Vice President of Finance, Pierpont Group (1996-2001); Vice President, Bank of New York (1995-1996); Senior Audit Manager, Price Waterhouse, LLP (1982-1995). | | | 91 | | | None. | |
Michael E. Nugent (80)
522 Fifth Avenue
New York, NY 10036 | | Chair of the Board and Director | | Chair of the Boards since July 2006 and Director since July 1991 | | Chair of the Boards of various Morgan Stanley Funds (since July 2006); Chairperson of the Closed-End Fund Committee (since June 2012) and Director or Trustee of various Morgan Stanley Funds (since July 1991); formerly, Chairperson of the Insurance Committee (until July 2006); General Partner, Triumph Capital, L.P. (private investment partnership) (1988-2013). | | | 92 | | | None. | |
W. Allen Reed (69)
c/o Perkins Coie LLP
Counsel to the Independent Directors
30 Rockefeller Plaza
New York, NY 10112 | | Director | | Since
August
2006 | | Chairperson of the Equity Sub-Committee of the Investment Committee (since October 2006) and Director or Trustee of various Morgan Stanley Funds (since August 2006); formerly, President and CEO of General Motors Asset Management; Chairman and Chief Executive Officer of the GM Trust Bank and Corporate Vice President of General Motors Corporation (August 1994-December 2005). | | | 91 | | | Director of Legg Mason, Inc.; formerly, Director of the Auburn University Foundation (2010-2015). | |
Fergus Reid (84)
c/o Joe Pietryka, Inc.
85 Charles Colman Blvd.
Pawling, NY 12564 | | Director | | Since
June
1992 | | Chairman, Joe Pietryka, Inc.; Chairperson of the Governance Committee and Director or Trustee of various Morgan Stanley Funds (since June 1992). | | | 92 | | | Formerly, Trustee and Director of certain investment companies in the JP Morgan Fund Complex managed by JP Morgan Investment Management Inc. (1987-2012). | |
* This is the earliest date the Director began serving the Morgan Stanley Funds. Each Director serves an indefinite term, until his or her successor is elected.
** The Fund Complex includes (as of December 31, 2016) all open-end and closed-end funds (including all of their portfolios) advised by Morgan Stanley Investment Management Inc. (the "Adviser") and any funds that have an adviser that is an affiliated person of the Adviser (including, but not limited to, Morgan Stanley AIP GP LP).
*** This includes any directorships at public companies and registered investment companies held by the Director at any time during the past five years.
36
Morgan Stanley Institutional Fund, Inc.
Annual Report — December 31, 2016
Director and Officer Information (unaudited) (cont'd)
Executive Officers:
Name, Age and Address of Executive Officer | | Position(s) Held
with
Registrant | | Length of Time
Served* | | Principal Occupation(s) During Past 5 Years | |
John H. Gernon (53)
522 Fifth Avenue
New York, NY 10036 | | President and Principal Executive Officer | | Since
September
2013 | | President and Principal Executive Officer of the Equity and Fixed Income Funds and the Morgan Stanley AIP Funds (since September 2013) and the Liquidity Funds and various money market funds (since May 2014) in the Fund Complex; Managing Director of the Adviser; Head of Product (since 2006). | |
Timothy J. Knierim (58)
522 Fifth Avenue
New York, NY 10036 | | Chief Compliance Officer | | Since
December
2016 | | Managing Director of the Adviser and various entities affiliated with the Adviser; Chief Compliance Officer of various Morgan Stanley Funds and the Adviser (since December 2016) and Chief Compliance Officer of Morgan Stanley AIP GP LP (since 2014). Formerly, Managing Director and Deputy Chief Compliance Officer of the Adviser (2014-2016); and formerly, Chief Compliance Officer of Prudential Investment Management, Inc. (2007-2014). | |
Francis J. Smith (51)
522 Fifth Avenue
New York, NY 10036 | | Treasurer and Principal Financial Officer | | Treasurer since July 2003 and Principal Financial Officer since September 2002 | | Managing Director of the Adviser and various entities affiliated with the Adviser; Treasurer (since July 2003) and Principal Financial Officer of various Morgan Stanley Funds (since September 2002). | |
Mary E. Mullin (49)
522 Fifth Avenue
New York, NY 10036 | | Secretary | | Since
June
1999 | | Executive Director of the Adviser; Secretary of various Morgan Stanley Funds (since June 1999). | |
* This is the earliest date the officer began serving the Morgan Stanley Funds. Each officer serves a one-year term, until his or her successor is elected and qualifies.
37
Morgan Stanley Institutional Fund, Inc.
Annual Report — December 31, 2016
Adviser and Administrator
Morgan Stanley Investment Management Inc.
522 Fifth Avenue
New York, New York 10036
Distributor
Morgan Stanley Distribution, Inc.
522 Fifth Avenue
New York, New York 10036
Dividend Disbursing and Transfer Agent
Boston Financial Data Services, Inc.
2000 Crown Colony Drive
Quincy, Massachusetts 02169
Custodian
State Street Bank and Trust Company
One Lincoln Street
Boston, Massachusetts 02111
Legal Counsel
Dechert LLP
1095 Avenue of the Americas
New York, New York 10036
Counsel to the Independent Directors
Perkins Coie LLP
30 Rockefeller Plaza
New York, New York 10112
Independent Registered Public Accounting Firm
Ernst & Young LLP
200 Clarendon Street
Boston, Massachusetts 02116
Reporting to Shareholders
Each Morgan Stanley fund provides a complete schedule of portfolio holdings in its semi-annual and annual reports within 60 days of the end of the fund's second and fourth fiscal quarters. The semi-annual and annual reports are filed electronically with the Securities and Exchange Commission (SEC) on Form N-CSRS and Form N-CSR, respectively. Morgan Stanley also delivers the semi-annual and annual reports to fund shareholders and makes these reports available on its public website, www.morganstanley.com/im. Each Morgan Stanley fund also files a complete schedule of portfolio holdings with the SEC for the fund's first and third fiscal quarters on Form N-Q. Morgan Stanley does not deliver the reports for the first and third fiscal quarters to shareholders, nor are the reports posted to the Morgan Stanley public website. You may, however, obtain the Form N-Q filings (as well as the Form N-CSR and N-CSRS filings) by accessing the SEC's website, www.sec.gov. You may also review and copy them at the SEC's Public Reference Room in Washington, DC. Information on the operation of the SEC's Public Reference Room may be obtained by calling the SEC toll free at 1 (800) SEC-0330. You can also request copies of these materials, upon payment of a duplicating fee, by electronic request at the SEC's email address (publicinfo@sec.gov) or by writing the Public Reference Room of the SEC, 100 F Street, NE, Washington, DC 20549-0102.
Proxy Voting Policies and Procedures and Proxy Voting Record
You may obtain a copy of the Fund's Proxy Voting Policy and Procedures and information regarding how the Fund voted proxies relating to portfolio securities during the most recent twelve-month period ended June 30, without charge, upon request, by calling toll free 1 (800) 548-7786 or by visiting our website at www.morganstanley.com/im. This information is also available on the SEC's website at www.sec.gov.
This report is authorized for distribution only when preceded or accompanied by a prospectus or summary prospectus of the applicable Portfolio of Morgan Stanley Institutional Fund, Inc., which describes in detail the Portfolio's investment policies, risks, fees and expenses. Please read the prospectus carefully before you invest or send money. For additional information, including information regarding the investments comprising the Portfolio, please visit our website at www.morganstanley.com/im or call toll free 1 (800) 548-7786.
38
(This Page has been left blank intentionally.)
(This Page has been left blank intentionally.)
(This Page has been left blank intentionally.)
Printed in U.S.A.
This Report has been prepared for shareholders and may be distributed to others only if preceded or accompanied by a current prospectus.
Morgan Stanley Investment Management Inc.
522 Fifth Avenue
New York, New York 10036
© 2017 Morgan Stanley. Morgan Stanley Distribution, Inc.

IFIGRWANN
1696421 EXP. 02.28.18

Morgan Stanley Institutional Fund, Inc.
Insight Portfolio
Annual Report
December 31, 2016

Morgan Stanley Institutional Fund, Inc.
Annual Report — December 31, 2016
Shareholders' Letter | | | 2 | | |
Expense Example | | | 3 | | |
Investment Overview | | | 4 | | |
Portfolio of Investments | | | 6 | | |
Statement of Assets and Liabilities | | | 8 | | |
Statement of Operations | | | 10 | | |
Statements of Changes in Net Assets | | | 11 | | |
Financial Highlights | | | 13 | | |
Notes to Financial Statements | | | 17 | | |
Report of Independent Registered Public Accounting Firm | | | 25 | | |
Federal Tax Notice | | | 26 | | |
Privacy Notice | | | 27 | | |
Director and Officer Information | | | 30 | | |
This report is authorized for distribution only when preceded or accompanied by a prospectus or summary prospectus of the applicable Portfolio of Morgan Stanley Institutional Fund, Inc. To receive a prospectus and/or statement of additional information (SAI), which contains more complete information such as investment objectives, charges, expenses, policies for voting proxies, risk considerations, and describes in detail each of the Portfolio's investment policies to the prospective investor, please call toll free 1 (800) 548-7786. Please read the prospectuses carefully before you invest or send money.
Additionally, you can access information about the Portfolio, including performance, characteristics, and investment team commentary, through Morgan Stanley Investment Management's website: www.morganstanley.com/im.
Market forecasts provided in this report may not necessarily come to pass. There is no guarantee that any sectors mentioned will continue to perform as discussed herein or that securities in such sectors will be held by the Portfolio in the future. There is no assurance that a Portfolio will achieve its investment objective. Portfolios are subject to market risk, which is the possibility that market values of securities owned by the Portfolio will decline and, therefore, the value of the Portfolio's shares may be less than what you paid for them. Accordingly, you can lose money investing in this Portfolio. Please see the prospectus for more complete information on investment risks.
1
Morgan Stanley Institutional Fund, Inc.
Annual Report — December 31, 2016
Shareholders' Letter (unaudited)
Dear Shareholders,
We are pleased to provide this Annual report, in which you will learn how your investment in Insight Portfolio (the "Portfolio") performed during the latest twelve-month period.
Morgan Stanley Investment Management is a client-centric, investor-led organization. Our global presence, intellectual capital, and breadth of products and services enable us to partner with investors to meet the evolving challenges of today's financial markets. We aim to deliver superior investment service and to empower our clients to make the informed decisions that help them reach their investment goals.
As always, we thank you for selecting Morgan Stanley Investment Management, and look forward to working with you in the months and years ahead.
Sincerely,

John H. Gernon
President and Principal Executive Officer
January 2017
2
Morgan Stanley Institutional Fund, Inc.
Annual Report — December 31, 2016
Expense Example (unaudited)
Insight Portfolio
As a shareholder of the Portfolio, you incur two types of costs: (1) transactional costs; and (2) ongoing costs, which may include advisory fees, administration fees, distribution and shareholder services fees and other Portfolio expenses. This example is intended to help you understand your ongoing costs (in dollars) of investing in the Portfolio and to compare these costs with the ongoing costs of investing in other mutual funds.
This example is based on an investment of $1,000 invested at the beginning of the six-month period ended December 31, 2016 and held for the entire six-month period.
Actual Expenses
The table below provides information about actual account values and actual expenses. You may use the information in this table, together with the amount you invested, to estimate the expenses that you paid over the period. Simply divide your account value by $1,000 (for example, an $8,600 account value divided by $1,000 = 8.6), then multiply the result by the number in the table under the heading entitled "Actual Expenses Paid During Period" to estimate the expenses you paid on your account during this period.
Hypothetical Example for Comparison Purposes
The table below provides information about hypothetical account values and hypothetical expenses based on the Portfolio's actual expense ratio and an assumed rate of return of 5% per year before expenses, which is not the Portfolio's actual return. The hypothetical account values and expenses may not be used to estimate the actual ending account balance or expenses you paid for the period. You may use this information to compare the ongoing costs of investing in the Portfolio and other funds. To do so, compare this 5% hypothetical example with the 5% hypothetical examples that appear in the shareholder reports of the other funds.
Please note that the expenses shown in the table are meant to highlight your ongoing costs only and do not reflect any transactional costs, such as sales charges (loads). Therefore, the information for each class in the table is useful in comparing ongoing costs only, and will not help you determine the relative total costs of owning different funds. In addition, if these transactional costs were included, your costs would have been higher.
| | | Beginning
Account
Value
7/1/16 | | Actual Ending
Account
Value
12/31/16 | | Hypothetical
Ending Account
Value | | Actual
Expenses
Paid
During
Period* | | Hypothetical
Expenses Paid
During Period* | | Net
Expense
Ratio
During
Period** | |
Insight Portfolio Class I | | $ | 1,000.00 | | | $ | 1,182.70 | | | $ | 1,019.96 | | | $ | 5.65 | | | $ | 5.23 | | | | 1.03 | %*** | |
Insight Portfolio Class A | | | 1,000.00 | | | | 1,181.00 | | | | 1,018.20 | | | | 7.57 | | | | 7.00 | | | | 1.38 | *** | |
Insight Portfolio Class L | | | 1,000.00 | | | | 1,177.80 | | | | 1,015.69 | | | | 10.29 | | | | 9.53 | | | | 1.88 | *** | |
Insight Portfolio Class C | | | 1,000.00 | | | | 1,176.70 | | | | 1,014.43 | | | | 11.65 | | | | 10.79 | | | | 2.13 | *** | |
* Expenses are calculated using each Portfolio Class' annualized net expense ratio (as disclosed), multiplied by the average account value over the period, and multiplied by 184/366 (to reflect the most recent one-half year period).
** Annualized.
*** Refer to Note F in the Notes to Financial Statements for discussion of prior period custodian out-of-pocket expenses that were reimbursed in the current period.
3
Morgan Stanley Institutional Fund, Inc.
Annual Report — December 31, 2016
Investment Overview (unaudited)
Insight Portfolio
The Portfolio seeks long-term capital appreciation.
Performance
For the year ended December 31, 2016, the Portfolio's Class I shares had a total return based on net asset value and reinvestment of distributions per share of 31.14%, net of fees. The Portfolio's Class I shares outperformed the Portfolio's benchmark, the Russell 3000® Value Index (the "Index"), which returned 18.40%. Please keep in mind that high double-digit returns are highly unusual and cannot be sustained.
Factors Affecting Performance
• The U.S. stock market was overwhelmed by negative news early in 2016, but staged a turnaround over the remainder of the year. Concerns about China's economy, falling oil prices and U.S. Federal Reserve (Fed) monetary policy weighed heavily on the markets from January through mid-February. From there, oil prices stabilized, economic growth improved, corporate earnings recovered and the Fed refrained from raising interest rates (until its December 2016 meeting), which provided upside to stock prices. Two major political events, the U.K.'s "Brexit" referendum and the election of Donald Trump, were initially viewed as negative surprises, but volatility subsided fairly quickly. Anticipation of pro-growth fiscal policy from the new administration drove share prices sharply higher in the final weeks of the year.
• All sectors in the Index delivered positive performance for the period, led by double-digit returns in the materials, energy and industrials sectors. The health care, consumer discretionary and consumer staples sectors had the smallest gains.
• The long-term investment horizon and conviction-weighted investment approach embraced by the team since 1998 can result in periods of performance deviation from the benchmark and peers. In this reporting period, favorable stock selection drove the Portfolio's relative outperformance, while sector allocation was a mild detractor.
• The industrials sector was, by far, the largest contributor to relative performance, due to both stock selection and a significant overweight in the sector. Stock selection in the consumer discretionary sector added to relative gains, more than offsetting the negative impact of an overweight in the sector. The health care sector also modestly contributed to
outperformance, aided by both stock selection and an underweight allocation in the sector.
• The materials sector detracted from relative performance. Although an overweight to the materials sector was somewhat beneficial, stock selection was detrimental to relative returns. The Portfolio also maintained a considerable underweight to the energy sector, which was disadvantageous to relative performance, given the sector's strong appreciation in the Index during the 12-month period.
Management Strategies
• There were no changes to our bottom-up investment process during the period. We seek to invest primarily in established and cyclical franchise companies that we believe have strong name recognition, sustainable competitive advantages, and ample growth prospects, and are trading at an attractive discount to future cash flow generation capacity or asset value. We typically favor companies with the ability to generate attractive free cash flow yields. We utilize a bottom-up stock selection process, seeking attractive investments on an individual company basis. Our emphasis is on secular growth, and as a result short-term market events are not as meaningful in the stock selection process.
4
Morgan Stanley Institutional Fund, Inc.
Annual Report — December 31, 2016
Investment Overview (unaudited) (cont'd)
Insight Portfolio
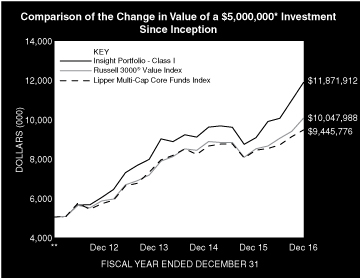
* Minimum Investment for Class I shares
** Commenced Operations on December 28, 2011.
In accordance with SEC regulations, the Portfolio's performance shown assumes that all recurring fees (including management fees) were deducted and all dividends and distributions were reinvested. The performance of Class A, L and C shares will vary from the performance of Class I shares based upon their different inception dates and will be impacted by additional fees assessed to those classes.
Performance Compared to the Russell 3000® Value Index(1) and the Lipper Multi-Cap Core Funds Index(2)
| | | Period Ended December 31, 2016
Total Returns(3) | |
| | | | | Average Annual | |
| | | One
Year | | Five
Years | | Ten
Years | | Since
Inception(6) | |
Portfolio — Class I Shares
w/o sales charges(4) | | | 31.14 | % | | | 18.74 | % | | | — | | | | 18.85 | % | |
Portfolio — Class A Shares
w/o sales charges(4) | | | 30.74 | | | | 18.38 | | | | — | | | | 18.49 | | |
Portfolio — Class A Shares with
maximum 5.25% sales charges(4) | | | 23.89 | | | | 17.11 | | | | — | | | | 17.23 | | |
Portfolio — Class L Shares
w/o sales charges(4) | | | 30.18 | | | | 17.79 | | | | — | | | | 17.90 | | |
Portfolio — Class C Shares
w/o sales charges(5) | | | 29.87 | | | | — | | | | — | | | | 12.38 | | |
Portfolio — Class C Shares
with maximum 1.00%
deferred sales charges(5) | | | 28.87 | | | | — | | | | — | | | | 12.38 | | |
Russell 3000® Value Index | | | 18.40 | | | | 14.81 | | | | — | | | | 14.95 | | |
Lipper Multi-Cap Core Funds Index | | | 12.27 | | | | 13.39 | | | | — | | | | 13.54 | | |
Performance data quoted represents past performance, which is no guarantee of future results, and current performance may be lower or higher than the figures shown. Performance assumes that all dividends and distributions, if any, were reinvested. For the most recent month-end
performance figures, please visit www.morganstanley.com/im. Investment return and principal value will fluctuate so that Portfolio shares, when redeemed, may be worth more or less than their original cost. Total returns do not reflect the deduction of taxes that a shareholder would pay on Portfolio distributions or the redemption of Portfolio shares. Performance of share classes will vary due to difference in sales charges and expenses.
(1) The Russell 3000® Value Index measures the performance of those companies in the Russell 3000® Index with lower price-to-book ratios and lower forecasted growth values. The Russell 3000® Index measures the performance of the largest 3000 U.S. companies representing approximately 98% of the investable U.S. equity market. The Index is unmanaged and its returns do not include any sales charges or fees. Such costs would lower performance. It is not possible to invest directly in an index.
(2) The Lipper Multi-Cap Core Funds Index is an equally weighted performance index of the largest qualifying funds (based on net assets) in the Lipper Multi-Cap Core Funds classification. The Index, which is adjusted for capital gains distributions and income dividends, is unmanaged and should not be considered an investment. There are currently 30 funds represented in this Index. As of the date of this report, the Portfolio is in the Lipper Multi-Cap Core Funds classification.
(3) Total returns for the Portfolio reflect fees waived and expenses reimbursed, if applicable, by the Adviser. Without such waivers and reimbursements, total returns would have been lower.
(4) Commenced operations on December 28, 2011.
(5) Commenced offering on April 30, 2015.
(6) For comparative purposes, average annual since inception returns listed for the Indexes refer to the inception date of Class I of the Portfolio, not the inception of the Index.
5
Morgan Stanley Institutional Fund, Inc.
Annual Report — December 31, 2016
Portfolio of Investments
Insight Portfolio
| | | Shares | | Value
(000) | |
Common Stocks (83.5%) | |
Aerospace & Defense (8.7%) | |
BWX Technologies, Inc. | | | 20,751 | | | $ | 824 | | |
United Technologies Corp. | | | 11,821 | | | | 1,296 | | |
| | | | 2,120 | | |
Automobiles (4.8%) | |
Harley-Davidson, Inc. | | | 19,984 | | | | 1,166 | | |
Beverages (0.0%) | |
Big Rock Brewery, Inc. (Canada) (a) | | | 1,928 | | | | 8 | | |
Capital Markets (0.9%) | |
Donnelley Financial Solutions, Inc. (a) | | | 9,288 | | | | 213 | | |
Chemicals (5.7%) | |
Ashland Global Holdings, Inc. | | | 7,688 | | | | 840 | | |
Mosaic Co. (The) | | | 18,707 | | | | 549 | | |
| | | | 1,389 | | |
Commercial Services & Supplies (2.0%) | |
Copart, Inc. (a) | | | 8,782 | | | | 487 | | |
Diversified Financial Services (5.7%) | |
Berkshire Hathaway, Inc., Class B (a) | | | 2,465 | | | | 402 | | |
Leucadia National Corp. | | | 42,572 | | | | 990 | | |
| | | | 1,392 | | |
Energy Equipment & Services (1.2%) | |
Dril-Quip, Inc. (a) | | | 5,070 | | | | 304 | | |
Food Products (1.1%) | |
Lamb Weston Holdings, Inc. (a) | | | 6,935 | | | | 262 | | |
Health Care Equipment & Supplies (3.3%) | |
Intuitive Surgical, Inc. (a) | | | 1,278 | | | | 810 | | |
Health Care Technology (0.1%) | |
Castlight Health, Inc., Class B (a) | | | 6,131 | | | | 30 | | |
Hotels, Restaurants & Leisure (3.8%) | |
BJ's Restaurants, Inc. (a) | | | 6,221 | | | | 245 | | |
Bojangles', Inc. (a) | | | 6,830 | | | | 127 | | |
El Pollo Loco Holdings, Inc. (a) | | | 10,503 | | | | 129 | | |
Fiesta Restaurant Group, Inc. (a) | | | 11,928 | | | | 356 | | |
Habit Restaurants, Inc. (The) (a) | | | 2,550 | | | | 44 | | |
Papa Murphy's Holdings, Inc. (a)(b) | | | 2,946 | | | | 13 | | |
Wingstop, Inc. | | | 656 | | | | 19 | | |
| | | | 933 | | |
Industrial Conglomerates (1.8%) | |
Koninklijke Philips N.V. (Netherlands) | | | 14,063 | | | | 430 | | |
Insurance (8.1%) | |
Progressive Corp. (The) | | | 26,649 | | | | 946 | | |
RenaissanceRe Holdings Ltd. | | | 7,530 | | | | 1,026 | | |
| | | | 1,972 | | |
Internet Software & Services (3.8%) | |
Criteo SA ADR (France) (a) | | | 11,103 | | | | 456 | | |
eBay, Inc. (a) | | | 13,114 | | | | 389 | | |
Twitter, Inc. (a) | | | 5,740 | | | | 94 | | |
| | | | 939 | | |
| | | Shares | | Value
(000) | |
Leisure Products (1.8%) | |
Vista Outdoor, Inc. (a) | | | 11,657 | | | $ | 430 | | |
Machinery (17.0%) | |
Deere & Co. | | | 5,028 | | | | 518 | | |
Joy Global, Inc. | | | 36,369 | | | | 1,018 | | |
Manitowoc Co., Inc. (The) (a) | | | 19,490 | | | | 117 | | |
Manitowoc Foodservice, Inc. (a) | | | 78,344 | | | | 1,515 | | |
Terex Corp. | | | 30,964 | | | | 976 | | |
| | | | 4,144 | | |
Media (7.6%) | |
News Corp., Class A | | | 20,043 | | | | 229 | | |
Time Warner, Inc. | | | 16,914 | | | | 1,633 | | |
| | | | 1,862 | | |
Metals & Mining (0.6%) | |
Dominion Diamond Corp. (Canada) | | | 15,975 | | | | 155 | | |
Specialty Retail (0.3%) | |
Container Store Group, Inc. (The) (a)(b) | | | 12,736 | | | | 81 | | |
Trading Companies & Distributors (2.8%) | |
Fastenal Co. | | | 14,621 | | | | 687 | | |
Transportation Infrastructure (2.4%) | |
BBA Aviation PLC (United Kingdom) | | | 171,596 | | | | 599 | | |
Total Common Stocks (Cost $18,650) | | | 20,413 | | |
Short-Term Investments (15.5%) | |
Securities held as Collateral on Loaned Securities (0.4%) | |
Investment Company (0.3%) | |
Morgan Stanley Institutional Liquidity
Funds — Treasury Securities Portfolio —
Institutional Class (See Note G) | | | 69,377 | | | | 69 | | |
| | | Face
Amount
(000) | | | |
Repurchase Agreements (0.1%) | |
Merrill Lynch & Co., Inc., (0.50%,
dated 12/30/16, due 1/3/17;
proceeds $1; fully collateralized
by a U.S. Government obligation;
1.88% due 8/31/22; valued at $1) | | $ | 1 | | | | 1 | | |
Merrill Lynch & Co., Inc., (0.50%,
dated 12/30/16, due 1/3/17;
proceeds $7; fully collateralized
by U.S. Government agency
securities; 2.88% - 4.60%
due 11/20/65 - 11/20/66;
valued at $7) | | | 7 | | | | 7 | | |
Merrill Lynch & Co., Inc., (0.81%,
dated 12/30/16, due 1/3/17;
proceeds $10; fully collateralized
by Exchange Traded Funds;
valued at $11) | | | 10 | | | | 10 | | |
| | | | 18 | | |
Total Securities held as Collateral on Loaned
Securities (Cost $87) | | | 87 | | |
The accompanying notes are an integral part of the financial statements.
6
Morgan Stanley Institutional Fund, Inc.
Annual Report — December 31, 2016
Portfolio of Investments (cont'd)
Insight Portfolio
| | | Shares | | Value
(000) | |
Investment Company (15.1%) | |
Morgan Stanley Institutional Liquidity
Funds — Treasury Securities
Portfolio — Institutional Class
(See Note G)
(Cost $3,700) | | | 3,699,547 | | | $ | 3,700 | | |
Total Short-Term Investments (Cost $3,787) | | | 3,787 | | |
Total Investments (99.0%) (Cost $22,437)
Including $82 of Securities Loaned (c) | | | 24,200 | | |
Other Assets in Excess of Liabilities (1.0%) | | | 234 | | |
Net Assets (100.0%) | | $ | 24,434 | | |
(a) Non-income producing security.
(b) All or a portion of this security was on loan at December 31, 2016.
(c) At December 31, 2016, the aggregate cost for federal income tax purposes is approximately $22,459,000. The aggregate gross unrealized appreciation is approximately $1,913,000 and the aggregate gross unrealized depreciation is approximately $172,000 resulting in net unrealized appreciation of approximately $1,741,000.
ADR American Depositary Receipt.
Portfolio Composition*
Classification | | Percentage of
Total Investments | |
Other** | | | 31.2 | % | |
Machinery | | | 17.2 | | |
Short-Term Investments | | | 15.3 | | |
Aerospace & Defense | | | 8.8 | | |
Insurance | | | 8.2 | | |
Media | | | 7.7 | | |
Diversified Financial Services | | | 5.8 | | |
Chemicals | | | 5.8 | | |
Total Investments | | | 100.0 | % | |
* Percentages indicated are based upon total investments (excluding Securities held as Collateral on Loaned Securities) as of December 31, 2016.
** Industries and/or investment types representing less than 5% of total investments.
The accompanying notes are an integral part of the financial statements.
7
Morgan Stanley Institutional Fund, Inc.
Annual Report — December 31, 2016
Statement of Assets and Liabilities | | December 31, 2016
(000) | |
Assets: | |
Investments in Securities of Unaffiliated Issuers, at Value(1) (Cost $18,668) | | $ | 20,431 | | |
Investment in Security of Affiliated Issuer, at Value (Cost $3,769) | | | 3,769 | | |
Total Investments in Securities, at Value (Cost $22,437) | | | 24,200 | | |
Foreign Currency, at Value (Cost —@) | | | — | @ | |
Receivable for Portfolio Shares Sold | | | 343 | | |
Dividends Receivable | | | 3 | | |
Receivable from Affiliate | | | 1 | | |
Other Assets | | | 38 | | |
Total Assets | | | 24,585 | | |
Liabilities: | |
Collateral on Securities Loaned, at Value | | | 87 | | |
Payable for Professional Fees | | | 34 | | |
Payable for Advisory Fees | | | 13 | | |
Payable for Shareholder Services Fees- Class A | | | 1 | | |
Payable for Distribution and Shareholder Services Fees — Class L | | | — | @ | |
Payable for Distribution and Shareholder Services Fees — Class C | | | 2 | | |
Payable for Custodian Fees | | | 3 | | |
Payable for Transfer Agency Fees — Class I | | | 1 | | |
Payable for Transfer Agency Fees — Class A | | | 1 | | |
Payable for Transfer Agency Fees — Class L | | | — | @ | |
Payable for Transfer Agency Fees — Class C | | | 1 | | |
Payable for Administration Fees | | | 2 | | |
Bank Overdraft | | | 1 | | |
Payable for Portfolio Shares Redeemed | | | 1 | | |
Payable for Sub Transfer Agency Fees — Class I | | | — | @ | |
Payable for Sub Transfer Agency Fees — Class L | | | — | @ | |
Other Liabilities | | | 4 | | |
Total Liabilities | | | 151 | | |
Net Assets | | $ | 24,434 | | |
Net Assets Consist Of: | |
Paid-in-Capital | | $ | 22,522 | | |
Accumulated Undistributed Net Investment Income | | | — | @ | |
Accumulated Net Realized Gain | | | 149 | | |
Unrealized Appreciation (Depreciation) on: | |
Investments | | | 1,763 | | |
Foreign Currency Translations | | | — | @ | |
Net Assets | | $ | 24,434 | | |
The accompanying notes are an integral part of the financial statements.
8
Morgan Stanley Institutional Fund, Inc.
Annual Report — December 31, 2016
Statement of Assets and Liabilities (cont'd) | | December 31, 2016
(000) | |
CLASS I: | |
Net Assets | | $ | 13,578 | | |
| Shares Outstanding $0.001 par value shares of beneficial interest (unlimited shares authorized) (not in 000's) | | | 940,086 | | |
Net Asset Value, Offering and Redemption Price Per Share | | $ | 14.44 | | |
CLASS A: | |
Net Assets | | $ | 7,365 | | |
| Shares Outstanding $0.001 par value shares of beneficial interest (unlimited shares authorized) (not in 000's) | | | 511,547 | | |
Net Asset Value, Redemption Price Per Share | | $ | 14.40 | | |
Maximum Sales Load | | | 5.25 | % | |
Maximum Sales Charge | | $ | 0.80 | | |
Maximum Offering Price Per Share | | $ | 15.20 | | |
CLASS L: | |
Net Assets | | $ | 150 | | |
| Shares Outstanding $0.001 par value shares of beneficial interest (unlimited shares authorized) (not in 000's) | | | 10,663 | | |
Net Asset Value, Offering and Redemption Price Per Share | | $ | 14.09 | | |
CLASS C: | |
Net Assets | | $ | 3,341 | | |
| Shares Outstanding $0.001 par value shares of beneficial interest (unlimited shares authorized) (not in 000's) | | | 238,173 | | |
Net Asset Value, Offering and Redemption Price Per Share | | $ | 14.03 | | |
(1) Including:
Securities on Loan, at Value: | | $ | 82 | | |
@ Amount is less than $500.
The accompanying notes are an integral part of the financial statements.
9
Morgan Stanley Institutional Fund, Inc.
Annual Report — December 31, 2016
Statement of Operations | | Year Ended
December 31, 2016
(000) | |
Investment Income: | |
Dividends from Securities of Unaffiliated Issuers (Net of $—@ of foreign Taxes Withheld) | | $ | 104 | | |
Dividends from Security of Affiliated Issuer (Note G) | | | 2 | | |
Income from Securities Loaned — Net | | | 1 | | |
Total Investment Income | | | 107 | | |
Expenses: | |
Professional Fees | | | 82 | | |
Advisory Fees (Note B) | | | 67 | | |
Registration Fees | | | 55 | | |
Shareholder Services Fees — Class A (Note D) | | | 5 | | |
Distribution and Shareholder Services Fees — Class L (Note D) | | | 1 | | |
Distribution and Shareholder Services Fees — Class C (Note D) | | | 7 | | |
Shareholder Reporting Fees | | | 11 | | |
Transfer Agency Fees — Class I (Note E) | | | 2 | | |
Transfer Agency Fees — Class A (Note E) | | | 3 | | |
Transfer Agency Fees — Class L (Note E) | | | 2 | | |
Transfer Agency Fees — Class C (Note E) | | | 2 | | |
Administration Fees (Note C) | | | 7 | | |
Sub Transfer Agency Fees — Class I | | | 2 | | |
Sub Transfer Agency Fees — Class A | | | 1 | | |
Sub Transfer Agency Fees — Class L | | | — | @ | |
Sub Transfer Agency Fees — Class C | | | — | @ | |
Custodian Fees (Note F) | | | 3 | | |
Directors' Fees and Expenses | | | 3 | | |
Pricing Fees | | | 3 | | |
Other Expenses | | | 9 | | |
Total Expenses | | | 265 | | |
Waiver of Advisory Fees (Note B) | | | (67 | ) | |
Expenses Reimbursed by Adviser (Note B) | | | (63 | ) | |
Reimbursement of Class Specific Expenses — Class I (Note B) | | | (4 | ) | |
Reimbursement of Class Specific Expenses — Class A (Note B) | | | (2 | ) | |
Reimbursement of Class Specific Expenses — Class L (Note B) | | | (2 | ) | |
Reimbursement of Class Specific Expenses — Class C (Note B) | | | (2 | ) | |
Rebate from Morgan Stanley Affiliate (Note G) | | | (2 | ) | |
Reimbursement of Custodian Fees (Note F) | | | (21 | ) | |
Net Expenses | | | 102 | | |
Net Investment Income | | | 5 | | |
Realized Gain (Loss): | |
Investments Sold | | | 519 | | |
Foreign Currency Transactions | | | (— | @) | |
Net Realized Gain | | | 519 | | |
Change in Unrealized Appreciation (Depreciation): | |
Investments | | | 1,941 | | |
Foreign Currency Translations | | | (— | @) | |
Net Change in Unrealized Appreciation (Depreciation) | | | 1,941 | | |
Net Realized Gain and Change in Unrealized Appreciation (Depreciation) | | | 2,460 | | |
Net Increase in Net Assets Resulting from Operations | | $ | 2,465 | | |
@ Amount is less than $500.
The accompanying notes are an integral part of the financial statements.
10
Morgan Stanley Institutional Fund, Inc.
Annual Report — December 31, 2016
Statements of Changes in Net Assets | | Year Ended
December 31, 2016
(000) | | Year Ended
December 31, 2015
(000) | |
Increase (Decrease) in Net Assets: | |
Operations: | |
Net Investment Income | | $ | 5 | | | $ | 17 | | |
Net Realized Gain | | | 519 | | | | 203 | | |
Net Change in Unrealized Appreciation (Depreciation) | | | 1,941 | | | | (376 | ) | |
Net Increase (Decrease) in Net Assets Resulting from Operations | | | 2,465 | | | | (156 | ) | |
Distributions from and/or in Excess of: | |
Class I: | |
Net Investment Income | | | (6 | ) | | | (15 | ) | |
Net Realized Gain | | | (212 | ) | | | (256 | ) | |
Class A: | |
Net Investment Income | | | (— | @) | | | (2 | ) | |
Net Realized Gain | | | (116 | ) | | | (53 | ) | |
Class L: | |
Net Investment Income | | | (— | @) | | | (— | @) | |
Net Realized Gain | | | (3 | ) | | | (16 | ) | |
Class C: | |
Net Investment Income | | | (— | @) | | | (— | @) | |
Net Realized Gain | | | (44 | ) | | | (7 | ) | |
Total Distributions | | | (381 | ) | | | (349 | ) | |
Capital Share Transactions:(1) | |
Class I: | |
Subscribed | | | 10,923 | | | | 188 | | |
Distributions Reinvested | | | 217 | | | | 270 | | |
Redeemed | | | (995 | ) | | | (53 | ) | |
Class A: | |
Subscribed | | | 6,908 | | | | 320 | | |
Distributions Reinvested | | | 116 | | | | 52 | | |
Redeemed | | | (528 | ) | | | (121 | ) | |
Class L: | |
Exchanged | | | 49 | | | | — | | |
Subscribed | | | — | | | | 129 | | |
Distributions Reinvested | | | 2 | | | | 15 | | |
Redeemed | | | (17 | ) | | | (80 | ) | |
Class C: | |
Subscribed | | | 3,158 | | | | 72 | * | |
Distributions Reinvested | | | 44 | | | | 6 | * | |
Redeemed | | | (55 | ) | | | (10 | )* | |
Net Increase in Net Assets Resulting from Capital Share Transactions | | | 19,822 | | | | 788 | | |
Total Increase in Net Assets | | | 21,906 | | | | 283 | | |
Net Assets: | |
Beginning of Period | | | 2,528 | | | | 2,245 | | |
End of Period (Including Accumulated Undistributed Net Investment Income of —@ and $3) | | $ | 24,434 | | | $ | 2,528 | | |
The accompanying notes are an integral part of the financial statements.
11
Morgan Stanley Institutional Fund, Inc.
Annual Report — December 31, 2016
Statements of Changes in Net Assets (cont'd) | | Year Ended
December 31, 2016
(000) | | Year Ended
December 31, 2015
(000) | |
(1) Capital Share Transactions: | |
Class I: | |
Shares Subscribed | | | 821 | | | | 14 | | |
Shares Issued on Distributions Reinvested | | | 15 | | | | 23 | | |
Shares Redeemed | | | (73 | ) | | | (4 | ) | |
Net Increase in Class I Shares Outstanding | | | 763 | | | | 33 | | |
Class A: | |
Shares Subscribed | | | 509 | | | | 24 | | |
Shares Issued on Distributions Reinvested | | | 8 | | | | 4 | | |
Shares Redeemed | | | (41 | ) | | | (9 | ) | |
Net Increase in Class A Shares Outstanding | | | 476 | | | | 19 | | |
Class L: | |
Shares Exchanged | | | 4 | | | | — | | |
Shares Subscribed | | | — | | | | 10 | | |
Shares Issued on Distributions Reinvested | | | — | @@ | | | 2 | | |
Shares Redeemed | | | (1 | ) | | | (7 | ) | |
Net Increase in Class L Shares Outstanding | | | 3 | | | | 5 | | |
Class C: | |
Shares Subscribed | | | 234 | | | | 6 | * | |
Shares Issued on Distributions Reinvested | | | 3 | | | | — | @@* | |
Shares Redeemed | | | (4 | ) | | | (1 | )* | |
Net Increase in Class C Shares Outstanding | | | 233 | | | | 5 | | |
* For the period April 30, 2015 through December 31, 2015.
@ Amount is less than $500.
@@ Amount is less than 500 shares.
The accompanying notes are an integral part of the financial statements.
12
Morgan Stanley Institutional Fund, Inc.
Annual Report — December 31, 2016
Financial Highlights
Insight Portfolio
| | | Class I | |
| | | Year Ended December 31, | |
Selected Per Share Data and Ratios | | 2016(1) | | 2015 | | 2014 | | 2013 | | 2012 | |
Net Asset Value, Beginning of Period | | $ | 11.21 | | | $ | 13.65 | | | $ | 15.40 | | | $ | 11.86 | | | $ | 10.06 | | |
Income (Loss) from Investment Operations: | |
Net Investment Income (2) | | | 0.03 | | | | 0.10 | | | | 0.06 | | | | 0.18 | | | | 0.17 | | |
Net Realized and Unrealized Gain (Loss) | | | 3.46 | | | | (0.82 | ) | | | 0.87 | | | | 4.52 | | | | 2.59 | | |
Total from Investment Operations | | | 3.49 | | | | (0.72 | ) | | | 0.93 | | | | 4.70 | | | | 2.76 | | |
Distributions from and/or in Excess of: | |
Net Investment Income | | | (0.01 | ) | | | (0.10 | ) | | | (0.04 | ) | | | (0.16 | ) | | | (0.14 | ) | |
Net Realized Gain | | | (0.25 | ) | | | (1.62 | ) | | | (2.64 | ) | | | (1.00 | ) | | | (0.82 | ) | |
Total Distributions | | | (0.26 | ) | | | (1.72 | ) | | | (2.68 | ) | | | (1.16 | ) | | | (0.96 | ) | |
Net Asset Value, End of Period | | $ | 14.44 | | | $ | 11.21 | | | $ | 13.65 | | | $ | 15.40 | | | $ | 11.86 | | |
Total Return (3) | | | 31.14 | % | | | (5.58 | )% | | | 6.66 | % | | | 40.20 | % | | | 27.47 | % | |
Ratios and Supplemental Data: | |
Net Assets, End of Period (Thousands) | | $ | 13,578 | | | $ | 1,981 | | | $ | 1,968 | | | $ | 1,859 | | | $ | 12 | | |
Ratio of Expenses to Average Net Assets (5) | | | 1.03 | %(4) | | | 1.04 | %(4) | | | 1.04 | %(4) | | | 1.04 | %(4) | | | 1.04 | %(4) | |
Ratio of Net Investment Income to Average Net Assets (5) | | | 0.25 | %(4) | | | 0.78 | %(4) | | | 0.44 | %(4) | | | 1.25 | %(4) | | | 1.47 | %(4) | |
Ratio of Rebate from Morgan Stanley Affiliates to Average Net Assets | | | 0.02 | % | | | 0.01 | % | | | 0.01 | % | | | 0.01 | % | | | 0.01 | % | |
Portfolio Turnover Rate | | | 42 | % | | | 55 | % | | | 82 | % | | | 51 | % | | | 62 | % | |
(5) Supplemental Information on the Ratios to Average Net Assets: | |
Ratios Before Expense Limitation: | |
Expenses to Average Net Assets | | | 2.93 | % | | | 7.50 | % | | | 7.69 | % | | | 10.83 | % | | | 11.61 | % | |
Net Investment Loss to Average Net Assets | | | (1.65 | )% | | | (5.68 | )% | | | (6.21 | )% | | | (8.54 | )% | | | (9.10 | )% | |
(1) Refer to Note F in the Notes to Financial Statements for discussion of prior period custodian out-of-pocket expenses that were reimbursed in the current period. The amount of the reimbursement was immaterial on a per share basis and did not impact the total return of Class I shares. The Ratio of Expenses to Average Net Assets and the Ratio of Net Investment Income to Average Net Assets would be unchanged as the reimbursement of custodian fees was offset against current period expense waivers/reimbursements with no impact to net expenses or net investment income.
(2) Per share amount is based on average shares outstanding.
(3) Calculated based on the net asset value as of the last business day of the period.
(4) The Ratios of Expenses and Net Investment Income reflect the rebate of certain Portfolio expenses in connection with the investments in Morgan Stanley affiliates during the period. The effect of the rebate on the ratios is disclosed in the above table as "Ratio of Rebate from Morgan Stanley Affiliates to Average Net Assets."
The accompanying notes are an integral part of the financial statements.
13
Morgan Stanley Institutional Fund, Inc.
Annual Report — December 31, 2016
Financial Highlights
Insight Portfolio
| | | Class A | |
| | | Year Ended December 31, | |
Selected Per Share Data and Ratios | | 2016(1) | | 2015 | | 2014 | | 2013 | | 2012 | |
Net Asset Value, Beginning of Period | | $ | 11.21 | | | $ | 13.66 | | | $ | 15.43 | | | $ | 11.86 | | | $ | 10.06 | | |
Income (Loss) from Investment Operations: | |
Net Investment Income (Loss) (2) | | | (0.02 | ) | | | 0.05 | | | | 0.01 | | | | 0.07 | | | | 0.14 | | |
Net Realized and Unrealized Gain (Loss) | | | 3.46 | | | | (0.82 | ) | | | 0.87 | | | | 4.58 | | | | 2.59 | | |
Total from Investment Operations | | | 3.44 | | | | (0.77 | ) | | | 0.88 | | | | 4.65 | | | | 2.73 | | |
Distributions from and/or in Excess of: | |
Net Investment Income | | | (0.00 | )(3) | | | (0.06 | ) | | | (0.01 | ) | | | (0.08 | ) | | | (0.11 | ) | |
Net Realized Gain | | | (0.25 | ) | | | (1.62 | ) | | | (2.64 | ) | | | (1.00 | ) | | | (0.82 | ) | |
Total Distributions | | | (0.25 | ) | | | (1.68 | ) | | | (2.65 | ) | | | (1.08 | ) | | | (0.93 | ) | |
Net Asset Value, End of Period | | $ | 14.40 | | | $ | 11.21 | | | $ | 13.66 | | | $ | 15.43 | | | $ | 11.86 | | |
Total Return (4) | | | 30.74 | % | | | (5.97 | )% | | | 6.41 | % | | | 39.73 | % | | | 27.21 | % | |
Ratios and Supplemental Data: | |
Net Assets, End of Period (Thousands) | | $ | 7,365 | | | $ | 399 | | | $ | 230 | | | $ | 209 | | | $ | 1,144 | | |
Ratio of Expenses to Average Net Assets (7) | | | 1.38 | %(5) | | | 1.39 | %(5) | | | 1.39 | %(5) | | | 1.30 | %(5)(6) | | | 1.29 | %(5) | |
Ratio of Net Investment Income (Loss) to Average Net Assets (7) | | | (0.15 | )%(5) | | | 0.42 | %(5) | | | 0.09 | %(5) | | | 0.50 | %(5) | | | 1.22 | %(5) | |
Ratio of Rebate from Morgan Stanley Affiliates to Average Net Assets | | | 0.02 | % | | | 0.01 | % | | | 0.01 | % | | | 0.01 | % | | | 0.01 | % | |
Portfolio Turnover Rate | | | 42 | % | | | 55 | % | | | 82 | % | | | 51 | % | | | 62 | % | |
(7) Supplemental Information on the Ratios to Average Net Assets: | |
Ratios Before Expense Limitation: | |
Expenses to Average Net Assets | | | 3.28 | % | | | 8.32 | % | | | 8.91 | % | | | 13.79 | % | | | 11.86 | % | |
Net Investment Loss to Average Net Assets | | | (2.05 | )% | | | (6.51 | )% | | | (7.43 | )% | | | (11.99 | )% | | | (9.35 | )% | |
(1) Refer to Note F in the Notes to Financial Statements for discussion of prior period custodian out-of-pocket expenses that were reimbursed in the current period. The amount of the reimbursement was immaterial on a per share basis and did not impact the total return of Class A shares. The Ratio of Expenses to Average Net Assets and the Ratio of Net Investment Loss to Average Net Assets would be unchanged as the reimbursement of custodian fees was offset against current period expense waivers/reimbursements with no impact to net expenses or net investment loss.
(2) Per share amount is based on average shares outstanding.
(3) Amount is less than $0.005 per share.
(4) Calculated based on the net asset value which does not reflect sales charges, if applicable, as of the last business day of the period.
(5) The Ratios of Expenses and Net Investment Income (Loss) reflect the rebate of certain Portfolio expenses in connection with the investments in Morgan Stanley affiliates during the period. The effect of the rebate on the ratios is disclosed in the above table as "Ratio of Rebate from Morgan Stanley Affiliates to Average Net Assets."
(6) Effective September 16, 2013, the Adviser has agreed to limit the ratio of expenses to average net assets to the maximum ratio of 1.40% for Class A shares. Prior to September 16, 2013, the maximum ratio was 1.30% for Class A shares.
The accompanying notes are an integral part of the financial statements.
14
Morgan Stanley Institutional Fund, Inc.
Annual Report — December 31, 2016
Financial Highlights
Insight Portfolio
| | | Class L | |
| | | Year Ended December 31, | |
Selected Per Share Data and Ratios | | 2016(1) | | 2015 | | 2014 | | 2013 | | 2012 | |
Net Asset Value, Beginning of Period | | $ | 11.02 | | | $ | 13.50 | | | $ | 15.35 | | | $ | 11.85 | | | $ | 10.06 | | |
Income (Loss) from Investment Operations: | |
Net Investment Income (Loss) (2) | | | (0.06 | ) | | | (0.01 | ) | | | (0.06 | ) | | | 0.08 | | | | 0.08 | | |
Net Realized and Unrealized Gain (Loss) | | | 3.38 | | | | (0.82 | ) | | | 0.86 | | | | 4.49 | | | | 2.58 | | |
Total from Investment Operations | | | 3.32 | | | | (0.83 | ) | | | 0.80 | | | | 4.57 | | | | 2.66 | | |
Distributions from and/or in Excess of: | |
Net Investment Income | | | (0.00 | )(3) | | | (0.03 | ) | | | (0.01 | ) | | | (0.07 | ) | | | (0.05 | ) | |
Net Realized Gain | | | (0.25 | ) | | | (1.62 | ) | | | (2.64 | ) | | | (1.00 | ) | | | (0.82 | ) | |
Total Distributions | | | (0.25 | ) | | | (1.65 | ) | | | (2.65 | ) | | | (1.07 | ) | | | (0.87 | ) | |
Net Asset Value, End of Period | | $ | 14.09 | | | $ | 11.02 | | | $ | 13.50 | | | $ | 15.35 | | | $ | 11.85 | | |
Total Return (4) | | | 30.18 | % | | | (6.49 | )% | | | 5.83 | % | | | 39.13 | % | | | 26.52 | % | |
Ratios and Supplemental Data: | |
Net Assets, End of Period (Thousands) | | $ | 150 | | | $ | 90 | | | $ | 47 | | | $ | 115 | | | $ | 12 | | |
Ratio of Expenses to Average Net Assets (7) | | | 1.88 | %(5) | | | 1.89 | %(5) | | | 1.89 | %(5) | | | 1.84 | %(5)(6) | | | 1.79 | %(5) | |
Ratio of Net Investment Income (Loss) to Average Net Assets (7) | | | (0.52 | )%(5) | | | (0.09 | )%(5) | | | (0.41 | )%(5) | | | 0.54 | %(5) | | | 0.72 | %(5) | |
Ratio of Rebate from Morgan Stanley Affiliates to Average Net Assets | | | 0.02 | % | | | 0.01 | % | | | 0.01 | % | | | 0.01 | % | | | 0.01 | % | |
Portfolio Turnover Rate | | | 42 | % | | | 55 | % | | | 82 | % | | | 51 | % | | | 62 | % | |
(7) Supplemental Information on the Ratios to Average Net Assets: | |
Ratios Before Expense Limitation: | |
Expenses to Average Net Assets | | | 5.57 | % | | | 10.04 | % | | | 10.64 | % | | | 12.31 | % | | | 12.36 | % | |
Net Investment Loss to Average Net Assets | | | (4.21 | )% | | | (8.24 | )% | | | (9.16 | )% | | | (9.93 | )% | | | (9.85 | )% | |
(1) Refer to Note F in the Notes to Financial Statements for discussion of prior period custodian out-of-pocket expenses that were reimbursed in the current period. The amount of the reimbursement was immaterial on a per share basis and did not impact the total return of Class L shares. The Ratio of Expenses to Average Net Assets and the Ratio of Net Investment Loss to Average Net Assets would be unchanged as the reimbursement of custodian fees was offset against current period expense waivers/reimbursements with no impact to net expenses or net investment loss.
(2) Per share amount is based on average shares outstanding.
(3) Amount less than $0.005 per share.
(4) Calculated based on the net asset value as of the last business day of the period.
(5) The Ratios of Expenses and Net Investment Income (Loss) reflect the rebate of certain Portfolio expenses in connection with the investments in Morgan Stanley affiliates during the period. The effect of the rebate on the ratios is disclosed in the above table as "Ratio of Rebate from Morgan Stanley Affiliates to Average Net Assets."
(6) Effective September 16, 2013, the Adviser has agreed to limit the ratio of expenses to average net assets to the maximum ratio of 1.90% for Class L shares. Prior to September 16, 2013, the maximum ratio was 1.80% for Class L shares.
The accompanying notes are an integral part of the financial statements.
15
Morgan Stanley Institutional Fund, Inc.
Annual Report — December 31, 2016
Financial Highlights
Insight Portfolio
| | | Class C | |
Selected Per Share Data and Ratios | | Year Ended
December 31, 2016(1) | | Period from
April 30, 2015(2) to
December 31, 2015 | |
Net Asset Value, Beginning of Period | | $ | 11.00 | | | $ | 13.47 | | |
Income (Loss) from Investment Operations: | |
Net Investment Loss (3) | | | (0.12 | ) | | | (0.08 | ) | |
Net Realized and Unrealized Gain (Loss) | | | 3.40 | | | | (0.74 | ) | |
Total from Investment Operations | | | 3.28 | | | | (0.82 | ) | |
Distributions from and/or in Excess of: | |
Net Investment Income | | | (0.00 | )(4) | | | (0.03 | ) | |
Net Realized Gain | | | (0.25 | ) | | | (1.62 | ) | |
Total Distributions | | | (0.25 | ) | | | (1.65 | ) | |
Net Asset Value, End of Period | | $ | 14.03 | | | $ | 11.00 | | |
Total Return (5) | | | 29.87 | % | | | (6.42 | )%(7) | |
Ratios and Supplemental Data: | |
Net Assets, End of Period (Thousands) | | $ | 3,341 | | | $ | 58 | | |
Ratio of Expenses to Average Net Assets (9) | | | 2.13 | %(6) | | | 2.14 | %(6)(8) | |
Ratio of Net Investment Loss to Average Net Assets (9) | | | (0.91 | )%(6) | | | (0.91 | )%(6)(8) | |
Ratio of Rebate from Morgan Stanley Affiliates to Average Net Assets | | | 0.02 | % | | | 0.01 | %(8) | |
Portfolio Turnover Rate | | | 42 | % | | | 55 | % | |
(9) Supplemental Information on the Ratios to Average Net Assets: | |
Ratios Before Expense Limitation: | |
Expense to Average Net Assets | | | 4.23 | % | | | 12.97 | %(8) | |
Net Investment Loss to Average Net Assets | | | (3.01 | )% | | | (11.74 | )%(8) | |
(1) Refer to Note F in the Notes to Financial Statements for discussion of prior period custodian out-of-pocket expenses that were reimbursed in the current period. The amount of the reimbursement was immaterial on a per share basis and did not impact the total return of Class C shares. The Ratio of Expenses to Average Net Assets and the Ratio of Net Investment Loss to Average Net Assets would be unchanged as the reimbursement of custodian fees was offset against current period expense waivers/reimbursements with no impact to net expenses or net investment loss.
(2) Commencement of Offering.
(3) Per share amount is based on average shares outstanding.
(4) Amount less than $0.005 per share.
(5) Calculated based on the net asset value which does not reflect sales charges, if applicable, as of the last business day of the period.
(6) The Ratios of Expenses and Net Investment Loss reflect the rebate of certain Portfolio expenses in connection with the investments in Morgan Stanley affiliates during the period. The effect of the rebate on the ratios is disclosed in the above table as "Ratio of Rebate from Morgan Stanley Affiliates to Average Net Assets."
(7) Not Annualized.
(8) Annualized.
The accompanying notes are an integral part of the financial statements.
16
Morgan Stanley Institutional Fund, Inc.
Annual Report — December 31, 2016
Notes to Financial Statements
Morgan Stanley Institutional Fund, Inc. (the "Fund") is registered under the Investment Company Act of 1940, as amended (the "Act"), as an open-end management investment company. The Fund is comprised of twenty-nine separate, active, diversified and non-diversified portfolios (individually referred to as a "Portfolio", collectively as the "Portfolios"). The Fund applies investment company accounting and reporting guidance.
The accompanying financial statements relate to the Insight Portfolio. The Portfolio seeks long-term capital appreciation.
The Portfolio offers four classes of shares — Class I, Class A, Class L and Class C. On April 30, 2015, the Portfolio suspended offering of Class L shares. Existing Class L shareholders may invest through reinvestment of dividends and distributions.
A. Significant Accounting Policies: The following significant accounting policies are in conformity with U.S. generally accepted accounting principles ("GAAP"). Such policies are consistently followed by the Fund in the preparation of its financial statements. GAAP may require management to make estimates and assumptions that affect the reported amounts and disclosures in the financial statements. Actual results may differ from those estimates.
1. Security Valuation: (1) An equity portfolio security listed or traded on an exchange is valued at its latest reported sales price (or at the exchange official closing price if such exchange reports an official closing price), and if there were no sales on a given day and if there is no official exchange closing price for that day, the security is valued at the mean between the last reported bid and asked prices if such bid and asked prices are available on the relevant exchanges; (2) all other equity portfolio securities for which over-the-counter ("OTC") market quotations are readily available are valued at the latest reported sales price (or at the market official closing price if such market reports an official closing price), and if there was no trading in the security on a given day and if there is no official closing price from relevant markets for that day, the security is valued at the mean between the last reported bid and asked prices if such bid and asked prices are available on the relevant markets. Listed equity securities not traded on the valuation date with no reported bid and asked prices available on the exchange are valued at the mean between the current bid and asked prices obtained from one or more reputable brokers or dealers. An unlisted equity
security that does not trade on the valuation date and for which bid and asked prices from the relevant markets are unavailable is valued at the mean between the current bid and asked prices obtained from one or more reputable brokers or dealers. In cases where a security is traded on more than one exchange, the security is valued on the exchange designated as the primary market; (3) certain portfolio securities may be valued by an outside pricing service/vendor approved by the Fund's Board of Directors (the "Directors"). The pricing service/vendor may employ a pricing model that takes into account, among other things, bids, yield spreads, and/or other market data and specific security characteristics. Alternatively, if a valuation is not available from an outside pricing service/vendor, and the security trades on an exchange, the security may be valued at its latest reported sale price (or at the exchange official closing price if such exchange reports an official closing price), prior to the time when assets are valued. If there are no sales on a given day and if there is no official exchange closing price for that day, the security is valued at the mean between the last reported bid and asked prices if such bid and asked prices are available in the relevant exchanges; (4) when market quotations are not readily available, including circumstances under which Morgan Stanley Investment Management Inc. (the "Adviser") determines that the closing price, last sale price or the mean between the last reported bid and asked prices are not reflective of a security's market value, portfolio securities are valued at their fair value as determined in good faith under procedures established by and under the general supervision of the Directors. Occasionally, developments affecting the closing prices of securities and other assets may occur between the times at which valuations of such securities are determined (that is, close of the foreign market on which the securities trade) and the close of business of the New York Stock Exchange ("NYSE"). If developments occur during such periods that are expected to materially affect the value of such securities, such valuations may be adjusted to reflect the estimated fair value of such securities as of the close of the NYSE, as determined in good faith by the Directors or by the Adviser using a pricing service and/or procedures approved by the Directors; (5) quotations of foreign portfolio securities, other assets and liabilities and forward contracts stated in foreign currency are translated into U.S. dollar equivalents at the prevailing market rates prior to the close of the NYSE; and (6) investments in mutual funds, including the
17
Morgan Stanley Institutional Fund, Inc.
Annual Report — December 31, 2016
Notes to Financial Statements (cont'd)
Morgan Stanley Institutional Liquidity Funds, are valued at the net asset value ("NAV") as of the close of each business day.
The Directors have responsibility for determining in good faith the fair value of the investments, and the Directors may appoint others, such as the Fund's Adviser or a valuation committee, to assist the Directors in determining fair value and to make the actual calculations pursuant to the fair valuation methodologies previously approved by the Directors. Under procedures approved by the Directors, the Fund's Adviser has formed a Valuation Committee whose members are approved by the Directors. The Valuation Committee provides administration and oversight of the Fund's valuation policies and procedures, which are reviewed at least annually by the Directors. These procedures allow the Fund to utilize independent pricing services, quotations from securities and financial instrument dealers, and other market sources to determine fair value.
The Fund has procedures to determine the fair value of securities and other financial instruments for which market prices are not readily available. Under these procedures, the Valuation Committee convenes on a regular and ad hoc basis to review such securities and considers a number of factors, including valuation methodologies and significant unobservable valuation inputs, when arriving at fair value. The Valuation Committee may employ a market-based approach which may use related or comparable assets or liabilities, recent transactions, market multiples, book values, and other relevant information for the investment to determine the fair value of the investment. An income-based valuation approach may also be used in which the anticipated future cash flows of the investment are discounted to calculate fair value. Discounts may also be applied due to the nature or duration of any restrictions on the disposition of the investments. Due to the inherent uncertainty of valuations of such investments, the fair values may differ significantly from the values that would have been used had an active market existed. The Valuation Committee employs various methods for calibrating these valuation approaches including a regular review of valuation methodologies, key inputs and assumptions, transactional back-testing or disposition analysis, and reviews of any related market activity.
2. Fair Value Measurement: Financial Accounting Standards Board ("FASB") Accounting Standards
CodificationTM ("ASC") 820, "Fair Value Measurement" ("ASC 820"), defines fair value as the value that the Fund would receive to sell an investment or pay to transfer a liability in a timely transaction with an independent buyer in the principal market, or in the absence of a principal market, the most advantageous market for the investment or liability. ASC 820 establishes a three-tier hierarchy to distinguish between (1) inputs that reflect the assumptions market participants would use in valuing an asset or liability developed based on market data obtained from sources independent of the reporting entity (observable inputs) and (2) inputs that reflect the reporting entity's own assumptions about the assumptions market participants would use in valuing an asset or liability developed based on the best information available in the circumstances (unobservable inputs) and to establish classification of fair value measurements for disclosure purposes. Various inputs are used in determining the value of the Fund's investments. The inputs are summarized in the three broad levels listed below.
• Level 1 – unadjusted quoted prices in active markets for identical investments
• Level 2 – other significant observable inputs (including quoted prices for similar investments, interest rates, prepayment speeds, credit risk, etc.)
• Level 3 – significant unobservable inputs including the Fund's own assumptions in determining the fair value of investments. Factors considered in making this determination may include, but are not limited to, information obtained by contacting the issuer, analysts, or the appropriate stock exchange (for exchange-traded securities), analysis of the issuer's financial statements or other available documents and, if necessary, available information concerning other securities in similar circumstances
The inputs or methodology used for valuing securities are not necessarily an indication of the risk associated with investing in those securities and the determination of the significance of a particular input to the fair value measurement in its entirety requires judgment and considers factors specific to each security.
18
Morgan Stanley Institutional Fund, Inc.
Annual Report — December 31, 2016
Notes to Financial Statements (cont'd)
The following is a summary of the inputs used to value the Portfolio's investments as of December 31, 2016.
Investment Type | | Level 1
Unadjusted
quoted
prices
(000) | | Level 2
Other
significant
observable
inputs
(000) | | Level 3
Significant
unobservable
inputs
(000) | | Total
(000) | |
Assets: | |
Common Stocks | |
Aerospace & Defense | | $ | 2,120 | | | $ | — | | | $ | — | | | $ | 2,120 | | |
Automobiles | | | 1,166 | | | | — | | | | — | | | | 1,166 | | |
Beverages | | | 8 | | | | — | | | | — | | | | 8 | | |
Capital Markets | | | 213 | | | | — | | | | — | | | | 213 | | |
Chemicals | | | 1,389 | | | | — | | | | — | | | | 1,389 | | |
Commercial Services &
Supplies | | | 487 | | | | — | | | | — | | | | 487 | | |
Diversified Financial
Services | | | 1,392 | | | | — | | | | — | | | | 1,392 | | |
Energy Equipment &
Services | | | 304 | | | | — | | | | — | | | | 304 | | |
Food Products | | | 262 | | | | — | | | | — | | | | 262 | | |
Health Care Equipment &
Supplies | | | 810 | | | | — | | | | — | | | | 810 | | |
Health Care Technology | | | 30 | | | | — | | | | — | | | | 30 | | |
Hotels, Restaurants &
Leisure | | | 933 | | | | — | | | | — | | | | 933 | | |
Industrial Conglomerates | | | 430 | | | | — | | | | — | | | | 430 | | |
Insurance | | | 1,972 | | | | — | | | | — | | | | 1,972 | | |
Internet Software &
Services | | | 939 | | | | — | | | | — | | | | 939 | | |
Leisure Products | | | 430 | | | | — | | | | — | | | | 430 | | |
Machinery | | | 4,144 | | | | — | | | | — | | | | 4,144 | | |
Media | | | 1,862 | | | | — | | | | — | | | | 1,862 | | |
Metals & Mining | | | 155 | | | | — | | | | — | | | | 155 | | |
Specialty Retail | | | 81 | | | | — | | | | — | | | | 81 | | |
Trading Companies &
Distributors | | | 687 | | | | — | | | | — | | | | 687 | | |
Transportation
Infrastructure | | | 599 | | | | — | | | | — | | | | 599 | | |
Total Common Stocks | | | 20,413 | | | | — | | | | — | | | | 20,413 | | |
Short-Term Investments | |
Investment Company | | | 3,769 | | | | — | | | | — | | | | 3,769 | | |
Repurchase Agreements | | | — | | | | 18 | | | | — | | | | 18 | | |
Total Short-Term
Investments | | | 3,769 | | | | 18 | | | | — | | | | 3,787 | | |
Total Assets | | $ | 24,182 | | | $ | 18 | | | $ | — | | | $ | 24,200 | | |
Transfers between investment levels may occur as the markets fluctuate and/or the availability of data used in an investment's valuation changes. The Portfolio recognizes transfers between the levels as of the end of the period. As of December 31, 2016, securities with a total value of approximately $599,000 transferred from Level 2 to Level 1. Securities that were valued using other significant observable inputs at December 31, 2015 were valued using unadjusted quoted prices at December 31, 2016. At December 31, 2015, the fair value of certain securities were adjusted due to developments which occurred between the time of the close of the foreign markets on
which they trade and the close of business on the NYSE which resulted in their Level 2 classification.
3. Repurchase Agreements: The Portfolio may enter into repurchase agreements under which the Portfolio lends cash and takes possession of securities with an agreement that the counterparty will repurchase such securities. In connection with transactions in repurchase agreements, a bank as custodian for the Portfolio takes possession of the underlying securities which are held as collateral, with a market value at least equal to the amount of the repurchase transaction, including principal and accrued interest. To the extent that any repurchase transaction exceeds one business day, the value of the collateral is marked-to-market on a daily basis to determine that the value of the collateral does not decrease below the repurchase price plus accrued interest as earned. If such a decrease occurs, additional collateral will be requested and, when received, will be added to the account to maintain full collateralization. In the event of default on the obligation to repurchase, the Portfolio has the right to liquidate the collateral and apply the proceeds in satisfaction of the obligation. In the event of default or bankruptcy by the counterparty to the agreement, realization of the collateral proceeds may be subject to cost and delays. The Portfolio, along with other affiliated investment companies, may utilize a joint trading account for the purpose of entering into repurchase agreements.
4. Foreign Currency Translation and Foreign Investments: The books and records of the Portfolio are maintained in U.S. dollars. Foreign currency amounts are translated into U.S. dollars as follows:
– investments, other assets and liabilities at the prevailing rate of exchange on the valuation date;
– investment transactions and investment income at the prevailing rates of exchange on the dates of such transactions.
Although the net assets of the Portfolio are presented at the foreign exchange rates and market values at the close of the period, the Portfolio does not isolate that portion of the results of operations arising as a result of changes in the foreign exchange rates from the fluctuations arising from changes in the market prices of securities held at period end. Similarly, the Portfolio does not isolate the effect of changes in foreign exchange rates from the fluctuations arising from changes in the market prices of securities sold during the period. Accordingly, realized and unrealized foreign currency gains (losses) on investments in securities
19
Morgan Stanley Institutional Fund, Inc.
Annual Report — December 31, 2016
Notes to Financial Statements (cont'd)
are included in the reported net realized and unrealized gains (losses) on investment transactions and balances. However, pursuant to U.S. federal income tax regulations, gains and losses from certain foreign currency transactions and the foreign currency portion of gains and losses realized on sales and maturities of foreign denominated debt securities are treated as ordinary income for U.S. federal income tax purposes.
Net realized gains (losses) on foreign currency transactions represent net foreign exchange gains (losses) from foreign currency forward exchange contracts, disposition of foreign currencies, currency gains (losses) realized between the trade and settlement dates on securities transactions, and the difference between the amount of investment income and foreign withholding taxes recorded on the Portfolio's books and the U.S. dollar equivalent amounts actually received or paid. Net unrealized currency gains (losses) from valuing foreign currency denominated assets and liabilities at period end exchange rates are reflected as a component of unrealized appreciation (depreciation) in the Statement of Assets and Liabilities. The change in unrealized currency gains (losses) on foreign currency translations for the period is reflected in the Statement of Operations.
Foreign security and currency transactions may involve certain considerations and risks not typically associated with those of U.S. dollar denominated transactions as a result of, among other factors, fluctuations of exchange rates in relation to the U.S. dollar, the possibility of lower levels of governmental supervision and regulation of foreign securities markets and the possibility of political or economic instability.
Governmental approval for foreign investments may be required in advance of making an investment under certain circumstances in some countries, and the extent of foreign investments in domestic companies may be subject to limitation in other countries. Foreign ownership limitations also may be imposed by the charters of individual companies to prevent, among other concerns, violations of foreign investment limitations. As a result, an additional class of shares (identified as "Foreign" in the Portfolio of Investments) may be created and offered for investment. The "local" and "foreign shares" market values may differ. In the absence of trading of the foreign shares in such markets, the Portfolio values the foreign shares at the closing exchange price of the local shares.
5. Securities Lending: The Portfolio lends securities to qualified financial institutions, such as broker-dealers, to earn additional income. Any increase or decrease in the fair value of the securities loaned that might occur and any interest earned or dividends declared on those securities during the term of the loan would remain in the Portfolio. The Portfolio would receive cash or securities as collateral in an amount equal to or exceeding 100% of the current fair value of the loaned securities. The collateral is marked-to-market daily by State Street Bank and Trust Company ("State Street"), the securities lending agent, to ensure that a minimum of 100% collateral coverage is maintained.
Based on pre-established guidelines, the securities lending agent invests any cash collateral that is received in an affiliated money market portfolio and repurchase agreements. Securities lending income is generated from the earnings on the invested collateral and borrowing fees, less any rebates owed to the borrowers and compensation to the lending agent, and is recorded as "Income from Securities Loaned — Net" in the Portfolio's Statement of Operations. Risks in securities lending transactions are that a borrower may not provide additional collateral when required or return the securities when due, and that the value of the short-term investments will be less than the amount of cash collateral plus any rebate that is required to be returned to the borrower.
The Portfolio has the right under the lending agreement to recover the securities from the borrower on demand.
The following table presents financial instruments that are subject to enforceable netting arrangements as of December 31, 2016.
Gross Amounts Not Offset in the Statement of Assets and Liabilities | |
Gross Asset
Amounts
Presented in
Statement of
Assets and
Liabilities
(000) | | Financial
Instrument
(000) | | Collateral
Received
(000) | | Net Amount
(not less
than $0)
(000) | |
| $ | 82 | (a) | | $ | — | | | $ | (82 | )(b)(c) | | $ | 0 | | |
(a) Represents market value of loaned securities at period end.
(b) The Portfolio received cash collateral of approximately $87,000, of which approximately $87,000 was subsequently invested in a Repurchase Agreement and Morgan Stanley Institutional Liquidity Funds as reported in the Portfolio of Investments. As of December 31, 2016, there was uninvested cash of less than $500, which is not reflected in the Portfolio of Investments.
(c) The actual collateral received is greater than the amount shown here due to overcollateralization.
20
Morgan Stanley Institutional Fund, Inc.
Annual Report — December 31, 2016
Notes to Financial Statements (cont'd)
FASB Accounting Standards Update No. 2014-11 ("ASU No. 2014-11"), "Transfers & Servicing (Topic 860): Repurchase-to-Maturity Transactions, Repurchase Financings, and Disclosures", is intended to provide increased transparency about the types of collateral pledged in securities lending transactions and other similar transactions that are accounted for as secured borrowing.
The following table displays a breakdown of transactions accounted for as secured borrowings, the gross obligations by class of collateral pledged, and the remaining contractual maturity of those transactions as of December 31, 2016.
Remaining Contractual Maturity of the Agreements | |
| | | Overnight and
Continuous
(000) | | <30 days
(000) | | Between
30 &
90 days
(000) | | >90 days
(000) | | Total
(000) | |
Securities Lending
Transactions | |
Common Stocks | | $ | 87 | | | $ | — | | | $ | — | | | $ | — | | | $ | 87 | | |
Total Borrowings | | $ | 87 | | | $ | — | | | $ | — | | | $ | — | | | $ | 87 | | |
Gross amount of
recognized liabilities
for securities lending
transactions | | | | | | | | | | $ | 87 | | |
6. Indemnifications: The Fund enters into contracts that contain a variety of indemnifications. The Fund's maximum exposure under these arrangements is unknown. However, the Fund has not had prior claims or losses pursuant to these contracts and expects the risk of loss to be remote.
7. Dividends and Distributions to Shareholders: Dividend income and distributions to shareholders are recorded on the ex-dividend date. Dividends from net investment income, if any, are declared and paid annually. Net realized capital gains, if any, are distributed at least annually.
8. Security Transactions, Income and Expenses: Security transactions are accounted for on the trade date (date the order to buy or sell is executed). Realized gains and losses on the sale of investment securities are determined on the specific identified cost method. Dividend income and other distributions are recorded on the ex-dividend date (except for certain foreign dividends which may be recorded as soon as the Portfolio is informed of such dividends) net of applicable withholding taxes. Interest income is recognized on the accrual basis except where
collection is in doubt. Discounts are accreted and premiums are amortized over the life of the respective securities. Most expenses of the Fund can be directly attributed to a particular Portfolio. Expenses which cannot be directly attributed are apportioned among the Portfolios based upon relative net assets or other appropriate methods. Income, expenses (other than class specific expenses — distribution and shareholder services, transfer agency and sub transfer agency fees) and realized and unrealized gains or losses are allocated to each class of shares based upon their relative net assets.
B. Advisory Fees: The Adviser, a wholly-owned subsidiary of Morgan Stanley, provides the Portfolio with advisory services under the terms of an Investment Advisory Agreement, paid quarterly, at the annual rate based on the daily net assets as follows:
First $750
million | | Next $750
million | | Over $1.5
billion | |
| | 0.80 | % | | | 0.75 | % | | | 0.70 | % | |
For the year ended December 31, 2016, the advisory fee rate (net of waivers/rebate) was equivalent to an annual effective rate of 0.00% of the Portfolio's average daily net assets.
The Adviser has agreed to reduce its advisory fee and/or reimburse the Portfolio so that total annual portfolio operating expenses, excluding certain investment related expenses, taxes, interest and other extraordinary expenses (including litigation), will not exceed 1.05% for Class I shares, 1.40% for Class A shares, 1.90% for Class L shares and 2.15% for Class C shares. The fee waivers and/or expense reimbursements will continue for at least one year from the date of the Portfolio's prospectus or until such time as the Directors act to discontinue all or a portion of such waivers and/or reimbursements when they deem such action is appropriate. For the year ended December 31, 2016, approximately $67,000 of advisory fees were waived and approximately $73,000 of other expenses were reimbursed by the Adviser pursuant to this arrangement.
C. Administration Fees: The Adviser also serves as Administrator to the Fund and provides administrative services pursuant to an Administration Agreement for an annual fee, accrued daily and paid monthly, of 0.08% of the Portfolio's average daily net assets.
Under a Sub-Administration Agreement between the Administrator and State Street, State Street provides certain administrative services to the Fund. For such services, the Administrator pays State Street a portion of the fee the Administrator receives from the Portfolio.
21
Morgan Stanley Institutional Fund, Inc.
Annual Report — December 31, 2016
Notes to Financial Statements (cont'd)
D. Distribution and Shareholder Services Fees: Morgan Stanley Distribution, Inc. ("MSDI" or the "Distributor"), a wholly-owned subsidiary of the Adviser and an indirect subsidiary of Morgan Stanley, serves as the Fund's Distributor of Portfolio shares pursuant to a Distribution Agreement. The Fund has adopted a Shareholder Services Plan with respect to Class A shares pursuant to Rule 12b-1 under the Act. Under the Shareholder Services Plan, the Portfolio pays the Distributor a shareholder services fee, accrued daily and paid monthly, at an annual rate of 0.25% of the Portfolio's average daily net assets attributable to Class A shares.
The Fund has adopted a Distribution and Shareholder Services Plan with respect to Class L shares pursuant to Rule 12b-1 under the Act. Under the Distribution and Shareholder Services Plan, the Portfolio pays the Distributor a distribution fee, accrued daily and paid monthly, at an annual rate of 0.50% and a shareholder services fee, accrued daily and paid monthly, at an annual rate of 0.25% of the Portfolio's average daily net assets attributable to Class L shares.
The Fund has adopted a Distribution and Shareholder Services Plan with respect to Class C shares pursuant to Rule 12b-1 under the Act. Under the Distribution and Shareholder Services Plan, the Portfolio pays the Distributor a distribution fee, accrued daily and paid monthly, at an annual rate of 0.75% and a shareholder services fee, accrued daily and paid monthly, at an annual rate of 0.25% of the Portfolio's average daily net assets attributable to Class C shares.
The distribution and shareholder services fees are used to support the expenses associated with servicing and maintaining accounts. The Distributor may compensate other parties for providing shareholder support services to investors who purchase Class A, Class L and Class C shares.
E. Dividend Disbursing and Transfer Agent: The Fund's dividend disbursing and transfer agent is Boston Financial Data Services, Inc. ("BFDS"). Pursuant to a Transfer Agency Agreement, the Fund pays BFDS a fee based on the number of classes, accounts and transactions relating to the Portfolios of the Fund.
F. Custodian Fees: State Street (the "Custodian") serves as Custodian for the Fund in accordance with a Custodian Agreement. The Custodian holds cash, securities, and other assets of the Fund as required by the Act. Custody fees are payable monthly based on assets held in custody, investment purchases and sales activity and account maintenance fees, plus reimbursement for certain out-of-pocket expenses.
In December 2015, the Fund's Custodian announced that it had identified inconsistencies in the way in which clients were invoiced for out-of-pocket expenses from 1998 until November 2015. The dollar amount difference between what was charged and what should have been charged, plus interest, was paid back to the Portfolio in September 2016 as a reimbursement. The Custodian reimbursed the Portfolio directly, which was recognized as a change in accounting estimate and was reflected as "Reimbursement of Custodian Fees" in the Statement of Operations. Pursuant to the expense limitations described in Note B, the Portfolio has experienced waiver of advisory fees and expenses reimbursed by the Adviser during the current period. Accordingly, the reimbursement of out-of-pocket custodian expenses in the current period resulted in the reduction in the current period expenses reimbursed by the Adviser.
G. Security Transactions and Transactions with Affiliates: For the year ended December 31, 2016, purchases and sales of investment securities for the Portfolio, other than long-term U.S. Government securities and short-term investments, were approximately $18,766,000 and $3,282,000, respectively. There were no purchases and sales of long-term U.S. Government securities for the year ended December 31, 2016.
The Portfolio invests in the Institutional Class of the Morgan Stanley Institutional Liquidity Funds (the "Liquidity Funds"), an open-end management investment company managed by the Adviser, both directly and as a portion of the securities held as collateral on loaned securities. Advisory fees paid by the Portfolio are reduced by an amount equal to its pro-rata share of the advisory and administration fees paid by the Portfolio due to its investment in the Liquidity Funds. For the year ended December 31, 2016, advisory fees paid were reduced by approximately $2,000 relating to the Portfolio's investment in the Liquidity Funds.
A summary of the Portfolio's transactions in shares of the Liquidity Funds during the year ended December 31, 2016 is as follows:
Value
December 31,
2015
(000) | | Purchases
at Cost
(000) | | Sales
(000) | | Dividend
Income
(000) | | Value
December 31,
2016
(000) | |
| $ | 54 | | | $ | 16,192 | | | $ | 12,477 | | | $ | 2 | | | $ | 3,769 | | |
The Portfolio is permitted to purchase and sell securities ("cross-trade") from and to other Morgan Stanley Funds as well as other funds and client accounts for which the Adviser or an affiliate of the Adviser serves as investment adviser, pursuant to
22
Morgan Stanley Institutional Fund, Inc.
Annual Report — December 31, 2016
Notes to Financial Statements (cont'd)
procedures approved by the Directors in compliance with Rule 17a-7 under the Act (the "Rule"). Each cross-trade is executed at the current market price in compliance with provisions of the Rule. For the year ended December 31, 2016, the Portfolio did not engage in any cross-trade transactions.
The Portfolio has an unfunded Deferred Compensation Plan (the "Compensation Plan"), which allows each independent Director to defer payment of all, or a portion, of the fees he or she receives for serving on the Board of Directors. Each eligible Director generally may elect to have the deferred amounts credited with a return equal to the total return on one or more of the Morgan Stanley funds that are offered as investment options under the Compensation Plan. Appreciation/depreciation and distributions received from these investments are recorded with an offsetting increase/decrease in the deferred compensation obligation and do not affect the NAV of the Portfolio.
H. Federal Income Taxes: It is the Portfolio's intention to continue to qualify as a regulated investment company and distribute all of its taxable and tax-exempt income. Accordingly, no provision for federal income taxes is required in the financial statements.
The Portfolio may be subject to taxes imposed by countries in which it invests. Such taxes are generally based on income and/or capital gains earned or repatriated. Taxes are accrued based on net investment income, net realized gains and net unrealized appreciation as such income and/or gains are earned or repatriated. Taxes are accrued based on net investment income, net realized gains and net unrealized appreciation as such income and/or gains are earned. Taxes may also be based on transactions in foreign currency and are accrued based on the value of investments denominated in such currency.
FASB ASC 740-10, "Income Taxes — Overall", sets forth a minimum threshold for financial statement recognition of the benefit of a tax position taken or expected to be taken in a tax return. Management has concluded that there are no significant uncertain tax positions that would require recognition in the financial statements. If applicable, the Portfolio recognizes interest accrued related to unrecognized tax benefits in "Interest Expense" and penalties in "Other Expenses" in the Statement of Operations. The Portfolio files tax returns with the U.S. Internal Revenue Service, New York and various states. Generally, each of the tax years in the four-year period ended December 31, 2016, remains subject to examination by taxing authorities.
The tax character of distributions paid may differ from the character of distributions shown in the Statements of Changes
in Net Assets due to short-term capital gains being treated as ordinary income for tax purposes. The tax character of distributions paid during fiscal years 2016 and 2015 was as follows:
2016
Distributions
Paid From: | | 2015
Distributions
Paid From: | |
Ordinary
Income
(000) | | Long-Term
Capital Gain
(000) | | Ordinary
Income
(000) | | Long-Term
Capital Gain
(000) | |
| $ | 257 | | | $ | 124 | | | $ | 127 | | | $ | 223 | | |
The amount and character of income and gains to be distributed are determined in accordance with income tax regulations which may differ from GAAP. These book/tax differences are either considered temporary or permanent in nature.
Temporary differences are primarily due to differing book and tax treatments in the timing of the recognition of gains (losses) on certain investment transactions and the timing of the deductibility of certain expenses.
Permanent differences, primarily due to differing treatments of gains (losses) related to foreign currency transactions, resulted in the following reclassifications among the components of net assets at December 31, 2016:
Accumulated
Undistributed
Net Investment
Income
(000) | | Accumulated
Net Realized
Gain
(000) | | Paid-in-
Capital
(000) | |
| $ | (2 | ) | | $ | 2 | | | $ | — | | |
At December 31, 2016, the components of distributable earnings for the Portfolio on a tax basis were as follows:
Undistributed
Ordinary
Income
(000) | | Undistributed
Long-Term
Capital Gain
(000) | |
| $ | 118 | | | $ | 53 | | |
I. Credit Facility: As of April 4, 2016, the Fund and other Morgan Stanley funds participated in a $150,000,000 committed, unsecured revolving line of credit facility (the "facility") with State Street. This facility is to be used for temporary emergency purposes or funding of shareholder redemption requests. The interest rate on borrowings is based on the federal funds rate or one month libor rate plus a spread. The facility also has a commitment fee of 0.25% per annum based on the unused portion of the facility. During the year ended December 31, 2016, the Portfolio did not have any borrowings under the facility.
J. Other: At December 31, 2016, the Portfolio had record owners of 10% or greater. Investment activities of these shareholders could have a material impact on the Portfolio. The aggregate percentage of such owners was 42.5%.
23
Morgan Stanley Institutional Fund, Inc.
Annual Report — December 31, 2016
Notes to Financial Statements (cont'd)
K. Accounting Pronouncements: In December 2016, FASB issued Accounting Standards update 2016-19 — Technical Corrections and Improvements ("ASU 2016-19"), which is effective for interim periods for all entities beginning after December 15, 2016. ASU 2016-19 includes an amendment to Topic 820, Fair Value Measurement, which clarifies the difference between a valuation approach and a valuation technique when applying the guidance in that Topic. That amendment also requires an entity to disclose when there has been a change in either or both a valuation approach and/or a valuation technique. The transition guidance for the amendment must be applied prospectively because it could potentially involve the use of hindsight that includes fair value measurements. Although still evaluating the potential impacts of ASU 2016-19 to the Portfolio, management expects that the impact of the Portfolio's adoption will be limited to additional financial statement disclosures.
In October 2016, the Securities and Exchange Commission ("SEC") issued a new rule, Investment Company Reporting Modernization, which, among other provisions, amends Regulation S-X to require standardized, enhanced disclosures, particularly related to derivatives, in investment company financial statements. Compliance with the guidance is effective for financial statements filed with the SEC on or after August 1, 2017; adoption will have no effect on the Portfolio's net assets or results of operations. Although still evaluating the potential impacts of the Investment Company Reporting Modernization to the Portfolio, management expects that the impact of the Portfolio's adoption will be limited to additional financial statement disclosures.
24
Morgan Stanley Institutional Fund, Inc.
Annual Report — December 31, 2016
Report of Independent Registered Public Accounting Firm
To the Shareholders and Board of Directors of
Morgan Stanley Institutional Fund, Inc. —
Insight Portfolio
We have audited the accompanying statement of assets and liabilities, including the portfolio of investments, of Insight Portfolio (one of the portfolios constituting Morgan Stanley Institutional Fund, Inc.) (the "Portfolio") as of December 31, 2016, and the related statement of operations for the year then ended, the statements of changes in net assets for each of the two years in the period then ended and the financial highlights for each of the years or periods indicated therein. These financial statements and financial highlights are the responsibility of the Portfolio's management. Our responsibility is to express an opinion on these financial statements and financial highlights based on our audits.
We conducted our audits in accordance with the standards of the Public Company Accounting Oversight Board (United States). Those standards require that we plan and perform the audit to obtain reasonable assurance about whether the financial statements and financial highlights are free of material misstatement. We were not engaged to perform an audit of the Portfolio's internal control over financial reporting. Our audits included consideration of internal control over financial reporting as a basis for designing audit procedures that are appropriate in the circumstances, but not for the purpose of expressing an opinion on the effectiveness of the Portfolio's internal control over financial reporting. Accordingly, we express no such opinion. An audit also includes examining, on a test basis, evidence supporting the amounts and disclosures in the financial statements and financial highlights, assessing the accounting principles used and significant estimates made by management, and evaluating the overall financial statement presentation. Our procedures included confirmation of securities owned as of December 31, 2016, by correspondence with the custodian and others or by other appropriate auditing procedures where replies from others were not received. We believe that our audits provide a reasonable basis for our opinion.
In our opinion, the financial statements and financial highlights referred to above present fairly, in all material respects, the financial position of Insight Portfolio (one of the portfolios constituting Morgan Stanley Institutional Fund, Inc.) at December 31, 2016, the results of its operations for the year then ended, the changes in its net assets for each of the two years in the period then ended and the financial highlights for each of the years or periods indicated therein, in conformity with U.S. generally accepted accounting principles.

Boston, Massachusetts
February 28, 2017
25
Morgan Stanley Institutional Fund, Inc.
Annual Report — December 31, 2016
Federal Tax Notice (unaudited)
For federal income tax purposes, the following information is furnished with respect to the distributions paid by the Portfolio during its taxable year ended December 31, 2016. For corporate shareholders, 19.7% of the dividends qualified for the dividends received deduction.
The Portfolio designated and paid approximately $124,000 as a long-term capital gain distribution.
For federal income tax purposes, the following information is furnished with respect to the Portfolio's earnings for its taxable year ended December 31, 2016. When distributed, certain earnings may be subject to a maximum tax rate of 15% as provided for the Jobs and Growth Tax Relief Reconciliation Act of 2003. The Portfolio designated up to a maximum of approximately $97,000 as taxable at this lower rate.
In January, the Portfolio provides tax information to shareholders for the preceding calendar year.
26
Morgan Stanley Institutional Fund, Inc.
Annual Report — December 31, 2016
Privacy Notice (unaudited)
MORGAN STANLEY INVESTMENT MANAGEMENT INC.
AN IMPORTANT NOTICE CONCERNING OUR U.S. PRIVACY POLICY
We are required by federal law to provide you with a copy of our privacy policy annually. This policy applies to current and former individual investors in funds managed or sponsored by Morgan Stanley Investment Management Inc. ("MSIM") as well as current and former individual clients of MSIM. This policy is not applicable to partnerships, corporations, trusts or other non-individual clients or investors. Please note that we may amend this policy at any time, and will inform you of any changes as required by law.
WE RESPECT YOUR PRIVACY
We appreciate that you have provided us with your personal financial information. We strive to maintain the privacy of such information while we help you achieve your financial objectives. This Notice describes what non-public personal information we collect about you, why we collect it, when we may share it with others and how certain others may use it. It discusses the steps you may take to limit our sharing of certain information about you to affiliated companies in the Morgan Stanley family of companies ("other Morgan Stanley companies"). It also discloses how you may limit use of certain shared information for marketing purposes by other Morgan Stanley branded companies. Throughout this policy, we refer to the non-public information that personally identifies you or your accounts as "personal information.''
1. WHAT PERSONAL INFORMATION DO WE COLLECT ABOUT YOU?
We obtain personal information from applications and other forms you submit to us, from your dealings with us, from consumer reporting agencies, from our Web sites and from third parties and other sources.
For example:
• We may collect information such as your name, address, e-mail address, telephone/fax numbers, assets, income and investment objectives through subscription documents, applications and other forms you submit to us.
• We may obtain information about account balances, your use of account(s) and the types of products and services you prefer to receive from us through your dealings and transactions with us and other sources.
• We may obtain information about your creditworthiness and credit history from consumer reporting agencies.
• We may collect background information from and through third-party vendors to verify representations you have made and to comply with various regulatory requirements.
• If you interact with us through our public and private Web sites, we may collect information that you provide directly through online communications (such as an e-mail address). We may also collect information about your Internet service provider, your domain name, your computer's operating system and Web browser, your use of our Web sites and your product and service preferences, through the use of "cookies." Please consult the Terms of Use of these sites for more details.
2. WHEN DO WE DISCLOSE PERSONAL INFORMATION WE COLLECT ABOUT YOU?
We may disclose personal information we collect about you to other Morgan Stanley companies and to non-affiliated third parties.
a. Information We Disclose to Other Morgan Stanley Companies.
We may disclose personal information to other Morgan Stanley companies for a variety of reasons, including to manage your account(s) effectively, to service and process your transactions, to let you know about products and services offered by us and other Morgan Stanley companies, to manage our business, and as otherwise required or permitted by law. Offers for products and services from other Morgan Stanley companies are developed under conditions designed to safeguard your personal information.
27
Morgan Stanley Institutional Fund, Inc.
Annual Report — December 31, 2016
Privacy Notice (unaudited) (cont'd)
b. Information We Disclose to Non-affiliated Third Parties.
We do not disclose personal information that we collect about you to non-affiliated third parties except to those who provide marketing services on our behalf, to financial institutions with whom we have joint marketing agreements, and as otherwise required or permitted by law. For example, we may disclose personal information to nonaffiliated third parties for servicing and processing transactions, to offer our own products and services, to protect against fraud, for institutional risk control, to respond to judicial process or to perform services on our behalf. When we share personal information with a non-affiliated third party, they are required to limit their use of personal information to the particular purpose for which it was shared and they are not allowed to share personal information with others except to fulfill that limited purpose or as may be permitted or required by law.
3. HOW DO WE PROTECT THE SECURITY AND CONFIDENTIALITY OF PERSONAL INFORMATION WE COLLECT ABOUT YOU?
We maintain physical, electronic and procedural security measures to help safeguard the personal information we collect about you. We have internal policies governing the proper handling of client information. Third parties that provide support or marketing services on our behalf may also receive personal information, and we require them to adhere to confidentiality standards with respect to such information.
4. HOW CAN YOU LIMIT THE SHARING OF CERTAIN TYPES OF PERSONAL INFORMATION WITH OTHER MORGAN STANLEY COMPANIES?
We offer you choices as to whether we share with other Morgan Stanley companies the personal information that was collected to determine your eligibility for products and services you request ("eligibility information"). Eligibility information does not include your identification information or personal information pertaining to our transactions or experiences with you. Please note that, even if you direct us not to share eligibility information with other Morgan Stanley companies ("opt-out"), we may still share personal information, including eligibility information, with those companies in circumstances excluded from the opt-out under applicable law, such as to process transactions or to service your account.
5. HOW CAN YOU LIMIT THE USE OF CERTAIN TYPES OF PERSONAL INFORMATION BY OTHER MORGAN STANLEY COMPANIES FOR MARKETING?
By following the opt-out instructions in Section 6 below, you may limit other Morgan Stanley branded companies from marketing their products or services to you based on personal information we disclose to them. This information may include, for example, your income and account history with us. Please note that, even if you choose to limit Other Morgan Stanley Companies from using personal information about you that we may share with them for marketing their products and services to you, Other Morgan Stanley Companies may use your personal information that they obtain from us to market to you in circumstances permitted by law, such as if the Other Morgan Stanley Company has its own relationship with you.
6. HOW CAN YOU SEND US AN OPT-OUT INSTRUCTION?
If you wish to limit our sharing of eligibility information about you with other Morgan Stanley companies or other Morgan Stanley companies' use of personal information for marketing purposes, as described in this notice, you may do so by:
• Calling us at (800) 548-7786
Monday–Friday between 8a.m. and 6p.m.(EST)
• Writing to us at the following address:
Boston Financial Data Services, Inc.
c/o Privacy Coordinator
P.O. Box 219804
Kansas City, Missouri 64121
28
Morgan Stanley Institutional Fund, Inc.
Annual Report — December 31, 2016
Privacy Notice (unaudited) (cont'd)
Your written request should include your name, address, telephone number and account number(s) to which the opt-out applies and whether you are opting out with respect to sharing of eligibility information (Section 4 above), or if information used for Marketing (Section 5 above) or both. Written opt-out requests should not be sent with any other correspondence. In order to process your request, we require that the request be provided by you directly and not through a third party.
Your opt-out preference will remain in effect with respect to this policy (as it may be amended) until you notify us otherwise. If you have a joint account, your direction for us not to share this information with other Morgan Stanley companies and for those other Morgan Stanley companies not to use your personal information for marketing will be applied to all account holders on that account. Please understand that if you limit our sharing or our affiliated companies' use of personal information, you and any joint account holder(s) may not receive information about Morgan Stanley products and services, including products or services that could help you manage your financial resources and achieve your investment objectives.
7. WHAT IF AN AFFILIATED COMPANY BECOMES A NON-AFFILIATED THIRD PARTY?
If, at any time in the future, an affiliated company becomes a non-affiliated third party, further disclosures of personal information made to the former affiliated company will be limited to those described in Section 2(b) above relating to non-affiliated third parties. If you elected under Section 6 to limit disclosures we make to affiliated companies, or use of personal information by affiliated companies, your election will not apply to use by any former affiliated company of your personal information in their possession once it becomes a non-affiliated third party.
SPECIAL NOTICE TO RESIDENTS OF VERMONT
The following section supplements our policy with respect to our individual clients who have a Vermont address and supersedes anything to the contrary in the above policy with respect to those clients only.
The state of Vermont requires financial institutions to obtain your consent prior to sharing personal information that they collect about you with affiliated companies and non-affiliated third parties other than in certain limited circumstances. Except as permitted by law, we will not share personal information we collect about you with non-affiliated third parties or other Morgan Stanley companies unless you provide us with your written consent to share such information ("opt-in").
If you wish to receive offers for investment products and services offered by or through other Morgan Stanley companies, please notify us in writing at the following address:
Boston Financial Data Services, Inc.
c/o Privacy Coordinator
P.O. Box 219804
Kansas City, Missouri 64121
Your authorization should include your name, address, telephone number and account number(s) to which the opt-in applies and should not be sent with any other correspondence. In order to process your authorization, we require that the authorization be provided by you directly and not through a third party.
SPECIAL NOTICE TO RESIDENTS OF CALIFORNIA
The following section supplements our policy with respect to our individual clients who have a California address and supersedes anything to the contrary in the above policy with respect to those clients only.
In response to a California law, if your account has a California home address, your personal information will not be disclosed to nonaffiliated third parties except as permitted by applicable California law, and we will limit sharing such information with our affiliates to comply with California privacy laws that apply to us.
29
Morgan Stanley Institutional Fund, Inc.
Annual Report — December 31, 2016
Director and Officer Information (unaudited)
Independent Directors:
Name, Age and Address of
Independent Director | | Position(s)
Held with
Registrant | | Length of Time
Served* | | Principal Occupation(s) During Past 5 Years
and Other Relevant Professional Experience | | Number of
Overseen by
Independent
Director** | | Portfolios in
Fund Complex
Other Directorships
Held by Independent
Director*** | |
Frank L. Bowman (72)
c/o Perkins Coie LLP
Counsel to the Independent
Directors
30 Rockefeller Plaza
New York, NY 10112 | | Director | | Since
August
2006 | | President, Strategic Decisions, LLC (consulting) (since February 2009); Director or Trustee of various Morgan Stanley Funds (since August 2006); Chairperson of the Compliance and Insurance Committee (since October 2015); formerly, Chairperson of the Insurance Sub-Committee of the Compliance and Insurance Committee (2007-2015); served as President and Chief Executive Officer of the Nuclear Energy Institute (policy organization) (February 2005-November 2008); retired as Admiral, U.S. Navy after serving over 38 years on active duty including 8 years as Director of the Naval Nuclear Propulsion Program in the Department of the Navy and the U.S. Department of Energy (1996-2004); served as Chief of Naval Personnel (July 1994-September 1996) and on the Joint Staff as Director of Political Military Affairs (June 1992-July 1994); knighted as Honorary Knight Commander of the Most Excellent Order of the British Empire; awarded the Officier de l'Orde National du Mérite by the French Government; elected to the National Academy of Engineering (2009). | | | 90 | | | Director of BP p.l.c.; Director of Naval and Nuclear Technologies LLP; Director Emeritus of the Armed Services YMCA; Director of the U.S. Naval Submarine League; Member of the National Security Advisory Council of the Center for U.S. Global Engagement and a member of the CNA Military Advisory Board; Chairman of the charity J Street Cup Golf; Trustee of Fairhaven United Methodist Church; and Director of other various non-profit organizations. | |
Kathleen A. Dennis (63)
c/o Perkins Coie LLP
Counsel to the Independent Directors
30 Rockefeller Plaza
New York, NY 10112 | | Director | | Since
August
2006 | | President, Cedarwood Associates (mutual fund and investment management consulting) (since July 2006); Chairperson of the Liquidity and Alternatives Sub-Committee of the Investment Committee (since October 2006) and Director or Trustee of various Morgan Stanley Funds (since August 2006); formerly, Senior Managing Director of Victory Capital Management (1993-2006). | | | 91 | | | Director of various non-profit organizations. | |
Nancy C. Everett (61)
c/o Perkins Coie LLP
Counsel to the Independent Directors
30 Rockefeller Plaza
New York, NY 10112 | | Director | | Since
January
2015 | | Chief Executive Officer, Virginia Commonwealth University Investment Company (since November 2015); Owner, OBIR, LLC (institutional investment management consulting) (since June 2014); formerly, Managing Director, BlackRock Inc. (February 2011-December 2013); and Chief Executive Officer, General Motors Asset Management (a/k/a Promark Global Advisors, Inc.) (June 2005-May 2010). | | | 91 | | | Member of Virginia Commonwealth University School of Business Foundation; formerly, Member of Virginia Commonwealth University Board of Visitors (2013-2015); Member of Committee on Directors for Emerging Markets Growth Fund, Inc. (2007-2010); Chairperson of Performance Equity Management, LLC (2006-2010); and Chairperson, GMAM Absolute Return Strategies Fund, LLC (2006-2010). | |
30
Morgan Stanley Institutional Fund, Inc.
Annual Report — December 31, 2016
Director and Officer Information (unaudited) (cont'd)
Independent Directors: (cont'd)
Name, Age and Address of
Independent Director | | Position(s)
Held with
Registrant | | Length of Time
Served* | | Principal Occupation(s) During Past 5 Years
and Other Relevant Professional Experience | | Number of
Overseen by
Independent
Director** | | Portfolios in
Fund Complex
Other Directorships
Held by Independent
Director*** | |
Jakki L. Haussler (59)
c/o Perkins Coie LLP
Counsel to the Independent Directors
30 Rockefeller Plaza
New York, NY 10112 | | Director | | Since
January
2015 | | Chairman and Chief Executive Officer, Opus Capital Group (since January 1996); formerly, Director, Capvest Venture Fund, LP (May 2000-December 2011); Partner, Adena Ventures, LP (July 1999-December 2010); Director, The Victory Funds (February 2005-July 2008). | | | 91 | | | Director of Cincinnati Bell Inc. and Member, Audit Committee and Compensation Committee; Director of Northern Kentucky University Foundation and Member, Investment Committee; Member of Chase College of Law Transactional Law Practice Center Board of Advisors; Director of Best Transport; Director of Chase College of Law Board of Visitors; formerly, Member, University of Cincinnati Foundation Investment Committee; Member, Miami University Board of Visitors (2008-2011); Trustee of Victory Funds (2005-2008) and Chairman, Investment Committee (2007-2008) and Member, Service Provider Committee (2005-2008). | |
Dr. Manuel H. Johnson (67)
c/o Johnson Smick
International, Inc.
220 I Street, N.E. — Suite 200
Washington, D.C. 20002 | | Director | | Since
July
1991 | | Senior Partner, Johnson Smick International, Inc. (consulting firm); Chairperson of the Investment Committee (since October 2006) and Director or Trustee of various Morgan Stanley Funds (since July 1991); Co-Chairman and a founder of the Group of Seven Council (G7C) (international economic commission); formerly, Chairperson of the Audit Committee (July 1991-September 2006), Vice Chairman of the Board of Governors of the Federal Reserve System and Assistant Secretary of the U.S. Treasury. | | | 91 | | | Director of NVR, Inc. (home construction). | |
Joseph J. Kearns (74)
c/o Kearns & Associates LLC
46 E Peninsula Center #385
Rolling Hills Estates, CA 90274-3712 | | Director | | Since
August
1994 | | President, Kearns & Associates LLC (investment consulting); Chairperson of the Audit Committee (since October 2006) and Director or Trustee of various Morgan Stanley Funds (since August 1994); formerly, Deputy Chairperson of the Audit Committee (July 2003-September 2006) and Chairperson of the Audit Committee of various Morgan Stanley Funds (since August 1994); CFO of the J. Paul Getty Trust. | | | 93 | | | Director of Electro Rent Corporation (equipment leasing). Prior to December 31, 2013, Director of The Ford Family Foundation. | |
31
Morgan Stanley Institutional Fund, Inc.
Annual Report — December 31, 2016
Director and Officer Information (unaudited) (cont'd)
Independent Directors: (cont'd)
Name, Age and Address of
Independent Director | | Position(s)
Held with
Registrant | | Length of Time
Served* | | Principal Occupation(s) During Past 5 Years
and Other Relevant Professional Experience | | Number of
Overseen by
Independent
Director** | | Portfolios in
Fund Complex
Other Directorships
Held by Independent
Director*** | |
Michael F. Klein (58)
c/o Perkins Coie LLP
Counsel to the Independent Directors
30 Rockefeller Plaza
New York, NY 10112 | | Director | | Since
August
2006 | | Managing Director, Aetos Capital, LLC (since March 2000); Co-President, Aetos Alternatives Management, LLC (since January 2004) and Co-Chief Executive Officer of Aetos Capital LLC (since August 2013); Chairperson of the Fixed Income Sub-Committee of the Investment Committee (since October 2006) and Director or Trustee of various Morgan Stanley Funds (since August 2006); formerly, Managing Director, Morgan Stanley & Co. Inc. and Morgan Stanley Dean Witter Investment Management, President, various Morgan Stanley Funds (June 1998-March 2000) and Principal, Morgan Stanley & Co. Inc. and Morgan Stanley Dean Witter Investment Management (August 1997-December 1999). | | | 90 | | | Director of certain investment funds managed or sponsored by Aetos Capital, LLC; Director of Sanitized AG and Sanitized Marketing AG (specialty chemicals). | |
Patricia Maleski (56)
c/o Perkins Coie LLP
Counsel to the Independent Directors
30 Rockefeller Plaza
New York, NY 10112 | | Director | | Since
January
2017 | | Management Director, JPMorgan Asset Management (2013-2016); President, JPMorgan Funds (2010-2013), Chief Administrative Officer, JPMorgan Funds (2004-2010), Treasurer, JPMorgan Funds (2003-2004, 2008-2010), and Vice President and Board Liaison, JPMorgan Funds (2001-2004); Managing Director, J.P. Morgan Investment Management Inc. (2001-2013); Vice President of Finance, Pierpont Group (1996-2001); Vice President, Bank of New York (1995-1996); Senior Audit Manager, Price Waterhouse, LLP (1982-1995). | | | 91 | | | None. | |
Michael E. Nugent (80)
522 Fifth Avenue
New York, NY 10036 | | Chair of the Board and Director | | Chair of the Boards since July 2006 and Director since July 1991 | | Chair of the Boards of various Morgan Stanley Funds (since July 2006); Chairperson of the Closed-End Fund Committee (since June 2012) and Director or Trustee of various Morgan Stanley Funds (since July 1991); formerly, Chairperson of the Insurance Committee (until July 2006); General Partner, Triumph Capital, L.P. (private investment partnership) (1988-2013). | | | 92 | | | None. | |
W. Allen Reed (69)
c/o Perkins Coie LLP
Counsel to the Independent Directors
30 Rockefeller Plaza
New York, NY 10112 | | Director | | Since
August
2006 | | Chairperson of the Equity Sub-Committee of the Investment Committee (since October 2006) and Director or Trustee of various Morgan Stanley Funds (since August 2006); formerly, President and CEO of General Motors Asset Management; Chairman and Chief Executive Officer of the GM Trust Bank and Corporate Vice President of General Motors Corporation (August 1994-December 2005). | | | 91 | | | Director of Legg Mason, Inc.; formerly, Director of the Auburn University Foundation (2010-2015). | |
Fergus Reid (84)
c/o Joe Pietryka, Inc.
85 Charles Colman Blvd.
Pawling, NY 12564 | | Director | | Since
June
1992 | | Chairman, Joe Pietryka, Inc.; Chairperson of the Governance Committee and Director or Trustee of various Morgan Stanley Funds (since June 1992). | | | 92 | | | Formerly, Trustee and Director of certain investment companies in the JP Morgan Fund Complex managed by JP Morgan Investment Management Inc. (1987-2012). | |
* This is the earliest date the Director began serving the Morgan Stanley Funds. Each Director serves an indefinite term, until his or her successor is elected.
** The Fund Complex includes (as of December 31, 2016) all open-end and closed-end funds (including all of their portfolios) advised by Morgan Stanley Investment Management Inc. (the "Adviser") and any funds that have an adviser that is an affiliated person of the Adviser (including, but not limited to, Morgan Stanley AIP GP LP).
*** This includes any directorships at public companies and registered investment companies held by the Director at any time during the past five years.
32
Morgan Stanley Institutional Fund, Inc.
Annual Report — December 31, 2016
Director and Officer Information (unaudited) (cont'd)
Executive Officers:
Name, Age and Address of Executive Officer | | Position(s) Held
with
Registrant | | Length of Time
Served* | | Principal Occupation(s) During Past 5 Years | |
John H. Gernon (53)
522 Fifth Avenue
New York, NY 10036 | | President and Principal Executive Officer | | Since
September
2013 | | President and Principal Executive Officer of the Equity and Fixed Income Funds and the Morgan Stanley AIP Funds (since September 2013) and the Liquidity Funds and various money market funds (since May 2014) in the Fund Complex; Managing Director of the Adviser; Head of Product (since 2006). | |
Timothy J. Knierim (58)
522 Fifth Avenue
New York, NY 10036 | | Chief Compliance Officer | | Since
December
2016 | | Managing Director of the Adviser and various entities affiliated with the Adviser; Chief Compliance Officer of various Morgan Stanley Funds and the Adviser (since December 2016) and Chief Compliance Officer of Morgan Stanley AIP GP LP (since 2014). Formerly, Managing Director and Deputy Chief Compliance Officer of the Adviser (2014-2016); and formerly, Chief Compliance Officer of Prudential Investment Management, Inc. (2007-2014). | |
Francis J. Smith (51)
522 Fifth Avenue
New York, NY 10036 | | Treasurer and Principal Financial Officer | | Treasurer since July 2003 and Principal Financial Officer since September 2002 | | Managing Director of the Adviser and various entities affiliated with the Adviser; Treasurer (since July 2003) and Principal Financial Officer of various Morgan Stanley Funds (since September 2002). | |
Mary E. Mullin (49)
522 Fifth Avenue
New York, NY 10036 | | Secretary | | Since
June
1999 | | Executive Director of the Adviser; Secretary of various Morgan Stanley Funds (since June 1999). | |
* This is the earliest date the officer began serving the Morgan Stanley Funds. Each officer serves a one-year term, until his or her successor is elected and qualifies.
33
Morgan Stanley Institutional Fund, Inc.
Annual Report — December 31, 2016
Adviser and Administrator
Morgan Stanley Investment Management Inc.
522 Fifth Avenue
New York, New York 10036
Distributor
Morgan Stanley Distribution, Inc.
522 Fifth Avenue
New York, New York 10036
Dividend Disbursing and Transfer Agent
Boston Financial Data Services, Inc.
2000 Crown Colony Drive
Quincy, Massachusetts 02169
Custodian
State Street Bank and Trust Company
One Lincoln Street
Boston, Massachusetts 02111
Legal Counsel
Dechert LLP
1095 Avenue of the Americas
New York, New York 10036
Counsel to the Independent Directors
Perkins Coie LLP
30 Rockefeller Plaza
New York, New York 10112
Independent Registered Public Accounting Firm
Ernst & Young LLP
200 Clarendon Street
Boston, Massachusetts 02116
Reporting to Shareholders
Each Morgan Stanley fund provides a complete schedule of portfolio holdings in its semi-annual and annual reports within 60 days of the end of the fund's second and fourth fiscal quarters. The semi-annual and annual reports are filed electronically with the Securities and Exchange Commission (SEC) on Form N-CSRS and Form N-CSR, respectively. Morgan Stanley also delivers the semi-annual and annual reports to fund shareholders and makes these reports available on its public website, www.morganstanley.com/im. Each Morgan Stanley fund also files a complete schedule of portfolio holdings with the SEC for the fund's first and third fiscal quarters on Form N-Q. Morgan Stanley does not deliver the reports for the first and third fiscal quarters to shareholders, nor are the reports posted to the Morgan Stanley public website. You may, however, obtain the Form N-Q filings (as well as the Form N-CSR and N-CSRS filings) by accessing the SEC's website, www.sec.gov. You may also review and copy them at the SEC's Public Reference Room in Washington, DC. Information on the operation of the SEC's Public Reference Room may be obtained by calling the SEC toll free at 1 (800) SEC-0330. You can also request copies of these materials, upon payment of a duplicating fee, by electronic request at the SEC's email address (publicinfo@sec.gov) or by writing the Public Reference Room of the SEC, 100 F Street, NE, Washington, DC 20549-0102.
Proxy Voting Policies and Procedures and Proxy Voting Record
You may obtain a copy of the Fund's Proxy Voting Policy and Procedures and information regarding how the Fund voted proxies relating to portfolio securities during the most recent twelve-month period ended June 30, without charge, upon request, by calling toll free 1 (800) 548-7786 or by visiting our website at www.morganstanley.com/im. This information is also available on the SEC's website at www.sec.gov.
This report is authorized for distribution only when preceded or accompanied by a prospectus or summary prospectus of the applicable Portfolio of Morgan Stanley Institutional Fund, Inc., which describes in detail the Portfolio's investment policies, risks, fees and expenses. Please read the prospectus carefully before you invest or send money. For additional information, including information regarding the investments comprising the Portfolio, please visit our website at www.morganstanley.com/im or call toll free 1 (800) 548-7786.
34
(This Page has been left blank intentionally.)
(This Page has been left blank intentionally.)
(This Page has been left blank intentionally.)
Printed in U.S.A.
This Report has been prepared for shareholders and may be distributed to others only if preceded or accompanied by a current prospectus.
Morgan Stanley Investment Management Inc.
522 Fifth Avenue
New York, New York 10036
© 2017 Morgan Stanley. Morgan Stanley Distribution, Inc.

IFIINSGTANN
1695806 EXP. 02.28.18

Morgan Stanley Institutional Fund, Inc.
International Advantage Portfolio
Annual Report
December 31, 2016

Morgan Stanley Institutional Fund, Inc.
Annual Report — December 31, 2016
Shareholders' Letter | | | 2 | | |
Expense Example | | | 3 | | |
Investment Overview | | | 4 | | |
Portfolio of Investments | | | 6 | | |
Statement of Assets and Liabilities | | | 8 | | |
Statement of Operations | | | 10 | | |
Statements of Changes in Net Assets | | | 11 | | |
Financial Highlights | | | 13 | | |
Notes to Financial Statements | | | 17 | | |
Report of Independent Registered Public Accounting Firm | | | 27 | | |
Federal Tax Notice | | | 28 | | |
Privacy Notice | | | 29 | | |
Director and Officer Information | | | 32 | | |
This report is authorized for distribution only when preceded or accompanied by a prospectus or summary prospectus of the applicable Portfolio of Morgan Stanley Institutional Fund, Inc. To receive a prospectus and/or statement of additional information (SAI), which contains more complete information such as investment objectives, charges, expenses, policies for voting proxies, risk considerations, and describes in detail each of the Portfolio's investment policies to the prospective investor, please call toll free 1 (800) 548-7786. Please read the prospectuses carefully before you invest or send money.
Additionally, you can access information about the Portfolio, including performance, characteristics, and investment team commentary, through Morgan Stanley Investment Management's website: www.morganstanley.com/im.
Market forecasts provided in this report may not necessarily come to pass. There is no guarantee that any sectors mentioned will continue to perform as discussed herein or that securities in such sectors will be held by the Portfolio in the future. There is no assurance that a Portfolio will achieve its investment objective. Portfolios are subject to market risk, which is the possibility that market values of securities owned by the Portfolio will decline and, therefore, the value of the Portfolio's shares may be less than what you paid for them. Accordingly, you can lose money investing in this Portfolio. Please see the prospectus for more complete information on investment risks.
1
Morgan Stanley Institutional Fund, Inc.
Annual Report — December 31, 2016
Shareholders' Letter (unaudited)
Dear Shareholders,
We are pleased to provide this Annual report, in which you will learn how your investment in International Advantage Portfolio (the "Portfolio") performed during the latest twelve-month period.
Morgan Stanley Investment Management is a client-centric, investor-led organization. Our global presence, intellectual capital, and breadth of products and services enable us to partner with investors to meet the evolving challenges of today's financial markets. We aim to deliver superior investment service and to empower our clients to make the informed decisions that help them reach their investment goals.
As always, we thank you for selecting Morgan Stanley Investment Management, and look forward to working with you in the months and years ahead.
Sincerely,

John H. Gernon
President and Principal Executive Officer
January 2017
2
Morgan Stanley Institutional Fund, Inc.
Annual Report — December 31, 2016
Expense Example (unaudited)
International Advantage Portfolio
As a shareholder of the Portfolio, you incur two types of costs: (1) transactional costs, including redemption fees; and (2) ongoing costs, which may include advisory fees, administration fees, distribution and shareholder services fees and other Portfolio expenses. This example is intended to help you understand your ongoing costs (in dollars) of investing in the Portfolio and to compare these costs with the ongoing costs of investing in other mutual funds.
This example is based on an investment of $1,000 invested at the beginning of the six-month period ended December 31, 2016 and held for the entire six-month period.
Actual Expenses
The table below provides information about actual account values and actual expenses. You may use the information in this table, together with the amount you invested, to estimate the expenses that you paid over the period. Simply divide your account value by $1,000 (for example, an $8,600 account value divided by $1,000 = 8.6), then multiply the result by the number in the table under the heading entitled "Actual Expenses Paid During Period" to estimate the expenses you paid on your account during this period.
Hypothetical Example for Comparison Purposes
The table below provides information about hypothetical account values and hypothetical expenses based on the Portfolio's actual expense ratio and an assumed rate of return of 5% per year before expenses, which is not the Portfolio's actual return. The hypothetical account values and expenses may not be used to estimate the actual ending account balance or expenses you paid for the period. You may use this information to compare the ongoing costs of investing in the Portfolio and other funds. To do so, compare this 5% hypothetical example with the 5% hypothetical examples that appear in the shareholder reports of the other funds.
Please note that the expenses shown in the table are meant to highlight your ongoing costs only and do not reflect any transactional costs, such as sales charges (loads) and redemption fees. Therefore, the information for each class in the table is useful in comparing ongoing costs only, and will not help you determine the relative total costs of owning different funds. In addition, if these transactional costs were included, your costs would have been higher.
| | | Beginning
Account
Value
7/1/16 | | Actual Ending
Account
Value
12/31/16 | | Hypothetical
Ending Account
Value | | Actual
Expenses
Paid
During
Period* | | Hypothetical
Expenses Paid
During Period* | | Net
Expense
Ratio
During
Period** | |
International Advantage Portfolio Class I | | $ | 1,000.00 | | | $ | 1,023.80 | | | $ | 1,020.16 | | | $ | 5.04 | | | $ | 5.03 | | | | 0.99 | %*** | |
International Advantage Portfolio Class A | | | 1,000.00 | | | | 1,022.20 | | | | 1,018.35 | | | | 6.86 | | | | 6.85 | | | | 1.35 | *** | |
International Advantage Portfolio Class L | | | 1,000.00 | | | | 1,019.80 | | | | 1,015.89 | | | | 9.34 | | | | 9.32 | | | | 1.84 | *** | |
International Advantage Portfolio Class C | | | 1,000.00 | | | | 1,019.10 | | | | 1,014.63 | | | | 10.61 | | | | 10.58 | | | | 2.09 | *** | |
* Expenses are calculated using each Portfolio Class' annualized net expense ratio (as disclosed), multiplied by the average account value over the period, and multiplied by 184/366 (to reflect the most recent one-half year period).
** Annualized.
*** Refer to Note F in the Notes to Financial Statements for discussion of prior period custodian out-of-pocket expenses that were reimbursed in the current period.
3
Morgan Stanley Institutional Fund, Inc.
Annual Report — December 31, 2016
Investment Overview (unaudited)
International Advantage Portfolio
The Portfolio seeks long-term capital appreciation.
Performance
For the year ended December 31, 2016, the Portfolio's Class I shares had a total return based on net asset value and reinvestment of distributions per share of 2.47%, net of fees. The Portfolio's Class I shares underperformed the Portfolio's benchmark, the MSCI All Country World ex USA Index (the "Index"), which returned 4.50%.
Factors Affecting Performance
• International equities rose 4.50% for the 12-month period, as measured by the Index. The Index was led by commodity-driven markets, including Brazil, Russia and Canada, while Japan and Europe lagged. Early in the year, worries about weak global growth and disinflation drove share prices lower. However, sentiment brightened as commodity prices bottomed, China's economy stabilized, the U.S. economy strengthened and global central banks remained accommodative. In the second half of the year, equity markets largely shrugged off the Brexit referendum's surprise outcome, and the unexpected election of Donald Trump was broadly supportive for equities as investors anticipated a pro-growth, reflationary policy scenario from the new administration.
• The Portfolio underperformed the Index during the period, due to unfavorable stock selection and sector allocation.
• Detractors from relative performance included stock selection in the information technology and consumer staples sectors. Underweight allocations to the materials and energy sectors were also detrimental to relative results, as was an overweight to consumer staples.
• Relative gains came from our stock selection in the consumer discretionary, utilities and health care sectors, as well as from an underweight in health care and overweight in information technology.
Management Strategies
• There were no changes to our bottom-up investment process during the period. The Growth Team seeks high quality companies, which we define primarily as those with sustainable competitive advantages. Our team continues to focus on bottom-up stock selection and the
long-term outlook for companies owned in the portfolio; accordingly, we have had very limited turnover in the portfolio to date, as our ongoing work reaffirms our assessment of quality and competitive advantage in the names we own.
• At the close of the period, consumer discretionary represented the largest sector weight in the Portfolio, followed by consumer staples and information technology. The team's bottom-up investment process resulted in sector overweight positions in consumer staples, consumer discretionary and information technology, and underweight positions in financials, materials, energy, industrials, health care, telecommunication services, real estate and utilities.
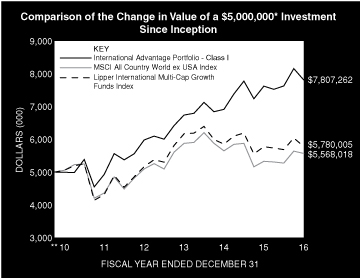
* Minimum Investment for Class I shares
** Commenced Operations on December 28, 2010.
In accordance with SEC regulations, the Portfolio's performance shown assumes that all recurring fees (including management fees) were deducted and all dividends and distributions were reinvested. The performance of Class A, L and C shares will vary from the performance of Class I shares based upon their different inception dates and will be impacted by additional fees assessed to those classes.
4
Morgan Stanley Institutional Fund, Inc.
Annual Report — December 31, 2016
Investment Overview (unaudited) (cont'd)
International Advantage Portfolio
Performance Compared to the MSCI All Country World ex USA Index(1) and the Lipper International Multi-Cap Growth Funds Index(2)
| | | Period Ended December 31, 2016
Total Returns(3) | |
| | | | | Average Annual | |
| | | One
Year | | Five
Years | | Ten
Years | | Since
Inception(6) | |
Portfolio — Class I Shares
w/o sales charges(4) | | | 2.47 | % | | | 9.63 | % | | | — | | | | 7.70 | % | |
Portfolio — Class A Shares
w/o sales charges(4) | | | 2.13 | | | | 9.31 | | | | — | | | | 7.39 | | |
Portfolio — Class A Shares with
maximum 5.25% sales charges(4) | | | –3.20 | | | | 8.15 | | | | — | | | | 6.44 | | |
Portfolio — Class L Shares
w/o sales charges(4) | | | 1.64 | | | | 8.77 | | | | — | | | | 6.85 | | |
Portfolio — Class C Shares
w/o sales charges(5) | | | 1.38 | | | | — | | | | — | | | | –0.77 | | |
Portfolio — Class C Shares with
maximum 1.00% deferred
sales charges(5) | | | 0.39 | | | | — | | | | — | | | | –0.77 | | |
MSCI All Country World
ex USA Index | | | 4.50 | | | | 5.00 | | | | — | | | | 1.81 | | |
Lipper International Multi-Cap
Growth Funds Index | | | 0.08 | | | | 6.02 | | | | — | | | | 2.44 | | |
Performance data quoted represents past performance, which is no guarantee of future results, and current performance may be lower or higher than the figures shown. Performance assumes that all dividends and distributions, if any, were reinvested. For the most recent month-end performance figures, please visit www.morganstanley.com/im. Investment return and principal value will fluctuate so that Portfolio shares, when redeemed, may be worth more or less than their original cost. Total returns do not reflect the deduction of taxes that a shareholder would pay on Portfolio distributions or the redemption of Portfolio shares. Performance of share classes will vary due to difference in sales charges and expenses.
(1) The MSCI All Country World ex USA Index is a free float-adjusted market capitalization weighted index designed to measure the equity market performance of developed and emerging markets, excluding the United States. The term "free float" represents the portion of shares outstanding that are deemed to be available for purchase in the public equity markets by investors. The Index is unmanaged and its returns do not include any sales charges or fees. Such costs would lower performance. It is not possible to invest directly in an index.
(2) The Lipper International Multi-Cap Growth Funds Index is an equally weighted performance index of the largest qualifying funds (based on net assets) in the Lipper International Multi-Cap Growth Funds classification. The Index, which is adjusted for capital gains distributions and income dividends, is unmanaged and should not be considered an investment. There are currently 30 funds represented in this Index. As of the date of this report, the Portfolio was in the Lipper International Multi-Cap Growth Funds classification.
(3) Total returns for the Portfolio reflect fees waived and expenses reimbursed, if applicable, by the Adviser. Without such waivers and reimbursements, total returns would have been lower.
(4) Commenced operations on December 28, 2010.
(5) Commenced offering on April 30, 2015.
(6) For comparative purposes, average annual since inception returns listed for the Indexes refer to the inception date of Class I of the Portfolio, not the inception of the Index.
5
Morgan Stanley Institutional Fund, Inc.
Annual Report — December 31, 2016
Portfolio of Investments
International Advantage Portfolio
| | | Shares | | Value
(000) | |
Common Stocks (94.4%) | |
Australia (2.0%) | |
CSL Ltd. | | | 11,402 | | | $ | 826 | | |
Belgium (2.7%) | |
Anheuser-Busch InBev N.V. | | | 10,688 | | | | 1,131 | | |
Canada (4.6%) | |
Brookfield Asset Management, Inc., Class A | | | 23,607 | | | | 779 | | |
Brookfield Infrastructure Partners LP | | | 33,967 | | | | 1,137 | | |
| | | | 1,916 | | |
China (14.9%) | |
Foshan Haitian Flavouring & Food Co., Ltd.,
Class A | | | 201,100 | | | | 849 | | |
Jiangsu Hengrui Medicine Co., Ltd., Class A | | | 138,660 | | | | 908 | | |
Kweichow Moutai Co., Ltd., Class A | | | 9,411 | | | | 452 | | |
Suofeiya Home Collection Co. Ltd., Class A | | | 23,310 | | | | 182 | | |
TAL Education Group ADR (a) | | | 30,875 | | | | 2,166 | | |
Tencent Holdings Ltd. (b) | | | 68,200 | | | | 1,668 | | |
| | | | 6,225 | | |
Denmark (5.7%) | |
DSV A/S | | | 53,337 | | | | 2,373 | | |
France (15.1%) | |
Christian Dior SE | | | 9,962 | | | | 2,089 | | |
Danone SA | | | 13,500 | | | | 856 | | |
Hermes International | | | 6,156 | | | | 2,527 | | |
Pernod Ricard SA | | | 7,606 | | | | 824 | | |
| | | | 6,296 | | |
Hong Kong (2.5%) | |
AIA Group Ltd. | | | 182,000 | | | | 1,027 | | |
Japan (6.1%) | |
Calbee, Inc. | | | 47,000 | | | | 1,472 | | |
Keyence Corp. | | | 1,600 | | | | 1,098 | | |
| | | | 2,570 | | |
Korea, Republic of (1.3%) | |
Loen Entertainment, Inc. (a) | | | 8,458 | | | | 532 | | |
Netherlands (4.7%) | |
Priceline Group, Inc. (The) (a) | | | 1,326 | | | | 1,944 | | |
Norway (0.9%) | |
Telenor ASA | | | 25,636 | | | | 383 | | |
Switzerland (4.4%) | |
Kuehne & Nagel International AG (Registered) | | | 6,335 | | | | 837 | | |
Nestle SA (Registered) | | | 14,062 | | | | 1,009 | | |
| | | | 1,846 | | |
United Kingdom (16.2%) | |
Burberry Group PLC | | | 61,807 | | | | 1,140 | | |
Diageo PLC | | | 32,479 | | | | 845 | | |
Fevertree Drinks PLC | | | 91,991 | | | | 1,291 | | |
Hargreaves Lansdown PLC | | | 48,999 | | | | 733 | | |
Reckitt Benckiser Group PLC | | | 23,056 | | | | 1,957 | | |
Rightmove PLC | | | 17,057 | | | | 820 | | |
| | | | 6,786 | | |
| | | Shares | | Value
(000) | |
United States (13.3%) | |
Brookfield Business Partners LP (a) | | | 185 | | | $ | 5 | | |
Cognizant Technology Solutions Corp., Class A (a) | | | 29,272 | | | | 1,640 | | |
EPAM Systems, Inc. (a) | | | 29,311 | | | | 1,885 | | |
Globant SA (a) | | | 14,308 | | | | 477 | | |
Luxoft Holding, Inc. (a) | | | 27,569 | | | | 1,549 | | |
| | | | 5,556 | | |
Total Common Stocks (Cost $38,853) | | | 39,411 | | |
Participation Note (1.0%) | |
China (1.0%) | |
Suofeiya Home Collection Co., Ltd., Equity
Linked Notes, expires 4/25/17 (a)
(Cost $445) | | | 51,400 | | | | 400 | | |
| | | Notional
Amount | | (000) | |
Call Option Purchased (0.0%) | |
Foreign Currency Option (0.0%) | |
USD/CNY May 2017 @ CNY 7.90,
Royal Bank of Scotland (Cost $14) | | | 3,281 | | | | 12 | | |
| | | Shares | | | |
Short-Term Investment (3.8%) | |
Investment Company (3.8%) | |
Morgan Stanley Institutional Liquidity
Funds — Treasury Securities Portfolio —
Institutional Class (See Note G)
(Cost $1,586) | | | 1,585,666 | | | | 1,586 | | |
Total Investments (99.2%) (Cost $40,898) (c) | | | 41,409 | | |
Other Assets in Excess of Liabilities (0.8%) | | | 336 | | |
Net Assets (100.0%) | | $ | 41,745 | | |
Country assignments and aggregations are based generally on third party vendor classifications and information, and may be different from the assignments and aggregations under the policies set forth in the Portfolio's prospectus and/or statement of additional information relating to geographic classifications.
(a) Non-income producing security.
(b) Security trades on the Hong Kong exchange.
(c) At December 31, 2016, the aggregate cost for federal income tax purposes is approximately $40,955,000. The aggregate gross unrealized appreciation is approximately $1,311,000 and the aggregate gross unrealized depreciation is approximately $857,000, resulting in net unrealized appreciation of approximately $454,000.
ADR American Depositary Receipt.
CNY Chinese Yuan Renminbi
USD United States Dollar
The accompanying notes are an integral part of the financial statements.
6
Morgan Stanley Institutional Fund, Inc.
Annual Report — December 31, 2016
Portfolio of Investments (cont'd)
International Advantage Portfolio
Portfolio Composition
Classification | | Percentage of
Total Investments | |
Other* | | | 35.8 | % | |
Textiles, Apparel & Luxury Goods | | | 13.9 | | |
Information Technology Services | | | 12.3 | | |
Beverages | | | 11.0 | | |
Food Products | | | 10.1 | | |
Internet Software & Services | | | 6.0 | | |
Road & Rail | | | 5.7 | | |
Diversified Consumer Services | | | 5.2 | | |
Total Investments | | | 100.0 | % | |
* Industries and/or investment types representing less than 5% of total investments.
The accompanying notes are an integral part of the financial statements.
7
Morgan Stanley Institutional Fund, Inc.
Annual Report — December 31, 2016
International Advantage Portfolio
Statement of Assets and Liabilities | | December 31, 2016
(000) | |
Assets: | |
Investments in Securities of Unaffiliated Issuers, at Value (Cost $39,312) | | $ | 39,823 | | |
Investment in Security of Affiliated Issuer, at Value (Cost $1,586) | | | 1,586 | | |
Total Investments in Securities, at Value (Cost $40,898) | | | 41,409 | | |
Foreign Currency, at Value (Cost $1) | | | 1 | | |
Cash | | | 8 | | |
Receivable for Portfolio Shares Sold | | | 412 | | |
Tax Reclaim Receivable | | | 11 | | |
Dividends Receivable | | | 9 | | |
Receivable from Affiliate | | | 1 | | |
Other Assets | | | 37 | | |
Total Assets | | | 41,888 | | |
Liabilities: | |
Payable for Professional Fees | | | 48 | | |
Payable for Portfolio Shares Redeemed | | | 42 | | |
Payable for Advisory Fees | | | 26 | | |
Payable for Custodian Fees | | | 8 | | |
Payable for Shareholder Services Fees — Class A | | | 2 | | |
Payable for Distribution and Shareholder Services Fees — Class L | | | — | @ | |
Payable for Distribution and Shareholder Services Fees — Class C | | | 1 | | |
Payable for Transfer Agency Fees — Class I | | | 1 | | |
Payable for Transfer Agency Fees — Class A | | | 1 | | |
Payable for Transfer Agency Fees — Class L | | | — | @ | |
Payable for Transfer Agency Fees — Class C | | | 1 | | |
Payable for Administration Fees | | | 2 | | |
Payable for Sub Transfer Agency Fees — Class I | | | 1 | | |
Payable for Sub Transfer Agency Fees — Class A | | | 1 | | |
Payable for Sub Transfer Agency Fees — Class L | | | — | @ | |
Payable for Sub Transfer Agency Fees — Class C | | | — | @ | |
Other Liabilities | | | 9 | | |
Total Liabilities | | | 143 | | |
Net Assets | | $ | 41,745 | | |
Net Assets Consist Of: | |
Paid-in-Capital | | $ | 41,154 | | |
Accumulated Net Investment Loss | | | (11 | ) | |
Accumulated Undistributed Net Realized Gain | | | 92 | | |
Unrealized Appreciation (Depreciation) on: | |
Investments | | | 511 | | |
Foreign Currency Translations | | | (1 | ) | |
Net Assets | | $ | 41,745 | | |
The accompanying notes are an integral part of the financial statements.
8
Morgan Stanley Institutional Fund, Inc.
Annual Report — December 31, 2016
International Advantage Portfolio
Statement of Assets and Liabilities (cont'd) | | December 31, 2016
(000) | |
CLASS I: | |
Net Assets | | $ | 29,781 | | |
| Shares Outstanding $0.001 par value shares of beneficial interest (unlimited shares authorized) (not in 000's) | | | 2,499,979 | | |
Net Asset Value, Offering and Redemption Price Per Share | | $ | 11.91 | | |
CLASS A: | |
Net Assets | | $ | 10,822 | | |
| Shares Outstanding $0.001 par value shares of beneficial interest (unlimited shares authorized) (not in 000's) | | | 912,581 | | |
Net Asset Value, Redemption Price Per Share | | $ | 11.86 | | |
Maximum Sales Load | | | 5.25 | % | |
Maximum Sales Charge | | $ | 0.66 | | |
Maximum Offering Price Per Share | | $ | 12.52 | | |
CLASS L: | |
Net Assets | | $ | 75 | | |
| Shares Outstanding $0.001 par value shares of beneficial interest (unlimited shares authorized) (not in 000's) | | | 6,384 | | |
Net Asset Value, Offering and Redemption Price Per Share | | $ | 11.70 | | |
CLASS C: | |
Net Assets | | $ | 1,067 | | |
| Shares Outstanding $0.001 par value shares of beneficial interest (unlimited shares authorized) (not in 000's) | | | 91,726 | | |
Net Asset Value, Offering and Redemption Price Per Share | | $ | 11.63 | | |
@ Amount is less than $500.
The accompanying notes are an integral part of the financial statements.
9
Morgan Stanley Institutional Fund, Inc.
Annual Report — December 31, 2016
International Advantage Portfolio
Statement of Operations | | Year Ended
December 31, 2016
(000) | |
Investment Income: | |
Dividends from Securities of Unaffiliated Issuers (Net of $22 of Foreign Taxes Withheld) | | $ | 215 | | |
Dividends from Security of Affiliated Issuer (Note G) | | | 3 | | |
Income from Securities Loaned — Net | | | 2 | | |
Total Investment Income | | | 220 | | |
Expenses: | |
Advisory Fees (Note B) | | | 142 | | |
Professional Fees | | | 97 | | |
Registration Fees | | | 51 | | |
Custodian Fees (Note F) | | | 36 | | |
Shareholder Services Fees — Class A (Note D) | | | 17 | | |
Distribution and Shareholder Services Fees — Class L (Note D) | | | 2 | | |
Distribution and Shareholder Services Fees — Class C (Note D) | | | 7 | | |
Sub Transfer Agency Fees — Class I | | | 9 | | |
Sub Transfer Agency Fees — Class A | | | 8 | | |
Sub Transfer Agency Fees — Class L | | | — | @ | |
Sub Transfer Agency Fees — Class C | | | 1 | | |
Administration Fees (Note C) | | | 14 | | |
Shareholder Reporting Fees | | | 12 | | |
Transfer Agency Fees — Class I (Note E) | | | 3 | | |
Transfer Agency Fees — Class A (Note E) | | | 2 | | |
Transfer Agency Fees — Class L (Note E) | | | 2 | | |
Transfer Agency Fees — Class C (Note E) | | | 2 | | |
Pricing Fees | | | 6 | | |
Directors' Fees and Expenses | | | 2 | | |
Other Expenses | | | 23 | | |
Total Expenses | | | 436 | | |
Waiver of Advisory Fees (Note B) | | | (142 | ) | |
Expenses Reimbursed by Adviser (Note B) | | | (33 | ) | |
Reimbursement of Class Specific Expenses — Class I (Note B) | | | (12 | ) | |
Reimbursement of Class Specific Expenses — Class A (Note B) | | | (3 | ) | |
Reimbursement of Class Specific Expenses — Class L (Note B) | | | (2 | ) | |
Reimbursement of Class Specific Expenses — Class C (Note B) | | | (2 | ) | |
Rebate from Morgan Stanley Affiliate (Note G) | | | (2 | ) | |
Reimbursement of Custodian Fees (Note F) | | | (30 | ) | |
Net Expenses | | | 210 | | |
Net Investment Income | | | 10 | | |
Realized Gain (Loss): | |
Investments Sold | | | 586 | | |
Foreign Currency Transactions | | | (11 | ) | |
Net Realized Gain | | | 575 | | |
Change in Unrealized Appreciation (Depreciation): | |
Investments | | | 181 | | |
Foreign Currency Translations | | | — | @ | |
Net Change in Unrealized Appreciation (Depreciation) | | | 181 | | |
Net Realized Gain and Change in Unrealized Appreciation (Depreciation) | | | 756 | | |
Net Increase in Net Assets Resulting from Operations | | $ | 766 | | |
@ Amount is less than $500.
The accompanying notes are an integral part of the financial statements.
10
Morgan Stanley Institutional Fund, Inc.
Annual Report — December 31, 2016
International Advantage Portfolio
Statements of Changes in Net Assets | | Year Ended
December 31, 2016
(000) | | Year Ended
December 31, 2015
(000) | |
Increase (Decrease) in Net Assets: | |
Operations: | |
Net Investment Income | | $ | 10 | | | $ | 26 | | |
Net Realized Gain | | | 575 | | | | 594 | | |
Net Change in Unrealized Appreciation (Depreciation) | | | 181 | | | | (85 | ) | |
Net Increase in Net Assets Resulting from Operations | | | 766 | | | | 535 | | |
Distributions from and/or in Excess of: | |
Class I: | |
Net Investment Income | | | — | | | | (24 | ) | |
Net Realized Gain | | | (272 | ) | | | (340 | ) | |
Class A: | |
Net Investment Income | | | — | | | | (11 | ) | |
Net Realized Gain | | | (182 | ) | | | (343 | ) | |
Class L: | |
Net Investment Income | | | — | | | | (1 | ) | |
Net Realized Gain | | | (1 | ) | | | (26 | ) | |
Class C: | |
Net Investment Income | | | — | | | | (— | @) | |
Net Realized Gain | | | (17 | ) | | | (29 | ) | |
Total Distributions | | | (472 | ) | | | (774 | ) | |
Capital Share Transactions:(1) | |
Class I: | |
Subscribed | | | 30,034 | | | | 1,649 | | |
Distributions Reinvested | | | 272 | | | | 307 | | |
Redeemed | | | (3,133 | ) | | | (3,117 | ) | |
Class A: | |
Subscribed | | | 12,448 | | | | 2,595 | | |
Distributions Reinvested | | | 182 | | | | 318 | | |
Redeemed | | | (4,830 | ) | | | (508 | ) | |
Class L: | |
Exchanged | | | 51 | | | | — | | |
Subscribed | | | — | | | | 91 | | |
Distributions Reinvested | | | 1 | | | | 9 | | |
Redeemed | | | (193 | ) | | | (25 | ) | |
Class C: | |
Subscribed | | | 975 | | | | 253 | * | |
Distributions Reinvested | | | 17 | | | | 28 | * | |
Redeemed | | | (159 | ) | | | — | | |
Net Increase in Net Assets Resulting from Capital Share Transactions | | | 35,665 | | | | 1,600 | | |
Redemption Fees | | | 1 | | | | — | | |
Total Increase in Net Assets | | | 35,960 | | | | 1,361 | | |
Net Assets: | |
Beginning of Period | | | 5,785 | | | | 4,424 | | |
End of Period (Including Accumulated Net Investment Loss and Distributions in Excess of Net Investment Income
of $(11) and $(—@), respectively) | | $ | 41,745 | | | $ | 5,785 | | |
The accompanying notes are an integral part of the financial statements.
11
Morgan Stanley Institutional Fund, Inc.
Annual Report — December 31, 2016
International Advantage Portfolio
Statements of Changes in Net Assets (cont'd) | | Year Ended
December 31, 2016
(000) | | Year Ended
December 31, 2015
(000) | |
(1) Capital Share Transactions: | |
Class I: | |
Shares Subscribed | | | 2,536 | | | | 126 | | |
Shares Issued on Distributions Reinvested | | | 23 | | | | 25 | | |
Shares Redeemed | | | (259 | ) | | | (225 | ) | |
Net Increase (Decrease) in Class I Shares Outstanding | | | 2,300 | | | | (74 | ) | |
Class A: | |
Shares Subscribed | | | 1,045 | | | | 193 | | |
Shares Issued on Distributions Reinvested | | | 16 | | | | 26 | | |
Shares Redeemed | | | (400 | ) | | | (39 | ) | |
Net Increase in Class A Shares Outstanding | | | 661 | | | | 180 | | |
Class L: | |
Shares Exchanged | | | 4 | | | | — | | |
Shares Subscribed | | | — | | | | 7 | | |
Shares Issued on Distributions Reinvested | | | — | @@ | | | 1 | | |
Shares Redeemed | | | (16 | ) | | | (2 | ) | |
Net Increase (Decrease) in Class L Shares Outstanding | | | (12 | ) | | | 6 | | |
Class C: | |
Shares Subscribed | | | 83 | | | | 19 | * | |
Shares Issued on Distributions Reinvested | | | 1 | | | | 2 | * | |
Shares Redeemed | | | (13 | ) | | | — | | |
Net Increase in Class C Shares Outstanding | | | 71 | | | | 21 | | |
* For the period April 30, 2015 through December 31, 2015.
@ Amount is less than $500.
@@ Amount is less than 500 shares.
The accompanying notes are an integral part of the financial statements.
12
Morgan Stanley Institutional Fund, Inc.
Annual Report — December 31, 2016
Financial Highlights
International Advantage Portfolio
| | | Class I | |
| | | Year Ended December 31, | |
Selected Per Share Data and Ratios | | 2016(1) | | 2015 | | 2014 | | 2013 | | 2012 | |
Net Asset Value, Beginning of Period | | $ | 11.80 | | | $ | 12.36 | | | $ | 12.36 | | | $ | 11.60 | | | $ | 9.65 | | |
Income from Investment Operations: | |
Net Investment Income (2) | | | 0.02 | | | | 0.10 | | | | 0.13 | | | | 0.13 | | | | 0.12 | | |
Net Realized and Unrealized Gain | | | 0.29 | | | | 1.18 | | | | 0.20 | | | | 1.32 | | | | 1.93 | | |
Total from Investment Operations | | | 0.31 | | | | 1.28 | | | | 0.33 | | | | 1.45 | | | | 2.05 | | |
Distributions from and/or in Excess of: | |
Net Investment Income | | | — | | | | (0.10 | ) | | | (0.07 | ) | | | (0.12 | ) | | | (0.10 | ) | |
Net Realized Gain | | | (0.20 | ) | | | (1.74 | ) | | | (0.26 | ) | | | (0.57 | ) | | | — | | |
Total Distributions | | | (0.20 | ) | | | (1.84 | ) | | | (0.33 | ) | | | (0.69 | ) | | | (0.10 | ) | |
Redemption Fees | | | 0.00 | (3) | | | — | | | | 0.00 | (3) | | | — | | | | — | | |
Net Asset Value, End of Period | | $ | 11.91 | | | $ | 11.80 | | | $ | 12.36 | | | $ | 12.36 | | | $ | 11.60 | | |
Total Return (4) | | | 2.47 | % | | | 10.23 | % | | | 2.58 | % | | | 12.72 | % | | | 21.27 | % | |
Ratios and Supplemental Data: | |
Net Assets, End of Period (Thousands) | | $ | 29,781 | | | $ | 2,361 | | | $ | 3,387 | | | $ | 2,637 | | | $ | 1,421 | | |
Ratio of Expenses to Average Net Assets (8) | | | 0.99 | %(5) | | | 1.16 | %(5)(6) | | | 1.24 | %(5) | | | 1.24 | %(5) | | | 1.24 | %(5) | |
Ratio of Net Investment Income to Average Net Assets (8) | | | 0.20 | %(5) | | | 0.76 | %(5) | | | 1.05 | %(5) | | | 1.04 | %(5) | | | 1.08 | %(5) | |
Ratio of Rebate from Morgan Stanley Affiliates to Average Net Assets | | | 0.01 | % | | | 0.00 | %(7) | | | 0.01 | % | | | 0.00 | %(7) | | | 0.01 | % | |
Portfolio Turnover Rate | | | 23 | % | | | 96 | % | | | 30 | % | | | 49 | % | | | 40 | % | |
(8) Supplemental Information on the Ratios to Average Net Assets: | |
Ratios Before Expense Limitation: | |
Expenses to Average Net Assets | | | 2.26 | % | | | 4.82 | % | | | 5.47 | % | | | 6.30 | % | | | 8.89 | % | |
Net Investment Loss to Average Net Assets | | | (1.07 | )% | | | (2.90 | )% | | | (3.18 | )% | | | (4.02 | )% | | | (6.57 | )% | |
(1) Refer to Note F in the Notes to Financial Statements for discussion of prior period custodian out-of-pocket expenses that were reimbursed in the current period. The amount of the reimbursement was immaterial on a per share basis and did not impact the total return of Class I shares. The Ratio of Expenses to Average Net Assets and the Ratio of Net Investment Income to Average Net Assets would be unchanged as the reimbursement of custodian fees was offset against current period expense waivers/reimbursements with no impact to net expenses or net investment income.
(2) Per share amount is based on average shares outstanding.
(3) Amount is less than $0.005 per share.
(4) Calculated based on the net asset value as of the last business day of the period.
(5) The Ratios of Expenses and Net Investment Income reflect the rebate of certain Portfolio expenses in connection with the investments in Morgan Stanley affiliates during the period. The effect of the rebate on the ratios is disclosed in the above table as "Ratio of Rebate from Morgan Stanley Affiliates to Average Net Assets."
(6) Effective July 1, 2015, the Adviser has agreed to limit the ratio of expenses to average net assets to the maximum ratio of 1.00% for Class I shares. Prior to July 1, 2015, the maximum ratio was 1.25% for Class I shares.
(7) Amount is less than 0.005%.
The accompanying notes are an integral part of the financial statements.
13
Morgan Stanley Institutional Fund, Inc.
Annual Report — December 31, 2016
Financial Highlights
International Advantage Portfolio
| | | Class A | |
| | | Year Ended December 31, | |
Selected Per Share Data and Ratios | | 2016(1) | | 2015 | | 2014 | | 2013 | | 2012 | |
Net Asset Value, Beginning of Period | | $ | 11.79 | | | $ | 12.37 | | | $ | 12.38 | | | $ | 11.60 | | | $ | 9.65 | | |
Income (Loss) from Investment Operations: | |
Net Investment Income (Loss) (2) | | | (0.00 | )(3) | | | 0.01 | | | | 0.09 | | | | 0.04 | | | | 0.09 | | |
Net Realized and Unrealized Gain | | | 0.27 | | | | 1.23 | | | | 0.19 | | | | 1.38 | | | | 1.94 | | |
Total from Investment Operations | | | 0.27 | | | | 1.24 | | | | 0.28 | | | | 1.42 | | | | 2.03 | | |
Distributions from and/or in Excess of: | |
Net Investment Income | | | — | | | | (0.08 | ) | | | (0.03 | ) | | | (0.07 | ) | | | (0.08 | ) | |
Net Realized Gain | | | (0.20 | ) | | | (1.74 | ) | | | (0.26 | ) | | | (0.57 | ) | | | — | | |
Total Distributions | | | (0.20 | ) | | | (1.82 | ) | | | (0.29 | ) | | | (0.64 | ) | | | (0.08 | ) | |
Redemption Fees | | | 0.00 | (3) | | | — | | | | 0.00 | (3) | | | — | | | | — | | |
Net Asset Value, End of Period | | $ | 11.86 | | | $ | 11.79 | | | $ | 12.37 | | | $ | 12.38 | | | $ | 11.60 | | |
Total Return (4) | | | 2.13 | % | | | 9.92 | % | | | 2.21 | % | | | 12.43 | % | | | 20.99 | % | |
Ratios and Supplemental Data: | |
Net Assets, End of Period (Thousands) | | $ | 10,822 | | | $ | 2,966 | | | $ | 889 | | | $ | 248 | | | $ | 116 | | |
Ratio of Expenses to Average Net Assets (9) | | | 1.34 | %(5) | | | 1.46 | %(5)(7) | | | 1.59 | %(5) | | | 1.55 | %(5)(6) | | | 1.49 | %(5) | |
Ratio of Net Investment Income (Loss) to Average Net Assets (9) | | | (0.04 | )%(5) | | | 0.09 | %(5) | | | 0.70 | %(5) | | | 0.29 | %(5) | | | 0.83 | %(5) | |
Ratio of Rebate from Morgan Stanley Affiliates to Average Net Assets | | | 0.01 | % | | | 0.00 | %(8) | | | 0.01 | % | | | 0.00 | %(8) | | | 0.01 | % | |
Portfolio Turnover Rate | | | 23 | % | | | 96 | % | | | 30 | % | | | 49 | % | | | 40 | % | |
(9) Supplemental Information on the Ratios to Average Net Assets: | |
Ratios Before Expense Limitation: | |
Expenses to Average Net Assets | | | 2.55 | % | | | 5.77 | % | | | 6.03 | % | | | 6.89 | % | | | 9.14 | % | |
Net Investment Loss to Average Net Assets | | | (1.25 | )% | | | (4.22 | )% | | | (3.74 | )% | | | (5.05 | )% | | | (6.82 | )% | |
(1) Refer to Note F in the Notes to Financial Statements for discussion of prior period custodian out-of-pocket expenses that were reimbursed in the current period. The amount of the reimbursement was immaterial on a per share basis and did not impact the total return of Class A shares. The Ratio of Expenses to Average Net Assets and the Ratio of Net Investment Loss to Average Net Assets would be unchanged as the reimbursement of custodian fees was offset against current period expense waivers/reimbursements with no impact to net expenses or net investment loss.
(2) Per share amount is based on average shares outstanding.
(3) Amount is less than $0.005 per share.
(4) Calculated based on the net asset value which does not reflect sales charges, if applicable, as of the last business day of the period.
(5) The Ratios of Expenses and Net Investment Income (Loss) reflect the rebate of certain Portfolio expenses in connection with the investments in Morgan Stanley affiliates during the period. The effect of the rebate on the ratios is disclosed in the above table as "Ratio of Rebate from Morgan Stanley Affiliates to Average Net Assets."
(6) Effective September 16, 2013, the Adviser has agreed to limit the ratio of expenses to average net assets to the maximum ratio of 1.60% for Class A shares. Prior to September 16, 2013, the maximum ratio was 1.50% for Class A shares.
(7) Effective July 1, 2015, the Adviser has agreed to limit the ratio of expenses to average net assets to the maximum ratio of 1.35% for Class A shares. Prior to July 1, 2015, the maximum ratio was 1.60% for Class A shares.
(8) Amount is less than 0.005%.
The accompanying notes are an integral part of the financial statements.
14
Morgan Stanley Institutional Fund, Inc.
Annual Report — December 31, 2016
Financial Highlights
International Advantage Portfolio
| | | Class L | |
| | | Year Ended December 31, | |
Selected Per Share Data and Ratios | | 2016(1) | | 2015 | | 2014 | | 2013 | | 2012 | |
Net Asset Value, Beginning of Period | | $ | 11.69 | | | $ | 12.31 | | | $ | 12.36 | | | $ | 11.60 | | | $ | 9.65 | | |
Income (Loss) from Investment Operations: | |
Net Investment Income (Loss) (2) | | | (0.06 | ) | | | (0.04 | ) | | | 0.02 | | | | 0.02 | | | | 0.04 | | |
Net Realized and Unrealized Gain | | | 0.27 | | | | 1.20 | | | | 0.20 | | | | 1.34 | | | | 1.93 | | |
Total from Investment Operations | | | 0.21 | | | | 1.16 | | | | 0.22 | | | | 1.36 | | | | 1.97 | | |
Distributions from and/or in Excess of: | |
Net Investment Income | | | — | | | | (0.04 | ) | | | (0.01 | ) | | | (0.03 | ) | | | (0.02 | ) | |
Net Realized Gain | | | (0.20 | ) | | | (1.74 | ) | | | (0.26 | ) | | | (0.57 | ) | | | — | | |
Total Distributions | | | (0.20 | ) | | | (1.78 | ) | | | (0.27 | ) | | | (0.60 | ) | | | (0.02 | ) | |
Redemption Fees | | | 0.00 | (3) | | | — | | | | 0.00 | (3) | | | — | | | | — | | |
Net Asset Value, End of Period | | $ | 11.70 | | | $ | 11.69 | | | $ | 12.31 | | | $ | 12.36 | | | $ | 11.60 | | |
Total Return (4) | | | 1.64 | % | | | 9.34 | % | | | 1.69 | % | | | 11.88 | % | | | 20.43 | % | |
Ratios and Supplemental Data: | |
Net Assets, End of Period (Thousands) | | $ | 75 | | | $ | 211 | | | $ | 148 | | | $ | 123 | | | $ | 116 | | |
Ratio of Expenses to Average Net Assets (9) | | | 1.84 | %(5) | | | 1.97 | %(5)(7) | | | 2.09 | %(5) | | | 2.03 | %(5)(6) | | | 1.99 | %(5) | |
Ratio of Net Investment Income (Loss) to Average Net Assets (9) | | | (0.52 | )%(5) | | | (0.31 | )%(5) | | | 0.20 | %(5) | | | 0.18 | %(5) | | | 0.33 | %(5) | |
Ratio of Rebate from Morgan Stanley Affiliates to Average Net Assets | | | 0.01 | % | | | 0.00 | %(8) | | | 0.01 | % | | | 0.00 | %(8) | | | 0.01 | % | |
Portfolio Turnover Rate | | | 23 | % | | | 96 | % | | | 30 | % | | | 49 | % | | | 40 | % | |
(9) Supplemental Information on the Ratios to Average Net Assets: | |
Ratios Before Expense Limitation: | |
Expenses to Average Net Assets | | | 3.96 | % | | | 6.87 | % | | | 7.42 | % | | | 7.43 | % | | | 9.64 | % | |
Net Investment Loss to Average Net Assets | | | (2.64 | )% | | | (5.21 | )% | | | (5.13 | )% | | | (5.22 | )% | | | (7.32 | )% | |
(1) Refer to Note F in the Notes to Financial Statements for discussion of prior period custodian out-of-pocket expenses that were reimbursed in the current period. The amount of the reimbursement was immaterial on a per share basis and did not impact the total return of Class L shares. The Ratio of Expenses to Average Net Assets and the Ratio of Net Investment Loss to Average Net Assets would be unchanged as the reimbursement custodian fees was offset against current period expense waivers/reimbursements with no impact to net expenses or net investment loss.
(2) Per share amount is based on average shares outstanding.
(3) Amount is less than $0.005 per share.
(4) Calculated based on the net asset value as of the last business day of the period.
(5) The Ratios of Expenses and Net Investment Income (Loss) reflect the rebate of certain Portfolio expenses in connection with the investments in Morgan Stanley affiliates during the period. The effect of the rebate on the ratios is disclosed in the above table as "Ratio of Rebate from Morgan Stanley Affiliates to Average Net Assets."
(6) Effective September 16, 2013, the Adviser has agreed to limit the ratio of expenses to average net assets to the maximum ratio of 2.10% for Class L shares. Prior to September 16, 2013, the maximum ratio was 2.00% for Class L shares.
(7) Effective July 1, 2015, the Adviser has agreed to limit the ratio of expenses to average net assets to the maximum ratio of 1.85% for Class L shares. Prior to July 1, 2015, the maximum ratio was 2.10% for Class L shares.
(8) Amount is less than 0.005%.
The accompanying notes are an integral part of the financial statements.
15
Morgan Stanley Institutional Fund, Inc.
Annual Report — December 31, 2016
Financial Highlights
International Advantage Portfolio
| | | Class C | |
Selected Per Share Data and Ratios | | Year Ended
December 31, 2016(1) | | Period from
April 30, 2015(2) to
December 31, 2015 | |
Net Asset Value, Beginning of Period | | $ | 11.66 | | | $ | 13.80 | | |
Income (Loss) from Investment Operations: | |
Net Investment Loss (3) | | | (0.11 | ) | | | (0.08 | ) | |
Net Realized and Unrealized Gain(Loss) | | | 0.28 | | | | (0.26 | ) | |
Total from Investment Operations | | | 0.17 | | | | (0.34 | ) | |
Distributions from and/or in Excess of: | |
Net Investment Income | | | — | | | | (0.06 | ) | |
Net Realized Gain | | | (0.20 | ) | | | (1.74 | ) | |
Total Distributions | | | (0.20 | ) | | | (1.80 | ) | |
Redemption Fees | | | 0.00 | (4) | | | — | | |
Net Asset Value, End of Period | | $ | 11.63 | | | $ | 11.66 | | |
Total Return (5) | | | 1.38 | % | | | (2.63 | )%(9) | |
Ratios and Supplemental Data: | |
Net Assets, End of Period (Thousands) | | $ | 1,067 | | | $ | 247 | | |
Ratio of Expenses to Average Net Assets (11) | | | 2.09 | %(6) | | | 2.11 | %(6)(7)(10) | |
Ratio of Net Investment Loss to Average Net Assets (11) | | | (0.91 | )%(6) | | | (0.94 | )%(6)(10) | |
Ratio of Rebate from Morgan Stanley Affiliates to Average Net Assets | | | 0.01 | % | | | 0.00 | %(8) | |
Portfolio Turnover Rate | | | 23 | % | | | 96 | % | |
(11) Supplemental Information on the Ratios to Average Net Assets: | |
Ratios Before Expense Limitation: | |
Expense to Average Net Assets | | | 3.60 | % | | | 9.11 | %(10) | |
Net Investment Loss to Average Net Assets | | | (2.42 | )% | | | (7.94 | )%(10) | |
(1) Refer to Note F in the Notes to Financial Statements for discussion of prior period custodian out-of-pocket expenses that were reimbursed in the current period. The amount of the reimbursement was immaterial on a per share basis and did not impact the total return of Class C shares. The Ratio of Expenses to Average Net Assets and the Ratio of Net Investment Loss to Average Net Assets would be unchanged as the reimbursement of custodian fees was offset against current period expense waivers/reimbursements with no impact to net expenses or net investment loss.
(2) Commencement of Offering.
(3) Per share amount is based on average shares outstanding.
(4) Amount is less than $0.005 per share.
(5) Calculated based on the net asset value which does not reflect sales charges, if applicable, as of the last business day of the period.
(6) The Ratios of Expenses and Net Investment Loss reflect the rebate of certain Portfolio expenses in connection with the investments in Morgan Stanley affiliates during the period. The effect of the rebate on the ratios is disclosed in the above table as "Ratio of Rebate from Morgan Stanley Affiliates to Average Net Assets."
(7) Effective July 1, 2015, the Adviser has agreed to limit the ratio of expenses to average net assets to the maximum ratio of 2.10% for Class C shares. Prior to July 1, 2015, the maximum ratio was 2.35% for Class C shares.
(8) Amount is less than 0.005%.
(9) Not Annualized.
(10) Annualized.
The accompanying notes are an integral part of the financial statements.
16
Morgan Stanley Institutional Fund, Inc.
Annual Report — December 31, 2016
Notes to Financial Statements
Morgan Stanley Institutional Fund, Inc. (the "Fund") is registered under the Investment Company Act of 1940, as amended (the "Act"), as an open-end management investment company. The Fund is comprised of twenty-nine separate, active, diversified and non-diversified portfolios (individually referred to as a "Portfolio", collectively as the "Portfolios"). The Fund applies investment company accounting and reporting guidance.
The accompanying financial statements relate to the International Advantage Portfolio. The Portfolio seeks long-term capital appreciation.
The Portfolio offers four classes of shares — Class I, Class A, Class L and Class C. On April 30, 2015, the Portfolio suspended offering of Class L shares. Existing Class L shareholders may invest through reinvestment of dividends and distributions.
A. Significant Accounting Policies: The following significant accounting policies are in conformity with U.S. generally accepted accounting principles ("GAAP"). Such policies are consistently followed by the Fund in the preparation of its financial statements. GAAP may require management to make estimates and assumptions that affect the reported amounts and disclosures in the financial statements. Actual results may differ from those estimates.
1. Security Valuation: (1) An equity portfolio security listed or traded on an exchange is valued at its latest reported sales price (or at the exchange official closing price if such exchange reports an official closing price), and if there were no sales on a given day and if there is no official exchange closing price for that day, the security is valued at the mean between the last reported bid and asked prices if such bid and asked prices are available on the relevant exchanges; (2) all other equity portfolio securities for which over-the-counter ("OTC") market quotations are readily available are valued at the latest reported sales price (or at the market official closing price if such market reports an official closing price), and if there was no trading in the security on a given day and if there is no official closing price from relevant markets for that day, the security is valued at the mean between the last reported bid and asked prices if such bid and asked prices are available on the relevant markets. Listed equity securities not traded on the valuation date with no reported bid and asked prices available on the exchange are valued at the mean between the current bid and asked prices obtained from one or more reputable brokers or dealers. An unlisted equity security that does not trade on the valuation date and for which
bid and asked prices from the relevant markets are unavailable is valued at the mean between the current bid and asked prices obtained from one or more reputable brokers or dealers. In cases where a security is traded on more than one exchange, the security is valued on the exchange designated as the primary market; (3) certain portfolio securities may be valued by an outside pricing service/vendor approved by the Fund's Board of Directors (the "Directors"). The pricing service/vendor may employ a pricing model that takes into account, among other things, bids, yield spreads, and/or other market data and specific security characteristics. Alternatively, if a valuation is not available from an outside pricing service/vendor, and the security trades on an exchange, the security may be valued at its latest reported sale price (or at the exchange official closing price if such exchange reports an official closing price), prior to the time when assets are valued. If there are no sales on a given day and if there is no official exchange closing price for that day, the security is valued at the mean between the last reported bid and asked prices if such bid and asked prices are available in the relevant exchanges; (4) Listed options are valued at the last reported sales price on the exchange on which they are listed (or at the exchange official closing price if such exchange reports an official closing price). If an official closing price or last reported sale price is unavailable, the listed option should be fair valued at the mean between its latest bid and ask prices. Unlisted options are valued at the mean between their latest bid and ask prices from a broker/dealer or valued by a pricing service/vendor; (5) when market quotations are not readily available, including circumstances under which Morgan Stanley Investment Management Inc. (the "Adviser") determines that the closing price, last sale price or the mean between the last reported bid and asked prices are not reflective of a security's market value, portfolio securities are valued at their fair value as determined in good faith under procedures established by and under the general supervision of the Directors. Occasionally, developments affecting the closing prices of securities and other assets may occur between the times at which valuations of such securities are determined (that is, close of the foreign market on which the securities trade) and the close of business of the New York Stock Exchange ("NYSE"). If developments occur during such periods that are expected to materially affect the value of such securities, such valuations may be adjusted to reflect the estimated fair value of such securities as of the close of the
17
Morgan Stanley Institutional Fund, Inc.
Annual Report — December 31, 2016
Notes to Financial Statements (cont'd)
NYSE, as determined in good faith by the Directors or by the Adviser using a pricing service and/or procedures approved by the Directors; (6) quotations of foreign portfolio securities, other assets and liabilities and forward contracts stated in foreign currency are translated into U.S. dollar equivalents at the prevailing market rates prior to the close of the NYSE; and (7) investments in mutual funds, including the Morgan Stanley Institutional Liquidity Funds, are valued at the net asset value ("NAV") as of the close of each business day.
The Directors have responsibility for determining in good faith the fair value of the investments, and the Directors may appoint others, such as the Fund's Adviser or a valuation committee, to assist the Directors in determining fair value and to make the actual calculations pursuant to the fair valuation methodologies previously approved by the Directors. Under procedures approved by the Directors, the Fund's Adviser has formed a Valuation Committee whose members are approved by the Directors. The Valuation Committee provides administration and oversight of the Fund's valuation policies and procedures, which are reviewed at least annually by the Directors. These procedures allow the Fund to utilize independent pricing services, quotations from securities and financial instrument dealers, and other market sources to determine fair value.
The Fund has procedures to determine the fair value of securities and other financial instruments for which market prices are not readily available. Under these procedures, the Valuation Committee convenes on a regular and ad hoc basis to review such securities and considers a number of factors, including valuation methodologies and significant unobservable valuation inputs, when arriving at fair value. The Valuation Committee may employ a market-based approach which may use related or comparable assets or liabilities, recent transactions, market multiples, book values, and other relevant information for the investment to determine the fair value of the investment. An income-based valuation approach may also be used in which the anticipated future cash flows of the investment are discounted to calculate fair value. Discounts may also be applied due to the nature or duration of any restrictions on the disposition of the investments. Due to the inherent uncertainty of valuations of such investments, the fair values may differ significantly from the values that would have been used had an
active market existed. The Valuation Committee employs various methods for calibrating these valuation approaches including a regular review of valuation methodologies, key inputs and assumptions, transactional back-testing or disposition analysis, and reviews of any related market activity.
2. Fair Value Measurement: Financial Accounting Standards Board ("FASB") Accounting Standards CodificationTM ("ASC") 820, "Fair Value Measurement" ("ASC 820"), defines fair value as the value that the Fund would receive to sell an investment or pay to transfer a liability in a timely transaction with an independent buyer in the principal market, or in the absence of a principal market, the most advantageous market for the investment or liability. ASC 820 establishes a three-tier hierarchy to distinguish between (1) inputs that reflect the assumptions market participants would use in valuing an asset or liability developed based on market data obtained from sources independent of the reporting entity (observable inputs) and (2) inputs that reflect the reporting entity's own assumptions about the assumptions market participants would use in valuing an asset or liability developed based on the best information available in the circumstances (unobservable inputs) and to establish classification of fair value measurements for disclosure purposes. Various inputs are used in determining the value of the Fund's investments. The inputs are summarized in the three broad levels listed below.
• Level 1 – unadjusted quoted prices in active markets for identical investments
• Level 2 – other significant observable inputs (including quoted prices for similar investments, interest rates, prepayment speeds, credit risk, etc.)
• Level 3 – significant unobservable inputs including the Fund's own assumptions in determining the fair value of investments. Factors considered in making this determination may include, but are not limited to, information obtained by contacting the issuer, analysts, or the appropriate stock exchange (for exchange-traded securities), analysis of the issuer's financial statements or other available documents and, if necessary, available information concerning other securities in similar circumstances
18
Morgan Stanley Institutional Fund, Inc.
Annual Report — December 31, 2016
Notes to Financial Statements (cont'd)
The inputs or methodology used for valuing securities are not necessarily an indication of the risk associated with investing in those securities and the determination of the significance of a particular input to the fair value measurement in its entirety requires judgment and considers factors specific to each security.
The following is a summary of the inputs used to value the Portfolio's investments as of December 31, 2016.
Investment Type | | Level 1
Unadjusted
quoted
prices
(000) | | Level 2
Other
significant
observable
inputs
(000) | | Level 3
Significant
unobservable
inputs
(000) | | Total
(000) | |
Assets: | |
Common Stocks | |
Beverages | | $ | 4,543 | | | $ | — | | | $ | — | | | $ | 4,543 | | |
Biotechnology | | | 826 | | | | — | | | | — | | | | 826 | | |
Capital Markets | | | 1,512 | | | | — | | | | — | | | | 1,512 | | |
Construction & Engineering | | | 5 | | | | — | | | | — | | | | 5 | | |
Diversified Consumer
Services | | | 2,166 | | | | — | | | | — | | | | 2,166 | | |
Diversified
Telecommunication
Services | | | 383 | | | | — | | | | — | | | | 383 | | |
Electric Utilities | | | 1,137 | | | | — | | | | — | | | | 1,137 | | |
Electronic Equipment,
Instruments &
Components | | | 1,098 | | | | — | | | | — | | | | 1,098 | | |
Food Products | | | 4,186 | | | | — | | | | — | | | | 4,186 | | |
Household Durables | | | 182 | | | | — | | | | — | | | | 182 | | |
Household Products | | | 1,957 | | | | — | | | | — | | | | 1,957 | | |
Information Technology
Services | | | 5,074 | | | | — | | | | — | | | | 5,074 | | |
Insurance | | | 1,027 | | | | — | | | | — | | | | 1,027 | | |
Internet & Direct Marketing
Retail | | | 1,944 | | | | — | | | | — | | | | 1,944 | | |
Internet Software &
Services | | | 2,488 | | | | — | | | | — | | | | 2,488 | | |
Marine | | | 837 | | | | — | | | | — | | | | 837 | | |
Media | | | 532 | | | | — | | | | — | | | | 532 | | |
Pharmaceuticals | | | 908 | | | | — | | | | — | | | | 908 | | |
Road & Rail | | | 2,373 | | | | — | | | | — | | | | 2,373 | | |
Software | | | 477 | | | | — | | | | — | | | | 477 | | |
Textiles, Apparel & Luxury
Goods | | | 5,756 | | | | — | | | | — | | | | 5,756 | | |
Total Common Stocks | | | 39,411 | | | | — | | | | — | | | | 39,411 | | |
Participation Note | | | — | | | | 400 | | | | — | | | | 400 | | |
Call Option Purchased | | | — | | | | 12 | | | | — | | | | 12 | | |
Short-Term Investment | |
Investment Company | | | 1,586 | | | | — | | | | — | | | | 1,586 | | |
Total Assets | | $ | 40,997 | | | $ | 412 | | | $ | — | | | $ | 41,409 | | |
Transfers between investment levels may occur as the markets fluctuate and/or the availability of data used in an investment's valuation changes. The Portfolio recognizes transfers between the levels as of the end of the period. As of December 31, 2016, securities with a total value of approximately $22,005,000 transferred from Level 2 to
Level 1. Securities that were valued using other significant observable inputs at December 31, 2015 were valued using unadjusted quoted prices at December 31, 2016. At December 31 2015, the fair value of certain securities were adjusted due to developments which occurred between the time of the close of the foreign markets on which they trade and the close of business on the NYSE which resulted in their Level 2 classification.
3. Foreign Currency Translation and Foreign Investments: The books and records of the Portfolio are maintained in U.S. dollars. Foreign currency amounts are translated into U.S. dollars as follows:
– investments, other assets and liabilities at the prevailing rate of exchange on the valuation date;
– investment transactions and investment income at the prevailing rates of exchange on the dates of such transactions.
Although the net assets of the Portfolio are presented at the foreign exchange rates and market values at the close of the period, the Portfolio does not isolate that portion of the results of operations arising as a result of changes in the foreign exchange rates from the fluctuations arising from changes in the market prices of securities held at period end. Similarly, the Portfolio does not isolate the effect of changes in foreign exchange rates from the fluctuations arising from changes in the market prices of securities sold during the period. Accordingly, realized and unrealized foreign currency gains (losses) on investments in securities are included in the reported net realized and unrealized gains (losses) on investment transactions and balances. However, pursuant to U.S. federal income tax regulations, gains and losses from certain foreign currency transactions and the foreign currency portion of gains and losses realized on sales and maturities of foreign denominated debt securities are treated as ordinary income for U.S. federal income tax purposes.
Net realized gains (losses) on foreign currency transactions represent net foreign exchange gains (losses) from foreign currency forward exchange contracts, disposition of foreign currencies, currency gains (losses) realized between the trade and settlement dates on securities transactions, and the difference between the amount of investment income and foreign withholding taxes recorded on the Portfolio's books and the U.S. dollar
19
Morgan Stanley Institutional Fund, Inc.
Annual Report — December 31, 2016
Notes to Financial Statements (cont'd)
equivalent amounts actually received or paid. Net unrealized currency gains (losses) from valuing foreign currency denominated assets and liabilities at period end exchange rates are reflected as a component of unrealized appreciation (depreciation) in the Statement of Assets and Liabilities. The change in unrealized currency gains (losses) on foreign currency translations for the period is reflected in the Statement of Operations.
Foreign security and currency transactions may involve certain considerations and risks not typically associated with those of U.S. dollar denominated transactions as a result of, among other factors, fluctuations of exchange rates in relation to the U.S. dollar, the possibility of lower levels of governmental supervision and regulation of foreign securities markets and the possibility of political or economic instability.
Governmental approval for foreign investments may be required in advance of making an investment under certain circumstances in some countries, and the extent of foreign investments in domestic companies may be subject to limitation in other countries. Foreign ownership limitations also may be imposed by the charters of individual companies to prevent, among other concerns, violations of foreign investment limitations. As a result, an additional class of shares (identified as "Foreign" in the Portfolio of Investments) may be created and offered for investment. The "local" and "foreign shares" market values may differ. In the absence of trading of the foreign shares in such markets, the Portfolio values the foreign shares at the closing exchange price of the local shares.
4. Derivatives: The Portfolio may, but is not required to, use derivative instruments for a variety of purposes, including hedging, risk management, portfolio management or to earn income. Derivatives are financial instruments whose value is based, in part, on the value of an underlying asset, interest rate, index or financial instrument. Prevailing interest rates and volatility levels, among other things, also affect the value of derivative instruments. A derivative instrument often has risks similar to its underlying asset and may have additional risks, including imperfect correlation between the value of the derivative and the underlying asset, risks of default by the counterparty to certain transactions, magnification of losses incurred due to changes in the market value of the securities, instruments, indices or interest rates to which the derivative instrument relates, risks that the transactions may not be liquid and risks arising from
margin requirements. The use of derivatives involves risks that are different from, and possibly greater than, the risks associated with other portfolio investments. Derivatives may involve the use of highly specialized instruments that require investment techniques and risk analyses different from those associated with other portfolio investments. All of the Portfolio's holdings, including derivative instruments, are marked-to-market each day with the change in value reflected in unrealized appreciation (depreciation). Upon disposition, a realized gain or loss is recognized.
Certain derivative transactions may give rise to a form of leverage. Leverage magnifies the potential for gain and the risk of loss. Leverage associated with derivative transactions may cause the Portfolio to liquidate portfolio positions when it may not be advantageous to do so to satisfy its obligations or to meet earmarking or segregation requirements, pursuant to applicable Securities and Exchange Commission rules and regulations, or may cause the Portfolio to be more volatile than if the Portfolio had not been leveraged. Although the Adviser seeks to use derivatives to further the Portfolio's investment objectives, there is no assurance that the use of derivatives will achieve this result.
Following is a description of the derivative instruments and techniques that the Portfolio used during the period and their associated risks:
Options: With respect to options, the Portfolio is subject to equity risk, interest rate risk and foreign currency exchange risk in the normal course of pursuing its investment objectives. If the Portfolio buys an option, it buys a legal contract giving it the right to buy or sell a specific amount of the underlying instrument or foreign currency, or futures contract on the underlying instrument or foreign currency, at an agreed-upon price typically in exchange for a premium paid by the Portfolio. The Portfolio may purchase and/or sell put and call options. Purchasing call options tends to increase the Portfolio's exposure to the underlying (or similar) instrument. Purchasing put options tends to decrease the Portfolio's exposure to the underlying (or similar) instrument. When entering into purchased option contracts, the Portfolio bears the risk of interest or exchange rates or securities prices moving unexpectedly, in which case, the Portfolio may not achieve the anticipated benefits of the purchased option contracts; however the risk of loss is limited to the premium paid. Purchased options are reported as part of "Total
20
Morgan Stanley Institutional Fund, Inc.
Annual Report — December 31, 2016
Notes to Financial Statements (cont'd)
Investments in Securities" in the Statement of Assets and Liabilities. Premium paid for purchasing options which expired are treated as realized losses. If the Portfolio sells an option, it sells to another party the right to buy from or sell to the Portfolio a specific amount of the underlying instrument or foreign currency, or futures contract on the underlying instrument or foreign currency, at an agreed-upon price typically in exchange for a premium received by the Portfolio. When options are purchased OTC, the Portfolio bears the risk that the counterparty that wrote the option will be unable or unwilling to perform its obligations under the option contract. Options may also be illiquid and the Portfolio may have difficulty closing out its position. A decision as to whether, when and how to use options involves the exercise of skill and judgment and even a well-conceived option transaction may be unsuccessful because of market behavior or unexpected events. The prices of options can be highly volatile and the use of options can lower total returns.
FASB ASC 815, "Derivatives and Hedging" ("ASC 815"), is intended to improve financial reporting about derivative instruments by requiring enhanced disclosures to enable investors to better understand how and why the Portfolio uses derivative instruments, how these derivative instruments are accounted for and their effects on the Portfolio's financial position and results of operations.
The following table sets forth the fair value of the Portfolio's derivative contracts by primary risk exposure as of December 31, 2016.
| | | Asset Derivatives
Statement of Assets and
Liabilities Location | | Primary Risk
Exposure | | Value
(000) | |
Option Purchased | | Investments, at Value
(Option Purchased) | | Currency Risk | | $ | 12 | (a) | |
(a) Amounts are included in Investments in Securities in the Statement of Assets and Liabilities.
The following tables set forth by primary risk exposure the Portfolio's realized gains (losses) and change in unrealized appreciation (depreciation) by type of derivative contract for the year ended December 31, 2016 in accordance with ASC 815.
Realized Gain (Loss) | |
Primary Risk Exposure | | Derivative Type | | Value
(000) | |
Currency Risk
| | Investments
(Options Purchased) | | $ | (11 | )(b) | |
(b) Amounts are included in Investments Sold in the Statement of Operations.
Change in Unrealized Appreciation (Depreciation) | |
Primary Risk Exposure | | Derivative Type | | Value
(000) | |
Currency Risk
| | Investments
(Options Purchased) | | $ | (13 | )(c) | |
(c) Amounts are included in Investments in the Statement of Operations.
At December 31, 2016, the Portfolio's derivative assets and liabilities are as follows:
Gross Amounts of Assets and Liabilities Presented in the
Statement of Assets and Liabilities | |
Derivatives | | Assets(d)
(000) | | Liabilities(d)
(000) | |
Option Purchased | | $ | 12 | (a) | | $ | — | | |
(a) Amounts are included in Investments in Securities in the Statement of Assets and Liabilities.
(d) Absent an event of default or early termination, OTC derivative assets and liabilities are presented gross and not offset in the Statement of Assets and Liabilities.
The Portfolio typically enters into International Swaps and Derivatives Association, Inc. Master Agreements ("ISDA Master Agreements") or similar master agreements (collectively, "Master Agreements") with its contract counterparties for certain OTC derivatives in order to, among other things, reduce its credit risk to counterparties. ISDA Master Agreements include provisions for general obligations, representations, collateral and events of default or termination. Under an ISDA Master Agreement, the Portfolio typically may offset with the counterparty certain OTC derivative financial instruments' payables and/or receivables with collateral held and/or posted and create one single net payment (close-out netting) in the event of default, termination and/or potential deterioration in the credit quality of the counterparty. Various Master Agreements govern the terms of certain transactions with counterparties, including transactions such as swap, forward, repurchase and reverse repurchase agreements. These Master Agreements typically attempt to reduce the counterparty risk associated with such transactions by specifying credit protection mechanisms and providing standardization that improves legal certainty. Cross-termination provisions under Master Agreements typically provide that a default in connection with one transaction between the Portfolio and a counterparty gives the non-defaulting party the right to terminate any other transactions in place with the defaulting party to create one single net payment due to/due from the defaulting party and may be a feature in certain Master Agreements. In the event the Portfolio exercises its right to terminate a Master Agreement after a counterparty experiences a termination event as defined in the Master
21
Morgan Stanley Institutional Fund, Inc.
Annual Report — December 31, 2016
Notes to Financial Statements (cont'd)
Agreement, the return of collateral with market value in excess of the Portfolio's net liability may be delayed or denied.
The following table presents derivative financial instruments that are subject to enforceable netting arrangements as of December 31, 2016.
Gross Amounts Not Offset in the Statement of Assets and Liabilities | |
Counterparty | | Gross Asset
Derivatives
Presented in
Statement of
Assets and
Liabilities
(000) | | Financial
Instrument
(000) | | Collateral
Received
(000) | | Net Amount
(not less
than $0)
(000) | |
Royal Bank of Scotland | | $ | 12 | | | $ | — | | | $ | — | | | $ | 12 | | |
For the year ended December 31, 2016, the approximate average monthly amount outstanding for each derivative type is as follows:
Options Purchased: | |
Average monthly notional amount | | | 1,877,000 | | |
5. Securities Lending: The Portfolio lends securities to qualified financial institutions, such as broker-dealers, to earn additional income. Any increase or decrease in the fair value of the securities loaned that might occur and any interest earned or dividends declared on those securities during the term of the loan would remain in the Portfolio. The Portfolio would receive cash or securities as collateral in an amount equal to or exceeding 100% of the current fair value of the loaned securities. The collateral is marked-to-market daily by State Street Bank and Trust Company ("State Street"), the securities lending agent, to ensure that a minimum of 100% collateral coverage is maintained.
Based on pre-established guidelines, the securities lending agent invests any cash collateral that is received in an affiliated money market portfolio and repurchase agreements. Securities lending income is generated from the earnings on the invested collateral and borrowing fees, less any rebates owed to the borrowers and compensation to the lending agent, and is recorded as "Income from Securities Loaned — Net" in the Portfolio's Statement of Operations. Risks in securities lending transactions are that a borrower may not provide additional collateral when required or return the securities when due, and that the value of the short-term investments will be less than the amount of cash collateral plus any rebate that is required to be returned to the borrower.
The Portfolio has the right under the lending agreement to recover the securities from the borrower on demand.
At December 31, 2016, the Portfolio did not have any outstanding securities on loan.
6. Structured Investments: The Portfolio invested a portion of its assets in structured investments. A structured investment is a derivative security designed to offer a return linked to a particular underlying security, currency, commodity or market. Structured investments may come in various forms including notes (such as exchange-traded notes), warrants and options to purchase securities. The Portfolio will typically use structured investments to gain exposure to a permitted underlying security, currency, commodity or market when direct access to a market is limited or inefficient from a tax or cost standpoint. There can be no assurance that structured investments will trade at the same price or have the same value as the underlying security, currency, commodity or market. Investments in structured investments involve risks including issuer risk, counterparty risk and market risk. Holders of structured investments bear risks of the underlying investment and are subject to issuer or counterparty risk because the Portfolio is relying on the creditworthiness of such issuer or counterparty and has no rights with respect to the underlying investment. Certain structured investments may be thinly traded or have a limited trading market and may have the effect of increasing the Portfolio's illiquidity to the extent that the Portfolio, at a particular time, may be unable to find qualified buyers for these securities.
7. Redemption Fees: The Portfolio will assess a 2% redemption fee on Class I shares, Class A shares, Class L shares and Class C shares, which is paid directly to the Portfolio, for shares redeemed or exchanged within thirty days of purchase, subject to certain exceptions. The redemption fee is designed to protect the Portfolio and its remaining shareholders from the effects of short-term trading. These fees, if any, are included in the Statements of Changes in Net Assets.
8. Indemnifications: The Fund enters into contracts that contain a variety of indemnifications. The Fund's maximum exposure under these arrangements is unknown. However, the Fund has not had prior claims or losses pursuant to these contracts and expects the risk of loss to be remote.
9. Dividends and Distributions to Shareholders: Dividend income and distributions to shareholders are recorded on the ex-dividend date. Dividends from net
22
Morgan Stanley Institutional Fund, Inc.
Annual Report — December 31, 2016
Notes to Financial Statements (cont'd)
investment income, if any, are declared and paid annually. Net realized capital gains, if any, are distributed at least annually.
10. Security Transactions, Income and Expenses: Security transactions are accounted for on the trade date (date the order to buy or sell is executed). Realized gains and losses on the sale of investment securities are determined on the specific identified cost method. Dividend income and other distributions are recorded on the ex-dividend date (except for certain foreign dividends which may be recorded as soon as the Portfolio is informed of such dividends) net of applicable withholding taxes. Interest income is recognized on the accrual basis except where collection is in doubt. Discounts are accreted and premiums are amortized over the life of the respective securities. Most expenses of the Fund can be directly attributed to a particular Portfolio. Expenses which cannot be directly attributed are apportioned among the Portfolios based upon relative net assets or other appropriate methods. Income, expenses (other than class specific expenses — distribution and shareholder services, transfer agency and sub transfer agency fees) and realized and unrealized gains or losses are allocated to each class of shares based upon their relative net assets.
B. Advisory Fees: The Adviser, a wholly-owned subsidiary of Morgan Stanley, provides the Portfolio with advisory services under the terms of an Investment Advisory Agreement, paid quarterly, at the annual rate based on the daily net assets as follows:
First $1
billion | | Over $1
billion | |
| | 0.80 | % | | | 0.75 | % | |
For the year ended December 31, 2016, the advisory fee rate (net of waivers/rebate) was equivalent to an annual effective rate of 0.00% of the Portfolio's average daily net assets.
The Adviser has agreed to reduce its advisory fee and/or reimburse the Portfolio so that total annual portfolio operating expenses, excluding certain investment related expenses, taxes, interest and other extraordinary expenses (including litigation), will not exceed 1.00% for Class I shares, 1.35% for Class A shares, 1.85% for Class L shares and 2.10% for Class C shares. The fee waivers and/or expense reimbursements will continue for at least one year from the date of the Portfolio's prospectus or until such time as the Directors act to discontinue all or a portion of such waivers and/or reimbursements when they deem such action is appropriate. For the year ended
December 31, 2016, approximately $142,000 of advisory fees were waived and approximately $52,000 of other expenses were reimbursed by the Adviser pursuant to this arrangement.
C. Administration Fees: The Adviser also serves as Administrator to the Fund and provides administrative services pursuant to an Administration Agreement for an annual fee, accrued daily and paid monthly, of 0.08% of the Portfolio's average daily net assets.
Under a Sub-Administration Agreement between the Administrator and State Street, State Street provides certain administrative services to the Fund. For such services, the Administrator pays State Street a portion of the fee the Administrator receives from the Portfolio.
D. Distribution and Shareholder Services Fees: Morgan Stanley Distribution, Inc. ("MSDI" or the "Distributor"), a wholly-owned subsidiary of the Adviser and an indirect subsidiary of Morgan Stanley, serves as the Fund's Distributor of Portfolio shares pursuant to a Distribution Agreement. The Fund has adopted a Shareholder Services Plan with respect to Class A shares pursuant to Rule 12b-1 under the Act. Under the Shareholder Services Plan, the Portfolio pays the Distributor a shareholder services fee, accrued daily and paid monthly, at an annual rate of 0.25% of the Portfolio's average daily net assets attributable to Class A shares.
The Fund has adopted a Distribution and Shareholder Services Plan with respect to Class L shares pursuant to Rule 12b-1 under the Act. Under the Distribution and Shareholder Services Plan, the Portfolio pays the Distributor a distribution fee, accrued daily and paid monthly, at an annual rate of 0.50% and a shareholder services fee, accrued daily and paid monthly, at an annual rate of 0.25% of the Portfolio's average daily net assets attributable to Class L shares.
The Fund has adopted a Distribution and Shareholder Services Plan with respect to Class C shares pursuant to Rule 12b-1 under the Act. Under the Distribution and Shareholder Services Plan, the Portfolio pays the Distributor a distribution fee, accrued daily and paid monthly, at an annual rate of 0.75% and a shareholder services fee, accrued daily and paid monthly, at an annual rate of 0.25% of the Portfolio's average daily net assets attributable to Class C shares.
The distribution and shareholder services fees are used to support the expenses associated with servicing and maintaining accounts. The Distributor may compensate other parties for providing shareholder support services to investors who purchase Class A, Class L and Class C shares.
23
Morgan Stanley Institutional Fund, Inc.
Annual Report — December 31, 2016
Notes to Financial Statements (cont'd)
E. Dividend Disbursing and Transfer Agent: The Fund's dividend disbursing and transfer agent is Boston Financial Data Services, Inc. ("BFDS"). Pursuant to a Transfer Agency Agreement, the Fund pays BFDS a fee based on the number of classes, accounts and transactions relating to the Portfolios of the Fund.
F. Custodian Fees: State Street (the "Custodian") serves as Custodian for the Fund in accordance with a Custodian Agreement. The Custodian holds cash, securities, and other assets of the Fund as required by the Act. Custody fees are payable monthly based on assets held in custody, investment purchases and sales activity and account maintenance fees, plus reimbursement for certain out-of-pocket expenses.
In December 2015, the Fund's Custodian announced that it had identified inconsistencies in the way in which clients were invoiced for out-of-pocket expenses from 1998 until November 2015. The dollar amount difference between what was charged and what should have been charged, plus interest, was paid back to the Portfolio in September 2016 as a reimbursement. The Custodian reimbursed the Portfolio directly, which was recognized as a change in accounting estimate and was reflected as "Reimbursement of Custodian Fees" in the Statement of Operations. Pursuant to the expense limitations described in Note B, the Portfolio has experienced waiver of advisory fees and expenses reimbursed by the Adviser during the current period. Accordingly, the reimbursement of out-of-pocket custodian expenses in the current period resulted in the reduction in the current period expenses reimbursed by the Adviser.
G. Security Transactions and Transactions with Affiliates: For the year ended December 31, 2016, purchases and sales of investment securities for the Portfolio, other than long-term U.S. Government securities and short-term investments, were approximately $37,281,000 and $4,005,000, respectively. There were no purchases and sales of long-term U.S. Government securities for the year ended December 31, 2016.
The Portfolio invests in the Institutional Class of the Morgan Stanley Institutional Liquidity Funds (the "Liquidity Funds"), an open-end management investment company managed by the Adviser, both directly and as a portion of the securities held as collateral on loaned securities. Advisory fees paid by the Portfolio are reduced by an amount equal to its pro-rata share of the advisory and administration fees paid by the Portfolio due to its investment in the Liquidity Funds. For the year ended December 31, 2016, advisory fees paid were reduced by
approximately $2,000 relating to the Portfolio's investment in the Liquidity Funds.
A summary of the Portfolio's transactions in shares of the Liquidity Funds during the year ended December 31, 2016 is as follows:
Value
December 31,
2015
(000) | | Purchases
at Cost
(000) | | Sales
(000) | | Dividend
Income
(000) | | Value
December 31,
2016
(000) | |
| $ | 325 | | | $ | 30,812 | | | $ | 29,551 | | | $ | 3 | | | $ | 1,586 | | |
The Portfolio is permitted to purchase and sell securities ("cross-trade") from and to other Morgan Stanley Funds as well as other funds and client accounts for which the Adviser or an affiliate of the Adviser serves as investment adviser, pursuant to procedures approved by the Directors in compliance with Rule 17a-7 under the Act (the "Rule"). Each cross-trade is executed at the current market price in compliance with provisions of the Rule. For the year ended December 31, 2016, the Portfolio did not engage in any cross-trade transactions.
The Portfolio has an unfunded Deferred Compensation Plan (the "Compensation Plan"), which allows each independent Director to defer payment of all, or a portion, of the fees he or she receives for serving on the Board of Directors. Each eligible Director generally may elect to have the deferred amounts credited with a return equal to the total return on one or more of the Morgan Stanley funds that are offered as investment options under the Compensation Plan. Appreciation/depreciation and distributions received from these investments are recorded with an offsetting increase/decrease in the deferred compensation obligation and do not affect the NAV of the Portfolio.
H. Federal Income Taxes: It is the Portfolio's intention to continue to qualify as a regulated investment company and distribute all of its taxable and tax-exempt income. Accordingly, no provision for federal income taxes is required in the financial statements.
The Portfolio may be subject to taxes imposed by countries in which it invests. Such taxes are generally based on income and/or capital gains earned or repatriated. Taxes are accrued based on net investment income, net realized gains and net unrealized appreciation as such income and/or gains are earned. Taxes may also be based on transactions in foreign currency and are accrued based on the value of investments denominated in such currency.
FASB ASC 740-10, "Income Taxes — Overall", sets forth a minimum threshold for financial statement recognition of the benefit of a tax position taken or expected to be taken in a tax
24
Morgan Stanley Institutional Fund, Inc.
Annual Report — December 31, 2016
Notes to Financial Statements (cont'd)
return. Management has concluded there are no significant uncertain tax positions that would require recognition in the financial statements. If applicable, the Portfolio recognizes interest accrued related to unrecognized tax benefits in "Interest Expense" and penalties in "Other Expenses" in the Statement of Operations. The Portfolio files tax returns with the U.S. Internal Revenue Service, New York and various states. Generally, each of the tax years in the four-year period ended December 31, 2016, remains subject to examination by taxing authorities.
The tax character of distributions paid may differ from the character of distributions shown in the Statements of Changes in Net Assets due to short-term capital gains being treated as ordinary income for tax purposes. The tax character of distributions paid during fiscal years 2016 and 2015 was as follows:
2016
Distributions
Paid From: | | 2015
Distributions
Paid From: | |
Ordinary
Income
(000) | | Long-Term
Capital Gain
(000) | | Ordinary
Income
(000) | | Long-Term
Capital Gain
(000) | |
| $ | 326 | | | $ | 146 | | | $ | 229 | | | $ | 545 | | |
The amount and character of income and gains to be distributed are determined in accordance with income tax regulations which may differ from GAAP. These book/tax differences are either considered temporary or permanent in nature.
Temporary differences are primarily due to differing book and tax treatments for the timing of the recognition of gains (losses) on certain investment transactions and the timing of the deductibility of certain expenses.
Permanent differences, primarily due to differing treatments of gains (losses) related to foreign currency transactions and distribution redesignations, resulted in the following reclassifications among the components of net assets at December 31, 2016:
Accumulated
Net Investment
Loss
(000) | | Accumulated
Undistributed
Net Realized
Gain
(000) | | Paid-in-
Capital
(000) | |
| $ | (21 | ) | | $ | 21 | | | $ | — | | |
At December 31, 2016, the components of distributable earnings for the Portfolio on a tax basis were as follows:
Undistributed
Ordinary
Income
(000) | | Undistributed
Long-Term
Capital Gain
(000) | |
| $ | 14 | | | $ | 135 | | |
Qualified late year losses are capital losses and specified ordinary losses, including currency losses, incurred after October 31 but within the taxable year that, if elected, are deemed to arise on the first day of the Portfolio's next taxable year. These also include non-specified ordinary losses incurred after December 31 but within the same taxable year. For the year ended December 31, 2016, the Portfolio deferred to January 1, 2017 for U.S. federal income tax purposes the following losses:
Qualified Late
Year Ordinary
Losses
(000) | | Post-October
Capital Losses
(000) | |
| $ | 10 | | | | — | | |
I. Credit Facility: As of April 4, 2016, the Fund and other Morgan Stanley funds participated in a $150,000,000 committed, unsecured revolving line of credit facility (the "facility") with State Street. This facility is to be used for temporary emergency purposes or funding of shareholder redemption requests. The interest rate on borrowings is based on the federal funds rate or one month libor rate plus a spread. The facility also has a commitment fee of 0.25% per annum based on the unused portion of the facility. During the year ended December 31, 2016, the Portfolio did not have any borrowings under the facility.
J. Other: At December 31, 2016, the Portfolio had record owners of 10% or greater. Investment activities of these shareholders could have a material impact on the Portfolio. The aggregate percentage of such owners was 66.6%.
K. Accounting Pronouncements: In December 2016, FASB issued Accounting Standards update 2016-19 — Technical Corrections and Improvements ("ASU 2016-19"), which is effective for interim periods for all entities beginning after December 15, 2016. ASU 2016-19 includes an amendment to Topic 820, Fair Value Measurement, which clarifies the difference between a valuation approach and a valuation technique when applying the guidance in that Topic. That amendment also requires an entity to disclose when there has been a change in either or both a valuation approach and/or a valuation technique. The transition guidance for the amendment must be applied prospectively because it could potentially involve the use of hindsight that includes fair value measurements. Although still evaluating the potential impacts of ASU 2016-19 to the Portfolio, management expects that the impact of the Portfolio's adoption will be limited to additional financial statement disclosures.
25
Morgan Stanley Institutional Fund, Inc.
Annual Report — December 31, 2016
Notes to Financial Statements (cont'd)
In October 2016, the Securities and Exchange Commission ("SEC") issued a new rule, Investment Company Reporting Modernization, which, among other provisions, amends Regulation S-X to require standardized, enhanced disclosures, particularly related to derivatives, in investment company financial statements. Compliance with the guidance is effective for financial statements filed with the SEC on or after August 1, 2017; adoption will have no effect on the Portfolio's net assets or results of operations. Although still evaluating the potential impacts of the Investment Company Reporting Modernization to the Portfolio, management expects that the impact of the Portfolio's adoption will be limited to additional financial statement disclosures.
26
Morgan Stanley Institutional Fund, Inc.
Annual Report — December 31, 2016
Report of Independent Registered Public Accounting Firm
To the Shareholders and Board of Directors of
Morgan Stanley Institutional Fund, Inc. —
International Advantage Portfolio
We have audited the accompanying statement of assets and liabilities, including the portfolio of investments, of International Advantage Portfolio (one of the portfolios constituting Morgan Stanley Institutional Fund, Inc.) (the "Portfolio") as of December 31, 2016, and the related statement of operations for the year then ended, the statements of changes in net assets for each of the two years in the period then ended and the financial highlights for each of the years or periods indicated therein. These financial statements and financial highlights are the responsibility of the Portfolio's management. Our responsibility is to express an opinion on these financial statements and financial highlights based on our audits.
We conducted our audits in accordance with the standards of the Public Company Accounting Oversight Board (United States). Those standards require that we plan and perform the audit to obtain reasonable assurance about whether the financial statements and financial highlights are free of material misstatement. We were not engaged to perform an audit of the Portfolio's internal control over financial reporting. Our audits included consideration of internal control over financial reporting as a basis for designing audit procedures that are appropriate in the circumstances, but not for the purpose of expressing an opinion on the effectiveness of the Portfolio's internal control over financial reporting. Accordingly, we express no such opinion. An audit also includes examining, on a test basis, evidence supporting the amounts and disclosures in the financial statements and financial highlights, assessing the accounting principles used and significant estimates made by management, and evaluating the overall financial statement presentation. Our procedures included confirmation of securities owned as of December 31, 2016, by correspondence with the custodian and others or by other appropriate auditing procedures where replies from others were not received. We believe that our audits provide a reasonable basis for our opinion.
In our opinion, the financial statements and financial highlights referred to above present fairly, in all material respects, the financial position of International Advantage Portfolio (one of the portfolios constituting Morgan Stanley Institutional Fund, Inc.) at December 31, 2016, the results of its operations for the year then ended, the changes in its net assets for each of the two years in the period then ended and the financial highlights for each of the years or periods indicated therein, in conformity with U.S. generally accepted accounting principles.

Boston, Massachusetts
February 28, 2017
27
Morgan Stanley Institutional Fund, Inc.
Annual Report — December 31, 2016
Federal Tax Notice (unaudited)
For federal income tax purposes, the following information is furnished with respect to the distributions paid by the Portfolio during its taxable year ended December 31, 2016.
The Portfolio designated and paid approximately $146,000 as a long-term capital gain distribution.
For federal income tax purposes, the following information is furnished with respect to the Portfolio's earnings for its taxable year ended December 31, 2016. When distributed, certain earnings may be subject to a maximum tax rate of 15% as provided for by the Jobs and Growth Tax Relief Reconciliation Act of 2003. The Portfolio designated up to a maximum of approximately $189,000 as taxable at this lower rate.
The Portfolio intends to pass through foreign tax credits of approximately $22,000 and has derived net income from sources within foreign countries amounting to approximately $230,000.
In January, the Portfolio provides tax information to shareholders for the preceding calendar year.
28
Morgan Stanley Institutional Fund, Inc.
Annual Report — December 31, 2016
Privacy Notice (unaudited)
MORGAN STANLEY INVESTMENT MANAGEMENT INC.
AN IMPORTANT NOTICE CONCERNING OUR U.S. PRIVACY POLICY
We are required by federal law to provide you with a copy of our privacy policy annually. This policy applies to current and former individual investors in funds managed or sponsored by Morgan Stanley Investment Management Inc. ("MSIM") as well as current and former individual clients of MSIM. This policy is not applicable to partnerships, corporations, trusts or other non-individual clients or investors. Please note that we may amend this policy at any time, and will inform you of any changes as required by law.
WE RESPECT YOUR PRIVACY
We appreciate that you have provided us with your personal financial information. We strive to maintain the privacy of such information while we help you achieve your financial objectives. This Notice describes what non-public personal information we collect about you, why we collect it, when we may share it with others and how certain others may use it. It discusses the steps you may take to limit our sharing of certain information about you to affiliated companies in the Morgan Stanley family of companies ("other Morgan Stanley companies"). It also discloses how you may limit use of certain shared information for marketing purposes by other Morgan Stanley branded companies. Throughout this policy, we refer to the non-public information that personally identifies you or your accounts as "personal information."
1. WHAT PERSONAL INFORMATION DO WE COLLECT ABOUT YOU?
We obtain personal information from applications and other forms you submit to us, from your dealings with us, from consumer reporting agencies, from our Web sites and from third parties and other sources.
For example:
• We may collect information such as your name, address, e-mail address, telephone/fax numbers, assets, income and investment objectives through subscription documents, applications and other forms you submit to us.
• We may obtain information about account balances, your use of account(s) and the types of products and services you prefer to receive from us through your dealings and transactions with us and other sources.
• We may obtain information about your creditworthiness and credit history from consumer reporting agencies.
• We may collect background information from and through third-party vendors to verify representations you have made and to comply with various regulatory requirements.
• If you interact with us through our public and private Web sites, we may collect information that you provide directly through online communications (such as an e-mail address). We may also collect information about your Internet service provider, your domain name, your computer's operating system and Web browser, your use of our Web sites and your product and service preferences, through the use of "cookies." Please consult the Terms of Use of these sites for more details.
2. WHEN DO WE DISCLOSE PERSONAL INFORMATION WE COLLECT ABOUT YOU?
We may disclose personal information we collect about you to other Morgan Stanley companies and to non-affiliated third parties.
a. Information We Disclose to Other Morgan Stanley Companies.
We may disclose personal information to other Morgan Stanley companies for a variety of reasons, including to manage your account(s) effectively, to service and process your transactions, to let you know about products and services offered by us and other Morgan Stanley companies, to manage our business, and as otherwise required or permitted by law. Offers for products and services from other Morgan Stanley companies are developed under conditions designed to safeguard your personal information.
29
Morgan Stanley Institutional Fund, Inc.
Annual Report — December 31, 2016
Privacy Notice (unaudited) (cont'd)
b. Information We Disclose to Non-affiliated Third Parties.
We do not disclose personal information that we collect about you to non-affiliated third parties except to those who provide marketing services on our behalf, to financial institutions with whom we have joint marketing agreements, and as otherwise required or permitted by law. For example, we may disclose personal information to nonaffiliated third parties for servicing and processing transactions, to offer our own products and services, to protect against fraud, for institutional risk control, to respond to judicial process or to perform services on our behalf. When we share personal information with a non-affiliated third party, they are required to limit their use of personal information to the particular purpose for which it was shared and they are not allowed to share personal information with others except to fulfill that limited purpose or as may be permitted or required by law.
3. HOW DO WE PROTECT THE SECURITY AND CONFIDENTIALITY OF PERSONAL INFORMATION WE COLLECT ABOUT YOU?
We maintain physical, electronic and procedural security measures to help safeguard the personal information we collect about you. We have internal policies governing the proper handling of client information. Third parties that provide support or marketing services on our behalf may also receive personal information, and we require them to adhere to confidentiality standards with respect to such information.
4. HOW CAN YOU LIMIT THE SHARING OF CERTAIN TYPES OF PERSONAL INFORMATION WITH OTHER MORGAN STANLEY COMPANIES?
We offer you choices as to whether we share with other Morgan Stanley companies the personal information that was collected to determine your eligibility for products and services you request ("eligibility information"). Eligibility information does not include your identification information or personal information pertaining to our transactions or experiences with you. Please note that, even if you direct us not to share eligibility information with other Morgan Stanley companies ("opt-out"), we may still share personal information, including eligibility information, with those companies in circumstances excluded from the opt-out under applicable law, such as to process transactions or to service your account.
5. HOW CAN YOU LIMIT THE USE OF CERTAIN TYPES OF PERSONAL INFORMATION BY OTHER MORGAN STANLEY COMPANIES FOR MARKETING?
By following the opt-out instructions in Section 6 below, you may limit other Morgan Stanley branded companies from marketing their products or services to you based on personal information we disclose to them. This information may include, for example, your income and account history with us. Please note that, even if you choose to limit Other Morgan Stanley Companies from using personal information about you that we may share with them for marketing their products and services to you, Other Morgan Stanley Companies may use your personal information that they obtain from us to market to you in circumstances permitted by law, such as if the Other Morgan Stanley Company has its own relationship with you.
6. HOW CAN YOU SEND US AN OPT-OUT INSTRUCTION?
If you wish to limit our sharing of eligibility information about you with other Morgan Stanley companies or other Morgan Stanley companies' use of personal information for marketing purposes, as described in this notice, you may do so by:
• Calling us at (800) 548-7786
Monday–Friday between 8a.m. and 6p.m.(EST)
• Writing to us at the following address:
Boston Financial Data Services, Inc.
c/o Privacy Coordinator
P.O. Box 219804
Kansas City, Missouri 64121
30
Morgan Stanley Institutional Fund, Inc.
Annual Report — December 31, 2016
Privacy Notice (unaudited) (cont'd)
Your written request should include your name, address, telephone number and account number(s) to which the opt-out applies and whether you are opting out with respect to sharing of eligibility information (Section 4 above), or if information used for Marketing (Section 5 above) or both. Written opt-out requests should not be sent with any other correspondence. In order to process your request, we require that the request be provided by you directly and not through a third party.
Your opt-out preference will remain in effect with respect to this policy (as it may be amended) until you notify us otherwise. If you have a joint account, your direction for us not to share this information with other Morgan Stanley companies and for those other Morgan Stanley companies not to use your personal information for marketing will be applied to all account holders on that account. Please understand that if you limit our sharing or our affiliated companies' use of personal information, you and any joint account holder(s) may not receive information about Morgan Stanley products and services, including products or services that could help you manage your financial resources and achieve your investment objectives.
7. WHAT IF AN AFFILIATED COMPANY BECOMES A NON-AFFILIATED THIRD PARTY?
If, at any time in the future, an affiliated company becomes a non-affiliated third party, further disclosures of personal information made to the former affiliated company will be limited to those described in Section 2(b) above relating to non-affiliated third parties. If you elected under Section 6 to limit disclosures we make to affiliated companies, or use of personal information by affiliated companies, your election will not apply to use by any former affiliated company of your personal information in their possession once it becomes a non-affiliated third party.
SPECIAL NOTICE TO RESIDENTS OF VERMONT
The following section supplements our policy with respect to our individual clients who have a Vermont address and supersedes anything to the contrary in the above policy with respect to those clients only.
The state of Vermont requires financial institutions to obtain your consent prior to sharing personal information that they collect about you with affiliated companies and non-affiliated third parties other than in certain limited circumstances. Except as permitted by law, we will not share personal information we collect about you with non-affiliated third parties or other Morgan Stanley companies unless you provide us with your written consent to share such information ("opt-in").
If you wish to receive offers for investment products and services offered by or through other Morgan Stanley companies, please notify us in writing at the following address:
Boston Financial Data Services, Inc.
c/o Privacy Coordinator
P.O. Box 219804
Kansas City, Missouri 64121
Your authorization should include your name, address, telephone number and account number(s) to which the opt-in applies and should not be sent with any other correspondence. In order to process your authorization, we require that the authorization be provided by you directly and not through a third party.
SPECIAL NOTICE TO RESIDENTS OF CALIFORNIA
The following section supplements our policy with respect to our individual clients who have a California address and supersedes anything to the contrary in the above policy with respect to those clients only.
In response to a California law, if your account has a California home address, your personal information will not be disclosed to nonaffiliated third parties except as permitted by applicable California law, and we will limit sharing such information with our affiliates to comply with California privacy laws that apply to us.
31
Morgan Stanley Institutional Fund, Inc.
Annual Report — December 31, 2016
Director and Officer Information (unaudited)
Independent Directors:
Name, Age and Address of
Independent Director | | Position(s)
Held with
Registrant | | Length of Time
Served* | | Principal Occupation(s) During Past 5 Years
and Other Relevant Professional Experience | | Number of
Portfolios in
Fund Complex
Overseen by
Independent
Director** | | Other Directorships
Held by Independent
Director*** | |
Frank L. Bowman (72)
c/o Perkins Coie LLP
Counsel to the Independent
Directors
30 Rockefeller Plaza
New York, NY 10112 | | Director | | Since
August
2006 | | President, Strategic Decisions, LLC (consulting) (since February 2009); Director or Trustee of various Morgan Stanley Funds (since August 2006); Chairperson of the Compliance and Insurance Committee (since October 2015); formerly, Chairperson of the Insurance Sub-Committee of the Compliance and Insurance Committee (2007-2015); served as President and Chief Executive Officer of the Nuclear Energy Institute (policy organization) (February 2005-November 2008); retired as Admiral, U.S. Navy after serving over 38 years on active duty including 8 years as Director of the Naval Nuclear Propulsion Program in the Department of the Navy and the U.S. Department of Energy (1996-2004); served as Chief of Naval Personnel (July 1994-September 1996) and on the Joint Staff as Director of Political Military Affairs (June 1992-July 1994); knighted as Honorary Knight Commander of the Most Excellent Order of the British Empire; awarded the Officier de l'Orde National du Mérite by the French Government; elected to the National Academy of Engineering (2009). | | | 90 | | | Director of BP p.l.c.; Director of Naval and Nuclear Technologies LLP; Director Emeritus of the Armed Services YMCA; Director of the U.S. Naval Submarine League; Member of the National Security Advisory Council of the Center for U.S. Global Engagement and a member of the CNA Military Advisory Board; Chairman of the charity J Street Cup Golf; Trustee of Fairhaven United Methodist Church; and Director of other various non-profit organizations. | |
Kathleen A. Dennis (63)
c/o Perkins Coie LLP
Counsel to the Independent Directors
30 Rockefeller Plaza
New York, NY 10112 | | Director | | Since
August
2006 | | President, Cedarwood Associates (mutual fund and investment management consulting) (since July 2006); Chairperson of the Liquidity and Alternatives Sub-Committee of the Investment Committee (since October 2006) and Director or Trustee of various Morgan Stanley Funds (since August 2006); formerly, Senior Managing Director of Victory Capital Management (1993-2006). | | | 91 | | | Director of various non-profit organizations. | |
Nancy C. Everett (61)
c/o Perkins Coie LLP
Counsel to the Independent Directors
30 Rockefeller Plaza
New York, NY 10112 | | Director | | Since
January
2015 | | Chief Executive Officer, Virginia Commonwealth University Investment Company (since November 2015); Owner, OBIR, LLC (institutional investment management consulting) (since June 2014); formerly, Managing Director, BlackRock Inc. (February 2011-December 2013); and Chief Executive Officer, General Motors Asset Management (a/k/a Promark Global Advisors, Inc.) (June 2005-May 2010). | | | 91 | | | Member of Virginia Commonwealth University School of Business Foundation; formerly, Member of Virginia Commonwealth University Board of Visitors (2013-2015); Member of Committee on Directors for Emerging Markets Growth Fund, Inc. (2007-2010); Chairperson of Performance Equity Management, LLC (2006-2010); and Chairperson, GMAM Absolute Return Strategies Fund, LLC (2006-2010). | |
32
Morgan Stanley Institutional Fund, Inc.
Annual Report — December 31, 2016
Director and Officer Information (unaudited) (cont'd)
Independent Directors: (cont'd)
Name, Age and Address of
Independent Director | | Position(s)
Held with
Registrant | | Length of Time
Served* | | Principal Occupation(s) During Past 5 Years
and Other Relevant Professional Experience | | Number of
Portfolios in
Fund Complex
Overseen by
Independent
Director** | | Other Directorships
Held by Independent
Director*** | |
Jakki L. Haussler (59)
c/o Perkins Coie LLP
Counsel to the Independent Directors
30 Rockefeller Plaza
New York, NY 10112 | | Director | | Since
January
2015 | | Chairman and Chief Executive Officer, Opus Capital Group (since January 1996); formerly, Director, Capvest Venture Fund, LP (May 2000-December 2011); Partner, Adena Ventures, LP (July 1999-December 2010); Director, The Victory Funds (February 2005-July 2008). | | | 91 | | | Director of Cincinnati Bell Inc. and Member, Audit Committee and Compensation Committee; Director of Northern Kentucky University Foundation and Member, Investment Committee; Member of Chase College of Law Transactional Law Practice Center Board of Advisors; Director of Best Transport; Director of Chase College of Law Board of Visitors; formerly, Member, University of Cincinnati Foundation Investment Committee; Member, Miami University Board of Visitors (2008-2011); Trustee of Victory Funds (2005-2008) and Chairman, Investment Committee (2007-2008) and Member, Service Provider Committee (2005-2008). | |
Dr. Manuel H. Johnson (67)
c/o Johnson Smick
International, Inc.
220 I Street, N.E. — Suite 200
Washington, D.C. 20002 | | Director | | Since
July
1991 | | Senior Partner, Johnson Smick International, Inc. (consulting firm); Chairperson of the Investment Committee (since October 2006) and Director or Trustee of various Morgan Stanley Funds (since July 1991); Co-Chairman and a founder of the Group of Seven Council (G7C) (international economic commission); formerly, Chairperson of the Audit Committee (July 1991-September 2006), Vice Chairman of the Board of Governors of the Federal Reserve System and Assistant Secretary of the U.S. Treasury. | | | 91 | | | Director of NVR, Inc. (home construction). | |
Joseph J. Kearns (74)
c/o Kearns & Associates LLC
46 E Peninsula Center #385
Rolling Hills Estates, CA 90274-3712 | | Director | | Since
August
1994 | | President, Kearns & Associates LLC (investment consulting); Chairperson of the Audit Committee (since October 2006) and Director or Trustee of various Morgan Stanley Funds (since August 1994); formerly, Deputy Chairperson of the Audit Committee (July 2003-September 2006) and Chairperson of the Audit Committee of various Morgan Stanley Funds (since August 1994); CFO of the J. Paul Getty Trust. | | | 93 | | | Director of Electro Rent Corporation (equipment leasing). Prior to December 31, 2013, Director of The Ford Family Foundation. | |
33
Morgan Stanley Institutional Fund, Inc.
Annual Report — December 31, 2016
Director and Officer Information (unaudited) (cont'd)
Independent Directors: (cont'd)
Name, Age and Address of
Independent Director | | Position(s)
Held with
Registrant | | Length of Time
Served* | | Principal Occupation(s) During Past 5 Years
and Other Relevant Professional Experience | | Number of
Portfolios in
Fund Complex
Overseen by
Independent
Director** | | Other Directorships
Held by Independent
Director*** | |
Michael F. Klein (58)
c/o Perkins Coie LLP
Counsel to the Independent Directors
30 Rockefeller Plaza
New York, NY 10112 | | Director | | Since
August
2006 | | Managing Director, Aetos Capital, LLC (since March 2000); Co-President, Aetos Alternatives Management, LLC (since January 2004) and Co-Chief Executive Officer of Aetos Capital LLC (since August 2013); Chairperson of the Fixed Income Sub-Committee of the Investment Committee (since October 2006) and Director or Trustee of various Morgan Stanley Funds (since August 2006); formerly, Managing Director, Morgan Stanley & Co. Inc. and Morgan Stanley Dean Witter Investment Management, President, various Morgan Stanley Funds (June 1998-March 2000) and Principal, Morgan Stanley & Co. Inc. and Morgan Stanley Dean Witter Investment Management (August 1997-December 1999). | | | 90 | | | Director of certain investment funds managed or sponsored by Aetos Capital, LLC; Director of Sanitized AG and Sanitized Marketing AG (specialty chemicals). | |
Patricia Maleski (56)
c/o Perkins Coie LLP
Counsel to the Independent Directors
30 Rockefeller Plaza
New York, NY 10112 | | Director | | Since
January
2017 | | Management Director, JPMorgan Asset Management (2013-2016); President, JPMorgan Funds (2010-2013), Chief Administrative Officer, JPMorgan Funds (2004-2010), Treasurer, JPMorgan Funds (2003-2004, 2008-2010), and Vice President and Board Liaison, JPMorgan Funds (2001-2004); Managing Director, J.P. Morgan Investment Management Inc. (2001-2013); Vice President of Finance, Pierpont Group (1996-2001); Vice President, Bank of New York (1995-1996); Senior Audit Manager, Price Waterhouse, LLP (1982-1995). | | | 91 | | | None. | |
Michael E. Nugent (80)
522 Fifth Avenue
New York, NY 10036 | | Chair of the Board and Director | | Chair of the Boards since July 2006 and Director since July 1991 | | Chair of the Boards of various Morgan Stanley Funds (since July 2006); Chairperson of the Closed-End Fund Committee (since June 2012) and Director or Trustee of various Morgan Stanley Funds (since July 1991); formerly, Chairperson of the Insurance Committee (until July 2006); General Partner, Triumph Capital, L.P. (private investment partnership) (1988-2013). | | | 92 | | | None. | |
W. Allen Reed (69)
c/o Perkins Coie LLP
Counsel to the Independent Directors
30 Rockefeller Plaza
New York, NY 10112 | | Director | | Since
August
2006 | | Chairperson of the Equity Sub-Committee of the Investment Committee (since October 2006) and Director or Trustee of various Morgan Stanley Funds (since August 2006); formerly, President and CEO of General Motors Asset Management; Chairman and Chief Executive Officer of the GM Trust Bank and Corporate Vice President of General Motors Corporation (August 1994-December 2005). | | | 91 | | | Director of Legg Mason, Inc.; formerly, Director of the Auburn University Foundation (2010-2015). | |
Fergus Reid (84)
c/o Joe Pietryka, Inc.
85 Charles Colman Blvd.
Pawling, NY 12564 | | Director | | Since
June
1992 | | Chairman, Joe Pietryka, Inc.; Chairperson of the Governance Committee and Director or Trustee of various Morgan Stanley Funds (since June 1992). | | | 92 | | | Formerly, Trustee and Director of certain investment companies in the JP Morgan Fund Complex managed by JP Morgan Investment Management Inc. (1987-2012). | |
* This is the earliest date the Director began serving the Morgan Stanley Funds. Each Director serves an indefinite term, until his or her successor is elected.
** The Fund Complex includes (as of December 31, 2016) all open-end and closed-end funds (including all of their portfolios) advised by Morgan Stanley Investment Management Inc. (the "Adviser") and any funds that have an adviser that is an affiliated person of the Adviser (including, but not limited to, Morgan Stanley AIP GP LP).
*** This includes any directorships at public companies and registered investment companies held by the Director at any time during the past five years.
34
Morgan Stanley Institutional Fund, Inc.
Annual Report — December 31, 2016
Director and Officer Information (unaudited) (cont'd)
Executive Officers:
Name, Age and Address of Executive Officer | | Position(s) Held
with
Registrant | | Length of Time
Served* | | Principal Occupation(s) During Past 5 Years | |
John H. Gernon (53)
522 Fifth Avenue
New York, NY 10036 | | President and Principal Executive Officer | | Since
September
2013 | | President and Principal Executive Officer of the Equity and Fixed Income Funds and the Morgan Stanley AIP Funds (since September 2013) and the Liquidity Funds and various money market funds (since May 2014) in the Fund Complex; Managing Director of the Adviser; Head of Product (since 2006). | |
Timothy J. Knierim (58)
522 Fifth Avenue
New York, NY 10036 | | Chief Compliance Officer | | Since
December
2016 | | Managing Director of the Adviser and various entities affiliated with the Adviser; Chief Compliance Officer of various Morgan Stanley Funds and the Adviser (since December 2016) and Chief Compliance Officer of Morgan Stanley AIP GP LP (since 2014). Formerly, Managing Director and Deputy Chief Compliance Officer of the Adviser (2014-2016); and formerly, Chief Compliance Officer of Prudential Investment Management, Inc. (2007-2014). | |
Francis J. Smith (51)
522 Fifth Avenue
New York, NY 10036 | | Treasurer and Principal Financial Officer | | Treasurer since July 2003 and Principal Financial Officer since September 2002 | | Managing Director of the Adviser and various entities affiliated with the Adviser; Treasurer (since July 2003) and Principal Financial Officer of various Morgan Stanley Funds (since September 2002). | |
Mary E. Mullin (49)
522 Fifth Avenue
New York, NY 10036 | | Secretary | | Since
June
1999 | | Executive Director of the Adviser; Secretary of various Morgan Stanley Funds (since June 1999). | |
* This is the earliest date the officer began serving the Morgan Stanley Funds. Each officer serves a one-year term, until his or her successor is elected and qualifies.
35
Morgan Stanley Institutional Fund, Inc.
Annual Report — December 31, 2016
Adviser and Administrator
Morgan Stanley Investment Management Inc.
522 Fifth Avenue
New York, New York 10036
Distributor
Morgan Stanley Distribution, Inc.
522 Fifth Avenue
New York, New York 10036
Dividend Disbursing and Transfer Agent
Boston Financial Data Services, Inc.
2000 Crown Colony Drive
Quincy, Massachusetts 02169
Custodian
State Street Bank and Trust Company
One Lincoln Street
Boston, Massachusetts 02111
Legal Counsel
Dechert LLP
1095 Avenue of the Americas
New York, New York 10036
Counsel to the Independent Directors
Perkins Coie LLP
30 Rockefeller Plaza
New York, New York 10112
Independent Registered Public Accounting Firm
Ernst & Young LLP
200 Clarendon Street
Boston, Massachusetts 02116
Reporting to Shareholders
Each Morgan Stanley fund provides a complete schedule of portfolio holdings in its semi-annual and annual reports within 60 days of the end of the fund's second and fourth fiscal quarters. The semi-annual and annual reports are filed electronically with the Securities and Exchange Commission (SEC) on Form N-CSRS and Form N-CSR, respectively. Morgan Stanley also delivers the semi-annual and annual reports to fund shareholders and makes these reports available on its public website, www.morganstanley.com/im. Each Morgan Stanley fund also files a complete schedule of portfolio holdings with the SEC for the fund's first and third fiscal quarters on Form N-Q. Morgan Stanley does not deliver the reports for the first and third fiscal quarters to shareholders, nor are the reports posted to the Morgan Stanley public website. You may, however, obtain the Form N-Q filings (as well as the Form N-CSR and N-CSRS filings) by accessing the SEC's website, www.sec.gov. You may also review and copy them at the SEC's Public Reference Room in Washington, DC. Information on the operation of the SEC's Public Reference Room may be obtained by calling the SEC toll free at 1 (800) SEC-0330. You can also request copies of these materials, upon payment of a duplicating fee, by electronic request at the SEC's email address (publicinfo@sec.gov) or by writing the Public Reference Room of the SEC, 100 F Street, NE, Washington, DC 20549-0102.
Proxy Voting Policies and Procedures and Proxy Voting Record
You may obtain a copy of the Fund's Proxy Voting Policy and Procedures and information regarding how the Fund voted proxies relating to portfolio securities during the most recent twelve-month period ended June 30, without charge, upon request, by calling toll free 1 (800) 548-7786 or by visiting our website at www.morganstanley.com/im. This information is also available on the SEC's website at www.sec.gov.
This report is authorized for distribution only when preceded or accompanied by a prospectus or summary prospectus of the applicable Portfolio of Morgan Stanley Institutional Fund, Inc., which describes in detail the Portfolio's investment policies, risks, fees and expenses. Please read the prospectus carefully before you invest or send money. For additional information, including information regarding the investments comprising the Portfolio, please visit our website at www.morganstanley.com/im or call toll free 1 (800) 548-7786.
36
(This Page has been left blank intentionally.)
Printed in U.S.A.
This Report has been prepared for shareholders and may be distributed to others only if preceded or accompanied by a current prospectus.
Morgan Stanley Investment Management Inc.
522 Fifth Avenue
New York, New York 10036
© 2017 Morgan Stanley. Morgan Stanley Distribution, Inc.

IFIIAANN
1697136 EXP. 02.28.18

Morgan Stanley Institutional Fund, Inc.
International Equity Portfolio
Annual Report
December 31, 2016

Morgan Stanley Institutional Fund, Inc.
Annual Report — December 31, 2016
Shareholders' Letter | | | 2 | | |
Expense Example | | | 3 | | |
Investment Overview | | | 4 | | |
Portfolio of Investments | | | 8 | | |
Statement of Assets and Liabilities | | | 10 | | |
Statement of Operations | | | 12 | | |
Statements of Changes in Net Assets | | | 13 | | |
Financial Highlights | | | 15 | | |
Notes to Financial Statements | | | 20 | | |
Report of Independent Registered Public Accounting Firm | | | 30 | | |
Federal Tax Notice | | | 31 | | |
Privacy Notice | | | 32 | | |
Director and Officer Information | | | 35 | | |
This report is authorized for distribution only when preceded or accompanied by a prospectus or summary prospectus of the applicable Portfolio of Morgan Stanley Institutional Fund, Inc. To receive a prospectus and/or statement of additional information (SAI), which contains more complete information such as investment objectives, charges, expenses, policies for voting proxies, risk considerations, and describes in detail each of the Portfolio's investment policies to the prospective investor, please call toll free 1 (800) 548-7786. Please read the prospectuses carefully before you invest or send money.
Additionally, you can access information about the Portfolio, including performance, characteristics, and investment team commentary, through Morgan Stanley Investment Management's website: www.morganstanley.com/im.
Market forecasts provided in this report may not necessarily come to pass. There is no guarantee that any sectors mentioned will continue to perform as discussed herein or that securities in such sectors will be held by the Portfolio in the future. There is no assurance that a Portfolio will achieve its investment objective. Portfolios are subject to market risk, which is the possibility that market values of securities owned by the Portfolio will decline and, therefore, the value of the Portfolio's shares may be less than what you paid for them. Accordingly, you can lose money investing in this Portfolio. Please see the prospectus for more complete information on investment risks.
1
Morgan Stanley Institutional Fund, Inc.
Annual Report — December 31, 2016
Shareholders' Letter (unaudited)
Dear Shareholders,
We are pleased to provide this Annual report, in which you will learn how your investment in International Equity Portfolio (the "Portfolio") performed during the latest twelve-month period.
Morgan Stanley Investment Management is a client-centric, investor-led organization. Our global presence, intellectual capital, and breadth of products and services enable us to partner with investors to meet the evolving challenges of today's financial markets. We aim to deliver superior investment service and to empower our clients to make the informed decisions that help them reach their investment goals.
As always, we thank you for selecting Morgan Stanley Investment Management, and look forward to working with you in the months and years ahead.
Sincerely,

John H. Gernon
President and Principal Executive Officer
January 2017
2
Morgan Stanley Institutional Fund, Inc.
Annual Report — December 31, 2016
Expense Example (unaudited)
International Equity Portfolio
As a shareholder of the Portfolio, you incur two types of costs: (1) transactional costs, including redemption fees; and (2) ongoing costs, which may include advisory fees, administration fees, distribution and shareholder services fees and other Portfolio expenses. This example is intended to help you understand your ongoing costs (in dollars) of investing in the Portfolio and to compare these costs with the ongoing costs of investing in other mutual funds.
This example is based on an investment of $1,000 invested at the beginning of the six-month period ended December 31, 2016 and held for the entire six-month period.
Actual Expenses
The table below provides information about actual account values and actual expenses. You may use the information in this table, together with the amount you invested, to estimate the expenses that you paid over the period. Simply divide your account value by $1,000 (for example, an $8,600 account value divided by $1,000 = 8.6), then multiply the result by the number in the table under the heading entitled "Actual Expenses Paid During Period" to estimate the expenses you paid on your account during this period.
Hypothetical Example for Comparison Purposes
The table below provides information about hypothetical account values and hypothetical expenses based on the Portfolio's actual expense ratio and an assumed rate of return of 5% per year before expenses, which is not the Portfolio's actual return. The hypothetical account values and expenses may not be used to estimate the actual ending account balance or expenses you paid for the period. You may use this information to compare the ongoing costs of investing in the Portfolio and other funds. To do so, compare this 5% hypothetical example with the 5% hypothetical examples that appear in the shareholder reports of the other funds.
Please note that the expenses shown in the table are meant to highlight your ongoing costs only and do not reflect any transactional costs, such as sales charges (loads) and redemption fees. Therefore, the information for each class in the table is useful in comparing ongoing costs only, and will not help you determine the relative total costs of owning different funds. In addition, if these transactional costs were included, your costs would have been higher.
| | | Beginning
Account
Value
7/1/16 | | Actual Ending
Account
Value
12/31/16 | | Hypothetical
Ending Account
Value | | Actual
Expenses
Paid
During
Period* | | Hypothetical
Expenses Paid
During Period* | | Net
Expense
Ratio
During
Period** | |
International Equity Portfolio Class I | | $ | 1,000.00 | | | $ | 1,000.60 | | | $ | 1,020.36 | | | $ | 4.78 | | | $ | 4.82 | | | | 0.95 | %*** | |
International Equity Portfolio Class A | | | 1,000.00 | | | | 998.80 | | | | 1,018.65 | | | | 6.48 | | | | 6.55 | | | | 1.29 | *** | |
International Equity Portfolio Class L | | | 1,000.00 | | | | 996.60 | | | | 1,016.09 | | | | 9.03 | | | | 9.12 | | | | 1.80 | *** | |
International Equity Portfolio Class C | | | 1,000.00 | | | | 995.50 | | | | 1,014.83 | | | | 10.28 | | | | 10.38 | | | | 2.05 | *** | |
International Equity Portfolio Class IS | | | 1,000.00 | | | | 1,001.00 | | | | 1,020.61 | | | | 4.53 | | | | 4.57 | | | | 0.90 | *** | |
* Expenses are calculated using each Portfolio Class' annualized net expense ratio (as disclosed), multiplied by the average account value over the period, and multiplied by 184/366 (to reflect the most recent one-half year period).
** Annualized.
*** Refer to Note F in the Notes to Financial Statements for discussion of prior period custodian out-of-pocket expenses that were reimbursed in the current period.
3
Morgan Stanley Institutional Fund, Inc.
Annual Report — December 31, 2016
Investment Overview (unaudited)
International Equity Portfolio
The Portfolio seeks long-term capital appreciation by investing primarily in equity securities of non-U.S. issuers.
Performance
For the year ended December 31, 2016, the Portfolio's Class I shares had a total return based on net asset value and reinvestment of distributions per share of –2.00%, net of fees. The Portfolio's Class I shares underperformed the Portfolio's benchmark, the MSCI EAFE Index (the "Index"), which returned 1.00%.
Factors Affecting Performance
• After all was said and done, the Index ended the year up 1.0% in U.S. dollar ("USD") terms (+5.3% local) as a strong USD continued to impact local market returns. This was well behind the U.S., which ended the year up 11% (as measured by the MSCI USA Index).(i) The commodity markets fared best, with Canada up 25% in USD, Norway gaining 13% and Australia up 11%. Core Europe was up mildly, with France rising +5%, the Netherlands rising +5% and Germany up +3% in USD and 6% in euros. Japan was up 2% in USD but down 1% in yen, while the U.K. was flat in dollars, but up a mighty 19% in wilting sterling. Peripheral Europe lagged the Index, with Spain off 1%, Ireland down 7% and Italy down 10%, despite a late-year rally. It was a decent year for emerging markets, up 11% in USD and 10% in USD in local currency (as measured by the MSCI Emerging Markets Index). The stars were Brazil (up 66%) and Russia (up 55%).
• Overall 2016 saw the commodity complex doing best, with energy up +27% and materials up +24%, and the cyclical industrials (+7%) and information technology (+4%) also beat the Index, while financials (+1%) were broadly in line.(i) Consumer discretionary lagged a little, down 1%, while consumer staples were down 3%, with the other defensives trailing further as utilities finished down 5%, telecommunications down 7% and health care bringing up the rear, losing 11%. The real story was that it was a year of two halves, with, what we consider, high quality ruling the first half and lower quality dominating the second half. Consumer staples were 10% ahead of the market in the first half of 2016 but 15% behind in the second half,
while financials were 12% behind in the first half but 14% ahead in the second half.
• In the Portfolio, for 2016 as a whole, sector allocation was significantly negative thanks to the overweights in consumer staples and health care and the underweights in energy and financials, while stock selection was roughly neutral, as outperformance in information technology, health care, consumer staples and materials was balanced by underperformance in financials, telecommunications and energy. A yen hedge, managed with currency forwards, was a detractor for the year.
Management Strategies
• The defining feature of the second half of 2016 has been the massive rally in value stocks (and a balancing de-rating of defensives) given an extra boost in the fourth quarter by the election of President Trump. Executing an effortless hand-brake turn, it appears that the market has effectively reassessed the global outlook from one of sluggish growth and disinflation to one of reflation and rising growth. We believe the market is clearly hoping that fiscal policy will now drive reflation (i.e., growth and inflation) after monetary policy failed to do so. After years of deadlock, America now seems to be getting an executive that can get laws through Congress (for better or worse) as Trump and the Republican establishment decide that on balance they despise each other less than they hate the Democrats. This means that the U.S. may use fiscal policy where it previously over-used monetary policy in the face of political gridlock. Whether it works or not or has the desired outcomes is of course another question.
• We believe low expectations may well help Trump and should not obscure his biggest potential long-term opportunity — to sort out the U.S. taxation system, which has incentivized U.S. companies to invest outside America.
• Cutting personal and corporate tax rates should provide a stimulus to the economy, and in the case of some domestically focused U.S. companies, could significantly boost post-tax earnings. However, there are a series of provisos. Many U.S. corporates already
(i) Country, region and sector performance data from FactSet
4
Morgan Stanley Institutional Fund, Inc.
Annual Report — December 31, 2016
Investment Overview (unaudited) (cont'd)
International Equity Portfolio
have a tax rate well below the headline 35% rate,(ii) either because of foreign income or assorted loopholes, while the proposed border adjustment tax brings risks of trade wars. The hopes of a resultant capital expenditure surge may be overstated in the short term, particularly in the case of the piles of overseas cash held by tech companies, as they are not exactly cash-constrained at present. However, longer term, a border adjustment tax, if actually implemented, could be a game changer if the rest of the world, and particularly China, puts up with the U.S. joining the global tax arbitrage game rather than risking hard tariffs.
• Looking at the macro side, the personal tax cuts look to be heavily skewed to higher earners (as opposed to those on lower incomes who reportedly helped put Trump in the White House), which may limit the macro impact given the wealthy's higher propensity to save rather than spend. However, the state of the economic cycle may be more of a problem. U.S. unemployment is already under 5%,(iii) and rising wages, while positive for demand, could well put significant pressures on corporate margins, potentially wiping out the taxation gains in many cases where companies lack pricing power. It could well also push the Federal Reserve to tighten faster than expected.
• The market assumption that there will be reflation via fiscal policy outside the U.S. looks particularly dangerous. In Europe, the Germans are critical of the European Union agreeing to use fiscal policy (or at least, relax current fiscal constraints on individual countries) to reflate and we see next to no chance of a significant move in 2017. Mrs. Merkel wants to be re-elected in September 2017 and may therefore be extremely reluctant to give further ammunition to the euro-skeptic German AfD (Alternative for Germany) party, which has seen substantial state election gains in 2016 following Merkel's unpopular refugee policy. In Japan, there has been a history of reflation via fiscal policy, but the government has yet to cross the Rubicon of the
Bank of Japan backing effectively unlimited government fiscal expenditure rather than merely tethering bond yields to circa 0%. Of all developed countries, Japan is probably closest to crossing this Rubicon due to its dire government debt situation, but will probably be cautious about doing so as it would almost certainly blow up the yen.
• Overall, we do not yet see a significant inflationary threat. The rise in commodity prices is likely to feed through over the next year, and there are the classic late-cycle pressures in the U.S. through increasing labor costs. However, there are still substantial deflationary forces in the system, given the enormous overhang of debt in the world and the impacts of technology. There has already been a transfer of $3 trillion of value from the bond market to the equity market,(iv) and Trump has not always been a friend of debt holders during his business career, but a severe bond rout looks unlikely.
• We do worry that the market is too sanguine on political risk. The biggest single worry is Trump doing something crazy (via executive order or tweet) on foreign policy or trade. The next biggest worry is European politics. In 2017, Europe is facing elections in the Netherlands, France and Germany and a potential early election in Italy. Each of these has potential existential risk for the eurozone if they follow the political playbook of Brexit or Trump. While it is likely that the status quo will just about scrape by in each country, it is far from clear that it will manage a clean sweep. If any one of these elections creates existential threats for Europe, we expect stock market fireworks in 2017. At a more fundamental level, it is far from clear that the sustained global howl of rage at the financial and political elites should be positive for asset prices.
• Any update from us these days would not be complete without a moan about valuations. The MSCI World Index is trading at over 16x estimated 2017 earnings, which are themselves assumed to be up a healthy 13% on the 2016 earnings, with the
(ii) Source: U.S. Government Accountability Office Report to the Ranking Member, Committee on the Budget, U.S. Senate, "Corporate Income Tax: Most Large Profitable U.S. Corporations Paid Tax but Effective Tax Rates Differed Significantly from the Statutory Rate," GAO-16-363, March 2016.
(iii) Source: Bureau of Labor Statistics, December 2016
(iv) Source: Deutsche Bank Research, December 20, 2016
5
Morgan Stanley Institutional Fund, Inc.
Annual Report — December 31, 2016
Investment Overview (unaudited) (cont'd)
International Equity Portfolio
U.S. more than a turn higher than that.(v) This does not seem to give a sufficient margin of safety given the myriad risks we have mentioned above, even before considering how the "adjusted" earnings are inflated versus the official GAAP/IFRS (Generally Accepted Accounting Principles/International Financial Reporting Standards) numbers these days. The Schiller Price-Earnings (P/E), which attempts to control for the business cycle by using a 10-year average for earnings, is now at 28x(v) for the U.S., only beaten during the Tech-Media-Telecom boom and the late-1920s bubble.(v)
• While the overall level of valuations are demanding, the sector rotation over the last six months has left the two highest-quality sectors, consumer staples and health care, looking attractive in relative terms. The consumer staples premium to MSCI World Index has halved over the period from 31% to 15%, and is lower still than that in free cash flow terms, while health care, very unusually, is trading at a 10% discount to the market, although, in our view, the threat of significant drug pricing reform in the U.S., had Clinton won, has been replaced by the threat of occasional threatening tweets under Trump.(v) While it is very possible that the Trump rally and rotation has further to run, these two sectors look reasonably priced in absolute terms and attractive in relative terms given their historically defensive stability and high returns on capital. By contrast, the European banks, after their very strong run, look distinctly fully valued at 1x book for an 8% return on equity in 2016, with a struggle to improve it significantly thereafter.(v) There are cheaper opportunities in the sector, but they require you to delve into the murky waters of Italian or investment banks.
• The International Equity Portfolio has tended to have a bias to the highest-quality sectors, consumer staples and health care, because of their potential to compound steadily. This is particularly the case at the moment, given the assorted risks mentioned above and the lack of attractive opportunities elsewhere, and thus they make up 46% of the Portfolio, as against 22% of the Index. By contrast banks are only 3% of the Portfolio as against 15% of the Index (including diversified financials). During the year, this skew increased during the first half of the year, with additions to both consumer
staples and health care alongside a reduction in European banks. Our decision to sell down European banks and not buy new ones following Brexit was clearly costly to performance in 2016, as the market has shrugged off the risks with the hope that fiscal policy and Trump conquer all. As discussed above, we are not inclined to change course now, given the valuations and the risks.

* Minimum Investment for Class I shares
In accordance with SEC regulations, the Portfolio's performance shown assumes that all recurring fees (including management fees) were deducted and all dividends and distributions were reinvested. The performance of Class A, L, C and IS shares will vary from the performance of Class I shares based upon their different inception dates and will be negatively impacted by additional fees assessed to those classes (if applicable).
(v) Source: FactSet December 31, 2016
6
Morgan Stanley Institutional Fund, Inc.
Annual Report — December 31, 2016
Investment Overview (unaudited) (cont'd)
International Equity Portfolio
Performance Compared to the MSCI EAFE Index(1) and the Lipper International Large-Cap Growh Funds Index(2)
| | | Period Ended December 31, 2016
Total Returns(3) | |
| | | | | Average Annual | |
| | | One
Year | | Five
Years | | Ten
Years | | Since
Inception(9) | |
Portfolio — Class I Shares
w/o sales charges(4) | | | –2.00 | % | | | 5.87 | % | | | 1.53 | % | | | 8.04 | % | |
Portfolio — Class A Shares
w/o sales charges(5) | | | –2.33 | | | | 5.54 | | | | 1.24 | | | | 6.91 | | |
Portfolio — Class A Shares with
maximum 5.25% sales charges(5) | | | –7.48 | | | | 4.41 | | | | 0.70 | | | | 6.63 | | |
Portfolio — Class L Shares
w/o sales charges(6) | | | –2.82 | | | | — | | | | — | | | | 5.10 | | |
Portfolio — Class C Shares
w/o sales charges(8) | | | –3.01 | | | | — | | | | — | | | | –7.45 | | |
Portfolio — Class C Shares with
maximum 1.00% deferred
sales charges(8) | | | –3.98 | | | | — | | | | — | | | | –7.45 | | |
Portfolio — Class IS Shares
w/o sales charges(7) | | | –1.95 | | | | — | | | | — | | | | –0.21 | | |
MSCI EAFE Index | | | 1.00 | | | | 6.53 | | | | 0.75 | | | | 4.16 | | |
Lipper International Large-Cap
Growth Funds Index | | | –0.70 | | | | 5.96 | | | | 1.40 | | | | — | | |
Performance data quoted represents past performance, which is no guarantee of future results, and current performance may be lower or higher than the figures shown. Performance assumes that all dividends and distributions, if any, were reinvested. For the most recent month-end performance figures, please visit www.morganstanley.com/im. Investment return and principal value will fluctuate so that Portfolio shares, when redeemed, may be worth more or less than their original cost. Total returns do not reflect the deduction of taxes that a shareholder would pay on Portfolio distributions or the redemption of Portfolio shares. Performance of share classes will vary due to difference in sales charges and expenses.
(1) The MSCI EAFE Index (Europe, Australasia, Far East) is a free float-adjusted market capitalization index that is designed to measure the international equity market performance of developed markets, excluding the U.S. & Canada. The term "free float" represents the portion of shares outstanding that are deemed to be available for purchase in the public equity markets by investors. The MSCI EAFE Index currently consists of 21 developed market country indices. The performance of the Index is listed in U.S. dollars and assumes reinvestment of net dividends. The Index is unmanaged and its returns do not include any sales charges or fees. Such costs would lower performance. It is not possible to invest directly in an index.
(2) The Lipper International Large-Cap Growth Funds Index is an equally weighted performance index of the largest qualifying funds (based on net assets) in the Lipper International Large-Cap Growth Funds classification. The Index, which is adjusted for capital gains distributions and income dividends, is unmanaged and should not be considered an investment. There are currently 30 funds represented in this Index. As of the date of this report, the Portfolio is in the Lipper International Large-Cap Growth Funds classification.
(3) Total returns for the Portfolio reflect fees waived and expenses reimbursed, if applicable, by the Adviser. Without such waivers and reimbursements, total returns would have been lower.
(4) Commenced operations on August 4, 1989.
(5) Commenced offering on January 2, 1996.
(6) Commenced offering on June 14, 2012.
(7) Commenced offering on September 13, 2013.
(8) Commenced offering on April 30, 2015.
(9) For comparative purposes, average annual since inception returns listed for the Indexes refer to the inception date of Class I of the Portfolio, not the inception of the Index.
7
Morgan Stanley Institutional Fund, Inc.
Annual Report — December 31, 2016
Portfolio of Investments
International Equity Portfolio
| | | Shares | | Value
(000) | |
Common Stocks (97.9%) | |
Canada (2.7%) | |
Barrick Gold Corp. | | | 5,175,467 | | | $ | 82,837 | | |
Turquoise Hill Resources Ltd. (a) | | | 7,807,968 | | | | 25,064 | | |
| | | | 107,901 | | |
China (2.1%) | |
China Petroleum & Chemical Corp. H Shares (b) | | | 38,258,000 | | | | 27,135 | | |
Tencent Holdings Ltd. (b) | | | 2,327,700 | | | | 56,943 | | |
| | | | 84,078 | | |
France (13.7%) | |
AXA SA | | | 1,410,259 | | | | 35,606 | | |
L'Oreal SA | | | 910,406 | | | | 166,176 | | |
Pernod Ricard SA | | | 1,081,441 | | | | 117,196 | | |
Publicis Groupe SA | | | 568,245 | | | | 39,210 | | |
Safran SA | | | 744,046 | | | | 53,588 | | |
Sanofi | | | 1,260,332 | | | | 102,022 | | |
Total SA | | | 562,672 | | | | 28,857 | | |
| | | | 542,655 | | |
Germany (7.4%) | |
BASF SE | | | 395,211 | | | | 36,739 | | |
Bayer AG (Registered) | | | 1,068,999 | | | | 111,549 | | |
Continental AG | | | 205,084 | | | | 39,657 | | |
SAP SE | | | 1,188,524 | | | | 103,604 | | |
| | | | 291,549 | | |
Hong Kong (1.5%) | |
AIA Group Ltd. | | | 10,441,200 | | | | 58,908 | | |
Ireland (1.4%) | |
Bank of Ireland (a) | | | 94,488,233 | | | | 23,275 | | |
CRH PLC | | | 920,759 | | | | 31,941 | | |
| | | | 55,216 | | |
Japan (16.9%) | |
FANUC Corp. | | | 437,700 | | | | 74,208 | | |
Hitachi Ltd. | | | 11,130,000 | | | | 60,185 | | |
Inpex Corp. | | | 1,653,900 | | | | 16,571 | | |
Japan Tobacco, Inc. | | | 1,079,300 | | | | 35,498 | | |
Keyence Corp. | | | 84,110 | | | | 57,716 | | |
Komatsu Ltd. | | | 905,300 | | | | 20,507 | | |
Mitsubishi Estate Co., Ltd. | | | 1,294,000 | | | | 25,769 | | |
MS&AD Insurance Group Holdings, Inc. | | | 618,600 | | | | 19,181 | | |
NGK Spark Plug Co., Ltd. | | | 2,649,300 | | | | 58,891 | | |
Nitto Denko Corp. | | | 729,600 | | | | 55,990 | | |
Shiseido Co., Ltd. | | | 2,315,500 | | | | 58,613 | | |
Sompo Holdings, Inc. | | | 1,329,500 | | | | 45,047 | | |
Sumco Corp. (c) | | | 405,700 | | | | 5,242 | | |
Sumitomo Mitsui Financial Group, Inc. | | | 1,362,351 | | | | 51,988 | | |
Sumitomo Mitsui Trust Holdings, Inc. | | | 139,099 | | | | 4,978 | | |
Toyota Motor Corp. | | | 974,700 | | | | 57,360 | | |
USS Co., Ltd. | | | 1,382,700 | | | | 22,029 | | |
| | | | 669,773 | | |
Korea, Republic of (0.9%) | |
LG Household & Health Care Ltd. | | | 51,851 | | | | 36,791 | | |
| | | Shares | | Value
(000) | |
Netherlands (7.5%) | |
Akzo Nobel N.V. | | | 769,710 | | | $ | 48,120 | | |
RELX N.V. | | | 3,861,121 | | | | 64,990 | | |
Unilever N.V. CVA | | | 4,452,271 | | | | 183,319 | | |
| | | | 296,429 | | |
Portugal (0.4%) | |
Galp Energia SGPS SA | | | 1,104,372 | | | | 16,496 | | |
Sweden (1.2%) | |
Nordea Bank AB | | | 4,181,218 | | | | 46,491 | | |
Switzerland (11.8%) | |
LafargeHolcim Ltd. (Registered) (a) | | | 440,638 | | | | 23,215 | | |
Nestle SA (Registered) | | | 1,661,483 | | | | 119,190 | | |
Novartis AG (Registered) | | | 1,976,703 | | | | 143,841 | | |
Roche Holding AG (Genusschein) | | | 513,935 | | | | 117,393 | | |
Swisscom AG (Registered) | | | 83,260 | | | | 37,293 | | |
Zurich Insurance Group AG (a) | | | 99,832 | | | | 27,490 | | |
| | | | 468,422 | | |
United Kingdom (29.8%) | |
Admiral Group PLC | | | 952,658 | | | | 21,450 | | |
Aviva PLC | | | 8,113,858 | | | | 48,638 | | |
British American Tobacco PLC | | | 3,337,500 | | | | 190,088 | | |
BT Group PLC | | | 13,309,094 | | | | 60,179 | | |
Bunzl PLC | | | 2,676,656 | | | | 69,570 | | |
Experian PLC | | | 3,074,669 | | | | 59,642 | | |
GlaxoSmithKline PLC | | | 8,261,215 | | | | 159,029 | | |
Imperial Brands PLC | | | 2,335,795 | | | | 101,976 | | |
Meggitt PLC | | | 6,602,706 | | | | 37,317 | | |
Prudential PLC | | | 4,997,440 | | | | 100,235 | | |
Reckitt Benckiser Group PLC | | | 2,209,560 | | | | 187,510 | | |
RELX PLC | | | 3,353,706 | | | | 59,889 | | |
Travis Perkins PLC | | | 851,690 | | | | 15,241 | | |
Wolseley PLC | | | 1,175,245 | | | | 71,868 | | |
| | | | 1,182,632 | | |
United States (0.6%) | |
AAC Technologies Holdings, Inc. (b)(c) | | | 2,576,064 | | | | 23,404 | | |
Total Common Stocks (Cost $3,313,055) | | | 3,880,745 | | |
Short-Term Investments (2.0%) | |
Securities held as Collateral on Loaned Securities (0.0%) | |
Investment Company (0.0%) | |
Morgan Stanley Institutional Liquidity
Funds — Treasury Securities Portfolio —
Institutional Class (See Note G) | | | 47,000 | | | | 47 | | |
| | | Face
Amount
(000) | | | |
Repurchase Agreements (0.0%) | |
Merrill Lynch & Co., Inc., (0.50%,
dated 12/30/16, due 1/3/17;
proceeds $1; fully collateralized by a
U.S. Government obligation;
1.88% due 8/31/22; valued at $1) | | $ | 1 | | | | 1 | | |
The accompanying notes are an integral part of the financial statements.
8
Morgan Stanley Institutional Fund, Inc.
Annual Report — December 31, 2016
Portfolio of Investments (cont'd)
International Equity Portfolio
| | | Face
Amount
(000) | | Value
(000) | |
Repurchase Agreements (cont'd) | |
Merrill Lynch & Co., Inc., (0.50%,
dated 12/30/16, due 1/3/17;
proceeds $4; fully collateralized by
U.S. Government agency securities;
2.88% - 4.60% due 11/20/65 - 11/20/66;
valued at $4) | | $ | 4 | | | $ | 4 | | |
Merrill Lynch & Co., Inc., (0.81%,
dated 12/30/16, due 1/3/17;
proceeds $6; fully collateralized by
Exchange Traded Funds; valued at $7) | | | 6 | | | | 6 | | |
| | | | 11 | | |
Total Securities held as Collateral on Loaned
Securities (Cost $58) | | | 58 | | |
| | | Shares | | | |
Investment Company (2.0%) | |
Morgan Stanley Institutional Liquidity
Funds — Treasury Securities Portfolio —
Institutional Class (See Note G)
(Cost $77,550) | | | 77,550,199 | | | | 77,550 | | |
Total Short-Term Investments (Cost $77,608) | | | 77,608 | | |
Total Investments (99.9%) (Cost $3,390,663)
Including $2,320 of Securities Loaned (d)(e) | | | 3,958,353 | | |
Other Assets in Excess of Liabilities (0.1%) | | | 3,830 | | |
Net Assets (100.0%) | | $ | 3,962,183 | | |
Country assignments and aggregations are based generally on third party vendor classifications and information, and may be different from the assignments and aggregations under the policies set forth in the Portfolio's prospectus and/or statement of additional information relating to geographic classifications.
(a) Non-income producing security.
(b) Security trades on the Hong Kong exchange.
(c) All or a portion of this security was on loan at December 31, 2016.
(d) Securities are available for collateral in connection with an open foreign currency forward exchange contract.
(e) At December 31, 2016, the aggregate cost for federal income tax purposes is approximately $3,422,950,000. The aggregate gross unrealized appreciation is approximately $672,107,000 and the aggregate gross unrealized depreciation is approximately $136,704,000, resulting in net unrealized appreciation of approximately $535,403,000.
CVA Certificaten Van Aandelen.
Foreign Currency Forward Exchange Contract:
The Portfolio had the following foreign currency forward exchange contract open at December 31, 2016:
Counterparty | | Contracts to
Deliver
(000) | | In Exchange
For
(000) | | Delivery
Date | | Unrealized
Depreciation
(000) | |
Commonwealth Bank of Australia | | JPY | 22,932,000 | | | $ | 194,153 | | | 1/26/17 | | $ | (2,306 | ) | |
JPY — Japanese Yen
Portfolio Composition*
Classification | | Percentage of
Total Investments | |
Other** | | | 55.5 | % | |
Pharmaceuticals | | | 16.0 | | |
Personal Products | | | 11.2 | | |
Insurance | | | 9.0 | | |
Tobacco | | | 8.3 | | |
Total Investments | | | 100.0 | %*** | |
* Percentages indicated are based upon total investments (excluding Securities held as Collateral on Loaned Securities) as of December 31, 2016.
** Industries and/or investment types representing less than 5% of total investments.
*** Does not include an open foreign currency forward exchange contract with unrealized depreciation of approximately $2,306,000.
The accompanying notes are an integral part of the financial statements.
9
Morgan Stanley Institutional Fund, Inc.
Annual Report — December 31, 2016
International Equity Portfolio
Statement of Assets and Liabilities | | December 31, 2016
(000) | |
Assets: | |
Investments in Securities of Unaffiliated Issuers, at Value(1) (Cost $3,313,066) | | $ | 3,880,756 | | |
Investment in Security of Affiliated Issuer, at Value (Cost $77,597) | | | 77,597 | | |
Total Investments in Securities, at Value (Cost $3,390,663) | | | 3,958,353 | | |
Foreign Currency, at Value (Cost $1,886) | | | 1,898 | | |
Tax Reclaim Receivable | | | 7,310 | | |
Receivable for Portfolio Shares Sold | | | 4,865 | | |
Dividends Receivable | | | 4,649 | | |
Receivable from Affiliate | | | 18 | | |
Other Assets | | | 236 | | |
Total Assets | | | 3,977,329 | | |
Liabilities: | |
Payable for Advisory Fees | | | 8,144 | | |
Payable for Portfolio Shares Redeemed | | | 2,882 | | |
Unrealized Depreciation on Foreign Currency Forward Exchange Contracts | | | 2,306 | | |
Payable for Sub Transfer Agency Fees — Class I | | | 245 | | |
Payable for Sub Transfer Agency Fees — Class A | | | 207 | | |
Payable for Sub Transfer Agency Fees — Class L | | | 4 | | |
Payable for Sub Transfer Agency Fees — Class C | | | — | @ | |
Payable for Administration Fees | | | 265 | | |
Payable for Shareholder Services Fees — Class A | | | 249 | | |
Payable for Distribution and Shareholder Services Fees — Class L | | | 4 | | |
Payable for Distribution and Shareholder Services Fees — Class C | | | — | @ | |
Payable for Directors' Fees and Expenses | | | 247 | | |
Payable for Custodian Fees | | | 207 | | |
Payable for Investments Purchased | | | 80 | | |
Collateral on Securities Loaned, at Value | | | 58 | | |
Payable for Professional Fees | | | 58 | | |
Payable for Transfer Agency Fees — Class I | | | 7 | | |
Payable for Transfer Agency Fees — Class A | | | 5 | | |
Payable for Transfer Agency Fees — Class L | | | 1 | | |
Payable for Transfer Agency Fees — Class C | | | — | @ | |
Payable for Transfer Agency Fees — Class IS | | | 1 | | |
Other Liabilities | | | 176 | | |
Total Liabilities | | | 15,146 | | |
Net Assets | | $ | 3,962,183 | | |
Net Assets Consist Of: | |
Paid-in-Capital | | $ | 3,597,276 | | |
Accumulated Undistributed Net Investment Income | | | 29,235 | | |
Accumulated Net Realized Loss | | | (229,307 | ) | |
Unrealized Appreciation (Depreciation) on: | |
Investments | | | 567,690 | | |
Foreign Currency Forward Exchange Contracts | | | (2,306 | ) | |
Foreign Currency Translations | | | (405 | ) | |
Net Assets | | $ | 3,962,183 | | |
The accompanying notes are an integral part of the financial statements.
10
Morgan Stanley Institutional Fund, Inc.
Annual Report — December 31, 2016
International Equity Portfolio
Statement of Assets and Liabilities (cont'd) | | December 31, 2016
(000) | |
CLASS I: | |
Net Assets | | $ | 1,719,699 | | |
| Shares Outstanding $0.001 par value shares of beneficial interest (unlimited shares authorized) (not in 000's) | | | 117,456,182 | | |
Net Asset Value, Offering and Redemption Price Per Share | | $ | 14.64 | | |
CLASS A: | |
Net Assets | | $ | 1,176,835 | | |
| Shares Outstanding $0.001 par value shares of beneficial interest (unlimited shares authorized) (not in 000's) | | | 81,378,942 | | |
Net Asset Value, Redemption Price Per Share | | $ | 14.46 | | |
Maximum Sales Load | | | 5.25 | % | |
Maximum Sales Charge | | $ | 0.80 | | |
Maximum Offering Price Per Share | | $ | 15.26 | | |
CLASS L: | |
Net Assets | | $ | 7,008 | | |
| Shares Outstanding $0.001 par value shares of beneficial interest (unlimited shares authorized) (not in 000's) | | | 485,787 | | |
Net Asset Value, Offering and Redemption Price Per Share | | $ | 14.43 | | |
CLASS C: | |
Net Assets | | $ | 476 | | |
| Shares Outstanding $0.001 par value shares of beneficial interest (unlimited shares authorized) (not in 000's) | | | 33,301 | | |
Net Asset Value, Offering and Redemption Price Per Share | | $ | 14.31 | | |
CLASS IS: | |
Net Assets | | $ | 1,058,165 | | |
| Shares Outstanding $0.001 par value shares of beneficial interest (unlimited shares authorized) (not in 000's) | | | 72,283,775 | | |
Net Asset Value, Offering and Redemption Price Per Share | | $ | 14.64 | | |
(1) Including:
Securities on Loan, at Value: | | $ | 2,320 | | |
@ Amount is less than $500.
The accompanying notes are an integral part of the financial statements.
11
Morgan Stanley Institutional Fund, Inc.
Annual Report — December 31, 2016
International Equity Portfolio
Statement of Operations | | Year Ended
December 31, 2016
(000) | |
Investment Income: | |
Dividends from Securities of Unaffiliated Issuers (Net of $9,827 of Foreign Taxes Withheld) | | $ | 117,798 | | |
Income from Securities Loaned — Net | | | 708 | | |
Dividends from Security of Affiliated Issuer (Note G) | | | 146 | | |
Total Investment Income | | | 118,652 | | |
Expenses: | |
Advisory Fees (Note B) | | | 33,290 | | |
Administration Fees (Note C) | | | 3,329 | | |
Shareholder Services Fees — Class A (Note D) | | | 3,229 | | |
Distribution and Shareholder Services Fees — Class L (Note D) | | | 59 | | |
Distribution and Shareholder Services Fees — Class C (Note D) | | | 7 | | |
Sub Transfer Agency Fees — Class I | | | 1,252 | | |
Sub Transfer Agency Fees — Class A | | | 1,775 | | |
Sub Transfer Agency Fees — Class L | | | 17 | | |
Sub Transfer Agency Fees — Class C | | | 1 | | |
Custodian Fees (Note F) | | | 596 | | |
Registration Fees | | | 229 | | |
Professional Fees | | | 119 | | |
Shareholder Reporting Fees | | | 103 | | |
Directors' Fees and Expenses | | | 99 | | |
Transfer Agency Fees — Class I (Note E) | | | 30 | | |
Transfer Agency Fees — Class A (Note E) | | | 18 | | |
Transfer Agency Fees — Class L (Note E) | | | 4 | | |
Transfer Agency Fees — Class C (Note E) | | | 2 | | |
Transfer Agency Fees — Class IS (Note E) | | | 4 | | |
Pricing Fees | | | 7 | | |
Other Expenses | | | 126 | | |
Expenses Before Non Operating Expenses | | | 44,296 | | |
Bank Overdraft Expense | | | 8 | | |
Total Expenses | | | 44,304 | | |
Reimbursement of Class Specific Expenses — Class I (Note B) | | | (517 | ) | |
Reimbursement of Class Specific Expenses — Class L (Note B) | | | (10 | ) | |
Reimbursement of Class Specific Expenses — Class C (Note B) | | | (2 | ) | |
Rebate from Morgan Stanley Affiliate (Note G) | | | (127 | ) | |
Reimbursement of Custodian Fees (Note F) | | | (127 | ) | |
Net Expenses | | | 43,521 | | |
Net Investment Income | | | 75,131 | | |
Realized Loss: | |
Investments Sold | | | (102,142 | ) | |
Foreign Currency Forward Exchange Contracts | | | (13,744 | ) | |
Foreign Currency Transactions | | | (4,858 | ) | |
Net Realized Loss | | | (120,744 | ) | |
Change in Unrealized Appreciation (Depreciation): | |
Investments | | | (50,954 | ) | |
Foreign Currency Forward Exchange Contracts | | | 4,097 | | |
Foreign Currency Translations | | | 359 | | |
Net Change in Unrealized Appreciation (Depreciation) | | | (46,498 | ) | |
Net Realized Loss and Change in Unrealized Appreciation (Depreciation) | | | (167,242 | ) | |
Net Decrease in Net Assets Resulting from Operations | | $ | (92,111 | ) | |
The accompanying notes are an integral part of the financial statements.
12
Morgan Stanley Institutional Fund, Inc.
Annual Report — December 31, 2016
International Equity Portfolio
Statements of Changes in Net Assets | | Year Ended
December 31, 2016
(000) | | Year Ended
December 31, 2015
(000) | |
Increase (Decrease) in Net Assets: | |
Operations: | |
Net Investment Income | | $ | 75,131 | | | $ | 83,904 | | |
Net Realized Loss | | | (120,744 | ) | | | (81,009 | ) | |
Net Change in Unrealized Appreciation (Depreciation) | | | (46,498 | ) | | | 40,881 | | |
Net Increase (Decrease) in Net Assets Resulting from Operations | | | (92,111 | ) | | | 43,776 | | |
Distributions from and/or in Excess of: | |
Class I: | |
Net Investment Income | | | (18,324 | ) | | | (63,421 | ) | |
Class A: | |
Net Investment Income | | | (8,374 | ) | | | (34,301 | ) | |
Class L: | |
Net Investment Income | | | (11 | ) | | | (186 | ) | |
Class C: | |
Net Investment Income | | | (1 | ) | | | (7 | ) | |
Class IS: | |
Net Investment Income | | | (11,726 | ) | | | (23,788 | ) | |
Total Distributions | | | (38,436 | ) | | | (121,703 | ) | |
Capital Share Transactions:(1) | |
Class I: | |
Subscribed | | | 292,344 | | | | 249,465 | | |
Distributions Reinvested | | | 17,125 | | | | 60,713 | | |
Redeemed | | | (590,802 | ) | | | (821,490 | ) | |
Class A: | |
Subscribed | | | 325,847 | | | | 221,012 | | |
Distributions Reinvested | | | 8,356 | | | | 34,196 | | |
Redeemed | | | (489,120 | ) | | | (441,011 | ) | |
Class L: | |
Exchanged | | | 243 | | | | — | | |
Subscribed | | | — | | | | 1,036 | | |
Distributions Reinvested | | | 10 | | | | 183 | | |
Redeemed | | | (2,032 | ) | | | (1,712 | ) | |
Class C: | |
Subscribed | | | 508 | | | | 524 | * | |
Distributions Reinvested | | | 1 | | | | 7 | * | |
Redeemed | | | (403 | ) | | | (128 | )* | |
Class IS: | |
Subscribed | | | 345,619 | | | | 246,796 | | |
Distributions Reinvested | | | 11,091 | | | | 22,149 | | |
Redeemed | | | (151,013 | ) | | | (90,463 | ) | |
Net Decrease in Net Assets Resulting from Capital Share Transactions | | | (232,226 | ) | | | (518,723 | ) | |
Redemption Fees | | | 16 | | | | 50 | | |
Total Decrease in Net Assets | | | (362,757 | ) | | | (596,600 | ) | |
Net Assets: | |
Beginning of Period | | | 4,324,940 | | | | 4,921,540 | | |
End of Period (Including Accumulated Undistributed Net Investment Income of $29,235 and $9,314) | | $ | 3,962,183 | | | $ | 4,324,940 | | |
The accompanying notes are an integral part of the financial statements.
13
Morgan Stanley Institutional Fund, Inc.
Annual Report — December 31, 2016
International Equity Portfolio
Statements of Changes in Net Assets (cont'd) | | Year Ended
December 31, 2016
(000) | | Year Ended
December 31, 2015
(000) | |
(1) Capital Share Transactions: | |
Class I: | |
Shares Subscribed | | | 19,900 | | | | 15,470 | | |
Shares Issued on Distributions Reinvested | | | 1,182 | | | | 3,885 | | |
Shares Redeemed | | | (40,979 | ) | | | (51,356 | ) | |
Net Decrease in Class I Shares Outstanding | | | (19,897 | ) | | | (32,001 | ) | |
Class A: | |
Shares Subscribed | | | 23,324 | | | | 14,515 | | |
Shares Issued on Distributions Reinvested | | | 584 | | | | 2,210 | | |
Shares Redeemed | | | (34,381 | ) | | | (28,049 | ) | |
Net Decrease in Class A Shares Outstanding | | | (10,473 | ) | | | (11,324 | ) | |
Class L: | |
Shares Exchanged | | | 17 | | | | — | | |
Shares Subscribed | | | — | | | | 65 | | |
Shares Issued on Distributions Reinvested | | | 1 | | | | 12 | | |
Shares Redeemed | | | (141 | ) | | | (109 | ) | |
Net Decrease in Class L Shares Outstanding | | | (123 | ) | | | (32 | ) | |
Class C: | |
Shares Subscribed | | | 36 | | | | 33 | * | |
Shares Issued on Distributions Reinvested | | | — | @@ | | | — | @@* | |
Shares Redeemed | | | (28 | ) | | | (8 | )* | |
Net Increase in Class C Shares Outstanding | | | 8 | | | | 25 | | |
Class IS: | |
Shares Subscribed | | | 24,017 | | | | 15,745 | | |
Shares Issued on Distributions Reinvested | | | 765 | | | | 1,418 | | |
Shares Redeemed | | | (10,253 | ) | | | (5,630 | ) | |
Net Increase in Class IS Shares Outstanding | | | 14,529 | | | | 11,533 | | |
* For period April 30, 2015 through December 31, 2015.
@@ Amount is less than 500 shares.
The accompanying notes are an integral part of the financial statements.
14
Morgan Stanley Institutional Fund, Inc.
Annual Report — December 31, 2016
Financial Highlights
International Equity Portfolio
| | | Class I | |
| | | Year Ended December 31, | |
Selected Per Share Data and Ratios | | 2016(1) | | 2015 | | 2014 | | 2013 | | 2012 | |
Net Asset Value, Beginning of Period | | $ | 15.10 | | | $ | 15.47 | | | $ | 16.98 | | | $ | 14.35 | | | $ | 12.25 | | |
Income (Loss) from Investment Operations: | |
Net Investment Income (2) | | | 0.27 | | | | 0.30 | | | | 0.39 | | | | 0.32 | | | | 0.31 | | |
Net Realized and Unrealized Gain (Loss) | | | (0.57 | ) | | | (0.23 | ) | | | (1.42 | ) | | | 2.59 | | | | 2.09 | | |
Total from Investment Operations | | | (0.30 | ) | | | 0.07 | | | | (1.03 | ) | | | 2.91 | | | | 2.40 | | |
Distributions from and/or in Excess of: | |
Net Investment Income | | | (0.16 | ) | | | (0.44 | ) | | | (0.48 | ) | | | (0.28 | ) | | | (0.30 | ) | |
Redemption Fees | | | 0.00 | (3) | | | 0.00 | (3) | | | 0.00 | (3) | | | 0.00 | (3) | | | 0.00 | (3) | |
Net Asset Value, End of Period | | $ | 14.64 | | | $ | 15.10 | | | $ | 15.47 | | | $ | 16.98 | | | $ | 14.35 | | |
Total Return (4) | | | (2.00 | )% | | | 0.36 | % | | | (6.08 | )% | | | 20.39 | % | | | 19.60 | % | |
Ratios and Supplemental Data: | |
Net Assets, End of Period (Thousands) | | $ | 1,719,699 | | | $ | 2,073,782 | | | $ | 2,620,040 | | | $ | 3,694,164 | | | $ | 3,631,307 | | |
Ratio of Expenses to Average Net Assets (7) | | | 0.95 | %(5) | | | 0.95 | %(5) | | | 0.95 | %(5) | | | 0.94 | %(5) | | | 0.95 | %(5) | |
Ratio of Expenses to Average Net Assets Excluding Non Operating Expenses | | | 0.95 | %(5) | | | 0.95 | %(5) | | | 0.95 | %(5) | | | 0.95 | %(5) | | | N/A | | |
Ratio of Net Investment Income to Average Net Assets (7) | | | 1.86 | %(5) | | | 1.85 | %(5) | | | 2.33 | %(5) | | | 2.04 | %(5) | | | 2.31 | %(5) | |
Ratio of Rebate from Morgan Stanley Affiliates to Average Net Assets | | | 0.00 | %(6) | | | 0.00 | %(6) | | | 0.00 | %(6) | | | 0.00 | %(6) | | | 0.00 | %(6) | |
Portfolio Turnover Rate | | | 33 | % | | | 29 | % | | | 29 | % | | | 29 | % | | | 23 | % | |
(7) Supplemental Information on the Ratios to Average Net Assets: | |
Ratios Before Expense Limitation: | |
Expenses to Average Net Assets | | | 0.98 | % | | | 1.01 | % | | | 1.04 | % | | | 0.99 | % | | | 0.97 | % | |
Net Investment Income to Average Net Assets | | | 1.83 | % | | | 1.79 | % | | | 2.24 | % | | | 1.99 | % | | | 2.29 | % | |
(1) Refer to Note F in the Notes to Financial Statements for discussion of prior period custodian out-of-pocket expenses that were reimbursed in the current period. The amount of the reimbursement was immaterial on a per share basis and did not impact the total return of Class I shares. The Ratio of Expenses to Average Net Assets and the Ratio of Net Investment Income to Average Net Assets would be unchanged as the reimbursement of custodian fees was offset against current period expense waivers/reimbursements with no impact to net expenses or net investment income.
(2) Per share amount is based on average shares outstanding.
(3) Amount is less than $0.005 per share.
(4) Calculated based on the net asset value as of the last business day of the period.
(5) The Ratios of Expenses and Net Investment Income reflect the rebate of certain Portfolio expenses in connection with the investments in Morgan Stanley affiliates during the period. The effect of the rebate on the ratios is disclosed in the above table as "Ratio of Rebate from Morgan Stanley Affiliates to Average Net Assets."
(6) Amount is less than 0.005%.
The accompanying notes are an integral part of the financial statements.
15
Morgan Stanley Institutional Fund, Inc.
Annual Report — December 31, 2016
Financial Highlights
International Equity Portfolio
| | | Class A | |
| | | Year Ended December 31, | |
Selected Per Share Data and Ratios | | 2016(1) | | 2015 | | 2014 | | 2013 | | 2012 | |
Net Asset Value, Beginning of Period | | $ | 14.91 | | | $ | 15.28 | | | $ | 16.78 | | | $ | 14.18 | | | $ | 12.11 | | |
Income (Loss) from Investment Operations: | |
Net Investment Income (2) | | | 0.23 | | | | 0.24 | | | | 0.31 | | | | 0.25 | | | | 0.27 | | |
Net Realized and Unrealized Gain (Loss) | | | (0.58 | ) | | | (0.23 | ) | | | (1.38 | ) | | | 2.59 | | | | 2.07 | | |
Total from Investment Operations | | | (0.35 | ) | | | 0.01 | | | | (1.07 | ) | | | 2.84 | | | | 2.34 | | |
Distributions from and/or in Excess of: | |
Net Investment Income | | | (0.10 | ) | | | (0.38 | ) | | | (0.43 | ) | | | (0.24 | ) | | | (0.27 | ) | |
Redemption Fees | | | 0.00 | (3) | | | 0.00 | (3) | | | 0.00 | (3) | | | 0.00 | (3) | | | 0.00 | (3) | |
Net Asset Value, End of Period | | $ | 14.46 | | | $ | 14.91 | | | $ | 15.28 | | | $ | 16.78 | | | $ | 14.18 | | |
Total Return (4) | | | (2.33 | )% | | | (0.02 | )% | | | (6.43 | )% | | | 20.13 | % | | | 19.31 | % | |
Ratios and Supplemental Data: | |
Net Assets, End of Period (Thousands) | | $ | 1,176,835 | | | $ | 1,369,566 | | | $ | 1,576,475 | | | $ | 1,508,564 | | | $ | 1,012,956 | | |
Ratio of Expenses to Average Net Assets (8) | | | 1.29 | %(5) | | | 1.30 | %(5) | | | 1.30 | %(5) | | | 1.22 | %(5)(6) | | | 1.20 | %(5) | |
Ratio of Expenses to Average Net Assets Excluding Non Operating Expenses | | | 1.29 | %(5) | | | 1.30 | %(5) | | | 1.30 | %(5) | | | 1.22 | %(5)(6) | | | N/A | | |
Ratio of Net Investment Income to Average Net Assets (8) | | | 1.60 | %(5) | | | 1.48 | %(5) | | | 1.89 | %(5) | | | 1.60 | %(5) | | | 2.06 | %(5) | |
Ratio of Rebate from Morgan Stanley Affiliates to Average Net Assets | | | 0.01 | % | | | 0.00 | %(7) | | | 0.00 | %(7) | | | 0.00 | %(7) | | | 0.00 | %(7) | |
Portfolio Turnover Rate | | | 33 | % | | | 29 | % | | | 29 | % | | | 29 | % | | | 23 | % | |
(8) Supplemental Information on the Ratios to Average Net Assets: | |
Ratios Before Expense Limitation: | |
Expenses to Average Net Assets | | | 1.30 | % | | | 1.32 | % | | | 1.34 | % | | | 1.25 | % | | | 1.22 | % | |
Net Investment Income to Average Net Assets | | | 1.59 | % | | | 1.46 | % | | | 1.85 | % | | | 1.57 | % | | | 2.04 | % | |
(1) Refer to Note F in the Notes to Financial Statements for discussion of prior period custodian out-of-pocket expenses that were reimbursed in the current period. The amount of the reimbursement was immaterial on a per share basis and did not impact the total return of Class A shares. The Ratio of Expenses to Average Net Assets would have been less than 0.005% higher and the Ratio of Net Investment Income to Average Net Assets would have been less than 0.005% lower had the custodian not reimbursed the Portfolio.
(2) Per share amount is based on average shares outstanding.
(3) Amount is less than $0.005 per share.
(4) Calculated based on the net asset value which does not reflect sales charges, if applicable, as of the last business day of the period.
(5) The Ratios of Expenses and Net Investment Income reflect the rebate of certain Portfolio expenses in connection with the investments in Morgan Stanley affiliates during the period. The effect of the rebate on the ratios is disclosed in the above table as "Ratio of Rebate from Morgan Stanley Affiliates to Average Net Assets."
(6) Effective September 16, 2013, the Adviser has agreed to limit the ratio of expenses to average net assets to the maximum ratio of 1.30% for Class A shares. Prior to September 16, 2013, the maximum ratio was 1.20% for Class A shares.
(7) Amount is less than 0.005%.
The accompanying notes are an integral part of the financial statements.
16
Morgan Stanley Institutional Fund, Inc.
Annual Report — December 31, 2016
Financial Highlights
International Equity Portfolio
| | | Class L | |
| | | Year Ended December 31, | | Period from
June 14, 2012(2) to | |
Selected Per Share Data and Ratios | | 2016(1) | | 2015 | | 2014 | | 2013 | | December 31, 2012 | |
Net Asset Value, Beginning of Period | | $ | 14.87 | | | $ | 15.23 | | | $ | 16.71 | | | $ | 14.12 | | | $ | 12.36 | | |
Income (Loss) from Investment Operations: | |
Net Investment Income (Loss) (3) | | | 0.16 | | | | 0.15 | | | | 0.24 | | | | 0.19 | | | | (0.07 | ) | |
Net Realized and Unrealized Gain (Loss) | | | (0.58 | ) | | | (0.21 | ) | | | (1.39 | ) | | | 2.55 | | | | 2.11 | | |
Total from Investment Operations | | | (0.42 | ) | | | (0.06 | ) | | | (1.15 | ) | | | 2.74 | | | | 2.04 | | |
Distributions from and/or in Excess of: | |
Net Investment Income | | | (0.02 | ) | | | (0.30 | ) | | | (0.33 | ) | | | (0.15 | ) | | | (0.28 | ) | |
Redemption Fees | | | 0.00 | (4) | | | 0.00 | (4) | | | 0.00 | (4) | | | 0.00 | (4) | | | 0.00 | (4) | |
Net Asset Value, End of Period | | $ | 14.43 | | | $ | 14.87 | | | $ | 15.23 | | | $ | 16.71 | | | $ | 14.12 | | |
Total Return (5) | | | (2.82 | )% | | | (0.47 | )% | | | (6.91 | )% | | | 19.49 | % | | | 16.53 | %(9) | |
Ratios and Supplemental Data: | |
Net Assets, End of Period (Thousands) | | $ | 7,008 | | | $ | 9,053 | | | $ | 9,763 | | | $ | 12,072 | | | $ | 11,982 | | |
Ratio of Expenses to Average Net Assets (11) | | | 1.80 | %(6) | | | 1.80 | %(6) | | | 1.80 | %(6) | | | 1.72 | %(6)(7) | | | 1.70 | %(6)(10) | |
Ratio of Expenses to Average Net Assets Excluding Non Operating Expenses | | | 1.80 | %(6) | | | 1.80 | %(6) | | | 1.80 | %(6) | | | 1.73 | %(6)(7) | | | N/A | | |
Ratio of Net Investment Income (Loss) to Average Net Assets (11) | | | 1.09 | %(6) | | | 0.97 | %(6) | | | 1.48 | %(6) | | | 1.24 | %(6) | | | (0.91 | )%(6)(10) | |
Ratio of Rebate from Morgan Stanley Affiliates to Average Net Assets | | | 0.00 | %(8) | | | 0.00 | %(8) | | | 0.00 | %(8) | | | 0.00 | %(8) | | | 0.00 | %(8)(10) | |
Portfolio Turnover Rate | | | 33 | % | | | 29 | % | | | 29 | % | | | 29 | % | | | 23 | %(9) | |
(11) Supplemental Information on the Ratios to Average Net Assets: | |
Ratios Before Expense Limitation: | |
Expenses to Average Net Assets | | | 1.93 | % | | | 1.89 | % | | | 1.89 | % | | | 1.78 | % | | | 1.70 | %(10) | |
Net Investment Income (Loss) to Average Net Assets | | | 0.96 | % | | | 0.88 | % | | | 1.38 | % | | | 1.18 | % | | | (0.91 | )%(10) | |
(1) Refer to Note F in the Notes to Financial Statements for discussion of prior period custodian out-of-pocket expenses that were reimbursed in the current period. The amount of the reimbursement was immaterial on a per share basis and did not impact the total return of Class L shares. The Ratio of Expenses to Average Net Assets and the Ratio of Net Investment Income to Average Net Assets would be unchanged as the reimbursement of custodian fees was offset against current period expense waivers/reimbursements with no impact to net expenses or net investment income.
(2) Commencement of Offering.
(3) Per share amount is based on average shares outstanding.
(4) Amount is less than $0.005 per share.
(5) Calculated based on the net asset value as of the last business day of the period.
(6) The Ratios of Expenses and Net Investment Income (Loss) reflect the rebate of certain Portfolio expenses in connection with the investments in Morgan Stanley affiliates during the period. The effect of the rebate on the ratios is disclosed in the above table as "Ratio of Rebate from Morgan Stanley Affiliates to Average Net Assets."
(7) Effective September 16, 2013, the Adviser has agreed to limit the ratio of expenses to average net assets to the maximum ratio of 1.80% for Class L shares. Prior to September 16, 2013, the maximum ratio was 1.70% for Class L shares.
(8) Amount is less than 0.005%.
(9) Not Annualized.
(10) Annualized.
The accompanying notes are an integral part of the financial statements.
17
Morgan Stanley Institutional Fund, Inc.
Annual Report — December 31, 2016
Financial Highlights
International Equity Portfolio
| | | Class C | |
Selected Per Share Data and Ratios | | Year Ended
December 31, 2016(1) | | Period from
April 30, 2015(2) to
December 31, 2015 | |
Net Asset Value, Beginning of Period | | $ | 14.77 | | | $ | 16.70 | | |
Income (Loss) from Investment Operations: | |
Net Investment Income (Loss) (3) | | | 0.14 | | | | (0.03 | ) | |
Net Realized and Unrealized Loss | | | (0.58 | ) | | | (1.53 | ) | |
Total from Investment Operations | | | (0.44 | ) | | | (1.56 | ) | |
Distributions from and/or in Excess of: | |
Net Investment Income | | | (0.02 | ) | | | (0.37 | ) | |
Redemption Fees | | | 0.00 | (4) | | | 0.00 | (4) | |
Net Asset Value, End of Period | | $ | 14.31 | | | $ | 14.77 | | |
Total Return (5) | | | (3.01 | )% | | | (9.41 | )%(8) | |
Ratios and Supplemental Data: | |
Net Assets, End of Period (Thousands) | | $ | 476 | | | $ | 372 | | |
Ratio of Expenses to Average Net Assets (10) | | | 2.05 | %(6) | | | 2.05 | %(6)(9) | |
Ratio of Expenses to Average Net Assets Excluding Non Operating Expenses | | | 2.05 | %(6) | | | 2.05 | %(6)(9) | |
Ratio of Net Investment Income (Loss) to Average Net Assets (10) | | | 0.95 | %(6) | | | (0.27 | )%(6)(9) | |
Ratio of Rebate from Morgan Stanley Affiliates to Average Net Assets | | | 0.00 | %(7) | | | 0.00 | %(7)(9) | |
Portfolio Turnover Rate | | | 33 | % | | | 29 | % | |
(10) Supplemental Information on the Ratios to Average Net Assets: | |
Ratios Before Expense Limitation: | |
Expense to Average Net Assets | | | 2.40 | % | | | 2.75 | %(9) | |
Net Investment Income (Loss) to Average Net Assets | | | 0.60 | % | | | (0.97 | )%(9) | |
(1) Refer to Note F in the Notes to Financial Statements for discussion of prior period custodian out-of pocket expenses that were reimbursed in the current period. The amount of the reimbursement was immaterial on a per share basis and did not impact the total return of Class C shares. The Ratio of Expenses to Average Net Assets and the Ratio of Net Investment Income to Average Net Assets would be unchanged as the reimbursement of custodian fees was offset against current period expense waivers/reimbursements with no impact to net expenses or net investment income.
(2) Commencement of Offering.
(3) Per share amount is based on average shares outstanding.
(4) Amount is less than $0.005 per share.
(5) Calculated based on the net asset value which does not reflect sales charges, if applicable, as of the last business day of the period.
(6) The Ratios of Expenses and Net Investment Income (Loss) reflect the rebate of certain Portfolio expenses in connection with the investments in Morgan Stanley affiliates during the period. The effect of the rebate on the ratios is disclosed in the above table as "Ratio of Rebate from Morgan Stanley Affiliates to Average Net Assets."
(7) Amount is less than 0.005%
(8) Not Annualized.
(9) Annualized.
The accompanying notes are an integral part of the financial statements.
18
Morgan Stanley Institutional Fund, Inc.
Annual Report — December 31, 2016
Financial Highlights
International Equity Portfolio
| | | Class IS | |
| | | Year Ended December 31, | | Period from
September 13, 2013(2) to | |
Selected Per Share Data and Ratios | | 2016(1) | | 2015 | | 2014 | | December 31, 2013 | |
Net Asset Value, Beginning of Period | | $ | 15.10 | | | $ | 15.47 | | | $ | 16.98 | | | $ | 16.08 | | |
Income (Loss) from Investment Operations: | |
Net Investment Income (Loss) (3) | | | 0.29 | | | | 0.30 | | | | 0.40 | | | | (0.01 | ) | |
Net Realized and Unrealized Gain (Loss) | | | (0.59 | ) | | | (0.23 | ) | | | (1.43 | ) | | | 1.19 | | |
Total from Investment Operations | | | (0.30 | ) | | | 0.07 | | | | (1.03 | ) | | | 1.18 | | |
Distributions from and/or in Excess of: | |
Net Investment Income | | | (0.16 | ) | | | (0.44 | ) | | | (0.48 | ) | | | (0.28 | ) | |
Redemption Fees | | | 0.00 | (4) | | | 0.00 | (4) | | | 0.00 | (4) | | | 0.00 | (4) | |
Net Asset Value, End of Period | | $ | 14.64 | | | $ | 15.10 | | | $ | 15.47 | | | $ | 16.98 | | |
Total Return (5) | | | (1.95 | )% | | | 0.40 | % | | | (6.07 | )% | | | 7.42 | %(9) | |
Ratios and Supplemental Data: | |
Net Assets, End of Period (Thousands) | | $ | 1,058,165 | | | $ | 872,167 | | | $ | 715,262 | | | $ | 285,253 | | |
Ratio of Expenses to Average Net Assets (11) | | | 0.91 | %(6) | | | 0.91 | %(6) | | | 0.91 | %(6) | | | 0.91 | %(6)(7)(10) | |
Ratio of Expenses to Average Net Assets Excluding Non Operating Expenses | | | 0.91 | %(6) | | | 0.91 | %(6) | | | 0.91 | %(6) | | | 0.91 | %(6)(7)(10) | |
Ratio of Net Investment Income (Loss) to Average Net Assets (11) | | | 1.96 | %(6) | | | 1.84 | %(6) | | | 2.36 | %(6) | | | (0.29 | )%(6)(10) | |
Ratio of Rebate from Morgan Stanley Affiliates to Average Net Assets | | | 0.00 | %(8) | | | 0.00 | %(8) | | | 0.00 | %(8) | | | 0.00 | %(8)(10) | |
Portfolio Turnover Rate | | | 33 | % | | | 29 | % | | | 29 | % | | | 29 | %(9) | |
(11) Supplemental Information on the Ratios to Average Net Assets: | |
Ratios Before Expense Limitation: | |
Expenses to Average Net Assets | | | 0.91 | % | | | 0.91 | % | | | 0.91 | % | | | 0.91 | %(10) | |
Net Investment Income (Loss) to Average Net Assets | | | 1.96 | % | | | 1.84 | % | | | 2.36 | % | | | (0.29 | )%(10) | |
(1) Refer to Note F in the Notes to Financial Statements for discussion of prior period custodian out-of pocket expenses that were reimbursed in the current period. The amount of the reimbursement was immaterial on a per share basis and did not impact the total return of Class IS shares. The Ratio of Expenses to Average Net Assets would have been less than 0.005% higher and the Ratio of Net Investment Income to Average Net Assets would have been less than 0.005% lower had the custodian not reimbursed the Portfolio.
(2) Commencement of Offering.
(3) Per share amount is based on average shares outstanding.
(4) Amount is less than $0.005 per share.
(5) Calculated based on the net asset value as of the last business day of the period.
(6) The Ratios of Expenses and Net Investment Income (Loss) reflect the rebate of certain Portfolio expenses in connection with the investments in Morgan Stanley affiliates during the period. The effect of the rebate on the ratios is disclosed in the above table as "Ratio of Rebate from Morgan Stanley Affiliates to Average Net Assets."
(7) Effective September 16, 2013, the Adviser has agreed to limit the ratio of expenses to average net assets to the maximum ratio of 0.91% for class IS shares.
(8) Amount is less than 0.005%.
(9) Not Annualized.
(10) Annualized.
The accompanying notes are an integral part of the financial statements.
19
Morgan Stanley Institutional Fund, Inc.
Annual Report — December 31, 2016
Notes to Financial Statements
Morgan Stanley Institutional Fund, Inc. (the "Fund") is registered under the Investment Company Act of 1940, as amended (the "Act"), as an open-end management investment company. The Fund is comprised of twenty-nine separate, active, diversified and non-diversified portfolios (individually referred to as a "Portfolio", collectively as the "Portfolios"). The Fund applies investment company accounting and reporting guidance.
The accompanying financial statements relate to the International Equity Portfolio. The Portfolio seeks long-term capital appreciation by investing primarily in equity securities of non-U.S. issuers.
The Portfolio offers five classes of shares — Class I, Class A, Class L, Class C and Class IS. On April 30, 2015, the Portfolio suspended offering of Class L shares. Existing Class L shareholders may invest through reinvestment of dividends and distributions.
A. Significant Accounting Policies: The following significant accounting policies are in conformity with U.S. generally accepted accounting principles ("GAAP"). Such policies are consistently followed by the Fund in the preparation of its financial statements. GAAP may require management to make estimates and assumptions that affect the reported amounts and disclosures in the financial statements. Actual results may differ from those estimates.
1. Security Valuation: (1) An equity portfolio security listed or traded on an exchange is valued at its latest reported sales price (or at the exchange official closing price if such exchange reports an official closing price), and if there were no sales on a given day and if there is no official exchange closing price for that day, the security is valued at the mean between the last reported bid and asked prices if such bid and asked prices are available on the relevant exchanges; (2) all other equity portfolio securities for which over-the-counter ("OTC") market quotations are readily available are valued at the latest reported sales price (or at the market official closing price if such market reports an official closing price), and if there was no trading in the security on a given day and if there is no official closing price from relevant markets for that day, the security is valued at the mean between the last reported bid and asked prices if such bid and asked prices are available on the relevant markets. Listed equity securities not traded on the valuation date with no reported bid and asked prices available on the exchange are valued at the mean between the current bid and asked prices obtained from one or more reputable brokers or dealers. An unlisted equity
security that does not trade on the valuation date and for which bid and asked prices from the relevant markets are unavailable is valued at the mean between the current bid and asked prices obtained from one or more reputable brokers or dealers. In cases where a security is traded on more than one exchange, the security is valued on the exchange designated as the primary market; (3) certain portfolio securities may be valued by an outside pricing service/vendor approved by the Fund's Board of Directors (the "Directors"). The pricing service/vendor may employ a pricing model that takes into account, among other things, bids, yield spreads, and/or other market data and specific security characteristics. Alternatively, if a valuation is not available from an outside pricing service/vendor, and the security trades on an exchange, the security may be valued at its latest reported sale price (or at the exchange official closing price if such exchange reports an official closing price), prior to the time when assets are valued. If there are no sales on a given day and if there is no official exchange closing price for that day, the security is valued at the mean between the last reported bid and asked prices if such bid and asked prices are available in the relevant exchanges; (4) when market quotations are not readily available, including circumstances under which Morgan Stanley Investment Management Inc. (the "Adviser") or Morgan Stanley Investment Management Limited ("MSIM Limited") and Morgan Stanley Investment Management Company ("MSIM Company") (together, the "Sub-Advisers"), each a whole owned subsidiary of Morgan Stanley, determine that the closing price, last sale price or the mean between the last reported bid and asked prices are not reflective of a security's market value, portfolio securities are valued at their fair value as determined in good faith under procedures established by and under the general supervision of the Fund's Board of Directors. Occasionally, developments affecting the closing prices of securities and other assets may occur between the times at which valuations of such securities are determined (that is, close of the foreign market on which the securities trade) and the close of business of the New York Stock Exchange ("NYSE"). If developments occur during such periods that are expected to materially affect the value of such securities, such valuations may be adjusted to reflect the estimated fair value of such securities as of the close of the NYSE, as determined in good faith by the Directors or by the Adviser using a pricing service and/or procedures approved by the Directors; (5) quotations of foreign
20
Morgan Stanley Institutional Fund, Inc.
Annual Report — December 31, 2016
Notes to Financial Statements (cont'd)
portfolio securities, other assets and liabilities and forward contracts stated in foreign currency are translated into U.S. dollar equivalents at the prevailing market rates prior to the close of the NYSE; and (6) investments in mutual funds, including the Morgan Stanley Institutional Liquidity Funds, are valued at the net asset value ("NAV") as of the close of each business day.
The Directors have responsibility for determining in good faith the fair value of the investments, and the Directors may appoint others, such as the Fund's Adviser or a valuation committee, to assist the Directors in determining fair value and to make the actual calculations pursuant to the fair valuation methodologies previously approved by the Directors. Under procedures approved by the Directors, the Fund's Adviser has formed a Valuation Committee whose members are approved by the Directors. The Valuation Committee provides administration and oversight of the Fund's valuation policies and procedures, which are reviewed at least annually by the Directors. These procedures allow the Fund to utilize independent pricing services, quotations from securities and financial instrument dealers, and other market sources to determine fair value.
The Fund has procedures to determine the fair value of securities and other financial instruments for which market prices are not readily available. Under these procedures, the Valuation Committee convenes on a regular and ad hoc basis to review such securities and considers a number of factors, including valuation methodologies and significant unobservable valuation inputs, when arriving at fair value. The Valuation Committee may employ a market-based approach which may use related or comparable assets or liabilities, recent transactions, market multiples, book values, and other relevant information for the investment to determine the fair value of the investment. An income-based valuation approach may also be used in which the anticipated future cash flows of the investment are discounted to calculate fair value. Discounts may also be applied due to the nature or duration of any restrictions on the disposition of the investments. Due to the inherent uncertainty of valuations of such investments, the fair values may differ significantly from the values that would have been used had an active market existed. The Valuation Committee employs various methods for calibrating these valuation approaches including a regular review of valuation methodologies, key inputs and assumptions,
transactional back-testing or disposition analysis, and reviews of any related market activity.
2. Fair Value Measurement: Financial Accounting Standards Board ("FASB") Accounting Standards CodificationTM ("ASC") 820, "Fair Value Measurement" ("ASC 820"), defines fair value as the value that the Fund would receive to sell an investment or pay to transfer a liability in a timely transaction with an independent buyer in the principal market, or in the absence of a principal market, the most advantageous market for the investment or liability. ASC 820 establishes a three-tier hierarchy to distinguish between (1) inputs that reflect the assumptions market participants would use in valuing an asset or liability developed based on market data obtained from sources independent of the reporting entity (observable inputs) and (2) inputs that reflect the reporting entity's own assumptions about the assumptions market participants would use in valuing an asset or liability developed based on the best information available in the circumstances (unobservable inputs) and to establish classification of fair value measurements for disclosure purposes. Various inputs are used in determining the value of the Fund's investments. The inputs are summarized in the three broad levels listed below.
• Level 1 – unadjusted quoted prices in active markets for identical investments
• Level 2 – other significant observable inputs (including quoted prices for similar investments, interest rates, prepayment speeds, credit risk, etc.)
• Level 3 – significant unobservable inputs including the Fund's own assumptions in determining the fair value of investments. Factors considered in making this determination may include, but are not limited to, information obtained by contacting the issuer, analysts, or the appropriate stock exchange (for exchange-traded securities), analysis of the issuer's financial statements or other available documents and, if necessary, available information concerning other securities in similar circumstances
The inputs or methodology used for valuing securities are not necessarily an indication of the risk associated with investing in those securities and the determination of the significance of a particular input to the fair value
21
Morgan Stanley Institutional Fund, Inc.
Annual Report — December 31, 2016
Notes to Financial Statements (cont'd)
measurement in its entirety requires judgment and considers factors specific to each security.
The following is a summary of the inputs used to value the Portfolio's investments as of December 31, 2016.
Investment Type | | Level 1
Unadjusted
quoted
prices
(000) | | Level 2
Other
significant
observable
inputs
(000) | | Level 3
Significant
unobservable
inputs
(000) | | Total
(000) | |
Assets: | |
Common Stocks | |
Aerospace & Defense | | $ | 90,905 | | | $ | — | | | $ | — | | | $ | 90,905 | | |
Auto Components | | | 98,548 | | | | — | | | | — | | | | 98,548 | | |
Automobiles | | | 57,360 | | | | — | | | | — | | | | 57,360 | | |
Banks | | | 126,732 | | | | — | | | | — | | | | 126,732 | | |
Beverages | | | 117,196 | | | | — | | | | — | | | | 117,196 | | |
Chemicals | | | 140,849 | | | | — | | | | — | | | | 140,849 | | |
Construction Materials | | | 55,156 | | | | — | | | | — | | | | 55,156 | | |
Diversified
Telecommunication
Services | | | 97,472 | | | | — | | | | — | | | | 97,472 | | |
Electronic Equipment,
Instruments &
Components | | | 141,305 | | | | — | | | | — | | | | 141,305 | | |
Food Products | | | 119,190 | | | | — | | | | — | | | | 119,190 | | |
Household Products | | | 187,510 | | | | — | | | | — | | | | 187,510 | | |
Insurance | | | 356,555 | | | | — | | | | — | | | | 356,555 | | |
Internet Software &
Services | | | 56,943 | | | | — | | | | — | | | | 56,943 | | |
Machinery | | | 94,715 | | | | — | | | | — | | | | 94,715 | | |
Media | | | 39,210 | | | | — | | | | — | | | | 39,210 | | |
Metals & Mining | | | 107,901 | | | | — | | | | — | | | | 107,901 | | |
Oil, Gas & Consumable
Fuels | | | 89,059 | | | | — | | | | — | | | | 89,059 | | |
Personal Products | | | 444,899 | | | | — | | | | — | | | | 444,899 | | |
Pharmaceuticals | | | 633,834 | | | | — | | | | — | | | | 633,834 | | |
Professional Services | | | 184,521 | | | | — | | | | — | | | | 184,521 | | |
Real Estate
Management &
Development | | | 25,769 | | | | — | | | | — | | | | 25,769 | | |
Semiconductors &
Semiconductor
Equipment | | | 5,242 | | | | — | | | | — | | | | 5,242 | | |
Software | | | 103,604 | | | | — | | | | — | | | | 103,604 | | |
Specialty Retail | | | 22,029 | | | | — | | | | — | | | | 22,029 | | |
Tobacco | | | 327,562 | | | | — | | | | — | | | | 327,562 | | |
Trading Companies &
Distributors | | | 156,679 | | | | — | | | | — | | | | 156,679 | | |
Total Common Stocks | | | 3,880,745 | | | | — | | | | — | | | | 3,880,745 | | |
Short-Term Investments | |
Investment Company | | | 77,597 | | | | — | | | | — | | | | 77,597 | | |
Repurchase Agreements | | | — | | | | 11 | | | | — | | | | 11 | | |
Total Short-Term
Investments | | | 77,597 | | | | 11 | | | | — | | | | 77,608 | | |
Total Assets | | | 3,958,342 | | | | 11 | | | | — | | | | 3,958,353 | | |
Liabilities: | |
Foreign Currency
Forward Exchange
Contract | | | — | | | | (2,306 | ) | | | — | | | | (2,306 | ) | |
Total | | $ | 3,958,342 | | | $ | (2,295 | ) | | $ | — | | | $ | 3,956,047 | | |
Transfers between investment levels may occur as the markets fluctuate and/or the availability of data used in an investment's valuation changes. The Portfolio recognizes transfers between the levels as of the end of the period. As of December 31, 2016, securities with a total value of approximately $3,276,011,000 transferred from Level 2 to Level 1. Securities that were valued using other significant observable inputs at December 31, 2015 were valued using unadjusted quoted prices at December 31, 2016. At December 31, 2015, the fair value of certain securities were adjusted due to developments which occurred between the time of the close of the foreign markets on which they trade and the close of business on the NYSE which resulted in their Level 2 classification.
3. Repurchase Agreements: The Portfolio may enter into repurchase agreements under which the Portfolio lends cash and takes possession of securities with an agreement that the counterparty will repurchase such securities. In connection with transactions in repurchase agreements, a bank as custodian for the Portfolio takes possession of the underlying securities which are held as collateral, with a market value at least equal to the amount of the repurchase transaction, including principal and accrued interest. To the extent that any repurchase transaction exceeds one business day, the value of the collateral is marked-to-market on a daily basis to determine that the value of the collateral does not decrease below the repurchase price plus accrued interest as earned. If such a decrease occurs, additional collateral will be requested and, when received, will be added to the account to maintain full collateralization. In the event of default on the obligation to repurchase, the Portfolio has the right to liquidate the collateral and apply the proceeds in satisfaction of the obligation. In the event of default or bankruptcy by the counterparty to the agreement, realization of the collateral proceeds may be subject to cost and delays. The Portfolio, along with other affiliated investment companies, may utilize a joint trading account for the purpose of entering into repurchase agreements.
4. Foreign Currency Translation and Foreign Investments: The books and records of the Portfolio are maintained in U.S. dollars. Foreign currency amounts are translated into U.S. dollars as follows:
– investments, other assets and liabilities at the prevailing rate of exchange on the valuation date;
– investment transactions and investment income at the prevailing rates of exchange on the dates of such transactions.
22
Morgan Stanley Institutional Fund, Inc.
Annual Report — December 31, 2016
Notes to Financial Statements (cont'd)
Although the net assets of the Portfolio are presented at the foreign exchange rates and market values at the close of the period, the Portfolio does not isolate that portion of the results of operations arising as a result of changes in the foreign exchange rates from the fluctuations arising from changes in the market prices of securities held at period end. Similarly, the Portfolio does not isolate the effect of changes in foreign exchange rates from the fluctuations arising from changes in the market prices of securities sold during the period. Accordingly, realized and unrealized foreign currency gains (losses) on investments in securities are included in the reported net realized and unrealized gains (losses) on investment transactions and balances. However, pursuant to U.S. federal income tax regulations, gains and losses from certain foreign currency transactions and the foreign currency portion of gains and losses realized on sales and maturities of foreign denominated debt securities are treated as ordinary income for U.S. federal income tax purposes.
Net realized gains (losses) on foreign currency transactions represent net foreign exchange gains (losses) from foreign currency forward exchange contracts, disposition of foreign currencies, currency gains (losses) realized between the trade and settlement dates on securities transactions, and the difference between the amount of investment income and foreign withholding taxes recorded on the Portfolio's books and the U.S. dollar equivalent amounts actually received or paid. Net unrealized currency gains (losses) from valuing foreign currency denominated assets and liabilities at period end exchange rates are reflected as a component of unrealized appreciation (depreciation) in the Statement of Assets and Liabilities. The change in unrealized currency gains (losses) on foreign currency translations for the period is reflected in the Statement of Operations.
Foreign security and currency transactions may involve certain considerations and risks not typically associated with those of U.S. dollar denominated transactions as a result of, among other factors, fluctuations of exchange rates in relation to the U.S. dollar, the possibility of lower levels of governmental supervision and regulation of foreign securities markets and the possibility of political or economic instability.
Governmental approval for foreign investments may be required in advance of making an investment under
certain circumstances in some countries, and the extent of foreign investments in domestic companies may be subject to limitation in other countries. Foreign ownership limitations also may be imposed by the charters of individual companies to prevent, among other concerns, violations of foreign investment limitations. As a result, an additional class of shares (identified as "Foreign" in the Portfolio of Investments) may be created and offered for investment. The "local" and "foreign shares" market values may differ. In the absence of trading of the foreign shares in such markets, the Portfolio values the foreign shares at the closing exchange price of the local shares.
5. Derivatives: The Portfolio may, but is not required to, use derivative instruments for a variety of purposes, including hedging, risk management, portfolio management or to earn income. Derivatives are financial instruments whose value is based, in part, on the value of an underlying asset, interest rate, index or financial instrument. Prevailing interest rates and volatility levels, among other things, also affect the value of derivative instruments. A derivative instrument often has risks similar to its underlying asset and may have additional risks, including imperfect correlation between the value of the derivative and the underlying asset, risks of default by the counterparty to certain transactions, magnification of losses incurred due to changes in the market value of the securities, instruments, indices or interest rates to which the derivative instrument relates, risks that the transactions may not be liquid and risks arising from margin requirements. The use of derivatives involves risks that are different from, and possibly greater than, the risks associated with other portfolio investments. Derivatives may involve the use of highly specialized instruments that require investment techniques and risk analyses different from those associated with other portfolio investments. All of the Portfolio's holdings, including derivative instruments, are marked-to-market each day with the change in value reflected in unrealized appreciation (depreciation). Upon disposition, a realized gain or loss is recognized.
Certain derivative transactions may give rise to a form of leverage. Leverage magnifies the potential for gain and the risk of loss. Leverage associated with derivative transactions may cause the Portfolio to liquidate portfolio positions when it may not be advantageous to do so to satisfy its obligations or to meet earmarking or
23
Morgan Stanley Institutional Fund, Inc.
Annual Report — December 31, 2016
Notes to Financial Statements (cont'd)
segregation requirements, pursuant to applicable Securities and Exchange Commission rules and regulations, or may cause the Portfolio to be more volatile than if the Portfolio had not been leveraged. Although the Adviser and/or Sub-Advisers seek to use derivatives to further the Portfolio's investment objectives, there is no assurance that the use of derivatives will achieve this result.
Following is a description of the derivative instruments and techniques that the Portfolio used during the period and their associated risks:
Foreign Currency Forward Exchange Contracts: In connection with its investments in foreign securities, the Portfolio also entered into contracts with banks, brokers or dealers to purchase or sell securities or foreign currencies at a future date. A foreign currency forward exchange contract ("currency contract") is a negotiated agreement between the contracting parties to exchange a specified amount of currency at a specified future time at a specified rate. The rate can be higher or lower than the spot rate between the currencies that are the subject of the contract. Currency contracts may be used to protect against uncertainty in the level of future foreign currency exchange rates or to gain or modify exposure to a particular currency. To the extent hedged by the use of currency contracts, the precise matching of the currency contract amounts and the value of the securities involved will not generally be possible because the future value of such securities in foreign currencies will change as a consequence of market movements in the value of those securities between the date on which the contract is entered into and the date it matures. Furthermore, such transactions may reduce or preclude the opportunity for gain if the value of the currency should move in the direction opposite to the position taken. There is additional risk to the extent that currency contracts create exposure to currencies in which the Portfolio's securities are not denominated. Unanticipated changes in currency prices may result in poorer overall performance for the Portfolio than if it had not entered into such contracts. The use of currency contracts involves the risk of loss from the insolvency or bankruptcy of the counterparty to the contract or the failure of the counterparty to make payments or otherwise comply with the terms of the contract. A currency contract is marked-to-market daily and the change in market value is recorded by the Portfolio as unrealized gain or loss. The Portfolio
records realized gains (losses) when the currency contract is closed equal to the difference between the value of the currency contract at the time it was opened and the value at the time it was closed.
FASB ASC 815, "Derivatives and Hedging" ("ASC 815"), is intended to improve financial reporting about derivative instruments by requiring enhanced disclosures to enable investors to better understand how and why the Portfolio uses derivative instruments, how these derivative instruments are accounted for and their effects on the Portfolio's financial position and results of operations.
The following table sets forth the fair value of the Portfolio's derivative contracts by primary risk exposure as of December 31, 2016.
| | | Liability Derivatives
Statement of Assets and
Liabilities Location | | Primary Risk
Exposure | | Value
(000) | |
Foreign Currency Forward | | Unrealized Depreciation on
Exchange Contract
Exchange Contract | | Foreign Currency Forward
Currency Risk | | $ | (2,306 | ) | |
The following tables set forth by primary risk exposure the Portfolio's realized gains (losses) and change in unrealized appreciation (depreciation) by type of derivative contract for the year ended December 31, 2016 in accordance with ASC 815.
Realized Gain (Loss) | |
Primary Risk Exposure | | Derivative Type | | Value
(000) | |
Currency Risk | | Foreign Currency
Forward Exchange Contracts | | $ | (13,744 | ) | |
Change in Unrealized Appreciation (Depreciation) | |
Primary Risk Exposure | | Derivative Type | | Value
(000) | |
Currency Risk | | Foreign Currency
Forward Exchange Contracts | | $ | 4,097 | | |
At December 31, 2016, the Portfolio's derivative assets and liabilities are as follows:
Gross Amounts of Assets and Liabilities Presented in the
Statement of Assets and Liabilities | |
Derivatives | | Assets(a)
(000) | | Liabilities(a)
(000) | |
Foreign Currency Forward Exchange Contract | | $ | — | | | $ | (2,306 | ) | |
(a) Absent an event of default or early termination, OTC derivative assets and liabilities are presented gross and not offset in the Statement of Assets and Liabilities.
The Portfolio typically enters into International Swaps and Derivatives Association, Inc. Master Agreements ("ISDA Master Agreements") or similar master agreements (collectively, "Master Agreements") with its contract counterparties for certain OTC derivatives in order
24
Morgan Stanley Institutional Fund, Inc.
Annual Report — December 31, 2016
Notes to Financial Statements (cont'd)
to, among other things, reduce its credit risk to counterparties. ISDA Master Agreements include provisions for general obligations, representations, collateral and events of default or termination. Under an ISDA Master Agreement, the Portfolio typically may offset with the counterparty certain OTC derivative financial instruments' payables and/or receivables with collateral held and/or posted and create one single net payment (close-out netting) in the event of default, termination and/or potential deterioration in the credit quality of the counterparty. Various Master Agreements govern the terms of certain transactions with counterparties, including transactions such as swap, forward, repurchase and reverse repurchase agreements. These Master Agreements typically attempt to reduce the counterparty risk associated with such transactions by specifying credit protection mechanisms and providing standardization that improves legal certainty. Cross-termination provisions under Master Agreements typically provide that a default in connection with one transaction between the Portfolio and a counterparty gives the non-defaulting party the right to terminate any other transactions in place with the defaulting party to create one single net payment due to/due from the defaulting party and may be a feature in certain Master Agreements. In the event the Portfolio exercises its right to terminate a Master Agreement after a counterparty experiences a termination event as defined in the Master Agreement, the return of collateral with market value in excess of the Portfolio's net liability may be delayed or denied.
The following table presents derivative financial instruments that are subject to enforceable netting arrangements as of December 31, 2016.
Gross Amounts Not Offset in the Statement of Assets and Liabilities | |
Counterparty | | Gross Liability
Derivatives
Presented in
Statement of
Assets and
Liabilities
(000) | | Financial
Instrument
(000) | | Collateral
Pledged
(000) | | Net
Amount
(not less
than $0)
(000) | |
Commonwealth Bank of Australia | | $ | 2,306 | | | $ | — | | | $ | — | | | $ | 2,306 | | |
For the year ended December 31, 2016, the approximate average monthly amount outstanding for each derivative type is as follows:
Foreign Currency Forward Exchange Contracts: | |
Average monthly principal amount | | $ | 231,171,000 | | |
6. Securities Lending: The Portfolio lends securities to qualified financial institutions, such as broker-dealers, to earn additional income. Any increase or decrease in the fair value of the securities loaned that might occur and any interest earned or dividends declared on those securities during the term of the loan would remain in the Portfolio. The Portfolio would receive cash or securities as collateral in an amount equal to or exceeding 100% of the current fair value of the loaned securities. The collateral is marked-to-market daily by State Street Bank and Trust Company ("State Street"), the securities lending agent, to ensure that a minimum of 100% collateral coverage is maintained.
Based on pre-established guidelines, the securities lending agent invests any cash collateral that is received in an affiliated money market portfolio and repurchase agreements. Securities lending income is generated from the earnings on the invested collateral and borrowing fees, less any rebates owed to the borrowers and compensation to the lending agent, and is recorded as "Income from Securities Loaned — Net" in the Portfolio's Statement of Operations. Risks in securities lending transactions are that a borrower may not provide additional collateral when required or return the securities when due, and that the value of the short-term investments will be less than the amount of cash collateral plus any rebate that is required to be returned to the borrower.
The Portfolio has the right under the lending agreement to recover the securities from the borrower on demand.
The following table presents financial instruments that are subject to enforceable netting arrangements as of December 31, 2016.
Gross Amounts Not Offset in the Statement of Assets and Liabilities | |
Gross Asset
Amounts
Presented in
Statement of
Assets and
Liabilities
(000) | | Financial
Instrument
(000) | | Collateral
Received
(000) | | Net Amount
(not less
than $0)
(000) | |
| $ | 2,320 | (b) | | $ | — | | | $ | (2,320 | )(c)(d) | | $ | 0 | | |
(b) Represents market value of loaned securities at period end.
(c) The Portfolio received cash collateral of approximately $58,000, which was subsequently invested in a Repurchase Agreement and Morgan Stanley Institutional Liquidity Funds as reported in the Portfolio of Investments. As of December 31, 2016, there was uninvested cash of less than $500, which is not reflected in the Portfolio of Investments. In addition, the Portfolio received non-cash collateral of approximately $2,402,000 in the form of U.S. Government agency securities and U.S. Government obligations, which the Portfolio cannot sell or repledge, and accordingly are not reflected in the Portfolio of Investments.
(d) The actual collateral received is greater than the amount shown here due to over-ollateralization.
25
Morgan Stanley Institutional Fund, Inc.
Annual Report — December 31, 2016
Notes to Financial Statements (cont'd)
FASB Accounting Standards Update No. 2014-11 ("ASU No. 2014-11"), "Transfers & Servicing (Topic 860): Repurchase-to-Maturity Transactions, Repurchase Financings, and Disclosures", is intended to provide increased transparency about the types of collateral pledged in securities lending transactions and other similar transactions that are accounted for as secured borrowing.
The following table displays a breakdown of transactions accounted for as secured borrowings, the gross obligations by class of collateral pledged, and the remaining contractual maturity of those transactions as of December 31, 2016.
Remaining Contractual Maturity of the Agreements | |
| | | Overnight and
Continuous
(000) | | <30 days
(000) | | Between
30 &
90 days
(000) | | >90 days
(000) | | Total
(000) | |
Securities Lending
Transactions | |
Common Stocks | | $ | 58 | | | $ | — | | | $ | — | | | $ | — | | | $ | 58 | | |
Total Borrowings | | $ | 58 | | | $ | — | | | $ | — | | | $ | — | | | $ | 58 | | |
Gross amount of
recognized liabilities
for securities lending
transactions | | | | | | | | | | $ | 58 | | |
7. Redemption Fees: The Portfolio will assess a 2% redemption fee on Class I shares, Class A shares, Class L shares, Class C shares and Class IS shares, which is paid directly to the Portfolio, for shares redeemed or exchanged within thirty days of purchase, subject to certain exceptions. The redemption fee is designed to protect the Portfolio and its remaining shareholders from the effects of short-term trading. These fees, if any, are included in the Statements of Changes in Net Assets.
8. Indemnifications: The Fund enters into contracts that contain a variety of indemnifications. The Fund's maximum exposure under these arrangements is unknown. However, the Fund has not had prior claims or losses pursuant to these contracts and expects the risk of loss to be remote.
9. Dividends and Distributions to Shareholders: Dividend income and distributions to shareholders are recorded on the ex-dividend date. Dividends from net investment income, if any, are declared and paid annually. Net realized capital gains, if any, are distributed at least annually.
10. Security Transactions, Income and Expenses: Security transactions are accounted for on the trade date
(date the order to buy or sell is executed). Realized gains and losses on the sale of investment securities are determined on the specific identified cost method. Dividend income and other distributions are recorded on the ex-dividend date (except for certain foreign dividends which may be recorded as soon as the Portfolio is informed of such dividends) net of applicable withholding taxes. Interest income is recognized on the accrual basis except where collection is in doubt. Discounts are accreted and premiums are amortized over the life of the respective securities. Most expenses of the Fund can be directly attributed to a particular Portfolio. Expenses which cannot be directly attributed are apportioned among the Portfolios based upon relative net assets or other appropriate methods. Income, expenses (other than class specific expenses — distribution and shareholder services, transfer agency and sub transfer agency fees) and realized and unrealized gains or losses are allocated to each class of shares based upon their relative net assets.
B. Advisory/Sub-Advisory Fees: The Adviser, a wholly-owned subsidiary of Morgan Stanley, provides the Portfolio with advisory services under the terms of an Investment Advisory Agreement, paid quarterly, at the annual rate based on the daily net assets as follows:
First $10
billion | | Over $10
billion | |
| | 0.80 | % | | | 0.75 | % | |
For the year ended December 31, 2016, the advisory fee rate (net of waivers/rebate) was equivalent to an annual effective rate of 0.80% of the Portfolio's average daily net assets.
The Adviser has agreed to reduce its advisory fee and/or reimburse the Portfolio so that total annual portfolio operating expenses, excluding certain investment related expenses, taxes, interest and other extraordinary expenses (including litigation), will not exceed 0.95% for Class I shares, 1.30% for Class A shares, 1.80% for Class L shares, 2.05% for Class C shares and 0.91% for Class IS shares. The fee waivers and/or expense reimbursements will continue for at least one year from the date of the Portfolio's prospectus or until such time as the Directors act to discontinue all or a portion of such waivers and/or reimbursements when they deem such action is appropriate. For the year ended December 31, 2016, approximately $529,000 of other expenses were reimbursed by the Adviser pursuant to this arrangement.
The Adviser has entered into a Sub-Advisory Agreement with the Sub-Advisers, each a wholly-owned subsidiary of Morgan
26
Morgan Stanley Institutional Fund, Inc.
Annual Report — December 31, 2016
Notes to Financial Statements (cont'd)
Stanley. The Sub-Advisers provide the Portfolio with advisory services subject to the overall supervision of the Adviser and the Fund's Officers and Directors. The Adviser pays the Sub-Advisers on a monthly basis a portion of the net advisory fees the Adviser receives from the Portfolio.
C. Administration Fees: The Adviser also serves as Administrator to the Fund and provides administrative services pursuant to an Administration Agreement for an annual fee, accrued daily and paid monthly, of 0.08% of the Portfolio's average daily net assets.
Under a Sub-Administration Agreement between the Administrator and State Street, State Street provides certain administrative services to the Fund. For such services, the Administrator pays State Street a portion of the fee the Administrator receives from the Portfolio.
D. Distribution and Shareholder Services Fees: Morgan Stanley Distribution, Inc. ("MSDI" or the "Distributor"), a wholly-owned subsidiary of the Adviser and Sub-Advisers and an indirect subsidiary of Morgan Stanley, serves as the Fund's Distributor of Portfolio shares pursuant to a Distribution Agreement. The Fund has adopted a Shareholder Services Plan with respect to Class A shares pursuant to Rule 12b-1 under the Act. Under the Shareholder Services Plan, the Portfolio pays the Distributor a shareholder services fee, accrued daily and paid monthly, at an annual rate of 0.25% of the Portfolio's average daily net assets attributable to Class A shares.
The Fund has adopted a Distribution and Shareholder Services Plan with respect to Class L shares pursuant to Rule 12b-1 under the Act. Under the Distribution and Shareholder Services Plan, the Portfolio pays the Distributor a distribution fee, accrued daily and paid monthly, at an annual rate of 0.50% and a shareholder services fee, accrued daily and paid monthly, at an annual rate of 0.25% of the Portfolio's average daily net assets attributable to Class L shares.
The Fund has adopted a Distribution and Shareholder Services Plan with respect to Class C shares pursuant to Rule 12b-1 under the Act. Under the Distribution and Shareholder Services Plan, the Portfolio pays the Distributor a distribution fee, accrued daily and paid monthly, at an annual rate of 0.75% and a shareholder services fee, accrued daily and paid monthly, at an annual rate of 0.25% of the Portfolio's average daily net assets attributable to Class C shares.
The distribution and shareholder services fees are used to support the expenses associated with servicing and maintaining accounts. The Distributor may compensate other parties for
providing shareholder support services to investors who purchase Class A, Class L and Class C shares.
E. Dividend Disbursing and Transfer Agent: The Fund's dividend disbursing and transfer agent is Boston Financial Data Services, Inc. ("BFDS"). Pursuant to a Transfer Agency Agreement, the Fund pays BFDS a fee based on the number of classes, accounts and transactions relating to the Portfolios of the Fund.
F. Custodian Fees: State Street (the "Custodian") serves as Custodian for the Fund in accordance with a Custodian Agreement. The Custodian holds cash, securities, and other assets of the Fund as required by the Act. Custody fees are payable monthly based on assets held in custody, investment purchases and sales activity and account maintenance fees, plus reimbursement for certain out-of-pocket expenses.
In December 2015, the Fund's Custodian announced that it had identified inconsistencies in the way in which clients were invoiced for out-of-pocket expenses from 1998 until November 2015. The dollar amount difference between what was charged and what should have been charged, plus interest, was paid back to the Portfolio in September 2016 as a reimbursement. The Custodian reimbursed the Portfolio directly, which was recognized as a change in accounting estimate and was reflected as "Reimbursement of Custodian Fees" in the Statement of Operations. Pursuant to the expense limitations described in Note B, the Portfolio has experienced expenses reimbursed by the Adviser during the current period. Accordingly, the reimbursement of out-of-pocket custodian expenses in the current period resulted in the reduction in the current period expenses reimbursed by the Adviser.
G. Security Transactions and Transactions with Affiliates: For the year ended December 31, 2016, purchases and sales of investment securities for the Portfolio, other than long-term U.S. Government securities and short-term investments, were approximately $1,360,346,000 and $1,446,242,000, respectively. There were no purchases and sales of long-term U.S. Government securities for the year ended December 31, 2016.
The Portfolio invests in the Institutional Class of the Morgan Stanley Institutional Liquidity Funds — Treasury Securities Portfolio (the "Liquidity Funds"), an open-end management investment company managed by the Adviser, both directly and as a portion of the securities held as collateral on loaned securities. Advisory fees paid by the Portfolio are reduced by an amount equal to its pro-rata share of the advisory and
27
Morgan Stanley Institutional Fund, Inc.
Annual Report — December 31, 2016
Notes to Financial Statements (cont'd)
administration fees paid by the Portfolio due to its investment in the Liquidity Funds. For the year ended December 31, 2016, advisory fees paid were reduced by approximately $127,000 relating to the Portfolio's investment in the Liquidity Funds.
A summary of the Portfolio's transactions in shares of the Liquidity Funds during the year ended December 31, 2016 is as follows:
Value
December 31,
2015
(000) | | Purchases
at Cost
(000) | | Sales
(000) | | Dividend
Income
(000) | | Value
December 31,
2016
(000) | |
| $ | 114,192 | | | $ | 918,587 | | | $ | 955,182 | | | $ | 146 | | | $ | 77,597 | | |
The Portfolio is permitted to purchase and sell securities ("cross-trade") from and to other Morgan Stanley Funds as well as other funds and client accounts for which the Adviser or an affiliate of the Adviser serves as investment adviser, pursuant to procedures approved by the Directors in compliance with Rule 17a-7 under the Act (the "Rule"). Each cross-trade is executed at the current market price in compliance with provisions of the Rule. For the year ended December 31, 2016, the Portfolio did not engage in any cross-trade transactions.
The Portfolio has an unfunded Deferred Compensation Plan (the "Compensation Plan"), which allows each independent Director to defer payment of all, or a portion, of the fees he or she receives for serving on the Board of Directors. Each eligible Director generally may elect to have the deferred amounts credited with a return equal to the total return on one or more of the Morgan Stanley funds that are offered as investment options under the Compensation Plan. Appreciation/depreciation and distributions received from these investments are recorded with an offsetting increase/decrease in the deferred compensation obligation and do not affect the NAV of the Portfolio.
H. Federal Income Taxes: It is the Portfolio's intention to continue to qualify as a regulated investment company and distribute all of its taxable and tax-exempt income. Accordingly, no provision for federal income taxes is required in the financial statements.
The Portfolio may be subject to taxes imposed by countries in which it invests. Such taxes are generally based on income and/or capital gains earned or repatriated. Taxes are accrued based on net investment income, net realized gains and net unrealized appreciation as such income and/or gains are earned or repatriated. Taxes are accrued based on net investment income, net realized gains and net unrealized appreciation as such
income and/or gains are earned. Taxes may also be based on transactions in foreign currency and are accrued based on the value of investments denominated in such currency.
FASB ASC 740-10, "Income Taxes — Overall", sets forth a minimum threshold for financial statement recognition of the benefit of a tax position taken or expected to be taken in a tax return. Management has concluded that there are no significant uncertain tax positions that would require recognition in the financial statements. If applicable, the Portfolio recognizes interest accrued related to unrecognized tax benefits in "Interest Expense" and penalties in "Other Expenses" in the Statement of Operations. The Portfolio files tax returns with the U.S. Internal Revenue Service, New York and various states. Generally, each of the tax years in the four-year period ended December 31, 2016, remains subject to examination by taxing authorities.
The tax character of distributions paid may differ from the character of distributions shown in the Statements of Changes in Net Assets due to short-term capital gains being treated as ordinary income for tax purposes. The tax character of distributions paid during fiscal years 2016 and 2015 was as follows:
2016
Distributions
Paid From: | | 2015
Distributions
Paid From: | |
Ordinary
Income
(000) | | Long-Term
Capital Gain
(000) | | Ordinary
Income
(000) | | Long-Term
Capital Gain
(000) | |
| $ | 38,436 | | | $ | — | | | $ | 121,703 | | | $ | — | | |
The amount and character of income and gains to be distributed are determined in accordance with income tax regulations which may differ from GAAP. These book/tax differences are either considered temporary or permanent in nature.
Temporary differences are primarily due to differing book and tax treatments in the timing of the recognition of gains (losses) on certain investment transactions and the timing of the deductibility of certain expenses.
Permanent differences, primarily due to differing treatments of gains (losses) related to foreign currency transactions, basis adjustments on certain equity securities designated as passive foreign investment companies and an expired capital loss carryforward, resulted in the following reclassifications among the components of net assets at December 31, 2016:
Accumulated
Undistributed
Net Investment
Income
(000) | | Accumulated
Net Realized
Loss
(000) | | Paid-in-
Capital
(000) | |
| $ | (16,774 | ) | | $ | 26,775 | | | $ | (10,001 | ) | |
28
Morgan Stanley Institutional Fund, Inc.
Annual Report — December 31, 2016
Notes to Financial Statements (cont'd)
At December 31, 2016, the components of distributable earnings for the Portfolio on a tax basis were as follows:
Undistributed
Ordinary
Income
(000) | | Undistributed
Long-Term
Capital Gain
(000) | |
| $ | 27,240 | | | $ | — | | |
At December 31, 2016, the Portfolio had available for federal income tax purposes unused short-term capital losses of approximately $11,439,000 and long-term capital losses of approximately $177,592,000 that do not have an expiration date.
In addition, at December 31, 2016, the Portfolio had available for federal income tax purposes unused capital losses which will expire on the indicated dates:
Amount
(000) | | Expiration* | |
| $ | 8,116 | | | December 31, 2017 | |
* Includes capital losses acquired from Morgan Stanley International Value Equity Fund that may be subject to limitation under IRC section 382 in future years, reducing the total carryforwad available.
During the year ended December 31, 2016, capital loss carryforwards of approximately $10,001,000 expired for federal income tax purposes.
To the extent that capital loss carryforwards are used to offset any future capital gains realized during the carryover period as provided by U.S. federal income tax regulations, no capital gains tax liability will be incurred by the Portfolio for gains realized and not distributed. To the extent that capital gains are offset, such gains will not be distributed to the shareholders.
I. Credit Facility: As of April 4, 2016, the Fund and other Morgan Stanley funds participated in a $150,000,000 committed, unsecured revolving line of credit facility (the "facility") with State Street. This facility is to be used for temporary emergency purposes or funding of shareholder redemption requests. The interest rate on borrowings is based on the federal funds rate or one month libor rate plus a spread. The facility also has a commitment fee of 0.25% per annum based on the unused portion of the facility. During the year ended December 31, 2016, the Portfolio did not have any borrowings under the facility.
J. Other: At December 31, 2016, the Portfolio had record owners of 10% or greater. Investment activities of these shareholders could have a material impact on the Portfolio. The aggregate percentage of such owners was 41.7%.
K. Accounting Pronouncements: In December 2016, FASB issued Accounting Standards update 2016-19 — Technical Corrections and Improvements ("ASU 2016-19"), which is effective for interim periods for all entities beginning after December 15, 2016. ASU 2016-19 includes an amendment to Topic 820, Fair Value Measurement, which clarifies the difference between a valuation approach and a valuation technique when applying the guidance in that Topic. That amendment also requires an entity to disclose when there has been a change in either or both a valuation approach and/or a valuation technique. The transition guidance for the amendment must be applied prospectively because it could potentially involve the use of hindsight that includes fair value measurements. Although still evaluating the potential impacts of ASU 2016-19 to the Portfolio, management expects that the impact of the Portfolio's adoption will be limited to additional financial statement disclosures.
In October 2016, the Securities and Exchange Commission ("SEC") issued a new rule, Investment Company Reporting Modernization, which, among other provisions, amends Regulation S-X to require standardized, enhanced disclosures, particularly related to derivatives, in investment company financial statements. Compliance with the guidance is effective for financial statements filed with the SEC on or after August 1, 2017; adoption will have no effect on the Portfolio's net assets or results of operations. Although still evaluating the potential impacts of the Investment Company Reporting Modernization to the Portfolio, management expects that the impact of the Portfolio's adoption will be limited to additional financial statement disclosures.
29
Morgan Stanley Institutional Fund, Inc.
Annual Report — December 31, 2016
Report of Independent Registered Public Accounting Firm
To the Shareholders and Board of Directors of
Morgan Stanley Institutional Fund, Inc. —
International Equity Portfolio
We have audited the accompanying statement of assets and liabilities, including the portfolio of investments, of International Equity Portfolio (one of the portfolios constituting Morgan Stanley Institutional Fund, Inc.) (the "Portfolio") as of December 31, 2016 and the related statement of operations for the year then ended, the statements of changes in net assets for each of the two years in the period then ended and the financial highlights for each of the years or periods indicated therein. These financial statements and financial highlights are the responsibility of the Portfolio's management. Our responsibility is to express an opinion on these financial statements and financial highlights based on our audits.
We conducted our audits in accordance with the standards of the Public Company Accounting Oversight Board (United States). Those standards require that we plan and perform the audit to obtain reasonable assurance about whether the financial statements and financial highlights are free of material misstatement. We were not engaged to perform an audit of the Portfolio's internal control over financial reporting. Our audits included consideration of internal control over financial reporting as a basis for designing audit procedures that are appropriate in the circumstances, but not for the purpose of expressing an opinion on the effectiveness of the Portfolio's internal control over financial reporting. Accordingly, we express no such opinion. An audit also includes examining, on a test basis, evidence supporting the amounts and disclosures in the financial statements and financial highlights, assessing the accounting principles used and significant estimates made by management, and evaluating the overall financial statement presentation. Our procedures included confirmation of securities owned as of December 31, 2016, by correspondence with the custodian and others or by other appropriate auditing procedures where replies from others were not received. We believe that our audits provide a reasonable basis for our opinion.
In our opinion, the financial statements and financial highlights referred to above present fairly, in all material respects, the financial position of International Equity Portfolio (one of the portfolios constituting Morgan Stanley Institutional Fund, Inc.) at December 31, 2016, the results of its operations for the year then ended, the changes in its net assets for each of the two years in the period then ended and the financial highlights for each of the years or periods indicated therein, in conformity with U.S. generally accepted accounting principles.

Boston, Massachusetts
February 28, 2017
30
Morgan Stanley Institutional Fund, Inc.
Annual Report — December 31, 2016
Federal Tax Notice (unaudited)
For federal income tax purposes, the following information is furnished with respect to the Portfolio's earnings for the taxable year ended December 31, 2016.
When distributed, certain earnings may be subject to a maximum tax rate of 15% as provided for the Jobs and Growth Tax Relief Reconciliation Act of 2003. The Portfolio designated up to a maximum of approximately $45,169,000 as taxable at this lower rate.
The Portfolio intends to pass through foreign tax credits of approximately $6,733,000, and has derived net income from sources within foreign countries amounting to approximately $125,274,000.
In January, the Portfolio provides tax information to shareholders for the preceding calendar year.
31
Morgan Stanley Institutional Fund, Inc.
Annual Report — December 31, 2016
Privacy Notice (unaudited)
MORGAN STANLEY INVESTMENT MANAGEMENT INC.
AN IMPORTANT NOTICE CONCERNING OUR U.S. PRIVACY POLICY
We are required by federal law to provide you with a copy of our privacy policy annually. This policy applies to current and former individual investors in funds managed or sponsored by Morgan Stanley Investment Management Inc. ("MSIM") as well as current and former individual clients of MSIM. This policy is not applicable to partnerships, corporations, trusts or other non-individual clients or investors. Please note that we may amend this policy at any time, and will inform you of any changes as required by law.
WE RESPECT YOUR PRIVACY
We appreciate that you have provided us with your personal financial information. We strive to maintain the privacy of such information while we help you achieve your financial objectives. This Notice describes what non-public personal information we collect about you, why we collect it, when we may share it with others and how certain others may use it. It discusses the steps you may take to limit our sharing of certain information about you to affiliated companies in the Morgan Stanley family of companies ("other Morgan Stanley companies"). It also discloses how you may limit use of certain shared information for marketing purposes by other Morgan Stanley branded companies. Throughout this policy, we refer to the non-public information that personally identifies you or your accounts as "personal information.''
1. WHAT PERSONAL INFORMATION DO WE COLLECT ABOUT YOU?
We obtain personal information from applications and other forms you submit to us, from your dealings with us, from consumer reporting agencies, from our Web sites and from third parties and other sources.
For example:
• We may collect information such as your name, address, e-mail address, telephone/fax numbers, assets, income and investment objectives through subscription documents, applications and other forms you submit to us.
• We may obtain information about account balances, your use of account(s) and the types of products and services you prefer to receive from us through your dealings and transactions with us and other sources.
• We may obtain information about your creditworthiness and credit history from consumer reporting agencies.
• We may collect background information from and through third-party vendors to verify representations you have made and to comply with various regulatory requirements.
• If you interact with us through our public and private Web sites, we may collect information that you provide directly through online communications (such as an e-mail address). We may also collect information about your Internet service provider, your domain name, your computer's operating system and Web browser, your use of our Web sites and your product and service preferences, through the use of "cookies." Please consult the Terms of Use of these sites for more details.
2. WHEN DO WE DISCLOSE PERSONAL INFORMATION WE COLLECT ABOUT YOU?
We may disclose personal information we collect about you to other Morgan Stanley companies and to non-affiliated third parties.
a. Information We Disclose to Other Morgan Stanley Companies.
We may disclose personal information to other Morgan Stanley companies for a variety of reasons, including to manage your account(s) effectively, to service and process your transactions, to let you know about products and services offered by us and other Morgan Stanley companies, to manage our business, and as otherwise required or permitted by law. Offers for products and services from other Morgan Stanley companies are developed under conditions designed to safeguard your personal information.
32
Morgan Stanley Institutional Fund, Inc.
Annual Report — December 31, 2016
Privacy Notice (unaudited) (cont'd)
b. Information We Disclose to Non-affiliated Third Parties.
We do not disclose personal information that we collect about you to non-affiliated third parties except to those who provide marketing services on our behalf, to financial institutions with whom we have joint marketing agreements, and as otherwise required or permitted by law. For example, we may disclose personal information to nonaffiliated third parties for servicing and processing transactions, to offer our own products and services, to protect against fraud, for institutional risk control, to respond to judicial process or to perform services on our behalf. When we share personal information with a non-affiliated third party, they are required to limit their use of personal information to the particular purpose for which it was shared and they are not allowed to share personal information with others except to fulfill that limited purpose or as may be permitted or required by law.
3. HOW DO WE PROTECT THE SECURITY AND CONFIDENTIALITY OF PERSONAL INFORMATION WE COLLECT ABOUT YOU?
We maintain physical, electronic and procedural security measures to help safeguard the personal information we collect about you. We have internal policies governing the proper handling of client information. Third parties that provide support or marketing services on our behalf may also receive personal information, and we require them to adhere to confidentiality standards with respect to such information.
4. HOW CAN YOU LIMIT THE SHARING OF CERTAIN TYPES OF PERSONAL INFORMATION WITH OTHER MORGAN STANLEY COMPANIES?
We offer you choices as to whether we share with other Morgan Stanley companies the personal information that was collected to determine your eligibility for products and services you request ("eligibility information"). Eligibility information does not include your identification information or personal information pertaining to our transactions or experiences with you. Please note that, even if you direct us not to share eligibility information with other Morgan Stanley companies ("opt-out"), we may still share personal information, including eligibility information, with those companies in circumstances excluded from the opt-out under applicable law, such as to process transactions or to service your account.
5. HOW CAN YOU LIMIT THE USE OF CERTAIN TYPES OF PERSONAL INFORMATION BY OTHER MORGAN STANLEY COMPANIES FOR MARKETING?
By following the opt-out instructions in Section 6 below, you may limit other Morgan Stanley branded companies from marketing their products or services to you based on personal information we disclose to them. This information may include, for example, your income and account history with us. Please note that, even if you choose to limit Other Morgan Stanley Companies from using personal information about you that we may share with them for marketing their products and services to you, Other Morgan Stanley Companies may use your personal information that they obtain from us to market to you in circumstances permitted by law, such as if the Other Morgan Stanley Company has its own relationship with you.
6. HOW CAN YOU SEND US AN OPT-OUT INSTRUCTION?
If you wish to limit our sharing of eligibility information about you with other Morgan Stanley companies or other Morgan Stanley companies' use of personal information for marketing purposes, as described in this notice, you may do so by:
• Calling us at (800) 548-7786
Monday–Friday between 8a.m. and 6p.m.(EST)
• Writing to us at the following address:
Boston Financial Data Services, Inc.
c/o Privacy Coordinator
P.O. Box 219804
Kansas City, Missouri 64121
33
Morgan Stanley Institutional Fund, Inc.
Annual Report — December 31, 2016
Privacy Notice (unaudited) (cont'd)
Your written request should include your name, address, telephone number and account number(s) to which the opt-out applies and whether you are opting out with respect to sharing of eligibility information (Section 4 above), or if information used for Marketing (Section 5 above) or both. Written opt-out requests should not be sent with any other correspondence. In order to process your request, we require that the request be provided by you directly and not through a third party.
Your opt-out preference will remain in effect with respect to this policy (as it may be amended) until you notify us otherwise. If you have a joint account, your direction for us not to share this information with other Morgan Stanley companies and for those other Morgan Stanley companies not to use your personal information for marketing will be applied to all account holders on that account. Please understand that if you limit our sharing or our affiliated companies' use of personal information, you and any joint account holder(s) may not receive information about Morgan Stanley products and services, including products or services that could help you manage your financial resources and achieve your investment objectives.
7. WHAT IF AN AFFILIATED COMPANY BECOMES A NON-AFFILIATED THIRD PARTY?
If, at any time in the future, an affiliated company becomes a non-affiliated third party, further disclosures of personal information made to the former affiliated company will be limited to those described in Section 2(b) above relating to non-affiliated third parties. If you elected under Section 6 to limit disclosures we make to affiliated companies, or use of personal information by affiliated companies, your election will not apply to use by any former affiliated company of your personal information in their possession once it becomes a non-affiliated third party.
SPECIAL NOTICE TO RESIDENTS OF VERMONT
The following section supplements our policy with respect to our individual clients who have a Vermont address and supersedes anything to the contrary in the above policy with respect to those clients only.
The state of Vermont requires financial institutions to obtain your consent prior to sharing personal information that they collect about you with affiliated companies and non-affiliated third parties other than in certain limited circumstances. Except as permitted by law, we will not share personal information we collect about you with non-affiliated third parties or other Morgan Stanley companies unless you provide us with your written consent to share such information ("opt-in").
If you wish to receive offers for investment products and services offered by or through other Morgan Stanley companies, please notify us in writing at the following address:
Boston Financial Data Services, Inc.
c/o Privacy Coordinator
P.O. Box 219804
Kansas City, Missouri 64121
Your authorization should include your name, address, telephone number and account number(s) to which the opt-in applies and should not be sent with any other correspondence. In order to process your authorization, we require that the authorization be provided by you directly and not through a third party.
SPECIAL NOTICE TO RESIDENTS OF CALIFORNIA
The following section supplements our policy with respect to our individual clients who have a California address and supersedes anything to the contrary in the above policy with respect to those clients only.
In response to a California law, if your account has a California home address, your personal information will not be disclosed to nonaffiliated third parties except as permitted by applicable California law, and we will limit sharing such information with our affiliates to comply with California privacy laws that apply to us.
34
Morgan Stanley Institutional Fund, Inc.
Annual Report — December 31, 2016
Director and Officer Information (unaudited)
Independent Directors:
Name, Age and Address of
Independent Director | | Position(s)
Held with
Registrant | | Length of Time
Served* | | Principal Occupation(s) During Past 5 Years
and Other Relevant Professional Experience | | Number of
Portfolios in
Fund Complex
Overseen by
Independent
Director** | | Other Directorships
Held by Independent
Director*** | |
Frank L. Bowman (72)
c/o Perkins Coie LLP
Counsel to the Independent
Directors
30 Rockefeller Plaza
New York, NY 10112 | | Director | | Since
August
2006 | | President, Strategic Decisions, LLC (consulting) (since February 2009); Director or Trustee of various Morgan Stanley Funds (since August 2006); Chairperson of the Compliance and Insurance Committee (since October 2015); formerly, Chairperson of the Insurance Sub-Committee of the Compliance and Insurance Committee (2007-2015); served as President and Chief Executive Officer of the Nuclear Energy Institute (policy organization) (February 2005-November 2008); retired as Admiral, U.S. Navy after serving over 38 years on active duty including 8 years as Director of the Naval Nuclear Propulsion Program in the Department of the Navy and the U.S. Department of Energy (1996-2004); served as Chief of Naval Personnel (July 1994-September 1996) and on the Joint Staff as Director of Political Military Affairs (June 1992-July 1994); knighted as Honorary Knight Commander of the Most Excellent Order of the British Empire; awarded the Officier de l'Orde National du Mérite by the French Government; elected to the National Academy of Engineering (2009). | | | 90 | | | Director of BP p.l.c.; Director of Naval and Nuclear Technologies LLP; Director Emeritus of the Armed Services YMCA; Director of the U.S. Naval Submarine League; Member of the National Security Advisory Council of the Center for U.S. Global Engagement and a member of the CNA Military Advisory Board; Chairman of the charity J Street Cup Golf; Trustee of Fairhaven United Methodist Church; and Director of other various non-profit organizations. | |
Kathleen A. Dennis (63)
c/o Perkins Coie LLP
Counsel to the Independent Directors
30 Rockefeller Plaza
New York, NY 10112 | | Director | | Since
August
2006 | | President, Cedarwood Associates (mutual fund and investment management consulting) (since July 2006); Chairperson of the Liquidity and Alternatives Sub-Committee of the Investment Committee (since October 2006) and Director or Trustee of various Morgan Stanley Funds (since August 2006); formerly, Senior Managing Director of Victory Capital Management (1993-2006). | | | 91 | | | Director of various non-profit organizations. | |
Nancy C. Everett (61)
c/o Perkins Coie LLP
Counsel to the Independent Directors
30 Rockefeller Plaza
New York, NY 10112 | | Director | | Since
January
2015 | | Chief Executive Officer, Virginia Commonwealth University Investment Company (since November 2015); Owner, OBIR, LLC (institutional investment management consulting) (since June 2014); formerly, Managing Director, BlackRock Inc. (February 2011-December 2013); and Chief Executive Officer, General Motors Asset Management (a/k/a Promark Global Advisors, Inc.) (June 2005-May 2010). | | | 91 | | | Member of Virginia Commonwealth University School of Business Foundation; formerly, Member of Virginia Commonwealth University Board of Visitors (2013-2015); Member of Committee on Directors for Emerging Markets Growth Fund, Inc. (2007-2010); Chairperson of Performance Equity Management, LLC (2006-2010); and Chairperson, GMAM Absolute Return Strategies Fund, LLC (2006-2010). | |
35
Morgan Stanley Institutional Fund, Inc.
Annual Report — December 31, 2016
Director and Officer Information (unaudited) (cont'd)
Independent Directors: (cont'd)
Name, Age and Address of
Independent Director | | Position(s)
Held with
Registrant | | Length of Time
Served* | | Principal Occupation(s) During Past 5 Years
and Other Relevant Professional Experience | | Number of
Portfolios in
Fund Complex
Overseen by
Independent
Director** | | Other Directorships
Held by Independent
Director*** | |
Jakki L. Haussler (59)
c/o Perkins Coie LLP
Counsel to the Independent Directors
30 Rockefeller Plaza
New York, NY 10112 | | Director | | Since
January
2015 | | Chairman and Chief Executive Officer, Opus Capital Group (since January 1996); formerly, Director, Capvest Venture Fund, LP (May 2000-December 2011); Partner, Adena Ventures, LP (July 1999-December 2010); Director, The Victory Funds (February 2005-July 2008). | | | 91 | | | Director of Cincinnati Bell Inc. and Member, Audit Committee and Compensation Committee; Director of Northern Kentucky University Foundation and Member, Investment Committee; Member of Chase College of Law Transactional Law Practice Center Board of Advisors; Director of Best Transport; Director of Chase College of Law Board of Visitors; formerly, Member, University of Cincinnati Foundation Investment Committee; Member, Miami University Board of Visitors (2008-2011); Trustee of Victory Funds (2005-2008) and Chairman, Investment Committee (2007-2008) and Member, Service Provider Committee (2005-2008). | |
Dr. Manuel H. Johnson (67)
c/o Johnson Smick
International, Inc.
220 I Street, N.E. — Suite 200
Washington, D.C. 20002 | | Director | | Since
July
1991 | | Senior Partner, Johnson Smick International, Inc. (consulting firm); Chairperson of the Investment Committee (since October 2006) and Director or Trustee of various Morgan Stanley Funds (since July 1991); Co-Chairman and a founder of the Group of Seven Council (G7C) (international economic commission); formerly, Chairperson of the Audit Committee (July 1991-September 2006), Vice Chairman of the Board of Governors of the Federal Reserve System and Assistant Secretary of the U.S. Treasury. | | | 91 | | | Director of NVR, Inc. (home construction). | |
Joseph J. Kearns (74)
c/o Kearns & Associates LLC
46 E Peninsula Center #385
Rolling Hills Estates, CA 90274-3712 | | Director | | Since
August
1994 | | President, Kearns & Associates LLC (investment consulting); Chairperson of the Audit Committee (since October 2006) and Director or Trustee of various Morgan Stanley Funds (since August 1994); formerly, Deputy Chairperson of the Audit Committee (July 2003-September 2006) and Chairperson of the Audit Committee of various Morgan Stanley Funds (since August 1994); CFO of the J. Paul Getty Trust. | | | 93 | | | Director of Electro Rent Corporation (equipment leasing). Prior to December 31, 2013, Director of The Ford Family Foundation. | |
36
Morgan Stanley Institutional Fund, Inc.
Annual Report — December 31, 2016
Director and Officer Information (unaudited) (cont'd)
Independent Directors: (cont'd)
Name, Age and Address of
Independent Director | | Position(s)
Held with
Registrant | | Length of Time
Served* | | Principal Occupation(s) During Past 5 Years
and Other Relevant Professional Experience | | Number of
Portfolios in
Fund Complex
Overseen by
Independent
Director** | | Other Directorships
Held by Independent
Director*** | |
Michael F. Klein (58)
c/o Perkins Coie LLP
Counsel to the Independent Directors
30 Rockefeller Plaza
New York, NY 10112 | | Director | | Since
August
2006 | | Managing Director, Aetos Capital, LLC (since March 2000); Co-President, Aetos Alternatives Management, LLC (since January 2004) and Co-Chief Executive Officer of Aetos Capital LLC (since August 2013); Chairperson of the Fixed Income Sub-Committee of the Investment Committee (since October 2006) and Director or Trustee of various Morgan Stanley Funds (since August 2006); formerly, Managing Director, Morgan Stanley & Co. Inc. and Morgan Stanley Dean Witter Investment Management, President, various Morgan Stanley Funds (June 1998-March 2000) and Principal, Morgan Stanley & Co. Inc. and Morgan Stanley Dean Witter Investment Management (August 1997-December 1999). | | | 90 | | | Director of certain investment funds managed or sponsored by Aetos Capital, LLC; Director of Sanitized AG and Sanitized Marketing AG (specialty chemicals). | |
Patricia Maleski (56)
c/o Perkins Coie LLP
Counsel to the Independent Directors
30 Rockefeller Plaza
New York, NY 10112 | | Director | | Since
January
2017 | | Management Director, JPMorgan Asset Management (2013-2016); President, JPMorgan Funds (2010-2013), Chief Administrative Officer, JPMorgan Funds (2004-2010), Treasurer, JPMorgan Funds (2003-2004, 2008-2010), and Vice President and Board Liaison, JPMorgan Funds (2001-2004); Managing Director, J.P. Morgan Investment Management Inc. (2001-2013); Vice President of Finance, Pierpont Group (1996-2001); Vice President, Bank of New York (1995-1996); Senior Audit Manager, Price Waterhouse, LLP (1982-1995). | | | 91 | | | None. | |
Michael E. Nugent (80)
522 Fifth Avenue
New York, NY 10036 | | Chair of the Board and Director | | Chair of the Boards since July 2006 and Director since July 1991 | | Chair of the Boards of various Morgan Stanley Funds (since July 2006); Chairperson of the Closed-End Fund Committee (since June 2012) and Director or Trustee of various Morgan Stanley Funds (since July 1991); formerly, Chairperson of the Insurance Committee (until July 2006); General Partner, Triumph Capital, L.P. (private investment partnership) (1988-2013). | | | 92 | | | None. | |
W. Allen Reed (69)
c/o Perkins Coie LLP
Counsel to the Independent Directors
30 Rockefeller Plaza
New York, NY 10112 | | Director | | Since
August
2006 | | Chairperson of the Equity Sub-Committee of the Investment Committee (since October 2006) and Director or Trustee of various Morgan Stanley Funds (since August 2006); formerly, President and CEO of General Motors Asset Management; Chairman and Chief Executive Officer of the GM Trust Bank and Corporate Vice President of General Motors Corporation (August 1994-December 2005). | | | 91 | | | Director of Legg Mason, Inc.; formerly, Director of the Auburn University Foundation (2010-2015). | |
Fergus Reid (84)
c/o Joe Pietryka, Inc.
85 Charles Colman Blvd.
Pawling, NY 12564 | | Director | | Since
June
1992 | | Chairman, Joe Pietryka, Inc.; Chairperson of the Governance Committee and Director or Trustee of various Morgan Stanley Funds (since June 1992). | | | 92 | | | Formerly, Trustee and Director of certain investment companies in the JP Morgan Fund Complex managed by JP Morgan Investment Management Inc. (1987-2012). | |
* This is the earliest date the Director began serving the Morgan Stanley Funds. Each Director serves an indefinite term, until his or her successor is elected.
** The Fund Complex includes (as of December 31, 2016) all open-end and closed-end funds (including all of their portfolios) advised by Morgan Stanley Investment Management Inc. (the "Adviser") and any funds that have an adviser that is an affiliated person of the Adviser (including, but not limited to, Morgan Stanley AIP GP LP).
*** This includes any directorships at public companies and registered investment companies held by the Director at any time during the past five years.
37
Morgan Stanley Institutional Fund, Inc.
Annual Report — December 31, 2016
Director and Officer Information (unaudited) (cont'd)
Executive Officers:
Name, Age and Address of Executive Officer | | Position(s) Held
with
Registrant | | Length of Time
Served* | | Principal Occupation(s) During Past 5 Years | |
John H. Gernon (53)
522 Fifth Avenue
New York, NY 10036 | | President and Principal Executive Officer | | Since
September
2013 | | President and Principal Executive Officer of the Equity and Fixed Income Funds and the Morgan Stanley AIP Funds (since September 2013) and the Liquidity Funds and various money market funds (since May 2014) in the Fund Complex; Managing Director of the Adviser; Head of Product (since 2006). | |
Timothy J. Knierim (58)
522 Fifth Avenue
New York, NY 10036 | | Chief Compliance Officer | | Since
December
2016 | | Managing Director of the Adviser and various entities affiliated with the Adviser; Chief Compliance Officer of various Morgan Stanley Funds and the Adviser (since December 2016) and Chief Compliance Officer of Morgan Stanley AIP GP LP (since 2014). Formerly, Managing Director and Deputy Chief Compliance Officer of the Adviser (2014-2016); and formerly, Chief Compliance Officer of Prudential Investment Management, Inc. (2007-2014). | |
Francis J. Smith (51)
522 Fifth Avenue
New York, NY 10036 | | Treasurer and Principal Financial Officer | | Treasurer since July 2003 and Principal Financial Officer since September 2002 | | Managing Director of the Adviser and various entities affiliated with the Adviser; Treasurer (since July 2003) and Principal Financial Officer of various Morgan Stanley Funds (since September 2002). | |
Mary E. Mullin (49)
522 Fifth Avenue
New York, NY 10036 | | Secretary | | Since
June
1999 | | Executive Director of the Adviser; Secretary of various Morgan Stanley Funds (since June 1999). | |
* This is the earliest date the officer began serving the Morgan Stanley Funds. Each officer serves a one-year term, until his or her successor is elected and qualifies.
38
Morgan Stanley Institutional Fund, Inc.
Annual Report — December 31, 2016
Adviser and Administrator
Morgan Stanley Investment Management Inc.
522 Fifth Avenue
New York, New York 10036
Sub-Advisers
Morgan Stanley Investment Management Limited
25 Cabot Square, Canary Wharf
London, E14 4QA, England
Morgan Stanley Investment Management Company
23 Church Street
16-01 Capital Square, Singapore 049481
Distributor
Morgan Stanley Distribution, Inc.
522 Fifth Avenue
New York, New York 10036
Dividend Disbursing and Transfer Agent
Boston Financial Data Services, Inc.
2000 Crown Colony Drive
Quincy, Massachusetts 02169
Custodian
State Street Bank and Trust Company
One Lincoln Street
Boston, Massachusetts 02111
Legal Counsel
Dechert LLP
1095 Avenue of the Americas
New York, New York 10036
Counsel to the Independent Directors
Perkins Coie LLP
30 Rockefeller Plaza
New York, New York 10112
Independent Registered Public Accounting Firm
Ernst & Young LLP
200 Clarendon Street
Boston, Massachusetts 02116
Reporting to Shareholders
Each Morgan Stanley fund provides a complete schedule of portfolio holdings in its semi-annual and annual reports within 60 days of the end of the fund's second and fourth fiscal quarters. The semi-annual and annual reports are filed electronically with the Securities and Exchange Commission (SEC) on Form N-CSRS and Form N-CSR, respectively. Morgan Stanley also delivers the semi-annual and annual reports to fund shareholders and makes these reports available on its public website, www.morganstanley.com/im. Each Morgan Stanley fund also files a complete schedule of portfolio holdings with the SEC for the fund's first and third fiscal quarters on Form N-Q. Morgan Stanley does not deliver the reports for the first and third fiscal quarters to shareholders, nor are the reports posted to the Morgan Stanley public website. You may, however, obtain the Form N-Q filings (as well as the Form N-CSR and N-CSRS filings) by accessing the SEC's website, www.sec.gov. You may also review and copy them at the SEC's Public Reference Room in Washington, DC. Information on the operation of the SEC's Public Reference Room may be obtained by calling the SEC toll free at 1 (800) SEC-0330. You can also request copies of these materials, upon payment of a duplicating fee, by electronic request at the SEC's email address (publicinfo@sec.gov) or by writing the Public Reference Room of the SEC, 100 F Street, NE, Washington, DC 20549-0102.
Proxy Voting Policies and Procedures and Proxy Voting Record
You may obtain a copy of the Fund's Proxy Voting Policy and Procedures and information regarding how the Fund voted proxies relating to portfolio securities during the most recent twelve-month period ended June 30, without charge, upon request, by calling toll free 1 (800) 548-7786 or by visiting our website at www.morganstanley.com/im. This information is also available on the SEC's website at www.sec.gov.
This report is authorized for distribution only when preceded or accompanied by a prospectus or summary prospectus of the applicable Portfolio of Morgan Stanley Institutional Fund, Inc., which describes in detail the Portfolio's investment policies, risks, fees and expenses. Please read the prospectus carefully before you invest or send money. For additional information, including information regarding the investments comprising the Portfolio, please visit our website at www.morganstanley.com/im or call toll free 1 (800) 548-7786.
39
(This Page has been left blank intentionally.)
(This Page has been left blank intentionally.)
Printed in U.S.A.
This Report has been prepared for shareholders and may be distributed to others only if preceded or accompanied by a current prospectus.
Morgan Stanley Investment Management Inc.
522 Fifth Avenue
New York, New York 10036
© 2017 Morgan Stanley. Morgan Stanley Distribution, Inc.

IFIIEANN
1695770 EXP. 02.28.18

Morgan Stanley Institutional Fund, Inc.
International Opportunity Portfolio
Annual Report
December 31, 2016

Morgan Stanley Institutional Fund, Inc.
Annual Report — December 31, 2016
Shareholders' Letter | | | 2 | | |
Expense Example | | | 3 | | |
Investment Overview | | | 4 | | |
Portfolio of Investments | | | 6 | | |
Statement of Assets and Liabilities | | | 8 | | |
Statement of Operations | | | 10 | | |
Statements of Changes in Net Assets | | | 11 | | |
Financial Highlights | | | 13 | | |
Notes to Financial Statements | | | 18 | | |
Report of Independent Registered Public Accounting Firm | | | 29 | | |
Federal Tax Notice | | | 30 | | |
Privacy Notice | | | 31 | | |
Director and Officer Information | | | 34 | | |
This report is authorized for distribution only when preceded or accompanied by a prospectus or summary prospectus of the applicable Portfolio of Morgan Stanley Institutional Fund, Inc. To receive a prospectus and/or statement of additional information (SAI), which contains more complete information such as investment objectives, charges, expenses, policies for voting proxies, risk considerations, and describes in detail each of the Portfolio's investment policies to the prospective investor, please call toll free 1 (800) 548-7786. Please read the prospectuses carefully before you invest or send money.
Additionally, you can access information about the Portfolio, including performance, characteristics, and investment team commentary, through Morgan Stanley Investment Management's website: www.morganstanley.com/im.
Market forecasts provided in this report may not necessarily come to pass. There is no guarantee that any sectors mentioned will continue to perform as discussed herein or that securities in such sectors will be held by the Portfolio in the future. There is no assurance that a Portfolio will achieve its investment objective. Portfolios are subject to market risk, which is the possibility that market values of securities owned by the Portfolio will decline and, therefore, the value of the Portfolio's shares may be less than what you paid for them. Accordingly, you can lose money investing in this Portfolio. Please see the prospectus for more complete information on investment risks.
1
Morgan Stanley Institutional Fund, Inc.
Annual Report — December 31, 2016
Shareholders' Letter (unaudited)
Dear Shareholders,
We are pleased to provide this Annual report, in which you will learn how your investment in International Opportunity Portfolio (the "Portfolio") performed during the latest twelve-month period.
Morgan Stanley Investment Management is a client-centric, investor-led organization. Our global presence, intellectual capital, and breadth of products and services enable us to partner with investors to meet the evolving challenges of today's financial markets. We aim to deliver superior investment service and to empower our clients to make the informed decisions that help them reach their investment goals.
As always, we thank you for selecting Morgan Stanley Investment Management, and look forward to working with you in the months and years ahead.
Sincerely,

John H. Gernon
President and Principal Executive Officer
January 2017
2
Morgan Stanley Institutional Fund, Inc.
Annual Report — December 31, 2016
Expense Example (unaudited)
International Opportunity Portfolio
As a shareholder of the Portfolio, you incur two types of costs: (1) transactional costs, including redemption fees; and (2) ongoing costs, which may include advisory fees, administration fees, distribution and shareholder services fees and other Portfolio expenses. This example is intended to help you understand your ongoing costs (in dollars) of investing in the Portfolio and to compare these costs with the ongoing costs of investing in other mutual funds.
This example is based on an investment of $1,000 invested at the beginning of the six-month period ended December 31, 2016 and held for the entire six-month period.
Actual Expenses
The table below provides information about actual account values and actual expenses. You may use the information in this table, together with the amount you invested, to estimate the expenses that you paid over the period. Simply divide your account value by $1,000 (for example, an $8,600 account value divided by $1,000 = 8.6), then multiply the result by the number in the table under the heading entitled "Actual Expenses Paid During Period" to estimate the expenses you paid on your account during this period.
Hypothetical Example for Comparison Purposes
The table below provides information about hypothetical account values and hypothetical expenses based on the Portfolio's actual expense ratio and an assumed rate of return of 5% per year before expenses, which is not the Portfolio's actual return. The hypothetical account values and expenses may not be used to estimate the actual ending account balance or expenses you paid for the period. You may use this information to compare the ongoing costs of investing in the Portfolio and other funds. To do so, compare this 5% hypothetical example with the 5% hypothetical examples that appear in the shareholder reports of the other funds.
Please note that the expenses shown in the table are meant to highlight your ongoing costs only and do not reflect any transactional costs, such as sales charges (loads) and redemption fees. Therefore, the information for each class in the table is useful in comparing ongoing costs only, and will not help you determine the relative total costs of owning different funds. In addition, if these transactional costs were included, your costs would have been higher.
| | | Beginning
Account
Value
7/1/16 | | Actual Ending
Account
Value
12/31/16 | | Hypothetical
Ending Account
Value | | Actual
Expenses
Paid
During
Period* | | Hypothetical
Expenses Paid
During Period* | | Net
Expense
Ratio
During
Period** | |
International Opportunity Portfolio Class I | | $ | 1,000.00 | | | $ | 1,016.50 | | | $ | 1,020.01 | | | $ | 5.17 | | | $ | 5.18 | | | | 1.02 | %*** | |
International Opportunity Portfolio Class A | | | 1,000.00 | | | | 1,014.40 | | | | 1,018.10 | | | | 7.09 | | | | 7.10 | | | | 1.40 | *** | |
International Opportunity Portfolio Class L | | | 1,000.00 | | | | 1,012.60 | | | | 1,015.89 | | | | 9.31 | | | | 9.32 | | | | 1.84 | *** | |
International Opportunity Portfolio Class C | | | 1,000.00 | | | | 1,012.00 | | | | 1,014.58 | | | | 10.62 | | | | 10.63 | | | | 2.10 | *** | |
International Opportunity Portfolio Class IS | | | 1,000.00 | | | | 1,016.60 | | | | 1,020.46 | | | | 4.71 | | | | 4.72 | | | | 0.93 | *** | |
* Expenses are calculated using each Portfolio Class' annualized net expense ratio (as disclosed), multiplied by the average account value over the period, and multiplied by 184/366 (to reflect the most recent one-half year period).
** Annualized.
*** Refer to Note F in the Notes to Financial Statements for discussion of prior period custodian out-of-pocket expenses that were reimbursed in the current period.
3
Morgan Stanley Institutional Fund, Inc.
Annual Report — December 31, 2016
Investment Overview (unaudited)
International Opportunity Portfolio
The Portfolio seeks long-term capital appreciation.
Performance
For the year ended December 31, 2016, the Portfolio's Class I shares had a total return based on net asset value and reinvestment of distributions per share of –0.65%, net of fees. The Portfolio's Class I shares underperformed the Portfolio's benchmark, the MSCI All Country World ex USA Index (the "Index"), which returned 4.50%.
Factors Affecting Performance
• International equities rose 4.50% for the 12-month period, as measured by the Index. The Index was led by commodity-driven markets, including Brazil, Russia and Canada, while Japan and Europe lagged. Early in the year, worries about weak global growth and disinflation drove share prices lower. However, sentiment brightened as commodity prices bottomed, China's economy stabilized, the U.S. economy strengthened and global central banks remained accommodative. In the second half of the year, equity markets largely shrugged off the Brexit referendum's surprise outcome, and the unexpected election of Donald Trump was broadly supportive for equities as investors anticipated a pro-growth, reflationary policy scenario from the new administration.
• The Portfolio underperformed the Index for the period overall, due to unfavorable stock selection and sector allocation.
• Detractors from relative performance were stock selection in the information technology and health care sectors. Underweight allocations to the energy and materials sectors, along with an overweight to the consumer staples sector, were also disadvantageous to relative results.
• Stock selection in the consumer discretionary sector contributed positively to relative performance. The Portfolio also benefited from an overweight to information technology and underweights to health care, telecommunication services and utilities.
Management Strategies
• There were no changes to our bottom-up investment process during the period. The Growth Team seeks high quality companies, which we define primarily as those with sustainable
competitive advantages. Our team continues to focus on bottom-up stock selection and the long-term outlook for companies owned in the portfolio; accordingly, we have had very limited turnover in the portfolio to date, as our ongoing work reaffirms our assessment of quality and competitive advantage in the names we own.
• At the close of the period, consumer discretionary represented the largest sector weight in the Portfolio, followed by information technology and consumer staples. The team's bottom-up investment process resulted in sector overweight positions in consumer discretionary, information technology and consumer staples, and underweight positions in financials, materials, energy, industrials, telecommunication services, health care, real estate and utilities.

* Minimum Investment for Class I shares
** Commenced Operations on March 31, 2010.
In accordance with SEC regulations, the Portfolio's performance shown assumes that all recurring fees (including management fees) were deducted and all dividends and distributions were reinvested. The performance of Class A, L, C and IS shares will vary from the performance of Class I shares based upon their different inception dates and will be impacted by additional fees assessed to those classes (if applicable).
4
Morgan Stanley Institutional Fund, Inc.
Annual Report — December 31, 2016
Investment Overview (unaudited) (cont'd)
International Opportunity Portfolio
Performance Compared to the MSCI All Country World ex USA Index.(1) and the Lipper International Multi-Cap Growth Funds Index(2)
| | | Period Ended December 31, 2016
Total Returns(3) | |
| | | | | Average Annual | |
| | | One
Year | | Five
Years | | Ten
Years | | Since
Inception(7) | |
Portfolio — Class I Shares
w/o sales charges(4) | | | –0.65 | % | | | 9.64 | % | | | — | | | | 8.35 | % | |
Portfolio — Class A Shares
w/o sales charges(4) | | | –1.00 | | | | 9.28 | | | | — | | | | 8.01 | | |
Portfolio — Class A Shares with
maximum 5.25% sales charges(4) | | | –6.21 | | | | 8.10 | | | | — | | | | 7.16 | | |
Portfolio — Class L Shares
w/o sales charges(4) | | | –1.50 | | | | 8.72 | | | | — | | | | 7.47 | | |
Portfolio — Class C Shares
w/o sales charges(6) | | | –1.71 | | | | — | | | | — | | | | –2.13 | | |
Portfolio — Class C Shares with
maximum 1.00% deferred
sales charges(6) | | | –2.69 | | | | — | | | | — | | | | –2.13 | | |
Portfolio — Class IS Shares
w/o sales charges(5) | | | –0.64 | | | | — | | | | — | | | | 7.46 | | |
MSCI All Country World
ex USA Index | | | 4.50 | | | | 5.00 | | | | — | | | | 2.80 | | |
Lipper International Multi-Cap
Growth Funds Index | | | 0.08 | | | | 6.02 | | | | — | | | | 3.72 | | |
Performance data quoted represents past performance, which is no guarantee of future results, and current performance may be lower or higher than the figures shown. Performance assumes that all dividends and distributions, if any, were reinvested. For the most recent month-end performance figures, please visit www.morganstanley.com/im. Investment return and principal value will fluctuate so that Portfolio shares, when redeemed, may be worth more or less than their original cost. Total returns do not reflect the deduction of taxes that a shareholder would pay on Portfolio distributions or the redemption of Portfolio shares. Performance of share classes will vary due to difference in sales charges and expenses.
(1) The MSCI All Country World ex USA Index is a free float-adjusted market capitalization weighted index designed to measure the equity market performance of developed and emerging markets, excluding the United States. The term "free float" represents the portion of shares outstanding that are deemed to be available for purchase in the public equity markets by investors. The Index is unmanaged and its returns do not include any sales charges or fees. Such costs would lower performance. It is not possible to invest directly in an index.
(2) The Lipper International Multi-Cap Growth Funds Index is an equally weighted performance index of the largest qualifying funds (based on net assets) in the Lipper International Multi-Cap Growth Funds classification. The Index, which is adjusted for capital gains distributions and income dividends, is unmanaged and should not be considered an investment. There are currently 30 funds represented in this Index. As of the date of this report, the Portfolio was in the Lipper International Multi-Cap Growth Funds classification.
(3) Total returns for the Portfolio reflect fees waived and expenses reimbursed, if applicable, by the Adviser. Without such waivers and reimbursements, total returns would have been lower.
(4) Commenced operations on March 31, 2010.
(5) Commenced offering on September 13, 2013.
(6) Commenced offering on April 30, 2015.
(7) For comparative purposes, average annual since inception returns listed for the Indexes refer to the inception date of Class I of the Portfolio, not the inception of the Index.
5
Morgan Stanley Institutional Fund, Inc.
Annual Report — December 31, 2016
Portfolio of Investments
International Opportunity Portfolio
| | | Shares | | Value
(000) | |
Common Stocks (88.9%) | |
Australia (0.0%) | |
AET&D Holdings No. 1 Ltd. (a)(b)(c) | | | 16,699 | | | $ | — | | |
Belgium (2.1%) | |
Anheuser-Busch InBev N.V. | | | 15,042 | | | | 1,592 | | |
Canada (1.4%) | |
Brookfield Asset Management, Inc., Class A | | | 32,337 | | | | 1,067 | | |
China (18.6%) | |
Alibaba Group Holding Ltd. ADR (a) | | | 12,899 | | | | 1,133 | | |
China Resources Beer Holdings
Company Ltd. (a)(d) | | | 1,050,666 | | | | 2,086 | | |
Foshan Haitian Flavouring & Food Co., Ltd.,
Class A | | | 340,900 | | | | 1,439 | | |
Jiangsu Hengrui Medicine Co., Ltd., Class A | | | 253,738 | | | | 1,661 | | |
TAL Education Group ADR (a) | | | 71,577 | | | | 5,021 | | |
Tencent Holdings Ltd. (d) | | | 124,500 | | | | 3,046 | | |
| | | | 14,386 | | |
Denmark (5.6%) | |
DSV A/S | | | 97,426 | | | | 4,334 | | |
France (8.1%) | |
Christian Dior SE | | | 13,390 | | | | 2,808 | | |
Hermes International | | | 8,418 | | | | 3,456 | | |
| | | | 6,264 | | |
Germany (1.7%) | |
Adidas AG | | | 8,254 | | | | 1,305 | | |
Hong Kong (1.7%) | |
AIA Group Ltd. | | | 237,000 | | | | 1,337 | | |
India (1.7%) | |
HDFC Bank Ltd. ADR | | | 22,091 | | | | 1,341 | | |
Japan (5.0%) | |
Calbee, Inc. | | | 76,900 | | | | 2,408 | | |
Keyence Corp. | | | 2,100 | | | | 1,441 | | |
| | | | 3,849 | | |
Korea, Republic of (5.9%) | |
Amorepacific Corp. | | | 5,527 | | | | 1,471 | | |
Loen Entertainment, Inc. (a)(e) | | | 16,845 | | | | 1,059 | | |
Medy-Tox, Inc. | | | 3,699 | | | | 1,092 | | |
Osstem Implant Co., Ltd. (a) | | | 18,447 | | | | 927 | | |
| | | | 4,549 | | |
Netherlands (4.3%) | |
Priceline Group, Inc. (The) (a) | | | 2,263 | | | | 3,318 | | |
South Africa (2.7%) | |
Naspers Ltd., Class N | | | 14,279 | | | | 2,094 | | |
Switzerland (1.4%) | |
Nestle SA (Registered) | | | 15,121 | | | | 1,085 | | |
United Kingdom (12.9%) | |
Burberry Group PLC | | | 110,769 | | | | 2,044 | | |
Fevertree Drinks PLC | | | 164,301 | | | | 2,306 | | |
Hargreaves Lansdown PLC | | | 89,488 | | | | 1,338 | | |
Just Eat PLC (a) | | | 234,893 | | | | 1,689 | | |
Reckitt Benckiser Group PLC | | | 30,971 | | | | 2,628 | | |
| | | | 10,005 | | |
| | | Shares | | Value
(000) | |
United States (15.8%) | |
Cognizant Technology Solutions Corp., Class A (a) | | | 50,347 | | | $ | 2,821 | | |
EPAM Systems, Inc. (a) | | | 67,651 | | | | 4,350 | | |
Globant SA (a) | | | 42,032 | | | | 1,402 | | |
Luxoft Holding, Inc. (a) | | | 64,694 | | | | 3,636 | | |
| | | | 12,209 | | |
Total Common Stocks (Cost $66,017) | | | 68,735 | | |
Preferred Stock (0.1%) | |
India (0.1%) | |
Flipkart Online Services Pvt Ltd. Series D (a)(b)(c)(f)
(acquisition cost — $36; acquired 10/4/13)
(Cost $36) | | | 1,590 | | | | 80 | | |
Participation Notes (4.0%) | |
China (4.0%) | |
Jiangsu Yanghe Brewery, Class A,
Equity Linked Notes, expires 1/23/17 (a) | | | 151,200 | | | | 1,536 | | |
Suofeiya Home Collection Co., Ltd.,
Equity Linked Notes, expires 4/25/17 (a) | | | 200,900 | | | | 1,566 | | |
Total Participation Notes (Cost $3,234) | | | 3,102 | | |
| | | Notional
Amount
(000) | | | |
Call Option Purchased (0.1%) | |
Foreign Currency Option (0.1%) | |
USD/CNY May 2017 @ CNY 7.90,
Royal Bank of Scotland (Cost $39) | | | 9,421 | | | | 35 | | |
| | | Shares | | | |
Short-Term Investment (6.9%) | |
Investment Company (6.9%) | |
Morgan Stanley Institutional Liquidity
Funds — Treasury Securities Portfolio —
Institutional Class (See Note G)
(Cost $5,351) | | | 5,350,513 | | | | 5,351 | | |
Total Investments (100.0%) (Cost $74,677)
Including $503 of Securities Loaned (g) | | | 77,303 | | |
Liabilities in Excess of Other Assets (0.0%) | | | (23 | ) | |
Net Assets (100.0%) | | $ | 77,280 | | |
Country assignments and aggregations are based generally on third party vendor classifications and information, and may be different from the assignments and aggregations under the policies set forth in the Portfolio's prospectus and/or statement of additional information relating to geographic classifications.
(a) Non-income producing security.
(b) Security has been deemed illiquid at December 31, 2016.
(c) At December 31, 2016, the Portfolio held fair valued securities valued at approximately $80,000, representing 0.1% of net assets. These securities have been fair valued as determined in good faith under procedures established by and under the general supervision of the Fund's Directors.
(d) Security trades on the Hong Kong exchange.
(e) All or a portion of this security was on loan at December 31, 2016.
The accompanying notes are an integral part of the financial statements.
6
Morgan Stanley Institutional Fund, Inc.
Annual Report — December 31, 2016
Portfolio of Investments (cont'd)
International Opportunity Portfolio
(f) Security cannot be offered for public resale without first being registered under the Securities Act of 1933 and related rules ("restricted security"). Acquisition date represents the day on which an enforceable right to acquire such security is obtained and is presented along with related cost in the security description. The Portfolio has registration rights for certain restricted securities. Any costs related to such registration are borne by the issuer. The aggregate value of restricted securities (excluding 144A holdings) at December 31, 2016, amounts to approximately $80,000 and represents 0.1% of net assets.
(g) At December 31, 2016, the aggregate cost for federal income tax purposes is approximately $74,796,000. The aggregate gross unrealized appreciation is approximately $6,443,000 and the aggregate gross unrealized depreciation is approximately $3,936,000, resulting in net unrealized appreciation of approximately $2,507,000.
ADR American Depositary Receipt.
CNY Chinese Yuan Renminbi
USD United States Dollar
Portfolio Composition
Classification | | Percentage of
Total Investments | |
Other* | | | 30.9 | % | |
Information Technology Services | | | 14.0 | | |
Textiles, Apparel & Luxury Goods | | | 12.4 | | |
Beverages | | | 9.7 | | |
Internet Software & Services | | | 7.6 | | |
Short-Term Investments | | | 6.9 | | |
Diversified Consumer Services | | | 6.5 | | |
Food Products | | | 6.4 | | |
Road & Rail | | | 5.6 | | |
Total Investments | | | 100.0 | % | |
*�� Industries and/or investment types representing less than 5% of total investments.
The accompanying notes are an integral part of the financial statements.
7
Morgan Stanley Institutional Fund, Inc.
Annual Report — December 31, 2016
International Opportunity Portfolio
Statement of Assets and Liabilities | | December 31, 2016
(000) | |
Assets: | |
Investments in Securities of Unaffiliated Issuers, at Value(1) (Cost $69,326) | | $ | 71,952 | | |
Investment in Security of Affiliated Issuer, at Value (Cost $5,351) | | | 5,351 | | |
Total Investments in Securities, at Value (Cost $74,677) | | | 77,303 | | |
Foreign Currency, at Value (Cost —@) | | | — | @ | |
Receivable for Portfolio Shares Sold | | | 980 | | |
Tax Reclaim Receivable | | | 24 | | |
Dividends Receivable | | | 21 | | |
Receivable from Affiliate | | | 1 | | |
Other Assets | | | 29 | | |
Total Assets | | | 78,358 | | |
Liabilities: | |
Payable for Portfolio Shares Redeemed | | | 867 | | |
Payable for Advisory Fees | | | 116 | | |
Payable for Professional Fees | | | 50 | | |
Payable for Sub Transfer Agency Fees — Class I | | | 9 | | |
Payable for Sub Transfer Agency Fees — Class A | | | 2 | | |
Payable for Sub Transfer Agency Fees — Class L | | | — | @ | |
Payable for Sub Transfer Agency Fees — Class C | | | — | @ | |
Payable for Custodian Fees | | | 8 | | |
Payable for Administration Fees | | | 5 | | |
Payable for Transfer Agency Fees — Class I | | | 3 | | |
Payable for Transfer Agency Fees — Class A | | | 1 | | |
Payable for Transfer Agency Fees — Class L | | | — | @ | |
Payable for Transfer Agency Fees — Class C | | | — | @ | |
Payable for Shareholder Services Fees — Class A | | | 2 | | |
Payable for Distribution and Shareholder Services Fees — Class L | | | — | @ | |
Payable for Distribution and Shareholder Services Fees — Class C | | | 2 | | |
Other Liabilities | | | 13 | | |
Total Liabilities | | | 1,078 | | |
Net Assets | | $ | 77,280 | | |
Net Assets Consist Of: | |
Paid-in-Capital | | $ | 74,436 | | |
Distributions in Excess of Net Investment Income | | | (35 | ) | |
Accumulated Net Realized Gain | | | 255 | | |
Unrealized Appreciation (Depreciation) on: | |
Investments | | | 2,626 | | |
Foreign Currency Translations | | | (2 | ) | |
Net Assets | | $ | 77,280 | | |
The accompanying notes are an integral part of the financial statements.
8
Morgan Stanley Institutional Fund, Inc.
Annual Report — December 31, 2016
International Opportunity Portfolio
Statement of Assets and Liabilities (cont'd) | | December 31, 2016
(000) | |
CLASS I: | |
Net Assets | | $ | 62,440 | | |
| Shares Outstanding $0.001 par value shares of beneficial interest (unlimited shares authorized) (not in 000's) | | | 4,180,869 | | |
Net Asset Value, Offering and Redemption Price Per Share | | $ | 14.93 | | |
CLASS A: | |
Net Assets | | $ | 11,727 | | |
| Shares Outstanding $0.001 par value shares of beneficial interest (unlimited shares authorized) (not in 000's) | | | 792,662 | | |
Net Asset Value, Redemption Price Per Share | | $ | 14.79 | | |
Maximum Sales Load | | | 5.25 | % | |
Maximum Sales Charge | | $ | 0.82 | | |
Maximum Offering Price Per Share | | $ | 15.61 | | |
CLASS L: | |
Net Assets | | $ | 221 | | |
| Shares Outstanding $0.001 par value shares of beneficial interest (unlimited shares authorized) (not in 000's) | | | 15,253 | | |
Net Asset Value, Offering and Redemption Price Per Share | | $ | 14.47 | | |
CLASS C: | |
Net Assets | | $ | 1,862 | | |
| Shares Outstanding $0.001 par value shares of beneficial interest (unlimited shares authorized) (not in 000's) | | | 129,448 | | |
Net Asset Value, Offering and Redemption Price Per Share | | $ | 14.39 | | |
CLASS IS: | |
Net Assets | | $ | 1,030 | | |
| Shares Outstanding $0.001 par value shares of beneficial interest (unlimited shares authorized) (not in 000's) | | | 68,969 | | |
Net Asset Value, Offering and Redemption Price Per Share | | $ | 14.94 | | |
(1) Including:
Securities on Loan, at Value: | | $ | 503 | | |
@ Amount is less than $500.
The accompanying notes are an integral part of the financial statements.
9
Morgan Stanley Institutional Fund, Inc.
Annual Report — December 31, 2016
International Opportunity Portfolio
Statement of Operations | | Year Ended
December 31, 2016
(000) | |
Investment Income: | |
Dividends from Securities of Unaffiliated Issuers (Net of $49 of Foreign Taxes Withheld) | | $ | 534 | | |
Income from Securities Loaned — Net | | | 20 | | |
Dividends from Security of Affiliated Issuer (Note G) | | | 7 | | |
Interest from Securities of Unaffiliated Issuers | | | — | @ | |
Total Investment Income | | | 561 | | |
Expenses: | |
Advisory Fees (Note B) | | | 580 | | |
Professional Fees | | | 99 | | |
Registration Fees | | | 82 | | |
Sub Transfer Agency Fees — Class I | | | 48 | | |
Sub Transfer Agency Fees — Class A | | | 16 | | |
Sub Transfer Agency Fees — Class L | | | — | @ | |
Sub Transfer Agency Fees — Class C | | | 1 | | |
Administration Fees (Note C) | | | 58 | | |
Shareholder Services Fees — Class A (Note D) | | | 28 | | |
Distribution and Shareholder Services Fees — Class L (Note D) | | | 1 | | |
Distribution and Shareholder Services Fees — Class C (Note D) | | | 19 | | |
Custodian Fees (Note F) | | | 26 | | |
Transfer Agency Fees — Class I (Note E) | | | 13 | | |
Transfer Agency Fees — Class A (Note E) | | | 3 | | |
Transfer Agency Fees — Class L (Note E) | | | 2 | | |
Transfer Agency Fees — Class C (Note E) | | | 2 | | |
Transfer Agency Fees — Class IS (Note E) | | | 2 | | |
Shareholder Reporting Fees | | | 18 | | |
Pricing Fees | | | 6 | | |
Directors' Fees and Expenses | | | 4 | | |
Other Expenses | | | 26 | | |
Total Expenses | | | 1,034 | | |
Waiver of Advisory Fees (Note B) | | | (174 | ) | |
Reimbursement of Class Specific Expenses — Class I (Note B) | | | (25 | ) | |
Reimbursement of Class Specific Expenses — Class A (Note B) | | | (1 | ) | |
Reimbursement of Class Specific Expenses — Class L (Note B) | | | (2 | ) | |
Reimbursement of Class Specific Expenses — Class C (Note B) | | | (1 | ) | |
Reimbursement of Class Specific Expenses — Class IS (Note B) | | | (2 | ) | |
Rebate from Morgan Stanley Affiliate (Note G) | | | (4 | ) | |
Reimbursement of Custodian Fees (Note F) | | | (42 | ) | |
Net Expenses | | | 783 | | |
Net Investment Loss | | | (222 | ) | |
Realized Gain (Loss): | |
Investments Sold | | | 975 | | |
Foreign Currency Transactions | | | (23 | ) | |
Net Realized Gain | | | 952 | | |
Change in Unrealized Appreciation (Depreciation): | |
Investments | | | (174 | ) | |
Foreign Currency Translations | | | — | @ | |
Net Change in Unrealized Appreciation (Depreciation) | | | (174 | ) | |
Net Realized Gain and Change in Unrealized Appreciation (Depreciation) | | | 778 | | |
Net Increase in Net Assets Resulting from Operations | | $ | 556 | | |
@ Amount is less than $500.
The accompanying notes are an integral part of the financial statements.
10
Morgan Stanley Institutional Fund, Inc.
Annual Report — December 31, 2016
International Opportunity Portfolio
Statements of Changes in Net Assets | | Year Ended
December 31, 2016
(000) | | Year Ended
December 31, 2015
(000) | |
Increase (Decrease) in Net Assets: | |
Operations: | |
Net Investment Loss | | $ | (222 | ) | | $ | (23 | ) | |
Net Realized Gain (Loss) | | | 952 | | | | (96 | ) | |
Net Change in Unrealized Appreciation (Depreciation) | | | (174 | ) | | | 1,132 | | |
Net Increase in Net Assets Resulting from Operations | | | 556 | | | | 1,013 | | |
Distributions from and/or in Excess of: | |
Class I: | |
Net Investment Income | | | (10 | ) | | | (39 | ) | |
Net Realized Gain | | | — | | | | (847 | ) | |
Class A: | |
Net Investment Income | | | — | | | | (1 | ) | |
Net Realized Gain | | | — | | | | (135 | ) | |
Class L: | |
Net Realized Gain | | | — | | | | (7 | ) | |
Class C: | |
Net Investment Income | | | — | | | | (1 | ) | |
Net Realized Gain | | | — | | | | (25 | ) | |
Class IS: | |
Net Investment Income | | | (— | @) | | | (— | @) | |
Net Realized Gain | | | — | | | | (— | @) | |
Total Distributions | | | (10 | ) | | | (1,055 | ) | |
Capital Share Transactions:(1) | |
Class I: | |
Subscribed | | | 38,010 | | | | 46,792 | | |
Distributions Reinvested | | | 10 | | | | 695 | | |
Redeemed | | | (28,192 | ) | | | (6,474 | ) | |
Class A: | |
Subscribed | | | 11,094 | | | | 9,679 | | |
Distributions Reinvested | | | — | | | | 127 | | |
Redeemed | | | (8,975 | ) | | | (1,112 | ) | |
Class L: | |
Exchanged | | | 146 | | | | — | | |
Subscribed | | | — | | | | 63 | | |
Distributions Reinvested | | | — | | | | 2 | | |
Redeemed | | | (190 | ) | | | (4 | ) | |
Class C: | |
Subscribed | | | 722 | | | | 1,921 | * | |
Distributions Reinvested | | | — | | | | 26 | * | |
Redeemed | | | (604 | ) | | | (111 | )* | |
Class IS: | |
Subscribed | | | 1,008 | | | | — | | |
Net Increase in Net Assets Resulting from Capital Share Transactions | | | 13,029 | | | | 51,604 | | |
Redemption Fees | | | 3 | | | | 1 | | |
Total Increase in Net Assets | | | 13,578 | | | | 51,563 | | |
Net Assets: | |
Beginning of Period | | | 63,702 | | | | 12,139 | | |
End of Period (Including Distributions in Excess of Net Investment Income and Accumulated Undistributed
Net Investment Income of $(35) and $21, respectively) | | $ | 77,280 | | | $ | 63,702 | | |
The accompanying notes are an integral part of the financial statements.
11
Morgan Stanley Institutional Fund, Inc.
Annual Report — December 31, 2016
International Opportunity Portfolio
Statements of Changes in Net Assets (cont'd) | | Year Ended
December 31, 2016
(000) | | Year Ended
December 31, 2015
(000) | |
(1) Capital Share Transactions: | |
Class I: | |
Shares Subscribed | | | 2,611 | | | | 3,070 | | |
Shares Issued on Distributions Reinvested | | | 1 | | | | 45 | | |
Shares Redeemed | | | (1,900 | ) | | | (432 | ) | |
Net Increase in Class I Shares Outstanding | | | 712 | | | | 2,683 | | |
Class A: | |
Shares Subscribed | | | 764 | | | | 632 | | |
Shares Issued on Distributions Reinvested | | | — | | | | 8 | | |
Shares Redeemed | | | (609 | ) | | | (74 | ) | |
Net Increase in Class A Shares Outstanding | | | 155 | | | | 566 | | |
Class L: | |
Shares Exchanged | | | 10 | | | | — | | |
Shares Subscribed | | | — | | | | 4 | | |
Shares Issued on Distributions Reinvested | | | — | | | | — | @@ | |
Shares Redeemed | | | (13 | ) | | | (— | @@) | |
Net Increase (Decrease) in Class L Shares Outstanding | | | (3 | ) | | | 4 | | |
Class C: | |
Shares Subscribed | | | 50 | | | | 125 | * | |
Shares Issued on Distributions Reinvested | | | — | | | | 2 | * | |
Shares Redeemed | | | (42 | ) | | | (6 | )* | |
Net Increase in Class C Shares Outstanding | | | 8 | | | | 121 | | |
Class IS: | |
Shares Subscribed | | | 68 | | | | — | | |
@ Amount is less than $500.
@@ Amount is less than 500 shares.
* For the period April 30, 2015 through December 31, 2015.
The accompanying notes are an integral part of the financial statements.
12
Morgan Stanley Institutional Fund, Inc.
Annual Report — December 31, 2016
Financial Highlights
International Opportunity Portfolio
| | | Class I | |
| | | Year Ended December 31, | |
Selected Per Share Data and Ratios | | 2016(1) | | 2015 | | 2014 | | 2013 | | 2012 | |
Net Asset Value, Beginning of Period | | $ | 15.03 | | | $ | 13.92 | | | $ | 13.77 | | | $ | 11.19 | | | $ | 10.26 | | |
Income (Loss) from Investment Operations: | |
Net Investment Income (Loss) (2) | | | (0.03 | ) | | | (0.00 | )(3) | | | 0.08 | | | | 0.10 | | | | 0.08 | | |
Net Realized and Unrealized Gain (Loss) | | | (0.07 | ) | | | 1.58 | | | | 0.36 | | | | 2.85 | | | | 0.92 | | |
Total from Investment Operations | | | (0.10 | ) | | | 1.58 | | | | 0.44 | | | | 2.95 | | | | 1.00 | | |
Distributions from and/or in Excess of: | |
Net Investment Income | | | (0.00 | )(3) | | | (0.03 | ) | | | (0.01 | ) | | | (0.09 | ) | | | (0.07 | ) | |
Net Realized Gain | | | — | | | | (0.44 | ) | | | (0.28 | ) | | | (0.28 | ) | | | — | | |
Total Distributions | | | (0.00 | )(3) | | | (0.47 | ) | | | (0.29 | ) | | | (0.37 | ) | | | (0.07 | ) | |
Redemption Fees | | | 0.00 | (3) | | | 0.00 | (3) | | | 0.00 | (3) | | | — | | | | — | | |
Net Asset Value, End of Period | | $ | 14.93 | | | $ | 15.03 | | | $ | 13.92 | | | $ | 13.77 | | | $ | 11.19 | | |
Total Return (4) | | | (0.65 | )% | | | 11.40 | % | | | 3.14 | % | | | 26.47 | % | | | 9.76 | % | |
Ratios and Supplemental Data: | |
Net Assets, End of Period (Thousands) | | $ | 62,440 | | | $ | 52,128 | | | $ | 10,943 | | | $ | 7,647 | | | $ | 5,259 | | |
Ratio of Expenses to Average Net Assets (8) | | | 1.00 | %(5) | | | 1.01 | %(5)(6) | | | 1.09 | %(5) | | | 1.13 | %(5) | | | 1.14 | %(5) | |
Ratio of Net Investment Income (Loss) to Average Net Assets (8) | | | (0.22 | )%(5) | | | (0.01 | )%(5) | | | 0.57 | %(5) | | | 0.82 | %(5) | | | 0.70 | %(5) | |
Ratio of Rebate from Morgan Stanley Affiliates to Average Net Assets | | | 0.00 | %(7) | | | 0.01 | % | | | 0.01 | % | | | 0.01 | % | | | 0.01 | % | |
Portfolio Turnover Rate | | | 42 | % | | | 51 | % | | | 33 | % | | | 40 | % | | | 33 | % | |
(8) Supplemental Information on the Ratios to Average Net Assets: | |
Ratios Before Expense Limitation: | |
Expenses to Average Net Assets | | | 1.34 | % | | | 1.95 | % | | | 3.25 | % | | | 3.84 | % | | | 3.87 | % | |
Net Investment Loss to Average Net Assets | | | (0.56 | )% | | | (0.95 | )% | | | (1.59 | )% | | | (1.89 | )% | | | (2.03 | )% | |
(1) Refer to Note F in the Notes to Financial Statements for discussion of prior period custodian out-of-pocket expenses that were reimbursed in the current period. The amount of the reimbursement was immaterial on a per share basis and did not impact the total return of Class I shares. The Ratio of Expenses to Average Net Assets and the Ratio of Net Investment Loss to Average Net Assets would be unchanged as the reimbursement of custodian fees was offset against current period expense waivers/reimbursements with no impact to net expenses or net investment loss.
(2) Per share amount is based on average shares outstanding.
(3) Amount is less than $0.005 per share.
(4) Calculated based on the net asset value as of the last business day of the period.
(5) The Ratios of Expenses and Net Investment Income (Loss) reflect the rebate of certain Portfolio expenses in connection with the investments in Morgan Stanley affiliates during the period. The effect of the rebate on the ratios is disclosed in the above table as "Ratio of Rebate from Morgan Stanley Affiliates to Average Net Assets."
(6) Effective July 1, 2015, the Adviser has agreed to limit the ratio of expenses to average net assets to the maximum ratio of 1.00% for Class I shares. Prior to July 1, 2015, the maximum ratio was 1.15% for Class I shares.
(7) Amount is less than 0.005%.
The accompanying notes are an integral part of the financial statements.
13
Morgan Stanley Institutional Fund, Inc.
Annual Report — December 31, 2016
Financial Highlights
International Opportunity Portfolio
| | | Class A | |
| | | Year Ended December 31, | |
Selected Per Share Data and Ratios | | 2016(1) | | 2015 | | 2014 | | 2013 | | 2012 | |
Net Asset Value, Beginning of Period | | $ | 14.93 | | | $ | 13.87 | | | $ | 13.78 | | | $ | 11.19 | | | $ | 10.26 | | |
Income (Loss) from Investment Operations: | |
Net Investment Income (Loss) (2) | | | (0.08 | ) | | | (0.06 | ) | | | 0.01 | | | | 0.02 | | | | 0.05 | | |
Net Realized and Unrealized Gain (Loss) | | | (0.06 | ) | | | 1.57 | | | | 0.37 | | | | 2.89 | | | | 0.92 | | |
Total from Investment Operations | | | (0.14 | ) | | | 1.51 | | | | 0.38 | | | | 2.91 | | | | 0.97 | | |
Distributions from and/or in Excess of: | |
Net Investment Income | | | — | | | | (0.01 | ) | | | (0.01 | ) | | | (0.04 | ) | | | (0.04 | ) | |
Net Realized Gain | | | — | | | | (0.44 | ) | | | (0.28 | ) | | | (0.28 | ) | | | — | | |
Total Distributions | | | — | | | | (0.45 | ) | | | (0.29 | ) | | | (0.32 | ) | | | (0.04 | ) | |
Redemption Fees | | | 0.00 | (3) | | | 0.00 | (3) | | | 0.00 | (3) | | | — | | | | — | | |
Net Asset Value, End of Period | | $ | 14.79 | | | $ | 14.93 | | | $ | 13.87 | | | $ | 13.78 | | | $ | 11.19 | | |
Total Return (4) | | | (1.00 | )% | | | 10.99 | % | | | 2.71 | % | | | 26.12 | % | | | 9.49 | % | |
Ratios and Supplemental Data: | |
Net Assets, End of Period (Thousands) | | $ | 11,727 | | | $ | 9,520 | | | $ | 992 | | | $ | 275 | | | $ | 112 | | |
Ratio of Expenses to Average Net Assets (9) | | | 1.35 | %(5) | | | 1.34 | %(5)(7) | | | 1.49 | %(5) | | | 1.44 | %(5)(6) | | | 1.39 | %(5) | |
Ratio of Net Investment Income (Loss) to Average Net Assets (9) | | | (0.55 | )%(5) | | | (0.39 | )%(5) | | | 0.04 | %(5) | | | 0.13 | %(5) | | | 0.45 | %(5) | |
Ratio of Rebate from Morgan Stanley Affiliates to Average Net Assets | | | 0.00 | %(8) | | | 0.01 | % | | | 0.01 | % | | | 0.01 | % | | | 0.01 | % | |
Portfolio Turnover Rate | | | 42 | % | | | 51 | % | | | 33 | % | | | 40 | % | | | 33 | % | |
(9) Supplemental Information on the Ratios to Average Net Assets: | |
Ratios Before Expense Limitation: | |
Expenses to Average Net Assets | | | 1.66 | % | | | 2.28 | % | | | 3.81 | % | | | 4.49 | % | | | 4.12 | % | |
Net Investment Loss to Average Net Assets | | | (0.86 | )% | | | (1.33 | )% | | | (2.28 | )% | | | (2.92 | )% | | | (2.28 | )% | |
(1) Refer to Note F in the Notes to Financial Statements for discussion of prior period custodian out-of-pocket expenses that were reimbursed in the current period. The amount of the reimbursement was immaterial on a per share basis and did not impact the total return of Class A shares. The Ratio of Expenses to Average Net Assets and the Ratio of Net Investment Loss to Average Net Assets would be unchanged as the reimbursement of custodian fees was offset against current period expense waivers/reimbursements with no impact to net expenses or net investment loss.
(2) Per share amount is based on average shares outstanding.
(3) Amount is less than $0.005 per share.
(4) Calculated based on the net asset value which does not reflect sales charges, if applicable, as of the last business day of the period.
(5) The Ratios of Expenses and Net Investment Income (Loss) reflect the rebate of certain Portfolio expenses in connection with the investments in Morgan Stanley affiliates during the period. The effect of the rebate on the ratios is disclosed in the above table as "Ratio of Rebate from Morgan Stanley Affiliates to Average Net Assets."
(6) Effective September 16, 2013, the Adviser has agreed to limit the ratio of expenses to average net assets to the maximum ratio of 1.50% for Class A shares. Prior to September 16, 2013, the maximum ratio was 1.40% for Class A shares.
(7) Effective July 1, 2015, the Adviser has agreed to limit the ratio of expenses to average net assets to the maximum ratio of 1.35% for Class A shares. Prior to July 1, 2015, the maximum ratio was 1.50% for Class A shares.
(8) Amount is less than 0.005%.
The accompanying notes are an integral part of the financial statements.
14
Morgan Stanley Institutional Fund, Inc.
Annual Report — December 31, 2016
Financial Highlights
International Opportunity Portfolio
| | | Class L | |
| | | Year Ended December 31, | |
Selected Per Share Data and Ratios | | 2016(1) | | 2015 | | 2014 | | 2013 | | 2012 | |
Net Asset Value, Beginning of Period | | $ | 14.69 | | | $ | 13.71 | | | $ | 13.68 | | | $ | 11.13 | | | $ | 10.22 | | |
Income (Loss) from Investment Operations: | |
Net Investment Loss (2) | | | (0.14 | ) | | | (0.12 | ) | | | (0.05 | ) | | | (0.00 | )(3) | | | (0.01 | ) | |
Net Realized and Unrealized Gain (Loss) | | | (0.08 | ) | | | 1.54 | | | | 0.36 | | | | 2.83 | | | | 0.92 | | |
Total from Investment Operations | | | (0.22 | ) | | | 1.42 | | | | 0.31 | | | | 2.83 | | | | 0.91 | | |
Distributions from and/or in Excess of: | |
Net Realized Gain | | | — | | | | (0.44 | ) | | | (0.28 | ) | | | (0.28 | ) | | | — | | |
Redemption Fees | | | 0.00 | (3) | | | 0.00 | (3) | | | 0.00 | (3) | | | — | | | | — | | |
Net Asset Value, End of Period | | $ | 14.47 | | | $ | 14.69 | | | $ | 13.71 | | | $ | 13.68 | | | $ | 11.13 | | |
Total Return (4) | | | (1.50 | )% | | | 10.38 | % | | | 2.24 | % | | | 25.49 | % | | | 8.90 | % | |
Ratios and Supplemental Data: | |
Net Assets, End of Period (Thousands) | | $ | 221 | | | $ | 266 | | | $ | 193 | | | $ | 137 | | | $ | 112 | | |
Ratio of Expenses to Average Net Assets (9) | | | 1.85 | %(5) | | | 1.91 | %(5)(7) | | | 1.99 | %(5) | | | 1.92 | %(5)(6) | | | 1.89 | %(5) | |
Ratio of Net Investment Loss to Average Net Assets (9) | | | (1.00 | )%(5) | | | (0.80 | )%(5) | | | (0.38 | )%(5) | | | (0.00 | )%(5)(8) | | | (0.05 | )%(5) | |
Ratio of Rebate from Morgan Stanley Affiliates to Average Net Assets | | | 0.00 | %(8) | | | 0.01 | % | | | 0.01 | % | | | 0.01 | % | | | 0.01 | % | |
Portfolio Turnover Rate | | | 42 | % | | | 51 | % | | | 33 | % | | | 40 | % | | | 33 | % | |
(9) Supplemental Information on the Ratios to Average Net Assets: | |
Ratios Before Expense Limitation: | |
Expenses to Average Net Assets | | | 3.16 | % | | | 3.54 | % | | | 5.06 | % | | | 4.91 | % | | | 4.62 | % | |
Net Investment Loss to Average Net Assets | | | (2.31 | )% | | | (2.43 | )% | | | (3.45 | )% | | | (2.99 | )% | | | (2.78 | )% | |
(1) Refer to Note F in the Notes to Financial Statements for discussion of prior period custodian out-of-pocket expenses that were reimbursed in the current period. The amount of the reimbursement was immaterial on a per share basis and did not impact the total return of Class L shares. The Ratio of Expenses to Average Net Assets and the Ratio of Net Investment Loss to Average Net Assets would be unchanged as the reimbursement of custodian fees was offset against current period expense waivers/reimbursements with no impact to net expenses or net investment loss.
(2) Per share amount is based on average shares outstanding.
(3) Amount is less than $0.005 per share.
(4) Calculated based on the net asset value as of the last business day of the period.
(5) The Ratios of Expenses and Net Investment Loss reflect the rebate of certain Portfolio expenses in connection with the investments in Morgan Stanley affiliates during the period. The effect of the rebate on the ratios is disclosed in the above table as "Ratio of Rebate from Morgan Stanley Affiliates to Average Net Assets."
(6) Effective September 16, 2013, the Adviser has agreed to limit the ratio of expenses to average net assets to the maximum ratio of 2.00% for Class L shares. Prior to September 16, 2013, the maximum ratio was 1.90% for Class L shares.
(7) Effective July 1, 2015, the Adviser has agreed to limit the ratio of expenses to average net assets to the maximum ratio of 1.85% for Class L shares. Prior to July 1, 2015, the maximum ratio was 2.00% for Class L shares.
(8) Amount is less than 0.005%.
The accompanying notes are an integral part of the financial statements.
15
Morgan Stanley Institutional Fund, Inc.
Annual Report — December 31, 2016
Financial Highlights
International Opportunity Portfolio
| | | Class C | |
Selected Per Share Data and Ratios | | Year Ended
December 31, 2016(1) | | Period from
April 30, 2015(2) to
December 31, 2015 | |
Net Asset Value, Beginning of Period | | $ | 14.63 | | | $ | 15.39 | | |
Loss from Investment Operations: | |
Net Investment Loss (3) | | | (0.19 | ) | | | (0.13 | ) | |
Net Realized and Unrealized Loss | | | (0.05 | ) | | | (0.16 | ) | |
Total from Investment Operations | | | (0.24 | ) | | | (0.29 | ) | |
Distributions from and/or in Excess of: | |
Net Investment Income | | | — | | | | (0.03 | ) | |
Net Realized Gain | | | — | | | | (0.44 | ) | |
Total Distributions | | | — | | | | (0.47 | ) | |
Redemption Fees | | | 0.00 | (4) | | | 0.00 | (4) | |
Net Asset Value, End of Period | | $ | 14.39 | | | $ | 14.63 | | |
Total Return (5) | | | (1.71 | )% | | | (1.85 | )%(9) | |
Ratios and Supplemental Data: | |
Net Assets, End of Period (Thousands) | | $ | 1,862 | | | $ | 1,776 | | |
Ratio of Expenses to Average Net Assets (11) | | | 2.10 | %(6) | | | 2.10 | %(6)(7)(10) | |
Ratio of Net Investment Loss to Average Net Assets (11) | | | (1.32 | )%(6) | | | (1.28 | )%(6)(10) | |
Ratio of Rebate from Morgan Stanley Affiliates to Average Net Assets | | | 0.00 | %(8) | | | 0.01 | %(10) | |
Portfolio Turnover Rate | | | 42 | % | | | 51 | % | |
(11) Supplemental Information on the Ratios to Average Net Assets: | |
Ratios Before Expense Limitation: | |
Expense to Average Net Assets | | | 2.43 | % | | | 3.03 | %(10) | |
Net Investment Loss to Average Net Assets | | | (1.65 | )% | | | (2.21 | )%(10) | |
(1) Refer to Note F in the Notes to Financial Statements for discussion of prior period custodian out-of-pocket expenses that were reimbursed in the current period. The amount of the reimbursement was immaterial on a per share basis and did not impact the total return of Class C shares. The Ratio of Expenses to Average Net Assets and the Ratio of Net Investment Loss to Average Net Assets would be unchanged as the reimbursement of custodian fees was offset against current period expense waivers/reimbursements with no impact to net expenses or net investment loss.
(2) Commencement of Offering.
(3) Per share amount is based on average shares outstanding.
(4) Amount is less than $0.005 per share.
(5) Calculated based on the net asset value which does not reflect sales charges, if applicable, as of the last business day of the period.
(6) The Ratios of Expenses and Net Investment Loss reflect the rebate of certain Portfolio expenses in connection with the investments in Morgan Stanley affiliates during the period. The effect of the rebate on the ratios is disclosed in the above table as "Ratio of Rebate from Morgan Stanley Affiliates to Average Net Assets."
(7) Effective July 1, 2015, the Adviser has agreed to limit the ratio of expenses to average net assets to the maximum ratio of 2.10% for Class C shares. Prior to July 1, 2015, the maximum ratio was 2.25% for Class C shares.
(8) Amount is less than 0.005%.
(9) Not Annualized.
(10) Annualized.
The accompanying notes are an integral part of the financial statements.
16
Morgan Stanley Institutional Fund, Inc.
Annual Report — December 31, 2016
Financial Highlights
International Opportunity Portfolio
| | | Class IS | |
| | | Year Ended December 31, | | Period from
September 13, 2013(2) to | |
Selected Per Share Data and Ratios | | 2016(1) | | 2015 | | 2014 | | December 31, 2013 | |
Net Asset Value, Beginning of Period | | $ | 15.03 | | | $ | 13.92 | | | $ | 13.77 | | | $ | 12.75 | | |
Income (Loss) from Investment Operations: | |
Net Investment Income (Loss) (3) | | | (0.03 | ) | | | 0.02 | | | | 0.07 | | | | (0.02 | ) | |
Net Realized and Unrealized Gain (Loss) | | | (0.06 | ) | | | 1.56 | | | | 0.37 | | | | 1.41 | | |
Total from Investment Operations | | | (0.09 | ) | | | 1.58 | | | | 0.44 | | | | 1.39 | | |
Distributions from and/or in Excess of: | |
Net Investment Income | | | (0.00 | )(4) | | | (0.03 | ) | | | (0.01 | ) | | | (0.09 | ) | |
Net Realized Gain | | | — | | | | (0.44 | ) | | | (0.28 | ) | | | (0.28 | ) | |
Total Distributions | | | (0.00 | )(4) | | | (0.47 | ) | | | (0.29 | ) | | | (0.37 | ) | |
Redemption Fees | | | 0.00 | (4) | | | 0.00 | (4) | | | 0.00 | (4) | | | — | | |
Net Asset Value, End of Period | | $ | 14.94 | | | $ | 15.03 | | | $ | 13.92 | | | $ | 13.77 | | |
Total Return (5) | | | (0.64 | )% | | | 11.40 | % | | | 3.22 | % | | | 10.96 | %(10) | |
Ratios and Supplemental Data: | |
Net Assets, End of Period (Thousands) | | $ | 1,030 | | | $ | 12 | | | $ | 11 | | | $ | 11 | | |
Ratio of Expenses to Average Net Assets (12) | | | 0.93 | %(6) | | | 1.01 | %(6)(8) | | | 1.08 | %(6) | | | 1.08 | %(6)(7)(11) | |
Ratio of Net Investment Income (Loss) to Average Net Assets (12) | | | (0.20 | )%(6) | | | 0.12 | %(6) | | | 0.51 | %(6) | | | (0.47 | )%(6)(11) | |
Ratio of Rebate from Morgan Stanley Affiliates to Average Net Assets | | | 0.01 | % | | | 0.00 | %(9) | | | 0.01 | % | | | 0.01 | %(11) | |
Portfolio Turnover Rate | | | 42 | % | | | 51 | % | | | 33 | % | | | 40 | %(10) | |
(12) Supplemental Information on the Ratios to Average Net Assets: | |
Ratios Before Expense Limitation: | |
Expenses to Average Net Assets | | | 5.64 | % | | | 15.79 | % | | | 20.64 | % | | | 9.61 | %(11) | |
Net Investment Loss to Average Net Assets | | | (4.91 | )% | | | (14.66 | )% | | | (19.05 | )% | | | (9.00 | )%(11) | |
(1) Refer to Note F in the Notes to Financial Statements for discussion of prior period custodian out-of-pocket expenses that were reimbursed in the current period. The amount of the reimbursement was immaterial on a per share basis and did not impact the total return of Class IS shares. The Ratio of Expenses to Average Net Assets and the Ratio of Net Investment Loss to Average Net Assets would be unchanged as the reimbursement of custodian fees was offset against current period expense waivers/reimbursements with no impact to net expenses or net investment loss.
(2) Commencement of Offering.
(3) Per share amount is based on average shares outstanding.
(4) Amount is less than $0.005 per share.
(5) Calculated based on the net asset value as of the last business day of the period.
(6) The Ratios of Expenses and Net Investment Income (Loss) reflect the rebate of certain Portfolio expenses in connection with the investments in Morgan Stanley affiliates during the period. The effect of the rebate on the ratios is disclosed in the above table as "Ratio of Rebate from Morgan Stanley Affiliates to Average Net Assets."
(7) Effective September 16, 2013, the Adviser has agreed to limit the ratio of expenses to average net assets to the maximum ratio of 1.09% for Class IS shares.
(8) Effective July 1, 2015, the Adviser has agreed to limit the ratio of expenses to average net assets to the maximum ratio of 0.94% for Class IS shares. Prior to July 1, 2015, the maximum ratio was 1.09% for Class IS shares.
(9) Amount is less than 0.005%.
(10) Not Annualized.
(11) Annualized.
The accompanying notes are an integral part of the financial statements.
17
Morgan Stanley Institutional Fund, Inc.
Annual Report — December 31, 2016
Notes to Financial Statements
Morgan Stanley Institutional Fund, Inc. (the "Fund") is registered under the Investment Company Act of 1940, as amended (the "Act"), as an open-end management investment company. The Fund is comprised of twenty-nine separate, active, diversified and non-diversified portfolios (individually referred to as a "Portfolio", collectively as the "Portfolios"). The Fund applies investment company accounting and reporting guidance.
The accompanying financial statements relate to the International Opportunity Portfolio. The Portfolio seeks long-term capital appreciation.
The Portfolio offers five classes of shares — Class I, Class A, Class L, Class C and Class IS. On April, 30, 2015, the Portfolio suspended offering of Class L shares. Existing Class L shareholders may invest through reinvestment of dividends and distributions.
A. Significant Accounting Policies: The following significant accounting policies are in conformity with U.S. generally accepted accounting principles ("GAAP"). Such policies are consistently followed by the Fund in the preparation of its financial statements. GAAP may require management to make estimates and assumptions that affect the reported amounts and disclosures in the financial statements. Actual results may differ from those estimates.
1. Security Valuation: (1) An equity portfolio security listed or traded on an exchange is valued at its latest reported sales price (or at the exchange official closing price if such exchange reports an official closing price), and if there were no sales on a given day and if there is no official exchange closing price for that day, the security is valued at the mean between the last reported bid and asked prices if such bid and asked prices are available on the relevant exchanges; (2) all other equity portfolio securities for which over-the-counter ("OTC") market quotations are readily available are valued at the latest reported sales price (or at the market official closing price if such market reports an official closing price), and if there was no trading in the security on a given day and if there is no official closing price from relevant markets for that day, the security is valued at the mean between the last reported bid and asked prices if such bid and asked prices are available on the relevant markets. Listed equity securities not traded on the valuation date with no reported bid and asked prices available on the exchange are valued at the mean between the current bid and asked prices
obtained from one or more reputable brokers or dealers. An unlisted equity security that does not trade on the valuation date and for which bid and asked prices from the relevant markets are unavailable is valued at the mean between the current bid and asked prices obtained from one or more reputable brokers or dealers. In cases where a security is traded on more than one exchange, the security is valued on the exchange designated as the primary market; (3) certain portfolio securities may be valued by an outside pricing service/vendor approved by the Fund's Board of Directors (the "Directors"). The pricing service/vendor may employ a pricing model that takes into account, among other things, bids, yield spreads, and/or other market data and specific security characteristics. Alternatively, if a valuation is not available from an outside pricing service/vendor, and the security trades on an exchange, the security may be valued at its latest reported sale price (or at the exchange official closing price if such exchange reports an official closing price), prior to the time when assets are valued. If there are no sales on a given day and if there is no official exchange closing price for that day, the security is valued at the mean between the last reported bid and asked prices if such bid and asked prices are available in the relevant exchanges; (4) Listed options are valued at the last reported sales price on the exchange on which they are listed (or at the exchange official closing price if such exchange reports an official closing price). If an official closing price or last reported sale price is unavailable, the listed option should be fair valued at the mean between its latest bid and ask prices. Unlisted options are valued at the mean between their latest bid and ask prices from a broker/dealer or valued by a pricing service/vendor; (5) when market quotations are not readily available, including circumstances under which Morgan Stanley Investment Management Inc. (the "Adviser") determines that the closing price, last sale price or the mean between the last reported bid and asked prices are not reflective of a security's market value, portfolio securities are valued at their fair value as determined in good faith under procedures established by and under the general supervision of the Directors. Occasionally, developments affecting the closing prices of securities and other assets may occur between the times at which valuations of such securities are determined (that is, close of the foreign market on which the securities trade) and the close of business of the New York Stock Exchange ("NYSE"). If developments occur during such periods that are expected to materially
18
Morgan Stanley Institutional Fund, Inc.
Annual Report — December 31, 2016
Notes to Financial Statements (cont'd)
affect the value of such securities, such valuations may be adjusted to reflect the estimated fair value of such securities as of the close of the NYSE, as determined in good faith by the Directors or by the Adviser using a pricing service and/or procedures approved by the Directors; (6) quotations of foreign portfolio securities, other assets and liabilities and forward contracts stated in foreign currency are translated into U.S. dollar equivalents at the prevailing market rates prior to the close of the NYSE; and (7) investments in mutual funds, including the Morgan Stanley Institutional Liquidity Funds, are valued at the net asset value ("NAV") as of the close of each business day.
The Directors have responsibility for determining in good faith the fair value of the investments, and the Directors may appoint others, such as the Fund's Adviser or a valuation committee, to assist the Directors in determining fair value and to make the actual calculations pursuant to the fair valuation methodologies previously approved by the Directors. Under procedures approved by the Directors, the Fund's Adviser has formed a Valuation Committee whose members are approved by the Directors. The Valuation Committee provides administration and oversight of the Fund's valuation policies and procedures, which are reviewed at least annually by the Directors. These procedures allow the Fund to utilize independent pricing services, quotations from securities and financial instrument dealers, and other market sources to determine fair value.
The Fund has procedures to determine the fair value of securities and other financial instruments for which market prices are not readily available. Under these procedures, the Valuation Committee convenes on a regular and ad hoc basis to review such securities and considers a number of factors, including valuation methodologies and significant unobservable valuation inputs, when arriving at fair value. The Valuation Committee may employ a market-based approach which may use related or comparable assets or liabilities, recent transactions, market multiples, book values, and other relevant information for the investment to determine the fair value of the investment. An income-based valuation approach may also be used in which the anticipated future cash flows of the investment are discounted to calculate fair value. Discounts may also be applied due to the nature or duration of any restrictions on the disposition of the investments. Due to the inherent uncertainty of valuations of such investments, the fair values may differ
significantly from the values that would have been used had an active market existed. The Valuation Committee employs various methods for calibrating these valuation approaches including a regular review of valuation methodologies, key inputs and assumptions, transactional back-testing or disposition analysis, and reviews of any related market activity.
2. Fair Value Measurement: Financial Accounting Standards Board ("FASB") Accounting Standards CodificationTM ("ASC") 820, "Fair Value Measurement" ("ASC 820"), defines fair value as the value that the Fund would receive to sell an investment or pay to transfer a liability in a timely transaction with an independent buyer in the principal market, or in the absence of a principal market, the most advantageous market for the investment or liability. ASC 820 establishes a three-tier hierarchy to distinguish between (1) inputs that reflect the assumptions market participants would use in valuing an asset or liability developed based on market data obtained from sources independent of the reporting entity (observable inputs) and (2) inputs that reflect the reporting entity's own assumptions about the assumptions market participants would use in valuing an asset or liability developed based on the best information available in the circumstances (unobservable inputs) and to establish classification of fair value measurements for disclosure purposes. Various inputs are used in determining the value of the Fund's investments. The inputs are summarized in the three broad levels listed below.
• Level 1 – unadjusted quoted prices in active markets for identical investments
• Level 2 – other significant observable inputs (including quoted prices for similar investments, interest rates, prepayment speeds, credit risk, etc.)
• Level 3 – significant unobservable inputs including the Fund's own assumptions in determining the fair value of investments. Factors considered in making this determination may include, but are not limited to, information obtained by contacting the issuer, analysts, or the appropriate stock exchange (for exchange-traded securities), analysis of the issuer's financial statements or other available documents and, if necessary, available
19
Morgan Stanley Institutional Fund, Inc.
Annual Report — December 31, 2016
Notes to Financial Statements (cont'd)
information concerning other securities in similar circumstances
The inputs or methodology used for valuing securities are not necessarily an indication of the risk associated with investing in those securities and the determination of the significance of a particular input to the fair value measurement in its entirety requires judgment and considers factors specific to each security.
The following is a summary of the inputs used to value the Portfolio's investments as of December 31, 2016.
Investment Type | | Level 1
Unadjusted
quoted
prices
(000) | | Level 2
Other
significant
observable
inputs
(000) | | Level 3
Significant
unobservable
inputs
(000) | | Total
(000) | |
Assets: | |
Common Stocks | |
Banks | | $ | 1,341 | | | $ | — | | | $ | — | | | $ | 1,341 | | |
Beverages | | | 5,984 | | | | — | | | | — | | | | 5,984 | | |
Biotechnology | | | 1,092 | | | | — | | | | — | | | | 1,092 | | |
Capital Markets | | | 2,405 | | | | — | | | | — | | | | 2,405 | | |
Diversified Consumer
Services | | | 5,021 | | | | — | | | | — | | | | 5,021 | | |
Electronic Equipment,
Instruments &
Components | | | 1,441 | | | | — | | | | — | | | | 1,441 | | |
Food Products | | | 4,932 | | | | — | | | | — | | | | 4,932 | | |
Health Care Equipment &
Supplies | | | 927 | | | | — | | | | — | | | | 927 | | |
Household Products | | | 2,628 | | | | — | | | | — | | | | 2,628 | | |
Information Technology
Services | | | 10,807 | | | | — | | | | — | | | | 10,807 | | |
Insurance | | | 1,337 | | | | — | | | | — | | | | 1,337 | | |
Internet & Direct
Marketing Retail | | | 3,318 | | | | — | | | | — | | | | 3,318 | | |
Internet Software &
Services | | | 5,868 | | | | — | | | | — | | | | 5,868 | | |
Media | | | 3,153 | | | | — | | | | — | | | | 3,153 | | |
Multi-Utilities | | | — | | | | — | | | | — | † | | | — | † | |
Personal Products | | | 1,471 | | | | — | | | | — | | | | 1,471 | | |
Pharmaceuticals | | | 1,661 | | | | — | | | | — | | | | 1,661 | | |
Road & Rail | | | 4,334 | | | | — | | | | — | | | | 4,334 | | |
Software | | | 1,402 | | | | — | | | | — | | | | 1,402 | | |
Textiles, Apparel &
Luxury Goods | | | 9,613 | | | | — | | | | — | | | | 9,613 | | |
Total Common Stocks | | | 68,735 | | | | — | | | | — | † | | | 68,735 | † | |
Preferred Stock | | | — | | | | — | | | | 80 | | | | 80 | | |
Participation Notes | | | — | | | | 3,102 | | | | — | | | | 3,102 | | |
Call Option Purchased | | | — | | | | 35 | | | | — | | | | 35 | | |
Short-Term Investment | |
Investment Company | | | 5,351 | | | | — | | | | — | | | | 5,351 | | |
Total Assets | | $ | 74,086 | | | $ | 3,137 | | | $ | 80 | † | | $ | 77,303 | † | |
† Includes one security which is valued at zero.
Transfers between investment levels may occur as the markets fluctuate and/or the availability of data used in an investment's valuation changes. The Portfolio recognizes transfers between the levels as of the end of the period. As of December 31, 2016, securities with a total value of approximately $34,378,000 transferred from Level 2 to Level 1. Securities that were valued using other significant observable inputs at December 31, 2015 were valued using unadjusted quoted prices at December 31, 2016. At December 31 2015, the fair value of certain securities were adjusted due to developments which occurred between the time of the close of the foreign markets on which they trade and the close of business on the NYSE which resulted in their Level 2 classification.
Following is a reconciliation of investments in which significant unobservable inputs (Level 3) were used in determining fair value.
| | | Common
Stock
(000) | | Preferred
Stock
(000) | |
Beginning Balance | | $ | — | † | | $ | 165 | | |
Purchases | | | — | | | | — | | |
Sales | | | — | | | | — | | |
Amortization of discount | | | — | | | | — | | |
Transfers in | | | — | | | | — | | |
Transfers out | | | — | | | | — | | |
Corporate actions | | | — | | | | — | | |
Change in unrealized appreciation (depreciation) | | | — | | | | (85 | ) | |
Realized gains (losses) | | | — | | | | — | | |
Ending Balance | | $ | — | † | | $ | 80 | | |
Net change in unrealized appreciation (depreciation)
from investments still held as of December 31, 2016 | | $ | — | | | $ | (85 | ) | |
† Includes one security which is valued at zero.
20
Morgan Stanley Institutional Fund, Inc.
Annual Report — December 31, 2016
Notes to Financial Statements (cont'd)
The following table presents additional information about valuation techniques and inputs used for investments that are measured at fair value and categorized within Level 3 as of December 31, 2016.
| | | Fair Value at
December 31, 2016
(000) | | Valuation
Technique | | Unobservable
Input | | Range | | Selected
Value | | Impact to
Valuation from an
Increase in Input | |
Internet & Direct Marketing Retail | |
Preferred Stock | | $ | 80 | | | Discounted Cash Flow | | Weighted Average
Cost of Capital | | | 17.5 | % | | | 19.5 | % | | | 18.5 | % | | Decrease | |
| | | | | | | Perpetual Growth Rate | | | 3.5 | % | | | 4.5 | % | | | 4.0 | % | | Increase | |
| | | | | Market Comparable
Companies | | Enterprise Value/
Revenue | | | 1.1 | x | | | 2.8 | x | | | 2.2 | x | | Increase | |
| | | | | | | Discount for Lack
of Marketability | | | 20.0 | % | | | 20.0 | % | | | 20.0 | % | | Decrease | |
3. Foreign Currency Translation and Foreign Investments: The books and records of the Portfolio are maintained in U.S. dollars. Foreign currency amounts are translated into U.S. dollars as follows:
– investments, other assets and liabilities at the prevailing rate of exchange on the valuation date;
– investment transactions and investment income at the prevailing rates of exchange on the dates of such transactions.
Although the net assets of the Portfolio are presented at the foreign exchange rates and market values at the close of the period, the Portfolio does not isolate that portion of the results of operations arising as a result of changes in the foreign exchange rates from the fluctuations arising from changes in the market prices of securities held at period end. Similarly, the Portfolio does not isolate the effect of changes in foreign exchange rates from the fluctuations arising from changes in the market prices of securities sold during the period. Accordingly, realized and unrealized foreign currency gains (losses) on investments in securities are included in the reported net realized and unrealized gains (losses) on investment transactions and balances. However, pursuant to U.S. federal income tax regulations, gains and losses from certain foreign currency transactions and the foreign currency portion of gains and losses realized on sales and maturities of foreign denominated debt securities are treated as ordinary income for U.S. federal income tax purposes.
Net realized gains (losses) on foreign currency transactions represent net foreign exchange gains (losses) from foreign currency forward exchange contracts, disposition
of foreign currencies, currency gains (losses) realized between the trade and settlement dates on securities transactions, and the difference between the amount of investment income and foreign withholding taxes recorded on the Portfolio's books and the U.S. dollar equivalent amounts actually received or paid. Net unrealized currency gains (losses) from valuing foreign currency denominated assets and liabilities at period end exchange rates are reflected as a component of unrealized appreciation (depreciation) in the Statement of Assets and Liabilities. The change in unrealized currency gains (losses) on foreign currency translations for the period is reflected in the Statement of Operations.
Foreign security and currency transactions may involve certain considerations and risks not typically associated with those of U.S. dollar denominated transactions as a result of, among other factors, fluctuations of exchange rates in relation to the U.S. dollar, the possibility of lower levels of governmental supervision and regulation of foreign securities markets and the possibility of political or economic instability.
Governmental approval for foreign investments may be required in advance of making an investment under certain circumstances in some countries, and the extent of foreign investments in domestic companies may be subject to limitation in other countries. Foreign ownership limitations also may be imposed by the charters of individual companies to prevent, among other concerns, violations of foreign investment limitations. As a result, an additional class of shares (identified as "Foreign" in the Portfolio of Investments) may be created and offered for investment. The "local" and "foreign shares" market values may differ. In the absence of trading of the
21
Morgan Stanley Institutional Fund, Inc.
Annual Report — December 31, 2016
Notes to Financial Statements (cont'd)
foreign shares in such markets, the Portfolio values the foreign shares at the closing exchange price of the local shares.
4. Derivatives: The Portfolio may, but is not required to, use derivative instruments for a variety of purposes, including hedging, risk management, portfolio management or to earn income. Derivatives are financial instruments whose value is based, in part, on the value of an underlying asset, interest rate, index or financial instrument. Prevailing interest rates and volatility levels, among other things, also affect the value of derivative instruments. A derivative instrument often has risks similar to its underlying asset and may have additional risks, including imperfect correlation between the value of the derivative and the underlying asset, risks of default by the counterparty to certain transactions, magnification of losses incurred due to changes in the market value of the securities, instruments, indices or interest rates to which the derivative instrument relates, risks that the transactions may not be liquid and risks arising from margin requirements. The use of derivatives involves risks that are different from, and possibly greater than, the risks associated with other portfolio investments. Derivatives may involve the use of highly specialized instruments that require investment techniques and risk analyses different from those associated with other portfolio investments. All of the Portfolio's holdings, including derivative instruments, are marked-to-market each day with the change in value reflected in unrealized appreciation (depreciation). Upon disposition, a realized gain or loss is recognized.
Certain derivative transactions may give rise to a form of leverage. Leverage magnifies the potential for gain and the risk of loss. Leverage associated with derivative transactions may cause the Portfolio to liquidate portfolio positions when it may not be advantageous to do so to satisfy its obligations or to meet earmarking or segregation requirements, pursuant to applicable Securities and Exchange Commission rules and regulations, or may cause the Portfolio to be more volatile than if the Portfolio had not been leveraged. Although the Adviser seeks to use derivatives to further the Portfolio's investment objectives, there is no assurance that the use of derivatives will achieve this result.
Following is a description of the derivative instruments and techniques that the Portfolio used during the period and their associated risks:
Options: With respect to options, the Portfolio is subject to equity risk, interest rate risk and foreign currency exchange risk in the normal course of pursuing its investment objectives. If the Portfolio buys an option, it buys a legal contract giving it the right to buy or sell a specific amount of the underlying instrument or foreign currency, or futures contract on the underlying instrument or foreign currency, at an agreed-upon price typically in exchange for a premium paid by the Portfolio. The Portfolio may purchase and/or sell put and call options. Purchasing call options tends to increase the Portfolio's exposure to the underlying (or similar) instrument. Purchasing put options tends to decrease the Portfolio's exposure to the underlying (or similar) instrument. When entering into purchased option contracts, the Portfolio bears the risk of interest or exchange rates or securities prices moving unexpectedly, in which case, the Portfolio may not achieve the anticipated benefits of the purchased option contracts; however the risk of loss is limited to the premium paid. Purchased options are reported as part of "Total Investments in Securities" in the Statement of Assets and Liabilities. Premium paid for purchasing options which expired are treated as realized losses. If the Portfolio sells an option, it sells to another party the right to buy from or sell to the Portfolio a specific amount of the underlying instrument or foreign currency, or futures contract on the underlying instrument or foreign currency, at an agreed-upon price typically in exchange for a premium received by the Portfolio. When options are purchased OTC, the Portfolio bears the risk that the counterparty that wrote the option will be unable or unwilling to perform its obligations under the option contract. Options may also be illiquid and the Portfolio may have difficulty closing out its position. A decision as to whether, when and how to use options involves the exercise of skill and judgment and even a well-conceived option transaction may be unsuccessful because of market behavior or unexpected events. The prices of options can be highly volatile and the use of options can lower total returns.
22
Morgan Stanley Institutional Fund, Inc.
Annual Report — December 31, 2016
Notes to Financial Statements (cont'd)
FASB ASC 815, "Derivatives and Hedging" ("ASC 815"), is intended to improve financial reporting about derivative instruments by requiring enhanced disclosures to enable investors to better understand how and why the Portfolio uses derivative instruments, how these derivative instruments are accounted for and their effects on the Portfolio's financial position and results of operations.
The following table sets forth the fair value of the Portfolio's derivative contracts by primary risk exposure as of December 31, 2016.
| | | Asset Derivatives
Statement of Assets and
Liabilities Location | | Primary Risk
Exposure | | Value
(000) | |
Option Purchased
| | Investments, at Value
(Option Purchased) | | Currency Risk | | $ | 35 | (a) | |
(a) Amounts are included in Investments in Securities in the Statement of Assets and Liabilities.
The following tables set forth by primary risk exposure the Portfolio's realized gains (losses) and change in unrealized appreciation (depreciation) by type of derivative contract for the year ended December 31, 2016 in accordance with ASC 815.
Realized Gain (Loss) | |
Primary Risk Exposure | | Derivative Type | | Value
(000) | |
Currency Risk
| | Investments
(Options Purchased) | | $ | (45 | )(b) | |
(b) Amounts are included in Investments Sold in the Statement of Operations.
Change in Unrealized Appreciation (Depreciation) | |
Primary Risk Exposure | | Derivative Type | | Value
(000) | |
Currency Risk
| | Investments
(Options Purchased) | | | $(37)(c) | | |
(c) Amounts are included in Investments in the Statement of Operations.
At December 31, 2016, the Portfolio's derivative assets and liabilities are as follows:
Gross Amounts of Assets and Liabilities Presented in the
Statement of Assets and Liabilities | |
Derivatives | | Assets(d)
(000) | | Liabilities(d)
(000) | |
Option Purchased | | $ | 35 | (a) | | $ | — | | |
(a) Amounts are included in Investments in Securities in the Statement of Assets andLiabilities.
(d) Absent an event of default or early termination, OTC derivative assets and liabilities are presented gross and not offset in the Statement of Assets and Liabilities.
The Portfolio typically enters into International Swaps and Derivatives Association, Inc. Master Agreements ("ISDA Master Agreements") or similar master agreements
(collectively, "Master Agreements") with its contract counterparties for certain OTC derivatives in order to, among other things, reduce its credit risk to counterparties. ISDA Master Agreements include provisions for general obligations, representations, collateral and events of default or termination. Under an ISDA Master Agreement, the Portfolio typically may offset with the counterparty certain OTC derivative financial instruments' payables and/or receivables with collateral held and/or posted and create one single net payment (close-out netting) in the event of default, termination and/or potential deterioration in the credit quality of the counterparty. Various Master Agreements govern the terms of certain transactions with counterparties, including transactions such as swap, forward, repurchase and reverse repurchase agreements. These Master Agreements typically attempt to reduce the counterparty risk associated with such transactions by specifying credit protection mechanisms and providing standardization that improves legal certainty. Cross-termination provisions under Master Agreements typically provide that a default in connection with one transaction between the Portfolio and a counterparty gives the non-defaulting party the right to terminate any other transactions in place with the defaulting party to create one single net payment due to/due from the defaulting party and may be a feature in certain Master Agreements. In the event the Portfolio exercises its right to terminate a Master Agreement after a counterparty experiences a termination event as defined in the Master Agreement, the return of collateral with market value in excess of the Portfolio's net liability may be delayed or denied.
The following table presents derivative financial instruments that are subject to enforceable netting arrangements as of December 31, 2016.
Gross Amounts Not Offset in the Statement of Assets and Liabilities | |
Counterparty | | Gross Asset
Derivatives
Presented in
Statement of
Assets and
Liabilities
(000) | | Financial
Instrument
(000) | | Collateral
Received
(000) | | Net Amount
(not less
than $0)
(000) | |
Royal Bank of Scotland | | $ | 35 | | | $ | — | | | $ | — | | | $ | 35 | | |
For the year ended December 31, 2016, the approximate average monthly amount outstanding for each derivative type is as follows:
Options Purchased: | |
Average monthly notional amount | | | 7,015,000 | | |
23
Morgan Stanley Institutional Fund, Inc.
Annual Report — December 31, 2016
Notes to Financial Statements (cont'd)
5. Securities Lending: The Portfolio lends securities to qualified financial institutions, such as broker-dealers, to earn additional income. Any increase or decrease in the fair value of the securities loaned that might occur and any interest earned or dividends declared on those securities during the term of the loan would remain in the Portfolio. The Portfolio would receive cash or securities as collateral in an amount equal to or exceeding 100% of the current fair value of the loaned securities. The collateral is marked-to-market daily by State Street Bank and Trust Company ("State Street"), the securities lending agent, to ensure that a minimum of 100% collateral coverage is maintained.
Based on pre-established guidelines, the securities lending agent invests any cash collateral that is received in an affiliated money market portfolio and repurchase agreements. Securities lending income is generated from the earnings on the invested collateral and borrowing fees, less any rebates owed to the borrowers and compensation to the lending agent, and is recorded as "Income from Securities Loaned — Net" in the Portfolio's Statement of Operations. Risks in securities lending transactions are that a borrower may not provide additional collateral when required or return the securities when due, and that the value of the short-term investments will be less than the amount of cash collateral plus any rebate that is required to be returned to the borrower.
The Portfolio has the right under the lending agreement to recover the securities from the borrower on demand.
The following table presents financial instruments that are subject to enforceable netting arrangements as of December 31, 2016.
Gross Amounts Not Offset in the Statement of Assets and Liabilities | |
Gross Asset
Amounts
Presented in
Statement of
Assets and
Liabilities
(000) | | Financial
Instrument
(000) | | Collateral
Received
(000) | | Net Amount
(not less
than $0)
(000) | |
| $ | 503 | (e) | | $ | — | | | $ | (503 | )(f)(g) | | $ | 0 | | |
(e) Represents market value of loaned securities at period end.
(f) The Portfolio received non-cash collateral of approximately $528,000 in the form of U.S. Government obligations, which the Portfolio cannot sell or repledge, and accordingly are not reflected in the Portfolio of Investments.
(g) The actual collateral received is greater than the amount shown here due to overcollateralization.
6. Structured Investments: The Portfolio invested a portion of its assets in structured investments. A structured investment is a derivative security designed to offer a return linked to a particular underlying security, currency, commodity or market. Structured investments may come in various forms including notes (such as exchange-traded notes), warrants and options to purchase securities. The Portfolio will typically use structured investments to gain exposure to a permitted underlying security, currency, commodity or market when direct access to a market is limited or inefficient from a tax or cost standpoint. There can be no assurance that structured investments will trade at the same price or have the same value as the underlying security, currency, commodity or market. Investments in structured investments involve risks including issuer risk, counterparty risk and market risk. Holders of structured investments bear risks of the underlying investment and are subject to issuer or counterparty risk because the Portfolio is relying on the creditworthiness of such issuer or counterparty and has no rights with respect to the underlying investment. Certain structured investments may be thinly traded or have a limited trading market and may have the effect of increasing the Portfolio's illiquidity to the extent that the Portfolio, at a particular time, may be unable to find qualified buyers for these securities.
7. Restricted Securities: The Portfolio invests in unregistered or otherwise restricted securities. The term "restricted securities" refers to securities that are unregistered or are held by control persons of the issuer and securities that are subject to contractual restrictions on their resale. As a result, restricted securities may be more difficult to value and the Portfolio may have difficulty disposing of such assets either in a timely manner or for a reasonable price. In order to dispose of an unregistered security, the Portfolio, where it has contractual rights to do so, may have to cause such security to be registered. A considerable period may elapse between the time the decision is made to sell the security and the time the security is registered so that the Portfolio could sell it. Contractual restrictions on the resale of securities vary in length and scope and are generally the result of a negotiation between the issuer and acquirer of the securities. The Portfolio would, in either case, bear market risks during that period. Restricted securities are identified in the Portfolio of Investments.
24
Morgan Stanley Institutional Fund, Inc.
Annual Report — December 31, 2016
Notes to Financial Statements (cont'd)
8. Redemption Fees: The Portfolio will assess a 2% redemption fee on Class I shares, Class A shares, Class L shares, Class C shares and Class IS shares, which is paid directly to the Portfolio, for shares redeemed or exchanged within thirty days of purchase, subject to certain exceptions. The redemption fee is designed to protect the Portfolio and its remaining shareholders from the effects of short-term trading. These fees, if any, are included in the Statements of Changes in Net Assets.
9. Indemnifications: The Fund enters into contracts that contain a variety of indemnifications. The Fund's maximum exposure under these arrangements is unknown. However, the Fund has not had prior claims or losses pursuant to these contracts and expects the risk of loss to be remote.
10. Dividends and Distributions to Shareholders: Dividend income and distributions to shareholders are recorded on the ex-dividend date. Dividends from net investment income, if any, are declared and paid annually. Net realized capital gains, if any, are distributed at least annually.
11. Security Transactions, Income and Expenses: Security transactions are accounted for on the trade date (date the order to buy or sell is executed). Realized gains and losses on the sale of investment securities are determined on the specific identified cost method. Dividend income and other distributions are recorded on the ex-dividend date (except for certain foreign dividends which may be recorded as soon as the Portfolio is informed of such dividends) net of applicable withholding taxes. Interest income is recognized on the accrual basis except where collection is in doubt. Discounts are accreted and premiums are amortized over the life of the respective securities. Most expenses of the Fund can be directly attributed to a particular Portfolio. Expenses which cannot be directly attributed are apportioned among the Portfolios based upon relative net assets or other appropriate methods. Income, expenses (other than class specific expenses — distribution and shareholder services, transfer agency and sub transfer agency fees) and realized and unrealized gains or losses are allocated to each class of shares based upon their relative net assets.
B. Advisory Fees: The Adviser, a wholly-owned subsidiary of Morgan Stanley, provides the Portfolio with advisory
services under the terms of an Investment Advisory Agreement, paid quarterly, at the annual rate based on the daily net assets as follows:
First $1
billion | | Over $1
billion | |
| | 0.80 | % | | | 0.75 | % | |
For the year ended December 31, 2016, the advisory fee rate (net of waivers/rebate) was equivalent to an annual effective rate of 0.56% of the Portfolio's average daily net assets.
The Adviser has agreed to reduce its advisory fee and/or reimburse the Portfolio so that total annual portfolio operating expenses, excluding certain investment related expenses, taxes, interest and other extraordinary expenses (including litigation), will not exceed 1.00% for Class I shares, 1.35% for Class A shares, 1.85% for Class L shares, 2.10% for Class C shares and 0.94% for Class IS shares. The fee waivers and/or expense reimbursements will continue for at least one year from the date of the Portfolio's prospectus or until such time as the Directors act to discontinue all or a portion of such waivers and/or reimbursements when they deem such action is appropriate. For the year ended December 31, 2016, approximately $174,000 of advisory fees were waived and approximately $31,000 of other expenses were reimbursed by the Adviser pursuant to this arrangement.
C. Administration Fees: The Adviser also serves as Administrator to the Fund and provides administrative services pursuant to an Administration Agreement for an annual fee, accrued daily and paid monthly, of 0.08% of the Portfolio's average daily net assets.
Under a Sub-Administration Agreement between the Administrator and State Street, State Street provides certain administrative services to the Fund. For such services, the Administrator pays State Street a portion of the fee the Administrator receives from the Portfolio.
D. Distribution and Shareholder Services Fees: Morgan Stanley Distribution, Inc. ("MSDI" or the "Distributor"), a wholly-owned subsidiary of the Adviser and an indirect subsidiary of Morgan Stanley, serves as the Fund's Distributor of Portfolio shares pursuant to a Distribution Agreement. The Fund has adopted a Shareholder Services Plan with respect to Class A shares pursuant to Rule 12b-1 under the Act. Under the Shareholder Services Plan, the Portfolio pays the Distributor a shareholder services fee, accrued daily and paid monthly, at an annual rate of 0.25% of the Portfolio's average daily net assets attributable to Class A shares.
25
Morgan Stanley Institutional Fund, Inc.
Annual Report — December 31, 2016
Notes to Financial Statements (cont'd)
The Fund has adopted a Distribution and Shareholder Services Plan with respect to Class L shares pursuant to Rule 12b-1 under the Act. Under the Distribution and Shareholder Services Plan, the Portfolio pays the Distributor a distribution fee, accrued daily and paid monthly, at an annual rate of 0.50% and a shareholder services fee, accrued daily and paid monthly, at an annual rate of 0.25% of the Portfolio's average daily net assets attributable to Class L shares.
The Fund has adopted a Distribution and Shareholder Services Plan with respect to Class C shares pursuant to Rule 12b-1 under the Act. Under the Distribution and Shareholder Services Plan, the Portfolio pays the Distributor a distribution fee, accrued daily and paid monthly, at an annual rate of 0.75% and a shareholder services fee, accrued daily and paid monthly, at an annual rate of 0.25% of the Portfolio's average daily net assets attributable to Class C shares.
The distribution and shareholder services fees are used to support the expenses associated with servicing and maintaining accounts. The Distributor may compensate other parties for providing shareholder support services to investors who purchase Class A, Class L and Class C shares.
E. Dividend Disbursing and Transfer Agent: The Fund's dividend disbursing and transfer agent is Boston Financial Data Services, Inc. ("BFDS"). Pursuant to a Transfer Agency Agreement, the Fund pays BFDS a fee based on the number of classes, accounts and transactions relating to the Portfolios of the Fund.
F. Custodian Fees: State Street (the "Custodian") serves as Custodian for the Fund in accordance with a Custodian Agreement. The Custodian holds cash, securities, and other assets of the Fund as required by the Act. Custody fees are payable monthly based on assets held in custody, investment purchases and sales activity and account maintenance fees, plus reimbursement for certain out-of-pocket expenses.
In December 2015, the Fund's Custodian announced that it had identified inconsistencies in the way in which clients were invoiced for out-of-pocket expenses from 1998 until November 2015. The dollar amount difference between what was charged and what should have been charged, plus interest, was paid back to the Portfolio in September 2016 as a reimbursement. The Custodian reimbursed the Portfolio directly, which was recognized as a change in accounting estimate and was reflected as "Reimbursement of Custodian Fees" in the Statement of Operations. Pursuant to the expense limitations described in Note B, the Portfolio has experienced waiver of
advisory fees during the current period. Accordingly, the reimbursement of out-of-pocket custodian expenses in the current period resulted in the reduction in the current period waiver of advisory fees.
G. Security Transactions and Transactions with Affiliates: For the year ended December 31, 2016, purchases and sales of investment securities for the Portfolio, other than long-term U.S. Government securities and short-term investments, were approximately $39,419,000 and $28,687,000, respectively. There were no purchases and sales of long-term U.S. Government securities for the year ended December 31, 2016.
The Portfolio invests in the Institutional Class of the Morgan Stanley Institutional Liquidity Funds (the "Liquidity Funds"), an open-end management investment company managed by the Adviser, both directly and as a portion of the securities held as collateral on loaned securities. Advisory fees paid by the Portfolio are reduced by an amount equal to its pro-rata share of the advisory and administration fees paid by the Portfolio due to its investment in the Liquidity Funds. For the year ended December 31, 2016, advisory fees paid were reduced by approximately $4,000 relating to the Portfolio's investment in the Liquidity Funds.
A summary of the Portfolio's transactions in shares of the Liquidity Funds during the year ended December 31, 2016 is as follows:
Value
December 31,
2015
(000) | | Purchases
at Cost
(000) | | Sales
(000) | | Dividend
Income
(000) | | Value
December 31,
2016
(000) | |
| $ | 4,275 | | | $ | 45,424 | | | $ | 44,348 | | | $ | 7 | | | $ | 5,351 | | |
The Portfolio is permitted to purchase and sell securities ("cross-trade") from and to other Morgan Stanley Funds as well as other funds and client accounts for which the Adviser or an affiliate of the Adviser serves as investment adviser, pursuant to procedures approved by the Directors in compliance with Rule 17a-7 under the Act (the "Rule"). Each cross-trade is executed at the current market price in compliance with provisions of the Rule. For the year ended December 31, 2016, the Portfolio did not engage in any cross-trade transactions.
The Portfolio has an unfunded Deferred Compensation Plan (the "Compensation Plan"), which allows each independent Director to defer payment of all, or a portion, of the fees he or she receives for serving on the Board of Directors. Each eligible Director generally may elect to have the deferred amounts credited with a return equal to the total return on one or more
26
Morgan Stanley Institutional Fund, Inc.
Annual Report — December 31, 2016
Notes to Financial Statements (cont'd)
of the Morgan Stanley funds that are offered as investment options under the Compensation Plan. Appreciation/depreciation and distributions received from these investments are recorded with an offsetting increase/decrease in the deferred compensation obligation and do not affect the NAV of the Portfolio.
H. Federal Income Taxes: It is the Portfolio's intention to continue to qualify as a regulated investment company and distribute all of its taxable and tax-exempt income. Accordingly, no provision for federal income taxes is required in the financial statements.
The Portfolio may be subject to taxes imposed by countries in which it invests. Such taxes are generally based on income and/or capital gains earned or repatriated. Taxes are accrued based on net investment income, net realized gains and net unrealized appreciation as such income and/or gains are earned. Taxes may also be based on transactions in foreign currency and are accrued based on the value of investments denominated in such currency.
FASB ASC 740-10, "Income Taxes — Overall", sets forth a minimum threshold for financial statement recognition of the benefit of a tax position taken or expected to be taken in a tax return. Management has concluded there are no significant uncertain tax positions that would require recognition in the financial statements. If applicable, the Portfolio recognizes interest accrued related to unrecognized tax benefits in "Interest Expense" and penalties in "Other Expenses" in the Statement of Operations. The Portfolio files tax returns with the U.S. Internal Revenue Service, New York and various states. Generally, each of the tax years in the four-year period ended December 31, 2016, remains subject to examination by taxing authorities.
The tax character of distributions paid may differ from the character of distributions shown in the Statements of Changes in Net Assets due to short-term capital gains being treated as ordinary income for tax purposes. The tax character of distributions paid during fiscal years 2016 and 2015 was as follows:
2016
Distributions
Paid From: | | 2015
Distributions
Paid From: | |
Ordinary
Income
(000) | | Long-Term
Capital Gain
(000) | | Ordinary
Income
(000) | | Long-Term
Capital Gain
(000) | |
| $ | 10 | | | $ | — | | | $ | 96 | | | $ | 960 | | |
The amount and character of income and gains to be distributed are determined in accordance with income tax regulations
which may differ from GAAP. These book/tax differences are either considered temporary or permanent in nature.
Temporary differences are primarily due to differing book and tax treatments for the timing of the recognition of gains (losses) on certain investment transactions and the timing of the deductibility of certain expenses.
Permanent differences, primarily due to differing treatments of gains (losses) related to foreign currency transactions and a net operating loss, resulted in the following reclassifications among the components of net assets at December 31, 2016:
Distributions
in Excess of
Net Investment
Income
(000) | | Accumulated
Undistributed
Net Realized
Gain
(000) | | Paid-in-
Capital
(000) | |
| $ | 176 | | | $ | 78 | | | $ | (254 | ) | |
At December 31, 2016, the components of distributable earnings for the Portfolio on a tax basis were as follows:
Undistributed
Ordinary
Income
(000) | | Undistributed
Long-Term
Capital Gain
(000) | |
| $ | — | | | $ | 372 | | |
Qualified late year losses are capital losses and specified ordinary losses, including currency losses, incurred after October 31 but within the taxable year that, if elected, are deemed to arise on the first day of the Portfolio's next taxable year. These also include non-specified ordinary losses incurred after December 31 but within the same taxable year. For the year ended December 31, 2016, the Portfolio deferred to January 1, 2017 for U.S. federal income tax purposes the following losses:
Qualified Late
Year Ordinary
Losses
(000) | | Post-October
Capital Losses
(000) | |
| $ | 34 | | | $ | — | | |
I. Credit Facility: As of April 4, 2016, the Fund and other Morgan Stanley funds participated in a $150,000,000 committed, unsecured revolving line of credit facility (the "facility") with State Street. This facility is to be used for temporary emergency purposes or funding of shareholder redemption requests. The interest rate on borrowings is based on the federal funds rate or one month libor rate plus a spread. The facility also has a commitment fee of 0.25% per annum based on the unused portion of the facility. During the year ended December 31, 2016, the Portfolio did not have any borrowings under the facility.
27
Morgan Stanley Institutional Fund, Inc.
Annual Report — December 31, 2016
Notes to Financial Statements (cont'd)
J. Other: At December 31, 2016, the Portfolio had record owners of 10% or greater. Investment activities of these shareholders could have a material impact on the Portfolio. The aggregate percentage of such owners was 51.8%.
K. Accounting Pronouncements: In December 2016, FASB issued Accounting Standards update 2016-19 — Technical Corrections and Improvements ("ASU 2016-19"), which is effective for interim periods for all entities beginning after December 15, 2016. ASU 2016-19 includes an amendment to Topic 820, Fair Value Measurement, which clarifies the difference between a valuation approach and a valuation technique when applying the guidance in that Topic. That amendment also requires an entity to disclose when there has been a change in either or both a valuation approach and/or a valuation technique. The transition guidance for the amendment must be applied prospectively because it could potentially involve the use of hindsight that includes fair value measurements. Although still evaluating the potential impacts of ASU 2016-19 to the Portfolio, management expects that the impact of the Portfolio's adoption will be limited to additional financial statement disclosures.
In October 2016, the Securities and Exchange Commission ("SEC") issued a new rule, Investment Company Reporting Modernization, which, among other provisions, amends Regulation S-X to require standardized, enhanced disclosures, particularly related to derivatives, in investment company financial statements. Compliance with the guidance is effective for financial statements filed with the SEC on or after August 1, 2017; adoption will have no effect on the Portfolio's net assets or results of operations. Although still evaluating the potential impacts of the Investment Company Reporting Modernization to the Portfolio, management expects that the impact of the Portfolio's adoption will be limited to additional financial statement disclosures.
28
Morgan Stanley Institutional Fund, Inc.
Annual Report — December 31, 2016
Report of Independent Registered Public Accounting Firm
To the Shareholders and Board of Directors of
Morgan Stanley Institutional Fund, Inc. —
International Opportunity Portfolio
We have audited the accompanying statement of assets and liabilities, including the portfolio of investments, of International Opportunity Portfolio (one of the portfolios constituting Morgan Stanley Institutional Fund, Inc.) (the "Portfolio") as of December 31, 2016, and the related statement of operations for the year then ended, the statements of changes in net assets for each of the two years in the period then ended and the financial highlights for each of the years or periods indicated therein. These financial statements and financial highlights are the responsibility of the Portfolio's management. Our responsibility is to express an opinion on these financial statements and financial highlights based on our audits.
We conducted our audits in accordance with the standards of the Public Company Accounting Oversight Board (United States). Those standards require that we plan and perform the audit to obtain reasonable assurance about whether the financial statements and financial highlights are free of material misstatement. We were not engaged to perform an audit of the Portfolio's internal control over financial reporting. Our audits included consideration of internal control over financial reporting as a basis for designing audit procedures that are appropriate in the circumstances, but not for the purpose of expressing an opinion on the effectiveness of the Portfolio's internal control over financial reporting. Accordingly, we express no such opinion. An audit also includes examining, on a test basis, evidence supporting the amounts and disclosures in the financial statements and financial highlights, assessing the accounting principles used and significant estimates made by management, and evaluating the overall financial statement presentation. Our procedures included confirmation of securities owned as of December 31, 2016, by correspondence with the custodian and others or by other appropriate auditing procedures where replies from others were not received. We believe that our audits provide a reasonable basis for our opinion.
In our opinion, the financial statements and financial highlights referred to above present fairly, in all material respects, the financial position of International Opportunity Portfolio (one of the portfolios constituting Morgan Stanley Institutional Fund, Inc.) at December 31, 2016, the results of its operations for the year then ended, the changes in its net assets for each of the two years in the period then ended and the financial highlights for each of the years or periods indicated therein, in conformity with U.S. generally accepted accounting principles.

Boston, Massachusetts
February 28, 2017
29
Morgan Stanley Institutional Fund, Inc.
Annual Report — December 31, 2016
Federal Tax Notice (unaudited)
For federal income tax purposes, the following information is furnished with respect to the Portfolio's earnings for its taxable year ended December 31, 2016. When distributed, certain earnings may be subject to a maximum tax rate of 15% as provided for by the Jobs and Growth Tax Relief Reconciliation Act of 2003. The Portfolio designated up to a maximum of approximately $10,000 as taxable at this lower rate.
In January, the Portfolio provides tax information to shareholders for the preceding calendar year.
30
Morgan Stanley Institutional Fund, Inc.
Annual Report — December 31, 2016
Privacy Notice (unaudited)
MORGAN STANLEY INVESTMENT MANAGEMENT INC.
AN IMPORTANT NOTICE CONCERNING OUR U.S. PRIVACY POLICY
We are required by federal law to provide you with a copy of our privacy policy annually. This policy applies to current and former individual investors in funds managed or sponsored by Morgan Stanley Investment Management Inc. ("MSIM") as well as current and former individual clients of MSIM. This policy is not applicable to partnerships, corporations, trusts or other non-individual clients or investors. Please note that we may amend this policy at any time, and will inform you of any changes as required by law.
WE RESPECT YOUR PRIVACY
We appreciate that you have provided us with your personal financial information. We strive to maintain the privacy of such information while we help you achieve your financial objectives. This Notice describes what non-public personal information we collect about you, why we collect it, when we may share it with others and how certain others may use it. It discusses the steps you may take to limit our sharing of certain information about you to affiliated companies in the Morgan Stanley family of companies ("other Morgan Stanley companies"). It also discloses how you may limit use of certain shared information for marketing purposes by other Morgan Stanley branded companies. Throughout this policy, we refer to the non-public information that personally identifies you or your accounts as "personal information.''
1. WHAT PERSONAL INFORMATION DO WE COLLECT ABOUT YOU?
We obtain personal information from applications and other forms you submit to us, from your dealings with us, from consumer reporting agencies, from our Web sites and from third parties and other sources.
For example:
• We may collect information such as your name, address, e-mail address, telephone/fax numbers, assets, income and investment objectives through subscription documents, applications and other forms you submit to us.
• We may obtain information about account balances, your use of account(s) and the types of products and services you prefer to receive from us through your dealings and transactions with us and other sources.
• We may obtain information about your creditworthiness and credit history from consumer reporting agencies.
• We may collect background information from and through third-party vendors to verify representations you have made and to comply with various regulatory requirements.
• If you interact with us through our public and private Web sites, we may collect information that you provide directly through online communications (such as an e-mail address). We may also collect information about your Internet service provider, your domain name, your computer's operating system and Web browser, your use of our Web sites and your product and service preferences, through the use of "cookies." Please consult the Terms of Use of these sites for more details.
2. WHEN DO WE DISCLOSE PERSONAL INFORMATION WE COLLECT ABOUT YOU?
We may disclose personal information we collect about you to other Morgan Stanley companies and to non-affiliated third parties.
a. Information We Disclose to Other Morgan Stanley Companies.
We may disclose personal information to other Morgan Stanley companies for a variety of reasons, including to manage your account(s) effectively, to service and process your transactions, to let you know about products and services offered by us and other Morgan Stanley companies, to manage our business, and as otherwise required or permitted by law. Offers for products and services from other Morgan Stanley companies are developed under conditions designed to safeguard your personal information.
31
Morgan Stanley Institutional Fund, Inc.
Annual Report — December 31, 2016
Privacy Notice (unaudited) (cont'd)
b. Information We Disclose to Non-affiliated Third Parties.
We do not disclose personal information that we collect about you to non-affiliated third parties except to those who provide marketing services on our behalf, to financial institutions with whom we have joint marketing agreements, and as otherwise required or permitted by law. For example, we may disclose personal information to nonaffiliated third parties for servicing and processing transactions, to offer our own products and services, to protect against fraud, for institutional risk control, to respond to judicial process or to perform services on our behalf. When we share personal information with a non-affiliated third party, they are required to limit their use of personal information to the particular purpose for which it was shared and they are not allowed to share personal information with others except to fulfill that limited purpose or as may be permitted or required by law.
3. HOW DO WE PROTECT THE SECURITY AND CONFIDENTIALITY OF PERSONAL INFORMATION WE COLLECT ABOUT YOU?
We maintain physical, electronic and procedural security measures to help safeguard the personal information we collect about you. We have internal policies governing the proper handling of client information. Third parties that provide support or marketing services on our behalf may also receive personal information, and we require them to adhere to confidentiality standards with respect to such information.
4. HOW CAN YOU LIMIT THE SHARING OF CERTAIN TYPES OF PERSONAL INFORMATION WITH OTHER MORGAN STANLEY COMPANIES?
We offer you choices as to whether we share with other Morgan Stanley companies the personal information that was collected to determine your eligibility for products and services you request ("eligibility information"). Eligibility information does not include your identification information or personal information pertaining to our transactions or experiences with you. Please note that, even if you direct us not to share eligibility information with other Morgan Stanley companies ("opt-out"), we may still share personal information, including eligibility information, with those companies in circumstances excluded from the opt-out under applicable law, such as to process transactions or to service your account.
5. HOW CAN YOU LIMIT THE USE OF CERTAIN TYPES OF PERSONAL INFORMATION BY OTHER MORGAN STANLEY COMPANIES FOR MARKETING?
By following the opt-out instructions in Section 6 below, you may limit other Morgan Stanley branded companies from marketing their products or services to you based on personal information we disclose to them. This information may include, for example, your income and account history with us. Please note that, even if you choose to limit Other Morgan Stanley Companies from using personal information about you that we may share with them for marketing their products and services to you, Other Morgan Stanley Companies may use your personal information that they obtain from us to market to you in circumstances permitted by law, such as if the Other Morgan Stanley Company has its own relationship with you.
6. HOW CAN YOU SEND US AN OPT-OUT INSTRUCTION?
If you wish to limit our sharing of eligibility information about you with other Morgan Stanley companies or other Morgan Stanley companies' use of personal information for marketing purposes, as described in this notice, you may do so by:
• Calling us at (800) 548-7786
Monday–Friday between 8a.m. and 6p.m.(EST)
• Writing to us at the following address:
Boston Financial Data Services, Inc.
c/o Privacy Coordinator
P.O. Box 219804
Kansas City, Missouri 64121
32
Morgan Stanley Institutional Fund, Inc.
Annual Report — December 31, 2016
Privacy Notice (unaudited) (cont'd)
Your written request should include your name, address, telephone number and account number(s) to which the opt-out applies and whether you are opting out with respect to sharing of eligibility information (Section 4 above), or if information used for Marketing (Section 5 above) or both. Written opt-out requests should not be sent with any other correspondence. In order to process your request, we require that the request be provided by you directly and not through a third party.
Your opt-out preference will remain in effect with respect to this policy (as it may be amended) until you notify us otherwise. If you have a joint account, your direction for us not to share this information with other Morgan Stanley companies and for those other Morgan Stanley companies not to use your personal information for marketing will be applied to all account holders on that account. Please understand that if you limit our sharing or our affiliated companies' use of personal information, you and any joint account holder(s) may not receive information about Morgan Stanley products and services, including products or services that could help you manage your financial resources and achieve your investment objectives.
7. WHAT IF AN AFFILIATED COMPANY BECOMES A NON-AFFILIATED THIRD PARTY?
If, at any time in the future, an affiliated company becomes a non-affiliated third party, further disclosures of personal information made to the former affiliated company will be limited to those described in Section 2(b) above relating to non-affiliated third parties. If you elected under Section 6 to limit disclosures we make to affiliated companies, or use of personal information by affiliated companies, your election will not apply to use by any former affiliated company of your personal information in their possession once it becomes a non-affiliated third party.
SPECIAL NOTICE TO RESIDENTS OF VERMONT
The following section supplements our policy with respect to our individual clients who have a Vermont address and supersedes anything to the contrary in the above policy with respect to those clients only.
The state of Vermont requires financial institutions to obtain your consent prior to sharing personal information that they collect about you with affiliated companies and non-affiliated third parties other than in certain limited circumstances. Except as permitted by law, we will not share personal information we collect about you with non-affiliated third parties or other Morgan Stanley companies unless you provide us with your written consent to share such information ("opt-in").
If you wish to receive offers for investment products and services offered by or through other Morgan Stanley companies, please notify us in writing at the following address:
Boston Financial Data Services, Inc.
c/o Privacy Coordinator
P.O. Box 219804
Kansas City, Missouri 64121
Your authorization should include your name, address, telephone number and account number(s) to which the opt-in applies and should not be sent with any other correspondence. In order to process your authorization, we require that the authorization be provided by you directly and not through a third party.
SPECIAL NOTICE TO RESIDENTS OF CALIFORNIA
The following section supplements our policy with respect to our individual clients who have a California address and supersedes anything to the contrary in the above policy with respect to those clients only.
In response to a California law, if your account has a California home address, your personal information will not be disclosed to nonaffiliated third parties except as permitted by applicable California law, and we will limit sharing such information with our affiliates to comply with California privacy laws that apply to us.
33
Morgan Stanley Institutional Fund, Inc.
Annual Report — December 31, 2016
Director and Officer Information (unaudited)
Independent Directors:
Name, Age and Address of
Independent Director | | Position(s)
Held with
Registrant | | Length of Time
Served* | | Principal Occupation(s) During Past 5 Years
and Other Relevant Professional Experience | | Number of
Portfolios in
Fund Complex
Overseen by
Independent
Director** | | Other Directorships
Held by Independent
Director*** | |
Frank L. Bowman (72)
c/o Perkins Coie LLP
Counsel to the Independent
Directors
30 Rockefeller Plaza
New York, NY 10112 | | Director | | Since
August
2006 | | President, Strategic Decisions, LLC (consulting) (since February 2009); Director or Trustee of various Morgan Stanley Funds (since August 2006); Chairperson of the Compliance and Insurance Committee (since October 2015); formerly, Chairperson of the Insurance Sub-Committee of the Compliance and Insurance Committee (2007-2015); served as President and Chief Executive Officer of the Nuclear Energy Institute (policy organization) (February 2005-November 2008); retired as Admiral, U.S. Navy after serving over 38 years on active duty including 8 years as Director of the Naval Nuclear Propulsion Program in the Department of the Navy and the U.S. Department of Energy (1996-2004); served as Chief of Naval Personnel (July 1994-September 1996) and on the Joint Staff as Director of Political Military Affairs (June 1992-July 1994); knighted as Honorary Knight Commander of the Most Excellent Order of the British Empire; awarded the Officier de l'Orde National du Mérite by the French Government; elected to the National Academy of Engineering (2009). | | | 90 | | | Director of BP p.l.c.; Director of Naval and Nuclear Technologies LLP; Director Emeritus of the Armed Services YMCA; Director of the U.S. Naval Submarine League; Member of the National Security Advisory Council of the Center for U.S. Global Engagement and a member of the CNA Military Advisory Board; Chairman of the charity J Street Cup Golf; Trustee of Fairhaven United Methodist Church; and Director of other various non-profit organizations. | |
Kathleen A. Dennis (63)
c/o Perkins Coie LLP
Counsel to the Independent Directors
30 Rockefeller Plaza
New York, NY 10112 | | Director | | Since
August
2006 | | President, Cedarwood Associates (mutual fund and investment management consulting) (since July 2006); Chairperson of the Liquidity and Alternatives Sub-Committee of the Investment Committee (since October 2006) and Director or Trustee of various Morgan Stanley Funds (since August 2006); formerly, Senior Managing Director of Victory Capital Management (1993-2006). | | | 91 | | | Director of various non-profit organizations. | |
Nancy C. Everett (61)
c/o Perkins Coie LLP
Counsel to the Independent Directors
30 Rockefeller Plaza
New York, NY 10112 | | Director | | Since
January
2015 | | Chief Executive Officer, Virginia Commonwealth University Investment Company (since November 2015); Owner, OBIR, LLC (institutional investment management consulting) (since June 2014); formerly, Managing Director, BlackRock Inc. (February 2011-December 2013); and Chief Executive Officer, General Motors Asset Management (a/k/a Promark Global Advisors, Inc.) (June 2005-May 2010). | | | 91 | | | Member of Virginia Commonwealth University School of Business Foundation; formerly, Member of Virginia Commonwealth University Board of Visitors (2013-2015); Member of Committee on Directors for Emerging Markets Growth Fund, Inc. (2007-2010); Chairperson of Performance Equity Management, LLC (2006-2010); and Chairperson, GMAM Absolute Return Strategies Fund, LLC (2006-2010). | |
34
Morgan Stanley Institutional Fund, Inc.
Annual Report — December 31, 2016
Director and Officer Information (unaudited) (cont'd)
Independent Directors: (cont'd)
Name, Age and Address of
Independent Director | | Position(s)
Held with
Registrant | | Length of Time
Served* | | Principal Occupation(s) During Past 5 Years
and Other Relevant Professional Experience | | Number of
Portfolios in
Fund Complex
Overseen by
Independent
Director** | | Other Directorships
Held by Independent
Director*** | |
Jakki L. Haussler (59)
c/o Perkins Coie LLP
Counsel to the Independent Directors
30 Rockefeller Plaza
New York, NY 10112 | | Director | | Since
January
2015 | | Chairman and Chief Executive Officer, Opus Capital Group (since January 1996); formerly, Director, Capvest Venture Fund, LP (May 2000-December 2011); Partner, Adena Ventures, LP (July 1999-December 2010); Director, The Victory Funds (February 2005-July 2008). | | | 91 | | | Director of Cincinnati Bell Inc. and Member, Audit Committee and Compensation Committee; Director of Northern Kentucky University Foundation and Member, Investment Committee; Member of Chase College of Law Transactional Law Practice Center Board of Advisors; Director of Best Transport; Director of Chase College of Law Board of Visitors; formerly, Member, University of Cincinnati Foundation Investment Committee; Member, Miami University Board of Visitors (2008-2011); Trustee of Victory Funds (2005-2008) and Chairman, Investment Committee (2007-2008) and Member, Service Provider Committee (2005-2008). | |
Dr. Manuel H. Johnson (67)
c/o Johnson Smick
International, Inc.
220 I Street, N.E. — Suite 200
Washington, D.C. 20002 | | Director | | Since
July
1991 | | Senior Partner, Johnson Smick International, Inc. (consulting firm); Chairperson of the Investment Committee (since October 2006) and Director or Trustee of various Morgan Stanley Funds (since July 1991); Co-Chairman and a founder of the Group of Seven Council (G7C) (international economic commission); formerly, Chairperson of the Audit Committee (July 1991-September 2006), Vice Chairman of the Board of Governors of the Federal Reserve System and Assistant Secretary of the U.S. Treasury. | | | 91 | | | Director of NVR, Inc. (home construction). | |
Joseph J. Kearns (74)
c/o Kearns & Associates LLC
46 E Peninsula Center #385
Rolling Hills Estates, CA 90274-3712 | | Director | | Since
August
1994 | | President, Kearns & Associates LLC (investment consulting); Chairperson of the Audit Committee (since October 2006) and Director or Trustee of various Morgan Stanley Funds (since August 1994); formerly, Deputy Chairperson of the Audit Committee (July 2003-September 2006) and Chairperson of the Audit Committee of various Morgan Stanley Funds (since August 1994); CFO of the J. Paul Getty Trust. | | | 93 | | | Director of Electro Rent Corporation (equipment leasing). Prior to December 31, 2013, Director of The Ford Family Foundation. | |
35
Morgan Stanley Institutional Fund, Inc.
Annual Report — December 31, 2016
Director and Officer Information (unaudited) (cont'd)
Independent Directors: (cont'd)
Name, Age and Address of
Independent Director | | Position(s)
Held with
Registrant | | Length of Time
Served* | | Principal Occupation(s) During Past 5 Years
and Other Relevant Professional Experience | | Number of
Portfolios in
Fund Complex
Overseen by
Independent
Director** | | Other Directorships
Held by Independent
Director*** | |
Michael F. Klein (58)
c/o Perkins Coie LLP
Counsel to the Independent Directors
30 Rockefeller Plaza
New York, NY 10112 | | Director | | Since
August
2006 | | Managing Director, Aetos Capital, LLC (since March 2000); Co-President, Aetos Alternatives Management, LLC (since January 2004) and Co-Chief Executive Officer of Aetos Capital LLC (since August 2013); Chairperson of the Fixed Income Sub-Committee of the Investment Committee (since October 2006) and Director or Trustee of various Morgan Stanley Funds (since August 2006); formerly, Managing Director, Morgan Stanley & Co. Inc. and Morgan Stanley Dean Witter Investment Management, President, various Morgan Stanley Funds (June 1998-March 2000) and Principal, Morgan Stanley & Co. Inc. and Morgan Stanley Dean Witter Investment Management (August 1997-December 1999). | | | 90 | | | Director of certain investment funds managed or sponsored by Aetos Capital, LLC; Director of Sanitized AG and Sanitized Marketing AG (specialty chemicals). | |
Patricia Maleski (56)
c/o Perkins Coie LLP
Counsel to the Independent Directors
30 Rockefeller Plaza
New York, NY 10112 | | Director | | Since
January
2017 | | Management Director, JPMorgan Asset Management (2013-2016); President, JPMorgan Funds (2010-2013), Chief Administrative Officer, JPMorgan Funds (2004-2010), Treasurer, JPMorgan Funds (2003-2004, 2008-2010), and Vice President and Board Liaison, JPMorgan Funds (2001-2004); Managing Director, J.P. Morgan Investment Management Inc. (2001-2013); Vice President of Finance, Pierpont Group (1996-2001);Vice President, Bank of New York (1995-1996); Senior Audit Manager, Price Waterhouse, LLP (1982-1995). | | | 91 | | | None. | |
Michael E. Nugent (80)
522 Fifth Avenue
New York, NY 10036 | | Chair of the Board and Director | | Chair of the Boards since July 2006 and Director since July 1991 | | Chair of the Boards of various Morgan Stanley Funds (since July 2006); Chairperson of the Closed-End Fund Committee (since June 2012) and Director or Trustee of various Morgan Stanley Funds (since July 1991); formerly, Chairperson of the Insurance Committee (until July 2006); General Partner, Triumph Capital, L.P. (private investment partnership) (1988-2013). | | | 92 | | | None. | |
W. Allen Reed (69)
c/o Perkins Coie LLP
Counsel to the Independent Directors
30 Rockefeller Plaza
New York, NY 10112 | | Director | | Since
August
2006 | | Chairperson of the Equity Sub-Committee of the Investment Committee (since October 2006) and Director or Trustee of various Morgan Stanley Funds (since August 2006); formerly, President and CEO of General Motors Asset Management; Chairman and Chief Executive Officer of the GM Trust Bank and Corporate Vice President of General Motors Corporation (August 1994-December 2005). | | | 91 | | | Director of Legg Mason, Inc.; formerly, Director of the Auburn University Foundation (2010-2015). | |
Fergus Reid (84)
c/o Joe Pietryka, Inc.
85 Charles Colman Blvd.
Pawling, NY 12564 | | Director | | Since
June
1992 | | Chairman, Joe Pietryka, Inc.; Chairperson of the Governance Committee and Director or Trustee of various Morgan Stanley Funds (since June 1992). | | | 92 | | | Formerly, Trustee and Director of certain investment companies in the JP Morgan Fund Complex managed by JP Morgan Investment Management Inc. (1987-2012). | |
* This is the earliest date the Director began serving the Morgan Stanley Funds. Each Director serves an indefinite term, until his or her successor is elected.
** The Fund Complex includes (as of December 31, 2016) all open-end and closed-end funds (including all of their portfolios) advised by Morgan Stanley Investment Management Inc. (the "Adviser") and any funds that have an adviser that is an affiliated person of the Adviser (including, but not limited to, Morgan Stanley AIP GP LP).
*** This includes any directorships at public companies and registered investment companies held by the Director at any time during the past five years.
36
Morgan Stanley Institutional Fund, Inc.
Annual Report — December 31, 2016
Director and Officer Information (unaudited) (cont'd)
Executive Officers:
Name, Age and Address of Executive Officer | | Position(s) Held
with
Registrant | | Length of Time
Served* | | Principal Occupation(s) During Past 5 Years | |
John H. Gernon (53)
522 Fifth Avenue
New York, NY 10036 | | President and Principal Executive Officer | | Since
September
2013 | | President and Principal Executive Officer of the Equity and Fixed Income Funds and the Morgan Stanley AIP Funds (since September 2013) and the Liquidity Funds and various money market funds (since May 2014) in the Fund Complex; Managing Director of the Adviser; Head of Product (since 2006). | |
Timothy J. Knierim (58)
522 Fifth Avenue
New York, NY 10036 | | Chief Compliance Officer | | Since
December
2016 | | Managing Director of the Adviser and various entities affiliated with the Adviser; Chief Compliance Officer of various Morgan Stanley Funds and the Adviser (since December 2016) and Chief Compliance Officer of Morgan Stanley AIP GP LP (since 2014). Formerly, Managing Director and Deputy Chief Compliance Officer of the Adviser (2014-2016); and formerly, Chief Compliance Officer of Prudential Investment Management, Inc. (2007-2014). | |
Francis J. Smith (51)
522 Fifth Avenue
New York, NY 10036 | | Treasurer and Principal Financial Officer | | Treasurer since July 2003 and Principal Financial Officer since September 2002 | | Managing Director of the Adviser and various entities affiliated with the Adviser; Treasurer (since July 2003) and Principal Financial Officer of various Morgan Stanley Funds (since September 2002). | |
Mary E. Mullin (49)
522 Fifth Avenue
New York, NY 10036 | | Secretary | | Since
June
1999 | | Executive Director of the Adviser; Secretary of various Morgan Stanley Funds (since June 1999). | |
* This is the earliest date the officer began serving the Morgan Stanley Funds. Each officer serves a one-year term, until his or her successor is elected and qualifies.
37
Morgan Stanley Institutional Fund, Inc.
Annual Report — December 31, 2016
Adviser and Administrator
Morgan Stanley Investment Management Inc.
522 Fifth Avenue
New York, New York 10036
Distributor
Morgan Stanley Distribution, Inc.
522 Fifth Avenue
New York, New York 10036
Dividend Disbursing and Transfer Agent
Boston Financial Data Services, Inc.
2000 Crown Colony Drive
Quincy, Massachusetts 02169
Custodian
State Street Bank and Trust Company
One Lincoln Street
Boston, Massachusetts 02111
Legal Counsel
Dechert LLP
1095 Avenue of the Americas
New York, New York 10036
Counsel to the Independent Directors
Perkins Coie LLP
30 Rockefeller Plaza
New York, New York 10112
Independent Registered Public Accounting Firm
Ernst & Young LLP
200 Clarendon Street
Boston, Massachusetts 02116
Reporting to Shareholders
Each Morgan Stanley fund provides a complete schedule of portfolio holdings in its semi-annual and annual reports within 60 days of the end of the fund's second and fourth fiscal quarters. The semi-annual and annual reports are filed electronically with the Securities and Exchange Commission (SEC) on Form N-CSRS and Form N-CSR, respectively. Morgan Stanley also delivers the semi-annual and annual reports to fund shareholders and makes these reports available on its public website, www.morganstanley.com/im. Each Morgan Stanley fund also files a complete schedule of portfolio holdings with the SEC for the fund's first and third fiscal quarters on Form N-Q. Morgan Stanley does not deliver the reports for the first and third fiscal quarters to shareholders, nor are the reports posted to the Morgan Stanley public website. You may, however, obtain the Form N-Q filings (as well as the Form N-CSR and N-CSRS filings) by accessing the SEC's website, www.sec.gov. You may also review and copy them at the SEC's Public Reference Room in Washington, DC. Information on the operation of the SEC's Public Reference Room may be obtained by calling the SEC toll free at 1 (800) SEC-0330. You can also request copies of these materials, upon payment of a duplicating fee, by electronic request at the SEC's email address (publicinfo@sec.gov) or by writing the Public Reference Room of the SEC, 100 F Street, NE, Washington, DC 20549-0102.
Proxy Voting Policies and Procedures and Proxy Voting Record
You may obtain a copy of the Fund's Proxy Voting Policy and Procedures and information regarding how the Fund voted proxies relating to portfolio securities during the most recent twelve-month period ended June 30, without charge, upon request, by calling toll free 1 (800) 548-7786 or by visiting our website at www.morganstanley.com/im. This information is also available on the SEC's website at www.sec.gov.
This report is authorized for distribution only when preceded or accompanied by a prospectus or summary prospectus of the applicable Portfolio of Morgan Stanley Institutional Fund, Inc., which describes in detail the Portfolio's investment policies, risks, fees and expenses. Please read the prospectus carefully before you invest or send money. For additional information, including information regarding the investments comprising the Portfolio, please visit our website at www.morganstanley.com/im or call toll free 1 (800) 548-7786.
38
(This Page has been left blank intentionally.)
(This Page has been left blank intentionally.)
(This Page has been left blank intentionally.)
Printed in U.S.A.
This Report has been prepared for shareholders and may be distributed to others only if preceded or accompanied by a current prospectus.
Morgan Stanley Investment Management Inc.
522 Fifth Avenue
New York, New York 10036
© 2017 Morgan Stanley. Morgan Stanley Distribution, Inc.

IFIIIOANN
1697236 EXP. 02.28.18

Morgan Stanley Institutional Fund, Inc.
International Real Estate Portfolio
Annual Report
December 31, 2016

Morgan Stanley Institutional Fund, Inc.
Annual Report — December 31, 2016
Shareholders' Letter | | | 2 | | |
Expense Example | | | 3 | | |
Investment Overview | | | 4 | | |
Portfolio of Investments | | | 7 | | |
Statement of Assets and Liabilities | | | 9 | | |
Statement of Operations | | | 11 | | |
Statements of Changes in Net Assets | | | 12 | | |
Financial Highlights | | | 14 | | |
Notes to Financial Statements | | | 19 | | |
Report of Independent Registered Public Accounting Firm | | | 26 | | |
Federal Tax Notice | | | 27 | | |
Privacy Notice | | | 28 | | |
Director and Officer Information | | | 31 | | |
This report is authorized for distribution only when preceded or accompanied by a prospectus or summary prospectus of the applicable Portfolio of Morgan Stanley Institutional Fund, Inc. To receive a prospectus and/or statement of additional information (SAI), which contains more complete information such as investment objectives, charges, expenses, policies for voting proxies, risk considerations, and describes in detail each of the Portfolio's investment policies to the prospective investor, please call toll free 1 (800) 548-7786. Please read the prospectuses carefully before you invest or send money.
Additionally, you can access information about the Portfolio, including performance, characteristics, and investment team commentary, through Morgan Stanley Investment Management's website: www.morganstanley.com/im.
Market forecasts provided in this report may not necessarily come to pass. There is no guarantee that any sectors mentioned will continue to perform as discussed herein or that securities in such sectors will be held by the Portfolio in the future. There is no assurance that a Portfolio will achieve its investment objective. Portfolios are subject to market risk, which is the possibility that market values of securities owned by the Portfolio will decline and, therefore, the value of the Portfolio's shares may be less than what you paid for them. Accordingly, you can lose money investing in this Portfolio. Please see the prospectus for more complete information on investment risks.
1
Morgan Stanley Institutional Fund, Inc.
Annual Report — December 31, 2016
Shareholders' Letter (unaudited)
Dear Shareholders,
We are pleased to provide this Annual report, in which you will learn how your investment in International Real Estate Portfolio (the "Portfolio") performed during the latest twelve-month period.
Morgan Stanley Investment Management is a client-centric, investor-led organization. Our global presence, intellectual capital, and breadth of products and services enable us to partner with investors to meet the evolving challenges of today's financial markets. We aim to deliver superior investment service and to empower our clients to make the informed decisions that help them reach their investment goals.
As always, we thank you for selecting Morgan Stanley Investment Management, and look forward to working with you in the months and years ahead.
Sincerely,

John H. Gernon
President and Principal Executive Officer
January 2017
2
Morgan Stanley Institutional Fund, Inc.
Annual Report — December 31, 2016
Expense Example (unaudited)
International Real Estate Portfolio
As a shareholder of the Portfolio, you incur two types of costs: (1) transactional costs, including redemption fees; and (2) ongoing costs, which may include advisory fees, administration fees, distribution and shareholder services fees and other Portfolio expenses. This example is intended to help you understand your ongoing costs (in dollars) of investing in the Portfolio and to compare these costs with the ongoing costs of investing in other mutual funds.
This example is based on an investment of $1,000 invested at the beginning of the six-month period ended December 31, 2016 and held for the entire six-month period.
Actual Expenses
The table below provides information about actual account values and actual expenses. You may use the information in this table, together with the amount you invested, to estimate the expenses that you paid over the period. Simply divide your account value by $1,000 (for example, an $8,600 account value divided by $1,000 = 8.6), then multiply the result by the number in the table under the heading entitled "Actual Expenses Paid During Period" to estimate the expenses you paid on your account during this period.
Hypothetical Example for Comparison Purposes
The table below provides information about hypothetical account values and hypothetical expenses based on the Portfolio's actual expense ratio and an assumed rate of return of 5% per year before expenses, which is not the Portfolio's actual return. The hypothetical account values and expenses may not be used to estimate the actual ending account balance or expenses you paid for the period. You may use this information to compare the ongoing costs of investing in the Portfolio and other funds. To do so, compare this 5% hypothetical example with the 5% hypothetical examples that appear in the shareholder reports of the other funds.
Please note that the expenses shown in the table are meant to highlight your ongoing costs only and do not reflect any transactional costs, such as sales charges (loads) and redemption fees. Therefore, the information for each class in the table is useful in comparing ongoing costs only, and will not help you determine the relative total costs of owning different funds. In addition, if these transactional costs were included, your costs would have been higher.
| | | Beginning
Account
Value
7/1/16 | | Actual Ending
Account
Value
12/31/16 | | Hypothetical
Ending Account
Value | | Actual
Expenses
Paid
During
Period* | | Hypothetical
Expenses Paid
During Period* | | Net
Expense
Ratio
During
Period** | |
International Real Estate Portfolio Class I | | $ | 1,000.00 | | | $ | 972.20 | | | $ | 1,020.11 | | | $ | 4.96 | | | $ | 5.08 | | | | 1.00 | %*** | |
International Real Estate Portfolio Class A | | | 1,000.00 | | | | 970.30 | | | | 1,018.35 | | | | 6.69 | | | | 6.85 | | | | 1.35 | *** | |
International Real Estate Portfolio Class L | | | 1,000.00 | | | | 967.80 | | | | 1,015.84 | | | | 9.15 | | | | 9.37 | | | | 1.85 | *** | |
International Real Estate Portfolio Class C | | | 1,000.00 | | | | 966.70 | | | | 1,014.58 | | | | 10.38 | | | | 10.63 | | | | 2.10 | *** | |
International Real Estate Portfolio Class IS | | | 1,000.00 | | | | 972.70 | | | | 1,020.26 | | | | 4.81 | | | | 4.93 | | | | 0.97 | *** | |
* Expenses are calculated using each Portfolio Class' annualized net expense ratio (as disclosed), multiplied by the average account value over the period, and multiplied by 184/366 (to reflect the most recent one-half year period).
** Annualized.
*** Refer to Note F in the Notes to Financial Statements for discussion of prior period custodian out-of-pocket expenses that were reimbursed in the current period.
3
Morgan Stanley Institutional Fund, Inc.
Annual Report — December 31, 2016
Investment Overview (unaudited)
International Real Estate Portfolio
The Portfolio seeks to provide current income and long-term capital appreciation.
Performance
For the year ended December 31, 2016, the Portfolio's Class I shares had a total return based on net asset value and reinvestment of distributions per share of –1.38%, net of fees. The Portfolio's Class I shares underperformed against the Portfolio's benchmark, the FTSE EPRA/NAREIT Developed ex-North America Real Estate — Net Total Return Index (the "Index"), which returned 0.25%, and the MSCI EAFE Index, which returned 1.00%.
Factors Affecting Performance
• The international real estate securities market gained 0.25% during the 12-month period ending December 31, 2016, as measured by the Index. Property stocks in Asia, measured by the FTSE EPRA/NAREIT Developed Asia Index, gained 6.1% in U.S. dollar ("USD") terms,(i) driven by particular strength in the Asian real estate investment trust ("REIT") markets, which benefited from strong investor demand for yield investments. Property stocks in Europe declined 7.3% in USD terms, as measured by the FTSE EPRA/NAREIT Developed Europe Index,(i) primarily driven by significant weakness in the U.K. due to the outcome of the Brexit vote and resultant prolonged period of uncertainty, as well as the associated depreciation of the pound.
• The Portfolio underperformed during the year primarily due to performance during the first half of 2016, where there was investor preference for yield-oriented stocks and/or market segments with perceived defensive characteristics, irrespective of underlying valuations (which included the Japan REIT sector, German residential sector and Australia). Investors also appeared to rotate away from segments where cash flows were viewed as more economically sensitive despite trading at very attractive discounted valuations (which included Hong Kong and Tokyo). The overweight to the U.K. prior to Brexit was also a significant detractor from full-year performance due to the outcome of the vote.
• The Portfolio outperformed in the second half of 2016 amid a partial reversal of the lower-for-longer investment theme that dominated the market in the
first half of 2016, though this was not sufficient to offset the underperformance in the first half of the year.
• Performance within the Asian and European regional portfolios detracted from relative performance. Top-down global allocation contributed, and cash held in the Portfolio detracted. In Asia, stock selection in Japan (overweight to Japan real estate operating companies, or REOCs, and underweight to Japan REITs) and Hong Kong detracted from the Portfolio's relative performance. In Europe, the Portfolio benefited from the overweight to Norway and stock selection in Sweden; but this was more than offset by the negative effect of the overweight to the U.K. and underweight to Germany.
Management Strategies
• The Portfolio is comprised of two regional portfolios with a global allocation which weights the European and Asian regions relative to the Index based on our view of the relative attractiveness of each region in terms of underlying real estate fundamentals and public market valuations. Moreover, both of the regional portfolios reflect our core investment philosophy as a real estate value investor, which results in the ownership of stocks that we believe provide the best valuation relative to their underlying real estate values, while maintaining portfolio diversification. Our company-specific research leads us to specific preferences for sub-segments within each of the property sectors and countries. For the period ended December 31, 2016, the Portfolio was overweight the Asian listed property sector and underweight the European listed property sector.
• In Asia, the Hong Kong REOCs continue to represent the most significant overweight, as we believe the stocks offer highly attractive value and trade at the widest discrepancy between private and public valuations among public listed global property markets. The companies traded at an average 46% discount to net asset values ("NAVs"),(ii) as share prices continued to reflect the various risks that could potentially impact operating fundamentals and did not reflect the solid recurring cash flows and asset values in the private market. The discounted valuations are further accentuated
(i) Source: FTSE
(ii) Source: Morgan Stanley Investment Management, as of December 31, 2016
4
Morgan Stanley Institutional Fund, Inc.
Annual Report — December 31, 2016
Investment Overview (unaudited) (cont'd)
International Real Estate Portfolio
as the Hong Kong REOCs maintained very modest leverage levels. There has been strength in office market fundamentals, but continued concerns with regard to retail and residential. Commercial asset transaction activity at peak pricing has been elevated. Sentiment, which continues to be a significant driver of share price movements, became even more cautious due to macro concerns regarding China and additional residential tightening measures in Hong Kong. The Japan REOCs ended the period trading at an average 22% discount to NAVs,(ii) as currency volatility weighed on sentiment and investors remained cautious after a volatile year of policy changes. In wide contrast, the Japan REITs continued to trade at a premium of 15%,(ii) with premium valuations driven by domestic investor attraction to yield, purchases by the Bank of Japan ("BOJ") and optimism towards the success of quantitative easing measures by the BOJ. As a result, we believe the Japan REOCs offer value versus the Japan REITs and we remain overweight to the REOCs and underweight the REITs within Japan. The Portfolio was underweight Singapore and Australia on relative valuation.
• In Europe, property stocks in the U.K. ended the period trading at an 11% discount to NAVs, with the U.K. Majors trading at a 20% discount and the London office specialists trading at a 16% discount.(ii) These discounts appear to be well in excess of expected asset value declines and reflect concerns over a prolonged period of uncertainty in the wake of the Brexit vote. To date, transaction and leasing activity have indicated these declines may be more modest than initially expected. Property stocks on the Continent ended the period trading at a 3% premium to NAVs.(ii) Share prices have been supported by monetary easing measures by the European Central Bank ("ECB") despite lackluster operating fundamentals. The Portfolio remains overweight the U.K., in particular the U.K. Majors and London office specialists, which trade at attractive discounts, and underweight the Continent due to the disparity in valuations.
• Investment values for prime real estate assets have improved due to investors' widespread acceptance of low expected returns from real estate in today's low return environment, coupled with continued credit availability and low borrowing rates. Very strong
capital flows to the sector have driven asset pricing to new peak levels in most prime markets. In Western markets, valuations for prime assets have largely recovered back to or in excess of peak levels achieved in 2007. In Asian markets, Hong Kong has witnessed an unusually active investment market at peak pricing due to both improved cash flows and capitalization rate compression, whereas in Japan and Australia, asset value improvements have largely been due to cap rate compression with a modest recovery in fundamentals.
• In Western markets, prime assets feature strong occupancy levels and rents continue to exhibit growth, although there is a trend toward decelerating rental growth in most sectors. In Europe, markets on the Continent have shown lackluster rental growth; in the U.K., there will likely be a prolonged period of uncertainty in the wake of the Brexit vote. In Asia, there has been continued strength in the Hong Kong office market featuring low vacancy levels and continued demand from Mainland Chinese financial service tenants. In contrast, the Singapore office market featured a continuation of weak rental levels due to recent new supply. In Tokyo, the office market features high occupancy levels but there is still only modest improvements in office rents. There has been an apparent stabilization in Hong Kong retail sales, which had been impaired primarily by reduced Chinese tourism spending, particularly for luxury items, which thus far resulted in relatively flattish rents in 2016 for Hong Kong malls. Operating fundamentals in the Australian retail sector have been stable.
(ii) Source: Morgan Stanley Investment Management, as of December 31, 2016
5
Morgan Stanley Institutional Fund, Inc.
Annual Report — December 31, 2016
Investment Overview (unaudited) (cont'd)
International Real Estate Portfolio

* Minimum Investment for Class I shares
In accordance with SEC regulations, the Portfolio's performance shown assumes that all recurring fees (including management fees) were deducted and all dividends and distributions were reinvested. The performance of Class A, L, C and IS shares will vary from the performance of Class I shares based upon their different inception dates and will be negatively impacted by additional fees assessed to those classes (if applicable).
Performance Compared to the FTSE EPRA/NAREIT Developed ex-North America Real Estate — Net Total Return Index(1) and the MSCI EAFE Index(2)
| | | Period Ended December 31, 2016
Total Returns(3) | |
| | | | | Average Annual | |
| | | One
Year | | Five
Years | | Ten
Years | | Since
Inception(8) | |
Portfolio — Class I Shares
w/o sales charges(4) | | | –1.38 | % | | | 8.06 | % | | | –2.44 | % | | | 7.18 | % | |
Portfolio — Class A Shares
w/o sales charges(4) | | | –1.78 | | | | 7.72 | | | | –2.72 | | | | 6.90 | | |
Portfolio — Class A Shares with
maximum 5.25% sales charges(4) | | | –6.95 | | | | 6.57 | | | | –3.24 | | | | 6.60 | | |
Portfolio — Class L Shares w/o
sales charges(5) | | | –2.23 | | | | — | | | | — | | | | 3.97 | | |
Portfolio — Class C Shares
w/o sales charges(7) | | | –2.44 | | | | — | | | | — | | | | –8.39 | | |
Portfolio — Class C Shares with
maximum 1.00% deferred sales
charges(7) | | | –3.38 | | | | — | | | | — | | | | –8.39 | | |
Portfolio — Class IS Shares w/o
sales charges(6) | | | –1.33 | | | | — | | | | — | | | | –0.42 | | |
FTSE EPRA/NAREIT Developed
ex-North America Real
Estate — Net Total Return Index | | | 0.25 | | | | 8.73 | | | | –0.39 | | | | 5.55 | | |
MSCI EAFE Index | | | 1.00 | | | | 6.53 | | | | 0.75 | | | | 3.78 | | |
Performance data quoted represents past performance, which is no guarantee of future results, and current performance may be lower or higher than the figures shown. Performance assumes that all dividends and distributions, if any, were reinvested. For the most recent month-end performance figures, please visit www.morganstanley.com/im. Investment return and principal value will fluctuate so that Portfolio shares, when redeemed, may be worth more or less than their original cost. Total returns do not reflect the deduction of taxes that a shareholder would pay on Portfolio distributions or the redemption of Portfolio shares. Performance of share classes will vary due to difference in sales charges and expenses.
(1) The FTSE EPRA/NAREIT Developed ex-North America Real Estate — Net Total Return Index is a free float-adjusted market capitalization weighted index designed to reflect the stock performance of companies engaged in the European and Asian real estate markets. The performance of the Index is listed in U.S. dollars and assumes reinvestment of dividends. "Net Total Return" reflects a reduction in total returns after taking into account the withholding tax on dividends by certain foreign countries represented in the Index for periods after 2/18/05 (gross returns used prior to 2/18/05). The Index is unmanaged and its returns do not include any sales charges or fees. Such costs would lower performance. It is not possible to invest directly in an index.
(2) The MSCI EAFE Index (Europe, Australasia, Far East) is a free float-adjusted market capitalization index that is designed to measure the international equity market performance of developed markets, excluding the US & Canada. The term "free float" represents the portion of shares outstanding that are deemed to be available for purchase in the public equity markets by investors. The MSCI EAFE Index currently consists of 21 developed market country indices. The performance of the Index is listed in U.S. dollars and assumes reinvestment of net dividends. The Index is unmanaged and its returns do not include any sales charges or fees. Such costs would lower performance. It is not possible to invest directly in an index.
(3) Total returns for the Portfolio reflect fees waived and expenses reimbursed, if applicable, by the Adviser. Without such waivers and reimbursements, total returns would have been lower.
(4) Commenced operations on October 1, 1997.
(5) Commenced offering on April 27, 2012.
(6) Commenced offering on September 13, 2013.
(7) Commenced offering on April 30, 2015.
(8) For comparative purposes, average annual since inception returns listed for the Indexes refer to the inception date of Class I of the Portfolio, not the inception of the Index.
6
Morgan Stanley Institutional Fund, Inc.
Annual Report — December 31, 2016
Portfolio of Investments
International Real Estate Portfolio
| | | Shares | | Value
(000) | |
Common Stocks (100.2%) | |
Australia (12.2%) | |
Dexus Property Group REIT | | | 40,373 | | | $ | 280 | | |
Goodman Group REIT | | | 134,879 | | | | 694 | | |
GPT Group REIT | | | 151,687 | | | | 551 | | |
Investa Office Fund REIT | | | 35,319 | | | | 120 | | |
Mirvac Group REIT | | | 181,984 | | | | 280 | | |
Scentre Group REIT | | | 347,851 | | | | 1,165 | | |
Shopping Centres Australasia Property Group REIT | | | 18,390 | | | | 29 | | |
Stockland REIT | | | 119,314 | | | | 395 | | |
Vicinity Centres REIT | | | 117,373 | | | | 253 | | |
Westfield Corp. REIT | | | 151,298 | | | | 1,024 | | |
| | | | 4,791 | | |
Austria (0.5%) | |
Atrium European Real Estate Ltd. | | | 20,534 | | | | 85 | | |
BUWOG AG (a) | | | 5,250 | | | | 122 | | |
| | | | 207 | | |
China (0.9%) | |
China Overseas Land & Investment Ltd. (b) | | | 62,000 | | | | 164 | | |
China Resources Land Ltd. (b) | | | 20,000 | | | | 45 | | |
Global Logistic Properties Ltd. | | | 84,500 | | | | 129 | | |
| | | | 338 | | |
Finland (0.8%) | |
Citycon Oyj | | | 134,248 | | | | 331 | | |
France (7.9%) | |
Fonciere Des Regions REIT | | | 1,578 | | | | 138 | | |
Gecina SA REIT | | | 3,810 | | | | 527 | | |
ICADE REIT | | | 5,392 | | | | 385 | | |
Klepierre REIT | | | 14,302 | | | | 562 | | |
Mercialys SA REIT | | | 441 | | | | 9 | | |
Unibail-Rodamco SE REIT | | | 6,234 | | | | 1,488 | | |
| | | | 3,109 | | |
Germany (3.9%) | |
ADO Properties SA (c) | | | 4,266 | | | | 144 | | |
Deutsche Wohnen AG | | | 17,397 | | | | 547 | | |
LEG Immobilien AG (a) | | | 815 | | | | 63 | | |
Vonovia SE | | | 23,617 | | | | 768 | | |
| | | | 1,522 | | |
Hong Kong (23.9%) | |
Cheung Kong Property Holdings Ltd. | | | 202,500 | | | | 1,242 | | |
Hang Lung Properties Ltd. | | | 49,000 | | | | 104 | | |
Henderson Land Development Co., Ltd. | | | 78,193 | | | | 416 | | |
Hongkong Land Holdings Ltd. | | | 283,100 | | | | 1,792 | | |
Hysan Development Co., Ltd. | | | 206,836 | | | | 855 | | |
Link REIT | | | 140,395 | | | | 912 | | |
New World Development Co., Ltd. | | | 322,748 | | | | 341 | | |
Sino Land Co., Ltd. | | | 40,945 | | | | 61 | | |
Sun Hung Kai Properties Ltd. | | | 165,456 | | | | 2,091 | | |
Swire Properties Ltd. | | | 384,700 | | | | 1,062 | | |
Wharf Holdings Ltd. (The) | | | 79,117 | | | | 526 | | |
| | | | 9,402 | | |
| | | Shares | | Value
(000) | |
Ireland (1.6%) | |
Green REIT PLC | | | 192,000 | | | $ | 277 | | |
Hibernia REIT PLC | | | 266,973 | | | | 346 | | |
| | | | 623 | | |
Italy (0.1%) | |
Beni Stabili SpA REIT (a) | | | 73,285 | | | | 42 | | |
Japan (26.2%) | |
Activia Properties, Inc. REIT | | | 70 | | | | 330 | | |
Advance Residence Investment Corp. REIT | | | 51 | | | | 135 | | |
Daiwa Office Investment Corp. REIT | | | 30 | | | | 151 | | |
GLP J-REIT | | | 208 | | | | 239 | | |
Hulic Co., Ltd. | | | 12,500 | | | | 111 | | |
Invincible Investment Corp. REIT | | | 645 | | | | 291 | | |
Japan Hotel REIT Investment Corp. REIT | | | 146 | | | | 98 | | |
Japan Real Estate Investment Corp. REIT | | | 96 | | | | 523 | | |
Japan Rental Housing Investments, Inc. REIT | | | 95 | | | | 64 | | |
Japan Retail Fund Investment Corp. REIT | | | 166 | | | | 336 | | |
Kenedix Office Investment Corp. REIT | | | 16 | | | | 92 | | |
Mitsubishi Estate Co., Ltd. | | | 117,000 | | | | 2,330 | | |
Mitsui Fudosan Co., Ltd. | | | 96,000 | | | | 2,222 | | |
Mori Hills Investment Corp. REIT | | | 82 | | | | 111 | | |
Mori Trust Sogo Reit, Inc. REIT | | | 146 | | | | 230 | | |
Nippon Building Fund, Inc. REIT | | | 121 | | | | 670 | | |
Nippon Prologis, Inc. REIT | | | 136 | | | | 278 | | |
Nomura Real Estate Master Fund, Inc. REIT | | | 376 | | | | 569 | | |
Orix, Inc. J-REIT | | | 122 | | | | 193 | | |
Sumitomo Realty & Development Co., Ltd. | | | 36,000 | | | | 957 | | |
United Urban Investment Corp. REIT | | | 257 | | | | 391 | | |
| | | | 10,321 | | |
Malta (0.4%) | |
BGP Holdings PLC (a)(d)(e) | | | 4,769,371 | | | | 153 | | |
Netherlands (1.7%) | |
Eurocommercial Properties N.V. CVA REIT | | | 8,982 | | | | 346 | | |
Vastned Retail N.V. REIT | | | 2,245 | | | | 87 | | |
Wereldhave N.V. REIT | | | 4,797 | | | | 216 | | |
| | | | 649 | | |
Norway (1.1%) | |
Entra ASA (c) | | | 38,296 | | | | 380 | | |
Norwegian Property ASA | | | 49,340 | | | | 57 | | |
| | | | 437 | | |
Singapore (2.4%) | |
Ascendas Real Estate Investment Trust REIT | | | 113,100 | | | | 177 | | |
CapitaLand Commercial Trust Ltd. REIT | | | 126,500 | | | | 129 | | |
CapitaLand Ltd. | | | 75,400 | | | | 157 | | |
CapitaLand Mall Trust REIT | | | 128,400 | | | | 167 | | |
City Developments Ltd. | | | 2,300 | | | | 13 | | |
EC World Real Estate Investment Trust Unit | | | 77,600 | | | | 39 | | |
Mapletree Commercial Trust REIT | | | 71,600 | | | | 69 | | |
Mapletree Logistics Trust REIT | | | 34,945 | | | | 25 | | |
Suntec REIT | | | 30,300 | | | | 35 | | |
UOL Group Ltd. | | | 36,722 | | | | 152 | | |
| | | | 963 | | |
The accompanying notes are an integral part of the financial statements.
7
Morgan Stanley Institutional Fund, Inc.
Annual Report — December 31, 2016
Portfolio of Investments (cont'd)
International Real Estate Portfolio
| | | Shares | | Value
(000) | |
Spain (1.4%) | |
Hispania Activos Inmobiliarios SAU REIT | | | 7,977 | | | $ | 94 | | |
Inmobiliaria Colonial SA | | | 29,882 | | | | 207 | | |
Merlin Properties Socimi SA REIT | | | 21,454 | | | | 233 | | |
| | | | 534 | | |
Sweden (1.7%) | |
Atrium Ljungberg AB, Class B | | | 9,430 | | | | 147 | | |
Castellum AB | | | 17,395 | | | | 238 | | |
Hufvudstaden AB, Class A | | | 18,148 | | | | 287 | | |
Wihlborgs Fastigheter AB | | | 783 | | | | 15 | | |
| | | | 687 | | |
Switzerland (1.7%) | |
PSP Swiss Property AG (Registered) | | | 6,858 | | | | 593 | | |
Swiss Prime Site AG (Registered) (a) | | | 764 | | | | 62 | | |
| | | | 655 | | |
United Kingdom (11.8%) | |
British Land Co., PLC REIT | | | 108,892 | | | | 845 | | |
Capital & Regional PLC REIT | | | 66,529 | | | | 45 | | |
Derwent London PLC REIT | | | 13,890 | | | | 475 | | |
Great Portland Estates PLC REIT | | | 49,810 | | | | 410 | | |
Hammerson PLC REIT | | | 58,316 | | | | 412 | | |
Intu Properties PLC REIT | | | 61,193 | | | | 212 | | |
Kennedy Wilson Europe Real Estate PLC | | | 8,115 | | | | 96 | | |
Land Securities Group PLC REIT | | | 89,444 | | | | 1,175 | | |
LXB Retail Properties PLC (a) | | | 168,042 | | | | 76 | | |
Segro PLC REIT | | | 44,974 | | | | 254 | | |
Shaftesbury PLC REIT | | | 1,243 | | | | 14 | | |
St. Modwen Properties PLC | | | 63,821 | | | | 239 | | |
Unite Group PLC | | | 12,867 | | | | 96 | | |
Urban & Civic PLC | | | 82,645 | | | | 230 | | |
Workspace Group PLC REIT | | | 7,506 | | | | 73 | | |
| | | | 4,652 | | |
Total Common Stocks (Cost $38,177) | | | 39,416 | | |
Short-Term Investment (0.5%) | |
Investment Company (0.5%) | |
Morgan Stanley Institutional Liquidity
Funds — Treasury Portfolio —
Institutional Class (See Note G)
(Cost $216) | | | 215,831 | | | | 216 | | |
Total Investments (100.7%) (Cost $38,393) (f) | | | 39,632 | | |
Liabilities in Excess of Other Assets (–0.7%) | | | (260 | ) | |
Net Assets (100.0%) | | $ | 39,372 | | |
Country assignments and aggregations are based generally on third party vendor classifications and information, and may be different from the assignments and aggregations under the policies set forth in the Portfolio's prospectus and/or statement of additional information relating to geographic classifications.
(a) Non-income producing security.
(b) Security trades on the Hong Kong exchange.
(c) 144A security — Certain conditions for public sale may exist. Unless otherwise noted, these securities are deemed to be liquid.
(d) At December 31, 2016, the Portfolio held a fair valued security valued at approximately $153,000, representing 0.4% of net assets. This security has been fair valued as determined in good faith under procedures established by and under the general supervision of the Fund's Directors.
(e) Security has been deemed illiquid at December 31, 2016.
(f) At December 31, 2016, the aggregate cost for federal income tax purposes is approximately $45,706,000. The aggregate gross unrealized appreciation is approximately $2,932,000 and the aggregate gross unrealized depreciation is approximately $9,006,000, resulting in net unrealized depreciation of approximately $6,074,000.
CVA Certificaten Van Aandelen.
REIT Real Estate Investment Trust.
Portfolio Composition
Classification | | Percentage of
Total Investments | |
Diversified | | | 53.7 | % | |
Retail | | | 19.6 | | |
Office | | | 15.2 | | |
Other* | | | 6.1 | | |
Residential | | | 5.4 | | |
Total Investments | | | 100.0 | % | |
* Industries and/or investment types representing less than 5% of total investments.
The accompanying notes are an integral part of the financial statements.
8
Morgan Stanley Institutional Fund, Inc.
Annual Report — December 31, 2016
International Real Estate Portfolio
Statement of Assets and Liabilities | | December 31, 2016
(000) | |
Assets: | |
Investments in Securities of Unaffiliated Issuers, at Value (Cost $38,177) | | $ | 39,416 | | |
Investment in Security of Affiliated Issuer, at Value (Cost $216) | | | 216 | | |
Total Investments in Securities, at Value (Cost $38,393) | | | 39,632 | | |
Foreign Currency, at Value (Cost $18) | | | 17 | | |
Dividends Receivable | | | 85 | | |
Tax Reclaim Receivable | | | 28 | | |
Receivable for Portfolio Shares Sold | | | 7 | | |
Receivable from Affiliate | | | — | @ | |
Other Assets | | | 41 | | |
Total Assets | | | 39,810 | | |
Liabilities: | |
Payable for Portfolio Shares Redeemed | | | 203 | | |
Payable for Advisory Fees | | | 107 | | |
Payable for Professional Fees | | | 59 | | |
Payable for Custodian Fees | | | 38 | | |
Payable for Sub Transfer Agency Fees — Class I | | | 4 | | |
Payable for Sub Transfer Agency Fees — Class A | | | 1 | | |
Payable for Sub Transfer Agency Fees — Class C | | | — | @ | |
Payable for Transfer Agency Fees — Class I | | | 1 | | |
Payable for Transfer Agency Fees — Class A | | | 1 | | |
Payable for Transfer Agency Fees — Class L | | | — | @ | |
Payable for Transfer Agency Fees — Class C | | | — | @ | |
Payable for Transfer Agency Fees — Class IS | | | 1 | | |
Payable for Administration Fees | | | 3 | | |
Payable for Directors' Fees and Expenses | | | 1 | | |
Payable for Shareholder Services Fees — Class A | | | — | @ | |
Payable for Distribution and Shareholder Services Fees — Class L | | | — | @ | |
Payable for Distribution and Shareholder Services Fees — Class C | | | — | @ | |
Other Liabilities | | | 19 | | |
Total Liabilities | | | 438 | | |
Net Assets | | $ | 39,372 | | |
Net Assets Consist Of: | |
Paid-in-Capital | | $ | 550,550 | | |
Accumulated Undistributed Net Investment Income | | | 359 | | |
Accumulated Net Realized Loss | | | (512,769 | ) | |
Unrealized Appreciation (Depreciation) on: | |
Investments | | | 1,239 | | |
Foreign Currency Translations | | | (7 | ) | |
Net Assets | | $ | 39,372 | | |
The accompanying notes are an integral part of the financial statements.
9
Morgan Stanley Institutional Fund, Inc.
Annual Report — December 31, 2016
International Real Estate Portfolio
Statement of Assets and Liabilities (cont'd) | | December 31, 2016
(000) | |
CLASS I: | |
Net Assets | | $ | 26,213 | | |
| Shares Outstanding $0.001 par value shares of beneficial interest (unlimited shares authorized) (not in 000's) | | | 1,495,598 | | |
Net Asset Value, Offering and Redemption Price Per Share | | $ | 17.53 | | |
CLASS A: | |
Net Assets | | $ | 1,512 | | |
| Shares Outstanding $0.001 par value shares of beneficial interest (unlimited shares authorized) (not in 000's) | | | 86,191 | | |
Net Asset Value, Redemption Price Per Share | | $ | 17.54 | | |
Maximum Sales Load | �� | | 5.25 | % | |
Maximum Sales Charge | | $ | 0.97 | | |
Maximum Offering Price Per Share | | $ | 18.51 | | |
CLASS L: | |
Net Assets | | $ | 53 | | |
| Shares Outstanding $0.001 par value shares of beneficial interest (unlimited shares authorized) (not in 000's) | | | 3,038 | | |
Net Asset Value, Offering and Redemption Price Per Share | | $ | 17.42 | | |
CLASS C: | |
Net Assets | | $ | 21 | | |
| Shares Outstanding $0.001 par value shares of beneficial interest (unlimited shares authorized) (not in 000's) | | | 1,237 | | |
Net Asset Value, Offering and Redemption Price Per Share | | $ | 17.32 | | |
CLASS IS: | |
Net Assets | | $ | 11,573 | | |
| Shares Outstanding $0.001 par value shares of beneficial interest (unlimited shares authorized) (not in 000's) | | | 660,672 | | |
Net Asset Value, Offering and Redemption Price Per Share | | $ | 17.52 | | |
@ Amount is less than $500.
The accompanying notes are an integral part of the financial statements.
10
Morgan Stanley Institutional Fund, Inc.
Annual Report — December 31, 2016
International Real Estate Portfolio
Statement of Operations | | Year Ended
December 31, 2016
(000) | |
Investment Income: | |
Dividends from Securities of Unaffiliated Issuers (Net of $168 of Foreign Taxes Withheld) | | $ | 2,567 | | |
Dividends from Security of Affiliated Issuer (Note G) | | | 1 | | |
Total Investment Income | | | 2,568 | | |
Expenses: | |
Advisory Fees (Note B) | | | 592 | | |
Professional Fees | | | 117 | | |
Custodian Fees (Note F) | | | 83 | | |
Registration Fees | | | 73 | | |
Administration Fees (Note C) | | | 59 | | |
Sub Transfer Agency Fees — Class I | | | 25 | | |
Sub Transfer Agency Fees — Class A | | | 3 | | |
Sub Transfer Agency Fees — Class C | | | — | @ | |
Shareholder Reporting Fees | | | 16 | | |
Transfer Agency Fees — Class I (Note E) | | | 4 | | |
Transfer Agency Fees — Class A (Note E) | | | 3 | | |
Transfer Agency Fees — Class L (Note E) | | | 2 | | |
Transfer Agency Fees — Class C (Note E) | | | 2 | | |
Transfer Agency Fees — Class IS (Note E) | | | 2 | | |
Pricing Fees | | | 10 | | |
Shareholder Services Fees — Class A (Note D) | | | 5 | | |
Distribution and Shareholder Services Fees — Class L (Note D) | | | — | @ | |
Distribution and Shareholder Services Fees — Class C (Note D) | | | — | @ | |
Directors' Fees and Expenses | | | 4 | | |
Other Expenses | | | 19 | | |
Total Expenses | | | 1,019 | | |
Waiver of Advisory Fees (Note B) | | | (156 | ) | |
Reimbursement of Class Specific Expenses — Class I (Note B) | | | (13 | ) | |
Reimbursement of Class Specific Expenses — Class A (Note B) | | | (3 | ) | |
Reimbursement of Class Specific Expenses — Class L (Note B) | | | (2 | ) | |
Reimbursement of Class Specific Expenses — Class C (Note B) | | | (2 | ) | |
Reimbursement of Class Specific Expenses — Class IS (Note B) | | | (2 | ) | |
Rebate from Morgan Stanley Affiliate (Note G) | | | (1 | ) | |
Reimbursement of Custodian Fees (Note F) | | | (98 | ) | |
Net Expenses | | | 742 | | |
Net Investment Income | | | 1,826 | | |
Realized Loss: | |
Investments Sold | | | (4,050 | ) | |
Foreign Currency Transactions | | | (9 | ) | |
Net Realized Loss | | | (4,059 | ) | |
Change in Unrealized Appreciation (Depreciation): | |
Investments | | | 2,789 | | |
Foreign Currency Translations | | | 3 | | |
Net Change in Unrealized Appreciation (Depreciation) | | | 2,792 | | |
Net Realized Loss and Change in Unrealized Appreciation (Depreciation) | | | (1,267 | ) | |
Net Increase in Net Assets Resulting from Operations | | $ | 559 | | |
@ Amount is less than $500.
The accompanying notes are an integral part of the financial statements.
11
Morgan Stanley Institutional Fund, Inc.
Annual Report — December 31, 2016
International Real Estate Portfolio
Statements of Changes in Net Assets | | Year Ended
December 31, 2016
(000) | | Year Ended
December 31, 2015
(000) | |
Increase (Decrease) in Net Assets: | |
Operations: | |
Net Investment Income | | $ | 1,826 | | | $ | 1,774 | | |
Net Realized Loss | | | (4,059 | ) | | | (4,948 | ) | |
Net Change in Unrealized Appreciation (Depreciation) | | | 2,792 | | | | 199 | | |
Net Increase (Decrease) in Net Assets Resulting from Operations | | | 559 | | | | (2,975 | ) | |
Distributions from and/or in Excess of: | |
Class I: | |
Net Investment Income | | | (1,543 | ) | | | (1,912 | ) | |
Class A: | |
Net Investment Income | | | (77 | ) | | | (53 | ) | |
Class H:** | |
Net Investment Income | | | — | | | | (1 | ) | |
Class L: | |
Net Investment Income | | | (2 | ) | | | (1 | ) | |
Class C: | |
Net Investment Income | | | (1 | ) | | | (— | @) | |
Class IS: | |
Net Investment Income | | | (639 | ) | | | (294 | ) | |
Total Distributions | | | (2,262 | ) | | | (2,261 | ) | |
Capital Share Transactions:(1) | |
Class I: | |
Subscribed | | | 2,882 | | | | 5,627 | | |
Distributions Reinvested | | | 1,354 | | | | 1,015 | | |
Redeemed | | | (44,218 | ) | | | (29,676 | ) | |
Class A: | |
Subscribed | | | 16 | | | | 128 | | |
Distributions Reinvested | | | 67 | | | | 47 | | |
Redeemed | | | (764 | ) | | | (525 | ) | |
Class H:** | |
Distributions Reinvested | | | — | | | | 1 | | |
Redeemed | | | (10 | ) | | | (103 | ) | |
Class L: | |
Distributions Reinvested | | | 2 | | | | 1 | | |
Redeemed | | | — | | | | (40 | ) | |
Class C: | |
Subscribed | | | — | | | | 25 | * | |
Distributions Reinvested | | | (— | @) | | | — | @* | |
Redeemed | | | — | | | | (— | @)* | |
Class IS: | |
Subscribed | | | 266 | | | | 19,970 | | |
Distributions Reinvested | | | 639 | | | | 294 | | |
Redeemed | | | (9,958 | ) | | | (555 | ) | |
Net Decrease in Net Assets Resulting from Capital Share Transactions | | | (49,724 | ) | | | (3,791 | ) | |
Redemption Fees | | | — | @ | | | — | @ | |
Total Decrease in Net Assets | | | (51,427 | ) | | | (9,027 | ) | |
Net Assets: | |
Beginning of Period | | | 90,799 | | | | 99,826 | | |
End of Period (Including Accumulated Undistributed Net Investment Income and Distributions in Excess of
Net Investment Income of $359 and $(357), respectively) | | $ | 39,372 | | | $ | 90,799 | | |
The accompanying notes are an integral part of the financial statements.
12
Morgan Stanley Institutional Fund, Inc.
Annual Report — December 31, 2016
International Real Estate Portfolio
Statements of Changes in Net Assets (cont'd) | | Year Ended
December 31, 2016
(000) | | Year Ended
December 31, 2015
(000) | |
(1) Capital Share Transactions: | |
Class I: | |
Shares Subscribed | | | 160 | | | | 272 | | |
Shares Issued on Distributions Reinvested | | | 78 | | | | 52 | | |
Shares Redeemed | | | (2,346 | ) | | | (1,473 | ) | |
Net Decrease in Class I Shares Outstanding | | | (2,108 | ) | | | (1,149 | ) | |
Class A: | |
Shares Subscribed | | | 1 | | | | 6 | | |
Shares Issued on Distributions Reinvested | | | 4 | | | | 2 | | |
Shares Redeemed | | | (42 | ) | | | (26 | ) | |
Net Decrease in Class A Shares Outstanding | | | (37 | ) | | | (18 | ) | |
Class H:** | |
Shares Issued on Distributions Reinvested | | | — | | | | — | @@ | |
Shares Redeemed | | | (1 | ) | | | (5 | ) | |
Net Decrease in Class H Shares Outstanding | | | (1 | ) | | | (5 | ) | |
Class L: | |
Shares Issued on Distributions Reinvested | | | — | @@ | | | — | @@ | |
Shares Redeemed | | | — | | | | (2 | ) | |
Net Increase (Decrease) in Class L Shares Outstanding | | | — | @@ | | | (2 | ) | |
Class C: | |
Shares Subscribed | | | — | | | | 1 | * | |
Shares Issued on Distributions Reinvested | | | — | @@ | | | — | @@* | |
Shares Redeemed | | | — | | | | (— | @@)* | |
Net Increase in Class C Shares Outstanding | | | — | @@ | | | 1 | | |
Class IS: | |
Shares Subscribed | | | 14 | | | | 1,002 | | |
Shares Issued on Distributions Reinvested | | | 37 | | | | 15 | | |
Shares Redeemed | | | (509 | ) | | | (27 | ) | |
Net Increase (Decrease) in Class IS Shares Outstanding | | | (458 | ) | | | 990 | | |
* For the period April 30, 2015 through December 31, 2015.
** Class H shares were liquidated on February 29, 2016.
@ Amount is less than $500.
@@ Amount is less than 500 shares.
The accompanying notes are an integral part of the financial statements.
13
Morgan Stanley Institutional Fund, Inc.
Annual Report — December 31, 2016
Financial Highlights
International Real Estate Portfolio
| | | Class I | |
| | | Year Ended December 31, | |
Selected Per Share Data and Ratios | | 2016(1) | | 2015 | | 2014 | | 2013 | | 2012 | |
Net Asset Value, Beginning of Period | | $ | 18.72 | | | $ | 19.84 | | | $ | 19.99 | | | $ | 20.16 | | | $ | 14.66 | | |
Income (Loss) from Investment Operations: | |
Net Investment Income (2) | | | 0.46 | | | | 0.37 | | | | 0.39 | | | | 0.41 | | | | 0.44 | | |
Net Realized and Unrealized Gain (Loss) | | | (0.73 | ) | | | (1.00 | ) | | | (0.07 | ) | | | 0.65 | | | | 5.89 | | |
Total from Investment Operations | | | (0.27 | ) | | | (0.63 | ) | | | 0.32 | | | | 1.06 | | | | 6.33 | | |
Distributions from and/or in Excess of: | |
Net Investment Income | | | (0.92 | ) | | | (0.49 | ) | | | (0.47 | ) | | | (1.23 | ) | | | (0.83 | ) | |
Redemption Fees | | | 0.00 | (3) | | | 0.00 | (3) | | | 0.00 | (3) | | | 0.00 | (3) | | | 0.00 | (3) | |
Net Asset Value, End of Period | | $ | 17.53 | | | $ | 18.72 | | | $ | 19.84 | | | $ | 19.99 | | | $ | 20.16 | | |
Total Return (4) | | | (1.38 | )% | | | (3.29 | )% | | | 1.61 | % | | | 5.56 | % | | | 44.05 | % | |
Ratios and Supplemental Data: | |
Net Assets, End of Period (Thousands) | | $ | 26,213 | | | $ | 67,459 | | | $ | 94,269 | | | $ | 130,023 | | | $ | 138,390 | | |
Ratio of Expenses to Average Net Assets (7) | | | 1.00 | %(5) | | | 1.00 | %(5) | | | 1.00 | %(5) | | | 1.00 | %(5) | | | 1.00 | %(5) | |
Ratio of Net Investment Income to Average Net Assets (7) | | | 2.47 | %(5) | | | 1.84 | %(5) | | | 1.91 | %(5) | | | 2.00 | %(5) | | | 2.54 | %(5) | |
Ratio of Rebate from Morgan Stanley Affiliates to Average Net Assets | | | 0.00 | %(6) | | | 0.00 | %(6) | | | 0.00 | %(6) | | | 0.00 | %(6) | | | 0.00 | %(6) | |
Portfolio Turnover Rate | | | 21 | % | | | 37 | % | | | 59 | % | | | 40 | % | | | 31 | % | |
(7) Supplemental Information on the Ratios to Average Net Assets: | |
Ratios Before Expense Limitation: | |
Expenses to Average Net Assets | | | 1.37 | % | | | 1.29 | % | | | 1.16 | % | | | 1.23 | %(5) | | | 1.12 | % | |
Net Investment Income to Average Net Assets | | | 2.10 | % | | | 1.55 | % | | | 1.75 | % | | | 1.76 | %(5) | | | 2.42 | % | |
(1) Refer to Note F in the Notes to Financial Statements for discussion of prior period custodian out-of-pocket expenses that were reimbursed in the current period. The amount of the reimbursement was immaterial on a per share basis and did not impact the total return of Class I shares. The Ratio of Expenses to Average Net Assets and the Ratio of Net Investment Income to Average Net Assets would be unchanged as the reimbursement of custodian fees was offset against current period expense waivers/reimbursements with no impact to net expenses or net investment income.
(2) Per share amount is based on average shares outstanding.
(3) Amount is less than $0.005 per share.
(4) Calculated based on the net asset value as of the last business day of the period.
(5) The Ratios of Expenses and Net Investment Income reflect the rebate of certain Portfolio expenses in connection with the investments in Morgan Stanley affiliates during the period. The effect of the rebate on the ratios is disclosed in the above table as "Ratio of Rebate from Morgan Stanley Affiliates to Average Net Assets."
(6) Amount is less than 0.005%.
The accompanying notes are an integral part of the financial statements.
14
Morgan Stanley Institutional Fund, Inc.
Annual Report — December 31, 2016
Financial Highlights
International Real Estate Portfolio
| | | Class A | |
| | | Year Ended December 31, | |
Selected Per Share Data and Ratios | | 2016(1) | | 2015 | | 2014 | | 2013 | | 2012 | |
Net Asset Value, Beginning of Period | | $ | 18.73 | | | $ | 19.84 | | | $ | 19.98 | | | $ | 20.14 | | | $ | 14.65 | | |
Income (Loss) from Investment Operations: | |
Net Investment Income (2) | | | 0.39 | | | | 0.30 | | | | 0.31 | | | | 0.35 | | | | 0.39 | | |
Net Realized and Unrealized Gain (Loss) | | | (0.73 | ) | | | (1.00 | ) | | | (0.06 | ) | | | 0.66 | | | | 5.89 | | |
Total from Investment Operations | | | (0.34 | ) | | | (0.70 | ) | | | 0.25 | | | | 1.01 | | | | 6.28 | | |
Distributions from and/or in Excess of: | |
Net Investment Income | | | (0.85 | ) | | | (0.41 | ) | | | (0.39 | ) | | | (1.17 | ) | | | (0.79 | ) | |
Redemption Fees | | | 0.00 | (3) | | | — | | | | 0.00 | (3) | | | 0.00 | (3) | | | 0.00 | (3) | |
Net Asset Value, End of Period | | $ | 17.54 | | | $ | 18.73 | | | $ | 19.84 | | | $ | 19.98 | | | $ | 20.14 | | |
Total Return (4) | | | (1.78 | )% | | | (3.61 | )% | | | 1.27 | % | | | 5.28 | % | | | 43.71 | % | |
Ratios and Supplemental Data: | |
Net Assets, End of Period (Thousands) | | $ | 1,512 | | | $ | 2,308 | | | $ | 2,792 | | | $ | 3,331 | | | $ | 4,431 | | |
Ratio of Expenses to Average Net Assets (8) | | | 1.35 | %(5) | | | 1.35 | %(5) | | | 1.35 | %(5) | | | 1.27 | %(5)(6) | | | 1.25 | %(5) | |
Ratio of Net Investment Income to Average Net Assets (8) | | | 2.10 | %(5) | | | 1.48 | %(5) | | | 1.55 | %(5) | | | 1.72 | %(5) | | | 2.23 | %(5) | |
Ratio of Rebate from Morgan Stanley Affiliates to Average Net Assets | | | 0.00 | %(7) | | | 0.00 | %(7) | | | 0.00 | %(7) | | | 0.00 | %(7) | | | 0.00 | %(7) | |
Portfolio Turnover Rate | | | 21 | % | | | 37 | % | | | 59 | % | | | 40 | % | | | 31 | % | |
(8) Supplemental Information on the Ratios to Average Net Assets: | |
Ratios Before Expense Limitation: | |
Expenses to Average Net Assets | | | 1.85 | % | | | 1.70 | % | | | 1.58 | % | | | 1.53 | %(5) | | | 1.38 | % | |
Net Investment Income to Average Net Assets | | | 1.60 | % | | | 1.13 | % | | | 1.32 | % | | | 1.47 | %(5) | | | 2.10 | % | |
(1) Refer to Note F in the Notes to Financial Statements for discussion of prior period custodian out-of-pocket expenses that were reimbursed in the current period. The amount of the reimbursement was immaterial on a per share basis and did not impact the total return of Class A shares. The Ratio of Expenses to Average Net Assets and the Ratio of Net Investment Income to Average Net Assets would be unchanged as the reimbursement of custodian fees was offset against current period expense waivers/reimbursements with no impact to net expenses or net investment income.
(2) Per share amount is based on average shares outstanding.
(3) Amount is less than $0.005 per share.
(4) Calculated based on the net asset value which does not reflect sales charges, if applicable, as of the last business day of the period.
(5) The Ratios of Expenses and Net Investment Income reflect the rebate of certain Portfolio expenses in connection with the investments in Morgan Stanley affiliates during the period. The effect of the rebate on the ratios is disclosed in the above table as "Ratio of Rebate from Morgan Stanley Affiliates to Average Net Assets."
(6) Effective September 16, 2013, the Adviser has agreed to limit the ratio of expenses to average net assets to the maximum ratio of 1.35% for Class A shares. Prior to September 16, 2013, the maximum ratio was 1.25% for Class A shares.
(7) Amount is less than 0.005%.
The accompanying notes are an integral part of the financial statements.
15
Morgan Stanley Institutional Fund, Inc.
Annual Report — December 31, 2016
Financial Highlights
International Real Estate Portfolio
| | | Class L | |
| | | Year Ended December 31, | | Period from
April 27, 2012(2) to | |
Selected Per Share Data and Ratios | | 2016(1) | | 2015 | | 2014 | | 2013 | | December 31, 2012 | |
Net Asset Value, Beginning of Period | | $ | 18.61 | | | $ | 19.69 | | | $ | 19.86 | | | $ | 20.13 | | | $ | 17.31 | | |
Income (Loss) from Investment Operations: | |
Net Investment Income (3) | | | 0.29 | | | | 0.18 | | | | 0.21 | | | | 0.22 | | | | 0.16 | | |
Net Realized and Unrealized Gain (Loss) | | | (0.71 | ) | | | (0.97 | ) | | | (0.06 | ) | | | 0.68 | | | | 3.40 | | |
Total from Investment Operations | | | (0.42 | ) | | | (0.79 | ) | | | 0.15 | | | | 0.90 | | | | 3.56 | | |
Distributions from and/or in Excess of: | |
Net Investment Income | | | (0.77 | ) | | | (0.29 | ) | | | (0.32 | ) | | | (1.17 | ) | | | (0.74 | ) | |
Redemption Fees | | | 0.00 | (4) | | | 0.00 | (4) | | | 0.00 | (4) | | | — | | | | — | | |
Net Asset Value, End of Period | | $ | 17.42 | | | $ | 18.61 | | | $ | 19.69 | | | $ | 19.86 | | | $ | 20.13 | | |
Total Return (5) | | | (2.23 | )% | | | (4.11 | )% | | | 0.75 | % | | | 4.73 | % | | | 21.28 | %(9) | |
Ratios and Supplemental Data: | |
Net Assets, End of Period (Thousands) | | $ | 53 | | | $ | 55 | | | $ | 95 | | | $ | 73 | | | $ | 12 | | |
Ratio of Expenses to Average Net Assets (11) | | | 1.85 | %(6) | | | 1.85 | %(6) | | | 1.85 | %(6) | | | 1.81 | %(6)(7) | | | 1.75 | %(6)(10) | |
Ratio of Net Investment Income to Average Net Assets (11) | | | 1.58 | %(6) | | | 0.90 | %(6) | | | 1.05 | %(6) | | | 1.08 | %(6) | | | 1.37 | %(6)(10) | |
Ratio of Rebate from Morgan Stanley Affiliates to Average Net Assets | | | 0.00 | %(8) | | | 0.00 | %(8) | | | 0.00 | %(8) | | | 0.00 | %(8) | | | 0.00 | %(8)(10) | |
Portfolio Turnover Rate | | | 21 | % | | | 37 | % | | | 59 | % | | | 40 | % | | | 31 | % | |
(11) Supplemental Information on the Ratios to Average Net Assets: | |
Ratios Before Expense Limitation: | |
Expenses to Average Net Assets | | | 5.51 | % | | | 4.58 | % | | | 3.90 | % | | | 3.44 | %(6) | | | 1.93 | %(10) | |
Net Investment Income (Loss) to Average Net Assets | | | (2.08 | )% | | | (1.83 | )% | | | (1.00 | )% | | | (0.55 | )%(6) | | | 1.19 | %(10) | |
(1) Refer to Note F in the Notes to Financial Statements for discussion of prior period custodian out-of-pocket expenses that were reimbursed in the current period. The amount of the reimbursement was immaterial on a per share basis and did not impact the total return of Class L shares. The Ratio of Expenses to Average Net Assets and the Ratio of Net Investment Income to Average Net Assets would be unchanged as the reimbursement of custodian fees was offset against current period expense waivers/reimbursements with no impact to net expenses or net investment income.
(2) Commencement of Offering.
(3) Per share amount is based on average shares outstanding.
(4) Amount is less than $0.005 per share.
(5) Calculated based on the net asset value as of the last business day of the period.
(6) The Ratios of Expenses and Net Investment Income reflect the rebate of certain Portfolio expenses in connection with the investments in Morgan Stanley affiliates during the period. The effect of the rebate on the ratios is disclosed in the above table as "Ratio of Rebate from Morgan Stanley Affiliates to Average Net Assets."
(7) Effective September 16, 2013, the Adviser has agreed to limit the ratio of expenses to average net assets to the maximum ratio of 1.85% for Class L shares. Prior to September 16, 2013, the maximum ratio was 1.75% for Class L shares.
(8) Amount is less than 0.005%.
(9) Not Annualized.
(10) Annualized.
The accompanying notes are an integral part of the financial statements.
16
Morgan Stanley Institutional Fund, Inc.
Annual Report — December 31, 2016
Financial Highlights
International Real Estate Portfolio
| | | Class C | |
Selected Per Share Data and Ratios | | Year Ended
December 31, 2016(1) | | Period from
April 30, 2015(2) to
December 31, 2015 | |
Net Asset Value, Beginning of Period | | $ | 18.50 | | | $ | 21.28 | | |
Income (Loss) from Investment Operations: | |
Net Investment Income (3) | | | 0.25 | | | | 0.06 | | |
Net Realized and Unrealized Gain | | | (0.71 | ) | | | (2.48 | ) | |
Total from Investment Operations | | | (0.46 | ) | | | (2.42 | ) | |
Distributions from and/or in Excess of: | |
Net Investment Income | | | (0.72 | ) | | | (0.36 | ) | |
Redemption Fees | | | 0.00 | (4) | | | 0.00 | (4) | |
Net Asset Value, End of Period | | $ | 17.32 | | | $ | 18.50 | | |
Total Return (5) | | | (2.44 | )% | | | (11.47 | )%(8) | |
Ratios and Supplemental Data: | |
Net Assets, End of Period (Thousands) | | $ | 21 | | | $ | 22 | | |
Ratio of Expenses to Average Net Assets (10) | | | 2.10 | %(6) | | | 2.10 | %(6)(9) | |
Ratio of Net Investment Income to Average Net Assets (10) | | | 1.33 | %(6) | | | 0.45 | %(6)(9) | |
Ratio of Rebate from Morgan Stanley Affiliates to Average Net Assets | | | 0.00 | %(7) | | | 0.00 | %(7)(9) | |
Portfolio Turnover Rate | | | 21 | % | | | 37 | % | |
(10) Supplemental Information on the Ratios to Average Net Assets: | |
Ratios Before Expense Limitation: | |
Expense to Average Net Assets | | | 12.39 | % | | | 10.98 | %(9) | |
Net Investment Loss to Average Net Assets | | | (8.96 | )% | | | (8.43 | )% | |
(1) Refer to Note F in the Notes to Financial Statements for discussion of prior period custodian out-of-pocket expenses that were reimbursed in the current period. The amount of the reimbursement was immaterial on a per share basis and did not impact the total return of Class C shares. The Ratio of Expenses to Average Net Assets and the Ratio of Net Investment Income to Average Net Assets would be unchanged as the reimbursement of custodian fees was offset against current period expense waivers/reimbursements with no impact to net expenses or net investment income.
(2) Commencement of Offering.
(3) Per share amount is based on average shares outstanding.
(4) Amount is less than $0.005 per share.
(5) Calculated based on the net asset value which does not reflect sales charges, if applicable, as of the last business day of the period.
(6) The Ratios of Expenses and Net Investment Income reflect the rebate of certain Portfolio expenses in connection with the investments in Morgan Stanley affiliates during the period. The effect of the rebate on the ratios is disclosed in the above table as "Ratio of Rebate from Morgan Stanley Affiliates to Average Net Assets."
(7) Amount is less than 0.005%.
(8) Not Annualized.
(9) Annualized.
The accompanying notes are an integral part of the financial statements.
17
Morgan Stanley Institutional Fund, Inc.
Annual Report — December 31, 2016
Financial Highlights
International Real Estate Portfolio
| | | Class IS | |
| | | Year Ended December 31, | | Period from
September 13, 2013(2) to | |
Selected Per Share Data and Ratios | | 2016(1) | | 2015 | | 2014 | | December 31, 2013 | |
Net Asset Value, Beginning of Period | | $ | 18.71 | | | $ | 19.83 | | | $ | 19.99 | | | $ | 19.97 | | |
Income (Loss) from Investment Operations: | |
Net Investment Income (3) | | | 0.47 | | | | 0.37 | | | | 0.23 | | | | 0.11 | | |
Net Realized and Unrealized Gain (Loss) | | | (0.73 | ) | | | (1.00 | ) | | | 0.09 | | | | 0.22 | | |
Total from Investment Operations | | | (0.26 | ) | | | (0.63 | ) | | | 0.32 | | | | 0.33 | | |
Distributions from and/or in Excess of: | |
Net Investment Income | | | (0.93 | ) | | | (0.49 | ) | | | (0.48 | ) | | | (0.31 | ) | |
Redemption Fees | | | 0.00 | (4) | | | 0.00 | (4) | | | 0.00 | (4) | | | — | | |
Net Asset Value, End of Period | | $ | 17.52 | | | $ | 18.71 | | | $ | 19.83 | | | $ | 19.99 | | |
Total Return (5) | | | (1.33 | )% | | | (3.26 | )% | | | 1.60 | % | | | 1.68 | %(9) | |
Ratios and Supplemental Data: | |
Net Assets, End of Period (Thousands) | | $ | 11,573 | | | $ | 20,944 | | | $ | 2,557 | | | $ | 10 | | |
Ratio of Expenses to Average Net Assets (11) | | | 0.97 | %(7) | | | 0.97 | %(7) | | | 0.97 | %(7) | | | 0.97 | %(6)(7)(10) | |
Ratio of Net Investment Income to Average Net Assets (11) | | | 2.52 | %(7) | | | 1.86 | %(7) | | | 1.14 | %(7) | | | 1.76 | %(7)(10) | |
Ratio of Rebate from Morgan Stanley Affiliates to Average Net Assets | | | 0.00 | %(8) | | | 0.00 | %(8) | | | 0.00 | %(8) | | | 0.00 | %(8)(10) | |
Portfolio Turnover Rate | | | 21 | % | | | 37 | % | | | 59 | % | | | 40 | % | |
(11) Supplemental Information on the Ratios to Average Net Assets: | |
Ratios Before Expense Limitation: | |
Expenses to Average Net Assets | | | 1.33 | % | | | 1.30 | % | | | 1.13 | % | | | 6.46 | %(10) | |
Net Investment Income (Loss) to Average Net Assets | | | 2.16 | % | | | 1.53 | % | | | 0.98 | % | | | (3.73 | )%(10) | |
(1) Refer to Note F in the Notes to Financial Statements for discussion of prior period custodian out-of-pocket expenses that were reimbursed in the current period. The amount of the reimbursement was immaterial on a per share basis and did not impact the total return of Class IS shares. The Ratio of Expenses to Average Net Assets and the Ratio of Net Investment Income to Average Net Assets would be unchanged as the reimbursement of custodian fees was offset against current period expense waivers/reimbursements with no impact to net expenses or net investment income.
(2) Commencement of Offering.
(3) Per share amount is based on average shares outstanding.
(4) Amount is less than $0.005 per share.
(5) Calculated based on the net asset value as of the last business day of the period.
(6) Effective September 16, 2013, the Adviser has agreed to limit the ratio of expenses to average net assets to the maximum ratio of 0.97% for Class IS shares.
(7) The Ratios of Expenses and Net Investment Income reflect the rebate of certain Portfolio expenses in connection with the investments in Morgan Stanley affiliates during the period. The effect of the rebate on the ratios is disclosed in the above table as "Ratio of Rebate from Morgan Stanley Affiliates to Average Net Assets."
(8) Amount is less than 0.005%.
(9) Not Annualized.
(10) Annualized.
The accompanying notes are an integral part of the financial statements.
18
Morgan Stanley Institutional Fund, Inc.
Annual Report — December 31, 2016
Notes to Financial Statements
Morgan Stanley Institutional Fund, Inc. (the "Fund") is registered under the Investment Company Act of 1940, as amended (the "Act"), as an open-end management investment company. The Fund is comprised of twenty-nine separate, active, diversified and non-diversified portfolios (individually referred to as a "Portfolio", collectively as the "Portfolios"). The Fund applies investment company accounting and reporting guidance.
The accompanying financial statements relate to the International Real Estate Portfolio. The Portfolio seeks to provide current income and long-term capital appreciation.
The Portfolio offers five classes of shares — Class I, Class A, Class L, Class C and Class IS. On April 30, 2015, the Portfolio suspended offering of Class L shares. Existing Class L shareholders may invest through reinvestment of dividends and distributions.
Effective February 29, 2016, the Fund's Board of Directors (the "Directors") approved the elimination of the H share class.
A. Significant Accounting Policies: The following significant accounting policies are in conformity with U.S. generally accepted accounting principles ("GAAP"). Such policies are consistently followed by the Fund in the preparation of its financial statements. GAAP may require management to make estimates and assumptions that affect the reported amounts and disclosures in the financial statements. Actual results may differ from those estimates.
1. Security Valuation: (1) An equity portfolio security listed or traded on an exchange is valued at its latest reported sales price (or at the exchange official closing price if such exchange reports an official closing price), and if there were no sales on a given day and if there is no official exchange closing price for that day, the security is valued at the mean between the last reported bid and asked prices if such bid and asked prices are available on the relevant exchanges; (2) all other equity portfolio securities for which over-the-counter ("OTC") market quotations are readily available are valued at the latest reported sales price (or at the market official closing price if such market reports an official closing price), and if there was no trading in the security on a given day and if there is no official closing price from relevant markets for that day, the security is valued at the mean between the last reported bid and asked prices if such bid and asked prices are available on the relevant markets. Listed equity securities not traded on the valuation date with no reported bid and asked
prices available on the exchange are valued at the mean between the current bid and asked prices obtained from one or more reputable brokers or dealers. An unlisted equity security that does not trade on the valuation date and for which bid and asked prices from the relevant markets are unavailable is valued at the mean between the current bid and asked prices obtained from one or more reputable brokers or dealers. In cases where a security is traded on more than one exchange, the security is valued on the exchange designated as the primary market; (3) certain portfolio securities may be valued by an outside pricing service/vendor approved by the Directors. The pricing service/vendor may employ a pricing model that takes into account, among other things, bids, yield spreads, and/or other market data and specific security characteristics. Alternatively, if a valuation is not available from an outside pricing service/vendor, and the security trades on an exchange, the security may be valued at its latest reported sale price (or at the exchange official closing price if such exchange reports an official closing price), prior to the time when assets are valued. If there are no sales on a given day and if there is no official exchange closing price for that day, the security is valued at the mean between the last reported bid and asked prices if such bid and asked prices are available in the relevant exchanges; (4) when market quotations are not readily available, including circumstances under which Morgan Stanley Investment Management Inc. (the "Adviser") or Morgan Stanley Investment Management Limited ("MSIM Limited") and Morgan Stanley Investment Management Company ("MSIM Company") (together, the "Sub-Advisers") determines that the closing price, last sale price or the mean between the last reported bid and asked prices are not reflective of a security's market value, portfolio securities are valued at their fair value as determined in good faith under procedures established by and under the general supervision of the Directors. Occasionally, developments affecting the closing prices of securities and other assets may occur between the times at which valuations of such securities are determined (that is, close of the foreign market on which the securities trade) and the close of business of the New York Stock Exchange ("NYSE"). If developments occur during such periods that are expected to materially affect the value of such securities, such valuations may be adjusted to reflect the estimated fair value of such securities as of the close of the NYSE, as determined in good faith by the Directors or by the Adviser using a pricing service and/or procedures approved by the Directors; (5) quotations of foreign portfolio securities, other assets
19
Morgan Stanley Institutional Fund, Inc.
Annual Report — December 31, 2016
Notes to Financial Statements (cont'd)
and liabilities and forward contracts stated in foreign currency are translated into U.S. dollar equivalents at the prevailing market rates prior to the close of the NYSE; and (6) investments in mutual funds, including the Morgan Stanley Institutional Liquidity Funds, are valued at the net asset value ("NAV") as of the close of each business day.
The Directors have responsibility for determining in good faith the fair value of the investments, and the Directors may appoint others, such as the Fund's Adviser or a valuation committee, to assist the Directors in determining fair value and to make the actual calculations pursuant to the fair valuation methodologies previously approved by the Directors. Under procedures approved by the Directors, the Fund's Adviser has formed a Valuation Committee whose members are approved by the Directors. The Valuation Committee provides administration and oversight of the Fund's valuation policies and procedures, which are reviewed at least annually by the Directors. These procedures allow the Fund to utilize independent pricing services, quotations from securities and financial instrument dealers, and other market sources to determine fair value.
The Fund has procedures to determine the fair value of securities and other financial instruments for which market prices are not readily available. Under these procedures, the Valuation Committee convenes on a regular and ad hoc basis to review such securities and considers a number of factors, including valuation methodologies and significant unobservable valuation inputs, when arriving at fair value. The Valuation Committee may employ a market-based approach which may use related or comparable assets or liabilities, recent transactions, market multiples, book values, and other relevant information for the investment to determine the fair value of the investment. An income-based valuation approach may also be used in which the anticipated future cash flows of the investment are discounted to calculate fair value. Discounts may also be applied due to the nature or duration of any restrictions on the disposition of the investments. Due to the inherent uncertainty of valuations of such investments, the fair values may differ significantly from the values that would have been used had an active market existed. The Valuation Committee employs various methods for calibrating these valuation approaches including a regular review of valuation methodologies, key inputs and assumptions, transactional back-testing or disposition analysis, and reviews of any related market activity.
The Portfolio invests a significant portion of its assets in securities of real estate investment trusts ("REITs"). The market's perception of prospective declines in private real estate values and other financial assets may result in increased volatility of market prices that can negatively impact the valuation of certain issuers held by the Portfolio.
2. Fair Value Measurement: Financial Accounting Standards Board ("FASB") Accounting Standards CodificationTM ("ASC") 820, "Fair Value Measurement" ("ASC 820"), defines fair value as the value that the Fund would receive to sell an investment or pay to transfer a liability in a timely transaction with an independent buyer in the principal market, or in the absence of a principal market, the most advantageous market for the investment or liability. ASC 820 establishes a three-tier hierarchy to distinguish between (1) inputs that reflect the assumptions market participants would use in valuing an asset or liability developed based on market data obtained from sources independent of the reporting entity (observable inputs) and (2) inputs that reflect the reporting entity's own assumptions about the assumptions market participants would use in valuing an asset or liability developed based on the best information available in the circumstances (unobservable inputs) and to establish classification of fair value measurements for disclosure purposes. Various inputs are used in determining the value of the Fund's investments. The inputs are summarized in the three broad levels listed below.
• Level 1 – unadjusted quoted prices in active markets for identical investments
• Level 2 – other significant observable inputs (including quoted prices for similar investments, interest rates, prepayment speeds, credit risk, etc.)
• Level 3 – significant unobservable inputs including the Fund's own assumptions in determining the fair value of investments. Factors considered in making this determination may include, but are not limited to, information obtained by contacting the issuer, analysts, or the appropriate stock exchange (for exchange-traded securities), analysis of the issuer's financial statements or other available documents and, if necessary, available information concerning other securities in similar circumstances
20
Morgan Stanley Institutional Fund, Inc.
Annual Report — December 31, 2016
Notes to Financial Statements (cont'd)
The inputs or methodology used for valuing securities are not necessarily an indication of the risk associated with investing in those securities and the determination of the significance of a particular input to the fair value measurement in its entirety requires judgment and considers factors specific to each security.
The following is a summary of the inputs used to value the Portfolio's investments as of December 31, 2016.
Investment Type | | Level 1
Unadjusted
quoted
prices
(000) | | Level 2
Other
significant
observable
inputs
(000) | | Level 3
Significant
unobservable
inputs
(000) | | Total
(000) | |
Assets: | |
Common Stocks | |
Diversified | | $ | 21,109 | | | $ | — | | | $ | 153 | | | $ | 21,262 | | |
Industrial | | | 1,835 | | | | — | | | | — | | | | 1,835 | | |
Lodging/Resorts | | | 98 | | | | — | | | | — | | | | 98 | | |
Mixed Industrial/Office | | | 280 | | | | — | | | | — | | | | 280 | | |
Office | | | 6,038 | | | | — | | | | — | | | | 6,038 | | |
Residential | | | 2,148 | | | | — | | | | — | | | | 2,148 | | |
Retail | | | 7,755 | | | | — | | | | — | | | | 7,755 | | |
Total Common Stocks | | | 39,263 | | | | — | | | | 153 | | | | 39,416 | | |
Short-Term Investment | |
Investment Company | | | 216 | | | | — | | | | — | | | | 216 | | |
Total Assets | | $ | 39,479 | | | $ | — | | | $ | 153 | | | $ | 39,632 | | |
Transfers between investment levels may occur as the markets fluctuate and/or the availability of data used in an investment's valuation changes. The Portfolio recognizes transfers between the levels as of the end of the
period. As of December 31, 2016, securities with a total value of approximately $37,545,000 transferred from Level 2 to Level 1. Securities that were valued using other significant observable inputs at December 31, 2015 were valued using unadjusted quoted prices at December 31, 2016. At December 31, 2015, the fair value of certain securities were adjusted due to developments which occurred between the time of the close of the foreign markets on which they trade and the close of business on the NYSE which resulted in their Level 2 classification.
Following is a reconciliation of investments in which significant unobservable inputs (Level 3) were used in determining fair value.
| | | Common
Stock
(000) | |
Beginning Balance | | $ | — | † | |
Purchases | | | — | | |
Sales | | | — | | |
Amortization of discount | | | — | | |
Transfers in | | | — | | |
Transfers out | | | — | | |
Corporate actions | | | — | | |
Change in unrealized appreciation (depreciation) | | | 153 | | |
Realized gains (losses) | | | — | | |
Ending Balance | | $ | 153 | | |
Net change in unrealized appreciation (depreciation) from investments
still held as of December 31, 2016 | | $ | 153 | | |
† Includes one security which is valued at zero.
The following table presents additional information about valuation techniques and inputs used for investments that are measured at fair value and categorized within Level 3 as of December 31, 2016.
| | Fair Value at
December 31, 2016
(000) | | Valuation
Technique | | Unobservable
Input | | Range | | Selected
Value | | Impact to
Valuation from an
increase in input | |
Diversified | |
Common Stock | | $ | 153 | | | Market Transaction Method | | Transaction Valuation | | $ | 0.03 | | | $ | 0.03 | | | $ | 0.03 | | | Increase | |
| | | | | | Discount for Lack of
Marketability | | | 50.0 | % | | | 50.0 | % | | | 50.0 | % | | Decrease | |
3. Foreign Currency Translation and Foreign Investments: The books and records of the Portfolio are maintained in U.S. dollars. Foreign currency amounts are translated into U.S. dollars as follows:
– investments, other assets and liabilities at the prevailing rate of exchange on the valuation date;
– investment transactions and investment income at the prevailing rates of exchange on the dates of such transactions.
Although the net assets of the Portfolio are presented at the foreign exchange rates and market values at the close of the period, the Portfolio does not isolate that portion of the results of operations arising as a result of changes in the foreign exchange rates from the fluctuations arising from changes in the market prices of securities held at period end. Similarly, the Portfolio does not isolate the effect of changes in foreign exchange rates from the fluctuations arising from changes in the market prices of securities sold during the period. Accordingly, realized
21
Morgan Stanley Institutional Fund, Inc.
Annual Report — December 31, 2016
Notes to Financial Statements (cont'd)
and unrealized foreign currency gains (losses) on investments in securities are included in the reported net realized and unrealized gains (losses) on investment transactions and balances. However, pursuant to U.S. federal income tax regulations, gains and losses from certain foreign currency transactions and the foreign currency portion of gains and losses realized on sales and maturities of foreign denominated debt securities are treated as ordinary income for U.S. federal income tax purposes.
Net realized gains (losses) on foreign currency transactions represent net foreign exchange gains (losses) from foreign currency forward exchange contracts, disposition of foreign currencies, currency gains (losses) realized between the trade and settlement dates on securities transactions, and the difference between the amount of investment income and foreign withholding taxes recorded on the Portfolio's books and the U.S. dollar equivalent amounts actually received or paid. Net unrealized currency gains (losses) from valuing foreign currency denominated assets and liabilities at period end exchange rates are reflected as a component of unrealized appreciation (depreciation) in the Statement of Assets and Liabilities. The change in unrealized currency gains (losses) on foreign currency translations for the period is reflected in the Statement of Operations.
Foreign security and currency transactions may involve certain considerations and risks not typically associated with those of U.S. dollar denominated transactions as a result of, among other factors, fluctuations of exchange rates in relation to the U.S. dollar, the possibility of lower levels of governmental supervision and regulation of foreign securities markets and the possibility of political or economic instability.
Governmental approval for foreign investments may be required in advance of making an investment under certain circumstances in some countries, and the extent of foreign investments in domestic companies may be subject to limitation in other countries. Foreign ownership limitations also may be imposed by the charters of individual companies to prevent, among other concerns, violations of foreign investment limitations. As a result, an additional class of shares (identified as "Foreign" in the Portfolio of Investments) may be created and offered for investment. The "local" and "foreign shares" market values may differ. In the absence of trading of the foreign shares in such markets, the
Portfolio values the foreign shares at the closing exchange price of the local shares.
4. Redemption Fees: The Portfolio will assess a 2% redemption fee on Class I shares, Class A shares, Class L shares, Class C shares and Class IS shares, which is paid directly to the Portfolio, for shares redeemed or exchanged within thirty days of purchase, subject to certain exceptions. The redemption fee is designed to protect the Portfolio and its remaining shareholders from the effects of short-term trading. These fees, if any, are included in the Statements of Changes in Net Assets.
5. Indemnifications: The Fund enters into contracts that contain a variety of indemnifications. The Fund's maximum exposure under these arrangements is unknown. However, the Fund has not had prior claims or losses pursuant to these contracts and expects the risk of loss to be remote.
6. Dividends and Distributions to Shareholders: Dividend income and distributions to shareholders are recorded on the ex-dividend date. Dividends from net investment income, if any, are declared and paid annually. Net realized capital gains, if any, are distributed at least annually.
7. Security Transactions, Income and Expenses: Security transactions are accounted for on the trade date (date the order to buy or sell is executed). Realized gains and losses on the sale of investment securities are determined on the specific identified cost method. Dividend income and other distributions are recorded on the ex-dividend date (except for certain foreign dividends which may be recorded as soon as the Portfolio is informed of such dividends) net of applicable withholding taxes. Interest income is recognized on the accrual basis except where collection is in doubt. Discounts are accreted and premiums are amortized over the life of the respective securities. Most expenses of the Fund can be directly attributed to a particular Portfolio. Expenses which cannot be directly attributed are apportioned among the Portfolios based upon relative net assets or other appropriate methods. Income, expenses (other than class specific expenses — distribution and shareholder services, transfer agency and sub transfer agency fees) and realized and unrealized gains or losses are allocated to each class of shares based upon their relative net assets.
The Portfolio owns shares of REITs which report information on the source of their distributions annually in the following calendar year. A portion of distributions
22
Morgan Stanley Institutional Fund, Inc.
Annual Report — December 31, 2016
Notes to Financial Statements (cont'd)
received from REITs during the year is estimated to be a return of capital and is recorded as a reduction of their cost.
B. Advisory/Sub-Advisory Fees: The Adviser, a wholly-owned subsidiary of Morgan Stanley, provides the Portfolio with advisory services under the terms of an Investment Advisory Agreement, paid quarterly, at an annual rate of 0.80% of the daily net assets of the Portfolio.
The Adviser has agreed to reduce its advisory fee and/or reimburse the Portfolio so that total annual portfolio operating expenses, excluding certain investment related expenses, taxes, interest and other extraordinary expenses (including litigation), will not exceed 1.00% for Class I shares, 1.35% for Class A shares, 1.85% for Class L shares, 2.10% for Class C shares and 0.97% for Class IS shares. The fee waivers and/or expense reimbursements will continue for at least one year from the date of the Portfolio's prospectus or until such time as the Directors act to discontinue all or a portion of such waivers and/or reimbursements when they deem such action is appropriate. For the year ended December 31, 2016, approximately $156,000 of advisory fees were waived and approximately $22,000 of other expenses were reimbursed by the Adviser pursuant to this arrangement.
The Adviser has entered into a Sub-Advisory Agreement with the Sub-Advisers, each a wholly-owned subsidiary of Morgan Stanley. The Sub-Advisers provide the Portfolio with advisory services subject to the overall supervision of the Adviser and the Fund's Officers and Directors. The Adviser pays the Sub-Advisers on a monthly basis a portion of the net advisory fees the Adviser receives from the Portfolio.
C. Administration Fees: The Adviser also serves as Administrator to the Fund and provides administrative services pursuant to an Administration Agreement for an annual fee, accrued daily and paid monthly, of 0.08% of the Portfolio's average daily net assets.
Under a Sub-Administration Agreement between the Administrator and State Street Bank and Trust Company ("State Street"), State Street provides certain administrative services to the Fund. For such services, the Administrator pays State Street a portion of the fee the Administrator receives from the Portfolio.
D. Distribution and Shareholder Services Fees: Morgan Stanley Distribution, Inc. ("MSDI" or the "Distributor"), a wholly-owned subsidiary of the Adviser and Sub-Advisers and an indirect subsidiary of Morgan Stanley, serves as the Fund's Distributor of Portfolio shares pursuant to a Distribution Agreement. The Fund has adopted a
Shareholder Services Plan with respect to Class A shares pursuant to Rule 12b-1 under the Act. Under the Shareholder Services Plan, the Portfolio pays the Distributor a shareholder services fee, accrued daily and paid monthly, at an annual rate of 0.25% of the Portfolio's average daily net assets attributable to Class A shares.
The Fund has adopted a Distribution and Shareholder Services Plan with respect to Class L shares pursuant to Rule 12b-1 under the Act. Under the Distribution and Shareholder Services Plan, the Portfolio pays the Distributor a distribution fee, accrued daily and paid monthly, at an annual rate of 0.50% and a shareholder services fee, accrued daily and paid monthly, at an annual rate of 0.25% of the Portfolio's average daily net assets attributable to Class L shares.
The Fund has adopted a Distribution and Shareholder Services Plan with respect to Class C shares pursuant to Rule 12b-1 under the Act. Under the Distribution and Shareholder Services Plan, the Portfolio pays the Distributor a distribution fee, accrued daily and paid monthly, at an annual rate of 0.75% and a shareholder services fee, accrued daily and paid monthly, at an annual rate of 0.25% of the Portfolio's average daily net assets attributable to Class C shares.
The distribution and shareholder services fees are used to support the expenses associated with servicing and maintaining accounts. The Distributor may compensate other parties for providing shareholder support services to investors who purchase Class A, Class L and Class C shares.
E. Dividend Disbursing and Transfer Agent: The Fund's dividend disbursing and transfer agent is Boston Financial Data Services, Inc. ("BFDS"). Pursuant to a Transfer Agency Agreement, the Fund pays BFDS a fee based on the number of classes, accounts and transactions relating to the Portfolios of the Fund.
F. Custodian Fees: State Street (the "Custodian") serves as Custodian for the Fund in accordance with a Custodian Agreement. The Custodian holds cash, securities, and other assets of the Fund as required by the Act. Custody fees are payable monthly based on assets held in custody, investment purchases and sales activity and account maintenance fees, plus reimbursement for certain out-of-pocket expenses.
In December 2015, the Fund's Custodian announced that it had identified inconsistencies in the way in which clients were invoiced for out-of-pocket expenses from 1998 until November 2015. The dollar amount difference between what was charged and what should have been charged, plus interest, was paid back to the Portfolio in September 2016 as a
23
Morgan Stanley Institutional Fund, Inc.
Annual Report — December 31, 2016
Notes to Financial Statements (cont'd)
reimbursement. The Custodian reimbursed the Portfolio directly, which was recognized as a change in accounting estimate and was reflected as "Reimbursement of Custodian Fees" in the Statement of Operations. Pursuant to the expense limitations described in Note B, the Portfolio has experienced waiver of advisory fees during the current period. Accordingly, the reimbursement of out-of-pocket custodian expenses in the current period resulted in the reduction in the current period waiver of advisory fees.
G. Security Transactions and Transactions with Affiliates: For the year ended December 31, 2016, purchases and sales of investment securities for the Portfolio, other than long-term U.S. Government securities and short-term investments, were approximately $15,228,000 and $64,622,000, respectively. There were no purchases and sales of long-term U.S. Government securities for the year ended December 31, 2016.
The Portfolio invests in the Institutional Class of the Morgan Stanley Institutional Liquidity Funds — Treasury Portfolio (the "Liquidity Funds"), an open-end management investment company managed by the Adviser. Advisory fees paid by the Portfolio are reduced by an amount equal to its pro-rata share of the advisory and administration fees paid by the Portfolio due to its investment in the Liquidity Funds. For the year ended December 31, 2016, advisory fees paid were reduced by approximately $1,000 relating to the Portfolio's investment in the Liquidity Funds.
A summary of the Portfolio's transactions in shares of the Liquidity Funds during the year ended December 31, 2016 is as follows:
Value
December 31,
2015
(000) | | Purchases
at Cost
(000) | | Sales
(000) | | Dividend
Income
(000) | | Value
December 31,
2016
(000) | |
| $ | 602 | | | $ | 14,384 | | | $ | 14,770 | | | $ | 1 | | | $ | 216 | | |
During the year ended December 31, 2016, the Portfolio incurred less than $500 in brokerage commissions with Morgan Stanley & Co., LLC, an affiliate of the Adviser/Administrator, Sub-Advisers and Distributor, for portfolio transactions executed on behalf of the Portfolio.
The Portfolio is permitted to purchase and sell securities ("cross-trade") from and to other Morgan Stanley Funds as well as other funds and client accounts for which the Adviser or an affiliate of the Adviser serves as investment adviser, pursuant to procedures approved by the Directors in compliance with Rule 17a-7 under the Act (the "Rule"). Each cross-trade is executed at the current market price in compliance with provisions of the Rule. For the year ended December 31, 2016, the Portfolio engaged in cross-trade purchases of approximately $17,000.
The Portfolio has an unfunded Deferred Compensation Plan (the "Compensation Plan"), which allows each independent Director to defer payment of all, or a portion, of the fees he or she receives for serving on the Board of Directors. Each eligible Director generally may elect to have the deferred amounts credited with a return equal to the total return on one or more of the Morgan Stanley funds that are offered as investment options under the Compensation Plan. Appreciation/depreciation and distributions received from these investments are recorded with an offsetting increase/decrease in the deferred compensation obligation and do not affect the NAV of the Portfolio.
H. Federal Income Taxes: It is the Portfolio's intention to continue to qualify as a regulated investment company and distribute all of its taxable and tax-exempt income. Accordingly, no provision for federal income taxes is required in the financial statements.
The Portfolio may be subject to taxes imposed by countries in which it invests. Such taxes are generally based on income and/or capital gains earned or repatriated. Taxes are accrued based on net investment income, net realized gains and net unrealized appreciation as such income and/or gains are earned. Taxes may also be based on transactions in foreign currency and are accrued based on the value of investments denominated in such currency.
FASB ASC 740-10, "Income Taxes — Overall", sets forth a minimum threshold for financial statement recognition of the benefit of a tax position taken or expected to be taken in a tax return. Management has concluded that there are no significant uncertain tax positions that would require recognition in the financial statements. If applicable, the Portfolio recognizes interest accrued related to unrecognized tax benefits in "Interest Expense" and penalties in "Other Expenses" in the Statement of Operations. The Portfolio files tax returns with the U.S. Internal Revenue Service, New York and various states. Generally, each of the tax years in the four-year period ended December 31, 2016, remains subject to examination by taxing authorities.
The tax character of distributions paid may differ from the character of distributions shown in the Statements of Changes in Net Assets due to short-term capital gains being treated as ordinary income for tax purposes. The tax character of distributions paid during fiscal years 2016 and 2015 was as follows:
2016
Distributions
Paid From: | | 2015
Distributions
Paid From: | |
Ordinary
Income
(000) | | Long-Term
Capital Gain
(000) | | Ordinary
Income
(000) | | Long-Term
Capital Gain
(000) | |
| $ | 2,262 | | | $ | — | | | $ | 2,263 | | | $ | — | | |
24
Morgan Stanley Institutional Fund, Inc.
Annual Report — December 31, 2016
Notes to Financial Statements (cont'd)
The amount and character of income and gains to be distributed are determined in accordance with income tax regulations which may differ from GAAP. These book/tax differences are either considered temporary or permanent in nature.
Temporary differences are primarily due to differing book and tax treatments in the timing of the recognition of gains (losses) on certain investment transactions and the timing of the deductibility of certain expenses.
Permanent differences, primarily due to differing treatments of gains (losses) related to foreign currency transactions, basis adjustments on certain equity securities designated as passive foreign investment companies and an expired capital loss carryforward, resulted in the following reclassifications among the components of net assets at December 31, 2016:
Accumulated
Undistributed Net
Investment
Income
(000) | | Accumulated
Net Realized
Loss
(000) | | Paid-in-
Capital
(000) | |
| $ | 1,152 | | | $ | 97,646 | | | $ | (98,798 | ) | |
At December 31, 2016, the components of distributable earnings for the Portfolio on a tax basis were as follows:
Undistributed
Ordinary
Income
(000) | | Undistributed
Long-Term
Capital Gain
(000) | |
| $ | 1,576 | | | $ | — | | |
At December 31, 2016, the Portfolio had available for federal income tax purposes unused short-term capital losses of approximately $3,409,000 and long-term capital losses of approximately $218,755,000 that do not have an expiration date.
In addition, at December 31, 2016, the Portfolio had available capital loss carryforwards to offset future net capital gains, to the extent provided by regulations, through the indicated expiration dates:
Amount
(000) | | Expiration | |
| $ | 217,627 | | | December 31, 2017 | |
| | 66,872 | | | December 31, 2018 | |
During the year ended December 31, 2016, capital loss carryforwards of approximately $98,798,000 expired for federal income tax purposes.
To the extent that capital loss carryforwards are used to offset any future capital gains realized during the carryover period as provided by U.S. federal income tax regulations, no capital gains tax liability will be incurred by the Portfolio for gains realized and not distributed. To the extent that capital gains are offset, such gains will not be distributed to the shareholders.
I. Credit Facility: As of April 4, 2016, the Fund and other Morgan Stanley funds participated in a $150,000,000 committed, unsecured revolving line of credit facility (the "facility") with State Street. This facility is to be used for temporary emergency purposes or funding of shareholder redemption requests. The interest rate on borrowings is based on the federal funds rate or one month libor rate plus a spread. The facility also has a commitment fee of 0.25% per annum based on the unused portion of the facility. During the year ended December 31, 2016, the Portfolio did not have any borrowings under the facility.
J. Other: At December 31, 2016, the Portfolio had record owners of 10% or greater. Investment activities of these shareholders could have a material impact on the Portfolio. The aggregate percentage of such owners was 60.5%.
K. Accounting Pronouncements: In December 2016, FASB issued Accounting Standards update 2016-19—Technical Corrections and Improvements ("ASU 2016-19"), which is effective for interim periods for all entities beginning after December 15, 2016. ASU 2016-19 includes an amendment to Topic 820, Fair Value Measurement, which clarifies the difference between a valuation approach and a valuation technique when applying the guidance in that Topic. That amendment also requires an entity to disclose when there has been a change in either or both a valuation approach and/or a valuation technique. The transition guidance for the amendment must be applied prospectively because it could potentially involve the use of hindsight that includes fair value measurements. Although still evaluating the potential impacts of ASU 2016-19 to the Portfolio, management expects that the impact of the Portfolio's adoption will be limited to additional financial statement disclosures.
In October 2016, the Securities and Exchange Commission ("SEC") issued a new rule, Investment Company Reporting Modernization, which, among other provisions, amends Regulation S-X to require standardized, enhanced disclosures, particularly related to derivatives, in investment company financial statements. Compliance with the guidance is effective for financial statements filed with the SEC on or after August 1, 2017; adoption will have no effect on the Portfolio's net assets or results of operations. Although still evaluating the potential impacts of the Investment Company Reporting Modernization to the Portfolio, management expects that the impact of the Portfolio's adoption will be limited to additional financial statement disclosures.
25
Morgan Stanley Institutional Fund, Inc.
Annual Report — December 31, 2016
Report of Independent Registered Public Accounting Firm
To the Shareholders and Board of Directors of
Morgan Stanley Institutional Fund, Inc. —
International Real Estate Portfolio
We have audited the accompanying statement of assets and liabilities, including the portfolio of investments, of International Real Estate Portfolio (one of the portfolios constituting Morgan Stanley Institutional Fund, Inc.) (the "Portfolio") as of December 31, 2016, and the related statement of operations for the year then ended, the statements of changes in net assets for each of the two years in the period then ended and the financial highlights for each of the years or periods indicated therein. These financial statements and financial highlights are the responsibility of the Portfolio's management. Our responsibility is to express an opinion on these financial statements and financial highlights based on our audits.
We conducted our audits in accordance with the standards of the Public Company Accounting Oversight Board (United States). Those standards require that we plan and perform the audit to obtain reasonable assurance about whether the financial statements and financial highlights are free of material misstatement. We were not engaged to perform an audit of the Portfolio's internal control over financial reporting. Our audits included consideration of internal control over financial reporting as a basis for designing audit procedures that are appropriate in the circumstances, but not for the purpose of expressing an opinion on the effectiveness of the Portfolio's internal control over financial reporting. Accordingly, we express no such opinion. An audit also includes examining, on a test basis, evidence supporting the amounts and disclosures in the financial statements and financial highlights, assessing the accounting principles used and significant estimates made by management, and evaluating the overall financial statement presentation. Our procedures included confirmation of securities owned as of December 31, 2016, by correspondence with the custodian and others or by other appropriate auditing procedures where replies from others were not received. We believe that our audits provide a reasonable basis for our opinion.
In our opinion, the financial statements and financial highlights referred to above present fairly, in all material respects, the financial position of International Real Estate Portfolio (one of the portfolios constituting Morgan Stanley Institutional Fund, Inc.) at December 31, 2016, the results of its operations for the year then ended, the changes in its net assets for each of the two years in the period then ended and the financial highlights for each of the years or periods indicated therein, in conformity with U.S. generally accepted accounting principles.

Boston, Massachusetts
February 28, 2017
26
Morgan Stanley Institutional Fund, Inc.
Annual Report — December 31, 2016
Federal Tax Notice (unaudited)
For federal income tax purposes, the following information is furnished with respect to the Portfolio's earnings for the taxable year ended December 31, 2016.
When distributed, certain earnings may be subject to a maximum tax rate of 15% as provided for the Jobs and Growth Tax Relief Reconciliation Act of 2003. The Portfolio designated up to a maximum of approximately $1,029,000 as taxable at this lower rate.
The Portfolio intends to pass through foreign tax credits of approximately $143,000, and has derived net income from sources within foreign countries amounting to approximately $2,647,000.
In January, the Portfolio provides tax information to shareholders for the preceding calendar year.
27
Morgan Stanley Institutional Fund, Inc.
Annual Report — December 31, 2016
Privacy Notice (unaudited)
MORGAN STANLEY INVESTMENT MANAGEMENT INC.
AN IMPORTANT NOTICE CONCERNING OUR U.S. PRIVACY POLICY
We are required by federal law to provide you with a copy of our privacy policy annually. This policy applies to current and former individual investors in funds managed or sponsored by Morgan Stanley Investment Management Inc. ("MSIM") as well as current and former individual clients of MSIM. This policy is not applicable to partnerships, corporations, trusts or other non-individual clients or investors. Please note that we may amend this policy at any time, and will inform you of any changes as required by law.
WE RESPECT YOUR PRIVACY
We appreciate that you have provided us with your personal financial information. We strive to maintain the privacy of such information while we help you achieve your financial objectives. This Notice describes what non-public personal information we collect about you, why we collect it, when we may share it with others and how certain others may use it. It discusses the steps you may take to limit our sharing of certain information about you to affiliated companies in the Morgan Stanley family of companies ("other Morgan Stanley companies"). It also discloses how you may limit use of certain shared information for marketing purposes by other Morgan Stanley branded companies. Throughout this policy, we refer to the non-public information that personally identifies you or your accounts as "personal information."
1. WHAT PERSONAL INFORMATION DO WE COLLECT ABOUT YOU?
We obtain personal information from applications and other forms you submit to us, from your dealings with us, from consumer reporting agencies, from our Web sites and from third parties and other sources.
For example:
• We may collect information such as your name, address, e-mail address, telephone/fax numbers, assets, income and investment objectives through subscription documents, applications and other forms you submit to us.
• We may obtain information about account balances, your use of account(s) and the types of products and services you prefer to receive from us through your dealings and transactions with us and other sources.
• We may obtain information about your creditworthiness and credit history from consumer reporting agencies.
• We may collect background information from and through third-party vendors to verify representations you have made and to comply with various regulatory requirements.
• If you interact with us through our public and private Web sites, we may collect information that you provide directly through online communications (such as an e-mail address). We may also collect information about your Internet service provider, your domain name, your computer's operating system and Web browser, your use of our Web sites and your product and service preferences, through the use of "cookies." Please consult the Terms of Use of these sites for more details.
2. WHEN DO WE DISCLOSE PERSONAL INFORMATION WE COLLECT ABOUT YOU?
We may disclose personal information we collect about you to other Morgan Stanley companies and to non-affiliated third parties.
a. Information We Disclose to Other Morgan Stanley Companies.
We may disclose personal information to other Morgan Stanley companies for a variety of reasons, including to manage your account(s) effectively, to service and process your transactions, to let you know about products and services offered by us and other Morgan Stanley companies, to manage our business, and as otherwise required or permitted by law. Offers for products and services from other Morgan Stanley companies are developed under conditions designed to safeguard your personal information.
28
Morgan Stanley Institutional Fund, Inc.
Annual Report — December 31, 2016
Privacy Notice (unaudited) (cont'd)
b. Information We Disclose to Non-affiliated Third Parties.
We do not disclose personal information that we collect about you to non-affiliated third parties except to those who provide marketing services on our behalf, to financial institutions with whom we have joint marketing agreements, and as otherwise required or permitted by law. For example, we may disclose personal information to nonaffiliated third parties for servicing and processing transactions, to offer our own products and services, to protect against fraud, for institutional risk control, to respond to judicial process or to perform services on our behalf. When we share personal information with a non-affiliated third party, they are required to limit their use of personal information to the particular purpose for which it was shared and they are not allowed to share personal information with others except to fulfill that limited purpose or as may be permitted or required by law.
3. HOW DO WE PROTECT THE SECURITY AND CONFIDENTIALITY OF PERSONAL INFORMATION WE COLLECT ABOUT YOU?
We maintain physical, electronic and procedural security measures to help safeguard the personal information we collect about you. We have internal policies governing the proper handling of client information. Third parties that provide support or marketing services on our behalf may also receive personal information, and we require them to adhere to confidentiality standards with respect to such information.
4. HOW CAN YOU LIMIT THE SHARING OF CERTAIN TYPES OF PERSONAL INFORMATION WITH OTHER MORGAN STANLEY COMPANIES?
We offer you choices as to whether we share with other Morgan Stanley companies the personal information that was collected to determine your eligibility for products and services you request ("eligibility information"). Eligibility information does not include your identification information or personal information pertaining to our transactions or experiences with you. Please note that, even if you direct us not to share eligibility information with other Morgan Stanley companies ("opt-out"), we may still share personal information, including eligibility information, with those companies in circumstances excluded from the opt-out under applicable law, such as to process transactions or to service your account.
5. HOW CAN YOU LIMIT THE USE OF CERTAIN TYPES OF PERSONAL INFORMATION BY OTHER MORGAN STANLEY COMPANIES FOR MARKETING?
By following the opt-out instructions in Section 6 below, you may limit other Morgan Stanley branded companies from marketing their products or services to you based on personal information we disclose to them. This information may include, for example, your income and account history with us. Please note that, even if you choose to limit Other Morgan Stanley Companies from using personal information about you that we may share with them for marketing their products and services to you, Other Morgan Stanley Companies may use your personal information that they obtain from us to market to you in circumstances permitted by law, such as if the Other Morgan Stanley Company has its own relationship with you.
6. HOW CAN YOU SEND US AN OPT-OUT INSTRUCTION?
If you wish to limit our sharing of eligibility information about you with other Morgan Stanley companies or other Morgan Stanley companies' use of personal information for marketing purposes, as described in this notice, you may do so by:
• Calling us at (800) 548-7786
Monday–Friday between 8a.m. and 6p.m.(EST)
• Writing to us at the following address:
Boston Financial Data Services, Inc.
c/o Privacy Coordinator
P.O. Box 219804
Kansas City, Missouri 64121
29
Morgan Stanley Institutional Fund, Inc.
Annual Report — December 31, 2016
Privacy Notice (unaudited) (cont'd)
Your written request should include your name, address, telephone number and account number(s) to which the opt-out applies and whether you are opting out with respect to sharing of eligibility information (Section 4 above), or if information used for Marketing (Section 5 above) or both. Written opt-out requests should not be sent with any other correspondence. In order to process your request, we require that the request be provided by you directly and not through a third party.
Your opt-out preference will remain in effect with respect to this policy (as it may be amended) until you notify us otherwise. If you have a joint account, your direction for us not to share this information with other Morgan Stanley companies and for those other Morgan Stanley companies not to use your personal information for marketing will be applied to all account holders on that account. Please understand that if you limit our sharing or our affiliated companies' use of personal information, you and any joint account holder(s) may not receive information about Morgan Stanley products and services, including products or services that could help you manage your financial resources and achieve your investment objectives.
7. WHAT IF AN AFFILIATED COMPANY BECOMES A NON-AFFILIATED THIRD PARTY?
If, at any time in the future, an affiliated company becomes a non-affiliated third party, further disclosures of personal information made to the former affiliated company will be limited to those described in Section 2(b) above relating to non-affiliated third parties. If you elected under Section 6 to limit disclosures we make to affiliated companies, or use of personal information by affiliated companies, your election will not apply to use by any former affiliated company of your personal information in their possession once it becomes a non-affiliated third party.
SPECIAL NOTICE TO RESIDENTS OF VERMONT
The following section supplements our policy with respect to our individual clients who have a Vermont address and supersedes anything to the contrary in the above policy with respect to those clients only.
The state of Vermont requires financial institutions to obtain your consent prior to sharing personal information that they collect about you with affiliated companies and non-affiliated third parties other than in certain limited circumstances. Except as permitted by law, we will not share personal information we collect about you with non-affiliated third parties or other Morgan Stanley companies unless you provide us with your written consent to share such information ("opt-in").
If you wish to receive offers for investment products and services offered by or through other Morgan Stanley companies, please notify us in writing at the following address:
Boston Financial Data Services, Inc.
c/o Privacy Coordinator
P.O. Box 219804
Kansas City, Missouri 64121
Your authorization should include your name, address, telephone number and account number(s) to which the opt-in applies and should not be sent with any other correspondence. In order to process your authorization, we require that the authorization be provided by you directly and not through a third party.
SPECIAL NOTICE TO RESIDENTS OF CALIFORNIA
The following section supplements our policy with respect to our individual clients who have a California address and supersedes anything to the contrary in the above policy with respect to those clients only.
In response to a California law, if your account has a California home address, your personal information will not be disclosed to nonaffiliated third parties except as permitted by applicable California law, and we will limit sharing such information with our affiliates to comply with California privacy laws that apply to us.
30
Morgan Stanley Institutional Fund, Inc.
Annual Report — December 31, 2016
Director and Officer Information (unaudited)
Independent Directors:
Name, Age and Address of
Independent Director | | Position(s)
Held with
Registrant | | Length of Time
Served* | | Principal Occupation(s) During Past 5 Years
and Other Relevant Professional Experience | | Number of
Overseen by
Independent
Director** | | Portfolios in
Fund Complex
Other Directorships
Held by Independent
Director*** | |
Frank L. Bowman (72)
c/o Perkins Coie LLP
Counsel to the Independent
Directors
30 Rockefeller Plaza
New York, NY 10112 | | Director | | Since
August
2006 | | President, Strategic Decisions, LLC (consulting) (since February 2009); Director or Trustee of various Morgan Stanley Funds (since August 2006); Chairperson of the Compliance and Insurance Committee (since October 2015); formerly, Chairperson of the Insurance Sub-Committee of the Compliance and Insurance Committee (2007-2015); served as President and Chief Executive Officer of the Nuclear Energy Institute (policy organization) (February 2005-November 2008); retired as Admiral, U.S. Navy after serving over 38 years on active duty including 8 years as Director of the Naval Nuclear Propulsion Program in the Department of the Navy and the U.S. Department of Energy (1996-2004); served as Chief of Naval Personnel (July 1994-September 1996) and on the Joint Staff as Director of Political Military Affairs (June 1992-July 1994); knighted as Honorary Knight Commander of the Most Excellent Order of the British Empire; awarded the Officier de l'Orde National du Mérite by the French Government; elected to the National Academy of Engineering (2009). | | 90 | | Director of BP p.l.c.; Director of Naval and Nuclear Technologies LLP; Director Emeritus of the Armed Services YMCA; Director of the U.S. Naval Submarine League; Member of the National Security Advisory Council of the Center for U.S. Global Engagement and a member of the CNA Military Advisory Board; Chairman of the charity J Street Cup Golf; Trustee of Fairhaven United Methodist Church; and Director of other various non-profit organizations. | |
Kathleen A. Dennis (63)
c/o Perkins Coie LLP
Counsel to the Independent Directors
30 Rockefeller Plaza
New York, NY 10112 | | Director | | Since
August
2006 | | President, Cedarwood Associates (mutual fund and investment management consulting) (since July 2006); Chairperson of the Liquidity and Alternatives Sub-Committee of the Investment Committee (since October 2006) and Director or Trustee of various Morgan Stanley Funds (since August 2006); formerly, Senior Managing Director of Victory Capital Management (1993-2006). | | 91 | | Director of various non-profit organizations. | |
Nancy C. Everett (61)
c/o Perkins Coie LLP
Counsel to the Independent Directors
30 Rockefeller Plaza
New York, NY 10112 | | Director | | Since
January
2015 | | Chief Executive Officer, Virginia Commonwealth University Investment Company (since November 2015); Owner, OBIR, LLC (institutional investment management consulting) (since June 2014); formerly, Managing Director, BlackRock Inc. (February 2011-December 2013); and Chief Executive Officer, General Motors Asset Management (a/k/a Promark Global Advisors, Inc.) (June 2005-May 2010). | | 91 | | Member of Virginia Commonwealth University School of Business Foundation; formerly, Member of Virginia Commonwealth University Board of Visitors (2013-2015); Member of Committee on Directors for Emerging Markets Growth Fund, Inc. (2007-2010); Chairperson of Performance Equity Management, LLC (2006-2010); and Chairperson, GMAM Absolute Return Strategies Fund, LLC (2006-2010). | |
31
Morgan Stanley Institutional Fund, Inc.
Annual Report — December 31, 2016
Director and Officer Information (unaudited) (cont'd)
Independent Directors: (cont'd)
Name, Age and Address of
Independent Director | | Position(s)
Held with
Registrant | | Length of Time
Served* | | Principal Occupation(s) During Past 5 Years
and Other Relevant Professional Experience | | Number of
Overseen by
Independent
Director** | | Portfolios in
Fund Complex
Other Directorships
Held by Independent
Director*** | |
Jakki L. Haussler (59)
c/o Perkins Coie LLP
Counsel to the Independent Directors
30 Rockefeller Plaza
New York, NY 10112 | | Director | | Since
January
2015 | | Chairman and Chief Executive Officer, Opus Capital Group (since January 1996); formerly, Director, Capvest Venture Fund, LP (May 2000-December 2011); Partner, Adena Ventures, LP (July 1999-December 2010); Director, The Victory Funds (February 2005-July 2008). | | 91 | | Director of Cincinnati Bell Inc. and Member, Audit Committee and Compensation Committee; Director of Northern Kentucky University Foundation and Member, Investment Committee; Member of Chase College of Law Transactional Law Practice Center Board of Advisors; Director of Best Transport; Director of Chase College of Law Board of Visitors; formerly, Member, University of Cincinnati Foundation Investment Committee; Member, Miami University Board of Visitors (2008-2011); Trustee of Victory Funds (2005-2008) and Chairman, Investment Committee (2007-2008) and Member, Service Provider Committee (2005-2008). | |
Dr. Manuel H. Johnson (67)
c/o Johnson Smick
International, Inc.
220 I Street, N.E. — Suite 200
Washington, D.C. 20002 | | Director | | Since
July
1991 | | Senior Partner, Johnson Smick International, Inc. (consulting firm); Chairperson of the Investment Committee (since October 2006) and Director or Trustee of various Morgan Stanley Funds (since July 1991); Co-Chairman and a founder of the Group of Seven Council (G7C) (international economic commission); formerly, Chairperson of the Audit Committee (July 1991-September 2006), Vice Chairman of the Board of Governors of the Federal Reserve System and Assistant Secretary of the U.S. Treasury. | | 91 | | Director of NVR, Inc. (home construction). | |
Joseph J. Kearns (74)
c/o Kearns & Associates LLC
46 E Peninsula Center #385
Rolling Hills Estates, CA 90274-3712 | | Director | | Since
August
1994 | | President, Kearns & Associates LLC (investment consulting); Chairperson of the Audit Committee (since October 2006) and Director or Trustee of various Morgan Stanley Funds (since August 1994); formerly, Deputy Chairperson of the Audit Committee (July 2003-September 2006) and Chairperson of the Audit Committee of various Morgan Stanley Funds (since August 1994); CFO of the J. Paul Getty Trust. | | 93 | | Director of Electro Rent Corporation (equipment leasing). Prior to December 31, 2013, Director of The Ford Family Foundation. | |
32
Morgan Stanley Institutional Fund, Inc.
Annual Report — December 31, 2016
Director and Officer Information (unaudited) (cont'd)
Independent Directors: (cont'd)
Name, Age and Address of
Independent Director | | Position(s)
Held with
Registrant | | Length of Time
Served* | | Principal Occupation(s) During Past 5 Years
and Other Relevant Professional Experience | | Number of
Overseen by
Independent
Director** | | Portfolios in
Fund Complex
Other Directorships
Held by Independent
Director*** | |
Michael F. Klein (58)
c/o Perkins Coie LLP
Counsel to the Independent Directors
30 Rockefeller Plaza
New York, NY 10112 | | Director | | Since
August
2006 | | Managing Director, Aetos Capital, LLC (since March 2000); Co-President, Aetos Alternatives Management, LLC (since January 2004) and Co-Chief Executive Officer of Aetos Capital LLC (since August 2013); Chairperson of the Fixed Income Sub-Committee of the Investment Committee (since October 2006) and Director or Trustee of various Morgan Stanley Funds (since August 2006); formerly, Managing Director, Morgan Stanley & Co. Inc. and Morgan Stanley Dean Witter Investment Management, President, various Morgan Stanley Funds (June 1998-March 2000) and Principal, Morgan Stanley & Co. Inc. and Morgan Stanley Dean Witter Investment Management (August 1997-December 1999). | | 90 | | Director of certain investment funds managed or sponsored by Aetos Capital, LLC; Director of Sanitized AG and Sanitized Marketing AG (specialty chemicals). | |
Patricia Maleski (56)
c/o Perkins Coie LLP
Counsel to the Independent Directors
30 Rockefeller Plaza
New York, NY 10112 | | Director | | Since
January
2017 | | Management Director, JPMorgan Asset Management (2013-2016); President, JPMorgan Funds (2010-2013), Chief Administrative Officer, JPMorgan Funds (2004-2010), Treasurer, JPMorgan Funds (2003-2004, 2008-2010), and Vice President and Board Liaison, JPMorgan Funds (2001-2004); Managing Director, J.P. Morgan Investment Management Inc. (2001-2013); Vice President of Finance, Pierpont Group (1996-2001); Vice President, Bank of New York (1995-1996); Senior Audit Manager, Price Waterhouse, LLP (1982-1995). | | 91 | | None. | |
Michael E. Nugent (80)
522 Fifth Avenue
New York, NY 10036 | | Chair of the Board and Director | | Chair of the Boards since July 2006 and Director since July 1991 | | Chair of the Boards of various Morgan Stanley Funds (since July 2006); Chairperson of the Closed-End Fund Committee (since June 2012) and Director or Trustee of various Morgan Stanley Funds (since July 1991); formerly, Chairperson of the Insurance Committee (until July 2006); General Partner, Triumph Capital, L.P. (private investment partnership) (1988-2013). | | 92 | | None. | |
W. Allen Reed (69)
c/o Perkins Coie LLP
Counsel to the Independent Directors
30 Rockefeller Plaza
New York, NY 10112 | | Director | | Since
August
2006 | | Chairperson of the Equity Sub-Committee of the Investment Committee (since October 2006) and Director or Trustee of various Morgan Stanley Funds (since August 2006); formerly, President and CEO of General Motors Asset Management; Chairman and Chief Executive Officer of the GM Trust Bank and Corporate Vice President of General Motors Corporation (August 1994-December 2005). | | 91 | | Director of Legg Mason, Inc.; formerly, Director of the Auburn University Foundation (2010-2015). | |
Fergus Reid (84)
c/o Joe Pietryka, Inc.
85 Charles Colman Blvd.
Pawling, NY 12564 | | Director | | Since
June
1992 | | Chairman, Joe Pietryka, Inc.; Chairperson of the Governance Committee and Director or Trustee of various Morgan Stanley Funds (since June 1992). | | 92 | | Formerly, Trustee and Director of certain investment companies in the JP Morgan Fund Complex managed by JP Morgan Investment Management Inc. (1987-2012). | |
* This is the earliest date the Director began serving the Morgan Stanley Funds. Each Director serves an indefinite term, until his or her successor is elected.
** The Fund Complex includes (as of December 31, 2016) all open-end and closed-end funds (including all of their portfolios) advised by Morgan Stanley Investment Management Inc. (the "Adviser") and any funds that have an adviser that is an affiliated person of the Adviser (including, but not limited to, Morgan Stanley AIP GP LP).
*** This includes any directorships at public companies and registered investment companies held by the Director at any time during the past five years.
33
Morgan Stanley Institutional Fund, Inc.
Annual Report — December 31, 2016
Director and Officer Information (unaudited) (cont'd)
Executive Officers:
Name, Age and Address of Executive Officer | | Position(s) Held
with
Registrant | | Length of Time
Served* | | Principal Occupation(s) During Past 5 Years | |
John H. Gernon (53)
522 Fifth Avenue
New York, NY 10036 | | President and Principal Executive Officer | | Since
September
2013 | | President and Principal Executive Officer of the Equity and Fixed Income Funds and the Morgan Stanley AIP Funds (since September 2013) and the Liquidity Funds and various money market funds (since May 2014) in the Fund Complex; Managing Director of the Adviser; Head of Product (since 2006). | |
Timothy J. Knierim (58)
522 Fifth Avenue
New York, NY 10036 | | Chief Compliance Officer | | Since
December
2016 | | Managing Director of the Adviser and various entities affiliated with the Adviser; Chief Compliance Officer of various Morgan Stanley Funds and the Adviser (since December 2016) and Chief Compliance Officer of Morgan Stanley AIP GP LP (since 2014). Formerly, Managing Director and Deputy Chief Compliance Officer of the Adviser (2014-2016); and formerly, Chief Compliance Officer of Prudential Investment Management, Inc. (2007-2014). | |
Francis J. Smith (51)
522 Fifth Avenue
New York, NY 10036 | | Treasurer and Principal Financial Officer | | Treasurer since July 2003 and Principal Financial Officer since September 2002 | | Managing Director of the Adviser and various entities affiliated with the Adviser; Treasurer (since July 2003) and Principal Financial Officer of various Morgan Stanley Funds (since September 2002). | |
Mary E. Mullin (49)
522 Fifth Avenue
New York, NY 10036 | | Secretary | | Since
June
1999 | | Executive Director of the Adviser; Secretary of various Morgan Stanley Funds (since June 1999). | |
* This is the earliest date the officer began serving the Morgan Stanley Funds. Each officer serves a one-year term, until his or her successor is elected and qualifies.
34
Morgan Stanley Institutional Fund, Inc.
Annual Report — December 31, 2016
Adviser and Administrator
Morgan Stanley Investment Management Inc.
522 Fifth Avenue
New York, New York 10036
Sub-Advisers
Morgan Stanley Investment Management Limited
25 Cabot Square, Canary Wharf
London, E14 4QA, England
Morgan Stanley Investment Management Company
23 Church Street
16-01 Capital Square, Singapore 049481
Distributor
Morgan Stanley Distribution, Inc.
522 Fifth Avenue
New York, New York 10036
Dividend Disbursing and Transfer Agent
Boston Financial Data Services, Inc.
2000 Crown Colony Drive
Quincy, Massachusetts 02169
Custodian
State Street Bank and Trust Company
One Lincoln Street
Boston, Massachusetts 02111
Legal Counsel
Dechert LLP
1095 Avenue of the Americas
New York, New York 10036
Counsel to the Independent Directors
Perkins Coie LLP
30 Rockefeller Plaza
New York, New York 10112
Independent Registered Public Accounting Firm
Ernst & Young LLP
200 Clarendon Street
Boston, Massachusetts 02116
Reporting to Shareholders
Each Morgan Stanley fund provides a complete schedule of portfolio holdings in its semi-annual and annual reports within 60 days of the end of the fund's second and fourth fiscal quarters. The semi-annual and annual reports are filed electronically with the Securities and Exchange Commission (SEC) on Form N-CSRS and Form N-CSR, respectively. Morgan Stanley also delivers the semi-annual and annual reports to fund shareholders and makes these reports available on its public website, www.morganstanley.com/im. Each Morgan Stanley fund also files a complete schedule of portfolio holdings with the SEC for the fund's first and third fiscal quarters on Form N-Q. Morgan Stanley does not deliver the reports for the first and third fiscal quarters to shareholders, nor are the reports posted to the Morgan Stanley public website. You may, however, obtain the Form N-Q filings (as well as the Form N-CSR and N-CSRS filings) by accessing the SEC's website, www.sec.gov. You may also review and copy them at the SEC's Public Reference Room in Washington, DC. Information on the operation of the SEC's Public Reference Room may be obtained by calling the SEC toll free at 1 (800) SEC-0330. You can also request copies of these materials, upon payment of a duplicating fee, by electronic request at the SEC's email address (publicinfo@sec.gov) or by writing the Public Reference Room of the SEC, 100 F Street, NE, Washington, DC 20549-0102.
Proxy Voting Policies and Procedures and Proxy Voting Record
You may obtain a copy of the Fund's Proxy Voting Policy and Procedures and information regarding how the Fund voted proxies relating to portfolio securities during the most recent twelve-month period ended June 30, without charge, upon request, by calling toll free 1 (800) 548-7786 or by visiting our website at www.morganstanley.com/im. This information is also available on the SEC's website at www.sec.gov.
This report is authorized for distribution only when preceded or accompanied by a prospectus or summary prospectus of the applicable Portfolio of Morgan Stanley Institutional Fund, Inc., which describes in detail the Portfolio's investment policies, risks, fees and expenses. Please read the prospectus carefully before you invest or send money. For additional information, including information regarding the investments comprising the Portfolio, please visit our website at www.morganstanley.com/im or call toll free 1 (800) 548-7786.
35
(This Page has been left blank intentionally.)
(This Page has been left blank intentionally.)
Printed in U.S.A.
This Report has been prepared for shareholders and may be distributed to others only if preceded or accompanied by a current prospectus.
Morgan Stanley Investment Management Inc.
522 Fifth Avenue
New York, New York 10036
© 2017 Morgan Stanley. Morgan Stanley Distribution, Inc.

IFIIREANN
1697310 EXP. 02.28.18

Morgan Stanley Institutional Fund, Inc.
Multi-Asset Portfolio
Annual Report
December 31, 2016

Morgan Stanley Institutional Fund, Inc.
Annual Report — December 31, 2016
Shareholders' Letter | | | 2 | | |
Consolidated Expense Example | | | 3 | | |
Investment Overview | | | 4 | | |
Consolidated Portfolio of Investments | | | 8 | | |
Consolidated Statement of Assets and Liabilities | | | 17 | | |
Consolidated Statement of Operations | | | 19 | | |
Consolidated Statements of Changes in Net Assets | | | 20 | | |
Consolidated Financial Highlights | | | 22 | | |
Notes to Consolidated Financial Statements | | | 27 | | |
Report of Independent Registered Public Accounting Firm | | | 41 | | |
Federal Tax Notice | | | 42 | | |
Privacy Notice | | | 43 | | |
Director and Officer Information | | | 46 | | |
This report is authorized for distribution only when preceded or accompanied by a prospectus or summary prospectus of the applicable Portfolio of Morgan Stanley Institutional Fund, Inc. To receive a prospectus and/or statement of additional information (SAI), which contains more complete information such as investment objectives, charges, expenses, policies for voting proxies, risk considerations, and describes in detail each of the Portfolio's investment policies to the prospective investor, please call toll free 1 (800) 548-7786. Please read the prospectuses carefully before you invest or send money.
Additionally, you can access information about the Portfolio, including performance, characteristics, and investment team commentary, through Morgan Stanley Investment Management's website: www.morganstanley.com/im.
Market forecasts provided in this report may not necessarily come to pass. There is no guarantee that any sectors mentioned will continue to perform as discussed herein or that securities in such sectors will be held by the Portfolio in the future. There is no assurance that a Portfolio will achieve its investment objective. Portfolios are subject to market risk, which is the possibility that market values of securities owned by the Portfolio will decline and, therefore, the value of the Portfolio's shares may be less than what you paid for them. Accordingly, you can lose money investing in this Portfolio. Please see the prospectus for more complete information on investment risks.
1
Morgan Stanley Institutional Fund, Inc.
Annual Report — December 31, 2016
Shareholders' Letter (unaudited)
Dear Shareholders,
We are pleased to provide this Annual report, in which you will learn how your investment in Multi-Asset Portfolio (the "Portfolio") performed during the latest twelve-month period.
Morgan Stanley Investment Management is a client-centric, investor-led organization. Our global presence, intellectual capital, and breadth of products and services enable us to partner with investors to meet the evolving challenges of today's financial markets. We aim to deliver superior investment service and to empower our clients to make the informed decisions that help them reach their investment goals.
As always, we thank you for selecting Morgan Stanley Investment Management, and look forward to working with you in the months and years ahead.
Sincerely,

John H. Gernon
President and Principal Executive Officer
January 2017
2
Morgan Stanley Institutional Fund, Inc.
Annual Report — December 31, 2016
Consolidated Expense Example (unaudited)
Multi-Asset Portfolio
As a shareholder of the Portfolio, you incur two types of costs: (1) transactional costs; and (2) ongoing costs, which may include advisory fees, administration fees, distribution and shareholder services fees and other Portfolio expenses. This example is intended to help you understand your ongoing costs (in dollars) of investing in the Portfolio and to compare these costs with the ongoing costs of investing in other mutual funds.
This example is based on an investment of $1,000 invested at the beginning of the six-month period ended December 31, 2016 and held for the entire six-month period.
Actual Expenses
The table below provides information about actual account values and actual expenses. You may use the information in this table, together with the amount you invested, to estimate the expenses that you paid over the period. Simply divide your account value by $1,000 (for example, an $8,600 account value divided by $1,000 = 8.6), then multiply the result by the number in the table under the heading entitled "Actual Expenses Paid During Period" to estimate the expenses you paid on your account during this period.
Hypothetical Example for Comparison Purposes
The table below provides information about hypothetical account values and hypothetical expenses based on the Portfolio's actual expense ratio and an assumed rate of return of 5% per year before expenses, which is not the Portfolio's actual return. The hypothetical account values and expenses may not be used to estimate the actual ending account balance or expenses you paid for the period. You may use this information to compare the ongoing costs of investing in the Portfolio and other funds. To do so, compare this 5% hypothetical example with the 5% hypothetical examples that appear in the shareholder reports of the other funds.
Please note that the expenses shown in the table are meant to highlight your ongoing costs only and do not reflect any transactional costs, such as sales charges (loads). Therefore, the information for each class in the table is useful in comparing ongoing costs only, and will not help you determine the relative total costs of owning different funds. In addition, if these transactional costs were included, your costs would have been higher.
| | | Beginning
Account
Value
7/1/16 | | Actual Ending
Account
Value
12/31/16 | | Hypothetical
Ending Account
Value | | Actual
Expenses
Paid
During
Period* | | Hypothetical
Expenses Paid
During Period* | | Net
Expense
Ratio
During
Period** | |
Multi-Asset Portfolio Class I | | $ | 1,000.00 | | | $ | 1,031.30 | | | $ | 1,019.91 | | | $ | 5.31 | | | $ | 5.28 | | | | 1.04 | %*** | |
Multi-Asset Portfolio Class A | | | 1,000.00 | | | | 1,030.90 | | | | 1,018.15 | | | | 7.10 | | | | 7.05 | | | | 1.39 | *** | |
Multi-Asset Portfolio Class L | | | 1,000.00 | | | | 1,027.80 | | | | 1,015.94 | | | | 9.33 | | | | 9.27 | | | | 1.83 | *** | |
Multi-Asset Portfolio Class C | | | 1,000.00 | | | | 1,027.10 | | | | 1,014.38 | | | | 10.90 | | | | 10.84 | | | | 2.14 | *** | |
Multi-Asset Portfolio Class IS | | | 1,000.00 | | | | 1,032.30 | | | | 1,020.06 | | | | 5.16 | | | | 5.13 | | | | 1.01 | *** | |
* Expenses are calculated using each Portfolio Class' annualized net expense ratio (as disclosed), multiplied by the average account value over the period, and multiplied by 184/366 (to reflect the most recent one-half year period).
** Annualized.
*** Refer to Note F in the Notes to Consolidated Financial Statements for discussion of prior period custodian out-of-pocket expenses that were reimbursed in the current period.
3
Morgan Stanley Institutional Fund, Inc.
Annual Report — December 31, 2016
Investment Overview (unaudited)
Multi-Asset Portfolio
The Portfolio seeks total return. The Portfolio's "Adviser," Morgan Stanley Investment Management Inc., seeks to achieve this objective with an emphasis on positive absolute return and controlling downside portfolio risk.
Performance
For the year ended December 31, 2016, the Portfolio's Class I shares had a total return based on net asset value and reinvestment of distributions per share of –2.75%, net of fees. The Portfolio's Class I shares underperformed the Portfolio's primary benchmark, the Bank of America/Merrill Lynch U.S. Dollar 1-month LIBID Average Index (the "Index"), which returned 0.37%, and underperformed the secondary benchmark, the Customized MSIM Global Allocation Index (comprising 60% MSCI All Country World Index, 30% Bloomberg Barclays Global Aggregate Bond Index, 5% S&P GSCI Light Energy Index, and 5% Bank of America/Merrill Lynch U.S. Dollar 1-Month LIBID Average Index), which returned 5.81%. The Portfolio and benchmark index performances are represented in U.S. dollar ("USD") terms.
Factors Affecting Performance*
• During 2016, global equities (MSCI All Country World Index) rose +7.9% in USD and +9.0% in local currency terms, making a new all-time high in local terms. Risky assets rallied despite intermittent growth scares (China during the first quarter, Brexit in the second quarter). The U.S. presidential election was supportive of equities, as markets appeared to price in optimistic expectations for pro-growth and inflationary outcomes of a Trump administration; the eurozone and the U.K. achieved better-than-expected growth despite Brexit concerns; and Chinese manufacturing activity bottomed in the first quarter and improved meaningfully throughout the year, supported by massive credit easing. Cyclical sectors outperformed, led by energy and materials, while defensive sectors such as health care and consumer staples lagged.
• U.S. equities (S&P 500 Index, +12.0% USD) outperformed global equities, as expectations for expansionary fiscal policy and corporate tax cuts under President-elect Trump helped the market to shrug off impending rate hikes. Emerging markets also outperformed (MSCI Emerging Markets, +11.2% USD), helped by a stabilization in Chinese growth and comparatively depressed valuations going into the year. Japanese equities (MSCI Japan Index +2.4% USD) lagged as inflation relapsed
while the Bank of Japan ("BOJ") appeared to have exhausted monetary policy. Eurozone equities were the worst-performing region (Euro Stoxx 50 Index, +0.7% USD), weighed down by Brexit, financial sector concerns and disappointing policy easing from the European Central Bank ("ECB").
• Bonds were slightly up for the year, with the J.P. Morgan Global Government Bond Index gaining +1.6% in USD (+2.9% local). Rates moved sharply lower in the first half of the year, with many sovereign yields reaching all-time lows in July 2016 following Brexit. However, these gains were largely erased as bonds corrected following the victory of Donald Trump in the U.S. presidential election, which was perceived to be pro-growth and inflationary. The Federal Reserve resumed hiking rates in December 2016, though the ECB and the BOJ proceeded to ease, with each cutting rates in the first quarter, the BOJ implementing yield curve control in the third quarter, and the ECB expanding quantitative easing during the fourth quarter. Within fixed income, high yield meaningfully outperformed on improving growth and better oil prices, with the Bloomberg Barclays U.S. Corporate High Yield Total Return Index up +17.1% in USD as spreads tightened by 250 basis points (bps) to 4.1%.
• Commodities outperformed equites and fixed income in 2016, with the S&P GSCI Total Return Index up +11.4% in USD. Brent oil rose +52.4% to $57 per barrel as the Organization of the Petroleum Exporting Countries implemented production cuts; industrial metals such as iron ore and copper rose +81.0% and +17.4%, respectively, on strong Chinese property sales and expectations for U.S. infrastructure spending; and gold gained +8.6% as U.S. and eurozone inflation improved.
• The Portfolio's best-performing investments in 2016 were positions within our Japan reflation theme. In the fourth quarter, we were long Japanese versus developed market equites and short the yen, based on our view that Japan's inflation outlook was improving.
* Certain of the Portfolio's investment themes may, in whole or part, be implemented through the use of derivatives, including the purchase and sale of futures, options, swaps, structured investments (including commodity-linked notes) and other related instruments and techniques. The Portfolio may also invest in foreign currency forward exchange contracts, which are also derivatives, in connection with its investments in foreign securities. The Portfolio may use derivative instruments for a variety of purposes, including hedging, risk management, portfolio management or to earn income. As a result, the use of derivatives had a material effect on the Portfolio's performance during the period.
4
Morgan Stanley Institutional Fund, Inc.
Annual Report — December 31, 2016
Investment Overview (unaudited) (cont'd)
Multi-Asset Portfolio
• Our long "value" / short expensive "safety" theme also contributed positively, as bank stocks and high yield bonds rallied, while global government bonds and bond proxies such as consumer staples stocks sold off sharply on bullish growth revisions following the U.S. election. Our "growth rebound" theme (long equites versus bonds), which we initiated post-Brexit, also contributed as growth came in better than expected during the second half of 2016.
• Our long in Brent oil contributed, though gains were partially offset by losses on longs in oil-sensitive currencies as the U.S. dollar rallied after the election.
• Tactical long positions in equities held in March and April were strong positive contributors, though these gains were partially offset by a short position in equities that was initiated in May (and closed in early June).
• Select emerging market assets contributed, including a Mexican rates flattener (short 2-year, long 10-year rates), longs in Argentine bonds, and short positions in the Chinese renminbi versus the U.S. dollar. However, positions with indirect exposure to slower growth in China detracted (short luxury goods and Chinese internet stocks, long Australian versus German 10-year rates).
• The European recovery theme (long eurozone versus U.S. equities, long eurozone banks and Greek bonds) detracted on a year-to-date basis, though the majority of losses were recovered during the fourth quarter as eurozone domestic growth accelerated and German yields backed up.
• Our aerospace cycle peaking theme detracted during the year, in addition to some of our independent sector themes (short U.S. apartment real estate investment trusts and media, long U.S. pharmaceuticals).
Management Strategies(i)
• As of December 31, 2016, the Portfolio's net equity exposure was 0.1%, net fixed income exposure was –15.6% (–9.3% in U.S. 10-year Treasury duration-equivalent exposure), and net commodities exposure was –4.4%.(ii)
• Heading into 2017, we are neutral global equities and slightly short global fixed income. The global economy and profits are currently growing above trend. However, in the medium term it is a low-growth world (with about 2.3% potential global gross domestic product growth); the upside we expect from a Trump presidency is mostly priced into equity and bond markets in the U.S.; and our expectation for a further slowdown in China presents downside risk. Our outlook for global equities is roughly balanced, with better growth offset by overbought sentiment, high valuations, rising yields and optimistic earnings growth estimates. Within fixed income, we closed our short position in U.S. Treasuries toward year-end and shifted to a small long position, as yields exceeded our target and sentiment moved into overbought territory. We remain slightly short fixed income as a consequence of being short German bunds, where we expect yields to backup further as growth continues at an above-trend pace.
• We believe U.S. equities are expensive, and expect U.S. growth to disappoint in 2017. We think tax cuts under the Trump administration may indeed improve U.S. growth in 2018, but trade and immigration restrictions may partially offset this. More immediately, we expect the 85 basis points (bps) increase in the 10-year Treasury yield and the +7% appreciation in the U.S. dollar during the fourth quarter to weigh on activity, causing 2017 growth to disappoint at 1.9% versus 2.3% expected by consensus. In addition, sentiment is extremely overbought and multiples have returned to cycle highs, having priced in roughly 75% of the expected benefit from corporate tax cuts in 2018. While better growth should have a positive impact on multiples, higher policy rates and long-dated yields tend to have the opposite effect, leaving valuations rich today.
(i) Source: Morgan Stanley Investment Management (MSIM) Global Multi-Asset Team analysis; market data sourced from Bloomberg; consensus estimates sourced from Thomson Reuters I/B/E/S.
(ii) The Portfolio seeks to achieve a consistent level of positive absolute returns while controlling downside portfolio risk. The Portfolio seeks to achieve this objective by taking long and short positions (often in the form of paired or hedged trades) in a range of equity and equity related securities of any market capitalization, bonds, currencies and commodities, which can result in negative net exposures. As the Portfolio's primary benchmark (the Bank of America/Merrill Lynch U.S. Dollar 1-month LIBID Average Index) represents cash, the Portfolio will maintain, from time to time, significant exposure to a risk-free asset class.
5
Morgan Stanley Institutional Fund, Inc.
Annual Report — December 31, 2016
Investment Overview (unaudited) (cont'd)
Multi-Asset Portfolio
• The eurozone recovery continues to be a significant theme in our Portfolio, expressed primarily through a long position in a basket of domestically oriented eurozone stocks. The eurozone economy has continued to weather Brexit well, and eurozone growth caught up with the U.S. in the second half of 2016. We expect the eurozone to continue growing between 1.5% and 1.75% in 2017, supported by accommodative monetary policy, growth in the banking sector, the end of fiscal austerity, a weak currency and pent-up demand. We believe valuation multiples are not yet reflecting resilient growth conditions. We expect eurozone domestic earnings per share ("EPS") growth of 9% in 2017 versus only 7% EPS growth in the U.S.; however, eurozone domestic stocks are currently trading at a 17% discount to U.S. equities versus a historical average discount of only 5%. We believe domestic equities could even re-rate to trade at a premium to U.S. equities, as they have done historically when eurozone growth has outpaced that of the U.S. and when the Federal Reserve has been tightening policy more than the ECB.
• We hold short positions in emerging market- and commodity-sensitive assets. In our view, emerging markets remain in transition to lower growth and the deflation of China's investment bubble remains incomplete. China's massive credit stimulus supported growth in the second half of 2016, but we are expecting a growth relapse in the first half of 2017, weighing on export-sensitive emerging market economies. Near-term growth momentum is highly dependent on continued stimulus, which we expect the government to be unable to sustain, and the effectiveness of credit stimulus has been rapidly diminishing given structural pressures.
• We are slightly short fixed income. We continue to hold a short in German 10-year bunds, as we believe yields remain expensive given ongoing improvements in global and eurozone growth. We expect global growth to pick up by 50 bps to 2.3-2.4% in 2017, with the eurozone growing at an above-trend pace of 1.5% to 1.7%. We estimate that fair value for the German 10-year yield is currently 0.8%, or roughly 50 bps above the current yield of 0.3%. We are long U.S. 10-year Treasuries, as yields have recently exceeded our estimate of fair value (2.3% as of end-2016, increasing to 2.6% by end-2018). On a relative basis, we believe Treasuries
are particularly expensive: taking into account expected policy rate differentials and inflation, we estimate that fair value for the U.S. versus German 10-year yield spread is closer to between 1.3% and 1.5% today, compared to the current spread of 2%. We also hold relative long positions (versus German bunds) in Australian 10-year bonds, given our expectation for additional policy easing as China slows, and Italian 10-year bonds, as we believe political and banking sector risks have been overstated.
• In sum, our main themes are centered around the eurozone economic recovery, our expectations for a further China-led commodity and global trade slowdown, the potential for a U.S. growth disappointment in 2017, as well as idiosyncratic themes such as the aerospace cycle peaking.

* Minimum Investment for Class I shares
** Commenced Operations on June 22, 2012.
In accordance with SEC regulations, the Portfolio's performance shown assumes that all recurring fees (including management fees) were deducted and all dividends and distributions were reinvested. The performance of Class A, L, C and IS shares will vary from the performance of Class I shares based upon their different inception dates and will be impacted by additional fees assessed to those classes (if applicable).
6
Morgan Stanley Institutional Fund, Inc.
Annual Report — December 31, 2016
Investment Overview (unaudited) (cont'd)
Multi-Asset Portfolio
Performance Compared to the Bank of America/Merrill Lynch U.S. Dollar 1-Month LIBID Average Index(1), the Customized MSIM Global Allocation Index(2) and the Lipper Alternative Global Macro Funds Index(3)
| | | Period Ended December 31, 2016
Total Returns(4) | |
| | | | | Averge Annual | |
| | | One
Year | | Five
Years | | Ten
Years | | Since
Inception(8) | |
Portfolio — Class I Shares
w/o sales charges(5) | | | –2.75 | % | | | — | | | | — | | | | 1.77 | % | |
Portfolio — Class A Shares
w/o sales charges(5) | | | –2.94 | | | | — | | | | — | | | | 1.49 | | |
Portfolio — Class A Shares with
maximum 5.25% sales charges(5) | | | –8.05 | | | | — | | | | — | | | | 0.29 | | |
Portfolio — Class L Shares
w/o sales charges(5) | | | –3.42 | | | | — | | | | — | | | | 0.98 | | |
Portfolio — Class C Shares
w/o sales charges(6) | | | –3.70 | | | | — | | | | — | | | | –7.64 | | |
Portfolio — Class C Shares with
maximum 1.00% deferred
sales charges(6) | | | –4.65 | | | | — | | | | — | | | | –7.64 | | |
Portfolio — Class IS Shares
w/o sales charges(7) | | | –2.65 | | | | — | | | | — | | | | –5.99 | | |
Bank of America/Merrill Lynch
U.S. Dollar 1-Month LIBID
Average Index | | | 0.37 | | | | — | | | | — | | | | 0.15 | | |
Customized MSIM Global
Allocation Index | | | 5.81 | | | | — | | | | — | | | | 5.37 | | |
Lipper Alternative Global Macro
Funds Index | | | 5.10 | | | | — | | | | — | | | | 2.76 | | |
Performance data quoted represents past performance, which is no guarantee of future results, and current performance may be lower or higher than the figures shown. Performance assumes that all dividends and distributions, if any, were reinvested. For the most recent month-end performance figures, please visit www.morganstanley.com/im. Investment return and principal value will fluctuate so that Portfolio shares, when redeemed, may be worth more or less than their original cost. Total returns do not reflect the deduction of taxes that a shareholder would pay on Portfolio distributions or the redemption of Portfolio shares. Performance of share classes will vary due to difference in sales charges and expenses.
(1) The Bank of America/Merrill Lynch U.S. Dollar 1-Month LIBID Average Index tracks the performance of a basket of synthetic assets paying LIBID to a stated maturity. The index purchases a new instrument each day, priced at par, having exactly its stated maturity and with a coupon equal to that day's fixing rate. All issues are held to maturity. Therefore, each day the index is comprised of a basket of securities. The index is not marked to market. The returns of the index represent the accrued income generated by the equally weighted average of all the coupons in the basket for a given day. The Index is unmanaged and its returns do not include any sales charges or fees. Such costs would lower performance. It is not possible to invest directly in an index.
(2) The Customized MSIM Global Allocation Index is comprised of 60% MSCI All Country World Index (benchmark that measures the equity market performance of developed and emerging markets), 30% Bloomberg Barclay Global Aggregate Bond Index (benchmark that provides a broadbased measure of the global
investment grade fixed-rate debt markets), 5% S&P GSCI Light Energy Index (benchmark for investment performance in the energy commodity market), and 5% Bank of America/Merrill Lynch U.S. Dollar 1-Month LIBID Average Index (benchmark that tracks the performance of a basket of synthetic assets paying LIBID to a stated maturity). The Index is unmanaged and its returns do not include any sales charges or fees. Such costs would lower performance. It is not possible to invest directly in an index.
(3) The Lipper Alternative Global Macro Funds Index is an equally weighted performance index of the largest qualifying funds (based on net assets) in the Lipper Alternative Global Macro Funds classification. The Index, which is adjusted for capital gains distributions and income dividends, is unmanaged and should not be considered an investment. There are currently 30 funds represented in this Index. As of the date of this report, the Portfolio is in the Lipper Alternative Global Macro Funds classification.
(4) Total returns for the Portfolio reflect fees waived and expenses reimbursed, if applicable, by the Adviser. Without such waivers and reimbursements, total returns would have been lower.
(5) Commenced operations on June 22, 2012.
(6) Commenced offering on April 30, 2015.
(7) Commenced offering on May 29, 2015.
(8) For comparative purposes, average annual since inception returns listed for the Indexes refer to the inception date of Class I of the Portfolio, not the inception of the Index.
7
Morgan Stanley Institutional Fund, Inc.
Annual Report — December 31, 2016
Consolidated Portfolio of Investments
Multi-Asset Portfolio
| | | Shares | | Value
(000) | |
Common Stocks (23.4%) | |
Australia (0.0%) | |
Goodman Group REIT | | | 33 | | | $ | — | @ | |
Stockland REIT | | | 67 | | | | — | @ | |
| | | | — | @ | |
Austria (0.1%) | |
Erste Group Bank AG (a) | | | 2,685 | | | | 79 | | |
Raiffeisen Bank International AG (a) | | | 1,123 | | | | 20 | | |
| | | | 99 | | |
Belgium (0.1%) | |
KBC Group N.V. | | | 2,410 | | | | 149 | | |
China (0.0%) | |
Hanergy Thin Film Power Group Ltd. (a)(b)(c)(d) | | | 178,000 | | | | 2 | | |
Denmark (0.5%) | |
DSV A/S | | | 7,828 | | | | 348 | | |
ISS A/S | | | 7,901 | | | | 267 | | |
| | | | 615 | | |
France (7.7%) | |
Accor SA | | | 21,421 | | | | 799 | | |
Aeroports de Paris (ADP) | | | 871 | | | | 93 | | |
Atos SE | | | 6,210 | | | | 655 | | |
BNP Paribas SA | | | 10,180 | | | | 649 | | |
Bouygues SA | | | 16,803 | | | | 602 | | |
Cap Gemini SA | | | 11,427 | | | | 964 | | |
Cie de Saint-Gobain | | | 35,876 | | | | 1,671 | | |
Credit Agricole SA | | | 10,158 | | | | 126 | | |
Groupe Eurotunnel SE | | | 19,556 | | | | 186 | | |
Metropole Television SA | | | 2,903 | | | | 54 | | |
Natixis SA | | | 9,021 | | | | 51 | | |
Peugeot SA (a) | | | 90,591 | | | | 1,478 | | |
Rexel SA | | | 18,499 | | | | 305 | | |
Societe Generale SA | | | 7,355 | | | | 362 | | |
Television Francaise 1 | | | 10,284 | | | | 102 | | |
Vinci SA | | | 26,931 | | | | 1,834 | | |
| | | | 9,931 | | |
Germany (1.2%) | |
Commerzbank AG | | | 10,249 | | | | 78 | | |
Deutsche Boerse AG (a) | | | 9,742 | | | | 795 | | |
Fraport AG Frankfurt Airport Services Worldwide | | | 2,533 | | | | 150 | | |
ProSiebenSat.1 Media SE (Registered) | | | 10,703 | | | | 413 | | |
Stroeer SE & Co. KGaA | | | 1,891 | | | | 83 | | |
| | | | 1,519 | | |
Ireland (0.6%) | |
Bank of Ireland (a) | | | 268,707 | | | | 66 | | |
CRH PLC | | | 20,311 | | | | 705 | | |
| | | | 771 | | |
Italy (2.1%) | |
Atlantia SpA | | | 35,818 | | | | 839 | | |
Intesa Sanpaolo SpA | | | 130,670 | | | | 332 | | |
Mediaset SpA | | | 82,562 | | | | 357 | | |
Mediobanca SpA | | | 121,121 | | | | 989 | | |
| | | Shares | | Value
(000) | |
UniCredit SpA | | | 48,732 | | | $ | 140 | | |
Unione di Banche Italiane SpA | | | 8,475 | | | | 24 | | |
| | | | 2,681 | | |
Netherlands (1.1%) | |
ABN AMRO Group N.V. CVA (e) | | | 2,259 | | | | 50 | | |
ING Groep N.V. | | | 37,162 | | | | 523 | | |
Randstad Holding N.V. | | | 15,017 | | | | 815 | | |
| | | | 1,388 | | |
Portugal (0.0%) | |
Banco Espirito Santo SA (Registered) (a)(c)(d) | | | 570,338 | | | | — | | |
Spain (1.3%) | |
Banco Bilbao Vizcaya Argentaria SA | | | 62,426 | | | | 422 | | |
Banco de Sabadell SA | | | 51,020 | | | | 71 | | |
Banco Popular Espanol SA | | | 32,037 | | | | 31 | | |
Banco Santander SA | | | 138,535 | | | | 723 | | |
Bankia SA | | | 44,197 | | | | 45 | | |
Bankinter SA | | | 6,472 | | | | 50 | | |
CaixaBank SA | | | 25,557 | | | | 85 | | |
Mediaset Espana Comunicacion SA | | | 26,087 | | | | 306 | | |
| | | | 1,733 | | |
Switzerland (1.0%) | |
Adecco Group AG (Registered) | | | 18,826 | | | | 1,232 | | |
United Kingdom (0.5%) | |
International Consolidated Airlines Group SA | | | 128,731 | | | | 699 | | |
United States (7.2%) | |
Abbott Laboratories | | | 2,500 | | | | 96 | | |
AbbVie, Inc. | | | 2,800 | | | | 175 | | |
AES Corp. | | | 1,100 | | | | 13 | | |
Aetna, Inc. | | | 600 | | | | 74 | | |
Agilent Technologies, Inc. | | | 600 | | | | 27 | | |
Alexion Pharmaceuticals, Inc. (a) | | | 400 | | | | 49 | | |
Allergan PLC (a) | | | 600 | | | | 126 | | |
Alliant Energy Corp. | | | 400 | | | | 15 | | |
Altria Group, Inc. | | | 3,300 | | | | 223 | | |
Ameren Corp. | | | 400 | | | | 21 | | |
American Electric Power Co., Inc. | | | 800 | | | | 50 | | |
American Water Works Co., Inc. | | | 300 | | | | 22 | | |
AmerisourceBergen Corp. | | | 300 | | | | 23 | | |
Amgen, Inc. | | | 1,200 | | | | 175 | | |
Anthem, Inc. | | | 400 | | | | 58 | | |
Archer-Daniels-Midland Co. | | | 1,000 | | | | 46 | | |
AT&T, Inc. | | | 10,500 | | | | 447 | | |
Baxter International, Inc. | | | 800 | | | | 35 | | |
Becton Dickinson and Co. | | | 400 | | | | 66 | | |
Biogen, Inc. (a) | | | 400 | | | | 113 | | |
Boston Scientific Corp. (a) | | | 2,300 | | | | 50 | | |
Bristol-Myers Squibb Co. | | | 2,800 | | | | 164 | | |
Brown-Forman Corp., Class B | | | 300 | | | | 13 | | |
Campbell Soup Co. | | | 300 | | | | 18 | | |
Cardinal Health, Inc. | | | 500 | | | | 36 | | |
Celgene Corp. (a) | | | 1,300 | | | | 150 | | |
Centene Corp. (a) | | | 300 | | | | 17 | | |
The accompanying notes are an integral part of the consolidated financial statements.
8
Morgan Stanley Institutional Fund, Inc.
Annual Report — December 31, 2016
Consolidated Portfolio of Investments (cont'd)
Multi-Asset Portfolio
| | | Shares | | Value
(000) | |
United States (cont'd) | |
CenterPoint Energy, Inc. | | | 700 | | | $ | 17 | | |
CenturyLink, Inc. | | | 900 | | | | 21 | | |
Cerner Corp. (a) | | | 500 | | | | 24 | | |
Church & Dwight Co., Inc. | | | 400 | | | | 18 | | |
Cigna Corp. | | | 400 | | | | 53 | | |
Clorox Co. (The) | | | 200 | | | | 24 | | |
CMS Energy Corp. | | | 500 | | | | 21 | | |
Coca-Cola Co. | | | 6,600 | | | | 274 | | |
Colgate-Palmolive Co. | | | 1,500 | | | | 98 | | |
Conagra Brands, Inc. | | | 700 | | | | 28 | | |
Consolidated Edison, Inc. | | | 500 | | | | 37 | | |
Constellation Brands, Inc., Class A | | | 300 | | | | 46 | | |
Cooper Cos., Inc. (The) | | | 100 | | | | 18 | | |
Costco Wholesale Corp. | | | 700 | | | | 112 | | |
Coty, Inc., Class A | | | 800 | | | | 15 | | |
CR Bard, Inc. | | | 100 | | | | 22 | | |
CVS Health Corp. | | | 1,800 | | | | 142 | | |
Danaher Corp. | | | 1,000 | | | | 78 | | |
DaVita, Inc. (a) | | | 300 | | | | 19 | | |
DENTSPLY SIRONA, Inc. | | | 400 | | | | 23 | | |
Dominion Resources, Inc. | | | 1,100 | | | | 84 | | |
Dr. Pepper Snapple Group, Inc. | | | 300 | | | | 27 | | |
DTE Energy Co. | | | 300 | | | | 30 | | |
Duke Energy Corp. | | | 1,200 | | | | 93 | | |
Edison International | | | 500 | | | | 36 | | |
Edwards Lifesciences Corp. (a) | | | 400 | | | | 37 | | |
Eli Lilly & Co. | | | 1,600 | | | | 118 | | |
Endo International PLC (a) | | | 400 | | | | 7 | | |
Entergy Corp. | | | 300 | | | | 22 | | |
Envision Healthcare Corp. (a) | | | 200 | | | | 13 | | |
Estee Lauder Cos., Inc. (The), Class A | | | 400 | | | | 31 | | |
Eversource Energy | | | 500 | | | | 28 | | |
Exelon Corp. | | | 1,500 | | | | 53 | | |
Express Scripts Holding Co. (a) | | | 1,100 | | | | 76 | | |
FirstEnergy Corp. | | | 700 | | | | 22 | | |
Frontier Communications Corp. | | | 1,900 | | | | 6 | | |
General Mills, Inc. | | | 1,000 | | | | 62 | | |
Gilead Sciences, Inc. | | | 2,200 | | | | 158 | | |
HCA Holdings, Inc. (a) | | | 500 | | | | 37 | | |
Henry Schein, Inc. (a) | | | 100 | | | | 15 | | |
Hershey Co. (The) | | | 200 | | | | 21 | | |
Hologic, Inc. (a) | | | 500 | | | | 20 | | |
Hormel Foods Corp. | | | 500 | | | | 17 | | |
Humana, Inc. | | | 300 | | | | 61 | | |
Illumina, Inc. (a) | | | 200 | | | | 26 | | |
Intuitive Surgical, Inc. (a) | | | 100 | | | | 63 | | |
JM Smucker Co. (The) | | | 200 | | | | 26 | | |
Johnson & Johnson | | | 4,600 | | | | 530 | | |
Kellogg Co. | | | 400 | | | | 30 | | |
Kimberly-Clark Corp. | | | 600 | | | | 68 | | |
Kraft Heinz Co. (The) | | | 1,000 | | | | 87 | | |
Kroger Co. (The) | | | 1,600 | | | | 55 | | |
| | | Shares | | Value
(000) | |
Laboratory Corp. of America Holdings (a) | | | 200 | | | $ | 26 | | |
Level 3 Communications, Inc. (a) | | | 500 | | | | 28 | | |
Mallinckrodt PLC (a) | | | 200 | | | | 10 | | |
McCormick & Co., Inc. | | | 200 | | | | 19 | | |
McKesson Corp. | | | 400 | | | | 56 | | |
Mead Johnson Nutrition Co. | | | 300 | | | | 21 | | |
Medtronic PLC | | | 2,400 | | | | 171 | | |
Merck & Co., Inc. | | | 4,700 | | | | 277 | | |
Molson Coors Brewing Co., Class B | | | 300 | | | | 29 | | |
Mondelez International, Inc., Class A | | | 2,600 | | | | 115 | | |
Monster Beverage Corp. (a) | | | 700 | | | | 31 | | |
Mylan N.V. (a) | | | 800 | | | | 31 | | |
NextEra Energy, Inc. | | | 800 | | | | 96 | | |
NiSource, Inc. | | | 600 | | | | 13 | | |
NRG Energy, Inc. | | | 500 | | | | 6 | | |
Patterson Cos., Inc. | | | 100 | | | | 4 | | |
PepsiCo, Inc. | | | 2,400 | | | | 251 | | |
PerkinElmer, Inc. | | | 200 | | | | 10 | | |
Perrigo Co., PLC | | | 200 | | | | 17 | | |
Pfizer, Inc. | | | 10,200 | | | | 331 | | |
PG&E Corp. | | | 800 | | | | 49 | | |
Philip Morris International, Inc. | | | 2,600 | | | | 238 | | |
Pinnacle West Capital Corp. | | | 200 | | | | 16 | | |
PPL Corp. | | | 1,100 | | | | 37 | | |
Procter & Gamble Co. (The) | | | 4,600 | | | | 387 | | |
Public Service Enterprise Group, Inc. | | | 900 | | | | 40 | | |
Quest Diagnostics, Inc. | | | 200 | | | | 18 | | |
Regeneron Pharmaceuticals, Inc. (a) | | | 100 | | | | 37 | | |
Reynolds American, Inc. | | | 1,400 | | | | 78 | | |
SCANA Corp. | | | 200 | | | | 15 | | |
Sempra Energy | | | 400 | | | | 40 | | |
Southern Co. (The) | | | 1,700 | | | | 84 | | |
St. Jude Medical, Inc. | | | 500 | | | | 40 | | |
Stryker Corp. | | | 500 | | | | 60 | | |
Sysco Corp. | | | 900 | | | | 50 | | |
Thermo Fisher Scientific, Inc. | | | 700 | | | | 99 | | |
Tyson Foods, Inc., Class A | | | 500 | | | | 31 | | |
UnitedHealth Group, Inc. | | | 1,600 | | | | 256 | | |
Universal Health Services, Inc., Class B | | | 200 | | | | 21 | | |
Varian Medical Systems, Inc. (a) | | | 200 | | | | 18 | | |
Verizon Communications, Inc. | | | 6,900 | | | | 368 | | |
Vertex Pharmaceuticals, Inc. (a) | | | 400 | | | | 29 | | |
Wal-Mart Stores, Inc. | | | 2,600 | | | | 180 | | |
Walgreens Boots Alliance, Inc. | | | 1,400 | | | | 116 | | |
Waters Corp. (a) | | | 100 | | | | 13 | | |
WEC Energy Group, Inc. | | | 500 | | | | 29 | | |
Whole Foods Market, Inc. | | | 500 | | | | 15 | | |
Xcel Energy, Inc. | | | 900 | | | | 37 | | |
Zimmer Biomet Holdings, Inc. | | | 300 | | | | 31 | | |
Zoetis, Inc. | | | 800 | | | | 43 | | |
| | | | 9,368 | | |
Total Common Stocks (Cost $28,913) | | | 30,187 | | |
The accompanying notes are an integral part of the consolidated financial statements.
9
Morgan Stanley Institutional Fund, Inc.
Annual Report — December 31, 2016
Consolidated Portfolio of Investments (cont'd)
Multi-Asset Portfolio
| | | No. of
Rights | | Value
(000) | |
Rights (0.0%) | |
United States (0.0%) | |
Safeway Casa Ley CVR (a) | | | 1,077 | | | $ | 1 | | |
Safeway PDC, LLC CVR (a) | | | 1,077 | | | | — | @ | |
Total Rights (Cost $1) | | | 1 | | |
| | | Face
Amount
(000) | | | |
Fixed Income Securities (0.9%) | |
Sovereign (0.9%) | |
Greece (0.9%) | |
Hellenic Republic Government Bond,
3.00%, 2/24/23 - 2/24/42 (f)
(Cost $1,202) | | EUR | 1,680 | | | | 1,225 | | |
| | | Shares | | | |
Short-Term Investments (73.8%) | |
Investment Company (68.3%) | |
Morgan Stanley Institutional Liquidity
Funds — Government Portfolio —
Institutional Class (See Note G)
(Cost $88,232) | | | 88,232,383 | | | | 88,232 | | |
| | | Face
Amount
(000) | | | |
U.S. Treasury Security (5.5%) | |
U.S. Treasury Bill,
0.41%, 3/23/17 (g)(h) (Cost $7,114) | | $ | 7,120 | | | | 7,112 | | |
Total Short-Term Investments (Cost $95,346) | | | 95,344 | | |
Total Investments (98.1%) (Cost $125,462) (i)(j) | | | 126,757 | | |
Other Assets in Excess of Liabilities (1.9%) | | | 2,487 | | |
Net Assets (100.0%) | | $ | 129,244 | | |
Country assignments and aggregations are based generally on third party vendor classifications and information, and may be different from the assignments and aggregations under the policies set forth in the Portfolio's prospectus and/or statement of additional information relating to geographic classifications.
(a) Non-income producing security.
(b) Security trades on the Hong Kong exchange.
(c) Security has been deemed illiquid at December 31, 2016.
(d) At December 31, 2016, the Portfolio held fair valued securities valued at approximately $2,000, representing less than 0.05% of net assets. These securities have been fair valued as determined in good faith under procedures established by and under the general supervision of the Fund's Directors.
(e) 144A security — Certain conditions for public sale may exist. Unless otherwise noted, these securities are deemed to be liquid.
(f) Multi-step — Coupon rate changes in predetermined increments to maturity. Rate disclosed is as of December 31, 2016. Maturity date disclosed is the ultimate maturity date.
(g) Rate shown is the yield to maturity at December 31, 2016.
(h) All or a portion of the security was pledged to cover margin requirements for swap agreements.
(i) Securities are available for collateral in connection with open foreign currency forward exchange contracts, futures contracts and swap agreements.
(j) At December 31, 2016, the aggregate cost for federal income tax purposes is approximately $126,373,000. The aggregate gross unrealized appreciation is approximately $3,510,000 and the aggregate gross unrealized depreciation is approximately $3,126,000, resulting in net unrealized appreciation of approximately $384,000.
@ Value is less than $500.
CVA Certificaten Van Aandelen.
REIT Real Estate Investment Trust.
Foreign Currency Forward Exchange Contracts:
The Portfolio had the following foreign currency forward exchange contracts open at December 31, 2016:
Counterparty | | Contracts to
Deliver
(000) | | In Exchange
For
(000) | | Delivery
Date | | Unrealized
Appreciation
(Depreciation)
(000) | |
Bank of America NA | | $ | 311 | | | GBP | 245 | | | 1/19/17 | | $ | (9 | ) | |
Bank of Montreal | | $ | 34 | | | CAD | 45 | | | 1/19/17 | | | (1 | ) | |
Bank of Montreal | | $ | 29 | | | GBP | 23 | | | 1/19/17 | | | (1 | ) | |
Bank of New York Mellon | | $ | 31 | | | GBP | 24 | | | 1/19/17 | | | (1 | ) | |
Bank of New York Mellon | | $ | 17 | | | SEK | 154 | | | 1/19/17 | | | — | @ | |
Barclays Bank PLC | | AUD | 2,436 | | | $ | 1,824 | | | 1/19/17 | | | 67 | | |
Barclays Bank PLC | | $ | 338 | | | GBP | 266 | | | 1/19/17 | | | (10 | ) | |
BNP Paribas SA | | JPY | 53,042 | | | $ | 455 | | | 1/19/17 | | | 1 | | |
BNP Paribas SA | | $ | 376 | | | CAD | 493 | | | 1/19/17 | | | (9 | ) | |
Citibank NA | | CHF | 476 | | | $ | 472 | | | 1/19/17 | | | 4 | | |
Citibank NA | | EUR | 39 | | | $ | 42 | | | 1/19/17 | | | — | @ | |
Citibank NA | | EUR | 1,496 | | | $ | 1,580 | | | 1/19/17 | | | 3 | | |
Citibank NA | | $ | 270 | | | DKK | 1,898 | | | 1/19/17 | | | (1 | ) | |
Citibank NA | | $ | 21 | | | JPY | 2,423 | | | 1/19/17 | | | (— | @) | |
Citibank NA | | $ | 4,431 | | | JPY | 518,562 | | | 1/19/17 | | | 10 | | |
Citibank NA | | $ | 739 | | | MYR | 3,264 | | | 1/19/17 | | | (12 | ) | |
Citibank NA | | $ | 494 | | | THB | 17,558 | | | 1/19/17 | | | (4 | ) | |
The accompanying notes are an integral part of the consolidated financial statements.
10
Morgan Stanley Institutional Fund, Inc.
Annual Report — December 31, 2016
Consolidated Portfolio of Investments (cont'd)
Multi-Asset Portfolio
Foreign Currency Forward Exchange Contracts (cont'd):
Counterparty | | Contracts to
Deliver
(000) | | In Exchange
For
(000) | | Delivery
Date | | Unrealized
Appreciation
(Depreciation)
(000) | |
Commonwealth Bank of Australia | | AUD | 722 | | | $ | 540 | | | 1/19/17 | | $ | 20 | | |
Commonwealth Bank of Australia | | EUR | 6,927 | | | $ | 7,386 | | | 1/19/17 | | | 89 | | |
Commonwealth Bank of Australia | | RUB | 10,986 | | | $ | 179 | | | 1/19/17 | | | — | @ | |
Commonwealth Bank of Australia | | $ | 5,873 | | | GBP | 4,624 | | | 1/19/17 | | | (171 | ) | |
Commonwealth Bank of Australia | | $ | 142 | | | GBP | 115 | | | 1/19/17 | | | (— | @) | |
Commonwealth Bank of Australia | | $ | 722 | | | RUB | 46,094 | | | 1/19/17 | | | 28 | | |
Credit Suisse International | | EUR | 983 | | | $ | 1,049 | | | 1/19/17 | | | 13 | | |
Credit Suisse International | | $ | 43 | | | GBP | 34 | | | 1/19/17 | | | (1 | ) | |
Credit Suisse International | | $ | 50 | | | NZD | 69 | | | 1/19/17 | | | (2 | ) | |
Credit Suisse International | | $ | 627 | | | SGD | 893 | | | 1/19/17 | | | (11 | ) | |
Credit Suisse International | | $ | 55 | | | THB | 1,957 | | | 1/19/17 | | | (— | @) | |
Goldman Sachs International | | DKK | 2,368 | | | $ | 340 | | | 1/19/17 | | | 4 | | |
Goldman Sachs International | | EUR | 297 | | | $ | 311 | | | 1/19/17 | | | (2 | ) | |
Goldman Sachs International | | EUR | 1,262 | | | $ | 1,346 | | | 1/19/17 | | | 16 | | |
Goldman Sachs International | | JPY | 21,151 | | | $ | 180 | | | 1/19/17 | | | (1 | ) | |
Goldman Sachs International | | NOK | 4 | | | $ | 1 | | | 1/19/17 | | | — | @ | |
Goldman Sachs International | | TRY | 182 | | | $ | 52 | | | 1/19/17 | | | — | @ | |
Goldman Sachs International | | $ | 1 | | | BRL | 3 | | | 1/19/17 | | | — | @ | |
Goldman Sachs International | | $ | 533 | | | EUR | 511 | | | 1/19/17 | | | 5 | | |
Goldman Sachs International | | $ | 641 | | | HKD | 4,973 | | | 1/19/17 | | | — | @ | |
Goldman Sachs International | | $ | 763 | | | JPY | 89,574 | | | 1/19/17 | | | 4 | | |
Goldman Sachs International | | $ | 17 | | | NZD | 24 | | | 1/19/17 | | | (1 | ) | |
JPMorgan Chase Bank NA | | AUD | 306 | | | $ | 229 | | | 1/19/17 | | | 8 | | |
JPMorgan Chase Bank NA | | EUR | 2,460 | | | $ | 2,624 | | | 1/19/17 | | | 32 | | |
JPMorgan Chase Bank NA | | NOK | 19 | | | $ | 2 | | | 1/19/17 | | | — | @ | |
JPMorgan Chase Bank NA | | $ | 240 | | | AUD | 332 | | | 1/19/17 | | | (1 | ) | |
JPMorgan Chase Bank NA | | $ | 147 | | | CHF | 150 | | | 1/19/17 | | | 1 | | |
JPMorgan Chase Bank NA | | $ | 130 | | | EUR | 123 | | | 1/19/17 | | | (1 | ) | |
JPMorgan Chase Bank NA | | $ | 309 | | | EUR | 295 | | | 1/19/17 | | | 2 | | |
JPMorgan Chase Bank NA | | $ | 2,439 | | | EUR | 2,330 | | | 1/19/17 | | | 16 | | |
JPMorgan Chase Bank NA | | $ | 116 | | | HKD | 897 | | | 1/19/17 | | | — | @ | |
JPMorgan Chase Bank NA | | $ | 80 | | | JPY | 9,233 | | | 1/19/17 | | | (1 | ) | |
JPMorgan Chase Bank NA | | $ | 2,894 | | | MXN | 58,836 | | | 1/19/17 | | | (62 | ) | |
JPMorgan Chase Bank NA | | $ | 112 | | | NZD | 155 | | | 1/19/17 | | | (4 | ) | |
State Street Bank and Trust Co. | | EUR | 849 | | | $ | 905 | | | 1/19/17 | | | 11 | | |
State Street Bank and Trust Co. | | $ | 180 | | | HKD | 1,395 | | | 1/19/17 | | | — | @ | |
UBS AG | | CHF | 224 | | | $ | 222 | | | 1/19/17 | | | 2 | | |
UBS AG | | DKK | 3,847 | | | $ | 552 | | | 1/19/17 | | | 6 | | |
UBS AG | | EUR | 4,952 | | | $ | 5,281 | | | 1/19/17 | | | 64 | | |
Citibank NA | | CNH | 92,402 | | | $ | 14,015 | | | 3/16/17 | | | 1,014 | | |
Citibank NA | | $ | 13,857 | | | CNH | 92,402 | | | 3/16/17 | | | (857 | ) | |
Citibank NA | | CNH | 192,040 | | | $ | 28,637 | | | 5/11/17 | | | 1,820 | | |
Citibank NA | | CNH | 50,609 | | | $ | 7,455 | | | 5/11/17 | | | 388 | | |
Citibank NA | | CNH | 50,761 | | | $ | 7,473 | | | 5/11/17 | | | 385 | | |
Citibank NA | | CNH | 15,384 | | | $ | 2,265 | | | 5/11/17 | | | 117 | | |
Citibank NA | | $ | 2,385 | | | CNH | 16,009 | | | 5/11/17 | | | (149 | ) | |
Citibank NA | | $ | 3,928 | | | CNH | 26,709 | | | 5/11/17 | | | (198 | ) | |
Citibank NA | | $ | 1,812 | | | CNH | 12,199 | | | 5/11/17 | | | (109 | ) | |
Citibank NA | | $ | 2,331 | | | CNH | 15,739 | | | 5/11/17 | | | (133 | ) | |
Citibank NA | | $ | 2,244 | | | CNH | 15,142 | | | 5/11/17 | | | (129 | ) | |
Citibank NA | | $ | 13,061 | | | CNH | 88,458 | | | 5/11/17 | | | (709 | ) | |
Citibank NA | | $ | 1,389 | | | CNH | 9,427 | | | 5/11/17 | | | (72 | ) | |
Citibank NA | | $ | 11,126 | | | CNH | 75,701 | | | 5/11/17 | | | (555 | ) | |
Citibank NA | | $ | 2,285 | | | CNH | 15,959 | | | 5/11/17 | | | (56 | ) | |
JPMorgan Chase Bank NA | | CNH | 50,609 | | | $ | 7,493 | | | 5/11/17 | | | 426 | | |
JPMorgan Chase Bank NA | | CNH | 75,438 | | | $ | 11,126 | | | 5/11/17 | | | 591 | | |
JPMorgan Chase Bank NA | | CNH | 75,438 | | | $ | 11,094 | | | 5/11/17 | | | 560 | | |
JPMorgan Chase Bank NA | | CNH | 14,200 | | | $ | 2,090 | | | 5/11/17 | | | 107 | | |
The accompanying notes are an integral part of the consolidated financial statements.
11
Morgan Stanley Institutional Fund, Inc.
Annual Report — December 31, 2016
Consolidated Portfolio of Investments (cont'd)
Multi-Asset Portfolio
Foreign Currency Forward Exchange Contracts (cont'd):
Counterparty | | Contracts to
Deliver
(000) | | In Exchange
For
(000) | | Delivery
Date | | Unrealized
Appreciation
(Depreciation)
(000) | |
JPMorgan Chase Bank NA | | $ | 7,034 | | | CNH | 47,631 | | | 5/11/17 | | $ | (383 | ) | |
JPMorgan Chase Bank NA | | $ | 545 | | | CNH | 3,691 | | | 5/11/17 | | | (29 | ) | |
JPMorgan Chase Bank NA | | $ | 961 | | | CNH | 6,488 | | | 5/11/17 | | | (55 | ) | |
JPMorgan Chase Bank NA | | $ | 456 | | | CNH | 3,067 | | | 5/11/17 | | | (28 | ) | |
JPMorgan Chase Bank NA | | $ | 2,096 | | | CNH | 14,686 | | | 5/11/17 | | | (45 | ) | |
JPMorgan Chase Bank NA | | $ | 1,397 | | | CNH | 9,599 | | | 5/11/17 | | | (57 | ) | |
JPMorgan Chase Bank NA | | $ | 181 | | | CNH | 1,296 | | | 5/11/17 | | | (— | @) | |
| | | | | | | | | $ | 1,944 | | |
Futures Contracts:
The Portfolio had the following futures contracts open at December 31, 2016:
| | | Number
of
Contracts | | Value
(000) | | Expiration
Date | | Unrealized
Appreciation
(Depreciation)
(000) | |
Long: | |
Euro Stoxx 50 Index (Germany) | | | 83 | | | $ | 2,863 | | | Mar-17 | | $ | 27 | | |
German Euro BTP (Germany) | | | 44 | | | | 6,267 | | | Mar-17 | | | 120 | | |
MSCI Emerging Market E Mini (United States) | | | 46 | | | | 1,976 | | | Mar-17 | | | (46 | ) | |
NIKKEI 225 Index (Japan) | | | 37 | | | | 3,014 | | | Mar-17 | | | 107 | | |
U.S. Treasury 10 yr. Ultra Long Bond (United States) | | �� | 86 | | | | 11,529 | | | Mar-17 | | | (16 | ) | |
Short: | |
Copper Future (United States) | | | 92 | | | | (5,762 | ) | | Mar-17 | | | 215 | | |
German Euro Bund (Germany) | | | 251 | | | | (43,371 | ) | | Mar-17 | | | (749 | ) | |
S&P 500 E Mini Index (United States) | | | 59 | | | | (6,597 | ) | | Mar-17 | | | 63 | | |
| | | | | | | | | $ | (279 | ) | |
Credit Default Swap Agreement:
The Portfolio had the following credit default swap agreement open at December 31, 2016:
Swap Counterparty and
Reference Obligation | | Buy/Sell
Protection | | Notional
Amount
(000) | | Pay/Receive
Fixed Rate | | Termination
Date | | Upfront
Payment
Paid
(000) | | Unrealized
Appreciation
(000) | | Value
(000) | | Credit
Rating of
Reference
Obligation†
(Unaudited) | |
Morgan Stanley & Co., LLC*
CDX.NA.HY.27 | | Sell | | $ | 4,680 | | | | 5.00 | % | | 12/20/21 | | $ | 172 | | | $ | 126 | | | $ | 298 | | | NR | |
Interest Rate Swap Agreements:
The Portfolio had the following interest rate swap agreements open at December 31, 2016:
Swap Counterparty | | Floating Rate
Index | | Pay/Receive
Floating Rate | | Fixed Rate | | Termination
Date | | Notional
Amount
(000) | | Unrealized
Appreciation
(Depreciation)
(000) | |
JPMorgan Chase Bank NA | | 6 Month BBSW | | Pay | | | 2.26 | % | | 6/14/26 | | AUD | 20,320 | | | $ | (859 | ) | |
Morgan Stanley & Co., LLC* | | 6 Month BBSW | | Pay | | | 3.08 | | | 12/23/26 | | | 1,630 | | | | 9 | | |
| | | $ | (850 | ) | |
The accompanying notes are an integral part of the consolidated financial statements.
12
Morgan Stanley Institutional Fund, Inc.
Annual Report — December 31, 2016
Consolidated Portfolio of Investments (cont'd)
Multi-Asset Portfolio
Total Return Swap Agreements:
The Portfolio had the following total return swap agreements open at December 31, 2016: | |
Swap Counterparty | | Index | | Notional
Amount
(000) | | Floating
Rate | | Pay/Receive
Total Return
of Referenced
Index | | Maturity
Date | | Upfront
Payment
Paid
(Received)
(000) | | Unrealized
Appreciation
(Depreciation)
(000) | |
Barclays Bank PLC | | Barclays Short Elevators Index†† | | $ | 1,415 | | | 3 Month USD LIBOR
plus 0.12% | | Pay | | 9/8/17 | | $ | — | | | $ | (19 | ) | |
Barclays Bank PLC | | Short U.S. Capital Goods Index | | | 9,267 | | | 3 Month USD LIBOR | | Pay | | 12/18/17 | | | — | | | | 139 | | |
BNP Paribas SA | | Long U.S. Value Index†† | | | 1,649 | | | 3 Month USD LIBOR | | Receive | | 11/2/17 | | | — | | | | — | @ | |
BNP Paribas SA | | Short U.S. Growth Index†† | | | 1,674 | | | 3 Month USD LIBOR
minus 0.20% | | Pay | | 11/2/17 | | | — | | | | —@ | | |
BNP Paribas SA | | Short Iron Ore Miners Index†† | | | 1,873 | | | 3 Month USD LIBOR
minus 0.04% | | Pay | | 11/16/17 | | | — | | | | (73) | | |
BNP Paribas SA | | Short Iron Ore Miners Index†† | | | 517 | | | 3 Month USD LIBOR
minus 0.04% | | Pay | | 11/16/17 | | | — | | | | 40 | | |
BNP Paribas SA | | Short Iron Ore Miners Index†† | | | 1,635 | | | 3 Month USD LIBOR
minus 0.04% | | Pay | | 11/16/17 | | | — | | | | 34 | | |
BNP Paribas SA | | Short Iron Ore Miners Index†† | | | 330 | | | 3 Month USD LIBOR
minus 0.04% | | Pay | | 11/16/17 | | | — | | | | (10) | | |
Goldman Sachs
International | | Global Aerospace Index†† | | | 10,186 | | | 3 Month USD LIBOR
minus 0.25% | | Pay | | 4/6/17 | | | — | | | | (904) | | |
Goldman Sachs
International | | Global Aerospace Index†† | | | 3,186 | | | 3 Month USD LIBOR
minus 0.25% | | Pay | | 4/6/17 | | | — | | | | (271) | | |
JPMorgan Chase
Bank NA | | Short European Staples Index†† | | | 1,207 | | | 3 Month USD LIBOR
plus 0.03% | | Pay | | 8/11/17 | | | — | | | | 33 | | |
JPMorgan Chase
Bank NA | | Short European Staples Index†† | | | 726 | | | 3 Month USD LIBOR
plus 0.03% | | Pay | | 8/11/17 | | | — | | | | 20 | | |
| | | $ | (1,011 | ) | |
†† See tables below for details of the equity basket holdings underlying the swap.
The following table represents the equity basket holdings underlying the total return swap with Barclays Short Elevators Index as of December 31, 2016.
Security Description | | Index Weight | |
Barclays Short Elevators Index | |
Fujitec Co., Ltd. | | | 1.45 | % | |
Kone OYJ | | | 55.24 | | |
Schindler Holding AG | | | 42.80 | | |
Yungtay Engineering Co., Ltd. | | | 0.51 | | |
| | | | 100.00 | % | |
The following table represents the equity basket holdings underlying the total return swap with Long U.S. Value Index as of December 31, 2016.
Security Description | | Index Weight | |
Long U.S. Value Index | |
AES Corp. | | | 0.99 | % | |
Aflac, Inc. | | | 0.99 | | |
Allstate Corp. (The) | | | 0.99 | | |
American Airlines Group, Inc. | | | 0.98 | | |
Anthem, Inc. | | | 0.99 | | |
Archer-Daniels-Midland Co. | | | 1.00 | | |
Arconic, Inc. | | | 0.98 | | |
AutoNation, Inc. | | | 0.99 | | |
Baker Hughes, Inc. | | | 1.00 | | |
Bed Bath & Beyond, Inc. | | | 0.99 | | |
Security Description | | Index Weight | |
BorgWarner, Inc. | | | 0.99 | % | |
Capital One Financial Corp. | | | 0.99 | | |
Cardinal Health, Inc. | | | 0.99 | | |
CBRE Group, Inc. | | | 1.00 | | |
Centene Corp. | | | 0.99 | | |
CF Industries Holdings, Inc. | | | 0.98 | | |
Cisco Systems, Inc. | | | 0.98 | | |
Citigroup, Inc. | | | 0.99 | | |
Corning, Inc. | | | 0.99 | | |
CVS Health Corp. | | | 0.99 | | |
DaVita, Inc. | | | 0.99 | | |
Delta Air Lines, Inc. | | | 0.99 | | |
Dow Chemical Co. (The) | | | 0.99 | | |
DR Horton, Inc. | | | 0.99 | | |
Duke Energy Corp. | | | 0.99 | | |
Eastman Chemical Co. | | | 0.99 | | |
Eaton Corp. PLC | | | 0.99 | | |
Endo International PLC | | | 1.04 | | |
Entergy Corp. | | | 0.99 | | |
Envision Healthcare Corp. | | | 0.98 | | |
Equity Residential | | | 1.00 | | |
Exelon Corp. | | | 0.99 | | |
Express Scripts Holding Co. | | | 0.98 | | |
FedEx Corp. | | | 0.99 | | |
First Solar, Inc. | | | 0.98 | | |
The accompanying notes are an integral part of the consolidated financial statements.
13
Morgan Stanley Institutional Fund, Inc.
Annual Report — December 31, 2016
Consolidated Portfolio of Investments (cont'd)
Multi-Asset Portfolio
Security Description | | Index Weight | |
Long U.S. Value Index (cont'd) | |
FirstEnergy Corp. | | | 0.99 | % | |
Fluor Corp. | | | 0.99 | | |
Ford Motor Co. | | | 0.99 | | |
Frontier Communications Corp. | | | 1.00 | | |
General Motors Co. | | | 0.98 | | |
Goodyear Tire & Rubber Co. (The) | | | 0.98 | | |
Hartford Financial Services Group, Inc. (The) | | | 0.99 | | |
HCP, Inc. | | | 1.01 | | |
Hewlett Packard Enterprise Co. | | | 0.98 | | |
Host Hotels & Resorts, Inc. | | | 1.00 | | |
HP, Inc. | | | 0.99 | | |
Intel Corp. | | | 0.98 | | |
Jacobs Engineering Group, Inc. | | | 0.99 | | |
Juniper Networks, Inc. | | | 0.99 | | |
Kimco Realty Corp. | | | 1.01 | | |
Kohl's Corp. | | | 0.98 | | |
Kroger Co. (The) | | | 0.99 | | |
L3 Technologies, Inc. | | | 0.99 | | |
Laboratory Corp. of America Holdings | | | 0.99 | | |
Lennar Corp. | | | 0.99 | | |
Lincoln National Corp. | | | 1.00 | | |
Loews Corp. | | | 0.99 | | |
Macy's, Inc. | | | 0.98 | | |
Mallinckrodt PLC | | | 1.00 | | |
Marathon Petroleum Corp. | | | 0.99 | | |
McKesson Corp. | | | 0.98 | | |
MetLife, Inc. | | | 0.99 | | |
Micron Technology, Inc. | | | 0.98 | | |
Mosaic Co. (The) | | | 0.99 | | |
Murphy Oil Corp. | | | 0.98 | | |
Mylan N.V. | | | 1.01 | | |
Navient Corp. | | | 1.00 | | |
News Corp. | | | 0.98 | | |
News Corp. | | | 0.97 | | |
NiSource, Inc. | | | 0.99 | | |
PACCAR, Inc. | | | 0.99 | | |
Phillips 66 | | | 0.99 | | |
PrIncipal Financial Group, Inc. | | | 0.99 | | |
Prudential Financial, Inc. | | | 0.99 | | |
PulteGroup, Inc. | | | 0.99 | | |
PVH Corp. | | | 0.99 | | |
Qorvo, Inc. | | | 0.98 | | |
Quanta Services, Inc. | | | 1.00 | | |
Ryder System, Inc. | | | 0.98 | | |
Seagate Technology PLC | | | 1.00 | | |
SL Green Realty Corp. | | | 1.02 | | |
Southwest Airlines Co. | | | 0.99 | | |
Staples, Inc. | | | 0.98 | | |
TE Connectivity Ltd. | | | 0.98 | | |
TEGNA, Inc. | | | 0.99 | | |
Tesoro Corp. | | | 0.98 | | |
Textron, Inc. | | | 0.99 | | |
Transocean Ltd. | | | 1.00 | | |
Travelers Cos., Inc. (The) | | | 0.99 | | |
Tyson Foods, Inc. | | | 0.99 | | |
United Continental Holdings, Inc. | | | 0.99 | | |
Universal Health Services, Inc. | | | 0.99 | | |
Security Description | | Index Weight | |
Unum Group | | | 1.00 | % | |
Valero Energy Corp. | | | 0.99 | | |
Walgreens Boots Alliance, Inc. | | | 0.98 | | |
Wal-Mart Stores, Inc. | | | 0.99 | | |
Western Digital Corp. | | | 0.99 | | |
WestRock Co. | | | 0.98 | | |
Whirlpool Corp. | | | 0.99 | | |
Whole Foods Market, Inc. | | | 0.99 | | |
Xerox Corp. | | | 0.99 | | |
| | | | 100.00 | % | |
The following table represents the equity basket holdings underlying the total return swap with Short U.S. Growth Index as of December 31, 2016.
Security Description | | Index Weight | |
Short U.S. Growth Index | |
3M Co. | | | 1.04 | % | |
Acuity Brands, Inc. | | | 1.03 | | |
Adobe Systems, Inc. | | | 1.03 | | |
Alexion Pharmaceuticals, Inc. | | | 1.02 | | |
Allegion PLC | | | 1.02 | | |
Alliant Energy Corp. | | | 1.03 | | |
Altria Group, Inc. | | | 1.03 | | |
Amazon.com, Inc. | | | 1.01 | | |
American Tower Corp. | | | 1.03 | | |
American Water Works Co., Inc. | | | 1.03 | | |
Aon PLC | | | 1.04 | | |
Autodesk, Inc. | | | 1.02 | | |
Automatic Data Processing, Inc. | | | 1.03 | | |
AutoZone, Inc. | | | 1.03 | | |
BlackRock, Inc. | | | 1.04 | | |
Bristol-Myers Squibb Co. | | | 1.03 | | |
Brown-Forman Corp. | | | 1.03 | | |
Cabot Oil & Gas Corp. | | | 1.06 | | |
Celgene Corp. | | | 1.03 | | |
Charles Schwab Corp. (The) | | | 1.03 | | |
Chipotle Mexican Grill, Inc. | | | 1.04 | | |
Cimarex Energy Co. | | | 1.03 | | |
Cintas Corp. | | | 1.03 | | |
CME Group, Inc. | | | 1.03 | | |
Colgate-Palmolive Co. | | | 1.03 | | |
Comerica, Inc. | | | 1.04 | | |
Concho Resources, Inc. | | | 1.02 | | |
CR Bard, Inc. | | | 1.04 | | |
Dominion Resources, Inc. | | | 1.03 | | |
Dun & Bradstreet Corp. (The) | | | 1.03 | | |
Edwards Lifesciences Corp. | | | 1.04 | | |
EI du Pont de Nemours & Co. | | | 1.03 | | |
EOG Resources, Inc. | | | 1.03 | | |
Equifax, Inc. | | | 1.03 | | |
Equinix, Inc. | | | 1.04 | | |
Extra Space Storage, Inc. | | | 1.06 | | |
F5 Networks, Inc. | | | 1.03 | | |
Facebook, Inc. | | | 1.02 | | |
Fastenal Co. | | | 1.03 | | |
Federal Realty Investment Trust | | | 1.05 | | |
Fortive Corp. | | | 1.03 | | |
Halliburton Co. | | | 1.04 | | |
The accompanying notes are an integral part of the consolidated financial statements.
14
Morgan Stanley Institutional Fund, Inc.
Annual Report — December 31, 2016
Consolidated Portfolio of Investments (cont'd)
Multi-Asset Portfolio
Security Description | | Index Weight | |
Short U.S. Growth Index (cont'd) | |
Home Depot, Inc. (The) | | | 1.03 | % | |
Illinois Tool Works, Inc. | | | 1.04 | | |
Illumina, Inc. | | | 1.03 | | |
Intercontinental Exchange, Inc. | | | 1.03 | | |
International Flavors & Fragrances, Inc. | | | 1.03 | | |
Intuit, Inc. | | | 1.03 | | |
Intuitive Surgical, Inc. | | | 1.03 | | |
KeyCorp | | | 1.04 | | |
M&T Bank Corp. | | | 1.04 | | |
Marsh & McLennan Cos, Inc. | | | 1.03 | | |
Mastercard, Inc. | | | 1.03 | | |
McDonald's Corp. | | | 1.03 | | |
Mead Johnson Nutrition Co. | | | 1.03 | | |
Mettler-Toledo International, Inc. | | | 1.03 | | |
Monster Beverage Corp. | | | 1.02 | | |
Moody's Corp. | | | 1.04 | | |
Netflix, Inc. | | | 1.02 | | |
Newfield Exploration Co. | | | 1.02 | | |
NextEra Energy, Inc. | | | 1.03 | | |
NIKE, Inc. | | | 1.03 | | |
Northern Trust Corp. | | | 1.04 | | |
NRG Energy, Inc. | | | 1.02 | | |
NVIDIA Corp. | | | 0.99 | | |
O'Reilly Automotive, Inc. | | | 1.02 | | |
Paychex, Inc. | | | 1.03 | | |
Philip Morris International, Inc. | | | 1.03 | | |
PPL Corp. | | | 1.03 | | |
Priceline Group, Inc. (The) | | | 1.03 | | |
Public Storage | | | 1.05 | | |
Red Hat, Inc. | | | 1.04 | | |
Regeneron Pharmaceuticals, Inc. | | | 1.02 | | |
Rockwell Automation, Inc. | | | 1.03 | | |
Roper Technologies, Inc. | | | 1.04 | | |
Ross Stores, Inc. | | | 1.02 | | |
S&P Global, Inc. | | | 1.03 | | |
salesforce.com, Inc. | | | 1.03 | | |
Sherwin-Williams Co. (The) | | | 1.03 | | |
Simon Property Group, Inc. | | | 1.05 | | |
Starbucks Corp. | | | 1.02 | | |
Stryker Corp. | | | 1.03 | | |
T Rowe Price Group, Inc. | | | 1.03 | | |
TransDigm Group, Inc. | | | 1.03 | | |
TripAdvisor, Inc. | | | 1.02 | | |
Ulta Salon Cosmetics & Fragrance, Inc. | | | 1.03 | | |
Under Armour, Inc. | | | 1.04 | | |
Union Pacific Corp. | | | 1.03 | | |
Verisk Analytics, Inc. | | | 1.03 | | |
Verizon Communications, Inc. | | | 1.03 | | |
Vertex Pharmaceuticals, Inc. | | | 1.03 | | |
Visa, Inc. | | | 1.03 | | |
Vulcan Materials Co. | | | 1.02 | | |
Wynn Resorts Ltd. | | | 1.03 | | |
Yum China Holdings, Inc. | | | 1.04 | | |
Yum! Brands, Inc. | | | 1.03 | | |
Zoetis, Inc. | | | 1.03 | | |
| | | | 100.00 | % | |
The following table represents the equity basket holdings underlying the total return swap with Short Iron Ore Miners Index as of December 31, 2016.
Security Description | | Index Weight | |
Short Iron Ore Miners Index | |
African Rainbow Minerals Ltd. | | | 1.25 | % | |
Assore Ltd. | | | 0.29 | | |
BHP Billiton PLC | | | 28.36 | | |
Ferrexpo PLC | | | 0.70 | | |
Fortescue Metals Group Ltd. | | | 9.13 | | |
Rio Tinto PLC | | | 40.58 | | |
Vale SA | | | 19.69 | | |
| | | | 100.00 | % | |
The following table represents the equity basket holdings underlying the total return swap with Global Aerospace Index as of December 31, 2016.
Security Description | | Index Weight | |
Global Aerospace Index | |
Airbus SE | | | 19.85 | % | |
B/E Aerospace, Inc. | | | 2.39 | | |
Boeing Co. (The) | | | 39.92 | | |
KLX, Inc. | | | 0.94 | | |
Rolls-Royce Holdings PLC | | | 5.72 | | |
Safran SA | | | 11.55 | | |
Spirit AeroSystems Holdings, Inc. | | | 5.59 | | |
Thales SA | | | 3.85 | | |
TransDigm Group, Inc. | | | 5.16 | | |
Zodiac Aerospace | | | 5.03 | | |
| | | | 100.00 | % | |
The following table represents the equity basket holdings underlying the total return swap with Short European Staples Index as of December 31, 2016.
Security Description | | Index Weight | |
Short European Staples Index | |
Anheuser-Busch InBev SA | | | 7.96 | % | |
Aryzta AG | | | 0.36 | | |
Associated British Foods PLC | | | 1.13 | | |
Barry Callebaut AG | | | 0.25 | | |
Beiersdorf AG | | | 0.80 | | |
British American Tobacco PLC | | | 9.93 | | |
Carlsberg A/S | | | 0.86 | | |
Carrefour SA | | | 1.25 | | |
Casino Guichard Perrachon SA | | | 0.25 | | |
Chocoladefabriken Lindt & Spruengli AG | | | 1.06 | | |
Coca-Cola European Partners PLC | | | 0.64 | | |
Coca-Cola HBC AG | | | 0.37 | | |
Colruyt SA | | | 0.31 | | |
Danone SA | | | 3.49 | | |
Diageo PLC | | | 6.12 | | |
Distribuidora Internacional de Alimentac | | | 0.29 | | |
Heineken Holding N.V. | | | 0.66 | | |
Heineken N.V. | | | 1.62 | | |
Henkel AG & Co., KGaA | | | 3.00 | | |
ICA Gruppen AB | | | 0.23 | | |
Imperial Brands PLC | | | 3.91 | | |
J Sainsbury PLC | | | 0.39 | | |
Jeronimo Martins SGPS SA | | | 0.37 | | |
The accompanying notes are an integral part of the consolidated financial statements.
15
Morgan Stanley Institutional Fund, Inc.
Annual Report — December 31, 2016
Consolidated Portfolio of Investments (cont'd)
Multi-Asset Portfolio
Security Description | | Index Weight | |
Short European Staples Index (cont'd) | |
Kerry Group PLC | | | 1.06 | % | |
Koninklijke Ahold Delhaize N.V. | | | 2.53 | | |
L'Oreal SA | | | 4.32 | | |
Marine Harvest ASA | | | 0.64 | | |
METRO AG | | | 0.55 | | |
Nestle SA | | | 21.37 | | |
Orkla ASA | | | 0.69 | | |
Pernod Ricard SA | | | 2.15 | | |
Reckitt Benckiser Group PLC | | | 5.04 | | |
Remy Cointreau SA | | | 0.17 | | |
Svenska Cellulosa AB SCA | | | 1.60 | | |
Swedish Match AB | | | 0.58 | | |
Tate & Lyle PLC | | | 0.38 | | |
Tesco PLC | | | 1.94 | | |
Unilever N.V. | | | 6.27 | | |
Unilever PLC | | | 4.87 | | |
Wm Morrison Supermarkets PLC | | | 0.59 | | |
| | | | 100.00 | % | |
@ Value is less than $500.
† Credit rating as issued by Standard & Poor's.
* Cleared swap agreement, the broker is Morgan Stanley & Co., LLC.
NR Not rated.
BBSW Australia's Bank Bill Swap.
LIBOR London Interbank Offered Rate.
AUD — Australian Dollar
BRL — Brazilian Real
CAD — Canadian Dollar
CHF — Swiss Franc
CNH — Chinese Yuan Renminbi
DKK — Danish Krone
EUR — Euro
GBP — British Pound
HKD — Hong Kong Dollar
JPY — Japanese Yen
MXN — Mexican Peso
MYR — Malaysian Ringgit
NOK — Norwegian Krone
NZD — New Zealand Dollar
RUB — Russian Ruble
SEK — Swedish Krona
SGD — Singapore Dollar
THB — Thai Baht
TRY — Turkish Lira
Portfolio Composition
Classification | | Percentage of
Total Investments | |
Short-Term Investments | | | 75.2 | % | |
Common Stocks | | | 23.8 | | |
Other** | | | 1.0 | | |
Total Investments | | | 100.0 | %*** | |
** Industries and/or investment types representing less than 5% of total investments.
*** Does not include open long/short futures contracts with an underlying face amount of approximately $81,379,000 with net unrealized depreciation of approximately $279,000. Does not include open foreign currency forward exchange contracts with net unrealized appreciation of approximately $1,944,000 and does not include open swap agreements with net unrealized depreciation of approximately $1,735,000.
The accompanying notes are an integral part of the consolidated financial statements.
16
Morgan Stanley Institutional Fund, Inc.
Annual Report — December 31, 2016
Consolidated Statement of Assets and Liabilities | | December 31, 2016
(000) | |
Assets: | |
Investments in Securities of Unaffiliated Issuers, at Value (Cost $37,230) | | $ | 38,525 | | |
Investment in Security of Affiliated Issuer, at Value (Cost $88,232) | | | 88,232 | | |
Total Investments in Securities, at Value (Cost $125,462) | | | 126,757 | | |
Foreign Currency, at Value (Cost $119) | | | 120 | | |
Unrealized Appreciation on Foreign Currency Forward Exchange Contracts | | | 5,814 | | |
Receivable for Investments Sold | | | 3,325 | | |
Receivable for Variation Margin on Futures Contracts | | | 2,424 | | |
Unrealized Appreciation on Swap Agreements | | | 266 | | |
Receivable for Swap Agreements Termination | | | 149 | | |
Tax Reclaim Receivable | | | 143 | | |
Interest Receivable | | | 45 | | |
Receivable from Affiliate | | | 30 | | |
Dividends Receivable | | | 9 | | |
Receivable for Variation Margin on Swap Agreements | | | 8 | | |
Receivable for Portfolio Shares Sold | | | 6 | | |
Other Assets | | | 33 | | |
Total Assets | | | 139,129 | | |
Liabilities: | |
Unrealized Depreciation on Foreign Currency Forward Exchange Contracts | | | 3,870 | | |
Payable for Portfolio Shares Redeemed | | | 2,476 | | |
Unrealized Depreciation on Swap Agreements | | | 2,136 | | |
Due to Broker | | | 845 | | |
Payable for Advisory Fees | | | 304 | | |
Payable for Custodian Fees | | | 79 | | |
Payable for Professional Fees | | | 68 | | |
Payable for Sub Transfer Agency Fees — Class I | | | 25 | | |
Payable for Sub Transfer Agency Fees — Class A | | | 2 | | |
Payable for Sub Transfer Agency Fees — Class L | | | 2 | | |
Payable for Sub Transfer Agency Fees — Class C | | | — | @ | |
Payable for Swap Agreements Termination | | | 16 | | |
Payable for Transfer Agency Fees — Class I | | | 1 | | |
Payable for Transfer Agency Fees — Class A | | | 7 | | |
Payable for Transfer Agency Fees — Class L | | | — | @ | |
Payable for Transfer Agency Fees — Class C | | | — | @ | |
Payable for Administration Fees | | | 9 | | |
Payable for Shareholder Services Fees — Class A | | | 3 | | |
Payable for Distribution and Shareholder Services Fees — Class L | | | 4 | | |
Payable for Distribution and Shareholder Services Fees — Class C | | | — | @ | |
Payable for Organization Costs for Subsidiary | | | 4 | | |
Other Liabilities | | | 34 | | |
Total Liabilities | | | 9,885 | | |
Net Assets | | $ | 129,244 | | |
Net Assets Consist Of: | |
Paid-in-Capital | | $ | 213,097 | | |
Distributions in Excess of Net Investment Income | | | (1,378 | ) | |
Accumulated Net Realized Loss | | | (83,688 | ) | |
Unrealized Appreciation (Depreciation) on: | |
Investments | | | 1,295 | | |
Futures Contracts | | | (279 | ) | |
Swap Agreements | | | (1,735 | ) | |
Foreign Currency Forward Exchange Contracts | | | 1,944 | | |
Foreign Currency Translations | | | (12 | ) | |
Net Assets | | $ | 129,244 | | |
The accompanying notes are an integral part of the consolidated financial statements.
17
Morgan Stanley Institutional Fund, Inc.
Annual Report — December 31, 2016
Consolidated Statement of Assets and Liabilities (cont'd) | | December 31, 2016
(000) | |
CLASS I: | |
Net Assets | | $ | 109,692 | | |
| Shares Outstanding $0.001 par value shares of beneficial interest (unlimited shares authorized) (not in 000's) | | | 11,282,044 | | |
Net Asset Value, Offering and Redemption Price Per Share | | $ | 9.72 | | |
CLASS A: | |
Net Assets | | $ | 12,914 | | |
| Shares Outstanding $0.001 par value shares of beneficial interest (unlimited shares authorized) (not in 000's) | | | 1,334,572 | | |
Net Asset Value, Redemption Price Per Share | | $ | 9.68 | | |
Maximum Sales Load | | | 5.25 | % | |
Maximum Sales Charge | | $ | 0.54 | | |
Maximum Offering Price Per Share | | $ | 10.22 | | |
CLASS L: | |
Net Assets | | $ | 6,357 | | |
| Shares Outstanding $0.001 par value shares of beneficial interest (unlimited shares authorized) (not in 000's) | | | 662,504 | | |
Net Asset Value, Offering and Redemption Price Per Share | | $ | 9.60 | | |
CLASS C: | |
Net Assets | | $ | 272 | | |
| Shares Outstanding $0.001 par value shares of beneficial interest (unlimited shares authorized) (not in 000's) | | | 28,775 | | |
Net Asset Value, Offering and Redemption Price Per Share | | $ | 9.47 | | |
CLASS IS: | |
Net Assets | | $ | 9 | | |
| Shares Outstanding $0.001 par value shares of beneficial interest (unlimited shares authorized) (not in 000's) | | | 902 | | |
Net Asset Value, Offering and Redemption Price Per Share | | $ | 9.72 | | |
@ Amount is less than $500.
The accompanying notes are an integral part of the consolidated financial statements.
18
Morgan Stanley Institutional Fund, Inc.
Annual Report — December 31, 2016
Consolidated Statement of Operations | | Year Ended
December 31, 2016
(000) | |
Investment Income: | |
Interest from Securities of Unaffiliated Issuers | | $ | 1,531 | | |
Dividends from Securities of Unaffiliated Issuers (Net of $104 of Foreign Taxes Withheld) | | | 1,292 | | |
Dividends from Securities of Affiliated Issuer (Note G) | | | 384 | | |
Total Investment Income | | | 3,207 | | |
Expenses: | |
Advisory Fees (Note B) | | | 1,957 | | |
Custodian Fees (Note F) | | | 222 | | |
Administration Fees (Note C) | | | 184 | | |
Professional Fees | | | 156 | | |
Shareholder Services Fees — Class A (Note D) | | | 55 | | |
Distribution and Shareholder Services Fees — Class L (Note D) | | | 86 | | |
Distribution and Shareholder Services Fees — Class C (Note D) | | | 4 | | |
Sub Transfer Agency Fees — Class I | | | 127 | | |
Sub Transfer Agency Fees — Class A | | | 5 | | |
Sub Transfer Agency Fees — Class L | | | 8 | | |
Sub Transfer Agency Fees — Class C | | | — | @ | |
Registration Fees | | | 85 | | |
Organization Costs for Subsidiary | | | 41 | | |
Transfer Agency Fees — Class I (Note E) | | | 4 | | |
Transfer Agency Fees — Class A (Note E) | | | 29 | | |
Transfer Agency Fees — Class L (Note E) | | | 2 | | |
Transfer Agency Fees — Class C (Note E) | | | 2 | | |
Transfer Agency Fees — Class IS (Note E) | | | 2 | | |
Shareholder Reporting Fees | | | 27 | | |
Pricing Fees | | | 25 | | |
Directors' Fees and Expenses | | | 9 | | |
Other Expenses | | | 28 | | |
Total Expenses | | | 3,058 | | |
Waiver of Advisory Fees (Note B) | | | (168 | ) | |
Rebate from Morgan Stanley Affiliate (Note G) | | | (137 | ) | |
Reimbursement of Class Specific Expenses — Class I (Note B) | | | (72 | ) | |
Reimbursement of Class Specific Expenses — Class A (Note B) | | | (5 | ) | |
Reimbursement of Class Specific Expenses — Class C (Note B) | | | (2 | ) | |
Reimbursement of Class Specific Expenses — Class IS (Note B) | | | (2 | ) | |
Reimbursement of Custodian Fees (Note F) | | | (97 | ) | |
Net Expenses | | | 2,575 | | |
Net Investment Income | | | 632 | | |
Realized Gain (Loss): | |
Investments Sold | | | (10,384 | ) | |
Foreign Currency Forward Exchange Contracts | | | (3,638 | ) | |
Foreign Currency Transactions | | | 193 | | |
Futures Contracts | | | 5,846 | | |
Options Written | | | 633 | | |
Swap Agreements | | | (5,755 | ) | |
Net Realized Loss | | | (13,105 | ) | |
Change in Unrealized Appreciation (Depreciation): | |
Investments | | | 6,782 | | |
Foreign Currency Forward Exchange Contracts | | | (359 | ) | |
Foreign Currency Translations | | | 51 | | |
Futures Contracts | | | (826 | ) | |
Swap Agreements | | | (2,931 | ) | |
Options Written | | | (52 | ) | |
Net Change in Unrealized Appreciation (Depreciation) | | | 2,665 | | |
Net Realized Loss and Change in Unrealized Appreciation (Depreciation) | | | (10,440 | ) | |
Net Decrease in Net Assets Resulting from Operations | | $ | (9,808 | ) | |
The accompanying notes are an integral part of the consolidated financial statements.
19
Morgan Stanley Institutional Fund, Inc.
Annual Report — December 31, 2016
Consolidated Statements of Changes in Net Assets | | Year Ended
December 31, 2016
(000) | | Year Ended
December 31, 2015***
(000) | |
Increase (Decrease) in Net Assets: | |
Operations: | |
Net Investment Income | | $ | 632 | | | $ | 2,749 | | |
Net Realized Loss | | | (13,105 | ) | | | (54,324 | ) | |
Net Change in Unrealized Appreciation (Depreciation) | | | 2,665 | | | | (7,037 | ) | |
Net Decrease in Net Assets Resulting from Operations | | | (9,808 | ) | | | (58,612 | ) | |
Distributions from and/or in Excess of: | |
Class I: | |
Net Investment Income | | | (3,297 | ) | | | (6,910 | ) | |
Class A: | |
Net Investment Income | | | (226 | ) | | | (710 | ) | |
Class L: | |
Net Investment Income | | | — | | | | (453 | ) | |
Class C: | |
Net Investment Income | | | (3 | ) | | | (3 | ) | |
Class IS: | |
Net Investment Income | | | (— | @) | | | (— | @) | |
Total Distributions | | | (3,526 | ) | | | (8,076 | ) | |
Capital Share Transactions:(1) | |
Class I: | |
Subscribed | | | 12,373 | | | | 132,370 | | |
Distributions Reinvested | | | 3,296 | | | | 6,894 | | |
Redeemed | | | (174,882 | ) | | | (297,687 | ) | |
Class A: | |
Subscribed | | | 2,631 | | | | 9,732 | | |
Distributions Reinvested | | | 186 | | | | 618 | | |
Redeemed | | | (17,814 | ) | | | (29,951 | ) | |
Class L: | |
Exchanged | | | 660 | | | | — | | |
Subscribed | | | — | | | | 4,714 | | |
Distributions Reinvested | | | — | | | | 453 | | |
Redeemed | | | (8,164 | ) | | | (27,947 | ) | |
Class C: | |
Subscribed | | | 119 | | | | 588 | * | |
Distributions Reinvested | | | 3 | | | | 3 | * | |
Redeemed | | | (248 | ) | | | (134 | )* | |
Class IS: | |
Subscribed | | | — | | | | 10 | ** | |
Net Decrease in Net Assets Resulting from Capital Share Transactions | | | (181,840 | ) | | | (200,337 | ) | |
Total Decrease in Net Assets | | | (195,174 | ) | | | (267,025 | ) | |
Net Assets: | |
Beginning of Period | | | 324,418 | | | | 591,443 | | |
End of Period (Including Distributions in Excess of Net Investment Income and Accumulated Undistributed
Net Investment Income of $(1,378) and $438, respectively) | | $ | 129,244 | | | $ | 324,418 | | |
The accompanying notes are an integral part of the consolidated financial statements.
20
Morgan Stanley Institutional Fund, Inc.
Annual Report — December 31, 2016
Consolidated Statements of Changes in Net Assets (cont'd) | | Year Ended
December 31, 2016
(000) | | Year Ended
December 31, 2015***
(000) | |
(1) | | Capital Share Transactions: | | | |
Class I: | |
Shares Subscribed | | | 1,241 | | | | 11,881 | | |
Shares Issued on Distributions Reinvested | | | 350 | | | | 645 | | |
Shares Redeemed | | | (17,884 | ) | | | (27,835 | ) | |
Net Decrease in Class I Shares Outstanding | | | (16,293 | ) | | | (15,309 | ) | |
Class A: | |
Shares Subscribed | | | 265 | | | | 875 | | |
Shares Issued on Distributions Reinvested | | | 20 | | | | 58 | | |
Shares Redeemed | | | (1,838 | ) | | | (2,810 | ) | |
Net Decrease in Class A Shares Outstanding | | | (1,553 | ) | | | (1,877 | ) | |
Class L: | |
Shares Exchanged | | | 67 | | | | — | | |
Shares Subscribed | | | — | | | | 422 | | |
Shares Issued on Distributions Reinvested | | | — | | | | 43 | | |
Shares Redeemed | | | (857 | ) | | | (2,635 | ) | |
Net Decrease in Class L Shares Outstanding | | | (790 | ) | | | (2,170 | ) | |
Class C: | |
Shares Subscribed | | | 13 | | | | 56 | * | |
Shares Issued on Distributions Reinvested | | | — | @@ | | | — | @@* | |
Shares Redeemed | | | (26 | ) | | | (14 | )* | |
Net Increase (Decrease) in Class C Shares Outstanding | | | (13 | ) | | | 42 | | |
Class IS: | |
Shares Subscribed | | | — | | | | 1 | ** | |
* For the period April 30, 2015 through December 31, 2015.
** For the period May 29, 2015 through December 31, 2015.
*** Not consolidated.
@ Amount is less than $500.
@@ Amount is less than 500 shares.
The accompanying notes are an integral part of the consolidated financial statements.
21
Morgan Stanley Institutional Fund, Inc.
Annual Report — December 31, 2016
Consolidated Financial Highlights
Multi-Asset Portfolio
| | | Class I | |
| | | Year Ended December 31, | | Period from
June 22, 2012(2) to | |
Selected Per Share Data and Ratios | | 2016(1) | | 2015(9) | | 2014(9) | | 2013(9) | | December 31, 2012(9) | |
Net Asset Value, Beginning of Period | | $ | 10.17 | | | $ | 11.55 | | | $ | 11.68 | | | $ | 10.30 | | | $ | 10.00 | | |
Income (Loss) from Investment Operations: | |
Net Investment Income (Loss) (3) | | | 0.03 | | | | 0.07 | | | | (0.02 | ) | | | 0.03 | | | | (0.02 | ) | |
Net Realized and Unrealized Gain (Loss) | | | (0.31 | ) | | | (1.29 | ) | | | 0.11 | | | | 1.84 | | | | 0.47 | | |
Total from Investment Operations | | | (0.28 | ) | | | (1.22 | ) | | | 0.09 | | | | 1.87 | | | | 0.45 | | |
Distributions from and/or in Excess of: | |
Net Investment Income | | | (0.17 | ) | | | (0.16 | ) | | | (0.22 | ) | | | — | | | | — | | |
Net Realized Gain | | | — | | | | — | | | | (0.00 | )(4) | | | (0.49 | ) | | | (0.15 | ) | |
Total Distributions | | | (0.17 | ) | | | (0.16 | ) | | | (0.22 | ) | | | (0.49 | ) | | | (0.15 | ) | |
Net Asset Value, End of Period | | $ | 9.72 | | | $ | 10.17 | | | $ | 11.55 | | | $ | 11.68 | | | $ | 10.30 | | |
Total Return (5) | | | (2.75 | )% | | | (10.60 | )% | | | 0.77 | % | | | 18.24 | % | | | 4.53 | %(7) | |
Ratios and Supplemental Data: | |
Net Assets, End of Period (Thousands) | | $ | 109,692 | | | $ | 280,423 | | | $ | 495,419 | | | $ | 107,463 | | | $ | 20,496 | | |
Ratio of Expenses to Average Net Assets (10) | | | 1.04 | %(6) | | | 1.05 | %(6) | | | 1.01 | %(6) | | | 1.03 | %(6) | | | 1.01 | %(6)(8) | |
Ratio of Net Investment Income (Loss) to Average Net Assets (10) | | | 0.35 | %(6) | | | 0.60 | %(6) | | | (0.14 | )%(6) | | | 0.25 | %(6) | | | (0.30 | )%(6)(8) | |
Ratio of Rebate from Morgan Stanley Affiliates to Average Net Assets | | | 0.06 | % | | | 0.04 | % | | | 0.09 | % | | | 0.07 | % | | | 0.09 | %(8) | |
Portfolio Turnover Rate | | | 353 | % | | | 355 | % | | | 264 | % | | | 223 | % | | | 167 | %(7) | |
(10) Supplemental Information on the Ratios to Average Net Assets: | |
Ratios Before Expense Limitation: | |
Expenses to Average Net Assets | | | 1.25 | % | | | 1.14 | % | | | 1.21 | % | | | 1.97 | % | | | 2.41 | %(8) | |
Net Investment Income (Loss) to Average Net Assets | | | 0.14 | % | | | 0.51 | % | | | (0.34 | )% | | | (0.69 | )% | | | (1.70 | )%(8) | |
(1) Refer to Note F in the Notes to Consolidated Financial Statements for discussion of prior period custodian out-of-pocket expenses that were reimbursed in the current period. The amount of the reimbursement was immaterial on a per share basis and did not impact the total return of Class I shares. The Ratio of Expenses to Average Net Assets and the Ratio of Net Investment Income to Average Net Assets would be unchanged as the reimbursement of custodian fees was offset against current period expense waivers/reimbursements with no impact to net expenses or net investment income.
(2) Commencement of Operations.
(3) Per share amount is based on average shares outstanding.
(4) Amount is less than $0.005 per share.
(5) Calculated based on the net asset value as of the last business day of the period.
(6) The Ratios of Expenses and Net Investment Income (Loss) reflect the rebate of certain Portfolio expenses in connection with the investments in Morgan Stanley affiliates during the period. The effect of the rebate on the ratios is disclosed in the above table as "Ratio of Rebate from Morgan Stanley Affiliates to Average Net Assets."
(7) Not Annualized.
(8) Annualized.
(9) Not consolidated.
The accompanying notes are an integral part of the consolidated financial statements.
22
Morgan Stanley Institutional Fund, Inc.
Annual Report — December 31, 2016
Consolidated Financial Highlights
Multi-Asset Portfolio
| | | Class A | |
| | | Year Ended December 31, | | Period from
June 22, 2012(2) to | |
Selected Per Share Data and Ratios | | 2016(1) | | 2015(10) | | 2014(10) | | 2013(10) | | December 31, 2012(10) | |
Net Asset Value, Beginning of Period | | $ | 10.09 | | | $ | 11.50 | | | $ | 11.63 | | | $ | 10.29 | | | $ | 10.00 | | |
Income (Loss) from Investment Operations: | |
Net Investment Income (Loss) (3) | | | (0.00 | )(4) | | | 0.03 | | | | (0.05 | ) | | | 0.01 | | | | (0.03 | ) | |
Net Realized and Unrealized Gain (Loss) | | | (0.31 | ) | | | (1.28 | ) | | | 0.11 | | | | 1.82 | | | | 0.47 | | |
Total from Investment Operations | | | (0.31 | ) | | | (1.25 | ) | | | 0.06 | | | | 1.83 | | | | 0.44 | | |
Distributions from and/or in Excess of: | |
Net Investment Income | | | (0.10 | ) | | | (0.16 | ) | | | (0.19 | ) | | | — | | | | — | | |
Net Realized Gain | | | — | | | | — | | | | (0.00 | )(4) | | | (0.49 | ) | | | (0.15 | ) | |
Total Distributions | | | (0.10 | ) | | | (0.16 | ) | | | (0.19 | ) | | | (0.49 | ) | | | (0.15 | ) | |
Net Asset Value, End of Period | | $ | 9.68 | | | $ | 10.09 | | | $ | 11.50 | | | $ | 11.63 | | | $ | 10.29 | | |
Total Return (5) | | | (2.94 | )% | | | (11.00 | )% | | | 0.55 | % | | | 17.86 | % | | | 4.43 | %(8) | |
Ratios and Supplemental Data: | |
Net Assets, End of Period (Thousands) | | $ | 12,914 | | | $ | 29,123 | | | $ | 54,771 | | | $ | 13,437 | | | $ | 103 | | |
Ratio of Expenses to Average Net Assets (11) | | | 1.39 | %(6) | | | 1.37 | %(6) | | | 1.30 | %(6) | | | 1.30 | %(6)(7) | | | 1.26 | %(6)(9) | |
Ratio of Net Investment Income (Loss) to Average Net Assets (11) | | | (0.01 | )%(6) | | | 0.27 | %(6) | | | (0.43 | )%(6) | | | 0.07 | %(6) | | | (0.55 | )%(6)(9) | |
Ratio of Rebate from Morgan Stanley Affiliates to Average Net Assets | | | 0.06 | % | | | 0.04 | % | | | 0.09 | % | | | 0.07 | % | | | 0.09 | %(9) | |
Portfolio Turnover Rate | | | 353 | % | | | 355 | % | | | 264 | % | | | 223 | % | | | 167 | %(8) | |
(11) Supplemental Information on the Ratios to Average Net Assets: | |
Ratios Before Expense Limitation: | |
Expenses to Average Net Assets | | | 1.59 | % | | | 1.47 | % | | | 1.46 | % | | | 2.24 | % | | | 2.66 | %(9) | |
Net Investment Income (Loss) to Average Net Assets | | | (0.21 | )% | | | 0.17 | % | | | (0.59 | )% | | | (0.87 | )% | | | (1.95 | )%(9) | |
(1) Refer to Note F in the Notes to Consolidated Financial Statements for discussion of prior period custodian out-of-pocket expenses that were reimbursed in the current period. The amount of the reimbursement was immaterial on a per share basis and did not impact the total return of Class A shares. The Ratio of Expenses to Average Net Assets and the Ratio of Net Investment Loss to Average Net Assets would be unchanged as the reimbursement of custodian fees was offset against current period expense waivers/reimbursements with no impact to net expenses or net investment loss.
(2) Commencement of Operations.
(3) Per share amount is based on average shares outstanding.
(4) Amount is less than $0.005 per share.
(5) Calculated based on the net asset value which does not reflect sales charges, if applicable, as of the last business day of the period.
(6) The Ratios of Expenses and Net Investment Income (Loss) reflect the rebate of certain Portfolio expenses in connection with the investments in Morgan Stanley affiliates during the period. The effect of the rebate on the ratios is disclosed in the above table as "Ratio of Rebate from Morgan Stanley Affiliates to Average Net Assets."
(7) Effective September 16, 2013, the Adviser has agreed to limit the ratio of expenses to average net assets to the maximum ratio of 1.45% for Class A shares. Prior to September 16, 2013, the maximum ratio was 1.35% for Class A shares.
(8) Not Annualized.
(9) Annualized.
(10) Not consolidated.
The accompanying notes are an integral part of the consolidated financial statements.
23
Morgan Stanley Institutional Fund, Inc.
Annual Report — December 31, 2016
Consolidated Financial Highlights
Multi-Asset Portfolio
| | | Class L | |
| | | Year Ended December 31, | | Period from
June 22, 2012(2) to | |
Selected Per Share Data and Ratios | | 2016(1) | | 2015(10) | | 2014(10) | | 2013(10) | | December 31, 2012(10) | |
Net Asset Value, Beginning of Period | | $ | 9.94 | | | $ | 11.39 | | | $ | 11.53 | | | $ | 10.26 | | | $ | 10.00 | | |
Income (Loss) from Investment Operations: | |
Net Investment Loss (3) | | | (0.04 | ) | | | (0.02 | ) | | | (0.10 | ) | | | (0.05 | ) | | | (0.06 | ) | |
Net Realized and Unrealized Gain (Loss) | | | (0.30 | ) | | | (1.27 | ) | | | 0.10 | | | | 1.81 | | | | 0.47 | | |
Total from Investment Operations | | | (0.34 | ) | | | (1.29 | ) | | | (0.00 | )(4) | | | 1.76 | | | | 0.41 | | |
Distributions from and/or in Excess of: | |
Net Investment Income | | | — | | | | (0.16 | ) | | | (0.14 | ) | | | — | | | | — | | |
Net Realized Gain | | | — | | | | — | | | | (0.00 | )(4) | | | (0.49 | ) | | | (0.15 | ) | |
Total Distributions | | | — | | | | (0.16 | ) | | | (0.14 | ) | | | (0.49 | ) | | | (0.15 | ) | |
Net Asset Value, End of Period | | $ | 9.60 | | | $ | 9.94 | | | $ | 11.39 | | | $ | 11.53 | | | $ | 10.26 | | |
Total Return (5) | | | (3.42 | )% | | | (11.37 | )% | | | 0.02 | % | | | 17.23 | % | | | 4.13 | %(8) | |
Ratios and Supplemental Data: | |
Net Assets, End of Period (Thousands) | | $ | 6,357 | | | $ | 14,443 | | | $ | 41,253 | | | $ | 9,513 | | | $ | 337 | | |
Ratio of Expenses to Average Net Assets (11) | | | 1.85 | %(6) | | | 1.85 | %(6) | | | 1.77 | %(6) | | | 1.79 | %(6)(7) | | | 1.76 | %(6)(9) | |
Ratio of Net Investment Loss to Average Net Assets (11) | | | (0.43 | )%(6) | | | (0.18 | )%(6) | | | (0.90 | )%(6) | | | (0.46 | )%(6) | | | (1.05 | )%(6)(9) | |
Ratio of Rebate from Morgan Stanley Affiliates to Average Net Assets | | | 0.06 | % | | | 0.04 | % | | | 0.09 | % | | | 0.07 | % | | | 0.09 | %(9) | |
Portfolio Turnover Rate | | | 353 | % | | | 355 | % | | | 264 | % | | | 223 | % | | | 167 | %(8) | |
(11) Supplemental Information on the Ratios to Average Net Assets: | |
Ratios Before Expense Limitation: | |
Expenses to Average Net Assets | | | 2.02 | % | | | 1.92 | % | | | 1.93 | % | | | 2.73 | % | | | 3.16 | %(9) | |
Net Investment Loss to Average Net Assets | | | (0.60 | )% | | | (0.25 | )% | | | (1.06 | )% | | | (1.40 | )% | | | (2.45 | )%(9) | |
(1) Refer to Note F in the Notes to Consolidated Financial Statements for discussion of prior period custodian out-of-pocket expenses that were reimbursed in the current period. The amount of the reimbursement was immaterial on a per share basis and did not impact the total return of Class L shares. The Ratio of Expenses to Average Net Assets and the Ratio of Net Investment Loss to Average Net Assets would be unchanged as the reimbursement of custodian fees was offset against current period expense waivers/reimbursements with no impact to net expenses or net investment loss.
(2) Commencement of Operations.
(3) Per share amount is based on average shares outstanding.
(4) Amount is less than $0.005 per share.
(5) Calculated based on the net asset value as of the last business day of the period.
(6) The Ratios of Expenses and Net Investment Loss reflect the rebate of certain Portfolio expenses in connection with the investments in Morgan Stanley affiliates during the period. The effect of the rebate on the ratios is disclosed in the above table as "Ratio of Rebate from Morgan Stanley Affiliates to Average Net Assets."
(7) Effective September 16, 2013, the Adviser has agreed to limit the ratio of expenses to average net assets to the maximum ratio of 1.95% for Class L shares. Prior to September 16, 2013, the maximum ratio was 1.85% for Class L shares.
(8) Not Annualized.
(9) Annualized.
(10) Not consolidated.
The accompanying notes are an integral part of the consolidated financial statements.
24
Morgan Stanley Institutional Fund, Inc.
Annual Report — December 31, 2016
Consolidated Financial Highlights
Multi-Asset Portfolio
| | | Class C | |
Selected Per Share Data and Ratios | | Year Ended
December 31, 2016(1) | | Period from
April 30, 2015(2) to
December 31, 2015(8) | |
Net Asset Value, Beginning of Period | | $ | 9.93 | | | $ | 11.09 | | |
Loss from Investment Operations: | |
Net Investment Loss (3) | | | (0.09 | ) | | | (0.07 | ) | |
Net Realized and Unrealized Loss | | | (0.28 | ) | | | (0.93 | ) | |
Total from Investment Operations | | | (0.37 | ) | | | (1.00 | ) | |
Distributions from and/or in Excess of: | |
Net Investment Income | | | (0.09 | ) | | | (0.16 | ) | |
Net Asset Value, End of Period | | $ | 9.47 | | | $ | 9.93 | | |
Total Return (4) | | | (3.70 | )% | | | (9.07 | )%(6) | |
Ratios and Supplemental Data: | |
Net Assets, End of Period (Thousands) | | $ | 272 | | | $ | 420 | | |
Ratio of Expenses to Average Net Assets (9) | | | 2.14 | %(5) | | | 2.17 | %(5)(7) | |
Ratio of Net Investment Loss to Average Net Assets (9) | | | (0.95 | )%(5) | | | (1.07 | )%(5)(7) | |
Ratio of Rebate from Morgan Stanley Affiliates to Average Net Assets | | | 0.06 | % | | | 0.03 | %(7) | |
Portfolio Turnover Rate | | | 353 | % | | | 355 | % | |
(9) Supplemental Information on the Ratios to Average Net Assets: | |
Ratios Before Expense Limitation: | |
Expense to Average Net Assets | | | 2.88 | % | | | 2.59 | %(7) | |
Net Investment Loss to Average Net Assets | | | (1.69 | )% | | | (1.49 | )%(7) | |
(1) Refer to Note F in the Notes to Consolidated Financial Statements for discussion of prior period custodian out-of-pocket expenses that were reimbursed in the current period. The amount of the reimbursement was immaterial on a per share basis and did not impact the total return of Class C shares. The Ratio of Expenses to Average Net Assets and the Ratio of Net Investment Loss to Average Net Assets would be unchanged as the reimbursement of custodian fees was offset against current period expense waivers/reimbursements with no impact to net expenses or net investment loss.
(2) Commencement of Offering.
(3) Per share amount is based on average shares outstanding.
(4) Calculated based on the net asset value which does not reflect sales charges, if applicable, as of the last business day of the period.
(5) The Ratios of Expenses and Net Investment Loss reflect the rebate of certain Portfolio expenses in connection with the investments in Morgan Stanley affiliates during the period. The effect of the rebate on the ratios is disclosed in the above table as "Ratio of Rebate from Morgan Stanley Affiliates to Average Net Assets."
(6) Not Annualized.
(7) Annualized.
(8) Not consolidated.
The accompanying notes are an integral part of the consolidated financial statements.
25
Morgan Stanley Institutional Fund, Inc.
Annual Report — December 31, 2016
Consolidated Financial Highlights
Multi-Asset Portfolio
| | | Class IS | |
Selected Per Share Data and Ratios | | Year Ended
December 31, 2016(1) | | Period from
May 29, 2015(2) to
December 31, 2015(8) | |
Net Asset Value, Beginning of Period | | $ | 10.17 | | | $ | 11.09 | | |
Income (Loss) from Investment Operations: | |
Net Investment Income (3) | | | 0.13 | | | | 0.01 | | |
Net Realized and Unrealized Loss | | | (0.41 | ) | | | (0.77 | ) | |
Total from Investment Operations | | | (0.28 | ) | | | (0.76 | ) | |
Distributions from and/or in Excess of: | |
Net Investment Income | | | (0.17 | ) | | | (0.16 | ) | |
Net Asset Value, End of Period | | $ | 9.72 | | | $ | 10.17 | | |
Total Return (4) | | | (2.65 | )% | | | (6.89 | )%(6) | |
Ratios and Supplemental Data: | |
Net Assets, End of Period (Thousands) | | $ | 9 | | | $ | 9 | | |
Ratio of Expenses to Average Net Assets (9) | | | 1.01 | %(5) | | | 1.04 | %(5)(7) | |
Ratio of Net Investment Income to Average Net Assets (9) | | | 1.36 | %(5) | | | 0.23 | %(5)(7) | |
Ratio of Rebate from Morgan Stanley Affiliates to Average Net Assets | | | 0.06 | % | | | 0.03 | %(7) | |
Portfolio Turnover Rate | | | 353 | % | | | 355 | % | |
(9) Supplemental Information on the Ratios to Average Net Assets: | |
Ratios Before Expense Limitation: | |
Expenses to Average Net Assets | | | 22.77 | % | | | 17.31 | %(7) | |
Net Investment Loss to Average Net Assets | | | (20.40 | )% | | | (16.04 | )%(7) | |
(1) Refer to Note F in the Notes to Consolidated Financial Statements for discussion of prior period custodian out-of-pocket expenses that were reimbursed in the current period. The amount of the reimbursement was immaterial on a per share basis and did not impact the total return of Class IS shares. The Ratio of Expenses to Average Net Assets and the Ratio of Net Investment Income to Average Net Assets would be unchanged as the reimbursement of custodian fees was offset against current period expense waivers/reimbursements with no impact to net expenses or net investment income.
(2) Commencement of Offering.
(3) Per share amount is based on average shares outstanding.
(4) Calculated based on the net asset value as of the last business day of the period.
(5) The Ratios of Expenses and Net Investment Income reflect the rebate of certain Portfolio expenses in connection with the investments in Morgan Stanley affiliates during the period. The effect of the rebate on the ratios is disclosed in the above table as "Ratio of Rebate from Morgan Stanley Affiliates to Average Net Assets."
(6) Not Annualized.
(7) Annualized.
(8) Not consolidated.
The accompanying notes are an integral part of the consolidated financial statements.
26
Morgan Stanley Institutional Fund, Inc.
Annual Report — December 31, 2016
Notes to Consolidated Financial Statements
Morgan Stanley Institutional Fund, Inc. (the "Fund") is registered under the Investment Company Act of 1940, as amended (the "Act"), as an open-end management investment company. The Fund is comprised of twenty-nine separate, active, diversified and non-diversified portfolios (individually referred to as a "Portfolio", collectively as the "Portfolios"). The Fund applies investment company accounting and reporting guidance.
The accompanying consolidated financial statements relate to the Multi-Asset Portfolio. The Portfolio seeks total return. The Portfolio's ("Adviser"), Morgan Stanley Investment Management Inc., seeks to achieve this objective with an emphasis on positive absolute return and controlling downside portfolio risk.
The Portfolio offers five classes of shares — Class I, Class A, Class L, Class C and Class IS shares. On April, 30, 2015, the Portfolio suspended offering of Class L shares. Existing Class L shareholders may invest through reinvestment of dividends and distributions.
A. Significant Accounting Policies: The following significant accounting policies are in conformity with U.S. generally accepted accounting principles ("GAAP"). Such policies are consistently followed by the Fund in the preparation of its consolidated financial statements. GAAP may require management to make estimates and assumptions that affect the reported amounts and disclosures in the consolidated financial statements. Actual results may differ from those estimates.
Effective October 3, 2016, the Portfolio may, consistent with its principal investment strategies, invest up to 25% of its total assets in a wholly-owned subsidiary of the Portfolio organized as a company under the laws of the Cayman Islands, Multi-Asset Cayman Portfolio, Ltd. (the "Subsidiary"). The Subsidiary may invest, directly or indirectly through the use of derivatives, in securities, commodities, commodity-related instruments and other investments, primarily futures, swaps and notes. The Portfolio is the sole shareholder of the Subsidiary, and it is not currently expected that shares of the Subsidiary will be sold or offered to other investors. The consolidated portfolio of investments and consolidated financial statements include the positions and accounts of the Portfolio and the Subsidiary. All intercompany accounts and transactions of the Portfolio and the Subsidiary have been eliminated in consolidation. As of December 31, 2016, the Subsidiary represented approximately $13,428,000 or approximately 10.39% of the total assets of the Portfolio.
Investments in the Subsidiary are expected to provide the Portfolio with exposure to the commodity markets within the limitations of Subchapter M of the Code and recent Internal Revenue Service ("IRS") revenue rulings, which require that a
mutual fund receive no more than ten percent of its gross income from such investments in order to receive favorable tax treatment as a regulated investment company ("RIC"). Tax treatment of the income received from the Subsidiary may potentially be affected by changes in legislation, regulations or other legally binding authority, which could affect the character, timing and amount of the Portfolio's taxable income and distributions. If such changes occur, the Portfolio may need to significantly change its investment strategy and recognize unrealized gains in order to remain qualified for taxation as a RIC, which could adversely affect the Portfolio.
1. Security Valuation: (1) an equity portfolio security listed or traded on an exchange is valued at its latest reported sales price (or at the exchange official closing price if such exchange reports an official closing price), and if there were no sales on a given day and if there is no official exchange closing price for that day, the security is valued at the mean between the last reported bid and asked prices if such bid and asked prices are available on the relevant exchanges; (2) all other equity portfolio securities for which over-the-counter ("OTC") market quotations are readily available are valued at the latest reported sales price (or at the market official closing price if such market reports an official closing price), and if there was no trading in the security on a given day and if there is no official closing price from relevant markets for that day, the security is valued at the mean between the last reported bid and asked prices if such bid and asked prices are available on the relevant markets. Listed equity securities not traded on the valuation date with no reported bid and asked prices available on the exchange are valued at the mean between the current bid and asked prices obtained from one or more reputable brokers or dealers. An unlisted equity security that does not trade on the valuation date and for which bid and asked prices from the relevant markets are unavailable is valued at the mean between the current bid and asked prices obtained from one or more reputable brokers or dealers. In cases where a security is traded on more than one exchange, the security is valued on the exchange designated as the primary market; (3) Certain portfolio securities may be valued by an outside pricing service/vendor approved by the Fund's Board of Directors (the "Directors"). The pricing service/vendor may employ a pricing model that takes into account, among other things, bids, yield spreads, and/or other market data and specific security characteristics. Alternatively, if a valuation is not available from an outside pricing service/vendor, and the security trades on an exchange, the security may be valued at its latest reported sale price (or
27
Morgan Stanley Institutional Fund, Inc.
Annual Report — December 31, 2016
Notes to Consolidated Financial Statements (cont'd)
at the exchange official closing price if such exchange reports an official closing price), prior to the time when assets are valued. If there are no sales on a given day and if there is no official exchange closing price for that day, the security is valued at the mean between the last reported bid and asked prices if such bid and asked prices are available in the relevant exchanges; (4) futures are valued at the settlement price on the exchange on which they trade or, if a settlement price is unavailable, at the last sale price on the exchange; (5) Listed options are valued at the last reported sales price on the exchange on which they are listed (or at the exchange official closing price if such exchange reports an official closing price). If an official closing price or last reported sale price is unavailable, the listed option should be fair valued at the mean between its latest bid and ask prices. Unlisted options are valued at the mean between their latest bid and ask prices from a broker/dealer or valued by a pricing service/vendor; (6) OTC swaps may be valued by an outside pricing service approved by the Directors or quotes from a broker or dealer. Swaps cleared on a clearinghouse or exchange may be valued using the closing price provided by the clearinghouse or exchange; (7) when market quotations are not readily available, including circumstances under which the Adviser determines that the closing price, last sale price or the mean between the last reported bid and asked prices are not reflective of a security's market value, portfolio securities are valued at their fair value as determined in good faith under procedures established by and under the general supervision of the Directors. Occasionally, developments affecting the closing prices of securities and other assets may occur between the times at which valuations of such securities are determined (that is, close of the foreign market on which the securities trade) and the close of business of the New York Stock Exchange ("NYSE"). If developments occur during such periods that are expected to materially affect the value of such securities, such valuations may be adjusted to reflect the estimated fair value of such securities as of the close of the NYSE, as determined in good faith by the Directors or by the Adviser using a pricing service and/or procedures approved by the Directors; (8) quotations of foreign portfolio securities, other assets and liabilities and forward contracts stated in foreign currency are translated into U.S. dollar equivalents at the prevailing market rates prior to the close of the NYSE; and (9) investments in mutual funds, including the Morgan Stanley Institutional Liquidity Funds, are valued at the net asset value ("NAV") as of the close of each business day.
The Directors have responsibility for determining in good faith the fair value of the investments, and the Directors may appoint others, such as the Fund's Adviser or a valuation committee, to assist the Directors in determining fair value and to make the actual calculations pursuant to the fair valuation methodologies previously approved by the Directors. Under procedures approved by the Directors, the Fund's Adviser has formed a Valuation Committee whose members are approved by the Directors. The Valuation Committee provides administration and oversight of the Fund's valuation policies and procedures, which are reviewed at least annually by the Directors. These procedures allow the Fund to utilize independent pricing services, quotations from securities and financial instrument dealers, and other market sources to determine fair value.
The Fund has procedures to determine the fair value of securities and other financial instruments for which market prices are not readily available. Under these procedures, the Valuation Committee convenes on a regular and ad hoc basis to review such securities and considers a number of factors, including valuation methodologies and significant unobservable valuation inputs, when arriving at fair value. The Valuation Committee may employ a market-based approach which may use related or comparable assets or liabilities, recent transactions, market multiples, book values, and other relevant information for the investment to determine the fair value of the investment. An income-based valuation approach may also be used in which the anticipated future cash flows of the investment are discounted to calculate fair value. Discounts may also be applied due to the nature or duration of any restrictions on the disposition of the investments. Due to the inherent uncertainty of valuations of such investments, the fair values may differ significantly from the values that would have been used had an active market existed. The Valuation Committee employs various methods for calibrating these valuation approaches including a regular review of valuation methodologies, key inputs and assumptions, transactional back-testing or disposition analysis, and reviews of any related market activity.
2. Fair Value Measurement: Financial Accounting Standards Board ("FASB") Accounting Standards CodificationTM ("ASC") 820, "Fair Value Measurement" ("ASC 820"), defines fair value as the value that the Fund
28
Morgan Stanley Institutional Fund, Inc.
Annual Report — December 31, 2016
Notes to Consolidated Financial Statements (cont'd)
would receive to sell an investment or pay to transfer a liability in a timely transaction with an independent buyer in the principal market, or in the absence of a principal market, the most advantageous market for the investment or liability. ASC 820 establishes a three-tier hierarchy to distinguish between (1) inputs that reflect the assumptions market participants would use in valuing an asset or liability developed based on market data obtained from sources independent of the reporting entity (observable inputs) and (2) inputs that reflect the reporting entity's own assumptions about the assumptions market participants would use in valuing an asset or liability developed based on the best information available in the circumstances (unobservable inputs) and to establish classification of fair value measurements for disclosure purposes. Various inputs are used in determining the value of the Fund's investments. The inputs are summarized in the three broad levels listed below.
• Level 1 – unadjusted quoted prices in active markets for identical investments
• Level 2 – other significant observable inputs (including quoted prices for similar investments, interest rates, prepayment speeds, credit risk, etc.)
• Level 3 – significant unobservable inputs including the Fund's own assumptions in determining the fair value of investments. Factors considered in making this determination may include, but are not limited to, information obtained by contacting the issuer, analysts, or the appropriate stock exchange (for exchange-traded securities), analysis of the issuer's financial statements or other available documents and, if necessary, available information concerning other securities in similar circumstances
The inputs or methodology used for valuing securities are not necessarily an indication of the risk associated with investing in those securities and the determination of the significance of a particular input to the fair value measurement in its entirety requires judgment and considers factors specific to each security.
The following is a summary of the inputs used to value the Portfolio's investments as of December 31, 2016.
Investment Type | | Level 1
Unadjusted
quoted
prices
(000) | | Level 2
Other
significant
observable
inputs
(000) | | Level 3
Significant
unobservable
inputs
(000) | | Total
(000) | |
Assets: | |
Common Stocks | |
Airlines | | $ | 699 | | | $ | — | | | $ | — | | | $ | 699 | | |
Automobiles | | | 1,478 | | | | — | | | | — | | | | 1,478 | | |
Banks | | | 5,065 | | | | — | | | | — | † | | | 5,065 | † | |
Beverages | | | 671 | | | | — | | | | — | | | | 671 | | |
Biotechnology | | | 886 | | | | — | | | | — | | | | 886 | | |
Building Products | | | 1,671 | | | | — | | | | — | | | | 1,671 | | |
Capital Markets | | | 795 | | | | — | | | | — | | | | 795 | | |
Commercial Services &
Supplies | | | 267 | | | | — | | | | — | | | | 267 | | |
Construction &
Engineering | | | 2,436 | | | | — | | | | — | | | | 2,436 | | |
Construction Materials | | | 705 | | | | — | | | | — | | | | 705 | | |
Diversified
Telecommunication
Services | | | 870 | | | | — | | | | — | | | | 870 | | |
Electric Utilities | | | 638 | | | | — | | | | — | | | | 638 | | |
Equity Real Estate
Investment Trusts
(REITs) | | | — | @ | | | — | | | | — | | | | — | @ | |
Food & Staples Retailing | | | 670 | | | | — | | | | — | | | | 670 | | |
Food Products | | | 521 | | | | — | | | | — | | | | 521 | | |
Health Care Equipment &
Supplies | | | 828 | | | | — | | | | — | | | | 828 | | |
Health Care Providers &
Services | | | 863 | | | | — | | | | — | | | | 863 | | |
Health Care Technology | | | 24 | | | | — | | | | — | | | | 24 | | |
Hotels, Restaurants &
Leisure | | | 799 | | | | — | | | | — | | | | 799 | | |
Household Products | | | 595 | | | | — | | | | — | | | | 595 | | |
Independent Power and
Renewable Electricity
Producers | | | 19 | | | | — | | | | — | | | | 19 | | |
Information Technology
Services | | | 1,619 | | | | — | | | | — | | | | 1,619 | | |
Life Sciences Tools &
Services | | | 175 | | | | — | | | | — | | | | 175 | | |
Media | | | 1,315 | | | | — | | | | — | | | | 1,315 | | |
Multi-Utilities | | | 347 | | | | — | | | | — | | | | 347 | | |
Personal Products | | | 46 | | | | — | | | | — | | | | 46 | | |
Pharmaceuticals | | | 1,654 | | | | — | | | | — | | | | 1,654 | | |
Professional Services | | | 2,047 | | | | — | | | | — | | | | 2,047 | | |
Road & Rail | | | 348 | | | | — | | | | — | | | | 348 | | |
Semiconductors &
Semiconductor
Equipment | | | — | | | | — | | | | 2 | | | | 2 | | |
Tobacco | | | 539 | | | | — | | | | — | | | | 539 | | |
Trading Companies &
Distributors | | | 305 | | | | — | | | | — | | | | 305 | | |
Transportation
Infrastructure | | | 1,268 | | | | — | | | | — | | | | 1,268 | | |
Water Utilities | | | 22 | | | | — | | | | — | | | | 22 | | |
Total Common Stocks | | | 30,185 | | | | — | | | | 2 | † | | | 30,187 | † | |
Rights | | | — | | | | 1 | | | | — | | | | 1 | | |
Fixed Income Securities | |
Sovereign | | | — | | | | 1,225 | | | | — | | | | 1,225 | | |
29
Morgan Stanley Institutional Fund, Inc.
Annual Report — December 31, 2016
Notes to Consolidated Financial Statements (cont'd)
Investment Type | | Level 1
Unadjusted
quoted
prices
(000) | | Level 2
Other
significant
observable
inputs
(000) | | Level 3
Significant
unobservable
inputs
(000) | | Total
(000) | |
Short-Term Investments | |
Investment Company | | $ | 88,232 | | | $ | — | | | $ | — | | | $ | 88,232 | | |
U.S. Treasury Security | | | — | | | | 7,112 | | | | — | | | | 7,112 | | |
Total Short-Term
Investments | | | 88,232 | | | | 7,112 | | | | — | | | | 95,344 | | |
Foreign Currency
Forward Exchange
Contracts | | | — | | | | 5,814 | | | | — | | | | 5,814 | | |
Futures Contracts | | | 532 | | | | — | | | | — | | | | 532 | | |
Credit Default Swap
Agreement | | | — | | | | 126 | | | | — | | | | 126 | | |
Interest Rate Swap
Agreement | | | — | | | | 9 | | | | — | | | | 9 | | |
Total Return Swap
Agreements | | | — | | | | 266 | | | | — | | | | 266 | | |
Total Assets | | | 118,949 | | | | 14,553 | | | | 2 | † | | | 133,504 | † | |
Liabilities: | |
Foreign Currency
Forward Exchange
Contracts | | | — | | | | (3,870 | ) | | | — | | | | (3,870 | ) | |
Futures Contracts | | | (811 | ) | | | — | | | | — | | | | (811 | ) | |
Interest Rate Swap
Agreement | | | — | | | | (859 | ) | | | — | | | | (859 | ) | |
Total Return Swap
Agreements | | | — | | | | (1,277 | ) | | | — | | | | (1,277 | ) | |
Total Liabilities | | | (811 | ) | | | (6,006 | ) | | | — | | | | (6,817 | ) | |
Total | | $ | 118,138 | | | $ | 8,547 | | | $ | 2 | † | | $ | 126,687 | † | |
† Includes one or more securities which are valued at zero.
@ Value is less than $500.
Transfers between investment levels may occur as the markets fluctuate and/or the availability of data used in an investment's valuation changes. The Portfolio recognizes
transfers between the levels as of the end of the period. As of December 31, 2016, securities with a total value of approximately $15,812 transferred from Level 2 to Level 1. Securities that were valued using other significant observable inputs at December 31, 2015 were valued using unadjusted quoted prices at December 31, 2016. At December 31, 2015, the fair value of certain securities were adjusted due to developments which occurred between the time of the close of the foreign markets on which they trade and the close of business on the NYSE which resulted in their Level 2 classification.
Following is a reconciliation of investments in which significant unobservable inputs (Level 3) were used in determining fair value.
| | | Common
Stocks
(000) | |
Beginning Balance | | $ | 5 | | |
Purchases | | | — | | |
Sales | | | — | | |
Amortization of discount | | | — | | |
Transfers in | | | — | † | |
Transfers out | | | — | | |
Corporate actions | | | — | | |
Change in unrealized appreciation (depreciation) | | | (3 | ) | |
Realized gains (losses) | | | — | | |
Ending Balance | | $ | 2 | † | |
Net change in unrealized appreciation (depreciation) from investments
still held as of December 31, 2016 | | $ | (3 | ) | |
† Includes one security which is valued at zero.
The following table presents additional information about valuation techniques and inputs used for investments that are measured at fair value and categorized within Level 3 as of December 31, 2016.
| | | Fair Value at
December 31, 2016
(000) | | Valuation
Technique | | Unobservable
Input | | Range | | Selected
Value | | Impact to
Valuation from an
Increase in Input | |
Semiconductors & Semiconductor Equipment | |
Common Stock | | $ | 2 | | | Tangible Net Asset
Value Method | | Tangible Net Asset
Value Per Share | | $ | 0.01 | | | $ | 0.01 | | | $ | 0.01 | | | Increase | |
| | | | | | | Discount for
Recoverability of
Certain Assets | | | 75.0 | % | | | 75.0 | % | | | 75.0 | % | | Decrease | |
3. Foreign Currency Translation and Foreign Investments: The books and records of the Portfolio are maintained in U.S. dollars. Foreign currency amounts are translated into U.S. dollars as follows:
— investments, other assets and liabilities at the prevailing rate of exchange on the valuation date;
— investment transactions and investment income at the prevailing rates of exchange on the dates of such transactions.
Although the net assets of the Portfolio are presented at the foreign exchange rates and market values at the close of the period, the Portfolio does not isolate that portion of the results of operations arising as a result of changes in the foreign
30
Morgan Stanley Institutional Fund, Inc.
Annual Report — December 31, 2016
Notes to Consolidated Financial Statements (cont'd)
exchange rates from the fluctuations arising from changes in the market prices of securities held at period end. Similarly, the Portfolio does not isolate the effect of changes in foreign exchange rates from the fluctuations arising from changes in the market prices of securities sold during the period. Accordingly, realized and unrealized foreign currency gains (losses) on investments in securities are included in the reported net realized and unrealized gains (losses) on investment transactions and balances. However, pursuant to U.S. federal income tax regulations, gains and losses from certain foreign currency transactions and the foreign currency portion of gains and losses realized on sales and maturities of foreign denominated debt securities are treated as ordinary income for U.S. federal income tax purposes.
Net realized gains (losses) on foreign currency transactions represent net foreign exchange gains (losses) from foreign currency forward exchange contracts, disposition of foreign currencies, currency gains (losses) realized between the trade and settlement dates on securities transactions, and the difference between the amount of investment income and foreign withholding taxes recorded on the Portfolio's books and the U.S. dollar equivalent amounts actually received or paid. Net unrealized currency gains (losses) from valuing foreign currency denominated assets and liabilities at period end exchange rates are reflected as a component of unrealized appreciation (depreciation) in the Consolidated Statement of Assets and Liabilities. The change in unrealized currency gains (losses) on foreign currency translations for the period is reflected in the Consolidated Statement of Operations.
Foreign security and currency transactions may involve certain considerations and risks not typically associated with those of U.S. dollar denominated transactions as a result of, among other factors, fluctuations of exchange rates in relation to the U.S. dollar, the possibility of lower levels of governmental supervision and regulation of foreign securities markets and the possibility of political or economic instability.
Governmental approval for foreign investments may be required in advance of making an investment under certain circumstances in some countries, and the extent of foreign investments in domestic companies may be subject to limitation in other countries. Foreign ownership limitations also may be imposed by the charters of individual companies to prevent, among other concerns, violations of foreign investment limitations. As a result, an additional class
of shares (identified as "Foreign" in the Consolidated Portfolio of Investments) may be created and offered for investment. The "local" and "foreign shares" market values may differ. In the absence of trading of the foreign shares in such markets, the Portfolio values the foreign shares at the closing exchange price of the local shares.
4. Derivatives: The Portfolio may, but is not required to, use derivative instruments for a variety of purposes, including hedging, risk management, portfolio management or to earn income. Derivatives are financial instruments whose value is based, in part, on the value of an underlying asset, interest rate, index or financial instrument. Prevailing interest rates and volatility levels, among other things, also affect the value of derivative instruments. A derivative instrument often has risks similar to its underlying asset and may have additional risks, including imperfect correlation between the value of the derivative and the underlying asset, risks of default by the counterparty to certain transactions, magnification of losses incurred due to changes in the market value of the securities, instruments, indices or interest rates to which the derivative instrument relates, risks that the transactions may not be liquid and risks arising from margin requirements. The use of derivatives involves risks that are different from, and possibly greater than, the risks associated with other portfolio investments. Derivatives may involve the use of highly specialized instruments that require investment techniques and risk analyses different from those associated with other portfolio investments. All of the Portfolio's holdings, including derivative instruments, are marked-to-market each day with the change in value reflected in unrealized appreciation (depreciation). Upon disposition, a realized gain or loss is recognized.
Certain derivative transactions may give rise to a form of leverage. Leverage magnifies the potential for gain and the risk of loss. Leverage associated with derivative transactions may cause the Portfolio to liquidate portfolio positions when it may not be advantageous to do so to satisfy its obligations or to meet earmarking or segregation requirements, pursuant to applicable Securities and Exchange Commission rules and regulations, or may cause the Portfolio to be more volatile than if the Portfolio had not been leveraged. Although the Adviser seeks to use derivatives to further the Portfolio's investment objectives, there is no assurance that the use of derivatives will achieve this result.
31
Morgan Stanley Institutional Fund, Inc.
Annual Report — December 31, 2016
Notes to Consolidated Financial Statements (cont'd)
Following is a description of the derivative instruments and techniques that the Portfolio used during the period and their associated risks:
Foreign Currency Forward Exchange Contracts: In connection with its investments in foreign securities, the Portfolio also entered into contracts with banks, brokers or dealers to purchase or sell securities or foreign currencies at a future date. A foreign currency forward exchange contract ("currency contract") is a negotiated agreement between the contracting parties to exchange a specified amount of currency at a specified future time at a specified rate. The rate can be higher or lower than the spot rate between the currencies that are the subject of the contract. Currency contracts may be used to protect against uncertainty in the level of future foreign currency exchange rates or to gain or modify exposure to a particular currency. To the extent hedged by the use of currency contracts, the precise matching of the currency contract amounts and the value of the securities involved will not generally be possible because the future value of such securities in foreign currencies will change as a consequence of market movements in the value of those securities between the date on which the contract is entered into and the date it matures. Furthermore, such transactions may reduce or preclude the opportunity for gain if the value of the currency should move in the direction opposite to the position taken. There is additional risk to the extent that currency contracts create exposure to currencies in which the Portfolio's securities are not denominated. Unanticipated changes in currency prices may result in poorer overall performance for the Portfolio than if it had not entered into such contracts. The use of currency contracts involves the risk of loss from the insolvency or bankruptcy of the counterparty to the contract or the failure of the counterparty to make payments or otherwise comply with the terms of the contract. A currency contract is marked-to-market daily and the change in market value is recorded by the Portfolio as unrealized gain or loss. The Portfolio records realized gains (losses) when the currency contract is closed equal to the difference between the value of the currency contract at the time it was opened and the value at the time it was closed.
Futures: A futures contract is a standardized, exchange-traded agreement to buy or sell a specific quantity of an underlying asset, reference rate or index at a specific price at a specific future time. The value of a futures
contract tends to increase and decrease in tandem with the value of the underlying instrument. Depending on the terms of the particular contract, futures contracts are settled through either physical delivery of the underlying instrument on the settlement date or by payment of a cash settlement amount on the settlement date. During the period the futures contract is open, payments are received from or made to the broker based upon changes in the value of the contract (the variation margin). A decision as to whether, when and how to use futures contracts involves the exercise of skill and judgment and even a well-conceived futures transaction may be unsuccessful because of market behavior or unexpected events. In addition to the derivatives risks discussed above, the prices of futures contracts can be highly volatile, using futures contracts can lower total return, and the potential loss from futures contracts can exceed the Portfolio's initial investment in such contracts. No assurance can be given that a liquid market will exist for any particular futures contract at any particular time. There is also the risk of loss by the Portfolio of margin deposits in the event of bankruptcy of a broker with which the Portfolio has open positions in the futures contract.
Swaps: The Portfolio may enter into OTC swap contracts or cleared swap transactions. A swap contract is an agreement between two parties pursuant to which the parties exchange payments at specified dates on the basis of a specified notional amount, with the payments calculated by reference to specified securities, indices, reference rates, currencies or other instruments. Typically swap agreements provide that when the period payment dates for both parties are the same, the payments are made on a net basis (i.e., the two payment streams are netted out, with only the net amount paid by one party to the other). The Portfolio's obligations or rights under a swap contract entered into on a net basis will generally be equal only to the net amount to be paid or received under the agreement, based on the relative values of the positions held by each party. Cleared swap transactions may help reduce counterparty credit risk. In a cleared swap, the Portfolio's ultimate counterparty is a clearinghouse rather than a swap dealer, bank or other financial institution. OTC swap agreements are not entered into or traded on exchanges and often there is no central clearing or guaranty function for OTC swaps. These OTC swaps are often subject to credit risk or the risk of default or non-performance by the counterparty. Both
32
Morgan Stanley Institutional Fund, Inc.
Annual Report — December 31, 2016
Notes to Consolidated Financial Statements (cont'd)
OTC and cleared swaps could result in losses if interest rates, foreign currency exchange rates or other factors are not correctly anticipated by the Portfolio or if the reference index, security or investments do not perform as expected. During the period swap agreements are open, payments are received from or made to the clearinghouse or counterparty based upon changes in the value of the contract (variation margin). The Dodd-Frank Wall Street Reform and Consumer Protection Act and related regulatory developments require the clearing and exchange-trading of certain standardized swap transactions. Mandatory exchange-trading and clearing is occurring on a phased-in basis.
The Portfolio's use of swaps during the period included those based on the credit of an underlying security commonly referred to as "credit default swaps." The Portfolio may be either the buyer or seller in a credit default swap. Where the Portfolio is the buyer of a credit default swap contract, it would typically be entitled to receive the par (or other agreed-upon) value of a referenced debt obligation from the counterparty to the contract only in the event of a default or similar event by the issuer of the debt obligation. If no default occurs, the Portfolio would have paid to the counterparty a periodic stream of payments over the term of the contract and received no benefit from the contract. When the Portfolio is the seller of a credit default swap contract, it typically receives the stream of payments but is obligated to pay an amount equal to the par (or other agreed-upon) value of a referenced debt obligation upon the default or similar event by the issuer of the referenced debt obligation. The use of credit default swaps could result in losses to the Portfolio if the Adviser fails to correctly evaluate the creditworthiness of the issuer of the referenced debt obligation.
If the Portfolio is a seller of protection and a credit event occurs, as defined under the terms of that particular swap agreement, the Portfolio will either (i) pay to the buyer of protection an amount equal to the notional amount of the swap agreement and take delivery of the referenced obligation, other deliverable obligations or underlying securities comprising the referenced index or (ii) pay a net settlement amount in the form of cash or securities equal to the notional amount of the swap agreement less the recovery value of the referenced obligation or underlying securities comprising the referenced index. If the Portfolio is a buyer of protection and
a credit event occurs, as defined under the terms of that particular swap agreement, the Portfolio will either (i) receive from the seller of protection an amount equal to the notional amount of the swap agreement and deliver the referenced obligation, other deliverable obligations or underlying securities comprising the referenced index or (ii) receive a net settlement amount in the form of cash or securities equal to the notional amount of the swap agreement less the recovery value of the referenced obligation or underlying securities comprising the referenced index. Recovery values are estimated by market makers considering either industry standard recovery rates or entity specific factors and considerations until a credit event occurs. If a credit event has occurred, the recovery value is determined by a facilitated auction whereby a minimum number of allowable broker bids, together with a specified valuation method, are used to calculate the settlement value. The Portfolio's maximum risk of loss from counterparty risk, either as the protection seller or as the protection buyer, is the fair value of the swap agreement.
The current credit rating of each individual issuer is listed in the table following the Consolidated Portfolio of Investments and serves as an indicator of the current status of the payment/performance risk of the credit derivative. Alternatively, for credit default swaps on an index of credits, the quoted market prices and current values serve as an indicator of the current status of the payment/performance risk of the credit derivative. Generally, lower credit ratings and increasing market values, in absolute terms, represent a deterioration of the credit and a greater likelihood of an adverse credit event of the issuer.
When the Portfolio has an unrealized loss on a swap agreement, the Portfolio has instructed the custodian to pledge cash or liquid securities as collateral with a value approximately equal to the amount of the unrealized loss. Collateral pledges are monitored and subsequently adjusted if and when the swap valuations fluctuate. If applicable, cash collateral is included with "Due from (to) Broker" in the Consolidated Statement of Assets and Liabilities.
Upfront payments paid or received by the Portfolio will be reflected as an asset or liability, respectively, in the Consolidated Statement of Assets and Liabilities.
33
Morgan Stanley Institutional Fund, Inc.
Annual Report — December 31, 2016
Notes to Consolidated Financial Statements (cont'd)
Options: With respect to options, the Portfolio is subject to equity risk, interest rate risk and foreign currency exchange risk in the normal course of pursuing its investment objectives. If the Portfolio buys an option, it buys a legal contract giving it the right to buy or sell a specific amount of the underlying instrument or foreign currency, or futures contract on the underlying instrument or foreign currency, at an agreed-upon price typically in exchange for a premium paid by the Portfolio. The Portfolio may purchase and/or sell put and call options. Purchasing call options tends to increase the Portfolio's exposure to the underlying (or similar) instrument. Purchasing put options tends to decrease the Portfolio's exposure to the underlying (or similar) instrument. When entering into purchased option contracts, the Portfolio bears the risk of interest or exchange rates or securities prices moving unexpectedly, in which case, the Portfolio may not achieve the anticipated benefits of the purchased option contracts; however the risk of loss is limited to the premium paid. Purchased options are reported as part of "Total Investments in Securities" in the Consolidated Statement of Assets and Liabilities. Premium paid for purchasing options which expired are treated as realized losses. If the Portfolio sells an option, it sells to another party the right to buy from or sell to the Portfolio a specific amount of the underlying instrument or foreign currency, or futures contract on the underlying instrument or foreign currency, at an agreed-upon price typically in exchange for a premium received by the Portfolio. The Portfolio may write call and put options on stock indexes, futures, securities or currencies it owns or in which it may invest. Writing put options tend to increase the Portfolio's exposure to the underlying instrument. Writing call options tend to decrease the Portfolio's exposure to the underlying instruments. When the Portfolio writes a call or put option, an amount equal to the premium received is recorded as a liability. Any liability recorded is subsequently adjusted to reflect the current value of the options written. Premiums received from writing options which expire are treated as realized gains. Premiums received from writing options which are exercised or are closed are added to or offset against the proceeds or amount paid on the transaction to determine the net realized gain or loss. The Portfolio as a writer of an option has no control over whether the underlying future, security or currency may be sold (call) or purchased (put)
and as a result bears the market risk of an unfavorable change in the price of the future, security or currency underlying the written option. When options are purchased OTC, the Portfolio bears the risk that the counterparty that wrote the option will be unable or unwilling to perform its obligations under the option contract. Options may also be illiquid and the Portfolio may have difficulty closing out its position. A decision as to whether, when and how to use options involves the exercise of skill and judgment and even a well-conceived option transaction may be unsuccessful because of market behavior or unexpected events. The prices of options can be highly volatile and the use of options can lower total returns.
Transactions in written options for the year ended December 31, 2016 were as follows:
Written Options | | Notional
Amount
(000) | | Premiums
Received
(000) | |
Options outstanding at December 31, 2015 | | | 99,460 | | | $ | 701 | | |
Options closed | | | (99,460 | ) | | | (701 | ) | |
Options outstanding at December 31, 2016 | | | — | | | $ | — | | |
FASB ASC 815, "Derivatives and Hedging" ("ASC 815"), is intended to improve financial reporting about derivative instruments by requiring enhanced disclosures to enable investors to better understand how and why the Portfolio uses derivative instruments, how these derivative instruments are accounted for and their effects on the Portfolio's financial position and results of operations.
The following tables set forth the fair value of the Portfolio's derivative contracts by primary risk exposure as of December 31, 2016.
| | | Asset Derivatives
Consolidated Statement
of Assets and
Liabilities Location | | Primary Risk
Exposure | | Value
(000) | |
Foreign Currency Forward | | Unrealized Appreciation on | | | | | |
Exchange Contracts | | Foreign Currency Forward | | | | | |
Futures Contract | | Exchange Contracts
Variation Margin | | Currency Risk | | $ | 5,814 | | |
| | on Futures Contracts | | Commodity Risk | | | 215 | (a) | |
Futures Contract | | Variation Margin | | | | | |
| | on Futures Contracts | | Equity Risk | | | 197 | (a) | |
Futures Contract | | Variation Margin | | | | | |
| | on Futures Contracts | | Interest Rate Risk | | | 120 | (a) | |
Swap Agreements | | Variation Margin | | | | | |
| | on Swap Agreements | | Credit Risk | | | 126 | (a) | |
Swap Agreements | | Unrealized Appreciation | | | | | |
| | on Swap Agreements | | Equity Risk | | | 266 | | |
Swap Agreements | | Variation Margin | | | | | |
| | on Swap Agreements | | Interest Rate Risk | | | 9 | (a) | |
Total | | | | | | $ | 6,747 | | |
34
Morgan Stanley Institutional Fund, Inc.
Annual Report — December 31, 2016
Notes to Consolidated Financial Statements (cont'd)
| | | Liability Derivatives
Consolidated Statement
of Assets and
Liabilities Location | | Primary Risk
Exposure | | Value
(000) | |
Foreign Currency Forward | | Unrealized Depreciation on | | | | | |
Exchange Contracts | | Foreign Currency Forward | | | | | |
| | | Exchange Contracts | | Currency Risk | | $ | (3,870 | ) | |
Futures Contracts | | Variation Margin
on Futures Contracts | | Equity Risk | | | (46 | )(a) | |
Futures Contracts | | Variation Margin
on Futures Contracts | | Interest Rate Risk | | | (765 | )(a) | |
Swap Agreements | | Unrealized Depreciation on
Swap Agreements | | Equity Risk | | | (1,277 | ) | |
Swap Agreements | | Unrealized Depreciation on
Swap Agreements | | Interest Rate Risk | | | (859 | ) | |
Total | | | | | | $ | (6,817 | ) | |
(a) This amount represents the cumulative appreciation (depreciation) as reported in the Consolidated Portfolio of Investments. The Consolidated Statement of Assets and Liabilities only reflects the current day's net variation margin.
The following tables set forth by primary risk exposure the Portfolio's realized gains (losses) and change in unrealized appreciation (depreciation) by type of derivative contract for the year ended December 31, 2016 in accordance with ASC 815.
Realized Gain (Loss) | |
Primary Risk Exposure | | Derivative Type | | Value
(000) | |
Currency Risk | | Options Purchased | | $ | (1,027 | )(b) | |
Currency Risk | | Options Written | | | 633 | | |
Currency Risk
| | Foreign Currency
Forward Exchange Contracts | | | (3,638 | ) | |
Commodity Risk | | Futures Contracts | | | (395 | ) | |
Equity Risk | | Futures Contracts | | | 8,029 | | |
Interest Rate Risk | | Futures Contracts | | | (1,788 | ) | |
Credit Risk | | Swap Agreements | | | 67 | | |
Equity Risk | | Swap Agreements | | | (2,988 | ) | |
Interest Rate Risk | | Swap Agreements | | | (2,834 | ) | |
Total | | | | $ | (3,941 | ) | |
(b) Amounts are included in Investments Sold in the Consolidated Statement of Operations
Change in Unrealized Appreciation (Depreciation) | |
Primary Risk Exposure | | Derivative Type | | Value
(000) | |
Currency Risk | | Options Purchased | | $ | (444 | )(c) | |
Currency Risk | | Options Written | | | (52 | ) | |
Currency Risk
| | Foreign Currency
Forward Exchange Contracts | | | (359 | ) | |
Commodity Risk | | Futures Contracts | | | 54 | | |
Equity Risk | | Futures Contracts | | | (352 | ) | |
Interest Rate Risk | | Futures Contracts | | | (528 | ) | |
Credit Risk | | Swap Agreements | | | 210 | | |
Equity Risk | | Swap Agreements | | | (1,696 | ) | |
Interest Rate Risk | | Swap Agreements | | | (1,445 | ) | |
Total | | | | $ | (4,612 | ) | |
(c) Amounts are included in Investments in the Consolidated Statement of Operations.
At December 31, 2016, the Portfolio's derivative assets and liabilities are as follows:
Gross Amounts of Assets and Liabilities Presented in the
Consolidated Statement of Assets and Liabilities | |
Derivatives(d) | | Assets(e)
(000) | | Liabilities(e)
(000) | |
Foreign Currency Forward Exchange Contracts | | $ | 5,814 | | | $ | (3,870 | ) | |
Swap Agreements | | | 266 | | | | (2,136 | ) | |
Total | | $ | 6,080 | | | $ | (6,006 | ) | |
(d) Excludes exchange traded derivatives.
(e) Absent an event of default or early termination, OTC derivative assets and liabilities are presented gross and not offset in the Consolidated Statement of Assets and Liabilities.
The Portfolio typically enters into International Swaps and Derivatives Association, Inc. Master Agreements ("ISDA Master Agreements") or similar master agreements (collectively, "Master Agreements") with its contract counterparties for certain OTC derivatives in order to, among other things, reduce its credit risk to counterparties. ISDA Master Agreements include provisions for general obligations, representations, collateral and events of default or termination. Under an ISDA Master Agreement, the Portfolio typically may offset with the counterparty certain OTC derivative financial instruments' payables and/or receivables with collateral held and/or posted and create one single net payment (close-out netting) in the event of default, termination and/or potential deterioration in the credit quality of the counterparty. Various Master Agreements govern the terms of certain transactions with counterparties, including transactions such as swap, forward, repurchase and reverse repurchase agreements. These Master Agreements typically attempt to reduce the counterparty risk associated with such transactions by specifying credit protection mechanisms and providing standardization that improves legal certainty. Cross-termination provisions under Master Agreements typically provide that a default in connection with one transaction between the Portfolio and a counterparty gives the non-defaulting party the right to terminate any other transactions in place with the defaulting party to create one single net payment due to/due from the defaulting party and may be a feature in certain Master Agreements. In the event the Portfolio exercises its right to terminate a Master Agreement after a counterparty experiences a termination event as defined in the Master Agreement, the
35
Morgan Stanley Institutional Fund, Inc.
Annual Report — December 31, 2016
Notes to Consolidated Financial Statements (cont'd)
return of collateral with market value in excess of the Portfolio's net liability may be delayed or denied.
The following tables present derivative financial instruments that are subject to enforceable netting arrangements as of December 31, 2016.
Gross Amounts Not Offset in the Consolidated Statement of Assets and Liabilities | |
Counterparty | | Gross Asset
Derivatives
Presented in
Consolidated
Statement of
Assets and
Liabilities
(000) | | Financial
Instrument
(000) | | Collateral
Received(f)
(000) | | Net Amount
(not less
than $0)
(000) | |
Bank of New York Mellon | | $ | — | @ | | $ | (— | @) | | $ | — | | | $ | 0 | | |
Barclays Bank PLC | | | 206 | | | | (29 | ) | | | — | | | | 177 | | |
BNP Paribas SA | | | 75 | | | | (75 | ) | | | — | | | | 0 | | |
Citibank NA | | | 3,741 | | | | (2,984 | ) | | | (757 | ) | | | 0 | | |
Commonwealth Bank
of Australia | | | 137 | | | | (137 | ) | | | — | | | | 0 | | |
Credit Suisse International | | | 13 | | | | (13 | ) | | | — | | | | 0 | | |
Goldman Sachs International | | | 29 | | | | (4 | ) | | | — | | | | 25 | | |
JPMorgan Chase Bank NA | | | 1,796 | | | | (719 | ) | | | — | | | | 1,077 | | |
State Street Bank and Trust Co. | | | 11 | | | | — | | | | — | | | | 11 | | |
UBS AG | | | 72 | | | | — | | | | — | | | | 72 | | |
Total | | $ | 6,080 | | | $ | (3,961 | ) | | $ | (757 | ) | | $ | 1,362 | | |
(f) In some instances, the actual collateral received may be more than the amount shown here due to overcollateralization.
Gross Amounts Not Offset in the Consolidated Statement of Assets and Liabilities | |
Counterparty | | Gross Liability
Derivatives
Presented in
Consolidated
Statement of
Assets and
Liabilities
(000) | | Financial
Instrument
(000) | | Collateral
Pledged(g)
(000) | | Net Amount
(not less
than $0)
(000) | |
Bank of America NA | | $ | 9 | | | $ | — | | | $ | — | | | $ | 9 | | |
Bank of Montreal | | | 2 | | | | — | | | | — | | | | 2 | | |
Bank of New York Mellon | | | 1 | | | | (— | @) | | | — | | | | 1 | | |
Barclays Bank PLC | | | 29 | | | | (29 | ) | | | — | | | | 0 | | |
BNP Paribas SA | | | 92 | | | | (75 | ) | | | — | | | | 17 | | |
Citibank NA | | | 2,984 | | | | (2,984 | ) | | | — | | | | 0 | | |
Commonwealth Bank
of Australia | | | 171 | | | | (137 | ) | | | — | | | | 34 | | |
Credit Suisse International | | | 14 | | | | (13 | ) | | | — | | | | 1 | | |
Goldman Sachs International | | | 1,179 | | | | (4 | ) | | | (1,175 | ) | | | 0 | | |
JPMorgan Chase Bank NA | | | 1,525 | | | | (719 | ) | | | — | | | | 806 | | |
Total | | $ | 6,006 | | | $ | (3,961 | ) | | $ | (1,175 | ) | | $ | 870 | | |
(g) In some instances, the actual collateral pledged may be more than the amount shown here due to overcollateralization.
For the year ended December 31, 2016, the approximate average monthly amount outstanding for each derivative type is as follows:
Foreign Currency Forward Exchange Contracts: | |
Average monthly principal amount | | $ | 302,934,000 | | |
Futures Contracts: | |
Average monthly original value | | $ | 349,815,000 | | |
Swap Agreements: | |
Average monthly notional amount | | $ | 198,091,000 | | |
Options Purchased: | |
| Average monthly notional amount | | | 39,587,000 | | |
Options Written: | |
| Average monthly notional amount | | | 37,847,000 | | |
5. Indemnifications: The Fund enters into contracts that contain a variety of indemnifications. The Fund's maximum exposure under these arrangements is unknown. However, the Fund has not had prior claims or losses pursuant to these contracts and expects the risk of loss to be remote.
6. Dividends and Distributions to Shareholders: Dividend income and distributions to shareholders are recorded on the ex-dividend date. Dividends from net investment income, if any, are declared and paid annually. Net realized capital gains, if any, are distributed at least annually.
7. Security Transactions, Income and Expenses: Security transactions are accounted for on the trade date (date the order to buy or sell is executed). Realized gains and losses on the sale of investment securities are determined on the specific identified cost method. Dividend income and other distributions are recorded on the ex-dividend date (except for certain foreign dividends which may be recorded as soon as the Portfolio is informed of such dividends) net of applicable withholding taxes. Interest income is recognized on the accrual basis except where collection is in doubt. Discounts are accreted and premiums are amortized over the life of the respective securities. Most expenses of the Fund can be directly attributed to a particular Portfolio. Expenses which cannot be directly attributed are apportioned among the Portfolios based upon relative net assets or other appropriate methods. Income, expenses (other than class specific expenses — distribution and shareholder services, transfer agency and sub transfer agency fees) and realized and unrealized gains or losses are allocated to each class of shares based upon their relative net assets.
36
Morgan Stanley Institutional Fund, Inc.
Annual Report — December 31, 2016
Notes to Consolidated Financial Statements (cont'd)
The Portfolio owns shares of real estate investment trusts ("REITs") which report information on the source of their distributions annually in the following calendar year. A portion of distributions received from REITs during the year is estimated to be a return of capital and is recorded as a reduction of their cost.
B. Advisory Fees: The Adviser, a wholly-owned subsidiary of Morgan Stanley, provides the Portfolio with advisory services under the terms of an Investment Advisory Agreement, paid quarterly, at the annual rate based on the daily net assets as follows:
First $750
million | | Next $750
million | | Over $1.5
billion | |
| | 0.85 | % | | | 0.80 | % | | | 0.75 | % | |
For the year ended December 31, 2016, the advisory fee rate (net of waivers/rebate) was equivalent to an annual effective rate of 0.72% of the Portfolio's average daily net assets.
The Adviser has agreed to reduce its advisory fee and/or reimburse the Portfolio so that total annual portfolio operating expenses, excluding certain investment related expenses, taxes, interest and other extraordinary expenses (including litigation), will not exceed 1.10% for Class I shares, 1.45% for Class A shares, 1.95% for Class L shares, 2.20% for Class C shares and 1.07% for Class IS shares. The fee waivers and/or expense reimbursements will continue for at least one year from the date of the Portfolio's prospectus or until such time as the Directors act to discontinue all or a portion of such waivers and/or reimbursements when they deem such action is appropriate. For the year ended December 31, 2016, approximately $168,000 of advisory fees were waived and approximately $81,000 of other expenses were reimbursed by the Adviser pursuant to this arrangement.
The Adviser provides investment advisory services to the Subsidiary pursuant to the Subsidiary Investment Management Agreement (the "Agreement"). Under the Agreement, the Subsidiary will pay the Adviser at the end of each fiscal quarter, calculated by applying a quarterly rate, based on the annual rate of 0.05%, to the average daily net assets of the Subsidiary.
The Adviser has agreed to waive its advisory fees by the amount of advisory fees it receives from the Subsidiary.
C. Administration Fees: The Adviser also serves as Administrator to the Fund and provides administrative services pursuant to an Administration Agreement for an annual fee, accrued daily and paid monthly, of 0.08% of the Portfolio's average daily net assets.
Under a Sub-Administration Agreement between the Administrator and State Street Bank and Trust Company ("State Street"), State Street provides certain administrative services to the Fund. For such services, the Administrator pays State Street a portion of the fee the Administrator receives from the Portfolio.
D. Distribution and Shareholder Services Fees: Morgan Stanley Distribution, Inc. ("MSDI" or the "Distributor"), a wholly-owned subsidiary of the Adviser and an indirect subsidiary of Morgan Stanley, serves as the Fund's Distributor of Portfolio shares pursuant to a Distribution Agreement. The Fund has adopted a Shareholder Services Plan with respect to Class A shares pursuant to Rule 12b-1 under the Act. Under the Shareholder Services Plan, the Portfolio pays the Distributor a shareholder services fee, accrued daily and paid monthly, at an annual rate of 0.25% of the Portfolio's average daily net assets attributable to Class A shares.
The Fund has adopted a Distribution and Shareholder Services Plan with respect to Class L shares pursuant to Rule 12b-1 under the Act. Under the Distribution and Shareholder Services Plan, the Portfolio pays the Distributor a distribution fee, accrued daily and paid monthly, at an annual rate of 0.50% and a shareholder services fee, accrued daily and paid monthly, at an annual rate of 0.25% of the Portfolio's average daily net assets attributable to Class L shares.
The Fund has adopted a Distribution and Shareholder Services Plan with respect to Class C shares pursuant to Rule 12b-1 under the Act. Under the Distribution and Shareholder Services Plan, the Portfolio pays the Distributor a distribution fee, accrued daily and paid monthly, at an annual rate of 0.75% and a shareholder services fee, accrued daily and paid monthly, at an annual rate of 0.25% of the Portfolio's average daily net assets attributable to Class C shares.
The distribution and shareholder services fees are used to support the expenses associated with servicing and maintaining accounts. The Distributor may compensate other parties for providing shareholder support services to investors who purchase Class A, Class L and Class C shares.
E. Dividend Disbursing and Transfer Agent: The Fund's dividend disbursing and transfer agent is Boston Financial Data Services, Inc. ("BFDS"). Pursuant to a Transfer Agency Agreement, the Fund pays BFDS a fee based on the number of classes, accounts and transactions relating to the Portfolios of the Fund.
37
Morgan Stanley Institutional Fund, Inc.
Annual Report — December 31, 2016
Notes to Consolidated Financial Statements (cont'd)
F. Custodian Fees: State Street (the "Custodian") serves as Custodian for the Fund in accordance with a Custodian Agreement. The Custodian holds cash, securities, and other assets of the Fund as required by the Act. Custody fees are payable monthly based on assets held in custody, investment purchases and sales activity and account maintenance fees, plus reimbursement for certain out-of-pocket expenses.
In December 2015, the Fund's Custodian announced that it had identified inconsistencies in the way in which clients were invoiced for out-of-pocket expenses from 1998 until November 2015. The dollar amount difference between what was charged and what should have been charged, plus interest, was paid back to the Portfolio in September 2016 as a reimbursement. The Custodian reimbursed the Portfolio directly, which was recognized as a change in accounting estimate and was reflected as "Reimbursement of Custodian Fees" in the Consolidated Statement of Operations. Pursuant to the expense limitations described in Note B, the Portfolio has experienced waiver of advisory fees during the current period. Accordingly, the reimbursement of out-of-pocket custodian expenses in the current period resulted in the reduction in the current period waiver of advisory fees.
G. Security Transactions and Transactions with Affiliates: For the year ended December 31, 2016, purchases and sales of investment securities for the Portfolio, other than long-term U.S. Government securities and short-term investments, were approximately $330,270,000 and $414,388,000, respectively. For the year ended December 31, 2016, purchases and sales of long-term U.S. Government securities were approximately $58,202,000 and $177,611,000, respectively.
The Portfolio invests in the Institutional Class of the Morgan Stanley Institutional Liquidity Funds (the "Liquidity Funds"), an open-end management investment company managed by the Adviser. Advisory fees paid by the Portfolio are reduced by an amount equal to its pro-rata share of the advisory and administration fees paid by the Portfolio due to its investment in the Liquidity Funds. For the year ended December 31, 2016, advisory fees paid were reduced by approximately $137,000 relating to the Portfolio's investment in the Liquidity Funds.
A summary of the Portfolio's transactions in shares of the Liquidity Funds during the year ended December 31, 2016 is as follows:
Value
December 31,
2015
(000) | | Purchases
at Cost
(000) | | Sales
(000) | | Dividend
Income
(000) | | Value
December 31,
2016
(000) | |
| $ | 40,037 | | | $ | 643,061 | | | $ | 594,866 | | | $ | 384 | | | $ | 88,232 | | |
The Portfolio is permitted to purchase and sell securities ("cross-trade") from and to other Morgan Stanley Funds as well as other funds and client accounts for which the Adviser or an affiliate of the Adviser serves as investment adviser, pursuant to procedures approved by the Directors in compliance with Rule 17a-7 under the Act (the "Rule"). Each cross-trade is executed at the current market price in compliance with provisions of the Rule. For the year ended December 31, 2016, the Portfolio did not engage in any cross-trade transactions.
The Portfolio has an unfunded Deferred Compensation Plan (the "Compensation Plan"), which allows each independent Director to defer payment of all, or a portion, of the fees he or she receives for serving on the Board of Directors. Each eligible Director generally may elect to have the deferred amounts credited with a return equal to the total return on one or more of the Morgan Stanley funds that are offered as investment options under the Compensation Plan. Appreciation/depreciation and distributions received from these investments are recorded with an offsetting increase/decrease in the deferred compensation obligation and do not affect the NAV of the Portfolio.
H. Federal Income Taxes: It is the Portfolio's intention to continue to qualify as a regulated investment company and distribute all of its taxable and tax-exempt income. Accordingly, no provision for federal income taxes is required in the financial statements.
The Portfolio may be subject to taxes imposed by countries in which it invests. Such taxes are generally based on income and/or capital gains earned or repatriated. Taxes are accrued based on net investment income, net realized gains and net unrealized appreciation as such income and/or gains are earned. Taxes may also be based on transactions in foreign currency and are accrued based on the value of investments denominated in such currency.
FASB ASC 740-10, "Income Taxes — Overall", sets forth a minimum threshold for consolidated financial statement recognition of the benefit of a tax position taken or expected to be taken in a tax return. Management has concluded there are no significant uncertain tax positions that would require recognition in the consolidated financial statements. If applicable, the Portfolio recognizes interest accrued related to unrecognized tax benefits in "Interest Expense" and penalties in "Other Expenses" in the Consolidated Statement of Operations. The Portfolio files tax returns with the U.S. Internal Revenue Service, New York and various states. Generally, each of the tax years in the four-year period ended December 31, 2016, remains subject to examination by taxing authorities.
38
Morgan Stanley Institutional Fund, Inc.
Annual Report — December 31, 2016
Notes to Consolidated Financial Statements (cont'd)
The tax character of distributions paid may differ from the character of distributions shown in the Statements of Changes in Net Assets due to short-term capital gains being treated as ordinary income for tax purposes. The tax character of distributions paid during fiscal years 2016 and 2015 was as follows:
2016
Distributions
Paid From: | | 2015
Distributions
Paid From: | |
Ordinary
Income
(000) | | Long-Term
Capital Gain
(000) | | Ordinary
Income
(000) | | Long-Term
Capital Gain
(000) | |
| $ | 3,526 | | | $ | — | | | $ | 8,076 | | | $ | — | | |
The amount and character of income and gains to be distributed are determined in accordance with income tax regulations which may differ from GAAP. These book/tax differences are either considered temporary or permanent in nature.
Temporary differences are attributable to differing book and tax treatments for the timing of the recognition of gains (losses) on certain investment transactions and the timing of the deductibility of certain expenses.
Permanent differences, primarily due to differing treatments of gains (losses) related to foreign currency transactions, tax adjustments on certain equity securities designated as issued by passive foreign investment companies, swap transactions and a net operating loss, resulted in the following reclassifications among the components of net assets at December 31, 2016:
Distributions
in Excess of
Net Investment
Income
(000) | | Accumulated
Net Realized
Loss
(000) | | Paid-in-
Capital
(000) | |
| $ | 1,078 | | | $ | 5,880 | | | $ | (6,958 | ) | |
At December 31, 2016, the Portfolio had no distributable earnings on a tax basis.
At December 31, 2016, the Portfolio had available for federal income tax purposes unused short-term and long-term capital losses of approximately $79,580,000 and $3,729,000 respectively, that do not have an expiration date.
To the extent that capital loss carryforwards are used to offset any future capital gains realized during the carryover period as provided by U.S. federal income tax regulations, no capital gains tax liability will be incurred by the Portfolio for gains realized and not distributed. To the extent that capital gains are offset, such gains will not be distributed to the shareholders.
Qualified late year losses are capital losses and specified ordinary losses, including currency losses, incurred after October 31 but within the taxable year that, if elected, are
deemed to arise on the first day of the Portfolio's next taxable year. These also include non-specified ordinary losses incurred after December 31 but within the same taxable year. For the year ended December 31, 2016, the Portfolio deferred to January 1, 2017 for U.S. federal income tax purposes the following losses:
Qualified Late
Year Ordinary
Losses
(000) | | Post-October
Capital Losses
(000) | |
| $ | 376 | | | $ | — | | |
I. Credit Facility: As of April 4, 2016, the Fund and other Morgan Stanley funds participated in a $150,000,000 committed, unsecured revolving line of credit facility (the "facility") with State Street. This facility is to be used for temporary emergency purposes or funding of shareholder redemption requests. The interest rate on borrowings is based on the federal funds rate or one month libor rate plus a spread. The facility also has a commitment fee of 0.25% per annum based on the unused portion of the facility. During the year ended December 31, 2016, the Portfolio did not have any borrowings under the facility.
J. Other: At December 31, 2016, the Portfolio had record owners of 10% or greater. Investment activities of these shareholders could have a material impact on the Portfolio. The aggregate percentage of such owners was 65.6%.
K. Accounting Pronouncements: In December 2016, FASB issued Accounting Standards update 2016-19 — Technical Corrections and Improvements ("ASU 2016-19"), which is effective for interim periods for all entities beginning after December 15, 2016. ASU 2016-19 includes an amendment to Topic 820, Fair Value Measurement, which clarifies the difference between a valuation approach and a valuation technique when applying the guidance in that Topic. That amendment also requires an entity to disclose when there has been a change in either or both a valuation approach and/or a valuation technique. The transition guidance for the amendment must be applied prospectively because it could potentially involve the use of hindsight that includes fair value measurements. Although still evaluating the potential impacts of ASU 2016-19 to the Portfolio, management expects that the impact of the Portfolio's adoption will be limited to additional financial statement disclosures.
In October 2016, the Securities and Exchange Commission ("SEC") issued a new rule, Investment Company Reporting Modernization, which, among other provisions, amends
39
Morgan Stanley Institutional Fund, Inc.
Annual Report — December 31, 2016
Notes to Consolidated Financial Statements (cont'd)
Regulation S-X to require standardized, enhanced disclosures, particularly related to derivatives, in investment company financial statements. Compliance with the guidance is effective for financial statements filed with the SEC on or after August 1, 2017; adoption will have no effect on the Portfolio's net assets or results of operations. Although still evaluating the potential impacts of the Investment Company Reporting Modernization to the Portfolio, management expects that the impact of the Portfolio's adoption will be limited to additional financial statement disclosures.
40
Morgan Stanley Institutional Fund, Inc.
Annual Report — December 31, 2016
Report of Independent Registered Public Accounting Firm
To the Shareholders and Board of Directors of
Morgan Stanley Institutional Fund, Inc. —
Multi-Asset Portfolio
We have audited the accompanying consolidated statement of assets and liabilities, including the consolidated portfolio of investments, of Multi-Asset Portfolio (one of the portfolios constituting Morgan Stanley Institutional Fund, Inc.) (the "Portfolio") as of December 31, 2016, the related consolidated statements of operations and changes in net assets and the consolidated financial highlights for the year then ended, and the statement of changes in net assets and the financial highlights for each of the years or periods indicated therein. These consolidated financial statements and financial highlights are the responsibility of the Portfolio's management. Our responsibility is to express an opinion on these financial statements and consolidated financial highlights based on our audits.
We conducted our audits in accordance with the standards of the Public Company Accounting Oversight Board (United States). Those standards require that we plan and perform the audit to obtain reasonable assurance about whether the consolidated financial statements and financial highlights are free of material misstatement. We were not engaged to perform an audit of the Portfolio's internal control over financial reporting. Our audits included consideration of internal control over financial reporting as a basis for designing audit procedures that are appropriate in the circumstances, but not for the purpose of expressing an opinion on the effectiveness of the Portfolio's internal control over financial reporting. Accordingly, we express no such opinion. An audit also includes examining, on a test basis, evidence supporting the amounts and disclosures in the consolidated financial statements and financial highlights, assessing the accounting principles used and significant estimates made by management, and evaluating the overall financial statement presentation. Our procedures included confirmation of securities owned as of December 31, 2016, by correspondence with the custodian and others or by other appropriate auditing procedures where replies from others were not received. We believe that our audits provide a reasonable basis for our opinion.
In our opinion, the consolidated financial statements and financial highlights referred to above present fairly, in all material respects, the consolidated financial position of Multi-Asset Portfolio (one of the portfolios constituting Morgan Stanley Institutional Fund, Inc.) at December 31, 2016, the consolidated results of its operations and changes in its net assets for the year then ended, and the changes in its net assets and the financial highlights for each of the years or periods indicated therein, in conformity with U.S. generally accepted accounting principles.

Boston, Massachusetts
February 28, 2017
41
Morgan Stanley Institutional Fund, Inc.
Annual Report — December 31, 2016
Federal Tax Notice (unaudited)
For federal income tax purposes, the following information is furnished with respect to the distributions paid by the Portfolio during its taxable year ended December 31, 2016. For corporate shareholders 20.20% of the dividends qualified for the dividends received deduction.
For federal income tax purposes, the following information is furnished with respect to the Portfolio's earnings for its taxable year ended December 31, 2016. When distributed, certain earnings may be subject to a maximum tax rate of 15% as provided for by the Jobs and Growth Tax Relief Reconciliation Act of 2003. The Portfolio designated up to a maximum of approximately $904,000 as taxable at this lower rate.
In January, the Portfolio provides tax information to shareholders for the preceding calendar year.
42
Morgan Stanley Institutional Fund, Inc.
Annual Report — December 31, 2016
Privacy Notice (unaudited)
MORGAN STANLEY INVESTMENT MANAGEMENT INC.
AN IMPORTANT NOTICE CONCERNING OUR U.S. PRIVACY POLICY
We are required by federal law to provide you with a copy of our privacy policy annually. This policy applies to current and former individual investors in funds managed or sponsored by Morgan Stanley Investment Management Inc. ("MSIM") as well as current and former individual clients of MSIM. This policy is not applicable to partnerships, corporations, trusts or other non-individual clients or investors. Please note that we may amend this policy at any time, and will inform you of any changes as required by law.
WE RESPECT YOUR PRIVACY
We appreciate that you have provided us with your personal financial information. We strive to maintain the privacy of such information while we help you achieve your financial objectives. This Notice describes what non-public personal information we collect about you, why we collect it, when we may share it with others and how certain others may use it. It discusses the steps you may take to limit our sharing of certain information about you to affiliated companies in the Morgan Stanley family of companies ("other Morgan Stanley companies"). It also discloses how you may limit use of certain shared information for marketing purposes by other Morgan Stanley branded companies. Throughout this policy, we refer to the non-public information that personally identifies you or your accounts as "personal information.''
1. WHAT PERSONAL INFORMATION DO WE COLLECT ABOUT YOU?
We obtain personal information from applications and other forms you submit to us, from your dealings with us, from consumer reporting agencies, from our Web sites and from third parties and other sources.
For example:
• We may collect information such as your name, address, e-mail address, telephone/fax numbers, assets, income and investment objectives through subscription documents, applications and other forms you submit to us.
• We may obtain information about account balances, your use of account(s) and the types of products and services you prefer to receive from us through your dealings and transactions with us and other sources.
• We may obtain information about your creditworthiness and credit history from consumer reporting agencies.
• We may collect background information from and through third-party vendors to verify representations you have made and to comply with various regulatory requirements.
• If you interact with us through our public and private Web sites, we may collect information that you provide directly through online communications (such as an e-mail address). We may also collect information about your Internet service provider, your domain name, your computer's operating system and Web browser, your use of our Web sites and your product and service preferences, through the use of "cookies." Please consult the Terms of Use of these sites for more details.
2. WHEN DO WE DISCLOSE PERSONAL INFORMATION WE COLLECT ABOUT YOU?
We may disclose personal information we collect about you to other Morgan Stanley companies and to non-affiliated third parties.
a. Information We Disclose to Other Morgan Stanley Companies.
We may disclose personal information to other Morgan Stanley companies for a variety of reasons, including to manage your account(s) effectively, to service and process your transactions, to let you know about products and services offered by us and other Morgan Stanley companies, to manage our business, and as otherwise required or permitted by law. Offers for products and services from other Morgan Stanley companies are developed under conditions designed to safeguard your personal information.
43
Morgan Stanley Institutional Fund, Inc.
Annual Report — December 31, 2016
Privacy Notice (unaudited) (cont'd)
b. Information We Disclose to Non-affiliated Third Parties.
We do not disclose personal information that we collect about you to non-affiliated third parties except to those who provide marketing services on our behalf, to financial institutions with whom we have joint marketing agreements, and as otherwise required or permitted by law. For example, we may disclose personal information to nonaffiliated third parties for servicing and processing transactions, to offer our own products and services, to protect against fraud, for institutional risk control, to respond to judicial process or to perform services on our behalf. When we share personal information with a non-affiliated third party, they are required to limit their use of personal information to the particular purpose for which it was shared and they are not allowed to share personal information with others except to fulfill that limited purpose or as may be permitted or required by law.
3. HOW DO WE PROTECT THE SECURITY AND CONFIDENTIALITY OF PERSONAL INFORMATION WE COLLECT ABOUT YOU?
We maintain physical, electronic and procedural security measures to help safeguard the personal information we collect about you. We have internal policies governing the proper handling of client information. Third parties that provide support or marketing services on our behalf may also receive personal information, and we require them to adhere to confidentiality standards with respect to such information.
4. HOW CAN YOU LIMIT THE SHARING OF CERTAIN TYPES OF PERSONAL INFORMATION WITH OTHER MORGAN STANLEY COMPANIES?
We offer you choices as to whether we share with other Morgan Stanley companies the personal information that was collected to determine your eligibility for products and services you request ("eligibility information"). Eligibility information does not include your identification information or personal information pertaining to our transactions or experiences with you. Please note that, even if you direct us not to share eligibility information with other Morgan Stanley companies ("opt-out"), we may still share personal information, including eligibility information, with those companies in circumstances excluded from the opt-out under applicable law, such as to process transactions or to service your account.
5. HOW CAN YOU LIMIT THE USE OF CERTAIN TYPES OF PERSONAL INFORMATION BY OTHER MORGAN STANLEY COMPANIES FOR MARKETING?
By following the opt-out instructions in Section 6 below, you may limit other Morgan Stanley branded companies from marketing their products or services to you based on personal information we disclose to them. This information may include, for example, your income and account history with us. Please note that, even if you choose to limit Other Morgan Stanley Companies from using personal information about you that we may share with them for marketing their products and services to you, Other Morgan Stanley Companies may use your personal information that they obtain from us to market to you in circumstances permitted by law, such as if the Other Morgan Stanley Company has its own relationship with you.
6. HOW CAN YOU SEND US AN OPT-OUT INSTRUCTION?
If you wish to limit our sharing of eligibility information about you with other Morgan Stanley companies or other Morgan Stanley companies' use of personal information for marketing purposes, as described in this notice, you may do so by:
• Calling us at (800) 548-7786
Monday–Friday between 8a.m. and 6p.m.(EST)
• Writing to us at the following address:
Boston Financial Data Services, Inc.
c/o Privacy Coordinator
P.O. Box 219804
Kansas City, Missouri 64121
44
Morgan Stanley Institutional Fund, Inc.
Annual Report — December 31, 2016
Privacy Notice (unaudited) (cont'd)
Your written request should include your name, address, telephone number and account number(s) to which the opt-out applies and whether you are opting out with respect to sharing of eligibility information (Section 4 above), or if information used for Marketing (Section 5 above) or both. Written opt-out requests should not be sent with any other correspondence. In order to process your request, we require that the request be provided by you directly and not through a third party.
Your opt-out preference will remain in effect with respect to this policy (as it may be amended) until you notify us otherwise. If you have a joint account, your direction for us not to share this information with other Morgan Stanley companies and for those other Morgan Stanley companies not to use your personal information for marketing will be applied to all account holders on that account. Please understand that if you limit our sharing or our affiliated companies' use of personal information, you and any joint account holder(s) may not receive information about Morgan Stanley products and services, including products or services that could help you manage your financial resources and achieve your investment objectives.
7. WHAT IF AN AFFILIATED COMPANY BECOMES A NON-AFFILIATED THIRD PARTY?
If, at any time in the future, an affiliated company becomes a non-affiliated third party, further disclosures of personal information made to the former affiliated company will be limited to those described in Section 2(b) above relating to non-affiliated third parties. If you elected under Section 6 to limit disclosures we make to affiliated companies, or use of personal information by affiliated companies, your election will not apply to use by any former affiliated company of your personal information in their possession once it becomes a non-affiliated third party.
SPECIAL NOTICE TO RESIDENTS OF VERMONT
The following section supplements our policy with respect to our individual clients who have a Vermont address and supersedes anything to the contrary in the above policy with respect to those clients only.
The state of Vermont requires financial institutions to obtain your consent prior to sharing personal information that they collect about you with affiliated companies and non-affiliated third parties other than in certain limited circumstances. Except as permitted by law, we will not share personal information we collect about you with non-affiliated third parties or other Morgan Stanley companies unless you provide us with your written consent to share such information ("opt-in").
If you wish to receive offers for investment products and services offered by or through other Morgan Stanley companies, please notify us in writing at the following address:
Boston Financial Data Services, Inc.
c/o Privacy Coordinator
P.O. Box 219804
Kansas City, Missouri 64121
Your authorization should include your name, address, telephone number and account number(s) to which the opt-in applies and should not be sent with any other correspondence. In order to process your authorization, we require that the authorization be provided by you directly and not through a third party.
SPECIAL NOTICE TO RESIDENTS OF CALIFORNIA
The following section supplements our policy with respect to our individual clients who have a California address and supersedes anything to the contrary in the above policy with respect to those clients only.
In response to a California law, if your account has a California home address, your personal information will not be disclosed to nonaffiliated third parties except as permitted by applicable California law, and we will limit sharing such information with our affiliates to comply with California privacy laws that apply to us.
45
Morgan Stanley Institutional Fund, Inc.
Annual Report — December 31, 2016
Director and Officer Information (unaudited)
Independent Directors:
Name, Age and Address of
Independent Director | | Position(s)
Held with
Registrant | | Length of Time
Served* | | Principal Occupation(s) During Past 5 Years
and Other Relevant Professional Experience | | Number of
Portfolios in
Fund Complex
Overseen by
Independent
Director** | | Other Directorships
Held by Independent
Director*** | |
Frank L. Bowman (72)
c/o Perkins Coie LLP
Counsel to the Independent
Directors
30 Rockefeller Plaza
New York, NY 10112 | | Director | | Since
August
2006 | | President, Strategic Decisions, LLC (consulting) (since February 2009); Director or Trustee of various Morgan Stanley Funds (since August 2006); Chairperson of the Compliance and Insurance Committee (since October 2015); formerly, Chairperson of the Insurance Sub-Committee of the Compliance and Insurance Committee (2007-2015); served as President and Chief Executive Officer of the Nuclear Energy Institute (policy organization) (February 2005-November 2008); retired as Admiral, U.S. Navy after serving over 38 years on active duty including 8 years as Director of the Naval Nuclear Propulsion Program in the Department of the Navy and the U.S. Department of Energy (1996-2004); served as Chief of Naval Personnel (July 1994-September 1996) and on the Joint Staff as Director of Political Military Affairs (June 1992-July 1994); knighted as Honorary Knight Commander of the Most Excellent Order of the British Empire; awarded the Officier de l'Orde National du Mérite by the French Government; elected to the National Academy of Engineering (2009). | | | 90 | | | Director of BP p.l.c.; Director of Naval and Nuclear Technologies LLP; Director Emeritus of the Armed Services YMCA; Director of the U.S. Naval Submarine League; Member of the National Security Advisory Council of the Center for U.S. Global Engagement and a member of the CNA Military Advisory Board; Chairman of the charity J Street Cup Golf; Trustee of Fairhaven United Methodist Church; and Director of other various non-profit organizations. | |
Kathleen A. Dennis (63)
c/o Perkins Coie LLP
Counsel to the Independent Directors
30 Rockefeller Plaza
New York, NY 10112 | | Director | | Since
August
2006 | | President, Cedarwood Associates (mutual fund and investment management consulting) (since July 2006); Chairperson of the Liquidity and Alternatives Sub-Committee of the Investment Committee (since October 2006) and Director or Trustee of various Morgan Stanley Funds (since August 2006); formerly, Senior Managing Director of Victory Capital Management (1993-2006). | | | 91 | | | Director of various non-profit organizations. | |
Nancy C. Everett (61)
c/o Perkins Coie LLP
Counsel to the Independent Directors
30 Rockefeller Plaza
New York, NY 10112 | | Director | | Since
January
2015 | | Chief Executive Officer, Virginia Commonwealth University Investment Company (since November 2015); Owner, OBIR, LLC (institutional investment management consulting) (since June 2014); formerly, Managing Director, BlackRock Inc. (February 2011-December 2013); and Chief Executive Officer, General Motors Asset Management (a/k/a Promark Global Advisors, Inc.) (June 2005-May 2010). | | | 91 | | | Member of Virginia Commonwealth University School of Business Foundation; formerly, Member of Virginia Commonwealth University Board of Visitors (2013-2015); Member of Committee on Directors for Emerging Markets Growth Fund, Inc. (2007-2010); Chairperson of Performance Equity Management, LLC (2006-2010); and Chairperson, GMAM Absolute Return Strategies Fund, LLC (2006-2010). | |
46
Morgan Stanley Institutional Fund, Inc.
Annual Report — December 31, 2016
Director and Officer Information (unaudited) (cont'd)
Independent Directors: (cont'd)
Name, Age and Address of
Independent Director | | Position(s)
Held with
Registrant | | Length of Time
Served* | | Principal Occupation(s) During Past 5 Years
and Other Relevant Professional Experience | | Number of
Portfolios in
Fund Complex
Overseen by
Independent
Director** | | Other Directorships
Held by Independent
Director*** | |
Jakki L. Haussler (59)
c/o Perkins Coie LLP
Counsel to the Independent Directors
30 Rockefeller Plaza
New York, NY 10112 | | Director | | Since
January
2015 | | Chairman and Chief Executive Officer, Opus Capital Group (since January 1996); formerly, Director, Capvest Venture Fund, LP (May 2000-December 2011); Partner, Adena Ventures, LP (July 1999-December 2010); Director, The Victory Funds (February 2005-July 2008). | | | 91 | | | Director of Cincinnati Bell Inc. and Member, Audit Committee and Compensation Committee; Director of Northern Kentucky University Foundation and Member, Investment Committee; Member of Chase College of Law Transactional Law Practice Center Board of Advisors; Director of Best Transport; Director of Chase College of Law Board of Visitors; formerly, Member, University of Cincinnati Foundation Investment Committee; Member, Miami University Board of Visitors (2008-2011); Trustee of Victory Funds (2005-2008) and Chairman, Investment Committee (2007-2008) and Member, Service Provider Committee (2005-2008). | |
Dr. Manuel H. Johnson (67)
c/o Johnson Smick
International, Inc.
220 I Street, N.E. — Suite 200
Washington, D.C. 20002 | | Director | | Since
July
1991 | | Senior Partner, Johnson Smick International, Inc. (consulting firm); Chairperson of the Investment Committee (since October 2006) and Director or Trustee of various Morgan Stanley Funds (since July 1991); Co-Chairman and a founder of the Group of Seven Council (G7C) (international economic commission); formerly, Chairperson of the Audit Committee (July 1991-September 2006), Vice Chairman of the Board of Governors of the Federal Reserve System and Assistant Secretary of the U.S. Treasury. | | | 91 | | | Director of NVR, Inc. (home construction). | |
Joseph J. Kearns (74)
c/o Kearns & Associates LLC
46 E Peninsula Center #385
Rolling Hills Estates, CA 90274-3712 | | Director | | Since
August
1994 | | President, Kearns & Associates LLC (investment consulting); Chairperson of the Audit Committee (since October 2006) and Director or Trustee of various Morgan Stanley Funds (since August 1994); formerly, Deputy Chairperson of the Audit Committee (July 2003-September 2006) and Chairperson of the Audit Committee of various Morgan Stanley Funds (since August 1994); CFO of the J. Paul Getty Trust. | | | 93 | | | Director of Electro Rent Corporation (equipment leasing). Prior to December 31, 2013, Director of The Ford Family Foundation. | |
47
Morgan Stanley Institutional Fund, Inc.
Annual Report — December 31, 2016
Director and Officer Information (unaudited) (cont'd)
Independent Directors: (cont'd)
Name, Age and Address of
Independent Director | | Position(s)
Held with
Registrant | | Length of Time
Served* | | Principal Occupation(s) During Past 5 Years
and Other Relevant Professional Experience | | Number of
Portfolios in
Fund Complex
Overseen by
Independent
Director** | | Other Directorships
Held by Independent
Director*** | |
Michael F. Klein (58)
c/o Perkins Coie LLP
Counsel to the Independent Directors
30 Rockefeller Plaza
New York, NY 10112 | | Director | | Since
August
2006 | | Managing Director, Aetos Capital, LLC (since March 2000); Co-President, Aetos Alternatives Management, LLC (since January 2004) and Co-Chief Executive Officer of Aetos Capital LLC (since August 2013); Chairperson of the Fixed Income Sub-Committee of the Investment Committee (since October 2006) and Director or Trustee of various Morgan Stanley Funds (since August 2006); formerly, Managing Director, Morgan Stanley & Co. Inc. and Morgan Stanley Dean Witter Investment Management, President, various Morgan Stanley Funds (June 1998-March 2000) and Principal, Morgan Stanley & Co. Inc. and Morgan Stanley Dean Witter Investment Management (August 1997-December 1999). | | | 90 | | | Director of certain investment funds managed or sponsored by Aetos Capital, LLC; Director of Sanitized AG and Sanitized Marketing AG (specialty chemicals). | |
Patricia Maleski (56)
c/o Perkins Coie LLP
Counsel to the Independent Directors
30 Rockefeller Plaza
New York, NY 10112 | | Director | | Since
January
2017 | | Management Director, JPMorgan Asset Management (2013-2016); President, JPMorgan Funds (2010-2013), Chief Administrative Officer, JPMorgan Funds (2004-2010), Treasurer, JPMorgan Funds (2003-2004, 2008-2010), and Vice President and Board Liaison, JPMorgan Funds (2001-2004); Managing Director, J.P. Morgan Investment Management Inc. (2001-2013); Vice President of Finance, Pierpont Group (1996-2001); Vice President, Bank of New York (1995-1996); Senior Audit Manager, Price Waterhouse, LLP (1982-1995). | | | 91 | | | None. | |
Michael E. Nugent (80)
522 Fifth Avenue
New York, NY 10036 | | Chair of the Board and Director | | Chair of the Boards since July 2006 and Director since July 1991 | | Chair of the Boards of various Morgan Stanley Funds (since July 2006); Chairperson of the Closed-End Fund Committee (since June 2012) and Director or Trustee of various Morgan Stanley Funds (since July 1991); formerly, Chairperson of the Insurance Committee (until July 2006); General Partner, Triumph Capital, L.P. (private investment partnership) (1988-2013). | | | 92 | | | None. | |
W. Allen Reed (69)
c/o Perkins Coie LLP
Counsel to the Independent Directors
30 Rockefeller Plaza
New York, NY 10112 | | Director | | Since
August
2006 | | Chairperson of the Equity Sub-Committee of the Investment Committee (since October 2006) and Director or Trustee of various Morgan Stanley Funds (since August 2006); formerly, President and CEO of General Motors Asset Management; Chairman and Chief Executive Officer of the GM Trust Bank and Corporate Vice President of General Motors Corporation (August 1994-December 2005). | | | 91 | | | Director of Legg Mason, Inc.; formerly, Director of the Auburn University Foundation (2010-2015). | |
Fergus Reid (84)
c/o Joe Pietryka, Inc.
85 Charles Colman Blvd.
Pawling, NY 12564 | | Director | | Since
June
1992 | | Chairman, Joe Pietryka, Inc.; Chairperson of the Governance Committee and Director or Trustee of various Morgan Stanley Funds (since June 1992). | | | 92 | | | Formerly, Trustee and Director of certain investment companies in the JP Morgan Fund Complex managed by JP Morgan Investment Management Inc. (1987-2012). | |
* This is the earliest date the Director began serving the Morgan Stanley Funds. Each Director serves an indefinite term, until his or her successor is elected.
** The Fund Complex includes (as of December 31, 2016) all open-end and closed-end funds (including all of their portfolios) advised by Morgan Stanley Investment Management Inc. (the "Adviser") and any funds that have an adviser that is an affiliated person of the Adviser (including, but not limited to, Morgan Stanley AIP GP LP).
*** This includes any directorships at public companies and registered investment companies held by the Director at any time during the past five years.
48
Morgan Stanley Institutional Fund, Inc.
Annual Report — December 31, 2016
Director and Officer Information (unaudited) (cont'd)
Executive Officers:
Name, Age and Address of Executive Officer | | Position(s)
Held with
Registrant | | Length of Time
Served* | | Principal Occupation(s) During Past 5 Years | |
John H. Gernon (53)
522 Fifth Avenue
New York, NY 10036 | | President and Principal Executive Officer | | Since
September
2013 | | President and Principal Executive Officer of the Equity and Fixed Income Funds and the Morgan Stanley AIP Funds (since September 2013) and the Liquidity Funds and various money market funds (since May 2014) in the Fund Complex; Managing Director of the Adviser; Head of Product (since 2006). | |
Timothy J. Knierim (58)
522 Fifth Avenue
New York, NY 10036 | | Chief Compliance Officer | | Since
December
2016 | | Managing Director of the Adviser and various entities affiliated with the Adviser; Chief Compliance Officer of various Morgan Stanley Funds and the Adviser (since December 2016) and Chief Compliance Officer of Morgan Stanley AIP GP LP (since 2014). Formerly, Managing Director and Deputy Chief Compliance Officer of the Adviser (2014-2016); and formerly, Chief Compliance Officer of Prudential Investment Management, Inc. (2007-2014). | |
Francis J. Smith (51)
522 Fifth Avenue
New York, NY 10036 | | Treasurer and Principal Financial Officer | | Treasurer since July 2003 and Principal Financial Officer since September 2002 | | Managing Director of the Adviser and various entities affiliated with the Adviser; Treasurer (since July 2003) and Principal Financial Officer of various Morgan Stanley Funds (since September 2002). | |
Mary E. Mullin (49)
522 Fifth Avenue
New York, NY 10036 | | Secretary | | Since
June
1999 | | Executive Director of the Adviser; Secretary of various Morgan Stanley Funds (since June 1999). | |
* This is the earliest date the officer began serving the Morgan Stanley Funds. Each officer serves a one-year term, until his or her successor is elected and qualifies.
49
Morgan Stanley Institutional Fund, Inc.
Annual Report — December 31, 2016
Adviser and Administrator
Morgan Stanley Investment Management Inc.
522 Fifth Avenue
New York, New York 10036
Distributor
Morgan Stanley Distribution, Inc.
522 Fifth Avenue
New York, New York 10036
Dividend Disbursing and Transfer Agent
Boston Financial Data Services, Inc.
2000 Crown Colony Drive
Quincy, Massachusetts 02169
Custodian
State Street Bank and Trust Company
One Lincoln Street
Boston, Massachusetts 02111
Legal Counsel
Dechert LLP
1095 Avenue of the Americas
New York, New York 10036
Counsel to the Independent Directors
Perkins Coie LLP
30 Rockefeller Plaza
New York, New York 10112
Independent Registered Public Accounting Firm
Ernst & Young LLP
200 Clarendon Street
Boston, Massachusetts 02116
Reporting to Shareholders
Each Morgan Stanley fund provides a complete schedule of portfolio holdings in its semi-annual and annual reports within 60 days of the end of the fund's second and fourth fiscal quarters. The semi-annual and annual reports are filed electronically with the Securities and Exchange Commission (SEC) on Form N-CSRS and Form N-CSR, respectively. Morgan Stanley also delivers the semi-annual and annual reports to fund shareholders and makes these reports available on its public website, www.morganstanley.com/im. Each Morgan Stanley fund also files a complete schedule of portfolio holdings with the SEC for the fund's first and third fiscal quarters on Form N-Q. Morgan Stanley does not deliver the reports for the first and third fiscal quarters to shareholders, nor are the reports posted to the Morgan Stanley public website. You may, however, obtain the Form N-Q filings (as well as the Form N-CSR and N-CSRS filings) by accessing the SEC's website, www.sec.gov. You may also review and copy them at the SEC's Public Reference Room in Washington, DC. Information on the operation of the SEC's Public Reference Room may be obtained by calling the SEC toll free at 1 (800) SEC-0330. You can also request copies of these materials, upon payment of a duplicating fee, by electronic request at the SEC's email address (publicinfo@sec.gov) or by writing the Public Reference Room of the SEC, 100 F Street, NE, Washington, DC 20549-0102.
Proxy Voting Policies and Procedures and Proxy Voting Record
You may obtain a copy of the Fund's Proxy Voting Policy and Procedures and information regarding how the Fund voted proxies relating to portfolio securities during the most recent twelve-month period ended June 30, without charge, upon request, by calling toll free 1 (800) 548-7786 or by visiting our website at www.morganstanley.com/im. This information is also available on the SEC's website at www.sec.gov.
This report is authorized for distribution only when preceded or accompanied by a prospectus or summary prospectus of the applicable Portfolio of Morgan Stanley Institutional Fund, Inc., which describes in detail the Portfolio's investment policies, risks, fees and expenses. Please read the prospectus carefully before you invest or send money. For additional information, including information regarding the investments comprising the Portfolio, please visit our website at www.morganstanley.com/im or call toll free 1 (800) 548-7786.
50
(This Page has been left blank intentionally.)
(This Page has been left blank intentionally.)
(This Page has been left blank intentionally.)
Printed in U.S.A.
This Report has been prepared for shareholders and may be distributed to others only if preceded or accompanied by a current prospectus.
Morgan Stanley Investment Management Inc.
522 Fifth Avenue
New York, New York 10036
© 2017 Morgan Stanley. Morgan Stanley Distribution, Inc.

IFIMAANN
1696284 EXP. 02.28.18

Morgan Stanley Institutional Fund, Inc.
Small Company Growth Portfolio
Annual Report
December 31, 2016

Morgan Stanley Institutional Fund, Inc.
Annual Report — December 31, 2016
Shareholders' Letter | | | 2 | | |
Expense Example | | | 3 | | |
Investment Overview | | | 4 | | |
Portfolio of Investments | | | 6 | | |
Statement of Assets and Liabilities | | | 9 | | |
Statement of Operations | | | 11 | | |
Statements of Changes in Net Assets | | | 12 | | |
Financial Highlights | | | 14 | | |
Notes to Financial Statements | | | 18 | | |
Report of Independent Registered Public Accounting Firm | | | 30 | | |
Federal Tax Notice | | | 31 | | |
Privacy Notice | | | 32 | | |
Director and Officer Information | | | 35 | | |
This report is authorized for distribution only when preceded or accompanied by a prospectus or summary prospectus of the applicable Portfolio of Morgan Stanley Institutional Fund, Inc. To receive a prospectus and/or statement of additional information (SAI), which contains more complete information such as investment objectives, charges, expenses, policies for voting proxies, risk considerations, and describes in detail each of the Portfolio's investment policies to the prospective investor, please call toll free 1 (800) 548-7786. Please read the prospectuses carefully before you invest or send money.
Additionally, you can access information about the Portfolio, including performance, characteristics, and investment team commentary, through Morgan Stanley Investment Management's website: www.morganstanley.com/im.
Market forecasts provided in this report may not necessarily come to pass. There is no guarantee that any sectors mentioned will continue to perform as discussed herein or that securities in such sectors will be held by the Portfolio in the future. There is no assurance that a Portfolio will achieve its investment objective. Portfolios are subject to market risk, which is the possibility that market values of securities owned by the Portfolio will decline and, therefore, the value of the Portfolio's shares may be less than what you paid for them. Accordingly, you can lose money investing in this Portfolio. Please see the prospectus for more complete information on investment risks.
1
Morgan Stanley Institutional Fund, Inc.
Annual Report — December 31, 2016
Shareholders' Letter (unaudited)
Dear Shareholders,
We are pleased to provide this Annual report, in which you will learn how your investment in Small Company Growth Portfolio (the "Portfolio") performed during the latest twelve-month period.
Morgan Stanley Investment Management is a client-centric, investor-led organization. Our global presence, intellectual capital, and breadth of products and services enable us to partner with investors to meet the evolving challenges of today's financial markets. We aim to deliver superior investment service and to empower our clients to make the informed decisions that help them reach their investment goals.
As always, we thank you for selecting Morgan Stanley Investment Management, and look forward to working with you in the months and years ahead.
Sincerely,

John H. Gernon
President and Principal Executive Officer
January 2017
2
Morgan Stanley Institutional Fund, Inc.
Annual Report — December 31, 2016
Expense Example (unaudited)
Small Company Growth Portfolio
As a shareholder of the Portfolio, you incur two types of costs: (1) transactional costs, including redemptions fees; and (2) ongoing costs, which may include advisory fees, administration fees, distribution and shareholder services fees and other Portfolio expenses. This example is intended to help you understand your ongoing costs (in dollars) of investing in the Portfolio and to compare these costs with the ongoing costs of investing in other mutual funds.
This example is based on an investment of $1,000 invested at the beginning of the six-month period ended December 31, 2016 and held for the entire six-month period.
Actual Expenses
The table below provides information about actual account values and actual expenses. You may use the information in this table, together with the amount you invested, to estimate the expenses that you paid over the period. Simply divide your account value by $1,000 (for example, an $8,600 account value divided by $1,000 = 8.6), then multiply the result by the number in the table under the heading entitled "Actual Expenses Paid During Period" to estimate the expenses you paid on your account during this period.
Hypothetical Example for Comparison Purposes
The table below provides information about hypothetical account values and hypothetical expenses based on the Portfolio's actual expense ratio and an assumed rate of return of 5% per year before expenses, which is not the Portfolio's actual return. The hypothetical account values and expenses may not be used to estimate the actual ending account balance or expenses you paid for the period. You may use this information to compare the ongoing costs of investing in the Portfolio and other funds. To do so, compare this 5% hypothetical example with the 5% hypothetical examples that appear in the shareholder reports of the other funds.
Please note that the expenses shown in the table are meant to highlight your ongoing costs only and do not reflect any transactional costs, such as sales charges (loads) and redemption fees. Therefore, the information for each class in the table is useful in comparing ongoing costs only, and will not help you determine the relative total costs of owning different funds. In addition, if these transactional costs were included, your costs would have been higher.
| | | Beginning
Account
Value
7/1/16 | | Actual Ending
Account
Value
12/31/16 | | Hypothetical
Ending Account
Value | | Actual
Expenses
Paid
During
Period* | | Hypothetical
Expenses Paid
During Period* | | Net
Expense
Ratio
During
Period** | |
Small Company Growth Portfolio Class I | | $ | 1,000.00 | | | $ | 1,011.90 | | | $ | 1,020.11 | | | $ | 5.06 | | | $ | 5.08 | | | | 1.00 | %*** | |
Small Company Growth Portfolio Class A | | | 1,000.00 | | | | 1,009.20 | | | | 1,018.45 | | | | 6.72 | | | | 6.75 | | | | 1.33 | *** | |
Small Company Growth Portfolio Class L | | | 1,000.00 | | | | 1,006.90 | | | | 1,015.84 | | | | 9.33 | | | | 9.37 | | | | 1.85 | *** | |
Small Company Growth Portfolio Class IS | | | 1,000.00 | | | | 1,011.90 | | | | 1,020.46 | | | | 4.70 | | | | 4.72 | | | | 0.93 | *** | |
* Expenses are calculated using each Portfolio Class' annualized net expense ratio (as disclosed), multiplied by the average account value over the period, and multiplied by 184/366 (to reflect the most recent one-half year period).
** Annualized.
*** Refer to Note F in the Notes to Financial Statements for discussion of prior period custodian out-of-pocket expenses that were reimbursed in the current period.
3
Morgan Stanley Institutional Fund, Inc.
Annual Report — December 31, 2016
Investment Overview (unaudited)
Small Company Growth Portfolio
The Portfolio seeks long-term capital appreciation by investing primarily in growth-oriented equity securities of small capitalization companies.
Performance
For the year ended December 31, 2016, the Portfolio's Class I shares had a total return based on net asset value and reinvestment of distributions per share of –0.35%, net of fees. The Portfolio's Class I shares underperformed the Portfolio's benchmark, the Russell 2000® Growth Index (the "Index"), which returned 11.32%.
Factors Affecting Performance
• The U.S. stock market was overwhelmed by negative news early in 2016 but staged a turnaround over the remainder of the year. Concerns about China's economy, falling oil prices and U.S. Federal Reserve ("Fed") monetary policy weighed heavily on the markets from January through mid-February. From there, oil prices stabilized, economic growth improved, corporate earnings recovered and the Fed refrained from raising interest rates (until its December 2016 meeting), which provided upside to stock prices. Two major political events, the U.K.'s "Brexit" referendum and the election of Donald Trump, were initially viewed as negative surprises, but volatility subsided fairly quickly. Anticipation of pro-growth fiscal policy from the new administration drove share prices sharply higher in the final weeks of the year.
• Within the universe of small-cap growth stocks, as represented by the Index, the materials, energy and industrials sectors were the top-performing sectors for the year, while health care (which had a negative return), utilities and consumer discretionary were the weakest performers.
• The long-term investment horizon and conviction-weighted investment approach embraced by the team since 1998 can result in periods of performance deviation from the benchmark and peers. In this reporting period, both stock selection and sector allocation detracted from the Portfolio's relative performance.
• The consumer discretionary and financials sectors had the largest negative impact, due to a combination of unfavorable stock selection and
disadvantageous sector allocations in the two sectors. The Portfolio was overweight in consumer discretionary and underweight in financials during the reporting period. Weak stock selection in the information technology sector also hampered performance, despite a small relative gain from an overweight allocation to the sector.
• The health care and industrials sectors aided relative performance. Stock selection in both sectors added to returns, as did an underweight in health care and an overweight in industrials.
Management Strategies
• There were no changes to our bottom-up investment process during the period. We continued to look for high-quality growth companies that we believe have these attributes: sustainable competitive advantages, above-average business visibility, rising return on invested capital, strong free cash flow generation and a favorable risk/reward profile. We find these companies through intense fundamental research. Our emphasis is on secular growth, and as a result short-term market events are not as meaningful in the stock selection process.
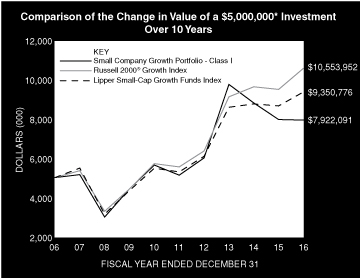
* Minimum Investment for Class I shares
In accordance with SEC regulations, the Portfolio's performance shown assumes that all recurring fees (including management fees) were deducted and all dividends and distributions were reinvested. The performance of Class A, L and IS shares will vary from the performance of Class I shares based upon their different inception dates and will be negatively impacted by additional fees assessed to those classes (if applicable).
4
Morgan Stanley Institutional Fund, Inc.
Annual Report — December 31, 2016
Investment Overview (unaudited) (cont'd)
Small Company Growth Portfolio
Performance Compared to the Russell 2000® Growth Index(1) and the Lipper Small-Cap Growth Funds Index(2)
| | | Period Ended December 31, 2016
Total Returns(3) | |
| | | | | Average Annual | |
| | | One
Year | | Five
Years | | Ten
Years | | Since
Inception(8) | |
Portfolio — Class I Shares
w/o sales charges(4) | | | –0.35 | | | | 9.11 | | | | 4.71 | | | | 10.15 | | |
Portfolio — Class A Shares
w/o sales charges(5) | | | –0.73 | | | | 8.76 | | | | 4.41 | | | | 8.93 | | |
Portfolio — Class A Shares with
maximum 5.25% sales charges(5) | | | –5.95 | | | | 7.60 | | | | 3.85 | | | | 8.65 | | |
Portfolio — Class L Shares
w/o sales charges(6) | | | –1.17 | | | | 8.22 | | | | — | | | | 7.24 | | |
Portfolio — Class IS Shares
w/o sales charges(7) | | | –0.28 | | | | — | | | | — | | | | –1.54 | | |
Russell 2000® Growth Index | | | 11.32 | | | | 13.74 | | | | 7.76 | | | | 7.71 | | |
Lipper Small-Cap Growth Funds Index | | | 8.19 | | | | 12.07 | | | | 6.46 | | | | 9.04 | | |
Performance data quoted represents past performance, which is no guarantee of future results, and current performance may be lower or higher than the figures shown. Performance assumes that all dividends and distributions, if any, were reinvested. For the most recent month-end performance figures, please visit www.morganstanley.com/im. Investment return and principal value will fluctuate so that Portfolio shares, when redeemed, may be worth more or less than their original cost. Total returns do not reflect the deduction of taxes that a shareholder would pay on Portfolio distributions or the redemption of Portfolio shares. Performance of share classes will vary due to difference in sales charges and expenses.
(1) The Russell 2000® Growth Index measures the performance of the small-cap growth segment of the U.S. equity universe. It includes those Russell 2000® Index companies with higher price-to-book ratios and higher forecasted growth values. The Russell 2000® Index is a subset of the Russell 3000® Index representing approximately 10% of the total market capitalization of that index. It includes approximately 2,000 of the smallest securities based on a combination of their market capitalization and current index membership. The Index is unmanaged and its returns do not include any sales charges or fees. Such costs would lower performance. It is not possible to invest directly in an index.
(2) The Lipper Small-Cap Growth Funds Index is an equally weighted performance index of the largest qualifying funds (based on net assets) in the Lipper Small-Cap Growth Funds classification. The Index, which is adjusted for capital gains distributions and income dividends, is unmanaged and should not be considered an investment. There are currently 30 funds represented in this Index. As of the date of this report, the Portfolio is in the Lipper Small-Cap Growth Funds classification.
(3) Total returns for the Portfolio reflect fees waived and expenses reimbursed, if applicable, by the Adviser. Without such waivers and reimbursements, total returns would have been lower.
(4) Commenced operations on November 1, 1989.
(5) Commenced offering on January 2, 1996.
(6) Commenced offering on November 11, 2011.
(7) Commenced offering on September 13, 2013.
(8) For comparative purposes, average annual since inception returns listed for the Indexes refer to the inception date of Class I of the Portfolio, not the inception of the Index.
5
Morgan Stanley Institutional Fund, Inc.
Annual Report — December 31, 2016
Portfolio of Investments
Small Company Growth Portfolio
| | | Shares | | Value
(000) | |
Common Stocks (85.0%) | |
Aerospace & Defense (4.1%) | |
BWX Technologies, Inc. | | | 787,046 | | | $ | 31,246 | | |
Biotechnology (1.5%) | |
Agios Pharmaceuticals, Inc. (a) | | | 37,069 | | | | 1,547 | | |
Alnylam Pharmaceuticals, Inc. (a) | | | 29,121 | | | | 1,090 | | |
Bellicum Pharmaceuticals, Inc. (a)(b) | | | 164,872 | | | | 2,246 | | |
Editas Medicine, Inc. (a)(b) | | | 101,360 | | | | 1,645 | | |
Intellia Therapeutics, Inc. (a)(b) | | | 122,887 | | | | 1,611 | | |
Intrexon Corp. (a)(b) | | | 108,530 | | | | 2,637 | | |
Juno Therapeutics, Inc. (a)(b) | | | 39,699 | | | | 748 | | |
| | | | 11,524 | | |
Capital Markets (1.1%) | |
WisdomTree Investments, Inc. (b) | | | 730,803 | | | | 8,141 | | |
Consumer Finance (0.9%) | |
LendingClub Corp. (a) | | | 1,275,503 | | | | 6,696 | | |
Electronic Equipment, Instruments & Components (0.9%) | |
Cognex Corp. | | | 59,690 | | | | 3,797 | | |
FARO Technologies, Inc. (a) | | | 85,156 | | | | 3,066 | | |
| | | | 6,863 | | |
Health Care Equipment & Supplies (1.0%) | |
Penumbra, Inc. (a) | | | 116,368 | | | | 7,424 | | |
Health Care Providers & Services (3.0%) | |
HealthEquity, Inc. (a) | | | 564,200 | | | | 22,861 | | |
Health Care Technology (10.7%) | |
athenahealth, Inc. (a) | | | 355,401 | | | | 37,378 | | |
Castlight Health, Inc., Class B (a)(b) | | | 891,819 | | | | 4,414 | | |
Cotiviti Holdings, Inc. (a) | | | 476,245 | | | | 16,383 | | |
Veeva Systems, Inc., Class A (a) | | | 561,405 | | | | 22,849 | | |
| | | | 81,024 | | |
Hotels, Restaurants & Leisure (12.7%) | |
BJ's Restaurants, Inc. (a) | | | 189,801 | | | | 7,459 | | |
Fiesta Restaurant Group, Inc. (a) | | | 730,039 | | | | 21,792 | | |
Habit Restaurants, Inc. (The) (a)(b) | | | 465,348 | | | | 8,027 | | |
Shake Shack, Inc., Class A (a)(b) | | | 927,394 | | | | 33,192 | | |
Wingstop, Inc. | | | 206,395 | | | | 6,107 | | |
Zoe's Kitchen, Inc. (a)(b) | | | 805,204 | | | | 19,317 | | |
| | | | 95,894 | | |
Internet & Direct Marketing Retail (3.2%) | |
Etsy, Inc. (a) | | | 524,219 | | | | 6,175 | | |
MakeMyTrip Ltd. (India) (a) | | | 227,008 | | | | 5,040 | | |
Shutterfly, Inc. (a) | | | 129,720 | | | | 6,510 | | |
Wayfair, Inc., Class A (a)(b) | | | 190,879 | | | | 6,690 | | |
| | | | 24,415 | | |
Internet Software & Services (18.1%) | |
Angie's List, Inc. (a) | | | 414,946 | | | | 3,415 | | |
Benefitfocus, Inc. (a) | | | 190,749 | | | | 5,665 | | |
Coupa Software, Inc. (a)(b) | | | 260,108 | | | | 6,505 | | |
Criteo SA ADR (France) (a) | | | 474,445 | | | | 19,490 | | |
GrubHub, Inc. (a) | | | 721,737 | | | | 27,152 | | |
Just Eat PLC (United Kingdom) (a) | | | 1,380,499 | | | | 9,927 | | |
| | | Shares | | Value
(000) | |
New Relic, Inc. (a) | | | 225,076 | | | $ | 6,358 | | |
Shutterstock, Inc. (a) | | | 397,589 | | | | 18,893 | | |
Twitter, Inc. (a) | | | 517,786 | | | | 8,440 | | |
Yelp, Inc. (a) | | | 204,398 | | | | 7,794 | | |
Zillow Group, Inc., Class A (a) | | | 213,155 | | | | 7,770 | | |
Zillow Group, Inc., Class C (a) | | | 428,756 | | | | 15,637 | | |
| | | | 137,046 | | |
Machinery (5.7%) | |
Manitowoc Foodservice, Inc. (a) | | | 1,149,437 | | | | 22,219 | | |
Terex Corp. | | | 654,554 | | | | 20,638 | | |
| | | | 42,857 | | |
Multi-line Retail (2.0%) | |
Ollie's Bargain Outlet Holdings, Inc. (a) | | | 533,339 | | | | 15,174 | | |
Multi-Utilities (0.0%) | |
AET&D Holdings No. 1 Ltd. (Australia) (a)(c) | | | 6,682,555 | | | | — | | |
Personal Products (0.3%) | |
elf Beauty, Inc. (a) | | | 77,077 | | | | 2,231 | | |
Professional Services (6.4%) | |
Advisory Board Co. (The) (a) | | | 533,282 | | | | 17,732 | | |
CEB, Inc. | | | 300,940 | | | | 18,237 | | |
WageWorks, Inc. (a) | | | 172,209 | | | | 12,485 | | |
| | | | 48,454 | | |
Software (9.5%) | |
Ellie Mae, Inc. (a) | | | 284,864 | | | | 23,838 | | |
Guidewire Software, Inc. (a) | | | 449,451 | | | | 22,171 | | |
HubSpot, Inc. (a) | | | 138,954 | | | | 6,531 | | |
Take-Two Interactive Software, Inc. (a) | | | 143,403 | | | | 7,068 | | |
Xero Ltd. (Australia) (a) | | | 255,081 | | | | 3,101 | | |
Zendesk, Inc. (a) | | | 438,318 | | | | 9,292 | | |
| | | | 72,001 | | |
Specialty Retail (3.9%) | |
Five Below, Inc. (a) | | | 746,626 | | | | 29,835 | | |
Total Common Stocks (Cost $544,068) | | | 643,686 | | |
Preferred Stocks (8.2%) | |
Health Care Technology (0.7%) | |
Grand Rounds, Inc. Series B (a)(c)(d)(e)
(acquisition cost — $3,362;
acquired 7/3/14) | | | 3,269,139 | | | | 5,492 | | |
Hotels, Restaurants & Leisure (2.1%) | |
Blue Bottle Coffee, Inc. Series B (a)(c)(d)(e)
(acquisition cost — $13,714;
acquired 1/24/14) | | | 947,792 | | | | 15,648 | | |
Internet & Direct Marketing Retail (2.8%) | |
Flipkart Online Services Pvt Ltd.
Series D (a)(c)(d)(e)
(acquisition cost — $9,579;
acquired 10/4/13) | | | 417,464 | | | | 21,086 | | |
Internet Software & Services (0.9%) | |
Doximity, Inc. Series C (a)(c)(d)(e)
(acquisition cost — $8,482;
acquired 4/10/14) | | | 1,759,434 | | | | 7,090 | | |
The accompanying notes are an integral part of the financial statements.
6
Morgan Stanley Institutional Fund, Inc.
Annual Report — December 31, 2016
Portfolio of Investments (cont'd)
Small Company Growth Portfolio
| | | Shares | | Value
(000) | |
Internet Software & Services (cont'd) | |
Mode Media Corporation Series M-1 (a)(c)(d)(e)
(acquisition cost — $5,449;
acquired 3/19/08) | | | 361,920 | | | $ | — | | |
Mode Media Corporation Escrow
Series M-1 (a)(c)(d)(e)
(acquisition cost — $506; acquired 3/19/08) | | | 51,702 | | | | — | | |
| | | | 7,090 | | |
Software (1.7%) | |
DOMO, Inc. (a)(c)(d)(e)
(acquisition cost — $10,559;
acquired 1/31/14 — 2/7/14) | | | 2,554,715 | | | | 9,274 | | |
Lookout, Inc. Series F (a)(c)(d)(e)
(acquisition cost — $13,476;
acquired 6/17/14) | | | 1,179,743 | | | | 3,610 | | |
| | | | 12,884 | | |
Tobacco (0.0%) | |
NJOY, Inc. Series D (a)(c)(d)(e)
(acquisition cost — $6,363;
acquired 2/14/14) | | | 375,918 | | | | — | | |
Total Preferred Stocks (Cost $71,490) | | | 62,200 | | |
| | | Face
Amount
(000) | | | |
Promissory Notes (0.0%) | |
Internet Software & Services (0.0%) | |
Mode Media Corporation
9.00%, 12/3/19 (a)(c)(d)(e)
(acquisition cost — $2,301;
acquired 3/19/08) | | $ | 793 | | | | — | | |
Mode Media Corporation Escrow
9.00%, 12/3/19 (a)(c)(d)(e)
(acquisition cost — $38; acquired 3/19/08) | | | 29 | | | | — | | |
Total Promissory Notes (Cost $2,339) | | | — | | |
| | | Notional
Amount
(000) | | | |
Call Option Purchased (0.1%) | |
Foreign Currency Option (0.1%) | |
USD/CNY May 2017 @ CNY 7.90,
Royal Bank of Scotland (Cost $460) | | $ | 112,397 | | | | 420 | | |
| | | Shares | | | |
Short-Term Investments (13.0%) | |
Securities held as Collateral on Loaned Securities (6.0%) | |
Investment Company (4.8%) | |
Morgan Stanley Institutional Liquidity
Funds — Treasury Securities Portfolio —
Institutional Class (See Note G) | | | 36,461,263 | | | | 36,461 | | |
| | | Face
Amount
(000) | | Value
(000) | |
Repurchase Agreements (1.2%) | |
Merrill Lynch & Co., Inc., (0.50%,
dated 12/30/16, due 1/3/17;
proceeds $3,437; fully collateralized
by U.S. Government agency securities;
2.88% — 4.60%
due 11/20/65 - 11/20/66;
valued at $3,506) | | $ | 3,437 | | | $ | 3,437 | | |
Merrill Lynch & Co., Inc., (0.50%,
dated 12/30/16, due 1/3/17;
proceeds $688; fully collateralized
by a U.S. Government obligation;
1.88% due 8/31/22;
valued at $701) | | | 688 | | | | 688 | | |
Merrill Lynch & Co., Inc., (0.81%,
dated 12/30/16, due 1/3/17;
proceeds $5,156; fully collateralized
by Exchange Traded Funds;
valued at $5,671) | | | 5,156 | | | | 5,156 | | |
| | | | 9,281 | | |
Total Securities held as Collateral on Loaned
Securities (Cost $45,742) | | | 45,742 | | |
| | | Shares | | | |
Investment Company (7.0%) | |
Morgan Stanley Institutional Liquidity
Funds — Treasury Securities Portfolio —
Institutional Class (See Note G)
(Cost $52,797) | | | 52,797,242 | | | | 52,797 | | |
Total Short-Term Investments (Cost $98,539) | | | 98,539 | | |
Total Investments (106.3%) (Cost $716,896)
Including $45,802 of Securities Loaned (f) | | | 804,845 | | |
Liabilities in Excess of Other Assets (–6.3%) | | | (47,926 | ) | |
Net Assets (100.0%) | | $ | 756,919 | | |
(a) Non-income producing security.
(b) All or a portion of this security was on loan at December 31, 2016.
(c) Security has been deemed illiquid at December 31, 2016.
(d) At December 31, 2016, the Portfolio held fair valued securities valued at approximately $62,200,000, representing 8.2% of net assets. These securities have been fair valued as determined in good faith under procedures established by and under the general supervision of the Fund's Directors.
(e) Security cannot be offered for public resale without first being registered under the Securities Act of 1933 and related rules ("restricted security"). Acquisition date represents the day on which an enforceable right to acquire such security is obtained and is presented along with related cost in the security description. The Portfolio has registration rights for certain restricted securities. Any costs related to such registration are borne by the issuer. The aggregate value of restricted securities (excluding 144A holdings) at December 31, 2016, amounts to approximately $62,200,000 and represents 8.2% of net assets.
The accompanying notes are an integral part of the financial statements.
7
Morgan Stanley Institutional Fund, Inc.
Annual Report — December 31, 2016
Portfolio of Investments (cont'd)
Small Company Growth Portfolio
(f) At December 31, 2016, the aggregate cost for federal income tax purposes is approximately $739,957,000. The aggregate gross unrealized appreciation is approximately $107,168,000 and the aggregate gross unrealized depreciation is approximately $42,280,000, resulting in net unrealized appreciation of approximately $64,888,000.
ADR American Depositary Receipt.
CNY Chinese Yuan Renminbi
USD United States Dollar
Portfolio Composition*
Classification | | Percentage of
Total Investments | |
Internet Software & Services | | | 19.0 | % | |
Other** | | | 18.8 | | |
Hotels, Restaurants & Leisure | | | 14.7 | | |
Health Care Technology | | | 11.4 | | |
Software | | | 11.2 | | |
Short-Term Investments | | | 6.9 | | |
Professional Services | | | 6.4 | | |
Internet & Direct Marketing Retail | | | 6.0 | | |
Machinery | | | 5.6 | | |
Total Investments | | | 100.0 | % | |
* Percentages indicated are based upon total investments (excluding Securities held as Collateral on Loaned Securities) as of December 31, 2016.
** Industries and/or investment types representing less than 5% of total investments.
The accompanying notes are an integral part of the financial statements.
8
Morgan Stanley Institutional Fund, Inc.
Annual Report — December 31, 2016
Small Company Growth Portfolio
Statement of Assets and Liabilities | | December 31, 2016
(000) | |
Assets: | |
Investments in Securities of Unaffiliated Issuers, at Value(1) (Cost $627,638) | | $ | 715,587 | | |
Investment in Security of Affiliated Issuer, at Value (Cost $89,258) | | | 89,258 | | |
Total Investments in Securities, at Value (Cost $716,896) | | | 804,845 | | |
Cash | | | 72 | | |
Receivable for Portfolio Shares Sold | | | 1,147 | | |
Dividends Receivable | | | 377 | | |
Interest Receivable | | | 148 | | |
Receivable from Affiliate | | | 8 | | |
Other Assets | | | 99 | | |
Total Assets | | | 806,696 | | |
Liabilities: | |
Collateral on Securities Loaned, at Value | | | 45,814 | | |
Payable for Advisory Fees | | | 1,815 | | |
Payable for Portfolio Shares Redeemed | | | 1,355 | | |
Due to Broker | | | 370 | | |
Payable for Sub Transfer Agency Fees — Class I | | | 131 | | |
Payable for Sub Transfer Agency Fees — Class A | | | 40 | | |
Payable for Sub Transfer Agency Fees — Class L | | | 1 | | |
Payable for Administration Fees | | | 53 | | |
Payable for Professional Fees | | | 46 | | |
Payable for Shareholder Services Fees — Class A | | | 20 | | |
Payable for Distribution and Shareholder Services Fees — Class L | | | 1 | | |
Payable for Directors' Fees and Expenses | | | 14 | | |
Payable for Custodian Fees | | | 12 | | |
Payable for Transfer Agency Fees — Class I | | | 5 | | |
Payable for Transfer Agency Fees — Class A | | | 5 | | |
Payable for Transfer Agency Fees — Class L | | | 1 | | |
Payable for Transfer Agency Fees — Class IS | | | 1 | | |
Other Liabilities | | | 93 | | |
Total Liabilities | | | 49,777 | | |
Net Assets | | $ | 756,919 | | |
Net Assets Consist Of: | |
Paid-in-Capital | | $ | 648,481 | | |
Accumulated Net Investment Loss | | | (573 | ) | |
Accumulated Net Realized Gain | | | 21,062 | | |
Unrealized Appreciation (Depreciation) on: | |
Investments | | | 87,949 | | |
Foreign Currency Translations | | | (— | @) | |
Net Assets | | $ | 756,919 | | |
The accompanying notes are an integral part of the financial statements.
9
Morgan Stanley Institutional Fund, Inc.
Annual Report — December 31, 2016
Small Company Growth Portfolio
Statement of Assets and Liabilities (cont'd) | | December 31, 2016
(000) | |
CLASS I: | |
Net Assets | | $ | 305,945 | | |
| Shares Outstanding $0.001 par value shares of beneficial interest (unlimited shares authorized) (not in 000's) | | | 23,077,681 | | |
Net Asset Value, Offering and Redemption Price Per Share | | $ | 13.26 | | |
CLASS A: | |
Net Assets | | $ | 87,864 | | |
| Shares Outstanding $0.001 par value shares of beneficial interest (unlimited shares authorized) (not in 000's) | | | 7,494,652 | | |
Net Asset Value, Redemption Price Per Share | | $ | 11.72 | | |
Maximum Sales Load | | | 5.25 | % | |
Maximum Sales Charge | | $ | 0.65 | | |
Maximum Offering Price Per Share | | $ | 12.37 | | |
CLASS L: | |
Net Assets | | $ | 1,524 | | |
| Shares Outstanding $0.001 par value shares of beneficial interest (unlimited shares authorized) (not in 000's) | | | 134,415 | | |
Net Asset Value, Offering and Redemption Price Per Share | | $ | 11.34 | | |
CLASS IS: | |
Net Assets | | $ | 361,586 | | |
| Shares Outstanding $0.001 par value shares of beneficial interest (unlimited shares authorized) (not in 000's) | | | 27,204,261 | | |
Net Asset Value, Offering and Redemption Price Per Share | | $ | 13.29 | | |
(1) Including:
Securities on Loan, at Value: | | $ | 45,802 | | |
@ Amount is less than $500.
The accompanying notes are an integral part of the financial statements.
10
Morgan Stanley Institutional Fund, Inc.
Annual Report — December 31, 2016
Small Company Growth Portfolio
Statement of Operations | | Year Ended
December 31, 2016
(000) | |
Investment Income: | |
Income from Securities Loaned — Net | | $ | 7,124 | | |
Dividends from Securities of Unaffiliated Issuers | | | 3,770 | | |
Dividends from Securities of Affiliated Issuer (Note G) | | | 122 | | |
Total Investment Income | | | 11,016 | | |
Expenses: | |
Advisory Fees (Note B) | | | 9,730 | | |
Sub Transfer Agency Fees — Class I | | | 683 | | |
Sub Transfer Agency Fees — Class A | | | 174 | | |
Sub Transfer Agency Fees — Class L | | | 5 | | |
Administration Fees (Note C) | | | 852 | | |
Shareholder Services Fees — Class A (Note D) | | | 286 | | |
Distribution and Shareholder Services Fees — Class L (Note D) | | | 12 | | |
Professional Fees | | | 97 | | |
Registration Fees | | | 94 | | |
Shareholder Reporting Fees | | | 79 | | |
Custodian Fees (Note F) | | | 73 | | |
Transfer Agency Fees — Class I (Note E) | | | 21 | | |
Transfer Agency Fees — Class A (Note E) | | | 19 | | |
Transfer Agency Fees — Class L (Note E) | | | 3 | | |
Transfer Agency Fees — Class IS (Note E) | | | 4 | | |
Directors' Fees and Expenses | | | 30 | | |
Pricing Fees | | | 6 | | |
Other Expenses | | | 46 | | |
Total Expenses | | | 12,214 | | |
Waiver of Advisory Fees (Note B) | | | (765 | ) | |
Reimbursement of Class Specific Expenses — Class I (Note B) | | | (351 | ) | |
Reimbursement of Class Specific Expenses — Class A (Note B) | | | (6 | ) | |
Reimbursement of Class Specific Expenses — Class L (Note B) | | | (4 | ) | |
Reimbursement of Class Specific Expenses — Class IS (Note B) | | | (3 | ) | |
Rebate from Morgan Stanley Affiliate (Note G) | | | (52 | ) | |
Reimbursement of Custodian Fees (Note F) | | | (43 | ) | |
Net Expenses | | | 10,990 | | |
Net Investment Income | | | 26 | | |
Realized Gain: | |
Investments Sold | | | 52,252 | | |
Foreign Currency Transactions | | | 10 | | |
Net Realized Gain | | | 52,262 | | |
Change in Unrealized Appreciation (Depreciation): | |
Investments | | | (85,970 | ) | |
Foreign Currency Translations | | | — | @ | |
Net Change in Unrealized Appreciation (Depreciation) | | | (85,970 | ) | |
Net Realized Gain and Change in Unrealized Appreciation (Depreciation) | | | (33,708 | ) | |
Net Decrease in Net Assets Resulting from Operations | | $ | (33,682 | ) | |
@ Amount is less than $500.
The accompanying notes are an integral part of the financial statements.
11
Morgan Stanley Institutional Fund, Inc.
Annual Report — December 31, 2016
Small Company Growth Portfolio
Statements of Changes in Net Assets | | Year Ended
December 31, 2016
(000) | | Year Ended
December 31, 2015
(000) | |
Increase (Decrease) in Net Assets: | |
Operations: | |
Net Investment Income (Loss) | | $ | 26 | | | $ | (5,406 | ) | |
Net Realized Gain | | | 52,262 | | | | 118,987 | | |
Net Change in Unrealized Appreciation (Depreciation) | | | (85,970 | ) | | | (280,693 | ) | |
Net Decrease in Net Assets Resulting from Operations | | | (33,682 | ) | | | (167,112 | ) | |
Distributions from and/or in Excess of: | |
Class I: | |
Net Realized Gain | | | (13,037 | ) | | | (63,449 | ) | |
Class A: | |
Net Realized Gain | | | (3,815 | ) | | | (12,300 | ) | |
Class L: | |
Net Realized Gain | | | (61 | ) | | | (174 | ) | |
Class IS: | |
Net Realized Gain | | | (12,878 | ) | | | (50,360 | ) | |
Total Distributions | | | (29,791 | ) | | | (126,283 | ) | |
Capital Share Transactions:(1) | |
Class I: | |
Subscribed | | | 66,765 | | | | 118,065 | | |
Distributions Reinvested | | | 11,844 | | | | 53,646 | | |
Redeemed | | | (467,089 | ) | | | (462,723 | ) | |
Class A: | |
Subscribed | | | 9,837 | | | | 16,043 | | |
Distributions Reinvested | | | 3,802 | | | | 12,255 | | |
Redeemed | | | (57,910 | ) | | | (50,786 | ) | |
Class L: | |
Subscribed | | | — | | | | 9 | | |
Distributions Reinvested | | | 61 | | | | 173 | | |
Redeemed | | | (323 | ) | | | (290 | ) | |
Class IS: | |
Subscribed | | | 47,147 | | | | 250,791 | | |
Distributions Reinvested | | | 12,801 | | | | 49,812 | | |
Redeemed | | | (323,566 | ) | | | (194,000 | ) | |
Net Decrease in Net Assets Resulting from Capital Share Transactions | | | (696,631 | ) | | | (207,005 | ) | |
Redemption Fees | | | 8 | | | | 41 | | |
Total Decrease in Net Assets | | | (760,096 | ) | | | (500,359 | ) | |
Net Assets: | |
Beginning of Period | | | 1,517,015 | | | | 2,017,374 | | |
End of Period (Including Accumulated Net Investment Loss of $(573) and $(1,142)) | | $ | 756,919 | | | $ | 1,517,015 | | |
The accompanying notes are an integral part of the financial statements.
12
Morgan Stanley Institutional Fund, Inc.
Annual Report — December 31, 2016
Small Company Growth Portfolio
Statements of Changes in Net Assets (cont'd) | | Year Ended
December 31, 2016
(000) | | Year Ended
December 31, 2015
(000) | |
(1) Capital Share Transactions: | |
Class I: | |
Shares Subscribed | | | 5,147 | | | | 7,216 | | |
Shares Issued on Distributions Reinvested | | | 889 | | | | 3,848 | | |
Shares Redeemed | | | (35,214 | ) | | | (28,933 | ) | |
Net Decrease in Class I Shares Outstanding | | | (29,178 | ) | | | (17,869 | ) | |
Class A: | |
Shares Subscribed | | | 856 | | | | 1,079 | | |
Shares Issued on Distributions Reinvested | | | 322 | | | | 986 | | |
Shares Redeemed | | | (4,837 | ) | | | (3,426 | ) | |
Net Decrease in Class A Shares Outstanding | | | (3,659 | ) | | | (1,361 | ) | |
Class L: | |
Shares Subscribed | | | — | | | | 1 | | |
Shares Issued on Distributions Reinvested | | | 5 | | | | 14 | | |
Shares Redeemed | | | (28 | ) | | | (20 | ) | |
Net Decrease in Class L Shares Outstanding | | | (23 | ) | | | (5 | ) | |
Class IS: | |
Shares Subscribed | | | 3,684 | | | | 15,424 | | |
Shares Issued on Distributions Reinvested | | | 958 | | | | 3,570 | | |
Shares Redeemed | | | (25,375 | ) | | | (11,750 | ) | |
Net Increase (Decrease) in Class IS Shares Outstanding | | | (20,733 | ) | | | 7,244 | | |
The accompanying notes are an integral part of the financial statements.
13
Morgan Stanley Institutional Fund, Inc.
Annual Report — December 31, 2016
Financial Highlights
Small Company Growth Portfolio
| | | Class I | |
| | | Year Ended December 31, | |
Selected Per Share Data and Ratios | | 2016(1) | | 2015 | | 2014 | | 2013 | | 2012 | |
Net Asset Value, Beginning of Period | | $ | 13.75 | | | $ | 16.50 | | | $ | 20.55 | | | $ | 14.16 | | | $ | 12.64 | | |
Income (Loss) from Investment Operations: | |
Net Investment Income (Loss) (2) | | | 0.00 | (3) | | | (0.05 | ) | | | (0.06 | ) | | | (0.09 | ) | | | (0.03 | ) | |
Net Realized and Unrealized Gain (Loss) | | | (0.05 | ) | | | (1.51 | ) | | | (2.04 | ) | | | 8.77 | | | | 2.19 | | |
Total from Investment Operations | | | (0.05 | ) | | | (1.56 | ) | | | (2.10 | ) | | | 8.68 | | | | 2.16 | | |
Distributions from and/or in Excess of: | |
Net Realized Gain | | | (0.44 | ) | | | (1.19 | ) | | | (1.95 | ) | | | (2.29 | ) | | | (0.64 | ) | |
Redemption Fees | | | 0.00 | (3) | | | 0.00 | (3) | | | 0.00 | (3) | | | 0.00 | (3) | | | 0.00 | (3) | |
Net Asset Value, End of Period | | $ | 13.26 | | | $ | 13.75 | | | $ | 16.50 | | | $ | 20.55 | | | $ | 14.16 | | |
Total Return (4) | | | (0.35 | )% | | | (9.58 | )% | | | (9.68 | )% | | | 62.26 | % | | | 17.10 | % | |
Ratios and Supplemental Data: | |
Net Assets, End of Period (Thousands) | | $ | 305,945 | | | $ | 718,386 | | | $ | 1,156,812 | | | $ | 2,017,558 | | | $ | 1,143,640 | | |
Ratio of Expenses to Average Net Assets (8) | | | 1.02 | %(5)(6) | | | 1.05 | %(5) | | | 1.05 | %(5) | | | 1.04 | %(5) | | | 1.05 | %(5) | |
Ratio of Net Investment Income (Loss) to Average Net Assets (8) | | | 0.02 | %(5) | | | (0.29 | )%(5) | | | (0.34 | )%(5) | | | (0.49 | )%(5) | | | (0.20 | )%(5) | |
Ratio of Rebate from Morgan Stanley Affiliates to Average Net Assets | | | 0.00 | %(7) | | | 0.00 | %(7) | | | 0.00 | %(7) | | | 0.01 | % | | | 0.00 | %(7) | |
Portfolio Turnover Rate | | | 51 | % | | | 42 | % | | | 53 | % | | | 43 | % | | | 22 | % | |
(8) Supplemental Information on the Ratios to Average Net Assets: | |
Ratios Before Expense Limitation: | |
Expenses to Average Net Assets | | | 1.17 | % | | | 1.11 | % | | | 1.13 | % | | | 1.08 | % | | | 1.12 | % | |
Net Investment Loss to Average Net Assets | | | (0.13 | )% | | | (0.35 | )% | | | (0.42 | )% | | | (0.53 | )% | | | (0.27 | )% | |
(1) Refer to Note F in the Notes to Financial Statements for discussion of prior period custodian out-of-pocket expenses that were reimbursed in the current period. The amount of the reimbursement was immaterial on a per share basis and did not impact the total return of Class I shares. The Ratio of Expenses to Average Net Assets and the Ratio of Net Investment Income to Average Net Assets would be unchanged as the reimbursement of custodian fees was offset against current period expense waivers/reimbursements with no impact to net expenses or net investment income.
(2) Per share amount is based on average shares outstanding.
(3) Amount is less than $0.005 per share.
(4) Calculated based on the net asset value as of the last business day of the period.
(5) The Ratios of Expenses and Net Investment Income (Loss) reflect the rebate of certain Portfolio expenses in connection with the investments in Morgan Stanley affiliates during the period. The effect of the rebate on the ratios is disclosed in the above table as "Ratio of Rebate from Morgan Stanley Affiliates to Average Net Assets."
(6) Effective July 1, 2016, the Adviser has agreed to limit the ratio of expenses to average net assets to the maximum ratio of 1.00% for Class I shares. Prior to July 1, 2016, the maximum ratio was 1.05% for Class I shares.
(7) Amount is less than 0.005%.
The accompanying notes are an integral part of the financial statements.
14
Morgan Stanley Institutional Fund, Inc.
Annual Report — December 31, 2016
Financial Highlights
Small Company Growth Portfolio
| | | Class A | |
| | | Year Ended December 31, | |
Selected Per Share Data and Ratios | | 2016(1) | | 2015 | | 2014 | | 2013 | | 2012 | |
Net Asset Value, Beginning of Period | | $ | 12.25 | | | $ | 14.89 | | | $ | 18.83 | | | $ | 13.13 | | | $ | 11.80 | | |
Income (Loss) from Investment Operations: | |
Net Investment Loss (2) | | | (0.04 | ) | | | (0.09 | ) | | | (0.11 | ) | | | (0.13 | ) | | | (0.06 | ) | |
Net Realized and Unrealized Gain (Loss) | | | (0.05 | ) | | | (1.36 | ) | | | (1.88 | ) | | | 8.12 | | | | 2.03 | | |
Total from Investment Operations | | | (0.09 | ) | | | (1.45 | ) | | | (1.99 | ) | | | 7.99 | | | | 1.97 | | |
Distributions from and/or in Excess of: | |
Net Realized Gain | | | (0.44 | ) | | | (1.19 | ) | | | (1.95 | ) | | | (2.29 | ) | | | (0.64 | ) | |
Redemption Fees | | | 0.00 | (3) | | | 0.00 | (3) | | | 0.00 | (3) | | | 0.00 | (3) | | | 0.00 | (3) | |
Net Asset Value, End of Period | | $ | 11.72 | | | $ | 12.25 | | | $ | 14.89 | | | $ | 18.83 | | | $ | 13.13 | | |
Total Return (4) | | | (0.73 | )% | | | (9.88 | )% | | | (9.98 | )% | | | 61.88 | % | | | 16.70 | % | |
Ratios and Supplemental Data: | |
Net Assets, End of Period (Thousands) | | $ | 87,864 | | | $ | 136,621 | | | $ | 186,307 | | | $ | 282,632 | | | $ | 156,824 | | |
Ratio of Expenses to Average Net Assets (9) | | | 1.37 | %(5)(7) | | | 1.37 | %(5) | | | 1.38 | %(5) | | | 1.31 | %(5)(6) | | | 1.30 | %(5) | |
Ratio of Net Investment Loss to Average Net Assets (9) | | | (0.35 | )%(5) | | | (0.61 | )%(5) | | | (0.67 | )%(5) | | | (0.75 | )%(5) | | | (0.45 | )%(5) | |
Ratio of Rebate from Morgan Stanley Affiliates to Average Net Assets | | | 0.00 | %(8) | | | 0.00 | %(8) | | | 0.00 | %(8) | | | 0.01 | % | | | 0.00 | %(8) | |
Portfolio Turnover Rate | | | 51 | %(4) | | | 42 | % | | | 53 | % | | | 43 | % | | | 22 | % | |
(9) Supplemental Information on the Ratios to Average Net Assets: | |
Ratios Before Expense Limitation: | |
Expenses to Average Net Assets | | | 1.45 | % | | | 1.38 | % | | | N/A | | | | 1.35 | % | | | 1.37 | % | |
Net Investment Loss to Average Net Assets | | | (0.43 | )% | | | (0.62 | )% | | | N/A | | | | (0.79 | )% | | | (0.52 | )% | |
(1) Refer to Note F in the Notes to Financial Statements for discussion of prior period custodian out-of-pocket expenses that were reimbursed in the current period. The amount of the reimbursement was immaterial on a per share basis and did not impact the total return of Class A shares. The Ratio of Expenses to Average Net Assets and the Ratio of Net Investment Loss to Average Net Assets would be unchanged as the reimbursement of custodian fees was offset against current period expense waivers/reimbursements with no impact to net expenses or net investment loss.
(2) Per share amount is based on average shares outstanding.
(3) Amount is less than $0.005 per share.
(4) Calculated based on the net asset value which does not reflect sales charges, if applicable, as of the last business day of the period.
(5) The Ratios of Expenses and Net Investment Loss reflect the rebate of certain Portfolio expenses in connection with the investments in Morgan Stanley affiliates during the period. The effect of the rebate on the ratios is disclosed in the above table as "Ratio of Rebate from Morgan Stanley Affiliates to Average Net Assets."
(6) Effective September 16, 2013, the Adviser has agreed to limit the ratio of expenses to average net assets to the maximum ratio of 1.40% for Class A shares. Prior to September 16, 2013, the maximum ratio was 1.30% for Class A shares.
(7) Effective July 1, 2016, the Adviser has agreed to limit the ratio of expenses to average net assets to the maximum ratio of 1.35% for Class A shares. Prior to July 1, 2016, the maximum ratio was 1.40% for Class A shares.
(8) Amount is less than 0.005%.
The accompanying notes are an integral part of the financial statements.
15
Morgan Stanley Institutional Fund, Inc.
Annual Report — December 31, 2016
Financial Highlights
Small Company Growth Portfolio
| | | Class L | |
| | | Year Ended December 31, | |
Selected Per Share Data and Ratios | | 2016(1) | | 2015 | | 2014 | | 2013 | | 2012 | |
Net Asset Value, Beginning of Period | | $ | 11.92 | | | $ | 14.60 | | | $ | 18.60 | | | $ | 13.06 | | | $ | 11.79 | | |
Income (Loss) from Investment Operations: | |
Net Investment Loss (2) | | | (0.10 | ) | | | (0.16 | ) | | | (0.19 | ) | | | (0.21 | ) | | | (0.12 | ) | |
Net Realized and Unrealized Gain (Loss) | | | (0.04 | ) | | | (1.33 | ) | | | (1.86 | ) | | | 8.04 | | | | 2.03 | | |
Total from Investment Operations | | | (0.14 | ) | | | (1.49 | ) | | | (2.05 | ) | | | 7.83 | | | | 1.91 | | |
Distributions from and/or in Excess of: | |
Net Realized Gain | | | (0.44 | ) | | | (1.19 | ) | | | (1.95 | ) | | | (2.29 | ) | | | (0.64 | ) | |
Redemption Fees | | | 0.00 | (3) | | | 0.00 | (3) | | | 0.00 | (3) | | | 0.00 | (3) | | | (0.00 | )(3) | |
Net Asset Value, End of Period | | $ | 11.34 | | | $ | 11.92 | | | $ | 14.60 | | | $ | 18.60 | | | $ | 13.06 | | |
Total Return (4) | | | (1.17 | )% | | | (10.36 | )% | | | (10.43 | )% | | | 60.97 | % | | | 16.21 | % | |
Ratios and Supplemental Data: | |
Net Assets, End of Period (Thousands) | | $ | 1,524 | | | $ | 1,874 | | | $ | 2,370 | | | $ | 2,632 | | | $ | 1,696 | | |
Ratio of Expenses to Average Net Assets (9) | | | 1.87 | %(5)(7) | | | 1.90 | %(5) | | | 1.90 | %(5) | | | 1.83 | %(5)(6) | | | 1.80 | %(5) | |
Ratio of Net Investment Loss to Average Net Assets (9) | | | (0.88 | )%(5) | | | (1.13 | )%(5) | | | (1.16 | )%(5) | | | (1.27 | )%(5) | | | (0.95 | )%(5) | |
Ratio of Rebate from Morgan Stanley Affiliates to Average Net Assets | | | 0.00 | %(8) | | | 0.00 | %(8) | | | 0.00 | %(8) | | | 0.01 | % | | | 0.00 | %(8) | |
Portfolio Turnover Rate | | | 51 | % | | | 42 | % | | | 53 | % | | | 43 | % | | | 22 | % | |
(9) Supplemental Information on the Ratios to Average Net Assets: | |
Ratios Before Expense Limitation: | |
Expenses to Average Net Assets | | | 2.21 | % | | | 2.10 | % | | | 2.02 | % | | | 1.92 | % | | | 1.87 | % | |
Net Investment Loss to Average Net Assets | | | (1.22 | )% | | | (1.33 | )% | | | (1.28 | )% | | | (1.36 | )% | | | (1.02 | )% | |
(1) Refer to Note F in the Notes to Financial Statements for discussion of prior period custodian out-of-pocket expenses that were reimbursed in the current period. The amount of the reimbursement was immaterial on a per share basis and did not impact the total return of Class L shares. The Ratio of Expenses to Average Net Assets and the Ratio of Net Investment Loss to Average Net Assets would be unchanged as the reimbursement of custodian fees was offset against current period expense waivers/reimbursements with no impact to net expenses or net investment loss.
(2) Per share amount is based on average shares outstanding.
(3) Amount is less than $0.005 per share.
(4) Calculated based on the net asset value as of the last business day of the period.
(5) The Ratios of Expenses and Net Investment Loss reflect the rebate of certain Portfolio expenses in connection with the investments in Morgan Stanley affiliates during the period. The effect of the rebate on the ratios is disclosed in the above table as "Ratio of Rebate from Morgan Stanley Affiliates to Average Net Assets."
(6) Effective September 16, 2013, the Adviser has agreed to limit the ratio of expenses to average net assets to the maximum ratio of 1.90% for Class L shares. Prior to September 16, 2013, the maximum ratio was 1.80% for Class L shares.
(7) Effective July 1, 2016, the Adviser has agreed to limit the ratio of expenses to average net assets to the maximum ratio of 1.85% for Class L shares. Prior to July 1, 2016, the maximum ratio was 1.90% for Class L shares.
(8) Amount is less than 0.005%.
The accompanying notes are an integral part of the financial statements.
16
Morgan Stanley Institutional Fund, Inc.
Annual Report — December 31, 2016
Financial Highlights
Small Company Growth Portfolio
| | | Class IS | |
| | | Year Ended December 31, | | Period from
September 13, 2013(2) to | |
Selected Per Share Data and Ratios | | 2016(1) | | 2015 | | 2014 | | December 31, 2013 | |
Net Asset Value, Beginning of Period | | $ | 13.77 | | | $ | 16.51 | | | $ | 20.55 | | | $ | 19.51 | | |
Income (Loss) from Investment Operations: | |
Net Investment Income (Loss) (3) | | | 0.01 | | | | (0.03 | ) | | | (0.03 | ) | | | (0.02 | ) | |
Net Realized and Unrealized Gain (Loss) | | | (0.05 | ) | | | (1.52 | ) | | | (2.06 | ) | | | 3.15 | | |
Total from Investment Operations | | | (0.04 | ) | | | (1.55 | ) | | | (2.09 | ) | | | 3.13 | | |
Distributions from and/or in Excess of: | |
Net Realized Gain | | | (0.44 | ) | | | (1.19 | ) | | | (1.95 | ) | | | (2.09 | ) | |
Redemption Fees | | | 0.00 | (4) | | | 0.00 | (4) | | | 0.00 | (4) | | | 0.00 | (4) | |
Net Asset Value, End of Period | | $ | 13.29 | | | $ | 13.77 | | | $ | 16.51 | | | $ | 20.55 | | |
Total Return (5) | | | (0.28 | )% | | | (9.52 | )% | | | (9.63 | )% | | | 16.50 | %(10) | |
Ratios and Supplemental Data: | |
Net Assets, End of Period (Thousands) | | $ | 361,586 | | | $ | 660,134 | | | $ | 671,885 | | | $ | 125,351 | | |
Ratio of Expenses to Average Net Assets (12) | | | 0.95 | %(6)(8) | | | 0.98 | %(6) | | | 0.97 | %(6) | | | 0.97 | %(6)(7)(11) | |
Ratio of Net Investment Income (Loss) to Average Net Assets (12) | | | 0.08 | %(6) | | | (0.21 | )%(6) | | | (0.17 | )%(6) | | | (0.30 | )%(6)(11) | |
Ratio of Rebate from Morgan Stanley Affiliates to Average Net Assets | | | 0.00 | %(9) | | | 0.00 | %(9) | | | 0.00 | %(9) | | | 0.01 | %(11) | |
Portfolio Turnover Rate | | | 51 | % | | | 42 | % | | | 53 | % | | | 43 | %(10) | |
(12) Supplemental Information on the Ratios to Average Net Assets: | |
Ratios Before Expense Limitation: | |
Expenses to Average Net Assets | | | 1.03 | % | | | 0.99 | % | | | 0.98 | % | | | 0.99 | %(11) | |
Net Investment Loss to Average Net Assets | | | (0.00 | )%(9) | | | (0.22 | )% | | | (0.18 | )% | | | (0.32 | )%(11) | |
(1) Refer to Note F in the Notes to Financial Statements for discussion of prior period custodian out-of-pocket expenses that were reimbursed in the current period. The amount of the reimbursement was immaterial on a per share basis and did not impact the total return of Class IS shares. The Ratio of Expenses to Average Net Assets and the Ratio of Net Investment Income to Average Net Assets would be unchanged as the reimbursement of custodian fees was offset against current period expense waivers/reimbursements with no impact to net expenses or net investment income.
(2) Commencement of Offering.
(3) Per share amount is based on average shares outstanding.
(4) Amount is less than $0.005 per share.
(5) Calculated based on the net asset value as of the last business day of the period.
(6) The Ratios of Expenses and Net Investment Income (Loss) reflect the rebate of certain Portfolio expenses in connection with the investments in Morgan Stanley affiliates during the period. The effect of the rebate on the ratios is disclosed in the above table as "Ratio of Rebate from Morgan Stanley Affiliates to Average Net Assets."
(7) Effective September 16, 2013, the Adviser has agreed to limit the ratio of expenses to average net assets to the maximum ratio of 0.98% for Class IS shares.
(8) Effective July 1, 2016, the Adviser has agreed to limit the ratio of expenses to average net assets to the maximum ratio of 0.93% for Class IS shares. Prior to July 1, 2016, the maximum ratio was 0.98% for Class IS shares.
(9) Amount is less than 0.005%.
(10) Not Annualized.
(11) Annualized.
The accompanying notes are an integral part of the financial statements.
17
Morgan Stanley Institutional Fund, Inc.
Annual Report — December 31, 2016
Notes to Financial Statements
Morgan Stanley Institutional Fund, Inc. (the "Fund") is registered under the Investment Company Act of 1940, as amended (the "Act"), as an open-end management investment company. The Fund is comprised of twenty-nine separate, active, diversified and non-diversified portfolios (individually referred to as a "Portfolio", collectively as the "Portfolios"). The Fund applies investment company accounting and reporting guidance.
The accompanying financial statements relate to the Small Company Growth Portfolio. The Portfolio seeks long-term capital appreciation by investing primarily in growth-oriented equity securities of small capitalization companies. The Portfolio holds promissory notes it has made to certain investee companies for this same purpose, the details of which are disclosed in the Portfolio of Investments.
The Portfolio offers four classes of shares — Class I, Class A, Class L and Class IS. The Portfolio's Class A shares are currently closed to new investors and the Portfolio suspended offering of Class L shares. Existing Class L shareholders may invest through reinvestment of dividends and distributions. The Portfolio's Class I and Class IS shares are closed to new investors with certain exceptions.
A. Significant Accounting Policies: The following significant accounting policies are in conformity with U.S. generally accepted accounting principles ("GAAP"). Such policies are consistently followed by the Fund in the preparation of its financial statements. GAAP may require management to make estimates and assumptions that affect the reported amounts and disclosures in the financial statements. Actual results may differ from those estimates.
1. Security Valuation: (1) An equity portfolio security listed or traded on an exchange is valued at its latest reported sales price (or at the exchange official closing price if such exchange reports an official closing price), and if there were no sales on a given day and if there is no official exchange closing price for that day, the security is valued at the mean between the last reported bid and asked prices if such bid and asked prices are available on the relevant exchanges; (2) all other equity portfolio securities for which over-the-counter ("OTC") market quotations are readily available are valued at the latest reported sales price (or at the market official closing price if such market reports an official closing price), and if there was no trading in the security on a given day and if there is no official
closing price from relevant markets for that day, the security is valued at the mean between the last reported bid and asked prices if such bid and asked prices are available on the relevant markets. Listed equity securities not traded on the valuation date with no reported bid and asked prices available on the exchange are valued at the mean between the current bid and asked prices obtained from one or more reputable brokers or dealers. An unlisted equity security that does not trade on the valuation date and for which bid and asked prices from the relevant markets are unavailable is valued at the mean between the current bid and asked prices obtained from one or more reputable brokers or dealers. In cases where a security is traded on more than one exchange, the security is valued on the exchange designated as the primary market; (3) certain portfolio securities may be valued by an outside pricing service/vendor approved by the Fund's Board of Directors (the "Directors"). The pricing service/vendor may employ a pricing model that takes into account, among other things, bids, yield spreads, and/or other market data and specific security characteristics. Alternatively, if a valuation is not available from an outside pricing service/vendor, and the security trades on an exchange, the security may be valued at its latest reported sale price (or at the exchange official closing price if such exchange reports an official closing price), prior to the time when assets are valued. If there are no sales on a given day and if there is no official exchange closing price for that day, the security is valued at the mean between the last reported bid and asked prices if such bid and asked prices are available in the relevant exchanges; (4) Listed options are valued at the last reported sales price on the exchange on which they are listed (or at the exchange official closing price if such exchange reports an official closing price). If an official closing price or last reported sale price is unavailable, the listed option should be fair valued at the mean between its latest bid and ask prices. Unlisted options are valued at the mean between their latest bid and ask prices from a broker/dealer or valued by a pricing service/vendor; (5) when market quotations are not readily available, including circumstances under which Morgan Stanley Investment Management Inc. (the "Adviser"), determines that the closing price, last sale price or the mean between the last reported bid and asked prices are not reflective of a security's market value, portfolio securities are valued at their fair value as
18
Morgan Stanley Institutional Fund, Inc.
Annual Report — December 31, 2016
Notes to Financial Statements (cont'd)
determined in good faith under procedures established by and under the general supervision of the Directors. Occasionally, developments affecting the closing prices of securities and other assets may occur between the times at which valuations of such securities are determined (that is, close of the foreign market on which the securities trade) and the close of business of the New York Stock Exchange ("NYSE"). If developments occur during such periods that are expected to materially affect the value of such securities, such valuations may be adjusted to reflect the estimated fair value of such securities as of the close of the NYSE, as determined in good faith by the Directors or by the Adviser using a pricing service and/or procedures approved by the Directors; (6) quotations of foreign portfolio securities, other assets and liabilities and forward contracts stated in foreign currency are translated into U.S. dollar equivalents at the prevailing market rates prior to the close of the NYSE; and (7) investments in mutual funds, including the Morgan Stanley Institutional Liquidity Funds, are valued at the net asset value ("NAV") as of the close of each business day.
The Directors have responsibility for determining in good faith the fair value of the investments, and the Directors may appoint others, such as the Fund's Adviser or a valuation committee, to assist the Directors in determining fair value and to make the actual calculations pursuant to the fair valuation methodologies previously approved by the Directors. Under procedures approved by the Directors, the Fund's Adviser has formed a Valuation Committee whose members are approved by the Directors. The Valuation Committee provides administration and oversight of the Fund's valuation policies and procedures, which are reviewed at least annually by the Directors. These procedures allow the Fund to utilize independent pricing services, quotations from securities and financial instrument dealers, and other market sources to determine fair value.
The Fund has procedures to determine the fair value of securities and other financial instruments for which market prices are not readily available. Under these procedures, the Valuation Committee convenes on a regular and ad hoc basis to review such securities and considers a number of factors, including valuation methodologies and significant unobservable valuation inputs, when arriving at fair value. The Valuation Committee may
employ a market-based approach which may use related or comparable assets or liabilities, recent transactions, market multiples, book values, and other relevant information for the investment to determine the fair value of the investment. An income-based valuation approach may also be used in which the anticipated future cash flows of the investment are discounted to calculate fair value. Discounts may also be applied due to the nature or duration of any restrictions on the disposition of the investments. Due to the inherent uncertainty of valuations of such investments, the fair values may differ significantly from the values that would have been used had an active market existed. The Valuation Committee employs various methods for calibrating these valuation approaches including a regular review of valuation methodologies, key inputs and assumptions, transactional back-testing or disposition analysis, and reviews of any related market activity.
2. Fair Value Measurement: Financial Accounting Standards Board ("FASB") Accounting Standards CodificationTM ("ASC") 820, "Fair Value Measurement" ("ASC 820"), defines fair value as the value that the Fund would receive to sell an investment or pay to transfer a liability in a timely transaction with an independent buyer in the principal market, or in the absence of a principal market, the most advantageous market for the investment or liability. ASC 820 establishes a three-tier hierarchy to distinguish between (1) inputs that reflect the assumptions market participants would use in valuing an asset or liability developed based on market data obtained from sources independent of the reporting entity (observable inputs) and (2) inputs that reflect the reporting entity's own assumptions about the assumptions market participants would use in valuing an asset or liability developed based on the best information available in the circumstances (unobservable inputs) and to establish classification of fair value measurements for disclosure purposes. Various inputs are used in determining the value of the Fund's investments. The inputs are summarized in the three broad levels listed below.
• Level 1 – unadjusted quoted prices in active markets for identical investments
• Level 2 – other significant observable inputs (including quoted prices for similar investments,
19
Morgan Stanley Institutional Fund, Inc.
Annual Report — December 31, 2016
Notes to Financial Statements (cont'd)
interest rates, prepayment speeds, credit risk, etc.)
• Level 3 – significant unobservable inputs including the Fund's own assumptions in determining the fair value of investments. Factors considered in making this determination may include, but are not limited to, information obtained by contacting the issuer, analysts, or the appropriate stock exchange (for exchange-traded securities), analysis of the issuer's financial statements or other available documents and, if necessary, available information concerning other securities in similar circumstances
The inputs or methodology used for valuing securities are not necessarily an indication of the risk associated with investing in those securities and the determination of the significance of a particular input to the fair value measurement in its entirety requires judgment and considers factors specific to each security.
The following is a summary of the inputs used to value the Portfolio's investments as of December 31, 2016.
Investment Type | | Level 1
Unadjusted
quoted
prices
(000) | | Level 2
Other
significant
observable
inputs
(000) | | Level 3
Significant
unobservable
inputs
(000) | | Total
(000) | |
Assets: | |
Common Stocks | |
Aerospace &
Defense | | $ | 31,246 | | | $ | — | | | $ | — | | | $ | 31,246 | | |
Biotechnology | | | 11,524 | | | | — | | | | — | | | | 11,524 | | |
Capital Markets | | | 8,141 | | | | — | | | | — | | | | 8,141 | | |
Consumer Finance | | | 6,696 | | | | — | | | | — | | | | 6,696 | | |
Electronic Equipment,
Instruments &
Components | | | 6,863 | | | | — | | | | — | | | | 6,863 | | |
Health Care
Equipment &
Supplies | | | 7,424 | | | | — | | | | �� | | | | 7,424 | | |
Health Care
Providers &
Services | | | 22,861 | | | | — | | | | — | | | | 22,861 | | |
Health Care
Technology | | | 81,024 | | | | — | | | | — | | | | 81,024 | | |
Hotels, Restaurants &
Leisure | | | 95,894 | | | | — | | | | — | | | | 95,894 | | |
Internet & Direct
Marketing Retail | | | 24,415 | | | | — | | | | — | | | | 24,415 | | |
Internet Software &
Services | | | 137,046 | | | | — | | | | — | | | | 137,046 | | |
Machinery | | | 42,857 | | | | — | | | | — | | | | 42,857 | | |
Multi-Utilities | | | — | | | | — | | | | — | † | | | — | † | |
Multi-line Retail | | | 15,174 | | | | — | | | | — | | | | 15,174 | | |
Personal Products | | | 2,231 | | | | — | | | | — | | | | 2,231 | | |
Professional Services | | | 48,454 | | | | — | | | | — | | | | 48,454 | | |
Software | | | 72,001 | | | | — | | | | — | | | | 72,001 | | |
Investment Type | | Level 1
Unadjusted
quoted
prices
(000) | | Level 2
Other
significant
observable
inputs
(000) | | Level 3
Significant
unobservable
inputs
(000) | | Total
(000) | |
Specialty Retail | | $ | 29,835 | | | $ | — | | | $ | — | | | $ | 29,835 | | |
Total Common Stocks | | | 643,686 | | | | — | | | | — | † | | | 643,686 | † | |
Preferred Stocks | | | — | | | | — | | | | 62,200 | † | | | 62,200 | † | |
Promissory Notes | | | — | | | | — | | | | — | † | | | — | † | |
Call Option Purchased | | | — | | | | 420 | | | | — | | | | 420 | | |
Short-Term Investments | |
Investment Company | | | 89,258 | | | | — | | | | — | | | | 89,258 | | |
Repurchase Agreements | | | — | | | | 9,281 | | | | — | | | | 9,281 | | |
Total Short-Term
Investments | | | 89,258 | | | | 9,281 | | | | — | | | | 98,539 | | |
Total Assets | | $ | 732,944 | | | $ | 9,701 | | | $ | 62,200 | † | | $ | 804,845 | † | |
† Includes one or more securities which are valued at zero.
Transfers between investment levels may occur as the markets fluctuate and/or the availability of data used in an investment's valuation changes. The Portfolio recognizes transfers between the levels as of the end of the period. As of December 31, 2016, securities with a total value of approximately $13,028 transferred from Level 2 to Level 1. Securities that were valued using other significant observable inputs at December 31, 2015 were valued using unadjusted quoted prices at December 31, 2016. At December 31 2015, the fair value of certain securities were adjusted due to developments which occurred between the time of the close of the foreign markets on which they trade and the close of business on the NYSE which resulted in their Level 2 classification.
Following is a reconciliation of investments in which significant unobservable inputs (Level 3) were used in determining fair value.
| | | Common
Stocks
(000) | | Preferred
Stocks
(000) | | Promissory
Notes
(000) | |
Beginning Balance | | $ | 7,611 | † | | $ | 99,647 | | | $ | 540 | | |
Purchases | | | — | | | | — | | | | — | | |
Sales | | | (9,081 | ) | | | — | | | | — | | |
Amortization of discount | | | — | | | | — | | | | (3 | ) | |
Transfers in | | | — | | | | — | | | | — | | |
Transfers out | | | — | | | | — | | | | — | | |
Corporate actions | | | — | | | | — | | | | — | | |
Change in unrealized appreciation
(depreciation) | | | (1,782 | ) | | | (37,447 | ) | | | (537 | ) | |
Realized gains (losses) | | | 3,252 | | | | — | | | | — | | |
Ending Balance | | $ | — | † | | $ | 62,200 | | | $ | — | † | |
Net change in unrealized appreciation
(depreciation) from investments
still held as of December 31, 2016 | | $ | — | | | $ | (37,447 | ) | | $ | (537 | ) | |
† Includes one or more securities which are valued at zero.
20
Morgan Stanley Institutional Fund, Inc.
Annual Report — December 31, 2016
Notes to Financial Statements (cont'd)
The following table presents additional information about valuation techniques and inputs used for investments that are measured at fair value and categorized within Level 3 as of December 31, 2016. Various valuation techniques were used in the valuation of certain investments and weighted based on the level of significance.
| | | Fair Value at
December 31, 2016
(000) | | Valuation
Technique | | Unobservable
Input | | Range | | Selected
Value | | Impact to
Valuation from an
increase in input | |
Health Care Technology | |
Preferred Stock | | $ | 5,492 | | | Discounted Cash Flow | | Weighted Average
Cost of Capital | | | 18.0 | % | | | 20.0 | % | | | 19.0 | % | | Decrease | |
| | | | | | | Perpetual Growth Rate | | | 3.0 | % | | | 4.0 | % | | | 3.5 | % | | Increase | |
| | | | | Market Comparable
Companies | | Enterprise Value/
Revenue | | | 8.6 | x | | | 12.8 | x | | | 12.3 | x | | Increase | |
| | | | | | | Discount for Lack
of Marketability | | | 20.0 | % | | | 20.0 | % | | | 20.0 | % | | Decrease | |
Hotels, Restaurants & Leisure | |
Preferred Stock | | $ | 15,648 | | | Discounted Cash Flow | | Weighted Average
Cost of Capital | | | 20.0 | % | | | 22.0 | % | | | 21.0 | % | | Decrease | |
| | | | | | | Perpetual Growth Rate | | | 2.5 | % | | | 3.5 | % | | | 3.0 | % | | Increase | |
| | | | | Market Comparable
Companies | | Enterprise Value/
Revenue | | | 1.9 | x | | | 5.5 | x | | | 3.2 | x | | Increase | |
| | | | | | | Discount for Lack
of Marketability | | | 20.0 | % | | | 20.0 | % | | | 20.0 | % | | Decrease | |
Internet & Direct Marketing Retail | |
Preferred Stock | | $ | 21,086 | | | Discounted Cash Flow | | Weighted Average
Cost of Capital | | | 17.5 | % | | | 19.5 | % | | | 18.5 | % | | Decrease | |
| | | | | | | Perpetual Growth Rate | | | 3.5 | % | | | 4.5 | % | | | 4.0 | % | | Increase | |
| | | | | Market Comparable
Companies | | Enterprise Value/
Revenue | | | 1.1 | x | | | 2.8 | x | | | 2.2 | x | | Increase | |
| | | | | | | Discount for Lack
of Marketability | | | 20.0 | % | | | 20.0 | % | | | 20.0 | % | | Decrease | |
Internet Software & Services | |
Preferred Stock | | $ | 7,090 | | | Discounted Cash Flow | | Weighted Average
Cost of Capital | | | 23.5 | % | | | 25.5 | % | | | 24.5 | % | | Decrease | |
| | | | | | | Perpetual Growth Rate | | | 3.0 | % | | | 4.0 | % | | | 3.5 | % | | Increase | |
| | | | | Market Comparable
Companies | | Enterprise Value/
Revenue | | | 2.5 | x | | | 10.6 | x | | | 7.9x | | | Increase | |
| | | | | | | Discount for Lack
of Marketability | | | 20.0 | % | | | 20.0 | % | | | 20.0 | % | | Decrease | |
Software | |
Preferred Stocks | | $ | 9,274 | | | Discounted Cash Flow | | Weighted Average
Cost of Capital | | | 19.0 | % | | | 21.0 | % | | | 20.0 | % | | Decrease | |
| | | | | | | Perpetual Growth Rate | | | 3.0 | % | | | 4.0 | % | | | 3.5 | % | | Increase | |
| | | | | Market Comparable
Companies | | Enterprise Value/
Revenue | | | 2.9 | x | | | 5.6 | x | | | 2.9 | x | | Increase | |
| | | | | | | Discount for Lack
of Marketability | | | 20.0 | % | | | 20.0 | % | | | 20.0 | % | | Decrease | |
| | | $ | 3,610 | | | Discounted Cash Flow | | Weighted Average
Cost of Capital | | | 19.0 | % | | | 21.0 | % | | | 20.0 | % | | Decrease | |
| | | | | | | Perpetual Growth Rate | | | 3.0 | % | | | 4.0 | % | | | 3.5 | % | | Increase | |
| | | | | Market Comparable
Companies | | Enterprise Value/
Revenue | | | 4.8 | x | | | 6.6 | x | | | 5.0 | x | | Increase | |
| | | | | | | Discount for Lack
of Marketability | | | 20.0 | % | | | 20.0 | % | | | 20.0 | % | | Decrease | |
21
Morgan Stanley Institutional Fund, Inc.
Annual Report — December 31, 2016
Notes to Financial Statements (cont'd)
3. Repurchase Agreements: The Portfolio may enter into repurchase agreements under which the Portfolio lends cash and takes possession of securities with an agreement that the counterparty will repurchase such securities. In connection with transactions in repurchase agreements, a bank as custodian for the Portfolio takes possession of the underlying securities which are held as collateral, with a market value at least equal to the amount of the repurchase transaction, including principal and accrued interest. To the extent that any repurchase transaction exceeds one business day, the value of the collateral is marked-to-market on a daily basis to determine that the value of the collateral does not decrease below the repurchase price plus accrued interest as earned. If such a decrease occurs, additional collateral will be requested and, when received, will be added to the account to maintain full collateralization. In the event of default on the obligation to repurchase, the Portfolio has the right to liquidate the collateral and apply the proceeds in satisfaction of the obligation. In the event of default or bankruptcy by the counterparty to the agreement, realization of the collateral proceeds may be subject to cost and delays. The Portfolio, along with other affiliated investment companies, may utilize a joint trading account for the purpose of entering into repurchase agreements.
4. Foreign Currency Translation and Foreign Investments: The books and records of the Portfolio are maintained in U.S. dollars. Foreign currency amounts are translated into U.S. dollars as follows:
– investments, other assets and liabilities at the prevailing rate of exchange on the valuation date;
– investment transactions and investment income at the prevailing rates of exchange on the dates of such transactions.
Although the net assets of the Portfolio are presented at the foreign exchange rates and market values at the close of the period, the Portfolio does not isolate that portion of the results of operations arising as a result of changes in the foreign exchange rates from the fluctuations arising from changes in the market prices of securities held at period end. Similarly, the Portfolio does not isolate the effect of changes in foreign exchange rates from the fluctuations arising from changes in the market prices of securities sold during the period. Accordingly, realized and unrealized foreign currency gains (losses) on investments in securities are included in the reported net realized and unrealized
gains (losses) on investment transactions and balances. However, pursuant to U.S. federal income tax regulations, gains and losses from certain foreign currency transactions and the foreign currency portion of gains and losses realized on sales and maturities of foreign denominated debt securities are treated as ordinary income for U.S. federal income tax purposes.
Net realized gains (losses) on foreign currency transactions represent net foreign exchange gains (losses) from foreign currency forward exchange contracts, disposition of foreign currencies, currency gains (losses) realized between the trade and settlement dates on securities transactions, and the difference between the amount of investment income and foreign withholding taxes recorded on the Portfolio's books and the U.S. dollar equivalent amounts actually received or paid. Net unrealized currency gains (losses) from valuing foreign currency denominated assets and liabilities at period end exchange rates are reflected as a component of unrealized appreciation (depreciation) in the Statement of Assets and Liabilities. The change in unrealized currency gains (losses) on foreign currency translations for the period is reflected in the Statement of Operations.
Foreign security and currency transactions may involve certain considerations and risks not typically associated with those of U.S. dollar denominated transactions as a result of, among other factors, fluctuations of exchange rates in relation to the U.S. dollar, the possibility of lower levels of governmental supervision and regulation of foreign securities markets and the possibility of political or economic instability.
Governmental approval for foreign investments may be required in advance of making an investment under certain circumstances in some countries, and the extent of foreign investments in domestic companies may be subject to limitation in other countries. Foreign ownership limitations also may be imposed by the charters of individual companies to prevent, among other concerns, violations of foreign investment limitations. As a result, an additional class of shares (identified as "Foreign" in the Portfolio of Investments) may be created and offered for investment. The "local" and "foreign shares" market values may differ. In the absence of trading of the foreign shares in such markets, the Portfolio values the foreign shares at the closing exchange price of the local shares.
22
Morgan Stanley Institutional Fund, Inc.
Annual Report — December 31, 2016
Notes to Financial Statements (cont'd)
5. Derivatives: The Portfolio may, but is not required to, use derivative instruments for a variety of purposes, including hedging, risk management, portfolio management or to earn income. Derivatives are financial instruments whose value is based, in part, on the value of an underlying asset, interest rate, index or financial instrument. Prevailing interest rates and volatility levels, among other things, also affect the value of derivative instruments. A derivative instrument often has risks similar to its underlying asset and may have additional risks, including imperfect correlation between the value of the derivative and the underlying asset, risks of default by the counterparty to certain transactions, magnification of losses incurred due to changes in the market value of the securities, instruments, indices or interest rates to which the derivative instrument relates, risks that the transactions may not be liquid and risks arising from margin requirements. The use of derivatives involves risks that are different from, and possibly greater than, the risks associated with other portfolio investments. Derivatives may involve the use of highly specialized instruments that require investment techniques and risk analyses different from those associated with other portfolio investments. All of the Portfolio's holdings, including derivative instruments, are marked-to-market each day with the change in value reflected in unrealized appreciation (depreciation). Upon disposition, a realized gain or loss is recognized.
Certain derivative transactions may give rise to a form of leverage. Leverage magnifies the potential for gain and the risk of loss. Leverage associated with derivative transactions may cause the Portfolio to liquidate portfolio positions when it may not be advantageous to do so to satisfy its obligations or to meet earmarking or segregation requirements, pursuant to applicable Securities and Exchange Commission rules and regulations, or may cause the Portfolio to be more volatile than if the Portfolio had not been leveraged. Although the Adviser seeks to use derivatives to further the Portfolio's investment objectives, there is no assurance that the use of derivatives will achieve this result.
Following is a description of the derivative instruments and techniques that the Portfolio used during the period and their associated risks:
Options: With respect to options, the Portfolio is subject to equity risk, interest rate risk and foreign currency exchange risk in the normal course of pursuing its
investment objectives. If the Portfolio buys an option, it buys a legal contract giving it the right to buy or sell a specific amount of the underlying instrument or foreign currency, or futures contract on the underlying instrument or foreign currency, at an agreed-upon price typically in exchange for a premium paid by the Portfolio. The Portfolio may purchase and/or sell put and call options. Purchasing call options tends to increase the Portfolio's exposure to the underlying (or similar) instrument. Purchasing put options tends to decrease the Portfolio's exposure to the underlying (or similar) instrument. When entering into purchased option contracts, the Portfolio bears the risk of interest or exchange rates or securities prices moving unexpectedly, in which case, the Portfolio may not achieve the anticipated benefits of the purchased option contracts; however the risk of loss is limited to the premium paid. Purchased options are reported as part of "Total Investments in Securities" in the Statement of Assets and Liabilities. Premium paid for purchasing options which expired are treated as realized losses. If the Portfolio sells an option, it sells to another party the right to buy from or sell to the Portfolio a specific amount of the underlying instrument or foreign currency, or futures contract on the underlying instrument or foreign currency, at an agreed-upon price typically in exchange for a premium received by the Portfolio. When options are purchased OTC, the Portfolio bears the risk that the counterparty that wrote the option will be unable or unwilling to perform its obligations under the option contract. Options may also be illiquid and the Portfolio may have difficulty closing out its position. A decision as to whether, when and how to use options involves the exercise of skill and judgment and even a well-conceived option transaction may be unsuccessful because of market behavior or unexpected events. The prices of options can be highly volatile and the use of options can lower total returns.
FASB ASC 815, "Derivatives and Hedging" ("ASC 815"), is intended to improve financial reporting about derivative instruments by requiring enhanced disclosures to enable investors to better understand how and why the Portfolio uses derivative instruments, how these derivative instruments are accounted for and their effects on the Portfolio's financial position and results of operations.
23
Morgan Stanley Institutional Fund, Inc.
Annual Report — December 31, 2016
Notes to Financial Statements (cont'd)
The following table sets forth the fair value of the Portfolio's derivative contracts by primary risk exposure as of December 31, 2016.
| | | Asset Derivatives
Statement of Assets and
Liabilities Location | | Primary Risk
Exposure | | Value
(000) | |
Options Purchased
| | Investments, at Value
(Options Purchased) | | |
Currency Risk | | | $ | 420 | (a) | |
(a) Amounts are included in Investments in Securities in the Statement of Assets and Liabilities.
The following tables set forth by primary risk exposure the Portfolio's realized gains (losses) and change in unrealized appreciation (depreciation) by type of derivative contract for the year ended December 31, 2016 in accordance with ASC 815.
Realized Gain (Loss) | |
Primary Risk Exposure | | Derivative Type | | Value
(000) | |
Currency Risk
| | Investments
(Options Purchased) | | $ | (1,523 | )(b) | |
(b) Amounts are included in Investments Sold in the Statement of Operations.
Change in Unrealized Appreciation (Depreciation) | |
Primary Risk Exposure | | Derivative Type | | Value
(000) | |
Currency Risk
| | Investments
(Options Purchased) | | $ | (3,493 | )(c) | |
(c) Amounts are included in Investments in the Statement of Operations.
At December 31, 2016, the Portfolio's derivative assets and liabilities are as follows:
Gross Amounts of Assets and Liabilities Presented in the
Statement of Assets and Liabilities | |
Derivatives | | Assets(d)
(000) | | Liabilities(d)
(000) | |
Options Purchased | | $ | 420 | (a) | | $ | — | | |
(a) Amounts are included in Investments in Securities in the Statement of Assets and Liabilities.
(d) Absent an event of default or early termination, OTC derivative assets and liabilities are presented gross and not offset in the Statement of Assets and Liabilities.
The Portfolio typically enters into International Swaps and Derivatives Association, Inc. Master Agreements ("ISDA Master Agreements") or similar master agreements (collectively, "Master Agreements") with its contract counterparties for certain OTC derivatives in order to, among other things, reduce its credit risk to counterparties. ISDA Master Agreements include provisions for general obligations, representations, collateral and events of default or termination. Under an ISDA Master Agreement, the Portfolio typically may offset with the counterparty certain OTC derivative financial instruments' payables and/or receivables with collateral held and/or posted and create one single net
payment (close-out netting) in the event of default, termination and/or potential deterioration in the credit quality of the counterparty. Various Master Agreements govern the terms of certain transactions with counterparties, including transactions such as swap, forward, repurchase and reverse repurchase agreements. These Master Agreements typically attempt to reduce the counterparty risk associated with such transactions by specifying credit protection mechanisms and providing standardization that improves legal certainty. Cross-termination provisions under Master Agreements typically provide that a default in connection with one transaction between the Portfolio and a counterparty gives the non-defaulting party the right to terminate any other transactions in place with the defaulting party to create one single net payment due to/due from the defaulting party and may be a feature in certain Master Agreements. In the event the Portfolio exercises its right to terminate a Master Agreement after a counterparty experiences a termination event as defined in the Master Agreement, the return of collateral with market value in excess of the Portfolio's net liability may be delayed or denied.
The following table presents derivative financial instruments that are subject to enforceable netting arrangements as of December 31, 2016.
Gross Amounts Not Offset in the Statement of Assets and Liabilities | |
Counterparty | | Gross Asset
Derivatives
Presented in
Statement of
Assets and
Liabilities
(000) | | Financial
Instrument
(000) | | Collateral
Received
(000) | | Net Amount
(not less
than $0)
(000) | |
Royal Bank of Scotland | | $ | 420 | | | $ | — | | | $ | (370 | ) | | $ | 50 | | |
For the year ended December 31, 2016, the approximate average monthly amount outstanding for each derivative type is as follows:
Options Purchased: | |
| Average monthly notional amount | | | 191,660,000 | | |
6. Securities Lending: The Portfolio lends securities to qualified financial institutions, such as broker-dealers, to earn additional income. Any increase or decrease in the fair value of the securities loaned that might occur and any interest earned or dividends declared on those securities during the term of the loan would remain in the Portfolio. The Portfolio would receive cash or securities as collateral in an amount equal to or exceeding 100% of the current fair value of the loaned securities. The collateral is marked-to-market daily by State Street Bank and
24
Morgan Stanley Institutional Fund, Inc.
Annual Report — December 31, 2016
Notes to Financial Statements (cont'd)
Trust Company ("State Street"), the securities lending agent, to ensure that a minimum of 100% collateral coverage is maintained.
Based on pre-established guidelines, the securities lending agent invests any cash collateral that is received in an affiliated money market portfolio and repurchase agreements. Securities lending income is generated from the earnings on the invested collateral and borrowing fees, less any rebates owed to the borrowers and compensation to the lending agent, and is recorded as "Income from Securities Loaned — Net" in the Portfolio's Statement of Operations. Risks in securities lending transactions are that a borrower may not provide additional collateral when required or return the securities when due, and that the value of the short-term investments will be less than the amount of cash collateral plus any rebate that is required to be returned to the borrower.
The Portfolio has the right under the lending agreement to recover the securities from the borrower on demand.
The following table presents financial instruments that are subject to enforceable netting arrangements as of December 31, 2016.
Gross Amounts Not Offset in the Statement of Assets and Liabilities | |
Gross Asset
Amounts
Presented in
Statement of
Assets and
Liabilities
(000) | | Financial
Instrument
(000) | | Collateral
Received
(000) | | Net Amount
(not less
than $0)
(000) | |
| $ | 45,802 | (e) | | $ | — | | | $ | (45,802 | )(f)(g) | | $ | 0 | | |
(e) Represents market value of loaned securities at period end.
(f) The Portfolio received cash collateral of approximately $45,814,000, of which approximately $45,742,000 was subsequently invested in Repurchase Agreements and Morgan Stanley Institutional Liquidity Funds as reported in the Portfolio of Investments. As of December 31, 2016, there was uninvested cash of approximately $72,000, which is not reflected in the Portfolio of Investments. In addition, the Portfolio received non-cash collateral of approximately $1,807,000 in the form of U.S. Government obligations, which the Portfolio cannot sell or repledge, and accordingly are not reflected in the Portfolio of Investments.
(g) The actual collateral received is greater than the amount shown here due to overcollateralization.
FASB Accounting Standards Update No. 2014-11 ("ASU No. 2014-11"), "Transfers & Servicing (Topic 860): Repurchase-to-Maturity Transactions, Repurchase Financings, and Disclosures", is intended to provide increased transparency about the types of collateral pledged in securities lending transactions and other similar transactions that are accounted for as secured borrowing.
The following table displays a breakdown of transactions accounted for as secured borrowings, the gross obligations by class of collateral pledged, and the remaining contractual maturity of those transactions as of December 31, 2016.
Remaining Contractual Maturity of the Agreements | |
| | | Overnight and
Continuous
(000) | | <30 days
(000) | | Between
30 &
90 days
(000) | | >90 days
(000) | | Total
(000) | |
Securities Lending
Transactions | |
Common Stocks | | $ | 45,814 | | | $ | — | | | $ | — | | | $ | — | | | $ | 45,814 | | |
Total Borrowings | | $ | 45,814 | | | $ | — | | | $ | — | | | $ | — | | | $ | 45,814 | | |
Gross amount of
recognized liabilities
for securities lending
transactions | | | | | | | | | | $ | 45,814 | | |
7. Restricted Securities: The Portfolio invests in unregistered or otherwise restricted securities. The term "restricted securities" refers to securities that are unregistered or are held by control persons of the issuer and securities that are subject to contractual restrictions on their resale. As a result, restricted securities may be more difficult to value and the Portfolio may have difficulty disposing of such assets either in a timely manner or for a reasonable price. In order to dispose of an unregistered security, the Portfolio, where it has contractual rights to do so, may have to cause such security to be registered. A considerable period may elapse between the time the decision is made to sell the security and the time the security is registered so that the Portfolio could sell it. Contractual restrictions on the resale of securities vary in length and scope and are generally the result of a negotiation between the issuer and acquirer of the securities. The Portfolio would, in either case, bear market risks during that period. Restricted securities are identified in the Portfolio of Investments.
8. Structured Investments: The Portfolio invested a portion of its assets in structured investments. A structured investment is a derivative security designed to offer a return linked to a particular underlying security, currency, commodity or market. Structured investments may come in various forms including notes (such as exchange-traded notes), warrants and options to purchase securities. The Portfolio will typically use structured investments to gain exposure to a permitted underlying security, currency, commodity or market when direct access to a market is limited or inefficient from a tax or cost standpoint. There can be no assurance that structured investments will trade
25
Morgan Stanley Institutional Fund, Inc.
Annual Report — December 31, 2016
Notes to Financial Statements (cont'd)
at the same price or have the same value as the underlying security, currency, commodity or market. Investments in structured investments involve risks including issuer risk, counterparty risk and market risk. Holders of structured investments bear risks of the underlying investment and are subject to issuer or counterparty risk because the Portfolio is relying on the creditworthiness of such issuer or counterparty and has no rights with respect to the underlying investment. Certain structured investments may be thinly traded or have a limited trading market and may have the effect of increasing the Portfolio's illiquidity to the extent that the Portfolio, at a particular time, may be unable to find qualified buyers for these securities.
9. Redemption Fees: The Portfolio will assess a 2% redemption fee, on Class I shares, Class A shares, Class L shares and Class IS shares, which is paid directly to the Portfolio, for shares redeemed or exchanged within thirty days of purchase, subject to certain exceptions. The redemption fee is designed to protect the Portfolio and its remaining shareholders from the effects of short-term trading. These fees, if any, are included in the Statements of Changes in Net Assets.
10. Indemnifications: The Fund enters into contracts that contain a variety of indemnifications. The Fund's maximum exposure under these arrangements is unknown. However, the Fund has not had prior claims or losses pursuant to these contracts and expects the risk of loss to be remote.
11. Dividends and Distributions to Shareholders: Dividend income and distributions to shareholders are recorded on the ex-dividend date. Dividends from net investment income, if any, are declared and paid annually. Net realized capital gains, if any, are distributed at least annually.
12. Security Transactions, Income and Expenses: Security transactions are accounted for on the trade date (date the order to buy or sell is executed). Realized gains and losses on the sale of investment securities are determined on the specific identified cost method. Dividend income and other distributions are recorded on the ex-dividend date (except for certain foreign dividends which may be recorded as soon as the Portfolio is informed of such dividends) net of applicable withholding taxes. Interest income is recognized on the accrual basis except where
collection is in doubt. Discounts are accreted and premiums are amortized over the life of the respective securities. Most expenses of the Fund can be directly attributed to a particular Portfolio. Expenses which cannot be directly attributed are apportioned among the Portfolios based upon relative net assets or other appropriate methods. Income, expenses (other than class specific expenses — distribution and shareholder services, transfer agency and sub transfer agency fees) and realized and unrealized gains or losses are allocated to each class of shares based upon their relative net assets.
B. Advisory Fees: The Adviser, a wholly-owned subsidiary of Morgan Stanley, provides the Portfolio with advisory services under the terms of an Investment Advisory Agreement, paid quarterly, at the annual rate based on the daily net assets as follows:
First $1
billion | | Next $500
million | | Next $500
million | | Over $2
billion | |
| | 0.92 | % | | | 0.85 | % | | | 0.80 | % | | | 0.75 | % | |
For the year ended December 31, 2016, the advisory fee rate (net of waivers/rebate) was equivalent to an annual effective rate of 0.84% of the Portfolio's average daily net assets.
The Adviser has agreed to reduce its advisory fee and/or reimburse the Portfolio so that total annual portfolio operating expenses, excluding certain investment related expenses, taxes, interest and other extraordinary expenses (including litigation), will not exceed 1.05% for Class I shares, 1.40% for Class A shares, 1.90% for Class L shares and 0.98% for Class IS shares. Effective July 1, 2016, the Adviser has agreed to reduce its advisory fee and/or reimburse the Portfolio so that total annual portfolio operating expenses will not exceed 1.00% for Class I shares, 1.35% for Class A shares, 1.85% for Class L shares and 0.93% for Class IS shares. The fee waivers and/or expense reimbursements will continue for at least one year from the date of the Portfolio's prospectus or until such time as the Directors act to discontinue all or a portion of such waivers and/or reimbursements when they deem such action is appropriate. For the year ended December 31, 2016, approximately $765,000 of advisory fees were waived and approximately $364,000 of other expenses were reimbursed by the Adviser pursuant to this arrangement.
C. Administration Fees: The Adviser also serves as Administrator to the Fund and provides administrative services pursuant to an Administration Agreement for an annual fee, accrued daily and paid monthly, of 0.08% of the Portfolio's average daily net assets.
26
Morgan Stanley Institutional Fund, Inc.
Annual Report — December 31, 2016
Notes to Financial Statements (cont'd)
Under a Sub-Administration Agreement between the Administrator and State Street, State Street provides certain administrative services to the Fund. For such services, the Administrator pays State Street a portion of the fee the Administrator receives from the Portfolio.
D. Distribution and Shareholder Services Fees: Morgan Stanley Distribution, Inc. ("MSDI" or the "Distributor"), a wholly-owned subsidiary of the Adviser and an indirect subsidiary of Morgan Stanley, serves as the Fund's Distributor of Portfolio shares pursuant to a Distribution Agreement. The Fund has adopted a Shareholder Services Plan with respect to Class A shares pursuant to Rule 12b-1 under the Act. Under the Shareholder Services Plan, the Portfolio pays the Distributor a shareholder services fee, accrued daily and paid monthly, at an annual rate of 0.25% of the Portfolio's average daily net assets attributable to Class A shares.
The Fund has adopted a Distribution and Shareholder Services Plan with respect to Class L shares pursuant to Rule 12b-1 under the Act. Under the Distribution and Shareholder Services Plan, the Portfolio pays the Distributor a distribution fee, accrued daily and paid monthly, at an annual rate of 0.50% and a shareholder services fee, accrued daily and paid monthly, at an annual rate of 0.25% of the Portfolio's average daily net assets attributable to Class L shares.
The distribution and shareholder services fees are used to support the expenses associated with servicing and maintaining accounts. The Distributor may compensate other parties for providing shareholder support services to investors who purchase Class A and Class L shares.
E. Dividend Disbursing and Transfer Agent: The Fund's dividend disbursing and transfer agent is Boston Financial Data Services, Inc. ("BFDS"). Pursuant to a Transfer Agency Agreement, the Fund pays BFDS a fee based on the number of classes, accounts and transactions relating to the Portfolios of the Fund.
F. Custodian Fees: State Street (the "Custodian") serves as Custodian for the Fund in accordance with a Custodian Agreement. The Custodian holds cash, securities, and other assets of the Fund as required by the Act. Custody fees are payable monthly based on assets held in custody, investment purchases and sales activity and account maintenance fees, plus reimbursement for certain out-of-pocket expenses.
In December 2015, the Fund's Custodian announced that it had identified inconsistencies in the way in which clients were
invoiced for out-of-pocket expenses from 1998 until November 2015. The dollar amount difference between what was charged and what should have been charged, plus interest, was paid back to the Portfolio in September 2016 as a reimbursement. The Custodian reimbursed the Portfolio directly, which was recognized as a change in accounting estimate and was reflected as "Reimbursement of Custodian Fees" in the Statement of Operations. Pursuant to the expense limitations described in Note B, the Portfolio has experienced waiver of advisory fees during the current period. Accordingly, the reimbursement of out-of-pocket custodian expenses in the current period resulted in the reduction in the current period waiver of advisory fees.
G. Security Transactions and Transactions with Affiliates: For the year ended December 31, 2016, purchases and sales of investment securities for the Portfolio, other than long-term U.S. Government securities and short-term investments, were approximately $531,630,000 and $1,257,217,000, respectively. There were no purchases and sales of long-term U.S. Government securities for the year ended December 31, 2016.
The Portfolio invests in the Institutional Class of the Morgan Stanley Institutional Liquidity Funds (the "Liquidity Funds"), an open-end management investment company managed by the Adviser, both directly and as a portion of the securities held as collateral on loaned securities. Advisory fees paid by the Portfolio are reduced by an amount equal to its pro-rata share of the advisory and administration fees paid by the Portfolio due to its investment in the Liquidity Funds. For the year ended December 31, 2016, advisory fees paid were reduced by approximately $52,000 relating to the Portfolio's investment in the Liquidity Funds.
A summary of the Portfolio's transactions in shares of the Liquidity Funds during the year ended December 31, 2016 is as follows:
Value
December 31,
2015
(000) | | Purchases
at Cost
(000) | | Sales
(000) | | Dividend
Income
(000) | | Value
December 31,
2016
(000) | |
| $ | 310,562 | | | $ | 783,816 | | | $ | 1,005,120 | | | $ | 122 | | | $ | 89,258 | | |
During the year ended December 31, 2016, the Portfolio incurred approximately $29,000 in brokerage commissions with Morgan Stanley & Co., LLC, an affiliate of the Adviser/Administrator and Distributor, for portfolio transactions executed on behalf of the Portfolio.
27
Morgan Stanley Institutional Fund, Inc.
Annual Report — December 31, 2016
Notes to Financial Statements (cont'd)
The Portfolio is permitted to purchase and sell securities ("cross-trade") from and to other Morgan Stanley Funds as well as other funds and client accounts for which the Adviser or an affiliate of the Adviser serves as investment adviser, pursuant to procedures approved by the Directors in compliance with Rule 17a-7 under the Act (the "Rule"). Each cross-trade is executed at the current market price in compliance with provisions of the Rule. For the year ended December 31, 2016, the Portfolio engaged in cross-trade sales of approximately $2,830,000 which resulted in net realized gains or losses of approximately $592,000.
The Portfolio has an unfunded Deferred Compensation Plan (the "Compensation Plan"), which allows each independent Director to defer payment of all, or a portion, of the fees he or she receives for serving on the Board of Directors. Each eligible Director generally may elect to have the deferred amounts credited with a return equal to the total return on one or more of the Morgan Stanley funds that are offered as investment options under the Compensation Plan. Appreciation/depreciation and distributions received from these investments are recorded with an offsetting increase/decrease in the deferred compensation obligation and do not affect the NAV of the Portfolio.
H. Federal Income Taxes: It is the Portfolio's intention to continue to qualify as a regulated investment company and distribute all of its taxable and tax-exempt income. Accordingly, no provision for federal income taxes is required in the financial statements.
The Portfolio may be subject to taxes imposed by countries in which it invests. Such taxes are generally based on income and/or capital gains earned or repatriated. Taxes are accrued based on net investment income, net realized gains and net unrealized appreciation as such income and/or gains are earned. Taxes may also be based on transactions in foreign currency and are accrued based on the value of investments denominated in such currency.
FASB ASC 740-10, "Income Taxes — Overall", sets forth a minimum threshold for financial statement recognition of the benefit of a tax position taken or expected to be taken in a tax return. Management has concluded that there are no significant uncertain tax positions that would require recognition in the financial statements. If applicable, the Portfolio recognizes interest accrued related to unrecognized tax benefits in "Interest Expense" and penalties in "Other Expenses" in the Statement of Operations. The Portfolio files tax returns with the U.S. Internal Revenue Service, New York and various states. Generally, each of the tax years in the four-year period ended December 31, 2016, remains subject to examination by taxing authorities.
The tax character of distributions paid may differ from the character of distributions shown in the Statements of Changes in Net Assets due to short-term capital gains being treated as ordinary income for tax purposes. The tax character of distributions paid during fiscal years 2016 and 2015 was as follows:
2016
Distributions
Paid From: | | 2015
Distributions
Paid From: | |
Ordinary
Income
(000) | | Long-Term
Capital Gain
(000) | | Ordinary
Income
(000) | | Long-Term
Capital Gain
(000) | |
| $ | — | | | $ | 29,791 | | | $ | — | | | $ | 126,283 | | |
The amount and character of income and gains to be distributed are determined in accordance with income tax regulations which may differ from GAAP. These book/tax differences are either considered temporary or permanent in nature.
Temporary differences are primarily due to differing book and tax treatments for the timing of the recognition of gains (losses) on certain investment transactions and the timing of the deductibility of certain expenses.
Permanent differences, primarily due to differing treatments of gains (losses) related to foreign currency transactions, a net operating loss and basis adjustments on partnerships, resulted in the following reclassifications among the components of net assets at December 31, 2016:
Accumulated
Net Investment
Loss
(000) | | Accumulated
Net Realized
Gain
(000) | | Paid-in-
Capital
(000) | |
| $ | 543 | | | $ | 2,869 | | | $ | (3,412 | ) | |
At December 31, 2016, the components of distributable earnings for the Portfolio on a tax basis were as follows:
Undistributed
Ordinary
Income
(000) | | Undistributed
Long-Term
Capital Gain
(000) | |
| $ | — | | | $ | 44,122 | | |
Qualified late year losses are capital losses and specified ordinary losses, including currency losses, incurred after October 31 but within the taxable year that, if elected, are deemed to arise on the first day of the Portfolio's next taxable year. For the year ended December 31, 2016, the Portfolio deferred to January 1, 2017 for U.S. federal income tax purposes the following losses:
Qualified Late
Year Ordinary
Losses
(000) | | Post-October
Capital
Losses
(000) | |
| $ | 506 | | | $ | — | | |
28
Morgan Stanley Institutional Fund, Inc.
Annual Report — December 31, 2016
Notes to Financial Statements (cont'd)
I. Credit Facility: As of April 4, 2016, the Fund and other Morgan Stanley funds participated in a $150,000,000 committed, unsecured revolving line of credit facility (the "facility") with State Street. This facility is to be used for temporary emergency purposes or funding of shareholder redemption requests. The interest rate on borrowings is based on the federal funds rate or one month libor rate plus a spread. The facility also has a commitment fee of 0.25% per annum based on the unused portion of the facility. During the year ended December 31, 2016, the Portfolio did not have any borrowings under the facility.
J. Other: At December 31, 2016, the Portfolio had record owners of 10% or greater. Investment activities of these shareholders could have a material impact on the Portfolio. The aggregate percentage of such owners was 48.2%.
K. Accounting Pronouncements: In December 2016, FASB issued Accounting Standards update 2016-19 — Technical Corrections and Improvements ("ASU 2016-19"), which is effective for interim periods for all entities beginning after December 15, 2016. ASU 2016-19 includes an amendment to Topic 820, Fair Value Measurement, which clarifies the difference between a valuation approach and a valuation technique when applying the guidance in that Topic. That amendment also requires an entity to disclose when there has been a change in either or both a valuation approach and/or a valuation technique. The transition guidance for the amendment must be applied prospectively because it could potentially involve the use of hindsight that includes fair value measurements. Although still evaluating the potential impacts of ASU 2016-19 to the Portfolio, management expects that the impact of the Portfolio's adoption will be limited to additional financial statement disclosures.
In October 2016, the Securities and Exchange Commission ("SEC") issued a new rule, Investment Company Reporting Modernization, which, among other provisions, amends Regulation S-X to require standardized, enhanced disclosures, particularly related to derivatives, in investment company financial statements. Compliance with the guidance is effective for financial statements filed with the SEC on or after August 1, 2017; adoption will have no effect on the Portfolio's net assets or results of operations. Although still evaluating the potential impacts of the Investment Company Reporting Modernization to the Portfolio, management expects that the impact of the Portfolio's adoption will be limited to additional financial statement disclosures.
29
Morgan Stanley Institutional Fund, Inc.
Annual Report — December 31, 2016
Report of Independent Registered Public Accounting Firm
To the Shareholders and Board of Directors of
Morgan Stanley Institutional Fund, Inc. —
Small Company Growth Portfolio
We have audited the accompanying statement of assets and liabilities, including the portfolio of investments, of Small Company Growth Portfolio (one of the portfolios constituting Morgan Stanley Institutional Fund, Inc.) (the "Portfolio") as of December 31, 2016, and the related statement of operations for the year then ended, the statements of changes in net assets for each of the two years in the period then ended and the financial highlights for each of the years or periods indicated therein. These financial statements and financial highlights are the responsibility of the Portfolio's management. Our responsibility is to express an opinion on these financial statements and financial highlights based on our audits.
We conducted our audits in accordance with the standards of the Public Company Accounting Oversight Board (United States). Those standards require that we plan and perform the audit to obtain reasonable assurance about whether the financial statements and financial highlights are free of material misstatement. We were not engaged to perform an audit of the Portfolio's internal control over financial reporting. Our audits included consideration of internal control over financial reporting as a basis for designing audit procedures that are appropriate in the circumstances, but not for the purpose of expressing an opinion on the effectiveness of the Portfolio's internal control over financial reporting. Accordingly, we express no such opinion. An audit also includes examining, on a test basis, evidence supporting the amounts and disclosures in the financial statements and financial highlights, assessing the accounting principles used and significant estimates made by management, and evaluating the overall financial statement presentation. Our procedures included confirmation of securities owned as of December 31, 2016, by correspondence with the custodian and others or by other appropriate auditing procedures where replies from others were not received. We believe that our audits provide a reasonable basis for our opinion.
In our opinion, the financial statements and financial highlights referred to above present fairly, in all material respects, the financial position of Small Company Growth Portfolio (one of the portfolios constituting Morgan Stanley Institutional Fund, Inc.) at December 31, 2016, the results of its operations for the year then ended, the changes in its net assets for each of the two years in the period then ended and the financial highlights for each of the years or periods indicated therein, in conformity with U.S. generally accepted accounting principles.

Boston, Massachusetts
February 28, 2017
30
Morgan Stanley Institutional Fund, Inc.
Annual Report — December 31, 2016
Federal Tax Notice (unaudited)
For federal income tax purposes, the following information is furnished with respect to the distributions paid by the Portfolio during its taxable year ended December 31, 2016. The Portfolio designated and paid approximately $29,791,000 as a long-term capital gain distribution.
In January, the Portfolio provides tax information to shareholders for the preceding calendar year.
31
Morgan Stanley Institutional Fund, Inc.
Annual Report — December 31, 2016
Privacy Notice (unaudited)
MORGAN STANLEY INVESTMENT MANAGEMENT INC.
AN IMPORTANT NOTICE CONCERNING OUR U.S. PRIVACY POLICY
We are required by federal law to provide you with a copy of our privacy policy annually. This policy applies to current and former individual investors in funds managed or sponsored by Morgan Stanley Investment Management Inc. ("MSIM") as well as current and former individual clients of MSIM. This policy is not applicable to partnerships, corporations, trusts or other non-individual clients or investors. Please note that we may amend this policy at any time, and will inform you of any changes as required by law.
WE RESPECT YOUR PRIVACY
We appreciate that you have provided us with your personal financial information. We strive to maintain the privacy of such information while we help you achieve your financial objectives. This Notice describes what non-public personal information we collect about you, why we collect it, when we may share it with others and how certain others may use it. It discusses the steps you may take to limit our sharing of certain information about you to affiliated companies in the Morgan Stanley family of companies ("other Morgan Stanley companies"). It also discloses how you may limit use of certain shared information for marketing purposes by other Morgan Stanley branded companies. Throughout this policy, we refer to the non-public information that personally identifies you or your accounts as "personal information.''
1. WHAT PERSONAL INFORMATION DO WE COLLECT ABOUT YOU?
We obtain personal information from applications and other forms you submit to us, from your dealings with us, from consumer reporting agencies, from our Web sites and from third parties and other sources.
For example:
• We may collect information such as your name, address, e-mail address, telephone/fax numbers, assets, income and investment objectives through subscription documents, applications and other forms you submit to us.
• We may obtain information about account balances, your use of account(s) and the types of products and services you prefer to receive from us through your dealings and transactions with us and other sources.
• We may obtain information about your creditworthiness and credit history from consumer reporting agencies.
• We may collect background information from and through third-party vendors to verify representations you have made and to comply with various regulatory requirements.
• If you interact with us through our public and private Web sites, we may collect information that you provide directly through online communications (such as an e-mail address). We may also collect information about your Internet service provider, your domain name, your computer's operating system and Web browser, your use of our Web sites and your product and service preferences, through the use of "cookies." Please consult the Terms of Use of these sites for more details.
2. WHEN DO WE DISCLOSE PERSONAL INFORMATION WE COLLECT ABOUT YOU?
We may disclose personal information we collect about you to other Morgan Stanley companies and to non-affiliated third parties.
a. Information We Disclose to Other Morgan Stanley Companies.
We may disclose personal information to other Morgan Stanley companies for a variety of reasons, including to manage your account(s) effectively, to service and process your transactions, to let you know about products and services offered by us and other Morgan Stanley companies, to manage our business, and as otherwise required or permitted by law. Offers for products and services from other Morgan Stanley companies are developed under conditions designed to safeguard your personal information.
32
Morgan Stanley Institutional Fund, Inc.
Annual Report — December 31, 2016
Privacy Notice (unaudited) (cont'd)
b. Information We Disclose to Non-affiliated Third Parties.
We do not disclose personal information that we collect about you to non-affiliated third parties except to those who provide marketing services on our behalf, to financial institutions with whom we have joint marketing agreements, and as otherwise required or permitted by law. For example, we may disclose personal information to nonaffiliated third parties for servicing and processing transactions, to offer our own products and services, to protect against fraud, for institutional risk control, to respond to judicial process or to perform services on our behalf. When we share personal information with a non-affiliated third party, they are required to limit their use of personal information to the particular purpose for which it was shared and they are not allowed to share personal information with others except to fulfill that limited purpose or as may be permitted or required by law.
3. HOW DO WE PROTECT THE SECURITY AND CONFIDENTIALITY OF PERSONAL INFORMATION WE COLLECT ABOUT YOU?
We maintain physical, electronic and procedural security measures to help safeguard the personal information we collect about you. We have internal policies governing the proper handling of client information. Third parties that provide support or marketing services on our behalf may also receive personal information, and we require them to adhere to confidentiality standards with respect to such information.
4. HOW CAN YOU LIMIT THE SHARING OF CERTAIN TYPES OF PERSONAL INFORMATION WITH OTHER MORGAN STANLEY COMPANIES?
We offer you choices as to whether we share with other Morgan Stanley companies the personal information that was collected to determine your eligibility for products and services you request ("eligibility information"). Eligibility information does not include your identification information or personal information pertaining to our transactions or experiences with you. Please note that, even if you direct us not to share eligibility information with other Morgan Stanley companies ("opt-out"), we may still share personal information, including eligibility information, with those companies in circumstances excluded from the opt-out under applicable law, such as to process transactions or to service your account.
5. HOW CAN YOU LIMIT THE USE OF CERTAIN TYPES OF PERSONAL INFORMATION BY OTHER MORGAN STANLEY COMPANIES FOR MARKETING?
By following the opt-out instructions in Section 6 below, you may limit other Morgan Stanley branded companies from marketing their products or services to you based on personal information we disclose to them. This information may include, for example, your income and account history with us. Please note that, even if you choose to limit Other Morgan Stanley Companies from using personal information about you that we may share with them for marketing their products and services to you, Other Morgan Stanley Companies may use your personal information that they obtain from us to market to you in circumstances permitted by law, such as if the Other Morgan Stanley Company has its own relationship with you.
6. HOW CAN YOU SEND US AN OPT-OUT INSTRUCTION?
If you wish to limit our sharing of eligibility information about you with other Morgan Stanley companies or other Morgan Stanley companies' use of personal information for marketing purposes, as described in this notice, you may do so by:
• Calling us at (800) 548-7786
Monday–Friday between 8a.m. and 6p.m.(EST)
• Writing to us at the following address:
Boston Financial Data Services, Inc.
c/o Privacy Coordinator
P.O. Box 219804
Kansas City, Missouri 64121
33
Morgan Stanley Institutional Fund, Inc.
Annual Report — December 31, 2016
Privacy Notice (unaudited) (cont'd)
Your written request should include your name, address, telephone number and account number(s) to which the opt-out applies and whether you are opting out with respect to sharing of eligibility information (Section 4 above), or if information used for Marketing (Section 5 above) or both. Written opt-out requests should not be sent with any other correspondence. In order to process your request, we require that the request be provided by you directly and not through a third party.
Your opt-out preference will remain in effect with respect to this policy (as it may be amended) until you notify us otherwise. If you have a joint account, your direction for us not to share this information with other Morgan Stanley companies and for those other Morgan Stanley companies not to use your personal information for marketing will be applied to all account holders on that account. Please understand that if you limit our sharing or our affiliated companies' use of personal information, you and any joint account holder(s) may not receive information about Morgan Stanley products and services, including products or services that could help you manage your financial resources and achieve your investment objectives.
7. WHAT IF AN AFFILIATED COMPANY BECOMES A NON-AFFILIATED THIRD PARTY?
If, at any time in the future, an affiliated company becomes a non-affiliated third party, further disclosures of personal information made to the former affiliated company will be limited to those described in Section 2(b) above relating to non-affiliated third parties. If you elected under Section 6 to limit disclosures we make to affiliated companies, or use of personal information by affiliated companies, your election will not apply to use by any former affiliated company of your personal information in their possession once it becomes a non-affiliated third party.
SPECIAL NOTICE TO RESIDENTS OF VERMONT
The following section supplements our policy with respect to our individual clients who have a Vermont address and supersedes anything to the contrary in the above policy with respect to those clients only.
The state of Vermont requires financial institutions to obtain your consent prior to sharing personal information that they collect about you with affiliated companies and non-affiliated third parties other than in certain limited circumstances. Except as permitted by law, we will not share personal information we collect about you with non-affiliated third parties or other Morgan Stanley companies unless you provide us with your written consent to share such information ("opt-in").
If you wish to receive offers for investment products and services offered by or through other Morgan Stanley companies, please notify us in writing at the following address:
Boston Financial Data Services, Inc.
c/o Privacy Coordinator
P.O. Box 219804
Kansas City, Missouri 64121
Your authorization should include your name, address, telephone number and account number(s) to which the opt-in applies and should not be sent with any other correspondence. In order to process your authorization, we require that the authorization be provided by you directly and not through a third party.
SPECIAL NOTICE TO RESIDENTS OF CALIFORNIA
The following section supplements our policy with respect to our individual clients who have a California address and supersedes anything to the contrary in the above policy with respect to those clients only.
In response to a California law, if your account has a California home address, your personal information will not be disclosed to nonaffiliated third parties except as permitted by applicable California law, and we will limit sharing such information with our affiliates to comply with California privacy laws that apply to us.
34
Morgan Stanley Institutional Fund, Inc.
Annual Report — December 31, 2016
Director and Officer Information (unaudited)
Independent Directors:
Name, Age and Address of
Independent Director | | Position(s)
Held with
Registrant | | Length of Time
Served* | | Principal Occupation(s) During Past 5 Years
and Other Relevant Professional Experience | | Number of
Portfolios in
Fund Complex
Overseen by
Independent
Director** | | Other Directorships
Held by Independent
Director*** | |
Frank L. Bowman (72)
c/o Perkins Coie LLP
Counsel to the Independent
Directors
30 Rockefeller Plaza
New York, NY 10112 | | Director | | Since
August
2006 | | President, Strategic Decisions, LLC (consulting) (since February 2009); Director or Trustee of various Morgan Stanley Funds (since August 2006); Chairperson of the Compliance and Insurance Committee (since October 2015); formerly, Chairperson of the Insurance Sub-Committee of the Compliance and Insurance Committee (2007-2015); served as President and Chief Executive Officer of the Nuclear Energy Institute (policy organization) (February 2005-November 2008); retired as Admiral, U.S. Navy after serving over 38 years on active duty including 8 years as Director of the Naval Nuclear Propulsion Program in the Department of the Navy and the U.S. Department of Energy (1996-2004); served as Chief of Naval Personnel (July 1994-September 1996) and on the Joint Staff as Director of Political Military Affairs (June 1992-July 1994); knighted as Honorary Knight Commander of the Most Excellent Order of the British Empire; awarded the Officier de l'Orde National du Mérite by the French Government; elected to the National Academy of Engineering (2009). | | | 90 | | | Director of BP p.l.c.; Director of Naval and Nuclear Technologies LLP; Director Emeritus of the Armed Services YMCA; Director of the U.S. Naval Submarine League; Member of the National Security Advisory Council of the Center for U.S. Global Engagement and a member of the CNA Military Advisory Board; Chairman of the charity J Street Cup Golf; Trustee of Fairhaven United Methodist Church; and Director of other various non-profit organizations. | |
Kathleen A. Dennis (63)
c/o Perkins Coie LLP
Counsel to the Independent Directors
30 Rockefeller Plaza
New York, NY 10112 | | Director | | Since
August
2006 | | President, Cedarwood Associates (mutual fund and investment management consulting) (since July 2006); Chairperson of the Liquidity and Alternatives Sub-Committee of the Investment Committee (since October 2006) and Director or Trustee of various Morgan Stanley Funds (since August 2006); formerly, Senior Managing Director of Victory Capital Management (1993-2006). | | | 91 | | | Director of various non-profit organizations. | |
Nancy C. Everett (61)
c/o Perkins Coie LLP
Counsel to the Independent Directors
30 Rockefeller Plaza
New York, NY 10112 | | Director | | Since
January
2015 | | Chief Executive Officer, Virginia Commonwealth University Investment Company (since November 2015); Owner, OBIR, LLC (institutional investment management consulting) (since June 2014); formerly, Managing Director, BlackRock Inc. (February 2011-December 2013); and Chief Executive Officer, General Motors Asset Management (a/k/a Promark Global Advisors, Inc.) (June 2005-May 2010). | | | 91 | | | Member of Virginia Commonwealth University School of Business Foundation; formerly, Member of Virginia Commonwealth University Board of Visitors (2013-2015); Member of Committee on Directors for Emerging Markets Growth Fund, Inc. (2007-2010); Chairperson of Performance Equity Management, LLC (2006-2010); and Chairperson, GMAM Absolute Return Strategies Fund, LLC (2006-2010). | |
35
Morgan Stanley Institutional Fund, Inc.
Annual Report — December 31, 2016
Director and Officer Information (unaudited) (cont'd)
Independent Directors: (cont'd)
Name, Age and Address of
Independent Director | | Position(s)
Held with
Registrant | | Length of Time
Served* | | Principal Occupation(s) During Past 5 Years
and Other Relevant Professional Experience | | Number of
Portfolios in
Fund Complex
Overseen by
Independent
Director** | | Other Directorships
Held by Independent
Director*** | |
Jakki L. Haussler (59)
c/o Perkins Coie LLP
Counsel to the Independent Directors
30 Rockefeller Plaza
New York, NY 10112 | | Director | | Since
January
2015 | | Chairman and Chief Executive Officer, Opus Capital Group (since January 1996); formerly, Director, Capvest Venture Fund, LP (May 2000-December 2011); Partner, Adena Ventures, LP (July 1999-December 2010); Director, The Victory Funds (February 2005-July 2008). | | | 91 | | | Director of Cincinnati Bell Inc. and Member, Audit Committee and Compensation Committee; Director of Northern Kentucky University Foundation and Member, Investment Committee; Member of Chase College of Law Transactional Law Practice Center Board of Advisors; Director of Best Transport; Director of Chase College of Law Board of Visitors; formerly, Member, University of Cincinnati Foundation Investment Committee; Member, Miami University Board of Visitors (2008-2011); Trustee of Victory Funds (2005-2008) and Chairman, Investment Committee (2007-2008) and Member, Service Provider Committee (2005-2008). | |
Dr. Manuel H. Johnson (67)
c/o Johnson Smick
International, Inc.
220 I Street, N.E. — Suite 200
Washington, D.C. 20002 | | Director | | Since
July
1991 | | Senior Partner, Johnson Smick International, Inc. (consulting firm); Chairperson of the Investment Committee (since October 2006) and Director or Trustee of various Morgan Stanley Funds (since July 1991); Co-Chairman and a founder of the Group of Seven Council (G7C) (international economic commission); formerly, Chairperson of the Audit Committee (July 1991-September 2006), Vice Chairman of the Board of Governors of the Federal Reserve System and Assistant Secretary of the U.S. Treasury. | | | 91 | | | Director of NVR, Inc. (home construction). | |
Joseph J. Kearns (74)
c/o Kearns & Associates LLC
46 E Peninsula Center #385
Rolling Hills Estates, CA 90274-3712 | | Director | | Since
August
1994 | | President, Kearns & Associates LLC (investment consulting); Chairperson of the Audit Committee (since October 2006) and Director or Trustee of various Morgan Stanley Funds (since August 1994); formerly, Deputy Chairperson of the Audit Committee (July 2003-September 2006) and Chairperson of the Audit Committee of various Morgan Stanley Funds (since August 1994); CFO of the J. Paul Getty Trust. | | | 93 | | | Director of Electro Rent Corporation (equipment leasing). Prior to December 31, 2013, Director of The Ford Family Foundation. | |
36
Morgan Stanley Institutional Fund, Inc.
Annual Report — December 31, 2016
Director and Officer Information (unaudited) (cont'd)
Independent Directors: (cont'd)
Name, Age and Address of
Independent Director | | Position(s)
Held with
Registrant | | Length of Time
Served* | | Principal Occupation(s) During Past 5 Years
and Other Relevant Professional Experience | | Number of
Portfolios in
Fund Complex
Overseen by
Independent
Director** | | Other Directorships
Held by Independent
Director*** | |
Michael F. Klein (58)
c/o Perkins Coie LLP
Counsel to the Independent Directors
30 Rockefeller Plaza
New York, NY 10112 | | Director | | Since
August
2006 | | Managing Director, Aetos Capital, LLC (since March 2000); Co-President, Aetos Alternatives Management, LLC (since January 2004) and Co-Chief Executive Officer of Aetos Capital LLC (since August 2013); Chairperson of the Fixed Income Sub-Committee of the Investment Committee (since October 2006) and Director or Trustee of various Morgan Stanley Funds (since August 2006); formerly, Managing Director, Morgan Stanley & Co. Inc. and Morgan Stanley Dean Witter Investment Management, President, various Morgan Stanley Funds (June 1998-March 2000) and Principal, Morgan Stanley & Co. Inc. and Morgan Stanley Dean Witter Investment Management (August 1997-December 1999). | | | 90 | | | Director of certain investment funds managed or sponsored by Aetos Capital, LLC; Director of Sanitized AG and Sanitized Marketing AG (specialty chemicals). | |
Patricia Maleski (56)
c/o Perkins Coie LLP
Counsel to the Independent Directors
30 Rockefeller Plaza
New York, NY 10112 | | Director | | Since
January
2017 | | Management Director, JPMorgan Asset Management (2013-2016); President, JPMorgan Funds (2010-2013), Chief Administrative Officer, JPMorgan Funds (2004-2010), Treasurer, JPMorgan Funds (2003-2004, 2008-2010), and Vice President and Board Liaison, JPMorgan Funds (2001-2004); Managing Director, J.P. Morgan Investment Management Inc. (2001-2013); Vice President of Finance, Pierpont Group (1996-2001); Vice President, Bank of New York (1995-1996); Senior Audit Manager, Price Waterhouse, LLP (1982-1995). | | | 91 | | | None. | |
Michael E. Nugent (80)
522 Fifth Avenue
New York, NY 10036 | | Chair of the Board and Director | | Chair of the Boards since July 2006 and Director since July 1991 | | Chair of the Boards of various Morgan Stanley Funds (since July 2006); Chairperson of the Closed-End Fund Committee (since June 2012) and Director or Trustee of various Morgan Stanley Funds (since July 1991); formerly, Chairperson of the Insurance Committee (until July 2006); General Partner, Triumph Capital, L.P. (private investment partnership) (1988-2013). | | | 92 | | | None. | |
W. Allen Reed (69)
c/o Perkins Coie LLP
Counsel to the Independent Directors
30 Rockefeller Plaza
New York, NY 10112 | | Director | | Since
August
2006 | | Chairperson of the Equity Sub-Committee of the Investment Committee (since October 2006) and Director or Trustee of various Morgan Stanley Funds (since August 2006); formerly, President and CEO of General Motors Asset Management; Chairman and Chief Executive Officer of the GM Trust Bank and Corporate Vice President of General Motors Corporation (August 1994-December 2005). | | | 91 | | | Director of Legg Mason, Inc.; formerly, Director of the Auburn University Foundation (2010-2015). | |
Fergus Reid (84)
c/o Joe Pietryka, Inc.
85 Charles Colman Blvd.
Pawling, NY 12564 | | Director | | Since
June
1992 | | Chairman, Joe Pietryka, Inc.; Chairperson of the Governance Committee and Director or Trustee of various Morgan Stanley Funds (since June 1992). | | | 92 | | | Formerly, Trustee and Director of certain investment companies in the JP Morgan Fund Complex managed by JP Morgan Investment Management Inc. (1987-2012). | |
* This is the earliest date the Director began serving the Morgan Stanley Funds. Each Director serves an indefinite term, until his or her successor is elected.
** The Fund Complex includes (as of December 31, 2016) all open-end and closed-end funds (including all of their portfolios) advised by Morgan Stanley Investment Management Inc. (the "Adviser") and any funds that have an adviser that is an affiliated person of the Adviser (including, but not limited to, Morgan Stanley AIP GP LP).
*** This includes any directorships at public companies and registered investment companies held by the Director at any time during the past five years.
37
Morgan Stanley Institutional Fund, Inc.
Annual Report — December 31, 2016
Director and Officer Information (unaudited) (cont'd)
Executive Officers:
Name, Age and Address of Executive Officer | | Position(s) Held
with
Registrant | | Length of Time
Served* | | Principal Occupation(s) During Past 5 Years | |
John H. Gernon (53)
522 Fifth Avenue
New York, NY 10036 | | President and Principal Executive Officer | | Since
September
2013 | | President and Principal Executive Officer of the Equity and Fixed Income Funds and the Morgan Stanley AIP Funds (since September 2013) and the Liquidity Funds and various money market funds (since May 2014) in the Fund Complex; Managing Director of the Adviser; Head of Product (since 2006). | |
Timothy J. Knierim (58)
522 Fifth Avenue
New York, NY 10036 | | Chief Compliance Officer | | Since
December
2016 | | Managing Director of the Adviser and various entities affiliated with the Adviser; Chief Compliance Officer of various Morgan Stanley Funds and the Adviser (since December 2016) and Chief Compliance Officer of Morgan Stanley AIP GP LP (since 2014). Formerly, Managing Director and Deputy Chief Compliance Officer of the Adviser (2014-2016); and formerly, Chief Compliance Officer of Prudential Investment Management, Inc. (2007-2014). | |
Francis J. Smith (51)
522 Fifth Avenue
New York, NY 10036 | | Treasurer and Principal Financial Officer | | Treasurer since July 2003 and Principal Financial Officer since September 2002 | | Managing Director of the Adviser and various entities affiliated with the Adviser; Treasurer (since July 2003) and Principal Financial Officer of various Morgan Stanley Funds (since September 2002). | |
Mary E. Mullin (49)
522 Fifth Avenue
New York, NY 10036 | | Secretary | | Since
June
1999 | | Executive Director of the Adviser; Secretary of various Morgan Stanley Funds (since June 1999). | |
* This is the earliest date the officer began serving the Morgan Stanley Funds. Each officer serves a one-year term, until his or her successor is elected and qualifies.
38
Morgan Stanley Institutional Fund, Inc.
Annual Report — December 31, 2016
Adviser and Administrator
Morgan Stanley Investment Management Inc.
522 Fifth Avenue
New York, New York 10036
Distributor
Morgan Stanley Distribution, Inc.
522 Fifth Avenue
New York, New York 10036
Dividend Disbursing and Transfer Agent
Boston Financial Data Services, Inc.
2000 Crown Colony Drive
Quincy, Massachusetts 02169
Custodian
State Street Bank and Trust Company
One Lincoln Street
Boston, Massachusetts 02111
Legal Counsel
Dechert LLP
1095 Avenue of the Americas
New York, New York 10036
Counsel to the Independent Directors
Perkins Coie LLP
30 Rockefeller Plaza
New York, New York 10112
Independent Registered Public Accounting Firm
Ernst & Young LLP
200 Clarendon Street
Boston, Massachusetts 02116
Reporting to Shareholders
Each Morgan Stanley fund provides a complete schedule of portfolio holdings in its semi-annual and annual reports within 60 days of the end of the fund's second and fourth fiscal quarters. The semi-annual and annual reports are filed electronically with the Securities and Exchange Commission (SEC) on Form N-CSRS and Form N-CSR, respectively. Morgan Stanley also delivers the semi-annual and annual reports to fund shareholders and makes these reports available on its public website, www.morganstanley.com/im. Each Morgan Stanley fund also files a complete schedule of portfolio holdings with the SEC for the fund's first and third fiscal quarters on Form N-Q. Morgan Stanley does not deliver the reports for the first and third fiscal quarters to shareholders, nor are the reports posted to the Morgan Stanley public website. You may, however, obtain the Form N-Q filings (as well as the Form N-CSR and N-CSRS filings) by accessing the SEC's website, www.sec.gov. You may also review and copy them at the SEC's Public Reference Room in Washington, DC. Information on the operation of the SEC's Public Reference Room may be obtained by calling the SEC toll free at 1 (800) SEC-0330. You can also request copies of these materials, upon payment of a duplicating fee, by electronic request at the SEC's email address (publicinfo@sec.gov) or by writing the Public Reference Room of the SEC, 100 F Street, NE, Washington, DC 20549-0102.
Proxy Voting Policies and Procedures and Proxy Voting Record
You may obtain a copy of the Fund's Proxy Voting Policy and Procedures and information regarding how the Fund voted proxies relating to portfolio securities during the most recent twelve-month period ended June 30, without charge, upon request, by calling toll free 1 (800) 548-7786 or by visiting our website at www.morganstanley.com/im. This information is also available on the SEC's website at www.sec.gov.
This report is authorized for distribution only when preceded or accompanied by a prospectus or summary prospectus of the applicable Portfolio of Morgan Stanley Institutional Fund, Inc., which describes in detail the Portfolio's investment policies, risks, fees and expenses. Please read the prospectus carefully before you invest or send money. For additional information, including information regarding the investments comprising the Portfolio, please visit our website at www.morganstanley.com/im or call toll free 1 (800) 548-7786.
39
(This Page has been left blank intentionally.)
(This Page has been left blank intentionally.)
Printed in U.S.A.
This Report has been prepared for shareholders and may be distributed to others only if preceded or accompanied by a current prospectus.
Morgan Stanley Investment Management Inc
522 Fifth Avenue
New York, New York 10036
© 2017 Morgan Stanley. Morgan Stanley Distribution, Inc.

IFISCGANN
1696210 EXP. 02.28.18

Morgan Stanley Institutional Fund, Inc.
U.S. Real Estate Portfolio
Annual Report
December 31, 2016

Morgan Stanley Institutional Fund, Inc.
Annual Report — December 31, 2016
Shareholders' Letter | | | 2 | | |
Expense Example | | | 3 | | |
Investment Overview | | | 4 | | |
Portfolio of Investments | | | 7 | | |
Statement of Assets and Liabilities | | | 9 | | |
Statement of Operations | | | 11 | | |
Statements of Changes in Net Assets | | | 12 | | |
Financial Highlights | | | 14 | | |
Notes to Financial Statements | | | 19 | | |
Report of Independent Registered Public Accounting Firm | | | 27 | | |
Federal Tax Notice | | | 28 | | |
Privacy Notice | | | 29 | | |
Director and Officer Information | | | 32 | | |
This report is authorized for distribution only when preceded or accompanied by a prospectus or summary prospectus of the applicable Portfolio of Morgan Stanley Institutional Fund, Inc. To receive a prospectus and/or statement of additional information (SAI), which contains more complete information such as investment objectives, charges, expenses, policies for voting proxies, risk considerations, and describes in detail each of the Portfolio's investment policies to the prospective investor, please call toll free 1 (800) 548-7786. Please read the prospectuses carefully before you invest or send money.
Additionally, you can access information about the Portfolio, including performance, characteristics, and investment team commentary, through Morgan Stanley Investment Management's website: www.morganstanley.com/im.
Market forecasts provided in this report may not necessarily come to pass. There is no guarantee that any sectors mentioned will continue to perform as discussed herein or that securities in such sectors will be held by the Portfolio in the future. There is no assurance that a Portfolio will achieve its investment objective. Portfolios are subject to market risk, which is the possibility that market values of securities owned by the Portfolio will decline and, therefore, the value of the Portfolio's shares may be less than what you paid for them. Accordingly, you can lose money investing in this Portfolio. Please see the prospectus for more complete information on investment risks.
1
Morgan Stanley Institutional Fund, Inc.
Annual Report — December 31, 2016
Shareholders' Letter (unaudited)
Dear Shareholders,
We are pleased to provide this Annual report, in which you will learn how your investment in U.S. Real Estate Portfolio (the "Portfolio") performed during the latest twelve-month period.
Morgan Stanley Investment Management is a client-centric, investor-led organization. Our global presence, intellectual capital, and breadth of products and services enable us to partner with investors to meet the evolving challenges of today's financial markets. We aim to deliver superior investment service and to empower our clients to make the informed decisions that help them reach their investment goals.
As always, we thank you for selecting Morgan Stanley Investment Management, and look forward to working with you in the months and years ahead.
Sincerely,

John H. Gernon
President and Principal Executive Officer
January 2017
2
Morgan Stanley Institutional Fund, Inc.
Annual Report — December 31, 2016
Expense Example (unaudited)
U.S. Real Estate Portfolio
As a shareholder of the Portfolio, you incur two types of costs: (1) transactional costs; and (2) ongoing costs, which may include advisory fees, administration fees, distribution and shareholder services fees and other Portfolio expenses. This example is intended to help you understand your ongoing costs (in dollars) of investing in the Portfolio and to compare these costs with the ongoing costs of investing in other mutual funds.
This example is based on an investment of $1,000 invested at the beginning of the six-month period ended December 31, 2016 and held for the entire six-month period.
Actual Expenses
The table below provides information about actual account values and actual expenses. You may use the information in this table, together with the amount you invested, to estimate the expenses that you paid over the period. Simply divide your account value by $1,000 (for example, an $8,600 account value divided by $1,000 = 8.6), then multiply the result by the number in the table under the heading entitled "Actual Expenses Paid During Period" to estimate the expenses you paid on your account during this period.
Hypothetical Example for Comparison Purposes
The table below provides information about hypothetical account values and hypothetical expenses based on the Portfolio's actual expense ratio and an assumed rate of return of 5% per year before expenses, which is not the Portfolio's actual return. The hypothetical account values and expenses may not be used to estimate the actual ending account balance or expenses you paid for the period. You may use this information to compare the ongoing costs of investing in the Portfolio and other funds. To do so, compare this 5% hypothetical example with the 5% hypothetical examples that appear in the shareholder reports of the other funds.
Please note that the expenses shown in the table are meant to highlight your ongoing costs only and do not reflect any transactional costs, such as sales charges (loads). Therefore, the information for each class in the table is useful in comparing ongoing costs only, and will not help you determine the relative total costs of owning different funds. In addition, if these transactional costs were included, your costs would have been higher.
| | | Beginning
Account
Value
7/1/16 | | Actual Ending
Account
Value
12/31/16 | | Hypothetical
Ending Account
Value | | Actual
Expenses
Paid
During
Period* | | Hypothetical
Expenses Paid
During Period* | | Net
Expense
Ratio
During
Period** | |
U.S. Real Estate Portfolio Class I | | $ | 1,000.00 | | | $ | 969.70 | | | $ | 1,020.16 | | | $ | 4.90 | | | $ | 5.03 | | | | 0.99 | %*** | |
U.S. Real Estate Portfolio Class A | | | 1,000.00 | | | | 968.30 | | | | 1,018.65 | | | | 6.38 | | | | 6.55 | | | | 1.29 | *** | |
U.S. Real Estate Portfolio Class L | | | 1,000.00 | | | | 965.90 | | | | 1,015.94 | | | | 9.04 | | | | 9.27 | | | | 1.83 | *** | |
U.S. Real Estate Portfolio Class C | | | 1,000.00 | | | | 964.90 | | | | 1,014.63 | | | | 10.32 | | | | 10.58 | | | | 2.09 | *** | |
U.S. Real Estate Portfolio Class IS | | | 1,000.00 | | | | 970.60 | | | | 1,020.66 | | | | 4.41 | | | | 4.52 | | | | 0.89 | *** | |
* Expenses are calculated using each Portfolio Class' annualized net expense ratio (as disclosed), multiplied by the average account value over the period, and multiplied by 184/366 (to reflect the most recent one-half year period).
** Annualized.
*** Refer to Note F in the Notes to Financial Statements for discussion of prior period custodian out-of-pocket expenses that were reimbursed in the current period.
3
Morgan Stanley Institutional Fund, Inc.
Annual Report — December 31, 2016
Investment Overview (unaudited)
U.S. Real Estate Portfolio
The Portfolio seeks to provide above average current income and long-term capital appreciation by investing primarily in equity securities of companies in the U.S. real estate industry, including real estate investment trusts ("REITs").
Performance
For the year ended December 31, 2016, the Portfolio's Class I shares had a total return based on net asset value and reinvestment of distributions per share of 6.79%, net of fees. The Portfolio's Class I shares underperformed against the Portfolio's benchmark, the FTSE NAREIT Equity REITs Index (the "Index"), which returned 8.52%, and underperformed the S&P 500® Index, which returned 11.96%.
Factors Affecting Performance
• The REITs market gained 8.52% in the 12-month period ending December 31, 2016, as measured by the Index. The key driver of Portfolio underperformance relative to the Index was the first half of 2016 when investors held a dramatic preference for yield-oriented stocks and/or market segments with perceived defensive characteristics, irrespective of underlying valuations, in a lower-for-longer interest rate environment, and appeared to rotate away from segments where cash flows were viewed as more economically sensitive despite trading at very attractive discounted valuations. In the second half of 2016, the Portfolio outperformed amid a partial reversal of the lower-for-longer investment theme and building enthusiasm for better economic growth, but this was not sufficient to offset underperformance in the first half of the year.
• Among the major sectors, the office sector outperformed and the apartment and retail sectors underperformed the Index. Within the office sector, companies with exposure to secondary central business district ("CBD")/suburban assets significantly outperformed the Index, while the primary CBD companies modestly underperformed the Index. The apartment sector appeared to underperform for the year due to the decelerating pace of net operating income growth, primarily due to weaker revenue growth in New York City and northern California markets, which are currently absorbing elevated supply deliveries. The retail sector significantly underperformed as both mall and shopping center owners underperformed the
Index as a result of concerns with regard to department store closures and specialty retailer bankruptcies resulting in additional store closures. This negative investor sentiment caused the malls to be among the weakest performers for the full year. The health care REITs significantly underperformed the Index in the fourth quarter as this sector had been a key beneficiary of the lower-for-longer investment theme, which had a partial reversal in the quarter. This fourth quarter weakness, along with operational challenges faced by health care companies in 2016, caused the sector to modestly underperform the Index for the full year. Among the smaller sectors, the hotel sector posted strong outperformance due to building enthusiasm for better economic growth, which could lead to improved corporate travel demand. The data center and industrial stocks were among the best-performing sectors for the full year, while the storage sector was the weakest. Finally, the net lease REITs posted strong outperformance for the full year despite significantly underperforming the Index in the fourth quarter, due to the partial reversal of the lower-for-longer investment theme.
• The Portfolio underperformed the Index for the period. Favorable bottom-up stock selection was more than offset by underperformance from top-down sector allocation relative to the Index. From a bottom-up perspective, the Portfolio achieved favorable relative stock selection in the hotel, health care and mall sectors. From a top-down perspective, the overweight to the hotel sector and underweight to the storage sector contributed to relative performance. This was more than offset by the overweight to the mall sector and underweight to the data center, industrial and net lease sectors, which detracted from performance.
Management Strategies
• We have maintained our core investment philosophy as a real estate value investor. This results in the ownership of stocks whose share prices we believe provide real estate exposure at the best valuation relative to their underlying asset values. We continue to focus on relative implied valuations as a key metric. Our company-specific research leads us to an overweighting in the Portfolio to a group of companies that are focused in the ownership of high quality malls, primary CBD
4
Morgan Stanley Institutional Fund, Inc.
Annual Report — December 31, 2016
Investment Overview (unaudited) (cont'd)
U.S. Real Estate Portfolio
office assets, apartments, and a number of out-of-favor companies, and an underweighting to companies concentrated in the ownership of net lease, data center, and health care assets.
• Our outlook for the REIT market is based on two key factors: private market pricing for underlying real estate assets and public market pricing for the securities. With asset values for high-quality assets having fully recovered and now, on average, approximately 20% in excess of peak levels achieved in 2007, the overall REIT market ended the year trading at a slight premium to net asset values ("NAVs").(i) We see attractive value in several key property sectors with malls and New York City office trading at the most significant discounts to NAVs. However, there is a disparity in valuations as sectors with perceived defensive characteristics and/or providing higher dividends (e.g., health care, net lease) are trading at significant premiums to NAVs. Excluding the health care and net lease stocks, the REIT sector ended the year trading at a 4% discount to NAVs.(i)
(i) Source: Morgan Stanley Investment Management as of ending date December 31, 2016

* Minimum Investment for Class I shares
In accordance with SEC regulations, the Portfolio's performance shown assumes that all recurring fees (including management fees) were deducted and all dividends and distributions were reinvested. The performance of Class A, L, C and IS shares will vary from the performance of Class I shares based upon their different inception dates and will be negatively impacted by additional fees assessed to those classes (if applicable).
5
Morgan Stanley Institutional Fund, Inc.
Annual Report — December 31, 2016
Investment Overview (unaudited) (cont'd)
U.S. Real Estate Portfolio
Performance Compared to the FTSE NAREIT Equity REITs Index(1), the S&P 500® Index(2), and the Lipper Real Estate Funds Average(3)
| | | Period Ended December 31, 2016
Total Returns(4) | |
| | | | | Average Annual | |
| | | One
Year | | Five
Years | | Ten
Years | | Since
Inception(10) | |
Portfolio — Class I Shares
w/o sales charges(5) | | | 6.79 | % | | | 11.21 | % | | | 4.55 | % | | | 12.35 | % | |
Portfolio — Class A Shares
w/o sales charges(6) | | | 6.47 | | | | 10.89 | | | | 4.26 | | | | 11.52 | | |
Portfolio — Class A Shares with
maximum 5.25% sales charges(6) | | | 0.85 | | | | 9.71 | | | | 3.70 | | | | 11.23 | | |
Portfolio — Class L Shares
w/o sales charges(7) | | | 5.91 | | | | 10.32 | | | | — | | | | 10.29 | | |
Portfolio — Class C Shares
w/o sales charges(9) | | | 5.72 | | | | — | | | | — | | | | 5.04 | | |
Portfolio — Class C Shares with
maximum 1.00% deferred
sales charges(9) | | | 4.76 | | | | — | | | | — | | | | 5.04 | | |
Portfolio — Class IS Shares
w/o sales charges(8) | | | 6.96 | | | | — | | | | — | | | | 11.61 | | |
FTSE NAREIT Equity REITs Index | | | 8.52 | | | | 12.01 | | | | 5.08 | | | | 11.05 | | |
S&P 500® Index | | | 11.96 | | | | 14.66 | | | | 6.95 | | | | 9.29 | | |
Lipper Real Estate Funds Average | | | 7.03 | | | | 10.84 | | | | 4.30 | | | | 10.91 | | |
Performance data quoted represents past performance, which is no guarantee of future results, and current performance may be lower or higher than the figures shown. Performance assumes that all dividends and distributions, if any, were reinvested. For the most recent month-end performance figures, please visit www.morganstanley.com/im. Investment return and principal value will fluctuate so that Portfolio shares, when redeemed, may be worth more or less than their original cost. Total returns do not reflect the deduction of taxes that a shareholder would pay on Portfolio distributions or the redemption of Portfolio shares. Performance of share classes will vary due to difference in sales charges and expenses.
(1) The FTSE NAREIT (National Association of Real Estate Investment Trusts) Equity REITs Index is a free float-adjusted market capitalization weighted index of tax-qualified REITs listed on the New York Stock Exchange, NYSE Amex and the NASDAQ National Market Systems. Effective December 20, 2010, the FTSE NAREIT Equity REITs Index will not include "Timber REITs". The Index is unmanaged and its returns do not include any sales charges or fees. Such costs would lower performance. It is not possible to invest directly in an index.
(2) The Standard & Poor's 500® Index (S&P 500®) measures the performance of the large cap segment of the U.S. equities market, covering approximately 80% of the U.S. equities market. The Index includes 500 leading companies in leading industries of the U.S. economy. The Index is unmanaged and its returns do not include any sales charges or fees. Such costs would lower performance. It is not possible to invest directly in an index.
(3) The Lipper Real Estate Funds Average tracks the performance of all funds in the Lipper Real Estate Funds classification. The Average, which is adjusted for capital gains distributions and income dividends, is unmanaged and should not be considered an investment. As of the date of this report, the Portfolio is in the Lipper Real Estate Funds classification.
(4) Total returns for the Portfolio reflect fees waived and expenses reimbursed, if applicable, by the Adviser. Without such waivers and reimbursements, total returns would have been lower.
(5) Commenced operations on February 24, 1995.
(6) Commenced offering on January 2, 1996.
(7) Commenced offering on November 11, 2011.
(8) Commenced offering on September 13, 2013.
(9) Commenced offering on April 30, 2015.
(10) For comparative purposes, average annual since inception returns listed for the Indexes refer to the inception date of Class I of the Portfolio, not the inception of the Index.
6
Morgan Stanley Institutional Fund, Inc.
Annual Report — December 31, 2016
Portfolio of Investments
U.S. Real Estate Portfolio
| | | Shares | | Value
(000) | |
Common Stocks (98.9%) | |
Apartments (17.8%) | |
Apartment Investment & Management Co.,
Class A REIT | | | 141,533 | | | $ | 6,433 | | |
AvalonBay Communities, Inc. REIT | | | 197,163 | | | | 34,927 | | |
Camden Property Trust REIT | | | 203,773 | | | | 17,131 | | |
Equity Residential REIT | | | 900,306 | | | | 57,944 | | |
Essex Property Trust, Inc. REIT | | | 86,660 | | | | 20,148 | | |
Monogram Residential Trust, Inc. REIT | | | 18,912 | | | | 205 | | |
| | | | 136,788 | | |
Data Centers (2.0%) | |
Digital Realty Trust, Inc. REIT | | | 61,190 | | | | 6,013 | | |
QTS Realty Trust, Inc., Class A REIT | | | 192,578 | | | | 9,561 | | |
| | | | 15,574 | | |
Diversified (7.3%) | |
Vornado Realty Trust REIT | | | 539,626 | | | | 56,321 | | |
Free Standing (2.2%) | |
National Retail Properties, Inc. REIT | | | 227,451 | | | | 10,053 | | |
Spirit Realty Capital, Inc. REIT | | | 143,100 | | | | 1,554 | | |
STORE Capital Corp. REIT | | | 217,782 | | | | 5,382 | | |
| | | | 16,989 | | |
Health Care (8.8%) | |
Healthcare Realty Trust, Inc. REIT | | | 163,574 | | | | 4,959 | | |
MedEquities Realty Trust, Inc. REIT | | | 107,536 | | | | 1,194 | | |
Senior Housing Properties Trust REIT | | | 225,253 | | | | 4,264 | | |
Ventas, Inc. REIT | | | 443,821 | | | | 27,748 | | |
Welltower, Inc. REIT | | | 437,924 | | | | 29,310 | | |
| | | | 67,475 | | |
Industrial (4.7%) | |
Cabot Industrial Value Fund II, LP REIT (a)(b)(c)(d)
(See Note A-4) | | | 14,000 | | | | 8,491 | | |
Duke Realty Corp. REIT | | | 202,425 | | | | 5,376 | | |
Exeter Industrial Value Fund, LP REIT (a)(b)(c)(d)
(See Note A-4) | | | 7,905,000 | | | | 2,292 | | |
Liberty Property Trust REIT | | | 11,657 | | | | 460 | | |
ProLogis, Inc. REIT | | | 263,566 | | | | 13,914 | | |
Rexford Industrial Realty, Inc. REIT | | | 231,736 | | | | 5,374 | | |
| | | | 35,907 | | |
Lodging/Resorts (8.1%) | |
Chesapeake Lodging Trust REIT | | | 231,818 | | | | 5,995 | | |
Hilton Worldwide Holdings, Inc. | | | 509,050 | | | | 13,846 | | |
Host Hotels & Resorts, Inc. REIT | | | 1,525,783 | | | | 28,746 | | |
LaSalle Hotel Properties REIT | | | 341,056 | | | | 10,392 | | |
Xenia Hotels & Resorts, Inc. REIT | | | 173,956 | | | | 3,378 | | |
| | | | 62,357 | | |
Manufactured Homes (0.3%) | |
Equity Lifestyle Properties, Inc. REIT | | | 35,099 | | | | 2,531 | | |
Office (12.6%) | |
Boston Properties, Inc. REIT | | | 340,205 | | | | 42,791 | | |
BRCP REIT II, LP (a)(b)(c)(d) (See Note A-4) | | | 8,363,574 | | | | 3,755 | | |
Columbia Property Trust, Inc. REIT | | | 127,192 | | | | 2,748 | | |
| | | Shares | | Value
(000) | |
Corporate Office Properties Trust REIT | | | 66,794 | | | $ | 2,085 | | |
Cousins Properties, Inc. REIT | | | 591,875 | | | | 5,037 | | |
Douglas Emmett, Inc. REIT | | | 243,188 | | | | 8,891 | | |
Hudson Pacific Properties, Inc. REIT | | | 426,228 | | | | 14,824 | | |
Mack-Cali Realty Corp. REIT | | | 29,492 | | | | 856 | | |
Paramount Group, Inc. REIT | | | 546,581 | | | | 8,740 | | |
Parkway, Inc. REIT (a) | | | 187,200 | | | | 4,165 | | |
SL Green Realty Corp. REIT | | | 31,800 | | | | 3,420 | | |
| | | | 97,312 | | |
Regional Malls (18.2%) | |
CBL & Associates Properties, Inc. REIT | | | 30,565 | | | | 351 | | |
General Growth Properties, Inc. REIT | | | 1,335,781 | | | | 33,368 | | |
Simon Property Group, Inc. REIT | | | 578,677 | | | | 102,814 | | |
Taubman Centers, Inc. REIT | | | 52,555 | | | | 3,885 | | |
| | | | 140,418 | | |
Self Storage (6.9%) | |
CubeSmart REIT | | | 135,369 | | | | 3,624 | | |
Life Storage, Inc. REIT | | | 118,465 | | | | 10,100 | | |
Public Storage REIT | | | 177,093 | | | | 39,580 | | |
| | | | 53,304 | | |
Shopping Centers (9.0%) | |
Acadia Realty Trust REIT | | | 36,247 | | | | 1,185 | | |
Brixmor Property Group, Inc. REIT | | | 162,740 | | | | 3,974 | | |
DDR Corp. REIT | | | 68,752 | | | | 1,050 | | |
Equity One, Inc. REIT | | | 221,380 | | | | 6,794 | | |
Federal Realty Investment Trust REIT | | | 23,499 | | | | 3,339 | | |
Kimco Realty Corp. REIT | | | 329,730 | | | | 8,296 | | |
Regency Centers Corp. REIT | | | 406,728 | | | | 28,044 | | |
Tanger Factory Outlet Centers, Inc. REIT | | | 461,629 | | | | 16,517 | | |
| | | | 69,199 | | |
Single Family Homes (0.2%) | |
American Homes 4 Rent, Class A REIT | | | 64,420 | | | | 1,352 | | |
Specialty (0.8%) | |
Gaming and Leisure Properties, Inc. REIT | | | 207,353 | | | | 6,349 | | |
Total Common Stocks (Cost $531,041) | | | 761,876 | | |
Short-Term Investment (0.7%) | |
Investment Company (0.7%) | |
Morgan Stanley Institutional Liquidity
Funds — Treasury Portfolio —
Institutional Class (See Note G)
(Cost $5,194) | | | 5,193,844 | | | | 5,194 | | |
Total Investments (99.6%) (Cost $536,235) (e) | | | 767,070 | | |
Other Assets in Excess of Liabilities (0.4%) | | | 3,367 | | |
Net Assets (100.0%) | | $ | 770,437 | | |
(a) Non-income producing security.
(b) At December 31, 2016, the Portfolio held fair valued securities valued at approximately $14,538,000, representing 1.9% of net assets. These securities have been fair valued as determined in good faith under procedures established by and under the general supervision of the Fund's Directors.
The accompanying notes are an integral part of the financial statements.
7
Morgan Stanley Institutional Fund, Inc.
Annual Report — December 31, 2016
Portfolio of Investments (cont'd)
U.S. Real Estate Portfolio
(c) Security has been deemed illiquid at December 31, 2016.
(d) Restricted security valued at fair value and not registered under the Securities Act of 1933. BRCP REIT II, LP was acquired between 10/06 - 4/11 and has a current cost basis of approximately $5,523,000. Cabot Industrial Value Fund II, LP was acquired between 11/05 - 2/10 and has a current cost basis of approximately $6,867,000. Exeter Industrial Value Fund, LP was acquired between 11/07 - 4/11 and has a current cost basis of approximately $245,000. At December 31, 2016, these securities had an aggregate market value of approximately $14,538,000, representing 1.9% of net assets.
(e) At December 31, 2016, the aggregate cost for federal income tax purposes is approximately $541,455,000. The aggregate gross unrealized appreciation is approximately $230,456,000 and the aggregate gross unrealized depreciation is approximately $4,841,000, resulting in net unrealized appreciation of approximately $225,615,000.
REIT Real Estate Investment Trust.
Portfolio Composition
Classification | | Percentage of
Total Investments | |
Regional Malls | | | 18.3 | % | |
Apartments | | | 17.8 | | |
Office | | | 12.7 | | |
Other* | | | 10.9 | | |
Shopping Centers | | | 9.0 | | |
Health Care | | | 8.8 | | |
Lodging/Resorts | | | 8.1 | | |
Diversified | | | 7.4 | | |
Self Storage | | | 7.0 | | |
Total Investments | | | 100.0 | % | |
* Industries and/or investment types representing less than 5% of total investments.
The accompanying notes are an integral part of the financial statements.
8
Morgan Stanley Institutional Fund, Inc.
Annual Report — December 31, 2016
U.S. Real Estate Portfolio
Statement of Assets and Liabilities | | December 31, 2016
(000) | |
Assets: | |
Investments in Securities of Unaffiliated Issuers, at Value (Cost $531,041) | | $ | 761,876 | | |
Investment in Security of Affiliated Issuer, at Value (Cost $5,194) | | | 5,194 | | |
Total Investments in Securities, at Value (Cost $536,235) | | | 767,070 | | |
Foreign Currency, at value (Cost $1) | | | — | @ | |
Receivable for Investments Sold | | | 5,675 | | |
Dividends Receivable | | | 3,228 | | |
Receivable for Portfolio Shares Sold | | | 813 | | |
Receivable from Affiliate | | | 2 | | |
Other Assets | | | 85 | | |
Total Assets | | | 776,873 | | |
Liabilities: | |
Payable for Portfolio Shares Redeemed | | | 3,902 | | |
Payable for Advisory Fees | | | 1,486 | | |
Payable for Investments Purchased | | | 684 | | |
Payable for Sub Transfer Agency Fees — Class I | | | 115 | | |
Payable for Sub Transfer Agency Fees — Class A | | | 19 | | |
Payable for Sub Transfer Agency Fees — Class L | | | 1 | | |
Payable for Sub Transfer Agency Fees — Class C | | | — | @ | |
Payable for Administration Fees | | | 52 | | |
Payable for Professional Fees | | | 42 | | |
Payable for Directors' Fees and Expenses | | | 25 | | |
Payable for Shareholder Services Fees — Class A | | | 16 | | |
Payable for Distribution and Shareholder Services Fees — Class L | | | 2 | | |
Payable for Distribution and Shareholder Services Fees — Class C | | | — | @ | |
Payable for Transfer Agency Fees — Class I | | | 8 | | |
Payable for Transfer Agency Fees — Class A | | | 4 | | |
Payable for Transfer Agency Fees — Class L | | | 1 | | |
Payable for Transfer Agency Fees — Class C | | | — | @ | |
Payable for Transfer Agency Fees — Class IS | | | — | @ | |
Payable for Custodian Fees | | | 10 | | |
Bank Overdraft | | | 2 | | |
Other Liabilities | | | 67 | | |
Total Liabilities | | | 6,436 | | |
Net Assets | | $ | 770,437 | | |
Net Assets Consist Of: | |
Paid-in-Capital | | $ | 536,621 | | |
Accumulated Undistributed Net Investment Income | | | 821 | | |
Accumulated Net Realized Gain | | | 2,160 | | |
Unrealized Appreciation (Depreciation) on: | |
Investments | | | 230,835 | | |
Foreign Currency Translations | | | (— | @) | |
Net Assets | | $ | 770,437 | | |
The accompanying notes are an integral part of the financial statements.
9
Morgan Stanley Institutional Fund, Inc.
Annual Report — December 31, 2016
U.S. Real Estate Portfolio
Statement of Assets and Liabilities (cont'd) | | December 31, 2016
(000) | |
CLASS I: | |
Net Assets | | $ | 494,967 | | |
| Shares Outstanding $0.001 par value shares of beneficial interest (unlimited shares authorized) (not in 000's) | | | 28,756,478 | | |
Net Asset Value, Offering and Redemption Price Per Share | | $ | 17.21 | | |
CLASS A: | |
Net Assets | | $ | 76,082 | | |
| Shares Outstanding $0.001 par value shares of beneficial interest (unlimited shares authorized) (not in 000's) | | | 4,544,424 | | |
Net Asset Value, Redemption Price Per Share | | $ | 16.74 | | |
Maximum Sales Load | | | 5.25 | % | |
Maximum Sales Charge | | $ | 0.93 | | |
Maximum Offering Price Per Share | | $ | 17.67 | | |
CLASS L: | |
Net Assets | | $ | 3,471 | | |
| Shares Outstanding $0.001 par value shares of beneficial interest (unlimited shares authorized) (not in 000's) | | | 207,477 | | |
Net Asset Value, Offering and Redemption Price Per Share | | $ | 16.73 | | |
CLASS C: | |
Net Assets | | $ | 427 | | |
| Shares Outstanding $0.001 par value shares of beneficial interest (unlimited shares authorized) (not in 000's) | | | 25,640 | | |
Net Asset Value, Offering and Redemption Price Per Share | | $ | 16.67 | | |
CLASS IS: | |
Net Assets | | $ | 195,490 | | |
| Shares Outstanding $0.001 par value shares of beneficial interest (unlimited shares authorized) (not in 000's) | | | 11,355,793 | | |
Net Asset Value, Offering and Redemption Price Per Share | | $ | 17.22 | | |
@ Amount is less than $500.
The accompanying notes are an integral part of the financial statements.
10
Morgan Stanley Institutional Fund, Inc.
Annual Report — December 31, 2016
U.S. Real Estate Portfolio
Statement of Operations | | Year Ended
December 31, 2016
(000) | |
Investment Income: | |
Dividends from Securities of Unaffiliated Issuers | | $ | 22,195 | | |
Dividends from Security of Affiliated Issuer (Note G) | | | 44 | | |
Total Investment Income | | | 22,239 | | |
Expenses: | |
Advisory Fees (Note B) | | | 6,407 | | |
Sub Transfer Agency Fees — Class I | | | 631 | | |
Sub Transfer Agency Fees — Class A | | | 115 | | |
Sub Transfer Agency Fees — Class L | | | 4 | | |
Sub Transfer Agency Fees — Class C | | | — | @ | |
Administration Fees (Note C) | | | 657 | | |
Shareholder Services Fees — Class A (Note D) | | | 215 | | |
Distribution and Shareholder Services Fees — Class L (Note D) | | | 29 | | |
Distribution and Shareholder Services Fees — Class C (Note D) | | | 2 | | |
Registration Fees | | | 99 | | |
Professional Fees | | | 85 | | |
Shareholder Reporting Fees | | | 79 | | |
Transfer Agency Fees — Class I (Note E) | | | 31 | | |
Transfer Agency Fees — Class A (Note E) | | | 15 | | |
Transfer Agency Fees — Class L (Note E) | | | 3 | | |
Transfer Agency Fees — Class C (Note E) | | | 2 | | |
Transfer Agency Fees — Class IS (Note E) | | | 2 | | |
Custodian Fees (Note F) | | | 24 | | |
Directors' Fees and Expenses | | | 21 | | |
Pricing Fees | | | 4 | | |
Other Expenses | | | 30 | | |
Total Expenses | | | 8,455 | | |
Reimbursement of Class Specific Expenses — Class I (Note B) | | | (82 | ) | |
Reimbursement of Class Specific Expenses — Class C (Note B) | | | (2 | ) | |
Rebate from Morgan Stanley Affiliate (Note G) | | | (33 | ) | |
Reimbursement of Custodian Fees (Note F) | | | (37 | ) | |
Net Expenses | | | 8,301 | | |
Net Investment Income | | | 13,938 | | |
Realized Gain: | |
Investments Sold | | | 52,824 | | |
Change in Unrealized Appreciation (Depreciation): | |
Investments | | | (13,149 | ) | |
Foreign Currency Translations | | | — | @ | |
Net Change in Unrealized Appreciation (Depreciation) | | | (13,149 | ) | |
Net Realized Gain and Change in Unrealized Appreciation (Depreciation) | | | 39,675 | | |
Net Increase in Net Assets Resulting from Operations | | $ | 53,613 | | |
@ Amount is less than $500.
The accompanying notes are an integral part of the financial statements.
11
Morgan Stanley Institutional Fund, Inc.
Annual Report — December 31, 2016
U.S. Real Estate Portfolio
Statements of Changes in Net Assets | | Year Ended
December 31, 2016
(000) | | Year Ended
December 31, 2015
(000) | |
Increase (Decrease) in Net Assets: | |
Operations: | |
Net Investment Income | | $ | 13,938 | | | $ | 15,592 | | |
Net Realized Gain | | | 52,824 | | | | 113,715 | | |
Net Change in Unrealized Appreciation (Depreciation) | | | (13,149 | ) | | | (109,098 | ) | |
Net Increase in Net Assets Resulting from Operations | | | 53,613 | | | | 20,209 | | |
Distributions from and/or in Excess of: | |
Class I: | |
Net Investment Income | | | (10,756 | ) | | | (8,675 | ) | |
Net Realized Gain | | | (42,079 | ) | | | (89,446 | ) | |
Class A: | |
Net Investment Income | | | (1,446 | ) | | | (982 | ) | |
Net Realized Gain | | | (6,682 | ) | | | (13,045 | ) | |
Class L: | |
Net Investment Income | | | (45 | ) | | | (20 | ) | |
Net Realized Gain | | | (303 | ) | | | (586 | ) | |
Class C: | |
Net Investment Income | | | (3 | ) | | | (— | @) | |
Net Realized Gain | | | (21 | ) | | | (11 | ) | |
Class IS: | |
Net Investment Income | | | (3,742 | ) | | | (2,237 | ) | |
Net Realized Gain | | | (15,246 | ) | | | (20,229 | ) | |
Total Distributions | | | (80,323 | ) | | | (135,231 | ) | |
Capital Share Transactions:(1) | |
Class I: | |
Subscribed | | | 89,531 | | | | 111,705 | | |
Distributions Reinvested | | | 52,022 | | | | 96,912 | | |
Redeemed | | | (257,414 | ) | | | (458,721 | ) | |
Class A: | |
Subscribed | | | 20,770 | | | | 22,527 | | |
Distributions Reinvested | | | 8,073 | | | | 13,932 | | |
Redeemed | | | (37,132 | ) | | | (44,080 | ) | |
Class L: | |
Exchanged | | | 4 | | | | — | | |
Subscribed | | | — | | | | 164 | | |
Distributions Reinvested | | | 346 | | | | 601 | | |
Redeemed | | | (740 | ) | | | (1,151 | ) | |
Class C: | |
Subscribed | | | 404 | | | | 92 | * | |
Distributions Reinvested | | | 22 | | | | 10 | * | |
Redeemed | | | (72 | ) | | | — | | |
Class IS: | |
Subscribed | | | 89,169 | | | | 232,226 | | |
Distributions Reinvested | | | 3,809 | | | | — | @ | |
Redeemed | | | (30,860 | ) | | | (60,663 | ) | |
Net Decrease in Net Assets Resulting from Capital Share Transactions | | | (62,068 | ) | | | (86,446 | ) | |
Total Decrease in Net Assets | | | (88,778 | ) | | | (201,468 | ) | |
Net Assets: | |
Beginning of Period | | | 859,215 | | | | 1,060,683 | | |
End of Period (Including Accumulated Undistributed Net Investment Income of $821 and $4,521) | | $ | 770,437 | | | $ | 859,215 | | |
The accompanying notes are an integral part of the financial statements.
12
Morgan Stanley Institutional Fund, Inc.
Annual Report — December 31, 2016
U.S. Real Estate Portfolio
Statements of Changes in Net Assets (cont'd) | | Year Ended
December 31, 2016
(000) | | Year Ended
December 31, 2015
(000) | |
(1) Capital Share Transactions: | |
Class I: | |
Shares Subscribed | | | 4,857 | | | | 5,439 | | |
Shares Issued on Distributions Reinvested | | | 2,935 | | | | 5,342 | | |
Shares Redeemed | | | (14,086 | ) | | | (22,044 | ) | |
Net Decrease in Class I Shares Outstanding | | | (6,294 | ) | | | (11,263 | ) | |
Class A: | |
Shares Subscribed | | | 1,161 | | | | 1,132 | | |
Shares Issued on Distributions Reinvested | | | 468 | | | | 788 | | |
Shares Redeemed | | | (2,106 | ) | | | (2,260 | ) | |
Net Decrease in Class A Shares Outstanding | | | (477 | ) | | | (340 | ) | |
Class L: | |
Shares Exchanged | | | — | @@ | | | — | | |
Shares Subscribed | | | — | | | | 8 | | |
Shares Issued on Distributions Reinvested | | | 20 | | | | 34 | | |
Shares Redeemed | | | (42 | ) | | | (58 | ) | |
Net Decrease in Class L Shares Outstanding | | | (22 | ) | | | (16 | ) | |
Class C: | |
Shares Subscribed | | | 23 | | | | 4 | * | |
Shares Issued on Distributions Reinvested | | | 1 | | | | 1 | * | |
Shares Redeemed | | | (4 | ) | | | — | | |
Net Increase in Class C Shares Outstanding | | | 20 | | | | 5 | | |
Class IS: | |
Shares Subscribed | | | 4,903 | | | | 10,956 | | |
Shares Issued on Distributions Reinvested | | | 218 | | | | — | @@ | |
Shares Redeemed | | | (1,696 | ) | | | (3,025 | ) | |
Net Increase in Class IS Shares Outstanding | | | 3,425 | | | | 7,931 | | |
* For the period April 30, 2015 through December 31, 2015.
@ Amount is less than $500.
@@ Amount is less than 500 shares.
The accompanying notes are an integral part of the financial statements.
13
Morgan Stanley Institutional Fund, Inc.
Annual Report — December 31, 2016
Financial Highlights
U.S. Real Estate Portfolio
| | | Class I | |
| | | Year Ended December 31, | |
Selected Per Share Data and Ratios | | 2016(1) | | 2015 | | 2014 | | 2013 | | 2012 | |
Net Asset Value, Beginning of Period | | $ | 17.86 | | | $ | 20.48 | | | $ | 16.55 | | | $ | 16.93 | | | $ | 14.99 | | |
Income from Investment Operations: | |
Net Investment Income (2) | | | 0.31 | | | | 0.32 | | | | 0.36 | | | | 0.27 | | | | 0.24 | | |
Net Realized and Unrealized Gain | | | 0.91 | | | | 0.10 | | | | 4.66 | | | | 0.14 | | | | 2.19 | | |
Total from Investment Operations | | | 1.22 | | | | 0.42 | | | | 5.02 | | | | 0.41 | | | | 2.43 | | |
Distributions from and/or in Excess of: | |
Net Investment Income | | | (0.38 | ) | | | (0.26 | ) | | | (0.35 | ) | | | (0.20 | ) | | | (0.20 | ) | |
Net Realized Gain | | | (1.49 | ) | | | (2.78 | ) | | | (0.74 | ) | | | (0.59 | ) | | | (0.29 | ) | |
Total Distributions | | | (1.87 | ) | | | (3.04 | ) | | | (1.09 | ) | | | (0.79 | ) | | | (0.49 | ) | |
Net Asset Value, End of Period | | $ | 17.21 | | | $ | 17.86 | | | $ | 20.48 | | | $ | 16.55 | | | $ | 16.93 | | |
Total Return (3) | | | 6.79 | % | | | 2.27 | % | | | 30.74 | % | | | 2.45 | % | | | 16.26 | % | |
Ratios and Supplemental Data: | |
Net Assets, End of Period (Thousands) | | $ | 494,967 | | | $ | 625,999 | | | $ | 948,311 | | | $ | 797,933 | | | $ | 826,420 | | |
Ratio of Expenses to Average Net Assets (6) | | | 1.00 | %(4) | | | 0.98 | %(4) | | | 0.95 | %(4) | | | 1.01 | %(4) | | | 0.98 | %(4) | |
Ratio of Expenses to Average Net Assets Excluding Non Operating Expenses | | | N/A | | | | 0.98 | %(4) | | | 0.94 | %(4) | | | 1.00 | %(4) | | | 0.97 | %(4) | |
Ratio of Net Investment Income to Average Net Assets (6) | | | 1.73 | %(4) | | | 1.61 | %(4) | | | 1.90 | %(4) | | | 1.51 | %(4) | | | 2.45 | %(4) | |
Ratio of Rebate from Morgan Stanley Affiliates to Average Net Assets | | | 0.00 | %(5) | | | 0.00 | %(5) | | | 0.00 | %(5) | | | 0.00 | %(5) | | | 0.00 | %(5) | |
Portfolio Turnover Rate | | | 24 | % | | | 24 | % | | | 25 | % | | | 24 | % | | | 22 | % | |
(6) Supplemental Information on the Ratios to Average Net Assets: | |
Ratios Before Expense Limitation: | |
Expenses to Average Net Assets | | | 1.02 | % | | | N/A | | | | N/A | | | | 1.03 | % | | | N/A | | |
Net Investment Income to Average Net Assets | | | 1.71 | % | | | N/A | | | | N/A | | | | 1.49 | % | | | N/A | | |
(1) Refer to Note F in the Notes to Financial Statements for discussion of prior period custodian out-of pocket expenses that were reimbursed in the current period. The amount of the reimbursement was immaterial on a per share basis and did not impact the total return of Class I shares. The Ratio of Expenses to Average Net Assets and the Ratio of Net Investment Income to Average Net Assets would be unchanged as the reimbursement of custodian fees was offset against current period expense waivers/reimbursements with no impact to net expenses or net investment income.
(2) Per share amount is based on average shares outstanding.
(3) Calculated based on the net asset value as of the last business day of the period.
(4) The Ratios of Expenses and Net Investment Income reflect the rebate of certain Portfolio expenses in connection with the investments in Morgan Stanley affiliates during the period. The effect of the rebate on the ratios is disclosed in the above table as "Ratio of Rebate from Morgan Stanley Affiliates to Average Net Assets."
(5) Amount is less than 0.005%.
The accompanying notes are an integral part of the financial statements.
14
Morgan Stanley Institutional Fund, Inc.
Annual Report — December 31, 2016
Financial Highlights
U.S. Real Estate Portfolio
| | | Class A | |
| | | Year Ended December 31, | |
Selected Per Share Data and Ratios | | 2016(1) | | 2015 | | 2014 | | 2013 | | 2012 | |
Net Asset Value, Beginning of Period | | $ | 17.42 | | | $ | 20.04 | | | $ | 16.21 | | | $ | 16.60 | | | $ | 14.70 | | |
Income from Investment Operations: | |
Net Investment Income (2) | | | 0.24 | | | | 0.28 | | | | 0.29 | | | | 0.23 | | | | 0.19 | | |
Net Realized and Unrealized Gain | | | 0.89 | | | | 0.08 | | | | 4.56 | | | | 0.12 | | | | 2.16 | | |
Total from Investment Operations | | | 1.13 | | | | 0.42 | | | | 4.85 | | | | 0.35 | | | | 2.35 | | |
Distributions from and/or in Excess of: | |
Net Investment Income | | | (0.32 | ) | | | (0.20 | ) | | | (0.28 | ) | | | (0.15 | ) | | | (0.16 | ) | |
Net Realized Gain | | | (1.49 | ) | | | (2.78 | ) | | | (0.74 | ) | | | (0.59 | ) | | | (0.29 | ) | |
Total Distributions | | | (1.81 | ) | | | (2.98 | ) | | | (1.02 | ) | | | (0.74 | ) | | | (0.45 | ) | |
Net Asset Value, End of Period | | $ | 16.74 | | | $ | 17.42 | | | $ | 20.04 | | | $ | 16.21 | | | $ | 16.60 | | |
Total Return (3) | | | 6.47 | % | | | 2.01 | % | | | 30.28 | % | | | 2.14 | % | | | 16.02 | % | |
Ratios and Supplemental Data: | |
Net Assets, End of Period (Thousands) | | $ | 76,082 | | | $ | 87,462 | | | $ | 107,441 | | | $ | 101,325 | | | $ | 92,240 | | |
Ratio of Expenses to Average Net Assets (7) | | | 1.29 | %(4) | | | 1.28 | %(4) | | | 1.31 | %(4) | | | 1.28 | %(4)(5) | | | 1.23 | %(4) | |
Ratio of Expenses to Average Net Assets Excluding Non Operating Expenses | | | N/A | | | | 1.28 | %(4) | | | 1.30 | %(4) | | | 1.27 | %(4)(5) | | | 1.22 | %(4) | |
Ratio of Net Investment Income to Average Net Assets (7) | | | 1.37 | %(4) | | | 1.43 | %(4) | | | 1.54 | %(4) | | | 1.35 | %(4) | | | 2.20 | %(4) | |
Ratio of Rebate from Morgan Stanley Affiliates to Average Net Assets | | | 0.00 | %(6) | | | 0.00 | %(6) | | | 0.00 | %(6) | | | 0.00 | %(6) | | | 0.00 | %(6) | |
Portfolio Turnover Rate | | | 24 | % | | | 24 | % | | | 25 | % | | | 24 | % | | | 22 | % | |
(7) Supplemental Information on the Ratios to Average Net Assets: | |
Ratios Before Expense Limitation: | |
Expenses to Average Net Assets | | | 1.30 | % | | | N/A | | | | N/A | | | | 1.29 | % | | | N/A | | |
Net Investment Income to Average Net Assets | | | 1.36 | % | | | N/A | | | | N/A | | | | 1.34 | % | | | N/A | | |
(1) Refer to Note F in the Notes to Financial Statements for discussion of prior period custodian out-of pocket expenses that were reimbursed in the current period. The amount of the reimbursement was immaterial on a per share basis and did not impact the total return of Class A shares. The Ratio of Expenses to Average Net Assets would have been less than 0.005% higher and the Ratio of Net Investment Income to Average Net Assets would have been less than 0.005% lower had the custodian not reimbursed the Portfolio.
(2) Per share amount is based on average shares outstanding.
(3) Calculated based on the net asset value which does not reflect sales charges, if applicable, as of the last business day of the period.
(4) The Ratios of Expenses and Net Investment Income reflect the rebate of certain Portfolio expenses in connection with the investments in Morgan Stanley affiliates during the period. The effect of the rebate on the ratios is disclosed in the above table as "Ratio of Rebate from Morgan Stanley Affiliates to Average Net Assets."
(5) Effective September 16, 2013, the Adviser has agreed to limit the ratio of expenses to average net assets to the maximum ratio of 1.35% for Class A shares. Prior to September 16, 2013, the maximum ratio was 1.25% for Class A shares.
(6) Amount is less than 0.005%.
The accompanying notes are an integral part of the financial statements.
15
Morgan Stanley Institutional Fund, Inc.
Annual Report — December 31, 2016
Financial Highlights
U.S. Real Estate Portfolio
| | | Class L | |
| | | Year Ended December 31, | |
Selected Per Share Data and Ratios | | 2016(1) | | 2015 | | 2014 | | 2013 | | 2012 | |
Net Asset Value, Beginning of Period | | $ | 17.41 | | | $ | 20.03 | | | $ | 16.20 | | | $ | 16.59 | | | $ | 14.69 | | |
Income from Investment Operations: | |
Net Investment Income (2) | | | 0.15 | | | | 0.21 | | | | 0.20 | | | | 0.13 | | | | 0.10 | | |
Net Realized and Unrealized Gain | | | 0.89 | | | | 0.04 | | | | 4.56 | | | | 0.13 | | | | 2.16 | | |
Total from Investment Operations | | | 1.04 | | | | 0.25 | | | | 4.76 | | | | 0.26 | | | | 2.26 | | |
Distributions from and/or in Excess of: | |
Net Investment Income | | | (0.23 | ) | | | (0.09 | ) | | | (0.19 | ) | | | (0.06 | ) | | | (0.07 | ) | |
Net Realized Gain | | | (1.49 | ) | | | (2.78 | ) | | | (0.74 | ) | | | (0.59 | ) | | | (0.29 | ) | |
Total Distributions | | | (1.72 | ) | | | (2.87 | ) | | | (0.93 | ) | | | (0.65 | ) | | | (0.36 | ) | |
Net Asset Value, End of Period | | $ | 16.73 | | | $ | 17.41 | | | $ | 20.03 | | | $ | 16.20 | | | $ | 16.59 | | |
Total Return (3) | | | 5.91 | % | | | 1.44 | % | | | 29.68 | % | | | 1.62 | % | | | 15.44 | % | |
Ratios and Supplemental Data: | |
Net Assets, End of Period (Thousands) | | $ | 3,471 | | | $ | 3,993 | | | $ | 4,919 | | | $ | 4,462 | | | $ | 4,975 | | |
Ratio of Expenses to Average Net Assets (7) | | | 1.84 | %(4) | | | 1.82 | %(4) | | | 1.79 | %(4) | | | 1.78 | %(4)(5) | | | 1.73 | %(4) | |
Ratio of Expenses to Average Net Assets Excluding Non Operating Expenses | | | N/A | | | | 1.81 | %(4) | | | 1.78 | %(4) | | | 1.77 | %(4)(5) | | | 1.72 | %(4) | |
Ratio of Net Investment Income to Average Net Assets (7) | | | 0.84 | %(4) | | | 1.08 | %(4) | | | 1.06 | %(4) | | | 0.73 | %(4) | | | 1.70 | %(4) | |
Ratio of Rebate from Morgan Stanley Affiliates to Average Net Assets | | | 0.00 | %(6) | | | 0.00 | %(6) | | | 0.00 | %(6) | | | 0.00 | %(6) | | | 0.00 | %(6) | |
Portfolio Turnover Rate | | | 24 | % | | | 24 | % | | | 25 | % | | | 24 | % | | | 22 | % | |
(7) Supplemental Information on the Ratios to Average Net Assets: | |
Ratios Before Expense Limitation: | |
Expenses to Average Net Assets | | | 1.84 | % | | | N/A | | | | N/A | | | | 1.79 | % | | | N/A | | |
Net Investment Income to Average Net Assets | | | 0.84 | % | | | N/A | | | | N/A | | | | 0.72 | % | | | N/A | | |
(1) Refer to Note F in the Notes to Financial Statements for discussion of prior period custodian out-of pocket expenses that were reimbursed in the current period. The amount of the reimbursement was immaterial on a per share basis and did not impact the total return of Class L shares. The Ratio of Expenses to Average Net Assets would have been less than 0.005% higher and the Ratio of Net Investment Income to Average Net Assets would have been less than 0.005% lower had the custodian not reimbursed the Portfolio.
(2) Per share amount is based on average shares outstanding.
(3) Calculated based on the net asset value as of the last business day of the period.
(4) The Ratios of Expenses and Net Investment Income reflect the rebate of certain Portfolio expenses in connection with the investments in Morgan Stanley affiliates during the period. The effect of the rebate on the ratios is disclosed in the above table as "Ratio of Rebate from Morgan Stanley Affiliates to Average Net Assets."
(5) Effective September 16, 2013, the Adviser has agreed to limit the ratio of expenses to average net assets to the maximum ratio of 1.85% for Class L shares. Prior to September 16, 2013, the maximum ratio was 1.75% for Class L shares.
(6) Amount is less than 0.005%.
The accompanying notes are an integral part of the financial statements.
16
Morgan Stanley Institutional Fund, Inc.
Annual Report — December 31, 2016
Financial Highlights
U.S. Real Estate Portfolio
| | | Class C | |
Selected Per Share Data and Ratios | | Year Ended
December 31, 2016(1) | | Period from
April 30, 2015(2) to
December 31, 2015 | |
Net Asset Value, Beginning of Period | | $ | 17.36 | | | $ | 19.73 | | |
Income from Investment Operations: | |
Net Investment Income (3) | | | 0.13 | | | | 0.18 | | |
Net Realized and Unrealized Gain | | | 0.87 | | | | 0.31 | | |
Total from Investment Operations | | | 1.00 | | | | 0.49 | | |
Distributions from and/or in Excess of: | |
Net Investment Loss | | | (0.20 | ) | | | (0.08 | ) | |
Net Realized Gain | | | (1.49 | ) | | | (2.78 | ) | |
Total Distributions | | | (1.69 | ) | | | (2.86 | ) | |
Net Asset Value, End of Period | | $ | 16.67 | | | $ | 17.36 | | |
Total Return (4) | | | 5.72 | % | | | 2.70 | %(7) | |
Ratios and Supplemental Data: | |
Net Assets, End of Period (Thousands) | | $ | 427 | | | $ | 91 | | |
Ratio of Expenses to Average Net Assets (9) | | | 2.10 | %(5) | | | 2.10 | %(5)(8) | |
Ratio of Expenses to Average Net Assets Excluding Non Operating Expenses | | | N/A | | | | 2.10 | %(5)(8) | |
Ratio of Net Investment Income to Average Net Assets (9) | | | 0.73 | %(5) | | | 1.44 | %(5)(8) | |
Ratio of Rebate from Morgan Stanley Affiliates to Average Net Assets | | | 0.00 | %(6) | | | 0.00 | %(6)(8) | |
Portfolio Turnover Rate | | | 24 | % | | | 24 | % | |
(9) Supplemental Information on the Ratios to Average Net Assets: | |
Ratios Before Expense Limitation: | |
Expense to Average Net Assets | | | 3.13 | % | | | 5.89 | %(8) | |
Net Investment Income (Loss) to Average Net Assets | | | (0.30 | )% | | | (2.35 | )%(8) | |
(1) Refer to Note F in the Notes to Financial Statements for discussion of prior period custodian out-of pocket expenses that were reimbursed in the current period. The amount of the reimbursement was immaterial on a per share basis and did not impact the total return of Class C shares. The Ratio of Expenses to Average Net Assets and the Ratio of Net Investment Income to Average Net Assets would be unchanged as the reimbursement of custodian fees was offset against current period expense waivers/reimbursements with no impact to net expenses or net investment income.
(2) Commencement of Offering.
(3) Per share amount is based on average shares outstanding.
(4) Calculated based on the net asset value which does not reflect sales charges, if applicable, as of the last business day of the period.
(5) The Ratios of Expenses and Net Investment Income reflect the rebate of certain Portfolio expenses in connection with the investments in Morgan Stanley affiliates during the period. The effect of the rebate on the ratios is disclosed in the above table as "Ratio of Rebate from Morgan Stanley Affiliates to Average Net Assets."
(6) Amount is less than 0.005%.
(7) Not Annualized.
(8) Annualized.
The accompanying notes are an integral part of the financial statements.
17
Morgan Stanley Institutional Fund, Inc.
Annual Report — December 31, 2016
Financial Highlights
U.S. Real Estate Portfolio
| | | Class IS | |
| | | Year Ended December 31, | | Period from
September 13, 2013(2) to | |
Selected Per Share Data and Ratios | | 2016(1) | | 2015 | | 2014 | | December 31, 2013 | |
Net Asset Value, Beginning of Period | | $ | 17.86 | | | $ | 20.48 | | | $ | 16.55 | | | $ | 17.13 | | |
Income from Investment Operations: | |
Net Investment Income (3) | | | 0.33 | | | | 0.36 | | | | 0.38 | | | | 0.03 | | |
Net Realized and Unrealized Gain | | | 0.92 | | | | 0.08 | | | | 4.65 | | | | 0.01 | | |
Total from Investment Operations | | | 1.25 | | | | 0.44 | | | | 5.03 | | | | 0.04 | | |
Distributions from and/or in Excess of: | |
Net Investment Income | | | (0.40 | ) | | | (0.28 | ) | | | (0.36 | ) | | | (0.11 | ) | |
Net Realized Gain | | | (1.49 | ) | | | (2.78 | ) | | | (0.74 | ) | | | (0.51 | ) | |
Total Distributions | | | (1.89 | ) | | | (3.06 | ) | | | (1.10 | ) | | | (0.62 | ) | |
Net Asset Value, End of Period | | $ | 17.22 | | | $ | 17.86 | | | $ | 20.48 | | | $ | 16.55 | | |
Total Return (4) | | | 6.96 | % | | | 2.36 | % | | | 30.82 | % | | | 0.30 | %(8) | |
Ratios and Supplemental Data: | |
Net Assets, End of Period (Thousands) | | $ | 195,490 | | | $ | 141,670 | | | $ | 12 | | | $ | 10 | | |
Ratio of Expenses to Average Net Assets (10) | | | 0.89 | %(5) | | | 0.90 | %(5) | | | 0.89 | %(5) | | | 0.90 | %(5)(6)(9) | |
Ratio of Expenses to Average Net Assets Excluding Non Operating Expenses | | | N/A | | | | 0.90 | %(5) | | | 0.88 | %(5) | | | 0.89 | %(5)(6)(9) | |
Ratio of Net Investment Income to Average Net Assets (10) | | | 1.79 | %(5) | | | 1.81 | %(5) | | | 1.96 | %(5) | | | 0.52 | %(5)(9) | |
Ratio of Rebate from Morgan Stanley Affiliates to Average Net Assets | | | 0.00 | %(7) | | | 0.00 | %(7) | | | 0.00 | %(7) | | | N/A | | |
Portfolio Turnover Rate | | | 24 | % | | | 24 | % | | | 25 | % | | | 24 | % | |
(10) Supplemental Information on the Ratios to Average Net Assets: | |
Ratios Before Expense Limitation: | |
Expenses to Average Net Assets | | | 0.90 | % | | | 0.90 | % | | | 20.21 | % | | | 6.19 | %(9) | |
Net Investment Income (Loss) to Average Net Assets | | | 1.78 | % | | | 1.81 | % | | | (17.36 | )% | | | (4.77 | )%(9) | |
(1) Refer to Note F in the Notes to Financial Statements for discussion of prior period custodian out-of pocket expenses that were reimbursed in the current period. The amount of the reimbursement was immaterial on a per share basis and did not impact the total return of Class IS shares. The Ratio of Expenses to Average Net Assets would have been less than 0.005% higher and the Ratio of Net Investment Income to Average Net Assets would have been less than 0.005% lower had the custodian not reimbursed the Portfolio.
(2) Commencement of Offering.
(3) Per share amount is based on average shares outstanding.
(4) Calculated based on the net asset value as of the last business day of the period.
(5) The Ratios of Expenses and Net Investment Income reflect the rebate of certain Portfolio expenses in connection with the investments in Morgan Stanley affiliates during the period. The effect of the rebate on the ratios is disclosed in the above table as "Ratio of Rebate from Morgan Stanley Affiliates to Average Net Assets."
(6) Effective September 16, 2013, the Adviser has agreed to limit the ratio of expenses to average net assets to the maximum ratio of 0.93% for Class IS shares.
(7) Amount is less than 0.005%.
(8) Not Annualized.
(9) Annualized.
The accompanying notes are an integral part of the financial statements.
18
Morgan Stanley Institutional Fund, Inc.
Annual Report — December 31, 2016
Notes to Financial Statements
Morgan Stanley Institutional Fund, Inc. (the "Fund") is registered under the Investment Company Act of 1940, as amended (the "Act"), as an open-end management investment company. The Fund is comprised of twenty-nine separate, active, diversified and non-diversified portfolios (individually referred to as a "Portfolio," collectively as the "Portfolios"). The Fund applies investment company accounting and reporting guidance.
The accompanying financial statements relate to the U.S. Real Estate Portfolio. The Portfolio seeks to provide above average current income and long-term capital appreciation by investing primarily in equity securities of companies in the U.S. real estate industry, including real estate investment trusts ("REITs"). The Portfolio has capital subscription commitments to certain investee companies for this same purpose, the details of which are disclosed in the Unfunded Commitments note.
The Portfolio offers five classes of shares — Class I, Class A, Class L, Class C and Class IS. On April 30, 2015, the Portfolio suspended offering of Class L shares. Existing Class L shareholders may invest through reinvestment of dividends and distributions.
A. Significant Accounting Policies: The following significant accounting policies are in conformity with U.S. generally accepted accounting principles ("GAAP"). Such policies are consistently followed by the Fund in the preparation of its financial statements. GAAP may require management to make estimates and assumptions that affect the reported amounts and disclosures in the financial statements. Actual results may differ from those estimates.
1. Security Valuation: (1) An equity portfolio security listed or traded on an exchange is valued at its latest reported sales price (or at the exchange official closing price if such exchange reports an official closing price), and if there were no sales on a given day and if there is no official exchange closing price for that day, the security is valued at the mean between the last reported bid and asked prices if such bid and asked prices are available on the relevant exchanges; (2) all other equity portfolio securities for which over-the-counter ("OTC") market quotations are readily available are valued at the latest reported sales price (or at the market official closing price if such market reports an official closing price), and if there was no trading in the security on a given day and if there is no official closing price from relevant markets for that day, the security is valued at the mean between the
last reported bid and asked prices if such bid and asked prices are available on the relevant markets. Listed equity securities not traded on the valuation date with no reported bid and asked prices available on the exchange are valued at the mean between the current bid and asked prices obtained from one or more reputable brokers or dealers. An unlisted equity security that does not trade on the valuation date and for which bid and asked prices from the relevant markets are unavailable is valued at the mean between the current bid and asked prices obtained from one or more reputable brokers or dealers. In cases where a security is traded on more than one exchange, the security is valued on the exchange designated as the primary market; (3) certain portfolio securities may be valued by an outside pricing service/vendor approved by the Fund's Board of Directors (the "Directors"). The pricing service/vendor may employ a pricing model that takes into account, among other things, bids, yield spreads, and/or other market data and specific security characteristics. Alternatively, if a valuation is not available from an outside pricing service/vendor, and the security trades on an exchange, the security may be valued at its latest reported sale price (or at the exchange official closing price if such exchange reports an official closing price), prior to the time when assets are valued. If there are no sales on a given day and if there is no official exchange closing price for that day, the security is valued at the mean between the last reported bid and asked prices if such bid and asked prices are available in the relevant exchanges; (4) when market quotations are not readily available, including circumstances under which Morgan Stanley Investment Management Inc. (the "Adviser") determines that the closing price, last sale price or the mean between the last reported bid and asked prices are not reflective of a security's market value, portfolio securities are valued at their fair value as determined in good faith under procedures established by and under the general supervision of the Directors. Occasionally, developments affecting the closing prices of securities and other assets may occur between the times at which valuations of such securities are determined (that is, close of the foreign market on which the securities trade) and the close of business of the New York Stock Exchange ("NYSE"). If developments occur during such periods that are expected to materially affect the value of such securities, such valuations may be adjusted to reflect the estimated fair value of such securities as of the close of the NYSE, as determined in good faith by the
19
Morgan Stanley Institutional Fund, Inc.
Annual Report — December 31, 2016
Notes to Financial Statements (cont'd)
Directors or by the Adviser using a pricing service and/or procedures approved by the Directors; (5) quotations of foreign portfolio securities, other assets and liabilities and forward contracts stated in foreign currency are translated into U.S. dollar equivalents at the prevailing market rates prior to the close of the NYSE; and (6) investments in mutual funds, including the Morgan Stanley Institutional Liquidity Funds, are valued at the net asset value ("NAV") as of the close of each business day.
The Directors have responsibility for determining in good faith the fair value of the investments, and the Directors may appoint others, such as the Fund's Adviser or a valuation committee, to assist the Directors in determining fair value and to make the actual calculations pursuant to the fair valuation methodologies previously approved by the Directors. Under procedures approved by the Directors, the Fund's Adviser has formed a Valuation Committee whose members are approved by the Directors. The Valuation Committee provides administration and oversight of the Fund's valuation policies and procedures, which are reviewed at least annually by the Directors. These procedures allow the Fund to utilize independent pricing services, quotations from securities and financial instrument dealers, and other market sources to determine fair value.
The Fund has procedures to determine the fair value of securities and other financial instruments for which market prices are not readily available. Under these procedures, the Valuation Committee convenes on a regular and ad hoc basis to review such securities and considers a number of factors, including valuation methodologies and significant unobservable valuation inputs, when arriving at fair value. The Valuation Committee may employ a market-based approach which may use related or comparable assets or liabilities, recent transactions, market multiples, book values, and other relevant information for the investment to determine the fair value of the investment. An income-based valuation approach may also be used in which the anticipated future cash flows of the investment are discounted to calculate fair value. Discounts may also be applied due to the nature or duration of any restrictions on the disposition of the investments. Due to the inherent uncertainty of valuations of such investments, the fair values may differ significantly from the values
that would have been used had an active market existed. The Valuation Committee employs various methods for calibrating these valuation approaches including a regular review of valuation methodologies, key inputs and assumptions, transactional back-testing or disposition analysis, and reviews of any related market activity.
The Portfolio invests a significant portion of its assets in securities of REITs. The market's perception of prospective declines in private real estate values and other financial assets may result in increased volatility of market prices that can negatively impact the valuation of certain issuers held by the Portfolio.
2. Fair Value Measurement: Financial Accounting Standards Board ("FASB") Accounting Standards CodificationTM ("ASC") 820, "Fair Value Measurement" ("ASC 820"), defines fair value as the value that the Fund would receive to sell an investment or pay to transfer a liability in a timely transaction with an independent buyer in the principal market, or in the absence of a principal market, the most advantageous market for the investment or liability. ASC 820 establishes a three-tier hierarchy to distinguish between (1) inputs that reflect the assumptions market participants would use in valuing an asset or liability developed based on market data obtained from sources independent of the reporting entity (observable inputs) and (2) inputs that reflect the reporting entity's own assumptions about the assumptions market participants would use in valuing an asset or liability developed based on the best information available in the circumstances (unobservable inputs) and to establish classification of fair value measurements for disclosure purposes. Various inputs are used in determining the value of the Fund's investments. The inputs are summarized in the three broad levels listed below.
• Level 1 – unadjusted quoted prices in active markets for identical investments
• Level 2 – other significant observable inputs (including quoted prices for similar investments, interest rates, prepayment speeds, credit risk, etc.)
• Level 3 – significant unobservable inputs including the Fund's own assumptions in determining the fair value of investments. Factors considered in making this determination
20
Morgan Stanley Institutional Fund, Inc.
Annual Report — December 31, 2016
Notes to Financial Statements (cont'd)
may include, but are not limited to, information obtained by contacting the issuer, analysts, or the appropriate stock exchange (for exchange-traded securities), analysis of the issuer's financial statements or other available documents and, if necessary, available information concerning other securities in similar circumstances
The inputs or methodology used for valuing securities are not necessarily an indication of the risk associated with investing in those securities and the determination of the significance of a particular input to the fair value measurement in its entirety requires judgment and considers factors specific to each security.
The following is a summary of the inputs used to value the Portfolio's investments as of December 31, 2016.
Investment Type | | Level 1
Unadjusted
quoted
prices
(000) | | Level 2
Other
significant
observable
inputs
(000) | | Level 3
Significant
unobservable
inputs
(000) | | Total
(000) | |
Assets: | |
Common Stocks | |
Apartments | | $ | 136,788 | | | $ | — | | | $ | — | | | $ | 136,788 | | |
Data Centers | | | 15,574 | | | | — | | | | — | | | | 15,574 | | |
Diversified | | | 56,321 | | | | — | | | | — | | | | 56,321 | | |
Free Standing | | | 16,989 | | | | — | | | | — | | | | 16,989 | | |
Health Care | | | 67,475 | | | | — | | | | — | | | | 67,475 | | |
Industrial | | | 25,124 | | | | — | | | | 10,783 | | | | 35,907 | | |
Lodging/Resorts | | | 62,357 | | | | — | | | | — | | | | 62,357 | | |
Manufactured Homes | | | 2,531 | | | | — | | | | — | | | | 2,531 | | |
Office | | | 93,557 | | | | — | | | | 3,755 | | | | 97,312 | | |
Regional Malls | | | 140,418 | | | | — | | | | — | | | | 140,418 | | |
Self Storage | | | 53,304 | | | | — | | | | — | | | | 53,304 | | |
Shopping Centers | | | 69,199 | | | | — | | | | — | | | | 69,199 | | |
Single Family Homes | | | 1,352 | | | | — | | | | — | | | | 1,352 | | |
Specialty | | | 6,349 | | | | — | | | | — | | | | 6,349 | | |
Total Common Stocks | | | 747,338 | | | | — | | | | 14,538 | | | | 761,876 | | |
Short-Term Investment | |
Investment Company | | | 5,194 | | | | — | | | | — | | | | 5,194 | | |
Total Assets | | $ | 752,532 | | | $ | — | | | $ | 14,538 | | | $ | 767,070 | | |
Transfers between investment levels may occur as the markets fluctuate and/or the availability of data used in an investment's valuation changes. The Portfolio recognizes transfers between the levels as of the end of the period. As of December 31, 2016, the Portfolio did not have any investments transfer between investment levels.
Following is a reconciliation of investments in which significant unobservable inputs (Level 3) were used in determining fair value.
| | | Common
Stocks
(000) | |
Beginning Balance | | $ | 15,704 | | |
Purchases | | | — | | |
Sales | | | — | | |
Amortization of discount | | | — | | |
Transfers in | | | — | | |
Transfers out | | | — | | |
Corporate actions | | | (2,551 | ) | |
Change in unrealized appreciation (depreciation) | | | 1,385 | | |
Realized gains (losses) | | | — | | |
Ending Balance | | $ | 14,538 | | |
Net change in unrealized appreciation from investments still held
as of December 31, 2016 | | $ | 1,725 | | |
The following table presents additional information about valuation techniques and inputs used for investments that are measured at fair value and categorized within Level 3 as of December 31, 2016.
| | | Fair Value at
December 31,
2016
(000) | | Valuation
Technique | | Unobservable
Input | |
Industrial | |
Common
Stocks
| | $ | 10,783
| | | Reported Capital Balance,
Adjusted for Subsequent
Capital Calls, Return of
Capital and Significant
Market Changes
between last Capital
Statement and Valuation
Date | | Adjusted Capital
Balance
| |
Office | |
Common
Stock
| | $ | 3,755
| | | Reported Capital Balance,
Adjusted for Subsequent
Capital Calls, Return of
Capital and Significant
Market Changes
between last Capital
Statement and Valuation
Date | | Adjusted Capital
Balance
| |
3. Foreign Currency Translation and Foreign Investments: The books and records of the Portfolio are maintained in U.S. dollars. Foreign currency amounts are translated into U.S. dollars as follows:
– investments, other assets and liabilities at the prevailing rate of exchange on the valuation date;
21
Morgan Stanley Institutional Fund, Inc.
Annual Report — December 31, 2016
Notes to Financial Statements (cont'd)
– investment transactions and investment income at the prevailing rates of exchange on the dates of such transactions.
Although the net assets of the Portfolio are presented at the foreign exchange rates and market values at the close of the period, the Portfolio does not isolate that portion of the results of operations arising as a result of changes in the foreign exchange rates from the fluctuations arising from changes in the market prices of securities held at period end. Similarly, the Portfolio does not isolate the effect of changes in foreign exchange rates from the fluctuations arising from changes in the market prices of securities sold during the period. Accordingly, realized and unrealized foreign currency gains (losses) on investments in securities are included in the reported net realized and unrealized gains (losses) on investment transactions and balances. However, pursuant to U.S. federal income tax regulations, gains and losses from certain foreign currency transactions and the foreign currency portion of gains and losses realized on sales and maturities of foreign denominated debt securities are treated as ordinary income for U.S. federal income tax purposes.
Net realized gains (losses) on foreign currency transactions represent net foreign exchange gains (losses) from foreign currency forward exchange contracts, disposition of foreign currencies, currency gains (losses) realized between the trade and settlement dates on securities transactions, and the difference between the amount of investment income and foreign withholding taxes recorded on the Portfolio's books and the U.S. dollar equivalent amounts actually received or paid. Net unrealized currency gains (losses) from valuing foreign currency denominated assets and liabilities at period end exchange rates are reflected as a component of unrealized appreciation (depreciation) in the Statement of Assets and Liabilities. The change in unrealized currency gains (losses) on foreign currency translations for the period is reflected in the Statement of Operations.
Foreign security and currency transactions may involve certain considerations and risks not typically associated with those of U.S. dollar denominated transactions as a result of, among other factors, fluctuations of exchange rates in relation to the U.S. dollar, the possibility of lower levels of governmental supervision and regulation
of foreign securities markets and the possibility of political or economic instability.
Governmental approval for foreign investments may be required in advance of making an investment under certain circumstances in some countries, and the extent of foreign investments in domestic companies may be subject to limitation in other countries. Foreign ownership limitations also may be imposed by the charters of individual companies to prevent, among other concerns, violations of foreign investment limitations. As a result, an additional class of shares (identified as "Foreign" in the Portfolio of Investments) may be created and offered for investment. The "local" and "foreign shares" market values may differ. In the absence of trading of the foreign shares in such markets, the Portfolio values the foreign shares at the closing exchange price of the local shares.
4. Unfunded Commitments: Subject to the terms of a Subscription Agreement between the Portfolio and BRCP REIT II, LP, the Portfolio has made a subscription commitment of $9,000,000 for which it will receive 9,000,000 shares of common stock. As of December 31, 2016, BRCP REIT II, LP has drawn down approximately $8,364,000 which represents 92.9% of the commitment.
Subject to the terms of a Subscription Agreement between the Portfolio and Exeter Industrial Value Fund, LP, the Portfolio has made a subscription commitment of $8,500,000 for which it will receive 8,500,000 shares of common stock. As of December 31, 2016, Exeter Industrial Value Fund, LP has drawn down approximately $7,905,000 which represents 93.0% of the commitment.
Subject to the terms of a Subscription Agreement between the Portfolio and Cabot Industrial Value Fund II, LP, the Portfolio has made a subscription commitment of $7,500,000 for which it will receive 15,000 shares of common stock. As of December 31, 2016, Cabot Industrial Value Fund II, LP has drawn down approximately $7,000,000 which represents 93.3% of the commitment.
5. Restricted Securities: The Portfolio invests in unregistered or otherwise restricted securities. The term "restricted securities" refers to securities that are unregistered or are held by control persons of the issuer and securities that are subject to contractual restrictions on their resale. As a result, restricted securities may be more difficult to value and the Portfolio may have difficulty
22
Morgan Stanley Institutional Fund, Inc.
Annual Report — December 31, 2016
Notes to Financial Statements (cont'd)
disposing of such assets either in a timely manner or for a reasonable price. In order to dispose of an unregistered security, the Portfolio, where it has contractual rights to do so, may have to cause such security to be registered. A considerable period may elapse between the time the decision is made to sell the security and the time the security is registered so that the Portfolio could sell it. Contractual restrictions on the resale of securities vary in length and scope and are generally the result of a negotiation between the issuer and acquirer of the securities. The Portfolio would, in either case, bear market risks during that period. Restricted securities are identified in the Portfolio of Investments.
6. Indemnifications: The Fund enters into contracts that contain a variety of indemnifications. The Fund's maximum exposure under these arrangements is unknown. However, the Fund has not had prior claims or losses pursuant to these contracts and expects the risk of loss to be remote.
7. Dividends and Distributions to Shareholders: Dividend income and distributions to shareholders are recorded on the ex-dividend date. Dividends from net investment income, if any, are declared and paid quarterly. Net realized capital gains, if any, are distributed at least annually.
8. Security Transactions, Income and Expenses: Security transactions are accounted for on the trade date (date the order to buy or sell is executed). Realized gains and losses on the sale of investment securities are determined on the specific identified cost method. Dividend income and other distributions are recorded on the ex-dividend date (except for certain foreign dividends which may be recorded as soon as the Portfolio is informed of such dividends) net of applicable withholding taxes. Interest income is recognized on the accrual basis except where collection is in doubt. Discounts are accreted and premiums are amortized over the life of the respective securities. Most expenses of the Fund can be directly attributed to a particular Portfolio. Expenses which cannot be directly attributed are apportioned among the Portfolios based upon relative net assets or other appropriate methods. Income, expenses (other than class specific expenses — distribution and shareholder services, transfer agency and sub transfer agency fees) and realized and unrealized gains or losses are allocated to each class of shares based upon their relative net assets.
The Portfolio owns shares of REITs which report information on the source of their distributions annually in the following calendar year. A portion of distributions received from REITs during the year is estimated to be a return of capital and is recorded as a reduction of their cost.
B. Advisory Fees: The Adviser, a wholly-owned subsidiary of Morgan Stanley, provides the Portfolio with advisory services under the terms of an Investment Advisory Agreement, paid quarterly, at the annual rate based on the daily net assets as follows:
First $500
million | | Next $500
million | | Over $1
billion | |
| | 0.80 | % | | | 0.75 | % | | | 0.70 | % | |
For the year ended December 31, 2016, the advisory fee rate (net of rebate) was equivalent to an annual effective rate of 0.78% of the Portfolio's average daily net assets.
The Adviser has agreed to reduce its advisory fee and/or reimburse the Portfolio so that total annual portfolio operating expenses, excluding certain investment related expenses, taxes, interest and other extraordinary expenses (including litigation), will not exceed 1.00% for Class I shares, 1.35% for Class A shares, 1.85% for Class L shares, 2.10% for Class C shares and 0.93% for Class IS shares. The fee waivers and/or expense reimbursements will continue for at least one year from the date of the Portfolio's prospectus or until such time as the Directors act to discontinue all or a portion of such waivers and/or reimbursements when they deem such action is appropriate. For the year ended December 31, 2016, approximately $84,000 of other expenses were reimbursed by the Adviser pursuant to this arrangement.
C. Administration Fees: The Adviser also serves as Administrator to the Fund and provides administrative services pursuant to an Administration Agreement for an annual fee, accrued daily and paid monthly, of 0.08% of the Portfolio's average daily net assets.
Under a Sub-Administration Agreement between the Administrator and State Street Bank and Trust Company ("State Street"), State Street provides certain administrative services to the Fund. For such services, the Administrator pays State Street a portion of the fee the Administrator receives from the Portfolio.
D. Distribution and Shareholder Services Fees: Morgan Stanley Distribution, Inc. ("MSDI" or the "Distributor"), a wholly-owned subsidiary of the Adviser and an indirect
23
Morgan Stanley Institutional Fund, Inc.
Annual Report — December 31, 2016
Notes to Financial Statements (cont'd)
subsidiary of Morgan Stanley, serves as the Fund's Distributor of Portfolio shares pursuant to a Distribution Agreement. The Fund has adopted a Shareholder Services Plan with respect to Class A shares pursuant to Rule 12b-1 under the Act. Under the Shareholder Services Plan, the Portfolio pays the Distributor a shareholder services fee, accrued daily and paid monthly, at an annual rate of 0.25% of the Portfolio's average daily net assets attributable to Class A shares.
The Fund has adopted a Distribution and Shareholder Services Plan with respect to Class L shares pursuant to Rule 12b-1 under the Act. Under the Distribution and Shareholder Services Plan, the Portfolio pays the Distributor a distribution fee, accrued daily and paid monthly, at an annual rate of 0.50% and a shareholder services fee, accrued daily and paid monthly, at an annual rate of 0.25% of the Portfolio's average daily net assets attributable to Class L shares.
The Fund has adopted a Distribution and Shareholder Services Plan with respect to Class C shares pursuant to Rule 12b-1 under the Act. Under the Distribution and Shareholder Services Plan, the Portfolio pays the Distributor a distribution fee, accrued daily and paid monthly, at an annual rate of 0.75% and a shareholder services fee, accrued daily and paid monthly, at an annual rate of 0.25% of the Portfolio's average daily net assets attributable to Class C shares.
The distribution and shareholder services fees are used to support the expenses associated with servicing and maintaining accounts. The Distributor may compensate other parties for providing shareholder support services to investors who purchase Class A, Class L and Class C shares.
E. Dividend Disbursing and Transfer Agent: The Fund's dividend disbursing and transfer agent is Boston Financial Data Services, Inc. ("BFDS"). Pursuant to a Transfer Agency Agreement, the Fund pays BFDS a fee based on the number of classes, accounts and transactions relating to the Portfolios of the Fund.
F. Custodian Fees: State Street (the "Custodian") serves as Custodian for the Fund in accordance with a Custodian Agreement. The Custodian holds cash, securities, and other assets of the Fund as required by the Act. Custody fees are payable monthly based on assets held in custody, investment purchases and sales activity and account maintenance fees, plus reimbursement for certain out-of-pocket expenses.
In December 2015, the Fund's Custodian announced that it had identified inconsistencies in the way in which clients were invoiced for out-of-pocket expenses from 1998 until
November 2015. The dollar amount difference between what was charged and what should have been charged, plus interest, was paid back to the Portfolio in September 2016 as a reimbursement. The Custodian reimbursed the Portfolio directly, which was recognized as a change in accounting estimate and was reflected as "Reimbursement of Custodian Fees" in the Statement of Operations. Pursuant to the expense limitations described in Note B, the Portfolio has experienced expenses reimbursed by the Adviser during the current period. Accordingly, the reimbursement of out-of-pocket custodian expenses in the current period resulted in the reduction in the current period expenses reimbursed by the Adviser.
G. Security Transactions and Transactions with Affiliates: For the year ended December 31, 2016, purchases and sales of investment securities for the Portfolio, other than long-term U.S. Government securities and short-term investments, were approximately $195,341,000 and $300,885,000, respectively. There were no purchases and sales of long-term U.S. Government securities for the year ended December 31, 2016.
The Portfolio invests in the Institutional Class of the Morgan Stanley Institutional Liquidity Funds — Treasury Portfolio (the "Liquidity Funds"), an open-end management investment company managed by the Adviser. Advisory fees paid by the Portfolio are reduced by an amount equal to its pro-rata share of the advisory and administration fees paid by the Portfolio due to its investment in the Liquidity Funds. For the year ended December 31, 2016, advisory fees paid were reduced by approximately $33,000 relating to the Portfolio's investment in the Liquidity Funds.
A summary of the Portfolio's transactions in shares of the Liquidity Funds during the year ended December 31, 2016 is as follows:
Value
December 31,
2015
(000) | | Purchases
at Cost
(000) | | Sales
(000) | | Dividend
Income
(000) | | Value
December 31,
2016
(000) | |
| $ | 12,619 | | | $ | 169,637 | | | $ | 177,062 | | | $ | 44 | | | $ | 5,194 | | |
The Portfolio is permitted to purchase and sell securities ("cross-trade") from and to other Morgan Stanley Funds as well as other funds and client accounts for which the Adviser or an affiliate of the Adviser serves as investment adviser, pursuant to procedures approved by the Directors in compliance with Rule 17a-7 under the Act (the "Rule"). Each cross-trade is executed at the current market price in compliance with provisions of the Rule. For the year ended December 31, 2016, the Portfolio did not engage in any cross-trade transactions.
24
Morgan Stanley Institutional Fund, Inc.
Annual Report — December 31, 2016
Notes to Financial Statements (cont'd)
The Portfolio has an unfunded Deferred Compensation Plan (the "Compensation Plan"), which allows each independent Director to defer payment of all, or a portion, of the fees he or she receives for serving on the Board of Directors. Each eligible Director generally may elect to have the deferred amounts credited with a return equal to the total return on one or more of the Morgan Stanley funds that are offered as investment options under the Compensation Plan. Appreciation/depreciation and distributions received from these investments are recorded with an offsetting increase/decrease in the deferred compensation obligation and do not affect the NAV of the Portfolio.
H. Federal Income Taxes: It is the Portfolio's intention to continue to qualify as a regulated investment company and distribute all of its taxable and tax-exempt income. Accordingly, no provision for federal income taxes is required in the financial statements.
The Portfolio may be subject to taxes imposed by countries in which it invests. Such taxes are generally based on income and/or capital gains earned or repatriated. Taxes are accrued based on net investment income, net realized gains and net unrealized appreciation as such income and/or gains are earned. Taxes may also be based on transactions in foreign currency and are accrued based on the value of investments denominated in such currency.
FASB ASC 740-10, "Income Taxes — Overall", sets forth a minimum threshold for financial statement recognition of the benefit of a tax position taken or expected to be taken in a tax return. Management has concluded that there are no significant uncertain tax positions that would require recognition in the financial statements. If applicable, the Portfolio recognizes interest accrued related to unrecognized tax benefits in "Interest Expense" and penalties in "Other Expenses" in the Statement of Operations. The Portfolio files tax returns with the U.S. Internal Revenue Service, New York and various states. Generally, each of the tax years in the four-year period ended December 31, 2016, remains subject to examination by taxing authorities.
The tax character of distributions paid may differ from the character of distributions shown in the Statements of Changes in Net Assets due to short-term capital gains being treated as
ordinary income for tax purposes. The tax character of distributions paid during fiscal years 2016 and 2015 was as follows:
2016
Distributions
Paid From: | | 2015
Distributions
Paid From: | |
Ordinary
Income
(000) | | Long-Term
Capital Gain
(000) | | Ordinary
Income
(000) | | Long-Term
Capital Gain
(000) | |
| $ | 21,077 | | | $ | 59,246 | | | $ | 13,888 | | | $ | 121,343 | | |
The amount and character of income and gains to be distributed are determined in accordance with income tax regulations which may differ from GAAP. These book/tax differences are either considered temporary or permanent in nature.
Temporary differences are primarily due to differing book and tax treatments in the timing of the recognition of gains (losses) on certain investment transactions and the timing of the deductibility of certain expenses.
Permanent differences, primarily due to basis adjustments on partnerships and differing treatments of gains (losses) related to REIT adjustments, resulted in the following reclassifications among the components of net assets at December 31, 2016:
Accumulated
Undistributed
Net Investment
Income
(000) | | Accumulated
Net Realized
Gain
(000) | | Paid-in-
Capital
(000) | |
| $ | (1,646 | ) | | $ | 1,677 | | | $ | (31 | ) | |
At December 31, 2016, the components of distributable earnings for the Portfolio on a tax basis were as follows:
Undistributed
Ordinary
Income
(000) | | Undistributed
Long-Term
Capital Gain
(000) | |
| $ | — | | | $ | 7,381 | | |
I. Credit Facility: As of April 4, 2016, the Fund and other Morgan Stanley funds participated in a $150,000,000 committed, unsecured revolving line of credit facility (the "facility") with State Street. This facility is to be used for temporary emergency purposes or funding of shareholder redemption requests. The interest rate on borrowings is based on the federal funds rate or one month libor rate plus a spread. The facility also has a commitment fee of 0.25% per annum based on the unused portion of the facility. During the year ended December 31, 2016, the Portfolio did not have any borrowings under the facility.
J. Other: At December 31, 2016, the Portfolio had record owners of 10% or greater. Investment activities of these shareholders could have a material impact on the Portfolio. The aggregate percentage of such owners was 44.7%.
25
Morgan Stanley Institutional Fund, Inc.
Annual Report — December 31, 2016
Notes to Financial Statements (cont'd)
K. Accounting Pronouncements: In December 2016, FASB issued Accounting Standards update 2016-19 — Technical Corrections and Improvements ("ASU 2016-19"), which is effective for interim periods for all entities beginning after December 15, 2016. ASU 2016-19 includes an amendment to Topic 820, Fair Value Measurement, which clarifies the difference between a valuation approach and a valuation technique when applying the guidance in that Topic. That amendment also requires an entity to disclose when there has been a change in either or both a valuation approach and/or a valuation technique. The transition guidance for the amendment must be applied prospectively because it could potentially involve the use of hindsight that includes fair value measurements. Although still evaluating the potential impacts of ASU 2016-19 to the Portfolio, management expects that the impact of the Portfolio's adoption will be limited to additional financial statement disclosures.
In October 2016, the Securities and Exchange Commission ("SEC") issued a new rule, Investment Company Reporting Modernization, which, among other provisions, amends Regulation S-X to require standardized, enhanced disclosures, particularly related to derivatives, in investment company financial statements. Compliance with the guidance is effective for financial statements filed with the SEC on or after August 1, 2017; adoption will have no effect on the Portfolio's net assets or results of operations. Although still evaluating the potential impacts of the Investment Company Reporting Modernization to the Portfolio, management expects that the impact of the Portfolio's adoption will be limited to additional financial statement disclosures.
26
Morgan Stanley Institutional Fund, Inc.
Annual Report — December 31, 2016
Report of Independent Registered Public Accounting Firm
To the Shareholders and Board of Directors of
Morgan Stanley Institutional Fund, Inc. —
U.S. Real Estate Portfolio
We have audited the accompanying statement of assets and liabilities, including the portfolio of investments, of U.S. Real Estate Portfolio (one of the portfolios constituting Morgan Stanley Institutional Fund, Inc.) (the "Portfolio") as of December 31, 2016, and the related statement of operations for the year then ended, the statements of changes in net assets for each of the two years in the period then ended and the financial highlights for each of the years or periods indicated therein. These financial statements and financial highlights are the responsibility of the Portfolio's management. Our responsibility is to express an opinion on these financial statements and financial highlights based on our audits.
We conducted our audits in accordance with the standards of the Public Company Accounting Oversight Board (United States). Those standards require that we plan and perform the audit to obtain reasonable assurance about whether the financial statements and financial highlights are free of material misstatement. We were not engaged to perform an audit of the Portfolio's internal control over financial reporting. Our audits included consideration of internal control over financial reporting as a basis for designing audit procedures that are appropriate in the circumstances, but not for the purpose of expressing an opinion on the effectiveness of the Portfolio's internal control over financial reporting. Accordingly, we express no such opinion. An audit also includes examining, on a test basis, evidence supporting the amounts and disclosures in the financial statements and financial highlights, assessing the accounting principles used and significant estimates made by management, and evaluating the overall financial statement presentation. Our procedures included confirmation of securities owned as of December 31, 2016, by correspondence with the custodian and others or by other appropriate auditing procedures where replies from others were not received. We believe that our audits provide a reasonable basis for our opinion.
In our opinion, the financial statements and financial highlights referred to above present fairly, in all material respects, the financial position of U.S. Real Estate Portfolio (one of the portfolios constituting Morgan Stanley Institutional Fund, Inc.) at December 31, 2016, the results of its operations for the year then ended, the changes in its net assets for each of the two years in the period then ended and the financial highlights for each of the years or periods indicated therein, in conformity with U.S. generally accepted accounting principles.

Boston, Massachusetts
February 28, 2017
27
Morgan Stanley Institutional Fund, Inc.
Annual Report — December 31, 2016
Federal Tax Notice (unaudited)
For federal income tax purposes, the following information is furnished with respect to the distributions paid by the Portfolio during its taxable year ended December 31, 2016. For corporate shareholders, 0.7% of the dividends qualified for the dividends received deduction.
The Portfolio designated and paid approximately $59,246,000 as a long-term capital gain distribution.
In January, the Portfolio provides tax information to shareholders for the preceding calendar year.
28
Morgan Stanley Institutional Fund, Inc.
Annual Report — December 31, 2016
Privacy Notice (unaudited)
MORGAN STANLEY INVESTMENT MANAGEMENT INC.
AN IMPORTANT NOTICE CONCERNING OUR U.S. PRIVACY POLICY
We are required by federal law to provide you with a copy of our privacy policy annually. This policy applies to current and former individual investors in funds managed or sponsored by Morgan Stanley Investment Management Inc. ("MSIM") as well as current and former individual clients of MSIM. This policy is not applicable to partnerships, corporations, trusts or other non-individual clients or investors. Please note that we may amend this policy at any time, and will inform you of any changes as required by law.
WE RESPECT YOUR PRIVACY
We appreciate that you have provided us with your personal financial information. We strive to maintain the privacy of such information while we help you achieve your financial objectives. This Notice describes what non-public personal information we collect about you, why we collect it, when we may share it with others and how certain others may use it. It discusses the steps you may take to limit our sharing of certain information about you to affiliated companies in the Morgan Stanley family of companies ("other Morgan Stanley companies"). It also discloses how you may limit use of certain shared information for marketing purposes by other Morgan Stanley branded companies. Throughout this policy, we refer to the non-public information that personally identifies you or your accounts as "personal information."
1. WHAT PERSONAL INFORMATION DO WE COLLECT ABOUT YOU?
We obtain personal information from applications and other forms you submit to us, from your dealings with us, from consumer reporting agencies, from our Web sites and from third parties and other sources.
For example:
• We may collect information such as your name, address, e-mail address, telephone/fax numbers, assets, income and investment objectives through subscription documents, applications and other forms you submit to us.
• We may obtain information about account balances, your use of account(s) and the types of products and services you prefer to receive from us through your dealings and transactions with us and other sources.
• We may obtain information about your creditworthiness and credit history from consumer reporting agencies.
• We may collect background information from and through third-party vendors to verify representations you have made and to comply with various regulatory requirements.
• If you interact with us through our public and private Web sites, we may collect information that you provide directly through online communications (such as an e-mail address). We may also collect information about your Internet service provider, your domain name, your computer's operating system and Web browser, your use of our Web sites and your product and service preferences, through the use of "cookies." Please consult the Terms of Use of these sites for more details.
2. WHEN DO WE DISCLOSE PERSONAL INFORMATION WE COLLECT ABOUT YOU?
We may disclose personal information we collect about you to other Morgan Stanley companies and to non-affiliated third parties.
a. Information We Disclose to Other Morgan Stanley Companies.
We may disclose personal information to other Morgan Stanley companies for a variety of reasons, including to manage your account(s) effectively, to service and process your transactions, to let you know about products and services offered by us and other Morgan Stanley companies, to manage our business, and as otherwise required or permitted by law. Offers for products and services from other Morgan Stanley companies are developed under conditions designed to safeguard your personal information.
29
Morgan Stanley Institutional Fund, Inc.
Annual Report — December 31, 2016
Privacy Notice (unaudited) (cont'd)
b. Information We Disclose to Non-affiliated Third Parties.
We do not disclose personal information that we collect about you to non-affiliated third parties except to those who provide marketing services on our behalf, to financial institutions with whom we have joint marketing agreements, and as otherwise required or permitted by law. For example, we may disclose personal information to nonaffiliated third parties for servicing and processing transactions, to offer our own products and services, to protect against fraud, for institutional risk control, to respond to judicial process or to perform services on our behalf. When we share personal information with a non-affiliated third party, they are required to limit their use of personal information to the particular purpose for which it was shared and they are not allowed to share personal information with others except to fulfill that limited purpose or as may be permitted or required by law.
3. HOW DO WE PROTECT THE SECURITY AND CONFIDENTIALITY OF PERSONAL INFORMATION WE COLLECT ABOUT YOU?
We maintain physical, electronic and procedural security measures to help safeguard the personal information we collect about you. We have internal policies governing the proper handling of client information. Third parties that provide support or marketing services on our behalf may also receive personal information, and we require them to adhere to confidentiality standards with respect to such information.
4. HOW CAN YOU LIMIT THE SHARING OF CERTAIN TYPES OF PERSONAL INFORMATION WITH OTHER MORGAN STANLEY COMPANIES?
We offer you choices as to whether we share with other Morgan Stanley companies the personal information that was collected to determine your eligibility for products and services you request ("eligibility information"). Eligibility information does not include your identification information or personal information pertaining to our transactions or experiences with you. Please note that, even if you direct us not to share eligibility information with other Morgan Stanley companies ("opt-out"), we may still share personal information, including eligibility information, with those companies in circumstances excluded from the opt-out under applicable law, such as to process transactions or to service your account.
5. HOW CAN YOU LIMIT THE USE OF CERTAIN TYPES OF PERSONAL INFORMATION BY OTHER MORGAN STANLEY COMPANIES FOR MARKETING?
By following the opt-out instructions in Section 6 below, you may limit other Morgan Stanley branded companies from marketing their products or services to you based on personal information we disclose to them. This information may include, for example, your income and account history with us. Please note that, even if you choose to limit Other Morgan Stanley Companies from using personal information about you that we may share with them for marketing their products and services to you, Other Morgan Stanley Companies may use your personal information that they obtain from us to market to you in circumstances permitted by law, such as if the Other Morgan Stanley Company has its own relationship with you.
6. HOW CAN YOU SEND US AN OPT-OUT INSTRUCTION?
If you wish to limit our sharing of eligibility information about you with other Morgan Stanley companies or other Morgan Stanley companies' use of personal information for marketing purposes, as described in this notice, you may do so by:
• Calling us at (800) 548-7786
Monday–Friday between 8a.m. and 6p.m.(EST)
• Writing to us at the following address:
Boston Financial Data Services, Inc.
c/o Privacy Coordinator
P.O. Box 219804
Kansas City, Missouri 64121
30
Morgan Stanley Institutional Fund, Inc.
Annual Report — December 31, 2016
Privacy Notice (unaudited) (cont'd)
Your written request should include your name, address, telephone number and account number(s) to which the opt-out applies and whether you are opting out with respect to sharing of eligibility information (Section 4 above), or if information used for Marketing (Section 5 above) or both. Written opt-out requests should not be sent with any other correspondence. In order to process your request, we require that the request be provided by you directly and not through a third party.
Your opt-out preference will remain in effect with respect to this policy (as it may be amended) until you notify us otherwise. If you have a joint account, your direction for us not to share this information with other Morgan Stanley companies and for those other Morgan Stanley companies not to use your personal information for marketing will be applied to all account holders on that account. Please understand that if you limit our sharing or our affiliated companies' use of personal information, you and any joint account holder(s) may not receive information about Morgan Stanley products and services, including products or services that could help you manage your financial resources and achieve your investment objectives.
7. WHAT IF AN AFFILIATED COMPANY BECOMES A NON-AFFILIATED THIRD PARTY?
If, at any time in the future, an affiliated company becomes a non-affiliated third party, further disclosures of personal information made to the former affiliated company will be limited to those described in Section 2(b) above relating to non-affiliated third parties. If you elected under Section 6 to limit disclosures we make to affiliated companies, or use of personal information by affiliated companies, your election will not apply to use by any former affiliated company of your personal information in their possession once it becomes a non-affiliated third party.
SPECIAL NOTICE TO RESIDENTS OF VERMONT
The following section supplements our policy with respect to our individual clients who have a Vermont address and supersedes anything to the contrary in the above policy with respect to those clients only.
The state of Vermont requires financial institutions to obtain your consent prior to sharing personal information that they collect about you with affiliated companies and non-affiliated third parties other than in certain limited circumstances. Except as permitted by law, we will not share personal information we collect about you with non-affiliated third parties or other Morgan Stanley companies unless you provide us with your written consent to share such information ("opt-in").
If you wish to receive offers for investment products and services offered by or through other Morgan Stanley companies, please notify us in writing at the following address:
Boston Financial Data Services, Inc.
c/o Privacy Coordinator
P.O. Box 219804
Kansas City, Missouri 64121
Your authorization should include your name, address, telephone number and account number(s) to which the opt-in applies and should not be sent with any other correspondence. In order to process your authorization, we require that the authorization be provided by you directly and not through a third party.
SPECIAL NOTICE TO RESIDENTS OF CALIFORNIA
The following section supplements our policy with respect to our individual clients who have a California address and supersedes anything to the contrary in the above policy with respect to those clients only.
In response to a California law, if your account has a California home address, your personal information will not be disclosed to nonaffiliated third parties except as permitted by applicable California law, and we will limit sharing such information with our affiliates to comply with California privacy laws that apply to us.
31
Morgan Stanley Institutional Fund, Inc.
Annual Report — December 31, 2016
Director and Officer Information (unaudited)
Independent Directors:
Name, Age and Address of
Independent Director | | Position(s)
Held with
Registrant | | Length of Time
Served* | | Principal Occupation(s) During Past 5 Years
and Other Relevant Professional Experience | | Number of
Overseen by
Independent
Director** | | Portfolios in
Fund Complex
Other Directorships
Held by Independent
Director*** | |
Frank L. Bowman (72)
c/o Perkins Coie LLP
Counsel to the Independent
Directors
30 Rockefeller Plaza
New York, NY 10112 | | Director | | Since
August
2006 | | President, Strategic Decisions, LLC (consulting) (since February 2009); Director or Trustee of various Morgan Stanley Funds (since August 2006); Chairperson of the Compliance and Insurance Committee (since October 2015); formerly, Chairperson of the Insurance Sub-Committee of the Compliance and Insurance Committee (2007-2015); served as President and Chief Executive Officer of the Nuclear Energy Institute (policy organization) (February 2005-November 2008); retired as Admiral, U.S. Navy after serving over 38 years on active duty including 8 years as Director of the Naval Nuclear Propulsion Program in the Department of the Navy and the U.S. Department of Energy (1996-2004); served as Chief of Naval Personnel (July 1994-September 1996) and on the Joint Staff as Director of Political Military Affairs (June 1992-July 1994); knighted as Honorary Knight Commander of the Most Excellent Order of the British Empire; awarded the Officier de l'Orde National du Mérite by the French Government; elected to the National Academy of Engineering (2009). | | 90 | | Director of BP p.l.c.; Director of Naval and Nuclear Technologies LLP; Director Emeritus of the Armed Services YMCA; Director of the U.S. Naval Submarine League; Member of the National Security Advisory Council of the Center for U.S. Global Engagement and a member of the CNA Military Advisory Board; Chairman of the charity J Street Cup Golf; Trustee of Fairhaven United Methodist Church; and Director of other various non-profit organizations. | |
Kathleen A. Dennis (63)
c/o Perkins Coie LLP
Counsel to the Independent Directors
30 Rockefeller Plaza
New York, NY 10112 | | Director | | Since
August
2006 | | President, Cedarwood Associates (mutual fund and investment management consulting) (since July 2006); Chairperson of the Liquidity and Alternatives Sub-Committee of the Investment Committee (since October 2006) and Director or Trustee of various Morgan Stanley Funds (since August 2006); formerly, Senior Managing Director of Victory Capital Management (1993-2006). | | 91 | | Director of various non-profit organizations. | |
Nancy C. Everett (61)
c/o Perkins Coie LLP
Counsel to the Independent Directors
30 Rockefeller Plaza
New York, NY 10112 | | Director | | Since
January
2015 | | Chief Executive Officer, Virginia Commonwealth University Investment Company (since November 2015); Owner, OBIR, LLC (institutional investment management consulting) (since June 2014); formerly, Managing Director, BlackRock Inc. (February 2011-December 2013); and Chief Executive Officer, General Motors Asset Management (a/k/a Promark Global Advisors, Inc.) (June 2005-May 2010). | | 91 | | Member of Virginia Commonwealth University School of Business Foundation; formerly, Member of Virginia Commonwealth University Board of Visitors (2013-2015); Member of Committee on Directors for Emerging Markets Growth Fund, Inc. (2007-2010); Chairperson of Performance Equity Management, LLC (2006-2010); and Chairperson, GMAM Absolute Return Strategies Fund, LLC (2006-2010). | |
32
Morgan Stanley Institutional Fund, Inc.
Annual Report — December 31, 2016
Director and Officer Information (unaudited) (cont'd)
Independent Directors: (cont'd)
Name, Age and Address of
Independent Director | | Position(s)
Held with
Registrant | | Length of Time
Served* | | Principal Occupation(s) During Past 5 Years
and Other Relevant Professional Experience | | Number of
Overseen by
Independent
Director** | | Portfolios in
Fund Complex
Other Directorships
Held by Independent
Director*** | |
Jakki L. Haussler (59)
c/o Perkins Coie LLP
Counsel to the Independent Directors
30 Rockefeller Plaza
New York, NY 10112 | | Director | | Since
January
2015 | | Chairman and Chief Executive Officer, Opus Capital Group (since January 1996); formerly, Director, Capvest Venture Fund, LP (May 2000-December 2011); Partner, Adena Ventures, LP (July 1999-December 2010); Director, The Victory Funds (February 2005-July 2008). | | 91 | | Director of Cincinnati Bell Inc. and Member, Audit Committee and Compensation Committee; Director of Northern Kentucky University Foundation and Member, Investment Committee; Member of Chase College of Law Transactional Law Practice Center Board of Advisors; Director of Best Transport; Director of Chase College of Law Board of Visitors; formerly, Member, University of Cincinnati Foundation Investment Committee; Member, Miami University Board of Visitors (2008-2011); Trustee of Victory Funds (2005-2008) and Chairman, Investment Committee (2007-2008) and Member, Service Provider Committee (2005-2008). | |
Dr. Manuel H. Johnson (67)
c/o Johnson Smick
International, Inc.
220 I Street, N.E. — Suite 200
Washington, D.C. 20002 | | Director | | Since
July
1991 | | Senior Partner, Johnson Smick International, Inc. (consulting firm); Chairperson of the Investment Committee (since October 2006) and Director or Trustee of various Morgan Stanley Funds (since July 1991); Co-Chairman and a founder of the Group of Seven Council (G7C) (international economic commission); formerly, Chairperson of the Audit Committee (July 1991-September 2006), Vice Chairman of the Board of Governors of the Federal Reserve System and Assistant Secretary of the U.S. Treasury. | | 91 | | Director of NVR, Inc. (home construction). | |
Joseph J. Kearns (74)
c/o Kearns & Associates LLC
46 E Peninsula Center #385
Rolling Hills Estates, CA 90274-3712 | | Director | | Since
August
1994 | | President, Kearns & Associates LLC (investment consulting); Chairperson of the Audit Committee (since October 2006) and Director or Trustee of various Morgan Stanley Funds (since August 1994); formerly, Deputy Chairperson of the Audit Committee (July 2003-September 2006) and Chairperson of the Audit Committee of various Morgan Stanley Funds (since August 1994); CFO of the J. Paul Getty Trust. | | 93 | | Director of Electro Rent Corporation (equipment leasing). Prior to December 31, 2013, Director of The Ford Family Foundation. | |
33
Morgan Stanley Institutional Fund, Inc.
Annual Report — December 31, 2016
Director and Officer Information (unaudited) (cont'd)
Independent Directors: (cont'd)
Name, Age and Address of
Independent Director | | Position(s)
Held with
Registrant | | Length of Time
Served* | | Principal Occupation(s) During Past 5 Years
and Other Relevant Professional Experience | | Number of
Overseen by
Independent
Director** | | Portfolios in
Fund Complex
Other Directorships
Held by Independent
Director*** | |
Michael F. Klein (58)
c/o Perkins Coie LLP
Counsel to the Independent Directors
30 Rockefeller Plaza
New York, NY 10112 | | Director | | Since
August
2006 | | Managing Director, Aetos Capital, LLC (since March 2000); Co-President, Aetos Alternatives Management, LLC (since January 2004) and Co-Chief Executive Officer of Aetos Capital LLC (since August 2013); Chairperson of the Fixed Income Sub-Committee of the Investment Committee (since October 2006) and Director or Trustee of various Morgan Stanley Funds (since August 2006); formerly, Managing Director, Morgan Stanley & Co. Inc. and Morgan Stanley Dean Witter Investment Management, President, various Morgan Stanley Funds (June 1998-March 2000) and Principal, Morgan Stanley & Co. Inc. and Morgan Stanley Dean Witter Investment Management (August 1997-December 1999). | | 90 | | Director of certain investment funds managed or sponsored by Aetos Capital, LLC; Director of Sanitized AG and Sanitized Marketing AG (specialty chemicals). | |
Patricia Maleski (56)
c/o Perkins Coie LLP
Counsel to the Independent Directors
30 Rockefeller Plaza
New York, NY 10112 | | Director | | Since
January
2017 | | Management Director, JPMorgan Asset Management (2013-2016); President, JPMorgan Funds (2010-2013), Chief Administrative Officer, JPMorgan Funds (2004-2010), Treasurer, JPMorgan Funds (2003-2004, 2008-2010), and Vice President and Board Liaison, JPMorgan Funds (2001-2004); Managing Director, J.P. Morgan Investment Management Inc. (2001-2013); Vice President of Finance, Pierpont Group (1996-2001); Vice President, Bank of New York (1995-1996); Senior Audit Manager, Price Waterhouse, LLP (1982-1995). | | 91 | | None. | |
Michael E. Nugent (80)
522 Fifth Avenue
New York, NY 10036 | | Chair of the Board and Director | | Chair of the Boards since July 2006 and Director since July 1991 | | Chair of the Boards of various Morgan Stanley Funds (since July 2006); Chairperson of the Closed-End Fund Committee (since June 2012) and Director or Trustee of various Morgan Stanley Funds (since July 1991); formerly, Chairperson of the Insurance Committee (until July 2006); General Partner, Triumph Capital, L.P. (private investment partnership) (1988-2013). | | 92 | | None. | |
W. Allen Reed (69)
c/o Perkins Coie LLP
Counsel to the Independent Directors
30 Rockefeller Plaza
New York, NY 10112 | | Director | | Since
August
2006 | | Chairperson of the Equity Sub-Committee of the Investment Committee (since October 2006) and Director or Trustee of various Morgan Stanley Funds (since August 2006); formerly, President and CEO of General Motors Asset Management; Chairman and Chief Executive Officer of the GM Trust Bank and Corporate Vice President of General Motors Corporation (August 1994-December 2005). | | 91 | | Director of Legg Mason, Inc.; formerly, Director of the Auburn University Foundation (2010-2015). | |
Fergus Reid (84)
c/o Joe Pietryka, Inc.
85 Charles Colman Blvd.
Pawling, NY 12564 | | Director | | Since
June
1992 | | Chairman, Joe Pietryka, Inc.; Chairperson of the Governance Committee and Director or Trustee of various Morgan Stanley Funds (since June 1992). | | 92 | | Formerly, Trustee and Director of certain investment companies in the JP Morgan Fund Complex managed by JP Morgan Investment Management Inc. (1987-2012). | |
* This is the earliest date the Director began serving the Morgan Stanley Funds. Each Director serves an indefinite term, until his or her successor is elected.
** The Fund Complex includes (as of December 31, 2016) all open-end and closed-end funds (including all of their portfolios) advised by Morgan Stanley Investment Management Inc. (the "Adviser") and any funds that have an adviser that is an affiliated person of the Adviser (including, but not limited to, Morgan Stanley AIP GP LP).
*** This includes any directorships at public companies and registered investment companies held by the Director at any time during the past five years.
34
Morgan Stanley Institutional Fund, Inc.
Annual Report — December 31, 2016
Director and Officer Information (unaudited) (cont'd)
Executive Officers:
Name, Age and Address of Executive Officer | | Position(s)
Held with
Registrant | | Length of Time
Served* | | Principal Occupation(s) During Past 5 Years | |
John H. Gernon (53)
522 Fifth Avenue
New York, NY 10036 | | President and Principal Executive Officer | | Since
September
2013 | | President and Principal Executive Officer of the Equity and Fixed Income Funds and the Morgan Stanley AIP Funds (since September 2013) and the Liquidity Funds and various money market funds (since May 2014) in the Fund Complex; Managing Director of the Adviser; Head of Product (since 2006). | |
Timothy J. Knierim (58)
522 Fifth Avenue
New York, NY 10036 | | Chief Compliance Officer | | Since
December
2016 | | Managing Director of the Adviser and various entities affiliated with the Adviser; Chief Compliance Officer of various Morgan Stanley Funds and the Adviser (since December 2016) and Chief Compliance Officer of Morgan Stanley AIP GP LP (since 2014). Formerly, Managing Director and Deputy Chief Compliance Officer of the Adviser (2014-2016); and formerly, Chief Compliance Officer of Prudential Investment Management, Inc. (2007-2014). | |
Francis J. Smith (51)
522 Fifth Avenue
New York, NY 10036 | | Treasurer and Principal Financial Officer | | Treasurer since July 2003 and Principal Financial Officer since September 2002 | | Managing Director of the Adviser and various entities affiliated with the Adviser; Treasurer (since July 2003) and Principal Financial Officer of various Morgan Stanley Funds (since September 2002). | |
Mary E. Mullin (49)
522 Fifth Avenue
New York, NY 10036 | | Secretary | | Since
June
1999 | | Executive Director of the Adviser; Secretary of various Morgan Stanley Funds (since June 1999). | |
* This is the earliest date the officer began serving the Morgan Stanley Funds. Each officer serves a one-year term, until his or her successor is elected and qualifies.
35
Morgan Stanley Institutional Fund, Inc.
Annual Report — December 31, 2016
Adviser and Administrator
Morgan Stanley Investment Management Inc.
522 Fifth Avenue
New York, New York 10036
Distributor
Morgan Stanley Distribution, Inc.
522 Fifth Avenue
New York, New York 10036
Dividend Disbursing and Transfer Agent
Boston Financial Data Services, Inc.
2000 Crown Colony Drive
Quincy, Massachusetts 02169
Custodian
State Street Bank and Trust Company
One Lincoln Street
Boston, Massachusetts 02111
Legal Counsel
Dechert LLP
1095 Avenue of the Americas
New York, New York 10036
Counsel to the Independent Directors
Perkins Coie LLP
30 Rockefeller Plaza
New York, New York 10112
Independent Registered Public Accounting Firm
Ernst & Young LLP
200 Clarendon Street
Boston, Massachusetts 02116
Reporting to Shareholders
Each Morgan Stanley fund provides a complete schedule of portfolio holdings in its semi-annual and annual reports within 60 days of the end of the fund's second and fourth fiscal quarters. The semi-annual and annual reports are filed electronically with the Securities and Exchange Commission (SEC) on Form N-CSRS and Form N-CSR, respectively. Morgan Stanley also delivers the semi-annual and annual reports to fund shareholders and makes these reports available on its public website, www.morganstanley.com/im. Each Morgan Stanley fund also files a complete schedule of portfolio holdings with the SEC for the fund's first and third fiscal quarters on Form N-Q. Morgan Stanley does not deliver the reports for the first and third fiscal quarters to shareholders, nor are the reports posted to the Morgan Stanley public website. You may, however, obtain the Form N-Q filings (as well as the Form N-CSR and N-CSRS filings) by accessing the SEC's website, www.sec.gov. You may also review and copy them at the SEC's Public Reference Room in Washington, DC. Information on the operation of the SEC's Public Reference Room may be obtained by calling the SEC toll free at 1 (800) SEC-0330. You can also request copies of these materials, upon payment of a duplicating fee, by electronic request at the SEC's email address (publicinfo@sec.gov) or by writing the Public Reference Room of the SEC, 100 F Street, NE, Washington, DC 20549-0102.
Proxy Voting Policies and Procedures and Proxy Voting Record
You may obtain a copy of the Fund's Proxy Voting Policy and Procedures and information regarding how the Fund voted proxies relating to portfolio securities during the most recent twelve-month period ended June 30, without charge, upon request, by calling toll free 1 (800) 548-7786 or by visiting our website at www.morganstanley.com/im. This information is also available on the SEC's website at www.sec.gov.
This report is authorized for distribution only when preceded or accompanied by a prospectus or summary prospectus of the applicable Portfolio of Morgan Stanley Institutional Fund, Inc., which describes in detail the Portfolio's investment policies, risks, fees and expenses. Please read the prospectus carefully before you invest or send money. For additional information, including information regarding the investments comprising the Portfolio, please visit our website at www.morganstanley.com/im or call toll free 1 (800) 548-7786.
36
Printed in U.S.A.
This Report has been prepared for shareholders and may be distributed to others only if preceded or accompanied by a current prospectus.
Morgan Stanley Investment Management Inc.
522 Fifth Avenue
New York, New York 10036
© 2017 Morgan Stanley. Morgan Stanley Distribution, Inc.

IFIUSREAANN
1700148 EXP. 02.28.18

Morgan Stanley Institutional Fund, Inc.
US Core Portfolio
Annual Report
December 31, 2016

Morgan Stanley Institutional Fund, Inc.
Annual Report — December 31, 2016
Shareholders' Letter | | | 2 | | |
Expense Example | | | 3 | | |
Investment Overview | | | 4 | | |
Portfolio of Investments | | | 6 | | |
Statement of Assets and Liabilities | | | 7 | | |
Statement of Operations | | | 8 | | |
Statement of Changes in Net Assets | | | 9 | | |
Financial Highlights | | | 10 | | |
Notes to Financial Statements | | | 14 | | |
Report of Independent Registered Public Accounting Firm | | | 20 | | |
Federal Tax Notice | | | 21 | | |
Privacy Notice | | | 22 | | |
Director and Officer Information | | | 25 | | |
This report is authorized for distribution only when preceded or accompanied by a prospectus or summary prospectus of the applicable Portfolio of Morgan Stanley Institutional Fund, Inc. To receive a prospectus and/or statement of additional information (SAI), which contains more complete information such as investment objectives, charges, expenses, policies for voting proxies, risk considerations, and describes in detail each of the Portfolio's investment policies to the prospective investor, please call toll free 1 (800) 548-7786. Please read the prospectuses carefully before you invest or send money.
Additionally, you can access information about the Portfolio, including performance, characteristics, and investment team commentary, through Morgan Stanley Investment Management's website: www.morganstanley.com/im.
Market forecasts provided in this report may not necessarily come to pass. There is no guarantee that any sectors mentioned will continue to perform as discussed herein or that securities in such sectors will be held by the Portfolio in the future. There is no assurance that a Portfolio will achieve its investment objective. Portfolios are subject to market risk, which is the possibility that market values of securities owned by the Portfolio will decline and, therefore, the value of the Portfolio's shares may be less than what you paid for them. Accordingly, you can lose money investing in this Portfolio. Please see the prospectus for more complete information on investment risks.
1
Morgan Stanley Institutional Fund, Inc.
Annual Report — December 31, 2016
Shareholders' Letter (unaudited)
Dear Shareholders,
We are pleased to provide this Annual report, in which you will learn how your investment in US Core Portfolio (the "Portfolio") performed during the period beginning May 27, 2016 (when the Portfolio launched) and ended December 31, 2016.
Morgan Stanley Investment Management is a client-centric, investor-led organization. Our global presence, intellectual capital, and breadth of products and services enable us to partner with investors to meet the evolving challenges of today's financial markets. We aim to deliver superior investment service and to empower our clients to make the informed decisions that help them reach their investment goals.
As always, we thank you for selecting Morgan Stanley Investment Management, and look forward to working with you in the months and years ahead.
Sincerely,

John H. Gernon
President and Principal Executive Officer
January 2017
2
Morgan Stanley Institutional Fund, Inc.
Annual Report — December 31, 2016
Expense Example (unaudited)
US Core Portfolio
As a shareholder of the Portfolio, you incur two types of costs: (1) transactional costs; and (2) ongoing costs, which may include advisory fees, administration fees, distribution and shareholder services fees and other Portfolio expenses. This example is intended to help you understand your ongoing costs (in dollars) of investing in the Portfolio and to compare these costs with the ongoing costs of investing in other mutual funds.
This example is based on an investment of $1,000 invested at the beginning of the six-month period ended December 31, 2016 and held for the entire six-month period.
Actual Expenses
The table below provides information about actual account values and actual expenses. You may use the information in this table, together with the amount you invested, to estimate the expenses that you paid over the period. Simply divide your account value by $1,000 (for example, an $8,600 account value divided by $1,000 = 8.6), then multiply the result by the number in the table under the heading entitled "Actual Expenses Paid During Period" to estimate the expenses you paid on your account during this period.
Hypothetical Example for Comparison Purposes
The table below provides information about hypothetical account values and hypothetical expenses based on the Portfolio's actual expense ratio and an assumed rate of return of 5% per year before expenses, which is not the Portfolio's actual return. The hypothetical account values and expenses may not be used to estimate the actual ending account balance or expenses you paid for the period. You may use this information to compare the ongoing costs of investing in the Portfolio and other funds. To do so, compare this 5% hypothetical example with the 5% hypothetical examples that appear in the shareholder reports of the other funds.
Please note that the expenses shown in the table are meant to highlight your ongoing costs only and do not reflect any transactional costs, such as sales charges (loads). Therefore, the information for each class in the table is useful in comparing ongoing costs only, and will not help you determine the relative total costs of owning different funds. In addition, if these transactional costs were included, your costs would have been higher.
| | | Beginning
Account
Value
7/1/16 | | Actual Ending
Account
Value
12/31/16 | | Hypothetical
Ending Account
Value | | Actual
Expenses
Paid
During
Period* | | Hypothetical
Expenses Paid
During Period* | | Net
Expense
Ratio
During
Period** | |
US Core Portfolio Class I | | $ | 1,000.00 | | | $ | 1,059.30 | | | $ | 1,021.27 | | | $ | 3.99 | | | $ | 3.91 | | | | 0.77 | % | |
US Core Portfolio Class A | | | 1,000.00 | | | | 1,058.20 | | | | 1,019.36 | | | | 5.95 | | | | 5.84 | | | | 1.15 | | |
US Core Portfolio Class C | | | 1,000.00 | | | | 1,053.10 | | | | 1,015.58 | | | | 9.81 | | | | 9.63 | | | | 1.90 | | |
US Core Portfolio Class IS | | | 1,000.00 | | | | 1,059.40 | | | | 1,021.37 | | | | 3.88 | | | | 3.81 | | | | 0.75 | | |
* Expenses are calculated using each Portfolio Class' annualized net expense ratio (as disclosed), multiplied by the average account value over the period, and multiplied by 184/366 (to reflect the most recent one-half year period).
** Annualized.
3
Morgan Stanley Institutional Fund, Inc.
Annual Report — December 31, 2016
Investment Overview (unaudited)
US Core Portfolio
The Portfolio seeks long-term capital appreciation.
Performance
For the period from inception on May 27, 2016 through December 31, 2016, the Portfolio's Class I shares had a total return based on net asset value and reinvestment of distributions per share of 5.50%, net of fees. The Portfolio's Class I shares underperformed the Portfolio's benchmark, the S&P 500 Index (the "Index"), which returned 8.00% for the same period.
Factors Affecting Performance
• The reporting period proved to be a volatile time for the equity market, beginning with the spillover effects going into and following the Brexit vote, anticipation of the next Federal Reserve rate hike, and reactions to the U.S. presidential election campaign as well as its ultimate result. Earnings projections for 2016 were roughly flat compared to 2015, and since prior to the election, earnings growth expectations for 2017 were in the low double-digits. However, it was not until immediately following the election that the market began to price in better earnings projections for 2017. Positive economic data such as gross domestic product growth, wage growth, low unemployment, moderate inflation, and increased consumer confidence contributed to investor enthusiasm.
• For the Index, the greatest strength over the reporting period came from the cyclical sectors that had experienced an earnings recession going into 2016: financials, energy, and industrials. However, health care, real estate, and consumer staples lagged overall market performance.
• The Portfolio benefited during the period from its sector allocation. An underweight to historically low volatility, higher dividend yielding sectors such as consumer staples, telecommunication services, and utilities contributed positively to the Portfolio. Likewise, the Portfolio's overweights to financials and industrials added gains. Slightly detracting from performance were overweights to consumer discretionary and information technology stocks and an underweight to energy stocks.
• For stock selection, two health care stocks in particular contributed to Portfolio underperformance for the period. Within health
care, the pharmaceuticals subsector had the greatest negative decline, as pricing concerns weighed on share prices since August.
• The top contributor to performance for the period was a global property, casualty and specialty insurance company that in December agreed to be acquired. The Portfolio also benefited from a position in a global semiconductor manufacturer that sells its chips into major manufacturers of mobile devices and internet connectivity devices.
Management Strategies
• There have been no changes to our investment process during the period. Statistically, the majority of a portfolio's annual return can be explained by its common factor exposures (which we categorize as growth, value, quality, and risk). The tilting of these exposures is highly correlated to alpha generation (that is, a portfolio's excess return over a benchmark). Therefore, the team begins with a quantitative process to identify the common factors we believe are likely to prevail going forward. The rest of a portfolio's annual returns is explained by its company-specific results, meaning that stock selection is also a key determinant to alpha generation. We employ in an effort a bottom-up fundamental stock selection process to capture idiosyncratic returns. The result is a highly active portfolio of fundamentally attractive stocks which we believe could benefit from what we have identified to be quantitative investment styles likely to outperform.
• As we move into 2017, the Portfolio is positioned with a modestly higher weighting in value stocks over growth stocks. We remain underweight in historically low volatility, higher dividend yielding sectors that remain expensive relative to their historic valuations. We believe that the financial sector in particular could benefit in an environment of rising interest rates following a decade of significant underperformance.
4
Morgan Stanley Institutional Fund, Inc.
Annual Report — December 31, 2016
Investment Overview (unaudited) (cont'd)
US Core Portfolio
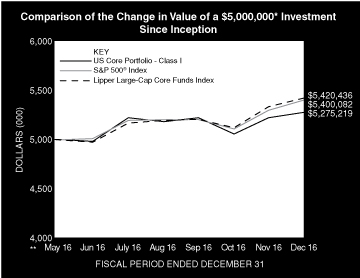
* Minimum Investment for Class I shares
** Commenced Operations on May 27, 2016.
In accordance with SEC regulations, the Portfolio's performance shown assumes that all recurring fees (including management fees) were deducted and all dividends and distributions were reinvested. The performance of Class A, C and IS shares will vary from the performance of Class I shares and will be impacted by additional fees assessed to those classes (if applicable).
Performance Compared to the S&P 500® Index(1) and the Lipper Large-Cap Core Funds Index(2)
| | | Period Ended December 31, 2016
Total Returns(3) | |
| | | One
Year | | Five
Years | | Ten
Years | | Since
Inception(5) | |
Portfolio — Class I Shares
w/o sales charges(4) | | | — | | | | — | | | | — | | | | 5.50 | % | |
Portfolio — Class A Shares
w/o sales charges(4) | | | — | | | | — | | | | — | | | | 5.30 | | |
Portfolio — Class A Shares with
maximum 5.25% sales charges(4) | | | — | | | | — | | | | — | | | | –0.19 | | |
Portfolio — Class C Shares
w/o sales charges(4) | | | — | | | | — | | | | — | | | | 4.79 | | |
Portfolio — Class C Shares with
maximum 1.00% deferred
sales charges(4) | | | — | | | | — | | | | — | | | | 3.79 | | |
Portfolio — Class IS Shares
w/o sales charges(4) | | | — | | | | — | | | | — | | | | 5.52 | | |
S&P 500® Index | | | — | | | | — | | | | — | | | | 8.00 | | |
Lipper Large-Cap Core Funds Index | | | — | | | | — | | | | — | | | | 8.41 | | |
Performance data quoted represents past performance, which is no guarantee of future results, and current performance may be lower or higher than the figures shown. Performance assumes that all dividends and distributions, if any, were reinvested. For the most recent month-end performance figures, please visit www.morganstanley.com/im. Investment return and principal value will fluctuate so that Portfolio shares, when redeemed, may be worth more or less than their original cost. Total returns do not reflect the deduction of taxes that a shareholder would pay on Portfolio distributions or the redemption of Portfolio shares. Returns for periods less than one year are not annualized. Performance of share classes will vary due to difference in expenses.
(1) The Standard & Poor's 500® Index (S&P 500®) measures the performance of the large cap segment of the U.S. equities market, covering approximately 80% of the U.S. equities market. The Index includes 500 leading companies in leading industries of the U.S. economy. The Index is unmanaged and its returns do not include any sales charges or fees. Such costs would lower performance. It is not possible to invest directly in an index.
(2) The Lipper Large-Cap Core Funds Index is an equally weighted performance index of the largest qualifying funds (based on net assets) in the Lipper Large-Cap Core Funds classification. The Index, which is adjusted for capital gains distributions and income dividends, is unmanaged and should not be considered an investment. There are currently 30 funds represented in this Index. As of the date of this report, the Portfolio is in the Lipper Large-Cap Core Funds classification.
(3) Total returns for the Portfolio reflect fees waived and expenses reimbursed, if applicable, by the Adviser. Without such waivers and reimbursements, total returns would have been lower.
(4) Commenced operations on May 27, 2016.
(5) For comparative purposes, average annual since inception returns listed for the Indexes refer to the inception date of the Portfolio, not the inception of the Index.
5
Morgan Stanley Institutional Fund, Inc.
Annual Report — December 31, 2016
Portfolio of Investments
US Core Portfolio
| | | Shares | | Value
(000) | |
Common Stocks (90.3%) | |
Aerospace & Defense (4.1%) | |
Northrop Grumman Corp. | | | 1,789 | | | $ | 416 | | |
Air Freight & Logistics (1.0%) | |
United Parcel Service, Inc., Class B | | | 838 | | | | 96 | | |
Banks (3.0%) | |
JPMorgan Chase & Co. | | | 3,558 | | | | 307 | | |
Biotechnology (2.4%) | |
Amgen, Inc. | | | 1,667 | | | | 244 | | |
Capital Markets (8.9%) | |
BlackRock, Inc. | | | 596 | | | | 227 | | |
Franklin Resources, Inc. | | | 11,426 | | | | 452 | | |
Invesco Ltd. | | | 7,288 | | | | 221 | | |
| | | | 900 | | |
Consumer Finance (1.1%) | |
Synchrony Financial | | | 2,999 | | | | 109 | | |
Diversified Telecommunication Services (5.6%) | |
Verizon Communications, Inc. | | | 10,680 | | | | 570 | | |
Electrical Equipment (1.4%) | |
Emerson Electric Co. | | | 2,617 | | | | 146 | | |
Energy Equipment & Services (5.8%) | |
National Oilwell Varco, Inc. | | | 4,993 | | | | 187 | | |
Schlumberger Ltd. | | | 4,795 | | | | 402 | | |
| | | | 589 | | |
Food & Staples Retailing (2.9%) | |
CVS Health Corp. | | | 3,650 | | | | 288 | | |
Health Care Equipment & Supplies (4.9%) | |
Danaher Corp. | | | 6,352 | | | | 494 | | |
Health Care Providers & Services (0.4%) | |
Cigna Corp. | | | 317 | | | | 42 | | |
Hotels, Restaurants & Leisure (2.5%) | |
Starbucks Corp. | | | 4,461 | | | | 248 | | |
Household Durables (3.3%) | |
Newell Brands, Inc. | | | 7,458 | | | | 333 | | |
Information Technology Services (1.7%) | |
Mastercard, Inc., Class A | | | 1,639 | | | | 169 | | |
Insurance (4.1%) | |
Allied World Assurance Co. Holdings AG | | | 5,112 | | | | 275 | | |
AmTrust Financial Services, Inc. | | | 4,974 | | | | 136 | | |
| | | | 411 | | |
Internet & Direct Marketing Retail (4.6%) | |
Priceline Group, Inc. (The) (Netherlands) (a) | | | 317 | | | | 465 | | |
Internet Software & Services (7.1%) | |
Alphabet, Inc., Class A (a) | | | 904 | | | | 716 | | |
Machinery (4.0%) | |
Illinois Tool Works, Inc. | | | 3,315 | | | | 406 | | |
Media (5.1%) | |
Comcast Corp., Class A | | | 7,525 | | | | 520 | | |
Metals & Mining (0.4%) | |
Agnico-Eagle Mines Ltd. (Canada) | | | 1,078 | | | | 45 | | |
| | | Shares | | Value
(000) | |
Pharmaceuticals (4.1%) | |
Allergan PLC (a) | | | 1,955 | | | $ | 411 | | |
Semiconductors & Semiconductor Equipment (7.2%) | |
Broadcom Ltd. | | | 475 | | | | 84 | | |
QUALCOMM, Inc. | | | 5,744 | | | | 375 | | |
Taiwan Semiconductor Manufacturing Co., Ltd.
ADR (Taiwan) | | | 9,199 | | | | 264 | | |
| | | | 723 | | |
Tech Hardware, Storage & Peripherals (4.7%) | |
Apple, Inc. | | | 4,068 | | | | 471 | | |
Total Common Stocks (Cost $8,771) | | | 9,119 | | |
Short-Term Investment (5.7%) | |
Investment Company (5.7%) | |
Morgan Stanley Institutional Liquidity
Funds — Treasury Securities Portfolio —
Institutional Class (See Note G)
(Cost $581) | | | 580,561 | | | | 581 | | |
Total Investments (96.0%) (Cost $9,352) (b) | | | 9,700 | | |
Other Assets in Excess of Liabilities (4.0%) | | | 407 | | |
Net Assets (100.0%) | | $ | 10,107 | | |
(a) Non-income producing security.
(b) At December 31, 2016, the aggregate cost for federal income tax purposes is approximately $9,377,000. The aggregate gross unrealized appreciation is approximately $487,000 and the aggregate gross unrealized depreciation is approximately $164,000, resulting in net unrealized appreciation of approximately $323,000.
ADR American Depositary Receipt.
Portfolio Composition
Classification | | Percentage of
Total Investments | |
Other* | | | 47.5 | % | |
Capital Markets | | | 9.3 | | |
Semiconductors & Semiconductor Equipment | | | 7.4 | | |
Internet Software & Services | | | 7.4 | | |
Energy Equipment & Services | | | 6.1 | | |
Short-Term Investments | | | 6.0 | | |
Diversified Telecommunication Services | | | 5.9 | | |
Media | | | 5.3 | | |
Health Care Equipment & Supplies | | | 5.1 | | |
Total Investments | | | 100.0 | % | |
* Industries and/or investment types representing less than 5% of total investments.
The accompanying notes are an integral part of the financial statements.
6
Morgan Stanley Institutional Fund, Inc.
Annual Report — December 31, 2016
Statement of Assets and Liabilities | | December 31, 2016
(000) | |
Assets: | |
Investments in Securities of Unaffiliated Issuers, at Value (Cost $8,771) | | $ | 9,119 | | |
Investment in Security of Affiliated Issuer, at Value (Cost $581) | | | 581 | | |
Total Investments in Securities, at Value (Cost $9,352) | | | 9,700 | | |
Receivable for Portfolio Shares Sold | | | 763 | | |
Due from Adviser | | | 42 | | |
Prepaid Offering Costs | | | 40 | | |
Dividends Receivable | | | 10 | | |
Receivable from Affiliate | | | — | @ | |
Other Assets | | | 1 | | |
Total Assets | | | 10,556 | | |
Liabilities: | |
Payable for Investments Purchased | | | 393 | | |
Payable for Professional Fees | | | 25 | | |
Payable for Offering Costs | | | 18 | | |
Payable for Custodian Fees | | | 2 | | |
Payable for Portfolio Shares Redeemed | | | 2 | | |
Payable for Transfer Agency Fees — Class I | | | — | @ | |
Payable for Transfer Agency Fees — Class A | | | — | @ | |
Payable for Transfer Agency Fees — Class C | | | — | @ | |
Payable for Shareholder Services Fees — Class A | | | — | @ | |
Payable for Distribution and Shareholder Services Fees — Class C | | | 1 | | |
Payable for Administration Fees | | | 1 | | |
Other Liabilities | | | 7 | | |
Total Liabilities | | | 449 | | |
Net Assets | | $ | 10,107 | | |
Net Assets Consist Of: | |
Paid-in-Capital | | $ | 9,872 | | |
Distributions in Excess of Net Investment Income | | | (36 | ) | |
Accumulated Net Realized Loss | | | (77 | ) | |
Unrealized Appreciation (Depreciation) on: | |
Investments | | | 348 | | |
Net Assets | | $ | 10,107 | | |
CLASS I: | |
Net Assets | | $ | 7,314 | | |
| Shares Outstanding $0.001 par value shares of beneficial interest (unlimited shares authorized) (not in 000's) | | | 699,878 | | |
Net Asset Value, Offering and Redemption Price Per Share | | $ | 10.45 | | |
CLASS A: | |
Net Assets | | $ | 1,406 | | |
| Shares Outstanding $0.001 par value shares of beneficial interest (unlimited shares authorized) (not in 000's) | | | 134,738 | | |
Net Asset Value, Redemption Price Per Share | | $ | 10.44 | | |
Maximum Sales Load | | | 5.25 | % | |
Maximum Sales Charge | | $ | 0.58 | | |
Maximum Offering Price Per Share | | $ | 11.02 | | |
CLASS C: | |
Net Assets | | $ | 1,377 | | |
| Shares Outstanding $0.001 par value shares of beneficial interest (unlimited shares authorized) (not in 000's) | | | 132,245 | | |
Net Asset Value, Offering and Redemption Price Per Share | | $ | 10.41 | | |
CLASS IS: | |
Net Assets | | $ | 10 | | |
| Shares Outstanding $0.001 par value shares of beneficial interest (unlimited shares authorized) (not in 000's) | | | 1,000 | | |
Net Asset Value, Offering and Redemption Price Per Share | | $ | 10.45 | | |
@ Amount is less than $500.
The accompanying notes are an integral part of the financial statements.
7
Morgan Stanley Institutional Fund, Inc.
Annual Report — December 31, 2016
Statement of Operations | | Period from
May 27, 2016^ to
December 31, 2016
(000) | |
Investment Income: | |
Dividends from Securities of Unaffiliated Issuers (Net of $2 of Foreign Taxes Withheld) | | $ | 80 | | |
Dividends from Security of Affiliated Issuer (Note G) | | | — | @ | |
Total Investment Income | | | 80 | | |
Expenses: | |
Offering Costs | | | 57 | | |
Professional Fees | | | 53 | | |
Advisory Fees (Note B) | | | 25 | | |
Shareholder Reporting Fees | | | 8 | | |
Transfer Agency Fees — Class I (Note E) | | | 1 | | |
Transfer Agency Fees — Class A (Note E) | | | 1 | | |
Transfer Agency Fees — Class C (Note E) | | | 1 | | |
Transfer Agency Fees — Class IS (Note E) | | | 1 | | |
Custodian Fees (Note F) | | | 4 | | |
Shareholder Services Fees — Class A (Note D) | | | 1 | | |
Distribution and Shareholder Services Fees — Class C (Note D) | | | 3 | | |
Administration Fees (Note C) | | | 3 | | |
Pricing Fees | | | 1 | | |
Sub Transfer Agency Fees — Class I | | | — | @ | |
Sub Transfer Agency Fees — Class A | | | — | @ | |
Sub Transfer Agency Fees — Class C | | | — | @ | |
Directors' Fees and Expenses | | | — | @ | |
Registration Fees | | | — | @ | |
Other Expenses | | | — | @ | |
Total Expenses | | | 159 | | |
Expenses Reimbursed by Adviser (Note B) | | | (94 | ) | |
Waiver of Advisory Fees (Note B) | | | (25 | ) | |
Reimbursement of Class Specific Expenses — Class A (Note B) | | | (— | @) | |
Reimbursement of Class Specific Expenses — Class C (Note B) | | | (1 | ) | |
Reimbursement of Class Specific Expenses — Class IS (Note B) | | | (1 | ) | |
Rebate from Morgan Stanley Affiliate (Note G) | | | (— | @) | |
Net Expenses | | | 38 | | |
Net Investment Income | | | 42 | | |
Realized Loss: | |
Investments Sold | | | (77 | ) | |
Change in Unrealized Appreciation (Depreciation): | |
Investments | | | 348 | | |
Net Realized Loss and Change in Unrealized Appreciation (Depreciation) | | | 271 | | |
Net Increase in Net Assets Resulting from Operations | | $ | 313 | | |
^ Commencement of Operations.
@ Amount is less than $500.
The accompanying notes are an integral part of the financial statements.
8
Morgan Stanley Institutional Fund, Inc.
Annual Report — December 31, 2016
Statement of Changes in Net Assets | | Period from
May 27, 2016^ to
December 31, 2016
(000) | |
Increase (Decrease) in Net Assets: | |
Operations: | |
Net Investment Income | | $ | 42 | | |
Net Realized Loss | | | (77 | ) | |
Net Change in Unrealized Appreciation (Depreciation) | | | 348 | | |
Net Increase in Net Assets Resulting from Operations | | | 313 | | |
Distributions from and/or in Excess of: | |
Class I: | |
Net Investment Income | | | (64 | ) | |
Class A: | |
Net Investment Income | | | (11 | ) | |
Class C: | |
Net Investment Income | | | (6 | ) | |
Class IS: | |
Net Investment Income | | | (— | @) | |
Total Distributions | | | (81 | ) | |
Capital Share Transactions:(1) | |
Class I: | |
Subscribed | | | 7,645 | | |
Distributions Reinvested | | | 14 | | |
Redeemed | | | (560 | ) | |
Class A: | |
Subscribed | | | 1,488 | | |
Distributions Reinvested | | | 11 | | |
Redeemed | | | (104 | ) | |
Class C: | |
Subscribed | | | 1,366 | | |
Distributions Reinvested | | | 6 | | |
Redeemed | | | (1 | ) | |
Class IS: | |
Subscribed | | | 10 | | |
Net Increase in Net Assets Resulting from Capital Share Transactions | | | 9,875 | | |
Total Increase in Net Assets | | | 10,107 | | |
Net Assets: | |
Beginning of Period | | | — | | |
End of Period (Including Distributions in Excess of Net Investment Income of $(36)) | | $ | 10,107 | | |
(1) Capital Share Transactions: | |
Class I: | |
Shares Subscribed | | | 754 | | |
Shares Issued on Distributions Reinvested | | | 1 | | |
Shares Redeemed | | | (55 | ) | |
Net Increase in Class I Shares Outstanding | | | 700 | | |
Class A: | |
Shares Subscribed | | | 144 | | |
Shares Issued on Distributions Reinvested | | | 1 | | |
Shares Redeemed | | | (10 | ) | |
Net Increase in Class A Shares Outstanding | | | 135 | | |
Class C: | |
Shares Subscribed | | | 131 | | |
Shares Issued on Distributions Reinvested | | | 1 | | |
Shares Redeemed | | | (— | @@) | |
Net Increase in Class C Shares Outstanding | | | 132 | | |
Class IS: | |
Shares Subscribed | | | 1 | | |
^ Commencement of Operations.
@ Amount is less than $500.
@@ Amount is less than 500 shares.
The accompanying notes are an integral part of the financial statements.
9
Morgan Stanley Institutional Fund, Inc.
Annual Report — December 31, 2016
Financial Highlights
US Core Portfolio
| | | Class I | |
Selected Per Share Data and Ratios | | Period from
May 27, 2016(1)
to December 31, 2016 | |
Net Asset Value, Beginning of Period | | $ | 10.00 | | |
Income from Investment Operations: | |
Net Investment Income (2) | | | 0.07 | | |
Net Realized and Unrealized Gain | | | 0.48 | | |
Total from Investment Operations | | | 0.55 | | |
Distributions from and/or in Excess of: | |
Net Investment Income | | | (0.10 | ) | |
Net Asset Value, End of Period | | $ | 10.45 | | |
Total Return (3) | | | 5.50 | %(6) | |
Ratios and Supplemental Data: | |
Net Assets, End of Period (Thousands) | | $ | 7,314 | | |
Ratio of Expenses to Average Net Assets (8) | | | 0.77 | %(4)(7) | |
Ratio of Net Investment Income to Average Net Assets (8) | | | 1.12 | %(4)(7) | |
Ratio of Rebate from Morgan Stanley Affiliates to Average Net Assets | | | 0.00 | %(5)(7) | |
Portfolio Turnover Rate | | | 28 | %(6) | |
(8) Supplemental Information on the Ratios to Average Net Assets: | |
Ratios Before Expense Limitation: | |
Expenses to Average Net Assets | | | 3.62 | %(7) | |
Net Investment Loss to Average Net Assets | | | (1.73 | )%(7) | |
(1) Commencement of Operations.
(2) Per share amount is based on average shares outstanding.
(3) Calculated based on the net asset value as of the last business day of the period.
(4) The Ratios of Expenses and Net Investment Income reflect the rebate of certain Portfolio expenses in connection with the investments in Morgan Stanley affiliates during the period. The effect of the rebate on the ratios is disclosed in the above table as "Ratio of Rebate from Morgan Stanley Affiliates to Average Net Assets."
(5) Amount is less than 0.005%.
(6) Not Annualized.
(7) Annualized.
The accompanying notes are an integral part of the financial statements.
10
Morgan Stanley Institutional Fund, Inc.
Annual Report — December 31, 2016
Financial Highlights
US Core Portfolio
| | | Class A | |
Selected Per Share Data and Ratios | | Period from
May 27, 2016(1)
to December 31, 2016 | |
Net Asset Value, Beginning of Period | | $ | 10.00 | | |
Income from Investment Operations: | |
Net Investment Income (2) | | | 0.04 | | |
Net Realized and Unrealized Gain | | | 0.49 | | |
Total from Investment Operations | | | 0.53 | | |
Distributions from and/or in Excess of: | |
Net Investment Income | | | (0.09 | ) | |
Net Asset Value, End of Period | | $ | 10.44 | | |
Total Return (3) | | | 5.30 | %(6) | |
Ratios and Supplemental Data: | |
Net Assets, End of Period (Thousands) | | $ | 1,406 | | |
Ratio of Expenses to Average Net Assets (8) | | | 1.15 | %(4)(7) | |
Ratio of Net Investment Income to Average Net Assets (8) | | | 0.66 | %(4)(7) | |
Ratio of Rebate from Morgan Stanley Affiliates to Average Net Assets | | | 0.00 | %(5)(7) | |
Portfolio Turnover Rate | | | 28 | %(6) | |
(8) Supplemental Information on the Ratios to Average Net Assets: | |
Ratios Before Expense Limitation: | |
Expenses to Average Net Assets | | | 4.12 | %(7) | |
Net Investment Loss to Average Net Assets | | | (2.31 | )%(7) | |
(1) Commencement of Operations.
(2) Per share amount is based on average shares outstanding.
(3) Calculated based on the net asset value which does not reflect sales charges, if applicable, as of the last business day of the period.
(4) The Ratios of Expenses and Net Investment Income reflect the rebate of certain Portfolio expenses in connection with the investments in Morgan Stanley affiliates during the period. The effect of the rebate on the ratios is disclosed in the above table as "Ratio of Rebate from Morgan Stanley Affiliates to Average Net Assets."
(5) Amount is less than 0.005%.
(6) Not Annualized.
(7) Annualized.
The accompanying notes are an integral part of the financial statements.
11
Morgan Stanley Institutional Fund, Inc.
Annual Report — December 31, 2016
Financial Highlights
US Core Portfolio
| | | Class C | |
Selected Per Share Data and Ratios | | Period from
May 27, 2016(1)
to December 31, 2016 | |
Net Asset Value, Beginning of Period | | $ | 10.00 | | |
Income (Loss) from Investment Operations: | |
Net Investment Loss (2) | | | (0.00 | )(3) | |
Net Realized and Unrealized Gain | | | 0.48 | | |
Total from Investment Operations | | | 0.48 | | |
Distributions from and/or in Excess of: | |
Net Investment Income | | | (0.07 | ) | |
Net Asset Value, End of Period | | $ | 10.41 | | |
Total Return (4) | | | 4.79 | %(7) | |
Ratios and Supplemental Data: | |
Net Assets, End of Period (Thousands) | | $ | 1,377 | | |
Ratio of Expenses to Average Net Assets (9) | | | 1.90 | %(5)(8) | |
Ratio of Net Investment Loss to Average Net Assets (9) | | | (0.05 | )%(5)(8) | |
Ratio of Rebate from Morgan Stanley Affiliates to Average Net Assets | | | 0.00 | %(6)(8) | |
Portfolio Turnover Rate | | | 28 | %(7) | |
(9) Supplemental Information on the Ratios to Average Net Assets: | |
Ratios Before Expense Limitation: | |
Expense to Average Net Assets | | | 4.99 | %(8) | |
Net Investment Loss to Average Net Assets | | | (3.14 | )%(8) | |
(1) Commencement of Operations.
(2) Per share amount is based on average shares outstanding.
(3) Amount is less than $0.005 per share.
(4) Calculated based on the net asset value which does not reflect sales charges, if applicable, as of the last business day of the period.
(5) The Ratios of Expenses and Net Investment Loss reflect the rebate of certain Portfolio expenses in connection with the investments in Morgan Stanley affiliates during the period. The effect of the rebate on the ratios is disclosed in the above table as "Ratio of Rebate from Morgan Stanley Affiliates to Average Net Assets."
(6) Amount is less than 0.005%.
(7) Not Annualized.
(8) Annualized.
The accompanying notes are an integral part of the financial statements.
12
Morgan Stanley Institutional Fund, Inc.
Annual Report — December 31, 2016
Financial Highlights
US Core Portfolio
| | | Class IS | |
Selected Per Share Data and Ratios | | Period from
May 27, 2016(1)
to December 31, 2016 | |
Net Asset Value, Beginning of Period | | $ | 10.00 | | |
Income from Investment Operations: | |
Net Investment Income (2) | | | 0.07 | | |
Net Realized and Unrealized Gain | | | 0.48 | | |
Total from Investment Operations | | | 0.55 | | |
Distributions from and/or in Excess of: | |
Net Investment Income | | | (0.10 | ) | |
Net Asset Value, End of Period | | $ | 10.45 | | |
Total Return (3) | | | 5.52 | %(6) | |
Ratios and Supplemental Data: | |
Net Assets, End of Period (Thousands) | | $ | 10 | | |
Ratio of Expenses to Average Net Assets (8) | | | 0.75 | %(4)(7) | |
Ratio of Net Investment Income to Average Net Assets (8) | | | 1.17 | %(4)(7) | |
Ratio of Rebate from Morgan Stanley Affiliates to Average Net Assets | | | 0.00 | %(5)(7) | |
Portfolio Turnover Rate | | | 28 | %(6) | |
(8) Supplemental Information on the Ratios to Average Net Assets: | |
Ratios Before Expense Limitation: | |
Expenses to Average Net Assets | | | 19.22 | %(7) | |
Net Investment Loss to Average Net Assets | | | (17.30 | )%(7) | |
(1) Commencement of Operations.
(2) Per share amount is based on average shares outstanding.
(3) Calculated based on the net asset value as of the last business day of the period.
(4) The Ratios of Expenses and Net Investment Income reflect the rebate of certain Portfolio expenses in connection with the investments in Morgan Stanley affiliates during the period. The effect of the rebate on the ratios is disclosed in the above table as "Ratio of Rebate from Morgan Stanley Affiliates to Average Net Assets."
(5) Amount is less than 0.005%.
(6) Not Annualized.
(7) Annualized.
The accompanying notes are an integral part of the financial statements.
13
Morgan Stanley Institutional Fund, Inc.
Annual Report — December 31, 2016
Notes to Financial Statements
Morgan Stanley Institutional Fund, Inc. (the "Fund") is registered under the Investment Company Act of 1940, as amended (the "Act"), as an open-end management investment company. The Fund is comprised of twenty-nine separate, active, diversified and non-diversified portfolios (individually referred to as a "Portfolio," collectively as the "Portfolios"). The Fund applies investment company accounting and reporting guidance.
The accompanying financial statements relate to the US Core Portfolio. The Portfolio seeks long-term capital appreciation.
The Portfolio commenced operations on May 27, 2016, and offers four classes of shares — Class I, Class A, Class C and Class IS.
A. Significant Accounting Policies: The following significant accounting policies are in conformity with U.S. generally accepted accounting principles ("GAAP"). Such policies are consistently followed by the Fund in the preparation of its financial statements. GAAP may require management to make estimates and assumptions that affect the reported amounts and disclosures in the financial statements. Actual results may differ from those estimates.
1. Security Valuation: (1) An equity portfolio security listed or traded on an exchange is valued at its latest reported sales price (or at the exchange official closing price if such exchange reports an official closing price), and if there were no sales on a given day and if there is no official exchange closing price for that day, the security is valued at the mean between the last reported bid and asked prices if such bid and asked prices are available on the relevant exchanges; (2) all other equity portfolio securities for which over-the-counter ("OTC") market quotations are readily available are valued at the latest reported sales price (or at the market official closing price if such market reports an official closing price), and if there was no trading in the security on a given day and if there is no official closing price from relevant markets for that day, the security is valued at the mean between the last reported bid and asked prices if such bid and asked prices are available on the relevant markets. Listed equity securities not traded on the valuation date with no reported bid and asked prices available on the exchange are valued at the mean between the current bid and asked prices obtained from one or more reputable brokers or dealers. An unlisted equity security that does not trade on the valuation date and for which bid and asked prices from the relevant markets are
unavailable is valued at the mean between the current bid and asked prices obtained from one or more reputable brokers or dealers. In cases where a security is traded on more than one exchange, the security is valued on the exchange designated as the primary market; (3) certain portfolio securities may be valued by an outside pricing service/vendor approved by the Fund's Board of Directors (the "Directors"). The pricing service/vendor may employ a pricing model that takes into account, among other things, bids, yield spreads, and/or other market data and specific security characteristics. Alternatively, if a valuation is not available from an outside pricing service/vendor, and the security trades on an exchange, the security may be valued at its latest reported sale price (or at the exchange official closing price if such exchange reports an official closing price), prior to the time when assets are valued. If there are no sales on a given day and if there is no official exchange closing price for that day, the security is valued at the mean between the last reported bid and asked prices if such bid and asked prices are available in the relevant exchanges; (4) when market quotations are not readily available, including circumstances under which Morgan Stanley Investment Management Inc. (the "Adviser") determines that the closing price, last sale price or the mean between the last reported bid and asked prices are not reflective of a security's market value, portfolio securities are valued at their fair value as determined in good faith under procedures established by and under the general supervision of the Directors. Occasionally, developments affecting the closing prices of securities and other assets may occur between the times at which valuations of such securities are determined (that is, close of the foreign market on which the securities trade) and the close of business of the New York Stock Exchange ("NYSE"). If developments occur during such periods that are expected to materially affect the value of such securities, such valuations may be adjusted to reflect the estimated fair value of such securities as of the close of the NYSE, as determined in good faith by the Directors or by the Adviser using a pricing service and/or procedures approved by the Directors; and (5) investments in mutual funds, including the Morgan Stanley Institutional Liquidity Funds, are valued at the net asset value ("NAV") as of the close of each business day.
The Directors have responsibility for determining in good faith the fair value of the investments, and the Directors may appoint others, such as the Fund's Adviser
14
Morgan Stanley Institutional Fund, Inc.
Annual Report — December 31, 2016
Notes to Financial Statements (cont'd)
or a valuation committee, to assist the Directors in determining fair value and to make the actual calculations pursuant to the fair valuation methodologies previously approved by the Directors. Under procedures approved by the Directors, the Fund's Adviser has formed a Valuation Committee whose members are approved by the Directors. The Valuation Committee provides administration and oversight of the Fund's valuation policies and procedures, which are reviewed at least annually by the Directors. These procedures allow the Fund to utilize independent pricing services, quotations from securities and financial instrument dealers, and other market sources to determine fair value.
The Fund has procedures to determine the fair value of securities and other financial instruments for which market prices are not readily available. Under these procedures, the Valuation Committee convenes on a regular and ad hoc basis to review such securities and considers a number of factors, including valuation methodologies and significant unobservable valuation inputs, when arriving at fair value. The Valuation Committee may employ a market-based approach which may use related or comparable assets or liabilities, recent transactions, market multiples, book values, and other relevant information for the investment to determine the fair value of the investment. An income-based valuation approach may also be used in which the anticipated future cash flows of the investment are discounted to calculate fair value. Discounts may also be applied due to the nature or duration of any restrictions on the disposition of the investments. Due to the inherent uncertainty of valuations of such investments, the fair values may differ significantly from the values that would have been used had an active market existed. The Valuation Committee employs various methods for calibrating these valuation approaches including a regular review of valuation methodologies, key inputs and assumptions, transactional back-testing or disposition analysis, and reviews of any related market activity.
2. Fair Value Measurement: Financial Accounting Standards Board ("FASB") Accounting Standards CodificationTM ("ASC") 820, "Fair Value Measurement" ("ASC 820"), defines fair value as the value that the Fund would receive to sell an investment or pay to transfer a
liability in a timely transaction with an independent buyer in the principal market, or in the absence of a principal market, the most advantageous market for the investment or liability. ASC 820 establishes a three-tier hierarchy to distinguish between (1) inputs that reflect the assumptions market participants would use in valuing an asset or liability developed based on market data obtained from sources independent of the reporting entity (observable inputs) and (2) inputs that reflect the reporting entity's own assumptions about the assumptions market participants would use in valuing an asset or liability developed based on the best information available in the circumstances (unobservable inputs) and to establish classification of fair value measurements for disclosure purposes. Various inputs are used in determining the value of the Fund's investments. The inputs are summarized in the three broad levels listed below.
• Level 1 – unadjusted quoted prices in active markets for identical investments
• Level 2 – other significant observable inputs (including quoted prices for similar investments, interest rates, prepayment speeds, credit risk, etc.)
• Level 3 – significant unobservable inputs including the Fund's own assumptions in determining the fair value of investments. Factors considered in making this determination may include, but are not limited to, information obtained by contacting the issuer, analysts, or the appropriate stock exchange (for exchange-traded securities), analysis of the issuer's financial statements or other available documents and, if necessary, available information concerning other securities in similar circumstances
The inputs or methodology used for valuing securities are not necessarily an indication of the risk associated with investing in those securities and the determination of the significance of a particular input to the fair value measurement in its entirety requires judgment and considers factors specific to each security.
15
Morgan Stanley Institutional Fund, Inc.
Annual Report — December 31, 2016
Notes to Financial Statements (cont'd)
The following is a summary of the inputs used to value the Portfolio's investments as of December 31, 2016.
Investment Type | | Level 1
Unadjusted
quoted
prices
(000) | | Level 2
Other
significant
observable
inputs
(000) | | Level 3
Significant
unobservable
inputs
(000) | | Total
(000) | |
Assets: | |
Common Stocks | |
Aerospace & Defense | | $ | 416 | | | $ | — | | | $ | — | | | $ | 416 | | |
Air Freight & Logistics | | | 96 | | | | — | | | | — | | | | 96 | | |
Banks | | | 307 | | | | — | | | | — | | | | 307 | | |
Biotechnology | | | 244 | | | | — | | | | — | | | | 244 | | |
Capital Markets | | | 900 | | | | — | | | | — | | | | 900 | | |
Consumer Finance | | | 109 | | | | — | | | | — | | | | 109 | | |
Diversified
Telecommunication
Services | | | 570 | | | | — | | | | — | | | | 570 | | |
Electrical Equipment | | | 146 | | | | — | | | | — | | | | 146 | | |
Energy Equipment &
Services | | | 589 | | | | — | | | | — | | | | 589 | | |
Food & Staples Retailing | | | 288 | | | | — | | | | — | | | | 288 | | |
Health Care
Equipment &
Supplies | | | 494 | | | | — | | | | — | | | | 494 | | |
Health Care Providers &
Services | | | 42 | | | | — | | | | — | | | | 42 | | |
Hotels, Restaurants &
Leisure | | | 248 | | | | — | | | | — | | | | 248 | | |
Household Durables | | | 333 | | | | — | | | | — | | | | 333 | | |
Information Technology
Services | | | 169 | | | | — | | | | — | | | | 169 | | |
Insurance | | | 411 | | | | — | | | | — | | | | 411 | | |
Internet & Direct
Marketing Retail | | | 465 | | | | — | | | | — | | | | 465 | | |
Internet Software &
Services | | | 716 | | | | — | | | | — | | | | 716 | | |
Machinery | | | 406 | | | | — | | | | — | | | | 406 | | |
Media | | | 520 | | | | — | | | | — | | | | 520 | | |
Metals & Mining | | | 45 | | | | — | | | | — | | | | 45 | | |
Pharmaceuticals | | | 411 | | | | — | | | | — | | | | 411 | | |
Semiconductors &
Semiconductor
Equipment | | | 723 | | | | — | | | | — | | | | 723 | | |
Tech Hardware,
Storage & Peripherals | | | 471 | | | | — | | | | — | | | | 471 | | |
Total Common Stocks | | | 9,119 | | | | — | | | | — | | | | 9,119 | | |
Short-Term Investment | |
Investment Company | | | 581 | | | | — | | | | — | | | | 581 | | |
Total Assets | | $ | 9,700 | | | $ | — | | | $ | — | | | $ | 9,700 | | |
Transfers between investment levels may occur as the markets fluctuate and/or the availability of data used in an investment's valuation changes. The Portfolio recognizes transfers between the levels as of the end of the period.
3. Indemnifications: The Fund enters into contracts that contain a variety of indemnifications. The Fund's maximum exposure under these arrangements is unknown. However, the Fund has not had prior claims or losses
pursuant to these contracts and expects the risk of loss to be remote.
4. Dividends and Distributions to Shareholders: Dividend income and distributions to shareholders are recorded on the ex-dividend date. Dividends from net investment income, if any, are declared and paid annually. Net realized capital gains, if any, are distributed at least annually.
5. Security Transactions, Income and Expenses: Security transactions are accounted for on the trade date (date the order to buy or sell is executed). Realized gains and losses on the sale of investment securities are determined on the specific identified cost method. Dividend income and other distributions are recorded on the ex-dividend date (except for certain foreign dividends which may be recorded as soon as the Portfolio is informed of such dividends) net of applicable withholding taxes. Interest income is recognized on the accrual basis except where collection is in doubt. Discounts are accreted and premiums are amortized over the life of the respective securities. Most expenses of the Fund can be directly attributed to a particular Portfolio. Expenses which cannot be directly attributed are apportioned among the Portfolios based upon relative net assets or other appropriate methods. Income, expenses (other than class specific expenses — distribution and shareholder services, transfer agency and sub transfer agency fees) and realized and unrealized gains or losses are allocated to each class of shares based upon their relative net assets.
B. Advisory Fees: The Adviser, a wholly-owned subsidiary of Morgan Stanley, provides the Portfolio with advisory services under the terms of an Investment Advisory Agreement, paid quarterly, at the annual rate based on the daily net assets as follows:
First $750
million | | Next $750
million | | Over $1.5
billion | |
| | 0.60 | % | | | 0.55 | % | | | 0.50 | % | |
For the period ended December 31, 2016, the advisory fee rate (net of waivers/rebate) was equivalent to an annual effective rate of 0.00% of the Portfolio's average daily net assets.
The Adviser has agreed to reduce its advisory fee and/or reimburse the Portfolio so that total annual portfolio operating expenses, excluding certain investment related expenses, taxes, interest and other extraordinary expenses (including litigation), will not exceed 0.80% for Class I shares, 1.15% for Class A shares, 1.90% for Class C shares and 0.75% for Class IS
16
Morgan Stanley Institutional Fund, Inc.
Annual Report — December 31, 2016
Notes to Financial Statements (cont'd)
shares. The fee waivers and/or expense reimbursements will continue for at least one year from the date of the Portfolio's prospectus or until such time as the Directors act to discontinue all or a portion of such waivers and/or reimbursements when they deem such action is appropriate. For the period ended December 31, 2016, approximately $25,000 of advisory fees were waived and approximately $96,000 of other expenses were reimbursed by the Adviser pursuant to this arrangement.
C. Administration Fees: The Adviser also serves as Administrator to the Fund and provides administrative services pursuant to an Administration Agreement for an annual fee, accrued daily and paid monthly, of 0.08% of the Portfolio's average daily net assets.
Under a Sub-Administration Agreement between the Administrator and State Street Bank and Trust Company ("State Street"), State Street provides certain administrative services to the Fund. For such services, the Administrator pays State Street a portion of the fee the Administrator receives from the Portfolio.
D. Distribution and Shareholder Services Fees: Morgan Stanley Distribution, Inc. ("MSDI" or the "Distributor"), a wholly-owned subsidiary of the Adviser and an indirect subsidiary of Morgan Stanley, serves as the Fund's Distributor of Portfolio shares pursuant to a Distribution Agreement. The Fund has adopted a Shareholder Services Plan with respect to Class A shares pursuant to Rule 12b-1 under the Act. Under the Shareholder Services Plan, the Portfolio pays the Distributor a shareholder services fee, accrued daily and paid monthly, at an annual rate of 0.25% of the Portfolio's average daily net assets attributable to Class A shares.
The Fund has adopted a Distribution and Shareholder Services Plan with respect to Class C shares pursuant to Rule 12b-1 under the Act. Under the Distribution and Shareholder Services Plan, the Portfolio pays the Distributor a distribution fee, accrued daily and paid monthly, at an annual rate of 0.75% and a shareholder services fee, accrued daily and paid monthly, at an annual rate of 0.25% of the Portfolio's average daily net assets attributable to Class C shares.
The distribution and shareholder services fees are used to support the expenses associated with servicing and maintaining accounts. The Distributor may compensate other parties for providing shareholder support services to investors who purchase Class A and Class C shares.
E. Dividend Disbursing and Transfer Agent: The Fund's dividend disbursing and transfer agent is Boston Financial Data Services, Inc. ("BFDS"). Pursuant to a Transfer Agency Agreement, the Fund pays BFDS a fee based on the number of classes, accounts and transactions relating to the Portfolios of the Fund.
F. Custodian Fees: State Street (the "Custodian") serves as Custodian for the Fund in accordance with a Custodian Agreement. The Custodian holds cash, securities, and other assets of the Fund as required by the Act. Custody fees are payable monthly based on assets held in custody, investment purchases and sales activity and account maintenance fees, plus reimbursement for certain out-of-pocket expenses.
G. Security Transactions and Transactions with Affiliates: For the period ended December 31, 2016, purchases and sales of investment securities for the Portfolio, other than long-term U.S. Government securities and short-term investments, were approximately $10,808,000 and $1,959,000, respectively. There were no purchases and sales of long-term U.S. Government securities for the period ended December 31, 2016.
The Portfolio invests in the Institutional Class of the Morgan Stanley Institutional Liquidity Funds — Treasury Securities Portfolio (the "Liquidity Funds"), an open-end management investment company managed by the Adviser. Advisory fees paid by the Portfolio are reduced by an amount equal to its pro-rata share of the advisory and administration fees paid by the Portfolio due to its investment in the Liquidity Funds. For the period ended December 31, 2016, advisory fees paid were reduced by less than $500 relating to the Portfolio's investment in the Liquidity Funds.
A summary of the Portfolio's transactions in shares of the Liquidity Funds during the period ended December 31, 2016 is as follows:
Purchases
at Cost
(000) | | Sales
(000) | | Dividend
Income
(000) | | Value
December 31,
2016
(000) | |
| $ | 8,910 | | | $ | 8,329 | | | $ | — | @ | | $ | 581 | | |
@ Amount is less than $500.
The Portfolio is permitted to purchase and sell securities ("cross-trade") from and to other Morgan Stanley Funds as well as other funds and client accounts for which the Adviser or an affiliate of the Adviser serves as investment adviser, pursuant to procedures approved by the Directors in compliance with
17
Morgan Stanley Institutional Fund, Inc.
Annual Report — December 31, 2016
Notes to Financial Statements (cont'd)
Rule 17a-7 under the Act (the "Rule"). Each cross-trade is executed at the current market price in compliance with provisions of the Rule. For the period ended December 31, 2016, the Portfolio did not engage in any cross-trade transactions.
The Portfolio has an unfunded Deferred Compensation Plan (the "Compensation Plan"), which allows each independent Director to defer payment of all, or a portion, of the fees he or she receives for serving on the Board of Directors. Each eligible Director generally may elect to have the deferred amounts credited with a return equal to the total return on one or more of the Morgan Stanley funds that are offered as investment options under the Compensation Plan. Appreciation/depreciation and distributions received from these investments are recorded with an offsetting increase/decrease in the deferred compensation obligation and do not affect the NAV of the Portfolio.
H. Federal Income Taxes: It is the Portfolio's intention to continue to qualify as a regulated investment company and distribute all of its taxable and tax-exempt income. Accordingly, no provision for federal income taxes is required in the financial statements.
The Portfolio may be subject to taxes imposed by countries in which it invests. Such taxes are generally based on income and/or capital gains earned or repatriated. Taxes are accrued based on net investment income, net realized gains and net unrealized appreciation as such income and/or gains are earned. Taxes may also be based on transactions in foreign currency and are accrued based on the value of investments denominated in such currency.
FASB ASC 740-10, "Income Taxes — Overall", sets forth a minimum threshold for financial statement recognition of the benefit of a tax position taken or expected to be taken in a tax return. Management has concluded there are no significant uncertain tax positions that would require recognition in the financial statements. If applicable, the Portfolio recognizes interest accrued related to unrecognized tax benefits in "Interest Expense" and penalties in "Other Expenses" in the Statement of Operations. The Portfolio files tax returns with the U.S. Internal Revenue Service, New York and various states. The tax period ended December 31, 2016, remains subject to examination by taxing authorities.
The tax character of distributions paid may differ from the character of distributions shown in the Statement of Changes in Net Assets due to short-term capital gains being treated as
ordinary income for tax purposes. The tax character of distributions paid during fiscal year 2016 was as follows:
2016 Distributions Paid From: | |
Ordinary
Income
(000) | | Paid-in-
Capital
(000) | |
| $ | 78 | | | $ | 3 | | |
The amount and character of income and gains to be distributed are determined in accordance with income tax regulations which may differ from GAAP. These book/tax differences are either considered temporary or permanent in nature.
Temporary differences are primarily due to differing book and tax treatments for the timing of the recognition of gains (losses) on certain investment transactions and the timing of the deductibility of certain expenses.
Permanent differences, due to a distribution in excess of current earnings, resulted in the following reclassifications among the components of net assets at December 31, 2016:
Distributions
in Excess of
Net Investment
Income
(000) | | Accumulated
Net Realized
Loss
(000) | | Paid-in-
Capital
(000) | |
| $ | 3 | | | | — | | | $ | (3 | ) | |
At December 31, 2016, the Portfolio had no distributable earnings on a tax basis.
At December 31, 2016, the Portfolio had available for federal income tax purposes unused short term capital losses of approximately $52,000 that do not have an expiration date.
To the extent that capital loss carryforwards are used to offset any future capital gains realized during the carryover period as provided by U.S. federal income tax regulations, no capital gains tax liability will be incurred by the Portfolio for gains realized and not distributed. To the extent that capital gains are offset, such gains will not be distributed to the shareholders.
I. Other: At December 31, 2016, the Portfolio had record owners of 10% or greater. Investment activities of these shareholders could have a material impact on the Portfolio. The aggregate percentage of such owners was 41.5%.
J. Accounting Pronouncements: In December 2016, FASB issued Accounting Standards update 2016-19 — Technical Corrections and Improvements ("ASU 2016-19"), which is effective for interim periods for all entities beginning after December 15, 2016. ASU 2016-19 includes an amendment to
18
Morgan Stanley Institutional Fund, Inc.
Annual Report — December 31, 2016
Notes to Financial Statements (cont'd)
Topic 820, Fair Value Measurement, which clarifies the difference between a valuation approach and a valuation technique when applying the guidance in that Topic. That amendment also requires an entity to disclose when there has been a change in either or both a valuation approach and/or a valuation technique. The transition guidance for the amendment must be applied prospectively because it could potentially involve the use of hindsight that includes fair value measurements. Although still evaluating the potential impacts of ASU 2016-19 to the Portfolio, management expects that the impact of the Portfolio's adoption will be limited to additional financial statement disclosures.
In October 2016, the Securities and Exchange Commission ("SEC") issued a new rule, Investment Company Reporting Modernization, which, among other provisions, amends Regulation S-X to require standardized, enhanced disclosures, particularly related to derivatives, in investment company financial statements. Compliance with the guidance is effective for financial statements filed with the SEC on or after August 1, 2017; adoption will have no effect on the Portfolio's net assets or results of operations. Although still evaluating the potential impacts of the Investment Company Reporting Modernization to the Portfolio, management expects that the impact of the Portfolio's adoption will be limited to additional financial statement disclosures.
19
Morgan Stanley Institutional Fund, Inc.
Annual Report — December 31, 2016
Report of Independent Registered Public Accounting Firm
To the Shareholders and Board of Directors of
Morgan Stanley Institutional Fund, Inc. —
US Core Portfolio
We have audited the accompanying statement of assets and liabilities, including the portfolio of investments, of US Core Portfolio (one of the portfolios constituting Morgan Stanley Institutional Fund, Inc.) (the "Portfolio") as of December 31, 2016, and the related statements of operations and changes in net assets and the financial highlights for the period from May 27, 2016 (commencement of operations) to December 31, 2016. These financial statements and financial highlights are the responsibility of the Portfolio's management. Our responsibility is to express an opinion on these financial statements and financial highlights based on our audit.
We conducted our audit in accordance with the standards of the Public Company Accounting Oversight Board (United States). Those standards require that we plan and perform the audit to obtain reasonable assurance about whether the financial statements and financial highlights are free of material misstatement. We were not engaged to perform an audit of the Portfolio's internal control over financial reporting. Our audit included consideration of internal control over financial reporting as a basis for designing audit procedures that are appropriate in the circumstances, but not for the purpose of expressing an opinion on the effectiveness of the Portfolio's internal control over financial reporting. Accordingly, we express no such opinion. An audit also includes examining, on a test basis, evidence supporting the amounts and disclosures in the financial statements and financial highlights, assessing the accounting principles used and significant estimates made by management, and evaluating the overall financial statement presentation. Our procedures included confirmation of securities owned as of December 31, 2016, by correspondence with the custodian and others or by other appropriate auditing procedures where replies from others were not received. We believe that our audit provides a reasonable basis for our opinion.
In our opinion, the financial statements and financial highlights referred to above present fairly, in all material respects, the financial position of US Core Portfolio (one of the portfolios constituting Morgan Stanley Institutional Fund, Inc.) at December 31, 2016, the results of its operations, the changes in its net assets and the financial highlights for the period from May 27, 2016 (commencement of operations) to December 31, 2016, in conformity with U.S. generally accepted accounting principles.

Boston, Massachusetts
February 28, 2017
20
Morgan Stanley Institutional Fund, Inc.
Annual Report — December 31, 2016
Federal Tax Notice (unaudited)
For federal income tax purposes, the following information is furnished with respect to the distributions paid by the Portfolio during its taxable year ended December 31, 2016. For corporate shareholders 69.42% of the dividends qualified for the dividends received deduction.
For federal income tax purposes, the following information is furnished with respect to the Portfolio's earnings for its taxable year ended December 31, 2016. When distributed, certain earnings may be subject to a maximum tax rate of 15% as provided for by the Jobs and Growth Tax Relief Reconciliation Act of 2003. The Portfolio designated up to a maximum of approximately $72,000 as taxable at this lower rate.
In January, the Portfolio provides tax information to shareholders for the preceding calendar year.
21
Morgan Stanley Institutional Fund, Inc.
Annual Report — December 31, 2016
Privacy Notice (unaudited)
MORGAN STANLEY INVESTMENT MANAGEMENT INC.
AN IMPORTANT NOTICE CONCERNING OUR U.S. PRIVACY POLICY
We are required by federal law to provide you with a copy of our privacy policy annually. This policy applies to current and former individual investors in funds managed or sponsored by Morgan Stanley Investment Management Inc. ("MSIM") as well as current and former individual clients of MSIM. This policy is not applicable to partnerships, corporations, trusts or other non-individual clients or investors. Please note that we may amend this policy at any time, and will inform you of any changes as required by law.
WE RESPECT YOUR PRIVACY
We appreciate that you have provided us with your personal financial information. We strive to maintain the privacy of such information while we help you achieve your financial objectives. This Notice describes what non-public personal information we collect about you, why we collect it, when we may share it with others and how certain others may use it. It discusses the steps you may take to limit our sharing of certain information about you to affiliated companies in the Morgan Stanley family of companies ("other Morgan Stanley companies"). It also discloses how you may limit use of certain shared information for marketing purposes by other Morgan Stanley branded companies. Throughout this policy, we refer to the non-public information that personally identifies you or your accounts as "personal information."
1. WHAT PERSONAL INFORMATION DO WE COLLECT ABOUT YOU?
We obtain personal information from applications and other forms you submit to us, from your dealings with us, from consumer reporting agencies, from our Web sites and from third parties and other sources.
For example:
• We may collect information such as your name, address, e-mail address, telephone/fax numbers, assets, income and investment objectives through subscription documents, applications and other forms you submit to us.
• We may obtain information about account balances, your use of account(s) and the types of products and services you prefer to receive from us through your dealings and transactions with us and other sources.
• We may obtain information about your creditworthiness and credit history from consumer reporting agencies.
• We may collect background information from and through third-party vendors to verify representations you have made and to comply with various regulatory requirements.
• If you interact with us through our public and private Web sites, we may collect information that you provide directly through online communications (such as an e-mail address). We may also collect information about your Internet service provider, your domain name, your computer's operating system and Web browser, your use of our Web sites and your product and service preferences, through the use of "cookies." Please consult the Terms of Use of these sites for more details.
2. WHEN DO WE DISCLOSE PERSONAL INFORMATION WE COLLECT ABOUT YOU?
We may disclose personal information we collect about you to other Morgan Stanley companies and to non-affiliated third parties.
a. Information We Disclose to Other Morgan Stanley Companies.
We may disclose personal information to other Morgan Stanley companies for a variety of reasons, including to manage your account(s) effectively, to service and process your transactions, to let you know about products and services offered by us and other Morgan Stanley companies, to manage our business, and as otherwise required or permitted by law. Offers for products and services from other Morgan Stanley companies are developed under conditions designed to safeguard your personal information.
22
Morgan Stanley Institutional Fund, Inc.
Annual Report — December 31, 2016
Privacy Notice (unaudited) (cont'd)
b. Information We Disclose to Non-affiliated Third Parties.
We do not disclose personal information that we collect about you to non-affiliated third parties except to those who provide marketing services on our behalf, to financial institutions with whom we have joint marketing agreements, and as otherwise required or permitted by law. For example, we may disclose personal information to nonaffiliated third parties for servicing and processing transactions, to offer our own products and services, to protect against fraud, for institutional risk control, to respond to judicial process or to perform services on our behalf. When we share personal information with a non-affiliated third party, they are required to limit their use of personal information to the particular purpose for which it was shared and they are not allowed to share personal information with others except to fulfill that limited purpose or as may be permitted or required by law.
3. HOW DO WE PROTECT THE SECURITY AND CONFIDENTIALITY OF PERSONAL INFORMATION WE COLLECT ABOUT YOU?
We maintain physical, electronic and procedural security measures to help safeguard the personal information we collect about you. We have internal policies governing the proper handling of client information. Third parties that provide support or marketing services on our behalf may also receive personal information, and we require them to adhere to confidentiality standards with respect to such information.
4. HOW CAN YOU LIMIT THE SHARING OF CERTAIN TYPES OF PERSONAL INFORMATION WITH OTHER MORGAN STANLEY COMPANIES?
We offer you choices as to whether we share with other Morgan Stanley companies the personal information that was collected to determine your eligibility for products and services you request ("eligibility information"). Eligibility information does not include your identification information or personal information pertaining to our transactions or experiences with you. Please note that, even if you direct us not to share eligibility information with other Morgan Stanley companies ("opt-out"), we may still share personal information, including eligibility information, with those companies in circumstances excluded from the opt-out under applicable law, such as to process transactions or to service your account.
5. HOW CAN YOU LIMIT THE USE OF CERTAIN TYPES OF PERSONAL INFORMATION BY OTHER MORGAN STANLEY COMPANIES FOR MARKETING?
By following the opt-out instructions in Section 6 below, you may limit other Morgan Stanley branded companies from marketing their products or services to you based on personal information we disclose to them. This information may include, for example, your income and account history with us. Please note that, even if you choose to limit Other Morgan Stanley Companies from using personal information about you that we may share with them for marketing their products and services to you, Other Morgan Stanley Companies may use your personal information that they obtain from us to market to you in circumstances permitted by law, such as if the Other Morgan Stanley Company has its own relationship with you.
6. HOW CAN YOU SEND US AN OPT-OUT INSTRUCTION?
If you wish to limit our sharing of eligibility information about you with other Morgan Stanley companies or other Morgan Stanley companies' use of personal information for marketing purposes, as described in this notice, you may do so by:
• Calling us at (800) 548-7786
Monday–Friday between 8a.m. and 6p.m.(EST)
• Writing to us at the following address:
Boston Financial Data Services, Inc.
c/o Privacy Coordinator
P.O. Box 219804
Kansas City, Missouri 64121
23
Morgan Stanley Institutional Fund, Inc.
Annual Report — December 31, 2016
Privacy Notice (unaudited) (cont'd)
Your written request should include your name, address, telephone number and account number(s) to which the opt-out applies and whether you are opting out with respect to sharing of eligibility information (Section 4 above), or if information used for Marketing (Section 5 above) or both. Written opt-out requests should not be sent with any other correspondence. In order to process your request, we require that the request be provided by you directly and not through a third party.
Your opt-out preference will remain in effect with respect to this policy (as it may be amended) until you notify us otherwise. If you have a joint account, your direction for us not to share this information with other Morgan Stanley companies and for those other Morgan Stanley companies not to use your personal information for marketing will be applied to all account holders on that account. Please understand that if you limit our sharing or our affiliated companies' use of personal information, you and any joint account holder(s) may not receive information about Morgan Stanley products and services, including products or services that could help you manage your financial resources and achieve your investment objectives.
7. WHAT IF AN AFFILIATED COMPANY BECOMES A NON-AFFILIATED THIRD PARTY?
If, at any time in the future, an affiliated company becomes a non-affiliated third party, further disclosures of personal information made to the former affiliated company will be limited to those described in Section 2(b) above relating to non-affiliated third parties. If you elected under Section 6 to limit disclosures we make to affiliated companies, or use of personal information by affiliated companies, your election will not apply to use by any former affiliated company of your personal information in their possession once it becomes a non-affiliated third party.
SPECIAL NOTICE TO RESIDENTS OF VERMONT
The following section supplements our policy with respect to our individual clients who have a Vermont address and supersedes anything to the contrary in the above policy with respect to those clients only.
The state of Vermont requires financial institutions to obtain your consent prior to sharing personal information that they collect about you with affiliated companies and non-affiliated third parties other than in certain limited circumstances. Except as permitted by law, we will not share personal information we collect about you with non-affiliated third parties or other Morgan Stanley companies unless you provide us with your written consent to share such information ("opt-in").
If you wish to receive offers for investment products and services offered by or through other Morgan Stanley companies, please notify us in writing at the following address:
Boston Financial Data Services, Inc.
c/o Privacy Coordinator
P.O. Box 219804
Kansas City, Missouri 64121
Your authorization should include your name, address, telephone number and account number(s) to which the opt-in applies and should not be sent with any other correspondence. In order to process your authorization, we require that the authorization be provided by you directly and not through a third party.
SPECIAL NOTICE TO RESIDENTS OF CALIFORNIA
The following section supplements our policy with respect to our individual clients who have a California address and supersedes anything to the contrary in the above policy with respect to those clients only.
In response to a California law, if your account has a California home address, your personal information will not be disclosed to nonaffiliated third parties except as permitted by applicable California law, and we will limit sharing such information with our affiliates to comply with California privacy laws that apply to us.
24
Morgan Stanley Institutional Fund, Inc.
Annual Report — December 31, 2016
Director and Officer Information (unaudited)
Independent Directors:
Name, Age and Address of
Independent Director | | Position(s)
Held with
Registrant | | Length of Time
Served* | | Principal Occupation(s) During Past 5 Years
and Other Relevant Professional Experience | | Number of
Portfolios in
Fund Complex
Overseen by
Independent
Director** | | Other Directorships
Held by Independent
Director*** | |
Frank L. Bowman (72)
c/o Perkins Coie LLP
Counsel to the Independent
Directors
30 Rockefeller Plaza
New York, NY 10112 | | Director | | Since
August
2006 | | President, Strategic Decisions, LLC (consulting) (since February 2009); Director or Trustee of various Morgan Stanley Funds (since August 2006); Chairperson of the Compliance and Insurance Committee (since October 2015); formerly, Chairperson of the Insurance Sub-Committee of the Compliance and Insurance Committee (2007-2015); served as President and Chief Executive Officer of the Nuclear Energy Institute (policy organization) (February 2005-November 2008); retired as Admiral, U.S. Navy after serving over 38 years on active duty including 8 years as Director of the Naval Nuclear Propulsion Program in the Department of the Navy and the U.S. Department of Energy (1996-2004); served as Chief of Naval Personnel (July 1994-September 1996) and on the Joint Staff as Director of Political Military Affairs (June 1992-July 1994); knighted as Honorary Knight Commander of the Most Excellent Order of the British Empire; awarded the Officier de l'Orde National du Mérite by the French Government; elected to the National Academy of Engineering (2009). | | | 90 | | | Director of BP p.l.c.; Director of Naval and Nuclear Technologies LLP; Director Emeritus of the Armed Services YMCA; Director of the U.S. Naval Submarine League; Member of the National Security Advisory Council of the Center for U.S. Global Engagement and a member of the CNA Military Advisory Board; Chairman of the charity J Street Cup Golf; Trustee of Fairhaven United Methodist Church; and Director of other various non-profit organizations. | |
Kathleen A. Dennis (63)
c/o Perkins Coie LLP
Counsel to the Independent Directors
30 Rockefeller Plaza
New York, NY 10112 | | Director | | Since
August
2006 | | President, Cedarwood Associates (mutual fund and investment management consulting) (since July 2006); Chairperson of the Liquidity and Alternatives Sub-Committee of the Investment Committee (since October 2006) and Director or Trustee of various Morgan Stanley Funds (since August 2006); formerly, Senior Managing Director of Victory Capital Management (1993-2006). | | | 91 | | | Director of various non-profit organizations. | |
Nancy C. Everett (61)
c/o Perkins Coie LLP
Counsel to the Independent Directors
30 Rockefeller Plaza
New York, NY 10112 | | Director | | Since
January
2015 | | Chief Executive Officer, Virginia Commonwealth University Investment Company (since November 2015); Owner, OBIR, LLC (institutional investment management consulting) (since June 2014); formerly, Managing Director, BlackRock Inc. (February 2011-December 2013); and Chief Executive Officer, General Motors Asset Management (a/k/a Promark Global Advisors, Inc.) (June 2005-May 2010). | | | 91 | | | Member of Virginia Commonwealth University School of Business Foundation; formerly, Member of Virginia Commonwealth University Board of Visitors (2013-2015); Member of Committee on Directors for Emerging Markets Growth Fund, Inc. (2007-2010); Chairperson of Performance Equity Management, LLC (2006-2010); and Chairperson, GMAM Absolute Return Strategies Fund, LLC (2006-2010). | |
25
Morgan Stanley Institutional Fund, Inc.
Annual Report — December 31, 2016
Director and Officer Information (unaudited) (cont'd)
Independent Directors: (cont'd)
Name, Age and Address of
Independent Director | | Position(s)
Held with
Registrant | | Length of Time
Served* | | Principal Occupation(s) During Past 5 Years
and Other Relevant Professional Experience | | Number of
Portfolios in
Fund Complex
Overseen by
Independent
Director** | | Other Directorships
Held by Independent
Director*** | |
Jakki L. Haussler (59)
c/o Perkins Coie LLP
Counsel to the Independent Directors
30 Rockefeller Plaza
New York, NY 10112 | | Director | | Since
January
2015 | | Chairman and Chief Executive Officer, Opus Capital Group (since January 1996); formerly, Director, Capvest Venture Fund, LP (May 2000-December 2011); Partner, Adena Ventures, LP (July 1999-December 2010); Director, The Victory Funds (February 2005-July 2008). | | | 91 | | | Director of Cincinnati Bell Inc. and Member, Audit Committee and Compensation Committee; Director of Northern Kentucky University Foundation and Member, Investment Committee; Member of Chase College of Law Transactional Law Practice Center Board of Advisors; Director of Best Transport; Director of Chase College of Law Board of Visitors; formerly, Member, University of Cincinnati Foundation Investment Committee; Member, Miami University Board of Visitors (2008-2011); Trustee of Victory Funds (2005-2008) and Chairman, Investment Committee (2007-2008) and Member, Service Provider Committee (2005-2008). | |
Dr. Manuel H. Johnson (67)
c/o Johnson Smick
International, Inc.
220 I Street, N.E. — Suite 200
Washington, D.C. 20002 | | Director | | Since
July
1991 | | Senior Partner, Johnson Smick International, Inc. (consulting firm); Chairperson of the Investment Committee (since October 2006) and Director or Trustee of various Morgan Stanley Funds (since July 1991); Co-Chairman and a founder of the Group of Seven Council (G7C) (international economic commission); formerly, Chairperson of the Audit Committee (July 1991-September 2006), Vice Chairman of the Board of Governors of the Federal Reserve System and Assistant Secretary of the U.S. Treasury. | | | 91 | | | Director of NVR, Inc. (home construction). | |
Joseph J. Kearns (74)
c/o Kearns & Associates LLC
46 E Peninsula Center #385
Rolling Hills Estates, CA 90274-3712 | | Director | | Since
August
1994 | | President, Kearns & Associates LLC (investment consulting); Chairperson of the Audit Committee (since October 2006) and Director or Trustee of various Morgan Stanley Funds (since August 1994); formerly, Deputy Chairperson of the Audit Committee (July 2003-September 2006) and Chairperson of the Audit Committee of various Morgan Stanley Funds (since August 1994); CFO of the J. Paul Getty Trust. | | | 93 | | | Director of Electro Rent Corporation (equipment leasing). Prior to December 31, 2013, Director of The Ford Family Foundation. | |
26
Morgan Stanley Institutional Fund, Inc.
Annual Report — December 31, 2016
Director and Officer Information (unaudited) (cont'd)
Independent Directors: (cont'd)
Name, Age and Address of
Independent Director | | Position(s)
Held with
Registrant | | Length of Time
Served* | | Principal Occupation(s) During Past 5 Years
and Other Relevant Professional Experience | | Number of
Portfolios in
Fund Complex
Overseen by
Independent
Director** | | Other Directorships
Held by Independent
Director*** | |
Michael F. Klein (58)
c/o Perkins Coie LLP
Counsel to the Independent Directors
30 Rockefeller Plaza
New York, NY 10112 | | Director | | Since
August
2006 | | Managing Director, Aetos Capital, LLC (since March 2000); Co-President, Aetos Alternatives Management, LLC (since January 2004) and Co-Chief Executive Officer of Aetos Capital LLC (since August 2013); Chairperson of the Fixed Income Sub-Committee of the Investment Committee (since October 2006) and Director or Trustee of various Morgan Stanley Funds (since August 2006); formerly, Managing Director, Morgan Stanley & Co. Inc. and Morgan Stanley Dean Witter Investment Management, President, various Morgan Stanley Funds (June 1998-March 2000) and Principal, Morgan Stanley & Co. Inc. and Morgan Stanley Dean Witter Investment Management (August 1997-December 1999). | | | 90 | | | Director of certain investment funds managed or sponsored by Aetos Capital, LLC; Director of Sanitized AG and Sanitized Marketing AG (specialty chemicals). | |
Patricia Maleski (56)
c/o Perkins Coie LLP
Counsel to the Independent Directors
30 Rockefeller Plaza
New York, NY 10112 | | Director | | Since
January
2017 | | Management Director, JPMorgan Asset Management (2013-2016); President, JPMorgan Funds (2010-2013), Chief Administrative Officer, JPMorgan Funds (2004-2010), Treasurer, JPMorgan Funds (2003-2004, 2008-2010), and Vice President and Board Liaison, JPMorgan Funds (2001-2004); Managing Director, J.P. Morgan Investment Management Inc. (2001-2013); Vice President of Finance, Pierpont Group (1996-2001); Vice President, Bank of New York (1995-1996); Senior Audit Manager, Price Waterhouse, LLP (1982-1995). | | | 91 | | | None. | |
Michael E. Nugent (80)
522 Fifth Avenue
New York, NY 10036 | | Chair of the Board and Director | | Chair of the Boards since July 2006 and Director since July 1991 | | Chair of the Boards of various Morgan Stanley Funds (since July 2006); Chairperson of the Closed-End Fund Committee (since June 2012) and Director or Trustee of various Morgan Stanley Funds (since July 1991); formerly, Chairperson of the Insurance Committee (until July 2006); General Partner, Triumph Capital, L.P. (private investment partnership) (1988-2013). | | | 92 | | | None. | |
W. Allen Reed (69)
c/o Perkins Coie LLP
Counsel to the Independent Directors
30 Rockefeller Plaza
New York, NY 10112 | | Director | | Since
August
2006 | | Chairperson of the Equity Sub-Committee of the Investment Committee (since October 2006) and Director or Trustee of various Morgan Stanley Funds (since August 2006); formerly, President and CEO of General Motors Asset Management; Chairman and Chief Executive Officer of the GM Trust Bank and Corporate Vice President of General Motors Corporation (August 1994-December 2005). | | | 91 | | | Director of Legg Mason, Inc.; formerly, Director of the Auburn University Foundation (2010-2015). | |
Fergus Reid (84)
c/o Joe Pietryka, Inc.
85 Charles Colman Blvd.
Pawling, NY 12564 | | Director | | Since
June
1992 | | Chairman, Joe Pietryka, Inc.; Chairperson of the Governance Committee and Director or Trustee of various Morgan Stanley Funds (since June 1992). | | | 92 | | | Formerly, Trustee and Director of certain investment companies in the JP Morgan Fund Complex managed by JP Morgan Investment Management Inc. (1987-2012). | |
* This is the earliest date the Director began serving the Morgan Stanley Funds. Each Director serves an indefinite term, until his or her successor is elected.
** The Fund Complex includes (as of December 31, 2016) all open-end and closed-end funds (including all of their portfolios) advised by Morgan Stanley Investment Management Inc. (the "Adviser") and any funds that have an adviser that is an affiliated person of the Adviser (including, but not limited to, Morgan Stanley AIP GP LP).
*** This includes any directorships at public companies and registered investment companies held by the Director at any time during the past five years.
27
Morgan Stanley Institutional Fund, Inc.
Annual Report — December 31, 2016
Director and Officer Information (unaudited) (cont'd)
Executive Officers:
Name, Age and Address of Executive Officer | | Position(s) Held
with
Registrant | | Length of Time
Served* | | Principal Occupation(s) During Past 5 Years | |
John H. Gernon (53)
522 Fifth Avenue
New York, NY 10036 | | President and Principal Executive Officer | | Since
September
2013 | | President and Principal Executive Officer of the Equity and Fixed Income Funds and the Morgan Stanley AIP Funds (since September 2013) and the Liquidity Funds and various money market funds (since May 2014) in the Fund Complex; Managing Director of the Adviser; Head of Product (since 2006). | |
Timothy J. Knierim (58)
522 Fifth Avenue
New York, NY 10036 | | Chief Compliance Officer | | Since
December
2016 | | Managing Director of the Adviser and various entities affiliated with the Adviser; Chief Compliance Officer of various Morgan Stanley Funds and the Adviser (since December 2016) and Chief Compliance Officer of Morgan Stanley AIP GP LP (since 2014). Formerly, Managing Director and Deputy Chief Compliance Officer of the Adviser (2014-2016); and formerly, Chief Compliance Officer of Prudential Investment Management, Inc. (2007-2014). | |
Francis J. Smith (51)
522 Fifth Avenue
New York, NY 10036 | | Treasurer and Principal Financial Officer | | Treasurer since July 2003 and Principal Financial Officer since September 2002 | | Managing Director of the Adviser and various entities affiliated with the Adviser; Treasurer (since July 2003) and Principal Financial Officer of various Morgan Stanley Funds (since September 2002). | |
Mary E. Mullin (49)
522 Fifth Avenue
New York, NY 10036 | | Secretary | | Since
June
1999 | | Executive Director of the Adviser; Secretary of various Morgan Stanley Funds (since June 1999). | |
* This is the earliest date the officer began serving the Morgan Stanley Funds. Each officer serves a one-year term, until his or her successor is elected and qualifies.
28
Morgan Stanley Institutional Fund, Inc.
Annual Report — December 31, 2016
Adviser and Administrator
Morgan Stanley Investment Management Inc.
522 Fifth Avenue
New York, New York 10036
Distributor
Morgan Stanley Distribution, Inc.
522 Fifth Avenue
New York, New York 10036
Dividend Disbursing and Transfer Agent
Boston Financial Data Services, Inc.
2000 Crown Colony Drive
Quincy, Massachusetts 02169
Custodian
State Street Bank and Trust Company
One Lincoln Street
Boston, Massachusetts 02111
Legal Counsel
Dechert LLP
1095 Avenue of the Americas
New York, New York 10036
Counsel to the Independent Directors
Perkins Coie LLP
30 Rockefeller Plaza
New York, New York 10112
Independent Registered Public Accounting Firm
Ernst & Young LLP
200 Clarendon Street
Boston, Massachusetts 02116
Reporting to Shareholders
Each Morgan Stanley fund provides a complete schedule of portfolio holdings in its semi-annual and annual reports within 60 days of the end of the fund's second and fourth fiscal quarters. The semi-annual and annual reports are filed electronically with the Securities and Exchange Commission (SEC) on Form N-CSRS and Form N-CSR, respectively. Morgan Stanley also delivers the semi-annual and annual reports to fund shareholders and makes these reports available on its public website, www.morganstanley.com/im. Each Morgan Stanley fund also files a complete schedule of portfolio holdings with the SEC for the fund's first and third fiscal quarters on Form N-Q. Morgan Stanley does not deliver the reports for the first and third fiscal quarters to shareholders, nor are the reports posted to the Morgan Stanley public website. You may, however, obtain the Form N-Q filings (as well as the Form N-CSR and N-CSRS filings) by accessing the SEC's website, www.sec.gov. You may also review and copy them at the SEC's Public Reference Room in Washington, DC. Information on the operation of the SEC's Public Reference Room may be obtained by calling the SEC toll free at 1 (800) SEC-0330. You can also request copies of these materials, upon payment of a duplicating fee, by electronic request at the SEC's email address (publicinfo@sec.gov) or by writing the Public Reference Room of the SEC, 100 F Street, NE, Washington, DC 20549-0102.
Proxy Voting Policies and Procedures and Proxy Voting Record
You may obtain a copy of the Fund's Proxy Voting Policy and Procedures and information regarding how the Fund voted proxies relating to portfolio securities during the most recent twelve-month period ended June 30, without charge, upon request, by calling toll free 1 (800) 548-7786 or by visiting our website at www.morganstanley.com/im. This information is also available on the SEC's website at www.sec.gov.
This report is authorized for distribution only when preceded or accompanied by a prospectus or summary prospectus of the applicable Portfolio of Morgan Stanley Institutional Fund, Inc., which describes in detail the Portfolio's investment policies, risks, fees and expenses. Please read the prospectus carefully before you invest or send money. For additional information, including information regarding the investments comprising the Portfolio, please visit our website at www.morganstanley.com/im or call toll free 1 (800) 548-7786.
29
Printed in U.S.A.
This Report has been prepared for shareholders and may be distributed to others only if preceded or accompanied by a current prospectus.
Morgan Stanley Investment Management Inc.
522 Fifth Avenue
New York, New York 10036
© 2017 Morgan Stanley. Morgan Stanley Distribution, Inc.

IFIUSCPANN
1698603 EXP. 02.28.18
Item 2. Code of Ethics.
(a) The Fund has adopted a code of ethics (the “Code of Ethics”) that applies to its principal executive officer, principal financial officer, principal accounting officer or controller, or persons performing similar functions, regardless of whether these individuals are employed by the Fund or a third party.
(b) No information need be disclosed pursuant to this paragraph.
(c) Not applicable.
(d) Not applicable.
(e) Not applicable.
(f)
(1) The Fund’s Code of Ethics is attached hereto as Exhibit 12 A.
(2) Not applicable.
(3) Not applicable.
Item 3. Audit Committee Financial Expert.
The Fund’s Board of Directors has determined that Joseph J. Kearns, an “independent” Director, is an “audit committee financial expert” serving on its audit committee. Under applicable securities laws, a person who is determined to be an audit committee financial expert will not be deemed an “expert” for any purpose, including without limitation for the purposes of Section 11 of the Securities Act of 1933, as a result of being designated or identified as an audit committee financial expert. The designation or identification of a person as an audit committee financial expert does not impose on such person any duties, obligations, or liabilities that are greater than the duties, obligations, and liabilities imposed on such person as a member of the audit committee and Board of Directors in the absence of such designation or identification.
Item 4. Principal Accountant Fees and Services.
(a)(b)(c)(d) and (g). Based on fees billed for the periods shown:
2016
| | Registrant | | Covered Entities(1) | |
Audit Fees | | $ | 1,169,439 | | N/A | |
| | | | | |
Non-Audit Fees | | | | | |
Audit-Related Fees | | $ | — | (2) | $ | — | (2) |
Tax Fees | | $ | 124,000 | (3) | $ | 8,817,179 | (4) |
All Other Fees | | $ | — | | $ | 227,300 | (5) |
Total Non-Audit Fees | | $ | 124,000 | | $ | 9,044,479 | |
| | | | | |
Total | | $ | 1,293,439 | | $ | 9,044,479 | |
2015
| | Registrant | | Covered Entities(1) | |
Audit Fees | | $ | 1,046,857 | | N/A | |
| | | | | |
Non-Audit Fees | | | | | |
Audit-Related Fees | | $ | — | (2) | $ | — | (2) |
Tax Fees | | $ | 108,000 | (3) | $ | 8,237,026 | (4) |
All Other Fees | | $ | — | | $ | 212,000 | (5) |
Total Non-Audit Fees | | $ | 108,000 | | $ | 8,449,026 | |
| | | | | |
Total | | $ | 1,154,857 | | $ | 8,449,026 | |
N/A- Not applicable, as not required by Item 4.
(1) Covered Entities include the Adviser (excluding sub-advisors) and any entity controlling, controlled by or under common control with the Adviser that provides ongoing services to the Registrant.
(2) Audit-Related Fees represent assurance and related services provided that are reasonably related to the performance of the audit of the financial statements of the Covered Entities’ and funds advised by the Adviser or its affiliates, specifically data verification and agreed-upon procedures related to asset securitizations and agreed-upon procedures engagements.
(3) Tax Fees represent tax compliance, tax planning and tax advice services provided in connection with the preparation and review of the Registrant’s tax returns.
(4) Tax Fees represent tax compliance, tax planning and tax advice services provided in connection with the review of Covered Entities’ tax returns.
(5) All other fees represent project management for future business applications and improving business and operational processes.
(e)(1) The audit committee’s pre-approval policies and procedures are as follows:
APPENDIX A
AUDIT COMMITTEE
AUDIT AND NON-AUDIT SERVICES
PRE-APPROVAL POLICY AND PROCEDURES
OF THE
MORGAN STANLEY RETAIL AND INSTITUTIONAL FUNDS
AS ADOPTED AND AMENDED JULY 23, 2004,(1)
1. Statement of Principles
The Audit Committee of the Board is required to review and, in its sole discretion, pre-approve all Covered Services to be provided by the Independent Auditors to the Fund and Covered Entities in order to assure that services performed by the Independent Auditors do not impair the auditor’s independence from the Fund.
The SEC has issued rules specifying the types of services that an independent auditor may not provide to its audit client, as well as the audit committee’s administration of the engagement of the independent auditor. The SEC’s rules establish two different approaches to pre-approving services, which the SEC considers to be equally valid. Proposed services either: may be pre-approved without consideration of specific case-by-case services by the Audit Committee (“general pre-approval”); or require the specific pre-approval of the Audit Committee or its delegate (“specific pre-approval”). The Audit Committee believes that the combination of these two approaches in this Policy will result in an effective and efficient procedure to pre-approve services performed by the Independent Auditors. As set forth in this Policy, unless a type of service has received general pre-approval, it will require specific pre-approval by the Audit Committee (or by any member of the Audit Committee to which pre-approval authority has been delegated) if it is to be provided by the Independent Auditors. Any proposed services exceeding pre-approved cost levels or budgeted amounts will also require specific pre-approval by the Audit Committee.
The appendices to this Policy describe the Audit, Audit-related, Tax and All Other services that have the general pre-approval of the Audit Committee. The term of any general pre-approval is 12 months from the date of pre-approval, unless the Audit Committee considers and provides a different period and states otherwise. The Audit Committee will annually review and pre-approve the services that may be provided by the Independent Auditors without obtaining specific pre-approval from the Audit Committee. The Audit Committee will add to or subtract from the list of general pre-approved services from time to time, based on subsequent determinations.
(1) This Audit Committee Audit and Non-Audit Services Pre-Approval Policy and Procedures (the “Policy”), adopted as of the date above, supersedes and replaces all prior versions that may have been adopted from time to time.
The purpose of this Policy is to set forth the policy and procedures by which the Audit Committee intends to fulfill its responsibilities. It does not delegate the Audit Committee’s responsibilities to pre-approve services performed by the Independent Auditors to management.
The Fund’s Independent Auditors have reviewed this Policy and believes that implementation of the Policy will not adversely affect the Independent Auditors’ independence.
2. Delegation
As provided in the Act and the SEC’s rules, the Audit Committee may delegate either type of pre-approval authority to one or more of its members. The member to whom such authority is delegated must report, for informational purposes only, any pre-approval decisions to the Audit Committee at its next scheduled meeting.
3. Audit Services
The annual Audit services engagement terms and fees are subject to the specific pre-approval of the Audit Committee. Audit services include the annual financial statement audit and other procedures required to be performed by the Independent Auditors to be able to form an opinion on the Fund’s financial statements. These other procedures include information systems and procedural reviews and testing performed in order to understand and place reliance on the systems of internal control, and consultations relating to the audit. The Audit Committee will approve, if necessary, any changes in terms, conditions and fees resulting from changes in audit scope, Fund structure or other items.
In addition to the annual Audit services engagement approved by the Audit Committee, the Audit Committee may grant general pre-approval to other Audit services, which are those services that only the Independent Auditors reasonably can provide. Other Audit services may include statutory audits and services associated with SEC registration statements (on Forms N-1A, N-2, N-3, N-4, etc.), periodic reports and other documents filed with the SEC or other documents issued in connection with securities offerings.
The Audit Committee has pre-approved the Audit services in Appendix B.1. All other Audit services not listed in Appendix B.1 must be specifically pre-approved by the Audit Committee (or by any member of the Audit Committee to which pre-approval has been delegated).
4. Audit-related Services
Audit-related services are assurance and related services that are reasonably related to the performance of the audit or review of the Fund’s financial statements and, to the extent they are Covered Services, the Covered Entities or that are traditionally performed by the Independent Auditors. Because the Audit Committee believes that the provision of Audit-related services does not impair the independence of the auditor and is consistent with the SEC’s rules on auditor independence, the Audit Committee may grant general pre-approval to Audit-related services. Audit-related services include, among others, accounting consultations related to accounting, financial reporting or disclosure matters not classified as “Audit services”; assistance with understanding and implementing new accounting and financial reporting guidance from rulemaking authorities; agreed-upon or expanded audit procedures related to accounting and/or billing records required to respond to or comply with financial, accounting or regulatory
reporting matters; and assistance with internal control reporting requirements under Forms N-SAR and/or N-CSR.
The Audit Committee has pre-approved the Audit-related services in Appendix B.2. All other Audit-related services not listed in Appendix B.2 must be specifically pre-approved by the Audit Committee (or by any member of the Audit Committee to which pre-approval has been delegated).
5. Tax Services
The Audit Committee believes that the Independent Auditors can provide Tax services to the Fund and, to the extent they are Covered Services, the Covered Entities, such as tax compliance, tax planning and tax advice without impairing the auditor’s independence, and the SEC has stated that the Independent Auditors may provide such services.
Pursuant to the preceding paragraph, the Audit Committee has pre-approved the Tax Services in Appendix B.3. All Tax services in Appendix B.3 must be specifically pre-approved by the Audit Committee (or by any member of the Audit Committee to which pre-approval has been delegated).
6. All Other Services
The Audit Committee believes, based on the SEC’s rules prohibiting the Independent Auditors from providing specific non-audit services, that other types of non-audit services are permitted. Accordingly, the Audit Committee believes it may grant general pre-approval to those permissible non-audit services classified as All Other services that it believes are routine and recurring services, would not impair the independence of the auditor and are consistent with the SEC’s rules on auditor independence.
The Audit Committee has pre-approved the All Other services in Appendix B.4. Permissible All Other services not listed in Appendix B.4 must be specifically pre-approved by the Audit Committee (or by any member of the Audit Committee to which pre-approval has been delegated).
7. Pre-Approval Fee Levels or Budgeted Amounts
Pre-approval fee levels or budgeted amounts for all services to be provided by the Independent Auditors will be established annually by the Audit Committee. Any proposed services exceeding these levels or amounts will require specific pre-approval by the Audit Committee. The Audit Committee is mindful of the overall relationship of fees for audit and non-audit services in determining whether to pre-approve any such services.
8. Procedures
All requests or applications for services to be provided by the Independent Auditors that do not require specific approval by the Audit Committee will be submitted to the Fund’s Chief Financial Officer and must include a detailed description of the services to be rendered. The Fund’s Chief Financial Officer will determine whether such services are included within the list of services that have received the general pre-approval of the Audit Committee. The Audit Committee will be informed on a timely basis of any such services rendered by the Independent Auditors. Requests or applications to provide services that require specific approval by the
Audit Committee will be submitted to the Audit Committee by both the Independent Auditors and the Fund’s Chief Financial Officer, and must include a joint statement as to whether, in their view, the request or application is consistent with the SEC’s rules on auditor independence.
The Audit Committee has designated the Fund’s Chief Financial Officer to monitor the performance of all services provided by the Independent Auditors and to determine whether such services are in compliance with this Policy. The Fund’s Chief Financial Officer will report to the Audit Committee on a periodic basis on the results of its monitoring. Both the Fund’s Chief Financial Officer and management will immediately report to the chairman of the Audit Committee any breach of this Policy that comes to the attention of the Fund’s Chief Financial Officer or any member of management.
9. Additional Requirements
The Audit Committee has determined to take additional measures on an annual basis to meet its responsibility to oversee the work of the Independent Auditors and to assure the auditor’s independence from the Fund, such as reviewing a formal written statement from the Independent Auditors delineating all relationships between the Independent Auditors and the Fund, consistent with Independence Standards Board No. 1, and discussing with the Independent Auditors its methods and procedures for ensuring independence.
10. Covered Entities
Covered Entities include the Fund’s investment adviser(s) and any entity controlling, controlled by or under common control with the Fund’s investment adviser(s) that provides ongoing services to the Fund(s). Beginning with non-audit service contracts entered into on or after May 6, 2003, the Fund’s audit committee must pre-approve non-audit services provided not only to the Fund but also to the Covered Entities if the engagements relate directly to the operations and financial reporting of the Fund. This list of Covered Entities would include:
Morgan Stanley Retail Funds
Morgan Stanley Investment Advisors Inc.
Morgan Stanley & Co. Incorporated
Morgan Stanley DW Inc.
Morgan Stanley Investment Management Inc.
Morgan Stanley Investment Management Limited
Morgan Stanley Investment Management Private Limited
Morgan Stanley Asset & Investment Trust Management Co., Limited
Morgan Stanley Investment Management Company
Morgan Stanley Services Company, Inc.
Morgan Stanley Distributors Inc.
Morgan Stanley Trust FSB
Morgan Stanley Institutional Funds
Morgan Stanley Investment Management Inc.
Morgan Stanley Investment Advisors Inc.
Morgan Stanley Investment Management Limited
Morgan Stanley Investment Management Private Limited
Morgan Stanley Asset & Investment Trust Management Co., Limited
Morgan Stanley Investment Management Company
Morgan Stanley & Co. Incorporated
Morgan Stanley Distribution, Inc.
Morgan Stanley AIP GP LP
Morgan Stanley Alternative Investment Partners LP
(e)(2) Beginning with non-audit service contracts entered into on or after May 6, 2003, the audit committee also is required to pre-approve services to Covered Entities to the extent that the services are determined to have a direct impact on the operations or financial reporting of the Registrant. 100% of such services were pre-approved by the audit committee pursuant to the Audit Committee’s pre-approval policies and procedures (attached hereto).
(f) Not applicable.
(g) See table above.
(h) The audit committee of the Board of Directors has considered whether the provision of services other than audit services performed by the auditors to the Registrant and Covered Entities is compatible with maintaining the auditors’ independence in performing audit services.
Item 5. Audit Committee of Listed Registrants.
(a) The Fund has a separately-designated standing audit committee established in accordance with Section 3(a)(58)(A) of the Exchange Act whose members are:
Joseph J. Kearns, Jakki L. Haussler, Michael F. Klein and Allen W. Reed.
(b) Not applicable.
Item 6. Schedule of Investments
(a) Refer to Item 1.
(b) Not applicable.
Item 7. Disclosure of Proxy Voting Policies and Procedures for Closed-End Management Investment Companies.
Applicable only to reports filed by closed-end funds.
Item 8. Portfolio Managers of Closed-End Management Investment Companies
Applicable only to reports filed by closed-end funds.
Item 9. Closed-End Fund Repurchases
Applicable only to reports filed by closed-end funds.
Item 10. Submission of Matters to a Vote of Security Holders
Not applicable.
Item 11. Controls and Procedures
(a) The Fund’s principal executive officer and principal financial officer have concluded that the Fund’s disclosure controls and procedures are sufficient to ensure that information required to be disclosed by the Fund in this Form N-CSR was recorded, processed, summarized and reported within the time periods specified in the Securities and Exchange Commission’s rules and forms, based upon such officers’ evaluation of these controls and procedures as of a date within 90 days of the filing date of the report.
(b) There were no changes in the registrant’s internal control over financial reporting that occurred during the second fiscal quarter of the period covered by this report that has materially affected, or is reasonably likely to materially affect, the registrant’s internal control over financial reporting.
Item 12. Exhibits
(a) The Code of Ethics for Principal Executive and Senior Financial Officers is attached hereto.
(b) A separate certification for each principal executive officer and principal financial officer of the registrant are attached hereto as part of EX-99.CERT.
SIGNATURES
Pursuant to the requirements of the Securities Exchange Act of 1934 and the Investment Company Act of 1940, the registrant has duly caused this report to be signed on its behalf by the undersigned, thereunto duly authorized.
Morgan Stanley Institutional Fund, Inc. | |
| |
/s/ John H. Gernon | |
John H. Gernon | |
Principal Executive Officer | |
February 16, 2017 | |
Pursuant to the requirements of the Securities Exchange Act of 1934 and the Investment Company Act of 1940, this report has been signed by the following persons on behalf of the registrant and in the capacities and on the dates indicated.
/s/ John H. Gernon | |
John H. Gernon | |
Principal Executive Officer | |
February 16, 2017 | |
| |
/s/ Francis Smith | |
Francis Smith | |
Principal Financial Officer | |
February 16, 2017 | |