| | |
| UNITED STATES
SECURITIES AND EXCHANGE COMMISSION |
| | |
| CERTIFIED SHAREHOLDER REPORT OF REGISTERED
MANAGEMENT INVESTMENT COMPANIES
|
| | |
| Investment Company Act file number: | (811-05635) |
| | |
| Exact name of registrant as specified in charter: | Putnam Diversified Income Trust |
| | |
| Address of principal executive offices: | One Post Office Square, Boston, Massachusetts 02109 |
| | |
| Name and address of agent for service: | Robert T. Burns, Vice President
One Post Office Square
Boston, Massachusetts 02109 |
| | |
| Copy to: | John W. Gerstmayr, Esq.
Ropes & Gray LLP
800 Boylston Street
Boston, Massachusetts 02199-3600 |
| | |
| Registrant’s telephone number, including area code: | (617) 292-1000 |
| | |
| Date of fiscal year end: | September 30, 2013 |
| | |
| Date of reporting period: | October 1, 2012 — March 31, 2013 |
| | |
|
Item 1. Report to Stockholders: | |
| | |
| The following is a copy of the report transmitted to stockholders pursuant to Rule 30e-1 under the Investment Company Act of 1940: | |

Putnam
Diversified
Income Trust
Semiannual report
3 | 31 | 13
| | | |
| Message from the Trustees | 1 | | |
| | |
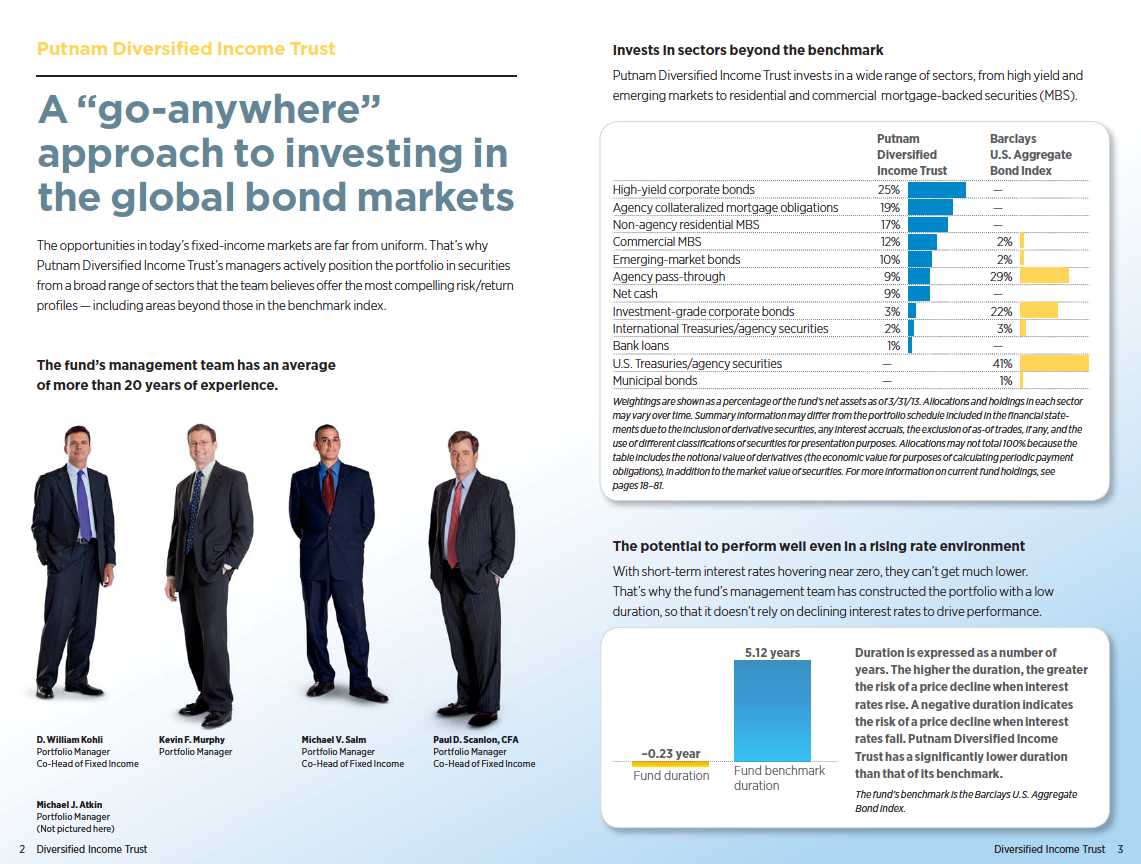
| About the fund | 2 | | |
| | |
| Performance snapshot | 4 | | |
| | |
| Interview with your fund’s portfolio manager | 5 | | |
| | |
| Your fund’s performance | 11 | | |
| | |
| Your fund’s expenses | 13 | | |
| | |
| Terms and definitions | 15 | | |
| | |
| Other information for shareholders | 16 | | |
| | |
| Financial statements | 17 | | |
| | |
Consider these risks before investing: International investing involves certain risks, such as currency fluctuations, economic instability, and political developments. Additional risks may be associated with emerging-market securities, including illiquidity and volatility. Lower-rated bonds may offer higher yields in return for more risk. Funds that invest in government securities are not guaranteed. Mortgage-backed securities are subject to prepayment risk. Derivatives also involve the risk, in the case of many over-the-counter instruments, of the potential inability to terminate or sell derivatives positions and the potential failure of the other party to the instrument to meet its obligations. Bond investments are subject to interest-rate risk, which means the prices of the fund’s bond investments are likely to fall if interest rates rise. Bond investments also are subject to credit risk, which is the risk that the issuer of the bond may default on payment of interest or principal. Interest-rate risk is generally greater for longer-term bonds, and credit risk is generally greater for below-investment-grade bonds, which may be considered speculative. Unlike bonds, funds that invest in bonds have ongoing fees and expenses. The prices of bonds in the fund’s portfolio may fall or fail to rise over extended periods of time for a variety of reasons, including both general financial market conditions and factors related to a specific issuer. You can lose money by investing in the fund.
Message from the Trustees
Dear Fellow Shareholder:
Many macroeconomic risks to global growth have diminished in recent months. A widespread financial collapse in Europe, an economic hard landing in China, and significant fallout from budget sequestration and the fiscal cliff in the United States have not come to pass. While these risks have not entirely dissipated, U.S. equity markets have managed to achieve record highs in the first quarter, recouping all of their losses from the 2008 financial crisis.
In the United States, corporate profits and balance sheets are strong. The Federal Reserve has pledged to keep interest rates at historic lows until the nation’s employment situation meaningfully improves. The U.S. housing market, a significant driver of GDP, has been steadily rebounding. And while the federal budget battle is not yet resolved, the markets appear to believe that Washington lawmakers will eventually reach a resolution.
At Putnam, our investment team employs a measured, balanced approach to managing risk while pursuing returns. It is also important to rely on the guidance of your financial advisor, who can help ensure that your portfolio matches your individual goals and tolerance for risk.
We would like to extend a welcome to new shareholders of the fund and to thank all of our investors for your continued confidence in Putnam.

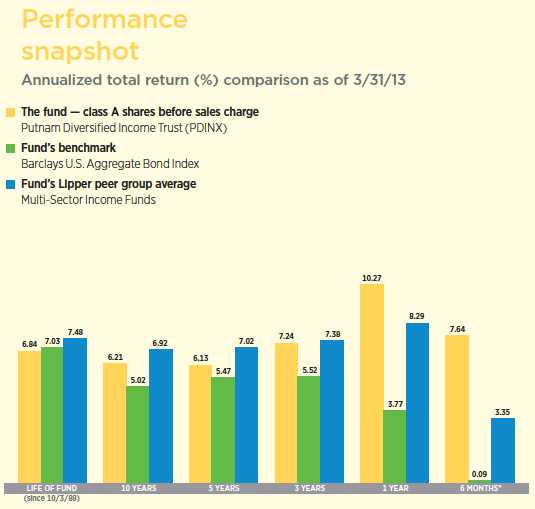
Current performance may be lower or higher than the quoted past performance, which cannot guarantee future results. Share price, principal value, and return will fluctuate, and you may have a gain or a loss when you sell your shares. Performance of class A shares assumes reinvestment of distributions and does not account for taxes. Fund returns in the bar chart do not reflect a sales charge of 4.00%; had they, returns would have been lower. See pages 5 and 11–12 for additional performance information. For a portion of the periods, the fund had expense limitations, without which returns would have been lower. To obtain the most recent month-end performance, visit putnam.com.
* Returns for the six-month period are not annualized, but cumulative.
| |
| 4 | Diversified Income Trust |
Interview with your fund’s portfolio manager

Bill, what was the bond market environment like during the six months ended March 31, 2013?
It was a strong period for the most credit-sensitive categories, particularly high-yield bonds and floating-rate bank-loan securities, which saw their yield spreads — their yield advantage over U.S. Treasuries — tighten further amid persistent investor demand and solid corporate fundamentals. These sectors were among the biggest beneficiaries of the improved risk sentiment that was spurred by global monetary easing during and prior to the period. With interest rates rising across most global developed markets, Treasuries, global government securities, and other defensive categories lagged, posting either negative or nominally positive returns.
Both at home and abroad, political leaders continued to grapple with fiscal challenges. While there were several events that produced negative headlines, including the government-spending sequester in the United States and the banking crisis in Cyprus, the fact that riskier assets performed well in an environment of policy and macroeconomic uncertainty suggests that investors are becoming more attuned to the opportunity cost of remaining on the sidelines.
Against this backdrop, the fund outperformed its benchmark and the average return for its Lipper peer group.

This comparison shows your fund’s performance in the context of broad market indexes for the six months ended 3/31/13. See pages 4 and 11–12 for additional fund performance information. Index descriptions can be found on pages 15–16.
| |
| Diversified Income Trust | 5 |
Turning to performance, the fund outpaced its benchmark by a sizable margin. What factors fueled this solid showing?
An out-of-benchmark stake in non-agency residential mortgage-backed securities [RMBS], along with our prepayment strategy, which was expressed through holdings of government-agency interest-only securities [agency IOs] hedged with agency mortgage pass-throughs, drove the fund’s outperformance. Our holdings of non-agency RMBS performed very well during the period’s first half, driven by investors’ appetite for higher-yielding securities, and by a strengthening U.S. housing market. Our prepayment strategy worked well as we focused our security selection in pools that we believed would experience fewer prepayments. At the same time, 10-year Treasury yields rose during the period’s second half, further reducing borrowers’ incentive to refinance and helping to keep mortgage prepayments at a relatively low level.
Elsewhere, strong security selection among commercial mortgage-backed securities [CMBS] also bolstered relative performance. Within CMBS, we held both Aaa-rated and “seasoned mezzanine” securities. CMBS are created when an underwriter assembles a package of commercial mortgages and issues bonds of varying creditworthiness. Aaa-rated CMBS occupy the top of the underwriter’s capital structure, and thus offer the greatest principal protection. Mezzanine CMBS are slightly lower in the capital structure, but still provide a meaningful amount of principal protection along with higher yields. The mezzanine bonds we selected were issued
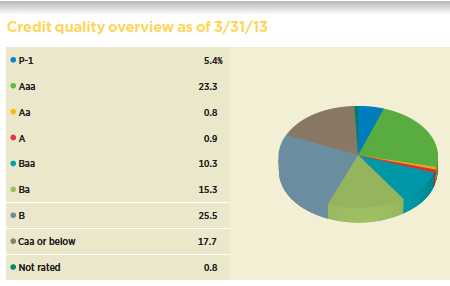
Credit qualities are shown as a percentage of the fund’s net assets. A bond rated Baa or higher (Prime-3 or higher, for short-term debt) is considered investment grade. The chart reflects Moody’s ratings; percentages may include bonds or derivatives not rated by Moody’s but rated by Standard & Poor’s (S&P) or, if unrated by S&P, by Fitch ratings, and then included in the closest equivalent Moody’s rating. Ratings may vary over time.
Credit quality includes bonds and represents only the fixed-income portion of the portfolio. Derivative instruments, including forward currency contracts, are only included to the extent of any unrealized gain or loss on such instruments and are shown in the not-rated category. Cash is also shown in the not-rated category. The fund itself has not been rated by an independent rating agency.
| |
| 6 | Diversified Income Trust |
prior to 2006, when CMBS underwriting standards were stronger than they were later in the decade.

A meaningful allocation to high-yield bonds was another contributor, as the asset class rallied strongly in step with global equity markets and was one of the best-performing fixed-income sectors during the period. Security selection among emerging-market bonds provided a further boost versus the benchmark, led by our holdings in Venezuela.
The fund’s term structure positioning, by which I mean its duration — or interest-rate sensitivity — and yield-curve strategy, also aided relative results. We sought to limit the fund’s interest-rate risk by maintaining a relatively short duration in the United States, while also positioning the fund to benefit should the yield curve steepen. While our duration stance slightly hampered performance, our steeper-yield-curve strategy proved beneficial and more than offset the negative impact of the fund’s short duration.
How did your currency strategy affect performance?
Our active currency strategy, which is implemented with long and short positions using forward currency contracts, was another significant contributor during the period. The fund benefited from short positions in the Japanese yen, the British pound sterling, and

This table shows the fund’s top 10 individual holdings and the percentage of the fund’s net assets that each represented as of 3/31/13. Short-term holdings, derivatives, and TBA commitments, if any, are excluded. Holdings may vary over time.
| |
| Diversified Income Trust | 7 |
the Swiss franc, combined with long positions in the Australian dollar and Mexican peso.
Which strategies detracted from results?
The only notable detractor was a large underweight in investment-grade corporate bonds, which was partially offset by favorable security selection within the sector, particularly among financial institutions.
How did you use derivatives during the period?
We used bond futures and interest-rate swaps — which allow two parties to exchange one stream of future interest payments for another, based on a specified principal amount — to take tactical positions at various points along the yield curve.
In addition, we employed interest-rate swaps and “swaptions” — which give us the option to enter into a swap contract — to hedge the interest-rate risk associated with our collateralized-mortgage-obligation [CMO] holdings. We also used total return swaps as a hedging tool and to help manage the fund’s sector exposure, as well as credit default swaps to hedge the fund’s credit risk.
Lastly, we used forward currency contracts to hedge the foreign exchange risk associated with non-U.S. bonds, and to efficiently gain exposure to foreign currencies as part of our active strategy involving global currency pairings.
What is your outlook for the coming months, and how are you positioning the fund?
We believe the U.S. economy remains solidly in a mid-cycle expansion, buoyed by stronger consumer spending, despite rising gasoline prices and higher payroll taxes. By boosting economic activity and underpinning firmer labor market conditions, the U.S. housing recovery is helping to offset the drag on consumers from fiscal austerity measures. During the six months ending February 2013, more than 10% of new jobs were in construction. Bank lending standards began
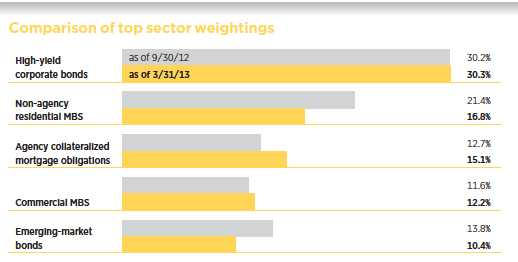
This chart shows how the fund’s top weightings have changed over the past six months. Allocations are represented as a percentage of the fund’s net assets. Current period summary information may differ from the portfolio schedule included in the financial statements due to the inclusion of derivative securities, any interest accruals, the exclusion of as-of trades, if any, and the use of different classifications of securities for presentation purposes. Holdings and allocations may vary over time.
| |
| 8 | Diversified Income Trust |
to loosen, helping to reinforce economic growth. That said, in our view, we do not see the economy growing strongly enough to cause the Federal Reserve to shift from its current accommodative monetary policy stance.
Outside the United States, Japan joined China in early-cycle recoveries, providing a lift to the rest of Asia. It appears that Germany’s economy has begun to pick up, but much of the rest of Europe remains in recession. Business confidence measures fell in March, perhaps because of the poor handling of the banking crisis in Cyprus. The European Central Bank has revised its 2013 growth forecast downward and is anticipating a modest contraction while remaining concerned about downside risks to the eurozone economy.
Within this environment, we plan to continue deemphasizing interest-rate risk in the portfolio and expect to maintain the fund’s bias toward a steepening yield curve in the United States. As long as the Fed continues to inject liquidity into the financial system through targeted bond purchases, we don’t believe that interest rates are likely to move significantly higher than where they are today. We recognize, however, that any strategy that relies on rates declining further to drive performance is risky amid what may be a range-bound and volatile interest-rate environment. For that reason, we intend to keep the portfolio’s overall duration near zero and will rely on other factors to influence the fund’s performance.
At period-end, our allocations to securitized sectors represented the fund’s greatest overweight. In prepayment-sensitive areas, we are more cautious toward lower-coupon pass-throughs — those with coupons below 4% — but favor pools in the middle of the coupon range of 4%–5% that we believe exhibit favorable prepayment profiles. In credit-sensitive areas, we plan to maintain
A word about derivatives
Derivatives are an increasingly common type of investment instrument, the performance of which is derived from an underlying security, index, currency, or other area of the capital markets. Derivatives employed by the fund’s managers generally serve one of two main purposes: to implement a strategy that may be difficult or more expensive to invest in through traditional securities, or to hedge unwanted risk associated with a particular position.
For example, the fund’s managers might use currency forward contracts to capitalize on an anticipated change in exchange rates between two currencies. This approach would require a significantly smaller outlay of capital than purchasing traditional bonds denominated in the underlying currencies. In another example, the managers may identify a bond that they believe is undervalued relative to its risk of default, but may seek to reduce the interest-rate risk of that bond by using interest-rate swaps, a derivative through which two parties “swap” payments based on the movement of certain rates.
Like any other investment, derivatives may not appreciate in value and may lose money. Derivatives may amplify traditional investment risks through the creation of leverage and may be less liquid than traditional securities. And because derivatives typically represent contractual agreements between two financial institutions, derivatives entail “counterparty risk,” which is the risk that the other party is unable or unwilling to pay. Putnam monitors the counterparty risks we assume. For example, Putnam may enter into collateral agreements that require the counterparties to post collateral on a regular basis to cover their obligations to the fund.
| |
| Diversified Income Trust | 9 |
our diversified exposure to CMBS, as well as modest allocations to high-yield bonds and investment-grade corporate bonds.
Thanks for your time and for bringing us up to date, Bill.
The views expressed in this report are exclusively those of Putnam Management and are subject to change. They are not meant as investment advice.
Please note that the holdings discussed in this report may not have been held by the fund for the entire period. Portfolio composition is subject to review in accordance with the fund’s investment strategy and may vary in the future. Current and future portfolio holdings are subject to risk.
Portfolio Manager D. William Kohli is Co-Head of Fixed Income at Putnam. He has an M.B.A. from the Haas School of Business at the University of California, Berkeley, and a B.A. from the University of California, San Diego. Bill joined Putnam in 1994 and has been in the investment industry since 1986.
In addition to Bill, your fund’s portfolio managers are Michael J. Atkin, Kevin F. Murphy, Michael V. Salm, and Paul D. Scanlon, CFA.
IN THE NEWS
The economic outlook for major industrialized nations is slowly improving, with the United States and Japan leading the way, according to a recent report by the Organisation for Economic Co-operation and Development (OECD). Economic expansion is also taking place in most major countries around the world, including the 17-nation eurozone, where Germany’s economy is growing and stabilization is occurring in Italy and France. Growth also is solidifying in Japan, whose new government has launched efforts to bring the country’s long-stagnant economy back to life through various stimulus efforts, and growth is picking up in China, where an economic hard landing has been avoided. The OECD sees growth weakening in India and normal, “around trend” growth taking place in Russia, Brazil, and the United Kingdom. Meanwhile, the World Trade Organization (WTO) has cut its overall 2013 forecast for global trade volume growth to 3.3% from 4.5%. Global trade grew by 2% in 2012, the second-worst figure since this economic statistic began to be tracked in 1981, according to the WTO. The worst trade figure came in 2009 during the global economic crisis.
| |
| 10 | Diversified Income Trust |
Your fund’s performance
This section shows your fund’s performance, price, and distribution information for periods ended March 31, 2013, the end of the first half of its current fiscal year. In accordance with regulatory requirements for mutual funds, we also include expense information taken from the fund’s current prospectus. Performance should always be considered in light of a fund’s investment strategy. Data represent past performance. Past performance does not guarantee future results. More recent returns may be less or more than those shown. Investment return and principal value will fluctuate, and you may have a gain or a loss when you sell your shares. Performance information does not reflect any deduction for taxes a shareholder may owe on fund distributions or on the redemption of fund shares. For the most recent month-end performance, please visit the Individual Investors section at putnam.com or call Putnam at 1-800-225-1581. Class R and class Y shares are not available to all investors. See the Terms and Definitions section in this report for definitions of the share classes offered by your fund.
Fund performance Total return for periods ended 3/31/13
| | | | | | | | | | |
| | Class A | Class B | Class C | Class M | Class R | Class Y |
| (inception dates) | (10/3/88) | (3/1/93) | (2/1/99) | (12/1/94) | (12/1/03) | (7/1/96) |
|
| | Before | After | | | | | Before | After | Net | Net |
| | sales | sales | Before | After | Before | After | sales | sales | asset | asset |
| | charge | charge | CDSC | CDSC | CDSC | CDSC | charge | charge | value | value |
|
| Annual average | | | | | | | | | | |
| (life of fund) | 6.84% | 6.66% | 6.02% | 6.02% | 6.02% | 6.02% | 6.54% | 6.40% | 6.55% | 7.00% |
|
| 10 years | 82.74 | 75.43 | 69.71 | 69.71 | 69.08 | 69.08 | 78.23 | 72.44 | 77.42 | 86.59 |
| Annual average | 6.21 | 5.78 | 5.43 | 5.43 | 5.39 | 5.39 | 5.95 | 5.60 | 5.90 | 6.44 |
|
| 5 years | 34.67 | 29.28 | 29.96 | 28.24 | 29.57 | 29.57 | 33.19 | 28.87 | 32.51 | 35.88 |
| Annual average | 6.13 | 5.27 | 5.38 | 5.10 | 5.32 | 5.32 | 5.90 | 5.20 | 5.79 | 6.32 |
|
| 3 years | 23.33 | 18.40 | 20.57 | 17.58 | 20.72 | 20.72 | 22.50 | 18.51 | 22.38 | 24.15 |
| Annual average | 7.24 | 5.79 | 6.43 | 5.55 | 6.48 | 6.48 | 7.00 | 5.83 | 6.96 | 7.48 |
|
| 1 year | 10.27 | 5.86 | 9.50 | 4.50 | 9.55 | 8.55 | 10.10 | 6.53 | 10.06 | 10.55 |
|
| 6 months | 7.64 | 3.33 | 7.15 | 2.15 | 7.33 | 6.33 | 7.60 | 4.10 | 7.42 | 7.72 |
|
Current performance may be lower or higher than the quoted past performance, which cannot guarantee future results. After-sales-charge returns for class A and M shares reflect the deduction of the maximum 4.00% and 3.25% sales charge, respectively, levied at the time of purchase. Class B share returns after contingent deferred sales charge (CDSC) reflect the applicable CDSC, which is 5% in the first year, declining over time to 1% in the sixth year, and is eliminated thereafter. Class C share returns after CDSC reflect a 1% CDSC for the first year that is eliminated thereafter. Class R and Y shares have no initial sales charge or CDSC. Performance for class B, C, M, R, and Y shares before their inception is derived from the historical performance of class A shares, adjusted for the applicable sales charge (or CDSC) and the higher operating expenses for such shares, except for class Y shares, for which 12b-1 fees are not applicable.
For a portion of the periods, the fund had expense limitations, without which returns would have been lower.
Class B share performance does not reflect conversion to class A shares.
| |
| Diversified Income Trust | 11 |
Comparative index returns For periods ended 3/31/13
| | |
| | Barclays U.S. Aggregate | Lipper Multi-Sector Income Funds |
| | Bond Index | category average* |
|
| Annual average (life of fund) | 7.03% | 7.48% |
|
| 10 years | 63.27 | 96.73 |
| Annual average | 5.02 | 6.92 |
|
| 5 years | 30.49 | 41.02 |
| Annual average | 5.47 | 7.02 |
|
| 3 years | 17.50 | 24.02 |
| Annual average | 5.52 | 7.38 |
|
| 1 year | 3.77 | 8.29 |
|
| 6 months | 0.09 | 3.35 |
|
Index and Lipper results should be compared with fund performance before sales charge, before CDSC, or at net asset value.
* Over the 6-month, 1-year, 3-year, 5-year, 10-year, and life-of-fund periods ended 3/31/13, there were 265, 240, 170, 148, 93, and 6 funds, respectively, in this Lipper category.
Fund price and distribution information For the six-month period ended 3/31/13
| | | | | | | | |
| Distributions | Class A | Class B | Class C | Class M | Class R | Class Y |
|
| Number | 6 | 6 | 6 | 6 | 6 | 6 |
|
| Income | $0.222 | $0.192 | $0.192 | $0.211 | $0.211 | $0.234 |
|
| Capital gains | — | — | — | — | — | — |
|
| Total | $0.222 | $0.192 | $0.192 | $0.211 | $0.211 | $0.234 |
|
| | Before | After | Net | Net | Before | After | Net | Net |
| | sales | sales | asset | asset | sales | sales | asset | asset |
| Share value | charge | charge | value | value | charge | charge | value | value |
|
| 9/30/12 | $7.59 | $7.91 | $7.53 | $7.48 | $7.48 | $7.73 | $7.52 | $7.54 |
|
| 3/31/13 | 7.94 | 8.27 | 7.87 | 7.83 | 7.83 | 8.09 | 7.86 | 7.88 |
|
| | Before | After | Net | Net | Before | After | Net | Net |
| | sales | sales | asset | asset | sales | sales | asset | asset |
| Current rate (end of period) | charge | charge | value | value | charge | charge | value | value |
|
| Current dividend rate 1 | 5.59% | 5.37% | 4.88% | 4.90% | 5.36% | 5.19% | 5.34% | 5.94% |
|
| Current 30-day SEC yield 2 | N/A | 4.67 | 4.12 | 4.11 | N/A | 4.46 | 4.62 | 5.12 |
|
The classification of distributions, if any, is an estimate. Before-sales-charge share value and current dividend rate for class A and M shares, if applicable, do not take into account any sales charge levied at the time of purchase. After-sales-charge share value, current dividend rate, and current 30-day SEC yield, if applicable, are calculated assuming that the maximum sales charge (4.00% for class A shares and 3.25% for class M shares) was levied at the time of purchase. Final distribution information will appear on your year-end tax forms.
1 Most recent distribution, including any return of capital and excluding capital gains, annualized and divided by share price before or after sales charge at period-end.
2 Based only on investment income and calculated using the maximum offering price for each share class, in accordance with SEC guidelines.
| |
| 12 | Diversified Income Trust |
Your fund’s expenses
As a mutual fund investor, you pay ongoing expenses, such as management fees, distribution fees (12b-1 fees), and other expenses. Using the following information, you can estimate how these expenses affect your investment and compare them with the expenses of other funds. You may also pay one-time transaction expenses, including sales charges (loads) and redemption fees, which are not shown in this section and would have resulted in higher total expenses. For more information, see your fund’s prospectus or talk to your financial representative.
Expense ratios
| | | | | | |
| | Class A | Class B | Class C | Class M | Class R | Class Y |
|
| Total annual operating expenses | | | | | | |
| for the fiscal year ended 9/30/12 | 0.99% | 1.74% | 1.74% | 1.24% | 1.24% | 0.74% |
|
| Annualized expense ratio for the | | | | | | |
| six-month period ended 3/31/13 | 1.00% | 1.75% | 1.75% | 1.25% | 1.25% | 0.75% |
|
Fiscal-year expense information in this table is taken from the most recent prospectus, is subject to change, and may differ from that shown for the annualized expense ratio and in the financial highlights of this report. Expenses are shown as a percentage of average net assets.
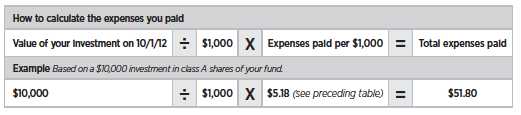
Expenses per $1,000
The following table shows the expenses you would have paid on a $1,000 investment in the fund from October 1, 2012, to March 31, 2013. It also shows how much a $1,000 investment would be worth at the close of the period, assuming actual returns and expenses.
| | | | | | |
| | Class A | Class B | Class C | Class M | Class R | Class Y |
|
| Expenses paid per $1,000*† | $5.18 | $9.04 | $9.05 | $6.47 | $6.46 | $3.88 |
|
| Ending value (after expenses) | $1,076.40 | $1,071.50 | $1,073.30 | $1,076.00 | $1,074.20 | $1,077.20 |
|
* Expenses for each share class are calculated using the fund’s annualized expense ratio for each class, which represents the ongoing expenses as a percentage of average net assets for the six months ended 3/31/13. The expense ratio may differ for each share class.
† Expenses are calculated by multiplying the expense ratio by the average account value for the period; then multiplying the result by the number of days in the period; and then dividing that result by the number of days in the year.
| |
| Diversified Income Trust | 13 |
Estimate the expenses you paid
To estimate the ongoing expenses you paid for the six months ended March 31, 2013, use the following calculation method. To find the value of your investment on October 1, 2012, call Putnam at 1-800-225-1581.
Compare expenses using the SEC’s method
The Securities and Exchange Commission (SEC) has established guidelines to help investors assess fund expenses. Per these guidelines, the following table shows your fund’s expenses based on a $1,000 investment, assuming a hypothetical 5% annualized return. You can use this information to compare the ongoing expenses (but not transaction expenses or total costs) of investing in the fund with those of other funds. All mutual fund shareholder reports will provide this information to help you make this comparison. Please note that you cannot use this information to estimate your actual ending account balance and expenses paid during the period.
| | | | | | |
| | Class A | Class B | Class C | Class M | Class R | Class Y |
|
| Expenses paid per $1,000*† | $5.04 | $8.80 | $8.80 | $6.29 | $6.29 | $3.78 |
|
| Ending value (after expenses) | $1,019.95 | $1,016.21 | $1,016.21 | $1,018.70 | $1,018.70 | $1,021.19 |
|
* Expenses for each share class are calculated using the fund’s annualized expense ratio for each class, which represents the ongoing expenses as a percentage of average net assets for the six months ended 3/31/13. The expense ratio may differ for each share class.
† Expenses are calculated by multiplying the expense ratio by the average account value for the period; then multiplying the result by the number of days in the period; and then dividing that result by the number of days in the year.
| |
| 14 | Diversified Income Trust |
Terms and definitions
Important terms
Total return shows how the value of the fund’s shares changed over time, assuming you held the shares through the entire period and reinvested all distributions in the fund.
Before sales charge, or net asset value, is the price, or value, of one share of a mutual fund, without a sales charge. Before-sales-charge figures fluctuate with market conditions, and are calculated by dividing the net assets of each class of shares by the number of outstanding shares in the class.
After sales charge is the price of a mutual fund share plus the maximum sales charge levied at the time of purchase. After-sales-charge performance figures shown here assume the 4.00% maximum sales charge for class A shares and 3.25% for class M shares.
Contingent deferred sales charge (CDSC) is generally a charge applied at the time of the redemption of class B or C shares and assumes redemption at the end of the period. Your fund’s class B CDSC declines over time from a 5% maximum during the first year to 1% during the sixth year. After the sixth year, the CDSC no longer applies. The CDSC for class C shares is 1% for one year after purchase.
Share classes
Class A shares are generally subject to an initial sales charge and no CDSC (except on certain redemptions of shares bought without an initial sales charge).
Class B shares are not subject to an initial sales charge. They may be subject to a CDSC.
Class C shares are not subject to an initial sales charge and are subject to a CDSC only if the shares are redeemed during the first year.
Class M shares have a lower initial sales charge and a higher 12b-1 fee than class A shares and no CDSC (except on certain redemptions of shares bought without an initial sales charge).
Class R shares are not subject to an initial sales charge or CDSC and are available only to certain defined contribution plans.
Class Y shares are not subject to an initial sales charge or CDSC, and carry no 12b-1 fee. They are generally only available to corporate and institutional clients and clients in other approved programs.
Fixed-income terms
Current yield is the annual rate of return earned from dividends or interest of an investment. Current yield is expressed as a percentage of the price of a security, fund share, or principal investment.
Mortgage-backed security (MBS), also known as a mortgage “pass-through,” is a type of asset-backed security that is secured by a mortgage or collection of mortgages. The following are types of MBSs:
• Agency “pass-through” has its principal and interest backed by a U.S. government agency, such as the Federal National Mortgage Association (Fannie Mae), Government National Mortgage Association (Ginnie Mae), and Federal Home Loan Mortgage Corporation (Freddie Mac).
• Collateralized mortgage obligation (CMO) represents claims to specific cash flows from pools of home mortgages. The streams of principal and interest payments on the mortgages are distributed to the different classes of CMO interests in “tranches.” Each tranche may have different principal balances, coupon rates, prepayment risks, and maturity dates. A CMO is highly sensitive to changes in interest rates and any resulting change in the rate at which homeowners sell their properties, refinance, or otherwise prepay loans. CMOs are subject to prepayment, market, and liquidity risks.
• Interest-only (IO) security is a type of CMO in which the underlying asset is the interest portion of mortgage, Treasury, or bond payments.
• Non-agency residential mortgage-backed security (RMBS) is an MBS not backed by Fannie Mae, Ginnie Mae, or Freddie Mac. One type of RMBS is an Alt-A mortgage-backed security.
• Commercial mortgage-backed security (CMBS) is secured by the loan on a commercial property.
Yield curve is a graph that plots the yields of bonds with equal credit quality against their differing maturity dates, ranging from shortest to longest. It is used as a benchmark for other debt, such as mortgage or bank lending rates.
Comparative indexes
Barclays U.S. Aggregate Bond Index is an unmanaged index of U.S. investment-grade fixed-income securities.
| |
| Diversified Income Trust | 15 |
BofA (Bank of America) Merrill Lynch U.S. 3-Month Treasury Bill Index is an unmanaged index that seeks to measure the performance of U.S. Treasury bills available in the marketplace.
S&P 500 Index is an unmanaged index of common stock performance.
Indexes assume reinvestment of all distributions and do not account for fees. Securities and performance of a fund and an index will differ. You cannot invest directly in an index.
Lipper is a third-party industry-ranking entity that ranks mutual funds. Its rankings do not reflect sales charges. Lipper rankings are based on total return at net asset value relative to other funds that have similar current investment styles or objectives as determined by Lipper. Lipper may change a fund’s category assignment at its discretion. Lipper category averages reflect performance trends for funds within a category.
Other information for shareholders
Important notice regarding delivery of shareholder documents
In accordance with Securities and Exchange Commission (SEC) regulations, Putnam sends a single copy of annual and semiannual shareholder reports, prospectuses, and proxy statements to Putnam shareholders who share the same address, unless a shareholder requests otherwise. If you prefer to receive your own copy of these documents, please call Putnam at 1-800-225-1581, and Putnam will begin sending individual copies within 30 days.
Proxy voting
Putnam is committed to managing our mutual funds in the best interests of our shareholders. The Putnam funds’ proxy voting guidelines and procedures, as well as information regarding how your fund voted proxies relating to portfolio securities during the 12-month period ended June 30, 2012, are available in the Individual Investors section of putnam.com, and on the SEC’s website, www.sec.gov. If you have questions about finding forms on the SEC’s website, you may call the SEC at 1-800-SEC-0330. You may also obtain the Putnam funds’ proxy voting guidelines and procedures at no charge by calling Putnam’s Shareholder Services at 1-800-225-1581.
Fund portfolio holdings
The fund will file a complete schedule of its portfolio holdings with the SEC for the first and third quarters of each fiscal year on Form N-Q. Shareholders may obtain the fund’s Forms N-Q on the SEC’s website at www.sec.gov. In addition, the fund’s Forms N-Q may be reviewed and copied at the SEC’s Public Reference Room in Washington, D.C. You may call the SEC at 1-800-SEC-0330 for information about the SEC’s website or the operation of the Public Reference Room.
Trustee and employee fund ownership
Putnam employees and members of the Board of Trustees place their faith, confidence, and, most importantly, investment dollars in Putnam mutual funds. As of March 31, 2013, Putnam employees had approximately $377,000,000 and the Trustees had approximately $90,000,000 invested in Putnam mutual funds. These amounts include investments by the Trustees’ and employees’ immediate family members as well as investments through retirement and deferred compensation plans.
| |
| 16 | Diversified Income Trust |
Financial statements
A guide to financial statements
These sections of the report, as well as the accompanying Notes, constitute the fund’s financial statements.
The fund’s portfolio lists all the fund’s investments and their values as of the last day of the reporting period. Holdings are organized by asset type and industry sector, country, or state to show areas of concentration and diversification.
Statement of assets and liabilities shows how the fund’s net assets and share price are determined. All investment and non-investment assets are added together. Any unpaid expenses and other liabilities are subtracted from this total. The result is divided by the number of shares to determine the net asset value per share, which is calculated separately for each class of shares. (For funds with preferred shares, the amount subtracted from total assets includes the liquidation preference of preferred shares.)
Statement of operations shows the fund’s net investment gain or loss. This is done by first adding up all the fund’s earnings — from dividends and interest income — and subtracting its operating expenses to determine net investment income (or loss). Then, any net gain or loss the fund realized on the sales of its holdings — as well as any unrealized gains or losses over the period — is added to or subtracted from the net investment result to determine the fund’s net gain or loss for the fiscal period.
Statement of changes in net assets shows how the fund’s net assets were affected by the fund’s net investment gain or loss, by distributions to shareholders, and by changes in the number of the fund’s shares. It lists distributions and their sources (net investment income or realized capital gains) over the current reporting period and the most recent fiscal year-end. The distributions listed here may not match the sources listed in the Statement of operations because the distributions are determined on a tax basis and may be paid in a different period from the one in which they were earned. Dividend sources are estimated at the time of declaration. Actual results may vary. Any non-taxable return of capital cannot be determined until final tax calculations are completed after the end of the fund’s fiscal year.
Financial highlights provide an overview of the fund’s investment results, per-share distributions, expense ratios, net investment income ratios, and portfolio turnover in one summary table, reflecting the five most recent reporting periods. In a semiannual report, the highlights table also includes the current reporting period.
| |
| Diversified Income Trust | 17 |
The fund’s portfolio 3/31/13 (Unaudited)
| | |
| MORTGAGE-BACKED SECURITIES (43.9%)* | Principal amount | Value |
|
| Agency collateralized mortgage obligations (14.9%) | | |
| Federal Home Loan Mortgage Corp. | | |
| IFB Ser. 3182, Class SP, 27.787s, 2032 | $1,120,476 | $1,833,507 |
| IFB Ser. 3408, Class EK, 24.975s, 2037 | 658,327 | 1,034,402 |
| IFB Ser. 2979, Class AS, 23.528s, 2034 | 315,567 | 424,176 |
| IFB Ser. 3727, Class PS, IO, 6.497s, 2038 | 19,842,995 | 1,940,428 |
| IFB Ser. 3895, Class SM, IO, 6.447s, 2040 | 13,898,016 | 1,867,287 |
| IFB Ser. 4048, Class GS, IO, 6.447s, 2040 | 21,143,987 | 4,070,006 |
| IFB Ser. 3860, Class SP, IO, 6.397s, 2040 | 37,691,091 | 5,723,015 |
| IFB Ser. 3861, Class PS, IO, 6.397s, 2037 | 15,667,165 | 2,596,519 |
| IFB Ser. 4032, Class SA, IO, 6.297s, 2042 | 18,738,345 | 2,864,653 |
| IFB Ser. 4125, Class SH, IO, 5.947s, 2042 | 20,502,270 | 3,388,615 |
| IFB Ser. 4105, Class LS, IO, 5.947s, 2041 | 19,128,326 | 3,728,876 |
| Ser. 3687, Class CI, IO, 5s, 2038 | 23,709,542 | 2,693,404 |
| Ser. 3632, Class CI, IO, 5s, 2038 | 6,287,240 | 365,163 |
| Ser. 3626, Class DI, IO, 5s, 2037 | 3,202,247 | 104,297 |
| Ser. 304, Class C27, IO, 4 1/2s, 2043 | 44,410,436 | 7,197,155 |
| Ser. 4122, Class TI, IO, 4 1/2s, 2042 | 29,941,415 | 4,560,078 |
| Ser. 4000, Class PI, IO, 4 1/2s, 2042 | 44,340,516 | 5,799,739 |
| Ser. 4019, Class GI, IO, 4 1/2s, 2041 | 67,094,667 | 9,084,618 |
| Ser. 4024, Class PI, IO, 4 1/2s, 2041 | 69,116,021 | 8,466,851 |
| Ser. 3747, Class HI, IO, 4 1/2s, 2037 | 8,626,714 | 736,774 |
| Ser. 4090, Class BI, IO, 4s, 2042 | 3,104,207 | 326,966 |
| Ser. 3748, Class NI, IO, 4s, 2034 | 20,299,242 | 554,575 |
| Ser. 3740, Class KI, IO, 4s, 2033 | 14,907,761 | 195,143 |
| Ser. 304, Class C22, IO, 3 1/2s, 2043 | 51,882,425 | 8,490,040 |
| Ser. 304, Class C4, IO, 3 1/2s, 2043 | 24,932,072 | 5,177,394 |
| Ser. 4105, Class HI, IO, 3 1/2s, 2041 | 15,937,413 | 2,529,905 |
| Ser. T-56, Class A, IO, 0.524s, 2043 | 287,243 | 4,971 |
| Ser. T-56, Class 3, IO, 0.418s, 2043 | 9,952,993 | 130,244 |
| Ser. T-57, Class 1AX, IO, 0.402s, 2043 | 19,170,837 | 227,429 |
| Ser. T-56, Class 1, IO, 0.215s, 2043 | 340,331 | 2,552 |
| Ser. T-56, Class 2, IO, 0.128s, 2043 | 313,077 | 966 |
| Ser. 4077, Class TO, PO, zero %, 2041 | 42,121,537 | 35,286,054 |
| Ser. 3314, PO, zero %, 2036 | 243,041 | 229,730 |
| Ser. 1208, Class F, PO, zero %, 2022 | 100,909 | 94,228 |
| FRB Ser. 3326, Class WF, zero %, 2035 | 164,919 | 162,236 |
| FRB Ser. 3007, Class LU, zero %, 2035 | 3,316 | 3,297 |
|
| Federal National Mortgage Association | | |
| IFB Ser. 06-8, Class HP, 23.818s, 2036 | 1,615,596 | 2,693,069 |
| IFB Ser. 05-45, Class DA, 23.671s, 2035 | 3,242,166 | 5,319,573 |
| IFB Ser. 05-83, Class QP, 16.863s, 2034 | 541,488 | 739,849 |
| Ser. 98-T2, Class A4, IO, 6 1/2s, 2036 | 96,335 | 16,369 |
| IFB Ser. 12-66, Class HS, IO, 6.496s, 2041 | 17,113,568 | 3,574,511 |
| IFB Ser. 12-88, Class SB, IO, 6.466s, 2042 | 43,174,865 | 6,809,540 |
| IFB Ser. 10-99, Class NS, IO, 6.396s, 2039 | 30,695,296 | 3,713,824 |
| IFB Ser. 11-87, Class HS, IO, 6.296s, 2041 | 22,024,673 | 3,610,064 |
|
| |
| 18 | Diversified Income Trust |
| | |
| MORTGAGE-BACKED SECURITIES (43.9%)* cont. | Principal amount | Value |
|
| Agency collateralized mortgage obligations cont. | | |
| Federal National Mortgage Association | | |
| IFB Ser. 12-132, Class SB, IO, 5.996s, 2042 | $65,278,215 | $10,174,263 |
| IFB Ser. 09-100, Class SA, IO, 5.996s, 2039 | 10,645,379 | 1,031,271 |
| IFB Ser. 13-18, Class SB, IO, 5.946s, 2041 | 30,595,558 | 5,987,551 |
| IFB Ser. 12-113, Class CS, IO, 5.946s, 2041 | 16,837,427 | 3,273,196 |
| IFB Ser. 12-113, Class SG, IO, 5.896s, 2042 | 17,186,162 | 3,182,190 |
| IFB Ser. 10-46, Class WS, IO, 5.546s, 2040 | 53,428,085 | 6,672,633 |
| Ser. 399, Class 2, IO, 5 1/2s, 2039 | 218,130 | 21,745 |
| Ser. 374, Class 6, IO, 5 1/2s, 2036 | 8,058,257 | 1,084,722 |
| Ser. 12-132, Class PI, IO, 5s, 2042 | 59,515,083 | 10,953,751 |
| Ser. 398, Class C5, IO, 5s, 2039 | 5,258,005 | 521,068 |
| Ser. 10-13, Class EI, IO, 5s, 2038 | 3,253,100 | 149,726 |
| Ser. 378, Class 19, IO, 5s, 2035 | 7,171,706 | 824,746 |
| Ser. 12-30, Class HI, IO, 4 1/2s, 2040 | 40,836,470 | 6,449,712 |
| Ser. 409, Class 81, IO, 4 1/2s, 2040 | 48,013,613 | 6,813,078 |
| Ser. 404, Class 2, IO, 4 1/2s, 2040 | 468,525 | 67,515 |
| Ser. 366, Class 22, IO, 4 1/2s, 2035 | 6,763,358 | 522,131 |
| Ser. 12-118, Class PI, IO, 4s, 2042 | 28,261,378 | 4,487,624 |
| Ser. 12-96, Class PI, IO, 4s, 2041 | 10,227,334 | 1,408,713 |
| Ser. 406, Class 2, IO, 4s, 2041 | 44,775,923 | 5,820,870 |
| Ser. 406, Class 1, IO, 4s, 2041 | 30,269,700 | 4,183,273 |
| Ser. 409, Class C16, IO, 4s, 2040 | 29,865,868 | 3,700,959 |
| Ser. 405, Class 2, IO, 4s, 2040 | 487,552 | 65,361 |
| Ser. 12-148, Class CI, IO, 3s, 2042 | 13,523,661 | 1,751,449 |
| Ser. 13-35, Class IP, IO, 3s, 2042 | 24,186,333 | 3,015,733 |
| Ser. 13-30, Class IP, IO, 3s, 2041 | 42,836,333 | 4,959,633 |
| Ser. 03-W10, Class 1, IO, 1.303s, 2043 | 9,286,040 | 371,079 |
| Ser. 00-T6, IO, 0.754s, 2030 | 9,895,331 | 210,276 |
| Ser. 01-T1, Class 1, IO, 0.739s, 2040 | 1,159,954 | 21,187 |
| Ser. 01-50, Class B1, IO, 0.404s, 2041 | 495,115 | 4,951 |
| Ser. 02-W8, Class 1, IO, 0.333s, 2042 | 14,013,237 | 166,407 |
| Ser. 99-51, Class N, PO, zero %, 2029 | 145,646 | 140,046 |
|
| Government National Mortgage Association | | |
| IFB Ser. 11-56, Class MS, 6.871s, 2041 | 82,667,870 | 91,134,640 |
| IFB Ser. 10-151, Class SL, IO, 6.497s, 2039 | 23,988,531 | 3,945,394 |
| IFB Ser. 10-163, Class SI, IO, 6.426s, 2037 | 29,859,966 | 4,105,716 |
| IFB Ser. 11-3, Class SG, IO, 6.347s, 2041 | 8,643,136 | 1,713,588 |
| IFB Ser. 10-35, Class CS, IO, 6.267s, 2040 | 20,715,079 | 3,987,591 |
| IFB Ser. 10-26, Class QS, IO, 6.047s, 2040 | 14,301,071 | 2,672,513 |
| IFB Ser. 10-20, Class SC, IO, 5.947s, 2040 | 26,509,121 | 4,963,568 |
| IFB Ser. 10-158, Class SA, IO, 5.847s, 2040 | 15,559,915 | 2,877,339 |
| IFB Ser. 10-151, Class SA, 5.847s, 2040 | 15,466,115 | 2,859,839 |
| IFB Ser. 10-61, Class SJ, IO, 5.847s, 2040 | 21,982,115 | 3,401,073 |
| IFB Ser. 11-70, Class SM, IO, 5.687s, 2041 | 32,221,000 | 8,717,714 |
| IFB Ser. 11-70, Class SH, IO, 5.687s, 2041 | 33,097,000 | 9,014,961 |
| IFB Ser. 10-37, Class SG, IO, 5.497s, 2040 | 21,113,418 | 3,658,533 |
| IFB Ser. 10-115, Class BS, IO, 5.197s, 2040 | 32,015,242 | 5,199,595 |
| Ser. 13-3, Class IT, IO, 5s, 2043 | 21,894,869 | 4,200,080 |
|
| |
| Diversified Income Trust | 19 |
| | |
| MORTGAGE-BACKED SECURITIES (43.9%)* cont. | Principal amount | Value |
|
| Agency collateralized mortgage obligations cont. | | |
| Government National Mortgage Association | | |
| Ser. 13-6, Class IC, IO, 5s, 2043 | $19,480,781 | $3,556,411 |
| Ser. 12-146, Class IO, IO, 5s, 2042 | 41,550,300 | 7,368,530 |
| Ser. 13-6, Class CI, IO, 5s, 2042 | 12,741,101 | 2,515,093 |
| Ser. 10-35, Class UI, IO, 5s, 2040 | 24,204,467 | 4,663,676 |
| Ser. 13-24, Class IC, IO, 4 1/2s, 2043 | 10,506,312 | 1,988,320 |
| Ser. 13-24, Class IK, IO, 4 1/2s, 2043 | 32,802,691 | 6,068,170 |
| Ser. 11-140, Class BI, IO, 4 1/2s, 2040 | 28,034,929 | 2,833,771 |
| Ser. 10-35, Class QI, IO, 4 1/2s, 2040 | 94,993,068 | 17,612,662 |
| Ser. 10-168, Class PI, IO, 4 1/2s, 2039 | 27,704,450 | 3,443,109 |
| Ser. 10-158, Class IP, IO, 4 1/2s, 2039 | 37,417,730 | 4,606,497 |
| Ser. 10-98, Class PI, IO, 4 1/2s, 2037 | 13,554,819 | 1,397,773 |
| Ser. 12-48, Class AI, IO, 3 1/2s, 2036 | 28,720,784 | 4,883,395 |
| Ser. 11-70, PO, zero %, 2041 | 64,666,335 | 53,687,285 |
| Ser. 06-36, Class OD, PO, zero %, 2036 | 41,498 | 38,219 |
| Ser. 06-64, PO, zero %, 2034 | 152,676 | 150,196 |
|
| Structured Asset Securities Corp. IFB Ser. 07-4, Class 1A3, IO, | | |
| 5.984s, 2045 | 108,956,239 | 20,837,881 |
|
| Structured Asset Securities Corp. 144A Ser. 98-RF3, Class A, | | |
| IO, 6.1s, 2028 | 577,234 | 95,244 |
|
| | | 524,607,327 |
| Commercial mortgage-backed securities (12.2%) | | |
| Banc of America Commercial Mortgage, Inc. | | |
| Ser. 06-4, Class AJ, 5.695s, 2046 | 14,900,000 | 14,675,949 |
| Ser. 06-1, Class B, 5.49s, 2045 | 4,164,000 | 3,758,914 |
| FRB Ser. 05-6, Class B, 5.188s, 2047 | 7,000,000 | 7,568,379 |
|
| Banc of America Commercial Mortgage, Inc. 144A | | |
| Ser. 01-1, Class J, 6 1/8s, 2036 | 121,947 | 106,094 |
| Ser. 01-1, Class K, 6 1/8s, 2036 | 2,468,104 | 1,071,942 |
| Ser. 07-5, Class XW, IO, 0.369s, 2051 | 199,228,056 | 2,350,493 |
|
| Bear Stearns Commercial Mortgage Securities, Inc. | | |
| FRB Ser. 07-T28, Class AJ, 5.964s, 2042 | 3,629,000 | 3,873,958 |
| FRB Ser. 07-PW17, Class AJ, 5.893s, 2050 | 12,097,000 | 11,613,120 |
| FRB Ser. 06-PW12, Class AJ, 5.757s, 2038 | 5,354,000 | 5,438,197 |
| Ser. 06-PW13, Class AJ, 5.611s, 2041 | 9,500,000 | 9,375,940 |
| FRB Ser. 06-PW11, Class AJ, 5.45s, 2039 | 3,607,000 | 3,602,491 |
| Ser. 05-PWR7, Class D, 5.304s, 2041 | 4,190,000 | 3,779,380 |
| Ser. 05-PWR7, Class C, 5.235s, 2041 | 4,945,000 | 4,425,093 |
| Ser. 05-PWR7, Class B, 5.214s, 2041 | 7,239,000 | 7,416,848 |
| Ser. 05-PWR9, Class C, 5.055s, 2042 | 3,745,000 | 3,528,165 |
| Ser. 05-PWR9, Class AJ, 4.985s, 2042 | 4,207,000 | 4,312,596 |
|
| Citigroup Commercial Mortgage Trust | | |
| Ser. 06-C5, Class AJ, 5.482s, 2049 | 7,097,000 | 7,063,658 |
| FRB Ser. 05-C3, Class B, 5.029s, 2043 | 16,007,000 | 14,792,069 |
|
| Citigroup/Deutsche Bank Commercial Mortgage Trust 144A | | |
| Ser. 07-CD5, Class XS, IO, 0.036s, 2044 | 132,501,233 | 580,714 |
|
| Commercial Mortgage Trust Ser. 07-C9, Class AJ, 5.65s, 2049 | 4,469,000 | 4,743,397 |
|
| |
| 20 | Diversified Income Trust |
| | | |
| MORTGAGE-BACKED SECURITIES (43.9%)* cont. | | Principal amount | Value |
|
| Commercial mortgage-backed securities cont. | | | |
| Commercial Mortgage Trust 144A | | | |
| FRB Ser. 13-CR6, Class D, 4.316s, 2046 | | $2,789,000 | $2,496,494 |
| FRB Ser. 07-C9, Class AJFL, 0.892s, 2049 | | 19,859,000 | 16,743,123 |
|
| Cornerstone Titan PLC 144A | | | |
| FRB Ser. 05-CT2A, Class E, 1.581s, 2014 (Ireland) | GBP | 681,923 | 922,171 |
| FRB Ser. 05-CT1A, Class D, 1.561s, 2014 (Ireland) | GBP | 2,491,896 | 3,180,501 |
|
| Crest, Ltd. 144A Ser. 03-2A, Class E2, 8s, 2038 (Cayman Islands) | | $4,177,494 | 171,277 |
|
| CS First Boston Mortgage Securities Corp. 144A | | | |
| Ser. 02-CP5, Class H, 6.326s, 2035 | | 9,440,000 | 9,462,042 |
| Ser. 02-CP5, Class M, 5 1/4s, 2035 | | 2,481,123 | 124,056 |
|
| Deutsche Bank-UBS Commercial Mortgage Trust 144A FRB | | | |
| Ser. 11-LC2A, Class D, 5.445s, 2044 | | 6,729,000 | 7,007,029 |
|
| DLJ Commercial Mortgage Corp. Ser. 98-CF2, Class B4, | | | |
| 6.04s, 2031 | | 2,235,111 | 2,235,111 |
|
| FFCA Secured Lending Corp. 144A Ser. 00-1, Class X, IO, | | | |
| 1.085s, 2020 | | 14,226,887 | 312,992 |
|
| First Union Commercial Mortgage Trust 144A Ser. 99-C1, | | | |
| Class G, 5.35s, 2035 | | 3,121,100 | 1,818,209 |
|
| G-Star, Ltd. 144A FRB Ser. 02-2A, Class BFL, 2.204s, 2037 | | | |
| (Cayman Islands) | | 264,369 | 241,897 |
|
| GE Capital Commercial Mortgage Corp. | | | |
| FRB Ser. 05-C4, Class AJ, 5.306s, 2045 | | 2,912,000 | 2,679,040 |
| FRB Ser. 06-C1, Class AJ, 5.293s, 2044 | | 6,144,000 | 6,140,068 |
|
| GMAC Commercial Mortgage Securities, Inc. Ser. 04-C3, Class B, | | | |
| 4.965s, 2041 | | 4,022,000 | 3,423,728 |
|
| Greenwich Capital Commercial Funding Corp. FRB Ser. 05-GG3, | | | |
| Class D, 4.986s, 2042 | | 12,139,000 | 11,875,851 |
|
| Greenwich Capital Commercial Funding Corp. 144A FRB | | | |
| Ser. 03-C1, Class J, 5.363s, 2035 | | 13,755,000 | 13,976,456 |
|
| GS Mortgage Securities Corp. II 144A Ser. 05-GG4, Class XC, IO, | | | |
| 0.747s, 2039 | | 359,141,749 | 5,566,697 |
|
| Guggenheim Structured Real Estate Funding, Ltd. 144A FRB | | | |
| Ser. 05-2A, Class E, 2.204s, 2030 (Cayman Islands) | | 2,622,218 | 1,481,553 |
|
| JPMorgan Chase Commercial Mortgage Securities Corp. | | | |
| FRB Ser. 07-CB20, Class AJ, 6.08s, 2051 | | 17,358,000 | 17,725,990 |
| FRB Ser. 06-LDP7, Class AJ, 5.871s, 2045 | | 19,160,000 | 19,879,477 |
| FRB Ser. 06-LDP7, Class B, 5.871s, 2045 | | 5,589,000 | 4,582,421 |
| Ser. 06-CB16, Class AJ, 5.623s, 2045 | | 13,578,000 | 12,835,148 |
| Ser. 06-LDP6, Class AJ, 5.565s, 2043 | | 8,255,000 | 8,024,686 |
| FRB Ser. 05-LDP3, Class D, 5.194s, 2042 | | 7,091,000 | 6,559,175 |
| FRB Ser. 04-CBX, Class B, 5.021s, 2037 | | 2,344,000 | 2,311,457 |
| FRB Ser. 04-C3, Class C, 4.981s, 2042 | | 4,777,000 | 4,621,748 |
| FRB Ser. 05-LDP2, Class C, 4.911s, 2042 | | 3,650,000 | 3,494,875 |
| FRB Ser. 13-C10, Class D, 4.3s, 2047 | | 6,108,000 | 5,535,070 |
|
| JPMorgan Chase Commercial Mortgage Securities Corp. 144A | | | |
| FRB Ser. 11-C3, Class E, 5.534s, 2046 | | 3,280,000 | 3,402,672 |
| FRB Ser. 12-LC9, Class E, 4.428s, 2047 | | 5,319,000 | 4,968,212 |
| Ser. 07-CB20, Class X1, IO, 0.134s, 2051 | | 258,136,067 | 2,442,225 |
|
| |
| Diversified Income Trust | 21 |
| | |
| MORTGAGE-BACKED SECURITIES (43.9%)* cont. | Principal amount | Value |
|
| Commercial mortgage-backed securities cont. | | |
| LB Commercial Conduit Mortgage Trust 144A | | |
| Ser. 99-C1, Class G, 6.41s, 2031 | $8,260,023 | $8,425,223 |
| Ser. 98-C4, Class J, 5.6s, 2035 | 3,535,000 | 3,928,799 |
|
| LB-UBS Commercial Mortgage Trust FRB Ser. 06-C6, Class C, | | |
| 5.482s, 2039 | 4,186,000 | 3,877,283 |
|
| Merrill Lynch Mortgage Investors, Inc. Ser. 96-C2, Class JS, IO, | | |
| 2.395s, 2028 | 466,677 | 1 |
|
| Merrill Lynch Mortgage Trust | | |
| FRB Ser. 08-C1, Class AJ, 6.248s, 2051 | 4,285,000 | 4,371,129 |
| FRB Ser. 07-C1, Class A2, 5.746s, 2050 | 1,047,515 | 1,066,410 |
| Ser. 04-KEY2, Class D, 5.046s, 2039 | 4,390,000 | 4,049,775 |
|
| Mezz Cap Commercial Mortgage Trust 144A | | |
| Ser. 04-C1, Class X, IO, 8.455s, 2037 | 2,966,291 | 137,339 |
| Ser. 07-C5, Class X, IO, 4.594s, 2049 | 8,106,939 | 572,350 |
|
| Morgan Stanley Bank of America Merrill Lynch Trust 144A | | |
| Ser. 13-C8, Class D, 4.173s, 2048 | 6,644,000 | 6,162,310 |
|
| Morgan Stanley Capital I 144A FRB Ser. 04-RR, | | |
| Class F7, 6s, 2039 | 11,496,823 | 11,022,579 |
|
| N-Star Real Estate CDO, Ltd. 144A FRB Ser. 1A, Class C1A, | | |
| 3.287s, 2038 | 2,016,779 | 1,714,262 |
|
| STRIPS 144A Ser. 03-1A, Class N, 5s, 2018 (Cayman Islands) | 1,590,000 | 1,192,500 |
|
| TIAA Real Estate CDO, Ltd. Ser. 03-1A, Class E, 8s, 2038 | 4,357,727 | 653,659 |
|
| Wachovia Bank Commercial Mortgage Trust | | |
| FRB Ser. 06-C26, Class AJ, 5.995s, 2045 | 15,371,000 | 15,569,286 |
| FRB Ser. 07-C34, Class AJ, 5.969s, 2046 | 8,227,000 | 8,359,455 |
| FRB Ser. 06-C25, Class AJ, 5.734s, 2043 | 5,419,000 | 5,634,676 |
| Ser. 06-C24, Class AJ, 5.658s, 2045 | 5,277,000 | 5,168,294 |
| FRB Ser. 05-C20, Class B, 5.248s, 2042 | 18,287,522 | 18,104,062 |
| FRB Ser. 05-C21, Class D, 5.241s, 2044 | 24,100,000 | 24,257,108 |
| Ser. 07-C34, IO, 0.341s, 2046 | 70,891,947 | 857,793 |
|
| WF-RBS Commercial Mortgage Trust 144A FRB Ser. 13-C11, | | |
| Class D, 4.186s, 2045 | 3,820,000 | 3,507,238 |
|
| | | 428,950,379 |
| Residential mortgage-backed securities (non-agency) (16.8%) | | |
| Adjustable Rate Mortgage Trust FRB Ser. 06-2, Class 1A1, | | |
| 3.224s, 2036 | 9,614,472 | 8,508,807 |
|
| American Home Mortgage Assets Ser. 07-5, Class XP, IO, PO, | | |
| zero %, 2047 | 69,385,308 | 8,811,934 |
|
| Banc of America Funding Corp. | | |
| Ser. 06-2, Class 2A13, 6s, 2036 | 6,763,129 | 7,050,562 |
| FRB Ser. 06-G, Class 2A5, 0.483s, 2036 | 4,814,492 | 4,092,318 |
|
| Banc of America Funding Corp. 144A | | |
| FRB Ser. 09-R12A, Class A2, 3.039s, 2036 | 4,199,445 | 2,876,620 |
| FRB Ser. 10-R4, Class 3A3, 1.281s, 2046 | 12,689,147 | 7,038,670 |
|
| Banc of America Mortgage Securities Ser. 05-11, | | |
| Class 1A10, 6s, 2035 | 5,800,000 | 5,655,000 |
|
| Barclays Capital, LLC Trust | | |
| Ser. 13-RR1, Class 4A3, 20.47s, 2037 | 2,057,079 | 1,764,603 |
| Ser. 13-RR1, Class 3A3, 16.917s, 2037 | 3,055,110 | 2,665,980 |
|
| |
| 22 | Diversified Income Trust |
| | |
| MORTGAGE-BACKED SECURITIES (43.9%)* cont. | Principal amount | Value |
|
| Residential mortgage-backed securities (non-agency) cont. | | |
| Barclays Capital, LLC Trust | | |
| Ser. 13-RR1, Class 10A2, 16.593s, 2036 | $6,381,797 | $5,935,072 |
| Ser. 12-RR10, Class 8A3, 15 3/4s, 2036 | 1,880,269 | 996,543 |
| Ser. 13-RR1, Class 2A4, 11.315s, 2036 | 4,952,337 | 4,949,267 |
| Ser. 13-RR1, Class 9A4, 10.594s, 2036 | 2,307,000 | 2,407,885 |
| Ser. 13-RR1, Class 3A2, 4s, 2037 | 3,331,036 | 3,389,329 |
| Ser. 13-RR1, Class 4A2, 4s, 2037 | 3,552,948 | 3,606,242 |
| Ser. 12-RR10, Class 8A2, 4s, 2036 | 4,097,984 | 4,138,964 |
| Ser. 13-RR1, Class 1A2, 2.874s, 2035 | 5,838,493 | 3,914,418 |
| FRB Ser. 12-RR10, Class 9A2, 2.671s, 2035 | 9,321,295 | 7,550,249 |
| Ser. 12-RR10, Class 4A2, 2.639s, 2036 | 6,490,341 | 5,338,305 |
|
| Barclays Capital, LLC Trust 144A | | |
| Ser. 12-RR11, Class 9A3, 21.132s, 2037 | 5,098,902 | 4,792,968 |
| FRB Ser. 12-RR12, Class 3A3, 20.031s, 2037 | 2,968,747 | 2,449,216 |
| FRB Ser. 12-RR12, Class 2A3, 14.228s, 2035 | 3,115,269 | 3,076,328 |
| Ser. 12-RR11, Class 4A3, 13.64s, 2037 | 3,906,682 | 2,695,611 |
| FRB Ser. 11-RR4, Class 6A4, 13.206s, 2037 | 11,283,387 | 8,913,876 |
| FRB Ser. 12-RR11, Class 5A3, 13.044s, 2037 | 1,583,130 | 1,005,287 |
| FRB Ser. 13-RR2, Class 4A2, 9.391s, 2036 | 3,745,596 | 2,996,477 |
| FRB Ser. 13-RR2, Class 3A2, 9.04s, 2036 | 3,193,000 | 3,134,887 |
| FRB Ser. 13-RR2, Class 6A2, 7.471s, 2037 | 3,339,389 | 2,334,567 |
| FRB Ser. 13-RR2, Class 1A2, 6.015s, 2037 | 6,163,516 | 4,129,556 |
| FRB Ser. 10-RR12, Class 6A1, 5.999s, 2037 | 10,645,131 | 11,257,226 |
| Ser. 12-RR11, Class 9A2, 4s, 2037 | 8,851,603 | 8,895,861 |
| Ser. 12-RR12, Class 3A2, 4s, 2037 | 5,477,863 | 5,532,642 |
| Ser. 12-RR11, Class 4A2, 4s, 2037 | 5,173,842 | 5,212,646 |
| Ser. 12-RR12, Class 1A2, 4s, 2037 | 2,143,187 | 2,164,619 |
| Ser. 12-RR11, Class 3A2, 4s, 2036 | 1,766,185 | 1,770,600 |
| Ser. 12-RR12, Class 2A2, 4s, 2035 | 2,946,295 | 2,983,123 |
| FRB Ser. 12-RR11, Class 5A2, 4s, 2037 | 3,196,909 | 3,244,863 |
| FRB Ser. 12-RR12, Class 5A2, 2.95s, 2036 | 9,808,411 | 7,356,308 |
| FRB Ser. 12-RR12, Class 4A2, 2.859s, 2036 | 5,844,755 | 3,331,510 |
| FRB Ser. 09-RR6, Class 1A2, 2.47s, 2035 | 7,751,421 | 5,757,600 |
| Ser. 09-RR7, Class 1A7, IO, 1.83s, 2046 | 394,740,807 | 17,763,336 |
| Ser. 09-RR7, Class 2A7, IO, 1.636s, 2047 | 360,336,856 | 14,881,912 |
|
| Bear Stearns Adjustable Rate Mortgage Trust FRB Ser. 06-1, | | |
| Class A1, 2.37s, 2036 | 3,428,595 | 3,325,737 |
|
| Bear Stearns Asset Backed Securities, Inc. FRB Ser. 04-FR3, | | |
| Class M6, 5.079s, 2034 | 265,627 | 22,605 |
|
| Bear Stearns Mortgage Funding Trust | | |
| Ser. 06-AR2, Class 1X, IO, 0.7s, 2046 | 63,890,330 | 2,057,269 |
| Ser. 06-AR3, Class 1X, IO, 0.4s, 2036 | 48,072,955 | 884,542 |
|
| Citigroup Mortgage Loan Trust, Inc. 144A | | |
| FRB Ser. 11-2, Class 3A2, 10.044s, 2037 | 6,434,161 | 6,063,232 |
| FRB Ser. 11-12, Class 2A2, 0.574s, 2035 | 8,520,000 | 6,499,482 |
|
| Countrywide Alternative Loan Trust Ser. 07-HY9, Class X, IO, | | |
| 0.65s, 2047 | 48,339,258 | 2,157,381 |
|
| |
| Diversified Income Trust | 23 |
| | | |
| MORTGAGE-BACKED SECURITIES (43.9%)* cont. | | Principal amount | Value |
|
| Residential mortgage-backed securities (non-agency) cont. | | | |
| Credit Suisse Commercial Mortgage Trust 144A FRB Ser. 08-4R, | | | |
| Class 3A4, 2.83s, 2038 | | $6,487,000 | $5,603,490 |
|
| Granite Mortgages PLC | | | |
| FRB Ser. 03-2, Class 3C, 3.061s, 2043 (United Kingdom) | GBP | 2,706,624 | 3,528,592 |
| FRB Ser. 03-2, Class 2C1, 2.754s, 2043 (United Kingdom) | EUR | 7,263,000 | 7,988,050 |
|
| Green Tree Financial Corp. Ser. 95-F, Class B2, 7.1s, 2021 | | $53,176 | 52,235 |
|
| Green Tree Home Improvement Loan Trust Ser. 95-D, Class B2, | | | |
| 7.45s, 2025 | | 50,102 | 45,523 |
|
| GSR Mortgage Loan Trust FRB Ser. 05-AR4, Class 3A5, | | | |
| 2.759s, 2035 | | 4,000,000 | 3,672,280 |
|
| Harborview Mortgage Loan Trust FRB Ser. 05-9, Class 2A1C, | | | |
| 0.653s, 2035 | | 5,962,674 | 5,381,313 |
|
| JPMorgan Mortgage Trust FRB Ser. 07-A1, Class 3A4, | | | |
| 3.03s, 2035 | | 4,770,814 | 3,809,299 |
|
| Merrill Lynch Alternative Note Asset Ser. 07-OAR5, Class X, IO, | | | |
| PO, 0.8s, 2047 | | 34,081,693 | 1,090,614 |
|
| Mortgage IT Trust FRB Ser. 05-3, Class A2, 0.554s, 2035 | | 8,618,278 | 7,239,353 |
|
| Nomura Resecuritization Trust 144A FRB Ser. 11-2RA, | | | |
| Class 1A2, 5.29s, 2046 | | 13,681,966 | 13,084,064 |
|
| Residential Accredit Loans, Inc. Ser. 05-QR1, Class A, 6s, 2034 | | 26,855,908 | 28,607,612 |
|
| Structured Asset Mortgage Investments Trust Ser. 07-AR6, | | | |
| Class X2, IO, 1/2s, 2047 | | 130,802,723 | 3,113,105 |
|
| WAMU Mortgage Pass-Through Certificates | | | |
| FRB Ser. 07-HY6, Class 2A1, 4.725s, 2037 | | 23,570,298 | 19,916,902 |
| FRB Ser. 06-AR7, Class 3A1B, 2.462s, 2046 | | 5,674,447 | 3,475,599 |
| FRB Ser. 04-AR14, Class B1, 2.441s, 2035 | | 6,769,156 | 4,146,108 |
| Ser. 05-AR17, Class X, IO, PO, 1.63s, 2045 | | 140,481,255 | 9,142,941 |
| Ser. 04-AR10, Class X, IO, PO, 1.61s, 2044 | | 44,943,801 | 2,669,887 |
| FRB Ser. 06-AR1, Class 2A1B, 1.247s, 2046 | | 17,310,949 | 14,930,694 |
| FRB Ser. 06-AR1, Class 2A1C, 1.247s, 2046 | | 17,180,538 | 10,050,615 |
| FRB Ser. 06-AR9, Class 1A, 1.177s, 2046 | | 26,201,495 | 21,485,226 |
| FRB Ser. 06-AR4, Class 1A1B, 1.117s, 2046 | | 7,969,723 | 5,977,292 |
| Ser. 06-AR11, Class 2XPP, IO, PO, 0.978s, 2046 | | 96,073,251 | 2,750,577 |
| FRB Ser. 05-AR8, Class B1, 0.874s, 2045 | | 26,903,280 | 12,644,542 |
| FRB Ser. 05-AR19, Class A1C3, 0.704s, 2045 | | 12,973,240 | 10,119,127 |
| FRB Ser. 05-AR13, Class A1C3, 0.694s, 2045 | | 39,243,095 | 30,805,829 |
| FRB Ser. 05-AR17, Class A1C3, 0.684s, 2045 | | 7,854,633 | 4,241,502 |
| FRB Ser. 05-AR15, Class A1C3, 0.684s, 2045 | | 10,823,194 | 5,628,061 |
| FRB Ser. 05-AR8, Class 2AC2, 0.664s, 2045 | | 12,279,198 | 10,652,205 |
| FRB Ser. 05-AR11, Class A1B2, 0.654s, 2045 | | 7,298,727 | 6,386,386 |
| FRB Ser. 05-AR13, Class A1B2, 0.634s, 2045 | | 9,082,037 | 7,901,372 |
| FRB Ser. 05-AR17, Class A1B2, 0.614s, 2045 | | 1,886,419 | 1,575,160 |
| FRB Ser. 05-AR19, Class A1C4, 0.604s, 2045 | | 4,968,626 | 3,838,263 |
| FRB Ser. 05-AR11, Class A1B3, 0.604s, 2045 | | 14,140,004 | 12,372,504 |
| FRB Ser. 05-AR8, Class 2AC3, 0.594s, 2045 | | 4,256,300 | 3,671,059 |
| FRB Ser. 05-AR1, Class A1B, 0.594s, 2045 | | 6,717,237 | 5,541,721 |
| FRB Ser. 05-AR19, Class A1B3, 0.554s, 2045 | | 3,952,128 | 3,477,872 |
| FRB Ser. 05-AR6, Class 2AB3, 0.474s, 2045 | | 4,214,854 | 3,666,923 |
|
| |
| 24 | Diversified Income Trust |
| | |
| MORTGAGE-BACKED SECURITIES (43.9%)* cont. | Principal amount | Value |
|
| Residential mortgage-backed securities (non-agency) cont. | | |
| Wells Fargo Mortgage Backed Securities Trust | | |
| Ser. 05-16, Class A18, 6s, 2036 | $6,180,000 | $6,450,684 |
| Ser. 08-1, Class 4A1, 5 3/4s, 2038 | 10,092,719 | 10,698,515 |
| Ser. 07-12, Class A7, 5 1/2s, 2037 | 3,103,516 | 3,235,415 |
| Ser. 07-5, Class 1A1, 5 1/2s, 2037 | 14,732,680 | 15,501,726 |
| FRB Ser. 06-AR11, Class A6, 5.165s, 2036 | 7,359,339 | 6,861,333 |
| FRB Ser. 05-AR6, Class B1, 5.002s, 2035 | 5,623,647 | 5,050,400 |
| FRB Ser. 05-AR16, Class 4A2, 2.651s, 2035 | 4,842,847 | 4,752,286 |
| FRB Ser. 06-AR2, Class 2A3, 2.641s, 2036 | 5,737,682 | 5,622,928 |
|
| | | 595,839,219 |
| | | |
| Total mortgage-backed securities (cost $1,451,676,845) | | $1,549,396,925 |
| |
| |
| CORPORATE BONDS AND NOTES (37.8%)* | Principal amount | Value |
|
| Basic materials (2.7%) | | |
| ArcelorMittal sr. unsec. bonds 10.35s, 2019 (France) | $1,275,000 | $1,613,855 |
|
| ArcelorMittal sr. unsec. unsub. notes 7 1/2s, 2039 (France) | 1,290,000 | 1,325,475 |
|
| Ashland, Inc. 144A company guaranty sr. unsec. unsub. notes | | |
| 4 3/4s, 2022 | 1,050,000 | 1,068,375 |
|
| Ashland, Inc. 144A sr. unsec. notes 4 3/4s, 2022 | 1,871,000 | 1,894,388 |
|
| Ashland, Inc. 144A sr. unsec. unsub. notes 3s, 2016 | 3,880,000 | 3,938,200 |
|
| Atkore International, Inc. company guaranty sr. notes | | |
| 9 7/8s, 2018 | 3,422,000 | 3,755,645 |
|
| Axiall Corp. 144A company guaranty sr. unsec. notes | | |
| 4 7/8s, 2023 | 155,000 | 157,713 |
|
| Boise Cascade LLC/Boise Cascade Finance Corp. 144A sr. | | |
| unsec. notes 6 3/8s, 2020 (United Kingdom) | 280,000 | 296,100 |
|
| Celanese US Holdings, LLC company guaranty sr. unsec. unsub. | | |
| notes 4 5/8s, 2022 (Germany) | 990,000 | 992,475 |
|
| Celanese US Holdings, LLC sr. notes 5 7/8s, 2021 (Germany) | 2,735,000 | 2,981,150 |
|
| Cemex Finance, LLC 144A company guaranty sr. bonds | | |
| 9 1/2s, 2016 | 2,360,000 | 2,554,700 |
|
| Cemex Finance, LLC 144A company guaranty sr. notes | | |
| 9 3/8s, 2022 | 955,000 | 1,110,188 |
|
| CEMEX SAB de CV 144A company guaranty sr. notes 9 1/2s, | | |
| 2018 (Mexico) | 845,000 | 982,313 |
|
| CEMEX SAB de CV 144A company guaranty sr. notes 5 7/8s, | | |
| 2019 (Mexico) | 580,000 | 585,800 |
|
| Compass Minerals International, Inc. company guaranty sr. | | |
| unsec. notes 8s, 2019 | 103,000 | 111,755 |
|
| Eagle Spinco, Inc. 144A company guaranty sr. unsec. notes | | |
| 4 5/8s, 2021 | 1,830,000 | 1,862,025 |
|
| Edgen Murray Corp. 144A company guaranty sr. notes | | |
| 8 3/4s, 2020 | 940,000 | 975,250 |
|
| Ferro Corp. sr. unsec. notes 7 7/8s, 2018 | 1,674,000 | 1,736,775 |
|
| FMG Resources August 2006 Pty, Ltd. 144A sr. notes 7s, | | |
| 2015 (Australia) | 2,579,000 | 2,695,055 |
|
| FMG Resources August 2006 Pty, Ltd. 144A sr. notes 6 7/8s, | | |
| 2018 (Australia) | 2,302,000 | 2,422,855 |
|
| FMG Resources August 2006 Pty, Ltd. 144A sr. unsec. notes | | |
| 6 7/8s, 2022 (Australia) | 1,125,000 | 1,178,438 |
|
| |
| Diversified Income Trust | 25 |
| | | |
| CORPORATE BONDS AND NOTES (37.8%)* cont. | | Principal amount | Value |
|
| Basic materials cont. | | | |
| Graphic Packaging International, Inc. company guaranty sr. | | | |
| unsec. notes 4 3/4s, 2021 | | $290,000 | $294,350 |
|
| Grohe Holding GmbH 144A company company guaranty sr. | | | |
| FRN notes 4.203s, 2017 (Germany) | EUR | 3,548,000 | 4,543,550 |
|
| HD Supply, Inc. company guaranty sr. unsec. unsub. notes | | | |
| 11 1/2s, 2020 | | $2,984,000 | 3,536,040 |
|
| HD Supply, Inc. company guaranty sr. unsec. sub. notes | | | |
| 10 1/2s, 2021 | | 814,000 | 846,560 |
|
| HD Supply, Inc. 144A sr. unsec. notes 7 1/2s, 2020 | | 1,400,000 | 1,473,500 |
|
| Hexion U.S. Finance Corp. 144A sr. notes 6 5/8s, 2020 | | 1,980,000 | 1,984,950 |
|
| Hexion U.S. Finance Corp./Hexion Nova Scotia Finance, ULC | | | |
| company guaranty sr. notes 8 7/8s, 2018 | | 1,725,000 | 1,785,375 |
|
| Hexion U.S. Finance Corp./Hexion Nova Scotia Finance, ULC | | | |
| 144A company guaranty sr. notes 8 7/8s, 2018 | | 424,000 | 439,900 |
|
| Huntsman International, LLC company guaranty sr. unsec. sub. | | | |
| notes 8 5/8s, 2021 | | 2,841,000 | 3,196,125 |
|
| Huntsman International, LLC company guaranty sr. unsec. sub. | | | |
| notes 8 5/8s, 2020 | | 1,100,000 | 1,229,250 |
|
| Huntsman International, LLC company guaranty sr. unsec. | | | |
| unsub. notes 4 7/8s, 2020 | | 995,000 | 1,002,463 |
|
| Huntsman International, LLC 144A sr. unsec. notes 4 7/8s, 2020 | | 660,000 | 664,950 |
|
| IAMGOLD Corp. 144A company guaranty sr. unsec. notes | | | |
| 6 3/4s, 2020 (Canada) | | 591,000 | 568,838 |
|
| INEOS Finance PLC 144A company guaranty sr. notes 9s, 2015 | | | |
| (United Kingdom) | | 140,000 | 147,350 |
|
| INEOS Finance PLC 144A company guaranty sr. notes 7 1/2s, | | | |
| 2020 (United Kingdom) | | 1,205,000 | 1,310,438 |
|
| JM Huber Corp. 144A sr. unsec. notes 9 7/8s, 2019 | | 2,472,000 | 2,790,270 |
|
| Louisiana-Pacific Corp. company guaranty sr. unsec. unsub. | | | |
| notes 7 1/2s, 2020 | | 1,614,000 | 1,835,925 |
|
| LyondellBasell Industries NV sr. unsec. notes 6s, 2021 | | 2,490,000 | 2,950,650 |
|
| LyondellBasell Industries NV sr. unsec. unsub. notes | | | |
| 5 3/4s, 2024 | | 2,335,000 | 2,737,788 |
|
| LyondellBasell Industries NV sr. unsec. unsub. notes 5s, 2019 | | 4,200,000 | 4,746,000 |
|
| Momentive Performance Materials, Inc. company guaranty sr. | | | |
| notes 10s, 2020 | | 392,000 | 392,000 |
|
| Momentive Performance Materials, Inc. company guaranty sr. | | | |
| notes 8 7/8s, 2020 | | 750,000 | 774,375 |
|
| New Gold, Inc. 144A sr. unsec. notes 6 1/4s, 2022 (Canada) | | 794,000 | 834,018 |
|
| Novelis, Inc. company guaranty sr. unsec. notes 8 3/4s, 2020 | | 1,585,000 | 1,787,088 |
|
| Nufarm Australia Ltd. 144A company guaranty sr. notes 6 3/8s, | | | |
| 2019 (Australia) | | 548,000 | 579,510 |
|
| Orion Engineered Carbons Bondco GmbH 144A company | | | |
| guaranty sr. notes 9 5/8s, 2018 (Germany) | | 154,000 | 171,325 |
|
| Perstorp Holding AB 144A company guaranty sr. notes 8 3/4s, | | | |
| 2017 (Sweden) | | 1,560,000 | 1,649,700 |
|
| PetroLogistics LP/Petrologistics Finance Corp. 144A company | | | |
| guaranty sr. unsec. notes 6 1/4s, 2020 | | 290,000 | 293,625 |
|
| PolyOne Corp. 144A sr. unsec. notes 5 1/4s, 2023 | | 1,325,000 | 1,334,938 |
|
| PQ Corp. 144A sr. notes 8 3/4s, 2018 | | 1,255,000 | 1,342,850 |
|
| |
| 26 | Diversified Income Trust |
| | | |
| CORPORATE BONDS AND NOTES (37.8%)* cont. | | Principal amount | Value |
|
| Basic materials cont. | | | |
| Roofing Supply Group, LLC/Roofing Supply Finance, Inc. 144A | | | |
| company guaranty sr. unsec. notes 10s, 2020 | | $435,000 | $491,550 |
|
| Ryerson, Inc./Joseph T Ryerson & Son, Inc. 144A company | | | |
| guaranty sr. notes 9s, 2017 | | 1,304,000 | 1,424,620 |
|
| Sealed Air Corp. 144A sr. unsec. notes 6 1/2s, 2020 | | 909,000 | 991,946 |
|
| Sealed Air Corp. 144A sr. unsec. notes 5 1/4s, 2023 | | 1,065,000 | 1,071,656 |
|
| Smurfit Kappa Acquisitions 144A company guaranty sr. notes | | | |
| 4 7/8s, 2018 (Ireland) | | 675,000 | 688,945 |
|
| Smurfit Kappa Treasury company guaranty sr. unsec. unsub. | | | |
| debs 7 1/2s, 2025 (Ireland) | | 82,000 | 90,200 |
|
| Steel Dynamics, Inc. 144A company guaranty sr. unsec. notes | | | |
| 6 3/8s, 2022 | | 305,000 | 329,400 |
|
| Steel Dynamics, Inc. 144A company guaranty sr. unsec. notes | | | |
| 6 1/8s, 2019 | | 405,000 | 437,400 |
|
| Steel Dynamics, Inc. 144A company guaranty sr. unsec. notes | | | |
| 5 1/4s, 2023 | | 190,000 | 190,950 |
|
| TPC Group, Inc. 144A company guaranty sr. notes 8 3/4s, 2020 | | 1,340,000 | 1,396,950 |
|
| Tronox Finance, LLC 144A company guaranty sr. unsec. notes | | | |
| 6 3/8s, 2020 | | 2,730,000 | 2,648,100 |
|
| US Coatings Acquisition, Inc./Flash Dutch 2 BV 144A company | | | |
| guaranty sr. unsec. notes 7 3/8s, 2021 (Netherlands) | | 445,000 | 468,363 |
|
| US Coatings Acquisition, Inc./Flash Dutch 2 BV 144A company | | | |
| guaranty sr. notes 5 3/4s, 2021 (Netherlands) | | 320,000 | 419,422 |
|
| USG Corp. sr. unsec. notes 9 3/4s, 2018 | | 1,317,000 | 1,560,645 |
|
| Weekley Homes, LLC/Weekley Finance Corp. 144A sr. unsec. | | | |
| notes 6s, 2023 | | 505,000 | 520,150 |
|
| | | | 94,212,528 |
| Capital goods (2.2%) | | | |
| ADS Waste Holdings, Inc. 144A sr. notes 8 1/4s, 2020 | | 2,255,000 | 2,429,763 |
|
| American Axle & Manufacturing, Inc. company guaranty sr. | | | |
| unsec. notes 7 3/4s, 2019 | | 3,121,000 | 3,440,903 |
|
| ARD Finance SA 144A sr. notes 11 1/8s, 2018 (Luxembourg) ‡‡ | | 1,027,300 | 1,119,757 |
|
| ARD Finance SA 144A sr. notes 11 1/8s, 2018 (Luxembourg) ‡‡ | EUR | 791,139 | 1,101,976 |
|
| Ardagh Packaging Finance PLC sr. notes Ser. REGS, 7 3/8s, | | | |
| 2017 (Ireland) | EUR | 500,000 | 690,815 |
|
| Ardagh Packaging Finance PLC 144A company guaranty sr. | | | |
| notes 7 3/8s, 2017 (Ireland) | EUR | 685,000 | 946,417 |
|
| Ardagh Packaging Finance PLC/Ardagh MP Holdings USA, Inc. | | | |
| 144A company guaranty sr. notes 7 3/8s, 2017 (Ireland) | | $250,000 | 273,750 |
|
| Ardagh Packaging Finance PLC/Ardagh MP Holdings USA, Inc. | | | |
| 144A sr. unsec. notes 7s, 2020 (Ireland) | | 1,450,000 | 1,493,500 |
|
| Ardagh Packaging Finance PLC/Ardagh MP Holdings USA, Inc. | | | |
| 144A sr. notes 4 7/8s, 2022 (Ireland) | | 735,000 | 727,650 |
|
| B/E Aerospace, Inc. sr. unsec. unsub. notes 6 7/8s, 2020 | | 4,330,000 | 4,790,063 |
|
| B/E Aerospace, Inc. sr. unsec. unsub. notes 5 1/4s, 2022 | | 1,425,000 | 1,473,094 |
|
| Berry Plastics Corp. company guaranty notes 9 1/2s, 2018 | | 1,194,000 | 1,332,803 |
|
| BOE Merger Corp. 144A sr. unsec. notes 9 1/2s, 2017 ‡‡ | | 650,000 | 697,125 |
|
| Bombardier, Inc. 144A sr. notes 6 1/8s, 2023 (Canada) | | 455,000 | 470,925 |
|
| Bombardier, Inc. 144A sr. notes 4 1/4s, 2016 (Canada) | | 1,091,000 | 1,131,913 |
|
| Briggs & Stratton Corp. company guaranty sr. unsec. notes | | | |
| 6 7/8s, 2020 | | 3,139,000 | 3,515,680 |
|
| |
| Diversified Income Trust | 27 |
| | | |
| CORPORATE BONDS AND NOTES (37.8%)* cont. | | Principal amount | Value |
|
| Capital goods cont. | | | |
| Consolidated Container Co. LLC/Consolidated Container | | | |
| Capital, Inc. 144A company guaranty sr. unsec. notes | | | |
| 10 1/8s, 2020 | | $181,000 | $198,195 |
|
| Crown Americas LLC/Crown Americas Capital Corp. IV 144A | | | |
| company guaranty sr. unsec. notes 4 1/2s, 2023 | | 540,000 | 525,150 |
|
| Crown Euro Holdings SA 144A sr. notes 7 1/8s, 2018 (France) | EUR | 475,000 | 660,262 |
|
| Delphi Corp. company guaranty sr. unsec. unsub. notes 5s, 2023 | | $1,390,000 | 1,466,450 |
|
| Dematic SA/DH Services Luxembourg Sarl 144A company | | | |
| guaranty sr. unsec. notes 7 3/4s, 2020 (Luxembourg) | | 1,875,000 | 1,950,000 |
|
| Exide Technologies sr. notes 8 5/8s, 2018 | | 572,000 | 491,205 |
|
| GrafTech International, Ltd. 144A company guaranty sr. unsec. | | | |
| notes 6 3/8s, 2020 | | 1,808,000 | 1,871,280 |
|
| KION Finance SA 144A sr. notes 6 3/4s, 2020 (Luxembourg) | | 590,000 | 807,448 |
|
| Kratos Defense & Security Solutions, Inc. company guaranty sr. | | | |
| notes 10s, 2017 | | 2,585,000 | 2,843,500 |
|
| Legrand France SA sr. unsec. unsub. debs 8 1/2s, 2025 (France) | | 3,324,000 | 4,451,603 |
|
| Manitowoc Co., Inc. (The) company guaranty sr. unsec. notes | | | |
| 5 7/8s, 2022 | | 1,838,000 | 1,929,900 |
|
| MasTec, Inc. company guaranty sr. unsec. unsub. notes | | | |
| 4 7/8s, 2023 | | 670,000 | 664,138 |
|
| Milacron LLC/Mcron Finance Corp. 144A sr. unsec. notes | | | |
| 7 3/4s, 2021 | | 290,000 | 299,788 |
|
| Mueller Water Products, Inc. company guaranty sr. unsec. | | | |
| unsub. notes 8 3/4s, 2020 | | 864,000 | 982,800 |
|
| Pittsburgh Glass Works, LLC 144A sr. notes 8 1/2s, 2016 | | 3,373,000 | 3,432,028 |
|
| Polypore International, Inc. company guaranty sr. unsec. notes | | | |
| 7 1/2s, 2017 | | 1,445,000 | 1,549,763 |
|
| Rexam PLC unsec. sub. FRB bonds 6 3/4s, 2067 | | | |
| (United Kingdom) | EUR | 560,000 | 751,381 |
|
| Rexel SA company guaranty sr. unsec. notes 8 1/4s, | | | |
| 2016 (France) | EUR | 1,019,000 | 1,420,747 |
|
| Rexel SA 144A company guaranty sr. unsec. unsub. notes | | | |
| 6 1/8s, 2019 (France) | | $2,425,000 | 2,564,438 |
|
| Reynolds Group Issuer, Inc./Reynolds Group Issuer, LLC/ | | | |
| Reynolds Group Issuer Lu company guaranty sr. unsec. unsub. | | | |
| notes 9 7/8s, 2019 | | 885,000 | 969,075 |
|
| Reynolds Group Issuer, Inc./Reynolds Group Issuer, LLC/ | | | |
| Reynolds Group Issuer Lu company guaranty sr. unsec. unsub. | | | |
| notes 9s, 2019 | | 3,375,000 | 3,569,063 |
|
| Reynolds Group Issuer, Inc./Reynolds Group Issuer, LLC/ | | | |
| Reynolds Group Issuer Lu company guaranty sr. unsec. unsub. | | | |
| notes 8 1/4s, 2021 | | 680,000 | 700,400 |
|
| Reynolds Group Issuer, Inc./Reynolds Group Issuer, LLC/ | | | |
| Reynolds Group Issuer Lu company guaranty sr. notes | | | |
| 7 7/8s, 2019 | | 1,325,000 | 1,460,813 |
|
| Reynolds Group Issuer, Inc./Reynolds Group Issuer, LLC/ | | | |
| Reynolds Group Issuer Lu company guaranty sr. notes | | | |
| 5 3/4s, 2020 | | 965,000 | 983,094 |
|
| Silver II Borrower/Silver II US Holdings, LLC 144A company | | | |
| guaranty sr. unsec. unsub. notes 7 3/4s, 2020 (Luxembourg) | | 525,000 | 559,125 |
|
| |
| 28 | Diversified Income Trust |
| | |
| CORPORATE BONDS AND NOTES (37.8%)* cont. | Principal amount | Value |
|
| Capital goods cont. | | |
| Tenneco, Inc. company guaranty sr. unsec. unsub. notes | | |
| 7 3/4s, 2018 | $2,190,000 | $2,409,000 |
|
| Tenneco, Inc. company guaranty sr. unsub. notes 6 7/8s, 2020 | 1,830,000 | 2,010,713 |
|
| Terex Corp. company guaranty sr. unsec. unsub. notes | | |
| 6 1/2s, 2020 | 415,000 | 442,494 |
|
| Terex Corp. company guaranty sr. unsec. unsub. notes 6s, 2021 | 1,980,000 | 2,086,425 |
|
| Thermadyne Holdings Corp. company guaranty sr. | | |
| notes 9s, 2017 | 3,154,000 | 3,437,860 |
|
| Thermon Industries, Inc. company guaranty sr. notes | | |
| 9 1/2s, 2017 | 1,893,000 | 2,101,230 |
|
| TransDigm, Inc. company guaranty unsec. sub. notes | | |
| 7 3/4s, 2018 | 2,171,000 | 2,382,673 |
|
| Triumph Group, Inc. 144A sr. unsec. notes 4 7/8s, 2021 | 1,395,000 | 1,408,950 |
|
| | | 79,017,125 |
| Communication services (5.2%) | | |
| Altice Finco SA 144A sr. unsec. notes 9 7/8s, | | |
| 2020 (Luxembourg) | 910,000 | 1,019,200 |
|
| Bresnan Broadband Holdings, LLC 144A company guaranty sr. | | |
| unsec. unsub. notes 8s, 2018 | 847,000 | 923,230 |
|
| Cablevision Systems Corp. sr. unsec. unsub. notes 8 5/8s, 2017 | 1,483,000 | 1,727,695 |
|
| Cablevision Systems Corp. sr. unsec. unsub. notes 7 3/4s, 2018 | 179,000 | 200,704 |
|
| CCO Holdings, LLC/CCO Holdings Capital Corp. company | | |
| guaranty sr. unsec. notes 6 1/2s, 2021 | 1,634,000 | 1,725,913 |
|
| CCO Holdings, LLC/CCO Holdings Capital Corp. company | | |
| guaranty sr. unsec. unsub. notes 5 1/8s, 2023 | 630,000 | 613,463 |
|
| CCO Holdings, LLC/CCO Holdings Capital Corp. company | | |
| guaranty sr. unsub. notes 7s, 2019 | 3,076,000 | 3,314,390 |
|
| CenturyLink, Inc. sr. unsec. unsub. notes 5 5/8s, 2020 | 380,000 | 388,550 |
|
| Cequel Communications Escrow Capital Corp. 144A sr. unsec. | | |
| notes 6 3/8s, 2020 | 375,000 | 389,063 |
|
| Cincinnati Bell, Inc. company guaranty sr. unsec. notes | | |
| 8 3/8s, 2020 | 531,000 | 552,240 |
|
| Cincinnati Bell, Inc. company guaranty sr. unsec. sub. notes | | |
| 8 3/4s, 2018 | 302,000 | 300,490 |
|
| Cincinnati Bell, Inc. company guaranty sr. unsec. sub. notes | | |
| 8 1/4s, 2017 | 2,017,000 | 2,138,020 |
|
| Clearwire Communications, LLC/Clearwire Finance, Inc. 144A | | |
| company guaranty sr. notes 12s, 2015 | 3,103,000 | 3,347,361 |
|
| Cricket Communications, Inc. company guaranty sr. unsec. | | |
| notes 7 3/4s, 2020 | 2,501,000 | 2,494,748 |
|
| Cricket Communications, Inc. company guaranty sr. unsub. | | |
| notes 7 3/4s, 2016 | 3,523,000 | 3,677,131 |
|
| Crown Castle International Corp. sr. unsec. notes 7 1/8s, 2019 | 950,000 | 1,037,875 |
|
| Crown Castle International Corp. sr. unsec. notes 5 1/4s, 2023 | 1,255,000 | 1,276,963 |
|
| CSC Holdings, LLC sr. unsec. unsub. notes 6 3/4s, 2021 | 2,275,000 | 2,559,375 |
|
| Digicel, Ltd. 144A sr. unsec. notes 8 1/4s, 2017 (Jamaica) | 3,373,000 | 3,566,948 |
|
| DISH DBS Corp. company guaranty notes 7 1/8s, 2016 | 1,370,000 | 1,522,413 |
|
| DISH DBS Corp. company guaranty notes 6 5/8s, 2014 | 3,500,000 | 3,723,125 |
|
| DISH DBS Corp. company guaranty sr. unsec. notes 6 3/4s, 2021 | 2,657,000 | 2,949,270 |
|
| Equinix, Inc. sr. unsec. notes 7s, 2021 | 1,840,000 | 2,037,800 |
|
| |
| Diversified Income Trust | 29 |
| | | |
| CORPORATE BONDS AND NOTES (37.8%)* cont. | | Principal amount | Value |
|
| Communication services cont. | | | |
| Frontier Communications Corp. sr. unsec. notes 9 1/4s, 2021 | | $620,000 | $711,450 |
|
| Frontier Communications Corp. sr. unsec. notes 8 1/4s, 2017 | | 710,000 | 830,700 |
|
| Frontier Communications Corp. sr. unsec. notes 8 1/8s, 2018 | | 4,695,000 | 5,340,563 |
|
| Frontier Communications Corp. sr. unsec. unsub. notes | | | |
| 7 5/8s, 2024 | | 475,000 | 489,250 |
|
| Hughes Satellite Systems Corp. company guaranty sr. notes | | | |
| 6 1/2s, 2019 | | 1,949,000 | 2,139,028 |
|
| Hughes Satellite Systems Corp. company guaranty sr. unsec. | | | |
| notes 7 5/8s, 2021 | | 3,202,000 | 3,662,288 |
|
| Inmarsat Finance PLC 144A company guaranty sr. notes 7 3/8s, | | | |
| 2017 (United Kingdom) | | 4,928,000 | 5,248,320 |
|
| Intelsat Jackson Holdings SA company guaranty sr. unsec. notes | | | |
| 7 1/2s, 2021 (Bermuda) | | 1,949,000 | 2,168,263 |
|
| Intelsat Jackson Holdings SA 144A sr. unsec. notes 6 5/8s, | | | |
| 2022 (Bermuda) | | 770,000 | 815,238 |
|
| Intelsat Luxembourg SA company guaranty sr. unsec. notes | | | |
| 11 1/2s, 2017 (Luxembourg) | | 7,278,093 | 7,729,335 |
|
| Intelsat Luxembourg SA company guaranty sr. unsec. notes | | | |
| 11 1/4s, 2017 (Luxembourg) | | 2,801,000 | 2,983,065 |
|
| Intelsat Luxembourg SA 144A company guaranty sr. unsec. | | | |
| notes 8 1/8s, 2023 (Luxembourg) ## | | 1,190,000 | 1,209,338 |
|
| Intelsat Luxembourg SA 144A sr. unsec. notes 7 3/4s, 2021 | | | |
| (Luxembourg) ## | | 3,378,000 | 3,437,115 |
|
| Intelsat Luxembourg SA 144A sr. unsec. notes 6 3/4s, 2018 | | | |
| (Luxembourg) ## | | 2,470,000 | 2,544,100 |
|
| Kabel Deutschland GmbH 144A sr. bonds 6 1/2s, | | | |
| 2018 (Germany) | EUR | 1,560,000 | 2,129,007 |
|
| Level 3 Financing, Inc. company guaranty sr. unsec. unsub. | | | |
| notes 9 3/8s, 2019 | | $1,699,000 | 1,904,919 |
|
| Level 3 Financing, Inc. company guaranty sr. unsec. unsub. | | | |
| notes 8 5/8s, 2020 | | 1,493,000 | 1,664,695 |
|
| Level 3 Financing, Inc. company guaranty sr. unsec. unsub. | | | |
| notes 8 1/8s, 2019 | | 515,000 | 566,500 |
|
| Level 3 Financing, Inc. 144A company guaranty sr. unsec. unsub. | | | |
| notes 7s, 2020 | | 183,000 | 191,693 |
|
| Lynx I Corp. 144A sr. notes 6s, 2021 | | 2,160,000 | 3,372,267 |
|
| Mediacom, LLC/Mediacom Capital Corp. sr. unsec. notes | | | |
| 9 1/8s, 2019 | | 386,000 | 430,873 |
|
| MetroPCS Wireless, Inc. company guaranty sr. unsec. notes | | | |
| 7 7/8s, 2018 | | 4,456,000 | 4,879,320 |
|
| MetroPCS Wireless, Inc. 144A company guaranty sr. unsec. | | | |
| unsub. notes 6 5/8s, 2023 | | 2,090,000 | 2,131,800 |
|
| MetroPCS Wireless, Inc. 144A company guaranty sr. unsec. | | | |
| unsub. notes 6 1/4s, 2021 | | 1,900,000 | 1,933,250 |
|
| NII Capital Corp. company guaranty sr. unsec. unsub. | | | |
| notes 10s, 2016 | | 3,892,000 | 3,493,070 |
|
| NII Capital Corp. company guaranty sr. unsec. unsub. notes | | | |
| 8 7/8s, 2019 | | 353,000 | 265,633 |
|
| NII Capital Corp. company guaranty sr. unsec. unsub. notes | | | |
| 7 5/8s, 2021 | | 1,502,000 | 1,081,440 |
|
| |
| 30 | Diversified Income Trust |
| | | |
| CORPORATE BONDS AND NOTES (37.8%)* cont. | | Principal amount | Value |
|
| Communication services cont. | | | |
| NII International Telecom Sarl 144A company guaranty sr. unsec. | | | |
| notes 11 3/8s, 2019 (Luxembourg) | | $525,000 | $548,625 |
|
| PAETEC Holding Corp. company guaranty sr. unsec. notes | | | |
| 9 7/8s, 2018 | | 3,202,000 | 3,674,295 |
|
| Phones4U Finance PLC 144A sr. notes 9 1/2s, 2018 | | | |
| (United Kingdom) | GBP | 2,520,000 | 3,982,174 |
|
| Quebecor Media, Inc. 144A sr. unsec. notes 5 3/4s, | | | |
| 2023 (Canada) | | $1,638,000 | 1,670,760 |
|
| Qwest Corp. sr. unsec. notes 7 1/2s, 2014 | | 610,000 | 664,878 |
|
| Qwest Corp. sr. unsec. unsub. notes 7 1/4s, 2025 | | 1,375,000 | 1,561,929 |
|
| SBA Telecommunications, Inc. company guaranty sr. unsec. | | | |
| notes 8 1/4s, 2019 | | 2,503,000 | 2,759,558 |
|
| SBA Telecommunications, Inc. 144A company guaranty sr. | | | |
| unsec. unsub. notes 5 3/4s, 2020 | | 520,000 | 540,800 |
|
| Sprint Capital Corp. company guaranty 8 3/4s, 2032 | | 1,134,000 | 1,352,295 |
|
| Sprint Capital Corp. company guaranty 6 7/8s, 2028 | | 3,610,000 | 3,691,225 |
|
| Sprint Nextel Corp. sr. notes 8 3/8s, 2017 | | 4,280,000 | 4,980,850 |
|
| Sprint Nextel Corp. sr. unsec. notes 6s, 2016 | | 1,886,000 | 2,046,310 |
|
| Sprint Nextel Corp. sr. unsec. unsub. notes 9 1/8s, 2017 | | 1,625,000 | 1,921,563 |
|
| Sprint Nextel Corp. sr. unsec. unsub. notes 7s, 2020 | | 1,152,000 | 1,267,200 |
|
| Sprint Nextel Corp. 144A company guaranty sr. unsec. | | | |
| notes 9s, 2018 | | 4,027,000 | 4,978,379 |
|
| Sunrise Communications International SA 144A company | | | |
| guaranty sr. notes 7s, 2017 (Luxembourg) | EUR | 495,000 | 678,012 |
|
| Sunrise Communications International SA 144A company | | | |
| guaranty sr. notes 7s, 2017 (Luxembourg) | CHF | 540,000 | 605,667 |
|
| Telenet Finance V Luxembourg SCA 144A bonds 6 3/4s, | | | |
| 2024 (Luxembourg) | EUR | 2,690,000 | 3,620,691 |
|
| Telenet Finance V Luxembourg SCA 144A bonds 6 1/4s, | | | |
| 2022 (Luxembourg) | | $790,000 | 1,054,677 |
|
| Unitymedia GmbH company guaranty sr. notes Ser. REGS, | | | |
| 9 5/8s, 2019 (Germany) | EUR | 2,398,000 | 3,435,028 |
|
| Unitymedia GmbH 144A sr. sub. notes 9 1/2s, 2021 (Germany) | EUR | 665,000 | 974,260 |
|
| Unitymedia Hessen GmbH & Co. KG/Unitymedia NRW GmbH sr. | | | |
| notes 7 1/2s, 2019 (Germany) | EUR | 1,855,000 | 2,584,086 |
|
| Unitymedia Hessen GmbH & Co. KG/Unitymedia NRW GmbH | | | |
| 144A company guaranty sr. notes 8 1/8s, 2017 (Germany) | EUR | 627,054 | 861,936 |
|
| Unitymedia Hessen GmbH & Co. KG/Unitymedia NRW GmbH | | | |
| 144A company guaranty sr. notes 5 1/8s, 2023 (Germany) | | $3,270,000 | 4,056,723 |
|
| UPC Holdings BV bonds 8 3/8s, 2020 (Netherlands) | | 1,986,000 | 2,786,406 |
|
| Videotron Ltee company guaranty sr. unsec. unsub. notes 5s, | | | |
| 2022 (Canada) | | 1,518,000 | 1,540,770 |
|
| Virgin Media Finance PLC company guaranty sr. unsec. bonds | | | |
| 8 7/8s, 2019 (United Kingdom) | GBP | 162,000 | 271,962 |
|
| Virgin Media Finance PLC company guaranty sr. unsec. unsub. | | | |
| notes 5 1/4s, 2022 (United Kingdom) | | $730,000 | 741,830 |
|
| West Corp. company guaranty sr. unsec. notes 8 5/8s, 2018 | | 1,026,000 | 1,113,210 |
|
| West Corp. company guaranty sr. unsec. notes 7 7/8s, 2019 | | 2,430,000 | 2,587,950 |
|
| WideOpenWest Finance, LLC/WideOpenWest Capital Corp. | | | |
| 144A company guaranty sr. unsec. notes 10 1/4s, 2019 | | 2,992,000 | 3,328,600 |
|
| |
| Diversified Income Trust | 31 |
| | | |
| CORPORATE BONDS AND NOTES (37.8%)* cont. | | Principal amount | Value |
|
| Communication services cont. | | | |
| Wind Acquisition Finance SA company guaranty sr. notes | | | |
| Ser. REGS, 7 3/8s, 2018 (Luxembourg) | EUR | 301,000 | $399,774 |
|
| Wind Acquisition Finance SA 144A company guaranty sr. notes | | | |
| 7 3/8s, 2018 (Luxembourg) | EUR | 4,110,000 | 5,366,557 |
|
| Wind Acquisition Finance SA 144A company guaranty sr. notes | | | |
| 7 1/4s, 2018 (Luxembourg) | | $1,135,000 | 1,181,819 |
|
| Wind Acquisition Holdings Finance SA company guaranty sr. | | | |
| notes 12 1/4s, 2017 (Luxembourg) ‡‡ | | 1,422,328 | 1,864,235 |
|
| Windstream Corp. company guaranty sr. unsec. unsub. notes | | | |
| 8 1/8s, 2018 | | 710,000 | 777,450 |
|
| Windstream Corp. company guaranty sr. unsec. unsub. notes | | | |
| 7 7/8s, 2017 | | 2,884,000 | 3,294,970 |
|
| Windstream Corp. company guaranty sr. unsec. unsub. notes | | | |
| 7 3/4s, 2021 | | 780,000 | 850,200 |
|
| Windstream Corp. 144A company guaranty sr. unsec. notes | | | |
| 6 3/8s, 2023 | | 815,000 | 808,888 |
|
| | | | 185,265,029 |
| Consumer cyclicals (6.3%) | | | |
| Academy, Ltd./Academy Finance Corp. 144A company | | | |
| guaranty sr. unsec. notes 9 1/4s, 2019 | | 360,000 | 405,900 |
|
| Affinion Group Holdings, Inc. company guaranty sr. unsec. notes | | | |
| 11 5/8s, 2015 | | 570,000 | 361,950 |
|
| Affinion Group, Inc. company guaranty sr. unsec. notes | | | |
| 7 7/8s, 2018 | | 4,005,000 | 3,163,950 |
|
| Affinion Group, Inc. company guaranty sr. unsec. sub. notes | | | |
| 11 1/2s, 2015 | | 3,145,000 | 2,744,013 |
|
| AMC Entertainment, Inc. company guaranty sr. sub. notes | | | |
| 9 3/4s, 2020 | | 2,673,000 | 3,083,974 |
|
| American Casino & Entertainment Properties LLC sr. | | | |
| notes 11s, 2014 | | 3,304,000 | 3,328,780 |
|
| Ashtead Capital, Inc. 144A company guaranty sr. notes | | | |
| 6 1/2s, 2022 | | 765,000 | 831,938 |
|
| Autonation, Inc. company guaranty sr. unsec. notes | | | |
| 6 3/4s, 2018 | | 2,870,000 | 3,264,625 |
|
| Autonation, Inc. company guaranty sr. unsec. unsub. notes | | | |
| 5 1/2s, 2020 | | 565,000 | 613,025 |
|
| Beazer Homes USA, Inc. company guaranty sr. unsec. notes | | | |
| 8 1/8s, 2016 | | 550,000 | 595,375 |
|
| Beazer Homes USA, Inc. 144A company guaranty sr. unsec. | | | |
| notes 7 1/4s, 2023 | | 1,909,000 | 1,947,180 |
|
| Bon-Ton Department Stores, Inc. (The) company guaranty notes | | | |
| 10 5/8s, 2017 | | 2,390,000 | 2,392,988 |
|
| Boyd Gaming Corp. company guaranty sr. unsec. notes | | | |
| 9 1/8s, 2018 | | 600,000 | 636,375 |
|
| Brookfield Residential Properties, Inc. 144A company guaranty | | | |
| sr. unsec. notes 6 1/2s, 2020 (Canada) | | 2,065,000 | 2,209,550 |
|
| Building Materials Corp. 144A company guaranty sr. notes | | | |
| 7 1/2s, 2020 | | 1,185,000 | 1,293,131 |
|
| Building Materials Corp. 144A sr. notes 7s, 2020 | | 2,425,000 | 2,631,125 |
|
| Building Materials Corp. 144A sr. notes 6 3/4s, 2021 | | 1,965,000 | 2,146,763 |
|
| Burlington Coat Factory Warehouse Corp. company guaranty sr. | | | |
| unsec. notes 10s, 2019 | | 1,865,000 | 2,070,150 |
|
| |
| 32 | Diversified Income Trust |
| | | |
| CORPORATE BONDS AND NOTES (37.8%)* cont. | | Principal amount | Value |
|
| Consumer cyclicals cont. | | | |
| Burlington Holdings, LLC/Burlington Holding Finance, Inc. 144A | | | |
| sr. unsec. notes 9s, 2018 ‡‡ | | $580,000 | $588,700 |
|
| Caesars Entertainment Operating Co., Inc. company guaranty sr. | | | |
| notes 10s, 2018 | | 2,674,000 | 1,821,663 |
|
| Caesars Entertainment Operating Co., Inc. sr. notes | | | |
| 11 1/4s, 2017 | | 3,259,000 | 3,466,761 |
|
| Caesars Entertainment Operating Co., Inc. 144A company | | | |
| guaranty sr. notes 9s, 2020 | | 4,650,000 | 4,679,063 |
|
| Cedar Fair LP/Canada’s Wonderland Co./Magnum Management | | | |
| Corp. company guaranty sr. unsec. notes 9 1/8s, 2018 | | 855,000 | 957,600 |
|
| Cedar Fair LP/Canada’s Wonderland Co./Magnum Management | | | |
| Corp. 144A company guaranty sr. unsec. notes 5 1/4s, 2021 | | 945,000 | 939,094 |
|
| Cenveo Corp. company guaranty sr. notes 8 7/8s, 2018 | | 2,760,000 | 2,760,000 |
|
| Choice Hotels International, Inc. company guaranty sr. unsec. | | | |
| unsub. notes 5 3/4s, 2022 | | 735,000 | 814,931 |
|
| Chrysler Group, LLC/CG Co-Issuer, Inc. company guaranty notes | | | |
| 8 1/4s, 2021 | | 3,825,000 | 4,269,656 |
|
| Cinemark USA, Inc. company guaranty sr. unsec. sub. notes | | | |
| 7 3/8s, 2021 | | 680,000 | 759,900 |
|
| CityCenter Holdings LLC/CityCenter Finance Corp. company | | | |
| guaranty notes 10 3/4s, 2017 | | 4,530,625 | 5,006,341 |
|
| Clear Channel Communications, Inc. company guaranty sr. | | | |
| notes 9s, 2021 | | 4,178,000 | 3,901,208 |
|
| Clear Channel Communications, Inc. 144A company guaranty sr. | | | |
| notes 9s, 2019 | | 1,221,000 | 1,173,686 |
|
| Clear Channel Worldwide Holdings, Inc. company guaranty sr. | | | |
| unsec. notes 7 5/8s, 2020 | | 703,000 | 733,756 |
|
| Cumulus Media Holdings, Inc. company guaranty sr. unsec. | | | |
| unsub. notes 7 3/4s, 2019 | | 3,470,000 | 3,565,425 |
|
| FelCor Lodging LP company guaranty sr. notes 10s, 2014 R | | 1,487,000 | 1,661,723 |
|
| FelCor Lodging LP company guaranty sr. notes 6 3/4s, 2019 R | | 3,355,000 | 3,640,175 |
|
| FelCor Lodging LP 144A sr. notes 5 5/8s, 2023 R | | 450,000 | 458,438 |
|
| Ford Motor Credit Co., LLC sr. unsec. notes 5s, 2018 | | 3,940,000 | 4,339,555 |
|
| Ford Motor Credit Co., LLC sr. unsec. unsub. notes 5 7/8s, 2021 | | 1,480,000 | 1,691,725 |
|
| Ford Motor Credit Co., LLC sr. unsec. unsub. notes 5 3/4s, 2021 | | 2,635,000 | 2,987,761 |
|
| Gray Television, Inc. company guaranty sr. unsec. notes | | | |
| 7 1/2s, 2020 | | 1,200,000 | 1,281,000 |
|
| Great Canadian Gaming Corp. 144A company guaranty sr. | | | |
| unsec. notes 6 5/8s, 2022 (Canada) | CAD | 2,495,000 | 2,563,279 |
|
| Grupo Televisa, S.A.B sr. unsec. bonds 6 5/8s, 2040 (Mexico) | | $900,000 | 1,096,153 |
|
| Grupo Televisa, S.A.B sr. unsec. notes 6s, 2018 (Mexico) | | 775,000 | 902,674 |
|
| Hanesbrands, Inc. company guaranty sr. unsec. notes | | | |
| 6 3/8s, 2020 | | 2,197,000 | 2,391,984 |
|
| Hanesbrands, Inc. sr. unsec. notes 8s, 2016 | | 485,000 | 525,619 |
|
| Igloo Holdings Corp. 144A sr. unsec. unsub. notes | | | |
| 8 1/4s, 2017 ‡‡ | | 900,000 | 929,250 |
|
| Interactive Data Corp. company guaranty sr. unsec. notes | | | |
| 10 1/4s, 2018 | | 1,769,000 | 2,012,238 |
|
| Isle of Capri Casinos, Inc. company guaranty sr. unsec. sub. | | | |
| notes 8 7/8s, 2020 | | 1,235,000 | 1,343,063 |
|
| |
| Diversified Income Trust | 33 |
| | | |
| CORPORATE BONDS AND NOTES (37.8%)* cont. | | Principal amount | Value |
|
| Consumer cyclicals cont. | | | |
| Isle of Capri Casinos, Inc. company guaranty sr. unsec. unsub. | | | |
| notes 7 3/4s, 2019 | | $4,588,000 | $4,989,450 |
|
| Isle of Capri Casinos, Inc. 144A sr. unsec. notes 5 7/8s, 2021 | | 1,725,000 | 1,725,000 |
|
| ISS Holdings A/S sr. sub. notes Ser. REGS, 8 7/8s, | | | |
| 2016 (Denmark) | EUR | 2,485,000 | 3,280,961 |
|
| Jaguar Land Rover Automotive PLC 144A company guaranty sr. | | | |
| unsec. unsub. notes 5 5/8s, 2023 (United Kingdom) | | $450,000 | 468,031 |
|
| Jarden Corp. company guaranty sr. unsec. sub. notes Ser. 1, | | | |
| 7 1/2s, 2020 | EUR | 265,000 | 359,301 |
|
| Jo-Ann Stores Holdings, Inc. 144A sr. unsec. notes | | | |
| 9 3/4s, 2019 ‡‡ | | $700,000 | 735,000 |
|
| K Hovnanian Enterprises, Inc. 144A company guaranty notes | | | |
| 9 1/8s, 2020 | | 485,000 | 541,381 |
|
| K Hovnanian Enterprises, Inc. 144A sr. notes 7 1/4s, 2020 | | 1,060,000 | 1,176,600 |
|
| Lamar Media Corp. company guaranty sr. notes 9 3/4s, 2014 | | 655,000 | 705,763 |
|
| Lamar Media Corp. company guaranty sr. sub. notes | | | |
| 5 7/8s, 2022 | | 580,000 | 627,850 |
|
| Lear Corp. 144A company guaranty sr. unsec. notes | | | |
| 4 3/4s, 2023 | | 1,815,000 | 1,769,625 |
|
| Lender Processing Services, Inc. company guaranty sr. unsec. | | | |
| unsub. notes 5 3/4s, 2023 | | 1,875,000 | 1,954,688 |
|
| Lennar Corp. 144A company guaranty sr. unsec. notes | | | |
| 4 3/4s, 2022 | | 645,000 | 632,100 |
|
| Limited Brands, Inc. company guaranty sr. unsec. notes | | | |
| 6 5/8s, 2021 | | 2,755,000 | 3,113,150 |
|
| Limited Brands, Inc. sr. notes 5 5/8s, 2022 | | 855,000 | 906,300 |
|
| Lottomatica Group SpA sub. FRN notes Ser. REGS, 8 1/4s, | | | |
| 2066 (Italy) | EUR | 3,337,000 | 4,482,002 |
|
| M/I Homes, Inc. company guaranty sr. unsec. notes 8 5/8s, 2018 | | $1,000,000 | 1,110,000 |
|
| Macy’s Retail Holdings, Inc. company guaranty sr. unsec. | | | |
| notes 5.9s, 2016 | | 883,000 | 1,025,418 |
|
| Mashantucket Western Pequot Tribe 144A bonds Ser. A, 8 1/2s, | | | |
| 2015 (In default) † | | 1,765,000 | 123,550 |
|
| Masonite International Corp., 144A company guaranty sr. notes | | | |
| 8 1/4s, 2021 (Canada) | | 1,420,000 | 1,576,200 |
|
| MGM Resorts International company guaranty sr. unsec. notes | | | |
| 7 5/8s, 2017 | | 2,555,000 | 2,836,050 |
|
| MGM Resorts International company guaranty sr. unsec. notes | | | |
| 6 7/8s, 2016 | | 915,000 | 995,063 |
|
| MGM Resorts International company guaranty sr. unsec. unsub. | | | |
| notes 7 3/4s, 2022 | | 1,120,000 | 1,250,200 |
|
| MGM Resorts International company guaranty sr. unsec. unsub. | | | |
| notes 6 5/8s, 2021 | | 360,000 | 378,450 |
|
| MGM Resorts International 144A company guaranty sr. unsec. | | | |
| notes 6 3/4s, 2020 | | 1,160,000 | 1,229,600 |
|
| Michaels Stores, Inc. company guaranty notes 11 3/8s, 2016 | | 843,000 | 881,997 |
|
| MTR Gaming Group, Inc. company guaranty notes | | | |
| 11 1/2s, 2019 ‡‡ | | 4,615,776 | 4,788,868 |
|
| Navistar International Corp. sr. notes 8 1/4s, 2021 | | 2,516,000 | 2,560,030 |
|
| Needle Merger Sub Corp. 144A sr. unsec. notes 8 1/8s, 2019 | | 2,625,000 | 2,743,125 |
|
| |
| 34 | Diversified Income Trust |
| | | |
| CORPORATE BONDS AND NOTES (37.8%)* cont. | | Principal amount | Value |
|
| Consumer cyclicals cont. | | | |
| New Academy Finance Co., LLC/New Academy Finance Corp. | | | |
| 144A sr. unsec. notes 8s, 2018 ‡‡ | | $365,000 | $377,775 |
|
| Nexstar Broadcasting, Inc. 144A company guaranty sr. unsec. | | | |
| unsub. notes 6 7/8s, 2020 | | 800,000 | 844,000 |
|
| Nielsen Finance, LLC/Nielsen Finance Co. company guaranty sr. | | | |
| unsec. notes 7 3/4s, 2018 | | 337,000 | 374,070 |
|
| Nielsen Finance, LLC/Nielsen Finance Co. 144A sr. unsec. notes | | | |
| 4 1/2s, 2020 | | 900,000 | 898,875 |
|
| Nortek, Inc. company guaranty sr. unsec. notes 10s, 2018 | | 2,343,000 | 2,624,160 |
|
| Nortek, Inc. company guaranty sr. unsec. notes 8 1/2s, 2021 | | 1,625,000 | 1,803,750 |
|
| Owens Corning company guaranty sr. unsec. notes 9s, 2019 | | 679,000 | 869,120 |
|
| Penn National Gaming, Inc. sr. unsec. sub. notes 8 3/4s, 2019 | | 2,466,000 | 2,786,580 |
|
| Penske Automotive Group, Inc. 144A company guaranty sr. sub. | | | |
| notes 5 3/4s, 2022 | | 1,510,000 | 1,574,175 |
|
| PETCO Animal Supplies, Inc. 144A company guaranty sr. notes | | | |
| 9 1/4s, 2018 | | 1,280,000 | 1,404,800 |
|
| Petco Holdings, Inc. 144A sr. notes 8 1/2s, 2017 ‡‡ | | 665,000 | 687,444 |
|
| Pinnacle Entertainment, Inc. company guaranty sr. unsec. notes | | | |
| 8 5/8s, 2017 | | 2,900,000 | 3,077,625 |
|
| Realogy Corp. company guaranty sr. unsec. unsub. notes | | | |
| 11 1/2s, 2017 | | 4,000,000 | 4,255,000 |
|
| Realogy Corp. 144A company guaranty sr. notes 7 7/8s, 2019 | | 695,000 | 761,025 |
|
| Regal Entertainment Group company guaranty sr. unsec. notes | | | |
| 9 1/8s, 2018 | | 3,500,000 | 3,928,750 |
|
| Rivers Pittsburgh Borrower LP/Rivers Pittsburgh Finance Corp. | | | |
| 144A sr. notes 9 1/2s, 2019 | | 545,000 | 594,050 |
|
| RSI Home Products, Inc. 144A company guaranty notes | | | |
| 6 7/8s, 2018 | | 1,270,000 | 1,295,400 |
|
| Sabre Holdings Corp. sr. unsec. unsub. notes 8.35s, 2016 | | 3,139,000 | 3,452,900 |
|
| Sabre, Inc. 144A sr. notes 8 1/2s, 2019 | | 1,705,000 | 1,849,925 |
|
| Schaeffler Finance BV 144A company guaranty sr. notes 8 3/4s, | | | |
| 2019 (Germany) | EUR | 2,595,000 | 3,767,151 |
|
| Schaeffler Finance BV 144A company guaranty sr. notes 8 1/2s, | | | |
| 2019 (Germany) | | $535,000 | 609,900 |
|
| Sealy Mattress Co. 144A company guaranty sr. notes | | | |
| 10 7/8s, 2016 | | 772,000 | 816,398 |
|
| Sinclair Television Group, Inc. 144A company guaranty sr. unsec. | | | |
| notes 5 3/8s, 2021 | | 665,000 | 660,013 |
|
| Sinclair Television Group, Inc. 144A sr. notes 6 1/8s, 2022 | | 670,000 | 701,825 |
|
| Sirius XM Radio, Inc. 144A sr. unsec. notes 5 1/4s, 2022 | | 200,000 | 203,750 |
|
| Six Flags Entertainment Corp. 144A company guaranty sr. | | | |
| unsec. unsub. notes 5 1/4s, 2021 | | 1,185,000 | 1,186,481 |
|
| Spectrum Brands Escrow Corp. 144A sr. unsec. notes | | | |
| 6 5/8s, 2022 | | 90,000 | 97,875 |
|
| Spectrum Brands Escrow Corp. 144A sr. unsec. notes | | | |
| 6 3/8s, 2020 | | 115,000 | 123,625 |
|
| Spectrum Brands, Inc. company guaranty sr. unsec. unsub. | | | |
| notes 6 3/4s, 2020 | | 1,125,000 | 1,213,594 |
|
| Tempur-Pedic International, Inc. 144A company guaranty sr. | | | |
| unsec. unsub. notes 6 7/8s, 2020 | | 1,095,000 | 1,168,913 |
|
| |
| Diversified Income Trust | 35 |
| | | |
| CORPORATE BONDS AND NOTES (37.8%)* cont. | | Principal amount | Value |
|
| Consumer cyclicals cont. | | | |
| Toys R Us Property Co., LLC company guaranty sr. notes | | | |
| 8 1/2s, 2017 | | $2,265,000 | $2,392,406 |
|
| Toys R Us Property Co., LLC company guaranty sr. unsec. notes | | | |
| 10 3/4s, 2017 | | 1,583,000 | 1,703,704 |
|
| Travelport, LLC company guaranty sr. unsec. sub. notes | | | |
| 11 7/8s, 2016 | | 2,243,000 | 1,906,550 |
|
| Travelport, LLC company guaranty sr. unsec. unsub. notes | | | |
| 9 7/8s, 2014 | | 997,000 | 1,001,985 |
|
| Travelport, LLC 144A sr. notes Ser. B, 6.308s, 2016 ‡‡ | | 717,043 | 659,680 |
|
| Travelport, LLC/Travelport, Inc. company guaranty sr. unsec. | | | |
| notes 9s, 2016 | | 1,853,000 | 1,859,949 |
|
| TRW Automotive, Inc. 144A company guaranty sr. notes | | | |
| 7 1/4s, 2017 | | 4,975,000 | 5,752,344 |
|
| TRW Automotive, Inc. 144A company guaranty sr. unsec. notes | | | |
| 4 1/2s, 2021 | | 475,000 | 482,125 |
|
| TVN Finance Corp. III AB 144A company guaranty sr. unsec. | | | |
| notes 7 7/8s, 2018 (Sweden) | EUR | 270,000 | 362,609 |
|
| Univision Communications, Inc. 144A company guaranty sr. | | | |
| unsec. notes 8 1/2s, 2021 | | $1,584,000 | 1,710,720 |
|
| Univision Communications, Inc. 144A sr. notes 7 7/8s, 2020 | | 2,324,000 | 2,556,400 |
|
| Univision Communications, Inc. 144A sr. notes 6 7/8s, 2019 | | 1,500,000 | 1,605,000 |
|
| XM Satellite Radio, Inc. 144A sr. unsec. notes 7 5/8s, 2018 | | 3,384,000 | 3,735,090 |
|
| YCC Holdings, LLC/Yankee Finance, Inc. sr. unsec. notes | | | |
| 10 1/4s, 2016 ‡‡ | | 4,720,000 | 4,867,500 |
|
| Yonkers Racing Corp. 144A sr. notes 11 3/8s, 2016 | | 3,053,000 | 3,274,343 |
|
| | | | 223,828,320 |
| Consumer staples (2.3%) | | | |
| Anheuser-Busch InBev Worldwide, Inc. company guaranty sr. | | | |
| unsec. notes 9 3/4s, 2015 | BRL | 16,800,000 | 8,986,659 |
|
| Avis Budget Car Rental, LLC/Avis Budget Finance, Inc. company | | | |
| guaranty sr. unsec. unsub. notes 8 1/4s, 2019 | | $520,000 | 576,550 |
|
| Avis Budget Car Rental, LLC/Avis Budget Finance, Inc. 144A | | | |
| 5 1/2s, 2023 | | 710,000 | 708,225 |
|
| Burger King Corp. company guaranty sr. unsec. notes | | | |
| 9 7/8s, 2018 | | 1,492,000 | 1,713,935 |
|
| CKE, Inc. 144A sr. unsec. notes 10 1/2s, 2016 ‡‡ | | 1,567,762 | 1,665,747 |
|
| Claire’s Stores, Inc. company guaranty sr. notes 8 7/8s, 2019 | | 3,612,000 | 3,810,660 |
|
| Claire’s Stores, Inc. 144A company guaranty sr. notes | | | |
| 6 1/8s, 2020 | | 475,000 | 484,500 |
|
| Claire’s Stores, Inc. 144A sr. notes 9s, 2019 | | 2,975,000 | 3,361,750 |
|
| Constellation Brands, Inc. company guaranty sr. unsec. unsub. | | | |
| notes 7 1/4s, 2016 | | 2,401,000 | 2,725,135 |
|
| Constellation Brands, Inc. company guaranty sr. unsec. unsub. | | | |
| notes 6s, 2022 | | 885,000 | 966,863 |
|
| Corrections Corp. of America 144A sr. unsec. notes | | | |
| 4 5/8s, 2023 R | | 480,000 | 491,400 |
|
| Corrections Corp. of America 144A sr. unsec. notes | | | |
| 4 1/8s, 2020 R | | 380,000 | 387,125 |
|
| Dean Foods Co. company guaranty sr. unsec. unsub. notes | | | |
| 9 3/4s, 2018 | | 212,000 | 245,390 |
|
| |
| 36 | Diversified Income Trust |
| | | |
| CORPORATE BONDS AND NOTES (37.8%)* cont. | | Principal amount | Value |
|
| Consumer staples cont. | | | |
| Dean Foods Co. company guaranty sr. unsec. unsub. | | | |
| notes 7s, 2016 | | $2,498,000 | $2,766,535 |
|
| DineEquity, Inc. company guaranty sr. unsec. notes 9 1/2s, 2018 | | 4,296,000 | 4,897,440 |
|
| Dole Food Co., Inc. 144A sr. notes 8s, 2016 | | 1,710,000 | 1,778,400 |
|
| Elizabeth Arden, Inc. sr. unsec. unsub. notes 7 3/8s, 2021 | | 2,115,000 | 2,350,294 |
|
| Enterprise Inns PLC sr. unsub. mtge. notes 6 1/2s, 2018 | | | |
| (United Kingdom) | GBP | 1,688,000 | 2,535,105 |
|
| ESAL GmbH 144A company guaranty sr. unsec. notes 6 1/4s, | | | |
| 2023 (Austria) | | $1,220,000 | 1,219,819 |
|
| Hawk Acquisition Sub, Inc. 144A sr. notes 4 1/4s, 2020 | | 2,160,000 | 2,162,700 |
|
| HDTFS, Inc. company guaranty sr. unsec. notes 6 1/4s, 2022 | | 280,000 | 303,800 |
|
| Hertz Corp. (The) company guaranty sr. unsec. notes | | | |
| 7 1/2s, 2018 | | 800,000 | 883,000 |
|
| Hertz Corp. (The) company guaranty sr. unsec. notes | | | |
| 5 7/8s, 2020 | | 280,000 | 295,400 |
|
| Hertz Holdings Netherlands BV sr. bonds Ser. REGS, 8 1/2s, | | | |
| 2015 (Netherlands) | EUR | 1,000,000 | 1,353,455 |
|
| Hertz Holdings Netherlands BV 144A sr. bonds 8 1/2s, | | | |
| 2015 (Netherlands) | EUR | 2,129,000 | 2,881,506 |
|
| JBS USA, LLC/JBS USA Finance, Inc. 144A sr. unsec. notes | | | |
| 8 1/4s, 2020 | | $680,000 | 742,900 |
|
| JBS USA, LLC/JBS USA Finance, Inc. 144A sr. unsec. notes | | | |
| 7 1/4s, 2021 | | 3,515,000 | 3,690,750 |
|
| Landry’s Holdings II, Inc. 144A sr. unsec. notes 10 1/4s, 2018 | | 955,000 | 1,000,363 |
|
| Libbey Glass, Inc. company guaranty sr. notes 6 7/8s, 2020 | | 1,828,000 | 1,969,670 |
|
| Post Holdings, Inc. company guaranty sr. unsec. notes | | | |
| 7 3/8s, 2022 | | 910,000 | 995,313 |
|
| Prestige Brands, Inc. company guaranty sr. unsec. notes | | | |
| 8 1/4s, 2018 | | 2,730,000 | 2,975,700 |
|
| Revlon Consumer Products Corp. 144A company guaranty sr. | | | |
| unsec. notes 5 3/4s, 2021 | | 1,855,000 | 1,861,956 |
|
| Rite Aid Corp. company guaranty sr. notes 7 1/2s, 2017 | | 4,000,000 | 4,115,000 |
|
| Rite Aid Corp. company guaranty sr. unsec. unsub. notes | | | |
| 9 1/2s, 2017 | | 1,745,000 | 1,830,069 |
|
| Rite Aid Corp. company guaranty sr. unsec. unsub. notes | | | |
| 9 1/4s, 2020 | | 2,220,000 | 2,505,825 |
|
| Rite Aid Corp. company guaranty sr. unsub. notes 8s, 2020 | | 595,000 | 672,350 |
|
| Smithfield Foods, Inc. sr. unsec. unsub. notes 6 5/8s, 2022 | | 1,405,000 | 1,534,963 |
|
| Spectrum Brands Holdings, Inc. company guaranty sr. notes | | | |
| 9 1/2s, 2018 | | 3,360,000 | 3,805,200 |
|
| United Rentals North America, Inc. company guaranty sr. unsec. | | | |
| notes 7 5/8s, 2022 | | 1,987,000 | 2,215,505 |
|
| United Rentals North America, Inc. company guaranty sr. unsec. | | | |
| unsub. notes 6 1/8s, 2023 | | 370,000 | 396,825 |
|
| Wells Enterprises, Inc. 144A sr. notes 6 3/4s, 2020 | | 653,000 | 688,915 |
|
| Wok Acquisition Corp. 144A sr. unsec. notes 10 1/4s, 2020 | | 260,000 | 278,200 |
|
| | | | 80,830,897 |
| |
| Diversified Income Trust | 37 |
| | | |
| CORPORATE BONDS AND NOTES (37.8%)* cont. | | Principal amount | Value |
|
| Energy (7.1%) | | | |
| Access Midstream Partners, LP/ACMP Finance Corp. company | | | |
| guaranty sr. unsec. unsub. notes 6 1/8s, 2022 | | $765,000 | $820,463 |
|
| Access Midstream Partners, LP/ACMP Finance Corp. company | | | |
| guaranty sr. unsec. notes 5 7/8s, 2021 | | 1,947,000 | 2,063,820 |
|
| Access Midstream Partners, LP/ACMP Finance Corp. company | | | |
| guaranty sr. unsec. unsub. notes 4 7/8s, 2023 | | 2,015,000 | 1,984,775 |
|
| Alpha Natural Resources, Inc. company guaranty sr. unsec. | | | |
| notes 6 1/4s, 2021 | | 605,000 | 544,500 |
|
| Alpha Natural Resources, Inc. company guaranty sr. unsec. | | | |
| notes 6s, 2019 | | 2,010,000 | 1,849,200 |
|
| Anadarko Petroleum Corp. sr. notes 5.95s, 2016 | | 3,610,000 | 4,155,015 |
|
| Arch Coal, Inc. company guaranty sr. unsec. notes 7 1/4s, 2020 | | 319,000 | 287,100 |
|
| Arch Coal, Inc. company guaranty sr. unsec. unsub. | | | |
| notes 7s, 2019 | | 2,176,000 | 1,963,840 |
|
| Atlas Pipeline Partners LP/Atlas Pipeline Finance Corp. 144A | | | |
| company guaranty sr. notes 6 5/8s, 2020 | | 570,000 | 594,225 |
|
| Atwood Oceanics, Inc. sr. unsec. unsub. notes 6 1/2s, 2020 | | 520,000 | 565,500 |
|
| Aurora USA Oil & Gas Inc., 144A sr. notes 9 7/8s, 2017 | | 1,560,000 | 1,712,100 |
|
| Carrizo Oil & Gas, Inc. company guaranty sr. unsec. notes | | | |
| 8 5/8s, 2018 | | 3,906,000 | 4,277,070 |
|
| Chaparral Energy, Inc. company guaranty sr. unsec. notes | | | |
| 9 7/8s, 2020 | | 1,640,000 | 1,894,200 |
|
| Chaparral Energy, Inc. company guaranty sr. unsec. notes | | | |
| 8 1/4s, 2021 | | 260,000 | 294,450 |
|
| Chesapeake Energy Corp. company guaranty sr. unsec. bonds | | | |
| 6 1/4s, 2017 | EUR | 565,000 | 774,921 |
|
| Chesapeake Energy Corp. company guaranty sr. unsec. notes | | | |
| 9 1/2s, 2015 | | $4,650,000 | 5,254,500 |
|
| Chesapeake Energy Corp. company guaranty sr. unsec. notes | | | |
| 5 3/4s, 2023 | | 475,000 | 481,531 |
|
| Concho Resources, Inc. company guaranty sr. unsec. notes | | | |
| 6 1/2s, 2022 | | 3,280,000 | 3,575,200 |
|
| Concho Resources, Inc. company guaranty sr. unsec. unsub. | | | |
| notes 5 1/2s, 2023 | | 500,000 | 518,750 |
|
| Concho Resources, Inc. company guaranty sr. unsec. unsub. | | | |
| notes 5 1/2s, 2022 | | 896,000 | 931,840 |
|
| Connacher Oil and Gas, Ltd. 144A notes 8 3/4s, 2018 (Canada) | CAD | 2,355,000 | 1,483,684 |
|
| Connacher Oil and Gas, Ltd. 144A notes 8 1/2s, 2019 (Canada) | | $827,000 | 543,753 |
|
| CONSOL Energy, Inc. company guaranty sr. unsec. notes | | | |
| 8 1/4s, 2020 | | 1,829,000 | 2,025,618 |
|
| CONSOL Energy, Inc. company guaranty sr. unsec. | | | |
| notes 8s, 2017 | | 7,000,000 | 7,560,000 |
|
| Continental Resources, Inc. company guaranty sr. unsec. | | | |
| notes 5s, 2022 | | 3,415,000 | 3,628,438 |
|
| Crosstex Energy LP/Crosstex Energy Finance Corp. company | | | |
| guaranty sr. unsec. notes 8 7/8s, 2018 | | 5,652,000 | 6,118,290 |
|
| Crosstex Energy LP/Crosstex Energy Finance Corp. 144A | | | |
| company guaranty sr. unsec. notes 7 1/8s, 2022 | | 650,000 | 689,000 |
|
| Denbury Resources, Inc. company guaranty sr. unsec. sub. notes | | | |
| 8 1/4s, 2020 | | 3,793,000 | 4,257,643 |
|
| EXCO Resources, Inc. company guaranty sr. unsec. notes | | | |
| 7 1/2s, 2018 | | 4,962,000 | 4,726,305 |
|
| |
| 38 | Diversified Income Trust |
| | |
| CORPORATE BONDS AND NOTES (37.8%)* cont. | Principal amount | Value |
|
| Energy cont. | | |
| Ferrellgas LP/Ferrellgas Finance Corp. sr. unsec. notes | | |
| 6 1/2s, 2021 | $1,264,000 | $1,305,080 |
|
| Forbes Energy Services Ltd. company guaranty sr. unsec. | | |
| notes 9s, 2019 | 2,205,000 | 2,138,850 |
|
| FTS International Services, LLC/FTS International Bonds, Inc. | | |
| 144A company guaranty sr. unsec. unsub. notes 8 1/8s, 2018 | 1,643,000 | 1,721,043 |
|
| Gaz Capital SA sr. unsec. notes Ser. REGS, 7.288s, 2037 (Russia) | 1,810,000 | 2,185,177 |
|
| Gazprom OAO Via Gaz Capital SA 144A sr. unsec. notes 7.288s, | | |
| 2037 (Russia) | 1,280,000 | 1,548,800 |
|
| Gazprom OAO Via Gaz Capital SA 144A sr. unsec. unsub. notes | | |
| 9 1/4s, 2019 (Russia) | 3,305,000 | 4,265,466 |
|
| Gazprom OAO Via Gaz Capital SA 144A sr. unsec. unsub. notes | | |
| 8.146s, 2018 (Russia) | 740,000 | 894,949 |
|
| Goodrich Petroleum Corp. company guaranty sr. unsec. unsub. | | |
| notes 8 7/8s, 2019 | 4,000,000 | 4,140,000 |
|
| Gulfport Energy Corp. 144A company guaranty sr. unsec. notes | | |
| 7 3/4s, 2020 | 2,883,000 | 3,041,565 |
|
| Halcon Resources Corp. 144A sr. unsec. notes 8 7/8s, 2021 | 3,443,000 | 3,709,833 |
|
| Hercules Offshore, Inc. 144A company guaranty sr. notes | | |
| 7 1/8s, 2017 | 175,000 | 188,563 |
|
| Hiland Partners LP/Hiland Partners Finance Corp. 144A | | |
| company guaranty sr. notes 7 1/4s, 2020 | 780,000 | 852,150 |
|
| Key Energy Services, Inc. company guaranty unsec. unsub. | | |
| notes 6 3/4s, 2021 | 1,492,000 | 1,555,410 |
|
| Kodiak Oil & Gas Corp. company guaranty sr. unsec. unsub. | | |
| notes 8 1/8s, 2019 | 540,000 | 610,200 |
|
| Laredo Petroleum, Inc. company guaranty sr. unsec. notes | | |
| 7 3/8s, 2022 | 655,000 | 717,225 |
|
| Laredo Petroleum, Inc. company guaranty sr. unsec. unsub. | | |
| notes 9 1/2s, 2019 | 2,918,000 | 3,297,340 |
|
| Lone Pine Resources Canada, Ltd. company guaranty sr. unsec. | | |
| notes 10 3/8s, 2017 (Canada) | 813,000 | 727,635 |
|
| Lukoil International Finance BV 144A company guaranty sr. | | |
| unsec. notes 6 1/8s, 2020 (Russia) | 5,000,000 | 5,675,000 |
|
| Lukoil International Finance BV 144A company guaranty sr. | | |
| unsec. unsub. bonds 6.656s, 2022 (Russia) | 2,380,000 | 2,820,300 |
|
| MEG Energy Corp. 144A company guaranty sr. unsec. notes | | |
| 6 1/2s, 2021 (Canada) | 1,624,000 | 1,729,560 |
|
| MEG Energy Corp. 144A company guaranty sr. unsec. notes | | |
| 6 3/8s, 2023 (Canada) | 901,000 | 937,040 |
|
| Milagro Oil & Gas, Inc. company guaranty notes 10 1/2s, 2016 | 3,295,000 | 2,570,100 |
|
| National JSC Naftogaz of Ukraine govt. guaranty unsec. notes | | |
| 9 1/2s, 2014 (Ukraine) | 3,725,000 | 3,821,925 |
|
| Neon Capital, Ltd. 144A limited recourse notes Ser. 97, 1.105s, | | |
| 2013 (Cayman Islands) F g | 2,649,208 | 308,080 |
|
| Newfield Exploration Co. sr. unsec. notes 5 3/4s, 2022 | 750,000 | 800,625 |
|
| Newfield Exploration Co. sr. unsec. sub. notes 6 7/8s, 2020 | 1,000,000 | 1,072,500 |
|
| Northern Oil and Gas, Inc. company guaranty sr. unsec. | | |
| notes 8s, 2020 | 1,620,000 | 1,688,850 |
|
| Oasis Petroleum, Inc. company guaranty sr. unsec. notes | | |
| 6 7/8s, 2023 | 1,045,000 | 1,146,888 |
|
| |
| Diversified Income Trust | 39 |
| | |
| CORPORATE BONDS AND NOTES (37.8%)* cont. | Principal amount | Value |
|
| Energy cont. | | |
| Offshore Group Investment, Ltd. 144A company guaranty sr. | | |
| notes 7 1/2s, 2019 (Cayman Islands) | $2,250,000 | $2,385,000 |
|
| Offshore Group Investment, Ltd. 144A company guaranty sr. | | |
| notes 7 1/8s, 2023 (Cayman Islands) | 1,425,000 | 1,457,063 |
|
| Peabody Energy Corp. company guaranty sr. unsec. notes | | |
| 7 3/8s, 2016 | 2,848,000 | 3,246,720 |
|
| Peabody Energy Corp. company guaranty sr. unsec. unsub. | | |
| notes 6 1/2s, 2020 | 208,000 | 221,520 |
|
| Pemex Project Funding Master Trust company guaranty unsec. | | |
| unsub. notes 6 5/8s, 2038 (Mexico) | 760,000 | 908,200 |
|
| Pertamina Persero PT 144A sr. unsec. notes 4 7/8s, | | |
| 2022 (Indonesia) | 720,000 | 748,800 |
|
| PetroBakken Energy, Ltd. 144A sr. unsec. notes 8 5/8s, | | |
| 2020 (Canada) | 3,270,000 | 3,335,400 |
|
| Petrohawk Energy Corp. company guaranty sr. unsec. notes | | |
| 10 1/2s, 2014 | 1,350,000 | 1,427,537 |
|
| Petroleos de Venezuela SA company guaranty sr. unsec. notes | | |
| 5 1/4s, 2017 (Venezuela) | 26,185,000 | 22,526,694 |
|
| Petroleos de Venezuela SA company guaranty sr. unsec. unsub. | | |
| notes 5 3/8s, 2027 (Venezuela) | 3,000,000 | 2,064,450 |
|
| Petroleos de Venezuela SA sr. unsec. notes 5 1/8s, | | |
| 2016 (Venezuela) | 5,000,000 | 4,376,700 |
|
| Petroleos de Venezuela SA sr. unsec. notes 4.9s, | | |
| 2014 (Venezuela) | 23,250,000 | 22,390,215 |
|
| Petroleos de Venezuela SA sr. unsec. sub. bonds 5s, | | |
| 2015 (Venezuela) | 16,885,000 | 15,612,378 |
|
| Petroleos de Venezuela SA 144A company guaranty sr. notes | | |
| 8 1/2s, 2017 (Venezuela) | 11,495,000 | 11,178,888 |
|
| Petroleos de Venezuela SA 144A company guaranty sr. unsec. | | |
| notes 12 3/4s, 2022 (Venezuela) | 2,400,000 | 2,712,000 |
|
| Petroleos de Venezuela SA 144A company guaranty sr. unsec. | | |
| notes 8s, 2013 (Venezuela) | 6,425,000 | 6,444,275 |
|
| Petroleos Mexicanos company guaranty sr. unsec. notes 6 1/2s, | | |
| 2041 (Mexico) | 1,000,000 | 1,177,500 |
|
| Quicksilver Resources, Inc. company guaranty sr. unsec. notes | | |
| 8 1/4s, 2015 | 500,000 | 491,875 |
|
| Quicksilver Resources, Inc. sr. notes 11 3/4s, 2016 | 1,710,000 | 1,744,200 |
|
| Range Resources Corp. company guaranty sr. sub. notes | | |
| 6 3/4s, 2020 | 1,640,000 | 1,804,000 |
|
| Range Resources Corp. company guaranty sr. unsec. sub. | | |
| notes 5s, 2022 | 790,000 | 805,800 |
|
| Rosetta Resources, Inc. company guaranty sr. unsec. notes | | |
| 9 1/2s, 2018 | 3,321,000 | 3,661,403 |
|
| Sabine Pass LNG LP company guaranty sr. notes 7 1/2s, 2016 | 2,885,000 | 3,187,925 |
|
| Sabine Pass LNG LP 144A sr. notes 6 1/2s, 2020 | 705,000 | 742,013 |
|
| Samson Investment Co. 144A sr. unsec. notes 9 3/4s, 2020 | 3,925,000 | 4,170,313 |
|
| SandRidge Energy, Inc. company guaranty sr. unsec. unsub. | | |
| notes 7 1/2s, 2021 | 678,000 | 705,120 |
|
| Shelf Drilling Holdings Ltd. 144A sr. notes 8 5/8s, 2018 | 1,545,000 | 1,637,700 |
|
| SM Energy Co. sr. unsec. notes 6 5/8s, 2019 | 1,105,000 | 1,185,113 |
|
| SM Energy Co. sr. unsec. unsub. notes 6 1/2s, 2023 | 985,000 | 1,083,500 |
|
| |
| 40 | Diversified Income Trust |
| | | |
| CORPORATE BONDS AND NOTES (37.8%)* cont. | | Principal amount | Value |
|
| Energy cont. | | | |
| Suburban Propane Partners LP/Suburban Energy Finance Corp. | | | |
| sr. unsec. notes 7 3/8s, 2021 | | $2,379,000 | $2,622,848 |
|
| Unit Corp. company guaranty sr. sub. notes 6 5/8s, 2021 | | 1,915,000 | 2,005,963 |
|
| Williams Cos., Inc. (The) notes 7 3/4s, 2031 | | 522,000 | 650,377 |
|
| Williams Cos., Inc. (The) sr. unsec. notes 7 7/8s, 2021 | | 690,000 | 881,671 |
|
| | | | 250,639,046 |
| Financials (5.5%) | | | |
| ACE Cash Express, Inc. 144A sr. notes 11s, 2019 | | 1,231,000 | 1,221,768 |
|
| Air Lease Corp. company guaranty sr. unsec. unsub. notes | | | |
| 4 3/4s, 2020 | | 825,000 | 845,625 |
|
| Air Lease Corp. sr. unsec. notes 6 1/8s, 2017 | | 1,690,000 | 1,829,425 |
|
| Ally Financial, Inc. company guaranty sr. notes 6 1/4s, 2017 | | 1,815,000 | 2,029,720 |
|
| Ally Financial, Inc. company guaranty sr. unsec. unsub. | | | |
| notes 8.3s, 2015 | | 4,595,000 | 5,100,450 |
|
| Ally Financial, Inc. company guaranty sr. unsec. unsub. notes | | | |
| 7 1/2s, 2020 | | 7,290,000 | 8,893,800 |
|
| Ally Financial, Inc. unsec. sub. notes 8s, 2018 | | 1,333,000 | 1,594,601 |
|
| American International Group, Inc. jr. sub. FRB bonds | | | |
| 8.175s, 2068 | | 3,027,000 | 4,075,099 |
|
| Banco do Brasil SA 144A unsec. sub. notes 5 7/8s, 2023 (Brazil) | | 1,200,000 | 1,290,000 |
|
| Boparan Finance PLC 144A company guaranty sr. unsec. unsub. | | | |
| bonds 9 3/4s, 2018 (United Kingdom) | EUR | 1,030,000 | 1,471,376 |
|
| Boparan Holdings, Ltd. 144A company guaranty sr. unsec. | | | |
| unsub. notes 9 7/8s, 2018 (United Kingdom) | | $1,365,000 | 2,308,002 |
|
| CB Richard Ellis Services, Inc. company guaranty sr. unsec. notes | | | |
| 6 5/8s, 2020 | | 1,235,000 | 1,339,975 |
|
| CB Richard Ellis Services, Inc. company guaranty sr. unsec. sub. | | | |
| notes 11 5/8s, 2017 | | 951,000 | 1,023,514 |
|
| CBRE Services, Inc. company guaranty sr. unsec. unsub. | | | |
| notes 5s, 2023 | | 782,000 | 790,798 |
|
| CIT Group, Inc. sr. unsec. notes 5s, 2022 | | 2,000,000 | 2,135,576 |
|
| CIT Group, Inc. sr. unsec. unsub. notes 5 3/8s, 2020 | | 1,350,000 | 1,481,625 |
|
| CIT Group, Inc. 144A company guaranty notes 6 5/8s, 2018 | | 2,885,000 | 3,288,900 |
|
| CIT Group, Inc. 144A company guaranty notes 5 1/2s, 2019 | | 1,710,000 | 1,876,725 |
|
| Community Choice Financial, Inc. company guaranty sr. notes | | | |
| 10 3/4s, 2019 | | 2,420,000 | 2,292,950 |
|
| Dresdner Funding Trust I jr. unsec. sub. notes 8.151s, 2031 | | 3,250,000 | 3,424,688 |
|
| Dresdner Funding Trust I 144A bonds 8.151s, 2031 | | 3,659,000 | 3,855,671 |
|
| E*Trade Financial Corp. sr. unsec. unsub. notes 6 3/8s, 2019 | | 3,141,000 | 3,321,608 |
|
| HSBC Capital Funding LP/Jersey bank guaranty jr. unsec. sub. | | | |
| FRB bonds 5.13s, perpetual maturity (Jersey) | EUR | 1,092,000 | 1,414,633 |
|
| Hub International Ltd. 144A company guaranty sr. notes | | | |
| 8 1/8s, 2018 | | $630,000 | 659,925 |
|
| Icahn Enterprises LP/Icahn Enterprises Finance Corp. company | | | |
| guaranty sr. unsec. notes 8s, 2018 | | 4,000,000 | 4,280,000 |
|
| Industry & Construction Bank St. Petersburg OJSC Via Or-ICB | | | |
| unsec. sub. FRN notes 5.01s, 2015 (Russia) | | 1,695,000 | 1,748,393 |
|
| International Lease Finance Corp. sr. unsec. notes 6 1/4s, 2019 | | 345,000 | 379,500 |
|
| International Lease Finance Corp. sr. unsec. unsub. notes | | | |
| 5 7/8s, 2022 | | 1,895,000 | 2,044,231 |
|
| |
| Diversified Income Trust | 41 |
| | | |
| CORPORATE BONDS AND NOTES (37.8%)* cont. | | Principal amount | Value |
|
| Financials cont. | | | |
| International Lease Finance Corp. sr. unsec. unsub. notes | | | |
| 4 7/8s, 2015 | | $775,000 | $813,750 |
|
| International Lease Finance Corp. sr. unsec. unsub. notes | | | |
| 4 5/8s, 2021 | | 660,000 | 659,175 |
|
| International Lease Finance Corp. sr. unsec. unsub. notes | | | |
| 3 7/8s, 2018 | | 1,675,000 | 1,670,813 |
|
| iStar Financial, Inc. sr. unsec. notes 7 1/8s, 2018 R | | 1,050,000 | 1,102,500 |
|
| LBG Capital No. 1 PLC 144A jr. unsec. sub. FRN notes 8s, | | | |
| perpetual maturity (United Kingdom) | | 2,158,000 | 2,254,506 |
|
| Liberty Mutual Insurance Co. 144A notes 7.697s, 2097 | | 2,775,000 | 3,037,410 |
|
| MetLife Capital Trust X 144A jr. sub. FRB bonds 9 1/4s, 2068 | | 935,000 | 1,301,988 |
|
| MPT Operating Partnership LP/MPT Finance Corp. company | | | |
| guaranty sr. unsec. unsub. notes 6 3/8s, 2022 R | | 1,140,000 | 1,222,650 |
|
| National Money Mart Co. company guaranty sr. unsec. unsub. | | | |
| notes 10 3/8s, 2016 (Canada) | | 1,029,000 | 1,134,473 |
|
| Nationstar Mortgage, LLC/Nationstar Capital Corp. 144A | | | |
| company guaranty sr. unsec. notes 7 7/8s, 2020 | | 740,000 | 817,700 |
|
| Nationstar Mortgage, LLC/Nationstar Capital Corp. 144A | | | |
| company guaranty sr. unsec. unsub. notes 6 1/2s, 2021 | | 2,002,000 | 2,087,085 |
|
| Nuveen Investments, Inc. 144A sr. unsec. notes 9 1/2s, 2020 | | 1,682,000 | 1,757,690 |
|
| Nuveen Investments, Inc. 144A sr. unsec. notes 9 1/8s, 2017 | | 1,774,000 | 1,831,655 |
|
| Onex USI Acquisition Corp. 144A sr. unsec. notes 7 3/4s, 2021 | | 1,938,000 | 1,928,310 |
|
| PHH Corp. sr. unsec. unsub. notes 9 1/4s, 2016 | | 1,085,000 | 1,266,738 |
|
| PHH Corp. sr. unsec. unsub. notes 7 3/8s, 2019 | | 1,240,000 | 1,399,650 |
|
| RBS Capital Trust III bank guaranty jr. unsec. sub. notes 5.512s, | | | |
| perpetual maturity (United Kingdom) | | 3,375,000 | 2,649,375 |
|
| Royal Bank of Scotland Group PLC jr. unsec. sub. FRB bonds | | | |
| 7.092s, 2049 (United Kingdom) | | 2,550,000 | 2,876,473 |
|
| Royal Bank of Scotland PLC (The) jr. sub. FRN notes Ser. MTN, | | | |
| 7.64s, perpetual maturity (United Kingdom) | | 3,300,000 | 2,970,000 |
|
| Russian Agricultural Bank OJSC Via RSHB Capital SA 144A sub. | | | |
| FRN notes 6s, 2021 (Russia) | | 6,000,000 | 6,209,265 |
|
| Sberbank of Russia Via SB Capital SA 144A sr. notes 6 1/8s, | | | |
| 2022 (Luxembourg) | | 2,100,000 | 2,346,604 |
|
| Sberbank of Russia Via SB Capital SA 144A sr. notes 4.95s, | | | |
| 2017 (Luxembourg) | | 5,200,000 | 5,538,000 |
|
| Springleaf Finance Corp. sr. unsec. notes Ser. MTN, 6.9s, 2017 | | 6,000,000 | 6,030,000 |
|
| State Bank of India/London 144A sr. unsec. notes 4 1/2s, | | | |
| 2015 (India) | | 1,665,000 | 1,753,628 |
|
| UBS AG/Jersey Branch jr. unsec. sub. FRB bonds 4.28s, | | | |
| perpetual maturity (Jersey) | EUR | 976,000 | 1,239,802 |
|
| UBS AG/Jersey Branch jr. unsec. sub. FRN notes Ser. EMTN, | | | |
| 7.152s, perpetual maturity (Jersey) | EUR | 2,000,000 | 2,797,614 |
|
| Ukreximbank Via Biz Finance PLC sr. unsec. unsub. bonds | | | |
| 8 3/8s, 2015 (United Kingdom) | | $3,400,000 | 3,460,996 |
|
| Vnesheconombank Via VEB Finance PLC 144A bank guaranty, | | | |
| sr. unsec. unsub. bonds 6.8s, 2025 (Russia) | | 1,956,000 | 2,288,520 |
|
| VTB Bank OJSC 144A jr. unsec. sub. FRN notes 9 1/2s, | | | |
| 2049 (Ireland) | | 1,600,000 | 1,713,956 |
|
| VTB Bank OJSC Via VTB Capital SA sr. notes 6 1/4s, | | | |
| 2035 (Russia) | | 4,335,000 | 4,681,453 |
|
| |
| 42 | Diversified Income Trust |
| | | |
| CORPORATE BONDS AND NOTES (37.8%)* cont. | | Principal amount | Value |
|
| Financials cont. | | | |
| VTB Bank OJSC Via VTB Capital SA 144A bank guaranty sr. | | | |
| unsec. notes 6.551s, 2020 (Russia) | | $5,000,000 | $5,487,500 |
|
| VTB Bank OJSC Via VTB Capital SA 144A sr. unsec. notes | | | |
| 6 7/8s, 2018 (Russia) | | 22,451,000 | 24,752,228 |
|
| VTB Bank OJSC Via VTB Capital SA 144A sr. unsec. notes | | | |
| 6 1/4s, 2035 (Russia) | | 23,618,000 | 25,505,551 |
|
| | | | 192,605,636 |
| Health care (2.5%) | | | |
| Acadia Healthcare Co., Inc. 144A company guaranty sr. unsec. | | | |
| notes 6 1/8s, 2021 | | 955,000 | 986,038 |
|
| AmSurg Corp. 144A company guaranty sr. unsec. unsub. notes | | | |
| 5 5/8s, 2020 | | 1,210,000 | 1,273,525 |
|
| Aviv Healthcare Properties LP company guaranty sr. unsec. | | | |
| notes 7 3/4s, 2019 | | 1,901,000 | 2,043,575 |
|
| Bayer AG jr. unsec. sub. bonds FRB 5s, 2105 (Germany) | EUR | 819,000 | 1,100,490 |
|
| Biomet, Inc. 144A sr. unsec. notes 6 1/2s, 2020 | | $2,085,000 | 2,212,706 |
|
| Capella Healthcare, Inc. company guaranty sr. unsec. notes | | | |
| 9 1/4s, 2017 | | 1,610,000 | 1,742,825 |
|
| Capsugel FinanceCo SCA 144A company guaranty sr. unsec. | | | |
| notes 9 7/8s, 2019 | EUR | 3,075,000 | 4,429,278 |
|
| CDRT Holding Corp. 144A sr. unsec. notes 9 1/4s, 2017 ‡‡ | | $1,925,000 | 1,992,375 |
|
| CHS/Community Health Systems, Inc. company guaranty sr. | | | |
| notes 5 1/8s, 2018 | | 1,505,000 | 1,576,488 |
|
| CHS/Community Health Systems, Inc. company guaranty sr. | | | |
| unsec. unsub. notes 8s, 2019 | | 721,000 | 798,508 |
|
| ConvaTec Healthcare E SA 144A sr. notes 7 3/8s, | | | |
| 2017 (Luxembourg) | EUR | 865,000 | 1,182,425 |
|
| ConvaTec Healthcare E SA 144A sr. unsec. notes 10 1/2s, | | | |
| 2018 (Luxembourg) | | $6,000,000 | 6,690,000 |
|
| Emergency Medical Services Corp. company guaranty sr. unsec. | | | |
| notes 8 1/8s, 2019 | | 2,594,000 | 2,846,915 |
|
| Endo Health Solutions, Inc. company guaranty sr. unsec. | | | |
| notes 7s, 2019 | | 1,880,000 | 2,009,250 |
|
| Fresenius Medical Care US Finance II, Inc. 144A company | | | |
| guaranty sr. unsec. notes 5 5/8s, 2019 | | 1,675,000 | 1,838,313 |
|
| Fresenius US Finance II, Inc. 144A sr. unsec. notes 9s, 2015 | | 2,160,000 | 2,473,200 |
|
| HCA, Inc. company guaranty sr. notes 7 7/8s, 2020 | | 1,500,000 | 1,657,500 |
|
| HCA, Inc. sr. notes 6 1/2s, 2020 | | 5,698,000 | 6,424,495 |
|
| HCA, Inc. sr. unsec. notes 7 1/2s, 2022 | | 741,000 | 853,076 |
|
| Health Net, Inc. sr. unsec. bonds 6 3/8s, 2017 | | 3,240,000 | 3,466,800 |
|
| Hologic, Inc. company guaranty sr. unsec. unsub. notes | | | |
| 6 1/4s, 2020 | | 455,000 | 484,006 |
|
| IASIS Healthcare, LLC/IASIS Capital Corp. company guaranty sr. | | | |
| unsec. notes 8 3/8s, 2019 | | 1,906,000 | 2,003,683 |
|
| IMS Health, Inc. 144A sr. unsec. notes 6s, 2020 | | 816,000 | 850,680 |
|
| Jaguar Holding Co. I 144A sr. unsec. notes 9 3/8s, 2017 ‡‡ | | 775,000 | 832,156 |
|
| Jaguar Holding Co. II/Jaguar Merger Sub, Inc. 144A sr. unsec. | | | |
| notes 9 1/2s, 2019 | | 1,349,000 | 1,547,978 |
|
| Kinetic Concepts, Inc./KCI USA, Inc. company guaranty notes | | | |
| 10 1/2s, 2018 | | 1,524,000 | 1,653,540 |
|
| |
| Diversified Income Trust | 43 |
| | |
| CORPORATE BONDS AND NOTES (37.8%)* cont. | Principal amount | Value |
|
| Health care cont. | | |
| Kinetic Concepts, Inc./KCI USA, Inc. company guaranty sr. | | |
| unsec. notes 12 1/2s, 2019 | $1,213,000 | $1,199,354 |
|
| Multiplan, Inc. 144A company guaranty sr. notes 9 7/8s, 2018 | 1,910,000 | 2,122,488 |
|
| Omega Healthcare Invepstors, Inc. company guaranty sr. unsec. | | |
| notes 6 3/4s, 2022 R | 1,266,000 | 1,395,765 |
|
| Priory Group No. 3 PLC 144A company guaranty sr. notes 7s, | | |
| 2018 (United Kingdom) | 2,990,000 | 4,684,265 |
|
| Rottapharm Ltd. 144A sr. unsec. notes 6 1/8s, 2019 (Ireland) | 1,085,000 | 1,399,083 |
|
| Service Corporation International sr. notes 7s, 2019 | 970,000 | 1,052,450 |
|
| Service Corporation International sr. notes 7s, 2017 | 3,136,000 | 3,563,280 |
|
| Sky Growth Acquisition Corp. 144A company guaranty sr. | | |
| unsec. notes 7 3/8s, 2020 | 1,913,000 | 2,022,998 |
|
| Stewart Enterprises, Inc. company guaranty sr. unsec. notes | | |
| 6 1/2s, 2019 | 2,790,000 | 2,978,325 |
|
| Surgical Care Affiliates, Inc. 144A sr. sub. notes 10s, 2017 | 1,505,000 | 1,567,081 |
|
| Surgical Care Affiliates, Inc. 144A sr. unsec. notes 8 7/8s, 2015 | 834,910 | 845,346 |
|
| Teleflex, Inc. company guaranty sr. unsec. sub. notes | | |
| 6 7/8s, 2019 | 2,400,000 | 2,598,000 |
|
| Tenet Healthcare Corp. company guaranty sr. notes 6 1/4s, 2018 | 2,265,000 | 2,514,150 |
|
| Tenet Healthcare Corp. sr. notes 8 7/8s, 2019 | 2,627,000 | 2,955,375 |
|
| Tenet Healthcare Corp. 144A company guaranty sr. notes | | |
| 4 1/2s, 2021 | 450,000 | 441,000 |
|
| Valeant Pharmaceuticals International 144A company guaranty | | |
| sr. notes 7s, 2020 | 350,000 | 377,125 |
|
| Valeant Pharmaceuticals International 144A company guaranty | | |
| sr. unsec. notes 6 7/8s, 2018 | 900,000 | 966,938 |
|
| Valeant Pharmaceuticals International 144A sr. notes | | |
| 6 3/4s, 2017 | 350,000 | 375,813 |
|
| VPI Escrow Corp. 144A sr. unsec. notes 6 3/8s, 2020 | 290,000 | 305,950 |
|
| | | 88,334,611 |
| Technology (1.4%) | | |
| Avaya, Inc. 144A company guaranty notes 10 1/2s, 2021 | 1,786,000 | 1,701,165 |
|
| Avaya, Inc. 144A company guaranty sr. notes 7s, 2019 | 2,414,000 | 2,359,685 |
|
| Ceridian Corp. company guaranty sr. unsec. notes | | |
| 12 1/4s, 2015 ‡‡ | 1,453,000 | 1,502,039 |
|
| Ceridian Corp. sr. unsec. notes 11 1/4s, 2015 | 3,905,000 | 4,031,913 |
|
| Ceridian Corp. 144A sr. notes 8 7/8s, 2019 | 520,000 | 605,800 |
|
| CyrusOne LP/CyrusOne Finance Corp. 144A company guaranty | | |
| sr. unsec. unsub. notes 6 3/8s, 2022 | 395,000 | 413,763 |
|
| Epicor Software Corp. company guaranty sr. unsec. notes | | |
| 8 5/8s, 2019 | 1,024,000 | 1,108,480 |
|
| Fidelity National Information Services, Inc. company guaranty sr. | | |
| unsec. notes 7 7/8s, 2020 | 1,239,000 | 1,396,973 |
|
| First Data Corp. company guaranty sr. unsec. notes | | |
| 12 5/8s, 2021 | 4,738,000 | 5,134,808 |
|
| First Data Corp. 144A company guaranty notes 8 1/4s, 2021 | 1,255,000 | 1,305,200 |
|
| First Data Corp. 144A company guaranty sr. notes 8 7/8s, 2020 | 820,000 | 916,350 |
|
| First Data Corp. 144A company guaranty sr. notes 7 3/8s, 2019 | 1,245,000 | 1,324,369 |
|
| First Data Corp. 144A company guaranty sr. unsec. notes | | |
| 11 1/4s, 2021 | 1,240,000 | 1,289,600 |
|
| |
| 44 | Diversified Income Trust |
| | | |
| CORPORATE BONDS AND NOTES (37.8%)* cont. | | Principal amount | Value |
|
| Technology cont. | | | |
| Freescale Semiconductor, Inc. company guaranty sr. unsec. | | | |
| notes 10 3/4s, 2020 | | $1,977,000 | $2,243,895 |
|
| Freescale Semiconductor, Inc. 144A company guaranty sr. notes | | | |
| 10 1/8s, 2018 | | 4,480,000 | 4,961,600 |
|
| Infor US, Inc. company guaranty sr. unsec. notes 9 3/8s, 2019 | | 555,000 | 629,231 |
|
| Iron Mountain, Inc. company guaranty sr. unsec. sub. | | | |
| notes 8s, 2020 | | 2,300,000 | 2,415,000 |
|
| Iron Mountain, Inc. sr. sub. notes 8 3/8s, 2021 | | 4,150,000 | 4,559,813 |
|
| NXP BV/NXP Funding, LLC 144A sr. unsec. notes 5 3/4s, | | | |
| 2023 (Netherlands) | | 1,035,000 | 1,055,700 |
|
| SunGard Data Systems, Inc. 144A company guaranty sr. sub. | | | |
| notes 6 5/8s, 2019 | | 1,060,000 | 1,094,450 |
|
| SunGard Data Systems, Inc. 144A sr. unsec. notes 7 5/8s, 2020 | | 2,062,000 | 2,234,693 |
|
| Syniverse Holdings, Inc. company guaranty sr. unsec. notes | | | |
| 9 1/8s, 2019 | | 3,115,000 | 3,418,713 |
|
| Techem Energy Metering Service GmbH 144A sr. sub. bonds | | | |
| 7 7/8s, 2020 (Germany) | | 1,550,000 | 2,118,519 |
|
| | | | 47,821,759 |
| Transportation (0.5%) | | | |
| Aguila 3 SA company guaranty sr. notes Ser. REGS, 7 7/8s, | | | |
| 2018 (Luxembourg) | CHF | 6,917,000 | 7,796,471 |
|
| Aguila 3 SA 144A company guaranty sr. notes 7 7/8s, | | | |
| 2018 (Luxembourg) | | $545,000 | 584,513 |
|
| Air Medical Group Holdings, Inc. company guaranty sr. notes | | | |
| 9 1/4s, 2018 | | 2,993,000 | 3,303,524 |
|
| Swift Services Holdings, Inc. company guaranty sr. | | | |
| notes 10s, 2018 | | 3,585,000 | 4,104,825 |
|
| Watco Cos LLC/Watco Finance Corp. 144A company guaranty | | | |
| sr. unsec. notes 6 3/8s, 2023 | | 670,000 | 689,263 |
|
| Western Express, Inc. 144A sr. notes 12 1/2s, 2015 | | 472,000 | 344,560 |
|
| | | | 16,823,156 |
| Utilities and power (2.1%) | | | |
| AES Corp. (VA) sr. unsec. unsub. notes 8s, 2017 | | 5,000,000 | 5,881,250 |
|
| AES Corp. (VA) sr. unsec. unsub. notes 7 3/8s, 2021 | | 1,960,000 | 2,273,600 |
|
| Calpine Corp. 144A sr. notes 7 1/4s, 2017 | | 6,203,000 | 6,575,180 |
|
| Cenrais Electricas Brasileiras SA 144A sr. unsec. unsub. notes | | | |
| 5 3/4s, 2021 (Brazil) | | 500,000 | 533,125 |
|
| Colorado Interstate Gas Co., LLC debs. 6.85s, 2037 (Canada) | | 2,495,000 | 3,026,428 |
|
| El Paso Corp. sr. unsec. notes 7s, 2017 | | 4,910,000 | 5,615,700 |
|
| El Paso Natural Gas Co. debs. 8 5/8s, 2022 | | 2,976,000 | 4,090,848 |
|
| Energy Future Intermediate Holding Co., LLC/EFIH Finance, Inc. | | | |
| sr. notes 10s, 2020 | | 6,590,000 | 7,471,413 |
|
| Energy Future Intermediate Holding Co., LLC/EFIH Finance, Inc. | | | |
| 144A notes 11 3/4s, 2022 | | 875,000 | 1,006,250 |
|
| Energy Future Intermediate Holding Co., LLC/EFIH Finance, Inc. | | | |
| 144A sr. notes 10s, 2020 | | 7,000,000 | 7,875,000 |
|
| Energy Transfer Equity LP company guaranty sr. unsec. notes | | | |
| 7 1/2s, 2020 | | 4,506,000 | 5,193,165 |
|
| EP Energy, LLC/Everest Acquisition Finance, Inc. company | | | |
| guaranty sr. notes 6 7/8s, 2019 | | 765,000 | 837,675 |
|
| EP Energy, LLC/Everest Acquisition Finance, Inc. company | | | |
| guaranty sr. unsec. notes 7 3/4s, 2022 | | 485,000 | 535,925 |
|
| |
| Diversified Income Trust | 45 |
| | | |
| CORPORATE BONDS AND NOTES (37.8%)* cont. | | Principal amount | Value |
|
| Utilities and power cont. | | | |
| EP Energy/EP Energy Finance, Inc. sr. unsec. notes 9 3/8s, 2020 | | $2,730,000 | $3,153,150 |
|
| EPE Holdings, LLC/EP Energy Bond Co., Inc. 144A sr. unsec. | | | |
| notes 8 1/8s, 2017 ‡‡ | | 950,000 | 988,000 |
|
| FirstEnergy Corp. sr. unsec. unsub. notes 4 1/4s, 2023 | | 605,000 | 611,885 |
|
| GenOn Energy, Inc. sr. unsec. notes 9 7/8s, 2020 | | 3,271,000 | 3,745,295 |
|
| GenOn Energy, Inc. sr. unsec. notes 9 1/2s, 2018 | | 530,000 | 624,075 |
|
| Ipalco Enterprises, Inc. 144A sr. notes 7 1/4s, 2016 | | 490,000 | 550,025 |
|
| NGPL PipeCo, LLC 144A sr. notes 9 5/8s, 2019 | | 760,000 | 851,200 |
|
| NRG Energy, Inc. company guaranty sr. unsec. notes 7/8s, 2021 | | 6,000,000 | 6,675,000 |
|
| NV Energy, Inc. sr. unsec. notes 6 1/4s, 2020 | | 1,370,000 | 1,654,627 |
|
| Regency Energy Partners company guaranty sr. unsec. unsub. | | | |
| notes 5 1/2s, 2023 | | 1,140,000 | 1,219,800 |
|
| Tennessee Gas Pipeline Co., LLC sr. unsec. unsub. debs. 7s, 2028 | | 520,000 | 705,813 |
|
| Texas Competitive/Texas Competitive Electric Holdings Co., LLC | | | |
| 144A company guaranty sr. notes 11 1/2s, 2020 | | 1,440,000 | 1,076,400 |
|
| Vattenfall AB jr. unsec. sub. FRB bonds 5 1/4s, perpetual | | | |
| maturity (Sweden) | EUR | 819,000 | 1,100,637 |
|
| | | | 73,871,466 |
| | | | |
| Total corporate bonds and notes (cost $1,261,700,568) | | | $1,333,249,573 |
| |
| |
| U.S. GOVERNMENT AND AGENCY | | | |
| MORTGAGE OBLIGATIONS (17.9%)* | | Principal amount | Value |
|
| U.S. Government Guaranteed Mortgage Obligations (1.6%) | | | |
| Government National Mortgage Association Pass-Through Certificates | | |
| 6 1/2s, November 20, 2038 | | $892,518 | $1,012,554 |
| 3s, TBA, May 1, 2043 | | 24,000,000 | 24,993,749 |
| 3s, TBA, April 1, 2043 | | 24,000,000 | 25,059,374 |
| 3s, TBA, April 1, 2043 | | 3,000,000 | 3,135,234 |
|
| | | | 54,200,911 |
| U.S. Government Agency Mortgage Obligations (16.3%) | | | |
| Federal National Mortgage Association Pass-Through Certificates | | | |
| 3s, TBA, May 1, 2043 | | 165,000,000 | 169,698,639 |
| 3s, TBA, April 1, 2043 | | 394,000,000 | 406,281,729 |
|
| | | | 575,980,368 |
| | | | |
| Total U.S. government and agency mortgage obligations (cost $628,776,979) | $630,181,279 |
| |
| |
| U.S. TREASURY OBLIGATIONS (—%)* | | Principal amount | Value |
|
| U.S. Treasury Notes | | | |
| 0.250%, May 31, 2014 i | | $133,000 | $133,202 |
| 0.250%, April 30, 2014 i | | 263,000 | 263,468 |
|
| Total U.S. treasury obligations (cost $396,670) | | | $396,670 |
| |
| |
| FOREIGN GOVERNMENT AND AGENCY | | | |
| BONDS AND NOTES (6.9%)* | Principal amount/units | Value |
|
| Argentina (Republic of) sr. unsec. bonds 7s, 2017 (Argentina) | | $12,925,000 | $10,372,313 |
|
| Argentina (Republic of) sr. unsec. bonds Ser. VII, 7s, | | | |
| 2013 (Argentina) | | 3,495,000 | 3,463,545 |
|
| Argentina (Republic of) sr. unsec. bonds FRB 0.448s, | | | |
| 2013 (Argentina) | | 10,393,000 | 1,278,339 |
|
| |
| 46 | Diversified Income Trust |
| | | |
| FOREIGN GOVERNMENT AND AGENCY | | | |
| BONDS AND NOTES (6.9%)* cont. | Principal amount/units | Value |
|
| Argentina (Republic of) sr. unsec. unsub. bonds 7s, | | | |
| 2015 (Argentina) | | $52,418,000 | $44,162,165 |
|
| Brazil (Federal Republic of) unsec. notes 10s, 2017 (Brazil) | units | 7,250 | 3,753,363 |
|
| Brazil (Federal Republic of) unsub. notes 10s, 2014 (Brazil) | units | 20,095 | 10,319,328 |
|
| Export-Import Bank of Korea 144A sr. unsec. unsub. notes 5.1s, | | | |
| 2013 (India) | INR | 182,100,000 | 3,247,746 |
|
| Ghana (Republic of) 144A unsec. notes 8 1/2s, 2017 (Ghana) | | $4,340,000 | 4,975,680 |
|
| Hellenic (Republic of) sr. unsec. unsub. bonds Ser. PSI, | | | |
| stepped-coupon 2s (3s, 2/24/15), 2042 (Greece) †† | EUR | 1,601,000 | 717,177 |
|
| Hellenic (Republic of) sr. unsec. unsub. bonds Ser. PSI, | | | |
| stepped-coupon 2s (3s, 2/24/15), 2041 (Greece) †† | EUR | 1,141,000 | 512,302 |
|
| Hellenic (Republic of) sr. unsec. unsub. bonds Ser. PSI, | | | |
| stepped-coupon 2s (3s, 2/24/15), 2040 (Greece) †† | EUR | 1,601,000 | 719,722 |
|
| Hellenic (Republic of) sr. unsec. unsub. bonds Ser. PSI, | | | |
| stepped-coupon 2s (3s, 2/24/15), 2039 (Greece) †† | EUR | 2,521,000 | 1,131,493 |
|
| Hellenic (Republic of) sr. unsec. unsub. bonds Ser. PSI, | | | |
| stepped-coupon 2s (3s, 2/24/15), 2038 (Greece) †† | EUR | 8,951,000 | 4,033,631 |
|
| Hellenic (Republic of) sr. unsec. unsub. bonds Ser. PSI, | | | |
| stepped-coupon 2s (3s, 2/24/15), 2037 (Greece) †† | EUR | 2,051,000 | 920,466 |
|
| Hellenic (Republic of) sr. unsec. unsub. bonds Ser. PSI, | | | |
| stepped-coupon 2s (3s, 2/24/15), 2036 (Greece) †† | EUR | 4,111,000 | 1,862,624 |
|
| Hellenic (Republic of) sr. unsec. unsub. bonds Ser. PSI, | | | |
| stepped-coupon 2s (3s, 2/24/15), 2035 (Greece) †† | EUR | 5,751,000 | 2,589,241 |
|
| Hellenic (Republic of) sr. unsec. unsub. bonds Ser. PSI, | | | |
| stepped-coupon 2s (3s, 2/24/15), 2034 (Greece) †† | EUR | 3,431,000 | 1,560,201 |
|
| Hellenic (Republic of) sr. unsec. unsub. bonds Ser. PSI, | | | |
| stepped-coupon 2s (3s, 2/24/15), 2033 (Greece) †† | EUR | 1,601,000 | 731,296 |
|
| Hellenic (Republic of) sr. unsec. unsub. bonds Ser. PSI, | | | |
| stepped-coupon 2s (3s, 2/24/15), 2032 (Greece) †† | EUR | 3,671,000 | 1,693,855 |
|
| Hellenic (Republic of) sr. unsec. unsub. bonds Ser. PSI, | | | |
| stepped-coupon 2s (3s, 2/24/15), 2031 (Greece) †† | EUR | 681,000 | 316,720 |
|
| Hellenic (Republic of) sr. unsec. unsub. bonds Ser. PSI, | | | |
| stepped-coupon 2s (3s, 2/24/15), 2030 (Greece) †† | EUR | 10,181,000 | 4,800,635 |
|
| Hellenic (Republic of) sr. unsec. unsub. bonds Ser. PSI, | | | |
| stepped-coupon 2s (3s, 2/24/15), 2029 (Greece) †† | EUR | 1,141,000 | 549,408 |
|
| Hellenic (Republic of) sr. unsec. unsub. bonds Ser. PSI, | | | |
| stepped-coupon 2s (3s, 2/24/15), 2028 (Greece) †† | EUR | 5,751,000 | 2,804,870 |
|
| Hellenic (Republic of) sr. unsec. unsub. bonds Ser. PSI, | | | |
| stepped-coupon 2s (3s, 2/24/15), 2027 (Greece) †† | EUR | 1,141,000 | 574,433 |
|
| Hellenic (Republic of) sr. unsec. unsub. bonds Ser. PSI, | | | |
| stepped-coupon 2s (3s, 2/24/15), 2026 (Greece) †† | EUR | 4,831,000 | 2,528,819 |
|
| Hellenic (Republic of) sr. unsec. unsub. bonds Ser. PSI, | | | |
| stepped-coupon 2s (3s, 2/24/15), 2025 (Greece) †† | EUR | 15,941,000 | 8,703,242 |
|
| Hellenic (Republic of) sr. unsec. unsub. bonds Ser. PSI, | | | |
| stepped-coupon 2s (3s, 2/24/15), 2024 (Greece) †† | EUR | 1,451,000 | 828,912 |
|
| |
| Diversified Income Trust | 47 |
| | | |
| FOREIGN GOVERNMENT AND AGENCY | | | |
| BONDS AND NOTES (6.9%)* cont. | | Principal amount | Value |
|
| Hellenic (Republic of) sr. unsec. unsub. bonds Ser. PSI, | | | |
| stepped-coupon 2s (3s, 2/24/15), 2023 (Greece) †† | EUR | 6,781,000 | $4,089,260 |
|
| Hungary (Government of) sr. unsec. unsub. notes 4 1/8s, | | | |
| 2018 (Hungary) | | $3,740,000 | 3,553,791 |
|
| Indonesia (Republic of) 144A sr. unsec. unsub. bonds 6 5/8s, | | | |
| 2037 (Indonesia) | | 3,255,000 | 4,034,312 |
|
| International Bank for Reconstruction & Development sr. disc. | | | |
| unsec. unsub. notes Ser. GDIF, 5 1/4s, 2014 (Supra-Nation) | RUB | 123,450,000 | 3,912,761 |
|
| Iraq (Republic of) 144A bonds 5.8s, 2028 (Iraq) | | $2,905,000 | 2,684,220 |
|
| Ireland (Republic of) unsec. bonds 5 1/2s, 2017 (Ireland) | EUR | 14,029,000 | 19,934,070 |
|
| Portugal (Republic of) sr. unsec. unsub. bonds 4.35s, | | | |
| 2017 (Portugal) | | $4,199,000 | 5,215,204 |
|
| Russia (Federation of) sr. unsec. unsub. bonds 7 1/2s, | | | |
| 2030 (Russia) | | 792,709 | 979,201 |
|
| Serbia (Republic of) 144A sr. unsec. bonds 4 7/8s, 2020 (Serbia) | | 2,050,000 | 2,025,412 |
|
| Spain (Kingdom of) sr. unsec. bonds 5 1/2s, 2017 (Spain) | EUR | 4,199,000 | 5,775,090 |
|
| Sri Lanka (Republic of) 144A notes 7.4s, 2015 (Sri Lanka) | | $1,300,000 | 1,386,931 |
|
| Turkey (Republic of) sr. unsec. bonds 5 5/8s, 2021 (Turkey) | | 6,800,000 | 7,749,960 |
|
| Turkey (Republic of) sr. unsec. notes 7 1/2s, 2017 (Turkey) | | 5,015,000 | 5,992,925 |
|
| Turkey (Republic of) unsec. notes 6 3/4s, 2040 (Turkey) | | 5,080,000 | 6,242,710 |
|
| Ukraine (Government of) Financing of Infrastructural Projects | | | |
| State Enterprise 144A govt. guaranty notes 8 3/8s, 2017 (Ukraine) | | 2,700,000 | 2,737,125 |
|
| Ukraine (Government of) 144A bonds 7 3/4s, 2020 (Ukraine) | | 7,125,000 | 7,402,875 |
|
| Ukraine (Government of) 144A notes 9 1/4s, 2017 (Ukraine) | | 3,330,000 | 3,586,172 |
|
| Ukraine (Government of) 144A sr. unsec. bonds 7.95s, | | | |
| 2014 (Ukraine) | | 5,200,000 | 5,316,650 |
|
| Ukraine (Government of) 144A sr. unsec. notes 7.8s, | | | |
| 2022 (Ukraine) | | 4,500,000 | 4,578,750 |
|
| Ukraine (Government of) 144A sr. unsec. unsub. notes 7.65s, | | | |
| 2013 (Ukraine) | | 14,610,000 | 14,681,589 |
|
| Venezuela (Republic of) sr. unsec. bonds 7s, 2038 (Venezuela) | | 2,900,000 | 2,252,604 |
|
| Venezuela (Republic of) unsec. notes 10 3/4s, 2013 (Venezuela) | | 4,150,000 | 4,218,309 |
|
| Venezuela (Republic of) 144A unsec. bonds 13 5/8s, | | | |
| 2018 (Venezuela) | | 4,935,000 | 5,699,777 |
|
| Total foreign government and agency bonds and notes (cost $255,607,638) | $243,201,224 |
| |
| |
| SENIOR LOANS (1.2%)*c | | Principal amount | Value |
|
| Ardent Medical Services, Inc. bank term loan FRN 6 3/4s, 2018 | | $1,251,863 | $1,270,640 |
|
| Burlington Coat Factory Warehouse Corp. bank term loan FRN | | | |
| Ser. B1, 5 1/2s, 2017 | | 714,894 | 723,048 |
|
| Caesars Entertainment Operating Co., Inc. bank term loan FRN | | | |
| Ser. B6, 5.454s, 2018 | | 5,776,936 | 5,347,999 |
|
| Charter Communications Operating, LLC bank term loan FRN | | | |
| Ser. C, 3.47s, 2016 | | 199,094 | 199,729 |
|
| Chesapeake Energy Corp. bank term loan FRN Ser. B, | | | |
| 5 3/4s, 2017 | | 2,091,000 | 2,153,356 |
|
| Clear Channel Communications, Inc. bank term loan FRN Ser. B, | | | |
| 3.854s, 2016 | | 4,921,601 | 4,357,158 |
|
| Emergency Medical Services Corp. bank term loan FRN | | | |
| Ser. B, 4s, 2018 | | 2,136,856 | 2,158,225 |
|
| First Data Corp. bank term loan FRN 5.204s, 2017 | | 61,131 | 61,284 |
|
| |
| 48 | Diversified Income Trust |
| | | |
| SENIOR LOANS (1.2%)*c cont. | | Principal amount | Value |
|
| First Data Corp. bank term loan FRN 4.204s, 2018 | | $574,435 | $572,424 |
|
| Frac Tech International, LLC bank term loan FRN Ser. B, | | |
| 8 1/2s, 2016 | | 1,758,535 | 1,666,945 |
|
| Golden Nugget, Inc. bank term loan FRN Ser. B, 3.21s, 2014 ‡‡ | 402,133 | 388,260 |
|
| Golden Nugget, Inc. bank term loan FRN Ser. DD, 3.21s, 2014 ‡‡ | 228,899 | 221,002 |
|
| H.J. Heinz Co. bank term loan FRN Ser. B2, 3 1/2s, 2020 | 1,420,000 | 1,432,070 |
|
| Intelsat SA bank term loan FRN 3.205s, 2014 (Luxembourg) | 1,987,780 | 1,985,918 |
|
| iStar Financial, Inc. bank term loan FRN 4 1/2s, 2017 R | 1,121,739 | 1,130,152 |
|
| Motor City Casino bank term loan FRN 6s, 2017 | | 3,107,202 | 3,130,506 |
|
| Navistar, Inc. bank term loan FRN Ser. B, 7s, 2017 | | 708,225 | 714,675 |
|
| Neiman Marcus Group, Inc. (The) bank term loan FRN 4s, 2018 | 2,362,808 | 2,383,482 |
|
| Nexeo Solutions, LLC bank term loan FRN Ser. B, 5s, 2017 | 1,244,600 | 1,247,712 |
|
| Plains Exploration & Production Co. bank term loan FRN | | |
| Class B, 4s, 2019 | | 1,520,000 | 1,520,543 |
|
| Quintiles Transnational Holdings, Inc. bank term loan FRN | | |
| 7 1/2s, 2017 ‡‡ | | 610,000 | 623,725 |
|
| Servicemaster Co. bank term loan FRN 4.46s, 2017 | | 579,265 | 584,153 |
|
| Springleaf Financial Funding Co. bank term loan FRN Ser. B, | | |
| 5 1/2s, 2017 | | 1,845,000 | 1,855,378 |
|
| SRAM Corp. bank term loan FRN 8 1/2s, 2018 | | 885,000 | 898,275 |
|
| Texas Competitive Electric Holdings Co., LLC bank term loan | | |
| FRN 4.733s, 2017 | | 4,000,000 | 2,836,000 |
|
| Thomson Learning bank term loan FRN Ser. B, 2.71s, 2014 | 1,148,010 | 881,815 |
|
| Travelport, LLC bank term loan FRN Ser. B, 5.056s, 2015 | 1,038,004 | 1,032,165 |
|
| Travelport, LLC bank term loan FRN Ser. S, 5.061s, 2015 | 326,996 | 325,157 |
|
| Tronox, Ltd. bank term loan FRN Ser. B, 4 1/2s, 2020 | | 1,260,000 | 1,275,300 |
|
| West Corp. bank term loan FRN Ser. B8, 4 1/4s, 2018 | | 161,601 | 164,025 |
|
| Total senior loans (cost $44,012,867) | | | $43,141,121 |
| |
| |
| PURCHASED SWAP OPTIONS OUTSTANDING (0.5%)* | | | |
| Counterparty | | | |
| Fixed right % to receive or (pay)/ | Expiration | Contract | |
| Floating rate index/Maturity date | date/strike | amount | Value |
|
| Goldman Sachs International | | | |
| (1.53)/3 month USD-LIBOR-BBA/Jan-18 | Jan-16/1.53 | $647,819,000 | $6,270,888 |
|
| (1.5725)/3 month USD-LIBOR-BBA/Jan-18 | Jan-16/1.5725 | 647,819,000 | 5,888,675 |
|
| JPMorgan Chase Bank N.A. | | | |
| (1.555)/3 month USD-LIBOR-BBA/Jan-18 | Jan-16/1.555 | 647,819,000 | 5,966,413 |
|
| Total purchased swap options outstanding (cost $18,926,680) | | $18,125,976 |
| |
| |
| CONVERTIBLE BONDS AND NOTES (0.1%)* | | Principal amount | Value |
|
| iStar Financial, Inc. cv. sr. unsec. unsub. notes 3s, 2016 R | $910,000 | $1,069,819 |
|
| Navistar International Corp. cv. sr. unsec. sub. notes 3s, 2014 | 1,053,000 | 1,074,718 |
|
| Steel Dynamics, Inc. cv. sr. notes 5 1/8s, 2014 | | 1,045,000 | 1,173,013 |
|
| Total convertible bonds and notes (cost $3,030,624) | | | $3,317,550 |
| |
| Diversified Income Trust | 49 |
| | |
| SHORT-TERM INVESTMENTS (9.7%)* | Principal amount/shares | Value |
|
| Putnam Short Term Investment Fund 0.08% L | 145,246,147 | $145,246,147 |
|
| SSgA Prime Money Market Fund 0.02% P | 7,710,000 | 7,710,000 |
|
| Straight-A Funding, LLC 144A, Ser. 1 commercial paper with | | |
| an effective yield of 0.19%, April 22, 2013 | $25,015,000 | 25,012,228 |
|
| Straight-A Funding, LLC 144A, Ser. 1 commercial paper with | | |
| an effective yield of 0.19%, April 19, 2013 | 29,700,000 | 29,697,178 |
|
| Straight-A Funding, LLC 144A, Ser. 1 commercial paper with | | |
| an effective yield of 0.18%, June 14, 2013 | 25,000,000 | 24,990,750 |
|
| U.S. Treasury Bills with effective yields ranging from 0.15% | | |
| to 0.17%, July 25, 2013 # ∆ | 108,941,000 | 108,883,844 |
|
| Total short-term investments (cost $341,540,147) | | $341,540,147 |
| |
| |
| TOTAL INVESTMENTS | | |
|
| Total investments (cost $4,005,669,018) | | $4,162,550,465 |
Key to holding’s currency abbreviations
| |
| AUD | Australian Dollar |
| BRL | Brazilian Real |
| CAD | Canadian Dollar |
| CHF | Swiss Franc |
| CZK | Czech Koruna |
| EUR | Euro |
| GBP | British Pound |
| INR | Indian Rupee |
| JPY | Japanese Yen |
| MXN | Mexican Peso |
| PLN | Polish Zloty |
| RUB | Russian Ruble |
| SEK | Swedish Krona |
| USD/$ | United States Dollar |
Key to holding’s abbreviations
| |
| bp | Basis Points |
| EMTN | Euro Medium Term Notes |
| FRB | Floating Rate Bonds: the rate shown is the current interest rate at the close of the reporting period |
| FRN | Floating Rate Notes: the rate shown is the current interest rate at the close of the reporting period |
| IFB | Inverse Floating Rate Bonds, which are securities that pay interest rates that vary inversely to changes |
| | in the market interest rates. As interest rates rise, inverse floaters produce less current income. The rate |
| | shown is the current interest rate at the close of the reporting period. |
| IO | Interest Only |
| JSC | Joint Stock Company |
| MTN | Medium Term Notes |
| OAO | Open Joint Stock Company |
| OJSC | Open Joint Stock Company |
| OTC | Over-the-counter |
| PO | Principal Only |
| TBA | To Be Announced Commitments |
| |
| 50 | Diversified Income Trust |
Notes to the fund’s portfolio
Unless noted otherwise, the notes to the fund’s portfolio are for the close of the fund’s reporting period, which ran from October 1, 2012 through March 31, 2013 (the reporting period). Within the following notes to the portfolio, references to “ASC 820” represent Accounting Standards Codification ASC 820 Fair Value Measurements and Disclosures and references to “OTC”, if any, represent over-the-counter.
* Percentages indicated are based on net assets of $3,526,637,142.
† Non-income-producing security.
†† The interest rate and date shown parenthetically represent the new interest rate to be paid and the date the fund will begin accruing interest at this rate.
‡‡ Income may be received in cash or additional securities at the discretion of the issuer.
# This security, in part or in entirety, was pledged and segregated with the broker to cover margin requirements for futures contracts at the close of the reporting period.
∆ This security, in part or in entirety, was pledged and segregated with the custodian for collateral on certain derivative contracts at the close of the reporting period.
## Forward commitment, in part or in entirety (Note 1).
c Senior loans are exempt from registration under the Securities Act of 1933, as amended, but contain certain restrictions on resale and cannot be sold publicly. These loans pay interest at rates which adjust periodically. The interest rates shown for senior loans are the current interest rates at the close of the reporting period. Senior loans are also subject to mandatory and/or optional prepayment which cannot be predicted. As a result, the remaining maturity may be substantially less than the stated maturity shown (Notes 1 and 7).
F Is valued at fair value following procedures approved by the Trustees. Securities may be classified as Level 2 or Level 3 for ASC 820 based on the securities’ valuation inputs.
g The notes are secured by debt and equity securities and equity participation agreements held by Neon Capital, Ltd.
i Security was pledged, or purchased with cash that was pledged, to the fund for collateral on certain derivative contracts (Note 1).
L Affiliated company (Note 6). The rate quoted in the security description is the annualized 7-day yield of the fund at the close of the reporting period.
P Security was pledged, or purchased with cash that was pledged, to the fund for collateral on certain derivatives contracts. The rate quoted in the security description is the annualized 7-day yield of the fund at the close of the reporting period (Note 1).
R Real Estate Investment Trust.
At the close of the reporting period, the fund maintained liquid assets totaling $731,566,468 to cover certain derivatives contracts.
Debt obligations are considered secured unless otherwise indicated.
144A after the name of an issuer represents securities exempt from registration under Rule 144A under the Securities Act of 1933, as amended. These securities may be resold in transactions exempt from registration, normally to qualified institutional buyers.
See Note 1 to the financial statements regarding TBA’s.
The dates shown on debt obligations are the original maturity dates.
| |
| Diversified Income Trust | 51 |
|
| DIVERSIFICATION BY COUNTRY |
|
Distribution of investments by country of risk at the close of the reporting period, excluding collateral received, if any (as a percentage of Portfolio Value):
| | | | |
| United States | 83.7% | | Greece | 1.0% |
| |
|
| Venezuela | 2.4 | | Ireland | 0.8 |
| |
|
| Russia | 2.1 | | Germany | 0.7 |
| |
|
| Luxembourg | 1.6 | | Canada | 0.6 |
| |
|
| Argentina | 1.4 | | Turkey | 0.5 |
| |
|
| United Kingdom | 1.2 | | Other | 3.0 |
| |
|
| Ukraine | 1.0 | | Total | 100.0% |
| | |
FORWARD CURRENCY CONTRACTS at 3/31/13 (aggregate face value $1,610,304,009) (Unaudited)
| | | | | | |
| | | | | | | Unrealized |
| | | Contract | Delivery | | Aggregate | appreciation/ |
| Counterparty | Currency | type | date | Value | face value | (depreciation) |
|
| Bank of America N.A. | | | | | |
|
| | British Pound | Sell | 6/19/13 | $8,813,842 | $8,790,332 | $(23,510) |
|
| | Canadian Dollar | Sell | 4/17/13 | 1,010,631 | 1,072,040 | 61,409 |
|
| | Chilean Peso | Buy | 4/17/13 | 10,003,356 | 9,906,605 | 96,751 |
|
| | Euro | Sell | 6/19/13 | 8,666,391 | 8,710,118 | 43,727 |
|
| | Japanese Yen | Sell | 5/15/13 | 12,537,641 | 12,632,234 | 94,593 |
|
| | Peruvian New Sol | Buy | 4/17/13 | 9,679,994 | 9,804,741 | (124,747) |
|
| | Swiss Franc | Sell | 6/19/13 | 14,747,639 | 14,876,639 | 129,000 |
|
| Barclays Bank PLC | | | | | |
|
| | Australian Dollar | Buy | 4/17/13 | 12,891,670 | 12,842,960 | 48,710 |
|
| | Brazilian Real | Buy | 4/17/13 | 6,275,495 | 6,358,026 | (82,531) |
|
| | British Pound | Sell | 6/19/13 | 21,913,402 | 21,818,560 | (94,842) |
|
| | Canadian Dollar | Sell | 4/17/13 | 8,818,372 | 8,907,792 | 89,420 |
|
| | Chilean Peso | Buy | 4/17/13 | 13,643,217 | 13,501,642 | 141,575 |
|
| | Euro | Sell | 6/19/13 | 22,858,311 | 23,201,980 | 343,669 |
|
| | Indonesian Rupiah | Buy | 5/15/13 | 7,675,355 | 7,675,727 | (372) |
|
| | Japanese Yen | Sell | 5/15/13 | 3,007,535 | 3,493,297 | 485,762 |
|
| | Malaysian Ringgit | Buy | 5/15/13 | 7,120,856 | 7,123,299 | (2,443) |
|
| | Mexican Peso | Buy | 4/17/13 | 7,948,832 | 7,617,942 | 330,890 |
|
| | New Taiwan Dollar | Buy | 5/15/13 | 1,480,762 | 1,502,981 | (22,219) |
|
| | New Zealand Dollar | Buy | 4/17/13 | 11,857,100 | 11,666,468 | 190,632 |
|
| | New Zealand Dollar | Sell | 4/17/13 | 11,857,100 | 11,581,706 | (275,394) |
|
| | Norwegian Krone | Sell | 6/19/13 | 8,335,964 | 8,429,138 | 93,174 |
|
| | Russian Ruble | Buy | 6/19/13 | 1,883,855 | 1,887,126 | (3,271) |
|
| | Singapore Dollar | Buy | 5/15/13 | 1,192,132 | 1,195,338 | (3,206) |
|
| | Singapore Dollar | Sell | 5/15/13 | 1,192,132 | 1,184,531 | (7,601) |
|
| | South Korean Won | Buy | 5/15/13 | 9,077,764 | 9,242,106 | (164,342) |
|
| | South Korean Won | Sell | 5/15/13 | 9,077,764 | 9,074,014 | (3,750) |
|
| | Swedish Krona | Buy | 6/19/13 | 22,255,575 | 22,447,930 | (192,355) |
|
| | Swiss Franc | Sell | 6/19/13 | 10,641,506 | 10,667,108 | 25,602 |
|
| | Turkish Lira | Buy | 6/19/13 | 8,392,630 | 8,400,855 | (8,225) |
|
| | Turkish Lira | Sell | 6/19/13 | 8,392,630 | 8,353,313 | (39,317) |
|
| |
| 52 | Diversified Income Trust |
FORWARD CURRENCY CONTRACTS at 3/31/13 (aggregate face value $1,610,304,009) (Unaudited) cont.
| | | | | | |
| | | | | | | Unrealized |
| | | Contract | Delivery | | Aggregate | appreciation/ |
| Counterparty | Currency | type | date | Value | face value | (depreciation) |
|
| Citibank, N.A. | | | | | | |
|
| | Australian Dollar | Buy | 4/17/13 | $29,256,418 | $29,029,056 | $227,362 |
|
| | Brazilian Real | Buy | 4/17/13 | 10,255,339 | 10,436,790 | (181,451) |
|
| | Brazilian Real | Sell | 4/17/13 | 10,255,339 | 10,510,684 | 255,345 |
|
| | British Pound | Sell | 6/19/13 | 4,854,979 | 4,700,862 | (154,117) |
|
| | Canadian Dollar | Sell | 4/17/13 | 8,080,719 | 8,209,794 | 129,075 |
|
| | Euro | Sell | 6/19/13 | 41,206,754 | 41,781,749 | 574,995 |
|
| | Japanese Yen | Buy | 5/15/13 | 26,321,601 | 26,124,282 | 197,319 |
|
| | Japanese Yen | Sell | 5/15/13 | 26,321,601 | 26,757,343 | 435,742 |
|
| | New Taiwan Dollar | Buy | 5/15/13 | 154,253 | 156,642 | (2,389) |
|
| | New Taiwan Dollar | Sell | 5/15/13 | 154,253 | 154,748 | 495 |
|
| | South Korean Won | Buy | 5/15/13 | 4,025,480 | 4,227,226 | (201,746) |
|
| | Swedish Krona | Buy | 6/19/13 | 11,683,581 | 11,822,078 | (138,497) |
|
| | Swiss Franc | Sell | 6/19/13 | 16,278,594 | 16,363,694 | 85,100 |
|
| | Thai Baht | Buy | 5/15/13 | 7,894,624 | 7,731,215 | 163,409 |
|
| | Turkish Lira | Buy | 6/19/13 | 4,261,735 | 4,323,256 | (61,521) |
|
| Credit Suisse International | | | | | |
|
| | Australian Dollar | Buy | 4/17/13 | 24,784,360 | 24,665,563 | 118,797 |
|
| | Brazilian Real | Buy | 4/17/13 | 3,765,089 | 3,824,298 | (59,209) |
|
| | British Pound | Sell | 6/19/13 | 8,130,970 | 8,072,708 | (58,262) |
|
| | Canadian Dollar | Sell | 4/17/13 | 10,297,416 | 10,280,410 | (17,006) |
|
| | Chilean Peso | Buy | 4/17/13 | 10,003,355 | 9,901,625 | 101,730 |
|
| | Chinese Yuan | Buy | 5/15/13 | 6,086,272 | 6,056,605 | 29,667 |
|
| | Czech Koruna | Buy | 6/19/13 | 164,396 | 228,211 | (63,815) |
|
| | Euro | Sell | 6/19/13 | 19,707,444 | 20,083,313 | 375,869 |
|
| | Japanese Yen | Sell | 5/15/13 | 5,089,268 | 5,573,737 | 484,469 |
|
| | Mexican Peso | Buy | 4/17/13 | 8,792,531 | 8,410,694 | 381,837 |
|
| | New Taiwan Dollar | Buy | 5/15/13 | 1,018,008 | 1,033,418 | (15,410) |
|
| | New Zealand Dollar | Buy | 4/17/13 | 218,927 | 215,373 | 3,554 |
|
| | Norwegian Krone | Buy | 6/19/13 | 8,757,142 | 8,811,480 | (54,338) |
|
| | Norwegian Krone | Sell | 6/19/13 | 8,757,142 | 8,799,796 | 42,654 |
|
| | Philippine Peso | Buy | 5/15/13 | 4,667,406 | 4,699,031 | (31,625) |
|
| | Polish Zloty | Buy | 6/19/13 | 2,386,676 | 2,373,515 | 13,161 |
|
| | Russian Ruble | Buy | 6/19/13 | 15,626,598 | 15,733,611 | (107,013) |
|
| | South Korean Won | Buy | 5/15/13 | 9,077,764 | 9,253,811 | (176,047) |
|
| | South Korean Won | Sell | 5/15/13 | 9,077,764 | 9,071,354 | (6,410) |
|
| | Swedish Krona | Buy | 6/19/13 | 7,221,916 | 7,311,054 | (89,138) |
|
| | Swiss Franc | Sell | 6/19/13 | 9,675,314 | 9,725,842 | 50,528 |
|
| | Turkish Lira | Buy | 6/19/13 | 8,392,630 | 8,383,229 | 9,401 |
|
| | Turkish Lira | Sell | 6/19/13 | 8,392,630 | 8,354,314 | (38,316) |
|
| Deutsche Bank AG | | | | | |
|
| | Australian Dollar | Buy | 4/17/13 | 14,287,537 | 14,230,778 | 56,759 |
|
| | Brazilian Real | Buy | 4/17/13 | 10,255,339 | 10,507,362 | (252,023) |
|
| | Brazilian Real | Sell | 4/17/13 | 10,255,339 | 10,514,410 | 259,071 |
|
| |
| Diversified Income Trust | 53 |
FORWARD CURRENCY CONTRACTS at 3/31/13 (aggregate face value $1,610,304,009) (Unaudited) cont.
| | | | | | |
| | | | | | Unrealized |
| | Contract | Delivery | | Aggregate | appreciation/ |
| Counterparty | Currency | type | date | Value | face value | (depreciation) |
|
| Deutsche Bank AG cont. | | | | |
|
| Canadian Dollar | Sell | 4/17/13 | $22,562,266 | $22,678,380 | $116,114 |
|
| Euro | Sell | 6/19/13 | 10,762,993 | 10,920,747 | 157,754 |
|
| Japanese Yen | Sell | 5/15/13 | 16,061,515 | 16,396,834 | 335,319 |
|
| Mexican Peso | Buy | 4/17/13 | 5,712,283 | 5,408,346 | 303,937 |
|
| Norwegian Krone | Sell | 6/19/13 | 11,395,575 | 11,334,027 | (61,548) |
|
| Polish Zloty | Buy | 6/19/13 | 5,343,963 | 5,462,988 | (119,025) |
|
| Singapore Dollar | Buy | 5/15/13 | 9,324,510 | 9,330,956 | (6,446) |
|
| Singapore Dollar | Sell | 5/15/13 | 9,324,510 | 9,256,481 | (68,029) |
|
| South Korean Won | Buy | 5/15/13 | 4,777,238 | 5,004,221 | (226,983) |
|
| Swedish Krona | Buy | 6/19/13 | 16,661,029 | 16,796,541 | (135,512) |
|
| Swiss Franc | Sell | 6/19/13 | 16,463,861 | 16,548,702 | 84,841 |
|
| Turkish Lira | Buy | 6/19/13 | 6,812,668 | 6,829,671 | (17,003) |
|
| Goldman Sachs International | | | | |
|
| British Pound | Buy | 6/19/13 | 5,841,468 | 5,836,959 | 4,509 |
|
| British Pound | Sell | 6/19/13 | 5,841,468 | 5,793,615 | (47,853) |
|
| Canadian Dollar | Sell | 4/17/13 | 8,717,309 | 8,543,049 | (174,260) |
|
| Euro | Sell | 6/19/13 | 25,667,889 | 26,051,820 | 383,931 |
|
| Japanese Yen | Sell | 5/15/13 | 16,605,280 | 16,854,754 | 249,474 |
|
| Norwegian Krone | Sell | 6/19/13 | 8,438,075 | 8,598,763 | 160,688 |
|
| HSBC Bank USA, National Association | | | |
|
| Australian Dollar | Buy | 4/17/13 | 13,279,821 | 13,230,385 | 49,436 |
|
| British Pound | Buy | 6/19/13 | 2,112,558 | 2,110,941 | 1,617 |
|
| British Pound | Sell | 6/19/13 | 2,112,558 | 2,086,865 | (25,693) |
|
| Canadian Dollar | Sell | 4/17/13 | 5,045,480 | 5,054,834 | 9,354 |
|
| Euro | Sell | 6/19/13 | 16,345,724 | 16,572,337 | 226,613 |
|
| Indian Rupee | Sell | 5/15/13 | 3,330,630 | 3,368,272 | 37,642 |
|
| Japanese Yen | Sell | 5/15/13 | 17,985,193 | 18,214,724 | 229,531 |
|
| Norwegian Krone | Buy | 6/19/13 | 40,148 | 40,151 | (3) |
|
| Norwegian Krone | Sell | 6/19/13 | 40,148 | 40,577 | 429 |
|
| Philippine Peso | Buy | 5/15/13 | 2,394,589 | 2,420,246 | (25,657) |
|
| Russian Ruble | Buy | 6/19/13 | 14,202,286 | 14,318,402 | (116,116) |
|
| South Korean Won | Buy | 5/15/13 | 4,092,377 | 4,305,058 | (212,681) |
|
| Swiss Franc | Sell | 6/19/13 | 16,421,262 | 16,555,142 | 133,880 |
|
| Turkish Lira | Buy | 6/19/13 | 5,391,834 | 5,419,235 | (27,401) |
|
| JPMorgan Chase Bank N.A. | | | |
|
| Australian Dollar | Buy | 4/17/13 | 23,351,467 | 23,089,796 | 261,671 |
|
| Brazilian Real | Buy | 4/17/13 | 4,052,615 | 4,131,187 | (78,572) |
|
| British Pound | Sell | 6/19/13 | 6,599,674 | 6,518,876 | (80,798) |
|
| Canadian Dollar | Buy | 4/17/13 | 17,601,514 | 17,415,991 | 185,523 |
|
| Canadian Dollar | Sell | 4/17/13 | 17,601,514 | 17,700,083 | 98,569 |
|
| Chilean Peso | Buy | 4/17/13 | 8,888,451 | 8,758,123 | 130,328 |
|
| Chinese Yuan | Buy | 5/15/13 | 6,086,272 | 6,060,461 | 25,811 |
|
| Euro | Sell | 6/19/13 | 20,385,278 | 20,891,353 | 506,075 |
|
| |
| 54 | Diversified Income Trust |
FORWARD CURRENCY CONTRACTS at 3/31/13 (aggregate face value $1,610,304,009) (Unaudited) cont.
| | | | | | |
| | | | | | | Unrealized |
| | | Contract | Delivery | | Aggregate | appreciation/ |
| Counterparty | Currency | type | date | Value | face value | (depreciation) |
|
| JPMorgan Chase Bank N.A. cont. | | | | | |
|
| | Japanese Yen | Sell | 5/15/13 | $2,793,656 | $3,463,067 | $669,411 |
|
| | Malaysian Ringgit | Buy | 5/15/13 | 5,817,365 | 5,809,456 | 7,909 |
|
| | Mexican Peso | Buy | 4/17/13 | 7,152,743 | 6,767,046 | 385,697 |
|
| | New Taiwan Dollar | Buy | 5/15/13 | 756,530 | 796,653 | (40,123) |
|
| | Norwegian Krone | Buy | 6/19/13 | 3,287,048 | 3,270,904 | 16,144 |
|
| | Polish Zloty | Buy | 6/19/13 | 1,013,953 | 1,035,469 | (21,516) |
|
| | Russian Ruble | Sell | 6/19/13 | 1,373,320 | 1,383,068 | 9,748 |
|
| | South Korean Won | Buy | 5/15/13 | 1,735,903 | 1,913,469 | (177,566) |
|
| | Swedish Krona | Buy | 6/19/13 | 11,507,057 | 11,705,867 | (198,810) |
|
| | Swiss Franc | Sell | 6/19/13 | 11,841,997 | 12,001,384 | 159,387 |
|
| | Turkish Lira | Buy | 6/19/13 | 1,999,017 | 2,052,622 | (53,605) |
|
| State Street Bank and Trust Co. | | | | | |
|
| | Australian Dollar | Buy | 4/17/13 | 6,465,024 | 6,404,218 | 60,806 |
|
| | Brazilian Real | Buy | 4/17/13 | 5,133,746 | 5,211,788 | (78,042) |
|
| | British Pound | Buy | 6/19/13 | 1,562,129 | 1,543,192 | 18,937 |
|
| | British Pound | Sell | 6/19/13 | 1,562,129 | 1,560,913 | (1,216) |
|
| | Canadian Dollar | Sell | 4/17/13 | 12,270,263 | 12,411,627 | 141,364 |
|
| | Chilean Peso | Buy | 4/17/13 | 11,142,248 | 11,021,460 | 120,788 |
|
| | Colombian Peso | Buy | 4/17/13 | 9,612,032 | 9,774,373 | (162,341) |
|
| | Czech Koruna | Buy | 6/19/13 | 2,449,483 | 2,479,279 | (29,796) |
|
| | Czech Koruna | Sell | 6/19/13 | 2,449,483 | 2,496,751 | 47,268 |
|
| | Euro | Sell | 6/19/13 | 21,298,718 | 21,620,257 | 321,539 |
|
| | Japanese Yen | Sell | 5/15/13 | 1,122,462 | 1,917,008 | 794,546 |
|
| | Mexican Peso | Buy | 4/17/13 | 6,939,098 | 6,635,001 | 304,097 |
|
| | Polish Zloty | Buy | 6/19/13 | 2,559,697 | 2,610,604 | (50,907) |
|
| | South Korean Won | Buy | 5/15/13 | 1,066,518 | 1,341,293 | (274,775) |
|
| | Swedish Krona | Sell | 6/19/13 | 412,154 | 369,577 | (42,577) |
|
| | Swiss Franc | Sell | 6/19/13 | 20,233,835 | 20,442,874 | 209,039 |
|
| | Turkish Lira | Buy | 6/19/13 | 5,575,643 | 5,634,700 | (59,057) |
|
| UBS AG | | | | | | |
|
| | Australian Dollar | Buy | 4/17/13 | 24,757,943 | 24,501,164 | 256,779 |
|
| | British Pound | Sell | 6/19/13 | 8,812,628 | 8,805,935 | (6,693) |
|
| | Canadian Dollar | Sell | 4/17/13 | 8,275,170 | 8,356,486 | 81,316 |
|
| | Chilean Peso | Buy | 4/17/13 | 836,653 | 757,283 | 79,370 |
|
| | Czech Koruna | Buy | 6/19/13 | 2,445,815 | 2,475,708 | (29,893) |
|
| | Czech Koruna | Sell | 6/19/13 | 2,445,815 | 2,492,174 | 46,359 |
|
| | Euro | Sell | 6/19/13 | 23,431,359 | 23,812,059 | 380,700 |
|
| | Japanese Yen | Buy | 5/15/13 | 20,043,547 | 19,749,916 | 293,631 |
|
| | Japanese Yen | Sell | 5/15/13 | 20,043,547 | 20,351,238 | 307,691 |
|
| | Mexican Peso | Buy | 4/17/13 | 8,633,029 | 8,282,421 | 350,608 |
|
| | New Taiwan Dollar | Buy | 5/15/13 | 4,093,585 | 4,154,141 | (60,556) |
|
| | Norwegian Krone | Buy | 6/19/13 | 8,757,125 | 8,811,766 | (54,641) |
|
| | Norwegian Krone | Sell | 6/19/13 | 8,757,125 | 8,838,258 | 81,133 |
|
| |
| Diversified Income Trust | 55 |
FORWARD CURRENCY CONTRACTS at 3/31/13 (aggregate face value $1,610,304,009) (Unaudited) cont.
| | | | | | |
| | | | | | | Unrealized |
| | | Contract | Delivery | | Aggregate | appreciation/ |
| Counterparty | Currency | type | date | Value | face value | (depreciation) |
|
| UBS AG cont. | | | | | | |
|
| | Philippine Peso | Buy | 5/15/13 | $3,349,607 | $3,376,430 | $(26,823) |
|
| | Russian Ruble | Buy | 6/19/13 | 170,901 | 177,109 | (6,208) |
|
| | Singapore Dollar | Buy | 5/15/13 | 9,324,591 | 9,331,716 | (7,125) |
|
| | Singapore Dollar | Sell | 5/15/13 | 9,324,591 | 9,256,636 | (67,955) |
|
| | Swedish Krona | Buy | 6/19/13 | 7,979,443 | 8,146,422 | (166,979) |
|
| | Swiss Franc | Sell | 6/19/13 | 19,060,338 | 19,155,554 | 95,216 |
|
| | Turkish Lira | Buy | 6/19/13 | 9,054,974 | 9,070,503 | (15,529) |
|
| WestPac Banking Corp. | | | | | |
|
| | Australian Dollar | Buy | 4/17/13 | 19,492,006 | 19,415,789 | 76,217 |
|
| | British Pound | Buy | 6/19/13 | 8,709,802 | 8,628,559 | 81,243 |
|
| | British Pound | Sell | 6/19/13 | 8,709,802 | 8,626,471 | (83,331) |
|
| | Canadian Dollar | Sell | 4/17/13 | 15,081,235 | 15,354,607 | 273,372 |
|
| | Euro | Sell | 6/19/13 | 11,690,156 | 11,880,827 | 190,671 |
|
| | Japanese Yen | Buy | 5/15/13 | 15,589,682 | 15,341,163 | 248,519 |
|
| | Japanese Yen | Sell | 5/15/13 | 15,589,682 | 15,874,116 | 284,434 |
|
| | New Zealand Dollar | Buy | 4/17/13 | 11,858,521 | 11,669,284 | 189,237 |
|
| | New Zealand Dollar | Sell | 4/17/13 | 11,858,521 | 11,574,952 | (283,569) |
|
| Total | | | | | | $10,267,804 |
FUTURES CONTRACTS OUTSTANDING at 3/31/13 (Unaudited)
| | | | | |
| | | | | | Unrealized |
| | Number of | | | Expiration | appreciation/ |
| | contracts | Value | | date | (depreciation) |
|
| Australian Government Treasury | | | | | |
| Bond 3 yr (Short) | 465 | $52,754,220 | | Jun-13 | $(191,335) |
|
| Australian Government Treasury | | | | | |
| Bond 10 yr (Short) | 19 | 2,405,496 | | Jun-13 | (32,579) |
|
| Canadian Government Bond | | | | | |
| 10 yr (Long) | 358 | 47,582,970 | | Jun-13 | 1,066,318 |
|
| Euro-Bobl 5 yr (Short) | 155 | 25,177,600 | | Jun-13 | (177,268) |
|
| Euro-Bund 10 yr (Short) | 37 | 6,900,369 | | Jun-13 | (105,870) |
|
| Euro-Dollar 90 day (Long) | 10,240 | 2,551,552,000 | | Jun-13 | (767,015) |
|
| Japanese Government Bond | | | | | |
| 10 yr (Long) | 23 | 35,637,967 | | Jun-13 | 268,541 |
|
| Japanese Government Bond | | | | | |
| 10 yr Mini (Long) | 29 | 4,492,559 | | Jun-13 | 32,825 |
|
| U.K. Gilt 10 yr (Long) | 3 | 541,441 | | Jun-13 | 21,827 |
|
| U.S. Treasury Note 10 yr (Short) | 44 | 5,807,313 | | Jun-13 | (8,693) |
|
| Total | | | | | $106,751 |
| |
| 56 | Diversified Income Trust |
WRITTEN SWAP OPTIONS OUTSTANDING at 3/31/13 (premiums $16,894,416) (Unaudited)
| | | | |
| Counterparty | | | | |
| Fixed Obligation % to receive or (pay)/ | Expiration | | Contract | |
| Floating rate index/Maturity date | date/strike | | amount | Value |
|
| Goldman Sachs International | | | | |
|
| 1.51/6 month EUR-EURIBOR_Reuters/Jan-18 | Jan-16/1.51 | EUR | 488,025,000 | $4,522,906 |
|
| 1.47/6 month EUR-EURIBOR_Reuters/Jan-18 | Jan-16/1.47 | EUR | 488,025,000 | 4,823,182 |
|
| JPMorgan Chase Bank N.A. | | | | |
|
| 1.474/6 month EUR-EURIBOR_Reuters/Jan-18 | Jan-16/1.474 | EUR | 488,025,000 | 4,666,788 |
|
| Total | | | | $14,012,876 |
FORWARD PREMIUM SWAP OPTION CONTRACTS OUTSTANDING at 3/31/13 (Unaudited)
| | | |
| Counterparty | | | Unrealized |
| Fixed right or obligation % to receive or (pay)/ | Expiration | Contract | appreciation/ |
| Floating rate index/Maturity date | date/strike | amount | (depreciation) |
|
| Barclays Bank PLC | | | |
| 1.90/3 month USD-LIBOR-BBA/ | | | |
| Jun-23 (Purchased) | Jun-13/1.90 | $22,243,000 | $2,669 |
|
| (2.40)/3 month USD-LIBOR-BBA/ | | | |
| Jun-23 (Purchased) | Jun-13/2.40 | 22,243,000 | (158,370) |
|
| 2.40/3 month USD-LIBOR-BBA/Jun-23 (Written) | Jun-13/2.40 | 27,190,000 | 118,277 |
|
| Citibank, N.A. | | | |
| 2.40/3 month USD-LIBOR-BBA/Jun-23 (Written) | Jun-13/2.40 | 27,190,000 | 117,189 |
|
| Credit Suisse International | | | |
| 1.90/3 month USD-LIBOR-BBA/ | | | |
| Jun-23 (Purchased) | Jun-13/1.90 | 26,250,000 | (4,988) |
|
| 1.83375/3 month USD-LIBOR-BBA/ | | | |
| Apr-23 (Purchased) | Apr-13/1.83375 | 162,959,600 | (57,036) |
|
| 1.83/3 month USD-LIBOR-BBA/ | | | |
| Apr-23 (Purchased) | Apr-13/1.83 | 165,959,600 | (99,576) |
|
| 1.82875/3 month USD-LIBOR-BBA/ | | | |
| Apr-23 (Purchased) | Apr-13/1.82875 | 166,959,600 | (101,845) |
|
| (2.40)/3 month USD-LIBOR-BBA/ | | | |
| Jun-23 (Purchased) | Jun-13/2.40 | 26,250,000 | (172,725) |
|
| (1.39)/3 month USD-LIBOR-BBA/ | | | |
| May-18 (Purchased) | May-13/1.39 | 686,733,000 | (1,311,659) |
|
| 2.386/3 month USD-LIBOR-BBA/ | | | |
| May-23 (Written) | May-13/2.386 | 176,833,000 | 938,984 |
|
| 0.876/3 month USD-LIBOR-BBA/ | | | |
| May-16 (Written) | May-13/0.876 | 566,554,000 | 266,280 |
|
| 2.33375/3 month USD-LIBOR-BBA/ | | | |
| Apr-23 (Written) | Apr-13/2.33375 | 162,959,600 | 127,108 |
|
| 2.40/3 month USD-LIBOR-BBA/Jun-23 (Written) | Jun-13/2.40 | 27,190,000 | 116,373 |
|
| 2.33/3 month USD-LIBOR-BBA/ | | | |
| Apr-23 (Written) | Apr-13/2.33 | 165,959,600 | 46,469 |
|
| 2.32875/3 month USD-LIBOR-BBA/ | | | |
| Apr-23 (Written) | Apr-13/2.32875 | 166,959,600 | 45,079 |
|
| |
| Diversified Income Trust | 57 |
FORWARD PREMIUM SWAP OPTION CONTRACTS OUTSTANDING at 3/31/13 (Unaudited) cont.
| | | |
| Counterparty | | | Unrealized |
| Fixed right or obligation % to receive or (pay)/ | Expiration | Contract | appreciation/ |
| Floating rate index/Maturity date | date/strike | amount | (depreciation) |
|
| Deutsche Bank AG | | | |
| 1.90/3 month USD-LIBOR-BBA/ | | | |
| Jun-23 (Purchased) | Jun-13/1.90 | $26,250,000 | $(3,150) |
|
| (2.40)/3 month USD-LIBOR-BBA/ | | | |
| Jun-23 (Purchased) | Jun-13/2.40 | 26,250,000 | (168,525) |
|
| (1.4075)/3 month USD-LIBOR-BBA/ | | | |
| May-18 (Purchased) | May-13/1.4075 | 343,366,000 | (697,033) |
|
| (1.37)/3 month USD-LIBOR-BBA/ | | | |
| May-18 (Purchased) | May-13/1.37 | 686,733,000 | (1,242,986) |
|
| (1.38)/3 month USD-LIBOR-BBA/ | | | |
| May-18 (Purchased) | May-13/1.38 | 686,733,000 | (1,284,190) |
|
| 2.395/3 month USD-LIBOR-BBA/ | | | |
| May-23 (Written) | May-13/2.395 | 176,833,000 | 928,373 |
|
| 2.38/3 month USD-LIBOR-BBA/ | | | |
| May-23 (Written) | May-13/2.38 | 176,833,000 | 891,238 |
|
| 2.425/3 month USD-LIBOR-BBA/ | | | |
| May-23 (Written) | May-13/2.425 | 88,416,000 | 507,508 |
|
| 0.87/3 month USD-LIBOR-BBA/ | | | |
| May-16 (Written) | May-13/0.87 | 566,554,000 | 266,280 |
|
| 0.865/3 month USD-LIBOR-BBA/ | | | |
| May-16 (Written) | May-13/0.865 | 566,554,000 | 249,284 |
|
| 0.8975/3 month USD-LIBOR-BBA/ | | | |
| May-16 (Written) | May-13/0.8975 | 283,276,000 | 150,136 |
|
| 2.40/3 month USD-LIBOR-BBA/Jun-23 (Written) | Jun-13/2.40 | 27,190,000 | 121,267 |
|
| Goldman Sachs International | | | |
| 1.91/3 month USD-LIBOR-BBA/ | | | |
| Apr-23 (Purchased) | Apr-13/1.91 | 151,159,600 | 42,325 |
|
| 1.90/3 month USD-LIBOR-BBA/ | | | |
| Jun-23 (Purchased) | Jun-13/1.90 | 138,061,743 | (157,390) |
|
| (1.37625)/3 month USD-LIBOR-BBA/ | | | |
| May-18 (Purchased) | May-13/1.37625 | 343,366,000 | (618,059) |
|
| (1.42125)/3 month USD-LIBOR-BBA/ | | | |
| May-18 (Purchased) | May-13/1.42125 | 343,366,000 | (655,829) |
|
| (2.40)/3 month USD-LIBOR-BBA/ | | | |
| Jun-23 (Purchased) | Jun-13/2.40 | 138,061,743 | (748,295) |
|
| 2.44/3 month USD-LIBOR-BBA/ | | | |
| May-23 (Written) | May-13/2.44 | 88,416,000 | 488,056 |
|
| 2.386/3 month USD-LIBOR-BBA/ | | | |
| May-23 (Written) | May-13/2.386 | 88,416,000 | 442,964 |
|
| 2.41/3 month USD-LIBOR-BBA/ | | | |
| Apr-23 (Written) | Apr-13/2.41 | 151,159,600 | 140,578 |
|
| 0.90/3 month USD-LIBOR-BBA/ | | | |
| May-16 (Written) | May-13/0.90 | 283,276,000 | 130,307 |
|
| 0.876/3 month USD-LIBOR-BBA/ | | | |
| May-16 (Written) | May-13/0.876 | 283,276,000 | 127,474 |
|
| |
| 58 | Diversified Income Trust |
FORWARD PREMIUM SWAP OPTION CONTRACTS OUTSTANDING at 3/31/13 (Unaudited) cont.
| | | |
| Counterparty | | | Unrealized |
| Fixed right or obligation % to receive or (pay)/ | Expiration | Contract | appreciation/ |
| Floating rate index/Maturity date | date/strike | amount | (depreciation) |
|
| JPMorgan Chase Bank N.A. | | | |
| 1.90/3 month USD-LIBOR-BBA/ | | | |
| Jun-23 (Purchased) | Jun-13/1.90 | $79,618,901 | $(62,103) |
|
| (2.40)/3 month USD-LIBOR-BBA/ | | | |
| Jun-23 (Purchased) | Jun-13/2.40 | 79,618,901 | (516,727) |
|
| Total | | | $(1,796,268) |
TBA SALE COMMITMENTS OUTSTANDING at 3/31/13 (proceeds receivable $303,471,484) (Unaudited)
| | | | |
| | Principal | | Settlement | |
| Agency | amount | | date | Value |
|
| Federal National Mortgage Association, 3s, April 1, 2043 | $268,000,000 | | 4/11/13 | $276,354,070 |
|
| Government National Mortgage Association, 3s, | | | | |
| April 1, 2043 | 24,000,000 | | 4/18/13 | 25,059,374 |
|
| Government National Mortgage Association, 3s, | | | | |
| April 1, 2043 | 3,000,000 | | 4/18/13 | 3,135,234 |
|
| Total | | | | $304,548,678 |
OTC INTEREST RATE SWAP CONTRACTS OUTSTANDING at 3/31/13 (Unaudited)
| | | | | | | |
| | | Upfront | | | Payments | Payments | Unrealized |
| Swap counterparty/ | premium | Termination | | made by | received by | appreciation/ |
| Notional amount | received (paid) | date | | fund per annum | fund per annum | (depreciation) |
|
| Bank of America N.A. | | | | | | |
| | $105,811,600 E | $1,210,485 | 6/19/23 | | 3 month USD- | 2.00% | $283,575 |
| | | | | | LIBOR-BBA | | |
|
| | 171,264,000 E | (1,699,204) | 6/19/23 | | 2.00% | 3 month USD- | (198,931) |
| | | | | | | LIBOR-BBA | |
|
| CAD | 101,833,000 | — | 2/25/23 | | 2.33% | 3 month CAD- | (411,376) |
| | | | | | | BA-CDOR | |
|
| Barclays Bank PLC | | | | | | |
| | $38,825,000 | — | 2/4/23 | | 3 month USD- | 2.0615% | 346,338 |
| | | | | | LIBOR-BBA | | |
|
| | 41,518,000 E | 46,153 | 6/19/15 | | 3 month USD- | 0.40% | 1,314 |
| | | | | | LIBOR-BBA | | |
|
| | 262,085,000 E | (980,977) | 6/19/18 | | 1.00% | 3 month USD- | (333,627) |
| | | | | | | LIBOR-BBA | |
|
| | 96,963,000 E | 1,295,550 | 6/19/23 | | 3 month USD- | 2.00% | 446,154 |
| | | | | | LIBOR-BBA | | |
|
| | 42,555,000 | — | 2/28/23 | | 1.96125% | 3 month USD- | 105,832 |
| | | | | | | LIBOR-BBA | |
|
| | 31,456,000 E | (39,637) | 6/19/15 | | 0.40% | 3 month USD- | (5,664) |
| | | | | | | LIBOR-BBA | |
|
| | 43,544,000 E | (674,119) | 6/19/23 | | 2.00% | 3 month USD- | (292,673) |
| | | | | | | LIBOR-BBA | |
|
| | 10,074,000 E | 142,436 | 6/19/43 | | 3 month USD- | 3.00% | 72,321 |
| | | | | | LIBOR-BBA | | |
|
| CHF | 28,474,000 | — | 12/7/22 | | 0.87% | 6 month CHF- | 483,950 |
| | | | | | | LIBOR-BBA | |
|
| |
| Diversified Income Trust | 59 |
OTC INTEREST RATE SWAP CONTRACTS OUTSTANDING at 3/31/13 (Unaudited) cont.
| | | | | | | |
| | | Upfront | | | Payments | Payments | Unrealized |
| Swap counterparty/ | premium | Termination | | made by | received by | appreciation/ |
| Notional amount | received (paid) | date | | fund per annum | fund per annum | (depreciation) |
|
| Barclays Bank PLC cont. | | | | | | |
| EUR | 198,611,000 | $— | 10/16/22 | | 1.747% | 6 month EUR- | $(4,675,428) |
| | | | | | | EURIBOR- | |
| | | | | | | REUTERS | |
|
| EUR | 398,858,000 E | — | 8/3/17 | | 1 month EUR- | 1.41727% | 2,500,140 |
| | | | | | EONIA-OIS- | | |
| | | | | | COMPOUND | | |
|
| EUR | 101,959,000 | — | 3/14/23 | | 1.755% | 6 month EUR- | (1,241,819) |
| | | | | | | EURIBOR- | |
| | | | | | | Telerate | |
|
| EUR | 33,356,000 | — | 3/18/23 | | 6 month EUR- | 1.7425% | 341,022 |
| | | | | | EURIBOR-Telerate | | |
|
| EUR | 38,645,000 | — | 3/18/23 | | 6 month EUR- | 1.748% | 420,954 |
| | | | | | EURIBOR-Telerate | | |
|
| GBP | 36,488,000 | — | 8/15/31 | | 3.60% | 6 month GBP- | (8,010,511) |
| | | | | | | LIBOR-BBA | |
|
| GBP | 17,252,000 | — | 7/25/42 | | 6 month GBP- | 2.8425% | (797,192) |
| | | | | | LIBOR-BBA | | |
|
| GBP | 30,633,000 | — | 7/25/22 | | 1.885% | 6 month GBP- | (444,989) |
| | | | | | | LIBOR-BBA | |
|
| GBP | 47,243,000 | — | 3/12/23 | | 2.03% | 6 month GBP- | (897,871) |
| | | | | | | LIBOR-BBA | |
|
| SEK | 94,636,000 | — | 3/14/23 | | 3 month SEK- | 2.42% | 161,340 |
| | | | | | STIBOR-SIDE | | |
|
| SEK | 240,860,000 | — | 3/18/23 | | 2.40% | 3 month SEK- | (337,008) |
| | | | | | | STIBOR-SIDE | |
|
| Citibank, N.A. | | | | | | |
| | $42,809,000 | — | 2/26/23 | | 2.038% | 3 month USD- | (206,309) |
| | | | | | | LIBOR-BBA | |
|
| | 35,720,000 | — | 2/8/23 | | 2.063% | 3 month USD- | (314,835) |
| | | | | | | LIBOR-BBA | |
|
| | 52,848,000 | — | 2/21/23 | | 2.068% | 3 month USD- | (430,954) |
| | | | | | | LIBOR-BBA | |
|
| | 696,857,000 E | (673,810) | 6/19/15 | | 0.40% | 3 month USD- | 78,795 |
| | | | | | | LIBOR-BBA | |
|
| | 155,415,000 E | (1,585,316) | 6/19/23 | | 2.00% | 3 month USD- | (223,881) |
| | | | | | | LIBOR-BBA | |
|
| | 3,103,000 E | (24,206) | 6/19/43 | | 3.00% | 3 month USD- | (2,609) |
| | | | | | | LIBOR-BBA | |
|
| | 70,967,000 E | (189,046) | 6/19/18 | | 1.00% | 3 month USD- | (13,757) |
| | | | | | | LIBOR-BBA | |
|
| CZK | 237,584,000 | — | 1/17/23 | | 6 month CZK- | 1.41% | 158,431 |
| | | | | | PRIBOR-PRBO | | |
|
| GBP | 35,162,000 | — | 2/1/23 | | 6 month GBP- | 2.10% | 1,175,990 |
| | | | | | LIBOR-BBA | | |
|
| PLN | 38,459,000 | — | 1/17/23 | | 3.84% | 6 month PLN- | (242,004) |
| | | | | | | WIBOR-WIBO | |
|
| |
| 60 | Diversified Income Trust |
OTC INTEREST RATE SWAP CONTRACTS OUTSTANDING at 3/31/13 (Unaudited) cont.
| | | | | | | |
| | | Upfront | | | Payments | Payments | Unrealized |
| Swap counterparty/ | premium | Termination | | made by | received by | appreciation/ |
| Notional amount | received (paid) | date | | fund per annum | fund per annum | (depreciation) |
|
| Citibank, N.A. cont. | | | | | | |
| SEK | 181,616,000 | $— | 8/2/22 | | 3 month SEK- | 2.285% | $423,780 |
| | | | | | STIBOR-SIDE | | |
|
| SEK | 86,430,000 | — | 12/20/22 | | 2.045% | 3 month SEK- | 215,710 |
| | | | | | | STIBOR-SIDE | |
|
| SEK | 210,668,000 | — | 3/1/23 | | 2.345% | 3 month SEK- | (159,788) |
| | | | | | | STIBOR-SIDE | |
|
| Credit Suisse International | | | | | | |
| | $113,147,000 | — | 1/9/16 | | 3 month USD- | 0.515% | 92,592 |
| | | | | | LIBOR-BBA | | |
|
| | 56,919,000 | — | 1/11/16 | | 3 month USD- | 0.50% | 19,542 |
| | | | | | LIBOR-BBA | | |
|
| | 68,783,000 | — | 1/11/18 | | 0.88% | 3 month USD- | 1,529 |
| | | | | | | LIBOR-BBA | |
|
| | 17,987,000 | — | 1/11/23 | | 3 month USD- | 1.88% | (109,181) |
| | | | | | LIBOR-BBA | | |
|
| | 93,762,000 | — | 1/7/16 | | 3 month USD- | 0.54% | 151,738 |
| | | | | | LIBOR-BBA | | |
|
| | 35,768,000 | — | 1/9/23 | | 3 month USD- | 1.93% | (41,799) |
| | | | | | LIBOR-BBA | | |
|
| | 137,567,000 | — | 1/9/18 | | 0.9125% | 3 month USD- | (233,004) |
| | | | | | | LIBOR-BBA | |
|
| | 29,390,000 | — | 1/7/23 | | 3 month USD- | 1.94% | (3,968) |
| | | | | | LIBOR-BBA | | |
|
| | 113,073,000 | — | 1/7/18 | | 0.93% | 3 month USD- | (296,063) |
| | | | | | | LIBOR-BBA | |
|
| | 29,421,000 | — | 2/6/23 | | 2.05% | 3 month USD- | (227,680) |
| | | | | | | LIBOR-BBA | |
|
| | 31,521,000 | — | 2/12/23 | | 2.0645% | 3 month USD- | (269,841) |
| | | | | | | LIBOR-BBA | |
|
| | 25,871,000 | — | 2/14/23 | | 2.058% | 3 month USD- | (202,146) |
| | | | | | | LIBOR-BBA | |
|
| | 68,425,000 | — | 3/4/18 | | 0.9275% | 3 month USD- | 20,368 |
| | | | | | | LIBOR-BBA | |
|
| | 5,428,000 E | (41,627) | 6/19/43 | | 3.00% | 3 month USD- | (3,848) |
| | | | | | | LIBOR-BBA | |
|
| | 124,551,000 E | (1,648,283) | 6/19/23 | | 2.00% | 3 month USD- | (557,216) |
| | | | | | | LIBOR-BBA | |
|
| | 17,789,000 | — | 3/8/23 | | 3 month USD- | 2.01875% | 39,196 |
| | | | | | LIBOR-BBA | | |
|
| | 17,789,000 | — | 3/11/23 | | 3 month USD- | 2.065% | 110,711 |
| | | | | | LIBOR-BBA | | |
|
| | 68,425,000 | — | 3/11/18 | | 0.9875% | 3 month USD- | (159,083) |
| | | | | | | LIBOR-BBA | |
|
| | 198,931,000 | — | 3/20/18 | | 0.968125% | 3 month USD- | (185,493) |
| | | | | | | LIBOR-BBA | |
|
| |
| Diversified Income Trust | 61 |
OTC INTEREST RATE SWAP CONTRACTS OUTSTANDING at 3/31/13 (Unaudited) cont.
| | | | | | | |
| | | Upfront | | | Payments | Payments | Unrealized |
| Swap counterparty/ | premium | Termination | | made by | received by | appreciation/ |
| Notional amount | received (paid) | date | | fund per annum | fund per annum | (depreciation) |
|
| Credit Suisse International cont. | | | | | |
| | $56,655,000 | $— | 3/4/16 | | 3 month USD- | 0.5025% | $(25,292) |
| | | | | | LIBOR-BBA | | |
|
| | 17,926,000 | — | 3/4/23 | | 3 month USD- | 1.975% | (30,332) |
| | | | | | LIBOR-BBA | | |
|
| | 52,893,000 | — | 3/5/23 | | 1.952% | 3 month USD- | 206,457 |
| | | | | | | LIBOR-BBA | |
|
| | 237,279,000 E | (262,059) | 6/19/15 | | 0.40% | 3 month USD- | (5,797) |
| | | | | | | LIBOR-BBA | |
|
| | 458,303,000 E | (1,500,282) | 6/19/18 | | 1.00% | 3 month USD- | (368,273) |
| | | | | | | LIBOR-BBA | |
|
| | 84,845,000 | — | 3/6/16 | | 3 month USD- | 0.495% | (60,300) |
| | | | | | LIBOR-BBA | | |
|
| | 26,686,000 | — | 3/6/23 | | 3 month USD- | 1.9575% | (91,135) |
| | | | | | LIBOR-BBA | | |
|
| | 102,636,000 | — | 3/6/18 | | 0.915% | 3 month USD- | 100,485 |
| | | | | | | LIBOR-BBA | |
|
| | 1,000,000 E | 2,010 | 6/19/18 | | 3 month USD- | 1.00% | (460) |
| | | | | | LIBOR-BBA | | |
|
| | 1,000,000 E | (1,610) | 6/19/43 | | 3 month USD- | 3.00% | (8,570) |
| | | | | | LIBOR-BBA | | |
|
| | 317,065,000 E | 4,193,538 | 6/19/23 | | 3 month USD- | 2.00% | 1,416,048 |
| | | | | | LIBOR-BBA | | |
|
| | 567,974,000 E | 594,594 | 6/19/15 | | 3 month USD- | 0.40% | (18,818) |
| | | | | | LIBOR-BBA | | |
|
| | 56,108,000 | — | 3/8/16 | | 3 month USD- | 0.5175% | (2,568) |
| | | | | | LIBOR-BBA | | |
|
| | 68,423,000 | — | 3/8/18 | | 0.955% | 3 month USD- | (62,521) |
| | | | | | | LIBOR-BBA | |
|
| | 56,108,000 | — | 3/11/16 | | 3 month USD- | 0.535% | 23,764 |
| | | | | | LIBOR-BBA | | |
|
| | 97,598,000 | — | 3/14/23 | | 3 month USD- | 2.10125% | 923,444 |
| | | | | | LIBOR-BBA | | |
|
| | 52,344,000 | — | 3/20/23 | | 3 month USD- | 2.045% | 189,564 |
| | | | | | LIBOR-BBA | | |
|
| | 164,735,000 | — | 3/20/16 | | 3 month USD- | 0.521465% | (27,022) |
| | | | | | LIBOR-BBA | | |
|
| AUD | 14,192,000 | — | 12/5/22 | | 6 month AUD-BBR- | 3.82% | (205,110) |
| | | | | | BBSW | | |
|
| AUD | 21,270,000 | — | 2/26/23 | | 6 month AUD-BBR- | 4.07% | 99,434 |
| | | | | | BBSW | | |
|
| AUD | 20,883,000 | — | 3/7/23 | | 6 month AUD-BBR- | 4.0325% | 18,346 |
| | | | | | BBSW | | |
|
| CAD | 97,054,000 | — | 3/14/23 | | 2.4525% | 3 month CAD- | (1,384,614) |
| | | | | | | BA-CDOR | |
|
| CAD | 87,283,000 | — | 2/25/23 | | 3 month CAD-BA- | 2.34% | 431,603 |
| | | | | | CDOR | | |
|
| |
| 62 | Diversified Income Trust |
OTC INTEREST RATE SWAP CONTRACTS OUTSTANDING at 3/31/13 (Unaudited) cont.
| | | | | | | |
| | | Upfront | | | Payments | Payments | Unrealized |
| Swap counterparty/ | premium | Termination | | made by | received by | appreciation/ |
| Notional amount | received (paid) | date | | fund per annum | fund per annum | (depreciation) |
|
| Credit Suisse International cont. | | | | | |
| CHF | 10,744,000 | $— | 2/18/23 | | 6 month CHF- | 1.185% | $114,992 |
| | | | | | LIBOR-BBA | | |
|
| CHF | 21,738,000 | — | 2/27/23 | | 1.20% | 6 month CHF- | (256,399) |
| | | | | | | LIBOR-BBA | |
|
| CHF | 32,316,000 | — | 3/8/23 | | 6 month CHF- | 1.1075% | 55,455 |
| | | | | | LIBOR-BBA | | |
|
| EUR | 161,600,000 | — | 6/28/14 | | 0.85% | 6 month EUR- | (2,239,394) |
| | | | | | | EURIBOR- | |
| | | | | | | REUTERS | |
|
| EUR | 63,043,000 | — | 2/4/23 | | 1.89% | 6 month EUR- | (1,990,795) |
| | | | | | | EURIBOR- | |
| | | | | | | REUTERS | |
|
| EUR | 27,122,000 | — | 2/15/23 | | 6 month EUR- | 1.919% | 930,316 |
| | | | | | EURIBOR-Telerate | | |
|
| EUR | 73,095,000 | — | 3/18/23 | | 6 month EUR- | 1.7525% | 836,655 |
| | | | | | EURIBOR-Telerate | | |
|
| EUR | 9,589,000 | — | 3/19/23 | | 6 month EUR- | 1.729% | 81,753 |
| | | | | | EURIBOR-Telerate | | |
|
| GBP | 10,582,000 | — | 1/31/23 | | 2.11% | 6 month GBP- | (371,075) |
| | | | | | | LIBOR-BBA | |
|
| GBP | 11,027,000 | — | 3/1/23 | | 6 month GBP- | 1.9675% | 124,235 |
| | | | | | LIBOR-BBA | | |
|
| GBP | 37,072,000 | — | 3/1/23 | | 6 month GBP- | 1.975% | 457,456 |
| | | | | | LIBOR-BBA | | |
|
| MXN | 364,910,000 | — | 7/21/20 | | 1 month MXN-TIIE- | 6.895% | 3,073,022 |
| | | | | | BANXICO | | |
|
| SEK | 329,122,000 | — | 3/15/23 | | 3 month SEK- | 2.405% | 490,608 |
| | | | | | STIBOR-SIDE | | |
|
| SEK | 113,700,000 | — | 3/19/23 | | 2.41% | 3 month SEK- | (174,649) |
| | | | | | | STIBOR-SIDE | |
|
| Deutsche Bank AG | | | | | | |
| | $94,668,000 E | 763,865 | 6/19/23 | | 3 month USD- | 2.00% | (65,426) |
| | | | | | LIBOR-BBA | | |
|
| | 73,120,000 E | 83,861 | 6/19/15 | | 3 month USD- | 0.40% | 4,891 |
| | | | | | LIBOR-BBA | | |
|
| | 23,772,000 E | (60,833) | 6/19/18 | | 1.00% | 3 month USD- | (2,117) |
| | | | | | | LIBOR-BBA | |
|
| | 10,513,000 E | (219,266) | 6/19/23 | | 2.00% | 3 month USD- | (127,172) |
| | | | | | | LIBOR-BBA | |
|
| | 3,813,000 E | 8,649 | 6/19/43 | | 3 month USD- | 3.00% | (17,890) |
| | | | | | LIBOR-BBA | | |
|
| MXN | 364,910,000 | — | 7/17/20 | | 1 month MXN-TIIE- | 6.95% | 3,081,271 |
| | | | | | BANXICO | | |
|
| |
| Diversified Income Trust | 63 |
OTC INTEREST RATE SWAP CONTRACTS OUTSTANDING at 3/31/13 (Unaudited) cont.
| | | | | | | |
| | | Upfront | | | Payments | Payments | Unrealized |
| Swap counterparty/ | premium | Termination | | made by | received by | appreciation/ |
| Notional amount | received (paid) | date | | fund per annum | fund per annum | (depreciation) |
|
| Goldman Sachs International | | | | | |
| | $56,516,000 E | $602,789 | 6/19/23 | | 3 month USD- | 2.00% | $107,709 |
| | | | | | LIBOR-BBA | | |
|
| | 47,736,000 | — | 2/4/23 | | 3 month USD- | 2.06625% | 447,191 |
| | | | | | LIBOR-BBA | | |
|
| | 51,691,000 | — | 2/19/23 | | 2.0675% | 3 month USD- | (423,954) |
| | | | | | | LIBOR-BBA | |
|
| | 42,526,000 | — | 2/28/23 | | 1.94% | 3 month USD- | 191,215 |
| | | | | | | LIBOR-BBA | |
|
| | 52,701,000 | — | 3/7/23 | | 1.9775% | 3 month USD- | 84,684 |
| | | | | | | LIBOR-BBA | |
|
| | 1,765,337,000 E | (2,286,257) | 6/19/15 | | 0.40% | 3 month USD- | (379,693) |
| | | | | | | LIBOR-BBA | |
|
| | 151,159,600 E | (3,310,395) | 6/19/23 | | 2.00% | 3 month USD- | (1,986,238) |
| | | | | | | LIBOR-BBA | |
|
| | 108,676,000 E | 700,015 | 6/19/43 | | 3 month USD- | 3.00% | (56,370) |
| | | | | | LIBOR-BBA | | |
|
| AUD | 167,048,000 | — | 2/5/23 | | 6 month AUD-BBR- | 3.97% | (552,257) |
| | | | | | BBSW | | |
|
| CAD | 21,156,000 | — | 2/25/23 | | 3 month CAD-BA- | 2.385% | 191,099 |
| | | | | | CDOR | | |
|
| CAD | 36,368,000 | — | 2/25/23 | | 3 month CAD-BA- | 2.34% | 179,835 |
| | | | | | CDOR | | |
|
| CAD | 21,238,000 | — | 2/26/23 | | 3 month CAD-BA- | 2.27% | (30,314) |
| | | | | | CDOR | | |
|
| CAD | 45,374,000 | — | 3/15/23 | | 2.4025% | 3 month CAD- | (439,412) |
| | | | | | | BA-CDOR | |
|
| CHF | 25,901,000 | — | 2/21/23 | | 1.1825% | 6 month CHF- | (267,252) |
| | | | | | | LIBOR-BBA | |
|
| CHF | 21,203,000 | — | 3/1/23 | | 1.1075% | 6 month CHF- | (44,854) |
| | | | | | | LIBOR-BBA | |
|
| CHF | 42,490,000 | — | 3/4/23 | | 1.1225% | 6 month CHF- | (144,752) |
| | | | | | | LIBOR-BBA | |
|
| CHF | 63,633,000 | — | 3/7/23 | | 6 month CHF- | 1.1025% | 80,703 |
| | | | | | LIBOR-BBA | | |
|
| CHF | 32,316,000 | — | 3/8/23 | | 6 month CHF- | 1.11% | 63,339 |
| | | | | | LIBOR-BBA | | |
|
| EUR | 63,693,000 | — | 10/18/22 | | 1.818% | 6 month EUR- | (2,049,074) |
| | | | | | | EURIBOR- | |
| | | | | | | REUTERS | |
|
| EUR | 1,704,291,000 E | — | 8/6/17 | | 1 year EUR-EONIA- | 1.102% | 3,692,051 |
| | | | | | OIS-COMPOUND | | |
|
| EUR | 414,401,000 | — | 8/30/14 | | 1 year EUR-EONIA- | 0.11% | 171,871 |
| | | | | | OIS-COMPOUND | | |
|
| EUR | 414,401,000 | — | 8/30/14 | | 0.309% | 3 month EUR- | (946,104) |
| | | | | | | EURIBOR- | |
| | | | | | | REUTERS | |
|
| |
| 64 | Diversified Income Trust |
OTC INTEREST RATE SWAP CONTRACTS OUTSTANDING at 3/31/13 (Unaudited) cont.
| | | | | | | |
| | | Upfront | | | Payments | Payments | Unrealized |
| Swap counterparty/ | premium | Termination | | made by | received by | appreciation/ |
| Notional amount | received (paid) | date | | fund per annum | fund per annum | (depreciation) |
|
| Goldman Sachs International cont. | | | | | |
| EUR | 414,401,000 | $— | 8/31/14 | | 1 year EUR-EONIA- | 0.11% | $171,815 |
| | | | | | OIS-COMPOUND | | |
|
| EUR | 414,401,000 | — | 8/31/14 | | 0.314% | 3 month EUR- | (994,832) |
| | | | | | | EURIBOR- | |
| | | | | | | REUTERS | |
|
| EUR | 414,401,000 | — | 9/3/14 | | 1 year EUR-EONIA- | 0.086% | (89,846) |
| | | | | | OIS-COMPOUND | | |
|
| EUR | 414,401,000 | — | 9/3/14 | | 0.283% | 3 month EUR- | (652,050) |
| | | | | | | EURIBOR- | |
| | | | | | | REUTERS | |
|
| EUR | 33,535,000 | — | 2/7/23 | | 1.895% | 6 month EUR- | (1,072,786) |
| | | | | | | EURIBOR- | |
| | | | | | | Telerate | |
|
| EUR | 51,233,000 | — | 2/22/23 | | 6 month EUR- | 1.9135% | 1,695,217 |
| | | | | | EURIBOR-Telerate | | |
|
| EUR | 201,354,000 | — | 2/4/23 | | 1.89% | 6 month EUR- | (6,358,428) |
| | | | | | | EURIBOR- | |
| | | | | | | REUTERS | |
|
| EUR | 17,539,000 | — | 2/5/23 | | 1.873% | 6 month EUR- | (516,196) |
| | | | | | | EURIBOR- | |
| | | | | | | Telerate | |
|
| EUR | 242,196,000 | — | 2/22/15 | | 0.59% | 6 month EUR- | (635,732) |
| | | | | | | EURIBOR- | |
| | | | | | | Telerate | |
|
| EUR | 30,952,000 | — | 3/7/23 | | 1.741% | 6 month EUR- | (343,086) |
| | | | | | | EURIBOR- | |
| | | | | | | Telerate | |
|
| EUR | 34,258,000 | — | 3/19/23 | | 6 month EUR- | 1.736% | 321,161 |
| | | | | | EURIBOR-Telerate | | |
|
| GBP | 36,428,000 | — | 9/23/31 | | 6 month GBP- | 3.1175% | 3,628,273 |
| | | | | | LIBOR-BBA | | |
|
| GBP | 8,538,000 | — | 1/31/23 | | 6 month GBP- | 2.11% | 299,298 |
| | | | | | LIBOR-BBA | | |
|
| GBP | 14,904,000 | — | 2/6/23 | | 2.11125% | 6 month GBP- | (513,991) |
| | | | | | | LIBOR-BBA | |
|
| GBP | 13,115,000 | — | 2/19/23 | | 2.18625% | 6 month GBP- | (574,822) |
| | | | | | | LIBOR-BBA | |
|
| GBP | 36,484,000 | — | 3/5/23 | | 6 month GBP- | 2.0275% | 708,640 |
| | | | | | LIBOR-BBA | | |
|
| JPY | 10,562,447,000 | — | 2/14/23 | | 0.811% | 6 month JPY- | (1,603,319) |
| | | | | | | LIBOR-BBA | |
|
| JPY | 9,455,730,000 | — | 2/1/23 | | 0.805% | 6 month JPY- | (1,420,010) |
| | | | | | | LIBOR-BBA | |
|
| JPY | 5,574,726,000 | — | 2/4/23 | | 0.7835% | 6 month JPY- | (702,318) |
| | | | | | | LIBOR-BBA | |
|
| JPY | 9,457,659,000 | — | 2/18/23 | | 6 month JPY- | 0.8026% | 1,335,390 |
| | | | | | LIBOR-BBA | | |
|
| |
| Diversified Income Trust | 65 |
OTC INTEREST RATE SWAP CONTRACTS OUTSTANDING at 3/31/13 (Unaudited) cont.
| | | | | | | |
| | | Upfront | | | Payments | Payments | Unrealized |
| Swap counterparty/ | premium | Termination | | made by | received by | appreciation/ |
| Notional amount | received (paid) | date | | fund per annum | fund per annum | (depreciation) |
|
| Goldman Sachs International cont. | | | | | |
| JPY | 13,086,822,000 | $— | 3/12/23 | | 6 month JPY- | 0.7525% | $1,060,079 |
| | | | | | LIBOR-BBA | | |
|
| SEK | 394,668,000 | — | 3/18/23 | | 3 month SEK- | 2.4025% | 566,199 |
| | | | | | STIBOR-SIDE | | |
|
| JPMorgan Chase Bank N.A. | | | | | | |
| | $83,032,000 | — | 2/5/23 | | 2.0475% | 3 month USD- | (627,186) |
| | | | | | | LIBOR-BBA | |
|
| | 29,243,000 | — | 2/11/23 | | 2.0225% | 3 month USD- | (135,149) |
| | | | | | | LIBOR-BBA | |
|
| | 90,147,000 | — | 2/28/18 | | 0.92% | 3 month USD- | 38,891 |
| | | | | | | LIBOR-BBA | |
|
| | 21,309,000 | — | 3/1/23 | | 1.955% | 3 month USD- | 68,787 |
| | | | | | | LIBOR-BBA | |
|
| | 84,722,000 E | (93,972) | 6/19/15 | | 0.40% | 3 month USD- | (2,472) |
| | | | | | | LIBOR-BBA | |
|
| | 146,832,000 | — | 3/14/23 | | 3 month USD- | 2.104% | 1,427,648 |
| | | | | | LIBOR-BBA | | |
|
| | 149,243,800 E | (1,991,206) | 6/19/23 | | 2.00% | 3 month USD- | (683,831) |
| | | | | | | LIBOR-BBA | |
|
| CAD | 41,210,000 | — | 9/21/21 | | 2.3911% | 3 month CAD- | (865,393) |
| | | | | | | BA-CDOR | |
|
| CAD | 72,924,000 | — | 5/2/15 | | 3 month CAD-BA- | 1.6575% | 609,920 |
| | | | | | CDOR | | |
|
| CAD | 52,889,000 | — | 2/25/23 | | 3 month CAD-BA- | 2.3825% | 465,641 |
| | | | | | CDOR | | |
|
| CAD | 37,865,000 | (2,085) | 2/25/23 | | 3 month CAD-BA- | 2.34% | 185,153 |
| | | | | | CDOR | | |
|
| CAD | 94,245,000 | — | 2/26/18 | | 3 month CAD-BA- | 1.65% | (42,934) |
| | | | | | CDOR | | |
|
| CZK | 237,584,000 | — | 1/16/23 | | 6 month CZK- | 1.44% | 192,846 |
| | | | | | PRIBOR-PRBO | | |
|
| CZK | 237,584,000 | — | 1/21/23 | | 6 month CZK- | 1.44% | 189,853 |
| | | | | | PRIBOR-PRBO | | |
|
| EUR | 38,060,000 | — | 1/14/23 | | 1.758% | 6 month EUR- | (668,800) |
| | | | | | | EURIBOR- | |
| | | | | | | REUTERS | |
|
| EUR | 18,125,000 | — | 7/30/22 | | 6 month EUR- | 1.803% | 717,826 |
| | | | | | EURIBOR-REUTERS | | |
|
| EUR | 43,923,000 | — | 2/21/23 | | 1.8725% | 6 month EUR- | (1,236,432) |
| | | | | | | EURIBOR- | |
| | | | | | | Telerate | |
|
| GBP | 23,949,000 | — | 1/10/23 | | 6 month GBP- | 2.1075% | 887,716 |
| | | | | | LIBOR-BBA | | |
|
| GBP | 18,041,000 | — | 1/15/23 | | 6 month GBP- | 2.0125% | 408,243 |
| | | | | | LIBOR-BBA | | |
|
| GBP | 37,589,000 | — | 2/25/23 | | 2.1475% | 6 month GBP- | (1,410,240) |
| | | | | | | LIBOR-BBA | |
|
| |
| 66 | Diversified Income Trust |
OTC INTEREST RATE SWAP CONTRACTS OUTSTANDING at 3/31/13 (Unaudited) cont.
| | | | | | | |
| | | Upfront | | | Payments | Payments | Unrealized |
| Swap counterparty/ | premium | Termination | | made by | received by | appreciation/ |
| Notional amount | received (paid) | date | | fund per annum | fund per annum | (depreciation) |
|
| JPMorgan Chase Bank N.A. cont. | | | | | |
| GBP | 23,251,000 | $— | 12/6/22 | | 1.856% | 6 month GBP- | $(108,880) |
| | | | | | | LIBOR-BBA | |
|
| GBP | 42,976,000 | — | 2/20/23 | | 2.226% | 6 month GBP- | (2,128,860) |
| | | | | | | LIBOR-BBA | |
|
| GBP | 212,133,000 | — | 2/20/15 | | 6 month GBP- | 0.668% | 339,553 |
| | | | | | LIBOR-BBA | | |
|
| GBP | 25,425,000 | — | 3/6/23 | | 6 month GBP- | 2.022% | 472,480 |
| | | | | | LIBOR-BBA | | |
|
| MXN | 232,234,000 | — | 9/11/20 | | 6.82% | 1 month MXN- | (1,873,196) |
| | | | | | | TIIE-BANXICO | |
|
| MXN | 299,735,000 | — | 9/14/20 | | 6.82% | 1 month MXN- | (2,421,425) |
| | | | | | | TIIE-BANXICO | |
|
| MXN | 52,130,000 | — | 7/16/20 | | 1 month MXN-TIIE- | 6.99% | 464,767 |
| | | | | | BANXICO | | |
|
| MXN | 325,230,000 | — | 7/30/20 | | 6.3833% | 1 month MXN- | (1,854,429) |
| | | | | | | TIIE-BANXICO | |
|
| MXN | 778,041,000 | — | 7/30/20 | | 6.3833% | 1 month MXN- | (4,436,312) |
| | | | | | | TIIE-BANXICO | |
|
| MXN | 325,230,000 | — | 8/19/20 | | 1 month MXN-TIIE- | 6.615% | 2,264,937 |
| | | | | | BANXICO | | |
|
| MXN | 528,640,000 | — | 11/4/20 | | 1 month MXN-TIIE- | 6.75% | 4,091,778 |
| | | | | | BANXICO | | |
|
| PLN | 38,459,000 | — | 1/16/23 | | 3.855% | 6 month PLN- | (266,876) |
| | | | | | | WIBOR-WIBO | |
|
| PLN | 38,459,000 | — | 1/21/23 | | 3.81% | 6 month PLN- | (210,652) |
| | | | | | | WIBOR-WIBO | |
|
| Royal Bank of Scotland PLC (The) | | | | | |
| | $41,485,000 E | (549,636) | 6/19/23 | | 2.00% | 3 month USD- | (186,227) |
| | | | | | | LIBOR-BBA | |
|
| Total | | | | | | | $(22,890,332) |
E Extended effective date.
OTC TOTAL RETURN SWAP CONTRACTS OUTSTANDING at 3/31/13 (Unaudited)
| | | | | | |
| | Upfront | | | Fixed payments | Total return | Unrealized |
| Swap counterparty/ | premium | Termination | | received (paid) by | received by | appreciation/ |
| Notional amount | received (paid) | date | | fund per annum | or paid by fund | (depreciation) |
|
| Barclays Bank PLC | | | | | | |
| $7,290,312 | $— | 1/12/40 | | 5.00% (1 month | Synthetic MBX Index | $32,003 |
| | | | | USD-LIBOR) | 5.00% 30 year Fannie | |
| | | | | | Mae pools | |
|
| 3,253,611 | — | 1/12/41 | | 3.50% (1 month | Synthetic TRS Index | (15,404) |
| | | | | USD-LIBOR) | 3.50% 30 year Fannie | |
| | | | | | Mae pools | |
|
| 3,026,557 | — | 1/12/41 | | 5.00% (1 month | Synthetic TRS Index | (12,412) |
| | | | | USD-LIBOR) | 5.00% 30 year Fannie | |
| | | | | | Mae pools | |
|
| |
| Diversified Income Trust | 67 |
OTC TOTAL RETURN SWAP CONTRACTS OUTSTANDING at 3/31/13 (Unaudited) cont.
| | | | | | |
| | Upfront | | | Fixed payments | Total return | Unrealized |
| Swap counterparty/ | premium | Termination | | received (paid) by | received by | appreciation/ |
| Notional amount | received (paid) | date | | fund per annum | or paid by fund | (depreciation) |
|
| Barclays Bank PLC cont. | | | | | | |
| $3,253,611 | $— | 1/12/41 | | 3.50% (1 month | Synthetic MBX Index | $29,014 |
| | | | | USD-LIBOR) | 3.50% 30 year Fannie | |
| | | | | | Mae pools | |
|
| 2,921,902 | — | 1/12/41 | | 4.00% (1 month | Synthetic MBX Index | 21,798 |
| | | | | USD-LIBOR) | 4.00% 30 year Fannie | |
| | | | | | Mae pools | |
|
| 2,768,012 | — | 1/12/41 | | 4.50% (1 month | Synthetic MBX Index | 13,587 |
| | | | | USD-LIBOR) | 4.50% 30 year Fannie | |
| | | | | | Mae pools | |
|
| 9,606,521 | — | 1/12/42 | | 4.00% (1 month | Synthetic TRS Index | (45,955) |
| | | | | USD-LIBOR) | 4.00% 30 year Fannie | |
| | | | | | Mae pools | |
|
| 9,049,739 | — | 1/12/40 | | 5.00% (1 month | Synthetic MBX Index | 39,727 |
| | | | | USD-LIBOR) | 5.00% 30 year Fannie | |
| | | | | | Mae pools | |
|
| 7,699,561 | — | 1/12/41 | | 5.00% (1 month | Synthetic MBX Index | 33,788 |
| | | | | USD-LIBOR) | 5.00% 30 year Fannie | |
| | | | | | Mae pools | |
|
| 20,093,337 | — | 1/12/41 | | 4.00% (1 month | Synthetic TRS Index | (96,099) |
| | | | | USD-LIBOR) | 4.00% 30 year Fannie | |
| | | | | | Mae pools | |
|
| 85,977,555 | — | 1/12/41 | | 4.00% (1 month | Synthetic TRS Index | (411,201) |
| | | | | USD-LIBOR) | 4.00% 30 year Fannie | |
| | | | | | Mae pools | |
|
| 5,425,972 | — | 1/12/41 | | 4.00% (1 month | Synthetic TRS Index | (25,951) |
| | | | | USD-LIBOR) | 4.00% 30 year Fannie | |
| | | | | | Mae pools | |
|
| 11,563,376 | — | 1/12/38 | | (6.50%) 1 month | Synthetic MBX Index | (56,267) |
| | | | | USD-LIBOR | 6.50% 30 year Fannie | |
| | | | | | Mae pools | |
|
| 13,881,135 | — | 1/12/40 | | 4.00% (1 month | Synthetic MBX Index | 112,242 |
| | | | | USD-LIBOR) | 4.00% 30 year Fannie | |
| | | | | | Mae pools | |
|
| 9,582,086 | — | 1/12/41 | | 4.00% (1 month | Synthetic TRS Index | (45,828) |
| | | | | USD-LIBOR) | 4.00% 30 year Fannie | |
| | | | | | Mae pools | |
|
| 4,355,972 | — | 1/12/41 | | 4.00% (1 month | Synthetic TRS Index | (20,833) |
| | | | | USD-LIBOR) | 4.00% 30 year Fannie | |
| | | | | | Mae pools | |
|
| 4,237,180 | — | 1/12/41 | | 5.00% (1 month | Synthetic MBX Index | 18,594 |
| | | | | USD-LIBOR) | 5.00% 30 year Fannie | |
| | | | | | Mae pools | |
|
| 3,966,869 | — | 1/12/40 | | 4.00% (1 month | Synthetic MBX Index | 32,076 |
| | | | | USD-LIBOR) | 4.00% 30 year Fannie | |
| | | | | | Mae pools | |
|
| 2,252,168 | — | 1/12/40 | | 4.50% (1 month | Synthetic MBX Index | 13,169 |
| | | | | USD-LIBOR) | 4.50% 30 year Fannie | |
| | | | | | Mae pools | |
|
| |
| 68 | Diversified Income Trust |
OTC TOTAL RETURN SWAP CONTRACTS OUTSTANDING at 3/31/13 (Unaudited) cont.
| | | | | | |
| | Upfront | | | Fixed payments | Total return | Unrealized |
| Swap counterparty/ | premium | Termination | | received (paid) by | received by | appreciation/ |
| Notional amount | received (paid) | date | | fund per annum | or paid by fund | (depreciation) |
|
| Barclays Bank PLC cont. | | | | | | |
| $2,784,806 | $— | 1/12/40 | | 5.00% (1 month | Synthetic MBX Index | $12,225 |
| | | | | USD-LIBOR) | 5.00% 30 year Fannie | |
| | | | | | Mae pools | |
|
| 33,102,059 | — | 1/12/41 | | 5.00% (1 month | Synthetic MBX Index | 145,264 |
| | | | | USD-LIBOR) | 5.00% 30 year Fannie | |
| | | | | | Mae pools | |
|
| 18,548,235 | — | 1/12/41 | | 4.00% (1 month | Synthetic TRS Index | (88,710) |
| | | | | USD-LIBOR) | 4.00% 30 year Fannie | |
| | | | | | Mae pools | |
|
| 10,722,606 | — | 1/12/39 | | 6.00% (1 month | Synthetic TRS Index | 5,302 |
| | | | | USD-LIBOR) | 6.00% 30 year Fannie | |
| | | | | | Mae pools | |
|
| 28,791,107 | — | 1/12/38 | | (6.50%) 1 month | Synthetic MBX Index | (140,097) |
| | | | | USD-LIBOR | 6.50% 30 year Fannie | |
| | | | | | Mae pools | |
|
| 25,343,782 | — | 1/12/41 | | 5.00% (1 month | Synthetic MBX Index | 111,218 |
| | | | | USD-LIBOR) | 5.00% 30 year Fannie | |
| | | | | | Mae pools | |
|
| 7,865,783 | — | 1/12/40 | | 4.00% (1 month | Synthetic MBX Index | 63,602 |
| | | | | USD-LIBOR) | 4.00% 30 year Fannie | |
| | | | | | Mae pools | |
|
| 1,486,214 | — | 1/12/38 | | 6.50% (1 month | Synthetic TRS Index | (3,289) |
| | | | | USD-LIBOR) | 6.50% 30 year Fannie | |
| | | | | | Mae pools | |
|
| 8,152,672 | — | 1/12/38 | | (6.50%) 1 month | Synthetic MBX Index | (39,671) |
| | | | | USD-LIBOR | 6.50% 30 year Fannie | |
| | | | | | Mae pools | |
|
| 72,920,000 | — | 4/7/16 | | (2.63%) | USA Non Revised | (1,289,664) |
| | | | | | Consumer Price | |
| | | | | | Index-Urban (CPI-U) | |
|
| 3,082,851 | — | 1/12/41 | | 5.00% (1 month | Synthetic MBX Index | 13,529 |
| | | | | USD-LIBOR) | 5.00% 30 year Fannie | |
| | | | | | Mae pools | |
|
| 12,432,803 | — | 1/12/41 | | 4.50% (1 month | Synthetic TRS Index | (54,246) |
| | | | | USD-LIBOR) | 4.50% 30 year Fannie | |
| | | | | | Mae pools | |
|
| 19,606,910 | — | 1/12/41 | | 3.50% (1 month | Synthetic MBX Index | 174,846 |
| | | | | USD-LIBOR) | 3.50% 30 year Fannie | |
| | | | | | Mae pools | |
|
| 4,114,516 | — | 1/12/41 | | 3.50% (1 month | Synthetic MBX Index | 36,692 |
| | | | | USD-LIBOR) | 3.50% 30 year Fannie | |
| | | | | | Mae pools | |
|
| 40,656,515 | — | 1/12/41 | | 4.00% (1 month | Synthetic TRS Index | (194,446) |
| | | | | USD-LIBOR) | 4.00% 30 year Fannie | |
| | | | | | Mae pools | |
|
| 21,038 | — | 1/12/41 | | 4.00% (1 month | Synthetic TRS Index | (101) |
| | | | | USD-LIBOR) | 4.00% 30 year Fannie | |
| | | | | | Mae pools | |
|
| |
| Diversified Income Trust | 69 |
OTC TOTAL RETURN SWAP CONTRACTS OUTSTANDING at 3/31/13 (Unaudited) cont.
| | | | | | |
| | Upfront | | | Fixed payments | Total return | Unrealized |
| Swap counterparty/ | premium | Termination | | received (paid) by | received by | appreciation/ |
| Notional amount | received (paid) | date | | fund per annum | or paid by fund | (depreciation) |
|
| Barclays Bank PLC cont. | | | | | | |
| $4,124,947 | $— | 1/12/41 | | 5.00% (1 month | Synthetic MBX Index | $12,949 |
| | | | | USD-LIBOR) | 5.00% 30 year Ginnie | |
| | | | | | Mae II pools | |
|
| 44,010,148 | — | 1/12/38 | | (6.50%) 1 month | Synthetic MBX Index | (214,153) |
| | | | | USD-LIBOR | 6.50% 30 year Fannie | |
| | | | | | Mae pools | |
|
| 25,930,169 | — | 1/12/40 | | 4.00% (1 month | Synthetic MBX Index | 209,669 |
| | | | | USD-LIBOR) | 4.00% 30 year Fannie | |
| | | | | | Mae pools | |
|
| 12,151,949 | — | 1/12/38 | | (6.50%) 1 month | Synthetic MBX Index | (59,131) |
| | | | | USD-LIBOR | 6.50% 30 year Fannie | |
| | | | | | Mae pools | |
|
| 19,250,076 | — | 1/12/41 | | 4.00% (1 month | Synthetic TRS Index | (92,066) |
| | | | | USD-LIBOR) | 4.00% 30 year Fannie | |
| | | | | | Mae pools | |
|
| 5,638,918 | — | 1/12/40 | | (4.00%) 1 month | Synthetic TRS Index | 30,480 |
| | | | | USD-LIBOR | 4.00% 30 year Fannie | |
| | | | | | Mae pools | |
|
| 4,819,281 | — | 1/12/40 | | 5.00% (1 month | Synthetic MBX Index | 21,156 |
| | | | | USD-LIBOR) | 5.00% 30 year Fannie | |
| | | | | | Mae pools | |
|
| 9,564,555 | — | 1/12/41 | | 4.00% (1 month | Synthetic TRS Index | (45,744) |
| | | | | USD-LIBOR) | 4.00% 30 year Fannie | |
| | | | | | Mae pools | |
|
| 668,547 | — | 1/12/41 | | (4.50%) 1 month | Synthetic TRS Index | 2,710 |
| | | | | USD-LIBOR | 4.50% 30 year Ginnie | |
| | | | | | Mae II pools | |
|
| 39,924,945 | — | 1/12/40 | | 4.50% (1 month | Synthetic MBX Index | 233,453 |
| | | | | USD-LIBOR) | 4.50% 30 year Fannie | |
| | | | | | Mae pools | |
|
| 136,567,329 | — | 1/12/41 | | 5.00% (1 month | Synthetic MBX Index | 599,306 |
| | | | | USD-LIBOR) | 5.00% 30 year Fannie | |
| | | | | | Mae pools | |
|
| 9,110,110 | — | 1/12/41 | | 3.50% (1 month | Synthetic MBX Index | 81,240 |
| | | | | USD-LIBOR) | 3.50% 30 year Fannie | |
| | | | | | Mae pools | |
|
| 38,557,730 | — | 1/12/41 | | 5.00% (1 month | Synthetic MBX Index | 169,205 |
| | | | | USD-LIBOR) | 5.00% 30 year Fannie | |
| | | | | | Mae pools | |
|
| 6,388,155 | — | 1/12/40 | | 5.00% (1 month | Synthetic MBX Index | 28,043 |
| | | | | USD-LIBOR) | 5.00% 30 year Fannie | |
| | | | | | Mae pools | |
|
| 20,715,735 | — | 1/12/40 | | 5.00% (1 month | Synthetic MBX Index | 90,938 |
| | | | | USD-LIBOR) | 5.00% 30 year Fannie | |
| | | | | | Mae pools | |
|
| 15,018,501 | — | 1/12/40 | | 5.00% (1 month | Synthetic MBX Index | 65,928 |
| | | | | USD-LIBOR) | 5.00% 30 year Fannie | |
| | | | | | Mae pools | |
|
| |
| 70 | Diversified Income Trust |
OTC TOTAL RETURN SWAP CONTRACTS OUTSTANDING at 3/31/13 (Unaudited) cont.
| | | | | | |
| | Upfront | | | Fixed payments | Total return | Unrealized |
| Swap counterparty/ | premium | Termination | | received (paid) by | received by | appreciation/ |
| Notional amount | received (paid) | date | | fund per annum | or paid by fund | (depreciation) |
|
| Barclays Bank PLC cont. | | | | | | |
| $183,550 | $— | 1/12/39 | | (6.00%) 1 month | Synthetic TRS Index | $91 |
| | | | | USD-LIBOR | 6.00% 30 year Fannie | |
| | | | | | Mae pools | |
|
| 3,569,116 | — | 1/12/41 | | 5.00% (1 month | Synthetic TRS Index | (14,087) |
| | | | | USD-LIBOR) | 5.00% 30 year Ginnie | |
| | | | | | Mae II pools | |
|
| 31,955,039 | — | 1/12/41 | | (4.50%) 1 month | Synthetic TRS Index | 139,423 |
| | | | | USD-LIBOR | 4.50% 30 year Fannie | |
| | | | | | Mae pools | |
|
| 1,430,775 | — | 1/12/39 | | (6.00%) 1 month | Synthetic MBX Index | (3,682) |
| | | | | USD-LIBOR | 6.00% 30 year Fannie | |
| | | | | | Mae pools | |
|
| 1,423,936 | — | 1/12/38 | | (6.50%) 1 month | Synthetic MBX Index | (6,929) |
| | | | | USD-LIBOR | 6.50% 30 year Fannie | |
| | | | | | Mae pools | |
|
| 65,714,625 | — | 1/12/38 | | (6.50%) 1 month | Synthetic MBX Index | (319,767) |
| | | | | USD-LIBOR | 6.50% 30 year Fannie | |
| | | | | | Mae pools | |
|
| 49,677,727 | — | 1/12/39 | | (6.00%) 1 month | Synthetic MBX Index | (127,850) |
| | | | | USD-LIBOR | 6.00% 30 year Fannie | |
| | | | | | Mae pools | |
|
| 46,938,733 | — | 1/12/38 | | 6.50% (1 month | Synthetic MBX Index | 228,404 |
| | | | | USD-LIBOR) | 6.50% 30 year Fannie | |
| | | | | | Mae pools | |
|
| 35,483,959 | — | 1/12/39 | | 6.00% (1 month | Synthetic MBX Index | 91,321 |
| | | | | USD-LIBOR) | 6.00% 30 year Fannie | |
| | | | | | Mae pools | |
|
| 35,820,291 | — | 1/12/41 | | (4.50%) 1 month | Synthetic TRS Index | 156,288 |
| | | | | USD-LIBOR | 4.50% 30 year Fannie | |
| | | | | | Mae pools | |
|
| 5,511,666 | — | 1/12/41 | | (4.50%) 1 month | Synthetic TRS Index | 24,048 |
| | | | | USD-LIBOR | 4.50% 30 year Fannie | |
| | | | | | Mae pools | |
|
| 21,507,537 | — | 1/12/41 | | (4.00%) 1 month | Synthetic TRS Index | 102,863 |
| | | | | USD-LIBOR | 4.00% 30 year Fannie | |
| | | | | | Mae pools | |
|
| Citibank, N.A. | | | | | | |
| 4,113,091 | — | 1/12/41 | | 5.00% (1 month | Synthetic MBX Index | 18,050 |
| | | | | USD-LIBOR) | 5.00% 30 year Fannie | |
| | | | | | Mae pools | |
|
| 24,742,103 | — | 1/12/41 | | 5.00% (1 month | Synthetic MBX Index | 108,577 |
| | | | | USD-LIBOR) | 5.00% 30 year Fannie | |
| | | | | | Mae pools | |
|
| 9,858,498 | — | 1/12/41 | | 4.00% (1 month | Synthetic TRS Index | (47,150) |
| | | | | USD-LIBOR) | 4.00% 30 year Fannie | |
| | | | | | Mae pools | |
|
| |
| Diversified Income Trust | 71 |
OTC TOTAL RETURN SWAP CONTRACTS OUTSTANDING at 3/31/13 (Unaudited) cont.
| | | | | | |
| | Upfront | | | Fixed payments | Total return | Unrealized |
| Swap counterparty/ | premium | Termination | | received (paid) by | received by | appreciation/ |
| Notional amount | received (paid) | date | | fund per annum | or paid by fund | (depreciation) |
|
| Citibank, N.A. cont. | | | | | | |
| $17,202,642 | $— | 1/12/41 | | (4.50%) 1 month | Synthetic TRS Index | $75,057 |
| | | | | USD-LIBOR | 4.50% 30 year Fannie | |
| | | | | | Mae pools | |
|
| 43,860,627 | (233,009) | 1/12/41 | | (3.50%) 1 month | Synthetic TRS Index | 8,420 |
| | | | | USD-LIBOR | 3.50% 30 year Fannie | |
| | | | | | Mae pools | |
|
| Credit Suisse International | | | | | |
| 14,527,473 | — | 1/12/41 | | 5.00% (1 month | Synthetic MBX Index | 63,752 |
| | | | | USD-LIBOR) | 5.00% 30 year Fannie | |
| | | | | | Mae pools | |
|
| 74,672,672 | — | 1/12/41 | | 4.50% (1 month | Synthetic MBX Index | 471,427 |
| | | | | USD-LIBOR) | 4.50% 30 year Ginnie | |
| | | | | | Mae II pools | |
|
| 11,746,186 | — | 1/12/41 | | 3.50% (1 month | Synthetic MBX Index | 104,748 |
| | | | | USD-LIBOR) | 3.50% 30 year Fannie | |
| | | | | | Mae pools | |
|
| 2,936,709 | — | 1/12/41 | | 3.50% (1 month | Synthetic MBX Index | 26,188 |
| | | | | USD-LIBOR) | 3.50% 30 year Fannie | |
| | | | | | Mae pools | |
|
| 6,173,395 | — | 1/12/41 | | 4.00% (1 month | Synthetic TRS Index | (29,525) |
| | | | | USD-LIBOR) | 4.00% 30 year Fannie | |
| | | | | | Mae pools | |
|
| 1,250,588 | — | 1/12/41 | | (4.50%) 1 month | Synthetic TRS Index | 5,456 |
| | | | | USD-LIBOR | 4.50% 30 year Fannie | |
| | | | | | Mae pools | |
|
| 13,611,973 | — | 1/12/41 | | 4.00% (1 month | Synthetic TRS Index | (65,101) |
| | | | | USD-LIBOR) | 4.00% 30 year Fannie | |
| | | | | | Mae pools | |
|
| 3,026,557 | — | 1/12/41 | | 5.00% (1 month | Synthetic MBX Index | 13,282 |
| | | | | USD-LIBOR) | 5.00% 30 year Fannie | |
| | | | | | Mae pools | |
|
| 19,929,124 | — | 1/12/38 | | (6.50%) 1 month | Synthetic MBX Index | (96,975) |
| | | | | USD-LIBOR | 6.50% 30 year Fannie | |
| | | | | | Mae pools | |
|
| 206,744 | — | 1/12/40 | | 5.00% (1 month | Synthetic TRS Index | (621) |
| | | | | USD-LIBOR) | 5.00% 30 year Fannie | |
| | | | | | Mae pools | |
|
| 721,789 | — | 1/12/34 | | 5.00% (1 month | Synthetic MBX Index | 2,154 |
| | | | | USD-LIBOR) | 5.00% 30 year Fannie | |
| | | | | | Mae pools | |
|
| 976,102 | — | 1/12/36 | | 5.00% (1 month | Synthetic MBX Index | 2,303 |
| | | | | USD-LIBOR) | 5.00% 30 year Fannie | |
| | | | | | Mae pools | |
|
| 909,179 | — | 1/12/39 | | 5.00% (1 month | Synthetic MBX Index | 2,574 |
| | | | | USD-LIBOR) | 5.00% 30 year Fannie | |
| | | | | | Mae pools | |
|
| |
| 72 | Diversified Income Trust |
OTC TOTAL RETURN SWAP CONTRACTS OUTSTANDING at 3/31/13 (Unaudited) cont.
| | | | | | |
| | Upfront | | | Fixed payments | Total return | Unrealized |
| Swap counterparty/ | premium | Termination | | received (paid) by | received by | appreciation/ |
| Notional amount | received (paid) | date | | fund per annum | or paid by fund | (depreciation) |
|
| Credit Suisse International cont. | | | | | |
| $3,467,872 | $— | 1/12/42 | | 4.50% (1 month | Synthetic TRS Index | $(16,219) |
| | | | | USD-LIBOR) | 4.50% 30 year Fannie | |
| | | | | | Mae pools | |
|
| 3,467,872 | — | 1/12/42 | | 4.50% (1 month | Synthetic MBX Index | 20,814 |
| | | | | USD-LIBOR) | 4.50% 30 year Fannie | |
| | | | | | Mae pools | |
|
| 22,996,522 | — | 1/12/41 | | 3.50% (1 month | Synthetic MBX Index | 205,073 |
| | | | | USD-LIBOR) | 3.50% 30 year Fannie | |
| | | | | | Mae pools | |
|
| 4,839,778 | — | 1/12/43 | | 3.00% (1 month | Synthetic TRS Index | (29,392) |
| | | | | USD-LIBOR) | 3.00% 30 year Fannie | |
| | | | | | Mae pools | |
|
| 17,676,339 | — | 1/12/41 | | (4.00%) 1 month | Synthetic TRS Index | 84,540 |
| | | | | USD-LIBOR | 4.00% 30 year Fannie | |
| | | | | | Mae pools | |
|
| Deutsche Bank AG | | | | | | |
| 4,694,255 | — | 1/12/40 | | 4.00% (1 month | Synthetic MBX Index | 37,957 |
| | | | | USD-LIBOR) | 4.00% 30 year Fannie | |
| | | | | | Mae pools | |
|
| 19,929,124 | — | 1/12/38 | | (6.50%) 1 month | Synthetic MBX Index | (96,975) |
| | | | | USD-LIBOR | 6.50% 30 year Fannie | |
| | | | | | Mae pools | |
|
| 547,297 | — | 1/12/34 | | 5.50% (1 month | Synthetic MBX Index | 3,060 |
| | | | | USD-LIBOR) | 5.50% 30 year Fannie | |
| | | | | | Mae pools | |
|
| 999,573 | — | 1/12/36 | | 5.50% (1 month | Synthetic MBX Index | 5,276 |
| | | | | USD-LIBOR) | 5.50% 30 year Fannie | |
| | | | | | Mae pools | |
|
| Goldman Sachs International | | | | | |
| 18,229,163 | — | 1/12/41 | | 4.00% (1 month | Synthetic TRS Index | (87,184) |
| | | | | USD-LIBOR) | 4.00% 30 year Fannie | |
| | | | | | Mae pools | |
|
| 4,105,655 | — | 1/12/39 | | 6.00% (1 month | Synthetic TRS Index | 2,030 |
| | | | | USD-LIBOR) | 6.00% 30 year Fannie | |
| | | | | | Mae pools | |
|
| 22,528,790 | — | 1/12/39 | | 6.00% (1 month | Synthetic TRS Index | 11,140 |
| | | | | USD-LIBOR) | 6.00% 30 year Fannie | |
| | | | | | Mae pools | |
|
| 2,921,902 | — | 1/12/41 | | 4.00% (1 month | Synthetic TRS Index | (13,974) |
| | | | | USD-LIBOR) | 4.00% 30 year Fannie | |
| | | | | | Mae pools | |
|
| 2,768,012 | — | 1/12/41 | | 4.50% (1 month | Synthetic TRS Index | (12,077) |
| | | | | USD-LIBOR) | 4.50% 30 year Fannie | |
| | | | | | Mae pools | |
|
| 41,680,000 | — | 3/1/16 | | 2.47% | USA Non Revised | 283,007 |
| | | | | | Consumer Price | |
| | | | | | Index-Urban (CPI-U) | |
|
| |
| Diversified Income Trust | 73 |
OTC TOTAL RETURN SWAP CONTRACTS OUTSTANDING at 3/31/13 (Unaudited) cont.
| | | | | | |
| | Upfront | | | Fixed payments | Total return | Unrealized |
| Swap counterparty/ | premium | Termination | | received (paid) by | received by | appreciation/ |
| Notional amount | received (paid) | date | | fund per annum | or paid by fund | (depreciation) |
|
| Goldman Sachs International cont. | | | | | |
| $31,260,000 | $— | 3/3/16 | | 2.45% | USA Non Revised | $180,370 |
| | | | | | Consumer Price | |
| | | | | | Index-Urban (CPI-U) | |
|
| 6,923,710 | — | 1/12/38 | | 6.50% (1 month | Synthetic TRS Index | (15,320) |
| | | | | USD-LIBOR) | 6.50% 30 year Fannie | |
| | | | | | Mae pools | |
|
| 6,230,664 | — | 1/12/41 | | 4.00% (1 month | Synthetic TRS Index | (29,799) |
| | | | | USD-LIBOR) | 4.00% 30 year Fannie | |
| | | | | | Mae pools | |
|
| 11,892,142 | — | 1/12/41 | | 4.00% (1 month | Synthetic TRS Index | (56,876) |
| | | | | USD-LIBOR) | 4.00% 30 year Fannie | |
| | | | | | Mae pools | |
|
| 11,967,223 | — | 1/12/41 | | 4.50% (1 month | Synthetic TRS Index | (52,214) |
| | | | | USD-LIBOR) | 4.50% 30 year Fannie | |
| | | | | | Mae pools | |
|
| 24,008,906 | — | 1/12/42 | | 4.00% (1 month | Synthetic TRS Index | (114,851) |
| | | | | USD-LIBOR) | 4.00% 30 year Fannie | |
| | | | | | Mae pools | |
|
| 24,008,906 | — | 1/12/42 | | 4.00% (1 month | Synthetic TRS Index | (114,851) |
| | | | | USD-LIBOR) | 4.00% 30 year Fannie | |
| | | | | | Mae pools | |
|
| 348,291 | — | 1/12/41 | | 4.00% (1 month | Synthetic TRS Index | (1,666) |
| | | | | USD-LIBOR) | 4.00% 30 year Fannie | |
| | | | | | Mae pools | |
|
| 7,856,726 | — | 1/12/41 | | 4.50% (1 month | Synthetic TRS Index | (34,280) |
| | | | | USD-LIBOR) | 4.50% 30 year Fannie | |
| | | | | | Mae pools | |
|
| 5,697,122 | — | 1/12/41 | | 4.50% (1 month | Synthetic TRS Index | (24,857) |
| | | | | USD-LIBOR) | 4.50% 30 year Fannie | |
| | | | | | Mae pools | |
|
| 23,878,953 | — | 1/12/41 | | 4.00% (1 month | Synthetic TRS Index | (114,205) |
| | | | | USD-LIBOR) | 4.00% 30 year Fannie | |
| | | | | | Mae pools | |
|
| 12,551,907 | — | 1/12/41 | | 4.00% (1 month | Synthetic TRS Index | (60,031) |
| | | | | USD-LIBOR) | 4.00% 30 year Fannie | |
| | | | | | Mae pools | |
|
| 38,200,228 | — | 1/12/41 | | 4.50% (1 month | Synthetic TRS Index | (166,672) |
| | | | | USD-LIBOR) | 4.50% 30 year Fannie | |
| | | | | | Mae pools | |
|
| 34,555,309 | — | 1/12/41 | | 4.50% (1 month | Synthetic TRS Index | (150,769) |
| | | | | USD-LIBOR) | 4.50% 30 year Fannie | |
| | | | | | Mae pools | |
|
| 10,022,190 | — | 1/12/38 | | (6.50%) 1 month | Synthetic MBX Index | (48,768) |
| | | | | USD-LIBOR | 6.50% 30 year Fannie | |
| | | | | | Mae pools | |
|
| 3,765,110 | — | 1/12/38 | | (6.50%) 1 month | Synthetic MBX Index | (18,321) |
| | | | | USD-LIBOR | 6.50% 30 year Fannie | |
| | | | | | Mae pools | |
|
| |
| 74 | Diversified Income Trust |
OTC TOTAL RETURN SWAP CONTRACTS OUTSTANDING at 3/31/13 (Unaudited) cont.
| | | | | | |
| | Upfront | | | Fixed payments | Total return | Unrealized |
| Swap counterparty/ | premium | Termination | | received (paid) by | received by | appreciation/ |
| Notional amount | received (paid) | date | | fund per annum | or paid by fund | (depreciation) |
|
| Goldman Sachs International cont. | | | | | |
| $64,335,798 | $— | 1/12/41 | | 4.50% (1 month | Synthetic TRS Index | $(280,704) |
| | | | | USD-LIBOR) | 4.50% 30 year Fannie | |
| | | | | | Mae pools | |
|
| 16,447,528 | — | 1/12/41 | | 4.50% (1 month | Synthetic TRS Index | (71,762) |
| | | | | USD-LIBOR) | 4.50% 30 year Fannie | |
| | | | | | Mae pools | |
|
| 5,483,242 | — | 1/12/41 | | 4.00% (1 month | Synthetic TRS Index | (26,224) |
| | | | | USD-LIBOR) | 4.00% 30 year Fannie | |
| | | | | | Mae pools | |
|
| 17,799,059 | — | 1/12/41 | | 4.00% (1 month | Synthetic TRS Index | (85,127) |
| | | | | USD-LIBOR) | 4.00% 30 year Fannie | |
| | | | | | Mae pools | |
|
| 7,892,666 | — | 1/12/39 | | 6.00% (1 month | Synthetic TRS Index | 3,903 |
| | | | | USD-LIBOR) | 6.00% 30 year Fannie | |
| | | | | | Mae pools | |
|
| 7,480,963 | — | 1/12/39 | | 6.00% (1 month | Synthetic TRS Index | 3,699 |
| | | | | USD-LIBOR) | 6.00% 30 year Fannie | |
| | | | | | Mae pools | |
|
| 2,491,140 | — | 1/12/38 | | (6.50%) 1 month | Synthetic MBX Index | (12,122) |
| | | | | USD-LIBOR | 6.50% 30 year Fannie | |
| | | | | | Mae pools | |
|
| 14,112,203 | — | 1/12/41 | | 4.00% (1 month | Synthetic TRS Index | (67,494) |
| | | | | USD-LIBOR) | 4.00% 30 year Fannie | |
| | | | | | Mae pools | |
|
| 511,680 | — | 1/12/38 | | 6.50% (1 month | Synthetic TRS Index | (1,132) |
| | | | | USD-LIBOR) | 6.50% 30 year Fannie | |
| | | | | | Mae pools | |
|
| 13,339,604 | — | 1/12/41 | | 4.50% (1 month | Synthetic TRS Index | (58,202) |
| | | | | USD-LIBOR) | 4.50% 30 year Fannie | |
| | | | | | Mae pools | |
|
| 100,787,436 | — | 1/12/40 | | 4.00% (1 month | Synthetic TRS Index | (544,781) |
| | | | | USD-LIBOR) | 4.00% 30 year Fannie | |
| | | | | | Mae pools | |
|
| 7,863,115 | — | 1/12/39 | | 6.00% (1 month | Synthetic TRS Index | 3,888 |
| | | | | USD-LIBOR) | 6.00% 30 year Fannie | |
| | | | | | Mae pools | |
|
| 4,696,687 | — | 1/12/39 | | 6.00% (1 month | Synthetic TRS Index | 2,322 |
| | | | | USD-LIBOR) | 6.00% 30 year Fannie | |
| | | | | | Mae pools | |
|
| 15,727,514 | — | 1/12/39 | | 6.00% (1 month | Synthetic TRS Index | 7,777 |
| | | | | USD-LIBOR) | 6.00% 30 year Fannie | |
| | | | | | Mae pools | |
|
| 8,218,228 | — | 1/12/41 | | 4.50% (1 month | Synthetic TRS Index | (35,857) |
| | | | | USD-LIBOR) | 4.50% 30 year Fannie | |
| | | | | | Mae pools | |
|
| 3,211,080 | — | 1/12/38 | | 6.50% (1 month | Synthetic TRS Index | (7,105) |
| | | | | USD-LIBOR) | 6.50% 30 year Fannie | |
| | | | | | Mae pools | |
|
| |
| Diversified Income Trust | 75 |
OTC TOTAL RETURN SWAP CONTRACTS OUTSTANDING at 3/31/13 (Unaudited) cont.
| | | | | | |
| | Upfront | | | Fixed payments | Total return | Unrealized |
| Swap counterparty/ | premium | Termination | | received (paid) by | received by | appreciation/ |
| Notional amount | received (paid) | date | | fund per annum | or paid by fund | (depreciation) |
|
| Goldman Sachs International cont. | | | | | |
| $3,579,232 | $— | 1/12/39 | | (6.00%) 1 month | Synthetic MBX Index | $(9,211) |
| | | | | USD-LIBOR | 6.00% 30 year Fannie | |
| | | | | | Mae pools | |
|
| 4,317,977 | — | 1/12/38 | | 6.50% (1 month | Synthetic MBX Index | 21,011 |
| | | | | USD-LIBOR) | 6.50% 30 year Fannie | |
| | | | | | Mae pools | |
|
| 5,016,875 | — | 1/12/40 | | (5.00%) 1 month | Synthetic MBX Index | (22,023) |
| | | | | USD-LIBOR | 5.00% 30 year Fannie | |
| | | | | | Mae pools | |
|
| 3,163,162 | — | 1/12/39 | | 5.50% (1 month | Synthetic MBX Index | 13,243 |
| | | | | USD-LIBOR) | 5.50% 30 year Fannie | |
| | | | | | Mae pools | |
|
| 4,281,538 | — | 1/12/40 | | (4.50%) 1 month | Synthetic MBX Index | (25,035) |
| | | | | USD-LIBOR | 4.50% 30 year Fannie | |
| | | | | | Mae pools | |
|
| 25,955,841 | — | 1/12/41 | | 4.00% (1 month | Synthetic TRS Index | (124,138) |
| | | | | USD-LIBOR) | 4.00% 30 year Fannie | |
| | | | | | Mae pools | |
|
| 7,461,796 | — | 1/12/38 | | (6.50%) 1 month | Synthetic MBX Index | (36,309) |
| | | | | USD-LIBOR | 6.50% 30 year Fannie | |
| | | | | | Mae pools | |
|
| 6,193,264 | — | 1/12/41 | | 4.00% (1 month | Synthetic TRS Index | (29,620) |
| | | | | USD-LIBOR) | 4.00% 30 year Fannie | |
| | | | | | Mae pools | |
|
| 11,861,754 | — | 1/12/41 | | 4.00% (1 month | Synthetic TRS Index | (56,731) |
| | | | | USD-LIBOR) | 4.00% 30 year Fannie | |
| | | | | | Mae pools | |
|
| 11,681,180 | — | 1/12/41 | | 4.00% (1 month | Synthetic TRS Index | (55,867) |
| | | | | USD-LIBOR) | 4.00% 30 year Fannie | |
| | | | | | Mae pools | |
|
| 11,112,578 | — | 1/12/41 | | 4.00% (1 month | Synthetic TRS Index | (53,148) |
| | | | | USD-LIBOR) | 4.00% 30 year Fannie | |
| | | | | | Mae pools | |
|
| 13,729,339 | — | 1/12/38 | | (6.50%) 1 month | Synthetic MBX Index | (66,807) |
| | | | | USD-LIBOR | 6.50% 30 year Fannie | |
| | | | | | Mae pools | |
|
| 583,857 | — | 1/12/41 | | 5.00% (1 month | Synthetic TRS Index | (2,304) |
| | | | | USD-LIBOR) | 5.00% 30 year Ginnie | |
| | | | | | Mae II pools | |
|
| 742,815 | — | 1/12/41 | | (4.00%) 1 month | Synthetic TRS Index | 2,975 |
| | | | | USD-LIBOR | 4.00% 30 year Ginnie | |
| | | | | | Mae II pools | |
|
| 8,954,487 | — | 1/12/38 | | (6.50%) 1 month | Synthetic MBX Index | (43,573) |
| | | | | USD-LIBOR | 6.50% 30 year Fannie | |
| | | | | | Mae pools | |
|
| 267,003 | — | 1/12/38 | | 6.50% (1 month | Synthetic TRS Index | (591) |
| | | | | USD-LIBOR) | 6.50% 30 year Fannie | |
| | | | | | Mae pools | |
|
| |
| 76 | Diversified Income Trust |
OTC TOTAL RETURN SWAP CONTRACTS OUTSTANDING at 3/31/13 (Unaudited) cont.
| | | | | | |
| | Upfront | | | Fixed payments | Total return | Unrealized |
| Swap counterparty/ | premium | Termination | | received (paid) by | received by | appreciation/ |
| Notional amount | received (paid) | date | | fund per annum | or paid by fund | (depreciation) |
|
| Goldman Sachs International cont. | | | | | |
| $4,629,037 | $— | 1/12/38 | | 6.50% (1 month | Synthetic TRS Index | $(10,243) |
| | | | | USD-LIBOR) | 6.50% 30 year Fannie | |
| | | | | | Mae pools | |
|
| 683,735 | — | 1/12/38 | | (6.50%) 1 month | Synthetic MBX Index | (3,327) |
| | | | | USD-LIBOR | 6.50% 30 year Fannie | |
| | | | | | Mae pools | |
|
| 1,824,013 | — | 1/12/38 | | (6.50%) 1 month | Synthetic MBX Index | (8,876) |
| | | | | USD-LIBOR | 6.50% 30 year Fannie | |
| | | | | | Mae pools | |
|
| 622,951 | — | 1/12/38 | | (6.50%) 1 month | Synthetic MBX Index | (3,031) |
| | | | | USD-LIBOR | 6.50% 30 year Fannie | |
| | | | | | Mae pools | |
|
| 34,850,000 | — | 4/3/17 | | 2.3225% | USA Non Revised | 72,488 |
| | | | | | Consumer Price | |
| | | | | | Index-Urban (CPI-U) | |
|
| 34,850,000 | — | 4/4/17 | | 2.35% | USA Non Revised | 124,066 |
| | | | | | Consumer Price | |
| | | | | | Index-Urban (CPI-U) | |
|
| 9,458,782 | — | 1/12/41 | | 4.00% (1 month | Synthetic TRS Index | (45,238) |
| | | | | USD-LIBOR) | 4.00% 30 year Fannie | |
| | | | | | Mae pools | |
|
| 4,492,855 | — | 1/12/38 | | 6.50% (1 month | Synthetic TRS Index | (9,942) |
| | | | | USD-LIBOR) | 6.50% 30 year Fannie | |
| | | | | | Mae pools | |
|
| 8,985,544 | — | 1/12/38 | | 6.50% (1 month | Synthetic TRS Index | (19,883) |
| | | | | USD-LIBOR) | 6.50% 30 year Fannie | |
| | | | | | Mae pools | |
|
| 1,660,760 | — | 1/12/38 | | 6.50% (1 month | Synthetic TRS Index | (3,675) |
| | | | | USD-LIBOR) | 6.50% 30 year Fannie | |
| | | | | | Mae pools | |
|
| 4,390,450 | — | 1/12/41 | | 4.00% (1 month | Synthetic TRS Index | (20,998) |
| | | | | USD-LIBOR) | 4.00% 30 year Fannie | |
| | | | | | Mae pools | |
|
| 8,413,325 | — | 1/12/41 | | 4.00% (1 month | Synthetic TRS Index | (40,238) |
| | | | | USD-LIBOR) | 4.00% 30 year Fannie | |
| | | | | | Mae pools | |
|
| 6,004,509 | — | 1/12/41 | | 4.00% (1 month | Synthetic TRS Index | (28,717) |
| | | | | USD-LIBOR) | 4.00% 30 year Fannie | |
| | | | | | Mae pools | |
|
| 34,850,000 | — | 4/5/17 | | 2.355% | USA Non Revised | 134,173 |
| | | | | | Consumer Price | |
| | | | | | Index-Urban (CPI-U) | |
|
| 34,850,000 | — | 4/5/22 | | 2.66% | USA Non Revised | 132,082 |
| | | | | | Consumer Price | |
| | | | | | Index-Urban (CPI-U) | |
|
| 19,393,249 | — | 1/12/41 | | 4.00% (1 month | Synthetic TRS Index | (92,751) |
| | | | | USD-LIBOR) | 4.00% 30 year Fannie | |
| | | | | | Mae pools | |
|
| |
| Diversified Income Trust | 77 |
OTC TOTAL RETURN SWAP CONTRACTS OUTSTANDING at 3/31/13 (Unaudited) cont.
| | | | | | | |
| | | Upfront | | | Fixed payments | Total return | Unrealized |
| Swap counterparty/ | premium | Termination | | received (paid) by | received by | appreciation/ |
| Notional amount | received (paid) | date | | fund per annum | or paid by fund | (depreciation) |
|
| Goldman Sachs International cont. | | | | | |
| | $9,475,144 | $— | 1/12/41 | | 4.00% (1 month | Synthetic TRS Index | $(45,316) |
| | | | | | USD-LIBOR) | 4.00% 30 year Fannie | |
| | | | | | | Mae pools | |
|
| | 26,154,646 | — | 1/12/42 | | 4.00% (1 month | Synthetic TRS Index | (125,116) |
| | | | | | USD-LIBOR) | 4.00% 30 year Fannie | |
| | | | | | | Mae pools | |
|
| | 25,909,091 | — | 1/12/41 | | (4.00%) 1 month | Synthetic TRS Index | 123,914 |
| | | | | | USD-LIBOR | 4.00% 30 year Fannie | |
| | | | | | | Mae pools | |
|
| | 25,811,499 | — | 1/12/41 | | (4.00%) 1 month | Synthetic TRS Index | 123,447 |
| | | | | | USD-LIBOR | 4.00% 30 year Fannie | |
| | | | | | | Mae pools | |
|
| | 3,839,087 | — | 1/12/41 | | (4.00%) 1 month | Synthetic TRS Index | 18,361 |
| | | | | | USD-LIBOR | 4.00% 30 year Fannie | |
| | | | | | | Mae pools | |
|
| | 3,839,087 | — | 1/12/41 | | (4.00%) 1 month | Synthetic TRS Index | 18,361 |
| | | | | | USD-LIBOR | 4.00% 30 year Fannie | |
| | | | | | | Mae pools | |
|
| | 10,003,042 | (12,504) | 1/12/41 | | (4.50%) 1 month | Synthetic TRS Index | 32,381 |
| | | | | | USD-LIBOR | 4.50% 30 year Fannie | |
| | | | | | | Mae pools | |
|
| GBP | 21,746,000 | — | 3/30/17 | | (3.0925%) | GBP Non-revised UK | 528,011 |
| | | | | | | Retail Price Index | |
|
| GBP | 21,746,000 | — | 4/2/17 | | (3.085%) | GBP Non-revised UK | 453,997 |
| | | | | | | Retail Price Index | |
|
| GBP | 43,492,000 | — | 9/20/17 | | 2.6625% | GBP Non-revised UK | (2,959,239) |
| | | | | | | Retail Price Index | |
|
| GBP | 21,746,000 | — | 9/21/17 | | 2.66% | GBP Non-revised UK | (1,483,915) |
| | | | | | | Retail Price Index | |
|
| GBP | 21,746,000 | — | 4/3/17 | | (3.09%) | GBP Non-revised UK | 445,075 |
| | | | | | | Retail Price Index | |
|
| JPMorgan Chase Bank N.A. | | | | | |
| | $38,441,129 | — | 1/12/41 | | 4.00% (1 month | Synthetic TRS Index | (183,851) |
| | | | | | USD-LIBOR) | 4.00% 30 year Fannie | |
| | | | | | | Mae pools | |
|
| | 25,535,465 | — | 1/12/41 | | 4.50% (1 month | Synthetic TRS Index | (111,414) |
| | | | | | USD-LIBOR) | 4.50% 30 year Fannie | |
| | | | | | | Mae pools | |
|
| GBP | 19,710,000 | — | 9/12/14 | | 2.825% | GBP Non-revised UK | (486,182) |
| | | | | | | Retail Price Index | |
|
| Royal Bank of Scotland PLC (The) | | | | | |
| | $2,921,902 | — | 1/12/41 | | 4.00% (1 month | Synthetic TRS Index | (13,974) |
| | | | | | USD-LIBOR) | 4.00% 30 year Fannie | |
| | | | | | | Mae pools | |
|
| Total | | | | | | | $(5,137,429) |
| |
| 78 | Diversified Income Trust |
OTC CREDIT DEFAULT CONTRACTS OUTSTANDING at 3/31/13 (Unaudited)
| | | | | | | | |
| | | Upfront | | | | | Fixed payments | |
| | | premium | | | | Termi- | received | Unrealized |
| Swap counterparty/ | | received | | Notional | | nation | (paid) by fund | appreciation/ |
| Referenced debt* | Rating*** | (paid)** | | amount | | date | per annum | (depreciation) |
|
| Bank of America N.A. | | | | | | | |
| DJ CDX NA CMBX | BBB–/P | $79,608 | | $1,321,000 | | 5/11/63 | 300 bp | $(11,563) |
| BBB Index | | | | | | | | |
|
| DJ CDX NA CMBX | BBB–/P | 128,914 | | 1,886,000 | | 5/11/63 | 300 bp | (1,251) |
| BBB Index | | | | | | | | |
|
| DJ CDX NA CMBX | BBB–/P | 163,473 | | 2,648,000 | | 5/11/63 | 300 bp | (19,283) |
| BBB Index | | | | | | | | |
|
| DJ CDX NA CMBX | BBB–/P | 155,838 | | 2,734,000 | | 5/11/63 | 300 bp | (32,854) |
| BBB Index | | | | | | | | |
|
| Barclays Bank PLC | | | | | | | | |
| Irish Gov’t, 4.50%, | — | (336,426) | | 4,199,000 | | 9/20/17 | (100 bp) | (207,952) |
| 4/18/2020 | | | | | | | | |
|
| Obrigacoes Do | — | (685,119) | | 4,199,000 | | 9/20/17 | (100 bp) | (209,975) |
| Tesouro, 5.45%, | | | | | | | | |
| 9/23/13 | | | | | | | | |
|
| Credit Suisse International | | | | | | | |
| DJ CDX NA HY | — | 655,800 | | 16,395,000 | | 12/20/17 | (500 bp) | (31,314) |
| Series 19 Index | | | | | | | | |
|
| DJ CDX NA HY | — | 486,630 | | 16,221,000 | | 6/20/18 | (500 bp) | (36,070) |
| Series 20 Index | | | | | | | | |
|
| DJ CDX NA HY | — | 481,339 | | 16,386,000 | | 6/20/18 | (500 bp) | (31,051) |
| Series 20 Index | | | | | | | | |
|
| Spain Gov’t, 5.50%, | — | (495,028) | | 4,199,000 | | 9/20/17 | (100 bp) | (176,128) |
| 7/30/2017 | | | | | | | | |
|
| Deutsche Bank AG | | | | | | | | |
| Republic of | B3 | 334,446 | | 2,860,000 | | 3/20/17 | 500 bp | (1,188,803) |
| Argentina, 8.28%, | | | | | | | | |
| 12/31/33 | | | | | | | | |
|
| Russian Federation, | — | — | | 987,500 | | 4/20/13 | (112 bp) | (5,262) |
| 7 1/2%, 3/31/30 | | | | | | | | |
|
| Smurfit Kappa | B+ | — | EUR | 2,045,000 | | 9/20/13 | 715 bp | 94,746 |
| Funding, 7 3/4%, | | | | | | | | |
| 4/1/15 | | | | | | | | |
|
| Virgin Media | BB– | — | EUR | 1,975,000 | | 9/20/13 | 535 bp | 62,560 |
| Finance PLC, | | | | | | | | |
| 8 3/4%, 4/15/14 | | | | | | | | |
|
| Virgin Media | BB– | — | EUR | 1,975,000 | | 9/20/13 | 477 bp | 54,954 |
| Finance PLC, | | | | | | | | |
| 8 3/4%, 4/15/14 | | | | | | | | |
|
| JPMorgan Chase Bank N.A. | | | | | | | |
| DJ CDX NA HY | — | 1,310,600 | | $32,765,000 | | 12/20/17 | (500 bp) | (62,581) |
| Series 19 Index | | | | | | | | |
|
| DJ CDX NA HY | — | 953,013 | | 32,443,000 | | 6/20/18 | (500 bp) | (92,419) |
| Series 20 Index | | | | | | | | |
|
| |
| Diversified Income Trust | 79 |
OTC CREDIT DEFAULT CONTRACTS OUTSTANDING at 3/31/13 (Unaudited) cont.
| | | | | | | |
| | | Upfront | | | | Fixed payments | |
| | | premium | | | Termi- | received | Unrealized |
| Swap counterparty/ | | received | Notional | | nation | (paid) by fund | appreciation/ |
| Referenced debt* | Rating*** | (paid)** | amount | | date | per annum | (depreciation) |
|
| JPMorgan Chase Bank N.A. cont. | | | | | | |
| DJ CDX NA HY | — | $1,908,439 | $63,322,000 | | 6/20/18 | (500 bp) | $(71,639) |
| Series 20 Index | | | | | | | |
|
| Russian Federation, | Baa1 | — | 495,000 | | 9/20/13 | 276 bp | 5,633 |
| 7 1/2%, 3/31/30 | | | | | | | |
|
| Total | | | | | | | $(1,960,252) |
* Payments related to the referenced debt are made upon a credit default event.
** Upfront premium is based on the difference between the original spread on issue and the market spread on day of execution.
*** Ratings are presented for credit default contracts in which the fund has sold protection on the underlying referenced debt. Ratings for an underlying index represent the average of the ratings of all the securities included in that index. The Moody’s, Standard & Poor’s or Fitch ratings are believed to be the most recent ratings available at March 31, 2013. Securities rated by Putnam are indicated by “/P.”
| |
| 80 | Diversified Income Trust |
ASC 820 establishes a three-level hierarchy for disclosure of fair value measurements. The valuation hierarchy is based upon the transparency of inputs to the valuation of the fund’s investments. The three levels are defined as follows:
Level 1: Valuations based on quoted prices for identical securities in active markets.
Level 2: Valuations based on quoted prices in markets that are not active or for which all significant inputs are observable, either directly or indirectly.
Level 3: Valuations based on inputs that are unobservable and significant to the fair value measurement.
The following is a summary of the inputs used to value the fund’s net assets as of the close of the reporting period:
| | | |
| | | Valuation inputs | |
|
| Investments in securities: | Level 1 | Level 2 | Level 3 |
|
| Convertible bonds and notes | $— | $3,317,550 | $— |
|
| Corporate bonds and notes | — | 1,332,941,493 | 308,080 |
|
| Foreign government and agency bonds and notes | — | 243,201,224 | — |
|
| Mortgage-backed securities | — | 1,549,396,925 | — |
|
| Purchased swap options outstanding | — | 18,125,976 | — |
|
| Senior loans | — | 43,141,121 | — |
|
| U.S. government and agency mortgage obligations | — | 630,181,279 | — |
|
| U.S. treasury obligations | — | 396,670 | — |
|
| Short-term investments | 152,956,147 | 188,584,000 | — |
|
| Totals by level | $152,956,147 | $4,009,286,238 | $308,080 |
| | | | |
| | | Valuation inputs | |
|
| Other financial instruments: | Level 1 | Level 2 | Level 3 |
|
| Forward currency contracts | $— | $10,267,804 | $— |
|
| Futures contracts | 106,751 | — | — |
|
| Written swap options outstanding | — | (14,012,876) | — |
|
| Forward premium swap option contracts | — | (1,796,268) | — |
|
| TBA sale commitments | — | (304,548,678) | — |
|
| Interest rate swap contracts | — | (14,700,451) | — |
|
| Total return swap contracts | — | (4,891,916) | — |
|
| Credit default contracts | — | (7,101,779) | — |
|
| Totals by level | $106,751 | $(336,784,164) | $— |
At the start and close of the reporting period, Level 3 investments in securities were not considered a significant portion of the fund’s portfolio.
The accompanying notes are an integral part of these financial statements.
| |
| Diversified Income Trust | 81 |
Statement of assets and liabilities 3/31/13 (Unaudited)
| |
| ASSETS | |
|
| Investment in securities, at value (Note 1): | |
| Unaffiliated issuers (identified cost $3,860,422,871) | $4,017,304,318 |
| Affiliated issuers (identified cost $145,246,147) (Note 6) | 145,246,147 |
|
| Cash | 141,908 |
|
| Foreign currency (cost $41,445) (Note 1) | 41,445 |
|
| Interest and other receivables | 45,683,548 |
|
| Receivable for shares of the fund sold | 17,568,679 |
|
| Receivable for investments sold | 16,191,577 |
|
| Receivable for sales of delayed delivery securities (Note 1) | 311,501,353 |
|
| Unrealized appreciation on OTC swap contracts (Note 1) | 55,547,442 |
|
| Unrealized appreciation on forward premium swap option contracts (Note 1) | 6,264,218 |
|
| Unrealized appreciation on forward currency contracts (Note 1) | 16,447,475 |
|
| Premium paid on OTC swap contracts (Note 1) | 19,595,912 |
|
| Receivable for variation margin (Note 1) | 90,220 |
|
| Total assets | 4,651,624,242 |
| |
| LIABILITIES | |
|
| Payable for investments purchased | 26,281,330 |
|
| Payable for purchases of delayed delivery securities (Note 1) | 643,676,697 |
|
| Payable for shares of the fund repurchased | 6,843,024 |
|
| Payable for compensation of Manager (Note 2) | 1,641,062 |
|
| Payable for investor servicing fees (Note 2) | 839,179 |
|
| Payable for custodian fees (Note 2) | 42,653 |
|
| Payable for Trustee compensation and expenses (Note 2) | 714,326 |
|
| Payable for administrative services (Note 2) | 12,262 |
|
| Payable for distribution fees (Note 2) | 1,858,316 |
|
| Unrealized depreciation on forward currency contracts (Note 1) | 6,179,671 |
|
| Unrealized depreciation on forward premium swap option contracts (Note 1) | 8,060,486 |
|
| Written options outstanding, at value (premiums $16,894,416) (Notes 1 and 3) | 14,012,876 |
|
| Premium received on OTC swap contracts (Note 1) | 16,302,045 |
|
| Unrealized depreciation on OTC swap contracts (Note 1) | 85,535,455 |
|
| TBA sale commitments, at value (proceeds receivable $303,471,484) (Note 1) | 304,548,678 |
|
| Collateral on certain derivative contracts, at value (Note 1) | 8,106,670 |
|
| Other accrued expenses | 332,370 |
|
| Total liabilities | 1,124,987,100 |
| | |
| Net assets | $3,526,637,142 |
|
| |
| REPRESENTED BY | |
|
| Paid-in capital (Unlimited shares authorized) (Notes 1 and 4) | $4,037,359,989 |
|
| Undistributed net investment income (Note 1) | 14,839,345 |
|
| Accumulated net realized loss on investments and foreign currency transactions (Note 1) | (662,475,285) |
|
| Net unrealized appreciation of investments and assets and liabilities in foreign currencies | 136,913,093 |
|
| Total — Representing net assets applicable to capital shares outstanding | $3,526,637,142 |
(Continued on next page)
| |
| 82 | Diversified Income Trust |
Statement of assets and liabilities (Continued)
| |
| COMPUTATION OF NET ASSET VALUE AND OFFERING PRICE | |
|
| Net asset value and redemption price per class A share | |
| ($1,878,190,588 divided by 236,441,852 shares) | $7.94 |
|
| Offering price per class A share (100/96.00 of $7.94)* | $8.27 |
|
| Net asset value and offering price per class B share ($77,292,810 divided by 9,816,086 shares)** | $7.87 |
|
| Net asset value and offering price per class C share ($651,886,025 divided by 83,278,940 shares)** | $7.83 |
|
| Net asset value and redemption price per class M share | |
| ($252,520,710 divided by 32,253,027 shares) | $7.83 |
|
| Offering price per class M share (100/96.75 of $7.83)† | $8.09 |
|
| Net asset value, offering price and redemption price per class R share | |
| ($4,231,138 divided by 538,071 shares) | $7.86 |
|
| Net asset value, offering price and redemption price per class Y share | |
| ($662,515,871 divided by 84,030,774 shares) | $7.88 |
|
* On single retail sales of less than $100,000. On sales of $100,000 or more the offering price is reduced.
** Redemption price per share is equal to net asset value less any applicable contingent deferred sales charge.
† On single retail sales of less than $50,000. On sales of $50,000 or more the offering price is reduced.
The accompanying notes are an integral part of these financial statements.
| |
| Diversified Income Trust | 83 |
Statement of operations Six months ended 3/31/13 (Unaudited)
| |
| INVESTMENT INCOME | |
|
| Interest (net of foreign tax of $194,039) (including interest income of $68,291 | |
| from investments in affiliated issuers) (Note 6) | $113,941,353 |
| | |
| EXPENSES | |
|
| Compensation of Manager (Note 2) | 9,269,535 |
|
| Investor servicing fees (Note 2) | 2,441,521 |
|
| Custodian fees (Note 2) | 77,817 |
|
| Trustee compensation and expenses (Note 2) | 170,317 |
|
| Administrative services (Note 2) | 55,756 |
|
| Distribution fees (Note 2) | 6,473,113 |
|
| Other | 519,839 |
|
| Total expenses | 19,007,898 |
| | |
| Expense reduction (Note 2) | (2,883) |
|
| Net expenses | 19,005,015 |
| | |
| Net investment income | 94,936,338 |
|
| |
| Net realized gain on investments (Notes 1 and 3) | 46,532,731 |
|
| Net realized gain on swap contracts (Note 1) | 15,579,357 |
|
| Net realized loss on futures contracts (Note 1) | (314,220) |
|
| Net realized gain on foreign currency transactions (Note 1) | 14,594,794 |
|
| Net realized gain on written options (Notes 1 and 3) | 10,939,309 |
|
| Net unrealized appreciation of assets and liabilities in foreign currencies during the period | 21,030,043 |
|
| Net unrealized appreciation of investments, futures contracts, swap contracts, written options, | |
| and TBA sale commitments during the period | 40,430,557 |
|
| Net gain on investments | 148,792,571 |
| | |
| Net increase in net assets resulting from operations | $243,728,909 |
|
The accompanying notes are an integral part of these financial statements.
| |
| 84 | Diversified Income Trust |
Statement of changes in net assets
| | |
| INCREASE (DECREASE) IN NET ASSETS | Six months ended 3/31/13* | Year ended 9/30/12 |
|
| Operations: | | |
| Net investment income | $94,936,338 | $199,866,951 |
|
| Net realized gain (loss) on investments | | |
| and foreign currency transactions | 87,331,971 | (423,770,245) |
|
| Net unrealized appreciation of investments and assets | | |
| and liabilities in foreign currencies | 61,460,600 | 547,074,103 |
|
| Net increase in net assets resulting from operations | 243,728,909 | 323,170,809 |
|
| Distributions to shareholders (Note 1): | | |
| From ordinary income | | |
| Net investment income | | |
|
| Class A | (51,209,044) | (37,511,118) |
|
| Class B | (1,909,397) | (1,331,538) |
|
| Class C | (16,058,277) | (12,181,569) |
|
| Class M | (7,071,103) | (5,464,682) |
|
| Class R | (120,559) | (84,304) |
|
| Class Y | (17,594,110) | (13,444,885) |
|
| From return of capital | | |
| Class A | — | (75,385,954) |
|
| Class B | — | (2,675,988) |
|
| Class C | — | (24,481,255) |
|
| Class M | — | (10,982,353) |
|
| Class R | — | (169,424) |
|
| Class Y | — | (27,020,136) |
|
| Increase (decrease) from capital share transactions (Note 4) | 55,663,096 | (942,557,966) |
|
| Total increase (decrease) in net assets | 205,429,515 | (830,120,363) |
| |
| NET ASSETS | | |
|
| Beginning of period | 3,321,207,627 | 4,151,327,990 |
|
| End of period (including undistributed net investment | | |
| income of $14,839,345 and $13,865,497, respectively) | $3,526,637,142 | $3,321,207,627 |
|
* Unaudited
The accompanying notes are an integral part of these financial statements.
| |
| Diversified Income Trust | 85 |
Financial highlights (For a common share outstanding throughout the period)
| | | | | | | | | | | | | | | |
| INVESTMENT OPERATIONS: | | LESS DISTRIBUTIONS: | | | | RATIOS AND SUPPLEMENTAL DATA: |
|
| | | | | | | | | | | | | | | Ratio | |
| | Net asset | | Net realized | | | | | | | | | | Ratio | of net investment | |
| | value, | | and unrealized | Total from | From | | | | | | Total return | Net assets, | of expenses | income (loss) | |
| | beginning | Net investment | gain (loss) | investment | net investment | From | Total | Redemption | Non-recurring | Net asset value, | at net asset | end of period | to average | to average | Portfolio |
| Period ended | of period | income (loss) a | on investments | operations | income | return of capital | distributions | fees | reimbursements | end of period | value (%) b | (in thousands) | net assets (%) c | net assets (%) | turnover (%) d |
|
| Class A | | | | | | | | | | | | | | | |
| March 31, 2013** | $7.59 | .23 | .34 | .57 | (.22) | — | (.22) | — | — | $7.94 | 7.64 * | $1,878,191 | .50 * | 2.89 * | 81 * |
| September 30, 2012 | 7.35 | .42 | .27 | .69 | (.15) | (.30) | (.45) | — | — | 7.59 | 9.58 | 1,788,786 | .99 | 5.67 | 120 |
| September 30, 2011 | 8.08 | .45 | (.58) | (.13) | (.60) | — | (.60) | — | — e,f | 7.35 | (2.04) | 2,162,131 | .98 | 5.57 | 165 |
| September 30, 2010 | 7.89 | .72 | .63 | 1.35 | (1.16) | — | (1.16) | — e | — | 8.08 | 18.39 | 2,328,480 | 1.01 g | 8.96 | 95 |
| September 30, 2009 | 8.10 | .49 | (.02) | .47 | (.68) | — | (.68) | — e | — e,h | 7.89 | 8.23 | 1,334,298 | 1.13 g,i | 7.44 i | 223 |
| September 30, 2008 | 9.91 | .69 | (1.90) | (1.21) | (.60) | — | (.60) | — e | — | 8.10 | (12.80) | 1,084,321 | 1.04 i | 7.36 i | 157 |
|
| Class B | | | | | | | | | | | | | | | |
| March 31, 2013** | $7.53 | .19 | .34 | .53 | (.19) | — | (.19) | — | — | $7.87 | 7.15 * | $77,293 | .87 * | 2.52 * | 81 * |
| September 30, 2012 | 7.29 | .37 | .26 | .63 | (.13) | (.26) | (.39) | — | — | 7.53 | 8.82 | 75,534 | 1.74 | 4.92 | 120 |
| September 30, 2011 | 8.01 | .39 | (.57) | (.18) | (.54) | — | (.54) | — | — e,f | 7.29 | (2.69) | 81,208 | 1.73 | 4.88 | 165 |
| September 30, 2010 | 7.83 | .66 | .62 | 1.28 | (1.10) | — | (1.10) | — e | — | 8.01 | 17.50 | 96,346 | 1.76 g | 8.36 | 95 |
| September 30, 2009 | 8.04 | .42 | — e | .42 | (.63) | — | (.63) | — e | — e,h | 7.83 | 7.43 | 83,497 | 1.88 g,i | 6.41 i | 223 |
| September 30, 2008 | 9.83 | .61 | (1.88) | (1.27) | (.52) | — | (.52) | — e | — | 8.04 | (13.40) | 109,173 | 1.79 i | 6.57 i | 157 |
|
| Class C | | | | | | | | | | | | | | | |
| March 31, 2013** | $7.48 | .19 | .35 | .54 | (.19) | — | (.19) | — | — | $7.83 | 7.33 * | $651,886 | .87 * | 2.52 * | 81 * |
| September 30, 2012 | 7.25 | .36 | .26 | .62 | (.13) | (.26) | (.39) | — | — | 7.48 | 8.73 | 644,638 | 1.74 | 4.93 | 120 |
| September 30, 2011 | 7.97 | .38 | (.56) | (.18) | (.54) | — | (.54) | — | — e,f | 7.25 | (2.68) | 776,778 | 1.73 | 4.82 | 165 |
| September 30, 2010 | 7.80 | .64 | .63 | 1.27 | (1.10) | — | (1.10) | — e | — | 7.97 | 17.47 | 797,345 | 1.76 g | 8.10 | 95 |
| September 30, 2009 | 8.03 | .48 | (.07) | .41 | (.64) | — | (.64) | — e | — e,h | 7.80 | 7.27 | 298,231 | 1.88 g,i | 7.12 i | 223 |
| September 30, 2008 | 9.84 | .61 | (1.89) | (1.28) | (.53) | — | (.53) | — e | — | 8.03 | (13.57) | 115,325 | 1.79 i | 6.62 i | 157 |
|
| Class M | | | | | | | | | | | | | | | |
| March 31, 2013** | $7.48 | .21 | .35 | .56 | (.21) | — | (.21) | — | — | $7.83 | 7.60 * | $252,521 | .62 * | 2.77 * | 81 * |
| September 30, 2012 | 7.25 | .40 | .25 | .65 | (.14) | (.28) | (.42) | — | — | 7.48 | 9.29 | 260,630 | 1.24 | 5.43 | 120 |
| September 30, 2011 | 7.97 | .43 | (.57) | (.14) | (.58) | — | (.58) | — | — e,f | 7.25 | (2.22) | 312,812 | 1.23 | 5.44 | 165 |
| September 30, 2010 | 7.79 | .70 | .62 | 1.32 | (1.14) | — | (1.14) | — e | — | 7.97 | 18.13 | 436,826 | 1.26 g | 8.92 | 95 |
| September 30, 2009 | 8.02 | .45 | (.01) | .44 | (.67) | — | (.67) | — e | — e,h | 7.79 | 7.81 | 460,240 | 1.38 g,i | 6.98 i | 223 |
| September 30, 2008 | 9.81 | .66 | (1.88) | (1.22) | (.57) | — | (.57) | — e | — | 8.02 | (12.95) | 514,664 | 1.29 i | 7.10 i | 157 |
|
| Class R | | | | | | | | | | | | | | | |
| March 31, 2013** | $7.52 | .21 | .34 | .55 | (.21) | — | (.21) | — | — | $7.86 | 7.42 * | $4,231 | .62 * | 2.77 * | 81 * |
| September 30, 2012 | 7.28 | .40 | .26 | .66 | (.14) | (.28) | (.42) | — | — | 7.52 | 9.38 | 4,307 | 1.24 | 5.44 | 120 |
| September 30, 2011 | 8.00 | .43 | (.57) | (.14) | (.58) | — | (.58) | — | — e,f | 7.28 | (2.21) | 4,315 | 1.23 | 5.34 | 165 |
| September 30, 2010 | 7.82 | .70 | .62 | 1.32 | (1.14) | — | (1.14) | — e | — | 8.00 | 18.08 | 4,185 | 1.26 g | 8.82 | 95 |
| September 30, 2009 | 8.06 | .48 | (.05) | .43 | (.67) | — | (.67) | — e | — e,h | 7.82 | 7.68 | 2,956 | 1.38 g,i | 7.20 i | 223 |
| September 30, 2008 | 9.89 | .66 | (1.92) | (1.26) | (.57) | — | (.57) | — e | — | 8.06 | (13.29) | 2,756 | 1.29 i | 7.09 i | 157 |
|
| Class Y | | | | | | | | | | | | | | | |
| March 31, 2013** | $7.54 | .23 | .34 | .57 | (.23) | — | (.23) | — | — | $7.88 | 7.72 * | $662,516 | .37 * | 3.02 * | 81 * |
| September 30, 2012 | 7.30 | .44 | .27 | .71 | (.16) | (.31) | (.47) | — | — | 7.54 | 9.98 | 547,313 | .74 | 5.92 | 120 |
| September 30, 2011 | 8.04 | .46 | (.58) | (.12) | (.62) | — | (.62) | — | — e,f | 7.30 | (1.89) | 814,084 | .73 | 5.79 | 165 |
| September 30, 2010 | 7.85 | .73 | .64 | 1.37 | (1.18) | — | (1.18) | — e | — | 8.04 | 18.84 | 991,846 | .76 g | 9.18 | 95 |
| September 30, 2009 | 8.08 | .60 | (.13) | .47 | (.70) | — | (.70) | — e | — e,h | 7.85 | 8.26 | 331,995 | .88 g,i | 8.61 i | 223 |
| September 30, 2008 | 9.92 | .71 | (1.93) | (1.22) | (.62) | — | (.62) | — e | — | 8.08 | (12.88) | 82,197 | .79 i | 7.59 i | 157 |
|
See notes to financial highlights at the end of this section.
The accompanying notes are an integral part of these financial statements.
| | | |
| 86 | Diversified Income Trust | Diversified Income Trust | 87 |
Financial highlights (Continued)
* Not annualized.
** Unaudited.
a Per share net investment income (loss) has been determined on the basis of the weighted average number of shares outstanding during the period.
b Total return assumes dividend reinvestment and does not reflect the effect of sales charges.
c Includes amounts paid through expense offset arrangements (Note 2).
d Portfolio turnover excludes TBA purchase and sale transactions.
e Amount represents less than $0.01 per share.
f Reflects a non-recurring reimbursement related to restitution amounts in connection with a distribution plan approved by the Securities and Exchange Commission (the SEC) which amounted to less than $0.01 per share outstanding on July 21, 2011. Also reflects a non-recurring reimbursement related to short-term trading related lawsuits, which amounted to less than $0.01 per share outstanding on May 11, 2011.
g Includes interest accrued in connection with certain terminated derivatives contracts, which amounted to less than 0.01% and 0.04% of average net assets for the periods ended September 30, 2010 and September 30, 2009, respectively.
h Reflects a non-recurring reimbursement pursuant to a settlement between the SEC and Bear Stearns & Co., Inc. and Bear Stearns Securities Corp., which amounted to less than $0.01 per share outstanding on May 21, 2009.
i Reflects an involuntary contractual expense limitation in effect during the period. For periods prior to September 30, 2009, certain fund expenses were waived in connection with the fund’s investment in Putnam Prime Money Market Fund. As a result of such limitation and/or waivers, the expenses of each class reflect a reduction of the following amounts:
| |
| | Percentage of |
| | average net assets |
|
| September 30, 2009 | 0.03% |
|
| September 30, 2008 | <0.01 |
|
The accompanying notes are an integral part of these financial statements.
| |
| 88 | Diversified Income Trust |
Notes to financial statements 3/31/13 (Unaudited)
Within the following Notes to financial statements, references to “State Street” represent State Street Bank and Trust Company, references to “the SEC” represent the Securities and Exchange Commission, references to “Putnam Management” represent Putnam Investment Management, LLC, the fund’s manager, an indirect wholly-owned subsidiary of Putnam Investments, LLC and references to “OTC”, if any, represent over-the-counter. Unless otherwise noted, the “reporting period” represents the period from October 1, 2012 through March 31, 2013.
Putnam Diversified Income Trust (the fund) is a Massachusetts business trust, which is registered under the Investment Company Act of 1940, as amended, as a diversified open-end management investment company. The investment objective of the fund is to seek as high a level of current income as Putnam Management believes is consistent with preservation of capital. The fund invests mainly in bonds that are securitized debt instruments (such as mortgage-backed investments) and other obligations of companies and governments worldwide, are either investment-grade or below-investment-grade (sometimes referred to as “junk bonds”) in quality and have intermediate- to long-term maturities (three years or longer). Putnam Management may consider, among other factors, credit, interest rate and prepayment risks, as well as general market conditions, when deciding whether to buy or sell investments.
The fund offers class A, class B, class C, class M, class R and class Y shares. Class A and class M shares are sold with a maximum front-end sales charge of 4.00% and 3.25%, respectively, and generally do not pay a contingent deferred sales charge. Class B shares, which convert to class A shares after approximately eight years, do not pay a front-end sales charge and are subject to a contingent deferred sales charge if those shares are redeemed within six years of purchase. Class C shares have a one-year 1.00% contingent deferred sales charge and do not convert to class A shares. Class R shares, which are not available to all investors, are sold at net asset value. The expenses for class A, class B, class C, class M and class R shares may differ based on the distribution fee of each class, which is identified in Note 2. Class Y shares, which are sold at net asset value, are generally subject to the same expenses as class A, class B, class C, class M and class R shares, but do not bear a distribution fee. Class Y shares are not available to all investors.
In the normal course of business, the fund enters into contracts that may include agreements to indemnify another party under given circumstances. The fund’s maximum exposure under these arrangements is unknown as this would involve future claims that may be, but have not yet been, made against the fund. However, the fund’s management team expects the risk of material loss to be remote.
Note 1: Significant accounting policies
The following is a summary of significant accounting policies consistently followed by the fund in the preparation of its financial statements. The preparation of financial statements is in conformity with accounting principles generally accepted in the United States of America and requires management to make estimates and assumptions that affect the reported amounts of assets and liabilities in the financial statements and the reported amounts of increases and decreases in net assets from operations. Actual results could differ from those estimates. Subsequent events after the Statement of assets and liabilities date through the date that the financial statements were issued have been evaluated in the preparation of the financial statements.
Investment income, realized and unrealized gains and losses and expenses of the fund are borne pro-rata based on the relative net assets of each class to the total net assets of the fund, except that each class bears expenses unique to that class (including the distribution fees applicable to such classes). Each class votes as a class only with respect to its own distribution plan or other matters on which a class vote is required by law or determined by the Trustees. If the fund were liquidated, shares of each class would receive their pro-rata share of the net assets of the fund. In addition, the Trustees declare separate dividends on each class of shares.
Security valuation Investments for which market quotations are readily available are valued at the last reported sales price on their principal exchange, or official closing price for certain markets, and are classified as Level 1 securities under Accounting Standards Codification ASC 820 Fair Value Measurements and Disclosures (ASC 820). If no sales are reported, as in the case of some securities that are traded OTC, a security is valued at its last reported bid price and is generally categorized as a Level 2 security.
Investments in open-end investment companies (excluding exchange traded funds), if any, which can be classified as Level 1 or Level 2 securities, are based on their net asset value. The net asset value of such investment companies equals the total value of their assets less their liabilities and divided by the number of their outstanding shares.
| |
| Diversified Income Trust | 89 |
Market quotations are not considered to be readily available for certain debt obligations and other investments; such investments are valued on the basis of valuations furnished by an independent pricing service approved by the Trustees or dealers selected by Putnam Management. Such services or dealers determine valuations for normal institutional-size trading units of such securities using methods based on market transactions for comparable securities and various relationships, generally recognized by institutional traders, between securities (which consider such factors as security prices, yields, maturities and ratings). These securities will generally be categorized as Level 2.
Many securities markets and exchanges outside the U.S. close prior to the close of the New York Stock Exchange and therefore the closing prices for securities in such markets or on such exchanges may not fully reflect events that occur after such close but before the close of the New York Stock Exchange. Accordingly, on certain days, the fund will fair value foreign equity securities taking into account multiple factors including movements in the U.S. securities markets, currency valuations and comparisons to the valuation of American Depository Receipts, exchange-traded funds and futures contracts. These securities, which would generally be classified as Level 1 securities, will be transferred to Level 2 of the fair value hierarchy when they are valued at fair value. The number of days on which fair value prices will be used will depend on market activity and it is possible that fair value prices will be used by the fund to a significant extent. Securities quoted in foreign currencies, if any, are translated into U.S. dollars at the current exchange rate.
To the extent a pricing service or dealer is unable to value a security or provides a valuation that Putnam Management does not believe accurately reflects the security’s fair value, the security will be valued at fair value by Putnam Management. Certain investments, including certain restricted and illiquid securities and derivatives, are also valued at fair value following procedures approved by the Trustees. These valuations consider such factors as significant market or specific security events such as interest rate or credit quality changes, various relationships with other securities, discount rates, U.S. Treasury, U.S. swap and credit yields, index levels, convexity exposures and recovery rates. These securities are classified as Level 2 or as Level 3 depending on the priority of the significant inputs.
Such valuations and procedures are reviewed periodically by the Trustees. Certain securities may be valued on the basis of a price provided by a single source. The fair value of securities is generally determined as the amount that the fund could reasonably expect to realize from an orderly disposition of such securities over a reasonable period of time. By its nature, a fair value price is a good faith estimate of the value of a security in a current sale and does not reflect an actual market price, which may be different by a material amount.
Security transactions and related investment income Security transactions are recorded on the trade date (the date the order to buy or sell is executed). Gains or losses on securities sold are determined on the identified cost basis.
Interest income, net of any applicable withholding taxes, is recorded on the accrual basis.
All premiums/discounts are amortized/accreted on a yield-to-maturity basis.
Securities purchased or sold on a forward commitment or delayed delivery basis may be settled a month or more after the trade date; interest income is accrued based on the terms of the securities. Losses may arise due to changes in the market value of the underlying securities or if the counterparty does not perform under the contract.
The fund earned certain fees in connection with its senior loan purchasing activities. These fees are treated as market discount and are amortized into income in the Statement of operations.
Stripped securities The fund may invest in stripped securities which represent a participation in securities that may be structured in classes with rights to receive different portions of the interest and principal. Interest-only securities receive all of the interest and principal-only securities receive all of the principal. If the interest-only securities experience greater than anticipated prepayments of principal, the fund may fail to recoup fully its initial investment in these securities. Conversely, principal-only securities increase in value if prepayments are greater than anticipated and decline if prepayments are slower than anticipated. The market value of these securities is highly sensitive to changes in interest rates.
Foreign currency translation The accounting records of the fund are maintained in U.S. dollars. The market value of foreign securities, currency holdings, and other assets and liabilities is recorded in the books and records of the fund after translation to U.S. dollars based on the exchange rates on that day. The cost of each security is determined using historical exchange rates. Income and withholding taxes are translated at prevailing exchange rates when earned or incurred. The fund does not isolate that portion of realized or unrealized gains or losses resulting from changes in the foreign exchange rate on investments from fluctuations arising from changes in the market prices of the securities. Such gains and losses are included with the net realized and unrealized gain or loss on
| |
| 90 | Diversified Income Trust |
investments. Net realized gains and losses on foreign currency transactions represent net realized exchange gains or losses on closed forward currency contracts, disposition of foreign currencies, currency gains and losses realized between the trade and settlement dates on securities transactions and the difference between the amount of investment income and foreign withholding taxes recorded on the fund’s books and the U.S. dollar equivalent amounts actually received or paid. Net unrealized appreciation and depreciation of assets and liabilities in foreign currencies arise from changes in the value of open forward currency contracts and assets and liabilities other than investments at the period end, resulting from changes in the exchange rate.
Options contracts The fund uses options contracts to hedge duration and convexity and to isolate prepayment risk.
The potential risk to the fund is that the change in value of options contracts may not correspond to the change in value of the hedged instruments. In addition, losses may arise from changes in the value of the underlying instruments, if there is an illiquid secondary market for the contracts, if interest or exchange rates move unexpectedly or if the counterparty to the contract is unable to perform. Realized gains and losses on purchased options are included in realized gains and losses on investment securities. If a written call option is exercised, the premium originally received is recorded as an addition to sales proceeds. If a written put option is exercised, the premium originally received is recorded as a reduction to the cost of investments.
Exchange traded options are valued at the last sale price or, if no sales are reported, the last bid price for purchased options and the last ask price for written options. OTC traded options are valued using prices supplied by dealers. Forward premium swap option contracts include premiums that do not settle until the expiration date of the contract. The delayed settlement of the premiums are factored into the daily valuation of the option contracts.
Written option contracts outstanding at period end, if any, are listed after the fund’s portfolio. For the fund’s average contract amount, see Note 5.
Futures contracts The fund uses futures contracts to gain exposure to interest rates.
The potential risk to the fund is that the change in value of futures contracts may not correspond to the change in value of the hedged instruments. In addition, losses may arise from changes in the value of the underlying instruments, if there is an illiquid secondary market for the contracts, if interest or exchange rates move unexpectedly or if the counterparty to the contract is unable to perform. With futures, there is minimal counterparty credit risk to the fund since futures are exchange traded and the exchange’s clearinghouse, as counterparty to all exchange traded futures, guarantees the futures against default. Risks may exceed amounts recognized on the Statement of assets and liabilities. When the contract is closed, the fund records a realized gain or loss equal to the difference between the value of the contract at the time it was opened and the value at the time it was closed.
Futures contracts are valued at the quoted daily settlement prices established by the exchange on which they trade. The fund and the broker agree to exchange an amount of cash equal to the daily fluctuation in the value of the futures contract. Such receipts or payments are known as “variation margin.”
Futures contracts outstanding at period end, if any, are listed after the fund’s portfolio. For the fund’s average number of contracts, see Note 5.
Forward currency contracts The fund buys and sells forward currency contracts, which are agreements between two parties to buy and sell currencies at a set price on a future date. These contracts are used to hedge foreign exchange risk and to gain exposure on currency.
The U.S. dollar value of forward currency contracts is determined using current forward currency exchange rates supplied by a quotation service. The market value of the contract will fluctuate with changes in currency exchange rates. The contract is marked to market daily and the change in market value is recorded as an unrealized gain or loss. The fund records a realized gain or loss equal to the difference between the value of the contract at the time it was opened and the value at the time it was closed when the contract matures or by delivery of the currency. The fund could be exposed to risk if the value of the currency changes unfavorably, if the counterparties to the contracts are unable to meet the terms of their contracts or if the fund is unable to enter into a closing position. Risks may exceed amounts recognized on the Statement of assets and liabilities.
Forward currency contracts outstanding at period end, if any, are listed after the fund’s portfolio. For the fund’s average contract amount, see Note 5.
Interest rate swap contracts The fund entered into OTC and/or centrally cleared interest rate swap contracts, which are arrangements between two parties to exchange cash flows based on a notional principal amount, to hedge interest rate risk and to gain exposure on interest rates.
| |
| Diversified Income Trust | 91 |
An OTC interest rate swap can be purchased or sold with an upfront premium. An upfront payment received by the fund is recorded as a liability on the fund’s books. An upfront payment made by the fund is recorded as an asset on the fund’s books. OTC and centrally cleared interest rate swap contracts are marked to market daily based upon quotations from an independent pricing service or market makers. Any change is recorded as an unrealized gain or loss on OTC interest rate swaps. Daily fluctuations in the value of centrally cleared interest rate swaps are recorded as a receivable or payable for variation margin on the Statement of assets and liabilities. Payments, including upfront premiums, received or made are recorded as realized gains or losses at the closing of the contract. Certain OTC and centrally cleared interest rate swap contracts may include extended effective dates. Payments related to these swap contracts are accrued based on the terms of the contract.
The fund could be exposed to credit or market risk due to unfavorable changes in the fluctuation of interest rates or if the counterparty defaults, in the case of OTC interest rate contracts, or the central clearing agency or a clearing member defaults, in the case of centrally cleared interest rate swap contracts, on its respective obligation to perform under the contract. The fund’s maximum risk of loss from counterparty risk or central clearing risk, is the fair value of the contract. This risk may be mitigated for OTC interest rate swap contracts by having a master netting arrangement between the fund and the counterparty and for centrally cleared interest rate swap contracts through the daily exchange of mark to market margin. There is minimal counterparty risk with respect to centrally cleared interest rate swap contracts due to the clearinghouse guarantee fund and other resources that are available in the event of a clearing member default.. Risk of loss may exceed amounts recognized on the Statement of assets and liabilities.
Interest rate swap contracts outstanding at period end, if any, are listed after the fund’s portfolio. For the fund’s average notional amount see Note 5.
Total return swap contracts The fund entered into OTC total return swap contracts, which are arrangements to exchange a market linked return for a periodic payment, both based on a notional principal amount, to hedge sector exposure, to manage exposure to specific sectors or industries and to gain exposure to specific sectors or industries.
To the extent that the total return of the security, index or other financial measure underlying the transaction exceeds or falls short of the offsetting interest rate obligation, the fund will receive a payment from or make a payment to the counterparty. OTC total return swap contracts are marked to market daily based upon quotations from an independent pricing service or market makers and the change, if any, is recorded as an unrealized gain or loss. Payments received or made are recorded as realized gains or losses. Certain OTC total return swap contracts may include extended effective dates. Payments related to these swap contracts are accrued based on the terms of the contract. The fund could be exposed to credit or market risk due to unfavorable changes in the fluctuation of interest rates or in the price of the underlying security or index, the possibility that there is no liquid market for these agreements or that the counterparty may default on its obligation to perform. The fund’s maximum risk of loss from counterparty risk is the fair value of the contract. This risk may be mitigated by having a master netting arrangement between the fund and the counterparty. Risk of loss may exceed amounts recognized on the Statement of assets and liabilities.
OTC total return swap contracts outstanding at period end, if any, are listed after the fund’s portfolio. For the fund’s average notional amount, see Note 5.
Credit default contracts The fund entered into OTC credit default contracts to hedge credit risk and to gain exposure on individual names and/or baskets of securities.
In an OTC credit default contract, the protection buyer typically makes an upfront payment and a periodic stream of payments to a counterparty, the protection seller, in exchange for the right to receive a contingent payment upon the occurrence of a credit event on the reference obligation or all other equally ranked obligations of the reference entity. Credit events are contract specific but may include bankruptcy, failure to pay, restructuring and obligation acceleration. An upfront payment received by the fund is recorded as a liability on the fund’s books. An upfront payment made by the fund is recorded as an asset on the fund’s books. Periodic payments received or paid by the fund are recorded as realized gains or losses. The OTC credit default contracts are marked to market daily based upon quotations from an independent pricing service or market makers and the change, if any, is recorded as an unrealized gain or loss. Upon the occurrence of a credit event, the difference between the par value and market value of the reference obligation, net of any proportional amount of the upfront payment, is recorded as a realized gain or loss.
| |
| 92 | Diversified Income Trust |
In addition to bearing the risk that the credit event will occur, the fund could be exposed to market risk due to unfavorable changes in interest rates or in the price of the underlying security or index or the possibility that the fund may be unable to close out its position at the same time or at the same price as if it had purchased the underlying reference obligations. In certain circumstances, the fund may enter into offsetting OTC credit default contracts which would mitigate its risk of loss. Risks of loss may exceed amounts recognized on the Statement of assets and liabilities. The fund’s maximum risk of loss from counterparty risk, either as the protection seller or as the protection buyer, is the fair value of the contract. This risk may be mitigated by having a master netting arrangement between the fund and the counterparty. Where the fund is a seller of protection, the maximum potential amount of future payments the fund may be required to make is equal to the notional amount of the relevant OTC credit default contract.
OTC credit default contracts outstanding, including their respective notional amounts at period end, if any, are listed after the fund’s portfolio. For the fund’s average notional amount, see Note 5.
Master agreements The fund is a party to ISDA (International Swaps and Derivatives Association, Inc.) Master Agreements (Master Agreements) with certain counterparties that govern OTC derivative and foreign exchange contracts entered into from time to time. The Master Agreements may contain provisions regarding, among other things, the parties’ general obligations, representations, agreements, collateral requirements, events of default and early termination. With respect to certain counterparties, in accordance with the terms of the Master Agreements, collateral posted to the fund is held in a segregated account by the fund’s custodian and with respect to those amounts which can be sold or repledged, are presented in the fund’s portfolio. Collateral posted to the fund which cannot be sold or repledged totaled $1,634,974 at the close of the reporting period.
Collateral pledged by the fund is segregated by the fund’s custodian and identified in the fund’s portfolio. Collateral can be in the form of cash or debt securities issued by the U.S. Government or related agencies or other securities as agreed to by the fund and the applicable counterparty. Collateral requirements are determined based on the fund’s net position with each counterparty.
Termination events applicable to the fund may occur upon a decline in the fund’s net assets below a specified threshold over a certain period of time. Termination events applicable to counterparties may occur upon a decline in the counterparty’s long-term and short-term credit ratings below a specified level. In each case, upon occurrence, the other party may elect to terminate early and cause settlement of all derivative and foreign exchange contracts outstanding, including the payment of any losses and costs resulting from such early termination, as reasonably determined by the terminating party. Any decision by one or more of the fund’s counterparties to elect early termination could impact the fund’s future derivative activity.
At the close of the reporting period, the fund had a net liability position of $24,415,759 on open derivative contracts subject to the Master Agreements. Collateral posted by the fund for these agreements totaled $20,983,703.
TBA purchase commitments The fund may enter into TBA (to be announced) commitments to purchase securities for a fixed unit price at a future date beyond customary settlement time. Although the unit price has been established, the principal value has not been finalized. However, it is anticipated that the amount of the commitments will not significantly differ from the principal amount. The fund holds, and maintains until settlement date, cash or high-grade debt obligations in an amount sufficient to meet the purchase price, or the fund may enter into offsetting contracts for the forward sale of other securities it owns. Income on the securities will not be earned until settlement date. TBA purchase commitments may be considered securities themselves, and involve a risk of loss if the value of the security to be purchased declines prior to the settlement date, which risk is in addition to the risk of decline in the value of the fund’s other assets. Unsettled TBA purchase commitments are valued at fair value of the underlying securities, according to the procedures described under “Security valuation” above. The contract is marked to market daily and the change in market value is recorded by the fund as an unrealized gain or loss.
Although the fund will generally enter into TBA purchase commitments with the intention of acquiring securities for its portfolio or for delivery pursuant to options contracts it has entered into, the fund may dispose of a commitment prior to settlement if Putnam Management deems it appropriate to do so.
TBA sale commitments The fund may enter into TBA sale commitments to hedge its portfolio positions or to sell mortgage-backed securities it owns under delayed delivery arrangements. Proceeds of TBA sale commitments are not received until the contractual settlement date. During the time a TBA sale commitment is outstanding, equivalent deliverable securities, or an offsetting TBA purchase commitment deliverable on or before the sale commitment date, are held as “cover” for the transaction.
| |
| Diversified Income Trust | 93 |
Unsettled TBA sale commitments are valued at the fair value of the underlying securities, generally according to the procedures described under “Security valuation” above. The contract is marked to market daily and the change in market value is recorded by the fund as an unrealized gain or loss. If the TBA sale commitment is closed through the acquisition of an offsetting TBA purchase commitment, the fund realizes a gain or loss. If the fund delivers securities under the commitment, the fund realizes a gain or a loss from the sale of the securities based upon the unit price established at the date the commitment was entered into. TBA sale commitments outstanding at period end, if any, are listed after the fund’s portfolio.
Interfund lending The fund, along with other Putnam funds, may participate in an interfund lending program pursuant to an exemptive order issued by the SEC. This program allows the fund to borrow from or lend to other Putnam funds that permit such transactions. Interfund lending transactions are subject to each fund’s investment policies and borrowing and lending limits. Interest earned or paid on the interfund lending transaction will be based on the average of certain current market rates. During the reporting period, the fund did not utilize the program.
Line of credit The fund participates, along with other Putnam funds, in a $315 million unsecured committed line of credit and a $185 million unsecured uncommitted line of credit, both provided by State Street. Borrowings may be made for temporary or emergency purposes, including the funding of shareholder redemption requests and trade settlements. Interest is charged to the fund based on the fund’s borrowing at a rate equal to the Federal Funds rate plus 1.25% for the committed line of credit and the Federal Funds rate plus 1.30% for the uncommitted line of credit. A closing fee equal to 0.02% of the committed line of credit and $50,000 for the uncommitted line of credit has been paid by the participating funds. In addition, a commitment fee of 0.11% per annum on any unutilized portion of the committed line of credit is allocated to the participating funds based on their relative net assets and paid quarterly. During the reporting period, the fund had no borrowings against these arrangements.
Federal taxes It is the policy of the fund to distribute all of its taxable income within the prescribed time period and otherwise comply with the provisions of the Internal Revenue Code of 1986, as amended (the Code), applicable to regulated investment companies. It is also the intention of the fund to distribute an amount sufficient to avoid imposition of any excise tax under Section 4982 of the Code.
The fund is subject to the provisions of Accounting Standards Codification ASC 740 Income Taxes (ASC 740). ASC 740 sets forth a minimum threshold for financial statement recognition of the benefit of a tax position taken or expected to be taken in a tax return. The fund did not have a liability to record for any unrecognized tax benefits in the accompanying financial statements. No provision has been made for federal taxes on income, capital gains or unrealized appreciation on securities held nor for excise tax on income and capital gains. Each of the fund’s federal tax returns for the prior three fiscal years remains subject to examination by the Internal Revenue Service.
The fund may also be subject to taxes imposed by governments of countries in which it invests. Such taxes are generally based on either income or gains earned or repatriated. The fund accrues and applies such taxes to net investment income, net realized gains and net unrealized gains as income and/or capital gains are earned. In some cases, the fund may be entitled to reclaim all or a portion of such taxes, and such reclaim amounts, if any, are reflected as an asset on the fund’s books. In many cases, however, the fund may not receive such amounts for an extended period of time, depending on the country of investment.
At September 30, 2012, the fund had a capital loss carryover of $363,561,832 available to the extent allowed by the Code to offset future net capital gain, if any. The amounts of the carryovers and the expiration dates are:
| | | |
| Loss carryover |
|
| Short-term | Long-term | Total | Expiration |
|
| $8,913,866 | $12,665,118 | $21,578,984 | * |
|
| 13,963,696 | N/A | 13,963,696 | September 30, 2015 |
|
| 18,714,447 | N/A | 18,714,447 | September 30, 2016 |
|
| 146,525,581 | N/A | 146,525,581 | September 30, 2017 |
|
| 162,779,124 | N/A | 162,779,124 | September 30, 2018 |
|
* Under the Regulated Investment Company Modernization Act of 2010, the fund will be permitted to carry forward capital losses incurred in taxable years beginning after December 22, 2010 for an unlimited period. However, any losses incurred will be required to be utilized prior to the losses incurred in pre-enactment tax years. As a result of this ordering rule, pre-enactment capital loss carryforwards may be more likely to expire unused. Additionally,
| |
| 94 | Diversified Income Trust |
post-enactment capital losses that are carried forward will retain their character as either short-term or long-term capital losses rather than being considered all short-term as under previous law.
Pursuant to federal income tax regulations applicable to regulated investment companies, the fund has elected to defer certain capital losses of $338,380,309 recognized during the period between November 1, 2011 and September 30, 2012 to its fiscal year ending September 30, 2013.
The aggregate identified cost on a tax basis is $4,060,302,189, resulting in gross unrealized appreciation and depreciation of $166,734,013 and $64,485,737, respectively, or net unrealized appreciation of $102,248,276.
Distributions to shareholders Distributions to shareholders from net investment income are recorded by the fund on the ex-dividend date. Distributions from capital gains, if any, are recorded on the ex-dividend date and paid at least annually. The amount and character of income and gains to be distributed are determined in accordance with income tax regulations, which may differ from generally accepted accounting principles. Dividend sources are estimated at the time of declaration. Actual results may vary. Any non-taxable return of capital cannot be determined until final tax calculations are completed after the end of the fund’s fiscal year. Reclassifications are made to the fund’s capital accounts to reflect income and gains available for distribution (or available capital loss carryovers) under income tax regulations.
Note 2: Management fee, administrative services and other transactions
The fund pays Putnam Management a management fee (based on the fund’s average net assets and computed and paid monthly) at annual rates that may vary based on the average of the aggregate net assets of most open-end funds, as defined in the fund’s management contract, sponsored by Putnam Management. Such annual rates may vary as follows:
| | | | |
| 0.700% | of the first $5 billion, | | 0.500% | of the next $50 billion, |
| |
|
| 0.650% | of the next $5 billion, | | 0.480% | of the next $50 billion, |
| |
|
| 0.600% | of the next $10 billion, | | 0.470% | of the next $100 billion and |
| |
|
| 0.550% | of the next $10 billion, | | 0.465% | of any excess thereafter. |
| |
|
Putnam Management has contractually agreed, through June 30, 2013, to waive fees or reimburse the fund’s expenses to the extent necessary to limit the cumulative expenses of the fund, exclusive of brokerage, interest, taxes, investment-related expenses, extraordinary expenses, acquired fund fees and expenses and payments under the fund’s investor servicing contract, investment management contract and distribution plans, on a fiscal year-to-date basis to an annual rate of 0.20% of the fund’s average net assets over such fiscal year-to-date period. During the reporting period, the fund’s expenses were not reduced as a result of this limit.
Putnam Investments Limited (PIL), an affiliate of Putnam Management, is authorized by the Trustees to manage a separate portion of the assets of the fund as determined by Putnam Management from time to time. Putnam Management pays a quarterly sub-management fee to PIL for its services at an annual rate of 0.40% of the average net assets of the portion of the fund managed by PIL.
The fund reimburses Putnam Management an allocated amount for the compensation and related expenses of certain officers of the fund and their staff who provide administrative services to the fund. The aggregate amount of all such reimbursements is determined annually by the Trustees.
Custodial functions for the fund’s assets are provided by State Street. Custody fees are based on the fund’s asset level, the number of its security holdings and transaction volumes.
Putnam Investor Services, Inc., an affiliate of Putnam Management, provides investor servicing agent functions to the fund. Putnam Investor Services, Inc. received fees for investor servicing based on the fund’s retail asset level, the number of shareholder accounts in the fund and the level of defined contribution plan assets in the fund. Investor servicing fees will not exceed an annual rate of 0.32% of the fund’s average net assets. During the reporting period, the expenses for each class of shares related to investor servicing fees were as follows:
| | | | |
| Class A | $1,307,141 | | Class R | 3,195 |
| |
|
| Class B | 55,896 | | Class Y | 421,832 |
| |
|
| Class C | 466,826 | | Total | $2,441,521 |
| |
|
| Class M | 186,631 | | | |
| | |
| |
| Diversified Income Trust | 95 |
The fund has entered into expense offset arrangements with Putnam Investor Services, Inc. and State Street whereby Putnam Investor Services, Inc.’s and State Street’s fees are reduced by credits allowed on cash balances. For the reporting period, the fund’s expenses were reduced by $2,883 under the expense offset arrangements.
Each independent Trustee of the fund receives an annual Trustee fee, of which $2,518, as a quarterly retainer, has been allocated to the fund, and an additional fee for each Trustees meeting attended. Trustees also are reimbursed for expenses they incur relating to their services as Trustees.
The fund has adopted a Trustee Fee Deferral Plan (the Deferral Plan) which allows the Trustees to defer the receipt of all or a portion of Trustees fees payable on or after July 1, 1995. The deferred fees remain invested in certain Putnam funds until distribution in accordance with the Deferral Plan.
The fund has adopted an unfunded noncontributory defined benefit pension plan (the Pension Plan) covering all Trustees of the fund who have served as a Trustee for at least five years and were first elected prior to 2004. Benefits under the Pension Plan are equal to 50% of the Trustee’s average annual attendance and retainer fees for the three years ended December 31, 2005. The retirement benefit is payable during a Trustee’s lifetime, beginning the year following retirement, for the number of years of service through December 31, 2006. Pension expense for the fund is included in Trustee compensation and expenses in the Statement of operations. Accrued pension liability is included in Payable for Trustee compensation and expenses in the Statement of assets and liabilities. The Trustees have terminated the Pension Plan with respect to any Trustee first elected after 2003.
The fund has adopted distribution plans (the Plans) with respect to its class A, class B, class C, class M and class R shares pursuant to Rule 12b–1 under the Investment Company Act of 1940. The purpose of the Plans is to compensate Putnam Retail Management Limited Partnership, an indirect wholly-owned subsidiary of Putnam Investments, LLC, for services provided and expenses incurred in distributing shares of the fund. The Plans provide for payments by the fund to Putnam Retail Management Limited Partnership at an annual rate of up to 0.35%, 1.00%, 1.00%, 1.00% and 1.00% of the average net assets attributable to class A, class B, class C, class M and class R shares, respectively. The Trustees have approved payment by the fund at an annual rate of 0.25%, 1.00%, 1.00%, 0.50% and 0.50% of the average net assets attributable to class A, class B, class C, class M and class R shares, respectively. During the reporting period, the class specific expenses related to distribution fees were as follows:
| | | | |
| Class A | $2,239,083 | | Class M | 639,796 |
| |
|
| Class B | 383,212 | | Class R | 10,962 |
| |
|
| Class C | 3,200,060 | | Total | $6,473,113 |
| |
|
For the reporting period, Putnam Retail Management Limited Partnership, acting as underwriter, received net commissions of $145,546 and $2,770 from the sale of class A and class M shares, respectively, and received $31,762 and $2,236 in contingent deferred sales charges from redemptions of class B and class C shares, respectively.
A deferred sales charge of up to 1.00% and 0.40% is assessed on certain redemptions of class A and class M shares, respectively. For the reporting period, Putnam Retail Management Limited Partnership, acting as underwriter, received $2,669 and no monies on class A and class M redemptions, respectively.
Note 3: Purchases and sales of securities
During the reporting period, cost of purchases and proceeds from sales of investment securities other than short-term investments and TBA transactions aggregated $2,553,112,140 and $2,666,543,728, respectively. There were no purchases or proceeds from sales of long-term U.S. government securities.
| |
| 96 | Diversified Income Trust |
Written option transactions during the reporting period are summarized as follows:
| | | |
| | | Written swap option | Written swap option |
| | | contract amounts | premiums |
|
| Written options outstanding at the | USD | 3,104,945,193 | $214,559,020 |
| beginning of the reporting period | EUR | — | $— |
|
| Options opened | USD | 6,668,865,200 | 8,032,140 |
| | EUR | 1,464,075,000 | 16,894,416 |
|
| Options exercised | USD | (311,692,000) | (625,199) |
| | EUR | — | — |
|
| Options closed | USD | (5,361,082,993) | (221,965,961) |
| | EUR | — | — |
|
| Written options outstanding at the end of | USD | 4,101,035,400 | $— |
| the reporting period | EUR | 1,464,075,000 | $16,894,416 |
|
Note 4: Capital shares
At the close of the reporting period, there was an unlimited number of shares of beneficial interest authorized. Transactions in capital shares were as follows:
| | | | |
| | Six months ended 3/31/13 | Year ended 9/30/12 |
|
| Class A | Shares | Amount | Shares | Amount |
|
| Shares sold | 36,428,325 | $285,364,388 | 49,904,063 | $374,207,397 |
|
| Shares issued in connection with | | | | |
| reinvestment of distributions | 5,621,228 | 43,690,004 | 12,173,135 | 90,829,317 |
|
| | 42,049,553 | 329,054,392 | 62,077,198 | 465,036,714 |
|
| Shares repurchased | (41,241,744) | (320,288,209) | (120,678,398) | (898,660,017) |
|
| Net increase (decrease) | 807,809 | $8,766,183 | (58,601,200) | $(433,623,303) |
|
| |
| | Six months ended 3/31/13 | Year ended 9/30/12 |
|
| Class B | Shares | Amount | Shares | Amount |
|
| Shares sold | 722,556 | $5,582,634 | 1,282,453 | $9,538,006 |
|
| Shares issued in connection with | | | | |
| reinvestment of distributions | 190,991 | 1,471,694 | 370,541 | 2,743,864 |
|
| | 913,547 | 7,054,328 | 1,652,994 | 12,281,870 |
|
| Shares repurchased | (1,133,939) | (8,777,387) | (2,759,958) | (20,457,595) |
|
| Net decrease | (220,392) | $(1,723,059) | (1,106,964) | $(8,175,725) |
|
| |
| | Six months ended 3/31/13 | Year ended 9/30/12 |
|
| Class C | Shares | Amount | Shares | Amount |
|
| Shares sold | 7,692,388 | $59,381,404 | 12,233,382 | $90,374,628 |
|
| Shares issued in connection with | | | | |
| reinvestment of distributions | 1,414,912 | 10,836,420 | 3,071,130 | 22,605,827 |
|
| | 9,107,300 | 70,217,824 | 15,304,512 | 112,980,455 |
|
| Shares repurchased | (11,980,150) | (91,862,621) | (36,330,550) | (267,373,448) |
|
| Net decrease | (2,872,850) | $(21,644,797) | (21,026,038) | $(154,392,993) |
|
| |
| Diversified Income Trust | 97 |
| | | | |
| | Six months ended 3/31/13 | Year ended 9/30/12 |
|
| Class M | Shares | Amount | Shares | Amount |
|
| Shares sold | 380,141 | $2,897,516 | 244,221 | $1,807,787 |
|
| Shares issued in connection with | | | | |
| reinvestment of distributions | 58,960 | 451,482 | 124,579 | 916,703 |
|
| | 439,101 | 3,348,998 | 368,800 | 2,724,490 |
|
| Shares repurchased | (3,011,021) | (23,054,489) | (8,691,292) | (64,059,958) |
|
| Net decrease | (2,571,920) | $(19,705,491) | (8,322,492) | $(61,335,468) |
|
| |
| | Six months ended 3/31/13 | Year ended 9/30/12 |
|
| Class R | Shares | Amount | Shares | Amount |
|
| Shares sold | 87,702 | $679,004 | 173,903 | $1,286,294 |
|
| Shares issued in connection with | | | | |
| reinvestment of distributions | 13,705 | 105,427 | 27,875 | 206,037 |
|
| | 101,407 | 784,431 | 201,778 | 1,492,331 |
|
| Shares repurchased | (136,435) | (1,062,378) | (221,540) | (1,640,088) |
|
| Net decrease | (35,028) | $(277,947) | (19,762) | $(147,757) |
|
| |
| | Six months ended 3/31/13 | Year ended 9/30/12 |
|
| Class Y | Shares | Amount | Shares | Amount |
|
| Shares sold | 29,247,780 | $228,084,423 | 37,200,226 | $277,027,889 |
|
| Shares issued in connection with | | | | |
| reinvestment of distributions | 1,366,708 | 10,548,294 | 2,897,143 | 21,487,807 |
|
| | 30,614,488 | 238,632,717 | 40,097,369 | 298,515,696 |
|
| Shares repurchased | (19,189,297) | (148,384,510) | (78,943,053) | (583,398,416) |
|
| Net increase (decrease) | 11,425,191 | $90,248,207 | (38,845,684) | $(284,882,720) |
|
Note 5: Summary of derivative activity
The average volume of activity for the reporting period for any derivative type that was held during the period is listed below and was as follows:
| |
| Purchased swap option contracts (contract amount) | $4,058,200,000 |
|
| Written swap option contracts (contract amount) | $3,005,500,000 |
|
| Futures contracts (number of contracts) | 6,000 |
|
| Forward currency contracts (contract amount) | $2,620,900,000 |
|
| OTC interest rate swap contracts (notional) | $18,172,800,000 |
|
| Centrally cleared interest rate swap contracts (notional) | $12,100,000 |
|
| OTC total return swap contracts (notional) | $2,535,900,000 |
|
| OTC credit default swap contracts (notional) | $107,400,000 |
|
| |
| 98 | Diversified Income Trust |
The following is a summary of the market values of derivative instruments as of the close of the reporting period:
Market values of derivative instruments as of the close of the reporting period
| | | | |
| | Asset derivatives | Liability derivatives |
|
| Derivatives not | | | | |
| accounted for as | Statement of | | Statement of | |
| hedging instruments | assets and | | assets and | |
| under ASC 815 | liabilities location | Market value | liabilities location | Market value |
|
| Credit contracts | Receivables | $1,140,411 | Payables | $8,242,190 |
|
| Foreign exchange | | | | |
| contracts | Receivables | 16,447,475 | Payables | 6,179,671 |
|
| | Investments, | | Payables, | |
| | Receivables, Net | | Net assets — | |
| | assets — Unrealized | | Unrealized | |
| Interest rate contracts | appreciation | 91,480,945* | depreciation | 108,649,729* |
|
| Total | | $109,068,831 | | $123,071,590 |
|
* Includes cumulative appreciation/depreciation of futures contracts as reported in the fund’s portfolio. Only current day’s variation margin is reported within the Statement of assets and liabilities.
The following is a summary of realized and change in unrealized gains or losses of derivative instruments on the Statement of operations for the reporting period (see Note 1):
Amount of realized gain or (loss) on derivatives recognized in net gain or (loss) on investments
| | | | | |
| Derivatives not accounted | | | Forward | | |
| for as hedging instruments | | | currency | | |
| under ASC 815 | Options | Futures | contracts | Swaps | Total |
|
| Credit contracts | $— | $— | $— | $2,098,773 | $2,098,773 |
|
| Foreign exchange | | | | | |
| contracts | — | — | 14,702,805 | — | $14,702,805 |
|
| Interest rate contracts | (6,026,546) | (314,220) | — | 13,480,584 | $7,139,818 |
|
| Total | $(6,026,546) | $(314,220) | $14,702,805 | $15,579,357 | $23,941,396 |
|
Change in unrealized appreciation or (depreciation) on derivatives recognized in net gain or (loss) on investments
| | | | | |
| Derivatives not accounted | | | Forward | | |
| for as hedging instruments | | | currency | | |
| under ASC 815 | Options | Futures | contracts | Swaps | Total |
|
| Credit contracts | $— | $— | $— | $(5,062,091) | $(5,062,091) |
|
| Foreign exchange | | | | | |
| contracts | — | — | 20,946,086 | — | $20,946,086 |
|
| Interest rate contracts | (5,622,042) | 923,624 | — | 12,368,555 | $7,670,137 |
|
| Total | $(5,622,042) | $923,624 | $20,946,086 | $7,306,464 | $23,554,132 |
|
| |
| Diversified Income Trust | 99 |
Note 6: Transactions with affiliated issuers
Transactions during the reporting period with Putnam Money Market Liquidity Fund and Putnam Short Term Investment Fund, which are under common ownership or control, were as follows:
| | | | | |
| | Market value at | | | | Market value |
| | the beginning | | | | at the end of |
| | of the reporting | | | Investment | the reporting |
| Name of affiliates | period | Purchase cost | Sale proceeds | income | period |
|
| Putnam Money Market | | | | | |
| Liquidity Fund* | $— | $707,500,419 | $707,500,419 | $58,895 | $— |
|
| Putnam Short Term | | | | | |
| Investment Fund* | — | 283,630,280 | 138,384,133 | 9,396 | 145,246,147 |
|
| Totals | $— | $991,130,699 | $845,884,552 | $68,291 | $145,246,147 |
|
* Management fees charged to Putnam Money Market Liquidity Fund and Putnam Short Term Investment Fund have been waived by Putnam Management.
Note 7: Senior loan commitments
Senior loans are purchased or sold on a when-issued or delayed delivery basis and may be settled a month or more after the trade date, which from time to time can delay the actual investment of available cash balances; interest income is accrued based on the terms of the securities. Senior loans can be acquired through an agent, by assignment from another holder of the loan, or as a participation interest in another holder’s portion of the loan. When the fund invests in a loan or participation, the fund is subject to the risk that an intermediate participant between the fund and the borrower will fail to meet its obligations to the fund, in addition to the risk that the borrower under the loan may default on its obligations.
Note 8: Market, credit and other risks
In the normal course of business, the fund trades financial instruments and enters into financial transactions where risk of potential loss exists due to changes in the market (market risk) or failure of the contracting party to the transaction to perform (credit risk). The fund may be exposed to additional credit risk that an institution or other entity with which the fund has unsettled or open transactions will default. Investments in foreign securities involve certain risks, including those related to economic instability, unfavorable political developments, and currency fluctuations. The fund may invest in higher yielding, lower rated bonds that may have a higher rate of default. The fund may invest a significant portion of its assets in securitized debt instruments, including mortgage-backed and asset-backed investments. The yields and values of these investments are sensitive to changes in interest rates, the rate of principal payments on the underlying assets and the market’s perception of the issuers. The market for these investments may be volatile and limited, which may make them difficult to buy or sell.
Note 9: New accounting pronouncement
In January 2013, ASU 2013–01 “Clarifying the Scope of Disclosures about Offsetting Assets and Liabilities” replaced ASU No. 2011–11 “Disclosures about Offsetting Assets and Liabilities”. The updates create new disclosure requirements requiring entities to disclose both gross and net information for derivatives and other financial instruments that are either offset in the Statement of assets and liabilities or subject to an enforceable master netting arrangement or similar agreement. The disclosure requirements are effective for annual reporting periods beginning on or after January 1, 2013 and interim periods within those annual periods. Putnam Management is currently evaluating the application of ASU 2013–01 and its impact, if any, on the fund’s financial statements.
| |
| 100 | Diversified Income Trust |
Fund information
Founded over 75 years ago, Putnam Investments was built around the concept that a balance between risk and reward is the hallmark of a well-rounded financial program. We manage over 100 funds across income, value, blend, growth, asset allocation, absolute return, and global sector categories.
| | |
| Investment Manager | Trustees | Robert R. Leveille |
| Putnam Investment | Jameson A. Baxter, Chair | Vice President and |
| Management, LLC | Liaquat Ahamed | Chief Compliance Officer |
| One Post Office Square | Ravi Akhoury | |
| Boston, MA 02109 | Barbara M. Baumann | Michael J. Higgins |
| | Charles B. Curtis | Vice President and Treasurer |
| Investment Sub-Manager | Robert J. Darretta | |
| Putnam Investments Limited | Katinka Domotorffy | Janet C. Smith |
| 57–59 St James’s Street | John A. Hill | Vice President, |
| London, England SW1A 1LD | Paul L. Joskow | Principal Accounting Officer, |
| | Elizabeth T. Kennan | and Assistant Treasurer |
| Marketing Services | Kenneth R. Leibler | |
| Putnam Retail Management | Robert E. Patterson | Susan G. Malloy |
| One Post Office Square | George Putnam, III | Vice President and |
| Boston, MA 02109 | Robert L. Reynolds | Assistant Treasurer |
| | W. Thomas Stephens | |
| Custodian | | James P. Pappas |
| State Street Bank | Officers | Vice President |
| and Trust Company | Robert L. Reynolds | |
| | President | Mark C. Trenchard |
| Legal Counsel | | Vice President and |
| Ropes & Gray LLP | Jonathan S. Horwitz | BSA Compliance Officer |
| | Executive Vice President, | |
| | Principal Executive Officer, and | Judith Cohen |
| | Compliance Liaison | Vice President, Clerk, and |
| | | Associate Treasurer |
| | Steven D. Krichmar | |
| | Vice President and | Nancy E. Florek |
| | Principal Financial Officer | Vice President, Proxy |
| | | Manager, Assistant Clerk, and |
| | Robert T. Burns | Associate Treasurer |
| | Vice President and | |
| | Chief Legal Officer | |
This report is for the information of shareholders of Putnam Diversified Income Trust. It may also be used as sales literature when preceded or accompanied by the current prospectus, the most recent copy of Putnam’s Quarterly Performance Summary, and Putnam’s Quarterly Ranking Summary. For more recent performance, please visit putnam.com. Investors should carefully consider the investment objectives, risks, charges, and expenses of a fund, which are described in its prospectus. For this and other information or to request a prospectus or summary prospectus, call 1-800-225-1581 toll free. Please read the prospectus carefully before investing. The fund’s Statement of Additional Information contains additional information about the fund’s Trustees and is available without charge upon request by calling 1-800-225-1581.
| |
| Item 3. Audit Committee Financial Expert: |
| |
| Item 4. Principal Accountant Fees and Services: |
| |
| Item 5. Audit Committee of Listed Registrants |
| |
| Item 6. Schedule of Investments: |
| |
| The registrant’s schedule of investments in unaffiliated issuers is included in the report to shareholders in Item 1 above. |
| |
| Item 7. Disclosure of Proxy Voting Policies and Procedures For Closed-End Management Investment Companies: |
| |
| Item 8. Portfolio Managers of Closed-End Investment Companies |
| |
| Item 9. Purchases of Equity Securities by Closed-End Management Investment Companies and Affiliated Purchasers: |
| |
| Item 10. Submission of Matters to a Vote of Security Holders: |
| |
| Item 11. Controls and Procedures: |
| |
| (a) The registrant’s principal executive officer and principal financial officer have concluded, based on their evaluation of the effectiveness of the design and operation of the registrant’s disclosure controls and procedures as of a date within 90 days of the filing date of this report, that the design and operation of such procedures are generally effective to provide reasonable assurance that information required to be disclosed by the registrant in this report is recorded, processed, summarized and reported within the time periods specified in the Commission’s rules and forms. |
| |
| (b) Changes in internal control over financial reporting: Not applicable |
| |
| (a)(2) Separate certifications for the principal executive officer and principal financial officer of the registrant as required by Rule 30a-2(a) under the Investment Company Act of 1940, as amended, are filed herewith. |
| |
| (b) The certifications required by Rule 30a-2(b) under the Investment Company Act of 1940, as amended, are filed herewith. |
| |
| Putnam Diversified Income Trust |
| |
| By (Signature and Title): |
| |
| /s/Janet C. Smith
Janet C. Smith
Principal Accounting Officer
|
| |
| Pursuant to the requirements of the Securities Exchange Act of 1934 and the Investment Company Act of 1940, this report has been signed below by the following persons on behalf of the registrant and in the capacities and on the dates indicated. |
| |
| By (Signature and Title): |
| |
| /s/Jonathan S. Horwitz
Jonathan S. Horwitz
Principal Executive Officer
|
| |
| By (Signature and Title): |
| |
| /s/Steven D. Krichmar
Steven D. Krichmar
Principal Financial Officer
|