| | | |
| UNITED STATES |
| SECURITIES AND EXCHANGE COMMISSION |
| Washington, D.C. 20549 |
| |
| FORM N-CSR |
| |
| CERTIFIED SHAREHOLDER REPORT OF REGISTERED |
| MANAGEMENT INVESTMENT COMPANIES |
| | |
| Investment Company Act file number: (811- 05635) | |
| | |
| Exact name of registrant as specified in charter: | Putnam Diversified Income Trust |
| |
| Address of principal executive offices: One Post Office Square, Boston, Massachusetts 02109 |
| | |
| Name and address of agent for service: | Beth S. Mazor, Vice President |
| | One Post Office Square |
| | Boston, Massachusetts 02109 |
| | |
| Copy to: | | John W. Gerstmayr, Esq. |
| | Ropes & Gray LLP |
| | 800 Boylston Street |
| | Boston, Massachusetts 02199-3600 |
| | |
| Registrant’s telephone number, including area code: | (617) 292-1000 |
| | | |
| Date of fiscal year end: September 30, 2011 | | |
| |
| Date of reporting period: October 1, 2010 — March 31, 2011 |
Item 1. Report to Stockholders:
The following is a copy of the report transmitted to stockholders pursuant to Rule 30e-1 under the Investment Company Act of 1940:

Putnam
Diversified
Income Trust
Semiannual report
3 | 31 | 11
| | | |
| Message from the Trustees | 1 | | |
| | |
| About the fund | 2 | | |
| | |
| Performance snapshot | 4 | | |
| | |
| Interview with your fund’s portfolio manager | 5 | | |
| | |
| Your fund’s performance | 11 | | |
| | |
| Your fund’s expenses | 13 | | |
| | |
| Terms and definitions | 15 | | |
| | |
| Other information for shareholders | 16 | | |
| | |
| Financial statements | 17 | | |
| | |
Consider these risks before investing: International investing involves certain risks, such as currency fluctuations, economic instability, and political developments. Additional risks may be associated with emerging-market securities, including illiquidity and volatility. Lower-rated bonds may offer higher yields in return for more risk. Funds that invest in government securities are not guaranteed. Mortgage-backed securities are subject to prepayment risk. The use of derivatives involves special risks and may result in losses. Funds that invest in bonds are subject to certain risks including interest-rate risk, credit risk, and inflation risk. As interest rates rise, the prices of bonds fall. Long-term bonds are more exposed to interest-rate risk than short-term bonds. Unlike bonds, bond funds have ongoing fees and expenses.
Message from the Trustees
Dear Fellow Shareholder:
The U.S. economy and markets continue to improve, despite the many headwinds that they face. The stock market has shown resilience, recently hitting multiple-year highs. The number of U.S. companies paying dividends is significantly higher than a year ago, and corporate profits remain strong.
Even with this positive news, Putnam believes that volatility will continue to roil the markets in the months ahead. Federal budget issues, inflationary pressures, stubbornly high unemployment, and global developments from Japan to Libya have created a cloud of uncertainty. In addition, the U.S. fixed-income market faces the end of the Federal Reserve’s quantitative easing program and the prospects of a tighter monetary policy in the future. We believe, however, that Putnam’s active, research-intensive approach is well suited to uncovering opportunities in this environment.
In addition, Putnam would like to thank Richard B. Worley and Myra R. Drucker, who have retired from the Board of Trustees, for their many years of dedicated and thoughtful leadership.
Lastly, we would like to take this opportunity to welcome new shareholders to the fund and to thank all of our investors for your continued confidence in Putnam.

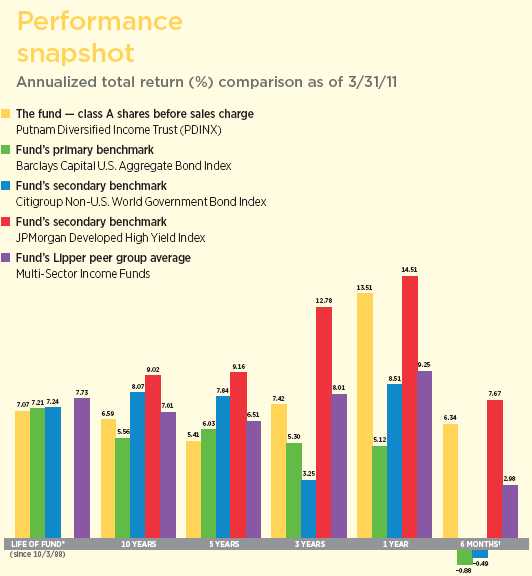
Current performance may be lower or higher than the quoted past performance, which cannot guarantee future results. Share price, principal value, and return will fluctuate, and you may have a gain or a loss when you sell your shares. Performance of class A shares assumes reinvestment of distributions and does not account for taxes. Fund returns in the bar chart do not reflect a sales charge of 4.00%; had they, returns would have been lower. See pages 5 and 11–12 for additional performance information. For a portion of the periods, the fund had expense limitations, without which returns would have been lower. To obtain the most recent month-end performance, visit putnam.com.
* The fund’s secondary benchmark, the JPMorgan Developed High Yield Index, was introduced on 12/31/94, which post-dates the inception of the fund’s class A shares.
† Returns for the six-month period are not annualized, but cumulative.
4
Interview with your fund’s portfolio manager
D. William Kohli
Bill, what was the environment like in global bond markets during the six months ended March 31, 2011?
The fixed-income market generated mixed results during the period. Sectors at the riskier end of the spectrum, such as high-yield corporate bonds, floating-rate bank loan securities, and commercial mortgage-backed securities [CMBS] performed the best. Bonds in these categories are generally less sensitive to interest-rate movements and benefited from an improving economy. U.S. Treasuries struggled during the period. Upward pressure on Treasury yields due to better economic prospects was offset by downward pressure resulting from macroeconomic risks in Europe, the Middle East, North Africa, and Japan. Similarly, increasing inflation expectations placed upward pressure on yields, but this was held in check by the Federal Reserve’s bond purchases under its quantitative easing program.
During the second half of the period, market participants increasingly concluded that the U.S. economy is returning to a more normal growth pattern. As a result, near-term inflation expectations increased considerably, causing yields at the shorter end of the Treasury yield curve to rise more than longer-maturity yields, and the yield curve flattened marginally. [The yield curve is a graphical representation of the difference in yields between shorter- and longer-term bonds.]
In this environment, our decision to limit the fund’s interest-rate risk versus the benchmark and focus on securities we believed could perform well despite rising rates enabled Putnam Diversified Income Trust to outperform its primary benchmark at net asset value by a sizeable margin.
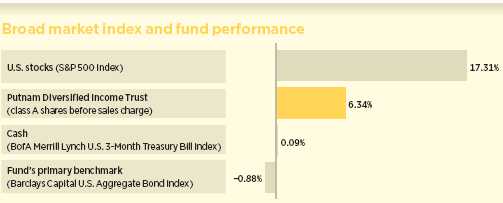
This comparison shows your fund’s performance in the context of broad market indexes for the six months ended 3/31/11. See pages 4 and 11–12 for additional fund performance information. Index descriptions can be found on page 15.
5
Looking more closely at the macroeconomic backdrop, leading economic indicators accelerated throughout the winter into the spring, signaling continued economic expansion for the United States in the coming months. Manufacturing activity improved, with a renewal of the inventory cycle potentially providing room for additional growth. Labor market conditions also strengthened, with total private employment increasing substantially during the first three months of 2011. On the downside, U.S. residential housing remained very weak, as sales patterns showed that the excesses of the housing bubble were still being worked through the system.
Leading indicators for many European economies painted a similar picture as those in the United States. While sovereign debt issues remain, economic stability pushed these concerns into the background, at least for now.
Globally, while a majority of both developed and emerging countries showed rising economic indicators, many emerging-market economies have been tightening their monetary policies to combat inflation and are generally in a later phase of the business cycle.
The fund outperformed its primary benchmark by a substantial margin. What factors drove this outperformance?
The fund’s interest-rate strategies were key contributors versus the benchmark. Using interest-rate swaps and futures,
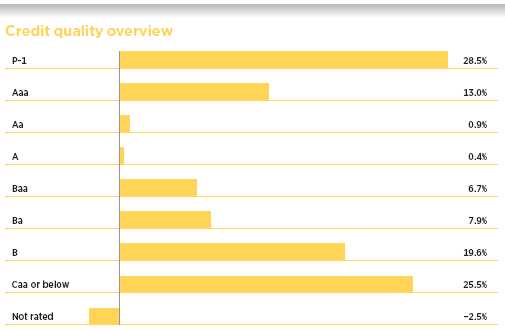
Credit qualities are shown as a percentage of net assets as of 3/31/11. A bond rated Baa or higher (Prime-3 or higher, for short-term debt) is considered investment grade. The chart reflects Moody’s ratings; percentages may include bonds or derivatives not rated by Moody’s but rated by Standard & Poor’s (S&P) or, if unrated by S&P, by Fitch, and then included in the closest equivalent Moody’s rating. Ratings will vary over time.
Credit quality includes bonds and cash and represents only the fixed-income portion of the portfolio. Derivative instruments, including currency forwards, are only included to the extent of any unrealized gain or loss on such instruments and are shown in the not-rated category. The fund itself has not been rated by an independent rating agency.
6
we successfully positioned the fund for a rising-rate environment and a flatter yield curve. In addition, we kept the fund’s duration — or sensitivity to interest-rate changes — short versus the index, which helped as rates moved higher.

The fund continued to benefit from the strong cash flows generated by our holdings of securitized bonds, specifically non-agency residential mortgage-backed securities [RMBS] and agency interest-only collateralized mortgage obligations [IO CMO]. In general, non-agency RMBS have minimal sensitivity to rising interest rates because of their relatively short durations. Also, in many cases, rising rates help IO CMOs by removing refinancing incentives for lower-rate mortgage pools. Refinancing activity on the mortgage pools underlying the IO CMOs that we held remained at low levels. As a result, these securities generated steady cash flows throughout the period and their prices moved higher. In fact, the returns from our IO CMO
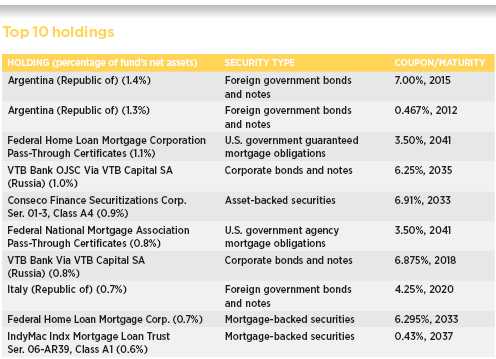
This table shows the fund’s top 10 individual holdings and the percentage of the fund’s net assets that each represented at 3/31/11. Short-term holdings are excluded. Holdings will vary over time.
7
positions were so solid that we significantly reduced the fund’s exposure to lock in profits.
In implementing our IO CMO strategy, we used interest-rate swaps and options to hedge the fund’s duration, in order to isolate the prepayment risk that we believed was attractively priced.
A significant allocation to high-yield corporate bonds was another key contributor to the fund’s outperformance, as the high-yield category was the top-performing bond-market sector for the period. Strong corporate fundamentals and positive credit trends bolstered high-yield bonds. High-yield credit spreads — or the yield advantage offered by high-yield bonds over U.S. Treasuries — declined over the period, but demand remained robust as investors moved up the risk spectrum in search of higher yields. The default rate, which is another important aspect of the asset class, declined to low single-digit levels by period-end — well below the historical average.
What other holdings aided the fund’s relative performance?
Security selection in emerging-market debt also boosted performance, with our investments in bonds from Argentina, and oil-rich Russia and Venezuela delivering the best results.
A small position in short-term CMBS rounded out the top contributors. Our holdings of bonds in the highly liquid topmost part of the capital structure benefited from investors’ perception that even though commercial mortgage delinquencies accelerated, senior CMBSs had enough structural protection to withstand losses. However, CMBSs were one of the first sectors to recover from the 2008–2009 credit crisis, and their valuations are not as attractive as they once were.
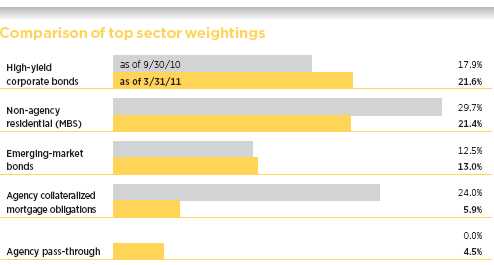
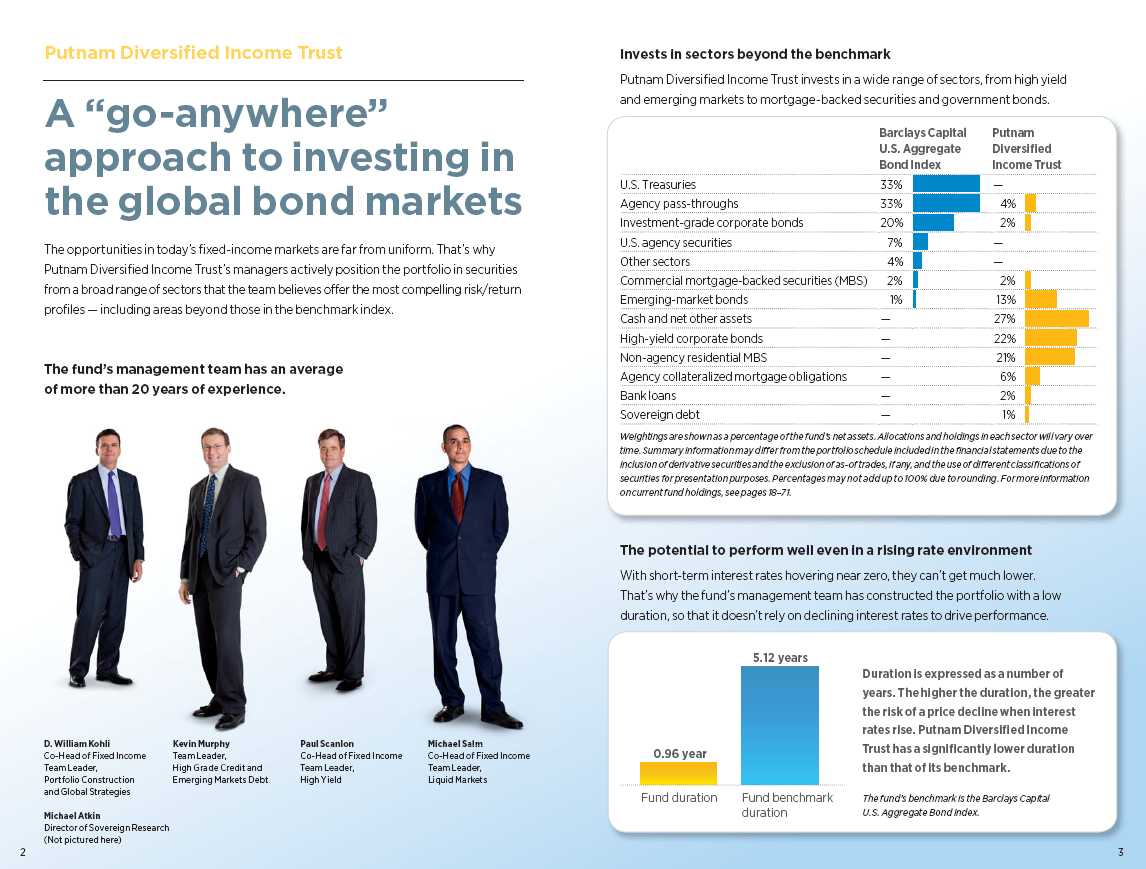
This chart shows how the fund’s top weightings have changed over the past six months. Weightings are shown as a percentage of net assets. Summary information may differ from the portfolio schedule included in the financial statements due to the inclusion of derivative securities and the exclusion of as-of trades, if any, and the use of different classifications of securities for presentation purposes. Holdings will vary over time.
8
Which strategies detracted from results?
Global currencies were volatile during the period, and our active currency management detracted from returns. Specifically, the fund was hurt by the unwinding of the “carry trade” in which we sold currencies from countries with relatively low interest rates and used the proceeds to buy currencies from countries with relatively high interest rates, most notably Australia. Tactical positioning in the British pound sterling and short positions in the Swiss franc and Canadian dollar also dampened results. We used currency-forward contracts to gain exposure to currencies and hedge the portfolio’s foreign exchange risk.
Additionally, the fund was underweight investment-grade corporate bonds versus the benchmark, which detracted modestly from relative performance.
In what additional ways did you use derivatives?
We used options to gain interest-rate exposure. We employed futures to help hedge the fund’s interest-rate risk. And we utilized total return swaps to generally manage the fund’s exposure to various market sectors and industries, and to gain exposure to and hedge the impact of inflation rates in specific countries.
What is your outlook for global economies and the credit markets in the coming months, and how are you positioning the fund?
Developed global economies appear to be transitioning into what I refer to as an “interest-rate normalization” mode. Reflecting its staunch anti-inflation posture, the European Central Bank raised its main policy rate by 0.25% shortly after the period ended — its first increase since 2008 — and is likely to do so again in the next two to three months. In the United States, if economic data continue to come in better than expected, it is likely the Federal Reserve will intensify its discussions about when to begin increasing the federal funds rate.
Overall, we have a positive outlook regarding global economic growth. At the same time, we are mindful of macro risks that do not appear to be fully reflected in the credit markets, such as the rising price of crude oil. Higher oil prices potentially have the dual negative impact of contributing to higher inflation as well as impairing economic growth. Rising oil prices act as a tax on the global economy by impeding consumer spending and squeezing corporate profit margins. At the very least, it is likely that higher oil prices will dampen economic growth over the near term.
In terms of portfolio positioning, as noted previously, we reduced the fund’s risk profile by sharply cutting our allocation to IO CMOs, concluding that their valuations had reached levels that were less compelling from a risk/reward standpoint. However, we continue to closely monitor the IO CMO market, and remain alert for opportunities to reallocate capital to this area when valuations warrant. We also trimmed our holdings of non-agency RMBS, the returns of which are heavily influenced by home prices. Lastly, we are maintaining a short-duration posture, as we anticipate that rates may continue to rise, and plan to continue the fund’s bias toward a flattening yield curve. Overall, the portfolio remains broadly diversified. We continue to believe that a number of attractive opportunities exist outside the broad market indexes for firms like Putnam that have the resources to capitalize on them.
Thanks for your time and for bringing us up to date, Bill.
9
The views expressed in this report are exclusively those of Putnam Management. They are not meant as investment advice.
Please note that the holdings discussed in this report may not have been held by the fund for the entire period. Portfolio composition is subject to review in accordance with the fund’s investment strategy and may vary in the future. Current and future portfolio holdings are subject to risk.
Of special interest
Your fund’s dividend rate was decreased twice during the semiannual period ended March 31, 2011. The dividend per class A share declined from $0.067 to $0.061 effective November 2010, and from $0.061 to $0.050 effective February 2011. These reductions were due to an overall decrease in interest income resulting from the current low interest-rate environment, and also due to variable cash flows from mortgage-related securities.

Portfolio Manager D. William Kohli is Co-Head of Fixed Income at Putnam and Team Leader of Portfolio Construction and Global Strategies. He has an M.B.A. from the Haas School of Business at the University of California, Berkeley, and a B.A. from the University of California, San Diego. Bill joined Putnam in 1994 and has been in the investment industry since 1987.
In addition to Bill, your fund is managed by Michael Atkin, Kevin Murphy, Michael Salm, and Paul Scanlon.
IN THE NEWS
The Federal Reserve continues to back its stimulus efforts already underway. Besides maintaining its near-zero interest-rate policy, the Federal Open Market Committee at its April 15 meeting remained committed to completing its second round of quantitative easing, dubbed “QE2.” Last fall, the central bank launched QE2, which involves the purchase of $600 billion in U.S. Treasury securities, with the primary aim of preventing deflation in the U.S. economy. Last summer, the United States teetered perilously on the brink of a deflationary cliff, as inflation rates fell to 50-year lows. Deflation, which occurs when prices fall in an economy, can cause long-term significant damage to growth. QE2 may have worked, as inflation has returned. In March, the most recent data available, prices measured by the Consumer Price Index (CPI) edged up 0.5% after increasing by the same margin in February. Core inflation, which excludes volatile food and energy prices, rose by 0.1% in March, following a 0.2% uptick in February.
10
Your fund’s performance
This section shows your fund’s performance, price, and distribution information for periods ended March 31, 2011, the end of the first half of its current fiscal year. In accordance with regulatory requirements for mutual funds, we also include expense information taken from the fund’s current prospectus. Performance should always be considered in light of a fund’s investment strategy. Data represent past performance. Past performance does not guarantee future results. More recent returns may be less or more than those shown. Investment return and principal value will fluctuate, and you may have a gain or a loss when you sell your shares. Performance information does not reflect any deduction for taxes a shareholder may owe on fund distributions or on the redemption of fund shares. For the most recent month-end performance, please visit the Individual Investors section at putnam.com or call Putnam at 1-800-225-1581. Class R and class Y shares are not available to all investors. See the Terms and Definitions section in this report for definitions of the share classes offered by your fund.
Fund performance Total return for periods ended 3/31/11
| | | | | | | | | | |
| | Class A | Class B | Class C | Class M | Class R | Class Y |
| (inception dates) | (10/3/88) | (3/1/93) | (2/1/99) | (12/1/94) | (12/1/03) | (7/1/96) |
|
| | NAV | POP | NAV | CDSC | NAV | CDSC | NAV | POP | NAV | NAV |
|
| Annual average | | | | | | | | | | |
| (life of fund) | 7.07% | 6.88% | 6.25% | 6.25% | 6.25% | 6.25% | 6.77% | 6.61% | 6.78% | 7.22% |
|
| 10 years | 89.28 | 81.71 | 75.62 | 75.62 | 74.94 | 74.94 | 84.35 | 78.35 | 83.66 | 93.00 |
| Annual average | 6.59 | 6.15 | 5.79 | 5.79 | 5.75 | 5.75 | 6.31 | 5.96 | 6.27 | 6.80 |
|
| 5 years | 30.12 | 24.91 | 25.52 | 23.84 | 25.08 | 25.08 | 28.52 | 24.30 | 27.84 | 31.21 |
| Annual average | 5.41 | 4.55 | 4.65 | 4.37 | 4.58 | 4.58 | 5.15 | 4.45 | 5.03 | 5.58 |
|
| 3 years | 23.94 | 18.93 | 21.38 | 18.71 | 20.96 | 20.96 | 23.10 | 19.07 | 22.53 | 24.38 |
| Annual average | 7.42 | 5.95 | 6.67 | 5.88 | 6.55 | 6.55 | 7.17 | 5.99 | 7.01 | 7.54 |
|
| 1 year | 13.51 | 8.99 | 12.61 | 7.61 | 12.70 | 11.70 | 13.21 | 9.59 | 13.16 | 13.64 |
|
| 6 months | 6.34 | 2.04 | 5.97 | 0.97 | 6.03 | 5.03 | 6.27 | 2.78 | 6.24 | 6.40 |
|
Current performance may be lower or higher than the quoted past performance, which cannot guarantee future results. After-sales-charge returns (public offering price, or POP) for class A and M shares reflect a maximum 4.00% and 3.25% load, respectively. Class B share returns reflect the applicable contingent deferred sales charge (CDSC), which is 5% in the first year, declining over time to 1% in the sixth year, and is eliminated thereafter. Class C shares reflect a 1% CDSC for the first year that is eliminated thereafter. Class R and Y shares have no initial sales charge or CDSC. Performance for class B, C, M, R, and Y shares before their inception is derived from the historical performance of class A shares, adjusted for the applicable sales charge (or CDSC) and the higher operating expenses for such shares, except for class Y shares, for which 12b-1 fees are not applicable.
For a portion of the periods, the fund had expense limitations, without which returns would have been lower.
Class B share performance does not reflect conversion to class A shares.
11
Comparative index returns For periods ended 3/31/11
| | | | |
| | Barclays Capital | Citigroup Non-U.S. | JPMorgan | Lipper Multi-Sector |
| | U.S. Aggregate | World Government | Developed High | Income Funds |
| | Bond Index | Bond Index | Yield Index | category average* |
|
| Annual average (life of fund) | 7.21% | 7.24% | —† | 7.73% |
|
| 10 years | 71.86 | 117.31 | 137.24% | 98.40 |
| Annual average | 5.56 | 8.07 | 9.02 | 7.01 |
|
| 5 years | 33.98 | 45.82 | 55.01 | 37.37 |
| Annual average | 6.03 | 7.84 | 9.16 | 6.51 |
|
| 3 years | 16.74 | 10.07 | 43.46 | 26.13 |
| Annual average | 5.30 | 3.25 | 12.78 | 8.01 |
|
| 1 year | 5.12 | 8.51 | 14.51 | 9.25 |
|
| 6 months | –0.88 | –0.49 | 7.67 | 2.98 |
|
Index and Lipper results should be compared to fund performance at net asset value.
* Over the 6-month, 1-year, 3-year, 5-year, 10-year, and life-of-fund periods ended 3/31/11, there were 185, 170, 131, 98, 70, and 5 funds, respectively, in this Lipper category.
† The fund’s secondary benchmark, the JPMorgan Developed High Yield Index, was introduced on 12/31/94, which post-dates the inception of the fund’s class A shares.
Fund price and distribution information For the six-month period ended 3/31/11
| | | | | | | | |
| Distributions | Class A | Class B | Class C | Class M | Class R | Class Y |
|
| Number | 6 | 6 | 6 | 6 | 6 | 6 |
|
| Income | $0.350 | $0.318 | $0.320 | $0.338 | $0.338 | $0.362 |
|
| Capital gains | — | — | — | — | — | — |
|
| Total | $0.350 | $0.318 | $0.320 | $0.338 | $0.338 | $0.362 |
|
| Share value | NAV | POP | NAV | NAV | NAV | POP | NAV | NAV |
|
| 9/30/10 | $8.08 | $8.42 | $8.01 | $7.97 | $7.97 | $8.24 | $8.00 | $8.04 |
|
| 3/31/11 | 8.23 | 8.57 | 8.16 | 8.12 | 8.12 | 8.39 | 8.15 | 8.18 |
|
| Current yield (end of period) | NAV | POP | NAV | NAV | NAV | POP | NAV | NAV |
|
| Current dividend rate 1 | 7.29% | 7.00% | 6.62% | 6.65% | 7.09% | 6.87% | 7.07% | 7.63% |
|
| Current 30-day SEC yield 2 | N/A | 4.47 | 3.90 | 3.90 | N/A | 4.26 | 4.40 | 4.90 |
|
The classification of distributions, if any, is an estimate. Final distribution information will appear on your year-end tax forms.
1 Most recent distribution, excluding capital gains, annualized and divided by NAV or POP at end of period.
2 Based only on investment income and calculated using the maximum offering price for each share class, in accordance with SEC guidelines.
12
Your fund’s expenses
As a mutual fund investor, you pay ongoing expenses, such as management fees, distribution fees (12b-1 fees), and other expenses. Using the following information, you can estimate how these expenses affect your investment and compare them with the expenses of other funds. You may also pay one-time transaction expenses, including sales charges (loads) and redemption fees, which are not shown in this section and would have resulted in higher total expenses. For more information, see your fund’s prospectus or talk to your financial representative.
Expense ratios
| | | | | | |
| | Class A | Class B | Class C | Class M | Class R | Class Y |
|
| Total annual operating expenses for the fiscal year | | | | | | |
| ended 9/30/10 | 1.01% | 1.76% | 1.76% | 1.26% | 1.26% | 0.76% |
|
| Annualized expense ratio for the six-month period | | | | | | |
| ended 3/31/11 | 0.98% | 1.73% | 1.73% | 1.23% | 1.23% | 0.73% |
|
Fiscal-year expense information in this table is taken from the most recent prospectus, is subject to change, and may differ from that shown for the annualized expense ratio and in the financial highlights of this report. Expenses are shown as a percentage of average net assets.
Expenses per $1,000
The following table shows the expenses you would have paid on a $1,000 investment in the fund from October 1, 2010, to March 31, 2011. It also shows how much a $1,000 investment would be worth at the close of the period, assuming actual returns and expenses.
| | | | | | |
| | Class A | Class B | Class C | Class M | Class R | Class Y |
|
| Expenses paid per $1,000*† | $5.04 | $8.88 | $8.89 | $6.33 | $6.32 | $3.76 |
|
| Ending value (after expenses) | $1,063.40 | $1,059.70 | $1,060.30 | $1,062.70 | $1,062.40 | $1,064.00 |
|
* Expenses for each share class are calculated using the fund’s annualized expense ratio for each class, which represents the ongoing expenses as a percentage of average net assets for the six months ended 3/31/11. The expense ratio may differ for each share class.
† Expenses are calculated by multiplying the expense ratio by the average account value for the period; then multiplying the result by the number of days in the period; and then dividing that result by the number of days in the year.
13
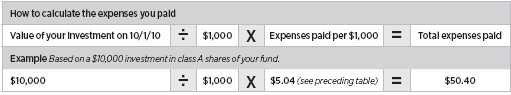
Estimate the expenses you paid
To estimate the ongoing expenses you paid for the six months ended March 31, 2011, use the following calculation method. To find the value of your investment on October 1, 2010, call Putnam at 1-800-225-1581.
Compare expenses using the SEC’s method
The Securities and Exchange Commission (SEC) has established guidelines to help investors assess fund expenses. Per these guidelines, the following table shows your fund’s expenses based on a $1,000 investment, assuming a hypothetical 5% annualized return. You can use this information to compare the ongoing expenses (but not transaction expenses or total costs) of investing in the fund with those of other funds. All mutual fund shareholder reports will provide this information to help you make this comparison. Please note that you cannot use this information to estimate your actual ending account balance and expenses paid during the period.
| | | | | | |
| | Class A | Class B | Class C | Class M | Class R | Class Y |
|
| Expenses paid per $1,000*† | $4.94 | $8.70 | $8.70 | $6.19 | $6.19 | $3.68 |
|
| Ending value (after expenses) | $1,020.04 | $1,016.31 | $1,016.31 | $1,018.80 | $1,018.80 | $1,021.29 |
|
* Expenses for each share class are calculated using the fund’s annualized expense ratio for each class, which represents the ongoing expenses as a percentage of average net assets for the six months ended 3/31/11. The expense ratio may differ for each share class.
† Expenses are calculated by multiplying the expense ratio by the average account value for the period; then multiplying the result by the number of days in the period; and then dividing that result by the number of days in the year.
14
Terms and definitions
Important terms
Total return shows how the value of the fund’s shares changed over time, assuming you held the shares through the entire period and reinvested all distributions in the fund.
Net asset value (NAV) is the price, or value, of one share of a mutual fund, without a sales charge. NAVs fluctuate with market conditions. NAV is calculated by dividing the net assets of each class of shares by the number of outstanding shares in the class.
Public offering price (POP) is the price of a mutual fund share plus the maximum sales charge levied at the time of purchase. POP performance figures shown here assume the 4.00% maximum sales charge for class A shares and 3.25% for class M shares.
Contingent deferred sales charge (CDSC) is generally a charge applied at the time of the redemption of class B or C shares and assumes redemption at the end of the period. Your fund’s class B CDSC declines over time from a 5% maximum during the first year to 1% during the sixth year. After the sixth year, the CDSC no longer applies. The CDSC for class C shares is 1% for one year after purchase.
Current yield is the annual rate of return earned from dividends or interest of an investment. Current yield is expressed as a percentage of the price of a security, fund share, or principal investment.
Share classes
Class A shares are generally subject to an initial sales charge and no CDSC (except on certain redemptions of shares bought without an initial sales charge).
Class B shares are not subject to an initial sales charge. They may be subject to a CDSC.
Class C shares are not subject to an initial sales charge and are subject to a CDSC only if the shares are redeemed during the first year.
Class M shares have a lower initial sales charge and a higher 12b-1 fee than class A shares and no CDSC (except on certain redemptions of shares bought without an initial sales charge).
Class R shares are not subject to an initial sales charge or CDSC and are available only to certain defined contribution plans.
Class Y shares are not subject to an initial sales charge or CDSC, and carry no 12b-1 fee. They are generally only available to corporate and institutional clients and clients in other approved programs.
Comparative indexes
Barclays Capital U.S. Aggregate Bond Index is an unmanaged index of U.S. investment-grade fixed-income securities.
BofA (Bank of America) Merrill Lynch U.S. 3-Month Treasury Bill Index is an unmanaged index that seeks to measure the performance of U.S. Treasury bills available in the marketplace.
Citigroup Non-U.S. World Government Bond Index is an unmanaged index generally considered to be representative of the world bond market excluding the United States.
JPMorgan Developed High Yield Index is an unmanaged index of high-yield fixed-income securities issued in developed countries.
S&P 500 Index is an unmanaged index of common stock performance.
Indexes assume reinvestment of all distributions and do not account for fees. Securities and performance of a fund and an index will differ. You cannot invest directly in an index.
Lipper is a third-party industry-ranking entity that ranks mutual funds. Its rankings do not reflect sales charges. Lipper rankings are based on total return at net asset value relative to other funds that have similar current investment styles or objectives as determined by Lipper. Lipper may change a fund’s category assignment at its discretion. Lipper category averages reflect performance trends for funds within a category.
15
Other information for shareholders
Important notice regarding delivery of shareholder documents
In accordance with SEC regulations, Putnam sends a single copy of annual and semiannual shareholder reports, prospectuses, and proxy statements to Putnam shareholders who share the same address, unless a shareholder requests otherwise. If you prefer to receive your own copy of these documents, please call Putnam at 1-800-225-1581, and Putnam will begin sending individual copies within 30 days.
Proxy voting
Putnam is committed to managing our mutual funds in the best interests of our shareholders. The Putnam funds’ proxy voting guidelines and procedures, as well as information regarding how your fund voted proxies relating to portfolio securities during the 12-month period ended June 30, 2010, are available in the Individual Investors section of putnam.com, and on the SEC’s website, www.sec.gov. If you have questions about finding forms on the SEC’s website, you may call the SEC at 1-800-SEC-0330. You may also obtain the Putnam funds’ proxy voting guidelines and procedures at no charge by calling Putnam’s Shareholder Services at 1-800-225-1581.
Fund portfolio holdings
The fund will file a complete schedule of its portfolio holdings with the SEC for the first and third quarters of each fiscal year on Form N-Q. Shareholders may obtain the fund’s Forms N-Q on the SEC’s website at www.sec.gov. In addition, the fund’s Forms N-Q may be reviewed and copied at the SEC’s Public Reference Room in Washington, D.C. You may call the SEC at 1-800-SEC-0330 for information about the SEC’s website or the operation of the Public Reference Room.
Trustee and employee fund ownership
Putnam employees and members of the Board of Trustees place their faith, confidence, and, most importantly, investment dollars in Putnam mutual funds. As of March 31, 2011, Putnam employees had approximately $376,000,000 and the Trustees had approximately $69,000,000 invested in Putnam mutual funds. These amounts include investments by the Trustees’ and employees’ immediate family members as well as investments through retirement and deferred compensation plans.
16
Financial statements
A guide to financial statements
These sections of the report, as well as the accompanying Notes, constitute the fund’s financial statements.
The fund’s portfolio lists all the fund’s investments and their values as of the last day of the reporting period. Holdings are organized by asset type and industry sector, country, or state to show areas of concentration and diversification.
Statement of assets and liabilities shows how the fund’s net assets and share price are determined. All investment and non-investment assets are added together. Any unpaid expenses and other liabilities are subtracted from this total. The result is divided by the number of shares to determine the net asset value per share, which is calculated separately for each class of shares. (For funds with preferred shares, the amount subtracted from total assets includes the liquidation preference of preferred shares.)
Statement of operations shows the fund’s net investment gain or loss. This is done by first adding up all the fund’s earnings — from dividends and interest income — and subtracting its operating expenses to determine net investment income (or loss). Then, any net gain or loss the fund realized on the sales of its holdings — as well as any unrealized gains or losses over the period — is added to or subtracted from the net investment result to determine the fund’s net gain or loss for the fiscal period.
Statement of changes in net assets shows how the fund’s net assets were affected by the fund’s net investment gain or loss, by distributions to shareholders, and by changes in the number of the fund’s shares. It lists distributions and their sources (net investment income or realized capital gains) over the current reporting period and the most recent fiscal year-end. The distributions listed here may not match the sources listed in the Statement of operations because the distributions are determined on a tax basis and may be paid in a different period from the one in which they were earned. Dividend sources are estimated at the time of declaration. Actual results may vary. Any non-taxable return of capital cannot be determined until final tax calculations are completed after the end of the fund’s fiscal year.
Financial highlights provide an overview of the fund’s investment results, per-share distributions, expense ratios, net investment income ratios, and portfolio turnover in one summary table, reflecting the five most recent reporting periods. In a semiannual report, the highlights table also includes the current reporting period.
17
The fund’s portfolio 3/31/11 (Unaudited)
| | | |
| CORPORATE BONDS AND NOTES (29.0%)* | Principal amount | Value |
|
| Basic materials (2.2%) | | | |
| Associated Materials, LLC 144A company guaranty sr. notes | | | |
| 9 1/8s, 2017 | | $3,183,000 | $3,405,810 |
|
| Atkore International, Inc. 144A sr. notes 9 7/8s, 2018 | | 3,317,000 | 3,540,898 |
|
| Celanese US Holdings, LLC 144A company guaranty sr. notes | | | |
| 6 5/8s, 2018 (Germany) | | 2,505,000 | 2,580,150 |
|
| Chemtura Corp. 144A company guaranty sr. unsec. notes | | | |
| 7 7/8s, 2018 | | 917,000 | 969,728 |
|
| Clondalkin Acquisition BV 144A company guaranty sr. notes | | | |
| FRN 2.31s, 2013 (Netherlands) | | 989,000 | 949,440 |
|
| Compass Minerals International, Inc. company guaranty sr. unsec. | | | |
| notes 8s, 2019 | | 135,000 | 147,150 |
|
| Ferro Corp. sr. unsec. notes 7 7/8s, 2018 | | 4,485,000 | 4,754,100 |
|
| FMG Resources August 2006 Pty, Ltd. 144A sr. notes 7s, 2015 | | | |
| (Australia) | | 3,548,000 | 3,659,896 |
|
| FMG Resources August 2006 Pty, Ltd. 144A sr. notes 6 7/8s, | | | |
| 2018 (Australia) | | 2,935,000 | 3,052,335 |
|
| Georgia-Pacific, LLC 144A company guaranty 7 1/8s, 2017 | | 2,315,000 | 2,456,794 |
|
| Georgia-Pacific, LLC sr. unsec. unsub. notes 8 1/8s, 2011 | | 230,000 | 231,438 |
|
| Graphic Packaging International, Inc. company guaranty sr. | | | |
| unsec. notes 7 7/8s, 2018 | | 966,000 | 1,033,620 |
|
| Hexion U.S. Finance Corp./Hexion Nova Scotia Finance, ULC | | | |
| company guaranty sr. notes 8 7/8s, 2018 | | 1,725,000 | 1,824,188 |
|
| Hexion U.S. Finance Corp./Hexion Nova Scotia Finance, ULC | | | |
| 144A sr. notes 9s, 2020 | | 2,229,000 | 2,311,194 |
|
| Huntsman International, LLC company guaranty sr. unsec. sub. | | | |
| notes 8 5/8s, 2020 | | 1,700,000 | 1,853,000 |
|
| Huntsman International, LLC 144A company guaranty sr. unsec. | | | |
| sub. notes 8 5/8s, 2021 | | 2,290,000 | 2,496,100 |
|
| Ineos Finance PLC 144A company guaranty sr. notes 9 1/4s, | | | |
| 2015 (United Kingdom) | EUR | 1,150,000 | 1,772,913 |
|
| Ineos Finance PLC 144A company guaranty sr. notes 9s, 2015 | | | |
| (United Kingdom) | | $2,425,000 | 2,655,375 |
|
| Ineos Group Holdings PLC company guaranty sr. unsec. | | | |
| notes Ser. REGS, 7 7/8s, 2016 (United Kingdom) | EUR | 1,938,000 | 2,687,686 |
|
| JMC Steel Group 144A sr. notes 8 1/4s, 2018 | | $945,000 | 966,263 |
|
| KRATON Polymers, LLC/KRATON Polymers Capital Corp. 144A | | | |
| sr. notes 6 3/4s, 2019 | | 830,000 | 842,450 |
|
| Kronos International, Inc. sr. notes 6 1/2s, 2013 (Germany) | EUR | 3,677,600 | 5,230,679 |
|
| Lyondell Chemical Co. sr. notes 11s, 2018 | | $10,015,000 | 11,241,838 |
|
| Lyondell Chemical Co. 144A company guaranty sr. notes | | | |
| 8s, 2017 | | 5,298,000 | 5,841,045 |
|
| Momentive Performance Materials, Inc. company | | | |
| guaranty sr. notes 12 1/2s, 2014 | | 2,360,000 | 2,619,600 |
|
| Momentive Performance Materials, Inc. 144A notes 9s, 2021 | | 3,930,000 | 4,062,638 |
|
| Nalco Co. 144A sr. notes 6 5/8s, 2019 | | 905,000 | 931,019 |
|
| NewPage Corp. company guaranty sr. notes 11 3/8s, 2014 | | 1,158,000 | 1,159,448 |
|
| Nexeo Solutions, LLC/Nexeo Solutions Finance Corp. 144A | | | |
| sr. sub. notes 8 3/8s, 2018 | | 835,000 | 851,700 |
|
18
| | | |
| CORPORATE BONDS AND NOTES (29.0%)* cont. | Principal amount | Value |
|
| Basic materials cont. | | | |
| Novelis, Inc. company guaranty sr. unsec. notes 7 1/4s, 2015 | | $2,471,000 | $2,520,420 |
|
| Novelis, Inc. 144A company guaranty sr. notes 8 3/4s, 2020 | | 4,425,000 | 4,867,500 |
|
| Omnova Solutions, Inc. 144A company | | | |
| guaranty sr. notes 7 7/8s, 2018 | | 2,433,000 | 2,463,413 |
|
| PE Paper Escrow GmbH sr. notes Ser. REGS, 11 3/4s, 2014 | | | |
| (Austria) | EUR | 3,742,000 | 6,052,821 |
|
| PE Paper Escrow GmbH 144A sr. notes 12s, 2014 (Austria) | | $2,140,000 | 2,461,000 |
|
| Rhodia SA 144A sr. notes 6 7/8s, 2020 (France) | | 900,000 | 916,875 |
|
| Rockwood Specialties Group, Inc. company | | | |
| guaranty sr. unsec. sub. notes 7 5/8s, 2014 | EUR | 465,000 | 673,365 |
|
| SGL Carbon SE company guaranty sr. sub. notes FRN | | | |
| Ser. EMTN, 2.343s, 2015 (Germany) | EUR | 1,050,000 | 1,465,123 |
|
| Smurfit Kappa Funding PLC sr. unsec. sub. notes 7 3/4s, | | | |
| 2015 (Ireland) | | $569,000 | 581,803 |
|
| Solutia, Inc. company guaranty sr. unsec. notes 8 3/4s, 2017 | | 1,710,000 | 1,881,000 |
|
| Solutia, Inc. company guaranty sr. unsec. notes 7 7/8s, 2020 | | 2,445,000 | 2,646,713 |
|
| Steel Dynamics, Inc. company guaranty sr. unsec. | | | |
| unsub. notes 7 3/8s, 2012 | | 989,000 | 1,053,285 |
|
| Steel Dynamics, Inc. sr. unsec. unsub. notes 7 3/4s, 2016 | | 2,451,000 | 2,591,933 |
|
| Teck Resources Limited sr. notes 10 3/4s, 2019 (Canada) | | 4,212,000 | 5,378,724 |
|
| Teck Resources Limited sr. notes 10 1/4s, 2016 (Canada) | | 1,000 | 1,203 |
|
| TPC Group, LLC 144A sr. notes 8 1/4s, 2017 | | 2,370,000 | 2,506,275 |
|
| Tube City IMS Corp. company guaranty sr. unsec. | | | |
| sub. notes 9 3/4s, 2015 | | 575,000 | 600,875 |
|
| USG Corp. 144A company guaranty sr. notes 8 3/8s, 2018 | | 895,000 | 935,275 |
|
| Vartellus Specialties, Inc. 144A company | | | |
| guaranty sr. notes 9 3/8s, 2015 | | 1,145,000 | 1,225,150 |
|
| Verso Paper Holdings, LLC/Verso Paper, Inc. company | | | |
| guaranty Ser. B, 11 3/8s, 2016 | | 1,035,000 | 1,097,100 |
|
| Verso Paper Holdings, LLC/Verso Paper, Inc. | | | |
| sr. notes 11 1/2s, 2014 | | 3,408,000 | 3,723,240 |
|
| Verso Paper Holdings, LLC/Verso Paper, Inc. 144A | | | |
| sr. notes 8 3/4s, 2019 | | 1,100,000 | 1,144,000 |
|
| | | | 122,915,588 |
| Capital goods (1.4%) | | | |
| Acquisition Co., Lanza Parent 144A sr. notes 10s, 2017 | | 3,155,000 | 3,478,388 |
|
| Alliant Techsystems, Inc. company guaranty sr. unsec. | | | |
| sub. notes 6 7/8s, 2020 | | 2,860,000 | 2,988,700 |
|
| Alliant Techsystems, Inc. sr. sub. notes 6 3/4s, 2016 | | 2,229,000 | 2,287,511 |
|
| Allison Transmission, Inc. 144A company guaranty sr. unsec. | | | |
| notes 11 1/4s, 2015 ‡‡ | | 3,717,440 | 4,038,069 |
|
| Altra Holdings, Inc. company guaranty sr. notes 8 1/8s, 2016 | | 3,995,000 | 4,284,638 |
|
| Ardagh Packaging Finance PLC sr. notes Ser. REGS, 7 3/8s, | | | |
| 2017 (Ireland) | EUR | 500,000 | 724,240 |
|
| Ardagh Packaging Finance PLC 144A company | | | |
| guaranty sr. notes 7 3/8s, 2017 (Ireland) | EUR | 685,000 | 1,007,441 |
|
| BE Aerospace, Inc. sr. unsec. unsub. notes 6 7/8s, 2020 | | $1,645,000 | 1,700,519 |
|
| Berry Plastics Corp. company guaranty sr. notes 9 1/2s, 2018 | | 1,347,000 | 1,340,265 |
|
| Berry Plastics Corp. 144A sr. notes 9 3/4s, 2021 | | 1,542,000 | 1,526,580 |
|
19
| | | |
| CORPORATE BONDS AND NOTES (29.0%)* cont. | Principal amount | Value |
|
| Capital goods cont. | | | |
| Berry Plastics Holding Corp. company guaranty notes FRN | | | |
| 4.185s, 2014 | | $1,565,000 | $1,473,056 |
|
| Briggs & Stratton Corp. company guaranty sr. unsec. | | | |
| notes 6 7/8s, 2020 | | 2,050,000 | 2,147,375 |
|
| Crown Americas, LLC/Crown Americas Capital Corp. III 144A | | | |
| sr. notes 6 1/4s, 2021 | | 1,835,000 | 1,867,113 |
|
| Crown European Holdings SA 144A sr. notes 7 1/8s, 2018 | | | |
| (France) | EUR | 475,000 | 699,205 |
|
| Exide Technologies 144A sr. notes 8 5/8s, 2018 | | $1,240,000 | 1,323,700 |
|
| Griffon Corp. 144A company guaranty sr. unsec. | | | |
| notes 7 1/8s, 2018 | | 955,000 | 971,713 |
|
| Kratos Defense & Security Solutions, Inc. company | | | |
| guaranty sr. notes 10s, 2017 | | 1,710,000 | 1,885,275 |
|
| Legrand SA unsec. unsub. debs. 8 1/2s, 2025 (France) | | 2,734,000 | 3,241,012 |
|
| Mueller Water Products, Inc. company guaranty sr. unsec. | | | |
| unsub. notes 8 3/4s, 2020 | | 1,335,000 | 1,485,188 |
|
| Polypore International, Inc. 144A sr. notes 7 1/2s, 2017 | | 1,445,000 | 1,517,250 |
|
| Pregis Corp. company guaranty sr. sub. notes 12 3/8s, 2013 | | 1,470,000 | 1,449,788 |
|
| Rexam PLC unsec. sub. bonds FRB 6 3/4s, 2067 | | | |
| (United Kingdom) | EUR | 1,430,000 | 1,971,843 |
|
| Rexel SA company guaranty sr. unsec. notes 8 1/4s, 2016 | | | |
| (France) | EUR | 3,217,000 | 4,947,698 |
|
| Reynolds Group DL Escrow, Inc./Reynolds Group Escrow, LLC | | | |
| 144A company guaranty sr. notes 7 3/4s, 2016 (Luxembourg) | | $1,410,000 | 1,491,075 |
|
| Reynolds Group DL Escrow, Inc./Reynolds Group Escrow, LLC | | | |
| 144A sr. notes 7 3/4s, 2016 (Luxembourg) | EUR | 2,660,000 | 3,922,269 |
|
| Reynolds Group Issuer, Inc. 144A sr. notes 9s, 2019 | | $4,375,000 | 4,528,125 |
|
| Reynolds Group Issuer, Inc. 144A sr. notes 7 1/8s, 2019 | | 1,600,000 | 1,640,000 |
|
| Reynolds Group Issuer, Inc. 144A sr. notes 6 7/8s, 2021 | | | |
| (New Zealand) | | 465,000 | 468,488 |
|
| Reynolds Group Issuer, Inc. 144A sr. unsec. notes 8 1/4s, | | | |
| 2021 (New Zealand) | | 680,000 | 673,200 |
|
| Ryerson, Inc. company guaranty sr. notes 12s, 2015 | | 3,661,000 | 3,972,185 |
|
| Tenneco, Inc. company guaranty sr. unsec. | | | |
| unsub. notes 7 3/4s, 2018 | | 820,000 | 875,350 |
|
| Tenneco, Inc. company guaranty sr. unsub. notes 6 7/8s, 2020 | | 1,830,000 | 1,894,050 |
|
| Terex Corp. sr. unsec. sub. notes 8s, 2017 | | 808,000 | 851,430 |
|
| Thermadyne Holdings Corp. 144A sr. notes 9s, 2017 | | 3,130,000 | 3,306,063 |
|
| Thermon Industries, Inc. company guaranty sr. notes 9 1/2s, 2017 | | 2,987,000 | 3,225,960 |
|
| TransDigm, Inc. 144A sr. sub. notes 7 3/4s, 2018 | | 2,805,000 | 3,011,869 |
|
| | | | 78,216,631 |
| Communication services (3.3%) | | | |
| Bresnan Broadband Holdings, LLC 144A company | | | |
| guaranty sr. unsec. unsub. notes 8s, 2018 | | 940,000 | 996,400 |
|
| CCH II, LLC/CCH II Capital company guaranty sr. unsec. | | | |
| notes 13 1/2s, 2016 | | 1,259,504 | 1,508,256 |
|
| CCO Holdings, LLC/CCO Holdings Capital Corp. company | | | |
| guaranty sr. unsec. notes 7 7/8s, 2018 | | 2,450,000 | 2,603,125 |
|
20
| | | |
| CORPORATE BONDS AND NOTES (29.0%)* cont. | Principal amount | Value |
|
| Communication services cont. | | | |
| CCO Holdings, LLC/CCO Holdings Capital Corp. company | | | |
| guaranty sr. unsub. notes 7s, 2019 | | $2,815,000 | $2,878,338 |
|
| Cequel Communications Holdings I LLC/Cequel Capital Corp. | | | |
| 144A sr. notes 8 5/8s, 2017 | | 5,806,000 | 6,052,755 |
|
| Cincinnati Bell, Inc. company guaranty sr. unsec. notes | | | |
| 7s, 2015 | | 804,000 | 814,050 |
|
| Cincinnati Bell, Inc. company guaranty sr. unsec. | | | |
| sub. notes 8 3/4s, 2018 | | 1,740,000 | 1,644,300 |
|
| Cincinnati Bell, Inc. company guaranty sr. unsec. | | | |
| sub. notes 8 1/4s, 2017 | | 1,250,000 | 1,259,375 |
|
| Clearwire Communications, LLC/Clearwire Finance, Inc. 144A | | | |
| company guaranty sr. notes 12s, 2015 | | 8,410,000 | 9,082,800 |
|
| CPI International Acquisition, Inc. 144A sr. notes 8s, 2018 | | 705,000 | 709,406 |
|
| Cricket Communications, Inc. company guaranty sr. unsec. | | | |
| notes 7 3/4s, 2020 | | 3,625,000 | 3,652,188 |
|
| Cricket Communications, Inc. company guaranty sr. unsec. | | | |
| unsub. notes 10s, 2015 | | 2,065,000 | 2,266,338 |
|
| Cricket Communications, Inc. company | | | |
| guaranty sr. unsub. notes 7 3/4s, 2016 | | 4,740,000 | 5,036,250 |
|
| Crown Castle International Corp. sr. unsec. notes 7 1/8s, 2019 | | 950,000 | 995,125 |
|
| CSC Holdings LLC sr. notes 6 3/4s, 2012 | | 364,000 | 377,650 |
|
| CSC Holdings LLC sr. unsec. unsub. notes 8 1/2s, 2014 | | 5,803,000 | 6,506,614 |
|
| Digicel Group, Ltd. 144A sr. notes 8 1/4s, 2017 (Jamaica) | | 4,769,000 | 5,055,140 |
|
| Frontier Communications Corp. sr. unsec. notes 8 1/4s, 2017 | | 2,405,000 | 2,597,400 |
|
| Frontier Communications Corp. sr. unsec. notes 8 1/8s, 2018 | | 5,296,000 | 5,713,060 |
|
| Inmarsat Finance PLC 144A company | | | |
| guaranty sr. notes 7 3/8s, 2017 (United Kingdom) | | 2,005,000 | 2,115,275 |
|
| Intelsat Jackson Holdings SA 144A company | | | |
| guaranty sr. notes 7 1/2s, 2021 (Bermuda) ∆ | | 2,960,000 | 2,967,400 |
|
| Intelsat Jackson Holdings SA 144A sr. unsec. notes 7 1/4s, | | | |
| 2020 (Bermuda) | | 2,660,000 | 2,660,000 |
|
| Intelsat Luxembourg SA company guaranty sr. unsec. | | | |
| notes 11 1/2s, 2017 (Luxembourg) ‡‡ | | 10,735,093 | 11,781,765 |
|
| Intelsat Luxembourg SA company guaranty sr. unsec. | | | |
| notes 11 1/4s, 2017 (Luxembourg) | | 2,801,000 | 3,060,093 |
|
| Kabel BW Erste Beteiligungs GmbH/Kabel Baden-Wurttemberg | | | |
| GmbH & Co. KG 144A company guaranty sr. notes 7 1/2s, 2019 | | | |
| (Germany) ∆ | EUR | 1,855,000 | 2,661,746 |
|
| Level 3 Financing, Inc. company guaranty sr. unsec. | | | |
| unsub. notes 9 1/4s, 2014 ∆ | | $4,179,000 | 4,273,028 |
|
| Level 3 Financing, Inc. 144A company guaranty sr. unsec. | | | |
| unsub. notes 9 3/8s, 2019 | | 1,699,000 | 1,643,783 |
|
| Mediacom LLC/Mediacom Capital Corp. sr. unsec. | | | |
| notes 9 1/8s, 2019 | | 386,000 | 413,020 |
|
| MetroPCS Wireless, Inc. company guaranty sr. unsec. | | | |
| notes 7 7/8s, 2018 | | 6,804,000 | 7,280,280 |
|
| MetroPCS Wireless, Inc. company guaranty sr. unsec. | | | |
| notes 6 5/8s, 2020 | | 1,774,000 | 1,771,783 |
|
| Musketeer GmbH 144A company guaranty sr. notes 9 1/2s, 2021 | | | |
| (Germany) ∆ | EUR | 665,000 | 982,107 |
|
21
| | | |
| CORPORATE BONDS AND NOTES (29.0%)* cont. | Principal amount | Value |
|
| Communication services cont. | | | |
| NII Capital Corp. company guaranty sr. unsec. | | | |
| unsub. notes 10s, 2016 | | $4,595,000 | $5,238,300 |
|
| NII Capital Corp. company guaranty sr. unsec. | | | |
| unsub. notes 7 5/8s, 2021 | | 900,000 | 920,250 |
|
| PAETEC Escrow Corp. 144A sr. unsec. notes 9 7/8s, 2018 | | 4,202,000 | 4,433,110 |
|
| PAETEC Holding Corp. company guaranty sr. notes 8 7/8s, 2017 | | 3,406,000 | 3,669,965 |
|
| PAETEC Holding Corp. company guaranty sr. unsec. | | | |
| unsub. notes 9 1/2s, 2015 | | 2,195,000 | 2,299,263 |
|
| Phones4U Finance PLC 144A sr. notes 9 1/2s, 2018 | | | |
| (United Kingdom) | GBP | 2,520,000 | 3,963,611 |
|
| Qwest Communications International, Inc. company | | | |
| guaranty 7 1/2s, 2014 | | $1,530,000 | 1,554,863 |
|
| Qwest Communications International, Inc. company | | | |
| guaranty Ser. B, 7 1/2s, 2014 | | 2,400,000 | 2,439,000 |
|
| Qwest Corp. sr. unsec. notes 7 1/2s, 2014 | | 610,000 | 696,925 |
|
| Qwest Corp. sr. unsec. unsub. notes 8 7/8s, 2012 | | 2,497,000 | 2,671,790 |
|
| Qwest Corp. sr. unsec. unsub. notes 7 1/4s, 2025 | | 1,375,000 | 1,464,375 |
|
| SBA Telecommunications, Inc. company guaranty sr. unsec. | | | |
| notes 8 1/4s, 2019 | | 3,850,000 | 4,254,250 |
|
| SBA Telecommunications, Inc. company guaranty sr. unsec. | | | |
| notes 8s, 2016 | | 1,130,000 | 1,230,288 |
|
| Sprint Capital Corp. company guaranty 6 7/8s, 2028 | | 3,610,000 | 3,330,225 |
|
| Sprint Capital Corp. company guaranty sr. unsec. | | | |
| notes 8 3/8s, 2012 | | 2,495,000 | 2,632,225 |
|
| Sprint Nextel Corp. sr. notes 8 3/8s, 2017 | | 9,600,000 | 10,692,000 |
|
| Sprint Nextel Corp. sr. unsec. notes 6s, 2016 | | 3,527,000 | 3,540,226 |
|
| Sunrise Communications Holdings SA 144A company | | | |
| guaranty sr. notes 8 1/2s, 2018 (Luxembourg) | EUR | 730,000 | 1,099,913 |
|
| Sunrise Communications International SA 144A company | | | |
| guaranty sr. notes 7s, 2017 (Luxembourg) | EUR | 495,000 | 733,600 |
|
| Sunrise Communications International SA 144A company | | | |
| guaranty sr. notes 7s, 2017 (Luxembourg) | CHF | 540,000 | 621,706 |
|
| Unitymedia GmbH company guaranty sr. notes Ser. REGS, | | | |
| 9 5/8s, 2019 (Germany) | EUR | 2,398,000 | 3,733,242 |
|
| Unitymedia Hessen/NRW 144A company | | | |
| guaranty sr. notes 8 1/8s, 2017 (Germany) | EUR | 1,624,000 | 2,430,071 |
|
| UPC Holdings BV sr. notes 9 3/4s, 2018 (Netherlands) | EUR | 1,990,000 | 3,057,652 |
|
| Virgin Media Finance PLC company guaranty sr. unsec. bond | | | |
| 8 7/8s, 2019 (United Kingdom) | GBP | 242,000 | 433,909 |
|
| Wind Acquisition Finance SA 144A company | | | |
| guaranty sr. notes 7 3/8s, 2018 (Netherlands) | EUR | 4,110,000 | 6,081,943 |
|
| Wind Acquisition Holding company | | | |
| guaranty sr. notes Ser. REGS, 12 1/4s, 2017 | | | |
| (Luxembourg) ‡‡ | EUR | 173,639 | 292,728 |
|
| Windstream Corp. company guaranty sr. unsec. | | | |
| unsub. notes 8 1/8s, 2018 | | $710,000 | 757,925 |
|
| Windstream Corp. company guaranty sr. unsec. | | | |
| unsub. notes 7 7/8s, 2017 | | 2,884,000 | 3,093,090 |
|
| Windstream Corp. 144A company guaranty sr. unsec. | | | |
| unsub. notes 7 3/4s, 2021 | | 1,895,000 | 1,925,794 |
|
| | | | 180,651,089 |
22
| | |
| CORPORATE BONDS AND NOTES (29.0%)* cont. | Principal amount | Value |
|
| Conglomerates (—%) | | |
| SPX Corp. sr. unsec. notes 7 5/8s, 2014 | $1,096,000 | $1,206,970 |
|
| SPX Corp. 144A company guaranty sr. unsec. notes 6 7/8s, | | |
| 2017 | 750,000 | 806,250 |
|
| | | 2,013,220 |
| Consumer cyclicals (4.8%) | | |
| Affinion Group, Inc. 144A sr. notes 10 3/4s, 2016 | 1,126,000 | 1,279,418 |
|
| Affinion Group, Inc. company guaranty sr. unsec. | | |
| sub. notes 11 1/2s, 2015 | 1,615,000 | 1,703,825 |
|
| Affinion Group, Inc. 144A sr. notes 7 7/8s, 2018 | 6,155,000 | 5,785,700 |
|
| AMC Entertainment, Inc. 144A | | |
| sr. sub. notes 9 3/4s, 2020 | 3,750,000 | 4,012,500 |
|
| AMC Entertainment, Inc. sr. sub. notes 8s, 2014 | 1,998,000 | 2,020,478 |
|
| American Axle & Manufacturing, Inc. company | | |
| guaranty sr. unsec. notes 5 1/4s, 2014 | 2,955,000 | 2,955,000 |
|
| American Casino & Entertainment Properties LLC | | |
| sr. notes 11s, 2014 ∆ | 1,244,000 | 1,323,305 |
|
| Ameristar Casinos, Inc. 144A sr. notes 7 1/2s, 2021 ∆ | 2,390,000 | 2,369,088 |
|
| Autonation, Inc. company guaranty sr. unsec. notes 6 3/4s, 2018 | 2,870,000 | 3,002,738 |
|
| Beazer Homes USA, Inc. 144A sr. notes 9 1/8s, 2019 | 1,445,000 | 1,461,256 |
|
| Bon-Ton Department Stores, Inc. (The) company | | |
| guaranty 10 1/4s, 2014 | 3,635,000 | 3,725,875 |
|
| Boyd Gaming Corp. 144A sr. notes 9 1/8s, 2018 | 600,000 | 619,500 |
|
| Brickman Group Holdings, Inc. 144A sr. notes 9 1/8s, 2018 | 793,000 | 850,493 |
|
| Building Materials Corp. 144A company | | |
| guaranty sr. notes 7 1/2s, 2020 | 1,185,000 | 1,229,438 |
|
| Building Materials Corp. 144A sr. notes 7s, 2020 | 2,425,000 | 2,515,938 |
|
| Building Materials Corp. 144A sr. notes 6 7/8s, 2018 | 830,000 | 848,675 |
|
| Burlington Coat Factory Warehouse Corp. 144A company | | |
| guaranty sr. unsec. notes 10s, 2019 | 1,865,000 | 1,809,050 |
|
| Caesars Entertainment Operating Co., Inc. company guaranty | | |
| sr. notes 10s, 2018 | 4,960,000 | 4,526,000 |
|
| Caesars Entertainment Operating Co., Inc. sr. notes 11 1/4s, 2017 | 5,125,000 | 5,823,281 |
|
| Cedar Fair LP/Canada’s Wonderland Co./Magnum | | |
| Management Corp. 144A company guaranty sr. unsec. | | |
| notes 9 1/8s, 2018 | 855,000 | 927,675 |
|
| Cengage Learning Acquisitions, Inc. 144A sr. notes 10 1/2s,2015 | 1,400,000 | 1,428,000 |
|
| Cenveo Corp. company guaranty sr. notes 8 7/8s, 2018 | 1,500,000 | 1,503,750 |
|
| Cenveo Corp. 144A company guaranty sr. unsec. | | |
| notes 10 1/2s, 2016 | 590,000 | 592,950 |
|
| Citadel Broadcasting Corp. 144A company guaranty sr. unsec. | | |
| notes 7 3/4s, 2018 | 740,000 | 801,975 |
|
| CityCenter Holdings LLC/CityCenter Finance Corp. 144A | | |
| company guaranty sr. notes 10 3/4s, 2017 ‡‡ | 2,620,000 | 2,705,150 |
|
| Clear Channel Communications, Inc. company guaranty unsec. | | |
| unsub. notes 10 3/4s, 2016 | 606,000 | 577,215 |
|
| Clear Channel Communications, Inc. 144A company | | |
| guaranty sr. notes 9s, 2021 | 5,324,000 | 5,310,690 |
|
| Clear Channel Worldwide Holdings, Inc. company | | |
| guaranty sr. unsec. unsub. notes Ser. B, 9 1/4s, 2017 | 6,329,000 | 6,938,166 |
|
| Compucom Systems, Inc. 144A sr. sub. notes 12 1/2s, 2015 | 685,000 | 740,656 |
|
23
| | | |
| CORPORATE BONDS AND NOTES (29.0%)* cont. | Principal amount | Value |
|
| Consumer cyclicals cont. | | | |
| Dana Holding Corp. sr. unsec. notes 6 3/4s, 2021 | | $1,315,000 | $1,315,000 |
|
| DIRECTV Holdings, LLC/DIRECTV Financing Co., Inc. company | | | |
| guaranty sr. unsec. notes 7 5/8s, 2016 | | 588,000 | 648,270 |
|
| DISH DBS Corp. company guaranty 7 1/8s, 2016 | | 2,345,000 | 2,503,288 |
|
| DISH DBS Corp. company guaranty 6 5/8s, 2014 | | 6,614,000 | 7,002,573 |
|
| DR Horton, Inc. sr. notes 7 7/8s, 2011 | | 140,000 | 142,100 |
|
| FelCor Lodging LP company guaranty sr. notes 10s, 2014 R | | 4,495,000 | 5,135,538 |
|
| Ford Motor Credit Co., LLC sr. unsec. unsub. notes 5 3/4s, 2021 | | 2,635,000 | 2,602,057 |
|
| Goodyear Tire & Rubber Co. (The) sr. unsec. notes 10 1/2s, 2016 | | 3,667,000 | 4,107,040 |
|
| Gray Television, Inc. company guaranty sr. notes 10 1/2s, 2015 | | 1,000,000 | 1,063,750 |
|
| Grupo Televisa SA sr. unsec. bonds 6 5/8s, 2040 (Mexico) | | 900,000 | 953,575 |
|
| Grupo Televisa SA sr. unsec. notes 6s, 2018 (Mexico) | | 1,410,000 | 1,537,953 |
|
| Gymboree Corp. 144A sr. unsec. notes 9 1/8s, 2018 | | 1,090,000 | 1,057,300 |
|
| Hanesbrands, Inc. company guaranty sr. unsec. notes 6 3/8s, 2020 | | 2,197,000 | 2,142,075 |
|
| Hanesbrands, Inc. sr. unsec. notes 8s, 2016 | | 970,000 | 1,051,238 |
|
| Host Hotels & Resorts LP company guaranty sr. unsec. | | | |
| unsub. notes Ser. Q, 6 3/4s, 2016 R | | 2,400,000 | 2,475,000 |
|
| Interactive Data Corp. 144A company | | | |
| guaranty sr. notes 10 1/4s, 2018 | | 7,265,000 | 8,154,963 |
|
| Isle of Capri Casinos, Inc. company guaranty 7s, 2014 | | 1,780,000 | 1,766,650 |
|
| Isle of Capri Casinos, Inc. 144A company guaranty sr. unsec. notes | | | |
| 7 3/4s, 2019 | | 2,425,000 | 2,412,875 |
|
| ISS Holdings A/S sr. sub. notes Ser. REGS, 8 7/8s, 2016 | | | |
| (Denmark) | EUR | 807,000 | 1,196,048 |
|
| Jarden Corp. company guaranty sr. sub. notes Ser. 1, | | | |
| 7 1/2s, 2020 | EUR | 265,000 | 390,199 |
|
| Jarden Corp. company guaranty sr. unsec. sub. notes 7 1/2s, | | | |
| 2017 | | $3,760,000 | 4,013,800 |
|
| Lamar Media Corp. company guaranty sr. notes 9 3/4s, 2014 | | 655,000 | 756,525 |
|
| Lear Corp. company guaranty sr. unsec. bonds 7 7/8s, 2018 | | 3,205,000 | 3,485,438 |
|
| Lear Corp. company guaranty sr. unsec. notes 8 1/8s, 2020 | | 2,960,000 | 3,256,000 |
|
| Lender Processing Services, Inc. company guaranty sr. unsec. | | | |
| unsub. notes 8 1/8s, 2016 | | 5,258,000 | 5,474,893 |
|
| Levi Strauss & Co. sr. unsec. notes 8 7/8s, 2016 | | 340,000 | 354,450 |
|
| Limited Brands, Inc. company guaranty sr. unsec. | | | |
| notes 6 5/8s, 2021 | | 2,175,000 | 2,218,500 |
|
| Lottomatica SpA sub. notes FRN Ser. REGS, 8 1/4s, 2066 | | | |
| (Italy) | EUR | 6,292,000 | 9,133,579 |
|
| M/I Homes, Inc. 144A sr. unsec. notes 8 5/8s, 2018 | | $1,000,000 | 1,000,000 |
|
| Macy’s Retail Holdings, Inc. company guaranty sr. unsec. | | | |
| notes 5.9s, 2016 | | 2,075,000 | 2,228,031 |
|
| Mashantucket Western Pequot Tribe 144A bonds 8 1/2s, | | | |
| 2015 (In default) † | | 1,765,000 | 176,500 |
|
| Michaels Stores, Inc. company guaranty 11 3/8s, 2016 | | 1,295,000 | 1,411,550 |
|
| MTR Gaming Group, Inc. company guaranty sr. notes 12 5/8s, 2014 | | 2,525,000 | 2,689,125 |
|
| Navistar International Corp. sr. notes 8 1/4s, 2021 | | 3,623,000 | 4,003,415 |
|
| Needle Merger Sub Corp. 144A sr. unsec. notes 8 1/8s, 2019 | | 1,890,000 | 1,908,900 |
|
| Neiman-Marcus Group, Inc. company guaranty sr. unsec. | | | |
| notes 9s, 2015 | | 1,092,000 | 1,141,140 |
|
24
| | | |
| CORPORATE BONDS AND NOTES (29.0%)* cont. | Principal amount | Value |
|
| Consumer cyclicals cont. | | | |
| Nielsen Finance, LLC/Nielsen Finance Co. 144A company | | | |
| guaranty sr. unsec. notes 7 3/4s, 2018 | | $1,790,000 | $1,919,775 |
|
| Nortek, Inc. company guaranty sr. notes 11s, 2013 | | 2,734,519 | 2,891,754 |
|
| Nortek, Inc. 144A company guaranty sr. unsec. notes 10s, 2018 | | 2,343,000 | 2,524,583 |
|
| Owens Corning company guaranty unsec. unsub. notes 9s, 2019 | | 5,347,000 | 6,309,460 |
|
| Penn National Gaming, Inc. sr. unsec. sub. notes 8 3/4s, 2019 | | 2,466,000 | 2,721,848 |
|
| Penske Automotive Group, Inc. company guaranty sr. unsec. | | | |
| sub. notes 7 3/4s, 2016 | | 1,713,000 | 1,770,814 |
|
| PETCO Animal Supplies, Inc. 144A company | | | |
| guaranty sr. notes 9 1/4s, 2018 | | 1,280,000 | 1,369,600 |
|
| PHH Corp. 144A sr. unsec. notes 9 1/4s, 2016 | | 1,085,000 | 1,179,938 |
|
| Pinnacle Entertainment, Inc. company guaranty sr. unsec. | | | |
| notes 8 5/8s, 2017 | | 2,900,000 | 3,161,000 |
|
| Pinnacle Entertainment, Inc. company guaranty sr. unsec. | | | |
| sub. notes 7 1/2s, 2015 | | 1,295,000 | 1,317,663 |
|
| Ply Gem Industries, Inc. 144A sr. notes 8 1/4s, 2018 | | 895,000 | 919,613 |
|
| Polish Television Holding BV sr. notes Ser. REGS, stepped-coupon | | | |
| 11 1/4s (13s, 11/15/14), 2017 (Netherlands) †† | EUR | 3,504,000 | 5,308,491 |
|
| Realogy Corp. 144A company guaranty sr. notes 7 7/8s, 2019 | | $695,000 | 689,788 |
|
| Realogy Corp. 144A company guaranty sr. unsec. | | | |
| notes 11 1/2s, 2017 | | 7,286,000 | 7,522,795 |
|
| Regal Entertainment Group company guaranty sr. unsec. | | | |
| notes 9 1/8s, 2018 | | 3,500,000 | 3,745,000 |
|
| Roofing Supply Group, LLC/Roofing Supply Finance, Inc. 144A | | | |
| sr. notes 8 5/8s, 2017 | | 4,133,000 | 4,349,983 |
|
| Sabre Holdings Corp. sr. unsec. unsub. notes 8.35s, 2016 | | 3,139,000 | 3,029,135 |
|
| Scotts Miracle-Gro Co. (The) 144A sr. notes 6 5/8s, 2020 | | 1,825,000 | 1,872,906 |
|
| Sealy Mattress Co. sr. sub. notes 8 1/4s, 2014 | | 525,000 | 530,250 |
|
| Sealy Mattress Co. 144A company guaranty sr. sec. | | | |
| notes 10 7/8s, 2016 | | 1,700,000 | 1,925,250 |
|
| Sears Holdings Corp. 144A sr. notes 6 5/8s, 2018 | | 1,678,000 | 1,627,660 |
|
| Sirius XM Radio, Inc. 144A sr. notes 9 3/4s, 2015 | | 3,403,000 | 3,832,629 |
|
| Standard Pacific Corp. company guaranty sr. unsec. | | | |
| unsub. notes 7s, 2015 | | 206,000 | 216,300 |
|
| Standard Pacific Corp. 144A company guaranty sr. unsec. | | | |
| notes 8 3/8s, 2021 | | 693,000 | 716,389 |
|
| Toys R Us, Inc. sr. unsec. unsub. notes 7 7/8s, 2013 | | 375,000 | 403,125 |
|
| Toys R Us — Delaware, Inc. 144A company | | | |
| guaranty sr. notes 7 3/8s, 2016 | | 505,000 | 534,038 |
|
| Toys R Us Property Co., LLC company | | | |
| guaranty sr. notes 8 1/2s, 2017 | | 2,265,000 | 2,434,875 |
|
| Toys R Us Property Co., LLC company guaranty sr. unsec. | | | |
| notes 10 3/4s, 2017 | | 4,385,000 | 4,976,975 |
|
| Travelport LLC company guaranty 11 7/8s, 2016 | | 2,830,000 | 2,638,975 |
|
| Travelport LLC company guaranty 9 7/8s, 2014 | | 958,000 | 932,853 |
|
| Travelport, LLC/Travelport, Inc. company | | | |
| guaranty sr. unsec. notes 9s, 2016 | | 2,520,000 | 2,340,450 |
|
| TRW Automotive, Inc. company guaranty sr. unsec. | | | |
| unsub. notes Ser. REGS, 6 3/8s, 2014 | EUR | 1,395,000 | 2,079,206 |
|
25
| | | |
| CORPORATE BONDS AND NOTES (29.0%)* cont. | Principal amount | Value |
|
| Consumer cyclicals cont. | | | |
| TRW Automotive, Inc. 144A company guaranty sr. notes | | | |
| 7 1/4s, 2017 | | $4,530,000 | $4,983,000 |
|
| TVN Finance Corp. III AB 144A company guaranty sr. unsec. | | | |
| notes 7 7/8s, 2018 (Sweden) | EUR | 270,000 | 388,440 |
|
| Universal City Development Partners, Ltd. company | | | |
| guaranty sr. unsec. notes 8 7/8s, 2015 | | $2,565,000 | 2,792,644 |
|
| Univision Communications, Inc. 144A company | | | |
| guaranty sr. unsec. notes 8 1/2s, 2021 | | 3,015,000 | 3,120,525 |
|
| Univision Communications, Inc. 144A sr. notes 7 7/8s, 2020 | | 2,324,000 | 2,457,630 |
|
| Visteon Corp. 144A sr. notes 6 3/4s, 2019 ∆ | | 1,910,000 | 1,910,000 |
|
| Wynn Las Vegas, LLC/Wynn Las Vegas Capital Corp. company | | | |
| guaranty mtge. notes 7 3/4s, 2020 | | 1,160,000 | 1,229,600 |
|
| XM Satellite Radio, Inc. 144A company guaranty sr. unsec. | | | |
| notes 13s, 2013 | | 1,831,000 | 2,174,313 |
|
| XM Satellite Radio, Inc. 144A sr. unsec. notes 7 5/8s, 2018 | | 3,182,000 | 3,357,010 |
|
| Yankee Candle Co. company guaranty sr. notes Ser. B, | | | |
| 8 1/2s, 2015 | | 1,680,000 | 1,743,000 |
|
| YCC Holdings, LLC/Yankee Finance, Inc. 144A sr. unsec. | | | |
| notes 10 1/4s, 2016 | | 3,955,000 | 3,984,663 |
|
| Yonkers Racing Corp. 144A sr. notes 11 3/8s, 2016 | | 2,428,000 | 2,701,150 |
|
| | | | 268,932,219 |
| Consumer staples (1.9%) | | | |
| Anheuser-Busch InBev Worldwide, Inc. company | | | |
| guaranty sr. unsec. notes 9 3/4s, 2015 | BRL | 16,800,000 | 10,184,852 |
|
| Archibald Candy Corp. company guaranty sub. notes 10s, | | | |
| 2011 (In default) † F | | $562,539 | 18,001 |
|
| Avis Budget Car Rental, LLC/Avis Budget Finance, Inc. | | | |
| company guaranty sr. unsec. unsub. notes 9 5/8s, 2018 | | 1,293,000 | 1,428,765 |
|
| Avis Budget Car Rental, LLC/Avis Budget Finance, Inc. | | | |
| company guaranty sr. unsec. unsub. notes 7 3/4s, 2016 | | 5,577,000 | 5,751,281 |
|
| Bumble Bee Acquisition Corp. 144A company guaranty sr. notes | | | |
| 9s, 2017 | | 1,990,000 | 2,069,600 |
|
| Burger King Corp. company guaranty sr. unsec. notes 9 7/8s, 2018 | | 2,242,000 | 2,373,718 |
|
| Central Garden & Pet Co. company guaranty sr. sub. notes | | | |
| 8 1/4s, 2018 | | 2,243,000 | 2,349,543 |
|
| CKE Holdings, Inc. 144A sr. notes 10 1/2s, 2016 ‡‡ | | 1,330,000 | 1,246,875 |
|
| CKE Restaurants, Inc. company guaranty sr. notes 11 3/8s, 2018 | | 2,290,000 | 2,524,725 |
|
| Claires Stores, Inc. 144A sr. notes 8 7/8s, 2019 | | 4,065,000 | 3,882,075 |
|
| Constellation Brands, Inc. company guaranty sr. unsec. | | | |
| notes 7 1/4s, 2017 | | 2,193,000 | 2,379,405 |
|
| Constellation Brands, Inc. company guaranty sr. unsec. | | | |
| unsub. notes 7 1/4s, 2016 | | 2,401,000 | 2,596,081 |
|
| Darling International, Inc. 144A company | | | |
| guaranty sr. unsec. notes 8 1/2s, 2018 | | 555,000 | 603,563 |
|
| Dean Foods Co. company guaranty sr. unsec. unsub. notes | | | |
| 7s, 2016 | | 2,498,000 | 2,382,468 |
|
| Dean Foods Co. 144A sr. notes 9 3/4s, 2018 | | 560,000 | 574,700 |
|
| DineEquity, Inc. 144A sr. unsec. notes 9 1/2s, 2018 | | 4,296,000 | 4,661,160 |
|
| Dole Food Co. 144A sr. notes 8s, 2016 | | 1,710,000 | 1,814,738 |
|
| Dunkin Finance Corp. 144A sr. notes 9 5/8s, 2018 | | 757,000 | 771,194 |
|
26
| | | |
| CORPORATE BONDS AND NOTES (29.0%)* cont. | Principal amount | Value |
|
| Consumer staples cont. | | | |
| EC Finance PLC company guaranty sr. bonds Ser. REGS, | | | |
| 9 3/4s, 2017 (United Kingdom) | EUR | 624,000 | $986,446 |
|
| Elizabeth Arden, Inc. sr. unsec. unsub. notes 7 3/8s, 2021 | | $2,115,000 | 2,207,531 |
|
| Europcar Groupe SA company guaranty sr. sub. bonds FRB | | | |
| Ser. REGS, 4.593s, 2013 (France) | EUR | 331,000 | 462,582 |
|
| Foodcorp (Pty), Ltd. 144A company guaranty sr. notes | | | |
| 8 3/4s, 2018 (South Africa) | EUR | 1,045,000 | 1,446,779 |
|
| Hertz Corp. company guaranty sr. unsec. notes 8 7/8s, 2014 | | $230,000 | 235,750 |
|
| Hertz Corp. 144A company guaranty sr. notes 6 3/4s, 2019 | | 925,000 | 916,906 |
|
| Hertz Corp. 144A company guaranty sr. unsec. notes 7 1/2s, 2018 | | 800,000 | 828,000 |
|
| Hertz Holdings Netherlands BV sr. sec. bonds Ser. REGS, | | | |
| 8 1/2s, 2015 (Netherlands) | EUR | 1,000,000 | 1,533,697 |
|
| Hertz Holdings Netherlands BV 144A sr. bonds 8 1/2s, 2015 | | | |
| (Netherlands) | EUR | 2,129,000 | 3,265,240 |
|
| Landry’s Restaurants, Inc. 144A company guaranty sr. notes | | | |
| 11 5/8s, 2015 | | $911,000 | 981,603 |
|
| Libbey Glass, Inc. sr. notes 10s, 2015 | | 574,000 | 625,660 |
|
| Prestige Brands, Inc. company guaranty sr. unsec. notes | | | |
| 8 1/4s, 2018 | | 1,830,000 | 1,930,650 |
|
| Prestige Brands, Inc. 144A company guaranty sr. unsec. | | | |
| notes 8 1/4s, 2018 | | 900,000 | 949,500 |
|
| Rite Aid Corp. company guaranty sr. notes 7 1/2s, 2017 | | 5,475,000 | 5,475,000 |
|
| Rite Aid Corp. company guaranty sr. unsec. unsub. notes | | | |
| 9 1/2s, 2017 | | 1,114,000 | 1,001,208 |
|
| Rite Aid Corp. company guaranty sr. unsub. notes 8s, 2020 | | 595,000 | 629,956 |
|
| Roadhouse Financing, Inc. 144A sr. notes 10 3/4s, 2017 | | 1,410,000 | 1,512,225 |
|
| RSC Equipment Rental, Inc. 144A sr. unsec. notes 8 1/4s, 2021 | | 1,220,000 | 1,268,800 |
|
| Service Corporation International sr. notes 7s, 2019 | | 970,000 | 1,018,500 |
|
| Service Corporation International sr. notes 7s, 2017 | | 3,136,000 | 3,355,520 |
|
| Simmons Foods, Inc. 144A sr. notes 10 1/2s, 2017 | | 1,451,000 | 1,574,335 |
|
| Smithfield Foods, Inc. company guaranty sr. notes 10s, 2014 | | 3,865,000 | 4,551,038 |
|
| Spectrum Brands, Inc. 144A sr. notes 9 1/2s, 2018 | | 3,360,000 | 3,704,400 |
|
| Stewart Enterprises, Inc. sr. notes 6 1/4s, 2013 | | 3,922,000 | 3,926,903 |
|
| Tyson Foods, Inc. sr. unsec. unsub. notes 10 1/2s, 2014 | | 2,070,000 | 2,484,000 |
|
| United Rentals North America, Inc. company guaranty sr. unsec. | | | |
| sub. notes 8 3/8s, 2020 | | 900,000 | 940,500 |
|
| Wendy’s/Arby’s Restaurants LLC company guaranty sr. unsec. | | | |
| unsub. notes 10s, 2016 | | 5,025,000 | 5,527,500 |
|
| West Corp. 144A sr. notes 7 7/8s, 2019 | | 2,430,000 | 2,475,563 |
|
| West Corp. 144A sr. unsec. notes 8 5/8s, 2018 | | 665,000 | 699,913 |
|
| | | | 104,128,449 |
| Energy (5.4%) | | | |
| Anadarko Finance Co. company guaranty sr. unsec. | | | |
| unsub. notes Ser. B, 7 1/2s, 2031 | | 1,505,000 | 1,661,511 |
|
| Anadarko Petroleum Corp. sr. notes 5.95s, 2016 | | 4,895,000 | 5,321,392 |
|
| Anadarko Petroleum Corp. sr. unsec. notes 6 3/8s, 2017 | | 2,960,000 | 3,258,057 |
|
| Arch Coal, Inc. company guaranty sr. unsec. notes 7 1/4s, 2020 | | 3,630,000 | 3,893,175 |
|
| Arch Western Finance, LLC company | | | |
| guaranty sr. notes 6 3/4s, 2013 | | 3,278,000 | 3,310,780 |
|
27
| | |
| CORPORATE BONDS AND NOTES (29.0%)* cont. | Principal amount | Value |
|
| Energy cont. | | |
| ATP Oil & Gas Corp. company guaranty sr. notes 11 7/8s, 2015 | $643,000 | $675,150 |
|
| Brigham Exploration Co. 144A company guaranty sr. unsec. | | |
| notes 8 3/4s, 2018 | 3,619,000 | 4,017,090 |
|
| Carrizo Oil & Gas, Inc. 144A sr. unsec. notes 8 5/8s, 2018 | 4,411,000 | 4,675,660 |
|
| Chaparral Energy, Inc. company guaranty sr. unsec. | | |
| notes 8 7/8s, 2017 | 3,970,000 | 4,168,500 |
|
| Chaparral Energy, Inc. 144A company guaranty sr. unsec. | | |
| notes 8 1/4s, 2021 | 910,000 | 937,300 |
|
| Chaparral Energy, Inc. 144A sr. notes 9 7/8s, 2020 | 1,640,000 | 1,820,400 |
|
| Chesapeake Energy Corp. company guaranty sr. unsec. | | |
| notes 9 1/2s, 2015 | 5,240,000 | 6,497,600 |
|
| Complete Production Services, Inc. company guaranty 8s, 2016 | 1,657,000 | 1,748,135 |
|
| Compton Petroleum Finance Corp. company guaranty sr. unsec. | | |
| notes 10s, 2017 (Canada) | 817,887 | 580,700 |
|
| Connacher Oil and Gas, Ltd. 144A sec. notes 10 1/4s, 2015 | | |
| (Canada) | 3,704,000 | 3,926,240 |
|
| Connacher Oil and Gas, Ltd. 144A sr. sec. notes 11 3/4s, | | |
| 2014 (Canada) | 2,145,000 | 2,305,875 |
|
| CONSOL Energy, Inc. company guaranty sr. unsec. | | |
| notes 8 1/4s, 2020 | 1,829,000 | 2,027,904 |
|
| CONSOL Energy, Inc. company guaranty sr. unsec. notes 8s, 2017 | 8,151,000 | 8,925,345 |
|
| CONSOL Energy, Inc. 144A company guaranty sr. unsec. | | |
| notes 6 3/8s, 2021 | 375,000 | 375,469 |
|
| Crosstex Energy LP/Crosstex Energy Finance Corp. company | | |
| guaranty sr. unsec. notes 8 7/8s, 2018 | 5,652,000 | 6,160,680 |
|
| Denbury Resources, Inc. company guaranty sr. unsec. | | |
| sub. notes 8 1/4s, 2020 | 3,793,000 | 4,229,195 |
|
| Denbury Resources, Inc. company guaranty sr. unsec. | | |
| sub. notes 6 3/8s, 2021 | 1,285,000 | 1,317,125 |
|
| EXCO Resources, Inc. company guaranty sr. unsec. | | |
| notes 7 1/2s, 2018 | 5,316,000 | 5,402,385 |
|
| Expro Finance Luxemburg 144A sr. notes 8 1/2s, 2016 | | |
| (Luxembourg) | 2,135,000 | 2,113,650 |
|
| Ferrellgas LP/Ferrellgas Finance Corp. 144A | | |
| sr. notes 6 1/2s, 2021 | 1,264,000 | 1,226,080 |
|
| Forest Oil Corp. sr. notes 8s, 2011 | 3,730,000 | 3,897,850 |
|
| Frac Tech Services, LLC/Frac Tech Finance, Inc. 144A | | |
| company guaranty sr. notes 7 1/8s, 2018 | 2,260,000 | 2,316,500 |
|
| Gazprom Via Gaz Capital SA sr. unsec. notes Ser. REGS, | | |
| 7.288s, 2037 (Russia) | 1,810,000 | 1,954,800 |
|
| Gazprom Via Gaz Capital SA 144A company guaranty sr. unsec. | | |
| bond 8.146s, 2018 (Russia) | 740,000 | 870,980 |
|
| Gazprom OAO Via Gaz Capital SA 144A sr. sec. bond 9 1/4s, 2019 | | |
| (Russia) | 3,305,000 | 4,107,157 |
|
| Gazprom OAO Via Gaz Capital SA 144A sr. unsec. 6.51s, 2022 | | |
| (Russia) | 1,090,000 | 1,158,125 |
|
| Gazprom OAO Via Gaz Capital SA 144A sr. unsec. notes 7.288s, | | |
| 2037 (Russia) | 1,280,000 | 1,382,400 |
|
| Gazprom OAO Via White Nights Finance BV notes 10 1/2s, 2014 | | |
| (Netherlands) | 8,525,000 | 10,243,470 |
|
28
| | | |
| CORPORATE BONDS AND NOTES (29.0%)* cont. | Principal amount | Value |
|
| Energy cont. | | | |
| Goodrich Petroleum Corp. 144A sr. notes 8 7/8s, 2019 | | $4,480,000 | $4,480,000 |
|
| Helix Energy Solutions Group, Inc. 144A sr. unsec. | | | |
| notes 9 1/2s, 2016 | | 3,440,000 | 3,629,200 |
|
| Hornbeck Offshore Services, Inc. sr. notes Ser. B, 6 1/8s, 2014 | | 3,379,000 | 3,400,119 |
|
| Inergy LP/Inergy Finance Corp. 144A sr. notes 6 7/8s, 2021 | | 2,746,000 | 2,862,705 |
|
| Infinis PLC sr. notes Ser. REGS, 9 1/8s, 2014 | | | |
| (United Kingdom) | GBP | 773,000 | 1,315,907 |
|
| James River Escrow, Inc. 144A sr. notes 7 7/8s, 2019 | | $965,000 | 998,775 |
|
| Key Energy Services, Inc. company guaranty unsec. | | | |
| unsub. notes 6 3/4s, 2021 | | 1,310,000 | 1,332,925 |
|
| Laredo Petroleum, Inc. 144A sr. notes 9 1/2s, 2019 | | 1,641,000 | 1,708,691 |
|
| Lukoil International Finance BV 144A company | | | |
| guaranty sr. unsec. unsub. bonds 6.656s, 2022 (Russia) | | 2,380,000 | 2,493,050 |
|
| Lukoil International Finance BV 144A company | | | |
| guaranty sr. unsec. unsub. notes 7 1/4s, 2019 (Russia) | | 2,920,000 | 3,223,008 |
|
| Massey Energy Co. company guaranty sr. unsec. notes | | | |
| 6 7/8s, 2013 | | 4,646,000 | 4,738,920 |
|
| MEG Energy Corp. 144A company guaranty sr. unsec. | | | |
| notes 6 1/2s, 2021 (Canada) | | 1,905,000 | 1,935,956 |
|
| Newfield Exploration Co. sr. unsec. sub. notes 6 7/8s, 2020 | | 1,000,000 | 1,055,000 |
|
| Newfield Exploration Co. sr. unsec. sub. notes 6 5/8s, 2014 | | 2,650,000 | 2,709,625 |
|
| OPTI Canada, Inc. company guaranty sr. sec. notes 8 1/4s, | | | |
| 2014 (Canada) | | 2,535,000 | 1,353,056 |
|
| OPTI Canada, Inc. company guaranty sr. sec. notes 7 7/8s, | | | |
| 2014 (Canada) | | 2,030,000 | 1,073,363 |
|
| OPTI Canada, Inc. 144A company guaranty sr. notes 9 3/4s, | | | |
| 2013 (Canada) | | 4,207,000 | 4,201,741 |
|
| OPTI Canada, Inc. 144A sr. notes 9s, 2012 (Canada) | | 948,000 | 963,405 |
|
| Peabody Energy Corp. company guaranty 7 3/8s, 2016 | | 8,163,000 | 9,060,930 |
|
| Peabody Energy Corp. company guaranty sr. unsec. | | | |
| unsub. notes 6 1/2s, 2020 | | 208,000 | 223,080 |
|
| Pemex Project Funding Master Trust company | | | |
| guaranty sr. unsec. unsub. bonds 6 5/8s, 2035 (Mexico) | | 1,140,000 | 1,143,549 |
|
| Pemex Project Funding Master Trust company guaranty unsec. | | | |
| unsub. notes 6 5/8s, 2038 (Mexico) | | 1,500,000 | 1,493,624 |
|
| Petrobras International Finance Co. company | | | |
| guaranty sr. unsec. notes 7 7/8s, 2019 (Brazil) | | 1,575,000 | 1,848,735 |
|
| Petrobras International Finance Co. company | | | |
| guaranty sr. unsec. notes 6 7/8s, 2040 (Brazil) | | 11,705,000 | 12,102,807 |
|
| Petrobras International Finance Co. company | | | |
| guaranty sr. unsec. notes 6 3/4s, 2041 (Brazil) | | 1,782,000 | 1,835,829 |
|
| Petrobras International Finance Co. company | | | |
| guaranty sr. unsec. notes 5 3/8s, 2021 (Brazil) | | 5,375,000 | 5,391,222 |
|
| Petrohawk Energy Corp. company guaranty sr. unsec. | | | |
| notes 10 1/2s, 2014 | | 1,350,000 | 1,550,813 |
|
| Petroleos de Venezuela SA company guaranty sr. unsec. | | | |
| notes 5 1/4s, 2017 (Venezuela) | | 27,200,000 | 16,428,800 |
|
| Petroleos de Venezuela SA company guaranty sr. unsec. | | | |
| unsub. notes 5 1/2s, 2037 (Venezuela) | | 3,200,000 | 1,460,800 |
|
29
| | |
| CORPORATE BONDS AND NOTES (29.0%)* cont. | Principal amount | Value |
|
| Energy cont. | | |
| Petroleos de Venezuela SA company guaranty sr. unsec. | | |
| unsub. notes 5 3/8s, 2027 (Venezuela) | $3,000,000 | $1,417,500 |
|
| Petroleos de Venezuela SA sr. unsec. bonds zero %, 2011 | | |
| (Venezuela) | 7,960,000 | 7,780,900 |
|
| Petroleos de Venezuela SA sr. unsec. notes 5 1/8s, 2016 | | |
| (Venezuela) | 5,000,000 | 3,032,050 |
|
| Petroleos de Venezuela SA sr. unsec. notes 4.9s, 2014 | | |
| (Venezuela) | 24,700,000 | 18,154,500 |
|
| Petroleos de Venezuela SA sr. unsec. sub. bonds 5s, 2015 | | |
| (Venezuela) | 14,010,000 | 9,206,251 |
|
| Petroleos de Venezuela SA 144A company | | |
| guaranty sr. notes 8 1/2s, 2017 (Venezuela) ∆ | 7,565,000 | 5,348,455 |
|
| Petroleos de Venezuela SA 144A company guaranty sr. unsec. | | |
| notes 8s, 2013 (Venezuela) | 6,425,000 | 5,959,188 |
|
| Petroleos Mexicanos company guaranty sr. unsec. | | |
| unsub. notes 5 1/2s, 2021 (Mexico) | 10,500,000 | 10,657,500 |
|
| Petroleum Co. of Trinidad & Tobago Ltd. 144A sr. unsec. | | |
| notes 9 3/4s, 2019 (Trinidad) | 1,165,000 | 1,412,563 |
|
| Petroleum Co. of Trinidad & Tobago Ltd. 144A sr. unsec. | | |
| notes 6s, 2022 (Trinidad) | 2,295,208 | 2,324,335 |
|
| Petroleum Development Corp. company guaranty sr. unsec. | | |
| notes 12s, 2018 | 1,465,000 | 1,660,944 |
|
| Plains Exploration & Production Co. company | | |
| guaranty 7 3/4s, 2015 | 2,900,000 | 3,026,875 |
|
| Plains Exploration & Production Co. company guaranty 7s, 2017 | 580,000 | 598,850 |
|
| Plains Exploration & Production Co. company | | |
| guaranty sr. unsec. notes 10s, 2016 | 1,180,000 | 1,330,450 |
|
| Power Sector Assets & Liabilities Management Corp. 144A | | |
| govt. guaranty sr. unsec. notes 7.39s, 2024 (Philippines) | 2,790,000 | 3,180,600 |
|
| Power Sector Assets & Liabilities Management Corp. 144A | | |
| govt. guaranty sr. unsec. notes 7 1/4s, 2019 (Philippines) | 2,100,000 | 2,394,000 |
|
| Quicksilver Resources, Inc. company guaranty sr. unsec. | | |
| notes 8 1/4s, 2015 | 500,000 | 523,750 |
|
| Quicksilver Resources, Inc. sr. notes 11 3/4s, 2016 | 1,710,000 | 1,992,150 |
|
| Range Resources Corp. company | | |
| guaranty sr. sub. notes 6 3/4s, 2020 | 1,640,000 | 1,746,600 |
|
| Rosetta Resources, Inc. company guaranty sr. unsec. | | |
| notes 9 1/2s, 2018 | 3,321,000 | 3,686,310 |
|
| Sabine Pass LNG LP sec. notes 7 1/2s, 2016 | 2,885,000 | 2,964,338 |
|
| SandRidge Energy, Inc. 144A company guaranty sr. unsec. | | |
| notes 7 1/2s, 2021 | 565,000 | 586,188 |
|
| SandRidge Energy, Inc. 144A company guaranty sr. unsec. | | |
| unsub. notes 8s, 2018 | 6,510,000 | 6,819,225 |
|
| SM Energy Co. 144A sr. unsec. notes 6 5/8s, 2019 | 1,105,000 | 1,134,006 |
|
| Williams Cos., Inc. (The) notes 7 3/4s, 2031 | 844,000 | 1,002,354 |
|
| Williams Cos., Inc. (The) sr. unsec. notes 7 7/8s, 2021 | 1,115,000 | 1,387,567 |
|
| | | 301,849,764 |
30
| | | |
| CORPORATE BONDS AND NOTES (29.0%)* cont. | Principal amount | Value |
|
| Financials (5.5%) | | | |
| ACE Cash Express, Inc. 144A sr. notes 11s, 2019 | | $2,380,000 | $2,421,650 |
|
| Ally Financial, Inc. company guaranty sr. unsec. notes 7s, 2012 | | 212,000 | 218,625 |
|
| Ally Financial, Inc. company guaranty sr. unsec. | | | |
| notes 6 7/8s, 2012 | | 1,379,000 | 1,447,950 |
|
| Ally Financial, Inc. company guaranty sr. unsec. | | | |
| notes 6 5/8s, 2012 | | 1,304,000 | 1,356,160 |
|
| Ally Financial, Inc. company guaranty sr. unsec. | | | |
| unsub. notes 8.3s, 2015 | | 4,595,000 | 5,037,269 |
|
| Ally Financial, Inc. company guaranty sr. unsec. | | | |
| unsub. notes FRN 2.511s, 2014 | | 168,000 | 162,992 |
|
| Ally Financial, Inc. unsec. sub. notes 8s, 2018 | | 1,333,000 | 1,431,309 |
|
| Ally Financial, Inc. 144A company guaranty notes 6 1/4s, 2017 | | 1,815,000 | 1,849,031 |
|
| Ally Financial, Inc. 144A company guaranty sr. unsec. | | | |
| unsub. notes 7 1/2s, 2020 | | 7,290,000 | 7,772,963 |
|
| American International Group, Inc. jr. sub. bonds FRB | | | |
| 8.175s, 2058 | | 2,043,000 | 2,198,779 |
|
| Banco Do Brasil 144A sr. unsec. 9 3/4s, 2017 (Brazil) | BRL | 1,745,000 | 1,069,830 |
|
| Bosphorus Financial Services, Ltd. 144A sr. notes FRN | | | |
| 2.113s, 2012 | | $2,574,750 | 2,545,748 |
|
| Capital One Capital IV company guaranty jr. unsec. | | | |
| sub. notes FRN 6.745s, 2037 | | 1,958,000 | 1,965,343 |
|
| CB Richard Ellis Services, Inc. company guaranty sr. unsec. | | | |
| notes 6 5/8s, 2020 | | 1,235,000 | 1,272,050 |
|
| CB Richard Ellis Services, Inc. company guaranty sr. unsec. | | | |
| sub. notes 11 5/8s, 2017 | | 1,000,000 | 1,180,000 |
|
| CIT Group, Inc. sr. bonds 7s, 2017 ∆ | | 12,809,000 | 12,825,011 |
|
| CIT Group, Inc. sr. bonds 7s, 2016 | | 8,296,000 | 8,306,370 |
|
| CIT Group, Inc. sr. bonds 7s, 2015 | | 1,390,000 | 1,402,163 |
|
| CIT Group, Inc. sr. bonds 7s, 2014 | | 439,000 | 447,231 |
|
| CIT Group, Inc. 144A company guaranty notes 6 5/8s, 2018 | | 2,885,000 | 2,927,176 |
|
| CNO Financial Group, Inc. 144A company | | | |
| guaranty sr. notes 9s, 2018 | | 730,000 | 773,800 |
|
| Corrections Corporation of America company | | | |
| guaranty sr. notes 7 3/4s, 2017 | | 6,495,000 | 7,047,075 |
|
| E*Trade Financial Corp. sr. unsec. unsub. notes 12 1/2s, 2017 | | 3,000,000 | 3,577,500 |
|
| HSBC Capital Funding LP/ Jersey Channel Islands company | | | |
| guaranty sub. FRB 5.13s, 2049 (United Kingdom) | EUR | 1,092,000 | 1,453,730 |
|
| HUB International Holdings, Inc. 144A | | | |
| sr. sub. notes 10 1/4s, 2015 | | $375,000 | 388,125 |
|
| HUB International Holdings, Inc. 144A sr. unsec. | | | |
| unsub. notes 9s, 2014 | | 270,000 | 282,150 |
|
| Icahn Enterprises LP/Icahn Enterprises Finance Corp. | | | |
| company guaranty sr. unsec. notes 8s, 2018 | | 5,270,000 | 5,414,925 |
|
| Industry & Construction Bank St. Petersburg OJSC Via Or-ICB | | | |
| for Industry unsec. sub. notes FRN 5.01s, 2015 | | | |
| (Luxembourg) | | 1,750,000 | 1,731,625 |
|
| JPMorgan Chase & Co. 144A sr. unsec. notes FRN zero %, 2017 | | 2,500,000 | 2,519,903 |
|
| JPMorgan Chase & Co. 144A sr. unsec. unsub. notes FRN | | | |
| 3.91s, 2011 | RUB | 102,000,000 | 3,586,229 |
|
31
| | | |
| CORPORATE BONDS AND NOTES (29.0%)* cont. | Principal amount | Value |
|
| Financials cont. | | | |
| JPMorgan Chase & Co. 144A unsec. unsub. notes 8s, 2012 | INR | 76,000,000 | $1,719,224 |
|
| Leucadia National Corp. sr. unsec. notes 7 1/8s, 2017 | | $3,482,000 | 3,656,100 |
|
| Liberty Mutual Insurance Co. 144A notes 7.697s, 2097 | | 4,365,000 | 4,014,137 |
|
| MetLife Capital Trust X 144A jr. sub. FRB 9 1/4s, 2038 | | 935,000 | 1,126,675 |
|
| National Money Mart Co. company guaranty sr. unsec. | | | |
| unsub. notes 10 3/8s, 2016 (Canada) | | 2,543,000 | 2,835,445 |
|
| Nuveen Investments, Inc. company guaranty sr. unsec. | | | |
| unsub. notes 10 1/2s, 2015 | | 4,159,000 | 4,273,373 |
|
| Offshore Group Investments, Ltd. company | | | |
| guaranty sr. notes 11 1/2s, 2015 (Cayman Islands) | | 1,245,000 | 1,381,950 |
|
| Omega Healthcare Investors, Inc. 144A sr. notes 6 3/4s, 2022 R | | 2,376,000 | 2,426,490 |
|
| Russian Agricultural Bank OJSC Via RSHB Capital SA | | | |
| sub. bonds FRB 6.97s, 2016 (Russia) | | 30,110,000 | 30,188,888 |
|
| Russian Agricultural Bank OJSC Via RSHB Capital SA 144A | | | |
| notes 7 3/4s, 2018 (Russia) | | 1,890,000 | 2,114,343 |
|
| Russian Agricultural Bank OJSC Via RSHB Capital SA 144A | | | |
| notes 7 1/8s, 2014 (Russia) | | 6,575,000 | 7,154,915 |
|
| Sabra Health Care LP/Sabra Capital Corp. company | | | |
| guaranty sr. unsec. unsub. notes 8 1/8s, 2018 R | | 1,260,000 | 1,329,300 |
|
| Shinhan Bank 144A sr. unsec. bond 6s, 2012 (South Korea) | | 1,398,000 | 1,470,047 |
|
| SLM Corp. sr. notes Ser. MTN, 6 1/4s, 2016 | | 2,190,000 | 2,291,639 |
|
| Springleaf Finance Corp. sr. unsec. notes Ser. MTN, 6.9s, 2017 | | 7,805,000 | 7,131,819 |
|
| State Bank of India/London 144A sr. unsec. notes 4 1/2s, | | | |
| 2015 (India) | | 1,665,000 | 1,691,940 |
|
| UBS AG/ Jersey Branch jr. unsec. sub. FRB 4.28s, 2015 | | | |
| (Cayman Islands) | EUR | 1,771,000 | 2,266,561 |
|
| Ukreximbank Via Biz Finance PLC sr. unsec. | | | |
| unsub. bonds 8 3/8s, 2015 (United Kingdom) | | $3,400,000 | 3,504,992 |
|
| USI Holdings Corp. 144A company guaranty sr. unsec. | | | |
| notes FRN 4.188s, 2014 | | 245,000 | 238,263 |
|
| Vnesheconombank Via VEB Finance, Ltd. 144A bank guaranteed | | | |
| bonds 6.8s, 2025 (Russia) | | 12,300,000 | 12,472,200 |
|
| VTB Bank OJSC Via VTB Capital SA sr. notes 6 1/4s, 2035 | | | |
| (Russia) | | 4,335,000 | 4,595,100 |
|
| VTB Bank OJSC Via VTB Capital SA 144A bank | | | |
| guaranty sr. unsec. notes 6.551s, 2020 (Russia) | | 5,000,000 | 5,068,500 |
|
| VTB Bank OJSC Via VTB Capital SA 144A sr. unsec. | | | |
| notes 7 1/2s, 2011 (Russia) | | 2,616,000 | 2,691,079 |
|
| VTB Bank OJSC Via VTB Capital SA 144A sr. unsec. | | | |
| notes 6 1/4s, 2035 (Russia) | | 50,831,000 | 53,880,860 |
|
| VTB Bank OJSC Via VTB Capital SA 144A sr. unsec. | | | |
| unsub. notes 6.609s, 2012 (Russia) | | 12,594,000 | 13,370,042 |
|
| VTB Bank OJSC Via VTB Capital SA 144A sr. unsec. | | | |
| unsub. notes 6.465s, 2015 (Russia) | | 3,000,000 | 3,213,600 |
|
| VTB Bank OJSC Via VTB Capital SA 144A sr. unsec. notes 6 7/8s, | | | |
| 2018 (Russia) | | 38,586,000 | 41,912,113 |
|
| | | | 302,632,307 |
32
| | | |
| CORPORATE BONDS AND NOTES (29.0%)* cont. | Principal amount | Value |
|
| Government (0.1%) | | | |
| International Bank for Reconstruction & Development | | | |
| sr. unsec. unsub. notes Ser. GDIF, 5 1/4s, 2014 | | | |
| (Supra-Nation) | RUB | 123,450,000 | $4,205,244 |
|
| | | | 4,205,244 |
| Health care (1.4%) | | | |
| Aviv Healthcare Properties LP 144A sr. notes 7 3/4s, 2019 ∆ | | $2,810,000 | 2,929,425 |
|
| Bayer AG jr. unsec. sub. bonds FRB 5s, 2105 (Germany) | EUR | 819,000 | 1,153,135 |
|
| Biomet, Inc. company guaranty sr. unsec. notes 10s, 2017 | | $1,876,000 | 2,056,565 |
|
| Capella Healthcare, Inc. 144A company | | | |
| guaranty sr. notes 9 1/4s, 2017 | | 1,610,000 | 1,714,650 |
|
| CHS/Community Health Systems, Inc. company | | | |
| guaranty sr. unsec. sub. notes 8 7/8s, 2015 | | 4,043,000 | 4,265,365 |
|
| ConvaTec Healthcare E SA 144A sr. notes 7 3/8s, 2017 | | | |
| (Luxembourg) | EUR | 865,000 | 1,264,604 |
|
| ConvaTec Healthcare E SA 144A sr. unsec. notes 10 1/2s, | | | |
| 2018 (Luxembourg) | | $5,050,000 | 5,302,500 |
|
| DaVita, Inc. company guaranty sr. unsec. notes 6 5/8s, 2020 | | 595,000 | 602,438 |
|
| DaVita, Inc. company guaranty sr. unsec. notes 6 3/8s, 2018 | | 1,770,000 | 1,787,700 |
|
| Fresenius Medical Care US Finance, Inc. 144A company | | | |
| guaranty sr. notes 5 3/4s, 2021 | | 2,950,000 | 2,857,813 |
|
| Fresenius US Finance II, Inc. 144A sr. unsec. notes 9s, 2015 | | 2,160,000 | 2,475,900 |
|
| Giant Funding Corp. 144A sr. notes 8 1/4s, 2018 (Spain) | | 2,056,000 | 2,109,970 |
|
| HCA Holdings, Inc. 144A sr. unsec. notes 7 3/4s, 2021 | | 4,481,000 | 4,671,443 |
|
| HCA, Inc. company guaranty sr. notes 9 5/8s, 2016 ‡‡ | | 7,361,000 | 7,931,478 |
|
| HCA, Inc. sr. sec. notes 9 1/4s, 2016 | | 5,814,000 | 6,257,318 |
|
| HCA, Inc. sr. sec. notes 9 1/8s, 2014 | | 2,248,000 | 2,357,590 |
|
| Multiplan, Inc. 144A company guaranty sr. notes 9 7/8s, 2018 | | 1,635,000 | 1,749,450 |
|
| Select Medical Corp. company guaranty 7 5/8s, 2015 | | 994,000 | 1,011,395 |
|
| Surgical Care Affiliates, Inc. 144A sr. sub. notes 10s, 2017 | | 1,505,000 | 1,557,675 |
|
| Surgical Care Affiliates, Inc. 144A sr. unsec. | | | |
| notes 8 7/8s, 2015 ‡‡ | | 834,910 | 853,695 |
|
| Talecris Biotherapeutics Holdings Corp. company | | | |
| guaranty sr. unsec. notes 7 3/4s, 2016 | | 1,754,000 | 1,925,015 |
|
| Tenet Healthcare Corp. company guaranty sr. notes 10s, 2018 | | 1,683,000 | 1,971,214 |
|
| Tenet Healthcare Corp. sr. notes 9s, 2015 | | 4,307,000 | 4,737,700 |
|
| Tenet Healthcare Corp. sr. notes 8 7/8s, 2019 | | 2,627,000 | 2,994,780 |
|
| Tenet Healthcare Corp. sr. unsec. notes 8s, 2020 | | 1,945,000 | 2,027,663 |
|
| Valeant Pharmaceuticals International 144A company | | | |
| guaranty sr. notes 7s, 2020 | | 350,000 | 339,500 |
|
| Valeant Pharmaceuticals International 144A company | | | |
| guaranty sr. unsec. notes 6 7/8s, 2018 | | 900,000 | 882,000 |
|
| Valeant Pharmaceuticals International 144A | | | |
| sr. notes 6 3/4s, 2017 | | 350,000 | 344,750 |
|
| Vanguard Health Systems, Inc. 144A sr. notes zero %, 2016 | | 6,990,000 | 4,438,650 |
|
| Ventas Realty LP/Capital Corp. company guaranty 9s, 2012 R | | 2,840,000 | 3,054,051 |
|
| | | | 77,625,432 |
| Technology (1.2%) | | | |
| Advanced Micro Devices, Inc. sr. unsec. notes 7 3/4s, 2020 | | 660,000 | 678,150 |
|
| Avaya, Inc. company guaranty sr. unsec. notes 9 3/4s, 2015 | | 3,357,000 | 3,411,551 |
|
| Avaya, Inc. 144A company guaranty sr. notes 7s, 2019 | | 2,500,000 | 2,437,500 |
|
33
| | | |
| CORPORATE BONDS AND NOTES (29.0%)* cont. | Principal amount | Value |
|
| Technology cont. | | | |
| Buccaneer Merger Sub., Inc. 144A sr. notes 9 1/8s, 2019 | | $2,680,000 | $2,840,800 |
|
| Ceridian Corp. company guaranty sr. unsec. notes 12 1/4s, 2015 ‡‡ | 470,000 | 491,150 |
|
| Ceridian Corp. sr. unsec. notes 11 1/4s, 2015 | | 2,853,000 | 2,967,120 |
|
| CommScope, Inc. 144A sr. notes 8 1/4s, 2019 | | 1,795,000 | 1,875,775 |
|
| Fidelity National Information Services, Inc. company | | | |
| guaranty sr. unsec. notes 7 7/8s, 2020 | | 859,000 | 938,458 |
|
| Fidelity National Information Services, Inc. company | | | |
| guaranty sr. unsec. notes 7 5/8s, 2017 | | 2,376,000 | 2,574,990 |
|
| First Data Corp. company guaranty sr. unsec. notes 10.55s, 2015 ‡‡ ∆ | 5,315,285 | 5,507,964 |
|
| First Data Corp. company guaranty sr. unsec. sub. notes | | | |
| 11 1/4s, 2016 | | 727,000 | 724,274 |
|
| First Data Corp. 144A company guaranty sr. notes 8 7/8s, 2020 | | 820,000 | 899,950 |
|
| First Data Corp. 144A company guaranty sr. notes 7 3/8s, 2019 ∆ | 680,000 | 694,450 |
|
| First Data Corp. 144A sr. bonds 12 5/8s, 2021 | | 6,080,000 | 6,596,800 |
|
| Freescale Semiconductor, Inc. company guaranty sr. unsec. | | | |
| sub. notes 10 1/8s, 2016 | | 10,000 | 10,625 |
|
| Freescale Semiconductor, Inc. 144A company | | | |
| guaranty sr. notes 10 1/8s, 2018 | | 6,198,000 | 6,926,265 |
|
| Freescale Semiconductor, Inc. 144A company | | | |
| guaranty sr. unsec. notes 10 3/4s, 2020 | | 3,323,000 | 3,730,068 |
|
| Iron Mountain, Inc. company guaranty sr. unsec. | | | |
| sub. notes 8s, 2020 | | 2,300,000 | 2,438,000 |
|
| Iron Mountain, Inc. sr. sub. notes 8 3/8s, 2021 | | 4,150,000 | 4,492,375 |
|
| NXP BV/NXP Funding, LLC sec. notes Ser. EXCH, 7 7/8s, 2014 | | | |
| (Netherlands) | | 1,695,000 | 1,760,681 |
|
| NXP BV/NXP Funding, LLC 144A company | | | |
| guaranty sr. notes 9 3/4s, 2018 (Netherlands) | | 4,543,000 | 5,088,160 |
|
| Seagate HDD Cayman 144A company guaranty sr. unsec. | | | |
| notes 7 3/4s, 2018 (Cayman Islands) | | 2,399,000 | 2,482,965 |
|
| STATS ChipPAC, Ltd. 144A company guaranty sr. unsec. | | | |
| notes 7 1/2s, 2015 (Singapore) | | 315,000 | 343,350 |
|
| SunGard Data Systems, Inc. company guaranty 10 1/4s, 2015 | | 5,159,000 | 5,416,950 |
|
| SunGard Data Systems, Inc. 144A sr. unsec. notes 7 5/8s, 2020 | | 2,062,000 | 2,118,705 |
|
| Unisys Corp. 144A company guaranty sr. sub. notes 14 1/4s, 2015 | 1,523,000 | 1,850,445 |
|
| | | | 69,297,521 |
| Transportation (0.2%) | | | |
| AMGH Merger Sub., Inc. 144A company | | | |
| guaranty sr. notes 9 1/4s, 2018 ∆ | | 3,325,000 | 3,566,063 |
|
| RailAmerica, Inc. company guaranty sr. notes 9 1/4s, 2017 | | 1,912,000 | 2,115,150 |
|
| Swift Services Holdings, Inc. 144A company | | | |
| guaranty sr. notes 10s, 2018 | | 2,715,000 | 2,945,775 |
|
| | | | 8,626,988 |
| Utilities and power (1.6%) | | | |
| AES Corp. (The) sr. unsec. unsub. notes 8s, 2017 | | 6,690,000 | 7,191,750 |
|
| Aguila 3 SA company guaranty sr. notes Ser. REGS, 7 7/8s, | | | |
| 2018 (Luxembourg) | CHF | 4,678,000 | 5,230,110 |
|
| Calpine Corp. 144A company guaranty sr. notes 7 7/8s, 2020 | | $1,995,000 | 2,114,700 |
|
| Calpine Corp. 144A sr. notes 7 1/4s, 2017 | | 4,592,000 | 4,775,680 |
|
| Cenrais Electricas Brasileiras SA 144A sr. unsec. | | | |
| unsub. notes 6 7/8s, 2019 (Brazil) | | 500,000 | 560,000 |
|
34
| | | |
| CORPORATE BONDS AND NOTES (29.0%)* cont. | Principal amount | Value |
|
| Utilities and power cont. | | | |
| Colorado Interstate Gas Co. debs. 6.85s, 2037 (Canada) | | $2,495,000 | $2,697,285 |
|
| Dynegy Holdings, Inc. sr. unsec. notes 7 3/4s, 2019 | | 6,270,000 | 4,867,088 |
|
| Edison Mission Energy sr. unsec. notes 7 3/4s, 2016 | | 654,000 | 555,900 |
|
| Edison Mission Energy sr. unsec. notes 7 1/2s, 2013 | | 305,000 | 303,475 |
|
| Edison Mission Energy sr. unsec. notes 7.2s, 2019 | | 605,000 | 471,900 |
|
| Edison Mission Energy sr. unsec. notes 7s, 2017 | | 90,000 | 72,225 |
|
| El Paso Corp. sr. unsec. notes 7s, 2017 | | 4,910,000 | 5,495,277 |
|
| El Paso Natural Gas Co. debs. 8 5/8s, 2022 | | 2,976,000 | 3,750,959 |
|
| Energy Future Holdings Corp. company guaranty sr. notes | | | |
| 10s, 2020 | | 8,180,000 | 8,668,142 |
|
| Energy Future Intermediate Holdings Co., LLC sr. notes 10s, 2020 | | 3,920,000 | 4,153,926 |
|
| Energy Transfer Equity LP company guaranty sr. unsec. | | | |
| notes 7 1/2s, 2020 | | 1,927,000 | 2,095,613 |
|
| GenOn Americas Generation, LLC sr. unsec. notes 8.3s, 2011 | | 530,000 | 531,325 |
|
| GenOn Energy, Inc. sr. unsec. unsub. notes 7 5/8s, 2014 | | 1,500,000 | 1,552,500 |
|
| GenOn Energy, Inc. 144A sr. notes 9 7/8s, 2020 | | 3,475,000 | 3,631,375 |
|
| GenOn Energy, Inc. 144A sr. unsec. notes 9 1/2s, 2018 | | 530,000 | 551,200 |
|
| Ipalco Enterprises, Inc. 144A sr. notes 7 1/4s, 2016 | | 490,000 | 530,425 |
|
| Majapahit Holding BV 144A company guaranty sr. unsec. | | | |
| notes 8s, 2019 (Indonesia) | | 2,575,000 | 2,922,625 |
|
| Majapahit Holding BV 144A company guaranty sr. unsec. | | | |
| notes 7 3/4s, 2020 (Indonesia) | | 7,660,000 | 8,626,309 |
|
| NRG Energy, Inc. company guaranty 7 3/8s, 2017 | | 4,975,000 | 5,180,219 |
|
| NRG Energy, Inc. sr. notes 7 3/8s, 2016 | | 6,949,000 | 7,192,215 |
|
| NV Energy, Inc. sr. unsec. notes 6 1/4s, 2020 | | 1,370,000 | 1,394,233 |
|
| NV Energy, Inc. sr. unsec. unsub. notes 6 3/4s, 2017 | | 955,000 | 979,503 |
|
| Tennessee Gas Pipeline Co. sr. unsec. unsub. debs. 7s, 2028 | | 520,000 | 577,828 |
|
| Vattenfall Treasury AB company guaranty jr. unsec. | | | |
| sub. bond FRB 5 1/4s, 2049 (Sweden) | EUR | 819,000 | 1,165,091 |
|
| | | | 87,838,878 |
| | | | |
| Total corporate bonds and notes (cost $1,543,899,024) | | | $1,608,933,330 |
| |
| |
| MORTGAGE-BACKED SECURITIES (19.6%)* | Principal amount | Value |
|
| Adjustable Rate Mortgage Trust | | | |
| FRB Ser. 07-1, Class 2A1, 5.646s, 2037 | | $6,294,323 | $3,817,901 |
| FRB Ser. 07-1, Class 5A31, 0.39s, 2037 | | 14,525,425 | 8,025,297 |
|
| Banc of America Commercial Mortgage, Inc. Ser. 07-2, | | | |
| Class A2, 5.634s, 2049 | | 1,832,588 | 1,848,377 |
|
| Banc of America Commercial Mortgage, Inc. 144A | | | |
| Ser. 01-1, Class J, 6 1/8s, 2036 | | 1,170,000 | 959,400 |
| Ser. 01-1, Class K, 6 1/8s, 2036 | | 2,633,000 | 1,965,488 |
| Ser. 07-5, Class XW, IO, 0.427s, 2051 | | 228,668,861 | 3,975,843 |
|
| Banc of America Funding Corp. | | | |
| FRB Ser. 06-D, Class 6A1, 5.429s, 2036 | | 11,426,798 | 7,484,553 |
| FRB Ser. 07-6, Class A1, 0.54s, 2037 | | 10,501,056 | 8,067,226 |
| FRB Ser. 07-B, Class A1, 0.464s, 2047 | | 24,294,012 | 16,034,048 |
|
| Barclays Capital, LLC Trust FRB Ser. 07-AA1, Class 2A1, | | | |
| 0.43s, 2037 | | 39,296,113 | 25,542,473 |
|
35
| | | |
| MORTGAGE-BACKED SECURITIES (19.6%)* cont. | Principal amount | Value |
|
| Bear Stearns Adjustable Rate Mortgage Trust FRB Ser. 07-1, | | | |
| Class 2A1, 5.237s, 2047 | | $15,691,753 | $10,356,557 |
|
| Bear Stearns Alt-A Trust | | | |
| FRB Ser. 06-5, Class 2A2, 5.999s, 2036 | | 20,245,143 | 13,969,149 |
| FRB Ser. 06-5, Class 2A1, 5.637s, 2036 | | 7,055,381 | 4,797,659 |
| FRB Ser. 06-1, Class 23A1, 5 1/2s, 2036 | | 3,750,824 | 2,963,151 |
| Ser. 06-4, Class 22A1, 5.217s, 2036 | | 9,097,071 | 4,684,992 |
| FRB Ser. 07-1, Class 21A1, 5.202s, 2047 | | 7,633,017 | 4,608,205 |
| FRB Ser. 05-10, Class 25A1, 2.671s, 2036 | | 9,646,366 | 6,270,138 |
| FRB Ser. 05-9, Class 11A1, 0.51s, 2035 | | 7,877,676 | 4,450,887 |
|
| Bear Stearns Alt-A Trust II FRB Ser. 07-1, Class 1A1, | | | |
| 5.447s, 2047 | | 48,694,420 | 30,251,408 |
|
| Bear Stearns Asset Backed Securities Trust | | | |
| FRB Ser. 07-AC4, Class A1, 0.55s, 2037 | | 32,248,089 | 16,124,045 |
| FRB Ser. 06-IM1, Class A1, 0.48s, 2036 | | 7,636,902 | 4,080,779 |
|
| Bear Stearns Commercial Mortgage Securities, Inc. 144A | | | |
| Ser. 07-PW18, Class X1, IO, 0.121s, 2050 | | 266,714,888 | 1,650,832 |
|
| Citigroup Mortgage Loan Trust, Inc. | | | |
| FRB Ser. 05-10, Class 1A5A, 5.581s, 2035 | | 3,868,071 | 2,668,969 |
| FRB Ser. 06-AR5, Class 2A5A, 5.473s, 2036 | | 5,548,346 | 3,228,538 |
| FRB Ser. 07-AR5, Class 1A1A, 5.411s, 2037 | | 8,824,445 | 5,496,773 |
| FRB Ser. 07-6, Class 1A3A, 5.284s, 2046 | | 15,615,902 | 8,120,269 |
| FRB Ser. 05-10, Class 1A4A, 2.4s, 2035 | | 6,331,822 | 4,068,196 |
|
| Citigroup/Deutsche Bank Commercial Mortgage Trust 144A | | | |
| Ser. 07-CD5, Class XS, IO, 1/8s, 2044 | | 158,453,751 | 1,027,260 |
|
| Cornerstone Titan PLC 144A | | | |
| FRB Ser. 05-CT1A, Class D, 1.823s, 2014 (United Kingdom) | GBP | 2,491,896 | 2,802,436 |
| FRB Ser. 05-CT2A, Class E, 1.789s, 2014 (United Kingdom) | GBP | 1,094,530 | 1,318,854 |
|
| Countrywide Alternative Loan Trust | | | |
| Ser. 07-16CB, Class 3A1, 6 3/4s, 2037 | | $8,522,052 | 5,306,682 |
| Ser. 07-16CB, Class 4A7, 6s, 2037 | | 4,780,884 | 3,681,281 |
| Ser. 06-45T1, Class 2A2, 6s, 2037 | | 6,559,166 | 4,644,545 |
| Ser. 06-45T1, Class 2A5, 6s, 2037 | | 8,023,338 | 5,776,803 |
| Ser. 06-J8, Class A4, 6s, 2037 | | 6,059,391 | 3,696,229 |
| Ser. 06-40T1, Class 1A11, 6s, 2037 | | 6,091,860 | 4,419,699 |
| Ser. 06-41CB, Class 1A7, 6s, 2037 | | 8,859,164 | 6,600,077 |
| Ser. 07-HY5R, Class 2A1A, 5.544s, 2047 | | 5,214,944 | 4,993,309 |
| Ser. 07-8CB, Class A1, 5 1/2s, 2037 | | 7,063,801 | 5,439,127 |
| FRB Ser. 05-4, Class 2A7, 3/4s, 2035 | | 14,808,677 | 10,842,728 |
| FRB Ser. 06-24CB, Class A13, 0.6s, 2036 | | 10,200,240 | 6,352,837 |
| FRB Ser. 06-OC10, Class 2A2A, 0.43s, 2036 | | 10,821,121 | 5,789,300 |
|
| Countrywide Home Loans | | | |
| FRB Ser. 06-HYB3, Class 2A1A, 4.696s, 2036 ∆ | | 11,077,726 | 7,958,338 |
| FRB Ser. 04-HYB6, Class A2, 3.079s, 2034 | | 5,712,258 | 4,741,174 |
| FRB Ser. 05-HYB4, Class 2A1, 2.87s, 2035 | | 3,669,872 | 2,715,705 |
| FRB Ser. 06-HYB2, Class 2A1B, 2.741s, 2036 | | 13,749,217 | 9,211,975 |
|
| Countrywide Home Loans 144A | | | |
| Ser. 05-R3, Class AS, IO, 5.532s, 2035 | | 324,210 | 39,851 |
| FRB Ser. 05-R3, Class AF, 0.65s, 2035 | | 318,702 | 274,083 |
|
36
| | | |
| MORTGAGE-BACKED SECURITIES (19.6%)* cont. | Principal amount | Value |
|
| Credit Suisse Mortgage Capital Certificates | | | |
| Ser. 07-1, Class 1A4, 6.131s, 2037 | | $8,417,206 | $5,260,754 |
| Ser. 07-C5, Class A3, 5.694s, 2040 | | 15,375,000 | 15,853,590 |
| Ser. 07-C1, Class AAB, 5.336s, 2040 | | 5,087,000 | 5,335,246 |
|
| CS First Boston Mortgage Securities Corp. 144A Ser. 02-CP5, | | | |
| Class M, 5 1/4s, 2035 | | 2,599,000 | 682,533 |
|
| Deutsche Alt-A Securities, Inc. Mortgage Loan Trust FRB | | | |
| Ser. 06-AR1, Class 1A3, 0.58s, 2036 | | 48,850,000 | 23,203,750 |
|
| Deutsche Alternative Securities, Inc. | | | |
| FRB Ser. 06-AR6, Class A6, 0.44s, 2037 | | 27,719,223 | 16,631,534 |
| FRB Ser. 06-AR4, Class A2, 0.44s, 2036 | | 8,698,262 | 4,131,674 |
| FRB Ser. 06-AR3, Class A1, 0.44s, 2036 | | 10,020,225 | 5,147,890 |
|
| DLJ Commercial Mortgage Corp. Ser. 98-CF2, Class B4, | | | |
| 6.04s, 2031 | | 2,235,111 | 2,234,887 |
|
| European Prime Real Estate PLC 144A FRB Ser. 1-A, Class D, | | | |
| 1 5/8s, 2014 (United Kingdom) | GBP | 1,626,522 | 365,844 |
|
| Federal Home Loan Mortgage Corp. | | | |
| IFB Ser. 3182, Class SP, 27.58s, 2032 | | $1,272,611 | 1,973,642 |
| IFB Ser. 3211, Class SI, IO, 26.593s, 2036 | | 1,762,243 | 1,075,726 |
| IFB Ser. 3408, Class EK, 24.767s, 2037 | | 1,130,550 | 1,598,951 |
| IFB Ser. 2979, Class AS, 23.338s, 2034 | | 699,179 | 915,786 |
| IFB Ser. 3105, Class SI, IO, 18.961s, 2036 | | 4,195,815 | 2,008,872 |
| IFB Ser. 3184, Class SP, IO, 7.095s, 2033 | | 5,651,785 | 643,772 |
| IFB Ser. 3727, Class PS, IO, 6.445s, 2038 | | 40,604,807 | 6,550,449 |
| IFB Ser. 3287, Class SE, IO, 6.445s, 2037 | | 17,348,569 | 2,706,724 |
| IFB Ser. 3398, Class SI, IO, 6.395s, 2036 | | 9,417,826 | 1,174,497 |
| IFB Ser. 3677, Class KS, IO, 6.295s, 2040 | | 53,250,626 | 7,564,209 |
| IFB Ser. 3485, Class SI, IO, 6.295s, 2036 | | 9,206,395 | 1,368,991 |
| IFB Ser. 3346, Class SC, IO, 6.295s, 2033 | | 262,092,522 | 38,158,050 |
| IFB Ser. 3346, Class SB, IO, 6.295s, 2033 | | 79,533,573 | 11,493,397 |
| IFB Ser. 3242, Class SC, IO, 6.035s, 2036 | | 8,744,969 | 1,180,571 |
| IFB Ser. 3225, Class EY, IO, 6.035s, 2036 | | 22,137,299 | 2,892,238 |
| IFB Ser. 3751, Class SB, IO, 5.785s, 2039 | | 103,076,061 | 14,430,648 |
| IFB Ser. 3725, Class CS, IO, 5.745s, 2040 | | 92,679,009 | 12,372,648 |
| Ser. 3672, Class PI, IO, 5 1/2s, 2039 | | 23,190,772 | 4,638,386 |
| Ser. 3645, Class ID, IO, 5s, 2040 | | 12,700,160 | 2,176,807 |
| Ser. 3687, Class CI, IO, 5s, 2038 | | 33,643,256 | 6,118,699 |
| Ser. 3653, Class KI, IO, 5s, 2038 | | 47,536,109 | 8,247,040 |
| Ser. 3632, Class CI, IO, 5s, 2038 | | 15,076,872 | 2,693,785 |
| Ser. 3626, Class DI, IO, 5s, 2037 | | 10,694,197 | 1,351,853 |
| Ser. 3623, Class CI, IO, 5s, 2036 | | 9,587,520 | 1,390,190 |
| Ser. 3747, Class HI, IO, 4 1/2s, 2037 | | 11,256,424 | 1,792,408 |
| Ser. 3738, Class MI, IO, 4s, 2034 | | 99,628,042 | 13,226,783 |
| Ser. 3736, Class QI, IO, 4s, 2034 | | 95,384,572 | 12,399,994 |
| Ser. 3740, Class KI, IO, 4s, 2033 | | 53,381,698 | 6,859,548 |
| Ser. 3707, Class HI, IO, 4s, 2023 | | 23,252,258 | 2,611,926 |
| Ser. 3707, Class KI, IO, 4s, 2023 | | 24,939,685 | 2,479,005 |
| Ser. T-56, Class A, IO, 0.524s, 2043 | | 351,213 | 6,585 |
| Ser. T-57, Class 1AX, IO, 0.425s, 2043 | | 10,357,871 | 134,427 |
| Ser. T-56, Class 3, IO, 0.008s, 2043 | | 11,651,908 | 7,282 |
| Ser. T-56, Class 1, IO, zero %, 2043 | | 422,850 | 330 |
37
| | |
| MORTGAGE-BACKED SECURITIES (19.6%)* cont. | Principal amount | Value |
|
| Federal Home Loan Mortgage Corp. | | |
| Ser. T-56, Class 2, IO, zero %, 2043 | $380,791 | $35 |
| Ser. 3369, PO, zero %, 2037 | 11,954 | 10,894 |
| Ser. 3314, PO, zero %, 2036 | 596,184 | 506,691 |
| Ser. 3124, Class DO, PO, zero %, 2036 | 76,450 | 57,206 |
| Ser. 2947, Class AO, PO, zero %, 2035 | 21,136 | 16,983 |
| Ser. 2692, Class TO, PO, zero %, 2033 | 27,634 | 22,280 |
| Ser. 1208, Class F, PO, zero %, 2022 | 184,535 | 164,237 |
| FRB Ser. 3251, Class TC, zero %, 2036 | 292,084 | 287,779 |
| FRB Ser. 3072, Class TJ, zero %, 2035 | 67,114 | 62,006 |
| FRB Ser. 3052, Class TJ, zero %, 2035 | 14,150 | 13,706 |
| FRB Ser. 3326, Class WF, zero %, 2035 | 519,766 | 486,225 |
| FRB Ser. 3030, Class EF, zero %, 2035 | 110,962 | 97,435 |
| FRB Ser. 3033, Class YF, zero %, 2035 | 37,023 | 36,759 |
| FRB Ser. 3412, Class UF, zero %, 2035 | 53,443 | 47,994 |
| FRB Ser. 3007, Class LU, zero %, 2035 | 21,256 | 17,647 |
|
| Federal National Mortgage Association | | |
| IFB Ser. 06-8, Class HP, 23.652s, 2036 | 2,209,830 | 3,053,764 |
| IFB Ser. 05-45, Class DA, 23.505s, 2035 | 4,581,422 | 6,565,592 |
| IFB Ser. 05-83, Class QP, 16.745s, 2034 | 730,430 | 901,599 |
| Ser. 98-T2, Class A4, IO, 6 1/2s, 2036 | 75,301 | 13,554 |
| Ser. 399, Class 2, IO, 5 1/2s, 2039 | 581,202 | 114,311 |
| Ser. 10-21, Class IP, IO, 5s, 2039 | 23,485,364 | 4,344,792 |
| Ser. 09-31, Class PI, IO, 5s, 2038 | 135,417,148 | 23,802,306 |
| Ser. 378, Class 19, IO, 5s, 2035 | 17,627,445 | 3,403,895 |
| Ser. 10-110, Class BI, IO, 5s, 2025 | 93,865,944 | 12,021,411 |
| Ser. 404, Class 2, IO, 4 1/2s, 2040 | 873,024 | 216,005 |
| Ser. 366, Class 22, IO, 4 1/2s, 2035 | 13,768,268 | 1,491,654 |
| Ser. 407, Class 2, IO, 4s, 2041 ∆ | 14,111,589 | 3,369,142 |
| Ser. 406, Class 2, IO, 4s, 2041 | 79,045,341 | 18,401,755 |
| Ser. 406, Class 1, IO, 4s, 2041 | 49,249,620 | 11,667,235 |
| Ser. 405, Class 2, IO, 4s, 2040 | 946,292 | 241,304 |
| Ser. 03-W10, Class 1, IO, 1.554s, 2043 | 12,181,468 | 571,006 |
| Ser. 06-26, Class NB, 1s, 2036 | 9,268 | 9,296 |
| Ser. 00-T6, IO, 0.77s, 2030 | 11,966,959 | 249,212 |
| Ser. 01-T1, Class 1, IO, 0.764s, 2040 | 713,062 | 16,640 |
| Ser. 01-50, Class B1, IO, 0.418s, 2041 | 716,947 | 9,410 |
| Ser. 02-W8, Class 1, IO, 0.34s, 2042 | 17,247,385 | 194,033 |
| Ser. 99-51, Class N, PO, zero %, 2029 | 220,661 | 198,955 |
| IFB Ser. 06-48, Class FG, zero %, 2036 | 132,644 | 131,222 |
|
| FFCA Secured Lending Corp. 144A Ser. 00-1, Class X, IO, | | |
| 1.114s, 2020 | 16,993,082 | 506,054 |
|
| First Union Commercial Mortgage Trust 144A Ser. 99-C1, | | |
| Class G, 5.35s, 2035 | 3,121,100 | 2,132,419 |
|
| GMAC Commercial Mortgage Securities, Inc. 144A Ser. 99-C3, | | |
| Class G, 6.974s, 2036 | 915,838 | 842,571 |
|
| Government National Mortgage Association | | |
| Ser. 06-36, Class OD, PO, zero %, 2036 | 95,985 | 89,772 |
| Ser. 06-64, PO, zero %, 2034 | 190,384 | 166,086 |
| Ser. 99-31, Class MP, PO, zero %, 2029 | 17,656 | 15,979 |
| FRB Ser. 07-73, Class KI, IO, zero %, 2037 | 786,105 | 13,634 |
| FRB Ser. 07-73, Class KM, zero %, 2037 | 78,735 | 68,162 |
|
38
| | |
| MORTGAGE-BACKED SECURITIES (19.6%)* cont. | Principal amount | Value |
|
| GS Mortgage Securities Corp. II 144A Ser. 05-GG4, Class XC, | | |
| IO, 0.285s, 2039 | $458,048,748 | $8,915,890 |
|
| GSC Capital Corp. Mortgage Trust FRB Ser. 06-2, Class A1, | | |
| 0.43s, 2036 | 3,572,811 | 1,836,611 |
|
| GSMPS Mortgage Loan Trust 144A | | |
| Ser. 05-RP1, Class 1AS, IO, 5.949s, 2035 | 351,075 | 49,736 |
| FRB Ser. 05-RP1, Class 1AF, 0.6s, 2035 | 351,075 | 294,903 |
|
| Harborview Mortgage Loan Trust FRB Ser. 05-14, Class 5A1A, | | |
| 5.6s, 2035 | 18,433,859 | 11,982,008 |
|
| HSI Asset Loan Obligation FRB Ser. 07-AR1, Class 2A1, | | |
| 5.835s, 2037 ∆ | 21,042,545 | 14,308,931 |
|
| IMPAC Secured Assets Corp. FRB Ser. 07-2, Class 1A1A, | | |
| 0.36s, 2037 F | 5,720,732 | 3,089,195 |
|
| IndyMac Indx Mortgage Loan Trust | | |
| FRB Ser. 07-AR15, Class 1A1, 5.473s, 2037 | 16,568,437 | 11,238,371 |
| FRB Ser. 06-AR25, Class 5A1, 5.434s, 2036 | 19,662,495 | 11,776,228 |
| FRB Ser. 06-AR25, Class 3A1, 5.399s, 2036 F | 7,566,591 | 4,161,625 |
| FRB Ser. 07-AR9, Class 2A1, 5.384s, 2037 | 5,752,216 | 3,809,002 |
| FRB Ser. 07-AR13, Class 4A1, 5.124s, 2037 | 7,090,711 | 3,585,241 |
| FRB Ser. 06-AR3, Class 3A1B, 5.088s, 2036 | 6,235,254 | 3,865,858 |
| FRB Ser. 07-AR5, Class 2A1, 5.034s, 2037 | 12,376,488 | 7,364,010 |
| FRB Ser. 07-AR7, Class 2A1, 4.808s, 2037 | 11,108,755 | 6,332,213 |
| FRB Ser. 07-AR11, Class 1A1, 4.742s, 2037 | 3,955,841 | 2,314,167 |
| FRB Ser. 06-AR3, Class 2A1A, 3.012s, 2036 | 25,076,442 | 13,737,878 |
| FRB Ser. 05-AR31, Class 3A1, 2.69s, 2036 | 9,475,561 | 6,396,004 |
| FRB Ser. 06-AR27, Class 2A2, 0.45s, 2036 | 8,646,540 | 6,052,578 |
| FRB Ser. 06-AR39, Class A1, 0.43s, 2037 | 51,919,325 | 32,838,973 |
| FRB Ser. 06-AR35, Class 2A1A, 0.42s, 2037 | 19,203,395 | 10,501,070 |
| FRB Ser. 06-AR15, Class A1, 0.37s, 2036 | 23,902,511 | 12,705,619 |
|
| JPMorgan Alternative Loan Trust | | |
| FRB Ser. 06-A7, Class 1A1, 0.41s, 2036 | 15,533,497 | 8,854,093 |
| FRB Ser. 06-A6, Class 1A1, 0.41s, 2036 | 4,411,819 | 2,657,594 |
|
| JPMorgan Chase Commercial Mortgage | | |
| Securities Corp. 144A | | |
| Ser. 07-CB20, Class X1, IO, 0.148s, 2051 | 286,706,029 | 2,773,766 |
| Ser. 05-LDP5, Class X1, IO, 0.078s, 2044 | 1,960,306,005 | 6,823,629 |
|
| LB Commercial Conduit Mortgage Trust 144A | | |
| Ser. 99-C1, Class G, 6.41s, 2031 | 1,960,723 | 1,922,833 |
| Ser. 98-C4, Class J, 5.6s, 2035 | 3,535,000 | 3,578,481 |
|
| Lehman XS Trust FRB Ser. 07-8H, Class A1, 0.38s, 2037 F | 12,114,231 | 6,057,116 |
|
| Luminent Mortgage Trust FRB Ser. 06-7, Class 1A1, 0.43s, | | |
| 2036 | 14,903,342 | 9,538,139 |
|
| Merrill Lynch Alternative Note Asset FRB Ser. 07-AF1, | | |
| Class AV1, 5.036s, 2037 | 7,929,831 | 4,282,108 |
|
| Merrill Lynch Mortgage Investors Trust | | |
| FRB Ser. 06-A4, Class 3A1, 4.141s, 2036 | 17,989,032 | 11,285,329 |
| FRB Ser. 06-A1, Class 1A1, 2.854s, 2036 | 18,030,190 | 11,568,170 |
|
| Merrill Lynch Mortgage Investors, Inc. Ser. 96-C2, | | |
| Class JS, IO, 2.287s, 2028 | 5,211,516 | 172,866 |
|
| Merrill Lynch Mortgage Trust | | |
| FRB Ser. 07-C1, Class A3, 5.828s, 2050 | 1,006,000 | 1,050,420 |
| FRB Ser. 07-C1, Class A2, 5.724s, 2050 | 6,683,583 | 6,855,707 |
|
39
| | | |
| MORTGAGE-BACKED SECURITIES (19.6%)* cont. | Principal amount | Value |
|
| Merrill Lynch/Countrywide Commercial Mortgage Trust | | | |
| Ser. 07-7, Class ASB, 5.745s, 2050 | | $4,138,000 | $4,316,011 |
| FRB Ser. 06-4, Class A2FL, 0.376s, 2049 | | 6,570,542 | 6,340,573 |
|
| Merrill Lynch/Countrywide Commercial Mortgage Trust 144A | | | |
| Ser. 06-4, Class XC, IO, 0.222s, 2049 | | 207,564,670 | 2,516,514 |
|
| Mezz Cap Commercial Mortgage Trust 144A | | | |
| Ser. 04-C1, Class X, IO, 7.667s, 2037 | | 6,300,305 | 370,458 |
| Ser. 07-C5, Class X, IO, 3.985s, 2049 | | 10,168,835 | 714,869 |
|
| Morgan Stanley Capital I Ser. 07-IQ14, Class A2, 5.61s, 2049 | | 123,738 | 124,647 |
|
| Morgan Stanley Capital I 144A FRB Ser. 04-RR, Class F7, 6s, 2039 | | 13,869,752 | 11,199,825 |
|
| Morgan Stanley Mortgage Loan Trust | | | |
| FRB Ser. 06-3AR, Class 3A1, 5.503s, 2036 | | 9,999,285 | 7,099,493 |
| FRB Ser. 07-11AR, Class 2A1, 5.068s, 2037 | | 15,726,423 | 7,934,137 |
| Ser. 05-5AR, Class 2A1, 2.987s, 2035 | | 5,118,042 | 3,377,908 |
| Ser. 06-6AR, Class 2A, 2.674s, 2036 | | 7,237,407 | 4,414,818 |
|
| Mortgage Capital Funding, Inc. Ser. 97-MC2, Class X, IO, | | | |
| 1.233s, 2012 | | 10,424 | 103 |
|
| PNC Mortgage Acceptance Corp. 144A Ser. 00-C1, Class J, | | | |
| 6 5/8s, 2033 | | 880,000 | 35,200 |
|
| Residential Accredit Loans, Inc. | | | |
| FRB Ser. 07-QA4, Class A1B, 0.46s, 2037 | | 11,362,425 | 5,283,527 |
| FRB Ser. 06-QA4, Class A, 0.43s, 2036 | | 9,631,813 | 4,430,634 |
|
| Residential Asset Securitization Trust | | | |
| Ser. 07-A5, Class 2A3, 6s, 2037 | | 9,533,685 | 7,197,932 |
| Ser. 06-A5CB, Class A6, 6s, 2036 | | 9,333,980 | 5,553,718 |
| FRB Ser. 05-A13, Class 1A1, 0.95s, 2035 | | 6,240,938 | 4,321,849 |
| FRB Ser. 05-A2, Class A1, 3/4s, 2035 | | 5,852,646 | 4,738,876 |
|
| STRIPS 144A Ser. 03-1A, Class N, 5s, 2018 | | 1,590,000 | 1,113,000 |
|
| Structured Adjustable Rate Mortgage Loan Trust | | | |
| FRB Ser. 07-10, Class 1A1, 6s, 2037 | | 11,931,203 | 6,144,570 |
| FRB Ser. 06-9, Class 1A1, 5.224s, 2036 | | 3,400,230 | 2,054,799 |
| FRB Ser. 05-18, Class 6A1, 2.697s, 2035 | | 9,220,657 | 7,376,526 |
| FRB Ser. 07-4, Class 1A1, 0.49s, 2037 | | 13,750,130 | 7,081,317 |
|
| Structured Asset Securities Corp. | | | |
| IFB Ser. 07-4, Class 1A3, IO, 5.99s, 2045 | | 138,537,876 | 19,135,544 |
| Ser. 07-4, Class 1A4, IO, 1s, 2045 | | 74,020,442 | 2,044,479 |
|
| Structured Asset Securities Corp. 144A | | | |
| Ser. 05-RF1, Class A, IO, 5.508s, 2035 | | 19,637,596 | 2,085,997 |
| Ser. 05-RF3, Class 1A, IO, 5.315s, 2035 | | 17,572,764 | 2,280,817 |
| FRB Ser. 05-RF3, Class 1A, 0.6s, 2035 | | 17,572,764 | 14,146,075 |
| FRB Ser. 05-RF1, Class A, 0.6s, 2035 | | 19,637,596 | 15,857,359 |
|
| Ursus PLC 144A | | | |
| FRB Ser. 1-A, Class D, 6.938s, 2012 (Ireland) | GBP | 1,294,295 | 103,971 |
| Ser. 1-A, Class X1, IO, 4.925s, 2012 (Ireland) | GBP | 5,000 | 35 |
|
| Wachovia Bank Commercial Mortgage Trust | | | |
| FRB Ser. 07-C32, Class A2, 5.735s, 2049 | | $13,866,683 | 14,411,498 |
| Ser. 07-C34, IO, 0.378s, 2046 | | 78,804,267 | 1,187,580 |
|
| Wachovia Bank Commercial Mortgage Trust 144A FRB | | | |
| Ser. 05-WL5A, Class L, 3.555s, 2018 | | 3,292,000 | 1,975,200 |
|
| Total mortgage-backed securities (cost $1,034,223,069) | | | $1,084,432,235 |
40
| | |
| U.S. GOVERNMENT AND AGENCY | | |
| MORTGAGE OBLIGATIONS (16.3%)* | Principal amount | Value |
|
| U.S. Government Guaranteed Mortgage Obligations (—%) | | |
| Government National Mortgage Association Pass-Through | | |
| Certificates 6 1/2s, November 20, 2038 | $1,622,891 | $1,814,532 |
|
| | | 1,814,532 |
| U.S. Government Agency Mortgage Obligations (16.3%) | | |
| Federal Home Loan Mortgage Corporation | | |
| Pass-Through Certificates | | |
| 3 1/2s, with due dates from December 1, 2040 to February 1, | | |
| 2041 ∆ | 111,502,737 | 104,921,466 |
| 3 1/2s, TBA, April 1, 2041 | 9,000,000 | 8,457,890 |
|
| Federal National Mortgage Association | | |
| Pass-Through Certificates | | |
| 4 1/2s, TBA, April 1, 2041 | 127,000,000 | 129,252,269 |
| 4s, TBA, April 1, 2041 | 294,000,000 | 289,222,500 |
| 3 1/2s, with due dates from December 1, 2040 to March 1, | | |
| 2041 ∆ | 149,350,028 | 140,826,577 |
| 3 1/2s, TBA, April 1, 2041 | 243,000,000 | 228,837,668 |
|
| | | 901,518,370 |
| | |
| Total U.S. government and agency mortgage obligations (cost $902,158,897) | $903,332,902 |
| |
| |
| U.S. TREASURY OBLIGATIONS (0.6%)* | Principal amount | Value |
|
| U.S. Treasury Inflation Protected Securities 1 1/4s, | | |
| July 15, 2020 i | $31,466,813 | $32,598,202 |
|
| Total U.S. treasury obligations (cost $32,598,202) | | $32,598,202 |
| |
| |
| ASSET-BACKED SECURITIES (9.9%)* | Principal amount | Value |
|
| Accredited Mortgage Loan Trust FRB Ser. 07-1, Class A3, | | |
| 0.38s, 2037 | $24,078,000 | $16,613,820 |
|
| Ace Securities Corp. | | |
| FRB Ser. 06-OP2, Class A2C, 0.4s, 2036 | 478,000 | 298,252 |
| FRB Ser. 06-HE3, Class A2C, 0.4s, 2036 | 429,000 | 204,605 |
|
| Aegis Asset Backed Securities Trust FRB Ser. 04-2, | | |
| Class M1, 0.85s, 2034 | 5,998,000 | 4,500,587 |
|
| Asset Backed Securities Corp. Home Equity Loan Trust FRB | | |
| Ser. 06-HE4, Class A5, 0.41s, 2036 | 306,893 | 218,552 |
|
| Bear Stearns Asset Backed Securities, Inc. FRB Ser. 04-FR3, | | |
| Class M6, 5 1/8s, 2034 | 285,150 | 63,129 |
|
| Bombardier Capital Mortgage Securitization Corp. Ser. 00-A, | | |
| Class A4, 8.29s, 2030 | 8,829,659 | 6,269,058 |
|
| Citigroup Mortgage Loan Trust, Inc. FRB Ser. 07-OPX1, | | |
| Class A1A, 0.32s, 2037 | 3,760,442 | 1,729,804 |
|
| Conseco Finance Securitizations Corp. | | |
| Ser. 00-4, Class A6, 8.31s, 2032 | 7,342,010 | 5,582,226 |
| Ser. 00-5, Class A7, 8.2s, 2032 | 445,024 | 371,595 |
| Ser. 00-1, Class A5, 8.06s, 2031 | 2,830,866 | 2,208,076 |
| Ser. 00-4, Class A5, 7.97s, 2032 | 1,169,399 | 964,754 |
| Ser. 00-6, Class A5, 7.27s, 2031 | 5,311,050 | 5,523,492 |
| Ser. 01-3, Class A4, 6.91s, 2033 | 47,957,691 | 49,875,999 |
| FRB Ser. 01-4, Class M1, 2.011s, 2033 | 2,391,000 | 1,263,419 |
|
41
| | | |
| ASSET-BACKED SECURITIES (9.9%)* cont. | Principal amount | Value |
|
| Countrywide Asset Backed Certificates | | | |
| FRB Ser. 07-12, Class 2A2, 3/4s, 2047 F | | $7,545,000 | $5,809,650 |
| FRB Ser. 06-BC1, Class 2A3, 0.54s, 2036 | | 9,191,000 | 6,709,430 |
| FRB Ser. 07-3, Class 2A2, 0.42s, 2047 | | 12,945,000 | 9,640,077 |
| FRB Ser. 07-6, Class 2A2, 0.42s, 2037 | | 7,600,000 | 5,905,960 |
| FRB Ser. 06-8, Class 2A3, 0.41s, 2046 | | 8,980,000 | 5,477,800 |
| FRB Ser. 06-24, Class 2A3, 0.4s, 2047 | | 15,275,000 | 7,713,875 |
| FRB Ser. 06-25, Class 2A2, 0.37s, 2047 | | 11,179,000 | 10,172,890 |
| FRB Ser. 07-1, Class 2A2, 0.35s, 2037 | | 27,658,502 | 22,403,387 |
|
| Credit-Based Asset Servicing and Securitization | | | |
| FRB Ser. 07-CB1, Class AF4, 5.851s, 2037 | | 8,736,080 | 4,542,762 |
| FRB Ser. 07-CB3, Class A4, 5.419s, 2037 | | 10,434,000 | 5,634,360 |
| FRB Ser. 06-CB9, Class A2, 0.36s, 2036 | | 19,187,000 | 8,730,085 |
| FRB Ser. 07-CB1, Class AF1A, 0.32s, 2037 | | 3,651,920 | 1,179,533 |
|
| Crest, Ltd. 144A Ser. 03-2A, Class E2, 8s, 2038 | | 3,636,760 | 72,735 |
|
| First Franklin Mortgage Loan Asset Backed Certificates | | | |
| FRB Ser. 07-FF1, Class A2D, 0.47s, 2038 | | 10,316,000 | 4,925,550 |
| FRB Ser. 06-FF18, Class A2C, 0.41s, 2037 | | 20,688,000 | 9,619,920 |
| FRB Ser. 06-FF11, Class 2A3, 0.4s, 2036 | | 15,794,000 | 9,338,203 |
| FRB Ser. 06-FF7, Class 2A3, 0.4s, 2036 | | 4,228,511 | 2,850,138 |
| FRB Ser. 07-FF1, Class A2C, 0.39s, 2038 | | 15,718,000 | 7,185,657 |
|
| Fremont Home Loan Trust FRB Ser. 06-2, Class 2A3, 0.42s, 2036 | | 1,320,000 | 836,770 |
|
| G-Star, Ltd. 144A FRB Ser. 02-2A, Class BFL, 2 1/4s, 2037 | | 614,000 | 104,380 |
|
| Granite Mortgages PLC | | | |
| FRB Ser. 03-2, Class 2C1, 3.562s, 2043 F | EUR | 10,080,000 | 7,570,729 |
| FRB Ser. 03-2, Class 3C, 3.326s, 2043 F | GBP | 4,838,514 | 3,634,037 |
|
| Green Tree Financial Corp. | | | |
| Ser. 94-6, Class B2, 9s, 2020 | | $6,412,289 | 4,488,603 |
| Ser. 94-4, Class B2, 8.6s, 2019 | | 2,435,352 | 1,255,403 |
| Ser. 93-1, Class B, 8.45s, 2018 | | 991,071 | 788,681 |
| Ser. 99-5, Class A5, 7.86s, 2029 | | 11,567,152 | 10,583,944 |
| Ser. 96-8, Class M1, 7.85s, 2027 | | 2,979,000 | 2,866,318 |
| Ser. 99-5, Class A6, 7 1/2s, 2030 | | 8,112,977 | 7,382,809 |
| Ser. 95-8, Class B1, 7.3s, 2026 | | 2,796,090 | 2,718,614 |
| Ser. 95-4, Class B1, 7.3s, 2025 | | 2,737,142 | 2,577,287 |
| Ser. 95-F, Class B2, 7.1s, 2021 | | 116,069 | 114,149 |
| Ser. 99-3, Class A7, 6.74s, 2031 | | 5,728,208 | 5,728,208 |
| Ser. 99-3, Class A9, 6.53s, 2031 | | 5,848,460 | 5,526,795 |
|
| Green Tree Home Improvement Loan Trust Ser. 95-D, Class B2, | | | |
| 7.45s, 2025 | | 105,356 | 90,684 |
|
| Greenpoint Manufactured Housing Ser. 00-3, Class IA, 8.45s, 2031 | | 13,794,473 | 14,208,307 |
|
| GSAA Home Equity Trust | | | |
| FRB Ser. 05-15, Class 2A2, 1/2s, 2036 | | 10,508,000 | 7,492,309 |
| FRB Ser. 05-11, Class 3A4, 1/2s, 2035 | | 18,106,070 | 15,390,160 |
| FRB Ser. 06-19, Class A3A, 0.49s, 2036 | | 6,137,217 | 3,160,667 |
| FRB Ser. 06-11, Class 2A2, 0.41s, 2036 | | 37,301,667 | 19,583,375 |
| FRB Ser. 07-4, Class A1, 0.35s, 2037 | | 22,061,857 | 11,135,612 |
| FRB Ser. 06-19, Class A1, 0.34s, 2036 | | 13,542,653 | 6,893,617 |
| FRB Ser. 06-17, Class A1, 0.31s, 2036 | | 38,425,673 | 18,828,580 |
| FRB Ser. 06-12, Class A1, 0.3s, 2036 | | 34,944,584 | 18,258,545 |
|
42
| | |
| ASSET-BACKED SECURITIES (9.9%)* cont. | Principal amount | Value |
|
| GSAMP Trust | | |
| FRB Ser. 07-FM1, Class A2D, 1/2s, 2036 | $24,247,000 | $9,904,900 |
| FRB Ser. 07-FM1, Class A2C, 0.42s, 2036 | 13,499,000 | 5,446,847 |
| FRB Ser. 07-HE2, Class A2A, 0.37s, 2047 | 3,284,563 | 3,101,448 |
|
| Guggenheim Structured Real Estate Funding, Ltd. 144A | | |
| FRB Ser. 05-2A, Class E, 2 1/4s, 2030 | 2,553,501 | 114,908 |
| FRB Ser. 05-1A, Class E, 2.05s, 2030 | 63,993 | 11,519 |
|
| HSI Asset Securitization Corp. Trust FRB Ser. 06-HE1, | | |
| Class 2A1, 0.3s, 2036 | 1,648,600 | 1,205,538 |
|
| JPMorgan Mortgage Acquisition Corp. FRB Ser. 06-WMC3, | | |
| Class A4, 0.4s, 2036 | 13,300,161 | 5,719,069 |
|
| Lehman XS Trust | | |
| FRB Ser. 07-3, Class 1BA2, 6.17s, 2037 | 13,483,526 | 6,303,549 |
| FRB Ser. 07-1, Class 1A3, 0.37s, 2037 | 53,857,641 | 22,860,953 |
|
| Long Beach Mortgage Loan Trust | | |
| FRB Ser. 06-4, Class 2A4, 0.51s, 2036 | 524,317 | 204,373 |
| FRB Ser. 06-WL1, Class 2A3, 0.49s, 2046 | 7,447,945 | 5,176,322 |
| FRB Ser. 06-6, Class 2A3, 0.4s, 2036 | 14,022,000 | 5,749,020 |
|
| Madison Avenue Manufactured Housing Contract FRB Ser. 02-A, | | |
| Class B1, 3 1/2s, 2032 | 8,794,511 | 8,222,868 |
|
| Merrill Lynch First Franklin Mortgage Loan Asset Backed | | |
| Certificates FRB Ser. 07-1, Class A2B, 0.42s, 2037 | 14,706,009 | 8,235,365 |
|
| Merrill Lynch Mortgage Investors Trust FRB Ser. 07-HE1, | | |
| Class A2B, 0.42s, 2037 | 15,160,403 | 5,834,390 |
|
| Mid-State Trust Ser. 11, Class B, 8.221s, 2038 | 866,855 | 827,773 |
|
| Morgan Stanley Capital, Inc. | | |
| FRB Ser. 04-HE8, Class B3, 3.45s, 2034 | 374,424 | 82,873 |
| FRB Ser. 06-WMC2, Class A2C, 0.4s, 2036 | 13,528,267 | 4,661,841 |
|
| N-Star Real Estate CDO, Ltd. 144A FRB Ser. 1A, Class C1A, | | |
| 3.311s, 2038 | 2,000,000 | 1,540,000 |
|
| Neon Capital, Ltd. 144A | | |
| limited recourse sec. notes Ser. 95, 2.319s, 2013 | | |
| (Cayman Islands) F g | 2,028,770 | 735,733 |
| limited recourse sec. notes Ser. 97, 1.105s, 2013 | | |
| (Cayman Islands) F g | 2,649,208 | 726,302 |
|
| Novastar Home Equity Loan | | |
| FRB Ser. 06-1, Class A2C, 0.41s, 2036 | 539,253 | 292,275 |
| FRB Ser. 06-2, Class A2C, 0.4s, 2036 | 663,000 | 367,997 |
| FRB Ser. 06-6, Class A2B, 0.35s, 2037 | 10,473,863 | 7,000,856 |
|
| Oakwood Mortgage Investors, Inc. | | |
| Ser. 99-D, Class A1, 7.84s, 2029 | 5,183,126 | 5,234,957 |
| Ser. 00-D, Class A4, 7.4s, 2030 | 15,672,955 | 10,971,068 |
| Ser. 02-B, Class A4, 7.09s, 2032 | 2,927,583 | 2,954,841 |
| Ser. 99-B, Class A4, 6.99s, 2026 | 5,250,273 | 5,250,273 |
| Ser. 01-D, Class A4, 6.93s, 2031 | 133,753 | 111,350 |
| Ser. 01-C, Class A2, 5.92s, 2017 | 7,405,347 | 4,072,941 |
| Ser. 02-C, Class A1, 5.41s, 2032 | 11,256,661 | 10,947,103 |
| Ser. 01-C, Class A1, 5.16s, 2012 | 663,519 | 312,232 |
| Ser. 01-E, Class A2, 5.05s, 2031 | 4,962,342 | 3,994,685 |
| Ser. 02-A, Class A2, 5.01s, 2020 | 325,925 | 297,720 |
|
43
| | | |
| ASSET-BACKED SECURITIES (9.9%)* cont. | Principal amount | Value |
|
| Oakwood Mortgage Investors, Inc. 144A | | | |
| Ser. 01-B, Class A4, 7.21s, 2030 | | $457,112 | $443,398 |
| FRB Ser. 01-B, Class A2, 0.63s, 2018 | | 194,588 | 171,953 |
|
| Residential Asset Mortgage Products, Inc. FRB Ser. 07-RZ1, | | | |
| Class A2, 0.41s, 2037 | | 657,000 | 428,612 |
|
| SG Mortgage Securities Trust FRB Ser. 06-OPT2, Class A3D, | | | |
| 0.46s, 2036 | | 1,124,000 | 434,727 |
|
| Soundview Home Equity Loan Trust FRB Ser. 06-OPT3, | | | |
| Class 2A3, 0.42s, 2036 | | 532,000 | 430,790 |
|
| Structured Asset Securities Corp. 144A Ser. 98-RF3, | | | |
| Class A, IO, 6.1s, 2028 | | 1,209,795 | 182,751 |
|
| TIAA Real Estate CDO, Ltd. Ser. 03-1A, Class E, 8s, 2038 | | 3,844,150 | 461,298 |
|
| TIAA Real Estate CDO, Ltd. 144A Ser. 02-1A, Class IV, | | | |
| 6.84s, 2037 | | 2,403,000 | 841,050 |
|
| Total asset-backed securities (cost $550,835,240) | | | $546,686,431 |
| |
| |
| FOREIGN GOVERNMENT BONDS AND NOTES (7.2%)* | Principal amount/units | Value |
|
| Argentina (Republic of) sr. unsec. bonds Ser. VII, 7s, 2013 | | $3,495,000 | $3,557,910 |
|
| Argentina (Republic of) sr. unsec. bonds FRB 0.45s, 2013 | | 13,993,000 | 5,009,494 |
|
| Argentina (Republic of) sr. unsec. unsub. bonds 7s, 2015 | | 84,418,000 | 79,479,547 |
|
| Argentina (Republic of) sr. unsec. unsub. bonds Ser. $V, | | | |
| 10 1/2s, 2012 | ARS | 6,340,000 | 1,548,840 |
|
| Argentina (Republic of) sr. unsec. unsub. bonds FRB 0.467s, 2012 | | $286,186,000 | 69,400,105 |
|
| Argentina (Republic of) sr. unsec. unsub. notes Ser. NY, | | | |
| 8.28s, 2033 | | 5,190,795 | 4,632,785 |
|
| Banco Nacional de Desenvolvimento Economico e Social 144A | | | |
| notes 5 1/2s, 2020 (Brazil) | | 4,080,000 | 4,151,400 |
|
| Banco Nacional de Desenvolvimento Economico e Social 144A | | | |
| sr. unsec. unsub. notes 6.369s, 2018 (Brazil) | | 540,000 | 587,250 |
|
| Brazil (Federal Republic of) notes 10s, 2017 | BRL | 7,250 | 4,042,554 |
|
| Brazil (Federal Republic of) unsub. notes 10s, 2014 | BRL | 20,095 | 11,819,115 |
|
| Chile (Republic of) notes 5 1/2s, 2020 | CLP | 1,856,500,000 | 3,900,733 |
|
| Colombia (Government of) bonds 6 1/8s, 2041 | | $2,875,000 | 2,932,500 |
|
| Croatia (Republic of) 144A sr. unsec. unsub. notes 6 3/8s, 2021 | | 3,725,000 | 3,729,656 |
|
| Export-Import Bank of Korea 144A sr. unsec. unsub. notes | | | |
| 5.1s, 2013 (South Korea) | INR | 286,400,000 | 6,081,223 |
|
| Ghana (Republic of) 144A unsec. notes 8 1/2s, 2017 | | $9,340,000 | 10,367,960 |
|
| Hungary (Republic of) sr. unsec. unsub. notes 7 5/8s, 2041 | | 4,000,000 | 4,017,080 |
|
| Hungary (Republic of) sr. unsec. unsub. notes 6 3/8s, 2021 | | 3,945,000 | 3,949,931 |
|
| Indonesia (Republic of) 144A sr. unsec. notes 11 5/8s, 2019 | | 2,560,000 | 3,642,266 |
|
| Indonesia (Republic of) 144A sr. unsec. unsub. bonds 7 3/4s, 2038 | | 1,875,000 | 2,235,938 |
|
| Indonesia (Republic of) 144A sr. unsec. unsub. bonds 6 7/8s, 2018 | | 3,775,000 | 4,275,188 |
|
| Indonesia (Republic of) 144A sr. unsec. unsub. bonds 6 3/4s, 2014 | | 1,310,000 | 1,450,733 |
|
| Indonesia (Republic of) 144A sr. unsec. unsub. bonds 6 5/8s, 2037 | | 3,255,000 | 3,465,436 |
|
| Iraq (Republic of) 144A bonds 5.8s, 2028 | | 2,905,000 | 2,666,790 |
|
| Italy (Republic of) bonds 4 1/4s, 2020 | EUR | 28,570,000 | 39,705,047 |
|
| Peru (Republic of) bonds 6.95s, 2031 | PEN | 30,650,000 | 10,776,892 |
|
| Philippines (Republic of) sr. unsec. unsub. bonds 6 1/2s, 2020 | | $4,450,000 | 5,034,063 |
|
44
| | | |
| FOREIGN GOVERNMENT BONDS AND NOTES (7.2%)* cont. | Principal amount/units | Value |
|
| Philippines (Republic of) sr. unsec. unsub. bonds 6 3/8s, 2034 | | $7,100,000 | $7,488,796 |
|
| Russia (Federation of) sr. unsec. unsub. bonds 7 1/2s, 2030 | | 884,765 | 1,026,947 |
|
| South Africa (Republic of) sr. unsec. unsub. notes 6 7/8s, 2019 | | 2,565,000 | 2,978,606 |
|
| Sri Lanka (Republic of) 144A notes 7.4s, 2015 | | 1,300,000 | 1,390,961 |
|
| Turkey (Republic of) bonds 16s, 2012 | TRY | 885,000 | 609,696 |
|
| Turkey (Republic of) sr. unsec. bonds 5 5/8s, 2021 | | $6,800,000 | 6,936,000 |
|
| Turkey (Republic of) sr. unsec. notes 7 1/2s, 2019 | | 1,660,000 | 1,913,930 |
|
| Turkey (Republic of) sr. unsec. notes 7 1/2s, 2017 | | 11,515,000 | 13,239,486 |
|
| Turkey (Republic of) unsec. notes 6 3/4s, 2040 | | 6,760,000 | 6,978,416 |
|
| Ukraine (Government of ) Financing of Infrastructural | | | |
| Projects State Enterprise 144A govt. guaranty notes 8 3/8s, 2017 | | 2,700,000 | 2,835,000 |
|
| Ukraine (Government of) sr. unsec. bonds 6.385s, 2012 | | 2,875,000 | 2,967,863 |
|
| Ukraine (Government of) 144A bonds 7 3/4s, 2020 | | 20,475,000 | 21,114,844 |
|
| Ukraine (Government of) 144A sr. unsec. notes 7.95s, 2021 | | 13,065,000 | 13,146,526 |
|
| Ukraine (Government of) 144A sr. unsec. unsub. notes 7.65s, 2013 | | 4,310,000 | 4,547,050 |
|
| United Mexican States sr. unsec. notes Ser. A, 6.05s, 2040 | | 725,000 | 746,750 |
|
| Venezuela (Republic of) bonds 8 1/2s, 2014 | | 2,850,000 | 2,583,468 |
|
| Venezuela (Republic of) sr. unsec. bonds 9 1/4s, 2027 | | 3,600,000 | 2,655,000 |
|
| Venezuela (Republic of) unsec. notes 10 3/4s, 2013 | | 4,150,000 | 4,153,196 |
|
| Venezuela (Republic of) unsec. notes FRN Ser. REGS, 1.303s, 2011 | | 3,250,000 | 3,239,340 |
|
| Venezuela (Republic of) 144A unsec. bonds 13 5/8s, 2018 | | 4,935,000 | 4,670,484 |
|
| Total foreign government bonds and notes (cost $367,414,675) | | | $397,682,795 |
| |
| |
| SENIOR LOANS (1.9%)* c | Principal amount | Value |
|
| Basic materials (0.1%) | | | |
| Georgia-Pacific, LLC bank term loan FRN Ser. B2, 2.303s, 2012 | | $222,530 | $222,303 |
|
| Ineos Holdings, Ltd. bank term loan FRN Ser. B2, 7.501s, | | | |
| 2013 (United Kingdom) ∆ | | 1,212,975 | 1,246,712 |
|
| Ineos Holdings, Ltd. bank term loan FRN Ser. C2, 8.001s, | | | |
| 2014 (United Kingdom) ∆ | | 1,287,025 | 1,322,821 |
|
| Momentive Performance Materials, Inc. bank term loan FRN | | | |
| 3.813s, 2013 | | 1,711,593 | 1,691,268 |
|
| Smurfit-Stone Container Enterprises, Inc. bank term loan | | | |
| FRN 6 3/4s, 2016 | | 571,282 | 572,354 |
|
| | | | 5,055,458 |
| Capital goods (—%) | | | |
| Pinafore, LLC bank term loan FRN Ser. B1, 4 1/4s, 2016 | | 624,938 | 626,344 |
|
| | | | 626,344 |
| Communication services (0.2%) | | | |
| CCO Holdings, LLC / CCO Holdings Capital Corp. bank term | | | |
| loan FRN 2.762s, 2014 | | 900,000 | 879,750 |
|
| Charter Communications Operating, LLC bank term loan FRN | | | |
| Ser. l, 7 1/4s, 2014 | | 389,533 | 390,994 |
|
| Charter Communications, Inc. bank term loan FRN Ser. C, | | | |
| 3.56s, 2016 | | 2,711,165 | 2,704,371 |
|
| Intelsat Jackson Holdings SA bank term loan FRN 3.303s, | | | |
| 2014 (Luxembourg) | | 1,987,780 | 1,946,782 |
|
| Level 3 Communications, Inc. bank term loan FRN 2.553s, 2014 | | 3,754,000 | 3,643,985 |
|
| Level 3 Financing, Inc. bank term loan FRN Ser. B, 11 1/2s, 2014 | | 280,000 | 299,040 |
|
| | | | 9,864,922 |
45
| | |
| SENIOR LOANS (1.9%)* c cont. | Principal amount | Value |
|
| Consumer cyclicals (0.8%) | | |
| Advantage Sales & Marketing, LLC bank term loan FRN 9 1/4s, 2018 | $270,000 | $274,388 |
|
| Brickman Group Holdings, Inc. bank term loan FRN Ser. B, | | |
| 7 1/4s, 2016 | 5,411,438 | 5,512,902 |
|
| Burlington Coat Factory Warehouse Corp. bank term loan FRN | | |
| Ser. B, 6 1/4s, 2017 | 690,000 | 680,405 |
|
| Caesars Entertainment Operating Co., Inc. bank term loan FRN Ser. B1, | | |
| 3.303s, 2015 | 2,870,000 | 2,654,302 |
|
| Caesars Entertainment Operating Co., Inc. bank term loan FRN Ser. B2, | | |
| 3.303s, 2015 | 3,653,635 | 3,379,042 |
|
| CCM Merger, Inc. bank term loan FRN Ser. B, 7s, 2017 | 3,470,000 | 3,511,206 |
|
| Cedar Fair LP bank term loan FRN 4s, 2017 | 844,754 | 847,916 |
|
| Cengage Learning Acquisitions, Inc. bank term loan FRN | | |
| Ser. B, 2.55s, 2014 | 3,698,468 | 3,540,847 |
|
| Clear Channel Communications, Inc. bank term loan FRN | | |
| Ser. B, 3.912s, 2016 | 4,284,276 | 3,767,189 |
|
| Compucom Systems, Inc. bank term loan FRN 3.77s, 2014 | 459,631 | 443,544 |
|
| Dex Media West, LLC bank term loan FRN Ser. A, 7s, 2014 | 698,103 | 618,549 |
|
| Federal Mogul Corp. bank term loan FRN Ser. B, 2.196s, 2014 | 879,442 | 856,828 |
|
| Federal Mogul Corp. bank term loan FRN Ser. C, 2.189s, 2015 | 448,695 | 437,157 |
|
| GateHouse Media, Inc. bank term loan FRN Ser. B, 2.52s, 2014 | 874,808 | 388,415 |
|
| GateHouse Media, Inc. bank term loan FRN Ser. B, 2.27s, 2014 ∆ | 2,041,991 | 906,644 |
|
| GateHouse Media, Inc. bank term loan FRN Ser. DD, 2.27s, 2014 ∆ | 761,937 | 338,300 |
|
| Golden Nugget, Inc. bank term loan FRN 2.268s, 2014 ‡‡ | 228,566 | 196,710 |
|
| Golden Nugget, Inc. bank term loan FRN Ser. B, 2.27s, 2014 ‡‡ | 401,536 | 345,572 |
|
| Goodman Global, Inc. bank term loan FRN 9s, 2017 | 1,758,000 | 1,805,246 |
|
| Goodman Global, Inc. bank term loan FRN 5 3/4s, 2016 | 3,056,640 | 3,069,994 |
|
| Michaels Stores, Inc. bank term loan FRN Ser. B, 2.584s, 2013 | 467,248 | 462,446 |
|
| National Bedding Co., LLC bank term loan FRN Ser. B, | | |
| 3.818s, 2013 | 229,870 | 229,008 |
|
| R.H. Donnelley, Inc. bank term loan FRN Ser. B, 9s, 2014 | 70,767 | 55,464 |
|
| Realogy Corp. bank term loan FRN Ser. B, 4.562s, 2016 | 1,674,366 | 1,574,951 |
|
| Revel Entertainment, LLC bank term loan FRN Ser. B, 9s, 2017 | 600,000 | 579,938 |
|
| ServiceMaster Co. (The) bank term loan FRN Ser. B, 2.779s, 2014 | 2,441,148 | 2,392,762 |
|
| ServiceMaster Co. (The) bank term loan FRN Ser. DD, 2.77s, 2014 | 242,937 | 238,122 |
|
| Six Flags Theme Parks bank term loan FRN Ser. B, 5 1/4s, 2016 | 2,075,357 | 2,086,772 |
|
| Texas Competitive Electric Holdings Co., LLC bank term loan FRN | | |
| Ser. B3, 3.761s, 2014 ∆ | 1,727,783 | 1,451,338 |
|
| Tribune Co. bank term loan FRN Ser. B, 5 1/4s, 2014 (In default) † | 3,221,563 | 2,242,510 |
|
| Univision Communications, Inc. bank term loan FRN 4.512s, 2017 | 1,020,833 | 992,760 |
|
| | | 45,881,227 |
| Consumer staples (0.3%) | | |
| Amscan Holdings, Inc. bank term loan FRN 6.752s, 2017 | 1,492,500 | 1,500,336 |
|
| Claire’s Stores, Inc. bank term loan FRN 3.026s, 2014 | 2,439,523 | 2,325,339 |
|
| Del Monte Foods Co. bank term loan FRN Ser. B, 4 1/2s, 2018 | 1,505,000 | 1,505,235 |
|
| Revlon Consumer Products bank term loan FRN 6.001s, 2015 | 9,405,000 | 9,428,512 |
|
| Rite-Aid Corp. bank term loan FRN Ser. B, 2.013s, 2014 | 411,157 | 395,019 |
|
| West Corp. bank term loan FRN Ser. B2, 2.743s, 2013 | 67,761 | 67,369 |
|
| West Corp. bank term loan FRN Ser. B5, 4.618s, 2016 | 164,805 | 164,943 |
|
| | | 15,386,753 |
46
| | | | |
| SENIOR LOANS (1.9%)* c cont. | Principal amount | Value |
|
| Energy (0.1%) | | | |
| EPCO Holdings, Inc. bank term loan FRN Ser. A, 1 1/4s, 2012 | $918,182 | $899,818 |
|
| Hercules Offshore, Inc. bank term loan FRN Ser. B, 7 1/2s, 2013 | 614,479 | 603,506 |
|
| MEG Energy Corp. bank term loan FRN Ser. B, 4s, 2018 (Canada) ∆ | 1,590,000 | 1,598,745 |
|
| | | | 3,102,069 |
| Financials (—%) | | | |
| AGFS Funding Co. bank term loan FRN 7 1/4s, 2015 | | 1,040,000 | 1,040,488 |
|
| Fifth Third Processing Solutions, Inc. bank term loan FRN | | |
| 8 1/4s, 2017 | | 535,000 | 542,356 |
|
| HUB International Holdings, Inc. bank term loan FRN 6 3/4s, 2014 | 513,185 | 509,849 |
|
| | | | 2,092,693 |
| Health care (0.3%) | | | |
| Ardent Health Systems bank term loan FRN Ser. B, 6 1/2s, 2015 | 1,596,840 | 1,602,163 |
|
| Axcan Intermediate Holdings, Inc. bank term loan FRN | | | |
| Ser. B, 5 1/2s, 2017 | | 892,763 | 890,252 |
|
| Carestream Health, Inc. bank term loan FRN Ser. B, 5s, 2017 | 1,960,000 | 1,916,206 |
|
| Grifols SA bank term loan FRN Ser. B, 6s, 2016 (Spain) ∆ | | 1,230,000 | 1,237,688 |
|
| Health Management Associates, Inc. bank term loan FRN | | |
| 2.053s, 2014 | | 2,570,061 | 2,530,868 |
|
| IASIS Healthcare Corp. bank term loan FRN 5.554s, 2014 ‡‡ | 2,783,174 | 2,746,612 |
|
| IASIS Healthcare, LLC bank term loan FRN 7.62s, 2014 | | 115,819 | 114,733 |
|
| IASIS Healthcare, LLC bank term loan FRN Ser. B, 2.262s, 2014 | 1,220,268 | 1,208,828 |
|
| IASIS Healthcare, LLC bank term loan FRN Ser. DD, 2.262s, 2014 | 422,377 | 418,417 |
|
| Multiplan, Inc. bank term loan FRN Ser. B, 4 3/4s, 2017 | | 1,742,278 | 1,747,069 |
|
| | | | 14,412,836 |
| Technology (0.1%) | | | |
| Avaya, Inc. bank term loan FRN Ser. B3, 4.811s, 2017 | | 969,546 | 945,302 |
|
| Ceridian Corp. bank term loan FRN 3.253s, 2014 | | 2,755,000 | 2,672,350 |
|
| First Data Corp. bank term loan FRN Ser. B3, 3.002s, 2014 | 677,148 | 647,899 |
|
| | | | 4,265,551 |
| Utilities and power (—%) | | | |
| NRG Energy, Inc. bank term loan FRN 3.553s, 2015 | | 642,505 | 637,786 |
|
| NRG Energy, Inc. bank term loan FRN 2.245s, 2013 | | 114,729 | 115,015 |
|
| NRG Energy, Inc. bank term loan FRN 2.053s, 2013 | | 246 | 244 |
|
| NRG Energy, Inc. bank term loan FRN Ser. B, 3.553s, 2015 | 761,080 | 763,934 |
|
| Texas Competitive Electric Holdings Co., LLC bank term loan | | |
| FRN Ser. B2, 3.786s, 2014 | | 1,040,597 | 875,774 |
|
| | | | 2,392,753 |
| | | | |
| Total senior loans (cost $104,290,101) | | | $103,080,606 |
| |
| |
| PURCHASED OPTIONS | Expiration date/ | Contract | |
| OUTSTANDING (0.2%)* | strike price | amount | Value |
|
| Option on an interest rate swap with Barclay’s | | | |
| Bank PLC for the right to pay a fixed rate | | | |
| of 3.96% versus the three month USD-LIBOR-BBA | | | |
| maturing June 3, 2021. | Jun-11/3.96 | $548,164,500 | $2,932,679 |
|
| Option on an interest rate swap with Credit | | | |
| Suisse International for the right to pay a | | | |
| fixed rate of 1.70175% versus the six month | | | |
| CHF-LIBOR-BBA maturing January 23, 2014. | Jan-12/1.70175 | CHF | 186,840,000 | 720,281 |
|
47
| | | | |
| PURCHASED OPTIONS | Expiration date/ | Contract | |
| OUTSTANDING (0.2%)* cont. | strike price | amount | Value |
|
| Option on an interest rate swap with Credit | | | |
| Suisse International for the right to pay a | | | |
| fixed rate of 1.578% versus the six month | | | |
| CHF-LIBOR-BBA maturing December 24, 2013. | Dec-11/1.578 | CHF | 200,160,000 | $764,031 |
|
| Option on an interest rate swap with Credit | | | |
| Suisse International for the right to pay a | | | |
| fixed rate of 1.602% versus the six month | | | |
| CHF-LIBOR-BBA maturing December 22, 2013. | Dec-11/1.602 | CHF | 200,160,000 | 722,680 |
|
| Option on an interest rate swap with JPMorgan | | | |
| Chase Bank, N.A. for the right to receive a | | | |
| fixed rate of 3.59% versus the three month | | | |
| USD-LIBOR-BBA maturing April 28, 2021. | Apr-11/3.59 | $288,507,567 | 2,812,949 |
|
| Option on an interest rate swap with UBS AG for | | | |
| the right to pay a fixed rate of 1.722% versus | | | |
| the six month CHF-LIBOR-BBA maturing | | | |
| January 23, 2014. | Jan-12/1.722 | CHF | 213,480,000 | 795,818 |
|
| Total purchased options outstanding (cost $13,491,261) | | $8,748,438 |
| |
| |
| CONVERTIBLE BONDS AND NOTES (0.1%)* | | Principal amount | Value |
|
| Advanced Micro Devices, Inc. cv. sr. unsec. notes 6s, 2015 | $1,635,000 | $1,686,094 |
|
| Ford Motor Co. cv. sr. unsec. notes 4 1/4s, 2016 | | 1,064,000 | 1,929,947 |
|
| General Growth Properties, Inc. 144A cv. escrow funding bonds | | |
| zero %, 2027 F R | | 2,030,000 | 2,538 |
|
| Meritor, Inc. cv. company guaranty sr. unsec. notes 4s, 2027 | 2,400,000 | 2,367,000 |
|
| Steel Dynamics, Inc. cv. sr. notes 5 1/8s, 2014 | | 1,045,000 | 1,334,988 |
|
| Total convertible bonds and notes (cost $6,085,687) | | | $7,320,567 |
| |
| |
| SHORT-TERM INVESTMENTS (34.8%)* | Principal amount/shares | Value |
|
| Putnam Money Market Liquidity Fund 0.13% e | | 353,247,331 | $353,247,331 |
|
| U.S. Treasury Bills with an effective yield of 0.24%, | | | |
| August 25, 2011 # ## | | $22,793,000 | 22,770,549 |
|
| U.S. Treasury Bills with an effective yield of 0.05%, | | | |
| April 21, 2011 ## | | 225,000,000 | 224,994,202 |
|
| U.S. Treasury Bills with effective yields ranging from | | | |
| 0.20% to 0.27%, June 2, 2011 # ## | | 266,487,000 | 266,363,352 |
|
| U.S. Treasury Bills with effective yields ranging from | | | |
| 0.22% to 0.24%, July 28, 2011 # ## | | 126,394,000 | 126,288,585 |
|
| U.S. Treasury Bills with effective yields ranging from | | | |
| 0.04% to 0.06%, April 7, 2011 | | 395,000,000 | 394,996,840 |
|
| U.S. Treasury Cash Management Bills with effective yields | | |
| ranging from 0.06% to 0.11%, April 15, 2011 | | 540,000,000 | 539,984,934 |
|
| Total short-term investments (cost $1,928,677,453) | | | $1,928,645,793 |
| |
| |
| TOTAL INVESTMENTS | | | |
|
| Total investments (cost $6,483,673,609) | | | $6,621,461,299 |
48
| |
| Key to holding’s currency abbreviations |
| | |
| ARS | Argentine Peso |
| AUD | Australian Dollar |
| BRL | Brazilian Real |
| CAD | Canadian Dollar |
| CHF | Swiss Franc |
| CLP | Chilean Peso |
| EUR | Euro |
| GBP | British Pound |
| INR | Indian Rupee |
| JPY | Japanese Yen |
| MXN | Mexican Peso |
| PEN | Peruvian Neuvo Sol |
| RUB | Russian Ruble |
| SEK | Swedish Krona |
| TRY | Turkish Lira |
| USD / $ | United States Dollar |
| |
| Key to holding’s abbreviations |
| | |
| EMTN | Euro Medium Term Notes |
| FRB | Floating Rate Bonds |
| FRN | Floating Rate Notes |
| IFB | Inverse Floating Rate Bonds |
| IO | Interest Only |
| MTN | Medium Term Notes |
| OAO | Open Joint Stock Company |
| OJSC | Open Joint Stock Company |
| PO | Principal Only |
| TBA | To Be Announced Commitments |
Notes to the fund’s portfolio
Unless noted otherwise, the notes to the fund’s portfolio are for the close of the fund’s reporting period, which ran from October 1, 2010 through March 31, 2011 (the reporting period).
* Percentages indicated are based on net assets of $5,546,643,427.
† Non-income-producing security.
†† The interest rate and date shown parenthetically represent the new interest rate to be paid and the date the fund will begin accruing interest at this rate.
‡‡ Income may be received in cash or additional securities at the discretion of the issuer.
# These securities, in part or in entirety, were pledged and segregated with the broker to cover margin requirements for futures contracts at the close of the reporting period.
## These securities, in part or in entirety, were pledged and segregated with the custodian for collateral on certain derivatives contracts at the close of the reporting period.
∆ Forward commitments, in part or in entirety (Note 1).
c Senior loans are exempt from registration under the Securities Act of 1933, as amended, but contain certain restrictions on resale and cannot be sold publicly. These loans pay interest at rates which adjust periodically. The interest rates shown for senior loans are the current interest rates at the close of the reporting period. Senior loans are also subject to mandatory and/or optional prepayment which cannot be predicted. As a result, the remaining maturity may be substantially less than the stated maturity shown (Notes 1 and 7).
e See Note 6 to the financial statements regarding investments in Putnam Money Market Liquidity Fund. The rate quoted in the security description is the annualized 7-day yield of the fund at the close of the reporting period.
49
F Is valued at fair value following procedures approved by the Trustees. Securities may be classified as Level 2 or Level 3 for Accounting Standards Codification ASC 820 Fair Value Measurements and Disclosures (ASC 820) based on the securities’ valuation inputs.
g The notes are secured by debt and equity securities and equity participation agreements held by Neon Capital, Ltd.
i Security purchased with cash or security received, that was pledged to the fund for collateral on certain derivatives contracts (Note 1).
R Real Estate Investment Trust.
At the close of the reporting period, the fund maintained liquid assets totaling $3,154,652,963 to cover certain derivatives contracts.
Debt obligations are considered secured unless otherwise indicated.
144A after the name of an issuer represents securities exempt from registration under Rule 144A under the Securities Act of 1933, as amended. These securities may be resold in transactions exempt from registration, normally to qualified institutional buyers.
See Note 1 to the financial statements regarding TBA’s.
The rates shown on FRB and FRN are the current interest rates at the close of the reporting period.
The dates shown on debt obligations are the original maturity dates.
IFB are securities that pay interest rates that vary inversely to changes in the market interest rates. As interest rates rise, inverse floaters produce less current income. The interest rates shown are the current interest rates at the close of the reporting period.
| | | | |
| DIVERSIFICATION BY COUNTRY | | | | |
|
| Distribution of investments by country of risk at the close of the reporting period (as a percentage of Portfolio Value): |
| | | | | |
| United States | 85.6% | | Luxembourg | 0.6% |
| |
|
| Russia | 2.9 | | Netherlands | 0.6 |
| |
|
| Argentina | 2.5 | | United Kingdom | 0.5 |
| |
|
| Venezuela | 1.3 | | Turkey | 0.5 |
| |
|
| Italy | 0.7 | | Other | 3.4 |
| |
|
| Ukraine | 0.7 | | Total | 100.0% |
| | | |
| Brazil | 0.7 | | | |
| | | |
FORWARD CURRENCY CONTRACTS at 3/31/11 (aggregate face value $3,139,679,258) (Unaudited)
| | | | | | |
| | | | | | | Unrealized |
| | | Contract | Delivery | | Aggregate | appreciation/ |
| Counterparty | Currency | type | date | Value | face value | (depreciation) |
|
| Bank of America, N.A. | | | | | |
|
| | Australian Dollar | Buy | 4/20/11 | $27,966,028 | $27,899,107 | $66,921 |
|
| | Brazilian Real | Buy | 4/20/11 | 4,626,230 | 4,516,647 | 109,583 |
|
| | British Pound | Sell | 4/20/11 | 53,863,971 | 54,202,762 | 338,791 |
|
| | Canadian Dollar | Buy | 4/20/11 | 14,322,585 | 14,034,461 | 288,124 |
|
| | Chilean Peso | Sell | 4/20/11 | 161,387 | 162,392 | 1,005 |
|
| | Czech Koruna | Sell | 4/20/11 | 2,815,979 | 2,811,495 | (4,484) |
|
| | Euro | Sell | 4/20/11 | 416,943 | 404,422 | (12,521) |
|
| | Japanese Yen | Sell | 4/20/11 | 35,867,000 | 36,475,246 | 608,246 |
|
| | Mexican Peso | Buy | 4/20/11 | 11,122,387 | 11,001,454 | 120,933 |
|
| | Norwegian Krone | Buy | 4/20/11 | 27,163,450 | 26,889,863 | 273,587 |
|
| | Singapore Dollar | Buy | 4/20/11 | 21,925,760 | 21,683,085 | 242,675 |
|
| | South African Rand | Sell | 4/20/11 | 15,317 | 14,530 | (787) |
|
| | South Korean Won | Buy | 4/20/11 | 12,731,857 | 12,525,020 | 206,837 |
|
| | Swedish Krona | Sell | 4/20/11 | 9,055,191 | 9,016,299 | (38,892) |
|
50
FORWARD CURRENCY CONTRACTS at 3/31/11 (aggregate face value $3,139,679,258) (Unaudited) cont.
| | | | | | |
| | | | | | | Unrealized |
| | | Contract | Delivery | | Aggregate | appreciation/ |
| Counterparty | Currency | type | date | Value | face value | (depreciation) |
|
| Bank of America, N.A. cont. | | | | | |
|
| | Swiss Franc | Sell | 4/20/11 | $31,451,435 | $31,695,952 | $244,517 |
|
| | Taiwan Dollar | Sell | 4/20/11 | 4,951,273 | 4,940,214 | (11,059) |
|
| | Turkish Lira | Sell | 4/20/11 | 5,716,621 | 5,429,080 | (287,541) |
|
| Barclays Bank PLC | | | | | |
|
| | Australian Dollar | Buy | 4/20/11 | 12,712,442 | 12,594,750 | 117,692 |
|
| | Brazilian Real | Buy | 4/20/11 | 6,959,176 | 6,843,741 | 115,435 |
|
| | British Pound | Sell | 4/20/11 | 41,886,222 | 42,281,474 | 395,252 |
|
| | Canadian Dollar | Sell | 4/20/11 | 19,769,028 | 19,640,851 | (128,177) |
|
| | Chilean Peso | Sell | 4/20/11 | 168,796 | 169,991 | 1,195 |
|
| | Czech Koruna | Sell | 4/20/11 | 7,750,589 | 7,722,252 | (28,337) |
|
| | Euro | Buy | 4/20/11 | 11,377,994 | 11,377,650 | 344 |
|
| | Hungarian Forint | Buy | 4/20/11 | 14,131,069 | 13,975,385 | 155,684 |
|
| | Indian Rupee | Sell | 4/20/11 | 16,170,240 | 15,888,235 | (282,005) |
|
| | Japanese Yen | Sell | 4/20/11 | 56,887,729 | 57,393,064 | 505,335 |
|
| | Mexican Peso | Sell | 4/20/11 | 2,987,991 | 2,956,190 | (31,801) |
|
| | New Zealand Dollar | Sell | 4/20/11 | 7,715,226 | 7,446,756 | (268,470) |
|
| | Norwegian Krone | Buy | 4/20/11 | 38,167,858 | 37,965,303 | 202,555 |
|
| | Philippines Peso | Buy | 4/20/11 | 6,527,872 | 6,551,904 | (24,032) |
|
| | Polish Zloty | Sell | 4/20/11 | 2,314,656 | 2,315,478 | 822 |
|
| | Singapore Dollar | Buy | 4/20/11 | 24,171,226 | 24,009,194 | 162,032 |
|
| | South Korean Won | Buy | 4/20/11 | 14,367,075 | 14,076,392 | 290,683 |
|
| | Swedish Krona | Sell | 4/20/11 | 15,726,473 | 15,699,840 | (26,633) |
|
| | Swiss Franc | Sell | 4/20/11 | 27,852,152 | 28,154,225 | 302,073 |
|
| | Taiwan Dollar | Sell | 4/20/11 | 59,672 | 59,468 | (204) |
|
| | Thai Baht | Buy | 4/20/11 | 6,389,000 | 6,348,289 | 40,711 |
|
| | Turkish Lira | Sell | 4/20/11 | 1,452,303 | 1,395,394 | (56,909) |
|
| Citibank, N.A. | | | | | | |
|
| | Australian Dollar | Buy | 4/20/11 | 7,347,334 | 7,180,785 | 166,549 |
|
| | Brazilian Real | Buy | 4/20/11 | 1,700,177 | 1,676,055 | 24,122 |
|
| | British Pound | Sell | 4/20/11 | 32,472,942 | 32,716,590 | 243,648 |
|
| | Canadian Dollar | Buy | 4/20/11 | 7,917,043 | 7,865,268 | 51,775 |
|
| | Chilean Peso | Sell | 4/20/11 | 2,401,693 | 2,417,573 | 15,880 |
|
| | Czech Koruna | Buy | 4/20/11 | 4,557,866 | 4,529,588 | 28,278 |
|
| | Danish Krone | Buy | 4/20/11 | 2,041,775 | 2,005,075 | 36,700 |
|
| | Euro | Buy | 4/20/11 | 29,166,864 | 29,117,655 | 49,209 |
|
| | Hungarian Forint | Buy | 4/20/11 | 7,764,526 | 7,771,897 | (7,371) |
|
| | Japanese Yen | Sell | 4/20/11 | 39,838,293 | 40,472,681 | 634,388 |
|
| | Mexican Peso | Buy | 4/20/11 | 10,608,098 | 10,498,643 | 109,455 |
|
| | New Zealand Dollar | Buy | 4/20/11 | 267,123 | 257,646 | 9,477 |
|
| | Norwegian Krone | Buy | 4/20/11 | 8,275,485 | 8,196,072 | 79,413 |
|
| | Polish Zloty | Sell | 4/20/11 | 638,125 | 635,822 | (2,303) |
|
| | Singapore Dollar | Sell | 4/20/11 | 441,256 | 439,254 | (2,002) |
|
| | South African Rand | Buy | 4/20/11 | 423,771 | 417,625 | 6,146 |
|
| | South Korean Won | Buy | 4/20/11 | 11,524,606 | 11,322,347 | 202,259 |
|
51
FORWARD CURRENCY CONTRACTS at 3/31/11 (aggregate face value $3,139,679,258) (Unaudited) cont.
| | | | | | |
| | | | | | | Unrealized |
| | | Contract | Delivery | | Aggregate | appreciation/ |
| Counterparty | Currency | type | date | Value | face value | (depreciation) |
|
| Citibank, N.A. cont. | | | | | |
|
| | Swedish Krona | Buy | 4/20/11 | $5,526,849 | $5,508,827 | $18,022 |
|
| | Swiss Franc | Buy | 4/20/11 | 9,415,130 | 9,584,521 | (169,391) |
|
| | Taiwan Dollar | Buy | 4/20/11 | 8,544,904 | 8,514,557 | 30,347 |
|
| | Turkish Lira | Buy | 4/20/11 | 1,656,738 | 1,592,035 | 64,703 |
|
| Credit Suisse AG | | | | | |
|
| | Australian Dollar | Buy | 4/20/11 | 4,915,222 | 4,866,249 | 48,973 |
|
| | Brazilian Real | Buy | 4/20/11 | 7,457,129 | 7,319,796 | 137,333 |
|
| | British Pound | Sell | 4/20/11 | 34,648,363 | 34,883,109 | 234,746 |
|
| | Canadian Dollar | Sell | 4/20/11 | 3,292,757 | 3,271,642 | (21,115) |
|
| | Czech Koruna | Sell | 4/20/11 | 333,716 | 333,464 | (252) |
|
| | Euro | Buy | 4/20/11 | 58,463,482 | 57,092,452 | 1,371,030 |
|
| | Indian Rupee | Sell | 4/20/11 | 2,498,045 | 2,468,156 | (29,889) |
|
| | Japanese Yen | Sell | 4/20/11 | 42,728,807 | 43,443,048 | 714,241 |
|
| | Malaysian Ringgit | Buy | 4/20/11 | 10,225,644 | 10,230,358 | (4,714) |
|
| | Mexican Peso | Buy | 4/20/11 | 8,389,550 | 8,372,082 | 17,468 |
|
| | Norwegian Krone | Buy | 4/20/11 | 23,831,453 | 23,727,940 | 103,513 |
|
| | Polish Zloty | Sell | 4/20/11 | 8,693,903 | 8,687,692 | (6,211) |
|
| | South African Rand | Buy | 4/20/11 | 10,229,079 | 10,022,771 | 206,308 |
|
| | South Korean Won | Buy | 4/20/11 | 15,141,933 | 14,987,449 | 154,484 |
|
| | Swedish Krona | Sell | 4/20/11 | 20,465,485 | 20,432,121 | (33,364) |
|
| | Swiss Franc | Sell | 4/20/11 | 24,562,614 | 24,841,822 | 279,208 |
|
| | Taiwan Dollar | Sell | 4/20/11 | 391,040 | 389,703 | (1,337) |
|
| | Turkish Lira | Buy | 4/20/11 | 1,942,585 | 1,869,017 | 73,568 |
|
| Deutsche Bank AG | | | | | |
|
| | Australian Dollar | Buy | 4/20/11 | 23,632,791 | 23,088,791 | 544,000 |
|
| | Brazilian Real | Buy | 4/20/11 | 3,260,588 | 3,206,888 | 53,700 |
|
| | British Pound | Sell | 4/20/11 | 31,281,223 | 31,504,996 | 223,773 |
|
| | Canadian Dollar | Sell | 4/20/11 | 21,008,198 | 20,864,713 | (143,485) |
|
| | Chilean Peso | Buy | 4/20/11 | 2,761,003 | 2,775,866 | (14,863) |
|
| | Czech Koruna | Sell | 4/20/11 | 4,564,730 | 4,528,042 | (36,688) |
|
| | Euro | Buy | 4/20/11 | 24,305,791 | 23,752,379 | 553,412 |
|
| | Hungarian Forint | Buy | 4/20/11 | 16,464,148 | 16,370,460 | 93,688 |
|
| | Malaysian Ringgit | Buy | 4/20/11 | 10,964,258 | 10,962,439 | 1,819 |
|
| | Mexican Peso | Buy | 4/20/11 | 5,089,393 | 5,059,693 | 29,700 |
|
| | New Zealand Dollar | Sell | 4/20/11 | 4,677,512 | 4,513,704 | (163,808) |
|
| | Norwegian Krone | Buy | 4/20/11 | 26,881,277 | 26,764,516 | 116,761 |
|
| | Peruvian New Sol | Sell | 4/20/11 | 7,868,437 | 7,969,278 | 100,841 |
|
| | Philippines Peso | Buy | 4/20/11 | 6,468,313 | 6,487,628 | (19,315) |
|
| | Polish Zloty | Buy | 4/20/11 | 1,024,570 | 1,014,926 | 9,644 |
|
| | Singapore Dollar | Buy | 4/20/11 | 12,733,855 | 12,598,899 | 134,956 |
|
| | South Korean Won | Buy | 4/20/11 | 7,942,835 | 7,817,794 | 125,041 |
|
| | Swedish Krona | Sell | 4/20/11 | 13,685,314 | 13,614,495 | (70,819) |
|
52
FORWARD CURRENCY CONTRACTS at 3/31/11 (aggregate face value $3,139,679,258) (Unaudited) cont.
| | | | | | |
| | | | | | Unrealized |
| | Contract | Delivery | | Aggregate | appreciation/ |
| Counterparty | Currency | type | date | Value | face value | (depreciation) |
|
| Deutsche Bank AG cont. | | | | | |
|
| Swiss Franc | Sell | 4/20/11 | $18,095,517 | $18,338,458 | $242,941 |
|
| Taiwan Dollar | Sell | 4/20/11 | 44,104 | 44,013 | (91) |
|
| Turkish Lira | Buy | 4/20/11 | 6,073,607 | 5,922,192 | 151,415 |
|
| Goldman Sachs International | | | | | |
|
| Australian Dollar | Buy | 4/20/11 | 20,214,117 | 19,893,511 | 320,606 |
|
| British Pound | Sell | 4/20/11 | 7,591,889 | 7,713,322 | 121,433 |
|
| Canadian Dollar | Buy | 4/20/11 | 2,733,645 | 2,682,532 | 51,113 |
|
| Chilean Peso | Buy | 4/20/11 | 149,981 | 150,947 | (966) |
|
| Euro | Sell | 4/20/11 | 16,395,510 | 16,305,392 | (90,118) |
|
| Hungarian Forint | Buy | 4/20/11 | 10,946,076 | 10,943,537 | 2,539 |
|
| Japanese Yen | Sell | 4/20/11 | 26,474,682 | 26,925,297 | 450,615 |
|
| Norwegian Krone | Buy | 4/20/11 | 14,167,408 | 14,012,410 | 154,998 |
|
| Polish Zloty | Sell | 4/20/11 | 5,371,856 | 5,366,015 | (5,841) |
|
| South African Rand | Buy | 4/20/11 | 1,090,984 | 1,066,036 | 24,948 |
|
| Swedish Krona | Sell | 4/20/11 | 24,819,224 | 24,778,761 | (40,463) |
|
| Swiss Franc | Buy | 4/20/11 | 1,060,096 | 1,079,150 | (19,054) |
|
| HSBC Bank USA, National Association | | | | |
|
| Australian Dollar | Buy | 4/20/11 | 10,749,628 | 10,507,432 | 242,196 |
|
| British Pound | Sell | 4/20/11 | 18,983,071 | 19,286,766 | 303,695 |
|
| Euro | Buy | 4/20/11 | 33,140,957 | 32,998,368 | 142,589 |
|
| Indian Rupee | Sell | 4/20/11 | 2,498,049 | 2,461,635 | (36,414) |
|
| Japanese Yen | Sell | 4/20/11 | 34,531,687 | 34,891,844 | 360,157 |
|
| Norwegian Krone | Buy | 4/20/11 | 22,855,009 | 22,621,167 | 233,842 |
|
| Philippines Peso | Buy | 4/20/11 | 6,468,313 | 6,480,145 | (11,832) |
|
| Singapore Dollar | Buy | 4/20/11 | 13,426,952 | 13,264,839 | 162,113 |
|
| South Korean Won | Buy | 4/20/11 | 9,694,557 | 9,626,814 | 67,743 |
|
| Swiss Franc | Sell | 4/20/11 | 30,683,731 | 30,221,553 | (462,178) |
|
| Taiwan Dollar | Buy | 4/20/11 | 95,315 | 94,876 | 439 |
|
| JPMorgan Chase Bank, N.A. | | | | | |
|
| Australian Dollar | Buy | 4/20/11 | 11,737,053 | 11,624,817 | 112,236 |
|
| Brazilian Real | Buy | 4/20/11 | 10,220,864 | 10,047,482 | 173,382 |
|
| British Pound | Sell | 4/20/11 | 55,758,289 | 55,932,043 | 173,754 |
|
| Canadian Dollar | Sell | 4/20/11 | 8,118,171 | 8,064,171 | (54,000) |
|
| Chilean Peso | Sell | 4/20/11 | 1,127,955 | 1,119,070 | (8,885) |
|
| Czech Koruna | Buy | 4/20/11 | 5,368,699 | 5,308,438 | 60,261 |
|
| Euro | Buy | 4/20/11 | 11,799,480 | 11,613,938 | 185,542 |
|
| Hungarian Forint | Buy | 4/20/11 | 2,394,324 | 2,305,001 | 89,323 |
|
| Japanese Yen | Sell | 4/20/11 | 19,179,606 | 19,507,608 | 328,002 |
|
| Malaysian Ringgit | Buy | 4/20/11 | 12,059,777 | 12,071,311 | (11,534) |
|
| Mexican Peso | Buy | 4/20/11 | 8,465,691 | 8,312,393 | 153,298 |
|
| New Zealand Dollar | Sell | 4/20/11 | 3,879,956 | 3,743,137 | (136,819) |
|
| Norwegian Krone | Sell | 4/20/11 | 1,856,639 | 1,838,417 | (18,222) |
|
53
FORWARD CURRENCY CONTRACTS at 3/31/11 (aggregate face value $3,139,679,258) (Unaudited) cont.
| | | | | | |
| | | | | | | Unrealized |
| | | Contract | Delivery | | Aggregate | appreciation/ |
| Counterparty | Currency | type | date | Value | face value | (depreciation) |
|
| JPMorgan Chase Bank, N.A. cont. | | | | | |
|
| | Peruvian New Sol | Sell | 4/20/11 | $4,011,335 | $4,061,278 | $49,943 |
|
| | Polish Zloty | Sell | 4/20/11 | 13,328,426 | 13,271,986 | (56,440) |
|
| | Singapore Dollar | Buy | 4/20/11 | 22,465,770 | 22,220,192 | 245,578 |
|
| | South African Rand | Buy | 4/20/11 | 5,257,176 | 5,181,298 | 75,878 |
|
| | South Korean Won | Buy | 4/20/11 | 7,843,035 | 7,743,194 | 99,841 |
|
| | Swedish Krona | Sell | 4/20/11 | 19,938,775 | 19,812,929 | (125,846) |
|
| | Swiss Franc | Sell | 4/20/11 | 19,663,232 | 19,708,230 | 44,998 |
|
| | Taiwan Dollar | Buy | 4/20/11 | 3,295,950 | 3,318,074 | (22,124) |
|
| | Thai Baht | Buy | 4/20/11 | 6,518,056 | 6,474,716 | 43,340 |
|
| | Turkish Lira | Buy | 4/20/11 | 526,207 | 505,336 | 20,871 |
|
| Royal Bank of Scotland PLC (The) | | | | | |
|
| | Australian Dollar | Buy | 4/20/11 | 14,808,459 | 14,579,101 | 229,358 |
|
| | Brazilian Real | Buy | 4/20/11 | 13,065,880 | 12,985,142 | 80,738 |
|
| | British Pound | Sell | 4/20/11 | 52,021,377 | 52,314,135 | 292,758 |
|
| | Canadian Dollar | Sell | 4/20/11 | 18,463,194 | 18,343,107 | (120,087) |
|
| | Chilean Peso | Buy | 4/20/11 | 489,695 | 479,493 | 10,202 |
|
| | Czech Koruna | Sell | 4/20/11 | 2,583,688 | 2,581,677 | (2,011) |
|
| | Euro | Buy | 4/20/11 | 33,294,844 | 33,204,679 | 90,165 |
|
| | Hungarian Forint | Buy | 4/20/11 | 10,525,064 | 10,523,129 | 1,935 |
|
| | Indian Rupee | Sell | 4/20/11 | 13,666,385 | 13,482,018 | (184,367) |
|
| | Japanese Yen | Sell | 4/20/11 | 55,290,531 | 56,011,850 | 721,319 |
|
| | Malaysian Ringgit | Buy | 4/20/11 | 10,225,677 | 10,233,768 | (8,091) |
|
| | Mexican Peso | Buy | 4/20/11 | 16,639,304 | 16,486,160 | 153,144 |
|
| | New Zealand Dollar | Sell | 4/20/11 | 8,327,024 | 8,192,109 | (134,915) |
|
| | Norwegian Krone | Buy | 4/20/11 | 391,729 | 386,504 | 5,225 |
|
| | Polish Zloty | Buy | 4/20/11 | 2,901,277 | 2,895,963 | 5,314 |
|
| | Singapore Dollar | Buy | 4/20/11 | 16,828,585 | 16,678,685 | 149,900 |
|
| | South African Rand | Buy | 4/20/11 | 14,949,912 | 14,603,870 | 346,042 |
|
| | South Korean Won | Buy | 4/20/11 | 12,588,995 | 12,369,942 | 219,053 |
|
| | Swedish Krona | Sell | 4/20/11 | 21,681,533 | 21,063,633 | (617,900) |
|
| | Swiss Franc | Sell | 4/20/11 | 24,401,957 | 24,679,066 | 277,109 |
|
| | Taiwan Dollar | Sell | 4/20/11 | 4,746,784 | 4,742,621 | (4,163) |
|
| | Turkish Lira | Buy | 4/20/11 | 1,731,301 | 1,730,429 | 872 |
|
| State Street Bank and Trust Co. | | | | | |
|
| | Australian Dollar | Sell | 4/20/11 | 13,097,570 | 12,382,625 | (714,945) |
|
| | Brazilian Real | Buy | 4/20/11 | 4,689,482 | 4,609,978 | 79,504 |
|
| | British Pound | Sell | 4/20/11 | 24,334,105 | 24,297,339 | (36,766) |
|
| | Canadian Dollar | Sell | 4/20/11 | 14,518,346 | 14,424,065 | (94,281) |
|
| | Euro | Buy | 4/20/11 | 17,475,417 | 17,207,001 | 268,416 |
|
| | Hungarian Forint | Buy | 4/20/11 | 16,958,950 | 16,807,505 | 151,445 |
|
| | Japanese Yen | Sell | 4/20/11 | 46,584,709 | 47,358,476 | 773,767 |
|
| | Malaysian Ringgit | Buy | 4/20/11 | 10,365,359 | 10,378,013 | (12,654) |
|
| | Mexican Peso | Buy | 4/20/11 | 10,489,456 | 10,388,993 | 100,463 |
|
54
FORWARD CURRENCY CONTRACTS at 3/31/11 (aggregate face value $3,139,679,258) (Unaudited) cont.
| | | | | | |
| | | | | | | Unrealized |
| | | Contract | Delivery | | Aggregate | appreciation/ |
| Counterparty | Currency | type | date | Value | face value | (depreciation) |
|
| State Street Bank and Trust Co. cont. | | | | | |
|
| | Norwegian Krone | Buy | 4/20/11 | $33,471,164 | $33,152,126 | $319,038 |
|
| | Philippines Peso | Buy | 4/20/11 | 6,468,313 | 6,499,938 | (31,625) |
|
| | Polish Zloty | Sell | 4/20/11 | 4,835,227 | 4,829,646 | (5,581) |
|
| | Singapore Dollar | Buy | 4/20/11 | 13,564,651 | 13,435,995 | 128,656 |
|
| | South African Rand | Buy | 4/20/11 | 8,423,620 | 8,301,871 | 121,749 |
|
| | Swedish Krona | Sell | 4/20/11 | 39,300,686 | 39,162,011 | (138,675) |
|
| | Swiss Franc | Sell | 4/20/11 | 40,541,759 | 40,649,406 | 107,647 |
|
| | Taiwan Dollar | Buy | 4/20/11 | 3,410,704 | 3,426,347 | (15,643) |
|
| | Thai Baht | Buy | 4/20/11 | 6,518,056 | 6,478,969 | 39,087 |
|
| UBS AG | | | | | | |
|
| | Australian Dollar | Buy | 4/20/11 | 53,989,863 | 53,511,515 | 478,348 |
|
| | Brazilian Real | Buy | 4/20/11 | 16,693,455 | 16,594,189 | 99,266 |
|
| | British Pound | Sell | 4/20/11 | 24,140,545 | 24,499,473 | 358,928 |
|
| | Canadian Dollar | Sell | 4/20/11 | 23,016,276 | 22,953,884 | (62,392) |
|
| | Czech Koruna | Sell | 4/20/11 | 9,031,802 | 9,016,899 | (14,903) |
|
| | Euro | Buy | 4/20/11 | 42,101,333 | 42,111,011 | (9,678) |
|
| | Hungarian Forint | Buy | 4/20/11 | 11,787,669 | 11,742,296 | 45,373 |
|
| | Indian Rupee | Sell | 4/20/11 | 19,019,054 | 18,734,295 | (284,759) |
|
| | Japanese Yen | Sell | 4/20/11 | 45,716,852 | 46,487,299 | 770,447 |
|
| | Mexican Peso | Buy | 4/20/11 | 13,928,855 | 13,872,212 | 56,643 |
|
| | New Zealand Dollar | Sell | 4/20/11 | 8,484,034 | 8,346,909 | (137,125) |
|
| | Norwegian Krone | Buy | 4/20/11 | 26,912,002 | 26,795,591 | 116,411 |
|
| | Polish Zloty | Sell | 4/20/11 | 4,052,127 | 4,052,424 | 297 |
|
| | Singapore Dollar | Buy | 4/20/11 | 30,040,501 | 29,800,319 | 240,182 |
|
| | South African Rand | Buy | 4/20/11 | 15,715,900 | 15,401,300 | 314,600 |
|
| | South Korean Won | Buy | 4/20/11 | 16,808,187 | 16,444,879 | 363,308 |
|
| | Swedish Krona | Sell | 4/20/11 | 18,123,499 | 18,094,010 | (29,489) |
|
| | Swiss Franc | Sell | 4/20/11 | 54,268,323 | 54,613,389 | 345,066 |
|
| | Taiwan Dollar | Sell | 4/20/11 | 73,171 | 73,119 | (52) |
|
| | Thai Baht | Buy | 4/20/11 | 6,389,000 | 6,344,228 | 44,772 |
|
| | Turkish Lira | Buy | 4/20/11 | 8,250,930 | 8,209,609 | 41,321 |
|
| Westpac Banking Corp. | | | | | |
|
| | Australian Dollar | Buy | 4/20/11 | 18,956,114 | 18,765,226 | 190,888 |
|
| | British Pound | Sell | 4/20/11 | 18,072,721 | 18,361,458 | 288,737 |
|
| | Canadian Dollar | Buy | 4/20/11 | 1,930,062 | 1,891,781 | 38,281 |
|
| | Euro | Buy | 4/20/11 | 7,386,753 | 7,177,043 | 209,710 |
|
| | Japanese Yen | Sell | 4/20/11 | 34,943,760 | 35,529,646 | 585,886 |
|
| | New Zealand Dollar | Buy | 4/20/11 | 1,773,169 | 1,672,321 | 100,848 |
|
| | Norwegian Krone | Buy | 4/20/11 | 27,493,005 | 27,372,600 | 120,405 |
|
| | Swedish Krona | Sell | 4/20/11 | 12,000,799 | 11,807,716 | (193,083) |
|
| | Swiss Franc | Sell | 4/20/11 | 23,888,335 | 24,160,412 | 272,077 |
|
| Total | | | | | | $20,651,148 |
55
FUTURES CONTRACTS OUTSTANDING at 3/31/11 (Unaudited)
| | | | | |
| | | | | | Unrealized |
| Number of | | | Expiration | appreciation/ |
| contracts | Value | | date | (depreciation) |
|
| Australian Government Treasury | | | | | |
| Bond 10 yr (Short) | 275 | $26,936,044 | | Jun-11 | $(25,697) |
|
| Canadian Government Bond 10 yr (Long) | 924 | 114,462,682 | | Jun-11 | (433,298) |
|
| Euro-Swiss Franc 3 Month (Short) | 534 | 144,725,160 | | Dec-11 | 6,637 |
|
| Euro-Swiss Franc 3 Month (Short) | 547 | 147,054,564 | | Dec-12 | 18,586 |
|
| Euro-Swiss Franc 3 Month (Short) | 541 | 145,840,045 | | Jun-12 | 141,532 |
|
| Euro-Swiss Franc 3 Month (Short) | 538 | 145,486,332 | | Mar-12 | 30,336 |
|
| Euro-Swiss Franc 3 Month (Short) | 532 | 144,473,400 | | Sep-11 | 21,074 |
|
| Euro-Bobl 5 yr (Long) | 67 | 10,900,574 | | Jun-11 | (10,663) |
|
| Euro-Bund 10 yr (Long) | 4,249 | 731,777,887 | | Jun-11 | (8,483,170) |
|
| Euro-Dollar 90 day (Short) | 4,136 | 1,025,159,300 | | Mar-12 | 1,442,116 |
|
| Euro-Schatz 2 yr (Short) | 2,485 | 378,219,383 | | Jun-11 | (93,080) |
|
| Japanese Government Bond 10 yr (Long) | 32 | 53,750,602 | | Jun-11 | (273,821) |
|
| Japanese Government Bond 10 yr | | | | | |
| Mini (Long) | 32 | 5,375,831 | | Jun-11 | 18,556 |
|
| U.K. Gilt 10 yr (Long) | 2,496 | 469,860,324 | | Jun-11 | (3,188,121) |
|
| U.S. Treasury Bond 20 yr (Long) | 2,203 | 264,773,063 | | Jun-11 | (109,799) |
|
| U.S. Treasury Bond 30 yr (Long) | 4,340 | 536,261,250 | | Jun-11 | 1,659,829 |
|
| U.S. Treasury Note 2 yr (Long) | 25 | 5,453,125 | | Jun-11 | (4,822) |
|
| U.S. Treasury Note 10 yr (Short) | 760 | 90,463,750 | | Jun-11 | (105,991) |
|
| Total | | | | | $(9,389,796) |
WRITTEN OPTIONS OUTSTANDING at 3/31/11 (premiums received $272,442,587) (Unaudited)
| | | | |
| | Contract | | Expiration date/ | |
| | amount | | strike price | Value |
|
| Option on an interest rate swap with Bank of America, | | | | |
| N.A. for the obligation to pay a fixed rate of 4.475% | | | | |
| versus the three month USD-LIBOR-BBA maturing | | | | |
| August 19, 2021. | $49,291,000 | | Aug-11/4.475 | $3,303,483 |
|
| Option on an interest rate swap with Bank of America, | | | | |
| N.A. for the obligation to pay a fixed rate of 4.55% | | | | |
| versus the three month USD-LIBOR-BBA maturing | | | | |
| August 17, 2021. | 73,698,000 | | Aug-11/4.55 | 5,360,056 |
|
| Option on an interest rate swap with Bank of America, | | | | |
| N.A. for the obligation to pay a fixed rate of 4.70% | | | | |
| versus the three month USD-LIBOR-BBA maturing | | | | |
| August 8, 2021. | 79,191,000 | | Aug-11/4.70 | 6,724,108 |
|
| Option on an interest rate swap with Bank of America, | | | | |
| N.A. for the obligation to pay a fixed rate of 4.765% | | | | |
| versus the three month USD-LIBOR-BBA maturing | | | | |
| August 16, 2021. | 122,408,000 | | Aug-11/4.765 | 10,944,500 |
|
| Option on an interest rate swap with Bank of America, | | | | |
| N.A. for the obligation to receive a fixed rate of 4.475% | | | | |
| versus the three month USD-LIBOR-BBA maturing | | | | |
| August 19, 2021. | 49,291,000 | | Aug-11/4.475 | 247,441 |
|
| Option on an interest rate swap with Bank of America, | | | | |
| N.A. for the obligation to receive a fixed rate of 4.55% | | | | |
| versus the three month USD-LIBOR-BBA maturing | | | | |
| August 17, 2021. | 73,698,000 | | Aug-11/4.55 | 300,688 |
|
56
WRITTEN OPTIONS OUTSTANDING at 3/31/11 (premiums received $272,442,587) (Unaudited) cont.
| | | | | |
| | Contract | | Expiration date/ | |
| | amount | | strike price | Value |
|
| Option on an interest rate swap with Bank of America, | | | | |
| N.A. for the obligation to receive a fixed rate of 4.70% | | | | |
| versus the three month USD-LIBOR-BBA maturing | | | | |
| August 8, 2021. | $79,191,000 | | Aug-11/4.70 | $182,931 |
|
| Option on an interest rate swap with Bank of America, | | | | |
| N.A. for the obligation to receive a fixed rate of 4.765% | | | | |
| versus the three month USD-LIBOR-BBA maturing | | | | |
| August 16, 2021. | 122,408,000 | | Aug-11/4.765 | 279,090 |
|
| Option on an interest rate swap with Barclays Bank PLC | | | |
| for the obligation to pay a fixed rate of 5.36% versus | | | | |
| the three month USD-LIBOR-BBA maturing | | | | |
| February 13, 2025. | 17,581,660 | | Feb-15/5.36 | 1,410,049 |
|
| Option on an interest rate swap with Barclays Bank | | | | |
| PLC for the obligation to receive a fixed rate of 5.36% | | | | |
| versus the three month USD-LIBOR-BBA maturing | | | | |
| February 13, 2025. | 17,581,660 | | Feb-15/5.36 | 887,874 |
|
| Option on an interest rate swap with Citibank, | | | | |
| N.A. for the obligation to pay a fixed rate of 4.49% | | | | |
| versus the three month USD-LIBOR-BBA maturing | | | | |
| August 17, 2021. | 147,396,000 | | Aug-11/4.49 | 10,058,303 |
|
| Option on an interest rate swap with Citibank, N.A. for | | | | |
| the obligation to pay a fixed rate of 4.52% versus the | | | | |
| three month USD-LIBOR-BBA maturing July 26, 2021. | 138,138,000 | | Jul-11/4.52 | 9,968,038 |
|
| Option on an interest rate swap with Citibank, N.A. for | | | | |
| the obligation to pay a fixed rate of 4.5475% versus the | | | | |
| three month USD-LIBOR-BBA maturing July 26, 2021. | 69,069,000 | | Jul-11/4.5475 | 5,131,827 |
|
| Option on an interest rate swap with Citibank, N.A. | | | | |
| for the obligation to receive a fixed rate of 4.49% | | | | |
| versus the three month USD-LIBOR-BBA maturing | | | | |
| August 17, 2021. | 147,396,000 | | Aug-11/4.49 | 694,235 |
|
| Option on an interest rate swap with Citibank, N.A. for | | | | |
| the obligation to receive a fixed rate of 4.52% versus the | | | |
| three month USD-LIBOR-BBA maturing July 26, 2021. | 138,138,000 | | Jul-11/4.52 | 381,261 |
|
| Option on an interest rate swap with Citibank, N.A. | | | | |
| for the obligation to receive a fixed rate of 4.5475% | | | | |
| versus the three month USD-LIBOR-BBA maturing | | | | |
| July 26, 2021. | 69,069,000 | | Jul-11/4.5475 | 176,126 |
|
| Option on an interest rate swap with Credit Suisse | | | | |
| International for the obligation to pay a fixed rate of | | | | |
| 0.578% versus the six month CHF-LIBOR-BBA | | | | |
| maturing December 24, 2013. | CHF | 200,160,000 | | Dec-11/0.578 | 45,722 |
|
| Option on an interest rate swap with Credit Suisse | | | | |
| International for the obligation to pay a fixed rate of | | | | |
| 0.602% versus the six month CHF-LIBOR-BBA | | | | |
| maturing December 22, 2013. | CHF | 200,160,000 | | Dec-11/0.602 | 52,692 |
|
| Option on an interest rate swap with Credit Suisse | | | | |
| International for the obligation to pay a fixed rate | | | | |
| of 0.70175% versus the six month CHF-LIBOR-BBA | | | | |
| maturing January 23, 2014. | CHF | 186,840,000 | | Jan-12/0.70175 | 93,684 |
|
57
WRITTEN OPTIONS OUTSTANDING at 3/31/11 (premiums received $272,442,587) (Unaudited) cont.
| | | | |
| | Contract | | Expiration date/ | |
| | amount | | strike price | Value |
|
| Option on an interest rate swap with JPMorgan Chase | | | | |
| Bank, N.A. for the obligation to pay a fixed rate of 4.04% | | | | |
| versus the three month USD-LIBOR-BBA maturing | | | | |
| September 11, 2025. | $403,795,500 | | Sep-15/4.04 | $13,920,398 |
|
| Option on an interest rate swap with JPMorgan Chase | | | | |
| Bank, N.A. for the obligation to pay a fixed rate of | | | | |
| 4.375% versus the three month USD-LIBOR-BBA | | | | |
| maturing August 10, 2045. | 88,935,500 | | Aug-15/4.375 | 6,728,860 |
|
| Option on an interest rate swap with JPMorgan Chase | | | | |
| Bank, N.A. for the obligation to pay a fixed rate of 4.46% | | | | |
| versus the three month USD-LIBOR-BBA maturing | | | | |
| August 7, 2045. | 88,935,500 | | Aug-15/4.46 | 7,134,406 |
|
| Option on an interest rate swap with JPMorgan Chase | | | | |
| Bank, N.A. for the obligation to pay a fixed rate of 4.46% | | | | |
| versus the three month USD-LIBOR-BBA maturing | | | | |
| July 26, 2021. | 147,297,000 | | Jul-11/4.46 | 9,948,439 |
|
| Option on an interest rate swap with JPMorgan Chase | | | | |
| Bank, N.A. for the obligation to pay a fixed rate of | | | | |
| 4.525% versus the three month USD-LIBOR-BBA | | | | |
| maturing July 26, 2021. | 147,297,000 | | Jul-11/4.525 | 10,686,397 |
|
| Option on an interest rate swap with JPMorgan Chase | | | | |
| Bank, N.A. for the obligation to pay a fixed rate of | | | | |
| 4.745% versus the three month USD-LIBOR-BBA | | | | |
| maturing July 27, 2021. | 220,945,500 | | Jul-11/4.745 | 19,801,136 |
|
| Option on an interest rate swap with JPMorgan Chase | | | | |
| Bank, N.A. for the obligation to pay a fixed rate of 4.82% | | | | |
| versus the three month USD-LIBOR-BBA maturing | | | | |
| September 12, 2018. | 132,437,000 | | Sep-13/4.82 | 6,516,855 |
|
| Option on an interest rate swap with JPMorgan Chase | | | | |
| Bank, N.A. for the obligation to pay a fixed rate of | | | | |
| 4.8675% versus the three month USD-LIBOR-BBA | | | | |
| maturing April 12, 2022. | 95,125,800 | | Apr-12/4.8675 | 7,739,055 |
|
| Option on an interest rate swap with JPMorgan Chase | | | | |
| Bank, N.A. for the obligation to pay a fixed rate of 5.27% | | | | |
| versus the three month USD-LIBOR-BBA maturing | | | | |
| February 12, 2025. | 51,844,360 | | Feb-15/5.27 | 3,953,132 |
|
| Option on an interest rate swap with JPMorgan Chase | | | | |
| Bank, N.A. for the obligation to pay a fixed rate of 5.51% | | | | |
| versus the three month USD-LIBOR-BBA maturing | | | | |
| May 14, 2022. | 21,412,000 | | May-12/5.51 | 2,647,267 |
|
| Option on an interest rate swap with JPMorgan Chase | | | | |
| Bank, N.A. for the obligation to receive a fixed rate | | | | |
| of 3.89% versus the three month USD-LIBOR-BBA | | | | |
| maturing April 28, 2021. | 115,403,025 | | Apr-11/3.89 | 226,190 |
|
| Option on an interest rate swap with JPMorgan Chase | | | | |
| Bank, N.A. for the obligation to receive a fixed rate | | | | |
| of 4.04% versus the three month USD-LIBOR-BBA | | | | |
| maturing September 11, 2025. | 403,795,500 | | Sep-15/4.04 | 42,539,690 |
|
| Option on an interest rate swap with JPMorgan Chase | | | | |
| Bank, N.A. for the obligation to receive a fixed rate | | | | |
| of 4.375% versus the three month USD-LIBOR-BBA | | | | |
| maturing August 10, 2045. | 88,935,500 | | Aug-15/4.375 | 13,701,403 |
|
58
WRITTEN OPTIONS OUTSTANDING at 3/31/11 (premiums received $272,442,587) (Unaudited) cont.
| | | | | |
| | Contract | | Expiration date/ | |
| | amount | | strike price | Value |
|
| Option on an interest rate swap with JPMorgan Chase | | | | |
| Bank, N.A. for the obligation to receive a fixed rate | | | | |
| of 4.46% versus the three month USD-LIBOR-BBA | | | | |
| maturing August 7, 2045. | $88,935,500 | | Aug-15/4.46 | $13,039,723 |
|
| Option on an interest rate swap with JPMorgan Chase | | | | |
| Bank, N.A. for the obligation to receive a fixed rate | | | | |
| of 4.46% versus the three month USD-LIBOR-BBA | | | | |
| maturing July 26, 2021. | 147,297,000 | | Jul-11/4.46 | 481,661 |
|
| Option on an interest rate swap with JPMorgan Chase | | | | |
| Bank, N.A. for the obligation to receive a fixed rate | | | | |
| of 4.525% versus the three month USD-LIBOR-BBA | | | | |
| maturing July 26, 2021. | 147,297,000 | | Jul-11/4.525 | 400,648 |
|
| Option on an interest rate swap with JPMorgan Chase | | | | |
| Bank, N.A. for the obligation to receive a fixed rate | | | | |
| of 4.745% versus the three month USD-LIBOR-BBA | | | | |
| maturing July 27, 2021. | 220,945,500 | | Jul-11/4.745 | 355,722 |
|
| Option on an interest rate swap with JPMorgan Chase | | | | |
| Bank, N.A. for the obligation to receive a fixed rate | | | | |
| of 4.82% versus the three month USD-LIBOR-BBA | | | | |
| maturing September 12, 2018. | 132,437,000 | | Sep-13/4.82 | 2,859,429 |
|
| Option on an interest rate swap with JPMorgan Chase | | | | |
| Bank, N.A. for the obligation to receive a fixed rate | | | | |
| of 4.8675% versus the three month USD-LIBOR-BBA | | | | |
| maturing April 12, 2022. | 95,125,800 | | Apr-12/4.8675 | 1,479,378 |
|
| Option on an interest rate swap with JPMorgan Chase | | | | |
| Bank, N.A. for the obligation to receive a fixed rate | | | | |
| of 5.27% versus the three month USD-LIBOR-BBA | | | | |
| maturing February 12, 2025. | 51,844,360 | | Feb-15/5.27 | 2,765,590 |
|
| Option on an interest rate swap with JPMorgan Chase | | | | |
| Bank, N.A. for the obligation to receive a fixed rate | | | | |
| of 5.51% versus the three month USD-LIBOR-BBA | | | | |
| maturing May 14, 2022. | 21,412,000 | | May-12/5.51 | 178,955 |
|
| Option on an interest rate swap with UBS AG for the | | | | |
| obligation to pay a fixed rate of 0.722% versus the six | | | | |
| month CHF-LIBOR-BBA maturing January 23, 2014. | CHF | 213,480,000 | | Jan-12/0.722 | 118,308 |
|
| Total | | | $223,464,750 |
TBA SALE COMMITMENTS OUTSTANDING at 3/31/11 (proceeds receivable $577,109,297) (Unaudited)
| | | | |
| | Principal | | Settlement | |
| Agency | amount | | date | Value |
|
| Federal Home Loan Mortgage Corporation, 3 1/2s, | | | | |
| April 1, 2041 | $9,000,000 | | 4/13/11 | $8,457,890 |
|
| Federal National Mortgage Association, 4 1/2s, | | | | |
| April 1, 2041 | 127,000,000 | | 4/13/11 | 129,252,269 |
|
| Federal National Mortgage Association, 4s, | | | | |
| April 1, 2041 | 294,000,000 | | 4/13/11 | 289,222,500 |
|
| Federal National Mortgage Association, 3 1/2s, | | | | |
| April 1, 2041 | 159,000,000 | | 4/13/11 | 149,733,289 |
|
| Total | | | | $576,665,948 |
59
INTEREST RATE SWAP CONTRACTS OUTSTANDING at 3/31/11 (Unaudited)
| | | | | | | |
| | | Upfront | | | Payments | Payments | Unrealized |
| Swap counterparty / | premium | Termination | | made by | received by | appreciation/ |
| Notional amount | received (paid) | date | | fund per annum | fund per annum | (depreciation) |
|
| Bank of America, N.A. | | |
| | $1,144,988,600 | $(77,717) | 12/6/12 | | 0.79% | 3 month USD- | |
| | | | | | | LIBOR-BBA | $(3,064,855) |
|
| GBP | 205,760,000 | — | 2/3/13 | | 1.875% | 6 month GBP- | |
| | | | | | | LIBOR-BBA | (852,176) |
|
| GBP | 92,060,000 | — | 2/3/16 | | 3.0625% | 6 month GBP- | |
| | | | | | | LIBOR-BBA | (1,295,819) |
|
| GBP | 64,920,000 | — | 2/3/21 | | 3.9225% | 6 month GBP- | |
| | | | | | | LIBOR-BBA | (1,518,690) |
|
| GBP | 133,730,000 E | — | 2/3/31 | | 6 month GBP- | | |
| | | | | | LIBOR-BBA | 4.87% | 1,185,975 |
|
| Barclays Bank PLC | | | |
| | $1,100,550,300 | (353,081) | 2/17/16 | | 3 month USD- | | |
| | | | | | LIBOR-BBA | 2.56% | 12,220,080 |
|
| | 164,957,000 | — | 3/9/21 | | 4.2375% | 3 month USD- | |
| | | | | | | LIBOR-BBA | (10,260,630) |
|
| EUR | 83,330,000 | — | 3/1/21 | | 6 month EUR- | | |
| | | | | | EURIBOR- | | |
| | | | | | REUTERS | 3.425% | (1,698,656) |
|
| | $200,563,900 | (939,534) | 3/4/21 | | 3.53% | 3 month USD- | |
| | | | | | | LIBOR-BBA | (1,223,689) |
|
| | 103,431,200 | — | 3/10/41 | | 3 month USD- | | |
| | | | | | LIBOR-BBA | 4.38% | 1,986,485 |
|
| | 215,694,700 | — | 3/10/18 | | 3.06% | 3 month USD- | |
| | | | | | | LIBOR-BBA | (1,002,088) |
|
| AUD | 248,160,000 | — | 3/21/16 | | 5.57% | 6 month AUD- | |
| | | | | | | BBR-BBSW | 1,157,221 |
|
| AUD | 188,630,000 | — | 3/21/21 | | 6 month AUD- | | |
| | | | | | BBR-BBSW | 5.88% | (1,747,318) |
|
| | $655,016,900 | 775,852 | 3/30/16 | | 3 month USD- | | |
| | | | | | LIBOR-BBA | 2.39% | 74,547 |
|
| | 400,360,300 | (811,383) | 3/30/21 | | 3.55% | 3 month USD- | |
| | | | | | | LIBOR-BBA | (872,060) |
|
| | 6,453,400 | 8,320 | 3/30/31 | | 3 month USD- | | |
| | | | | | LIBOR-BBA | 4.17% | 12,507 |
|
| | 927,596,500 | 214,607 | 4/1/13 | | 1% | 3 month USD- | |
| | | | | | | LIBOR-BBA | (722,266) |
|
| | 9,494,000 | — | 4/1/21 | | 3.562% | 3 month USD- | |
| | | | | | | LIBOR-BBA | (8,355) |
|
| GBP | 113,500,000 | — | 1/18/21 | | 3.7875% | 6 month GBP- | |
| | | | | | | LIBOR-BBA | (845,776) |
|
| GBP | 123,490,000 E | — | 2/3/31 | | 6 month GBP- | | |
| | | | | | LIBOR-BBA | 4.86% | 990,011 |
|
| GBP | 288,060,000 | — | 2/3/13 | | 1.895% | 6 month GBP- | |
| | | | | | | LIBOR-BBA | (1,374,160) |
|
| GBP | 47,340,000 | — | 2/3/21 | | 6 month GBP- | | |
| | | | | | LIBOR-BBA | 3.95% | 1,285,648 |
|
| EUR | 91,712,000 | — | 2/9/21 | | 3.53% | 6 month EUR- | |
| | | | | | | EURIBOR- | |
| | | | | | | REUTERS | 517,982 |
|
60
INTEREST RATE SWAP CONTRACTS OUTSTANDING at 3/31/11 (Unaudited) cont.
| | | | | | | |
| | | Upfront | | | Payments | Payments | Unrealized |
| Swap counterparty / | premium | Termination | | made by | received by | appreciation/ |
| Notional amount | received (paid) | date | | fund per annum | fund per annum | (depreciation) |
|
| Citibank, N.A. | | | |
| | $689,174,200 | $132,026 | 7/9/20 | | 3 month USD- | | |
| | | | | | LIBOR-BBA | 3.01% | $(20,349,916) |
|
| | 511,780,000 | — | 11/8/20 | | 2.635% | 3 month USD- | |
| | | | | | | LIBOR-BBA | 31,962,267 |
|
| SEK | 317,440,000 | — | 11/23/20 | | 3.25% | 3 month SEK- | |
| | | | | | | STIBOR-SIDE | 1,925,665 |
|
| | $1,063,165,800 | (292,537) | 12/10/12 | | 0.81% | 3 month USD- | |
| | | | | | | LIBOR-BBA | (3,480,292) |
|
| SEK | 285,890,000 | — | 3/24/21 | | 3 month SEK- | | |
| | | | | | STIBOR-SIDE | 3.8025% | (153,691) |
|
| | $1,060,568,100 | (287,170) | 6/28/14 | | 1.81% | 3 month USD- | |
| | | | | | | LIBOR-BBA | (10,979,052) |
|
| | 566,582,000 | (344,200) | 2/3/13 | | 0.8% | 3 month USD- | |
| | | | | | | LIBOR-BBA | (161,343) |
|
| SEK | 205,600,000 | — | 2/4/21 | | 3.79% | 3 month SEK- | |
| | | | | | | STIBOR-SIDE | 55,786 |
|
| GBP | 491,000,000 | — | 8/3/15 | | 2.9225% | 6 month GBP- | |
| | | | | | | LIBOR-BBA | (6,319,843) |
|
| GBP | 145,660,000 | — | 8/3/20 | | 6 month GBP- | | |
| | | | | | LIBOR-BBA | 3.885% | 3,618,347 |
|
| GBP | 613,760,000 | — | 8/3/12 | | 6 month GBP- | | |
| | | | | | LIBOR-BBA | 1.61% | 1,707,907 |
|
| SEK | 317,440,000 | — | 11/23/20 | | 3 month SEK- | | |
| | | | | | STIBOR-SIDE | 3.75% | (291,798) |
|
| Credit Suisse International | | | | | |
| CHF | 72,780,000 | — | 12/14/20 | | 2.1075% | 6 month CHF- | |
| | | | | | | LIBOR-BBA | 898,197 |
|
| CHF | 278,190,000 | — | 1/28/13 | | 0.675% | 6 month CHF- | |
| | | | | | | LIBOR-BBA | 559,571 |
|
| | $299,404,600 | — | 2/3/13 | | 0.83125% | 3 month USD- | |
| | | | | | | LIBOR-BBA | (89,106) |
|
| GBP | 147,690,000 | — | 2/3/16 | | 3.065% | 6 month GBP- | |
| | | | | | | LIBOR-BBA | (2,105,888) |
|
| GBP | 81,650,000 | — | 2/3/21 | | 6 month GBP- | | |
| | | | | | LIBOR-BBA | 3.93% | 1,994,245 |
|
| SEK | 205,600,000 | — | 2/7/21 | | 3.82% | 3 month SEK- | |
| | | | | | | STIBOR-SIDE | (20,574) |
|
| GBP | 41,670,000 | — | 3/3/21 | | 3.87375% | 6 month GBP- | |
| | | | | | | LIBOR-BBA | (516,058) |
|
| CHF | 41,670,000 | — | 3/7/21 | | 2.27% | 6 month CHF- | |
| | | | | | | LIBOR-BBA | 124,500 |
|
| | $988,351,500 | (1,317,266) | 3/14/16 | | 3 month USD- | | |
| | | | | | LIBOR-BBA | 2.35% | (2,676,276) |
|
| | 146,568,400 | (339,671) | 3/14/41 | | 3 month USD- | | |
| | | | | | LIBOR-BBA | 4.36% | 1,901,967 |
|
| CHF | 83,840,000 | — | 3/18/21 | | 2.16% | 6 month CHF- | |
| | | | | | | LIBOR-BBA | 1,250,080 |
|
61
INTEREST RATE SWAP CONTRACTS OUTSTANDING at 3/31/11 (Unaudited) cont.
| | | | | | | |
| | | Upfront | | | Payments | Payments | Unrealized |
| Swap counterparty / | premium | Termination | | made by | received by | appreciation/ |
| Notional amount | received (paid) | date | | fund per annum | fund per annum | (depreciation) |
|
| Credit Suisse International cont. | | | | | |
| CHF | 41,920,000 | $— | 3/21/21 | | 2.16% | 6 month CHF- | |
| | | | | | | LIBOR-BBA | $626,855 |
|
| | $381,800,000 E | — | 3/21/13 | | 1.15625% | 3 month USD- | |
| | | | | | | LIBOR-BBA | 950,682 |
|
| CHF | 78,210,000 | — | 3/22/16 | | 1.5075% | 6 month CHF- | |
| | | | | | | LIBOR-BBA | 606,020 |
|
| | $94,900,000 | — | 3/23/21 | | 3.452% | 3 month USD- | |
| | | | | | | LIBOR-BBA | 722,202 |
|
| SEK | 199,790,000 | — | 3/29/21 | | 3 month SEK- | | |
| | | | | | STIBOR-SIDE | 3.81125% | (86,166) |
|
| SEK | 157,310,000 | — | 4/4/21 | | 3.815% | 3 month SEK- | |
| | | | | | | STIBOR-SIDE | — |
|
| CHF | 78,080,000 | — | 7/28/15 | | 1.27% | 6 month CHF- | |
| | | | | | | LIBOR-BBA | 238,253 |
|
| MXN | 364,910,000 | — | 7/21/20 | | 1 month MXN- | | |
| | | | | | TIIE-BANXICO | 6.895% | (1,947,851) |
|
| | $178,159,000 | (48,976) | 11/3/12 | | 0.50% | 3 month USD- | |
| | | | | | | LIBOR-BBA | 281,699 |
|
| | 862,313,500 | — | 2/8/13 | | 0.96% | 3 month USD- | |
| | | | | | | LIBOR-BBA | (2,296,676) |
|
| CHF | 412,290,000 | — | 2/9/13 | | 0.6875% | 6 month CHF- | |
| | | | | | | LIBOR-BBA | 953,820 |
|
| | $645,412,900 | (132,044) | 2/24/15 | | 2.04% | 3 month USD- | |
| | | | | | | LIBOR-BBA | (3,297,257) |
|
| | 541,857,700 | (86,765) | 2/24/21 | | 3.69% | 3 month USD- | |
| | | | | | | LIBOR-BBA | (8,935,301) |
|
| | 290,545,700 | 85,015 | 2/24/26 | | 4.16% | 3 month USD- | |
| | | | | | | LIBOR-BBA | (6,531,599) |
|
| CHF | 41,620,000 | — | 2/25/21 | | 6 month CHF- | | |
| | | | | | LIBOR-BBA | 2.2125% | (326,126) |
|
| CHF | 39,040,000 | — | 3/1/21 | | 6 month CHF- | | |
| | | | | | LIBOR-BBA | 2.24% | (211,656) |
|
| EUR | 41,665,000 | — | 3/4/21 | | 3.46% | 6 month EUR- | |
| | | | | | | EURIBOR- | |
| | | | | | | REUTERS | 687,990 |
|
| SEK | 364,140,000 | — | 3/4/21 | | 3 month SEK- | | |
| | | | | | STIBOR-SIDE | 3.78% | (252,156) |
|
| | $1,534,431,400 | (837,185) | 7/8/20 | | 3 month USD- | | |
| | | | | | LIBOR-BBA | 3.06% | (39,960,648) |
|
| Deutsche Bank AG | | | | | | |
| | 1,317,485,700 | (37,370) | 11/3/12 | | 0.50% | 3 month USD- | |
| | | | | | | LIBOR-BBA | 2,407,975 |
|
| | 1,389,454,800 | 3,254,932 | 7/27/20 | | 3 month USD- | | |
| | | | | | LIBOR-BBA | 2.94% | (48,980,861) |
|
| MXN | 364,910,000 | — | 7/17/20 | | 1 month MXN- | | |
| | | | | | TIIE-BANXICO | 6.95% | (1,821,400) |
|
| | $860,492,900 | 151,712 | 12/31/14 | | 1.91% | 3 month USD- | |
| | | | | | | LIBOR-BBA | (4,898,975) |
|
62
INTEREST RATE SWAP CONTRACTS OUTSTANDING at 3/31/11 (Unaudited) cont.
| | | | | | | |
| | | Upfront | | | Payments | Payments | Unrealized |
| Swap counterparty / | premium | Termination | | made by | received by | appreciation/ |
| Notional amount | received (paid) | date | | fund per annum | fund per annum | (depreciation) |
|
| Deutsche Bank AG cont. | | | | | |
| | $411,071,500 | $— | 1/14/13 | | 0.85625% | 3 month USD- | |
| | | | | | | LIBOR-BBA | $(704,191) |
|
| | 898,335,000 | — | 2/5/14 | | 2.44661% | 3 month USD- | |
| | | | | | | LIBOR-BBA | (28,353,959) |
|
| EUR | 299,300,000 | — | 12/23/20 | | 3.325% | 6 month EUR- | |
| | | | | | | EURIBOR- | |
| | | | | | | REUTERS | 7,518,831 |
|
| Goldman Sachs International | | | | | |
| | $952,190,300 | 1,557,315 | 2/15/15 | | 2.16% | 3 month USD- | |
| | | | | | | LIBOR-BBA | (8,268,098) |
|
| SEK | 204,500,000 | — | 12/10/20 | | 3.5775% | 3 month SEK- | |
| | | | | | | STIBOR-SIDE | 392,599 |
|
| CHF | 304,870,000 | — | 12/15/12 | | 0.538% | 6 month CHF- | |
| | | | | | | LIBOR-BBA | 981,277 |
|
| | $1,051,106,600 | (248,455) | 1/5/13 | | 0.79% | 3 month USD- | |
| | | | | | | LIBOR-BBA | (1,009,291) |
|
| | 715,782,900 | (3,172,703) | 2/15/20 | | 3 month USD- | | |
| | | | | | LIBOR-BBA | 3.67% | 15,572,359 |
|
| | 120,599,800 | — | 2/28/41 | | 3 month USD- | | |
| | | | | | LIBOR-BBA | 4.31% | 999,216 |
|
| EUR | 41,665,000 | — | 3/2/21 | | 3.4325% | 6 month EUR- | |
| | | | | | | EURIBOR- | |
| | | | | | | REUTERS | 816,845 |
|
| SEK | 364,140,000 | — | 3/2/21 | | 3 month SEK- | | |
| | | | | | STIBOR-SIDE | 3.7575% | (348,730) |
|
| | $267,381,800 | (65,842) | 10/1/13 | | 0.84% | 3 month USD- | |
| | | | | | | LIBOR-BBA | 1,640,533 |
|
| | 245,540,700 E | — | 3/19/13 | | 1.09375% | 3 month USD- | |
| | | | | | | LIBOR-BBA | 743,988 |
|
| | 332,419,500 | — | 4/4/16 | | 3 month USD- | | |
| | | | | | LIBOR-BBA | 2.415% | — |
|
| GBP | 57,360,000 | — | 1/21/21 | | 3.81% | 6 month GBP- | |
| | | | | | | LIBOR-BBA | (578,300) |
|
| JPMorgan Chase Bank, N.A. | | | | | |
| JPY | 8,172,000,000 | — | 2/22/21 | | 1.36375% | 6 month JPY- | |
| | | | | | | LIBOR-BBA | (887,402) |
|
| | $36,780,200 | — | 3/9/26 | | 3 month USD- | | |
| | | | | | LIBOR-BBA | 4.07% | 389,851 |
|
| | 667,483,500 | 314,622 | 3/11/13 | | 0.91% | 3 month USD- | |
| | | | | | | LIBOR-BBA | 151,080 |
|
| | 139,525,900 | 238,405 | 3/11/21 | | 3.64% | 3 month USD- | |
| | | | | | | LIBOR-BBA | (1,173,831) |
|
| | 723,101,000 | (1,485,036) | 3/11/20 | | 3 month USD- | | |
| | | | | | LIBOR-BBA | 3.49% | 4,956,599 |
|
| | 67,418,500 | 256,854 | 3/11/41 | | 4.42% | 3 month USD- | |
| | | | | | | LIBOR-BBA | (1,497,040) |
|
63
INTEREST RATE SWAP CONTRACTS OUTSTANDING at 3/31/11 (Unaudited) cont.
| | | | | | | |
| | | Upfront | | | Payments | Payments | Unrealized |
| Swap counterparty / | premium | Termination | | made by | received by | appreciation/ |
| Notional amount | received (paid) | date | | fund per annum | fund per annum | (depreciation) |
|
| JPMorgan Chase Bank, N.A. cont. | | | | | |
| | $408,004,600 | $— | 3/11/13 | | 0.912% | 3 month USD- | |
| | | | | | | LIBOR-BBA | $(112,660) |
|
| | 717,700,000 E | — | 3/21/13 | | 1.1685% | 3 month USD- | |
| | | | | | | LIBOR-BBA | 1,700,949 |
|
| | 385,700,000 E | — | 3/22/13 | | 1.185% | 3 month USD- | |
| | | | | | | LIBOR-BBA | 863,968 |
|
| | 32,800,000 | — | 3/23/41 | | 4.21% | 3 month USD- | |
| | | | | | | LIBOR-BBA | 382,176 |
|
| | 160,400,400 | — | 3/28/41 | | 4.249% | 3 month USD- | |
| | | | | | | LIBOR-BBA | 874,213 |
|
| MXN | 52,130,000 | — | 7/16/20 | | 1 month MXN- | | |
| | | | | | TIIE-BANXICO | 6.99% | (247,734) |
|
| | $28,065,600 | (8,506) | 3/31/16 | | 2.42% | 3 month USD- | |
| | | | | | | LIBOR-BBA | (15,766) |
|
| | 407,585,600 | (816,602) | 3/31/41 | | 4.28% | 3 month USD- | |
| | | | | | | LIBOR-BBA | (762,813) |
|
| | 18,147,000 | — | 3/31/21 | | 3 month USD- | | |
| | | | | | LIBOR-BBA | 3.57% | 32,313 |
|
| | 24,532,000 | — | 3/31/21 | | 3 month USD- | | |
| | | | | | LIBOR-BBA | 3.565% | 33,130 |
|
| JPY | 13,447,610,000 | — | 5/25/15 | | 0.674375% | 6 month JPY- | |
| | | | | | | LIBOR-BBA | (1,102,037) |
|
| EUR | 97,820,000 | — | 5/31/15 | | 6 month EUR- | | |
| | | | | | EURIBOR- | | |
| | | | | | REUTERS | 2.0975% | (2,762,693) |
|
| MXN | 325,230,000 | — | 8/19/20 | | 1 month MXN- | | |
| | | | | | TIIE-BANXICO | 6.615% | (2,287,361) |
|
| | $1,054,315,200 | 326,080 | 1/6/13 | | 0.79% | 3 month USD- | |
| | | | | | | LIBOR-BBA | (422,810) |
|
| GBP | 47,340,000 | — | 2/3/21 | | 6 month GBP- | | |
| | | | | | LIBOR-BBA | 3.93105% | 1,162,457 |
|
| JPY | 13,410,360,000 | — | 9/16/15 | | 6 month JPY- | | |
| | | | | | LIBOR-BBA | 0.59125% | 212,719 |
|
| CAD | 41,210,000 | — | 9/21/20 | | 3.105% | 3 month CAD- | |
| | | | | | | BA-CDOR | 1,953,498 |
|
| JPY | 2,192,700,000 E | — | 7/28/29 | | 6 month JPY- | | |
| | | | | | LIBOR-BBA | 2.67% | (346,799) |
|
| JPY | 2,948,000,000 E | — | 7/28/39 | | 2.40% | 6 month JPY- | |
| | | | | | | LIBOR-BBA | 520,548 |
|
| EUR | 9,800,000 | — | 2/4/40 | | 6 month EUR- | | |
| | | | | | EURIBOR- | | |
| | | | | | REUTERS | 3.79% | (194,634) |
|
| MXN | 528,640,000 | — | 11/4/20 | | 1 month MXN- | | |
| | | | | | TIIE-BANXICO | 6.75% | (3,394,677) |
|
64
INTEREST RATE SWAP CONTRACTS OUTSTANDING at 3/31/11 (Unaudited) cont.
| | | | | | | |
| | | Upfront | | | Payments | Payments | Unrealized |
| Swap counterparty / | premium | Termination | | made by | received by | appreciation/ |
| Notional amount | received (paid) | date | | fund per annum | fund per annum | (depreciation) |
|
| UBS, AG | | | | | | |
| CHF | 420,800,000 | $— | 2/11/13 | | 0.6975% | 6 month CHF- | |
| | | | | | | LIBOR-BBA | $895,417 |
|
| CHF | 63,280,000 | — | 2/17/21 | | 2.275% | 6 month CHF- | |
| | | | | | | LIBOR-BBA | 63,648 |
|
| CHF | 29,910,000 | — | 3/28/21 | | 6 month CHF- | | |
| | | | | | LIBOR-BBA | 2.21% | (317,732) |
|
| Total | | | | | | | $(132,202,907) |
E See Note 1 to the financial statements regarding extended effective dates.
TOTAL RETURN SWAP CONTRACTS OUTSTANDING at 3/31/11 (Unaudited)
| | | | | | |
| | Upfront | | | Fixed payments | Total return | Unrealized |
| Swap counterparty / | premium | Termination | | received (paid) by | received by | appreciation/ |
| Notional amount | received (paid) | date | | fund per annum | or paid by fund | (depreciation) |
|
| Barclays Bank PLC | | | | | | |
| $16,269,985 | $— | 1/12/40 | | 5.00% (1 month | Synthetic TRS | $205,111 |
| | | | | USD-LIBOR) | Index 5.00% | |
| | | | | | 30 year Fannie Mae | |
| | | | | | pools | |
|
| 6,217,037 | — | 1/12/40 | | 4.50% (1 month | Synthetic TRS | 35,926 |
| | | | | USD-LIBOR) | Index 4.50% | |
| | | | | | 30 year Fannie Mae | |
| | | | | | pools | |
|
| 38,290,959 | — | 1/12/40 | | 5.00% (1 month | Synthetic TRS | 482,723 |
| | | | | USD-LIBOR) | Index 5.00% | |
| | | | | | 30 year Fannie Mae | |
| | | | | | pools | |
|
| 4,942,087 | — | 1/12/41 | | 3.50% (1 month | Synthetic TRS | 22,085 |
| | | | | USD-LIBOR) | Index 3.50% | |
| | | | | | 30 year Fannie Mae | |
| | | | | | pools | |
|
| 4,546,908 | — | 1/12/41 | | 5.00% (1 month | Synthetic TRS | 66,546 |
| | | | | USD-LIBOR) | Index 5.00% | |
| | | | | | 30 year Fannie Mae | |
| | | | | | pools | |
|
| 4,942,087 | — | 1/12/41 | | 3.50% (1 month | Synthetic MBX | (6,207) |
| | | | | USD-LIBOR) | Index 3.50% | |
| | | | | | 30 year Fannie Mae | |
| | | | | | pools | |
|
| 4,886,199 | — | 1/12/41 | | 4.00% (1 month | Synthetic MBX | (9,457) |
| | | | | USD-LIBOR) | Index 4.00% | |
| | | | | | 30 year Fannie Mae | |
| | | | | | pools | |
|
| 4,614,580 | — | 1/12/41 | | 4.50% (1 month | Synthetic MBX | (6,291) |
| | | | | USD-LIBOR) | Index 4.50% | |
| | | | | | 30 year Fannie Mae | |
| | | | | | pools | |
|
65
TOTAL RETURN SWAP CONTRACTS OUTSTANDING at 3/31/11 (Unaudited) cont.
| | | | | | |
| | Upfront | | | Fixed payments | Total return | Unrealized |
| Swap counterparty / | premium | Termination | | received (paid) by | received by | appreciation/ |
| Notional amount | received (paid) | date | | fund per annum | or paid by fund | (depreciation) |
|
| Barclays Bank PLC cont. | | | | | |
| $19,408,147 | $— | 1/12/40 | | 5.00% (1 month | Synthetic TRS | $244,673 |
| | | | | USD-LIBOR) | Index 5.00% | |
| | | | | | 30 year Fannie Mae | |
| | | | | | pools | |
|
| 54,612,306 | — | 1/12/38 | | (6.50%) 1 month | Synthetic TRS | (612,447) |
| | | | | USD-LIBOR | Index 6.50% | |
| | | | | | 30 year Fannie Mae | |
| | | | | | pools | |
|
| 71,218,884 | — | 1/12/40 | | 4.50% (1 month | Synthetic TRS | 411,551 |
| | | | | USD-LIBOR) | Index 4.50% | |
| | | | | | 30 year Fannie Mae | |
| | | | | | pools | |
|
| 58,098,299 | 72,623 | 1/12/40 | | 5.00% (1 month | Synthetic TRS | 725,285 |
| | | | | USD-LIBOR) | Index 5.00% | |
| | | | | | 30 year Fannie Mae | |
| | | | | | pools | |
|
| 33,617,113 | (341,424) | 1/12/41 | | 5.00% (1 month | Synthetic TRS | 72,195 |
| | | | | USD-LIBOR) | Index 5.00% | |
| | | | | | 30 year Fannie Mae | |
| | | | | | pools | |
|
| 20,235,055 | (82,205) | 1/12/40 | | 4.50% (1 month | Synthetic TRS | (10,186) |
| | | | | USD-LIBOR) | Index 4.50% | |
| | | | | | 30 year Fannie Mae | |
| | | | | | pools | |
|
| 11,563,697 | (148,160) | 1/12/41 | | 5.00% (1 month | Synthetic TRS | (7,468) |
| | | | | USD-LIBOR) | Index 5.00% | |
| | | | | | 30 year Fannie Mae | |
| | | | | | pools | |
|
| 141,541,869 | — | 1/12/40 | | 5.00% (1 month | Synthetic TRS | 1,784,377 |
| | | | | USD-LIBOR) | Index 5.00% | |
| | | | | | 30 year Fannie Mae | |
| | | | | | pools | |
|
| 38,307,881 | — | 1/12/40 | | 5.00% (1 month | Synthetic TRS | 482,936 |
| | | | | USD-LIBOR) | Index 5.00% | |
| | | | | | 30 year Fannie Mae | |
| | | | | | pools | |
|
| 104,008,530 | — | 1/12/40 | | 5.00% (1 month | Synthetic TRS | 1,311,205 |
| | | | | USD-LIBOR) | Index 5.00% | |
| | | | | | 30 year Fannie Mae | |
| | | | | | pools | |
|
| 32,309,630 | — | 1/12/40 | | 4.50% (1 month | Synthetic TRS | 186,707 |
| | | | | USD-LIBOR) | Index 4.50% | |
| | | | | | 30 year Fannie Mae | |
| | | | | | pools | |
|
| 23,511,203 | — | 1/12/38 | | (6.50%) 1 month | Synthetic TRS | (263,665) |
| | | | | USD-LIBOR | Index 6.50% | |
| | | | | | 30 year Fannie Mae | |
| | | | | | pools | |
|
66
TOTAL RETURN SWAP CONTRACTS OUTSTANDING at 3/31/11 (Unaudited) cont.
| | | | | | | |
| | | Upfront | | | Fixed payments | Total return | Unrealized |
| Swap counterparty / | premium | Termination | | received (paid) by | received by | appreciation/ |
| Notional amount | received (paid) | date | | fund per annum | or paid by fund | (depreciation) |
|
| Barclays Bank PLC cont. | | | | | |
| | $422,959 | $— | 1/12/39 | | 6.00% (1 month | Synthetic TRS | $4,698 |
| | | | | | USD-LIBOR) | Index 6.00% | |
| | | | | | | 30 year Fannie Mae | |
| | | | | | | pools | |
|
| | 16,783,923 | — | 1/12/39 | | 5.50% (1 month | Synthetic TRS | 142,661 |
| | | | | | USD-LIBOR) | Index 5.50% | |
| | | | | | | 30 year Fannie Mae | |
| | | | | | | pools | |
|
| | 48,924,461 | — | 1/12/38 | | (6.50%) 1 month | Synthetic TRS | (548,661) |
| | | | | | USD-LIBOR | Index 6.50% | |
| | | | | | | 30 year Fannie Mae | |
| | | | | | | pools | |
|
| Citibank, N.A. | | | | | | |
| GBP | 73,890,000 | — | 5/18/13 | | (3.38%) | GBP Non-revised | 2,911,805 |
| | | | | | | UK Retail Price | |
| | | | | | | Index | |
|
| Credit Suisse International | | | | | |
| | $4,546,908 | — | 1/12/41 | | 5.00% (1 month | Synthetic MBX | (8,571) |
| | | | | | USD-LIBOR) | Index 5.00% | |
| | | | | | | 30 year Fannie Mae | |
| | | | | | | pools | |
|
| Deutsche Bank AG | | | | | | |
| | 9,417,272 | — | 1/12/40 | | 4.00% (1 month | Synthetic MBX | (18,227) |
| | | | | | USD-LIBOR) | Index 4.00% | |
| | | | | | | 30 year Fannie Mae | |
| | | | | | | pools | |
|
| Goldman Sachs International | | | | | |
| | 36,945,000 | — | 7/28/11 | | (0.685%) | USA Non Revised | 770,872 |
| | | | | | | Consumer Price | |
| | | | | | | Index - Urban | |
| | | | | | | (CPI-U) | |
|
| | 36,945,000 | — | 7/29/11 | | (0.76%) | USA Non Revised | 743,814 |
| | | | | | | Consumer Price | |
| | | | | | | Index - Urban | |
| | | | | | | (CPI-U) | |
|
| | 36,945,000 | — | 7/30/11 | | (0.73%) | USA Non Revised | 755,533 |
| | | | | | | Consumer Price | |
| | | | | | | Index - Urban | |
| | | | | | | (CPI-U) | |
|
| | 4,886,199 | — | 1/12/41 | | 4.00% (1 month | Synthetic TRS | 39,154 |
| | | | | | USD-LIBOR) | Index 4.00% | |
| | | | | | | 30 year Fannie Mae | |
| | | | | | | pools | |
|
| | 4,614,580 | — | 1/12/41 | | 4.50% (1 month | Synthetic TRS | 51,894 |
| | | | | | USD-LIBOR) | Index 4.50% | |
| | | | | | | 30 year Fannie Mae | |
| | | | | | | pools | |
|
| | 41,680,000 | — | 3/1/16 | | 2.47% | USA Non Revised | (82,000) |
| | | | | | | Consumer Price | |
| | | | | | | Index - Urban | |
| | | | | | | (CPI-U) | |
|
67
TOTAL RETURN SWAP CONTRACTS OUTSTANDING at 3/31/11 (Unaudited) cont.
| | | | | | |
| | Upfront | | | Fixed payments | Total return | Unrealized |
| Swap counterparty / | premium | Termination | | received (paid) by | received by | appreciation/ |
| Notional amount | received (paid) | date | | fund per annum | or paid by fund | (depreciation) |
|
| Goldman Sachs International cont. | | | | | |
| $20,840,000 | $— | 3/2/16 | | 2.45% | USA Non Revised | $(60,297) |
| | | | | | Consumer Price | |
| | | | | | Index - Urban | |
| | | | | | (CPI-U) | |
|
| 41,680,000 | — | 3/3/16 | | 2.45% | USA Non Revised | (118,398) |
| | | | | | Consumer Price | |
| | | | | | Index - Urban | |
| | | | | | (CPI-U) | |
|
| 41,680,000 | — | 3/7/16 | | 2.51% | USA Non Revised | 12,743 |
| | | | | | Consumer Price | |
| | | | | | Index - Urban | |
| | | | | | (CPI-U) | |
|
| 26,905,123 | — | 1/12/40 | | (5.00%) 1 month | Synthetic TRS | (339,185) |
| | | | | USD-LIBOR | Index 5.00% | |
| | | | | | 30 year Fannie Mae | |
| | | | | | pools | |
|
| 25,098,138 | — | 1/12/39 | | 5.50% (1 month | Synthetic TRS | 213,331 |
| | | | | USD-LIBOR) | Index 5.50% | |
| | | | | | 30 year Fannie Mae | |
| | | | | | pools | |
|
| 25,764,463 | 16,103 | 1/12/40 | | 5.00% (1 month | Synthetic TRS | 330,290 |
| | | | | USD-LIBOR) | Index 5.00% | |
| | | | | | 30 year Fannie Mae | |
| | | | | | pools | |
|
| 57,214,883 | — | 1/12/39 | | 5.50% (1 month | Synthetic TRS | 486,320 |
| | | | | USD-LIBOR) | Index 5.50% | |
| | | | | | 30 year Fannie Mae | |
| | | | | | pools | |
|
| 8,247,703 | — | 1/12/39 | | (6.00%) 1 month | Synthetic MBX | 3,512 |
| | | | | USD-LIBOR | Index 6.00% | |
| | | | | | 30 year Fannie Mae | |
| | | | | | pools | |
|
| 8,660,847 | — | 1/12/38 | | 6.50% (1 month | Synthetic MBX | 26,979 |
| | | | | USD-LIBOR) | Index 6.50% | |
| | | | | | 30 year Fannie Mae | |
| | | | | | pools | |
|
| 8,768,394 | — | 1/12/40 | | (5.00%) 1 month | Synthetic MBX | 17,898 |
| | | | | USD-LIBOR | Index 5.00% | |
| | | | | | 30 year Fannie Mae | |
| | | | | | pools | |
|
| 8,003,233 | — | 1/12/39 | | 5.50% (1 month | Synthetic MBX | 753 |
| | | | | USD-LIBOR) | Index 5.50% | |
| | | | | | 30 year Fannie Mae | |
| | | | | | pools | |
|
| 8,905,040 | — | 1/12/40 | | (4.50%) 1 month | Synthetic MBX | 10,750 |
| | | | | USD-LIBOR | Index 4.50% | |
| | | | | | 30 year Fannie Mae | |
| | | | | | pools | |
|
| Total | | | | | | $10,463,267 |
68
CREDIT DEFAULT CONTRACTS OUTSTANDING at 3/31/11 (Unaudited)
| | | | | | | |
| | | Upfront | | | | Fixed payments | |
| | | premium | | | Termi- | received | Unrealized |
| Swap counterparty / | | received | Notional | | nation | (paid) by fund | appreciation/ |
| Referenced debt* | Rating*** | (paid)** | amount | | date | per annum | (depreciation) |
|
| Bank of America, N.A. | | | | | | | |
| Ford Motor Credit | | | | | | | |
| Co., 7%, 10/1/13 | Ba2 | $— | $6,000,000 | | 3/20/12 | 285 bp | $112,625 |
|
| Credit Suisse International | | | | | | |
| Bonos Y Oblig Del | | | | | | | |
| Estado, 5 1/2%, | | | | | | | |
| 7/30/17 | — | (147,863) | 16,610,000 | | 12/20/19 | (100 bp) | 1,473,347 |
|
| Ukraine (Government | | | | | | | |
| of), 7.65%, 6/11/13 | B2 | — | 4,715,000 | | 10/20/11 | 194 bp | 47,005 |
|
| Deutsche Bank AG | | | | | | | |
| Federal Republic of | | | | | | | |
| Brazil, 12 1/4%, | | | | | | | |
| 3/6/30 | Baa3 | — | 3,770,000 | | 10/20/17 | 105 bp | (35,309) |
|
| Russian Federation, | | | | | | | |
| 7 1/2%, 3/31/30 | — | — | 987,500 | | 4/20/13 | (112 bp) | (14,261) |
|
| Smurfit Kappa | | | | | | | |
| Funding, 7 3/4%, | | | | | | | |
| 4/1/15 | B2 | — | EUR 2,045,000 | | 9/20/13 | 715 bp | 407,239 |
|
| United Mexican | | | | | | | |
| States, 7.5%, 4/8/33 | Baa1 | — | $6,115,000 | | 3/20/14 | 56 bp | (34,639) |
|
| Virgin Media | | | | | | | |
| Finance PLC, | | | | | | | |
| 8 3/4%, 4/15/14 | BB– | — | EUR 1,975,000 | | 9/20/13 | 477 bp | 225,378 |
|
| Virgin Media | | | | | | | |
| Finance PLC, | | | | | | | |
| 8 3/4%, 4/15/14 | BB– | — | EUR 1,975,000 | | 9/20/13 | 535 bp | 264,884 |
|
| Goldman Sachs International | | | | | | |
| Lighthouse | | | | | | | |
| International Co, | | | | | | | |
| SA, 8%, 4/30/14 | Caa2 | — | EUR 1,835,000 | | 3/20/13 | 680 bp | (1,346,185) |
|
| JPMorgan Chase Bank, N.A. | | | | | | |
| DJ CDX NA EM Series | | | | | | | |
| 10 Index | Ba1 | 134,596 | $2,330,000 | | 12/20/13 | 335 bp | 242,166 |
|
| DJ CDX NA HY Series | | | | | | | |
| 16 Version 1 Index | B+ | (678,541) | 32,899,000 | | 6/20/16 | 500 bp | 62,929 |
|
| Republic of | | | | | | | |
| Argentina, 8.28%, | | | | | | | |
| 12/31/33 | B3 | — | 2,860,000 | | 6/20/14 | 235 bp | (240,160) |
|
| Russian Federation, | | | | | | | |
| 7 1/2%, 3/31/30 | Baa1 | — | 495,000 | | 9/20/13 | 276 bp | 24,699 |
|
| Morgan Stanley Capital Services, Inc. | | | | | |
| Dominican Republic, | | | | | | | |
| 8 5/8%, 4/20/27 | — | — | 5,020,000 | | 11/20/11 | (170 bp) | 11,100 |
|
| Freeport-McMoRan | | | | | | | |
| Copper & Gold, | | | | | | | |
| Inc., T/L Bank Loan | Baa1 | — | 4,877,900 | | 3/20/12 | 44 bp | 1,436 |
|
69
CREDIT DEFAULT CONTRACTS OUTSTANDING at 3/31/11 (Unaudited) cont.
| | | | | | | |
| | | Upfront | | | | Fixed payments | |
| | | premium | | | Termi- | received | Unrealized |
| Swap counterparty / | | received | Notional | | nation | (paid) by fund | appreciation/ |
| Referenced debt* | Rating*** | (paid)** | amount | | date | per annum | (depreciation) |
|
| Morgan Stanley Capital Services, Inc. cont. | | | | | |
| Republic of | | | | | | | |
| Venezuela, 9 1/4%, | | | | | | | |
| 9/15/27 | B2 | $— | $3,545,000 | | 10/20/12 | 339 bp | $(202,345) |
|
| Total | | | | | | | $999,909 |
* Payments related to the referenced debt are made upon a credit default event.
** Upfront premium is based on the difference between the original spread on issue and the market spread on day of execution.
*** Ratings are presented for credit default contracts in which the fund has sold protection on the underlying referenced debt. Ratings for an underlying index represent the average of the ratings of all the securities included in that index. The Moody’s, Standard & Poor’s or Fitch ratings are believed to be the most recent ratings available at March 31, 2011.
ASC 820 establishes a three-level hierarchy for disclosure of fair value measurements. The valuation hierarchy is based upon the transparency of inputs to the valuation of the fund’s investments. The three levels are defined as follows:
Level 1 — Valuations based on quoted prices for identical securities in active markets.
Level 2 — Valuations based on quoted prices in markets that are not active or for which all significant inputs are observable, either directly or indirectly.
Level 3 — Valuations based on inputs that are unobservable and significant to the fair value measurement.
The following is a summary of the inputs used to value the fund’s net assets as of the close of the reporting period:
| | | | | | |
| | | | | Valuation inputs | |
|
| Investments in securities: | | Level 1 | Level 2 | Level 3 |
|
| Asset-backed securities | | $— | $534,019,630 | $12,666,801 |
|
| Convertible bonds and notes | | — | 7,318,029 | 2,538 |
|
| Corporate bonds and notes | | — | 1,608,915,329 | 18,001 |
|
| Foreign government bonds and notes | | — | 397,682,795 | — |
|
| Mortgage-backed securities | | — | 1,084,432,235 | — |
|
| Purchased options outstanding | | — | 8,748,438 | — |
|
| Senior loans | | — | 103,080,606 | — |
|
| U.S. Government and agency mortgage obligations | — | 903,332,902 | — |
|
| U.S. Treasury obligations | | — | 32,598,202 | — |
|
| Short-term investments | | 353,247,331 | 1,575,398,462 | — |
|
| Totals by level | | $353,247,331 | $6,255,526,628 | $12,687,340 |
70
| | | | | | |
| | | | | Valuation inputs | |
|
| Other financial instruments: | | Level 1 | Level 2 | Level 3 |
|
| Forward currency contracts | | $— | $20,651,148 | $— |
|
| Futures contracts | | (9,389,796) | — | — |
|
| Written options | | — | (223,464,750) | — |
|
| TBA sale commitments | | — | (576,665,948) | — |
|
| Interest rate swap contracts | | — | (127,816,604) | — |
|
| Total return swap contracts | | — | 10,946,330 | — |
|
| Credit default contracts | | — | 1,691,717 | — |
|
| Totals by level | | $(9,389,796) | $(894,658,107) | $— |
At the start and/or close of the reporting period, Level 3 investments in securities were not considered a significant portion of the fund’s portfolio.
The accompanying notes are an integral part of these financial statements.
71
Statement of assets and liabilities 3/31/11 (Unaudited)
| |
| ASSETS | |
|
| Investment in securities, at value, including of securities on loan (Note 1): | |
| Unaffiliated issuers (identified cost $6,130,426,278) | $6,268,213,968 |
| Affiliated issuers (identified cost $353,247,331) (Note 6) | 353,247,331 |
|
| Cash | 11,926,740 |
|
| Foreign currency (cost $2,061,780) (Note 1) | 2,077,711 |
|
| Interest and other receivables | 52,372,516 |
|
| Receivable for shares of the fund sold | 40,065,215 |
|
| Receivable for investments sold | 103,152,823 |
|
| Receivable for sales of delayed delivery securities (Notes 1 and 7) | 576,141,786 |
|
| Unrealized appreciation on swap contracts (Note 1) | 131,189,833 |
|
| Unrealized appreciation on forward currency contracts (Note 1) | 26,533,939 |
|
| Premium paid on swap contracts (Note 1) | 13,100,236 |
|
| Total assets | 7,578,022,098 |
|
| |
| LIABILITIES | |
|
| Payable for variation margin (Note 1) | 402,732 |
|
| Payable for investments purchased | 86,241,564 |
|
| Payable for purchases of delayed delivery securities (Notes 1 and 7) | 826,805,396 |
|
| Payable for shares of the fund repurchased | 12,980,785 |
|
| Payable for compensation of Manager (Note 2) | 2,547,246 |
|
| Payable for investor servicing fees (Note 2) | 604,538 |
|
| Payable for custodian fees (Note 2) | 82,462 |
|
| Payable for Trustee compensation and expenses (Note 2) | 513,094 |
|
| Payable for administrative services (Note 2) | 27,418 |
|
| Payable for distribution fees (Note 2) | 2,716,387 |
|
| Unrealized depreciation on forward currency contracts (Note 1) | 5,882,791 |
|
| Written options outstanding, at value (premiums received $272,442,587) (Notes 1 and 3) | 223,464,750 |
|
| Premium received on swap contracts (Note 1) | 7,539,062 |
|
| Unrealized depreciation on swap contracts (Note 1) | 251,929,564 |
|
| TBA sale commitments, at value (proceeds receivable $577,109,297) (Note 1) | 576,665,948 |
|
| Collateral on certain derivative contracts, at value (Note 1) | 32,598,202 |
|
| Other accrued expenses | 376,732 |
|
| Total liabilities | 2,031,378,671 |
| |
| Net assets | $5,546,643,427 |
|
| |
| REPRESENTED BY | |
|
| Paid-in capital (Unlimited shares authorized) (Notes 1 and 4) | $6,112,522,243 |
|
| Distributions in excess of net investment income (Note 1) | (29,673,631) |
|
| Accumulated net realized loss on investments and foreign currency transactions (Note 1) | (613,903,676) |
|
| Net unrealized appreciation of investments and assets and liabilities in foreign currencies | 77,698,491 |
|
| Total — Representing net assets applicable to capital shares outstanding | $5,546,643,427 |
(Continued on next page)
72
Statement of assets and liabilities (Continued)
| |
| COMPUTATION OF NET ASSET VALUE AND OFFERING PRICE | |
|
| Net asset value and redemption price per class A share | |
| ($2,787,039,017 divided by 338,821,432 shares) | $8.23 |
|
| Offering price per class A share (100/96.00 of $8.23)* | $8.57 |
|
| Net asset value and offering price per class B share ($102,641,216 divided by 12,579,068 shares)** | $8.16 |
|
| Net asset value and offering price per class C share ($954,482,211 divided by 117,604,195 shares)** | $8.12 |
|
| Net asset value and redemption price per class M share ($400,578,394 divided by 49,346,282 shares) | $8.12 |
|
| Offering price per class M share (100/96.75 of $8.12)*** | $8.39 |
|
| Net asset value, offering price and redemption price per class R share | |
| ($4,884,514 divided by 599,461 shares) | $8.15 |
|
| Net asset value, offering price and redemption price per class Y share | |
| ($1,297,018,075 divided by 158,546,862 shares) | $8.18 |
|
* On single retail sales of less than $100,000. On sales of $100,000 or more the offering price is reduced.
** Redemption price per share is equal to net asset value less any applicable contingent deferred sales charge.
*** On single retail sales of less than $50,000. On sales of $50,000 or more the offering price is reduced.
The accompanying notes are an integral part of these financial statements.
73
Statement of operations Six months ended 3/31/11 (Unaudited)
| |
| INVESTMENT INCOME | |
|
| Interest (net of foreign tax of $535,822) (including interest income | |
| of $244,121 from investments in affiliated issuers) (Note 6) | $183,554,719 |
|
| Total investment income | 183,554,719 |
|
| |
| EXPENSES | |
|
| Compensation of Manager (Note 2) | 13,885,004 |
|
| Investor servicing fees (Note 2) | 3,384,936 |
|
| Custodian fees (Note 2) | 142,335 |
|
| Trustee compensation and expenses (Note 2) | 252,444 |
|
| Administrative services (Note 2) | 56,688 |
|
| Distribution fees — Class A (Note 2) | 3,196,842 |
|
| Distribution fees — Class B (Note 2) | 494,879 |
|
| Distribution fees — Class C (Note 2) | 4,392,510 |
|
| Distribution fees — Class M (Note 2) | 1,046,897 |
|
| Distribution fees — Class R (Note 2) | 11,070 |
|
| Other | 722,365 |
|
| Total expenses | 27,585,970 |
| | |
| Expense reduction (Note 2) | (28,935) |
|
| Net expenses | 27,557,035 |
| |
| Net investment income | 155,997,684 |
|
| |
| Net realized gain on investments (Notes 1 and 3) | 291,957,044 |
|
| Net realized loss on swap contracts (Note 1) | (52,675,837) |
|
| Net realized loss on futures contracts (Note 1) | (155,718,693) |
|
| Net realized loss on foreign currency transactions (Note 1) | (37,304,758) |
|
| Net realized gain on written options (Notes 1 and 3) | 19,624,840 |
|
| Net unrealized depreciation of assets and liabilities in foreign currencies during the period | (49,981) |
|
| Net unrealized appreciation of investments, futures contracts, swap contracts, | |
| written options and TBA sale commitments during the period | 84,535,190 |
|
| Net gain on investments | 150,367,805 |
| |
| Net increase in net assets resulting from operations | $306,365,489 |
|
The accompanying notes are an integral part of these financial statements.
74
Statement of changes in net assets
| | |
| INCREASE IN NET ASSETS | Six months ended 3/31/11* | Year ended 9/30/10 |
|
| Operations: | | |
| Net investment income | $155,997,684 | $321,688,395 |
|
| Net realized gain on investments and foreign currency transactions | 65,882,596 | 286,168,036 |
|
| Net unrealized appreciation (depreciation) of investments | | |
| and assets and liabilities in foreign currencies | 84,485,209 | (32,898,222) |
|
| Net increase in net assets resulting from operations | 306,365,489 | 574,958,209 |
|
| Distributions to shareholders (Note 1): | | |
| From ordinary income | | |
| Net investment income | | |
|
| Class A | (109,342,932) | (246,442,176) |
|
| Class B | (3,883,680) | (12,030,597) |
|
| Class C | (34,875,485) | (69,763,924) |
|
| Class M | (17,740,999) | (65,530,661) |
|
| Class R | (184,252) | (476,907) |
|
| Class Y | (48,373,389) | (101,862,507) |
|
| Redemption fees (Note 1) | — | 24,680 |
|
| Increase from capital share transactions (Note 4) | 799,650,603 | 2,064,935,305 |
|
| Total increase in net assets | 891,615,355 | 2,143,811,422 |
|
| |
| NET ASSETS | | |
|
| Beginning of period | 4,655,028,072 | 2,511,216,650 |
|
| End of period (including distributions in excess of net investment | | |
| income of $29,673,631 and undistributed net investment | | |
| income of $28,729,422, respectively) | $5,546,643,427 | $4,655,028,072 |
|
* Unaudited
The accompanying notes are an integral part of these financial statements.
75
Financial highlights (For a common share outstanding throughout the period)
| | | | | | | | | | | | | | | |
| INVESTMENT OPERATIONS: | LESS DISTRIBUTIONS: | | RATIOS AND SUPPLEMENTAL DATA: | |
|
| | | | | | | | | | | | | | Ratio | | |
| | | | | | | | | | | | | | of expenses | | |
| | | | | | | | | | | | | | to average | Ratio | |
| | Net asset | | Net realized | | | | | | | | | Ratio | net assets, | of net investment | |
| | value, | | and unrealized | Total from | From | | | Non-recurring | | Total return | Net assets, | of expenses | excluding | income (loss) | |
| | beginning | Net investment | gain (loss) | investment | net investment | Total | Redemption | reimburse- | Net asset value, | at net asset | end of period | to average | interest expense | to average | Portfolio |
| Period ended | of period | income (loss) a | on investments | operations | income | distributions | fees | ments | end of period | value (%) c | (in thousands) | net assets (%) d | (%) d | net assets (%) | turnover (%) e |
|
| Class A | | | | | | | | | | | | | | | |
| March 31, 2011** | $8.08 | .25 | .25 | .50 | (.35) | (.35) | — | — | $8.23 | 6.34 * | $2,787,039 | .49* | .49* | 3.13* | 71* |
| September 30, 2010 | 7.89 | .72 | .63 | 1.35 | (1.16) | (1.16) | — b | — | 8.08 | 18.39 | 2,328,480 | 1.01 f | 1.01 | 8.96 | 95 |
| September 30, 2009 | 8.10 | .49 | (.02) | .47 | (.68) | (.68) | — b | — b,g | 7.89 | 8.23 | 1,334,298 | 1.13 f,h | 1.09 h | 7.44 h | 223 |
| September 30, 2008 | 9.91 | .69 | (1.90) | (1.21) | (.60) | (.60) | — b | — | 8.10 | (12.80) | 1,084,321 | 1.04 h | 1.04 h | 7.36 h | 157 |
| September 30, 2007 | 9.93 | .52 | — b | .52 | (.54) | (.54) | — b | — | 9.91 | 5.36 | 1,457,286 | .98 h | .98 h | 5.17 h | 74 |
| September 30, 2006 | 10.20 | .53 i | (.05) | .48 | (.75) | (.75) | — b | — | 9.93 | 5.03 | 1,336,319 | .95 h,i | .95 h,i | 5.32 h,i | 71 |
|
| Class B | | | | | | | | | | | | | | | |
| March 31, 2011** | $8.01 | .22 | .25 | .47 | (.32) | (.32) | — | — | $8.16 | 5.97 * | $102,641 | .86* | .86* | 2.79* | 71* |
| September 30, 2010 | 7.83 | .66 | .62 | 1.28 | (1.10) | (1.10) | — b | — | 8.01 | 17.50 | 96,346 | 1.76 f | 1.76 | 8.36 | 95 |
| September 30, 2009 | 8.04 | .42 | — b | .42 | (.63) | (.63) | — b | — b,g | 7.83 | 7.43 | 83,497 | 1.88 f,h | 1.84 h | 6.41 h | 223 |
| September 30, 2008 | 9.83 | .61 | (1.88) | (1.27) | (.52) | (.52) | — b | — | 8.04 | (13.40) | 109,173 | 1.79 h | 1.79 h | 6.57 h | 157 |
| September 30, 2007 | 9.85 | .44 | .01 | .45 | (.47) | (.47) | — b | — | 9.83 | 4.61 | 201,481 | 1.73 h | 1.73 h | 4.45 h | 74 |
| September 30, 2006 | 10.12 | .45 i | (.04) | .41 | (.68) | (.68) | — b | — | 9.85 | 4.26 | 273,563 | 1.70 h,i | 1.70 h,i | 4.59 h,i | 71 |
|
| Class C | | | | | | | | | | | | | | | |
| March 31, 2011** | $7.97 | .22 | .25 | .47 | (.32) | (.32) | — | — | $8.12 | 6.03 * | $954,482 | .86* | .86* | 2.76* | 71* |
| September 30, 2010 | 7.80 | .64 | .63 | 1.27 | (1.10) | (1.10) | — b | — | 7.97 | 17.47 | 797,345 | 1.76 f | 1.76 | 8.10 | 95 |
| September 30, 2009 | 8.03 | .48 | (.07) | .41 | (.64) | (.64) | — b | — b,g | 7.80 | 7.27 | 298,231 | 1.88 f,h | 1.84 h | 7.12 h | 223 |
| September 30, 2008 | 9.84 | .61 | (1.89) | (1.28) | (.53) | (.53) | — b | — | 8.03 | (13.57) | 115,325 | 1.79 h | 1.79 h | 6.62 h | 157 |
| September 30, 2007 | 9.87 | .44 | — b | .44 | (.47) | (.47) | — b | — | 9.84 | 4.49 | 129,666 | 1.73 h | 1.73 h | 4.42 h | 74 |
| September 30, 2006 | 10.14 | .45 i | (.04) | .41 | (.68) | (.68) | — b | — | 9.87 | 4.25 | 120,990 | 1.70 h,i | 1.70 h,i | 4.61 h,i | 71 |
|
| Class M | | | | | | | | | | | | | | | |
| March 31, 2011** | $7.97 | .25 | .24 | .49 | (.34) | (.34) | — | — | $8.12 | 6.27 * | $400,578 | .61* | .61* | 3.07* | 71* |
| September 30, 2010 | 7.79 | .70 | .62 | 1.32 | (1.14) | (1.14) | — b | — | 7.97 | 18.13 | 436,826 | 1.26 f | 1.26 | 8.92 | 95 |
| September 30, 2009 | 8.02 | .45 | (.01) | .44 | (.67) | (.67) | — b | — b,g | 7.79 | 7.81 | 460,240 | 1.38 f,h | 1.34 h | 6.98 h | 223 |
| September 30, 2008 | 9.81 | .66 | (1.88) | (1.22) | (.57) | (.57) | — b | — | 8.02 | (12.95) | 514,664 | 1.29 h | 1.29 h | 7.10 h | 157 |
| September 30, 2007 | 9.84 | .49 | — b | .49 | (.52) | (.52) | — b | — | 9.81 | 5.05 | 745,508 | 1.23 h | 1.23 h | 4.96 h | 74 |
| September 30, 2006 | 10.11 | .50 i | (.04) | .46 | (.73) | (.73) | — b | — | 9.84 | 4.82 | 1,082,428 | 1.20 h,i | 1.20 h,i | 5.10 h,i | 71 |
|
| Class R | | | | | | | | | | | | | | | |
| March 31, 2011** | $8.00 | .24 | .25 | .49 | (.34) | (.34) | — | — | $8.15 | 6.24 * | $4,885 | .61* | .61* | 3.03* | 71* |
| September 30, 2010 | 7.82 | .70 | .62 | 1.32 | (1.14) | (1.14) | — b | — | 8.00 | 18.08 | 4,185 | 1.26 f | 1.26 | 8.82 | 95 |
| September 30, 2009 | 8.06 | .48 | (.05) | .43 | (.67) | (.67) | — b | — b,g | 7.82 | 7.68 | 2,956 | 1.38 f,h | 1.34 h | 7.20 h | 223 |
| September 30, 2008 | 9.89 | .66 | (1.92) | (1.26) | (.57) | (.57) | — b | — | 8.06 | (13.29) | 2,756 | 1.29 h | 1.29 h | 7.09 h | 157 |
| September 30, 2007 | 9.91 | .46 | .04 | .50 | (.52) | (.52) | — b | — | 9.89 | 5.13 | 4,896 | 1.23 h | 1.23 h | 4.66 h | 74 |
| September 30, 2006 | 10.18 | .50 i | (.04) | .46 | (.73) | (.73) | — b | — | 9.91 | 4.79 | 703 | 1.20 h,i | 1.20 h,i | 5.06 h,i | 71 |
|
| Class Y | | | | | | | | | | | | | | | |
| March 31, 2011** | $8.04 | .26 | .24 | .50 | (.36) | (.36) | — | — | $8.18 | 6.40 * | $1,297,018 | .36* | .36* | 3.25* | 71* |
| September 30, 2010 | 7.85 | .73 | .64 | 1.37 | (1.18) | (1.18) | — b | — | 8.04 | 18.84 | 991,846 | .76 f | .76 | 9.18 | 95 |
| September 30, 2009 | 8.08 | .60 | (.13) | .47 | (.70) | (.70) | — b | — b,g | 7.85 | 8.26 | 331,995 | .88 f,h | .84 h | 8.61 h | 223 |
| September 30, 2008 | 9.92 | .71 | (1.93) | (1.22) | (.62) | (.62) | — b | — | 8.08 | (12.88) | 82,197 | .79 h | .79 h | 7.59 h | 157 |
| September 30, 2007 | 9.93 | .54 | .01 | .55 | (.56) | (.56) | — b | — | 9.92 | 5.72 | 20,550 | .73 h | .73 h | 5.40 h | 74 |
| September 30, 2006 | 10.20 | .55 i | (.04) | .51 | (.78) | (.78) | — b | — | 9.93 | 5.29 | 16,251 | .70 h,i | .70 h,i | 5.59 h,i | 71 |
|
See notes to financial highlights at the end of this section.
The accompanying notes are an integral part of these financial statements.
Financial highlights (Continued)
* Not annualized.
** Unaudited.
a Per share net investment income (loss) has been determined on the basis of the weighted average number of shares outstanding during the period.
b Amount represents less than $0.01 per share.
c Total return assumes dividend reinvestment and does not reflect the effect of sales charges.
d Includes amounts paid through expense offset arrangements (Note 2).
e Portfolio turnover excludes dollar roll transactions.
f Includes interest accrued in connection with certain terminated derivatives contracts, which amounted to less than 0.01% and 0.04% of average net assets for the periods ended September 30, 2010 and September 30, 2009, respectively.
g Reflects a non-recurring reimbursement pursuant to a settlement between the Securities and Exchange Commission (the SEC) and Bear Stearns & Co., Inc. and Bear Stearns Securities Corp., which amounted to less than $0.01 per share outstanding on May 21, 2009.
h Reflects an involuntary contractual expense limitation in effect during the period. For periods prior to September 30, 2009, certain fund expenses were waived in connection with the fund’s investment in Putnam Prime Money Market Fund. As a result of such limitation and/or waivers, the expenses of each class reflect a reduction of the following amounts:
| |
| | Percentage of |
| | average net assets |
|
| September 30, 2009 | 0.03% |
|
| September 30, 2008 | <0.01 |
|
| September 30, 2007 | <0.01 |
|
| September 30, 2006 | 0.01 |
|
i Reflects a non-recurring reimbursement from Putnam Investments relating to the calculation of certain amounts paid by the fund to Putnam in previous years for transfer agent services, which amounted to less than $0.01 per share and 0.01% of average net assets for the period ended September 30, 2006.
The accompanying notes are an integral part of these financial statements.
78
Notes to financial statements 3/31/11 (Unaudited)
Note 1: Significant accounting policies
Putnam Diversified Income Trust (the fund), is a Massachusetts business trust, which is registered under the Investment Company Act of 1940, as amended, as a diversified, open-end management investment company. The investment objective of the fund is to seek as high a level of current income as Putnam Investment Management, LLC (Putnam Management), the fund’s manager, an indirect wholly-owned subsidiary of Putnam Investments, LLC, believes is consistent with preservation of capital by investing primarily in bonds that are securitized debt instruments and other obligations of companies and governments worldwide that are either investment-grade or below investment-grade and have intermediate– to long-term maturities. The fund may invest in higher yielding, lower rated bonds that may have a higher rate of default. The fund may invest a significant portion of its assets in securitized debt instruments, including mortgage-backed and asset-backed investments. The yields and values of these investments are sensitive to changes in interest rates, the rate of principal payments on the underlying assets and the market’s perception of the issuers. The market for these investments may be volatile and limited, which may make them difficult to buy or sell.
The fund offers class A, class B, class C, class M, class R and class Y shares. Class A and class M shares are sold with a maximum front-end sales charge of 4.00% and 3.25%, respectively, and generally do not pay a contingent deferred sales charge. Class B shares, which convert to class A shares after approximately eight years, do not pay a front-end sales charge and are subject to a contingent deferred sales charge if those shares are redeemed within six years of purchase. Class C shares have a one-year 1.00% contingent deferred sales charge and do not convert to class A shares. Class R shares, which are not available to all investors, are sold at net asset value. The expenses for class A, class B, class C, class M and class R shares may differ based on the distribution fee of each class, which is identified in Note 2. Class Y shares, which are sold at net asset value, are generally subject to the same expenses as class A, class B, class C, class M and class R shares, but do not bear a distribution fee. Class Y shares are not available to all investors.
Prior to August 2, 2010, a 1.00% redemption fee applied to certain shares that were redeemed (either by selling or exchanging into another fund) within 7 days of purchase. The redemption fee was accounted for as an addition to paid-in-capital. Effective August 2, 2010, this redemption fee no longer applies to shares redeemed.
Investment income, realized and unrealized gains and losses and expenses of the fund are borne pro-rata based on the relative net assets of each class to the total net assets of the fund, except that each class bears expenses unique to that class (including the distribution fees applicable to such classes). Each class votes as a class only with respect to its own distribution plan or other matters on which a class vote is required by law or determined by the Trustees. If the fund were liquidated, shares of each class would receive their pro-rata share of the net assets of the fund. In addition, the Trustees declare separate dividends on each class of shares.
In the normal course of business, the fund enters into contracts that may include agreements to indemnify another party under given circumstances. The fund’s maximum exposure under these arrangements is unknown as this would involve future claims that may be, but have not yet been, made against the fund. However, the fund’s management team expects the risk of material loss to be remote.
The following is a summary of significant accounting policies consistently followed by the fund in the preparation of its financial statements. The preparation of financial statements is in conformity with accounting principles generally accepted in the United States of America and requires management to make estimates and assumptions that affect the reported amounts of assets and liabilities in the financial statements and the reported amounts of increases and decreases in net assets from operations. Actual results could differ from those estimates. Subsequent events after the Statement of assets and liabilities date through the date that the financial statements were issued have been evaluated in the preparation of the financial statements. Unless otherwise noted, the “reporting period” represents the period from October 1, 2010 through March 31, 2011.
A) Security valuation Market quotations are not considered to be readily available for certain debt obligations and other investments; such investments are valued on the basis of valuations furnished by an independent pricing service approved by the Trustees or dealers selected by Putnam Management. Such services or dealers determine valuations for normal institutional-size trading units of such securities using methods based on market transactions for comparable securities and various relationships, generally recognized by institutional traders, between securities (which considers such factors as security prices, yields, maturities and ratings). These securities will
79
generally be categorized as Level 2. Securities quoted in foreign currencies, if any, are translated into U.S. dollars at the current exchange rate.
To the extent a pricing service or dealer is unable to value a security or provides a valuation that Putnam Management does not believe accurately reflects the security’s fair value, the security will be valued at fair value by Putnam Management. Certain investments, including certain restricted and illiquid securities and derivatives, are also valued at fair value following procedures approved by the Trustees. These valuations consider such factors as significant market or specific security events such as interest rate or credit quality changes, various relationships with other securities, discount rates, U.S. Treasury, U.S. swap and credit yields, index levels, convexity exposures and recovery rates. These securities are classified as Level 2 or as Level 3 depending on the priority of the significant inputs.
Such valuations and procedures are reviewed periodically by the Trustees. Certain securities may be valued on the basis of a price provided by a single source. The fair value of securities is generally determined as the amount that the fund could reasonably expect to realize from an orderly disposition of such securities over a reasonable period of time. By its nature, a fair value price is a good faith estimate of the value of a security in a current sale and does not reflect an actual market price, which may be different by a material amount.
B) Joint trading account Pursuant to an exemptive order from the Securities and Exchange Commission (the SEC), the fund may transfer uninvested cash balances into a joint trading account along with the cash of other registered investment companies and certain other accounts managed by Putnam Management. These balances may be invested in issues of short-term investments having maturities of up to 90 days.
C) Repurchase agreements The fund, or any joint trading account, through its custodian, receives delivery of the underlying securities, the market value of which at the time of purchase is required to be in an amount at least equal to the resale price, including accrued interest. Collateral for certain tri-party repurchase agreements is held at the counterparty’s custodian in a segregated account for the benefit of the fund and the counterparty. Putnam Management is responsible for determining that the value of these underlying securities is at all times at least equal to the resale price, including accrued interest. In the event of default or bankruptcy by the other party to the agreement, retention of the collateral may be subject to legal proceedings.
D) Security transactions and related investment income Security transactions are recorded on the trade date (the date the order to buy or sell is executed). Gains or losses on securities sold are determined on the identified cost basis.
Interest income is recorded on the accrual basis.
All premiums/discounts are amortized/accreted on a yield-to-maturity basis.
Securities purchased or sold on a forward commitment or delayed delivery basis may be settled a month or more after the trade date; interest income is accrued based on the terms of the securities. Losses may arise due to changes in the market value of the underlying securities or if the counterparty does not perform under the contract.
The fund earned certain fees in connection with its senior loan purchasing activities. These fees are treated as market discount and are amortized into income in the Statement of operations.
E) Stripped securities The fund may invest in stripped securities which represent a participation in securities that may be structured in classes with rights to receive different portions of the interest and principal. Interest-only securities receive all of the interest and principal-only securities receive all of the principal. If the interest-only securities experience greater than anticipated prepayments of principal, the fund may fail to recoup fully its initial investment in these securities. Conversely, principal-only securities increase in value if prepayments are greater than anticipated and decline if prepayments are slower than anticipated. The market value of these securities is highly sensitive to changes in interest rates.
F) Foreign currency translation The accounting records of the fund are maintained in U.S. dollars. The market value of foreign securities, currency holdings, and other assets and liabilities is recorded in the books and records of the fund after translation to U.S. dollars based on the exchange rates on that day. The cost of each security is determined using historical exchange rates. Income and withholding taxes are translated at prevailing exchange rates when earned or incurred. The fund does not isolate that portion of realized or unrealized gains or losses resulting from changes in the foreign exchange rate on investments from fluctuations arising from changes in the market prices of the securities. Such gains and losses are included with the net realized and unrealized gain or loss on investments. Net realized gains and losses on foreign currency transactions represent net realized exchange gains or losses on closed forward currency contracts, disposition of foreign currencies, currency gains and losses realized between the trade and settlement dates on securities transactions and the difference between the amount of investment income and foreign withholding taxes recorded on the fund’s books and the U.S. dollar equivalent amounts actually
80
received or paid. Net unrealized appreciation and depreciation of assets and liabilities in foreign currencies arise from changes in the value of open forward currency contracts and assets and liabilities other than investments at the period end, resulting from changes in the exchange rate. Investments in foreign securities involve certain risks, including those related to economic instability, unfavorable political developments, and currency fluctuations, not present with domestic investments. The fund may be subject to taxes imposed by governments of countries in which it invests. Such taxes are generally based on either income or gains earned or repatriated. The fund accrues and applies such taxes to net investment income, net realized gains and net unrealized gains as income and/or capital gains are earned. In some cases, the fund may be entitled to reclaim all or a portion of such taxes, and such reclaim amounts, if any, are reflected as an asset on the fund’s books. In many cases, however, the fund may not receive such amounts for an extended period of time, depending on the country of investment.
G) Futures contracts The fund uses futures contracts to hedge interest rate risk and to gain exposure to interest rates. The potential risk to the fund is that the change in value of futures contracts may not correspond to the change in value of the hedged instruments. In addition, losses may arise from changes in the value of the underlying instruments if there is an illiquid secondary market for the contracts, if interest or exchange rates move unexpectedly or if the counterparty to the contract is unable to perform. With futures, there is minimal counterparty credit risk to the fund since futures are exchange traded and the exchange’s clearinghouse, as counterparty to all exchange traded futures, guarantees the futures against default. Risks may exceed amounts recognized on the Statement of assets and liabilities. When the contract is closed, the fund records a realized gain or loss equal to the difference between the value of the contract at the time it was opened and the value at the time it was closed.
Futures contracts are valued at the quoted daily settlement prices established by the exchange on which they trade. The fund and the broker agree to exchange an amount of cash equal to the daily fluctuation in the value of the futures contract. Such receipts or payments are known as “variation margin.” Futures contracts outstanding at period end, if any, are listed after the fund’s portfolio. The fund had an average number of contracts of approximately 22,500 on futures contracts for the reporting period.
H) Options contracts The fund uses options contracts to hedge duration, convexity and prepayment risk and to gain exposure to interest rates. The potential risk to the fund is that the change in value of options contracts may not correspond to the change in value of the hedged instruments. In addition, losses may arise from changes in the value of the underlying instruments if there is an illiquid secondary market for the contracts, if interest or exchange rates move unexpectedly or if the counterparty to the contract is unable to perform. Realized gains and losses on purchased options are included in realized gains and losses on investment securities. If a written call option is exercised, the premium originally received is recorded as an addition to sales proceeds. If a written put option is exercised, the premium originally received is recorded as a reduction to the cost of investments.
Exchange traded options are valued at the last sale price or, if no sales are reported, the last bid price for purchased options and the last ask price for written options. Options traded over-the-counter are valued using prices supplied by dealers. Written option contracts outstanding at period end, if any, are listed after the fund’s portfolio. See Note 3 for the volume of written options contracts activity for the reporting period. The fund had an average contract amount of approximately 2,137,700,000 on purchased options contracts for the reporting period.
I) Forward currency contracts The fund buys and sells forward currency contracts, which are agreements between two parties to buy and sell currencies at a set price on a future date. These contracts are used to hedge foreign exchange risk and to gain exposure on currency. The U.S. dollar value of forward currency contracts is determined using current forward currency exchange rates supplied by a quotation service. The market value of the contract will fluctuate with changes in currency exchange rates. The contract is marked to market daily and the change in market value is recorded as an unrealized gain or loss. When the contract is closed, the fund records a realized gain or loss equal to the difference between the value of the contract at the time it was opened and the value at the time it was closed. The fund could be exposed to risk if the value of the currency changes unfavorably, if the counterparties to the contracts are unable to meet the terms of their contracts or if the fund is unable to enter into a closing position. Risks may exceed amounts recognized on the Statement of assets and liabilities. Forward currency contracts outstanding at period end, if any, are listed after the fund’s portfolio. The fund had an average contract amount of approximately $2,762,100,000 on forward currency contracts for the reporting period.
J) Total return swap contracts The fund enters into total return swap contracts, which are arrangements to exchange a market linked return for a periodic payment, both based on a notional principal amount to hedge sector exposure, to manage exposure to specific sectors or industries, to gain exposure to specific sectors/industries, to gain exposure to rates of inflation in specific regions/countries and to hedge inflation in specific regions/countries. To the extent that the total return of the security, index or other financial measure underlying the transaction
81
exceeds or falls short of the offsetting interest rate obligation, the fund will receive a payment from or make a payment to the counterparty. Total return swap contracts are marked to market daily based upon quotations from an independent pricing service or market makers and the change, if any, is recorded as an unrealized gain or loss. Payments received or made are recorded as realized gains or losses. Certain total return swap contracts may include extended effective dates. Payments related to these swap contracts are accrued based on the terms of the contract. The fund could be exposed to credit or market risk due to unfavorable changes in the fluctuation of interest rates or in the price of the underlying security or index, the possibility that there is no liquid market for these agreements or that the counterparty may default on its obligation to perform. The fund’s maximum risk of loss from counterparty risk is the fair value of the contract. This risk may be mitigated by having a master netting arrangement between the fund and the counterparty. Risk of loss may exceed amounts recognized on the Statement of assets and liabilities. Total return swap contracts outstanding at period end, if any, are listed after the fund’s portfolio. The fund had an average notional amount of approximately $983,400,000 on total return swap contracts for the reporting period.
K) Interest rate swap contracts The fund enters into interest rate swap contracts, which are arrangements between two parties to exchange cash flows based on a notional principal amount, to hedge interest rate risk and to gain exposure on interest rates. An interest rate swap can be purchased or sold with an upfront premium. An upfront payment received by the fund is recorded as a liability on the fund’s books. An upfront payment made by the fund is recorded as an asset on the fund’s books. Interest rate swap contracts are marked to market daily based upon quotations from an independent pricing service or market makers and the change, if any, is recorded as an unrealized gain or loss. Payments received or made are recorded as realized gains or losses. Certain interest rate swap contracts may include extended effective dates. Payments related to these swap contracts are accrued based on the terms of the contract. The fund could be exposed to credit or market risk due to unfavorable changes in the fluctuation of interest rates or if the counterparty defaults on its obligation to perform. The fund’s maximum risk of loss from counterparty risk is the fair value of the contract. This risk may be mitigated by having a master netting arrangement between the fund and the counterparty. Risk of loss may exceed amounts recognized on the Statement of assets and liabilities. Interest rate swap contracts outstanding at period end, if any, are listed after the fund’s portfolio. The fund had an average notional amount of approximately $41,439,200,000 on interest rate swap contracts for the reporting period.
L) Credit default contracts The fund enters into credit default contracts to hedge credit risk and to gain exposure on individual names and/or baskets of securities. In a credit default contract, the protection buyer typically makes an up front payment and a periodic stream of payments to a counterparty, the protection seller, in exchange for the right to receive a contingent payment upon the occurrence of a credit event on the reference obligation or all other equally ranked obligations of the reference entity. Credit events are contract specific but may include bankruptcy, failure to pay, restructuring and obligation acceleration. An upfront payment received by the fund, as the protection seller, is recorded as a liability on the fund’s books. An upfront payment made by the fund, as the protection buyer, is recorded as an asset on the fund’s books. Periodic payments received or paid by the fund are recorded as realized gains or losses. The credit default contracts are marked to market daily based upon quotations from an independent pricing service or market makers and the change, if any, is recorded as an unrealized gain or loss. Upon the occurrence of a credit event, the difference between the par value and market value of the reference obligation, net of any proportional amount of the upfront payment, is recorded as a realized gain or loss.
In addition to bearing the risk that the credit event will occur, the fund could be exposed to market risk due to unfavorable changes in interest rates or in the price of the underlying security or index or the possibility that the fund may be unable to close out its position at the same time or at the same price as if it had purchased the underlying reference obligations. In certain circumstances, the fund may enter into offsetting credit default contracts which would mitigate its risk of loss. Risks of loss may exceed amounts recognized on the Statement of assets and liabilities. The fund’s maximum risk of loss from counterparty risk, either as the protection seller or as the protection buyer, is the fair value of the contract. This risk may be mitigated by having a master netting arrangement between the fund and the counterparty. Where the fund is a seller of protection, the maximum potential amount of future payments the fund may be required to make is equal to the notional amount of the relevant credit default contract. Credit default contracts outstanding, including their respective notional amounts at period end, if any, are listed after the fund’s portfolio. Outstanding notional amount on credit default swap contracts at the close of the reporting period are indicative of the volume of activity during the reporting period.
82
M) Master agreements The fund is a party to ISDA (International Swap and Derivatives Association, Inc.) Master Agreements (Master Agreements) with certain counterparties that govern over-the-counter derivative and foreign exchange contracts entered into from time to time. The Master Agreements may contain provisions regarding, among other things, the parties’ general obligations, representations, agreements, collateral requirements, events of default and early termination. With respect to certain counterparties, in accordance with the terms of the Master Agreements, collateral posted to the fund is held in a segregated account by the fund’s custodian and with respect to those amounts which can be sold or repledged, are presented in the fund’s portfolio. Collateral posted to the fund which cannot be sold or repledged totaled $14,236,720 at the close of the reporting period. Collateral pledged by the fund is segregated by the fund’s custodian and identified in the fund’s portfolio. Collateral can be in the form of cash or debt securities issued by the U.S. Government or related agencies or other securities as agreed to by the fund and the applicable counterparty. Collateral requirements are determined based on the fund’s net position with each counterparty. Termination events applicable to the fund may occur upon a decline in the fund’s net assets below a specified threshold over a certain period of time. Termination events applicable to counterparties may occur upon a decline in the counterparty’s long-term and short-term credit ratings below a specified level. In each case, upon occurrence, the other party may elect to terminate early and cause settlement of all derivative and foreign exchange contracts outstanding, including the payment of any losses and costs resulting from such early termination, as reasonably determined by the terminating party. Any decision by one or more of the fund’s counterparties to elect early termination could impact the fund’s future derivative activity.
At the close of the reporting period, the fund had a net liability position of $343,940,150 on derivative contracts subject to the Master Agreements. Collateral posted by the fund totaled $360,636,957.
N) TBA purchase commitments The fund may enter into TBA (to be announced) commitments to purchase securities for a fixed unit price at a future date beyond customary settlement time. Although the unit price has been established, the principal value has not been finalized. However, it is anticipated that the amount of the commitments will not significantly differ from the principal amount. The fund holds, and maintains until settlement date, cash or high-grade debt obligations in an amount sufficient to meet the purchase price, or the fund may enter into offsetting contracts for the forward sale of other securities it owns. Income on the securities will not be earned until settlement date. TBA purchase commitments may be considered securities themselves, and involve a risk of loss if the value of the security to be purchased declines prior to the settlement date, which risk is in addition to the risk of decline in the value of the fund’s other assets. Unsettled TBA purchase commitments are valued at fair value of the underlying securities, according to the procedures described under “Security valuation” above. The contract is marked to market daily and the change in market value is recorded by the fund as an unrealized gain or loss.
Although the fund will generally enter into TBA purchase commitments with the intention of acquiring securities for its portfolio or for delivery pursuant to options contracts it has entered into, the fund may dispose of a commitment prior to settlement if Putnam Management deems it appropriate to do so.
O) TBA sale commitments The fund may enter into TBA sale commitments to hedge its portfolio positions or to sell mortgage-backed securities it owns under delayed delivery arrangements. Proceeds of TBA sale commitments are not received until the contractual settlement date. During the time a TBA sale commitment is outstanding, equivalent deliverable securities, or an offsetting TBA purchase commitment deliverable on or before the sale commitment date, are held as “cover” for the transaction.
Unsettled TBA sale commitments are valued at the fair value of the underlying securities, generally according to the procedures described under “Security valuation” above. The contract is marked to market daily and the change in market value is recorded by the fund as an unrealized gain or loss. If the TBA sale commitment is closed through the acquisition of an offsetting TBA purchase commitment, the fund realizes a gain or loss. If the fund delivers securities under the commitment, the fund realizes a gain or a loss from the sale of the securities based upon the unit price established at the date the commitment was entered into. TBA sale commitments outstanding at period end, if any, are listed after the fund’s portfolio.
P) Dollar rolls To enhance returns, the fund may enter into dollar rolls (principally using TBAs) in which the fund sells securities for delivery in the current month and simultaneously contracts to purchase similar securities on a specified future date. During the period between the sale and subsequent purchase, the fund will not be entitled to receive income and principal payments on the securities sold. The fund will, however, retain the difference between the initial sales price and the forward price for the future purchase. The fund will also be able to earn interest on the cash proceeds that are received from the initial sale on settlement date. The fund may be exposed to market or credit risk if the price of the security changes unfavorably or the counterparty fails to perform under the terms of the agreement.
83
Q) Interfund lending The fund, along with other Putnam funds, may participate in an interfund lending program pursuant to an exemptive order issued by the SEC. This program allows the fund to borrow from or lend to other Putnam funds that permit such transactions. Interfund lending transactions are subject to each fund’s investment policies and borrowing and lending limits. Interest earned or paid on the interfund lending transaction will be based on the average of certain current market rates. During the reporting period, the fund did not utilize the program.
R) Line of credit The fund participates, along with other Putnam funds, in a $285 million unsecured committed line of credit and a $165 million unsecured uncommitted line of credit, both provided by State Street Bank and Trust Company (State Street). Borrowings may be made for temporary or emergency purposes, including the funding of shareholder redemption requests and trade settlements. Interest is charged to the fund based on the fund’s borrowing at a rate equal to the Federal Funds rate plus 1.25% for the committed line of credit and the Federal Funds rate plus 1.30% for the uncommitted line of credit. A closing fee equal to 0.03% of the committed line of credit and $100,000 for the uncommitted line of credit has been paid by the participating funds. In addition, a commitment fee of 0.15% per annum on any unutilized portion of the committed line of credit is allocated to the participating funds based on their relative net assets and paid quarterly. During the reporting period, the fund had no borrowings against these arrangements.
S) Federal taxes It is the policy of the fund to distribute all of its taxable income within the prescribed time period and otherwise comply with the provisions of the Internal Revenue Code of 1986, as amended (the Code), applicable to regulated investment companies. It is also the intention of the fund to distribute an amount sufficient to avoid imposition of any excise tax under Section 4982 of the Code. The fund is subject to the provisions of Accounting Standards Codification ASC 740 Income Taxes (ASC 740). ASC 740 sets forth a minimum threshold for financial statement recognition of the benefit of a tax position taken or expected to be taken in a tax return. The fund did not have a liability to record for any unrecognized tax benefits in the accompanying financial statements. No provision has been made for federal taxes on income, capital gains or unrealized appreciation on securities held nor for excise tax on income and capital gains. Each of the fund’s federal tax returns for the prior three fiscal years remains subject to examination by the Internal Revenue Service.
At September 30, 2010, the fund had a capital loss carryover of $657,697,922 available to the extent allowed by the Code to offset future net capital gain, if any. The amounts of the carryovers and the expiration dates are:
| | |
| Loss carryover | Expiration |
|
| $311,230,234 | | September 30, 2011 |
|
| 4,275,641 | | September 30, 2012 |
|
| 13,963,696 | | September 30, 2015 |
|
| 18,714,447 | | September 30, 2016 |
|
| 146,525,581 | | September 30, 2017 |
|
| 162,988,323 | | September 30, 2018 |
|
Under the recently enacted Regulated Investment Company Modernization Act of 2010, the fund will be permitted to carry forward capital losses incurred in taxable years beginning after December 22, 2010 for an unlimited period. However, any losses incurred during those future years will be required to be utilized prior to the losses incurred in pre-enactment tax years. As a result of this ordering rule, pre-enactment capital loss carryforwards may be more likely to expire unused. Additionally, post-enactment capital losses that are carried forward will retain their character as either short-term or long-term capital losses rather than being considered all short-term as under previous law.
Pursuant to federal income tax regulations applicable to regulated investment companies, the fund has elected to defer to its fiscal year ending September 30, 2011 $4,255,635 of losses recognized during the period from November 1, 2009 to September 30, 2010.
The aggregate identified cost on a tax basis is $6,505,781,389, resulting in gross unrealized appreciation and depreciation of $190,331,467 and $74,651,557, respectively, or net unrealized appreciation of $115,679,910.
T) Distributions to shareholders Distributions to shareholders from net investment income are recorded by the fund on the ex-dividend date. Distributions from capital gains, if any, are recorded on the ex-dividend date and paid at least annually. The amount and character of income and gains to be distributed are determined in accordance with income tax regulations, which may differ from generally accepted accounting principles. Dividend sources are estimated at the time of declaration. Actual results may vary. Any non-taxable return of capital cannot be
84
determined until final tax calculations are completed after the end of the fund’s fiscal year. Reclassifications are made to the fund’s capital accounts to reflect income and gains available for distribution (or available capital loss carryovers) under income tax regulations.
Note 2: Management fee, administrative services and other transactions
The fund pays Putnam Management a management fee (based on the fund’s average net assets and computed and paid monthly) at annual rates that may vary based on the average of the aggregate net assets of most open-end funds, as defined in the fund’s management contract, sponsored by Putnam Management. Such annual rates may vary as follows:
| |
| 0.700% | of the first $5 billion, |
| 0.650% | of the next $5 billion, |
| 0.600% | of the next $10 billion, |
| 0.550% | of the next $10 billion, |
| 0.500% | of the next $50 billion, |
| 0.480% | of the next $50 billion, |
| 0.470% | of the next $100 billion, |
| 0.465% | of any excess thereafter. |
Putnam Management has contractually agreed, through June 30, 2011, to waive fees or reimburse the fund’s expenses to the extent necessary to limit the cumulative expenses of the fund, exclusive of brokerage, interest, taxes, investment-related expenses, extraordinary expenses and payments under the fund’s investor servicing contract, investment management contract and distribution plans, on a fiscal year-to-date basis to an annual rate of 0.20% of the fund’s average net assets over such fiscal year-to-date period. During the reporting period, the fund’s expenses were not reduced as a result of this limit.
Putnam Investments Limited (PIL), an affiliate of Putnam Management, is authorized by the Trustees to manage a separate portion of the assets of the fund as determined by Putnam Management from time to time. Putnam Management pays a quarterly sub-management fee to PIL for its services at an annual rate of 0.40% of the average net assets of the portion of the fund managed by PIL.
The fund reimburses Putnam Management an allocated amount for the compensation and related expenses of certain officers of the fund and their staff who provide administrative services to the fund. The aggregate amount of all such reimbursements is determined annually by the Trustees.
Custodial functions for the fund’s assets are provided by State Street. Custody fees are based on the fund’s asset level, the number of its security holdings and transaction volumes.
Putnam Investor Services, Inc., an affiliate of Putnam Management, provides investor servicing agent functions to the fund. Putnam Investor Services, Inc. received fees for investor servicing based on the fund’s retail asset level, the number of shareholder accounts in the fund and the level of defined contribution plan assets in the fund. Investor servicing fees will not exceed an annual rate of 0.375% of the fund’s average net assets. The amounts incurred for investor servicing agent functions during the reporting period are included in Investor servicing fees in the Statement of operations.
The fund has entered into expense offset arrangements with Putnam Investor Services, Inc. and State Street whereby Putnam Investor Services, Inc.’s and State Street’s fees are reduced by credits allowed on cash balances. For the reporting period, the fund’s expenses were reduced by $28,935 under the expense offset arrangements.
Each independent Trustee of the fund receives an annual Trustee fee, of which $3,119, as a quarterly retainer, has been allocated to the fund, and an additional fee for each Trustees meeting attended. Trustees also are reimbursed for expenses they incur relating to their services as Trustees.
The fund has adopted a Trustee Fee Deferral Plan (the Deferral Plan) which allows the Trustees to defer the receipt of all or a portion of Trustees fees payable on or after July 1, 1995. The deferred fees remain invested in certain Putnam funds until distribution in accordance with the Deferral Plan.
The fund has adopted an unfunded noncontributory defined benefit pension plan (the Pension Plan) covering all Trustees of the fund who have served as a Trustee for at least five years and were first elected prior to 2004. Benefits under the Pension Plan are equal to 50% of the Trustee’s average annual attendance and retainer fees for the three years ended December 31, 2005. The retirement benefit is payable during a Trustee’s lifetime, beginning the year following retirement, for the number of years of service through December 31, 2006. Pension expense for the fund is included in Trustee compensation and expenses in the Statement of operations. Accrued pension
85
liability is included in Payable for Trustee compensation and expenses in the Statement of assets and liabilities. The Trustees have terminated the Pension Plan with respect to any Trustee first elected after 2003.
The fund has adopted distribution plans (the Plans) with respect to its class A, class B, class C, class M and class R shares pursuant to Rule 12b-1 under the Investment Company Act of 1940. The purpose of the Plans is to compensate Putnam Retail Management Limited Partnership, a wholly-owned subsidiary of Putnam Investments, LLC and Putnam Retail Management GP, Inc., for services provided and expenses incurred in distributing shares of the fund. The Plans provide for payments by the fund to Putnam Retail Management Limited Partnership at an annual rate of up to 0.35%, 1.00%, 1.00%, 1.00% and 1.00% of the average net assets attributable to class A, class B, class C, class M and class R shares, respectively. The Trustees have approved payment by the fund at an annual rate of 0.25%, 1.00%, 1.00%, 0.50% and 0.50% of the average net assets attributable to class A, class B, class C, class M and class R shares, respectively.
For the reporting period, Putnam Retail Management Limited Partnership, acting as underwriter, received net commissions of $587,266 and $4,843 from the sale of class A and class M shares, respectively, and received $59,012 and $63,334 in contingent deferred sales charges from redemptions of class B and class C shares, respectively.
A deferred sales charge of up to 1.00% and 0.40% is assessed on certain redemptions of class A and class M shares, respectively. For the reporting period, Putnam Retail Management Limited Partnership, acting as underwriter, received $10,877 and no monies on class A and class M redemptions, respectively.
Note 3: Purchases and sales of securities
During the reporting period, cost of purchases and proceeds from sales of investment securities other than short-term investments aggregated $2,968,857,564 and $3,490,483,671, respectively. There were no purchases or proceeds from sales of long-term U.S. government securities.
Written option transactions during the reporting period are summarized as follows:
| | | | |
| | | Contract amounts | | Premiums received |
| Written options outstanding at the | USD | 5,115,352,440 | | $299,099,514 |
| beginning of the reporting period | CHF | — | | $— |
|
| Options | USD | 115,403,025 | | 1,066,035 |
| opened | CHF | 800,640,000 | | 879,514 |
|
| Options | USD | (720,211,600) | | (19,298,069) |
| exercised | CHF | — | | — |
|
| Options | USD | (188,092,400) | | (8,595,823) |
| expired | CHF | — | | — |
|
| Options | USD | (17,452,800) | | (708,584) |
| closed | CHF | — | | — |
|
| Written options outstanding at the | USD | 4,304,998,665 | | $271,563,073 |
| end of the reporting period | CHF | 800,640,000 | | $879,514 |
|
Note 4: Capital shares
At the close of the reporting period, there was an unlimited number of shares of beneficial interest authorized. Transactions in capital shares were as follows:
| | | | |
| | Six months ended 3/31/11 | Year ended 9/30/10 |
|
| Class A | Shares | Amount | Shares | Amount |
|
| Shares sold | 91,708,396 | $746,393,458 | 154,665,822 | $1,237,672,467 |
|
| Shares issued in connection with | | | | |
| reinvestment of distributions | 9,857,194 | 79,851,349 | 22,201,951 | 175,493,519 |
|
| | 101,565,590 | 826,244,807 | 176,867,773 | 1,413,165,986 |
|
| Shares repurchased | (51,046,452) | (415,064,790) | (57,777,770) | (461,960,217) |
|
| Net increase | 50,519,138 | $411,180,017 | 119,090,003 | $951,205,769 |
|
86
| | | | |
| | Six months ended 3/31/11 | Year ended 9/30/10 |
|
| Class B | Shares | Amount | Shares | Amount |
|
| Shares sold | 2,145,520 | $17,314,032 | 5,127,624 | $40,708,764 |
|
| Shares issued in connection with | | | | |
| reinvestment of distributions | 298,820 | 2,401,525 | 1,006,764 | 7,896,336 |
|
| | 2,444,340 | 19,715,557 | 6,134,388 | 48,605,100 |
|
| Shares repurchased | (1,889,498) | (15,270,550) | (4,772,005) | (37,995,022) |
|
| Net increase | 554,842 | $4,445,007 | 1,362,383 | $10,610,078 |
|
| |
| | Six months ended 3/31/11 | Year ended 9/30/10 |
|
| Class C | Shares | Amount | Shares | Amount |
|
| Shares sold | 28,580,378 | $229,550,669 | 66,730,096 | $527,822,004 |
|
| Shares issued in connection with | | | | |
| reinvestment of distributions | 2,268,584 | 18,137,677 | 3,932,320 | 30,735,278 |
|
| | 30,848,962 | 247,688,346 | 70,662,416 | 558,557,282 |
|
| Shares repurchased | (13,245,190) | (106,235,161) | (8,897,931) | (70,267,303) |
|
| Net increase | 17,603,772 | $141,453,185 | 61,764,485 | $488,289,979 |
|
| |
| | Six months ended 3/31/11 | Year ended 9/30/10 |
|
| Class M | Shares | Amount | Shares | Amount |
|
| Shares sold | 499,281 | $4,012,744 | 2,371,302 | $18,784,290 |
|
| Shares issued in connection with | | | | |
| reinvestment of distributions | 101,143 | 808,703 | 318,147 | 2,483,671 |
|
| | 600,424 | 4,821,447 | 2,689,449 | 21,267,961 |
|
| Shares repurchased | (6,043,086) | (48,541,058) | (6,949,534) | (54,903,618) |
|
| Net decrease | (5,442,662) | $(43,719,611) | (4,260,085) | $(33,635,657) |
|
| |
| | Six months ended 3/31/11 | Year ended 9/30/10 |
|
| Class R | Shares | Amount | Shares | Amount |
|
| Shares sold | 207,705 | $1,674,098 | 233,673 | $1,849,913 |
|
| Shares issued in connection with | | | | |
| reinvestment of distributions | 18,768 | 150,608 | 51,412 | 402,715 |
|
| | 226,473 | 1,824,706 | 285,085 | 2,252,628 |
|
| Shares repurchased | (150,005) | (1,206,136) | (140,101) | (1,112,906) |
|
| Net increase | 76,468 | $618,570 | 144,984 | $1,139,722 |
|
| |
| | Six months ended 3/31/11 | Year ended 9/30/10 |
|
| Class Y | Shares | Amount | Shares | Amount |
|
| Shares sold | 68,749,966 | $556,985,162 | 120,399,707 | $959,062,690 |
|
| Shares issued in connection with | | | | |
| reinvestment of distributions | 2,816,429 | 22,696,089 | 6,100,578 | 48,023,811 |
|
| | 71,566,395 | 579,681,251 | 126,500,285 | 1,007,086,501 |
|
| Shares repurchased | (36,447,787) | (294,007,816) | (45,341,548) | (359,761,087) |
|
| Net increase | 35,118,608 | $285,673,435 | 81,158,737 | $647,325,414 |
|
87
Note 5: Summary of derivative activity
The following is a summary of the market values of derivative instruments as of the close of the reporting period:
Market values of derivative instruments as of the close of the reporting period
| | | | |
| | Asset derivatives | Liability derivatives |
|
| Derivatives not | | | | |
| accounted for as | Statement of | | Statement of | |
| hedging instruments | assets and | | assets and | |
| under ASC 815 | liabilities location | Market value | liabilities location | Market value |
|
| Credit contracts | Receivables | $3,564,616 | Payables | $1,872,899 |
|
| Foreign exchange | | | | |
| contracts | Receivables | 26,533,939 | Payables | 5,882,791 |
|
| | Investments, | | Payables, | |
| | Receivables, Net | | Net assets — | |
| | assets — Unrealized | | Unrealized | |
| Interest rate | appreciation / | | appreciation / | |
| contracts | (depreciation) | 146,374,916* | (depreciation) | 487,351,298* |
|
| Total | | $176,473,471 | | $495,106,988 |
|
* Includes cumulative appreciation/depreciation of futures contracts as reported in The fund’s portfolio. Only current day’s variation margin is reported within the Statement of assets and liabilities.
The following is a summary of realized and change in unrealized gains or losses of derivative instruments on the Statement of operations for the reporting period (see Note 1):
Amount of realized gain or (loss) on derivatives recognized in net gain or (loss) on investments
| | | | | |
| Derivatives not | | | | | |
| accounted for as | | | Forward | | |
| hedging instruments | | | currency | | |
| under ASC 815 | Options | Futures | contracts | Swaps | Total |
|
| Credit contracts | $— | $— | $— | $1,170,151 | $1,170,151 |
|
| Foreign exchange | | | | | |
| contracts | — | — | (36,780,279) | — | $(36,780,279) |
|
| Interest rate contracts | 15,690,718 | (155,718,693) | — | (53,845,988) | $(193,873,963) |
|
| Total | $15,690,718 | $(155,718,693) | $(36,780,279) | $(52,675,837) | $(229,484,091) |
|
Change in unrealized appreciation or (depreciation) on derivatives recognized in net gain or (loss) on investments
| | | | | |
| Derivatives not | | | | | |
| accounted for as | | | Forward | | |
| hedging instruments | | | currency | | |
| under ASC 815 | Options | Futures | contracts | Swaps | Total |
|
| Credit contracts | $— | $— | $— | $556,466 | $556,466 |
|
| Foreign exchange | | | | | |
| contracts | — | — | (106,433) | — | $(106,433) |
|
| Interest rate contracts | 54,343,373 | (8,126,812) | — | 123,152,862 | $169,369,423 |
|
| Total | $54,343,373 | $(8,126,812) | $(106,433) | $123,709,328 | $169,819,456 |
|
88
Note 6: Investment in Putnam Money Market Liquidity Fund
The fund invested in Putnam Money Market Liquidity Fund, an open-end management investment company managed by Putnam Management. Investments in Putnam Money Market Liquidity Fund are valued at its closing net asset value each business day. Income distributions earned by the fund are recorded as interest income in the Statement of operations and totaled $244,121 for the reporting period. During the reporting period, cost of purchases and proceeds of sales of investments in Putnam Money Market Liquidity Fund aggregated $1,379,871,165 and $1,142,964,578, respectively. Management fees charged to Putnam Money Market Liquidity Fund have been waived by Putnam Management.
Note 7: Senior loan commitments
Senior loans are purchased or sold on a when-issued or delayed delivery basis and may be settled a month or more after the trade date, which from time to time can delay the actual investment of available cash balances; interest income is accrued based on the terms of the securities. Senior loans can be acquired through an agent, by assignment from another holder of the loan, or as a participation interest in another holder’s portion of the loan. When the fund invests in a loan or participation, the fund is subject to the risk that an intermediate participant between the fund and the borrower will fail to meet its obligations to the fund, in addition to the risk that the borrower under the loan may default on its obligations.
Note 8: Regulatory matters and litigation
In late 2003 and 2004, Putnam Management settled charges brought by the SEC and the Massachusetts Securities Division in connection with excessive short-term trading in Putnam funds. Distribution of payments from Putnam Management to certain open-end Putnam funds and their shareholders is expected to be completed in the next several months. These allegations and related matters have served as the general basis for certain lawsuits, including purported class action lawsuits against Putnam Management and, in a limited number of cases, some Putnam funds. Putnam Management believes that these lawsuits will have no material adverse effect on the funds or on Putnam Management’s ability to provide investment management services. In addition, Putnam Management has agreed to bear any costs incurred by the Putnam funds as a result of these matters.
Note 9: Market and credit risk
In the normal course of business, the fund trades financial instruments and enters into financial transactions where risk of potential loss exists due to changes in the market (market risk) or failure of the contracting party to the transaction to perform (credit risk). The fund may be exposed to additional credit risk that an institution or other entity with which the fund has unsettled or open transactions will default.
89
The Putnam family of funds
The following is a list of Putnam’s open-end mutual funds offered to the public. Investors should carefully consider the investment objective, risks, charges, and expenses of a fund before investing. For a prospectus, or a summary prospectus if available, containing this and other information for any Putnam fund or product, call your financial advisor at 1-800-225-1581 and ask for a prospectus. Please read the prospectus carefully before investing.
| |
| Growth | Value |
| Growth Opportunities Fund | Convertible Securities Fund |
| International Growth Fund | Prior to September 30, 2010, the fund was known as |
| Prior to January 1, 2010, the fund was known as | Putnam Convertible Income-Growth Trust |
| Putnam International New Opportunities Fund | Equity Income Fund |
| Multi-Cap Growth Fund | George Putnam Balanced Fund |
| Prior to September 1, 2010, the fund was known as | Prior to September 30, 2010, the fund was known as |
| Putnam New Opportunities Fund | The George Putnam Fund of Boston |
| Small Cap Growth Fund | The Putnam Fund for Growth and Income |
| Voyager Fund | International Value Fund |
| | Prior to January 1, 2010, the fund was known as |
| Blend | Putnam International Growth and Income Fund |
| Asia Pacific Equity Fund | Multi-Cap Value Fund |
| Capital Opportunities Fund | Prior to September 1, 2010, the fund was known as |
| Capital Spectrum Fund | Putnam Mid Cap Value Fund |
| Emerging Markets Equity Fund | Small Cap Value Fund |
| Equity Spectrum Fund | |
| Europe Equity Fund | Income |
| Global Equity Fund | American Government Income Fund |
| International Capital Opportunities Fund | Diversified Income Trust |
| International Equity Fund | Floating Rate Income Fund |
| Investors Fund | Global Income Trust |
| Multi-Cap Core Fund | High Yield Advantage Fund |
| Research Fund | High Yield Trust |
| | Income Fund |
| | Money Market Fund* |
| | U.S. Government Income Trust |
* An investment in a money market fund is not insured or guaranteed by the Federal Deposit Insurance Corporation or any other government agency. Although the fund seeks to preserve the value of your investment at $1.00 per share, it is possible to lose money by investing in the fund.
90
| |
| Tax-free income | Asset allocation |
| AMT-Free Municipal Fund | Income Strategies Fund |
| Tax Exempt Income Fund | Putnam Asset Allocation Funds — three |
| Tax Exempt Money Market Fund* | investment portfolios that spread your |
| Tax-Free High Yield Fund | money across a variety of stocks, bonds, |
| | and money market investments. |
| State tax-free income funds: | |
| Arizona, California, Massachusetts, Michigan, | The three portfolios: |
| Minnesota, New Jersey, New York, Ohio, | Asset Allocation: Balanced Portfolio |
| and Pennsylvania | Asset Allocation: Conservative Portfolio |
| | Asset Allocation: Growth Portfolio |
| Absolute Return | |
| Absolute Return 100 Fund | Putnam RetirementReady® |
| Absolute Return 300 Fund | Putnam RetirementReady Funds — 10 |
| Absolute Return 500 Fund | investment portfolios that offer diversifi- |
| Absolute Return 700 Fund | cation among stocks, bonds, and money |
| | market instruments and adjust to become |
| Global Sector | more conservative over time based on a |
| Global Consumer Fund | target date for withdrawing assets. |
| Global Energy Fund | |
| Global Financials Fund | The 10 funds: |
| Global Health Care Fund | Putnam RetirementReady 2055 Fund |
| Global Industrials Fund | Putnam RetirementReady 2050 Fund |
| Global Natural Resources Fund | Putnam RetirementReady 2045 Fund |
| Global Sector Fund | Putnam RetirementReady 2040 Fund |
| Global Technology Fund | Putnam RetirementReady 2035 Fund |
| Global Telecommunications Fund | Putnam RetirementReady 2030 Fund |
| Global Utilities Fund | Putnam RetirementReady 2025 Fund |
| | Putnam RetirementReady 2020 Fund |
| | Putnam RetirementReady 2015 Fund |
| | Putnam RetirementReady Maturity Fund |
A short-term trading fee of 1% may apply to redemptions or exchanges from certain funds within the time period specified in the fund's prospectus.
Check your account balances and the most recent month-end performance in the Individual Investors section at putnam.com.
91
Services for shareholders
Investor services
Systematic investment plan Tell us how much you wish to invest regularly — weekly, semimonthly, or monthly — and the amount you choose will be transferred automatically from your checking or savings account. There’s no additional fee for this service, and you can suspend it at any time. This plan may be a great way to save for college expenses or to plan for your retirement.
Please note that regular investing does not guarantee a profit or protect against loss in a declining market. Before arranging a systematic investment plan, consider your financial ability to continue making purchases in periods when prices are low.
Systematic exchange You can make regular transfers from one Putnam fund to another Putnam fund. There are no additional fees for this service, and you can cancel or change your options at any time.
Dividends PLUS You can choose to have the dividend distributions from one of your Putnam funds automatically reinvested in another Putnam fund at no additional charge.
Free exchange privilege You can exchange money between Putnam funds free of charge, as long as they are the same class of shares. A signature guarantee is required if you are exchanging more than $500,000. The fund reserves the right to revise or terminate the exchange privilege.
Reinstatement privilege If you’ve sold Putnam shares or received a check for a dividend or capital gain, you may reinvest the proceeds with Putnam within 90 days of the transaction and they will be reinvested at the fund’s current net asset value — with no sales charge. However, reinstatement of class B shares may have special tax consequences. Ask your financial or tax representative for details.
Check-writing service You have ready access to many Putnam accounts. It’s as simple as writing a check, and there are no special fees or service charges. For more information about the check-writing service, call Putnam or visit our website.
Dollar cost averaging When you’re investing for long-term goals, it’s time, not timing, that counts. Investing on a systematic basis is a better strategy than trying to figure out when the markets will go up or down. This means investing the same amount of money regularly over a long period. This method of investing is called dollar cost averaging. When a fund’s share price declines, your investment dollars buy more shares at lower prices. When it increases, they buy fewer shares. Over time, you will pay a lower average price per share.
For more information
Visit the Individual Investors section at putnam.com A secure section of our website contains complete information on your account, including balances and transactions, updated daily. You may also conduct transactions, such as exchanges, additional investments, and address changes. Log on today to get your password.
Call us toll free at 1-800-225-1581 Ask a helpful Putnam representative or your financial advisor for details about any of these or other services, or see your prospectus.
92
Fund information
Founded over 70 years ago, Putnam Investments was built around the concept that a balance between risk and reward is the hallmark of a well-rounded financial program. We manage over 100 funds across income, value, blend, growth, asset allocation, absolute return, and global sector categories.
| | |
| Investment Manager | George Putnam, III | Francis J. McNamara, III |
| Putnam Investment | Robert L. Reynolds | Vice President and |
| Management, LLC | W. Thomas Stephens | Chief Legal Officer |
| One Post Office Square | | |
| Boston, MA 02109 | Officers | James P. Pappas |
| | Robert L. Reynolds | Vice President |
| Investment Sub-Manager | President | |
| Putnam Investments Limited | | Judith Cohen |
| 57–59 St James’s Street | Jonathan S. Horwitz | Vice President, Clerk and |
| London, England SW1A 1LD | Executive Vice President, | Assistant Treasurer |
| | Principal Executive | |
| Marketing Services | Officer, Treasurer and | Michael Higgins |
| Putnam Retail Management | Compliance Liaison | Vice President, Senior Associate |
| One Post Office Square | | Treasurer and Assistant Clerk |
| Boston, MA 02109 | Steven D. Krichmar | |
| | Vice President and | Nancy E. Florek |
| Custodian | Principal Financial Officer | Vice President, Assistant Clerk, |
| State Street Bank | | Assistant Treasurer and |
| and Trust Company | Janet C. Smith | Proxy Manager |
| | Vice President, Assistant | |
| Legal Counsel | Treasurer and Principal | Susan G. Malloy |
| Ropes & Gray LLP | Accounting Officer | Vice President and |
| | | Assistant Treasurer |
| Trustees | Beth S. Mazor | |
| John A. Hill, Chairman | Vice President | |
| Jameson A. Baxter, | | |
| Vice Chairman | Robert R. Leveille | |
| Ravi Akhoury | Vice President and | |
| Barbara M. Baumann | Chief Compliance Officer | |
| Charles B. Curtis | | |
| Robert J. Darretta | Mark C. Trenchard | |
| Paul L. Joskow | Vice President and | |
| Kenneth R. Leibler | BSA Compliance Officer | |
| Robert E. Patterson | | |
This report is for the information of shareholders of Putnam Diversified Income Trust. It may also be used as sales literature when preceded or accompanied by the current prospectus, the most recent copy of Putnam’s Quarterly Performance Summary, and Putnam’s Quarterly Ranking Summary. For more recent performance, please visit putnam.com. Investors should carefully consider the investment objectives, risks, charges, and expenses of a fund, which are described in its prospectus. For this and other information or to request a prospectus or summary prospectus, call 1-800-225-1581 toll free. Please read the prospectus carefully before investing. The fund’s Statement of Additional Information contains additional information about the fund’s Trustees and is available without charge upon request by calling 1-800-225-1581.
Item 2. Code of Ethics:
Not applicable
Item 3. Audit Committee Financial Expert:
Not applicable
Item 4. Principal Accountant Fees and Services:
Not applicable
Item 5. Audit Committee of Listed Registrants
Not applicable
Item 6. Schedule of Investments:
The registrant’s schedule of investments in unaffiliated issuers is included in the report to shareholders in Item 1 above.
Item 7. Disclosure of Proxy Voting Policies and Procedures For Closed-End Management Investment Companies:
Not applicable
Item 8. Portfolio Managers of Closed-End Investment Companies
Not Applicable
Item 9. Purchases of Equity Securities by Closed-End Management Investment Companies and Affiliated Purchasers:
Not applicable
Item 10. Submission of Matters to a Vote of Security Holders:
Not applicable
Item 11. Controls and Procedures:
(a) The registrant's principal executive officer and principal financial officer have concluded, based on their evaluation of the effectiveness of the design and operation of the registrant's disclosure controls and procedures as of a date within 90 days of the filing date of this report, that the design and operation of such procedures are generally effective to provide reasonable assurance that information required to be disclosed by the registrant in this report is recorded, processed, summarized and reported within the time periods specified in the Commission's rules and forms.
(b) Changes in internal control over financial reporting: Not applicable
Item 12. Exhibits:
(a)(1) Not applicable
(a)(2) Separate certifications for the principal executive officer and principal financial officer of the registrant as required by Rule 30a-2(a) under the Investment Company Act of 1940, as amended, are filed herewith.
(b) The certifications required by Rule 30a-2(b) under the Investment Company Act of 1940, as amended, are filed herewith.
Putnam Diversified Income Trust
By (Signature and Title):
/s/Janet C. Smith
Janet C. Smith
Principal Accounting Officer
Date: May 27, 2011
Pursuant to the requirements of the Securities Exchange Act of 1934 and the Investment Company Act of 1940, this report has been signed below by the following persons on behalf of the registrant and in the capacities and on the dates indicated.
By (Signature and Title):
/s/Jonathan S. Horwitz
Jonathan S. Horwitz
Principal Executive Officer
Date: May 27, 2011
By (Signature and Title):
/s/Steven D. Krichmar
Steven D. Krichmar
Principal Financial Officer
Date: May 27, 2011