CERTIFIED SHAREHOLDER REPORT OF REGISTERED MANAGEMENT INVESTMENT COMPANIES
Investment Company Act file number:
(811-05635)
Exact name of registrant as specified in charter:
Putnam Diversified Income Trust
Address of principal executive offices:
One Post Office Square, Boston, Massachusetts 02109
Name and address of agent for service:
Robert T. Burns, Vice President One Post Office Square Boston, Massachusetts 02109
Copy to:
Bryan Chegwidden, Esq. Ropes & Gray LLP 1211 Avenue of the Americas New York, New York 10036
Registrant’s telephone number, including area code:
(617) 292-1000
Date of fiscal year end:
September 30, 2015
Date of reporting period:
October 1, 2014 – March 31, 2015
Item 1. Report to Stockholders:
The following is a copy of the report transmitted to stockholders pursuant to Rule 30e-1 under the Investment Company Act of 1940:
Putnam Diversified Income Trust
Semiannual report 3 | 31 | 15
Message from the Trustees
1
About the fund
2
Performance snapshot
4
Interview with your fund’s portfolio manager
5
Your fund’s performance
12
Your fund’s expenses
14
Terms and definitions
16
Other information for shareholders
17
Financial statements
18
Consider these risks before investing: International investing involves currency, economic, and political risks. Emerging-market securities carry illiquidity and volatility risks. Lower-rated bonds may offer higher yields in return for more risk. Funds that invest in government securities are not guaranteed. Mortgage-backed securities are subject to prepayment risk and the risk that they may increase in value less when interest rates decline and decline in value more when interest rates rise. Bond investments are subject to interest-rate risk (the risk of bond prices falling if interest rates rise) and credit risk (the risk of an issuer defaulting on interest or principal payments). Interest-rate risk is greater for longer-term bonds, and credit risk is greater for below-investment-grade bonds. Risks associated with derivatives include increased investment exposure (which may be considered leverage) and, in the case of over-the-counter instruments, the potential inability to terminate or sell derivatives positions and the potential failure of the other party to the instrument to meet its obligations. Unlike bonds, funds that invest in bonds have fees and expenses. The value of bonds in the fund’s portfolio may fall or fail to rise over extended periods of time for a variety of reasons including general financial market conditions, changing market perceptions of the risk of default, changes in government intervention, and factors related to a specific issuer or industry. These factors may also lead to periods of high volatility and reduced liquidity in the bond markets. You can lose money by investing in the fund.
Message from the Trustees
Dear Fellow Shareholder:
The month of March 2015 marked the six-year milestone of the bull market in U.S. stocks, and this June will be the sixth anniversary of the beginning of the U.S. economic recovery as dated by the National Bureau of Economic Research, which has traced the chronology of U.S. business cycles back to 1854.
While six years is above the historical average on both counts, reaching these milestones does not necessarily indicate anything about the sustainability of the expansion or the market advance. However, we believe it is an unusually long period for the Federal Reserve to have refrained from raising interest rates. The Fed now appears poised to act, and speculation is mounting about where equity and fixed-income markets around the world could go from this point forward. Your portfolio manager provides a perspective in the following pages.
At this juncture of the market cycle, you might consult your financial advisor who can help you review your goals and risk profile, and explain the importance of timely adjustments to keep your portfolio equipped for all seasons.
As you make progress toward your long-term financial goals, markets may move in different directions. With Putnam, you are aligned with a group of portfolio managers and analysts who are experienced in navigating through changing markets with consistent strategies. They are dedicated to active, fundamental research and to helping you meet your financial needs.
As always, thank you for investing with Putnam.
Respectfully yours,
Robert L. Reynolds President and Chief Executive Officer Putnam Investments
Jameson A. Baxter Chair, Board of Trustees
May 11, 2015
Performance snapshot
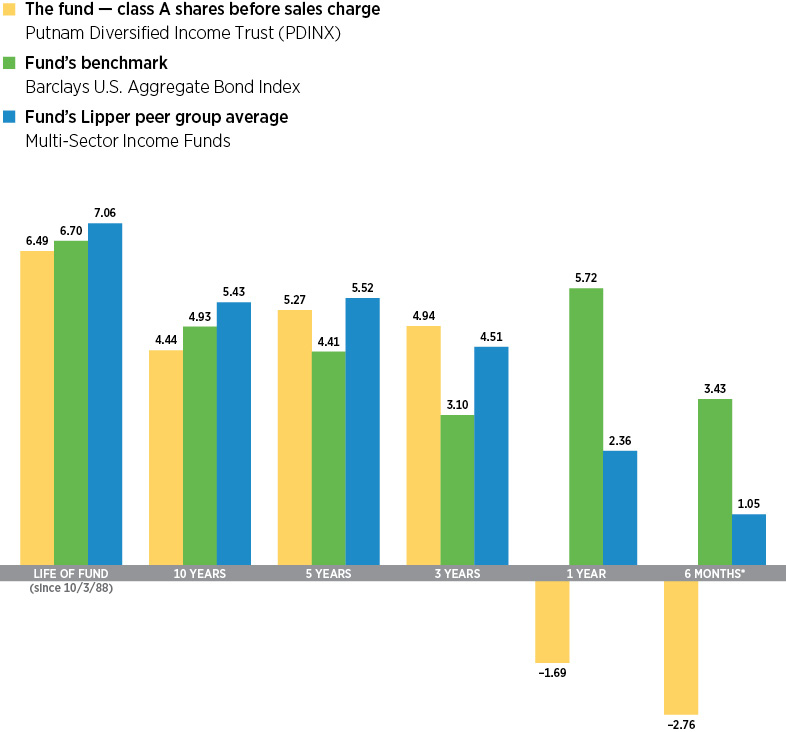
Annualized total return (%) comparison as of 3/31/15
Current performance may be lower or higher than the quoted past performance, which cannot guarantee future results. Share price, principal value, and return will fluctuate, and you may have a gain or a loss when you sell your shares. Performance of class A shares assumes reinvestment of distributions and does not account for taxes. Fund returns in the bar chart do not reflect a sales charge of 4.00%; had they, returns would have been lower. See pages 5 and 12–13 for additional performance information. For a portion of the periods, the fund had expense limitations, without which returns would have been lower. To obtain the most recent month-end performance, visit putnam.com.
*Returns for the six-month period are not annualized, but cumulative.
4 Diversified Income Trust
Interview with your fund’s portfolio manager
D. William Kohli
Bill, what was the bond market environment like during the six months ended March 31, 2015?
The period was punctuated by episodes of interest-rate volatility, but interest rates generally moved lower. We were not surprised to see some degree of interest rate volatility, given that the Federal Reserve ended its bond-buying program in October 2014 and the European Central Bank [ECB] officially announced its version of quantitative easing in January. Additionally, with U.S. gross domestic product growing at a 5% annual rate in the third quarter of 2014 — its strongest pace in 11 years — investors sought to fine-tune their forecasts as to when the Fed may begin raising short-term interest rates.
In January, the combination of a stock market pullback, weaker-than-expected U.S. economic data, and continued worries about deflation in Europe fueled investors’ appetite for government bonds. Against this backdrop, the yield on the benchmark 10-year U.S. Treasury fell to 1.64%, its low for the period. In February, concern that the Fed might start raising rates in June hampered Treasuries, causing prices to fall and yields to move higher. During March, however, dovish comments by Fed Chair Janet Yellen reassured investors that the central bank was likely to take a go-slow approach toward raising interest rates, which helped Treasuries modestly rebound during the final weeks of the period. The 10-year Treasury yield finished
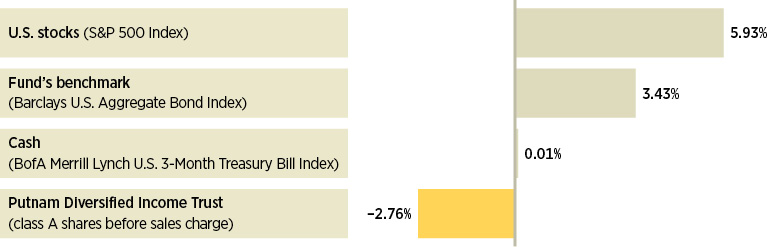
Broad market index and fund performance
This comparison shows your fund’s performance in the context of broad market indexes for the six months ended 3/31/15. See pages 4 and 12–13 for additional fund performance information. Index descriptions can be found on page 17.
Diversified Income Trust 5
the period at 1.92%, down from 2.49% at the beginning of the period.
The U.S. dollar continued to strengthen, rising more than 14% on an absolute basis during the six-month reporting period and outpacing every other major currency, according to the WSJ Dollar Index. The dollar’s surge against the euro was driven by the ECB’s launch of a larger-than-expected monetary easing program at the same time that the U.S. central bank stated its intention to raise interest rates.
After declining since midsummer 2014, oil prices settled into a trading range in February and March. Prices fluctuated in the low-to-mid $50-per-barrel range on signs that U.S. production may be peaking and global demand may be rising.
The fund lagged its benchmark by a significant margin during the period. What factors hampered its relative performance?
It’s important to point out that the fund’s benchmark comprises securities from various U.S.-government and corporate investment-grade sectors, and many of these sectors performed well during the six-month reporting period. Our strategy of investing in a variety of out-of-benchmark sectors, which has served the fund well over the long term, was largely unrewarded during the period. However, our biggest overall detractor was
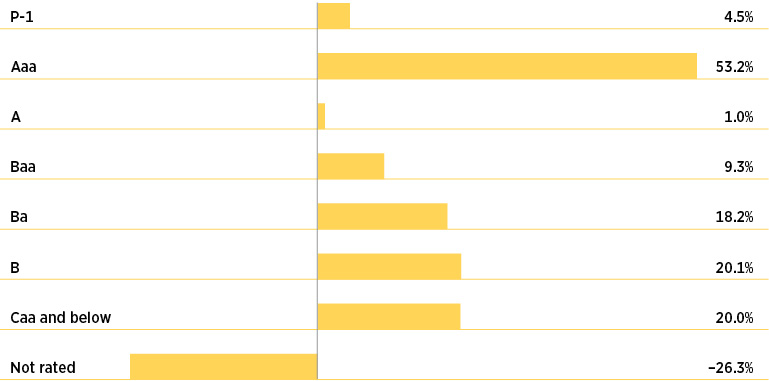
Credit quality overview
Credit qualities are shown as a percentage of the fund’s net assets as of 3/31/15. A bond rated Baa or higher (Prime-3 or higher, for short-term debt) is considered investment grade. The chart reflects Moody’s ratings; percentages may include bonds or derivatives not rated by Moody’s but rated by Standard & Poor’s (S&P) or, if unrated by S&P, by Fitch ratings, and then included in the closest equivalent Moody’s rating based on analysis of these agencies’ respective ratings criteria. Moody’s ratings are used in recognition of its prominence among rating agencies and breadth of coverage of rated securities. To-be-announced (TBA) mortgage commitments, if any, are included based on their issuer ratings. Ratings may vary over time.
Derivative instruments, including forward currency contracts, are only included to the extent of any unrealized gain or loss on such instruments and are shown in the not-rated category. Cash is also shown in the not-rated category. Derivative offset values are included in the not-rated category and may result in negative weights. The fund itself has not been rated by an independent rating agency.
6 Diversified Income Trust
“Globally, economies are currently in one of the most disparate growth cycles since the mid-to-late 1990s.”
Bill Kohli
the fund’s interest-rate and yield-curve positioning in the United States. The portfolio was defensively positioned for a rising-rate environment, resulting in an overall duration — a key measure of interest-rate sensitivity — that was moderately negative on a net basis. Unfortunately, because rates trended lower during the period, this positioning worked against the fund’s performance.
Elsewhere, our prepayment strategies, which we implemented with securities such as agency interest-only collateralized mortgage obligations [IO CMOs], also detracted. In January, the Obama administration announced that the Federal Housing Administration [FHA] would reduce the annual mortgage insurance premiums it charges to borrowers making small down payments. Investors reacted to this development by pricing in the possibility of faster mortgage prepayment speeds, which dampened the returns of existing prepayment-sensitive mortgage-backed securities. What’s more, this announcement came during a time when Treasury yields
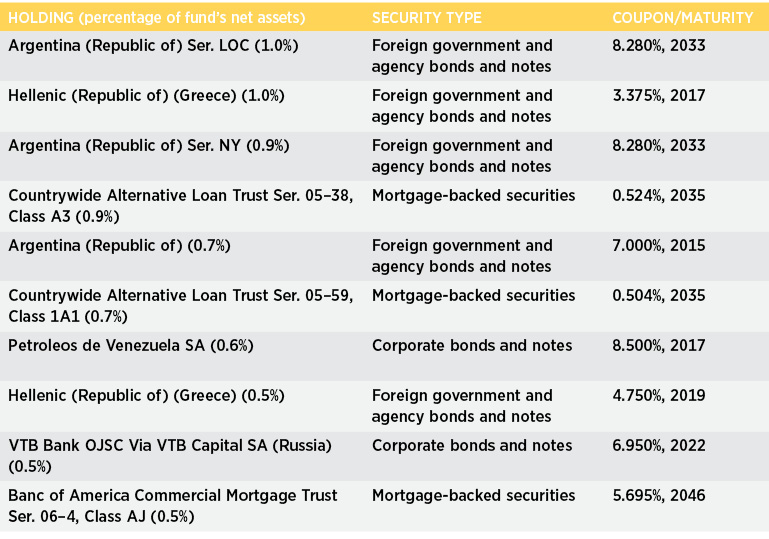
Top 10 holdings
This table shows the fund’s top 10 individual holdings and the percentage of the fund’s net assets that each represented as of 3/31/15. Short-term holdings, TBA commitments, and derivatives, if any, are excluded. Holdings may vary over time.
Diversified Income Trust 7
were sharply declining, compounding the negatives for IO CMOs. The asset class rebounded in February, but could not fully overcome January’s significant downturn.
Our investments in emerging-market [EM] debt, specifically U.S. dollar-denominated holdings in Venezuela and Russia, modestly hampered the fund’s performance. During the first half of the period, declining oil prices soured investor sentiment toward the bonds of these oil-exporting countries. Continued uncertainty regarding Ukraine also weighed on Russia’s bonds.
Within foreign sovereign debt, our exposure to Greece detracted as Greek yields rose sharply. Increasing uncertainty about Greece’s prospects for accessing new financing and its ability to remain within the European Union weighed on the country’s bonds.
Positions in high-yield bonds had a neutral impact on the fund’s return. Following a volatile period during 2014’s fourth quarter, high-yield bonds rallied in late January and February, fueled by oil prices settling into a trading range.
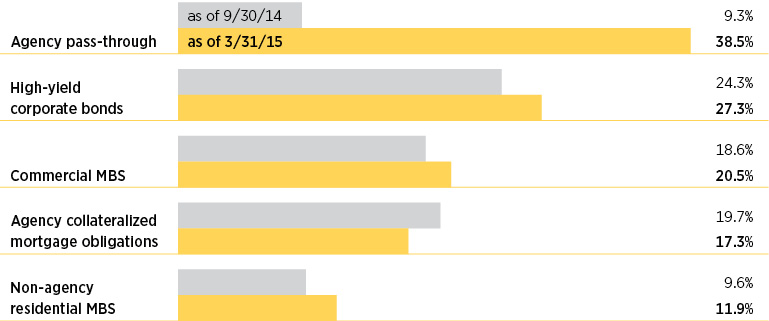
Comparison of top sector weightings
This chart shows how the fund’s top weightings have changed over the past six months. Allocations are shown as a percentage of the fund’s net assets. Current period summary information may differ from the portfolio schedule included in the financial statements due to the inclusion of derivative securities, any interest accruals, and the use of different classifications of securities for presentation purposes. Holdings and allocations may vary over time.
8 Diversified Income Trust
Turning to the positive side, which investments helped the fund’s performance?
Active currency positioning was the biggest contributor, as a long position in the U.S. dollar combined with short positions in most other major market currencies bolstered the fund’s performance. One exception to this strategy was a long position in the British pound sterling, which weakened relative to the U.S. dollar and slightly dampened the positive overall effect of our currency positioning.
Our mortgage credit investments, specifically positions in subordinated mezzanine commercial mortgage-backed securities [CMBS] and non-agency residential mortgage-backed securities [RMBS], also helped performance. Mezzanine CMBS benefited from supportive commercial real estate fundamentals, an improving U.S. economy, and persistent investor demand for higher-yielding bonds. Within non-agency RMBS, our holdings of Alternative-A [Alt-A] securities were helped by a strengthening housing market, coupled with solid investor demand amid shrinking supply. Alt-A securities are created from mortgage pools that occupy the space between riskier subprime mortgages and less risky prime mortgages.
How did you use derivatives during the period?
We used bond futures and interest-rate swaps to take tactical positions at various points along the yield curve, and to hedge the risk associated with the fund’s curve positioning. We also employed interest-rate swaps to help manage the fund’s duration and yield-curve positioning, and to gain exposure to interest rates in various countries. In addition, total return swaps were utilized as a hedging tool, and to help manage the portfolio’s sector exposure, as well as its inflation risk. Lastly, we used currency forward contracts to hedge the foreign exchange risk associated with non-U.S. bonds, and to efficiently gain exposure to foreign currencies.
ABOUT DERIVATIVES
Derivatives are an increasingly common type of investment instrument, the performance of which is derived from an underlying security, index, currency, or other area of the capital markets. Derivatives employed by the fund’s managers generally serve one of two main purposes: to implement a strategy that may be difficult or more expensive to invest in through traditional securities, or to hedge unwanted risk associated with a particular position.
For example, the fund’s managers might use currency forward contracts to capitalize on an anticipated change in exchange rates between two currencies. This approach would require a significantly smaller outlay of capital than purchasing traditional bonds denominated in the underlying currencies. In another example, the managers may identify a bond that they believe is undervalued relative to its risk of default, but may seek to reduce the interest-rate risk of that bond by using interest-rate swaps, a derivative through which two parties “swap” payments based on the movement of certain rates. In other examples, the managers may use options and futures contracts to hedge against a variety of risks by establishing a combination of long and short exposures to specific equity markets or sectors.
Like any other investment, derivatives may not appreciate in value and may lose money. Derivatives may amplify traditional investment risks through the creation of leverage and may be less liquid than traditional securities. And because derivatives typically represent contractual agreements between two financial institutions, derivatives entail “counterparty risk,” which is the risk that the other party is unable or unwilling to pay. Putnam monitors the counterparty risks we assume. For example, Putnam often enters into collateral agreements that require the counterparties to post collateral on a regular basis to cover their obligations to the fund. Counterparty risk for exchange-traded futures and centrally cleared swaps is mitigated by the daily exchange of margin and other safeguards against default through their respective clearinghouses.
Diversified Income Trust 9
The fund reduced its dividend rate during the period. What factors led to that decision?
Prior to 2014, the fund had maintained a stable dividend rate for several years. Recently, however, it became necessary to decrease the dividend rate due to lower available yields across fixed-income market sectors and the need to maintain a somewhat greater cash balance. As a result, the fund’s dividend per class A share was trimmed from $0.032 to $0.027 in October 2014. Similar reductions were made to other share classes.
What is your outlook for the coming months, and how are you positioning the fund?
We remain positive on U.S. economic growth, but it appears the recovery has reverted to a moderate pace after surging in the middle of last year. We believe this slowdown is partly because consumption has not increased as much as was expected. During the past year, rising hourly wages and lower gasoline prices benefited lower-wage workers, which we thought would bolster personal consumption expenditures. However, rather than spending more, these consumers increased their savings. According to the Commerce Department, personal spending increased slightly in February, but was down in December and January. At the same time, the personal savings rate continued to climb, reaching 5.8% in February, its highest level since the end of 2012. As the effects of an unseasonably cold winter in the Northeast and Midwest dissipate, we think consumption will improve.
We believe the Fed is likely to begin raising rates during 2015, possibly in September. Many investors believe the Fed will wait until later in 2015, or even into 2016, before it begins hiking rates. Consequently, there appears to be a considerable disconnect between what the market is forecasting and the Fed’s own outlook, which could spark some volatility. In our view, however, once the central bank begins to raise the federal funds rate, it will make every effort to do so in an orderly, well-communicated fashion in an effort to avoid major financial market disruption.
Globally, economies are currently in one of the most disparate growth cycles since the mid-to-late 1990s. Capital is flowing from the eurozone and elsewhere into the United States, seeking to capitalize on opportunities in stocks, high-yield bonds, mortgage-backed securities, and government debt. As a result, developing markets are under pressure since many of those economies require capital inflows to maintain their fiscal and monetary programs. Because of this, we are not enthusiastic about near-term prospects in emerging markets overall, although we continue to find what we believe are attractive country-specific investment opportunities.
Within this environment, we plan to maintain our diversified mortgage, corporate, and sovereign credit exposure primarily through allocations to mezzanine CMBS, high-yield bonds, and peripheral European sovereign bonds, respectively. As for prepayment risk, we expect to maintain our holdings of IO CMOs. We do not believe the new FHA policy is likely to have a major impact on the overall pace of residential refinancing. What’s more, we continue to find prepayment risk attractive, given the potential for higher interest rates as the U.S. economic recovery matures. We’re also excited about ongoing opportunities we see in the foreign-exchange market. Many of the fundamental drivers of currency performance, such as divergent trends in U.S. and foreign economic growth and monetary policies, appear to be gaining momentum.
Thanks for your time and for bringing us up to date, Bill.
10 Diversified Income Trust
The views expressed in this report are exclusively those of Putnam Management and are subject to change. They are not meant as investment advice.
Please note that the holdings discussed in this report may not have been held by the fund for the entire period. Portfolio composition is subject to review in accordance with the fund’s investment strategy and may vary in the future. Current and future portfolio holdings are subject to risk.
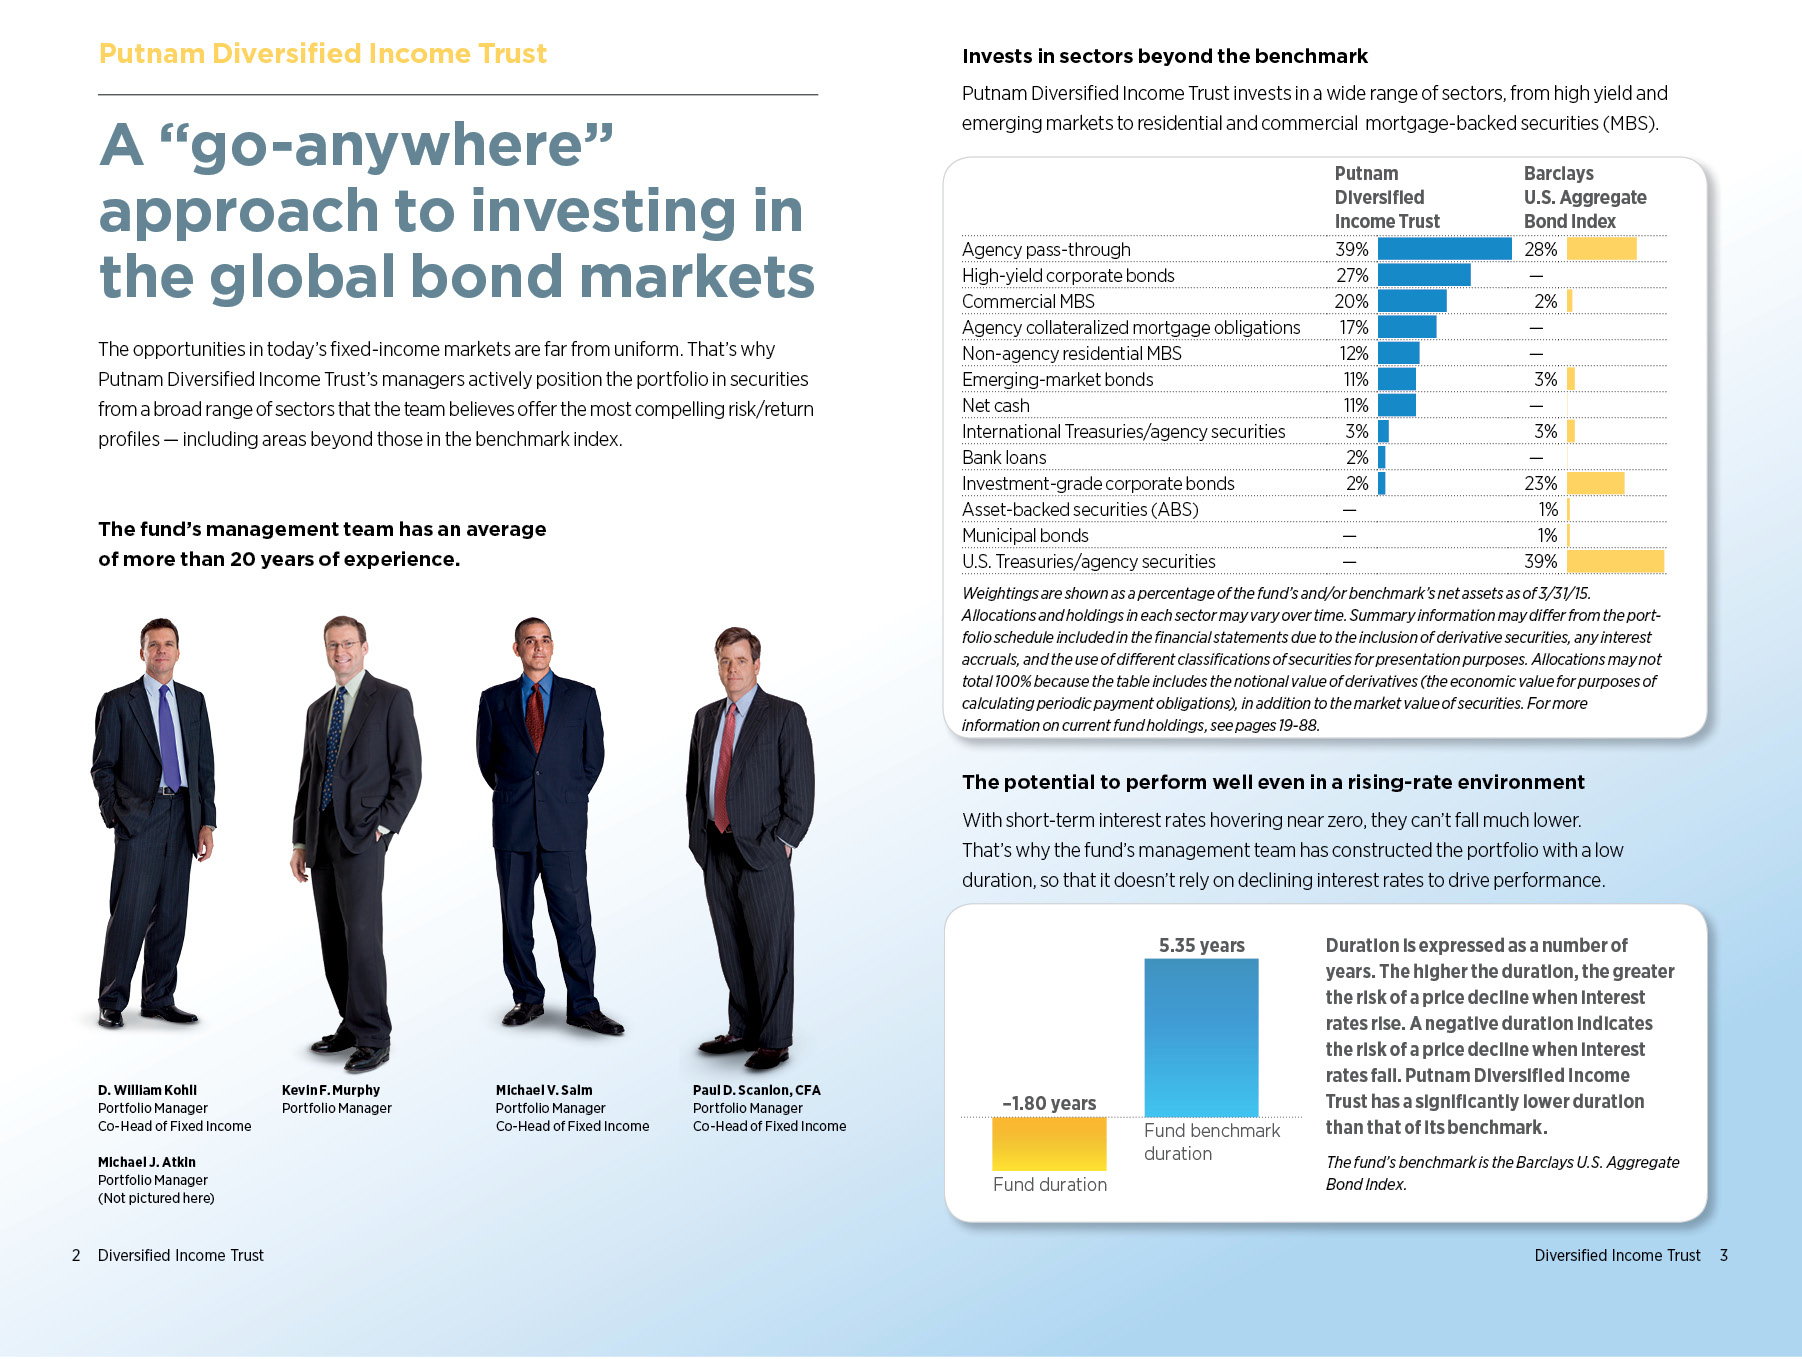
Portfolio Manager D. William Kohli is Co-Head of Fixed Income at Putnam. He has an M.B.A. from the Haas School of Business at the University of California, Berkeley, and a B.A. from the University of California, San Diego. Bill joined Putnam in 1994 and has been in the investment industry since 1986.
In addition to Bill, your fund’s portfolio managers are Michael J. Atkin, Kevin F. Murphy, Michael V. Salm, and Paul D. Scanlon, CFA.
IN THE NEWS
Although the U.S. economy is showing positive trends, uneven growth in consumer spending remains a bit perplexing. Despite rising personal income and lower energy costs, consumer spending in the United States rose by only 0.1% in February after dropping 0.2% in January, according to the Commerce Department. Harsh winter weather during those months, with heavy snowfalls blanketing the Northeast and Midwest, may have discouraged millions of Americans from heading to stores. Amid weak spending, the pace of hiring also slowed to 126,000 new jobs in March, the lowest since December 2013. These soft readings, however, might be as temporary as the weather. The personal savings rate rose from 5.5% in January to 5.8% in February, with Americans reaching their highest levels in savings in more than two years. In short, consumers have money to spend, and a rebound in economic activity, along the lines of that seen in 2014, may be likely.
Diversified Income Trust 11
Your fund’s performance
This section shows your fund’s performance, price, and distribution information for periods ended March 31, 2015, the end of the first half of its current fiscal year. In accordance with regulatory requirements for mutual funds, we also include expense information taken from the fund’s current prospectus. Performance should always be considered in light of a fund’s investment strategy. Data represent past performance. Past performance does not guarantee future results. More recent returns may be less or more than those shown. Investment return and principal value will fluctuate, and you may have a gain or a loss when you sell your shares. Performance information does not reflect any deduction for taxes a shareholder may owe on fund distributions or on the redemption of fund shares. For the most recent month-end performance, please visit the Individual Investors section at putnam.com or call Putnam at 1-800-225-1581. Class R, R5, R6, and Y shares are not available to all investors. See the Terms and Definitions section in this report for definitions of the share classes offered by your fund.
Fund performance Total return for periods ended 3/31/15
Class A
Class B
Class C
Class M
Class R
Class R5
Class R6
Class Y
(inception dates)
(10/3/88)
(3/1/93)
(2/1/99)
(12/1/94)
(12/1/03)
(11/1/13)
(11/1/13)
(7/1/96)
Before sales charge
After sales charge
Before CDSC
After CDSC
Before CDSC
After CDSC
Before sales charge
After sales charge
Net asset value
Net asset value
Net asset value
Net asset value
Annual average
(life of fund)
6.49%
6.33%
6.24%
6.24%
5.68%
5.68%
6.20%
6.06%
6.21%
6.66%
6.67%
6.66%
10 years
54.37
48.19
45.66
45.66
42.81
42.81
50.45
45.56
49.73
57.66
57.92
57.68
Annual average
4.44
4.01
3.83
3.83
3.63
3.63
4.17
3.83
4.12
4.66
4.68
4.66
5 years
29.26
24.09
24.50
22.62
24.56
24.56
27.60
23.45
27.62
30.76
30.98
30.78
Annual average
5.27
4.41
4.48
4.16
4.49
4.49
5.00
4.30
5.00
5.51
5.55
5.51
3 years
15.57
10.94
13.07
10.12
13.03
13.03
14.69
10.97
14.78
16.44
16.64
16.46
Annual average
4.94
3.52
4.18
3.26
4.17
4.17
4.68
3.53
4.70
5.20
5.26
5.21
1 year
–1.69
–5.62
–2.44
–7.13
–2.45
–3.38
–1.96
–5.15
–1.96
–1.41
–1.26
–1.41
6 months
–2.76
–6.65
–3.02
–7.79
–3.03
–3.98
–2.92
–6.08
–2.80
–2.65
–2.50
–2.65
Current performance may be lower or higher than the quoted past performance, which cannot guarantee future results. After-sales-charge returns for class A and M shares reflect the deduction of the maximum 4.00% and 3.25% sales charge, respectively, levied at the time of purchase. Class B share returns after contingent deferred sales charge (CDSC) reflect the applicable CDSC, which is 5% in the first year, declining over time to 1% in the sixth year, and is eliminated thereafter. Class C share returns after CDSC reflect a 1% CDSC for the first year that is eliminated thereafter. Class R, R5, R6, and Y shares have no initial sales charge or CDSC. Performance for class B, C, M, R, and Y shares before their inception is derived from the historical performance of class A shares, adjusted for the applicable sales charge (or CDSC) and the higher operating expenses for such shares, except for class Y shares, for which 12b-1 fees are not applicable. Performance for class R5 and R6 shares prior to their inception is derived from the historical performance of class Y shares and has not been adjusted for the lower investor servicing fees applicable to class R5 and R6 shares; had it, returns would have been higher.
For a portion of the periods, the fund had expense limitations, without which returns would have been lower.
Class B share performance reflects conversion to class A shares after eight years.
12 Diversified Income Trust
Comparative index returns For periods ended 3/31/15
Barclays U.S. Aggregate Bond Index
Lipper Multi-Sector Income Funds category average*
Annual average (life of fund)
6.70%
7.06%
10 years
61.74
71.07
Annual average
4.93
5.43
5 years
24.10
31.26
Annual average
4.41
5.52
3 years
9.60
14.23
Annual average
3.10
4.51
1 year
5.72
2.36
6 months
3.43
1.05
Index and Lipper results should be compared with fund performance before sales charge, before CDSC, or at net asset value.
*Over the 6-month, 1-year, 3-year, 5-year, 10-year, and life-of-fund periods ended 3/31/15, there were 280, 256, 182, 145, 93, and 5 funds, respectively, in this Lipper category.
Fund price and distribution information For the six-month period ended 3/31/15
Distributions
Class A
Class B
Class C
Class M
Class R
Class R5
Class R6
Class Y
Number
6
6
6
6
6
6
6
6
Income
$0.162
$0.134
$0.135
$0.153
$0.152
$0.173
$0.174
$0.173
Capital gains
—
—
—
—
—
—
—
—
Total
$0.162
$0.134
$0.135
$0.153
$0.152
$0.173
$0.174
$0.173
Share value
Before sales charge
After sales charge
Net asset value
Net asset value
Before sales charge
After sales charge
Net asset value
Net asset value
Net asset value
Net asset value
9/30/14
$7.89
$8.22
$7.81
$7.76
$7.77
$8.03
$7.80
$7.82
$7.82
$7.82
3/31/15
7.51
7.82
7.44
7.39
7.39
7.64
7.43
7.44
7.45
7.44
Current rate (end of period)
Before sales charge
After sales charge
Net asset value
Net asset value
Before sales charge
After sales charge
Net asset value
Net asset value
Net asset value
Net asset value
Current dividend rate 1
4.31%
4.14%
3.55%
3.73%
4.22%
4.08%
4.04%
4.68%
4.67%
4.68%
Current 30-day SEC yield 2
N/A
4.43
3.86
3.86
N/A
4.22
4.36
4.89
4.96
4.87
The classification of distributions, if any, is an estimate. Before-sales-charge share value and current dividend rate for class A and M shares, if applicable, do not take into account any sales charge levied at the time of purchase. After-sales-charge share value, current dividend rate, and current 30-day SEC yield, if applicable, are calculated assuming that the maximum sales charge (4.00% for class A shares and 3.25% for class M shares) was levied at the time of purchase. Final distribution information will appear on your year-end tax forms.
1Most recent distribution, including any return of capital and excluding capital gains, annualized and divided by share price before or after sales charge at period-end.
2Based only on investment income and calculated using the maximum offering price for each share class, in accordance with SEC guidelines.
Diversified Income Trust 13
Your fund’s expenses
As a mutual fund investor, you pay ongoing expenses, such as management fees, distribution fees (12b-1 fees), and other expenses. Using the following information, you can estimate how these expenses affect your investment and compare them with the expenses of other funds. You may also pay one-time transaction expenses, including sales charges (loads) and redemption fees, which are not shown in this section and would have resulted in higher total expenses. For more information, see your fund’s prospectus or talk to your financial representative.
Expense ratios
Class A
Class B
Class C
Class M
Class R
Class R5
Class R6
Class Y
Total annual operating expenses for the fiscal year ended 9/30/14
0.97%
1.72%
1.72%
1.22%
1.22%
0.71%*
0.64%*
0.72%
Annualized expense ratio for the six-month period ended 3/31/15
0.95%
1.70%
1.70%
1.20%
1.20%
0.69%
0.62%
0.70%
Fiscal-year expense information in this table is taken from the most recent prospectus, is subject to change, and may differ from that shown for the annualized expense ratio and in the financial highlights of this report.
Expenses are shown as a percentage of average net assets.
*Other expenses for class R5 and class R6 shares have been annualized.
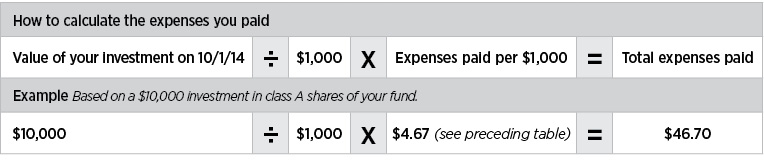
Expenses per $1,000
The following table shows the expenses you would have paid on a $1,000 investment in the fund from October 1, 2014, to March 31, 2015. It also shows how much a $1,000 investment would be worth at the close of the period, assuming actual returns and expenses.
Class A
Class B
Class C
Class M
Class R
Class R5
Class R6
Class Y
Expenses paid per $1,000*†
$4.67
$8.35
$8.35
$5.90
$5.90
$3.39
$3.05
$3.44
Ending value (after expenses)
$972.40
$969.80
$969.70
$970.80
$972.00
$973.50
$975.00
$973.50
*Expenses for each share class are calculated using the fund’s annualized expense ratio for each class, which represents the ongoing expenses as a percentage of average net assets for the six months ended 3/31/15. The expense ratio may differ for each share class.
†Expenses are calculated by multiplying the expense ratio by the average account value for the period; then multiplying the result by the number of days in the period; and then dividing that result by the number of days in the year.
14 Diversified Income Trust
Estimate the expenses you paid
To estimate the ongoing expenses you paid for the six months ended March 31, 2015, use the following calculation method. To find the value of your investment on October 1, 2014, call Putnam at 1-800-225-1581.
Compare expenses using the SEC’s method
The Securities and Exchange Commission (SEC) has established guidelines to help investors assess fund expenses. Per these guidelines, the following table shows your fund’s expenses based on a $1,000 investment, assuming a hypothetical 5% annualized return. You can use this information to compare the ongoing expenses (but not transaction expenses or total costs) of investing in the fund with those of other funds. All mutual fund shareholder reports will provide this information to help you make this comparison. Please note that you cannot use this information to estimate your actual ending account balance and expenses paid during the period.
Class A
Class B
Class C
Class M
Class R
Class R5
Class R6
Class Y
Expenses paid per $1,000*†
$4.78
$8.55
$8.55
$6.04
$6.04
$3.48
$3.13
$3.53
Ending value (after expenses)
$1,020.19
$1,016.45
$1,016.45
$1,018.95
$1,018.95
$1,021.49
$1,021.84
$1,021.44
*Expenses for each share class are calculated using the fund’s annualized expense ratio for each class, which represents the ongoing expenses as a percentage of average net assets for the six months ended 3/31/15. The expense ratio may differ for each share class.
†Expenses are calculated by multiplying the expense ratio by the average account value for the six-month period; then multiplying the result by the number of days in the six-month period; and then dividing that result by the number of days in the year.
Diversified Income Trust 15
Terms and definitions
Important terms
Total return shows how the value of the fund’s shares changed over time, assuming you held the shares through the entire period and reinvested all distributions in the fund.
Before sales charge, or net asset value, is the price, or value, of one share of a mutual fund, without a sales charge. Before-sales-charge figures fluctuate with market conditions, and are calculated by dividing the net assets of each class of shares by the number of outstanding shares in the class.
After sales charge is the price of a mutual fund share plus the maximum sales charge levied at the time of purchase. After-sales-charge performance figures shown here assume the 4.00% maximum sales charge for class A shares and 3.25% for class M shares.
Contingent deferred sales charge (CDSC) is generally a charge applied at the time of the redemption of class B or C shares and assumes redemption at the end of the period. Your fund’s class B CDSC declines over time from a 5% maximum during the first year to 1% during the sixth year. After the sixth year, the CDSC no longer applies. The CDSC for class C shares is 1% for one year after purchase.
Share classes
Class A shares are generally subject to an initial sales charge and no CDSC (except on certain redemptions of shares bought without an initial sales charge).
Class B shares are not subject to an initial sales charge and may be subject to a CDSC.
Class C shares are not subject to an initial sales charge and are subject to a CDSC only if the shares are redeemed during the first year.
Class M shares have a lower initial sales charge and a higher 12b-1 fee than class A shares and no CDSC (except on certain redemptions of shares bought without an initial sales charge).
Class R shares are not subject to an initial sales charge or CDSC and are available only to employer-sponsored retirement plans.
Class R5 and R6 shares are not subject to an initial sales charge or CDSC, and carry no 12b-1 fee. They are only available to employer-sponsored retirement plans.
Class Y shares are not subject to an initial sales charge or CDSC, and carry no 12b-1 fee. They are generally only available to corporate and institutional clients and clients in other approved programs.
Fixed-income terms
Current rate is the annual rate of return earned from dividends or interest of an investment. Current rate is expressed as a percentage of the price of a security, fund share, or principal investment.
Mortgage-backed security (MBS), also known as a mortgage “pass-through,” is a type of asset-backed security that is secured by a mortgage or collection of mortgages. The following are types of MBSs:
•Agency “pass-through” has its principal and interest backed by a U.S. government agency, such as the Federal National Mortgage Association (Fannie Mae), Government National Mortgage Association (Ginnie Mae), and Federal Home Loan Mortgage Corporation (Freddie Mac).
•Collateralized mortgage obligation (CMO) represents claims to specific cash flows from pools of home mortgages. The streams of principal and interest payments on the mortgages are distributed to the different classes of CMO interests in “tranches.” Each tranche may have different principal balances, coupon rates, prepayment risks, and maturity dates. A CMO is highly sensitive to changes in interest rates and any resulting change in the rate at which homeowners sell their properties, refinance, or otherwise prepay loans. CMOs are subject to prepayment, market, and liquidity risks.
•Interest-only (IO) security is a type of CMO in which the underlying asset is the interest portion of mortgage, Treasury, or bond payments.
•Non-agency residential mortgage-backed security (RMBS) is an MBS not backed by Fannie Mae, Ginnie Mae, or Freddie Mac. One type of RMBS is an Alt-A mortgage-backed security.
•Commercial mortgage-backed security (CMBS) is secured by the loan on a commercial property.
16 Diversified Income Trust
Yield curve is a graph that plots the yields of bonds with equal credit quality against their differing maturity dates, ranging from shortest to longest. It is used as a benchmark for other debt, such as mortgage or bank lending rates.
Comparative indexes
Barclays U.S. Aggregate Bond Index is an unmanaged index of U.S. investment-grade fixed-income securities.
BofA Merrill Lynch U.S. 3-Month Treasury Bill Index is an unmanaged index that seeks to measure the performance of U.S. Treasury bills available in the marketplace.
S&P 500 Index is an unmanaged index of common stock performance.
Indexes assume reinvestment of all distributions and do not account for fees. Securities and performance of a fund and an index will differ. You cannot invest directly in an index.
Lipper is a third-party industry-ranking entity that ranks mutual funds. Its rankings do not reflect sales charges. Lipper rankings are based on total return at net asset value relative to other funds that have similar current investment styles or objectives as determined by Lipper. Lipper may change a fund’s category assignment at its discretion. Lipper category averages reflect performance trends for funds within a category.
Other information for shareholders
Important notice regarding delivery of shareholder documents
In accordance with Securities and Exchange Commission (SEC) regulations, Putnam sends a single copy of annual and semiannual shareholder reports, prospectuses, and proxy statements to Putnam shareholders who share the same address, unless a shareholder requests otherwise. If you prefer to receive your own copy of these documents, please call Putnam at 1-800-225-1581, and Putnam will begin sending individual copies within 30 days.
Proxy voting
Putnam is committed to managing our mutual funds in the best interests of our shareholders. The Putnam funds’ proxy voting guidelines and procedures, as well as information regarding how your fund voted proxies relating to portfolio securities during the 12-month period ended June 30, 2014, are available in the Individual Investors section of putnam.com, and on the SEC’s website, www.sec.gov. If you have questions about finding forms on the SEC’s website, you may call the SEC at 1-800-SEC-0330. You may also obtain the Putnam funds’ proxy voting guidelines and procedures at no charge by calling Putnam’s Shareholder Services at 1-800-225-1581.
Fund portfolio holdings
The fund will file a complete schedule of its portfolio holdings with the SEC for the first and third quarters of each fiscal year on Form N-Q. Shareholders may obtain the fund’s Form N-Q on the SEC’s website at www.sec.gov. In addition, the fund’s Form N-Q may be reviewed and copied at the SEC’s Public Reference Room in Washington, D.C. You may call the SEC at 1-800-SEC-0330 for information about the SEC’s website or the operation of the Public Reference Room.
Trustee and employee fund ownership
Putnam employees and members of the Board of Trustees place their faith, confidence, and, most importantly, investment dollars in Putnam mutual funds. As of March 31, 2015, Putnam employees had approximately $494,000,000 and the Trustees had approximately $141,000,000 invested in Putnam mutual funds. These amounts include investments by the Trustees’ and employees’ immediate family members as well as investments through retirement and deferred compensation plans.
Diversified Income Trust 17
Financial statements
A guide to financial statements
These sections of the report, as well as the accompanying Notes, constitute the fund’s financial statements.
The fund’s portfolio lists all the fund’s investments and their values as of the last day of the reporting period. Holdings are organized by asset type and industry sector, country, or state to show areas of concentration and diversification.
Statement of assets and liabilities shows how the fund’s net assets and share price are determined. All investment and non-investment assets are added together. Any unpaid expenses and other liabilities are subtracted from this total. The result is divided by the number of shares to determine the net asset value per share, which is calculated separately for each class of shares. (For funds with preferred shares, the amount subtracted from total assets includes the liquidation preference of preferred shares.)
Statement of operations shows the fund’s net investment gain or loss. This is done by first adding up all the fund’s earnings — from dividends and interest income — and subtracting its operating expenses to determine net investment income (or loss). Then, any net gain or loss the fund realized on the sales of its holdings — as well as any unrealized gains or losses over the period — is added to or subtracted from the net investment result to determine the fund’s net gain or loss for the fiscal period.
Statement of changes in net assets shows how the fund’s net assets were affected by the fund’s net investment gain or loss, by distributions to shareholders, and by changes in the number of the fund’s shares. It lists distributions and their sources (net investment income or realized capital gains) over the current reporting period and the most recent fiscal year-end. The distributions listed here may not match the sources listed in the Statement of operations because the distributions are determined on a tax basis and may be paid in a different period from the one in which they were earned. Dividend sources are estimated at the time of declaration. Actual results may vary. Any non-taxable return of capital cannot be determined until final tax calculations are completed after the end of the fund’s fiscal year.
Financial highlights provide an overview of the fund’s investment results, per-share distributions, expense ratios, net investment income ratios, and portfolio turnover in one summary table, reflecting the five most recent reporting periods. In a semiannual report, the highlights table also includes the current reporting period.
18 Diversified Income Trust
The fund’s portfolio 3/31/15 (Unaudited)
U.S. GOVERNMENT AND AGENCY MORTGAGE OBLIGATIONS (53.0%)*
Principal amount
Value
U.S. Government Guaranteed Mortgage Obligations (—%)
Government National Mortgage Association Pass-Through Certificates 6 1/2s, November 20, 2038
$471,901
$544,713
544,713
U.S. Government Agency Mortgage Obligations (53.0%)
Federal Home Loan Mortgage Corporation Pass-Through Certificates 4s, TBA, April 1, 2045
44,000,000
47,004,373
Federal National Mortgage Association Pass-Through Certificates
5 1/2s, TBA, April 1, 2045
23,000,000
25,903,750
4 1/2s, TBA, May 1, 2045
252,000,000
274,207,500
4 1/2s, TBA, April 1, 2045
338,000,000
368,736,875
4s, TBA, April 1, 2045
289,000,000
309,026,804
3 1/2s, TBA, May 1, 2045
433,000,000
453,787,377
3 1/2s, TBA, April 1, 2045
488,000,000
512,666,887
3s, TBA, April 1, 2045
1,207,000,000
1,234,157,500
3,225,491,066
Total U.S. government and agency mortgage obligations (cost $3,203,864,674)
Total foreign government and agency bonds and notes (cost $636,092,240)
$539,579,316
SENIOR LOANS (2.4%)* c
Principal amount
Value
Basic materials (0.1%)
Atkore International, Inc. bank term loan FRN 4 1/2s, 2021
$1,786,500
$1,764,169
HD Supply, Inc. bank term loan FRN Ser. B, 4s, 2018
957,961
959,158
Ineos US Finance, LLC bank term loan FRN 3 3/4s, 2018
675,920
671,817
Oxea Sarl bank term loan FRN 8 1/4s, 2020 (Germany)
507,000
468,975
WR Grace & Co. bank term loan FRN 2 3/4s, 2021
1,670,495
1,669,003
WR Grace & Co. bank term loan FRN Ser. DD, 2 3/4s, 2021
601,125
600,588
6,133,710
Capital goods (0.1%)
ADS Waste Holdings, Inc. bank term loan FRN Ser. B, 3 3/4s, 2019
1,965,360
1,942,637
Gates Global, LLC/Gates Global Co. bank term loan FRN 4 1/4s, 2021
2,251,685
2,241,834
4,184,471
Communication services (0.2%)
Asurion, LLC bank term loan FRN 8 1/2s, 2021
4,695,000
4,713,583
Asurion, LLC bank term loan FRN Ser. B1, 5s, 2019
1,759,115
1,763,828
Level 3 Financing, Inc. bank term loan FRN Ser. B1, 4s, 2020
1,360,000
1,361,983
Level 3 Financing, Inc. bank term loan FRN Ser. B5, 4 1/2s, 2022
3,105,000
3,118,861
10,958,255
Consumer cyclicals (1.2%)
Caesars Entertainment Operating Co., Inc. bank term loan FRN Ser. B6, 9.005s, 2017
10,444,111
9,536,779
Caesars Entertainment Operating Co., Inc. bank term loan FRN Ser. B7, 11 3/4s, 2017
1,258,675
1,143,821
Caesars Growth Properties Holdings, LLC bank term loan FRN 6 1/4s, 2021
4,461,288
3,943,778
CCM Merger, Inc. bank term loan FRN Ser. B, 4 1/2s, 2021
3,376,881
3,385,324
Dollar Tree Stores, Inc. bank term loan FRN Ser. B, 4 1/4s, 2022
1,195,000
1,207,136
Garda World Security Corp. bank term loan FRN Ser. B, 4s, 2020 (Canada)
1,186,412
1,179,985
Garda World Security Corp. bank term loan FRN Ser. DD, 4s, 2020 (Canada)
303,501
301,857
Getty Images, Inc. bank term loan FRN Ser. B, 4 3/4s, 2019
5,128,815
4,313,333
Hilton Worldwide Finance, LLC bank term loan FRN Ser. B, 3 1/2s, 2020
2,507,961
2,510,200
iHeartCommunications, Inc. bank term loan FRN Ser. D, 6.922s, 2019
6,774,000
6,433,607
JC Penney Corp., Inc. bank term loan FRN 5s, 2019
9,244,410
9,090,334
Navistar, Inc. bank term loan FRN Ser. B, 5 3/4s, 2017
3,741,308
3,756,898
Neiman Marcus Group, Ltd., Inc. bank term loan FRN 4 1/4s, 2020
7,735,596
7,702,194
PetSmart, Inc. bank term loan FRN Ser. B, 5s, 2022
4,675,000
4,707,935
ROC Finance, LLC bank term loan FRN 5s, 2019
6,222,101
6,004,328
Diversified Income Trust 53
SENIOR LOANS (2.4%)* c cont.
Principal amount
Value
Consumer cyclicals cont.
Talbots, Inc. (The) bank term loan FRN 8 1/4s, 2021
$930,000
$885,825
Tribune Media Co. bank term loan FRN Ser. B, 4s, 2020
2,028,650
2,027,636
Univision Communications, Inc. bank term loan FRN 4s, 2020
4,560,273
4,550,300
Visteon Corp. bank term loan FRN Class B, 3 1/2s, 2021
1,692,213
1,688,512
74,369,782
Consumer staples (0.2%)
BC ULC bank term loan FRN Ser. B, 4 1/2s, 2021 (Canada)
3,270,862
3,301,235
CEC Entertainment, Inc. bank term loan FRN Ser. B, 4s, 2021
2,376,000
2,343,924
Del Monte Foods, Inc. bank term loan FRN 8 1/4s, 2021
1,435,000
1,291,500
H.J. Heinz Co. bank term loan FRN Ser. B2, 3 1/4s, 2020
930,279
930,163
Libbey Glass, Inc. bank term loan FRN Ser. B, 3 3/4s, 2021
1,488,750
1,479,445
Revlon Consumer Products Corp. bank term loan FRN Ser. B, 4s, 2019
2,990,598
2,987,796
WNA Holdings, Inc. bank term loan FRN 8 1/2s, 2020
1,000,000
986,250
13,320,313
Energy (—%)
Fieldwood Energy, LLC bank term loan FRN 8 3/8s, 2020
2,311,000
1,681,253
Shelf Drilling Holdings, Ltd. bank term loan FRN 10s, 2018 ‡‡
1,346,000
901,820
2,583,073
Health care (0.2%)
Grifols Worldwide Operations USA, Inc. bank term loan FRN 3.172s, 2021
3,960,000
3,954,555
MPH Acquisition Holdings, LLC bank term loan FRN Ser. B, 3 3/4s, 2021
2,551,892
2,543,234
Ortho-Clinical Diagnostics, Inc. bank term loan FRN Ser. B, 4 3/4s, 2021
1,424,238
1,409,773
Par Pharmaceutical Cos., Inc. bank term loan FRN Class B2, 4s, 2019
1,514,986
1,511,830
Patheon, Inc. bank term loan FRN Ser. B, 4 1/4s, 2021 (Netherlands)
2,578,883
2,563,841
Valeant Pharmaceuticals International, Inc. bank term loan FRN Ser. E, 3 1/2s, 2020
1,064,623
1,064,124
13,047,357
Technology (0.3%)
Avaya, Inc. bank term loan FRN Ser. B3, 4.676s, 2017
3,057,144
3,007,848
Avaya, Inc. bank term loan FRN Ser. B6, 6 1/2s, 2018
3,276,488
3,266,023
Dell International, LLC bank term loan FRN Ser. B, 4 1/2s, 2020
4,174,848
4,196,883
First Data Corp. bank term loan FRN 4.174s, 2021
61,131
61,372
First Data Corp. bank term loan FRN Ser. B, 3.674s, 2018
824,435
823,576
Freescale Semiconductor, Inc. bank term loan FRN Ser. B5, 5s, 2021
3,664,200
3,681,213
15,036,915
Transportation (0.1%)
Air Medical Group Holdings, Inc. bank term loan FRN 7 5/8s, 2018 ‡‡
3,750,000
3,768,750
3,768,750
Utilities and power (—%)
Texas Competitive Electric Holdings Co., LLC bank term loan FRN 4.662s, 2017
3,098,000
1,851,610
Texas Competitive Electric Holdings Co., LLC bank term loan FRN 4.662s, 2017
31,795
19,003
1,870,613
Total senior loans (cost $149,612,742)
$145,273,239
54 Diversified Income Trust
PURCHASED SWAP OPTIONS OUTSTANDING (1.1%)* Counterparty Fixed right % to receive or (pay)/ Floating rate index/Maturity date
Expiration date/strike
Contract amount
Value
Bank of America N.A.
2.175/3 month USD-LIBOR-BBA/Apr-25
Apr-15/2.175
$412,098,000
$5,645,743
(2.0875)/3 month USD-LIBOR-BBA/Jul-25
Jul-15/2.0875
206,049,000
3,618,220
(2.685)/3 month USD-LIBOR-BBA/Sep-25
Sep-15/2.685
402,015,100
2,327,667
1.816/3 month USD-LIBOR-BBA/Apr-25
Apr-15/1.816
402,015,100
498,499
Barclays Bank PLC
(2.1625)/3 month USD-LIBOR-BBA/May-25
May-15/2.1625
402,015,100
3,364,866
(2.31)/3 month USD-LIBOR-BBA/Apr-45
Apr-15/2.31
80,403,020
2,663,752
2.31/3 month USD-LIBOR-BBA/Apr-45
Apr-15/2.31
80,403,020
944,735
Citibank, N.A.
2.20/3 month USD-LIBOR-BBA/May-25
May-15/2.20
439,954,600
7,892,786
2.172/3 month USD-LIBOR-BBA/Apr-25
Apr-15/2.172
206,049,000
2,812,569
2.043/3 month USD-LIBOR-BBA/May-25
May-15/2.043
201,007,550
2,096,509
1.4015/3 month USD-LIBOR-BBA/May-20
May-15/1.4015
804,030,200
2,090,479
(2.13)/3 month USD-LIBOR-BBA/Apr-25
Apr-15/2.13
402,015,100
1,612,081
1.294/3 month USD-LIBOR-BBA/May-20
May-15/1.294
804,030,200
1,181,924
1.3735/3 month USD-LIBOR-BBA/May-20
May-15/1.3735
402,015,100
908,554
1.266/3 month USD-LIBOR-BBA/May-20
May-15/1.266
402,015,100
506,539
1.802/3 month USD-LIBOR-BBA/Apr-25
Apr-15/1.802
402,015,100
438,196
Credit Suisse International
2.25/3 month USD-LIBOR-BBA/May-25
May-15/2.25
621,470,200
13,187,598
2.09125/3 month USD-LIBOR-BBA/Apr-25
Apr-15/2.09125
411,334,000
3,414,072
2.09/3 month USD-LIBOR-BBA/Apr-25
Apr-15/2.09
411,334,000
3,381,165
1.795/3 month USD-LIBOR-BBA/Apr-25
Apr-15/1.795
403,037,400
411,098
Goldman Sachs International
2.655/3 month USD-LIBOR-BBA/May-45
May-15/2.655
100,503,775
6,313,647
(2.82)/3 month USD-LIBOR-BBA/Jan-46
Jan-16/2.82
78,040,450
2,946,027
1.84/3 month USD-LIBOR-BBA/Apr-25
Apr-15/1.84
301,511,000
648,249
1.76/3 month USD-LIBOR-BBA/Apr-25
Apr-15/1.76
301,511,000
355,783
Total purchased swap options outstanding (cost $62,019,834)
$69,260,758
PURCHASED OPTIONS OUTSTANDING (0.1%)*
Expiration date/strike price
Contract amount
Value
Federal National Mortgage Association 30 yr 3.0s TBA commitments (Put)
May-15/$102.57
$204,000,000
$1,838,856
Federal National Mortgage Association 30 yr 3.0s TBA commitments (Put)
Apr-15/103.07
224,000,000
1,730,176
Total purchased options outstanding (cost $6,821,250)
$3,569,032
CONVERTIBLE BONDS AND NOTES (—%)*
Principal amount
Value
iStar Financial, Inc. cv. sr. unsec. unsub. notes 3s, 2016 R
$910,000
$1,077,781
Total convertible bonds and notes (cost $952,257)
$1,077,781
Diversified Income Trust 55
SHORT-TERM INVESTMENTS (11.0%)*
Principal amount/shares
Value
Putnam Money Market Liquidity Fund 0.09% L
Shares 12,188,174
$12,188,174
Putnam Short Term Investment Fund 0.09% L
Shares 341,186,155
341,186,155
SSgA Prime Money Market Fund Class N 0.02% P
Shares 46,348,000
46,348,000
U.S. Treasury Bills with an effective yield of 0.03%, April 9, 2015 # Δ §
$39,400,000
39,399,764
U.S. Treasury Bills with an effective yield of 0.02%, July 2, 2015 Δ
750,000
749,938
U.S. Treasury Bills with an effective yield of 0.02%, April 23, 2015 Δ §
41,700,000
41,699,453
U.S. Treasury Bills with an effective yield of 0.01%, May 21, 2015 Δ §
23,300,000
23,299,628
U.S. Treasury Bills with an effective yield of 0.01%, May 14, 2015 # Δ §
124,200,000
124,198,960
U.S. Treasury Bills with effective yields ranging from 0.10% to 0.11%, July 23, 2015 # Δ §
39,618,000
39,613,007
U.S. Treasury Bills with effective yields ranging from 0.01% to 0.02%, May 7, 2015 # Δ §
3,104,000
3,103,950
Total short-term investments (cost $671,779,111)
$671,787,029
TOTAL INVESTMENTS
Total investments (cost $9,439,625,782)
$9,329,099,887
Key to holding’s currency abbreviations
AUD
Australian Dollar
BRL
Brazilian Real
CAD
Canadian Dollar
CHF
Swiss Franc
EUR
Euro
GBP
British Pound
JPY
Japanese Yen
KRW
South Korean Won
MXN
Mexican Peso
NOK
Norwegian Krone
NZD
New Zealand Dollar
PLN
Polish Zloty
SEK
Swedish Krona
USD/$
United States Dollar
ZAR
South African Rand
Key to holding’s abbreviations
bp
Basis Points
EMTN
Euro Medium Term Notes
FRB
Floating Rate Bonds: the rate shown is the current interest rate at the close of the reporting period
FRN
Floating Rate Notes: the rate shown is the current interest rate or yield at the close of the reporting period
IFB
Inverse Floating Rate Bonds, which are securities that pay interest rates that vary inversely to changes in the market interest rates. As interest rates rise, inverse floaters produce less current income. The rate shown is the current interest rate at the close of the reporting period.
IO
Interest Only
MTN
Medium Term Notes
OAO
Open Joint Stock Company
56 Diversified Income Trust
OJSC
Open Joint Stock Company
OTC
Over-the-counter
PO
Principal Only
REGS
Securities sold under Regulation S may not be offered, sold or delivered within the United States except pursuant to an exemption from, or in a transaction not subject to, the registration requirements of the Securities Act of 1933.
TBA
To Be Announced Commitments
Notes to the fund’s portfolio
Unless noted otherwise, the notes to the fund’s portfolio are for the close of the fund’s reporting period, which ran from October 1, 2014 through March 31, 2015 (the reporting period). Within the following notes to the portfolio, references to “ASC 820” represent Accounting Standards Codification 820 Fair Value Measurements and Disclosures and references to “OTC”, if any, represent over-the-counter.
*
Percentages indicated are based on net assets of $6,086,532,427.
†
This security is non-income-producing.
††
The interest rate and date shown parenthetically represent the new interest rate to be paid and the date the fund will begin accruing interest at this rate.
‡‡
Income may be received in cash or additional securities at the discretion of the issuer.
#
This security, in part or in entirety, was pledged and segregated with the broker to cover margin requirements for futures contracts at the close of the reporting period.
Δ
This security, in part or in entirety, was pledged and segregated with the custodian for collateral on certain derivative contracts at the close of the reporting period.
§
This security, in part or in entirety, was pledged and segregated with the custodian for collateral on the initial margin on certain centrally cleared derivative contracts at the close of the reporting period.
c
Senior loans are exempt from registration under the Securities Act of 1933, as amended, but contain certain restrictions on resale and cannot be sold publicly. These loans pay interest at rates which adjust periodically. The interest rates shown for senior loans are the current interest rates at the close of the reporting period. Senior loans are also subject to mandatory and/or optional prepayment which cannot be predicted. As a result, the remaining maturity may be substantially less than the stated maturity shown (Notes 1 and 6).
F
This security is valued at fair value following procedures approved by the Trustees. Securities may be classified as Level 2 or Level 3 for ASC 820 based on the securities’ valuation inputs (Note 1).
i
This security was pledged, or purchased with cash that was pledged, to the fund for collateral on certain derivative contracts (Note 1).
L
Affiliated company (Note 5). The rate quoted in the security description is the annualized 7-day yield of the fund at the close of the reporting period.
P
This security was pledged, or purchased with cash that was pledged, to the fund for collateral on certain derivative contracts. The rate quoted in the security description is the annualized 7-day yield of the fund at the close of the reporting period (Note 1).
R
Real Estate Investment Trust.
At the close of the reporting period, the fund maintained liquid assets totaling $4,306,206,862 to cover certain derivative contracts and delayed delivery securities.
Debt obligations are considered secured unless otherwise indicated.
144A after the name of an issuer represents securities exempt from registration under Rule 144A under the Securities Act of 1933, as amended. These securities may be resold in transactions exempt from registration, normally to qualified institutional buyers.
See Note 1 to the financial statements regarding TBA commitments.
The dates shown on debt obligations are the original maturity dates.
Diversified Income Trust 57
DIVERSIFICATION BY COUNTRY
Distribution of investments by country of risk at the close of the reporting period, excluding collateral received, if any (as a percentage of Portfolio Value):
United States
87.2%
Argentina
2.4
Greece
2.1
Russia
1.3
Canada
1.0
Venezuela
1.0
Luxembourg
0.7
United Kingdom
0.7
Indonesia
0.5
Mexico
0.5
Other
2.6
Total
100.0%
FORWARD CURRENCY CONTRACTS at 3/31/15 (aggregate face value $2,504,201,645) (Unaudited)
Counterparty
Currency
Contract type
Delivery date
Value
Aggregate face value
Unrealized appreciation/ (depreciation)
Bank of America N.A.
Australian Dollar
Buy
4/15/15
$17,173,461
$17,220,870
$(47,409)
British Pound
Buy
6/17/15
16,275,423
17,026,835
(751,412)
Canadian Dollar
Sell
4/15/15
44,550,360
47,033,922
2,483,562
Euro
Sell
6/17/15
21,877,662
24,098,432
2,220,770
Norwegian Krone
Buy
6/17/15
2,214,472
1,854,263
360,209
Barclays Bank PLC
Australian Dollar
Buy
4/15/15
18,845,897
19,167,168
(321,271)
British Pound
Buy
6/17/15
15,412,532
15,325,730
86,802
Canadian Dollar
Sell
4/15/15
59,533,998
62,186,196
2,652,198
Euro
Sell
6/17/15
8,448,498
9,313,627
865,129
Japanese Yen
Sell
5/20/15
15,310,810
15,616,150
305,340
Mexican Peso
Buy
4/15/15
29,662,138
30,498,809
(836,671)
New Zealand Dollar
Sell
4/15/15
12,499,073
12,107,945
(391,128)
Singapore Dollar
Sell
5/20/15
31,007,588
30,793,261
(214,327)
Swedish Krona
Buy
6/17/15
13,351,174
14,404,072
(1,052,898)
Swiss Franc
Sell
6/17/15
19,405,125
19,720,751
315,626
Citibank, N.A.
Australian Dollar
Buy
4/15/15
27,183,418
26,922,628
260,790
Brazilian Real
Buy
4/2/15
1,547,054
1,539,121
7,933
Brazilian Real
Sell
4/2/15
1,547,054
1,809,602
262,548
Brazilian Real
Sell
7/2/15
1,505,427
1,498,164
(7,263)
British Pound
Buy
6/17/15
14,880,268
15,426,218
(545,950)
Canadian Dollar
Sell
4/15/15
43,767,327
46,001,704
2,234,377
Chilean Peso
Buy
4/15/15
30,952,877
30,833,027
119,850
Danish Krone
Sell
6/17/15
29,145,507
30,474,153
1,328,646
Euro
Sell
6/17/15
16,108,021
16,820,017
711,996
Japanese Yen
Sell
5/20/15
2,619,386
2,663,934
44,548
Mexican Peso
Buy
4/15/15
31,392,085
31,123,852
268,233
New Zealand Dollar
Sell
4/15/15
23,462,651
23,903,490
440,839
Norwegian Krone
Buy
6/17/15
4,377,912
3,297,497
1,080,415
Philippine Peso
Buy
5/20/15
15,027,887
15,266,238
(238,351)
Swiss Franc
Sell
6/17/15
34,783,102
35,392,662
609,560
58 Diversified Income Trust
FORWARD CURRENCY CONTRACTS at 3/31/15 (aggregate face value $2,504,201,645) (Unaudited) cont.
Counterparty
Currency
Contract type
Delivery date
Value
Aggregate face value
Unrealized appreciation/ (depreciation)
Credit Suisse International
Australian Dollar
Sell
4/15/15
$15,663,132
$16,446,721
$783,589
British Pound
Buy
6/17/15
4,966,959
6,161,348
(1,194,389)
Canadian Dollar
Sell
4/15/15
58,700,284
59,926,004
1,225,720
Euro
Sell
6/17/15
6,024,632
6,133,881
109,249
Indian Rupee
Buy
5/20/15
65,674,498
66,041,783
(367,285)
Japanese Yen
Sell
5/20/15
5,619,441
5,734,114
114,673
New Zealand Dollar
Buy
4/15/15
24,891,598
25,372,263
(480,665)
Norwegian Krone
Sell
6/17/15
2,465,819
2,576,500
110,681
Swedish Krona
Sell
6/17/15
14,545,399
14,994,903
449,504
Swiss Franc
Sell
6/17/15
3,401,615
3,459,937
58,322
Deutsche Bank AG
Australian Dollar
Buy
4/15/15
5,572,959
5,439,407
133,552
British Pound
Buy
6/17/15
23,588,495
24,455,860
(867,365)
Canadian Dollar
Sell
4/15/15
54,867,221
56,622,819
1,755,598
Euro
Sell
6/17/15
7,855,206
9,572,870
1,717,664
New Zealand Dollar
Buy
4/15/15
31,662,038
31,154,853
507,185
Norwegian Krone
Sell
6/17/15
11,660,060
12,184,226
524,166
Polish Zloty
Sell
6/17/15
16,896,714
17,105,853
209,139
Swedish Krona
Sell
6/17/15
1,616
1,666
50
Swiss Franc
Sell
6/17/15
2,772,058
2,818,683
46,625
Turkish Lira
Sell
6/17/15
1,137,803
637,741
(500,062)
Goldman Sachs International
Australian Dollar
Buy
4/15/15
14,287,815
14,484,772
(196,957)
British Pound
Buy
6/17/15
15,185,689
15,744,617
(558,928)
Canadian Dollar
Sell
4/15/15
41,597,350
43,175,186
1,577,836
Euro
Sell
6/17/15
25,460,990
26,588,953
1,127,963
New Zealand Dollar
Buy
4/15/15
31,870,580
32,560,338
(689,758)
Norwegian Krone
Sell
6/17/15
13,467,312
14,092,177
624,865
Swedish Krona
Sell
6/17/15
3,961,743
4,084,768
123,025
HSBC Bank USA, National Association
Australian Dollar
Sell
4/15/15
491,495
1,181,560
690,065
British Pound
Buy
6/17/15
7,225,894
7,492,095
(266,201)
Canadian Dollar
Sell
4/15/15
49,262,370
51,371,056
2,108,686
Chinese Yuan (Onshore)
Buy
5/20/15
31,367,416
31,487,101
(119,685)
Euro
Sell
6/17/15
13,997,484
16,455,693
2,458,209
New Taiwan Dollar
Sell
5/20/15
31,283,645
30,965,387
(318,258)
New Zealand Dollar
Buy
4/15/15
15,621,284
15,949,553
(328,269)
Swedish Krona
Buy
6/17/15
1,425,849
1,470,631
(44,782)
JPMorgan Chase Bank N.A.
Australian Dollar
Buy
4/15/15
14,654,723
14,954,394
(299,671)
British Pound
Buy
6/17/15
12,125,689
12,487,024
(361,335)
Canadian Dollar
Sell
4/15/15
45,697,791
47,443,372
1,745,581
Diversified Income Trust 59
FORWARD CURRENCY CONTRACTS at 3/31/15 (aggregate face value $2,504,201,645) (Unaudited) cont.
Counterparty
Currency
Contract type
Delivery date
Value
Aggregate face value
Unrealized appreciation/ (depreciation)
JPMorgan Chase Bank N.A. cont.
Euro
Sell
6/17/15
$26,449,739
$28,647,969
$2,198,230
Indian Rupee
Buy
5/20/15
30,849,789
31,034,425
(184,636)
Japanese Yen
Sell
5/20/15
27,601,810
28,158,193
556,383
Malaysian Ringgit
Sell
5/20/15
195,936
488,499
292,563
Mexican Peso
Buy
4/15/15
29,907,166
30,153,681
(246,515)
New Zealand Dollar
Sell
4/15/15
17,972,351
17,805,669
(166,682)
Norwegian Krone
Buy
6/17/15
2,024,453
2,110,359
(85,906)
Philippine Peso
Buy
5/20/15
15,027,885
15,269,696
(241,811)
Singapore Dollar
Sell
5/20/15
32,158,053
32,752,496
594,443
South Korean Won
Sell
5/20/15
30,799,557
30,706,687
(92,870)
Swedish Krona
Buy
6/17/15
3,682,488
4,464,171
(781,683)
Swiss Franc
Buy
6/17/15
3,652,654
3,363,289
289,365
Royal Bank of Scotland PLC (The)
Australian Dollar
Buy
4/15/15
23,340,126
24,355,319
(1,015,193)
British Pound
Buy
6/17/15
7,400,696
8,394,830
(994,134)
Canadian Dollar
Sell
4/15/15
44,777,320
47,017,726
2,240,406
Euro
Sell
6/17/15
18,838,868
21,399,637
2,560,769
New Zealand Dollar
Sell
4/15/15
14,289,253
13,348,885
(940,368)
Norwegian Krone
Buy
6/17/15
7,249,006
6,297,797
951,209
Singapore Dollar
Sell
5/20/15
62,278,356
63,430,046
1,151,690
Swedish Krona
Buy
6/17/15
501,591
930,988
(429,397)
State Street Bank and Trust Co.
Australian Dollar
Sell
4/15/15
6,472,232
7,147,505
675,273
British Pound
Buy
6/17/15
2,025,718
3,030,265
(1,004,547)
Canadian Dollar
Sell
4/15/15
48,228,695
49,545,298
1,316,603
Chilean Peso
Buy
4/15/15
37,879
473,163
(435,284)
Euro
Sell
6/17/15
25,293,400
27,063,104
1,769,704
Hungarian Forint
Buy
6/17/15
29,273,268
29,974,955
(701,687)
Israeli Shekel
Buy
4/15/15
63,290,657
64,698,710
(1,408,053)
Israeli Shekel
Sell
4/15/15
63,290,657
63,145,330
(145,327)
Japanese Yen
Sell
5/20/15
15,131,093
15,439,825
308,732
Malaysian Ringgit
Sell
5/20/15
250,143
386,645
136,502
New Zealand Dollar
Buy
4/15/15
16,849,457
16,486,124
363,333
Norwegian Krone
Sell
6/17/15
6,555,637
6,848,357
292,720
Singapore Dollar
Sell
5/20/15
29,854,286
30,410,314
556,028
Swedish Krona
Sell
6/17/15
14,812,772
15,265,713
452,941
Swiss Franc
Buy
6/17/15
2,303,115
2,342,689
(39,574)
Turkish Lira
Sell
6/17/15
2,445,636
1,287,960
(1,157,676)
UBS AG
Australian Dollar
Sell
4/15/15
23,592,190
24,956,533
1,364,343
British Pound
Buy
6/17/15
23,946,402
24,851,384
(904,982)
Canadian Dollar
Sell
4/15/15
32,359,793
34,686,764
2,326,971
60 Diversified Income Trust
FORWARD CURRENCY CONTRACTS at 3/31/15 (aggregate face value $2,504,201,645) (Unaudited) cont.
Counterparty
Currency
Contract type
Delivery date
Value
Aggregate face value
Unrealized appreciation/ (depreciation)
UBS AG cont.
Chilean Peso
Buy
4/15/15
$37,879
$482,234
$(444,355)
Euro
Sell
6/17/15
14,398,000
15,882,268
1,484,268
Japanese Yen
Sell
5/20/15
9,969,416
10,177,960
208,544
New Taiwan Dollar
Sell
5/20/15
31,283,649
30,834,036
(449,613)
New Zealand Dollar
Buy
4/15/15
45,399,289
45,592,183
(192,894)
Norwegian Krone
Buy
6/17/15
30,168,695
29,916,351
252,344
Norwegian Krone
Sell
6/17/15
29,767,892
30,765,153
997,261
Swedish Krona
Buy
6/17/15
272,338
1,283,322
(1,010,984)
WestPac Banking Corp.
Australian Dollar
Sell
4/15/15
10,422,452
10,987,246
564,794
Canadian Dollar
Buy
4/15/15
36,795,425
38,810,576
(2,015,151)
Canadian Dollar
Sell
4/15/15
36,352,398
38,944,282
2,591,884
Euro
Sell
6/17/15
22,668,898
24,006,326
1,337,428
New Zealand Dollar
Buy
4/15/15
28,315,309
28,910,712
(595,403)
South Korean Won
Buy
5/20/15
1,245,557
1,267,549
(21,992)
Total
$35,989,042
FUTURES CONTRACTS OUTSTANDING at 3/31/15 (Unaudited)
Number of contracts
Value
Expiration date
Unrealized appreciation/ (depreciation)
Euro-Bobl 5 yr (Short)
2,195
$305,477,379
Jun-15
$(760,448)
Euro-Bund 10 yr (Long)
1,548
264,254,034
Jun-15
3,741,435
Euro-Buxl 30 yr (Short)
269
50,952,930
Jun-15
(3,431,050)
U.S. Treasury Bond 30 yr (Long)
143
23,434,125
Jun-15
124,803
U.S. Treasury Bond Ultra 30 yr (Long)
459
77,972,625
Jun-15
(341,845)
U.S. Treasury Note 2 yr (Short)
1,611
353,060,719
Jun-15
(733,611)
U.S. Treasury Note 5 yr (Short)
3,265
392,488,713
Jun-15
(1,806,817)
U.S. Treasury Note 10 yr (Short)
911
117,433,594
Jun-15
(858,893)
Total
$(4,066,426)
WRITTEN SWAP OPTIONS OUTSTANDING at 3/31/15 (premiums $98,151,719) (Unaudited)
Counterparty Fixed Obligation % to receive or (pay)/ Floating rate index/Maturity date
Expiration date/strike
Contract amount
Value
Bank of America N.A.
2.916/3 month USD-LIBOR-BBA/Apr-25
Apr-15/2.916
$402,015,100
$402
(1.9125)/3 month USD-LIBOR-BBA/Apr-25
Apr-15/1.9125
412,098,000
605,784
2.955/3 month USD-LIBOR-BBA/Sep-25
Sep-15/2.955
804,030,200
2,106,559
(2.04375)/3 month USD-LIBOR-BBA/Apr-25
Apr-15/2.04375
412,098,000
2,274,781
1.66/3 month USD-LIBOR-BBA/Jul-20
Jul-15/1.66
412,098,000
3,568,769
Diversified Income Trust 61
WRITTEN SWAP OPTIONS OUTSTANDING at 3/31/15 (premiums $98,151,719) (Unaudited) cont.
Counterparty Fixed Obligation % to receive or (pay)/ Floating rate index/Maturity date
Expiration date/strike
Contract amount
Value
Barclays Bank PLC
2.3775/3 month USD-LIBOR-BBA/May-25
May-15/2.3775
$402,015,100
$1,202,025
2.265/3 month USD-LIBOR-BBA/May-25
May-15/2.265
402,015,100
2,110,579
Citibank, N.A.
2.902/3 month USD-LIBOR-BBA/Apr-25
Apr-15/2.902
402,015,100
2,010
(1.602)/3 month USD-LIBOR-BBA/Apr-25
Apr-15/1.602
402,015,100
60,302
2.28/3 month USD-LIBOR-BBA/Apr-25
Apr-15/2.28
402,015,100
426,136
(1.932)/3 month USD-LIBOR-BBA/Apr-25
Apr-15/1.932
206,049,000
432,703
2.205/3 month USD-LIBOR-BBA/Apr-25
Apr-15/2.205
402,015,100
864,332
(2.052)/3 month USD-LIBOR-BBA/Apr-25
Apr-15/2.052
206,049,000
1,281,625
(1.481)/3 month USD-LIBOR-BBA/May-20
May-15/1.481
402,015,100
1,523,637
(2.223)/3 month USD-LIBOR-BBA/May-25
May-15/2.223
100,503,775
2,019,121
(1.509)/3 month USD-LIBOR-BBA/May-20
May-15/1.509
804,030,200
3,457,330
Credit Suisse International
2.895/3 month USD-LIBOR-BBA/Apr-25
Apr-15/2.895
403,037,400
403
(1.80)/3 month USD-LIBOR-BBA/Apr-25
Apr-15/1.80
411,334,000
185,100
(1.80125)/3 month USD-LIBOR-BBA/Apr-25
Apr-15/1.80125
411,334,000
189,214
(1.94)/3 month USD-LIBOR-BBA/Apr-25
Apr-15/1.94
411,334,000
933,728
(1.94125)/3 month USD-LIBOR-BBA/Apr-25
Apr-15/1.94125
411,334,000
946,068
Goldman Sachs International
(1.92)/3 month USD-LIBOR-BBA/Apr-25
Apr-15/1.92
301,511,000
1,133,681
(1.885)/3 month USD-LIBOR-BBA/Jan-46
Jan-16/1.885
78,040,450
1,773,235
(2.35)/3 month USD-LIBOR-BBA/May-45
May-15/2.35
100,503,775
2,225,154
(2.5025)/3 month USD-LIBOR-BBA/May-45
May-15/2.5025
100,503,775
3,927,689
JPMorgan Chase Bank N.A.
(6.00 Floor)/3 month USD-LIBOR-BBA/Mar-18
Mar-18/6.00
270,610,000
40,266,768
Total
$73,517,135
WRITTEN OPTIONS OUTSTANDING at 3/31/15 (premiums $6,840,313) (Unaudited)
Expiration date/strike price
Contract amount
Value
Federal National Mortgage Association 30 yr 3.0s TBA commitments (Put)
May-15/$101.57
$204,000,000
$901,272
Federal National Mortgage Association 30 yr 3.0s TBA commitments (Put)
May-15/100.57
204,000,000
353,532
Federal National Mortgage Association 30 yr 3.0s TBA commitments (Put)
Apr-15/102.07
224,000,000
469,056
Federal National Mortgage Association 30 yr 3.0s TBA commitments (Put)
Apr-15/101.07
224,000,000
40,096
Total
$1,763,956
62 Diversified Income Trust
FORWARD PREMIUM SWAP OPTION CONTRACTS OUTSTANDING at 3/31/15 (Unaudited)
Counterparty Fixed right or obligation % to receive or (pay)/Floating rate index/ Maturity date
Expiration date/strike
Contract amount
Premium receivable/ (payable)
Unrealized appreciation/ (depreciation)
Goldman Sachs International
1.955/3 month USD-LIBOR-BBA/Apr-25 (Purchased)
Apr-15/1.955
$281,410,570
$(1,575,899)
$(70,353)
(2.155)/3 month USD-LIBOR-BBA/Apr-25 (Purchased)
Apr-15/2.155
281,410,570
(1,575,899)
(98,494)
JPMorgan Chase Bank N.A.
2.117/3 month USD-LIBOR-BBA/Feb-27 (Purchased)
Feb-17/2.117
100,503,775
(2,462,644)
698,503
2.035/3 month USD-LIBOR-BBA/Feb-27 (Purchased)
Feb-17/2.035
100,503,775
(2,553,700)
274,978
(3.035)/3 month USD-LIBOR-BBA/Feb-27 (Purchased)
Feb-17/3.035
100,503,775
(2,674,204)
(320,607)
(3.117)/3 month USD-LIBOR-BBA/Feb-27 (Purchased)
Feb-17/3.117
100,503,775
(2,814,106)
(674,883)
2.655/3 month USD-LIBOR-BBA/Feb-19 (Written)
Feb-17/2.655
440,206,400
2,916,367
827,148
2.56/3 month USD-LIBOR-BBA/Feb-19 (Written)
Feb-17/2.56
440,206,400
2,814,105
516,802
(1.56)/3 month USD-LIBOR-BBA/Feb-19 (Written)
Feb-17/1.56
440,206,400
2,534,403
(449,011)
(1.655)/3 month USD-LIBOR-BBA/Feb-19 (Written)
Feb-17/1.655
440,206,400
2,509,176
(840,794)
Total
$(2,882,401)
$(136,711)
TBA SALE COMMITMENTS OUTSTANDING at 3/31/15 (proceeds receivable $878,005,566) (Unaudited)
Agency
Principal amount
Settlement date
Value
Federal National Mortgage Association, 4 1/2s, April 1, 2045
$338,000,000
4/14/15
$368,736,875
Federal National Mortgage Association, 3 1/2s, April 1, 2045
488,000,000
4/14/15
512,666,887
Total
$881,403,762
OTC INTEREST RATE SWAP CONTRACTS OUTSTANDING at 3/31/15 (Unaudited) cont.
Swap counterparty/ Notional amount
Upfront premium received (paid)
Termination date
Payments made by fund per annum
Payments received by fund per annum
Unrealized appreciation/ (depreciation)
Bank of America N.A.
CAD
83,015,000 E
$—
6/17/20
3 month CAD-BA-CDOR
1.385%
$481,094
CAD
354,672,000 E
—
6/17/17
0.93%
3 month CAD-BA-CDOR
(235,225)
CAD
143,810,000 E
—
6/17/20
3 month CAD-BA-CDOR
1.25%
82,888
CAD
199,277,000 E
—
6/17/17
1.00%
3 month CAD-BA-CDOR
(350,865)
Diversified Income Trust 63
OTC INTEREST RATE SWAP CONTRACTS OUTSTANDING at 3/31/15 (Unaudited) cont.
Swap counterparty/ Notional amount
Upfront premium received (paid)
Termination date
Payments made by fund per annum
Payments received by fund per annum
Unrealized appreciation/ (depreciation)
Citibank, N.A.
NZD
22,592,000
$—
2/17/25
3 month NZD-BBR-FRA
3.765%
$22,329
NZD
80,105,000
—
2/5/25
3.62%
3 month NZD-BBR-FRA
643,528
NZD
71,030,000
—
2/9/25
3.57%
3 month NZD-BBR-FRA
794,602
NZD
20,536,000
—
2/13/25
3.83%
3 month NZD-BBR-FRA
(103,330)
NZD
33,632,000
—
3/16/25
3.8675%
3 month NZD-BBR-FRA
(243,455)
Credit Suisse International
CAD
616,144,000 E
—
6/17/17
0.90929%
3 month CAD-BA-CDOR
(209,184)
CAD
254,164,000 E
—
6/17/20
3 month CAD-BA-CDOR
1.23%
(50,169)
NOK
103,025,000
—
3/12/25
1.915%
6 month NOK-NIBOR-NIBR
(103,650)
NOK
297,510,000
—
3/13/25
6 month NOK-NIBOR-NIBR
1.875%
166,471
SEK
430,901,000
—
11/11/19
0.78%
3 month SEK-STIBOR-SIDE
(1,169,726)
SEK
223,494,000
—
11/11/24
3 month SEK-STIBOR-SIDE
1.49%
1,480,760
Deutsche Bank AG
BRL
145,760,905
—
1/4/21
0.00%
Brazil Cetip Interbank Deposit Rate Over
194,649
BRL
495,431,099
—
1/2/17
Brazil Cetip Interbank Deposit Rate Over
0.00%
(475,631)
PLN
167,112,000
—
3/17/24
4.1072%
6 month PLN-WIBOR-WIBO
(7,386,237)
PLN
83,320,000
—
3/18/24
4.12875%
6 month PLN-WIBOR-WIBO
(3,720,030)
PLN
76,955,000
—
3/27/24
4.045%
6 month PLN-WIBOR-WIBO
(3,360,677)
ZAR
320,233,000
—
1/26/25
3 month ZAR-JIBAR-SAFEX
7.09%
(1,079,548)
ZAR
213,493,000
—
1/23/25
3 month ZAR-JIBAR-SAFEX
7.08%
(729,532)
Goldman Sachs International
KRW
32,815,000,000
—
11/06/19
3 month KRW-CD-KSDA-BLOOMBERG
2.17%
477,804
NOK
140,421,000
—
2/6/25
1.745%
6 month NOK-NIBOR-NIBR
111,370
NOK
113,842,000
—
2/6/25
1.74%
6 month NOK-NIBOR-NIBR
96,902
64 Diversified Income Trust
OTC INTEREST RATE SWAP CONTRACTS OUTSTANDING at 3/31/15 (Unaudited) cont.
Swap counterparty/ Notional amount
Upfront premium received (paid)
Termination date
Payments made by fund per annum
Payments received by fund per annum
Unrealized appreciation/ (depreciation)
Goldman Sachs International cont.
NOK
127,496,000
$—
2/11/25
6 month NOK-NIBOR-NIBR
1.7375%
$(116,955)
NOK
112,313,000
—
2/5/25
1.7125%
6 month NOK-NIBOR-NIBR
130,445
NOK
256,246,000
—
2/13/25
6 month NOK-NIBOR-NIBR
1.77%
(150,830)
NOK
94,820,500
—
2/17/25
1.80%
6 month NOK-NIBOR-NIBR
23,952
NOK
94,819,500
—
2/17/25
1.81%
6 month NOK-NIBOR-NIBR
13,092
NZD
37,877,000
—
3/11/25
3.97%
3 month NZD-BBR-FRA
(516,525)
NZD
24,479,000
—
3/20/25
3.80%
3 month NZD-BBR-FRA
(73,995)
SEK
454,216,000
—
11/10/19
0.775%
3 month SEK-STIBOR-SIDE
(1,216,321)
SEK
230,674,000
—
11/10/24
3 month SEK-STIBOR-SIDE
1.4775%
1,490,480
SEK
196,634,000
—
3/12/25
3 month SEK-STIBOR-SIDE
1.1475%
411,064
SEK
519,901,000
—
3/12/20
0.5325%
3 month SEK-STIBOR-SIDE
(426,760)
JPMorgan Chase Bank N.A.
BRL
500,419,006
—
1/2/17
Brazil Cetip Interbank Deposit Rate Over
0.00%
(1,663,438)
BRL
150,482,196
—
1/4/21
0.00%
Brazil Cetip Interbank Deposit Rate Over
1,734,090
BRL
66,346,495
—
1/4/21
0.00%
Brazil Cetip Interbank Deposit Rate Over
(272,554)
BRL
223,605,944
—
1/2/17
Brazil Cetip Interbank Deposit Rate Over
0.00%
367,825
NOK
114,554,000
—
2/17/25
1.795%
6 month NOK-NIBOR-NIBR
35,425
NZD
27,114,000
—
2/17/25
3 month NZD-BBR-FRA
3.765%
26,798
NZD
20,536,000
—
2/13/25
3.8225%
3 month NZD-BBR-FRA
(93,663)
NZD
12,795,000
—
2/17/25
3 month NZD-BBR-FRA
3.7275%
(17,239)
NZD
27,858,000
—
2/20/25
3 month NZD-BBR-FRA
3.815%
113,465
NZD
36,499,000
—
2/25/25
3 month NZD-BBR-FRA
3.885%
307,701
Diversified Income Trust 65
OTC INTEREST RATE SWAP CONTRACTS OUTSTANDING at 3/31/15 (Unaudited) cont.
Swap counterparty/ Notional amount
Upfront premium received (paid)
Termination date
Payments made by fund per annum
Payments received by fund per annum
Unrealized appreciation/ (depreciation)
JPMorgan Chase Bank N.A. cont.
NZD
22,452,000
$—
3/6/25
3.865%
3 month NZD-BBR-FRA
$(159,984)
NZD
29,681,000
—
3/12/25
3.94%
3 month NZD-BBR-FRA
(348,486)
PLN
84,511,000
—
3/12/25
2.42%
6 month PLN-WIBOR-WIBO
(672,791)
SEK
425,156,000
—
11/10/19
0.78%
3 month SEK-STIBOR-SIDE
(1,159,485)
SEK
221,195,000
—
11/10/24
3 month SEK-STIBOR-SIDE
1.485%
1,464,895
SEK
221,195,000
—
11/11/24
3 month SEK-STIBOR-SIDE
1.485%
1,463,014
SEK
425,156,000
—
11/11/19
0.775%
3 month SEK-STIBOR-SIDE
(1,145,351)
ZAR
221,498,000
—
1/22/25
3 month ZAR-JIBAR-SAFEX
7.14%
(678,082)
ZAR
664,494,000
—
1/23/25
3 month ZAR-JIBAR-SAFEX
7.0633%
(2,335,963)
ZAR
411,321,000
—
3/10/25
3 month ZAR-JIBAR-SAFEX
7.91%
504,659
Total
$—
$(17,626,379)
E Extended effective date.
CENTRALLY CLEARED INTEREST RATE SWAP CONTRACTS OUTSTANDING at 3/31/15 (Unaudited)
OTC TOTAL RETURN SWAP CONTRACTS OUTSTANDING at 3/31/15 (Unaudited)
Swap counterparty/ Notional amount
Upfront premium received (paid)
Termination date
Payments received (paid) by fund per annum
Total return received by or paid by fund
Unrealized appreciation/ (depreciation)
Bank of America N.A.
$12,228,578
$—
1/12/41
4.50% (1 month USD-LIBOR)
Synthetic TRS Index 4.50% 30 year Fannie Mae pools
$(143,179)
Barclays Bank PLC
4,266,906
—
1/12/40
5.00% (1 month USD-LIBOR)
Synthetic MBX Index 5.00% 30 year Fannie Mae pools
20,122
2,395,857
—
1/12/41
3.50% (1 month USD-LIBOR)
Synthetic TRS Index 3.50% 30 year Fannie Mae pools
(28,189)
1,916,172
—
1/12/41
5.00% (1 month USD-LIBOR)
Synthetic TRS Index 5.00% 30 year Fannie Mae pools
(19,836)
72 Diversified Income Trust
OTC TOTAL RETURN SWAP CONTRACTS OUTSTANDING at 3/31/15 (Unaudited) cont.
Swap counterparty/ Notional amount
Upfront premium received (paid)
Termination date
Payments received (paid) by fund per annum
Total return received by or paid by fund
Unrealized appreciation/ (depreciation)
Barclays Bank PLC cont.
$2,395,857
$—
1/12/41
3.50% (1 month USD-LIBOR)
Synthetic MBX Index 3.50% 30 year Fannie Mae pools
$20,274
2,016,772
—
1/12/41
4.00% (1 month USD-LIBOR)
Synthetic MBX Index 4.00% 30 year Fannie Mae pools
10,346
1,772,772
—
1/12/41
4.50% (1 month USD-LIBOR)
Synthetic MBX Index 4.50% 30 year Fannie Mae pools
13,160
6,884,898
—
1/12/42
4.00% (1 month USD-LIBOR)
Synthetic TRS Index 4.00% 30 year Fannie Mae pools
(87,806)
5,296,671
—
1/12/40
5.00% (1 month USD-LIBOR)
Synthetic MBX Index 5.00% 30 year Fannie Mae pools
24,979
4,874,742
—
1/12/41
5.00% (1 month USD-LIBOR)
Synthetic MBX Index 5.00% 30 year Fannie Mae pools
24,511
8,710,547
—
1/12/40
4.00% (1 month USD-LIBOR)
Synthetic MBX Index 4.00% 30 year Fannie Mae pools
46,051
2,682,641
—
1/12/41
5.00% (1 month USD-LIBOR)
Synthetic MBX Index 5.00% 30 year Fannie Mae pools
13,489
2,489,249
—
1/12/40
4.00% (1 month USD-LIBOR)
Synthetic MBX Index 4.00% 30 year Fannie Mae pools
13,160
1,303,784
—
1/12/40
4.50% (1 month USD-LIBOR)
Synthetic MBX Index 4.50% 30 year Fannie Mae pools
10,493
1,629,904
—
1/12/40
5.00% (1 month USD-LIBOR)
Synthetic MBX Index 5.00% 30 year Fannie Mae pools
7,687
20,957,557
—
1/12/41
5.00% (1 month USD-LIBOR)
Synthetic MBX Index 5.00% 30 year Fannie Mae pools
105,380
4,396,136
—
1/12/39
6.00% (1 month USD-LIBOR)
Synthetic TRS Index 6.00% 30 year Fannie Mae pools
30,993
12,814,082
—
1/12/38
(6.50%) 1 month USD-LIBOR
Synthetic MBX Index 6.50% 30 year Fannie Mae pools
(58,508)
16,045,641
—
1/12/41
5.00% (1 month USD-LIBOR)
Synthetic MBX Index 5.00% 30 year Fannie Mae pools
80,682
4,935,855
—
1/12/40
4.00% (1 month USD-LIBOR)
Synthetic MBX Index 4.00% 30 year Fannie Mae pools
26,095
Diversified Income Trust 73
OTC TOTAL RETURN SWAP CONTRACTS OUTSTANDING at 3/31/15 (Unaudited) cont.
Swap counterparty/ Notional amount
Upfront premium received (paid)
Termination date
Payments received (paid) by fund per annum
Total return received by or paid by fund
Unrealized appreciation/ (depreciation)
Barclays Bank PLC cont.
$661,471
$—
1/12/38
6.50% (1 month USD-LIBOR)
Synthetic TRS Index 6.50% 30 year Fannie Mae pools
$5,974
1,951,813
—
1/12/41
5.00% (1 month USD-LIBOR)
Synthetic MBX Index 5.00% 30 year Fannie Mae pools
9,814
2,537,498
—
1/12/41
5.00% (1 month USD-LIBOR)
Synthetic MBX Index 5.00% 30 year Ginnie Mae II pools
13,156
19,587,633
—
1/12/38
(6.50%) 1 month USD-LIBOR
Synthetic MBX Index 6.50% 30 year Fannie Mae pools
(89,436)
16,271,434
—
1/12/40
4.00% (1 month USD-LIBOR)
Synthetic MBX Index 4.00% 30 year Fannie Mae pools
86,024
5,408,478
—
1/12/38
(6.50%) 1 month USD-LIBOR
Synthetic MBX Index 6.50% 30 year Fannie Mae pools
(24,695)
2,820,650
—
1/12/40
5.00% (1 month USD-LIBOR)
Synthetic MBX Index 5.00% 30 year Fannie Mae pools
13,302
426,517
—
1/12/41
(4.50%) 1 month USD-LIBOR
Synthetic TRS Index 4.50% 30 year Ginnie Mae II pools
3,927
23,112,613
—
1/12/40
4.50% (1 month USD-LIBOR)
Synthetic MBX Index 4.50% 30 year Fannie Mae pools
186,019
86,463,429
—
1/12/41
5.00% (1 month USD-LIBOR)
Synthetic MBX Index 5.00% 30 year Fannie Mae pools
434,760
24,411,648
—
1/12/41
5.00% (1 month USD-LIBOR)
Synthetic MBX Index 5.00% 30 year Fannie Mae pools
122,748
3,738,888
—
1/12/40
5.00% (1 month USD-LIBOR)
Synthetic MBX Index 5.00% 30 year Fannie Mae pools
17,632
12,124,597
—
1/12/40
5.00% (1 month USD-LIBOR)
Synthetic MBX Index 5.00% 30 year Fannie Mae pools
57,179
8,790,095
—
1/12/40
5.00% (1 month USD-LIBOR)
Synthetic MBX Index 5.00% 30 year Fannie Mae pools
41,453
75,253
—
1/12/39
(6.00%)1 month USD-LIBOR
Synthetic TRS Index 6.00% 30 year Fannie Mae pools
531
2,195,573
—
1/12/41
5.00% (1 month USD-LIBOR)
Synthetic TRS Index 5.00% 30 year Ginnie Mae II pools
(4,541)
74 Diversified Income Trust
OTC TOTAL RETURN SWAP CONTRACTS OUTSTANDING at 3/31/15 (Unaudited) cont.
Swap counterparty/ Notional amount
Upfront premium received (paid)
Termination date
Payments received (paid) by fund per annum
Total return received by or paid by fund
Unrealized appreciation/ (depreciation)
Barclays Bank PLC cont.
$29,247,663
$—
1/12/38
(6.50%) 1 month USD-LIBOR
Synthetic MBX Index 6.50% 30 year Fannie Mae pools
$(133,543)
6,405,870
—
1/12/39
(6.00%) 1 month USD-LIBOR
Synthetic MBX Index 6.00% 30 year Fannie Mae pools
(38,582)
4,411,851
—
1/12/39
(5.50%) 1 month USD-LIBOR
Synthetic MBX Index 5.50% 30 year Fannie Mae pools
(23,346)
2,205,666
—
1/12/39
(5.50%) 1 month USD-LIBOR
Synthetic MBX Index 5.50% 30 year Fannie Mae pools
(11,672)
2,205,666
—
1/12/39
(5.50%) 1 month USD-LIBOR
Synthetic MBX Index 5.50% 30 year Fannie Mae pools
(11,672)
4,426,954
—
1/12/39
(5.50%) 1 month USD-LIBOR
Synthetic MBX Index 5.50% 30 year Fannie Mae pools
(23,426)
11,497,954
—
1/12/39
(5.50%) 1 month USD-LIBOR
Synthetic MBX Index 5.50% 30 year Fannie Mae pools
(60,843)
4,427,102
—
1/12/39
(5.50%) 1 month USD-LIBOR
Synthetic MBX Index 5.50% 30 year Fannie Mae pools
(23,427)
9,132,120
—
1/12/41
5.00% (1 month USD-LIBOR)
Synthetic TRS Index 5.00% 30 year Ginnie Mae II pools
(18,886)
5,497,733
—
1/12/41
5.00% (1 month USD-LIBOR)
Synthetic TRS Index 5.00% 30 year Ginnie Mae II pools
(11,370)
4,294,908
—
1/12/41
5.00% (1 month USD-LIBOR)
Synthetic MBX Index 5.00% 30 year Fannie Mae pools
21,596
6,972,822
—
1/12/41
5.00% (1 month USD-LIBOR)
Synthetic TRS Index 5.00% 30 year Ginnie Mae II pools
(14,420)
9,289,638
—
1/12/38
(6.50%) 1 month USD-LIBOR
Synthetic MBX Index 6.50% 30 year Fannie Mae pools
(42,416)
9,059,465
—
1/12/38
6.50% (1 month USD-LIBOR)
Synthetic TRS Index 6.50% 30 year Fannie Mae pools
81,815
1,299,880
—
1/12/38
6.50% (1 month USD-LIBOR)
Synthetic TRS Index 6.50% 30 year Fannie Mae pools
11,739
8,838,583
—
1/12/39
(5.50%) 1 month USD-LIBOR
Synthetic MBX Index 5.50% 30 year Fannie Mae pools
(46,770)
Diversified Income Trust 75
OTC TOTAL RETURN SWAP CONTRACTS OUTSTANDING at 3/31/15 (Unaudited) cont.
Swap counterparty/ Notional amount
Upfront premium received (paid)
Termination date
Payments received (paid) by fund per annum
Total return received by or paid by fund
Unrealized appreciation/ (depreciation)
Barclays Bank PLC cont.
$5,219,032
$—
1/12/38
(6.50%) 1 month USD-LIBOR
Synthetic MBX Index 6.50% 30 year Fannie Mae pools
$(23,830)
16,096,611
—
1/12/41
(5.00%) 1 month USD-LIBOR
Synthetic TRS Index 5.00% 30 year Fannie Mae pools
166,630
3,949,754
—
1/12/38
(6.50%) 1 month USD-LIBOR
Synthetic MBX Index 6.50% 30 year Fannie Mae pools
(18,034)
4,490,920
—
1/12/44
3.00% (1 month USD-LIBOR)
Synthetic MBX Index 3.00% 30 year Fannie Mae pools
48,761
39,063,304
—
1/12/43
3.50% (1 month USD-LIBOR)
Synthetic TRS Index 3.50% 30 year Fannie Mae pools
(459,671)
3,418,068
—
1/12/41
5.00% (1 month USD-LIBOR)
Synthetic MBX Index 5.00% 30 year Fannie Mae pools
17,187
28,025,875
—
1/12/41
(4.00%) 1 month USD-LIBOR
Synthetic TRS Index 4.00% 30 year Fannie Mae pools
353,032
Citibank, N.A.
2,604,078
—
1/12/41
5.00% (1 month USD-LIBOR)
Synthetic MBX Index 5.00% 30 year Fannie Mae pools
13,094
15,664,706
—
1/12/41
5.00% (1 month USD-LIBOR)
Synthetic MBX Index 5.00% 30 year Fannie Mae pools
78,766
EUR
134,930,000
—
2/21/19
(1.235%)
Eurostat Eurozone HICP excluding tobacco
(4,364,400)
EUR
70,320,000
—
2/21/24
1.69%
Eurostat Eurozone HICP excluding tobacco
4,965,943
Credit Suisse International
$9,197,626
—
1/12/41
5.00% (1 month USD-LIBOR)
Synthetic MBX Index 5.00% 30 year Fannie Mae pools
46,248
47,639,441
—
1/12/41
4.50% (1 month USD-LIBOR)
Synthetic MBX Index 4.50% 30 year Ginnie Mae II pools
383,379
1,916,172
—
1/12/41
5.00% (1 month USD-LIBOR)
Synthetic MBX Index 5.00% 30 year Fannie Mae pools
9,635
8,869,872
—
1/12/38
(6.50%) 1 month USD-LIBOR
Synthetic MBX Index 6.50% 30 year Fannie Mae pools
(40,499)
76 Diversified Income Trust
OTC TOTAL RETURN SWAP CONTRACTS OUTSTANDING at 3/31/15 (Unaudited) cont.
Swap counterparty/ Notional amount
Upfront premium received (paid)
Termination date
Payments received (paid) by fund per annum
Total return received by or paid by fund
Unrealized appreciation/ (depreciation)
Credit Suisse International cont.
$121,004
$—
1/12/40
5.00% (1 month USD-LIBOR)
Synthetic TRS Index 5.00% 30 year Fannie Mae pools
$(1,215)
386,902
—
1/12/34
5.00% (1 month USD-LIBOR)
Synthetic MBX Index 5.00% 30 year Fannie Mae pools
1,945
478,792
—
1/12/36
5.00% (1 month USD-LIBOR)
Synthetic MBX Index 5.00% 30 year Fannie Mae pools
2,258
381,774
—
1/12/39
5.00% (1 month USD-LIBOR)
Synthetic MBX Index 5.00% 30 year Fannie Mae pools
1,801
2,347,905
—
1/12/42
4.50% (1 month USD-LIBOR)
Synthetic TRS Index 4.50% 30 year Fannie Mae pools
(25,658)
2,347,905
—
1/12/42
4.50% (1 month USD-LIBOR)
Synthetic MBX Index 4.50% 30 year Fannie Mae pools
18,894
4,176,764
—
1/12/43
3.00% (1 month USD-LIBOR)
Synthetic TRS Index 3.00% 30 year Fannie Mae pools
(37,848)
16,215,924
—
1/12/41
5.00% (1 month USD-LIBOR)
Synthetic TRS Index 5.00% 30 year Ginnie Mae II pools
(33,535)
16,470,265
—
1/12/41
(5.00%) 1 month USD-LIBOR
Synthetic TRS Index 5.00% 30 year Fannie Mae pools
170,498
20,201,818
—
1/12/41
(5.00%) 1 month USD-LIBOR
Synthetic TRS Index 5.00% 30 year Fannie Mae pools
209,126
26,736,934
—
1/12/41
5.00% (1 month USD-LIBOR)
Synthetic MBX Index 5.00% 30 year Ginnie Mae II pools
(55,293)
4,490,920
—
1/12/44
3.00% (1 month USD-LIBOR)
Synthetic TRS Index 3.00% 30 year Fannie Mae pools
(41,397)
31,186,158
—
1/12/41
4.00% (1 month USD-LIBOR)
Synthetic TRS Index 4.00% 30 year Fannie Mae pools
(392,841)
36,016,731
—
1/12/41
4.00% (1 month USD-LIBOR)
Synthetic TRS Index 4.00% 30 year Fannie Mae pools
(453,690)
34,383,549
—
1/12/41
4.00% (1 month USD-LIBOR)
Synthetic TRS Index 4.00% 30 year Fannie Mae pools
(433,117)
26,848,675
—
1/12/44
3.50% (1 month USD-LIBOR)
Synthetic TRS Index 3.50% 30 year Fannie Mae pools
(370,467)
Diversified Income Trust 77
OTC TOTAL RETURN SWAP CONTRACTS OUTSTANDING at 3/31/15 (Unaudited) cont.
Swap counterparty/ Notional amount
Upfront premium received (paid)
Termination date
Payments received (paid) by fund per annum
Total return received by or paid by fund
Unrealized appreciation/ (depreciation)
Credit Suisse International cont.
$19,977,754
$—
1/12/44
3.50% (1 month USD-LIBOR)
Synthetic TRS Index 3.50% 30 year Fannie Mae pools
$(275,660)
9,985,364
—
1/12/44
3.50% (1 month USD-LIBOR)
Synthetic TRS Index 3.50% 30 year Fannie Mae pools
(137,781)
57,430,991
—
1/12/44
3.50% (1 month USD-LIBOR)
Synthetic TRS Index 3.50% 30 year Fannie Mae pools
(792,451)
4,592,546
718
1/12/45
4.00% (1 month USD-LIBOR)
Synthetic TRS Index 4.00% 30 year Fannie Mae pools
(82,751)
14,436,566
178,201
1/12/43
3.50% (1 month USD-LIBOR)
Synthetic TRS Index 3.50% 30 year Fannie Mae pools
(10)
28,823,986
481,901
1/12/43
3.50% (1 month USD-LIBOR)
Synthetic TRS Index 3.50% 30 year Fannie Mae pools
109,451
21,119,740
188,098
1/12/43
3.50% (1 month USD-LIBOR)
Synthetic TRS Index 3.50% 30 year Fannie Mae pools
(90,895)
41,947,537
439,138
1/12/43
3.50% (1 month USD-LIBOR)
Synthetic TRS Index 3.50% 30 year Fannie Mae pools
(127,095)
EUR
134,930,000
—
2/20/19
(1.2225%)
Eurostat Eurozone HICP excluding tobacco
(4,293,745)
EUR
70,320,000
—
2/20/24
1.68%
Eurostat Eurozone HICP excluding tobacco
4,927,003
Deutsche Bank AG
$2,945,691
—
1/12/40
4.00% (1 month USD-LIBOR)
Synthetic MBX Index 4.00% 30 year Fannie Mae pools
15,573
8,869,872
—
1/12/38
(6.50%) 1 month USD-LIBOR
Synthetic MBX Index 6.50% 30 year Fannie Mae pools
(40,499)
296,053
—
1/12/34
5.50% (1 month USD-LIBOR)
Synthetic MBX Index 5.50% 30 year Fannie Mae pools
1,474
501,251
—
1/12/36
5.50% (1 month USD-LIBOR)
Synthetic MBX Index 5.50% 30 year Fannie Mae pools
3,043
78 Diversified Income Trust
OTC TOTAL RETURN SWAP CONTRACTS OUTSTANDING at 3/31/15 (Unaudited) cont.
Swap counterparty/ Notional amount
Upfront premium received (paid)
Termination date
Payments received (paid) by fund per annum
Total return received by or paid by fund
Unrealized appreciation/ (depreciation)
Goldman Sachs International
$9,236,527
$—
1/12/39
6.00% (1 month USD-LIBOR)
Synthetic TRS Index 6.00% 30 year Fannie Mae pools
$65,118
2,016,772
—
1/12/41
4.00% (1 month USD-LIBOR)
Synthetic TRS Index 4.00% 30 year Fannie Mae pools
(25,405)
1,772,772
—
1/12/41
4.50% (1 month USD-LIBOR)
Synthetic TRS Index 4.50% 30 year Fannie Mae pools
(20,757)
3,081,541
—
1/12/38
6.50% (1 month USD-LIBOR)
Synthetic TRS Index 6.50% 30 year Fannie Mae pools
27,829
17,206,943
—
1/12/42
4.00% (1 month USD-LIBOR)
Synthetic TRS Index 4.00% 30 year Fannie Mae pools
(219,447)
17,206,943
—
1/12/42
4.00% (1 month USD-LIBOR)
Synthetic TRS Index 4.00% 30 year Fannie Mae pools
(219,447)
4,460,585
—
1/12/38
(6.50%) 1 month USD-LIBOR
Synthetic MBX Index 6.50% 30 year Fannie Mae pools
(20,367)
1,675,741
—
1/12/38
(6.50%) 1 month USD-LIBOR
Synthetic MBX Index 6.50% 30 year Fannie Mae pools
(7,651)
13,311,742
—
1/12/41
4.50% (1 month USD-LIBOR)
Synthetic TRS Index 4.50% 30 year Fannie Mae pools
(155,861)
3,235,896
—
1/12/39
6.00% (1 month USD-LIBOR)
Synthetic TRS Index 6.00% 30 year Fannie Mae pools
22,813
1,108,734
—
1/12/38
(6.50%) 1 month USD-LIBOR
Synthetic MBX Index 6.50% 30 year Fannie Mae pools
(5,062)
11,598,446
—
1/12/40
4.00% (1 month USD-LIBOR)
Synthetic TRS Index 4.00% 30 year Fannie Mae pools
(158,771)
1,030,144
—
1/12/39
6.00% (1 month USD-LIBOR)
Synthetic TRS Index 6.00% 30 year Fannie Mae pools
7,263
6,448,087
—
1/12/39
6.00% (1 month USD-LIBOR)
Synthetic TRS Index 6.00% 30 year Fannie Mae pools
45,459
1,467,441
—
1/12/39
(6.00%) 1 month USD-LIBOR
Synthetic MBX Index 6.00% 30 year Fannie Mae pools
(8,838)
1,921,806
—
1/12/38
6.50% (1 month USD-LIBOR)
Synthetic MBX Index 6.50% 30 year Fannie Mae pools
8,775
Diversified Income Trust 79
OTC TOTAL RETURN SWAP CONTRACTS OUTSTANDING at 3/31/15 (Unaudited) cont.
Swap counterparty/ Notional amount
Upfront premium received (paid)
Termination date
Payments received (paid) by fund per annum
Total return received by or paid by fund
Unrealized appreciation/ (depreciation)
Goldman Sachs International cont.
$2,936,299
$—
1/12/40
(5.00%) 1 month USD-LIBOR
Synthetic MBX Index 5.00% 30 year Fannie Mae pools
$(13,847)
1,295,665
—
1/12/39
5.50% (1 month USD-LIBOR)
Synthetic MBX Index 5.50% 30 year Fannie Mae pools
6,856
2,478,589
—
1/12/40
(4.50%) 1 month USD-LIBOR
Synthetic MBX Index 4.50% 30 year Fannie Mae pools
(19,949)
17,915,392
—
1/12/41
4.00% (1 month USD-LIBOR)
Synthetic TRS Index 4.00% 30 year Fannie Mae pools
(225,674)
3,321,028
—
1/12/38
(6.50%) 1 month USD-LIBOR
Synthetic MBX Index 6.50% 30 year Fannie Mae pools
(15,164)
6,110,528
—
1/12/38
(6.50%) 1 month USD-LIBOR
Synthetic MBX Index 6.50% 30 year Fannie Mae pools
(27,900)
359,165
—
1/12/41
5.00% (1 month USD-LIBOR)
Synthetic TRS Index 5.00% 30 year Ginnie Mae II pools
(743)
510,286
—
1/12/41
(4.00%) 1 month USD-LIBOR
Synthetic TRS Index 4.00% 30 year Ginnie Mae II pools
5,470
3,985,381
—
1/12/38
(6.50%) 1 month USD-LIBOR
Synthetic MBX Index 6.50% 30 year Fannie Mae pools
(18,197)
2,060,249
—
1/12/38
6.50% (1 month USD-LIBOR)
Synthetic TRS Index 6.50% 30 year Fannie Mae pools
18,606
304,311
—
1/12/38
(6.50%) 1 month USD-LIBOR
Synthetic MBX Index 6.50% 30 year Fannie Mae pools
(1,389)
811,815
—
1/12/38
(6.50%) 1 month USD-LIBOR
Synthetic MBX Index 6.50% 30 year Fannie Mae pools
(3,707)
277,257
—
1/12/38
(6.50%) 1 month USD-LIBOR
Synthetic MBX Index 6.50% 30 year Fannie Mae pools
(1,266)
11,806
—
1/12/38
6.50% (1 month USD-LIBOR)
Synthetic TRS Index 6.50% 30 year Fannie Mae pools
107
3,999,203
—
1/12/38
6.50% (1 month USD-LIBOR)
Synthetic TRS Index 6.50% 30 year Fannie Mae pools
36,116
18,744,773
—
1/12/42
4.00% (1 month USD-LIBOR)
Synthetic TRS Index 4.00% 30 year Fannie Mae pools
(239,059)
80 Diversified Income Trust
OTC TOTAL RETURN SWAP CONTRACTS OUTSTANDING at 3/31/15 (Unaudited) cont.
Swap counterparty/ Notional amount
Upfront premium received (paid)
Termination date
Payments received (paid) by fund per annum
Total return received by or paid by fund
Unrealized appreciation/ (depreciation)
Goldman Sachs International cont.
$2,291,384
$—
1/12/38
(6.50%) 1 month USD-LIBOR
Synthetic MBX Index 6.50% 30 year Fannie Mae pools
$(10,462)
4,192,292
—
1/12/39
6.00% (1 month USD-LIBOR)
Synthetic TRS Index 6.00% 30 year Fannie Mae pools
29,556
24,424,549
—
1/12/42
4.00% (1 month USD-LIBOR)
Synthetic TRS Index 4.00% 30 year Fannie Mae pools
(311,496)
16,759,782
—
1/12/41
4.00% (1 month USD-LIBOR)
Synthetic TRS Index 4.00% 30 year Fannie Mae pools
(211,117)
11,840,067
—
1/12/41
4.00% (1 month USD-LIBOR)
Synthetic TRS Index 4.00% 30 year Fannie Mae pools
(149,145)
39,830,447
—
1/12/41
4.00% (1 month USD-LIBOR)
Synthetic TRS Index 4.00% 30 year Fannie Mae pools
(501,729)
39,153,526
—
1/12/41
(5.00%) 1 month USD-LIBOR
Synthetic TRS Index 5.00% 30 year Fannie Mae pools
405,311
44,936,664
—
1/12/43
3.50% (1 month USD-LIBOR)
Synthetic TRS Index 3.50% 30 year Fannie Mae pools
(528,784)
67,555,000
—
2/24/25
(2.01%)
USA Non Revised Consumer Price Index- Urban (CPI-U)
(910,640)
34,853,478
—
1/12/44
3.50% (1 month USD-LIBOR)
Synthetic TRS Index 3.50% 30 year Fannie Mae pools
(480,920)
15,140,970
—
1/12/44
3.50% (1 month USD-LIBOR)
Synthetic TRS Index 3.50% 30 year Fannie Mae pools
(208,920)
20,183,275
—
1/12/44
3.50% (1 month USD-LIBOR)
Synthetic TRS Index 3.50% 30 year Fannie Mae pools
(278,496)
15,539,000
—
3/12/25
(1.925%)
USA Non Revised Consumer Price Index-Urban (CPI-U)
(3,108)
EUR
161,272,000
—
3/12/20
(0.9625%)
Eurostat Eurozone HICP excluding tobacco
(22,543)
EUR
44,983,000
—
3/12/25
1.3175%
Eurostat Eurozone HICP excluding tobacco
115,599
Diversified Income Trust 81
OTC TOTAL RETURN SWAP CONTRACTS OUTSTANDING at 3/31/15 (Unaudited) cont.
Swap counterparty/ Notional amount
Upfront premium received (paid)
Termination date
Payments received (paid) by fund per annum
Total return received by or paid by fund
Unrealized appreciation/ (depreciation)
Goldman Sachs International cont.
GBP
39,125,000
$—
2/20/25
(2.895%)
GBP Non-revised UK Retail Price Index
$145,211
GBP
8,993,000
—
3/10/25
(2.8675%)
GBP Non-revised UK Retail Price Index
(79,174)
JPMorgan Chase Bank N.A.
$26,533,060
—
1/12/41
4.00% (1 month USD-LIBOR)
Synthetic TRS Index 4.00% 30 year Fannie Mae pools
(334,227)
50,873,083
—
1/12/41
4.00% (1 month USD-LIBOR)
Synthetic TRS Index 4.00% 30 year Fannie Mae pools
(640,829)
39,830,851
—
1/12/41
4.00% (1 month USD-LIBOR)
Synthetic TRS Index 4.00% 30 year Fannie Mae pools
(501,734)
39,153,526
—
1/12/41
(5.00%) 1 month USD-LIBOR
Synthetic TRS Index 5.00% 30 year Fannie Mae pools
405,311
Total
$1,288,056
$(5,646,538)
OTC CREDIT DEFAULT CONTRACTS OUTSTANDING at 3/31/15 (Unaudited)
Swap counterparty/ Referenced debt*
Rating***
Upfront premium received (paid)**
Notional amount
Termi- nation date
Payments received (paid) by fund per annum
Unrealized appreciation/ (depreciation)
Bank of America N.A.
CMBX NA BBB– Index
BBB–/P
$155,838
$2,734,000
5/11/63
300 bp
$185,593
CMBX NA BBB– Index
BBB–/P
163,473
2,648,000
5/11/63
300 bp
192,292
CMBX NA BBB– Index
BBB–/P
79,608
1,321,000
5/11/63
300 bp
93,985
CMBX NA BBB– Index
BBB–/P
39,713
581,000
5/11/63
300 bp
46,036
Barclays Bank PLC
CMBX NA BBB– Index
BBB–/P
411,736
3,714,000
5/11/63
300 bp
452,157
EM Series 23 Index
BBB/P
97,200
1,000,000
6/20/20
100 bp
(4,006)
EM Series 23 Index
BBB/P
1,167,250
11,500,000
6/20/20
100 bp
1,150
Credit Suisse International
CMBX NA BBB– Index
BBB–/P
(41,612)
9,766,000
5/11/63
300 bp
64,674
CMBX NA BBB– Index
BBB–/P
(4,134)
6,317,000
5/11/63
300 bp
64,616
CMBX NA BBB– Index
BBB–/P
254,058
6,191,000
5/11/63
300 bp
321,438
82 Diversified Income Trust
OTC CREDIT DEFAULT CONTRACTS OUTSTANDING at 3/31/15 (Unaudited) cont.
Swap counterparty/ Referenced debt*
Rating***
Upfront premium received (paid)**
Notional amount
Termi- nation date
Payments received (paid) by fund per annum
Unrealized appreciation/ (depreciation)
Credit Suisse International cont.
CMBX NA BBB– Index
BBB–/P
$10,839
$3,317,000
5/11/63
300 bp
$46,939
CMBX NA BBB– Index
BBB–/P
7,592
3,317,000
5/11/63
300 bp
43,692
CMBX NA BBB– Index
BBB–/P
98,311
3,231,000
5/11/63
300 bp
133,475
CMBX NA BBB– Index
BBB–/P
249,546
3,223,000
5/11/63
300 bp
284,623
CMBX NA BBB– Index
BBB–/P
211,953
3,222,000
5/11/63
300 bp
247,020
CMBX NA BBB– Index
BBB–/P
361,220
3,197,000
5/11/63
300 bp
396,015
CMBX NA BBB– Index
BBB–/P
254,058
3,184,000
5/11/63
300 bp
288,710
CMBX NA BBB– Index
BBB–/P
47,813
3,112,000
5/11/63
300 bp
81,682
CMBX NA BBB– Index
BBB–/P
32,415
2,792,000
5/11/63
300 bp
62,801
CMBX NA BBB– Index
BBB–/P
199,232
2,735,000
5/11/63
300 bp
228,998
CMBX NA BBB– Index
BBB–/P
202,017
2,538,000
5/11/63
300 bp
229,639
CMBX NA BBB– Index
BBB–/P
5,303
2,313,000
5/11/63
300 bp
30,476
CMBX NA BBB– Index
BBB–/P
4,148
910,000
5/11/63
300 bp
14,052
CMBX NA BBB– Index
BBB–/P
53,187
694,000
5/11/63
300 bp
60,740
CMBX NA BBB– Index
BBB–/P
187
144,000
5/11/63
300 bp
1,754
CMBX NA BBB– Index
BBB–/P
380
65,000
5/11/63
300 bp
1,087
CMBX NA BBB– Index
—
37,993
3,467,000
5/11/63
(300 bp)
260
CMBX NA BBB– Index
BBB–/P
11,852
1,111,000
1/17/47
300 bp
3,390
CMBX NA BBB– Index
BBB–/P
34,342
4,388,000
1/17/47
300 bp
(909)
CMBX NA BBB– Index
BBB–/P
31,232
4,388,000
1/17/47
300 bp
(4,018)
CMBX NA BBB– Index
BBB–/P
28,246
6,602,000
1/17/47
300 bp
(22,039)
CMBX NA BB Index
—
(18,808)
2,062,000
5/11/63
(500 bp)
(51,331)
CMBX NA BB Index
—
(16,309)
2,124,000
5/11/63
(500 bp)
(49,809)
CMBX NA BB Index
—
(20,347)
2,124,000
5/11/63
(500 bp)
(53,848)
Diversified Income Trust 83
OTC CREDIT DEFAULT CONTRACTS OUTSTANDING at 3/31/15 (Unaudited) cont.
Swap counterparty/ Referenced debt*
Rating***
Upfront premium received (paid)**
Notional amount
Termi- nation date
Payments received (paid) by fund per annum
Unrealized appreciation/ (depreciation)
Credit Suisse International cont.
CMBX NA BB Index
—
$45,373
$2,269,000
5/11/63
(500 bp)
$9,586
CMBX NA BB Index
—
15,834
2,920,000
5/11/63
(500 bp)
(30,221)
CMBX NA BB Index
—
(12,807)
3,516,000
5/11/63
(500 bp)
(68,262)
CMBX NA BB Index
—
(62,472)
3,577,000
5/11/63
(500 bp)
(118,889)
CMBX NA BB Index
—
117,458
4,448,000
5/11/63
(500 bp)
47,303
CMBX NA BB Index
—
70,182
4,538,000
5/11/63
(500 bp)
(1,392)
CMBX NA BB Index
—
47,646
4,609,000
5/11/63
(500 bp)
(25,048)
CMBX NA BB Index
—
(32,354)
6,193,000
5/11/63
(500 bp)
(130,032)
CMBX NA BB Index
—
(70,192)
3,619,000
5/11/63
(500 bp)
(127,272)
CMBX NA BBB– Index
BBB–/P
379,120
15,496,000
5/11/63
300 bp
547,768
CMBX NA BBB– Index
BBB–/P
(149,916)
9,943,000
5/11/63
300 bp
(41,703)
CMBX NA BBB–Index
BBB–/P
(122,400)
9,933,000
5/11/63
300 bp
(14,295)
CMBX NA BBB– Index
BBB–/P
13,053
9,833,000
5/11/63
300 bp
120,069
CMBX NA BBB– Index
BBB–/P
(180,631)
9,330,000
5/11/63
300 bp
(79,089)
CMBX NA BBB– Index
BBB–/P
165,144
8,748,000
5/11/63
300 bp
260,352
CMBX NA BBB– Index
BBB–/P
189,437
8,748,000
5/11/63
300 bp
284,645
CMBX NA BBB– Index
BBB–/P
31,871
6,882,000
5/11/63
300 bp
106,770
CMBX NA BBB– Index
BBB–/P
(68,197)
6,789,000
5/11/63
300 bp
5,690
CMBX NA BBB– Index
BBB–/P
25,488
5,501,000
5/11/63
300 bp
85,357
CMBX NA BBB– Index
BBB–/P
3,103
4,661,000
5/11/63
300 bp
53,830
CMBX NA BBB– Index
BBB–/P
(42,822)
4,574,000
5/11/63
300 bp
6,959
CMBX NA BBB– Index
BBB–/P
(82,613)
4,573,000
5/11/63
300 bp
(32,844)
CMBX NA BBB– Index
BBB–/P
27,592
4,546,000
5/11/63
300 bp
77,068
CMBX NA BBB– Index
BBB–/P
(45,511)
4,543,000
5/11/63
300 bp
3,932
CMBX NA BBB– Index
BBB–/P
53,934
4,526,000
5/11/63
300 bp
103,192
CMBX NA BBB– Index
BBB–/P
44,995
4,526,000
5/11/63
300 bp
94,253
CMBX NA BBB– Index
BBB–/P
(15,070)
4,518,000
5/11/63
300 bp
34,101
84 Diversified Income Trust
OTC CREDIT DEFAULT CONTRACTS OUTSTANDING at 3/31/15 (Unaudited) cont.
Swap counterparty/ Referenced debt*
Rating***
Upfront premium received (paid)**
Notional amount
Termi- nation date
Payments received (paid) by fund per annum
Unrealized appreciation/ (depreciation)
Credit Suisse International cont.
CMBX NA BBB– Index
BBB–/P
$(15,079)
$4,511,000
5/11/63
300 bp
$34,016
CMBX NA BBB– Index
BBB–/P
(37,666)
4,501,000
5/11/63
300 bp
11,320
CMBX NA BBB– Index
BBB–/P
12,026
4,458,000
5/11/63
300 bp
60,544
CMBX NA BBB– Index
BBB–/P
3,088
4,449,000
5/11/63
300 bp
51,508
CMBX NA BBB– Index
BBB–/P
15,409
4,449,000
5/11/63
300 bp
63,829
CMBX NA BBB– Index
BBB–/P
149,128
3,116,000
5/11/63
300 bp
183,040
CMBX NA BBB– Index
BBB–/P
(23,586)
2,473,000
5/11/63
300 bp
3,328
CMBX NA BBB– Index
BBB–/P
(13,592)
2,255,000
5/11/63
300 bp
10,950
CMBX NA BBB– Index
BBB–/P
166,893
1,918,000
5/11/63
300 bp
187,767
CMBX NA BBB– Index
BBB–/P
122,967
1,424,000
5/11/63
300 bp
138,464
CMBX NA BBB– Index
BBB–/P
(3,788)
1,119,000
5/11/63
300 bp
8,391
CMBX NA BBB– Index
BBB–/P
9,994
420,000
5/11/63
300 bp
14,565
Goldman Sachs International
CMBX NA BBB– Index
BBB–/P
(38,115)
5,511,000
5/11/63
300 bp
21,863
CMBX NA BBB– Index
BBB–/P
2,373
910,000
5/11/63
300 bp
12,277
CMBX NA BBB– Index
BBB–/P
(616)
135,000
5/11/63
300 bp
853
CMBX NA BBB– Index
BBB–/P
28,746
1,066,000
1/17/47
300 bp
20,626
CMBX NA BBB– Index
BBB–/P
15,954
1,602,000
1/17/47
300 bp
3,752
CMBX NA BB Index
—
13,643
1,331,000
5/11/63
(500 bp)
(7,350)
CMBX NA BB Index
—
1,994
1,642,000
5/11/63
(500 bp)
(23,904)
CMBX NA BB Index
—
(19,697)
2,051,000
5/11/63
(500 bp)
(52,046)
CMBX NA BB Index
—
51,305
2,269,000
5/11/63
(500 bp)
15,518
CMBX NA BB Index
—
(47,676)
4,496,000
5/11/63
(500 bp)
(118,588)
CMBX NA BBB– Index
BBB–/P
27,342
4,583,000
5/11/63
300 bp
77,220
CMBX NA BBB– Index
BBB–/P
(76,199)
4,573,000
5/11/63
300 bp
(26,429)
Diversified Income Trust 85
OTC CREDIT DEFAULT CONTRACTS OUTSTANDING at 3/31/15 (Unaudited) cont.
Swap counterparty/ Referenced debt*
Rating***
Upfront premium received (paid)**
Notional amount
Termi- nation date
Payments received (paid) by fund per annum
Unrealized appreciation/ (depreciation)
Goldman Sachs International cont.
CMBX NA BBB– Index
BBB–/P
$(42,500)
$4,542,000
5/11/63
300 bp
$6,933
CMBX NA BBB– Index
BBB–/P
(45,552)
4,542,000
5/11/63
300 bp
3,880
CMBX NA BBB– Index
BBB–/P
(45,552)
4,542,000
5/11/63
300 bp
3,880
CMBX NA BBB– Index
BBB–/P
(18,102)
4,511,000
5/11/63
300 bp
30,993
CMBX NA BBB– Index
BBB–/P
(36,152)
4,501,000
5/11/63
300 bp
12,834
CMBX NA BBB– Index
BBB–/P
49,691
4,350,000
5/11/63
300 bp
97,034
CMBX NA BBB– Index
BBB–/P
(26,976)
2,473,000
5/11/63
300 bp
(62)
CMBX NA BBB– Index
BBB–/P
(398)
149,000
5/11/63
300 bp
1,223
Total
$4,674,084
$5,411,391
*Payments related to the referenced debt are made upon a credit default event.
**Upfront premium is based on the difference between the original spread on issue and the market spread on day of execution.
***Ratings are presented for credit default contracts in which the fund has sold protection on the underlying referenced debt. Ratings for an underlying index represent the average of the ratings of all the securities included in that index. The Moody’s, Standard & Poor’s or Fitch ratings are believed to be the most recent ratings available at March 31, 2015. Securities rated by Putnam are indicated by “/P.”
86 Diversified Income Trust
ASC 820 establishes a three-level hierarchy for disclosure of fair value measurements. The valuation hierarchy is based upon the transparency of inputs to the valuation of the fund’s investments. The three levels are defined as follows:
Level 1: Valuations based on quoted prices for identical securities in active markets.
Level 2: Valuations based on quoted prices in markets that are not active or for which all significant inputs are observable, either directly or indirectly.
Level 3: Valuations based on inputs that are unobservable and significant to the fair value measurement.
The following is a summary of the inputs used to value the fund’s net assets as of the close of the reporting period:
Valuation inputs
Investments in securities:
Level 1
Level 2
Level 3
Convertible bonds and notes
$—
$1,077,781
$—
Corporate bonds and notes
—
2,060,053,613
51
Foreign government and agency bonds and notes
—
539,579,316
—
Mortgage-backed securities
—
2,543,761,369
64,469,748
Purchased options outstanding
—
3,569,032
—
Purchased swap options outstanding
—
69,260,758
—
Senior loans
—
145,273,239
—
U.S. government and agency mortgage obligations
—
3,226,035,779
—
U.S. treasury obligations
—
4,232,172
—
Short-term investments
399,722,329
272,064,700
—
Totals by level
$399,722,329
$8,864,907,759
$64,469,799
Valuation inputs
Other financial instruments:
Level 1
Level 2
Level 3
Forward currency contracts
$—
$35,989,042
$—
Futures contracts
(4,066,426)
—
—
Written options outstanding
—
(1,763,956)
—
Written swap options outstanding
—
(73,517,135)
—
Forward premium swap option contracts
—
(136,711)
—
TBA sale commitments
—
(881,403,762)
—
Interest rate swap contracts
—
(149,761,794)
—
Total return swap contracts
—
(6,934,594)
—
Credit default contracts
—
737,307
—
Totals by level
$(4,066,426)
$(1,076,791,603)
$—
Diversified Income Trust 87
The following is a reconciliation of Level 3 assets as of the close of the reporting period:
Investments in securities:
Balance as of Sept. 30, 2014
Accrued discounts/ premiums
Realized gain/(loss)
Change in net unrealized appreciation/ (deprecia- tion) #
Purchases
Sales
Net transfers in and/or out of Level 3 †
Balance as of March 31, 2015
Corporate bonds and notes
$—
$—
$—
$50
$1
$—
$—
$51
Mortgage-backed securities
—
—
—
—
—
—
64,469,748
64,469,748
Totals
$—
$—
$—
$50
$1
$—
$64,469,748
$64,469,799
†Transfers during the reporting period are accounted for using the end of period market value and include valuations provided by a single broker quote. Such valuations involve certain inputs and estimates that were unobservable at the end of the reporting period.
#Includes $50 related to Level 3 securities still held at period end. Total change in unrealized appreciation/(depreciation) for securities (including Level 1 and Level 2) can be found in the Statement of operations.
During the reporting period, transfers between level 1 and level 2 within the fair value hierarchy, if any, did not represent, in the aggregate, more than 1% of the fund’s net assets measured as of the end of the period.
Level 3 securities, which are fair valued, are not material to the fund.
The accompanying notes are an integral part of these financial statements.
88 Diversified Income Trust
Statement of assets and liabilities 3/31/15 (Unaudited)
Receivable for sales of delayed delivery securities (Note 1)
579,517,144
Receivable for variation margin (Note 1)
87,199,734
Unrealized appreciation on forward premium swap option contracts (Note 1)
2,317,431
Unrealized appreciation on forward currency contracts (Note 1)
62,696,049
Unrealized appreciation on OTC swap contracts (Note 1)
33,578,311
Premium paid on OTC swap contracts (Note 1)
1,477,441
Prepaid assets
168,834
Total assets
10,328,813,623
LIABILITIES
Payable for investments purchased
44,546,206
Payable for purchases of delayed delivery securities (Note 1)
2,983,268,953
Payable for shares of the fund repurchased
12,349,075
Payable for compensation of Manager (Note 2)
2,808,632
Payable for custodian fees (Note 2)
102,525
Payable for investor servicing fees (Note 2)
1,446,312
Payable for Trustee compensation and expenses (Note 2)
835,647
Payable for administrative services (Note 2)
20,909
Payable for distribution fees (Note 2)
2,411,532
Payable for variation margin (Note 1)
98,792,172
Unrealized depreciation on OTC swap contracts (Note 1)
51,439,837
Premium received on OTC swap contracts (Note 1)
7,439,581
Unrealized depreciation on forward currency contracts (Note 1)
26,707,007
Unrealized depreciation on forward premium swap option contracts (Note 1)
2,454,142
Written options outstanding, at value (premiums $104,992,032) (Notes 1 and 3)
75,281,091
TBA sale commitments, at value (proceeds receivable $878,005,566) (Note 1)
881,403,762
Collateral on certain derivative contracts, at value (Note 1)
50,580,172
Other accrued expenses
393,641
Total liabilities
4,242,281,196
Net assets
$6,086,532,427
(Continued on next page)
Diversified Income Trust 89
Statement of assets and liabilities (Continued)
REPRESENTED BY
Paid-in capital (Unlimited shares authorized) (Notes 1 and 4)
$6,968,084,664
Undistributed net investment income (Note 1)
29,691,763
Accumulated net realized loss on investments and foreign currency transactions (Note 1)
(788,512,717)
Net unrealized depreciation of investments and assets and liabilities in foreign currencies
(122,731,283)
Total — Representing net assets applicable to capital shares outstanding
$6,086,532,427
COMPUTATION OF NET ASSET VALUE AND OFFERING PRICE
Net asset value and redemption price per class A share ($2,124,939,657 divided by 282,922,870 shares)
$7.51
Offering price per class A share (100/96.00 of $7.51)*
$7.82
Net asset value and offering price per class B share ($76,846,162 divided by 10,329,150 shares)**
$7.44
Net asset value and offering price per class C share ($1,068,886,549 divided by 144,639,718 shares)**
$7.39
Net asset value and redemption price per class M share ($190,248,725 divided by 25,726,763 shares)
$7.39
Offering price per class M share (100/96.75 of $7.39)†
$7.64
Net asset value, offering price and redemption price per class R share ($6,355,771 divided by 855,356 shares)
$7.43
Net asset value, offering price and redemption price per class R5 share ($10,321 divided by 1,386 shares) ‡
$7.44
Net asset value, offering price and redemption price per class R6 share ($11,514,037 divided by 1,545,885 shares)
$7.45
Net asset value, offering price and redemption price per class Y share ($2,607,731,205 divided by 350,480,483 shares)
$7.44
*
On single retail sales of less than $100,000. On sales of $100,000 or more the offering price is reduced.
**
Redemption price per share is equal to net asset value less any applicable contingent deferred sales charge.
†
On single retail sales of less than $50,000. On sales of $50,000 or more the offering price is reduced.
‡
Net asset value may not recalculate due to the rounding of fractional shares.
The accompanying notes are an integral part of these financial statements.
90 Diversified Income Trust
Statement of operations Six months ended 3/31/15 (Unaudited)
INVESTMENT INCOME
Interest (net of foreign tax of $3,414) (including interest income of $131,091 from investments in affiliated issuers) (Note 5)
$167,152,209
EXPENSES
Compensation of Manager (Note 2)
17,269,883
Investor servicing fees (Note 2)
4,247,593
Custodian fees (Note 2)
163,230
Trustee compensation and expenses (Note 2)
46,466
Distribution fees (Note 2)
9,164,635
Administrative services (Note 2)
97,127
Other
874,481
Total expenses
31,863,415
Expense reduction (Note 2)
(6,987)
Net expenses
31,856,428
Net investment income
135,295,781
Net realized gain on investments (Notes 1 and 3)
84,926,690
Net realized loss on swap contracts (Note 1)
(135,365,947)
Net realized loss on futures contracts (Note 1)
(51,975,631)
Net realized gain on foreign currency transactions (Note 1)
140,825,993
Net realized loss on written options (Notes 1 and 3)
(45,329,742)
Net unrealized depreciation of assets and liabilities in foreign currencies during the period
(23,571,793)
Net unrealized depreciation of investments, futures contracts, swap contracts, written options and TBA sale commitments during the period
(298,959,186)
Net loss on investments
(329,449,616)
Net decrease in net assets resulting from operations
$(194,153,835)
The accompanying notes are an integral part of these financial statements.
Diversified Income Trust 91
Statement of changes in net assets
INCREASE (DECREASE) IN NET ASSETS
Six months ended 3/31/15*
Year ended 9/30/14
Operations:
Net investment income
$135,295,781
$271,640,044
Net realized loss on investments and foreign currency transactions
(6,918,637)
(68,194,365)
Net unrealized appreciation (depreciation) of investments and assets and liabilities in foreign currencies
(322,530,979)
180,325,201
Net increase (decrease) in net assets resulting from operations
(194,153,835)
383,770,880
Distributions to shareholders (Note 1):
From ordinary income
Net investment income
Class A
(48,260,037)
(140,468,296)
Class B
(1,415,557)
(3,804,742)
Class C
(19,564,972)
(42,697,402)
Class M
(4,084,377)
(11,649,991)
Class R
(130,027)
(278,747)
Class R5
(237)
(531)
Class R6
(286,628)
(569,250)
Class Y
(63,958,079)
(106,292,326)
Increase (decrease) from capital share transactions (Note 4)
(547,751,145)
2,292,208,675
Total increase (decrease) in net assets
(879,604,894)
2,370,218,270
NET ASSETS
Beginning of period
6,966,137,321
4,595,919,051
End of period (including undistributed net investment income of $29,691,763 and $32,095,896, respectively)
$6,086,532,427
$6,966,137,321
*
Unaudited.
The accompanying notes are an integral part of these financial statements.
92 Diversified Income Trust
This page left blank intentionally.
Diversified Income Trust 93
Financial highlights (For a common share outstanding throughout the period)
INVESTMENT OPERATIONS:
LESS DISTRIBUTIONS:
RATIOS AND SUPPLEMENTAL DATA:
Period ended
Net asset value, beginning of period
Net investment income (loss)a
Net realized and unrealized gain (loss) on investments
Total from investment operations
From net investment income
From return of capital
Total distributions
Redemption fees
Non-recurring reimbursements
Net asset value, end of period
Total return at net asset value (%)b
Net assets, end of period (in thousands)
Ratio of expenses to average net assets (%)c
Ratio of net investment income (loss) to average net assets (%)
Portfolio turnover (%)
Class A
March 31, 2015**
$7.89
.16
(.38)
(.22)
(.16)
—
(.16)
—
—
$7.51
(2.76) *
$2,124,940
.48*
2.11*
289*d
September 30, 2014
7.74
.37
.20
.57
(.42)
—
(.42)
—
—
7.89
7.49
2,454,923
.97
4.73
257d
September 30, 2013
7.59
.44
.15
.59
(.44)
—
(.44)
—
—
7.74
7.93
2,286,977
.99
5.58
180e
September 30, 2012
7.35
.42
.27
.69
(.15)
(.30)
(.45)
—
—
7.59
9.58
1,788,786
.99
5.67
120e
September 30, 2011
8.08
.45
(.58)
(.13)
(.60)
—
(.60)
—
—f,g
7.35
(2.04)
2,162,131
.98
5.57
165e
September 30, 2010
7.89
.72
.63
1.35
(1.16)
—
(1.16)
—f
—
8.08
18.39
2,328,480
1.01h
8.96
95e
Class B
March 31, 2015**
$7.81
.13
(.37)
(.24)
(.13)
—
(.13)
—
—
$7.44
(3.02) *
$76,846
.85*
1.73*
289*d
September 30, 2014
7.67
.31
.19
.50
(.36)
—
(.36)
—
—
7.81
6.60
83,980
1.72
3.97
257d
September 30, 2013
7.53
.38
.14
.52
(.38)
—
(.38)
—
—
7.67
7.03
79,540
1.74
4.85
180e
September 30, 2012
7.29
.37
.26
.63
(.13)
(.26)
(.39)
—
—
7.53
8.82
75,534
1.74
4.92
120e
September 30, 2011
8.01
.39
(.57)
(.18)
(.54)
—
(.54)
—
—f,g
7.29
(2.69)
81,208
1.73
4.88
165e
September 30, 2010
7.83
.66
.62
1.28
(1.10)
—
(1.10)
—f
—
8.01
17.50
96,346
1.76h
8.36
95e
Class C
March 31, 2015**
$7.76
.13
(.36)
(.23)
(.14)
—
(.14)
—
—
$7.39
(3.03) *
$1,068,887
.85*
1.74*
289*d
September 30, 2014
7.62
.31
.19
.50
(.36)
—
(.36)
—
—
7.76
6.65
1,106,389
1.72
3.95
257d
September 30, 2013
7.48
.37
.16
.53
(.39)
—
(.39)
—
—
7.62
7.09
749,897
1.74
4.84
180e
September 30, 2012
7.25
.36
.26
.62
(.13)
(.26)
(.39)
—
—
7.48
8.73
644,638
1.74
4.93
120e
September 30, 2011
7.97
.38
(.56)
(.18)
(.54)
—
(.54)
—
—f,g
7.25
(2.68)
776,778
1.73
4.82
165e
September 30, 2010
7.80
.64
.63
1.27
(1.10)
—
(1.10)
—f
—
7.97
17.47
797,345
1.76h
8.10
95e
Class M
March 31, 2015**
$7.77
.15
(.38)
(.23)
(.15)
—
(.15)
—
—
$7.39
(2.92) *
$190,249
.60*
1.96*
289*d
September 30, 2014
7.62
.35
.20
.55
(.40)
—
(.40)
—
—
7.77
7.30
216,512
1.22
4.46
257d
September 30, 2013
7.48
.41
.15
.56
(.42)
—
(.42)
—
—
7.62
7.60
233,513
1.24
5.35
180e
September 30, 2012
7.25
.40
.25
.65
(.14)
(.28)
(.42)
—
—
7.48
9.29
260,630
1.24
5.43
120e
September 30, 2011
7.97
.43
(.57)
(.14)
(.58)
—
(.58)
—
—f,g
7.25
(2.22)
312,812
1.23
5.44
165e
September 30, 2010
7.79
.70
.62
1.32
(1.14)
—
(1.14)
—f
—
7.97
18.13
436,826
1.26h
8.92
95e
Class R
March 31, 2015**
$7.80
.15
(.37)
(.22)
(.15)
—
(.15)
—
—
$7.43
(2.80) *
$6,356
.60*
1.99*
289*d
September 30, 2014
7.66
.35
.19
.54
(.40)
—
(.40)
—
—
7.80
7.16
6,444
1.22
4.45
257d
September 30, 2013
7.52
.41
.15
.56
(.42)
—
(.42)
—
—
7.66
7.55
4,611
1.24
5.35
180e
September 30, 2012
7.28
.40
.26
.66
(.14)
(.28)
(.42)
—
—
7.52
9.38
4,307
1.24
5.44
120e
September 30, 2011
8.00
.43
(.57)
(.14)
(.58)
—
(.58)
—
—f,g
7.28
(2.21)
4,315
1.23
5.34
165e
September 30, 2010
7.82
.70
.62
1.32
(1.14)
—
(1.14)
—f
—
8.00
18.08
4,185
1.26h
8.82
95e
Class R5
March 31, 2015**
$7.82
.17
(.38)
(.21)
(.17)
—
(.17)
—
—
$7.44
(2.65) *
$10
.35*
2.26*
289*d
September 30, 2014†
7.77
.36
.09
.45
(.40)
—
(.40)
—
—
7.82
5.95*
11
.65*
4.57*
257d
Class R6
March 31, 2015**
$7.82
.17
(.37)
(.20)
(.17)
—
(.17)
—
—
$7.45
(2.50) *
$11,514
.31*
2.29*
289*d
September 30, 2014†
7.77
.36
.10
.46
(.41)
—
(.41)
—
—
7.82
5.97*
13,592
.59*
4.52*
257d
94
Diversified Income Trust
Diversified Income Trust
95
Financial highlights (Continued)
INVESTMENT OPERATIONS:
LESS DISTRIBUTIONS:
RATIOS AND SUPPLEMENTAL DATA:
Period ended
Net asset value, beginning of period
Net investment income (loss)a
Net realized and unrealized gain (loss) on investments
Total from investment operations
From net investment income
From return of capital
Total distributions
Redemption fees
Non-recurring reimbursements
Net asset value, end of period
Total return at net asset value (%)b
Net assets, end of period (in thousands)
Ratio of expenses to average net assets (%)c
Ratio of net investment income (loss) to average net assets (%)
Portfolio turnover (%)
Class Y
March 31, 2015**
$7.82
.17
(.38)
(.21)
(.17)
—
(.17)
—
—
$7.44
(2.65) *
$2,607,731
.35*
2.26*
289*d
September 30, 2014
7.68
.39
.19
.58
(.44)
—
(.44)
—
—
7.82
7.74
3,084,286
.72
4.93
257d
September 30, 2013
7.54
.45
.16
.61
(.47)
—
(.47)
—
—
7.68
8.18
1,241,380
.74
5.79
180e
September 30, 2012
7.30
.44
.27
.71
(.16)
(.31)
(.47)
—
—
7.54
9.98
547,313
.74
5.92
120e
September 30, 2011
8.04
.46
(.58)
(.12)
(.62)
—
(.62)
—
—f,g
7.30
(1.89)
814,084
.73
5.79
165e
September 30, 2010
7.85
.73
.64
1.37
(1.18)
—
(1.18)
—f
—
8.04
18.84
991,846
.76h
9.18
95e
* Not annualized.
† For the period November 1, 2013 (commencement of operations) to September 30, 2014.
** Unaudited.
a Per share net investment income (loss) has been determined on the basis of the weighted average number of shares outstanding during the period.
b Total return assumes dividend reinvestment and does not reflect the effect of sales charges.
c Includes amounts paid through expense offset and/or brokerage/service arrangements, if any (Note 2). Also excludes acquired fund fees and expenses, if any.
d Portfolio turnover includes TBA purchase and sale commitments.
e Portfolio turnover excludes TBA purchase and sale commitments. Including TBA purchase and sale commitments to conform with current year presentation, the portfolio turnover would have been the following:
Portfolio turnover %
September 30, 2013
466%
September 30, 2012
225
September 30, 2011
370
September 30, 2010
186
f Amount represents less than $0.01 per share.
g Reflects a non-recurring reimbursement related to restitution amounts in connection with a distribution plan approved by the Securities and Exchange Commission (the SEC) which amounted to less than $0.01 per share outstanding on July 21, 2011. Also reflects a non-recurring reimbursement related to short-term trading related lawsuits, which amounted to less than $0.01 per share outstanding on May 11, 2011.
h Includes interest accrued in connection with certain terminated derivatives contracts, which amounted to less than 0.01% of average net assets for the period ended September 30, 2010.
The accompanying notes are an integral part of these financial statements.
96
Diversified Income Trust
Diversified Income Trust
97
Notes to financial statements 3/31/15 (Unaudited)
Within the following Notes to financial statements, references to “State Street” represent State Street Bank and Trust Company, references to “the SEC” represent the Securities and Exchange Commission, references to “Putnam Management” represent Putnam Investment Management, LLC, the fund’s manager, an indirect wholly-owned subsidiary of Putnam Investments, LLC and references to “OTC”, if any, represent over-the-counter. Unless otherwise noted, the “reporting period” represents the period from October 1, 2014 through March 31, 2015.
Putnam Diversified Income Trust (the fund) is a Massachusetts business trust, which is registered under the Investment Company Act of 1940, as amended, as a diversified open-end management investment company. The goal of the fund is to seek as high a level of current income as Putnam Management believes is consistent with preservation of capital. The fund invests mainly in bonds that are securitized debt instruments (such as mortgage-backed investments) and other obligations of companies and governments worldwide, are either investment-grade or below-investment-grade in quality (sometimes referred to as “junk bonds”) and have intermediate- to long-term maturities (three years or longer). Putnam Management may consider, among other factors, credit, interest rate and prepayment risks, as well as general market conditions, when deciding whether to buy or sell investments.
The fund offers class A, class B, class C, class M, class R, class R5, class R6 and class Y shares. Class A and class M shares are sold with a maximum front-end sales charge of 4.00% and 3.25%, respectively, and generally do not pay a contingent deferred sales charge. Class B shares, which convert to class A shares after approximately eight years, do not pay a front-end sales charge and are subject to a contingent deferred sales charge if those shares are redeemed within six years of purchase. Class C shares have a one-year 1.00% contingent deferred sales charge and do not convert to class A shares. Class R shares, which are not available to all investors, are sold at net asset value. The expenses for class A, class B, class C, class M and class R shares may differ based on the distribution fee of each class, which is identified in Note 2. Class R5, class R6 and class Y shares, which are sold at net asset value, are generally subject to the same expenses as class A, class B, class C, class M and class R shares, but do not bear a distribution fee and in the case of class R5 and class R6 shares, bear a lower investor servicing fee, which is identified in Note 2. Class R5, class R6 and class Y shares are not available to all investors.
In the normal course of business, the fund enters into contracts that may include agreements to indemnify another party under given circumstances. The fund’s maximum exposure under these arrangements is unknown as this would involve future claims that may be, but have not yet been, made against the fund. However, the fund’s management team expects the risk of material loss to be remote.
Note 1: Significant accounting policies
The following is a summary of significant accounting policies consistently followed by the fund in the preparation of its financial statements. The preparation of financial statements is in conformity with accounting principles generally accepted in the United States of America and requires management to make estimates and assumptions that affect the reported amounts of assets and liabilities in the financial statements and the reported amounts of increases and decreases in net assets from operations. Actual results could differ from those estimates. Subsequent events after the Statement of assets and liabilities date through the date that the financial statements were issued have been evaluated in the preparation of the financial statements.
Investment income, realized and unrealized gains and losses and expenses of the fund are borne pro-rata based on the relative net assets of each class to the total net assets of the fund, except that each class bears expenses unique to that class (including the distribution fees applicable to such classes). Each class votes as a class only with respect to its own distribution plan or other matters on which a class vote is required by law or determined by the Trustees. If the fund were liquidated, shares of each class would receive their pro-rata share of the net assets of the fund. In addition, the Trustees declare separate dividends on each class of shares.
Security valuation Portfolio securities and other investments are valued using policies and procedures adopted by the Board of Trustees. The Trustees have formed a Pricing Committee to oversee the implementation of these procedures and have delegated responsibility for valuing the fund’s assets in accordance with these procedures to Putnam Management. Putnam Management has established an internal Valuation Committee that is responsible for making fair value determinations, evaluating the effectiveness of the pricing policies of the fund and reporting to the Pricing Committee.
Investments for which market quotations are readily available are valued at the last reported sales price on their principal exchange, or official closing price for certain markets, and are classified as Level 1 securities under Accounting Standards Codification 820 Fair Value Measurements and Disclosures (ASC 820). If no sales are
98 Diversified Income Trust
reported, as in the case of some securities that are traded OTC, a security is valued at its last reported bid price and is generally categorized as a Level 2 security.
Investments in open-end investment companies (excluding exchange-traded funds), if any, which can be classified as Level 1 or Level 2 securities, are valued based on their net asset value. The net asset value of such investment companies equals the total value of their assets less their liabilities and divided by the number of their outstanding shares.
Market quotations are not considered to be readily available for certain debt obligations and other investments; such investments are valued on the basis of valuations furnished by an independent pricing service approved by the Trustees or dealers selected by Putnam Management. Such services or dealers determine valuations for normal institutional-size trading units of such securities using methods based on market transactions for comparable securities and various relationships, generally recognized by institutional traders, between securities (which consider such factors as security prices, yields, maturities and ratings). These securities will generally be categorized as Level 2. Short-term securities with remaining maturities of 60 days or less may be valued at amortized cost, which approximates fair value, and are classified as Level 2 securities.
Many securities markets and exchanges outside the U.S. close prior to the close of the New York Stock Exchange and therefore the closing prices for securities in such markets or on such exchanges may not fully reflect events that occur after such close but before the close of the New York Stock Exchange. Accordingly, on certain days, the fund will fair value foreign equity securities taking into account multiple factors including movements in the U.S. securities markets, currency valuations and comparisons to the valuation of American Depository Receipts, exchange-traded funds and futures contracts. These securities, which would generally be classified as Level 1 securities, will be transferred to Level 2 of the fair value hierarchy when they are valued at fair value. The number of days on which fair value prices will be used will depend on market activity and it is possible that fair value prices will be used by the fund to a significant extent. Securities quoted in foreign currencies, if any, are translated into U.S. dollars at the current exchange rate.
To the extent a pricing service or dealer is unable to value a security or provides a valuation that Putnam Management does not believe accurately reflects the security’s fair value, the security will be valued at fair value by Putnam Management in accordance with policies and procedures approved by the Trustees. Certain investments, including certain restricted and illiquid securities and derivatives, are also valued at fair value following procedures approved by the Trustees. These valuations consider such factors as significant market or specific security events such as interest rate or credit quality changes, various relationships with other securities, discount rates, U.S. Treasury, U.S. swap and credit yields, index levels, convexity exposures, recovery rates, sales and other multiples and resale restrictions. These securities are classified as Level 2 or as Level 3 depending on the priority of the significant inputs.
To assess the continuing appropriateness of fair valuations, the Valuation Committee reviews and affirms the reasonableness of such valuations on a regular basis after considering all relevant information that is reasonably available. Such valuations and procedures are reviewed periodically by the Trustees. Certain securities may be valued on the basis of a price provided by a single source. The fair value of securities is generally determined as the amount that the fund could reasonably expect to realize from an orderly disposition of such securities over a reasonable period of time. By its nature, a fair value price is a good faith estimate of the value of a security in a current sale and does not reflect an actual market price, which may be different by a material amount.
Joint trading account Pursuant to an exemptive order from the SEC, the fund may transfer uninvested cash balances into a joint trading account along with the cash of other registered investment companies and certain other accounts managed by Putnam Management. These balances may be invested in issues of short-term investments having maturities of up to 90 days.
Repurchase agreements The fund, or any joint trading account, through its custodian, receives delivery of the underlying securities, the fair value of which at the time of purchase is required to be in an amount at least equal to the resale price, including accrued interest. Collateral for certain tri-party repurchase agreements is held at the counterparty’s custodian in a segregated account for the benefit of the fund and the counterparty. Putnam Management is responsible for determining that the value of these underlying securities is at all times at least equal to the resale price, including accrued interest. In the event of default or bankruptcy by the other party to the agreement, retention of the collateral may be subject to legal proceedings.
Security transactions and related investment income Security transactions are recorded on the trade date (the date the order to buy or sell is executed). Gains or losses on securities sold are determined on the identified cost basis.
Interest income, net of any applicable withholding taxes, is recorded on the accrual basis.
Diversified Income Trust 99
All premiums/discounts are amortized/accreted on a yield-to-maturity basis.
The fund earned certain fees in connection with its senior loan purchasing activities. These fees are treated as market discount and are amortized into income in the Statement of operations.
Securities purchased or sold on a delayed delivery basis may be settled at a future date beyond customary settlement time; interest income is accrued based on the terms of the securities. Losses may arise due to changes in the fair value of the underlying securities or if the counterparty does not perform under the contract.
Stripped securities The fund may invest in stripped securities which represent a participation in securities that may be structured in classes with rights to receive different portions of the interest and principal. Interest-only securities receive all of the interest and principal-only securities receive all of the principal. If the interest-only securities experience greater than anticipated prepayments of principal, the fund may fail to recoup fully its initial investment in these securities. Conversely, principal-only securities increase in value if prepayments are greater than anticipated and decline if prepayments are slower than anticipated. The fair value of these securities is highly sensitive to changes in interest rates.
Foreign currency translation The accounting records of the fund are maintained in U.S. dollars. The fair value of foreign securities, currency holdings, and other assets and liabilities is recorded in the books and records of the fund after translation to U.S. dollars based on the exchange rates on that day. The cost of each security is determined using historical exchange rates. Income and withholding taxes are translated at prevailing exchange rates when earned or incurred. The fund does not isolate that portion of realized or unrealized gains or losses resulting from changes in the foreign exchange rate on investments from fluctuations arising from changes in the market prices of the securities. Such gains and losses are included with the net realized and unrealized gain or loss on investments. Net realized gains and losses on foreign currency transactions represent net realized exchange gains or losses on closed forward currency contracts, disposition of foreign currencies, currency gains and losses realized between the trade and settlement dates on securities transactions and the difference between the amount of investment income and foreign withholding taxes recorded on the fund’s books and the U.S. dollar equivalent amounts actually received or paid. Net unrealized appreciation and depreciation of assets and liabilities in foreign currencies arise from changes in the value of open forward currency contracts and assets and liabilities other than investments at the period end, resulting from changes in the exchange rate.
Options contracts The fund uses options contracts to hedge duration and convexity, to isolate prepayment risk and to manage downside risks.
The potential risk to the fund is that the change in value of options contracts may not correspond to the change in value of the hedged instruments. In addition, losses may arise from changes in the value of the underlying instruments if there is an illiquid secondary market for the contracts, if interest or exchange rates move unexpectedly or if the counterparty to the contract is unable to perform. Realized gains and losses on purchased options are included in realized gains and losses on investment securities. If a written call option is exercised, the premium originally received is recorded as an addition to sales proceeds. If a written put option is exercised, the premium originally received is recorded as a reduction to the cost of investments.
Exchange-traded options are valued at the last sale price or, if no sales are reported, the last bid price for purchased options and the last ask price for written options. OTC traded options are valued using prices supplied by dealers.
Options on swaps are similar to options on securities except that the premium paid or received is to buy or grant the right to enter into a previously agreed upon interest rate or credit default contract. Forward premium swap option contracts include premiums that have extended settlement dates. The delayed settlement of the premiums is factored into the daily valuation of the option contracts. In the case of interest rate cap and floor contracts, in return for a premium, ongoing payments between two parties are based on interest rates exceeding a specified rate, in the case of a cap contract, or falling below a specified rate in the case of a floor contract.
Written option contracts outstanding at period end, if any, are listed after the fund’s portfolio.
Futures contracts The fund uses futures contracts for hedging treasury term structure risk and for yield curve positioning.
The potential risk to the fund is that the change in value of futures contracts may not correspond to the change in value of the hedged instruments. In addition, losses may arise from changes in the value of the underlying instruments, if there is an illiquid secondary market for the contracts, if interest or exchange rates move unexpectedly or if the counterparty to the contract is unable to perform. With futures, there is minimal counterparty credit risk to the fund since futures are exchange traded and the exchange’s clearinghouse, as counterparty to all exchange traded futures, guarantees the futures against default. Risks may exceed amounts recognized on the Statement
100 Diversified Income Trust
of assets and liabilities. When the contract is closed, the fund records a realized gain or loss equal to the difference between the value of the contract at the time it was opened and the value at the time it was closed.
Futures contracts are valued at the quoted daily settlement prices established by the exchange on which they trade. The fund and the broker agree to exchange an amount of cash equal to the daily fluctuation in the value of the futures contract. Such receipts or payments are known as “variation margin.”
Futures contracts outstanding at period end, if any, are listed after the fund’s portfolio.
Forward currency contracts The fund buys and sells forward currency contracts, which are agreements between two parties to buy and sell currencies at a set price on a future date. These contracts are used for hedging currency exposures and to gain exposure to currencies.
The U.S. dollar value of forward currency contracts is determined using current forward currency exchange rates supplied by a quotation service. The fair value of the contract will fluctuate with changes in currency exchange rates. The contract is marked to market daily and the change in fair value is recorded as an unrealized gain or loss. The fund records a realized gain or loss equal to the difference between the value of the contract at the time it was opened and the value at the time it was closed when the contract matures or by delivery of the currency. The fund could be exposed to risk if the value of the currency changes unfavorably, if the counterparties to the contracts are unable to meet the terms of their contracts or if the fund is unable to enter into a closing position. Risks may exceed amounts recognized on the Statement of assets and liabilities.
Forward currency contracts outstanding at period end, if any, are listed after the fund’s portfolio.
Interest rate swap contracts The fund entered into OTC and/or centrally cleared interest rate swap contracts, which are arrangements between two parties to exchange cash flows based on a notional principal amount, for hedging term structure risk, for yield curve positioning and for gaining exposure to rates in various countries.
An OTC and centrally cleared interest rate swap can be purchased or sold with an upfront premium. For OTC interest rate swap contracts, an upfront payment received by the fund is recorded as a liability on the fund’s books. An upfront payment made by the fund is recorded as an asset on the fund’s books. OTC and centrally cleared interest rate swap contracts are marked to market daily based upon quotations from an independent pricing service or market makers. Any change is recorded as an unrealized gain or loss on OTC interest rate swaps. Daily fluctuations in the value of centrally cleared interest rate swaps are settled through a central clearing agent and are recorded in variation margin on the Statement of assets and liabilities and recorded as unrealized gain or loss. Payments, including upfront premiums, received or made are recorded as realized gains or losses at the reset date or the closing of the contract. Certain OTC and centrally cleared interest rate swap contracts may include extended effective dates. Payments related to these swap contracts are accrued based on the terms of the contract.
The fund could be exposed to credit or market risk due to unfavorable changes in the fluctuation of interest rates or if the counterparty defaults, in the case of OTC interest rate contracts, or the central clearing agency or a clearing member defaults, in the case of centrally cleared interest rate swap contracts, on its respective obligation to perform under the contract. The fund’s maximum risk of loss from counterparty risk or central clearing risk is the fair value of the contract. This risk may be mitigated for OTC interest rate swap contracts by having a master netting arrangement between the fund and the counterparty and for centrally cleared interest rate swap contracts through the daily exchange of variation margin. There is minimal counterparty risk with respect to centrally cleared interest rate swap contracts due to the clearinghouse guarantee fund and other resources that are available in the event of a clearing member default. Risk of loss may exceed amounts recognized on the Statement of assets and liabilities.
OTC and centrally cleared interest rate swap contracts outstanding, including their respective notional amounts at period end, if any, are listed after the fund’s portfolio.
Total return swap contracts The fund entered into OTC total return swap contracts, which are arrangements to exchange a market-linked return for a periodic payment, both based on a notional principal amount, to hedge sector exposure, for gaining exposure to specific sectors, for hedging inflation and for gaining exposure to inflation.
To the extent that the total return of the security, index or other financial measure underlying the transaction exceeds or falls short of the offsetting interest rate obligation, the fund will receive a payment from or make a payment to the counterparty. OTC total return swap contracts are marked to market daily based upon quotations from an independent pricing service or market makers and the change, if any, is recorded as an unrealized gain or loss. Payments received or made are recorded as realized gains or losses. Certain OTC total return swap contracts may include extended effective dates. Payments related to these swap contracts are accrued based on the terms of the contract. The fund could be exposed to credit or market risk due to unfavorable changes in the fluctuation of interest rates or in the price of the underlying security or index, the possibility that there is no liquid market
Diversified Income Trust 101
for these agreements or that the counterparty may default on its obligation to perform. The fund’s maximum risk of loss from counterparty risk is the fair value of the contract. This risk may be mitigated by having a master netting arrangement between the fund and the counterparty. Risk of loss may exceed amounts recognized on the Statement of assets and liabilities.
OTC total return swap contracts outstanding, including their respective notional amounts at period end, if any, are listed after the fund’s portfolio.
Credit default contracts The fund entered into OTC and/or centrally cleared credit default contracts to hedge credit risk, for gaining liquid exposure to individual names, to hedge market risk and for gaining exposure to specific sectors.
In OTC and centrally cleared credit default contracts, the protection buyer typically makes a periodic stream of payments to a counterparty, the protection seller, in exchange for the right to receive a contingent payment upon the occurrence of a credit event on the reference obligation or all other equally ranked obligations of the reference entity. Credit events are contract specific but may include bankruptcy, failure to pay, restructuring and obligation acceleration. For OTC credit default contracts, an upfront payment received by the fund is recorded as a liability on the fund’s books. An upfront payment made by the fund is recorded as an asset on the fund’s books. Centrally cleared credit default contracts provide the same rights to the protection buyer and seller except the payments between parties, including upfront premiums, are settled through a central clearing agent through variation margin payments. Upfront and periodic payments received or paid by the fund for OTC and centrally cleared credit default contracts are recorded as realized gains or losses at the reset date or close of the contract. The OTC and centrally cleared credit default contracts are marked to market daily based upon quotations from an independent pricing service or market makers. Any change in value of OTC credit default contracts is recorded as an unrealized gain or loss. Daily fluctuations in the value of centrally cleared credit default contracts are recorded in variation margin on the Statement of assets and liabilities and recorded as unrealized gain or loss. Upon the occurrence of a credit event, the difference between the par value and fair value of the reference obligation, net of any proportional amount of the upfront payment, is recorded as a realized gain or loss.
In addition to bearing the risk that the credit event will occur, the fund could be exposed to market risk due to unfavorable changes in interest rates or in the price of the underlying security or index or the possibility that the fund may be unable to close out its position at the same time or at the same price as if it had purchased the underlying reference obligations. In certain circumstances, the fund may enter into offsetting OTC and centrally cleared credit default contracts which would mitigate its risk of loss. Risks of loss may exceed amounts recognized on the Statement of assets and liabilities. The fund’s maximum risk of loss from counterparty risk, either as the protection seller or as the protection buyer, is the fair value of the contract. This risk may be mitigated for OTC credit default contracts by having a master netting arrangement between the fund and the counterparty and for centrally cleared credit default contracts through the daily exchange of variation margin. Counterparty risk is further mitigated with respect to centrally cleared credit default swap contracts due to the clearinghouse guarantee fund and other resources that are available in the event of a clearing member default. Where the fund is a seller of protection, the maximum potential amount of future payments the fund may be required to make is equal to the notional amount.
OTC and centrally cleared credit default contracts outstanding, including their respective notional amounts at period end, if any, are listed after the fund’s portfolio.
TBA commitments The fund may enter into TBA (to be announced) commitments to purchase securities for a fixed unit price at a future date beyond customary settlement time. Although the unit price and par amount have been established, the actual securities have not been specified. However, it is anticipated that the amount of the commitments will not significantly differ from the principal amount. The fund holds, and maintains until settlement date, cash or high-grade debt obligations in an amount sufficient to meet the purchase price, or the fund may enter into offsetting contracts for the forward sale of other securities it owns. Income on the securities will not be earned until settlement date.
The fund may also enter into TBA sale commitments to hedge its portfolio positions, to sell mortgage-backed securities it owns under delayed delivery arrangements or to take a short position in mortgage-backed securities. Proceeds of TBA sale commitments are not received until the contractual settlement date. During the time a TBA sale commitment is outstanding, either equivalent deliverable securities, or an offsetting TBA purchase commitment deliverable on or before the sale commitment date, are held as “cover” for the transaction, or other liquid assets in an amount equal to the notional value of the TBA sale commitment are segregated. If the TBA sale commitment is closed through the acquisition of an offsetting TBA purchase commitment, the fund realizes a gain
102 Diversified Income Trust
or loss. If the fund delivers securities under the commitment, the fund realizes a gain or a loss from the sale of the securities based upon the unit price established at the date the commitment was entered into.
TBA commitments, which are accounted for as purchase and sale transactions, may be considered securities themselves, and involve a risk of loss due to changes in the value of the security prior to the settlement date as well as the risk that the counterparty to the transaction will not perform. Counterparty risk is mitigated by having a master agreement between the fund and the counterparty.
Unsettled TBA commitments are valued at their fair value according to the procedures described under “Security valuation” above. The contract is marked to market daily and the change in fair value is recorded by the fund as an unrealized gain or loss. Based on market circumstances, Putnam Management will determine whether to take delivery of the underlying securities or to dispose of the TBA commitments prior to settlement.
TBA purchase commitments outstanding at period end, if any, are listed within the fund’s portfolio and TBA sale commitments outstanding at period end, if any, are listed after the fund’s portfolio.
Master agreements The fund is a party to ISDA (International Swaps and Derivatives Association, Inc.) Master Agreements that govern OTC derivative and foreign exchange contracts and Master Securities Forward Transaction Agreements that govern transactions involving mortgage backed and other asset backed securities that may result in delayed delivery (Master Agreements) with certain counterparties entered into from time to time. The Master Agreements may contain provisions regarding, among other things, the parties’ general obligations, representations, agreements, collateral requirements, events of default and early termination. With respect to certain counterparties, in accordance with the terms of the Master Agreements, collateral posted to the fund is held in a segregated account by the fund’s custodian and, with respect to those amounts which can be sold or repledged, are presented in the fund’s portfolio. Collateral posted to the fund which cannot be sold or repledged totaled $3,300,061 at the close of the reporting period.
Collateral pledged by the fund is segregated by the fund’s custodian and identified in the fund’s portfolio. Collateral can be in the form of cash or debt securities issued by the U.S. Government or related agencies or other securities as agreed to by the fund and the applicable counterparty. Collateral requirements are determined based on the fund’s net position with each counterparty.
With respect to ISDA Master Agreements, termination events applicable to the fund may occur upon a decline in the fund’s net assets below a specified threshold over a certain period of time. Termination events applicable to counterparties may occur upon a decline in the counterparty’s long-term or short-term credit ratings below a specified level. In each case, upon occurrence, the other party may elect to terminate early and cause settlement of all derivative and foreign exchange contracts outstanding, including the payment of any losses and costs resulting from such early termination, as reasonably determined by the terminating party. Any decision by one or more of the fund’s counterparties to elect early termination could impact the fund’s future derivative activity.
At the close of the reporting period, the fund had a net liability position of $52,446,689 on open derivative contracts subject to the Master Agreements. Collateral posted by the fund at period end for these agreements totaled $56,606,331 and may include amounts related to unsettled agreements.
Interfund lending The fund, along with other Putnam funds, may participate in an interfund lending program pursuant to an exemptive order issued by the SEC. This program allows the fund to borrow from or lend to other Putnam funds that permit such transactions. Interfund lending transactions are subject to each fund’s investment policies and borrowing and lending limits. Interest earned or paid on the interfund lending transaction will be based on the average of certain current market rates. During the reporting period, the fund did not utilize the program.
Lines of credit The fund participates, along with other Putnam funds, in a $392.5 million unsecured committed line of credit and a $235.5 million unsecured uncommitted line of credit, both provided by State Street. Borrowings may be made for temporary or emergency purposes, including the funding of shareholder redemption requests and trade settlements. Interest is charged to the fund based on the fund’s borrowing at a rate equal to the Federal Funds rate plus 1.25% for the committed line of credit and the Federal Funds rate plus 1.30% for the uncommitted line of credit. A closing fee equal to 0.04% of the committed line of credit and 0.04% of the uncommitted line of credit has been paid by the participating funds. In addition, a commitment fee of 0.11% per annum on any unutilized portion of the committed line of credit is allocated to the participating funds based on their relative net assets and paid quarterly. During the reporting period, the fund had no borrowings against these arrangements.
Federal taxes It is the policy of the fund to distribute all of its taxable income within the prescribed time period and otherwise comply with the provisions of the Internal Revenue Code of 1986, as amended (the Code), applicable
Diversified Income Trust 103
to regulated investment companies. It is also the intention of the fund to distribute an amount sufficient to avoid imposition of any excise tax under Section 4982 of the Code.
The fund is subject to the provisions of Accounting Standards Codification 740 Income Taxes (ASC 740). ASC 740 sets forth a minimum threshold for financial statement recognition of the benefit of a tax position taken or expected to be taken in a tax return. The fund did not have a liability to record for any unrecognized tax benefits in the accompanying financial statements. No provision has been made for federal taxes on income, capital gains or unrealized appreciation on securities held nor for excise tax on income and capital gains. Each of the fund’s federal tax returns for the prior three fiscal years remains subject to examination by the Internal Revenue Service.
The fund may also be subject to taxes imposed by governments of countries in which it invests. Such taxes are generally based on either income or gains earned or repatriated. The fund accrues and applies such taxes to net investment income, net realized gains and net unrealized gains as income and/or capital gains are earned. In some cases, the fund may be entitled to reclaim all or a portion of such taxes, and such reclaim amounts, if any, are reflected as an asset on the fund’s books. In many cases, however, the fund may not receive such amounts for an extended period of time, depending on the country of investment.
At September 30, 2014, the fund had a capital loss carryover of $646,800,426 available to the extent allowed by the Code to offset future net capital gain, if any. The amounts of the carryovers and the expiration dates are:
Loss carryover
Short-term
Long-term
Total
Expiration
$219,214,069
$85,603,509
$304,817,578
*
13,963,696
N/A
13,963,696
September 30, 2015
18,714,447
N/A
18,714,447
September 30, 2016
146,525,581
N/A
146,525,581
September 30, 2017
162,779,124
N/A
162,779,124
September 30, 2018
*Under the Regulated Investment Company Modernization Act of 2010, the fund will be permitted to carry forward capital losses incurred in taxable years beginning after December 22, 2010 for an unlimited period. However, any losses incurred will be required to be utilized prior to the losses incurred in pre-enactment tax years. As a result of this ordering rule, pre-enactment capital loss carryforwards may be more likely to expire unused. Additionally, post-enactment capital losses that are carried forward will retain their character as either short-term or long-term capital losses rather than being considered all short-term as under previous law.
Pursuant to federal income tax regulations applicable to regulated investment companies, the fund has elected to defer certain capital losses of $84,718,064 recognized during the period between November 1, 2013 and September 30, 2014 to its fiscal year ending September 30, 2015.
The aggregate identified cost on a tax basis is $9,478,926,443, resulting in gross unrealized appreciation and depreciation of $236,229,080 and $386,055,636, respectively, or net unrealized depreciation of $149,826,556.
Distributions to shareholders Distributions to shareholders from net investment income are recorded by the fund on the ex-dividend date. Distributions from capital gains, if any, are recorded on the ex-dividend date and paid at least annually. The amount and character of income and gains to be distributed are determined in accordance with income tax regulations, which may differ from generally accepted accounting principles. Dividend sources are estimated at the time of declaration. Actual results may vary. Any non-taxable return of capital cannot be determined until final tax calculations are completed after the end of the fund’s fiscal year. Reclassifications are made to the fund’s capital accounts to reflect income and gains available for distribution (or available capital loss carryovers) under income tax regulations.
Note 2: Management fee, administrative services and other transactions
The fund pays Putnam Management a management fee (based on the fund’s average net assets and computed and paid monthly) at annual rates that may vary based on the average of the aggregate net assets of most open-end
104 Diversified Income Trust
funds, as defined in the fund’s management contract, sponsored by Putnam Management. Such annual rates may vary as follows:
0.700%
of the first $5 billion,
0.650%
of the next $5 billion,
0.600%
of the next $10 billion,
0.550%
of the next $10 billion,
0.500%
of the next $50 billion,
0.480%
of the next $50 billion,
0.470%
of the next $100 billion and
0.465%
of any excess thereafter.
Putnam Management has contractually agreed, through June 30, 2015, to waive fees or reimburse the fund’s expenses to the extent necessary to limit the cumulative expenses of the fund, exclusive of brokerage, interest, taxes, investment-related expenses, extraordinary expenses, acquired fund fees and expenses and payments under the fund’s investor servicing contract, investment management contract and distribution plans, on a fiscal year-to-date basis to an annual rate of 0.20% of the fund’s average net assets over such fiscal year-to-date period. During the reporting period, the fund’s expenses were not reduced as a result of this limit.
Putnam Investments Limited (PIL), an affiliate of Putnam Management, is authorized by the Trustees to manage a separate portion of the assets of the fund as determined by Putnam Management from time to time. Putnam Management pays a quarterly sub-management fee to PIL for its services at an annual rate of 0.40% of the average net assets of the portion of the fund managed by PIL.
The fund reimburses Putnam Management an allocated amount for the compensation and related expenses of certain officers of the fund and their staff who provide administrative services to the fund. The aggregate amount of all such reimbursements is determined annually by the Trustees.
Custodial functions for the fund’s assets are provided by State Street. Custody fees are based on the fund’s asset level, the number of its security holdings and transaction volumes.
Putnam Investor Services, Inc., an affiliate of Putnam Management, provides investor servicing agent functions to the fund. Putnam Investor Services, Inc. received fees for investor servicing (except for class R5 and R6 shares) that included (1) a per account fee for each direct and underlying non-defined contribution account (“retail account”) of the fund and each of the other funds in its specified category, which was totaled and then allocated to each fund in the category based on its average daily net assets; (2) a specified rate of the fund’s assets attributable to defined contribution plan accounts; and (3) for the portion of the fund’s fiscal year beginning after January 1, 2015, a specified rate based on the average net assets in retail accounts. Putnam Investor Services has agreed that the aggregate investor servicing fees for each fund’s retail and defined contribution accounts will not exceed an annual rate of 0.320% of the fund’s average assets attributable to such accounts. Class R5 shares paid a monthly fee based on the average net assets of class R5 shares at an annual rate of 0.12%. Class R6 shares paid a monthly fee based on the average net assets of class R6 shares at an annual rate of 0.05%. During the reporting period, the expenses for each class of shares related to investor servicing fees were as follows:
Class A
$1,500,079
Class B
52,815
Class C
718,817
Class M
132,425
Class R
4,265
Class R5
6
Class R6
3,098
Class Y
1,836,088
Total
$4,247,593
The fund has entered into expense offset arrangements with Putnam Investor Services, Inc. and State Street whereby Putnam Investor Services, Inc.’s and State Street’s fees are reduced by credits allowed on cash balances. For the reporting period, the fund’s expenses were reduced by $6,987 under the expense offset arrangements.
Each Independent Trustee of the fund receives an annual Trustee fee, of which $3,572, as a quarterly retainer, has been allocated to the fund, and an additional fee for each Trustees meeting attended. Trustees also are reimbursed for expenses they incur relating to their services as Trustees.
The fund has adopted a Trustee Fee Deferral Plan (the Deferral Plan) which allows the Trustees to defer the receipt of all or a portion of Trustees fees payable on or after July 1, 1995. The deferred fees remain invested in certain Putnam funds until distribution in accordance with the Deferral Plan.
The fund has adopted an unfunded noncontributory defined benefit pension plan (the Pension Plan) covering all Trustees of the fund who have served as a Trustee for at least five years and were first elected prior to 2004.
Diversified Income Trust 105
Benefits under the Pension Plan are equal to 50% of the Trustee’s average annual attendance and retainer fees for the three years ended December 31, 2005. The retirement benefit is payable during a Trustee’s lifetime, beginning the year following retirement, for the number of years of service through December 31, 2006. Pension expense for the fund is included in Trustee compensation and expenses in the Statement of operations. Accrued pension liability is included in Payable for Trustee compensation and expenses in the Statement of assets and liabilities. The Trustees have terminated the Pension Plan with respect to any Trustee first elected after 2003.
The fund has adopted distribution plans (the Plans) with respect to its class A, class B, class C, class M and class R shares pursuant to Rule 12b–1 under the Investment Company Act of 1940. The purpose of the Plans is to compensate Putnam Retail Management Limited Partnership, an indirect wholly-owned subsidiary of Putnam Investments, LLC, for services provided and expenses incurred in distributing shares of the fund. The Plans provide for payments by the fund to Putnam Retail Management Limited Partnership at an annual rate of up to 0.35%, 1.00%, 1.00%, 1.00% and 1.00% of the average net assets attributable to class A, class B, class C, class M and class R shares, respectively. The Trustees have approved payment by the fund at an annual rate of 0.25%, 1.00%, 1.00%, 0.50% and 0.50% of the average net assets attributable to class A, class B, class C, class M and class R shares, respectively. During the reporting period, the class specific expenses related to distribution fees were as follows:
Class A
$2,831,169
Class B
398,312
Class C
5,419,473
Class M
499,620
Class R
16,061
Total
$9,164,635
For the reporting period, Putnam Retail Management Limited Partnership, acting as underwriter, received net commissions of $196,607 and $3,565 from the sale of class A and class M shares, respectively, and received $11,054 and $9,471 in contingent deferred sales charges from redemptions of class B and class C shares, respectively.
A deferred sales charge of up to 1.00% and 0.40% is assessed on certain redemptions of class A and class M shares, respectively. For the reporting period, Putnam Retail Management Limited Partnership, acting as underwriter, received $2,138 and no monies on class A and class M redemptions, respectively.
Note 3: Purchases and sales of securities
During the reporting period, the cost of purchases and the proceeds from sales, excluding short-term investments, were as follows:
Cost of purchases
Proceeds from sales
Investments in securities, including TBA commitments (Long-term)
$22,227,062,229
$20,621,755,156
U.S. government securities (Long-term)
26,353,438
26,251,875
Total
$22,253,415,667
$20,648,007,031
Written option transactions during the reporting period are summarized as follows:
Written swap option contract amounts
Written swap option premiums
Written option contract amounts
Written option premiums
Written options outstanding at the beginning of the reporting period
$6,775,661,300
$82,754,159
$1,656,000,000
$13,470,000
Options opened
24,182,852,575
134,362,616
5,638,000,000
34,681,719
Options exercised
(1,289,071,050)
(7,724,205)
—
—
Options expired
(1,074,541,550)
(9,933,277)
(2,848,000,000)
(14,298,906)
Options closed
(17,361,456,300)
(101,307,574)
(3,590,000,000)
(27,012,500)
Written options outstanding at the end of the reporting period
$11,233,444,975
$98,151,719
$856,000,000
$6,840,313
106 Diversified Income Trust
Note 4: Capital shares
At the close of the reporting period, there were an unlimited number of shares of beneficial interest authorized. Transactions in capital shares were as follows:
Six months ended 3/31/15
Year ended 9/30/14
Class A
Shares
Amount
Shares
Amount
Shares sold
39,738,687
$303,751,669
183,400,504
$1,449,459,563
Shares issued in connection with reinvestment of distributions
5,435,593
41,181,952
15,438,796
121,781,458
45,174,280
344,933,621
198,839,300
1,571,241,021
Shares repurchased
(73,551,509)
(559,793,931)
(183,118,939)
(1,449,868,615)
Net increase (decrease)
(28,377,229)
$(214,860,310)
15,720,361
$121,372,406
Six months ended 3/31/15
Year ended 9/30/14
Class B
Shares
Amount
Shares
Amount
Shares sold
828,633
$6,239,028
2,122,587
$16,625,154
Shares issued in connection with reinvestment of distributions
153,084
1,149,550
394,594
3,083,741
981,717
7,388,578
2,517,181
19,708,895
Shares repurchased
(1,401,013)
(10,561,457)
(2,141,647)
(16,779,033)
Net increase (decrease)
(419,296)
$(3,172,879)
375,534
$2,929,862
Six months ended 3/31/15
Year ended 9/30/14
Class C
Shares
Amount
Shares
Amount
Shares sold
18,804,667
$141,310,985
58,910,826
$458,764,834
Shares issued in connection with reinvestment of distributions
2,036,723
15,187,230
4,124,203
32,047,393
20,841,390
156,498,215
63,035,029
490,812,227
Shares repurchased
(18,724,743)
(139,895,492)
(18,912,713)
(147,202,814)
Net increase
2,116,647
$16,602,723
44,122,316
$343,609,413
Six months ended 3/31/15
Year ended 9/30/14
Class M
Shares
Amount
Shares
Amount
Shares sold
260,981
$1,959,786
878,162
$6,833,125
Shares issued in connection with reinvestment of distributions
57,795
431,216
137,440
1,067,940
318,776
2,391,002
1,015,602
7,901,065
Shares repurchased
(2,466,647)
(18,564,744)
(3,769,409)
(29,349,743)
Net decrease
(2,147,871)
$(16,173,742)
(2,753,807)
$(21,448,678)
Six months ended 3/31/15
Year ended 9/30/14
Class R
Shares
Amount
Shares
Amount
Shares sold
156,180
$1,176,638
327,830
$2,565,318
Shares issued in connection with reinvestment of distributions
15,891
119,128
32,571
254,297
172,071
1,295,766
360,401
2,819,615
Shares repurchased
(142,590)
(1,070,304)
(136,509)
(1,069,902)
Net increase
29,481
$225,462
223,892
$1,749,713
Diversified Income Trust 107
Six months ended 3/31/15
For the period 11/1/13 (commencement of operations) to 9/30/14
Class R5
Shares
Amount
Shares
Amount
Shares sold
—
$—
1,287
$10,000
Shares issued in connection with reinvestment of distributions
31
237
68
531
31
237
1,355
10,531
Shares repurchased
—
—
—
—
Net increase
31
$237
1,355
$10,531
Six months ended 3/31/15
For the period 11/1/13 (commencement of operations) to 9/30/14
Class R6
Shares
Amount
Shares
Amount
Shares sold
234,258
$1,779,415
1,878,090
$14,779,692
Shares issued in connection with reinvestment of distributions
38,151
286,628
72,544
569,250
272,409
2,066,043
1,950,634
15,348,942
Shares repurchased
(464,481)
(3,514,477)
(212,677)
(1,672,724)
Net increase (decrease)
(192,072)
$(1,448,434)
1,737,957
$13,676,218
Six months ended 3/31/15
Year ended 9/30/14
Class Y
Shares
Amount
Shares
Amount
Shares sold
95,574,728
$722,075,655
309,086,361
$2,426,756,642
Shares issued in connection with reinvestment of distributions
6,390,896
47,978,112
8,717,079
68,210,298
101,965,624
770,053,767
317,803,440
2,494,966,940
Shares repurchased
(146,128,094)
(1,098,977,969)
(84,902,087)
(664,657,730)
Net increase (decrease)
(44,162,470)
$(328,924,202)
232,901,353
$1,830,309,210
At the close of the reporting period, Putnam Investments, LLC owned the following shares of the fund:
Shares owned
Percentage of ownership
Value
Class R5
1,386
100.00%
$10,321
Class R6
1,387
0.09
10,333
108 Diversified Income Trust
Note 5: Affiliated transactions
Transactions during the reporting period with Putnam Money Market Liquidity Fund and Putnam Short Term Investment Fund, which are under common ownership or control, were as follows:
Name of affiliate
Fair value at the beginning of the reporting period
Purchase cost
Sale proceeds
Investment income
Fair value at the end of the reporting period
Putnam Money Market Liquidity Fund*
$136,395,081
$259,093,300
$383,300,207
$2,266
$12,188,174
Putnam Short Term Investment Fund*
291,451,598
1,364,028,096
1,314,293,539
128,825
341,186,155
Totals
$427,846,679
$1,623,121,396
$1,697,593,746
$131,091
$353,374,329
*Management fees charged to Putnam Money Market Liquidity Fund and Putnam Short Term Investment Fund have been waived by Putnam Management.
Note 6: Senior loan commitments
Senior loans are purchased or sold on a when-issued or delayed delivery basis and may be settled a month or more after the trade date, which from time to time can delay the actual investment of available cash balances; interest income is accrued based on the terms of the securities. Senior loans can be acquired through an agent, by assignment from another holder of the loan, or as a participation interest in another holder’s portion of the loan. When the fund invests in a loan or participation, the fund is subject to the risk that an intermediate participant between the fund and the borrower will fail to meet its obligations to the fund, in addition to the risk that the borrower under the loan may default on its obligations.
Note 7: Market, credit and other risks
In the normal course of business, the fund trades financial instruments and enters into financial transactions where risk of potential loss exists due to changes in the market (market risk) or failure of the contracting party to the transaction to perform (credit risk). The fund may be exposed to additional credit risk that an institution or other entity with which the fund has unsettled or open transactions will default. Investments in foreign securities involve certain risks, including those related to economic instability, unfavorable political developments, and currency fluctuations. The fund may invest in higher yielding, lower rated bonds that may have a higher rate of default. The fund may invest a significant portion of its assets in securitized debt instruments, including mortgage-backed and asset-backed investments. The yields and values of these investments are sensitive to changes in interest rates, the rate of principal payments on the underlying assets and the market’s perception of the issuers. The market for these investments may be volatile and limited, which may make them difficult to buy or sell.
Note 8: Summary of derivative activity
The volume of activity for the reporting period for any derivative type that was held during the period is listed below and was as follows based on an average of the holdings at the end of each fiscal quarter:
The following is a summary of the fair value of derivative instruments as of the close of the reporting period:
Fair value of derivative instruments as of the close of the reporting period
Asset derivatives
Liability derivatives
Derivatives not accounted for as hedging instruments under ASC 815
Statement of assets and liabilities location
Fair value
Statement of assets and liabilities location
Fair value
Credit contracts
Receivables
$3,040,274
Payables
$2,302,967
Foreign exchange contracts
Receivables
62,696,049
Payables
26,707,007
Interest rate contracts
Investments, Receivables, Net assets — Unrealized appreciation
248,943,626*
Payables, Net assets — Unrealized depreciation
412,294,452*
Total
$314,679,949
$441,304,426
*Includes cumulative appreciation/depreciation of futures contracts and/or centrally cleared swaps as reported in the fund’s portfolio. Only current day’s variation margin is reported within the Statement of assets and liabilities.
The following is a summary of realized and change in unrealized gains or losses of derivative instruments on the Statement of operations for the reporting period (see Note 1):
Amount of realized gain or (loss) on derivatives recognized in net gain or (loss) on investments
Derivatives not accounted for as hedging instruments under ASC 815
Options
Futures
Forward currency contracts
Swaps
Total
Credit contracts
$—
$—
$—
$3,229,168
$3,229,168
Foreign exchange contracts
—
—
142,041,668
—
$142,041,668
Interest rate contracts
(30,240,187)
(51,975,631)
—
(138,595,115)
$(220,810,933)
Total
$(30,240,187)
$(51,975,631)
$142,041,668
$(135,365,947)
$(75,540,097)
Change in unrealized appreciation or (depreciation) on derivatives recognized in net gain or (loss) on investments
Derivatives not accounted for as hedging instruments under ASC 815
Options
Futures
Forward currency contracts
Swaps
Total
Credit contracts
$—
$—
$—
$2,729,658
$2,729,658
Foreign exchange contracts
—
—
(23,008,513)
—
$(23,008,513)
Interest rate contracts
33,228,486
(14,353,635)
—
(59,249,247)
$(40,374,396)
Total
$33,228,486
$(14,353,635)
$(23,008,513)
$(56,519,589)
$(60,653,251)
110 Diversified Income Trust
This page left blank intentionally.
Diversified Income Trust 111
Note 9: Offsetting of financial and derivative assets and liabilities
The following table summarizes any derivatives, repurchase agreements and reverse repurchase agreements, at the end of the reporting period, that are subject to an enforceable master netting agreement or similar agreement. For securities lending transactions or borrowing transactions associated with securities sold short, if any, see Note 1. For financial reporting purposes, the fund does not offset financial assets and financial liabilities that are subject to the master netting agreements in the Statement of assets and liabilities.
Bank of America N.A.
Barclays Bank PLC
Barclays Capital Inc. (clearing broker)
Citibank, N.A.
Credit Suisse International
Deutsche Bank AG
Goldman Sachs International
HSBC Bank USA, National Association
JPMorgan Chase Bank N.A.
JPMorgan Futures, Inc.
Royal Bank of Scotland PLC (The)
State Street Bank and Trust Co.
UBS AG
WestPac Banking Corp.
Total
Assets:
OTC Interest rate swap contracts*#
$563,982
$—
$—
$1,460,459
$1,647,231
$194,649
$2,755,109
$—
$6,017,872
$—
$—
$—
$—
$—
$12,639,302
Centrally cleared interest rate swap contracts§
—
—
87,104,505
—
—
—
—
—
—
—
—
—
—
—
87,104,505
OTC Total return swap contracts*#
—
2,140,701
—
5,057,803
5,770,787
20,090
940,089
—
405,311
—
—
—
—
—
14,334,781
OTC Credit default contracts*#
79,274
40,421
—
—
2,427,324
—
493,255
—
—
—
—
—
—
—
3,040,274
Futures contracts§
—
—
—
—
—
—
—
—
—
95,229
—
—
—
—
95,229
Forward currency contracts#
5,064,541
4,225,095
—
7,369,735
2,851,738
4,893,979
3,453,689
5,256,960
5,676,565
—
6,904,074
5,871,836
6,633,731
4,494,106
62,696,049
Forward premium swap option contracts#
—
—
—
—
—
—
—
—
2,317,431
—
—
—
—
—
2,317,431
Purchased swap options**#
12,090,129
6,973,353
—
19,539,637
20,393,933
—
10,263,706
—
—
—
—
—
—
—
69,260,758
Purchased options**#
—
—
—
—
—
—
—
—
3,569,032
—
—
—
—
—
3,569,032
Total Assets
$17,797,926
$13,379,570
$87,104,505
$33,427,634
$33,091,013
$5,108,718
$17,905,848
$5,256,960
$17,986,211
$95,229
$6,904,074
$5,871,836
$6,633,731
$4,494,106
$255,057,361
Liabilities:
OTC Interest rate swap contracts*#
$586,090
$—
$—
$346,785
$1,532,729
$16,751,655
$2,501,386
$—
$8,547,036
$—
$—
$—
$—
$—
$30,265,681
Centrally cleared interest rate swap contracts§
—
—
97,806,301
—
—
—
—
—
—
—
—
—
—
—
97,806,301
OTC Total return swap contracts*#
143,179
1,274,919
—
4,364,400
8,864,553
40,499
5,105,035
—
1,476,790
—
—
—
—
—
21,269,375
OTC Credit default contracts*#
—
1,267,306
—
—
829,400
—
206,261
—
—
—
—
—
—
—
2,302,967
Futures contracts§
—
—
—
—
—
—
—
—
—
985,871
—
—
—
—
985,871
Forward currency contracts#
798,821
2,816,295
—
791,564
2,042,339
1,367,427
1,445,643
1,077,195
2,461,109
—
3,379,092
4,892,148
3,002,828
2,632,546
26,707,007
Forward premium swap option contracts#
—
—
—
—
—
—
168,847
—
2,285,295
—
—
—
—
—
2,454,142
Written swap options#
8,556,295
3,312,604
—
10,067,196
2,254,513
—
9,059,759
—
40,266,768
—
—
—
—
—
73,517,135
Written options#
—
—
—
—
—
—
—
—
1,763,956
—
—
—
—
—
1,763,956
Total Liabilities
$10,084,385
$8,671,124
$97,806,301
$15,569,945
$15,523,534
$18,159,581
$18,486,931
$1,077,195
$56,800,954
$985,871
$3,379,092
$4,892,148
$3,002,828
$2,632,546
$257,072,435
Total Financial and Derivative Net Assets
$7,713,541
$4,708,446
$(10,701,796)
$17,857,689
$17,567,479
$(13,050,863)
$(581,083)
$4,179,765
$(38,814,743)
$(890,642)
$3,524,982
$979,688
$3,630,903
$1,861,560
$(2,015,074)
Total collateral received (pledged)†##
$5,480,000
$3,839,000
$—
$16,470,000
$17,553,000
$(13,050,863)
$(581,083)
$4,179,765
$(38,814,743)
$—
$3,006,000
$—
$3,300,061
$—
Net amount
$2,233,541
$869,446
$(10,701,796)
$1,387,689
$14,479
$—
$—
$—
$—
$(890,642)
$518,982
$979,688
$330,842
$1,861,560
*
Excludes premiums, if any. Included in unrealized appreciation and depreciation on OTC swap contracts on the Statement of assets and liabilities.
**
Included with Investments in securities on the Statement of assets and liabilities.
†
Additional collateral may be required from certain brokers based on individual agreements.
#
Covered by master netting agreement (Note 1).
##
Any over-collateralization of total financial and derivative net assets is not shown. Collateral may include amounts related to unsettled agreements.
§
Includes current day’s variation margin only as reported on the Statement of assets and liabilities, which is not collateralized. Cumulative appreciation/(depreciation) for futures contracts and centrally cleared swap contracts is represented in the tables listed after the fund’s portfolio.
112
Diversified Income Trust
Diversified Income Trust
113
Putnam family of funds
The following is a list of Putnam’s open-end mutual funds offered to the public. Investors should carefully consider the investment objective, risks, charges, and expenses of a fund before investing. For a prospectus, or a summary prospectus if available, containing this and other information for any Putnam fund or product, contact your financial advisor or call Putnam Investor Services at 1-800-225-1581. Please read the prospectus carefully before investing.
Growth
Growth Opportunities Fund
International Growth Fund
Multi-Cap Growth Fund
Small Cap Growth Fund
Voyager Fund
Blend
Asia Pacific Equity Fund
Capital Opportunities Fund
Capital Spectrum Fund
Emerging Markets Equity Fund
Equity Spectrum Fund
Europe Equity Fund
Global Equity Fund
International Capital Opportunities Fund
International Equity Fund
Investors Fund
Low Volatility Equity Fund
Multi-Cap Core Fund
Research Fund
Strategic Volatility Equity Fund
Value
Convertible Securities Fund
Equity Income Fund
Global Dividend Fund
The Putnam Fund for Growth and Income
International Value Fund
Multi-Cap Value Fund
Small Cap Value Fund
Income
American Government Income Fund
Diversified Income Trust
Emerging Markets Income Fund
Floating Rate Income Fund
Global Income Trust
High Yield Advantage Fund
High Yield Trust
Income Fund
Money Market Fund*
Short Duration Income Fund
U.S. Government Income Trust
Tax-free Income
AMT-Free Municipal Fund
Intermediate-Term Municipal Income Fund
Short-Term Municipal Income Fund
Tax Exempt Income Fund
Tax Exempt Money Market Fund*
Tax-Free High Yield Fund
State tax-free income funds†:
Arizona, California, Massachusetts, Michigan, Minnesota, New Jersey, New York, Ohio, and Pennsylvania.
* An investment in a money market fund is not insured or guaranteed by the Federal Deposit Insurance Corporation or any other government agency. Although the fund seeks to preserve the value of your investment at $1.00 per share, it is possible to lose money by investing in the fund.
†Not available in all states.
114 Diversified Income Trust
Absolute Return
Absolute Return 100 Fund®
Absolute Return 300 Fund®
Absolute Return 500 Fund®
Absolute Return 700 Fund®
Global Sector
Global Consumer Fund
Global Energy Fund
Global Financials Fund
Global Health Care Fund
Global Industrials Fund
Global Natural Resources Fund
Global Sector Fund
Global Technology Fund
Global Telecommunications Fund
Global Utilities Fund
Asset Allocation
George Putnam Balanced Fund
Global Asset Allocation Funds — four investment portfolios that spread your money across a variety of stocks, bonds, and money market instruments.
Dynamic Asset Allocation Balanced Fund
Dynamic Asset Allocation Conservative Fund
Dynamic Asset Allocation Growth Fund
Dynamic Risk Allocation Fund
Retirement Income Lifestyle Funds — portfolios with managed allocations to stocks, bonds, and money market investments to generate retirement income.
Retirement Income Fund Lifestyle 1
Retirement Income Fund Lifestyle 2
Retirement Income Fund Lifestyle 3
RetirementReady® Funds — portfolios with adjusting allocations to stocks, bonds, and money market instruments, becoming more conservative over time.
RetirementReady® 2055 Fund
RetirementReady® 2050 Fund
RetirementReady® 2045 Fund
RetirementReady® 2040 Fund
RetirementReady® 2035 Fund
RetirementReady® 2030 Fund
RetirementReady® 2025 Fund
RetirementReady® 2020 Fund
RetirementReady® 2015 Fund
Check your account balances and the most recent month-end performance in the Individual Investors section at putnam.com.
Diversified Income Trust 115
Services for shareholders
Investor services
Systematic investment plan Tell us how much you wish to invest regularly — weekly, semimonthly, or monthly — and the amount you choose will be transferred automatically from your checking or savings account. There’s no additional fee for this service, and you can suspend it at any time. This plan may be a great way to save for college expenses or to plan for your retirement.
Please note that regular investing does not guarantee a profit or protect against loss in a declining market. Before arranging a systematic investment plan, consider your financial ability to continue making purchases in periods when prices are low.
Systematic exchange You can make regular transfers from one Putnam fund to another Putnam fund. There are no additional fees for this service, and you can cancel or change your options at any time.
Dividends PLUS You can choose to have the dividend distributions from one of your Putnam funds automatically reinvested in another Putnam fund at no additional charge.
Free exchange privilege You can exchange money between Putnam funds free of charge, as long as they are the same class of shares. A signature guarantee is required if you are exchanging more than $500,000. The fund reserves the right to revise or terminate the exchange privilege.
Reinstatement privilege If you’ve sold Putnam shares or received a check for a dividend or capital gain, you may reinvest the proceeds with Putnam within 90 days of the transaction and they will be reinvested at the fund’s current net asset value — with no sales charge. However, reinstatement of class B shares may have special tax consequences. Ask your financial or tax representative for details.
Check-writing service You have ready access to many Putnam accounts. It’s as simple as writing a check, and there are no special fees or service charges. For more information about the check-writing service, call Putnam or visit our website.
Dollar cost averaging When you’re investing for long-term goals, it’s time, not timing, that counts. Investing on a systematic basis is a better strategy than trying to figure out when the markets will go up or down. This means investing the same amount of money regularly over a long period. This method of investing is called dollar cost averaging. When a fund’s share price declines, your investment dollars buy more shares at lower prices. When it increases, they buy fewer shares. Over time, you will pay a lower average price per share.
For more information
Visit the Individual Investors section at putnam.com A secure section of our website contains complete information on your account, including balances and transactions, updated daily. You may also conduct transactions, such as exchanges, additional investments, and address changes. Log on today to get your password.
Call us toll free at 1-800-225-1581 Ask a helpful Putnam representative or your financial advisor for details about any of these or other services, or see your prospectus.
116 Diversified Income Trust
Fund information
Founded over 75 years ago, Putnam Investments was built around the concept that a balance between risk and reward is the hallmark of a well-rounded financial program. We manage over 100 funds across income, value, blend, growth, asset allocation, absolute return, and global sector categories.
Investment Manager
Putnam Investment Management, LLC One Post Office Square Boston, MA 02109
Investment Sub-Manager
Putnam Investments Limited 57–59 St James’s Street London, England SW1A 1LD
Marketing Services
Putnam Retail Management One Post Office Square Boston, MA 02109
Custodian
State Street Bank and Trust Company
Legal Counsel
Ropes & Gray LLP
Trustees
Jameson A. Baxter, Chair Liaquat Ahamed Ravi Akhoury Barbara M. Baumann Charles B. Curtis Robert J. Darretta Katinka Domotorffy John A. Hill Paul L. Joskow Kenneth R. Leibler Robert E. Patterson George Putnam, III Robert L. Reynolds W. Thomas Stephens
Officers
Robert L. Reynolds President
Jonathan S. Horwitz Executive Vice President, Principal Executive Officer, and Compliance Liaison
Steven D. Krichmar Vice President and Principal Financial Officer
Robert T. Burns Vice President and Chief Legal Officer
Robert R. Leveille Vice President and Chief Compliance Officer
Michael J. Higgins Vice President, Treasurer, and Clerk
Janet C. Smith Vice President, Principal Accounting Officer, and Assistant Treasurer
Susan G. Malloy Vice President and Assistant Treasurer
James P. Pappas Vice President
Mark C. Trenchard Vice President and BSA Compliance Officer
Nancy E. Florek Vice President, Director of Proxy Voting and Corporate Governance, Assistant Clerk, and Associate Treasurer
This report is for the information of shareholders of Putnam Diversified Income Trust. It may also be used as sales literature when preceded or accompanied by the current prospectus, the most recent copy of Putnam’s Quarterly Performance Summary, and Putnam’s Quarterly Ranking Summary. For more recent performance, please visit putnam.com. Investors should carefully consider the investment objectives, risks, charges, and expenses of a fund, which are described in its prospectus. For this and other information or to request a prospectus or summary prospectus, call 1-800-225-1581 toll free. Please read the prospectus carefully before investing. The fund’s Statement of Additional Information contains additional information about the fund’s Trustees and is available without charge upon request by calling 1-800-225-1581.
Item 2. Code of Ethics:
Not applicable
Item 3. Audit Committee Financial Expert:
Not applicable
Item 4. Principal Accountant Fees and Services:
Not applicable
Item 5. Audit Committee of Listed Registrants
Not applicable
Item 6. Schedule of Investments:
The registrant’s schedule of investments in unaffiliated issuers is included in the report to shareholders in Item 1 above.
Item 7. Disclosure of Proxy Voting Policies and Procedures For Closed-End Management Investment Companies:
Not applicable
Item 8. Portfolio Managers of Closed-End Investment Companies
Not Applicable
Item 9. Purchases of Equity Securities by Closed-End Management Investment Companies and Affiliated Purchasers:
Not applicable
Item 10. Submission of Matters to a Vote of Security Holders:
Not applicable
Item 11. Controls and Procedures:
(a) The registrant’s principal executive officer and principal financial officer have concluded, based on their evaluation of the effectiveness of the design and operation of the registrant’s disclosure controls and procedures as of a date within 90 days of the filing date of this report, that the design and operation of such procedures are generally effective to provide reasonable assurance that information required to be disclosed by the registrant in this report is recorded, processed, summarized and reported within the time periods specified in the Commission’s rules and forms.
(b) Changes in internal control over financial reporting: Not applicable
Item 12. Exhibits:
(a)(1) Not applicable
(a)(2) Separate certifications for the principal executive officer and principal financial officer of the registrant as required by Rule 30a-2(a) under the Investment Company Act of 1940, as amended, are filed herewith.
(b) The certifications required by Rule 30a-2(b) under the Investment Company Act of 1940, as amended, are filed herewith.
Putnam Diversified Income Trust
By (Signature and Title):
/s/ Janet C. Smith Janet C. Smith Principal Accounting Officer
Date: May 29, 2015
Pursuant to the requirements of the Securities Exchange Act of 1934 and the Investment Company Act of 1940, this report has been signed below by the following persons on behalf of the registrant and in the capacities and on the dates indicated.
By (Signature and Title):
/s/ Jonathan S. Horwitz Jonathan S. Horwitz Principal Executive Officer
Date: May 29, 2015
By (Signature and Title):
/s/ Steven D. Krichmar Steven D. Krichmar Principal Financial Officer
Date: May 29, 2015
We use cookies on this site to provide a more responsive and personalized service. Continuing to browse, clicking I Agree, or closing this banner indicates agreement. See our Cookie Policy for more information.