UNITED STATES
SECURITIES AND EXCHANGE COMMISSION
Washington, D.C. 20549
FORM N-CSRS
CERTIFIED SHAREHOLDER REPORT OF REGISTERED
MANAGEMENT INVESTMENT COMPANIES
Investment Company Act file number 811-05583
| Franklin Templeton Variable Insurance Products Trust |
(Exact name of registrant as specified in charter)
| One Franklin Parkway, San Mateo, CA 94403-1906 |
(Address of principal executive offices) (Zip code)
| Craig S. Tyle, One Franklin Parkway, San Mateo, CA 94403-1906 |
(Name and address of agent for service)
Registrant’s telephone number, including area code: (650) 312-2000
Date of fiscal year end: 12/31
Date of reporting period: 06/30/12
| Item 1. | Reports to Stockholders. |

JUNE 30, 2012
FRANKLIN TEMPLETON
VARIABLE INSURANCE PRODUCTS TRUST
SEMIANNUAL
REPORT

FRANKLIN TEMPLETON VARIABLE INSURANCE
PRODUCTS TRUST SEMIANNUAL REPORT
TABLEOF CONTENTS
| i | ||||
| FFC-1 | ||||
*Statement of Additional Information Supplement | FFC-7 | |||
| FH-1 | ||||
| FI-1 | ||||
| FRD-1 | ||||
| FSV-1 | ||||
| FSV-7 | ||||
| FSC-1 | ||||
| FSI-1 | ||||
| FFA-1 | ||||
| MGD-1 | ||||
| MI-1 | ||||
| MS-1 | ||||
| TD-1 | ||||
| TF-1 | ||||
| TGB-1 | ||||
| TG-1 | ||||
| I-1 | ||||
| SI-1 |
*Not part of the semiannual report
NOT FDIC INSURED | MAY LOSE VALUE | NO BANK GUARANTEE
MASTER CLASS – 4
IMPORTANT NOTESTO PERFORMANCE INFORMATION
Performance data is historical and cannot predict or guarantee future results. Principal value and investment return will fluctuate with market conditions, and you may have a gain or loss when you withdraw your money. Inception dates of the funds may have preceded the effective dates of the subaccounts, contracts, or their availability in all states.
When reviewing the index comparisons, please keep in mind that indexes have a number of inherent performance differentials over the funds. First, unlike the funds, which must hold a minimum amount of cash to maintain liquidity, indexes do not have a cash component. Second, the funds are actively managed and, thus, are subject to management fees to cover salaries of securities analysts or portfolio managers in addition to other expenses. Indexes are unmanaged and do not include any commissions or other expenses typically associated with investing in securities. Third, indexes often contain a different mix of securities than the fund to which they are compared. Additionally, please remember that indexes are simply a measure of performance and cannot be invested in directly.
i
FRANKLIN FLEX CAP GROWTH SECURITIES FUND
This semiannual report for Franklin Flex Cap Growth Securities Fund covers the period ended June 30, 2012.
Performance Summary as of 6/30/12
Franklin Flex Cap Growth Securities Fund – Class 4 delivered a +7.74% total return* for the six-month period ended 6/30/12.
*The investment manager and administrator have contractually agreed to waive or assume certain expenses so that common expenses of the Fund (excluding Rule 12b-1 fees and acquired fund fees and expenses) do not exceed 0.68% (other than certain nonroutine expenses) until 4/30/13. Fund investment results reflect the expense reduction, without which the results would have been lower.
Performance reflects the Fund’s Class 4 operating expenses, but does not include any contract fees, expenses or sales charges. If they had been included, performance would be lower. These charges and deductions, particularly for variable life policies, can have a significant effect on contract values and insurance benefits. See the contract prospectus for a complete description of these expenses, including sales charges.
Franklin Flex Cap Growth Securities Fund – Class 4
Performance data represent past performance, which does not guarantee future results. Investment return and principal value will fluctuate, and you may have a gain or loss when you sell your shares. Current performance may differ from figures shown.
FFC-1
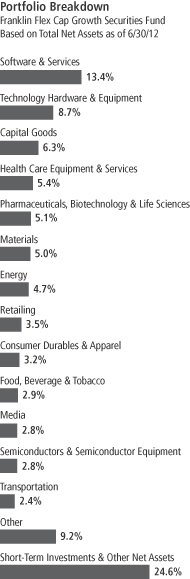
Fund Goal and Main Investments: Franklin Flex Cap Growth Securities Fund seeks capital appreciation. Under normal market conditions, the Fund invests predominantly in equity securities of companies that the investment manager believes have the potential for capital appreciation.
Performance Overview
You can find the Fund’s six-month total return in the Performance Summary. The Fund underperformed the Russell 1000® Growth Index, which had a +10.08% total return, and the Russell 3000® Growth Index, which had a +9.98% total return, for the same period.1
Economic and Market Overview
The U.S. economy, as measured by gross domestic product, grew modestly during the six-month period ended June 30, 2012. In the first quarter, personal income and spending rose, while federal, state and local government spending declined. The national unemployment rate for June 2012 stood at 8.2%, compared with 8.5% at the start of the period.2 Jobless claims touched a four-year low in February amid robust job creation; however, hiring slowed during the remainder of the period and jobless claims at period-end reached January’s level. Industrial production and manufacturing activity continued to increase, but the manufacturing sector shrank unexpectedly in June. Although gasoline prices hit a peak in early April, they plunged to a five-month low near period-end due to lower crude oil prices. In keeping with its goal to strengthen U.S. economic recovery by fostering increased employment while keeping inflation in check, during June the Federal Reserve Board (Fed) extended through 2012 its program (dubbed Operation Twist) to buy long-term Treasuries in an attempt to lower long-term yields. The Fed also reaffirmed its intention to keep the federal funds target rate low at least through late 2014.
During late March and early April 2012, improved economic reports helped U.S. stock markets reach multi-year highs. The Dow Jones Industrial Average exceeded 13,000 and the Standard & Poor’s® 500 Index topped 1,400 for the first time since 2008, while the NASDAQ Composite Index hit an 11-year high.3 Global markets grew volatile, however, amid renewed concerns about eurozone debt and slowing
1. Source: © 2012 Morningstar. One cannot invest directly in an index, and an index is not representative of the Fund’s portfolio. Please see Index Descriptions following the Fund Summaries.
2. Source: Bureau of Labor Statistics.
3. Please see Index Descriptions following the Fund Summaries.
Fund Risks: All investments involve risks, including possible loss of principal. Investors should be comfortable with fluctuations in the value of their investments, as small- and midsized-company stocks can be volatile, especially over the short term. Smaller, midsized and relatively new or unseasoned companies can be particularly sensitive to changing economic conditions, and their prospects for growth are less certain than those of larger, more established companies. The Fund may focus on particular sectors of the market from time to time, which can carry greater risks of adverse developments in such sectors. The Fund is actively managed but there is no guarantee that the manager’s investment decisions will produce the desired results. The Fund’s prospectus also includes a description of the main investment risks.
FFC-2
global economic growth. Fears of a Greek debt default and exit from the eurozone were somewhat mitigated by secured bailout financing and bondholder concessions in February, as well as elections in May and June that resulted in the formation of a new coalition government. Risk-averse investors seeking safety drove U.S. Treasury yields to historical lows during the period.
At the end of the reporting period, significant challenges to the U.S. economy remained, including weak jobs reports, lack of broad public and political agreement on how to achieve U.S. deficit reduction, and uncertainty surrounding deeply indebted European countries including Greece, Italy and Spain. Signs of China’s economic growth slowdown further contributed to pessimism. Although long-term resolution of European debt issues remained unclear, the European Central Bank’s latest plan to allow the European Stability Mechanism to directly recapitalize troubled banks throughout the eurozone, as well as a late-June proposal leaning toward fiscal and banking union, supported cautious optimism in U.S. and global markets.
Investment Strategy
We use fundamental, bottom-up research to seek companies meeting our criteria of growth potential, quality and valuation. In seeking sustainable growth characteristics, we look for companies we believe can produce sustainable earnings and cash flow growth, evaluating the long-term market opportunity and competitive structure of an industry to target leaders and emerging leaders. We define quality companies as those with strong and improving competitive positions in attractive markets. We also believe important attributes of quality are experienced and talented management teams as well as financial strength reflected in the capital structure, gross and operating margins, free cash flow generation and returns on capital employed. Our valuation analysis includes a range of potential outcomes based on an assessment of multiple scenarios. In assessing value, we consider whether security prices fully reflect the balance of the sustainable growth opportunities relative to business and financial risks.
Manager’s Discussion
From a sector perspective, stock selection in the consumer staples, health care and consumer discretionary sectors contributed to the Fund’s performance relative to the Russell 3000® Growth Index during
FFC-3
the six months under review.4 In the consumer staples sector, our holdings in energy drink maker Monster Beverage, natural and organic foods retailer Whole Foods Market and infant formula producer Mead Johnson Nutrition aided results. Health care information technology developer Cerner and heart valve maker Edwards Lifesciences in the health care sector also benefited the Fund. Among our consumer discretionary holdings, discount retailer Dollar General boosted Fund performance.
In contrast, stock selection in the energy, materials and industrials sectors constrained relative Fund performance.5 Among our energy holdings, independent energy company SM Energy, oilfield services company Key Energy Services and independent exploration and production company Whiting Petroleum were notable detractors. Materials holdings including chemical manufacturer Celanese, precious metal producer Goldcorp6 and industrial gas provider Praxair also hurt relative results. Key detractors in the industrials sector included solid waste services provider Waste Connections, industrial supply company Fastenal and power, control and information solution provider Rockwell Automation. Our underweighting in Apple in information technology also hindered relative Fund performance, as the computer hardware and software developer benefited from global demand for its iPhone and iPad products.
Fund cash levels were briefly elevated — as reflected in figures for the end of the period — by certain shareholder transactions.
Thank you for your participation in Franklin Flex Cap Growth Securities Fund. We look forward to serving your future investment needs.
4. The consumer staples sector comprises food and staples retailing; and food, beverage and tobacco in the SOI. The health care sector comprises health care equipment and services; and pharmaceuticals, biotechnology and life sciences in the SOI. The consumer discretionary sector comprises automobiles and components, consumer durables and apparel, consumer services, media, and retailing in the SOI.
5. The energy sector comprises energy in the SOI. The materials sector comprises materials in the SOI. The industrials sector comprises capital goods, commercial and professional services, and transportation in the SOI.
6. Not an index component.
The foregoing information reflects our analysis, opinions and portfolio holdings as of June 30, 2012, the end of the reporting period. The way we implement our main investment strategies and the resulting portfolio holdings may change depending on factors such as market and economic conditions. These opinions may not be relied upon as investment advice or an offer for a particular security. The information is not a complete analysis of every aspect of any market, country, industry, security or the Fund. Statements of fact are from sources considered reliable, but the investment manager makes no representation or warranty as to their completeness or accuracy. Although historical performance is no guarantee of future results, these insights may help you understand our investment management philosophy.
Top 10 Holdings
Franklin Flex Cap Growth Securities Fund
6/30/12
| Company Sector/Industry | % of Total Net Assets | |||
| Apple Inc. | 4.3% | |||
| Technology Hardware & Equipment | ||||
| Praxair Inc. | 1.8% | |||
| Materials | ||||
| International Business Machines Corp. | 1.5% | |||
| Software & Services | ||||
| EMC Corp. | 1.5% | |||
| Technology Hardware & Equipment | ||||
| Visa Inc., A | 1.4% | |||
| Software & Services | ||||
| MasterCard Inc., A | 1.4% | |||
| Software & Services | ||||
| Dollar General Corp. | 1.3% | |||
| Retailing | ||||
| Discovery Communications Inc., C | 1.3% | |||
| Media | ||||
| United Technologies Corp. | 1.3% | |||
| Capital Goods | ||||
| Chevron Corp. | 1.2% | |||
| Energy | ||||
The dollar value, number of shares or principal amount, and names of all portfolio holdings are listed in the Fund’s Statement of Investments (SOI).
FFC-4
Fund Expenses
As an investor in a variable insurance contract (Contract) that indirectly provides for investment in an underlying mutual fund, you can incur transaction and/or ongoing expenses at both the Fund level and the Contract level.
| • | Transaction expenses can include sales charges (loads) on purchases, surrender fees, transfer fees and premium taxes. |
| • | Ongoing expenses can include management fees, distribution and service (12b-1) fees, contract fees, annual maintenance fees, mortality and expense risk fees and other fees and expenses. All mutual funds and Contracts have some types of ongoing expenses. |
The expenses shown in the table are meant to highlight ongoing expenses at the Fund level only and do not include ongoing expenses at the Contract level, or transaction expenses at either the Fund or Contract levels. While the Fund does not have transaction expenses, if the transaction and ongoing expenses at the Contract level were included, the expenses shown below would be higher. You should consult your Contract prospectus or disclosure document for more information.
The table shows Fund-level ongoing expenses and can help you understand these expenses and compare them with those of other mutual funds offered through the Contract. The table assumes a $1,000 investment held for the six months indicated. Please refer to the Fund prospectus for additional information on operating expenses.
Actual Fund Expenses
The first line (Actual) of the table provides actual account values and expenses. The “Ending Account Value” is derived from the Fund’s actual return, which includes the effect of ongoing Fund expenses, but does not include the effect of ongoing Contract expenses.
You can estimate the Fund-level expenses you incurred during the period by following these steps. Of course, your account value and expenses will differ from those in this illustration:
| 1. | Divide your account value by $1,000. |
If an account had an $8,600 value, then $8,600 ÷ $1,000 = 8.6.
| 2. | Multiply the result by the number under the heading “Fund-Level Expenses Incurred During Period.” |
If Fund-Level Expenses Incurred During Period were $7.50, then 8.6 x $7.50 = $64.50.
In this illustration, the estimated expenses incurred this period at the Fund level are $64.50.
Franklin Flex Cap Growth Securities Fund – Class 4
FFC-5
Hypothetical Example for Comparison with Other Mutual Funds
Information in the second line (Hypothetical) of the table can help you compare ongoing expenses of the Fund with those of other mutual funds offered through the Contract. This information may not be used to estimate the actual ending account balance or expenses you incurred during the period. The hypothetical “Ending Account Value” is based on the Fund’s actual expense ratio and an assumed 5% annual rate of return before expenses, which does not represent the Fund’s actual return. The figure under the heading “Fund-Level Expenses Incurred During Period” shows the hypothetical expenses your account would have incurred under this scenario. You can compare this figure with the 5% hypothetical examples that appear in shareholder reports of other funds offered through a Contract.
| Class 4 | Beginning Account Value 1/1/12 | Ending Account Value 6/30/12 | Fund-Level Expenses Incurred During Period* 1/1/12–6/30/12 | |||||||||
Actual | $ | 1,000 | $ | 1,077.40 | $ | 5.32 | ||||||
Hypothetical (5% return before expenses) | $ | 1,000 | $ | 1,019.74 | $ | 5.17 | ||||||
*Expenses are calculated using the most recent six-month annualized expense ratio, net of expense waivers, for the Fund’s Class 4 shares (1.03%), which does not include any ongoing expenses of the Contract for which the Fund is an investment option, multiplied by the average account value over the period, multiplied by 182/366 to reflect the one-half year period.
FFC-6
SUPPLEMENT DATED AUGUST 15, 2012
TOTHE STATEMENTOF
ADDITIONAL INFORMATION DATED MAY 1, 2012OF
Franklin Flex Cap Growth Securities Fund
(A series of Franklin Templeton Variable Insurance Products Trust)
The Statement of Additional Information is amended as follows:
The section beginning on page 12 entitled “Glossary of Investments, Techniques, Strategies and Their Risks” is revised to add the following:
Exchange-traded funds. The Fund may invest in exchange-traded funds (ETFs). ETFs are regulated as registered investment companies under the 1940 Act. Many ETFs acquire and hold securities of all of the companies or other issuers, or a representative sampling of companies or other issuers, that are components of a particular index. Such ETFs are intended to provide investment results that, before expenses, generally correspond to the price and yield performance of the corresponding market index, and the value of their shares should, under normal circumstances, closely track the value of the index’s underlying component securities. Because an ETF has operating expenses and transaction costs, while a market index does not, ETFs that track particular indices typically will be unable to match the performance of the index exactly. ETF shares may be purchased and sold in the secondary trading market on a securities exchange, in lots of any size, at any time during the trading day. More recently, actively managed ETFs have been created that are managed similarly to other investment companies.
The shares of an ETF may be assembled in a block (typically 50,000 shares) known as a creation unit and redeemed in kind for a portfolio of the underlying securities (based on the ETF’s net asset value) together with a cash payment generally equal to accumulated dividends as of the date of redemption. Conversely, a creation unit may be purchased from the ETF by depositing a specified portfolio of the ETF’s underlying securities, as well as a cash payment generally equal to accumulated dividends of the securities (net of expenses) up to the time of deposit. ETF shares, as opposed to creation units, are generally purchased and sold by smaller investors in a secondary market on a securities exchange.
ETF shares can be traded in lots of any size, at any time during the trading day. Although the Fund, like most other investors in ETFs, intends to purchase and sell ETF shares primarily in the secondary trading market, the Fund may redeem creation units for the underlying securities (and any applicable cash), and may assemble a portfolio of the underlying securities and use it (and any required cash) to purchase creation units, if the investment manager believes it is in the Fund’s best interest to do so.
An investment in an ETF is subject to all of the risks of investing in the securities held by the ETF and have the same risks as investing in a closed-end fund. In addition, because of the ability of large market participants to arbitrage price differences by purchasing or redeeming creation units, the difference between the market value and the net asset value of ETF shares should in most cases be small. An ETF may be terminated and need to liquidate its portfolio securities at a time when the prices for those securities are falling.
Please keep this supplement for future reference.
FFC-7
Franklin Templeton Variable Insurance Products Trust
Financial Highlights
Franklin Flex Cap Growth Securities Fund
Six Months (unaudited) | Year Ended December 31, | |||||||||||||||||||||||
| Class 2 | 2011 | 2010 | 2009 | 2008 | 2007 | |||||||||||||||||||
| ||||||||||||||||||||||||
Per share operating performance | ||||||||||||||||||||||||
(for a share outstanding throughout the period) | ||||||||||||||||||||||||
Net asset value, beginning of period | $ | 12.09 | $ | 12.70 | $ | 10.93 | $ | 8.22 | $ | 12.72 | $ | 11.14 | ||||||||||||
|
| |||||||||||||||||||||||
Income from investment operationsa: | ||||||||||||||||||||||||
Net investment income (loss)b | (0.01 | ) | (0.02 | ) | (0.02 | ) | (— | )c | — | c | 0.04 | |||||||||||||
Net realized and unrealized gains (losses) | 0.95 | (0.59 | ) | 1.79 | 2.71 | (4.49 | ) | 1.55 | ||||||||||||||||
|
| |||||||||||||||||||||||
Total from investment operations | 0.94 | (0.61 | ) | 1.77 | 2.71 | (4.49 | ) | 1.59 | ||||||||||||||||
|
| |||||||||||||||||||||||
Less distributions from net investment income | — | — | — | — | (0.01 | ) | (0.01 | ) | ||||||||||||||||
|
| |||||||||||||||||||||||
Net asset value, end of period | $ | 13.03 | $ | 12.09 | $ | 12.70 | $ | 10.93 | $ | 8.22 | $ | 12.72 | ||||||||||||
|
| |||||||||||||||||||||||
Total returnd | 7.78% | (4.80)% | 16.19% | 32.97% | (35.31)% | 14.32% | ||||||||||||||||||
Ratios to average net assetse | ||||||||||||||||||||||||
Expenses before waiver and payments by affiliates | 1.17% | 1.16% | 1.18% | 1.19% | 1.21% | 1.25% | ||||||||||||||||||
Expenses net of waiver and payments by affiliates | 0.93% | 0.93% | 0.93% | 0.93% | f | 0.93% | 0.93% | f | ||||||||||||||||
Net investment income (loss) | (0.15)% | (0.14)% | (0.17)% | (0.01)% | 0.04% | 0.31% | ||||||||||||||||||
Supplemental data | ||||||||||||||||||||||||
Net assets, end of period (000’s) | $ | 192,328 | $ | 188,527 | $ | 227,774 | $ | 244,768 | $ | 195,425 | $ | 206,218 | ||||||||||||
Portfolio turnover rate | 15.73% | 63.99% | 60.00% | 33.64% | 32.76% | 30.15% | ||||||||||||||||||
aThe amount shown for a share outstanding throughout the period may not correlate with the Statement of Operations for the period due to the timing of sales and repurchases of the Fund shares in relation to income earned and/or fluctuating market value of the investments of the Fund.
bBased on average daily shares outstanding.
cAmount rounds to less than $0.01 per share.
dTotal return does not include fees, charges or expenses imposed by the variable annuity and life insurance contracts for which the Franklin Templeton Variable Insurance Products Trust serves as an underlying investment vehicle. Total return is not annualized for periods less than one year.
eRatios are annualized for periods less than one year.
fBenefit of expense reduction rounds to less than 0.01%.
The accompanying notes are an integral part of these financial statements.
FFC-8
Franklin Templeton Variable Insurance Products Trust
Financial Highlights (continued)
Franklin Flex Cap Growth Securities Fund
Six Months (unaudited) | Year Ended December 31, | |||||||||||||||||||
| Class 4 | 2011 | 2010 | 2009 | 2008a | ||||||||||||||||
| ||||||||||||||||||||
Per share operating performance | ||||||||||||||||||||
(for a share outstanding throughout the period) | ||||||||||||||||||||
Net asset value, beginning of period | $ | 12.01 | $ | 12.63 | $ | 10.88 | $ | 8.21 | $ | 11.22 | ||||||||||
|
| |||||||||||||||||||
Income from investment operationsb: | ||||||||||||||||||||
Net investment income (loss)c | (0.02 | ) | (0.03 | ) | (0.03 | ) | (0.01 | ) | — | d | ||||||||||
Net realized and unrealized gains (losses) | 0.95 | (0.59 | ) | 1.78 | 2.69 | (2.98 | ) | |||||||||||||
|
| |||||||||||||||||||
Total from investment operations | 0.93 | (0.62 | ) | 1.75 | 2.68 | (2.98 | ) | |||||||||||||
|
| |||||||||||||||||||
Less distributions from net investment income | — | — | — | (0.01 | ) | (0.03 | ) | |||||||||||||
|
| |||||||||||||||||||
Net asset value, end of period | $ | 12.94 | $ | 12.01 | $ | 12.63 | $ | 10.88 | $ | 8.21 | ||||||||||
|
| |||||||||||||||||||
Total returne | 7.74% | (4.91)% | 16.08% | 32.69% | (26.68)% | |||||||||||||||
Ratios to average net assetsf | ||||||||||||||||||||
Expenses before waiver and payments by affiliates | 1.27% | 1.26% | 1.28% | 1.29% | 1.31% | |||||||||||||||
Expenses net of waiver and payments by affiliates | 1.03% | 1.03% | 1.03% | 1.03% | g | 1.03% | ||||||||||||||
Net investment income (loss) | (0.25)% | (0.24)% | (0.27)% | (0.11)% | (0.06)% | |||||||||||||||
Supplemental data | ||||||||||||||||||||
Net assets, end of period (000’s) | $ | 281,387 | $ | 270,598 | $ | 263,746 | $ | 218,798 | $ | 50,268 | ||||||||||
Portfolio turnover rate | 15.73% | 63.99% | 60.00% | 33.64% | 32.76% | |||||||||||||||
aFor the period February 29, 2008 (effective date) to December 31, 2008.
bThe amount shown for a share outstanding throughout the period may not correlate with the Statement of Operations for the period due to the timing of sales and repurchases of the Fund shares in relation to income earned and/or fluctuating market value of the investments of the Fund.
cBased on average daily shares outstanding.
dAmount rounds to less than $0.01 per share.
eTotal return does not include fees, charges or expenses imposed by the variable annuity and life insurance contracts for which the Franklin Templeton Variable Insurance Products Trust serves as an underlying investment vehicle. Total return is not annualized for periods less than one year.
fRatios are annualized for periods less than one year.
gBenefit of expense reduction rounds to less than 0.01%.
The accompanying notes are an integral part of these financial statements.
FFC-9
Franklin Templeton Variable Insurance Products Trust
Statement of Investments, June 30, 2012 (unaudited)
| Franklin Flex Cap Growth Securities Fund | Shares | Value | ||||||||
Common Stocks 75.4% | ||||||||||
Automobiles & Components 1.7% | ||||||||||
aBorgWarner Inc. | 69,320 | $ | 4,546,699 | |||||||
Johnson Controls Inc. | 134,700 | 3,732,537 | ||||||||
|
| |||||||||
| 8,279,236 | ||||||||||
|
| |||||||||
Banks 1.0% | ||||||||||
aSignature Bank | 31,400 | 1,914,458 | ||||||||
Wells Fargo & Co. | 84,720 | 2,833,037 | ||||||||
|
| |||||||||
| 4,747,495 | ||||||||||
|
| |||||||||
Capital Goods 6.3% | ||||||||||
Cummins Inc. | 50,880 | 4,930,781 | ||||||||
Danaher Corp. | 71,080 | 3,701,846 | ||||||||
Fastenal Co. | 97,280 | 3,921,357 | ||||||||
Pall Corp. | 31,420 | 1,722,130 | ||||||||
Precision Castparts Corp. | 34,800 | 5,724,252 | ||||||||
Rockwell Automation Inc. | 44,300 | 2,926,458 | ||||||||
Roper Industries Inc. | 9,900 | 975,942 | ||||||||
United Technologies Corp. | 78,570 | 5,934,392 | ||||||||
|
| |||||||||
| 29,837,158 | ||||||||||
|
| |||||||||
Commercial & Professional Services 1.6% | ||||||||||
aIHS Inc., A | 13,940 | 1,501,756 | ||||||||
aStericycle Inc. | 35,910 | 3,291,870 | ||||||||
Waste Connections Inc. | 99,460 | 2,975,843 | ||||||||
|
| |||||||||
| 7,769,469 | ||||||||||
|
| |||||||||
Consumer Durables & Apparel 3.2% | ||||||||||
aLululemon Athletica Inc. (Canada) | 42,360 | 2,525,927 | ||||||||
NIKE Inc., B | 38,510 | 3,380,408 | ||||||||
Ralph Lauren Corp. | 30,030 | 4,206,002 | ||||||||
aUnder Armour Inc., A | 53,920 | 5,094,361 | ||||||||
|
| |||||||||
| 15,206,698 | ||||||||||
|
| |||||||||
Consumer Services 0.7% | ||||||||||
aChipotle Mexican Grill Inc. | 4,770 | 1,812,362 | ||||||||
Wynn Resorts Ltd. | 12,710 | 1,318,281 | ||||||||
|
| |||||||||
| 3,130,643 | ||||||||||
|
| |||||||||
Diversified Financials 1.1% | ||||||||||
BlackRock Inc. | 10,870 | 1,845,943 | ||||||||
T. Rowe Price Group Inc. | 51,680 | 3,253,773 | ||||||||
|
| |||||||||
| 5,099,716 | ||||||||||
|
| |||||||||
Energy 4.7% | ||||||||||
Anadarko Petroleum Corp. | 40,820 | 2,702,284 | ||||||||
aCameron International Corp. | 15,400 | 657,734 | ||||||||
Chevron Corp. | 54,630 | 5,763,465 | ||||||||
aFMC Technologies Inc. | 52,380 | 2,054,867 | ||||||||
aKey Energy Services Inc. | 187,060 | 1,421,656 | ||||||||
QEP Resources Inc. | 73,170 | 2,192,905 | ||||||||
Schlumberger Ltd. | 42,650 | 2,768,412 | ||||||||
SM Energy Co. | 32,220 | 1,582,324 | ||||||||
aWhiting Petroleum Corp. | 77,020 | 3,167,062 | ||||||||
|
| |||||||||
| 22,310,709 | ||||||||||
|
| |||||||||
Food & Staples Retailing 0.8% | ||||||||||
Whole Foods Market Inc. | 41,150 | 3,922,418 | ||||||||
|
| |||||||||
FFC-10
Franklin Templeton Variable Insurance Products Trust
Statement of Investments, June 30, 2012 (unaudited) (continued)
| Franklin Flex Cap Growth Securities Fund | Shares | Value | ||||||||
Common Stocks (continued) | ||||||||||
Food, Beverage & Tobacco 2.9% | ||||||||||
The Coca-Cola Co. | 15,090 | $ | 1,179,887 | |||||||
Mead Johnson Nutrition Co., A | 64,440 | 5,188,065 | ||||||||
aMonster Beverage Corp. | 47,760 | 3,400,512 | ||||||||
PepsiCo Inc. | 54,250 | 3,833,305 | ||||||||
|
| |||||||||
| 13,601,769 | ||||||||||
|
| |||||||||
Health Care Equipment & Services 5.4% | ||||||||||
aCerner Corp. | 67,350 | 5,567,151 | ||||||||
aDaVita Inc. | 21,970 | 2,157,674 | ||||||||
aDexCom Inc. | 130,420 | 1,690,243 | ||||||||
aEdwards Lifesciences Corp. | 28,060 | 2,898,598 | ||||||||
aExpress Scripts Holding Co. | 88,580 | 4,945,421 | ||||||||
aIDEXX Laboratories Inc. | 4,900 | 471,037 | ||||||||
aIntuitive Surgical Inc. | 8,860 | 4,906,579 | ||||||||
McKesson Corp. | 32,450 | 3,042,188 | ||||||||
|
| |||||||||
| 25,678,891 | ||||||||||
|
| |||||||||
Insurance 1.2% | ||||||||||
ACE Ltd. | 39,040 | 2,894,035 | ||||||||
Aflac Inc. | 68,620 | 2,922,526 | ||||||||
|
| |||||||||
| 5,816,561 | ||||||||||
|
| |||||||||
Materials 5.0% | ||||||||||
Airgas Inc. | 4,500 | 378,045 | ||||||||
Albemarle Corp. | 44,900 | 2,677,836 | ||||||||
Celanese Corp., A | 86,200 | 2,984,244 | ||||||||
Ecolab Inc. | 74,830 | 5,128,100 | ||||||||
Goldcorp Inc. (Canada) | 101,020 | 3,796,332 | ||||||||
Praxair Inc. | 78,570 | 8,542,916 | ||||||||
|
| |||||||||
| 23,507,473 | ||||||||||
|
| |||||||||
Media 2.8% | ||||||||||
aDIRECTV, A | 86,050 | 4,200,961 | ||||||||
aDiscovery Communications Inc., C | 119,390 | 5,980,245 | ||||||||
The Walt Disney Co. | 64,600 | 3,133,100 | ||||||||
|
| |||||||||
| 13,314,306 | ||||||||||
|
| |||||||||
Pharmaceuticals, Biotechnology & Life Sciences 5.1% | ||||||||||
Abbott Laboratories | 79,650 | 5,135,036 | ||||||||
Allergan Inc. | 12,830 | 1,187,673 | ||||||||
aBiogen Idec Inc. | 25,430 | 3,671,584 | ||||||||
aCelgene Corp. | 26,190 | 1,680,350 | ||||||||
Merck & Co. Inc. | 97,280 | 4,061,440 | ||||||||
Novo Nordisk AS, ADR (Denmark) | 3,000 | 436,020 | ||||||||
Perrigo Co. | 8,400 | 990,612 | ||||||||
aWaters Corp. | 35,260 | 2,802,112 | ||||||||
aWatson Pharmaceuticals Inc. | 53,920 | 3,989,541 | ||||||||
|
| |||||||||
| 23,954,368 | ||||||||||
|
| |||||||||
Real Estate 1.1% | ||||||||||
American Tower Corp. | 77,020 | 5,384,468 | ||||||||
|
| |||||||||
Retailing 3.5% | ||||||||||
aAmazon.com Inc. | 13,090 | 2,989,102 | ||||||||
Dick’s Sporting Goods Inc. | 64,350 | 3,088,800 | ||||||||
aDollar General Corp. | 117,460 | 6,388,649 | ||||||||
FFC-11
Franklin Templeton Variable Insurance Products Trust
Statement of Investments, June 30, 2012 (unaudited) (continued)
| Franklin Flex Cap Growth Securities Fund | Shares | Value | ||||||||
Common Stocks (continued) | ||||||||||
Retailing (continued) | ||||||||||
Guess? Inc. | 56,130 | $ | 1,704,668 | |||||||
aPriceline.com Inc. | 3,070 | 2,040,076 | ||||||||
Ulta Salon Cosmetics & Fragrance Inc. | 5,500 | 513,590 | ||||||||
|
| |||||||||
| 16,724,885 | ||||||||||
|
| |||||||||
Semiconductors & Semiconductor Equipment 2.8% | ||||||||||
Avago Technologies Ltd. (Singapore) | 80,750 | 2,898,925 | ||||||||
Intel Corp. | 112,250 | 2,991,462 | ||||||||
aLam Research Corp. | 12,480 | 470,995 | ||||||||
Microchip Technology Inc. | 104,770 | 3,465,792 | ||||||||
Xilinx Inc. | 101,530 | 3,408,362 | ||||||||
|
| |||||||||
| 13,235,536 | ||||||||||
|
| |||||||||
Software & Services 13.4% | ||||||||||
aBottomline Technologies Inc. | 72,530 | 1,309,167 | ||||||||
aCheck Point Software Technologies Ltd. (Israel) | 48,640 | 2,412,058 | ||||||||
aCitrix Systems Inc. | 52,380 | 4,396,777 | ||||||||
aCognizant Technology Solutions Corp., A | 46,210 | 2,772,600 | ||||||||
aeBay Inc. | 28,330 | 1,190,143 | ||||||||
aFacebook Inc., A | 61,620 | 1,917,614 | ||||||||
FactSet Research Systems Inc. | 23,570 | 2,190,596 | ||||||||
aFortinet Inc. | 82,310 | 1,911,238 | ||||||||
aInformatica Corp. | 111,680 | 4,730,765 | ||||||||
International Business Machines Corp. | 37,360 | 7,306,869 | ||||||||
MasterCard Inc., A | 14,960 | 6,434,446 | ||||||||
aNuance Communications Inc. | 134,300 | 3,199,026 | ||||||||
Oracle Corp. | 168,360 | 5,000,292 | ||||||||
aRed Hat Inc. | 88,580 | 5,002,998 | ||||||||
aSalesforce.com Inc. | 25,030 | 3,460,648 | ||||||||
aServiceSource International Inc. | 112,250 | 1,554,662 | ||||||||
aVantiv Inc., A | 40,430 | 941,615 | ||||||||
aVeriFone Systems Inc. | 40,350 | 1,335,182 | ||||||||
Visa Inc., A | 52,380 | 6,475,739 | ||||||||
|
| |||||||||
| 63,542,435 | ||||||||||
|
| |||||||||
Technology Hardware & Equipment 8.7% | ||||||||||
aAcme Packet Inc. | 84,720 | 1,580,028 | ||||||||
aApple Inc. | 34,660 | 20,241,440 | ||||||||
aAruba Networks Inc. | 42,820 | 644,441 | ||||||||
aEMC Corp. | 269,390 | 6,904,466 | ||||||||
aF5 Networks Inc. | 15,010 | 1,494,396 | ||||||||
National Instruments Corp. | 90,650 | 2,434,859 | ||||||||
QUALCOMM Inc. | 65,270 | 3,634,233 | ||||||||
aTrimble Navigation Ltd. | 92,430 | 4,252,704 | ||||||||
|
| |||||||||
| 41,186,567 | ||||||||||
|
| |||||||||
Transportation 2.4% | ||||||||||
Expeditors International of Washington Inc. | 50,060 | 1,939,825 | ||||||||
aHub Group Inc., A | 96,280 | 3,485,336 | ||||||||
Kansas City Southern | 74,830 | 5,205,175 | ||||||||
aSpirit Airlines Inc. | 26,960 | 524,641 | ||||||||
|
| |||||||||
| 11,154,977 | ||||||||||
|
| |||||||||
Total Common Stocks (Cost $253,371,717) | 357,405,778 | |||||||||
|
| |||||||||
FFC-12
Franklin Templeton Variable Insurance Products Trust
Statement of Investments, June 30, 2012 (unaudited) (continued)
| Franklin Flex Cap Growth Securities Fund | Shares | Value | ||||||||
Short Term Investments (Cost $9,458,914) 2.0% | ||||||||||
Money Market Funds 2.0% | ||||||||||
a,bInstitutional Fiduciary Trust Money Market Portfolio | 9,458,914 | $ | 9,458,914 | |||||||
|
| |||||||||
Total Investments (Cost $262,830,631) 77.4% | 366,864,692 | |||||||||
Other Assets, less Liabilities 22.6% | 106,850,354 | |||||||||
|
| |||||||||
Net Assets 100.0% | $ | 473,715,046 | ||||||||
|
| |||||||||
See Abbreviations on page 22.
aNon-income producing.
bSee Note 7 regarding investments in the Institutional Fiduciary Trust Money Market Portfolio.
The accompanying notes are an integral part of these financial statements.
FFC-13
Franklin Templeton Variable Insurance Products Trust
Financial Statements
Statement of Assets and Liabilities
June 30, 2012 (unaudited)
| Franklin Flex Cap Growth Securities Fund | ||||
Assets: | ||||
Investments in securities: | ||||
Cost - Unaffiliated issuers | $ | 253,371,717 | ||
Cost - Sweep Money Fund (Note 7) | 9,458,914 | |||
|
| |||
Total cost of investments | $ | 262,830,631 | ||
|
| |||
Value - Unaffiliated issuers | $ | 357,405,778 | ||
Value - Sweep Money Fund (Note 7) | 9,458,914 | |||
|
| |||
Total value of investments | 366,864,692 | |||
Receivables: | ||||
Investment securities sold | 115,543,524 | |||
Capital shares sold | 130,974 | |||
Dividends and interest | 254,932 | |||
Other assets | 9,923 | |||
|
| |||
Total assets | 482,804,045 | |||
|
| |||
Liabilities: | ||||
Payables: | ||||
Investment securities purchased | 8,164,183 | |||
Capital shares redeemed | 375,248 | |||
Affiliates | 493,174 | |||
Accrued expenses and other liabilities | 56,394 | |||
|
| |||
Total liabilities | 9,088,999 | |||
|
| |||
Net assets, at value | $ | 473,715,046 | ||
|
| |||
Net assets consist of: | ||||
Paid-in capital | $ | 378,315,484 | ||
Undistributed net investment income (loss) | (521,247 | ) | ||
Net unrealized appreciation (depreciation) | 104,034,061 | |||
Accumulated net realized gain (loss) | (8,113,252 | ) | ||
|
| |||
Net assets, at value | $ | 473,715,046 | ||
|
| |||
Class 2: | ||||
Net assets, at value | $ | 192,327,790 | ||
|
| |||
Shares outstanding | 14,764,204 | |||
|
| |||
Net asset value and maximum offering price per share | $ | 13.03 | ||
|
| |||
Class 4: | ||||
Net assets, at value | $ | 281,387,256 | ||
|
| |||
Shares outstanding | 21,743,439 | |||
|
| |||
Net asset value and maximum offering price per share | $ | 12.94 | ||
|
| |||
The accompanying notes are an integral part of these financial statements.
FFC-14
Franklin Templeton Variable Insurance Products Trust
Financial Statements (continued)
Statement of Operations
for the six months ended June 30, 2012 (unaudited)
| Franklin Flex Cap Growth Securities Fund | ||||
Investment income: | ||||
Dividends | $ | 1,919,362 | ||
Income from securities loaned | 3,085 | |||
|
| |||
Total investment income | 1,922,447 | |||
|
| |||
Expenses: | ||||
Management fees (Note 3a) | 1,584,719 | |||
Administrative fees (Note 3b) | 617,539 | |||
Distribution fees: (Note 3c) | ||||
Class 2 | 252,874 | |||
Class 4 | 511,115 | |||
Unaffiliated transfer agent fees | 410 | |||
Custodian fees (Note 4) | 3,419 | |||
Reports to shareholders | 34,555 | |||
Professional fees | 16,960 | |||
Trustees’ fees and expenses | 967 | |||
Other | 8,814 | |||
|
| |||
Total expenses | 3,031,372 | |||
Expenses waived/paid by affiliates (Note 3e) | (587,678 | ) | ||
|
| |||
Net expenses | 2,443,694 | |||
|
| |||
Net investment income (loss) | (521,247 | ) | ||
|
| |||
Realized and unrealized gains (losses): | ||||
Net realized gain (loss) from investments | 24,493,383 | |||
Net change in unrealized appreciation (depreciation) on investments | 12,969,385 | |||
|
| |||
Net realized and unrealized gain (loss) | 37,462,768 | |||
|
| |||
Net increase (decrease) in net assets resulting from operations | $ | 36,941,521 | ||
|
| |||
The accompanying notes are an integral part of these financial statements.
FFC-15
Franklin Templeton Variable Insurance Products Trust
Financial Statements (continued)
Statements of Changes in Net Assets
| Franklin Flex Cap Growth Securities Fund | ||||||||
| Six Months Ended June 30, 2012 (unaudited) | Year Ended December 31, 2011 | |||||||
| ||||||||
Increase (decrease) in net assets: | ||||||||
Operations: | ||||||||
Net investment income (loss) | $ | (521,247 | ) | $ | (951,190 | ) | ||
Net realized gain (loss) from investments | 24,493,383 | 23,226,156 | ||||||
Net change in unrealized appreciation (depreciation) on investments | 12,969,385 | (41,102,831 | ) | |||||
| ||||||||
Net increase (decrease) in net assets resulting from operations | 36,941,521 | (18,827,865 | ) | |||||
| ||||||||
Capital share transactions: (Note 2) | ||||||||
Class 2 | (11,138,170 | ) | (31,049,447 | ) | ||||
Class 4 | (11,212,871 | ) | 17,482,144 | |||||
| ||||||||
Total capital share transactions | (22,351,041 | ) | (13,567,303 | ) | ||||
| ||||||||
Net increase (decrease) in net assets | 14,590,480 | (32,395,168 | ) | |||||
Net assets: | ||||||||
Beginning of period | 459,124,566 | 491,519,734 | ||||||
| ||||||||
End of period | $ | 473,715,046 | $ | 459,124,566 | ||||
| ||||||||
Undistributed net investment income (loss) included in net assets: | ||||||||
End of period | $ | (521,247 | ) | $ | — | |||
| ||||||||
The accompanying notes are an integral part of these financial statements.
FFC-16
Franklin Templeton Variable Insurance Products Trust
Notes to Financial Statements (unaudited)
Franklin Flex Cap Growth Securities Fund
1. ORGANIZATION AND SIGNIFICANT ACCOUNTING POLICIES
Franklin Templeton Variable Insurance Products Trust (Trust) is registered under the Investment Company Act of 1940, as amended, (1940 Act) as an open-end investment company, consisting of twenty separate funds. The Franklin Flex Cap Growth Securities Fund (Fund) is included in this report. The financial statements of the remaining funds in the Trust are presented separately. Shares of the Fund are generally sold only to insurance company separate accounts to fund the benefits of variable life insurance policies or variable annuity contracts. At June 30, 2012, 77.55% of the Fund’s shares were held through one insurance company. The Fund offers two classes of shares: Class 2 and Class 4. Each class of shares differs by its distribution fees, voting rights on matters affecting a single class and its exchange privilege.
The following summarizes the Fund’s significant accounting policies.
a. Financial Instrument Valuation
The Fund’s investments in financial instruments are carried at fair value daily. Fair value is the price that would be received to sell an asset or paid to transfer a liability in an orderly transaction between market participants on the measurement date. Under procedures approved by the Trust’s Board of Trustees (the Board), the Fund’s administrator, investment manager and other affiliates have formed the Valuation and Liquidity Oversight Committee (VLOC). The VLOC provides administration and oversight of the Fund’s valuation policies and procedures, which are approved annually by the Board. Among other things, these procedures allow the Fund to utilize independent pricing services, quotations from securities and financial instrument dealers, and other market sources to determine fair value.
Equity securities listed on an exchange or on the NASDAQ National Market System are valued at the last quoted sale price or the official closing price of the day, respectively. Foreign equity securities are valued as of the close of trading on the foreign stock exchange on which the security is primarily traded, or the NYSE, whichever is earlier. The value is then converted into its U.S. dollar equivalent at the foreign exchange rate in effect at the close of the NYSE on the day that the value of the security is determined. Over-the-counter securities are valued within the range of the most recent quoted bid and ask prices. Securities that trade in multiple markets or on multiple exchanges are valued according to the broadest and most representative market. Certain equity securities are valued based upon fundamental characteristics or relationships to similar securities. Investments in open-end mutual funds are valued at the closing net asset value.
The Fund has procedures to determine the fair value of financial instruments for which market prices are not reliable or readily available. Under these procedures, the VLOC convenes on a regular basis to review such financial instruments and considers a number of factors, including significant unobservable valuation inputs, when arriving at fair value. The VLOC primarily employs a market-based approach which may use related or comparable assets or liabilities, recent transactions, market multiples, book values, and other relevant information for the investment to determine the fair value of the investment. An income-based valuation approach may also be used in which the anticipated future cash flows of the investment are discounted to calculate fair value. Discounts may also be applied due to the nature or duration of any restrictions on the disposition of the investments. Due to the inherent uncertainty of valuations of such investments, the fair values may differ significantly from the values that would have been used had an active market existed. The VLOC employs various methods for calibrating these valuation approaches including a regular review of key inputs and assumptions, transactional back-testing or disposition analysis, and reviews of any related market activity.
Trading in securities on foreign securities stock exchanges and over-the-counter markets may be completed before the daily close of business on the NYSE. Occasionally, events occur between the time at which trading in a foreign security is completed and the close of the NYSE that might call into question the reliability of the value of a portfolio security held by the Fund. As a result, differences may arise between the value of the Fund’s portfolio securities as determined at the foreign market close and the latest indications of value at the close of the NYSE. In order to minimize the potential for these differences, the VLOC monitors price movements following the close of trading in foreign stock markets through a series of country specific market proxies (such as baskets of American Depositary Receipts, futures contracts and exchange traded funds). These price movements are measured
FFC-17
Franklin Templeton Variable Insurance Products Trust
Notes to Financial Statements (unaudited) (continued)
Franklin Flex Cap Growth Securities Fund
1. ORGANIZATION AND SIGNIFICANT ACCOUNTING POLICIES (continued)
a. Financial Instrument Valuation (continued)
against established trigger thresholds for each specific market proxy to assist in determining if an event has occurred that may call into question the reliability of the values of the foreign securities held by the Fund. If such an event occurs, the securities may be valued using fair value procedures, which may include the use of independent pricing services.
b. Securities Lending
The Fund participates in an agency based securities lending program. The fund receives cash collateral against the loaned securities in an amount equal to at least 102% of the market value of the loaned securities. Collateral is maintained over the life of the loan in an amount not less than 100% of the market value of loaned securities, as determined at the close of fund business each day; any additional collateral required due to changes in security values is delivered to the fund on the next business day. The fund receives income from the investment of cash collateral, in addition to lending fees and rebates paid by the borrower. The fund bears the market risk with respect to the collateral investment, securities loaned, and the risk that the agent may default on its obligations to the fund. The securities lending agent has agreed to indemnify the fund in the event of default by a third party borrower. At June 30, 2012, the Fund had no securities on loan.
c. Income and Deferred Taxes
It is the Fund’s policy to qualify as a regulated investment company under the Internal Revenue Code. The Fund intends to distribute to shareholders substantially all of its taxable income and net realized gains to relieve it from federal income and if applicable, excise taxes. As a result, no provision for U.S. federal income taxes is required.
The Fund may be subject to foreign taxation related to income received, capital gains on the sale of securities and certain foreign currency transactions in the foreign jurisdictions in which it invests. Foreign taxes, if any, are recorded based on the tax regulations and rates that exist in the foreign markets in which the Fund invests. When a capital gain tax is determined to apply the Fund records an estimated deferred tax liability in an amount that would be payable if the securities were disposed of on the valuation date.
The Fund recognizes the tax benefits of uncertain tax positions only when the position is “more likely than not” to be sustained upon examination by the tax authorities based on the technical merits of the tax position. As of June 30, 2012, and for all open tax years, the Fund has determined that no liability for unrecognized tax benefits is required in the Fund’s financial statements related to uncertain tax positions taken on a tax return (or expected to be taken on future tax returns). Open tax years are those that remain subject to examination and are based on each tax jurisdiction statute of limitation.
d. Security Transactions, Investment Income, Expenses and Distributions
Security transactions are accounted for on trade date. Realized gains and losses on security transactions are determined on a specific identification basis. Estimated expenses are accrued daily. Dividend income is recorded on the ex-dividend date except that certain dividends from foreign securities are recognized as soon as the Fund is notified of the ex-dividend date. Distributions to shareholders are recorded on the ex-dividend date and are determined according to income tax regulations (tax basis). Distributable earnings determined on a tax basis may differ from earnings recorded in accordance with accounting principles generally accepted in the United States of America. These differences may be permanent or temporary. Permanent differences are reclassified among capital accounts to reflect their tax character. These reclassifications have no impact on net assets or the results of operations. Temporary differences are not reclassified, as they may reverse in subsequent periods.
Common expenses incurred by the Trust are allocated among the funds based on the ratio of net assets of each fund to the combined net assets of the Trust. Fund specific expenses are charged directly to the fund that incurred the expense.
FFC-18
Franklin Templeton Variable Insurance Products Trust
Notes to Financial Statements (unaudited) (continued)
Franklin Flex Cap Growth Securities Fund
1. ORGANIZATION AND SIGNIFICANT ACCOUNTING POLICIES (continued)
d. Security Transactions, Investment Income, Expenses and Distributions (continued)
Realized and unrealized gains and losses and net investment income, not including class specific expenses, are allocated daily to each class of shares based upon the relative proportion of net assets of each class. Differences in per share distributions, by class, are generally due to differences in class specific expenses.
e. Accounting Estimates
The preparation of financial statements in accordance with accounting principles generally accepted in the United States of America requires management to make estimates and assumptions that affect the reported amounts of assets and liabilities at the date of the financial statements and the amounts of income and expenses during the reporting period. Actual results could differ from those estimates.
f. Guarantees and Indemnifications
Under the Trust’s organizational documents, its officers and trustees are indemnified by the Trust against certain liabilities arising out of the performance of their duties to the Trust. Additionally, in the normal course of business, the Trust, on behalf of the Fund, enters into contracts with service providers that contain general indemnification clauses. The Trust’s maximum exposure under these arrangements is unknown as this would involve future claims that may be made against the Trust that have not yet occurred. Currently, the Trust expects the risk of loss to be remote.
2. SHARES OF BENEFICIAL INTEREST
At June 30, 2012, there were an unlimited number of shares authorized (without par value). Transactions in the Fund’s shares were as follows:
| Six Months Ended June 30, 2012 | Year Ended December 31, 2011 | |||||||||||||||
| Class 2 Shares: | Shares | Amount | Shares | Amount | ||||||||||||
Shares sold | 1,386,572 | $ | 18,737,523 | 2,603,604 | $ | 32,933,090 | ||||||||||
Shares redeemed | (2,221,009 | ) | (29,875,693 | ) | (4,943,943 | ) | (63,982,537 | ) | ||||||||
| ||||||||||||||||
Net increase (decrease) | (834,437 | ) | $ | (11,138,170 | ) | (2,340,339 | ) | $ | (31,049,447 | ) | ||||||
| ||||||||||||||||
Class 4 Shares: | ||||||||||||||||
Shares sold | 2,226,348 | $ | 29,225,679 | 8,511,819 | $ | 106,665,741 | ||||||||||
Shares redeemed | (3,008,303 | ) | (40,438,550 | ) | (6,865,481 | ) | (89,183,597 | ) | ||||||||
| ||||||||||||||||
Net increase (decrease) | (781,955 | ) | $ | (11,212,871 | )�� | 1,646,338 | $ | 17,482,144 | ||||||||
| ||||||||||||||||
3. TRANSACTIONS WITH AFFILIATES
Franklin Resources, Inc. is the holding company for various subsidiaries that together are referred to as Franklin Templeton Investments. Certain officers and trustees of the Fund are also officers and/or directors of the following subsidiaries
| Subsidiary | Affiliation | |
Franklin Advisers, Inc. (Advisers) | Investment manager | |
Franklin Templeton Services, LLC (FT Services) | Administrative manager | |
Franklin Templeton Distributors, Inc. (Distributors) | Principal underwriter | |
Franklin Templeton Investor Services, LLC (Investor Services) | Transfer agent |
FFC-19
Franklin Templeton Variable Insurance Products Trust
Notes to Financial Statements (unaudited) (continued)
Franklin Flex Cap Growth Securities Fund
3. TRANSACTIONS WITH AFFILIATES (continued)
a. Management Fees
The Fund pays an investment management fee to Advisers based on the average daily net assets of the Fund as follows:
| Annualized Fee Rate | Net Assets | |
| 0.750% | Up to and including $100 million | |
| 0.650% | Over $100 million, up to and including $250 million | |
| 0.600% | Over $250 million, up to and including $10 billion | |
| 0.550% | Over $10 billion, up to and including $12.5 billion | |
| 0.525% | Over $12.5 billion, up to and including $15 billion | |
| 0.500% | In excess of $15 billion |
b. Administrative Fees
The Fund pays an administrative fee to FT Services of 0.25% per year of the average daily net assets of the Fund.
c. Distribution Fees
The Board has adopted distribution plans for Class 2 and Class 4 shares pursuant to Rule 12b-1 under the 1940 Act. Under the Fund’s compensation distribution plans, the Fund pays Distributors for costs incurred in connection with the servicing, sale and distribution of the Fund’s shares up to 0.35% per year of its average daily net assets of each class. The Board has agreed to limit the current rate to 0.25% per year for Class 2.
d. Transfer Agent Fees
Investor Services, under terms of an agreement, performs shareholder servicing for the Fund and is not paid by the Fund for the services.
e. Waiver and Expense Reimbursements
FT Services has contractually agreed in advance to waive or limit its fees and to assume as its own expense certain expenses otherwise payable by the Fund so that the common expenses (i.e. a combination of management fees, administrative fees, and other expenses, but excluding distribution fees, and acquired fund fees and expenses, for each class of the Fund do not exceed 0.68% (other than certain non-routine expenses or costs, including those relating to litigation, indemnification, reorganizations, and liquidations) until April 30, 2013.
4. EXPENSE OFFSET ARRANGEMENT
The Fund has entered into an arrangement with its custodian whereby credits realized as a result of uninvested cash balances are used to reduce a portion of the Fund’s custodian expenses. During the period ended June 30, 2012, there were no credits earned.
5. INCOME TAXES
For tax purposes, capital losses may be carried over to offset future capital gains, if any. Capital loss carryforwards with no expiration, if any, must be fully utilized before those losses with expiration dates.
FFC-20
Franklin Templeton Variable Insurance Products Trust
Notes to Financial Statements (unaudited) (continued)
Franklin Flex Cap Growth Securities Fund
5. INCOME TAXES (continued)
At December 31, 2011, capital loss carryforwards were as follows:
Capital loss carryforwards expiring in: | ||||
2017 | $ | 25,971,698 | ||
2018 | 4,128,864 | |||
|
| |||
| $30,100,562 | ||||
|
|
At June 30, 2012, the cost of investments and net unrealized appreciation (depreciation) for income tax purposes were as follows:
Cost of investments | $ | 265,846,605 | ||
|
| |||
Unrealized appreciation | $ | 112,387,086 | ||
Unrealized depreciation | (11,368,999 | ) | ||
|
| |||
Net unrealized appreciation (depreciation) | $ | 101,018,087 | ||
|
| |||
Differences between income and/or capital gains as determined on a book basis and a tax basis are primarily due to differing treatment of wash sales.
6. INVESTMENT TRANSACTIONS
Purchases and sales of investments (excluding short term securities) for the period ended June 30, 2012, aggregated $75,084,683 and $194,899,580, respectively.
7. INVESTMENTS IN INSTITUTIONAL FIDUCIARY TRUST MONEY MARKET PORTFOLIO
The Fund invests in the Institutional Fiduciary Trust Money Market Portfolio (Sweep Money Fund), an open-end investment company managed by Advisers. Management fees paid by the Fund are reduced on assets invested in the Sweep Money Fund, in an amount not to exceed the management and administrative fees paid by the Sweep Money Fund.
8. CREDIT FACILITY
The Fund, together with other U.S. registered and foreign investment funds (collectively, Borrowers), managed by Franklin Templeton Investments, are borrowers in a joint syndicated senior unsecured credit facility totaling $1.5 billion (Global Credit Facility) which matures on January 18, 2013. This Global Credit Facility provides a source of funds to the Borrowers for temporary and emergency purposes, including the ability to meet future unanticipated or unusually large redemption requests.
Under the terms of the Global Credit Facility, the Fund shall, in addition to interest charged on any borrowings made by the Fund and other costs incurred by the Fund, pay its share of fees and expenses incurred in connection with the implementation and maintenance of the Global Credit Facility, based upon its relative share of the aggregate net assets of all of the Borrowers, including an annual commitment fee of 0.08% based upon the unused portion of the Global Credit Facility, which is reflected in other expenses on the Statement of Operations. During the period ended June 30, 2012, the Fund did not use the Global Credit Facility.
FFC-21
Franklin Templeton Variable Insurance Products Trust
Notes to Financial Statements (unaudited) (continued)
Franklin Flex Cap Growth Securities Fund
9. FAIR VALUE MEASUREMENTS
The Fund follows a fair value hierarchy that distinguishes between market data obtained from independent sources (observable inputs) and the Fund’s own market assumptions (unobservable inputs). These inputs are used in determining the value of the Fund’s financial instruments and are summarized in the following fair value hierarchy:
| • | Level 1 – quoted prices in active markets for identical financial instruments |
| • | Level 2 – other significant observable inputs (including quoted prices for similar financial instruments, interest rates, prepayment speed, credit risk, etc.) |
| • | Level 3 – significant unobservable inputs (including the Fund’s own assumptions in determining the fair value of financial instruments) |
The inputs or methodology used for valuing financial instruments are not an indication of the risk associated with investing in those financial instruments.
For movements between the levels within the fair value hierarchy, the Fund has adopted a policy of recognizing the transfers as of the date of the underlying event which caused the movement.
At June 30, 2012, all of the Fund’s investments in securities carried at fair value were valued using Level 1 inputs. For detailed categories, see the accompanying Statement of Investments.
10. NEW ACCOUNTING PRONOUNCEMENTS
In December 2011, the Financial Accounting Standards Board (FASB) issued Accounting Standards Update (ASU) No. 2011-11, Balance Sheet (Topic 210): Disclosures about Offsetting Assets and Liabilities. The amendments in the ASU enhance disclosures about offsetting of financial assets and liabilities to enable investors to understand the effect of these arrangements on a fund’s financial position. The ASU is effective for interim and annual reporting periods beginning on or after January 1, 2013. The Fund believes the adoption of this ASU will not have a material impact on its financial statements.
11. SUBSEQUENT EVENTS
The Fund has evaluated subsequent events through the issuance of the financial statements and determined that no events have occurred that require disclosure, except the following:
Subsequent to June 30, 2012, shares held through one insurance company were redeemed, representing approximately 20% of the Fund’s outstanding shares as of June 30, 2012.
��
ABBREVIATIONS | ||||
| Selected Portfolio | ||||
| ADR - American Depositary Receipt | ||||
FFC-22
FRANKLIN HIGH INCOME SECURITIES FUND
We are pleased to bring you Franklin High Income Securities Fund’s semiannual report for the period ended June 30, 2012.
Performance Summary as of 6/30/12
Franklin High Income Securities Fund – Class 4 delivered a +6.84% total return for the six-month period ended 6/30/12.
Performance reflects the Fund’s Class 4 operating expenses, but does not include any contract fees, expenses or sales charges. If they had been included, performance would be lower. These charges and deductions, particularly for variable life policies, can have a significant effect on contract values and insurance benefits. See the contract prospectus for a complete description of these expenses, including sales charges.
Franklin High Income Securities Fund – Class 4
Performance data represent past performance, which does not guarantee future results. Investment return and principal value will fluctuate, and you may have a gain or loss when you sell your shares.
Current performance may differ from figures shown.
FH-1
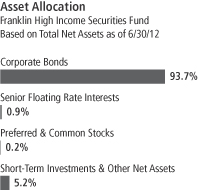
Fund Goals and Main Investments: Franklin High Income Securities Fund seeks a high level of current income with capital appreciation as a secondary goal. Under normal market conditions, the Fund invests primarily to predominantly in high yield, lower rated debt securities and preferred stocks.
Performance Overview
You can find the Fund’s six-month total return in the Performance Summary. In comparison, the Fund’s benchmark, the Credit Suisse (CS) High Yield Index, posted a +6.66% total return for the period under review.1 The Fund’s peers, as measured by the Lipper VIP High Current Yield Funds Classification Average, delivered a +6.48% total return.2
Economic and Market Overview
During the six months under review, uncertainty regarding the eurozone’s future continued to influence financial markets, and U.S. economic data appeared mixed. U.S. manufacturing indicators looked to have weakened, employment gains slowed and wage growth was sluggish during the period. However, energy prices declined significantly over the period and housing data strengthened with new and existing home sales as well as house prices pointing toward a gradual strengthening trend, albeit from a low base. The U.S. consumer showed resilience as consumption remained steady even as consumer confidence declined.
Financial markets seemed to be largely influenced by politics, sentiment and uncertainty in the eurozone, and they were quick to discount the latest Greek election results. The June 2012 Federal Open Market Committee meeting concluded with the extension of its plan designed to boost the economy by driving down long-term interest rates (dubbed Operation Twist) but made no formal announcement of an additional round of quantitative easing. During the six months under review, investment-grade fixed income markets, as measured by the Barclays U.S. Aggregate Index, posted modest returns.3 U.S. stocks, as measured by the Standard & Poor’s® 500 Index, faced bouts of risk aversion as investors shunned risk assets in light of uneven economic data but ended the period with robust gains.3 Overall, investor concerns about ongoing eurozone uncertainty, weak U.S. employment gains, and a lack
1. Source: © 2012 Morningstar.
2. Source: Lipper Inc.
One cannot invest directly in an index, and an index is not representative of the Fund’s portfolio. Please see Index Descriptions following the Fund Summaries.
3. Please see Index descriptions following the Fund summaries.
Fund Risks: All investments involve risks, including possible loss of principal. Risks associated with higher yielding, lower rated securities include higher risk of default and loss of principal. Investments in foreign securities involve special risks such as currency fluctuations, and political and economic uncertainty. Interest rate movements will affect the Fund’s share price and yield. As the prices of bonds in the Fund adjust to a rise in interest rates, the Fund’s share price may decline. Changes in the financial strength of a bond issuer or in a bond’s credit rating may affect its value. The Fund may from time to time enter into certain transactions involving derivatives, particularly credit default swap agreements, interest rate swap agreements and currency forwards; such techniques may not achieve the anticipated benefits and/or may result in losses to the Fund. The Fund is actively managed but there is no guarantee that these decisions will produce the desired results. The Fund’s prospectus also includes a description of the main investment risks.
FH-2
of broad public and political agreement on how to achieve U.S. deficit reduction drove the 10-year U.S. Treasury yield from 1.89% on December 31, 2011, to 1.67% on June 30, 2012.
Investment Strategy
We are research-driven, fundamental investors who rely on a team of analysts to provide in-depth industry expertise and use qualitative and quantitative analyses to evaluate companies. As bottom-up investors, we focus primarily on individual securities. We also consider sectors when choosing investments. In selecting securities for the Fund’s investment portfolio, we do not rely principally on ratings assigned by rating agencies, but perform our own independent analysis to evaluate an issuer’s creditworthiness. We consider a variety of factors, including an issuer’s experience and managerial strength, its sensitivity to economic conditions and its current financial condition. We may also enter into various transactions involving certain currency-, interest rate- or credit-related derivative instruments for hedging purposes, to enhance returns or to obtain exposure to various market sectors.
Manager’s Discussion
Despite market volatility for high yield bonds in the second quarter of 2012, the Fund delivered a positive return for the six months ended June 30, 2012. On the heels of a strong fourth quarter of 2011, the credit markets started 2012 with a very solid tone. The rally continued through mid-May but similar to the first half of 2011, faltered heading into June. In the U.S., second-quarter unemployment numbers disappointed investors and the pace of economic growth appeared to lose steam. Outside the U.S., although concerns regarding Greece began to recede from daily financial market headlines, concerns over Spain and Italy’s fiscal conditions and sovereign financing costs moved to the forefront. Although the high yield market initially decoupled from U.S. stock market weakness, by the middle of the second quarter high yield bond prices began to come under pressure. However, high yield bonds ended on a positive note as new-issue supply in the high yield market slowed and the stock market had one of its best single-day results of the year at June’s end when European leaders provided a plan to try to support banks, maintain the eurozone and restore investor confidence. Correspondingly, high yield bond prices also rallied at period-end.
Although cognizant of challenges to the economy, we remained encouraged by corporate balance sheet strength and mostly improving earnings. Trends for the U.S. economy remained positive, albeit at a slower
FH-3
rate of improvement. Accordingly, although we targeted subtle changes based on market valuations, we maintained a slightly elevated risk stance during the period. In addition, we drew on our fundamental research process to adjust industry positioning. Within that framework, we over- and underweighted certain industries relative to our benchmark, the CS High Yield Index.
For instance, amid continued pricing pressures in the utilities sector, which includes some pipeline and midstream energy companies, we underweighted this sector. The sector notably underperformed the benchmark, boosting the Fund’s relative performance. Similarly, we continued to find the paper industry unattractive as ongoing demand declines, price competition and a lack of positive near-term catalysts weighed on companies.4 Our resulting underweighted position benefited the Fund following the industry’s underperformance. In contrast, the auto sector represented one of the more strongly performing sectors as many auto companies restructured and benefited from rationalized cost structures and more stable demand.5 Bonds of one of the largest sector issuers, Ford Motor Credit, were upgraded to investment grade ratings during the period, providing a boost to prices. Given our favorable view of Ford Motor Credit bonds at the beginning of the review period as well as on certain auto sector issuers, we overweighted the sector in the Fund, contributing to relative performance.
Although some of the Fund’s positioning enhanced relative performance versus its benchmark, certain weightings detracted from relative results. For example, the Fund’s energy, building and wireless telecommunication services positioning versus the index was a drag on performance.6 Although security selection in energy aided relative performance, the Fund’s overweighting during the period resulted in an overall negative effect. One of the warmest winters on record, combined with growing production from shale operations, drove down natural gas prices, and the energy sector underperformed the benchmark. Although high yield energy companies usually produce natural gas and oil, production during the period in review was more heavily weighted to gas. In addition, European refiner Petroplus Holdings defaulted during the period on one of the Fund’s bonds, as the company failed to obtain the financing required to fund its working capital needs.
4. Paper holdings are part of materials in the SOI.
5. Auto holdings are part of automobiles and components in the SOI.
6. Building holdings are part of consumer durables and apparel in the SOI. Wireless telecommunication services is part of telecommunication services in the SOI.
Top 10 Sectors/Industries
Franklin High Income Securities Fund
6/30/12
| % of Total Net Assets | ||||
| Energy | 22.9% | |||
| Telecommunication Services | 9.0% | |||
| Media | 8.4% | |||
| Materials | 8.2% | |||
| Health Care Equipment & Services | 5.8% | |||
| Software & Services | 4.3% | |||
| Consumer Services | 4.2% | |||
| Diversified Financials | 3.7% | |||
| Automobiles & Components | 3.1% | |||
| Utilities | 2.9% | |||
The dollar value, number of shares or principal amount, and names of all portfolio holdings are listed in the Fund’s Statement of Investments (SOI).
FH-4
In contrast, the building industry followed 2011’s underperformance relative to the benchmark with outperformance for the six-month period in review. Home builders reported the best spring selling season since the housing market’s downturn began in 2006, and housing-related reports seemed to confirm a housing recovery. Investors helped drive the outperformance by shrugging off concerns about Europe, disappointing U.S. economic reports and the possibility that unseasonably warm weather throughout the U.S. accounted for the increased housing demand. The Fund maintained an underweighting given our more conservative outlook for the sector and this proved to hinder relative performance. Our overweighting in wireless telecommunication services
negatively impacted relative performance versus the benchmark as the industry slightly underperformed. Certain sector holdings, such as Sprint, notably outperformed and positively contributed to relative performance, but overall the sector did not keep pace with the index. Therefore, the overweighted telecommunications position negatively impacted the Fund’s relative performance.
Thank you for your participation in Franklin High Income Securities Fund. We look forward to serving your future investment needs.
The foregoing information reflects our analysis, opinions and portfolio holdings as of June 30, 2012, the end of the reporting period. The way we implement our main investment strategies and the resulting portfolio holdings may change depending on factors such as market and economic conditions. These opinions may not be relied upon as investment advice or an offer for a particular security. The information is not a complete analysis of every aspect of any market, country, industry, security or the Fund. Statements of fact are from sources considered reliable, but the investment manager makes no representation or warranty as to their completeness or accuracy. Although historical performance is no guarantee of future results, these insights may help you understand our investment management philosophy.
FH-5
Fund Expenses
As an investor in a variable insurance contract (Contract) that indirectly provides for investment in an underlying mutual fund, you can incur transaction and/or ongoing expenses at both the Fund level and the Contract level.
| • | Transaction expenses can include sales charges (loads) on purchases, surrender fees, transfer fees and premium taxes. |
| • | Ongoing expenses can include management fees, distribution and service (12b-1) fees, contract fees, annual maintenance fees, mortality and expense risk fees and other fees and expenses. All mutual funds and Contracts have some types of ongoing expenses. |
The expenses shown in the table are meant to highlight ongoing expenses at the Fund level only and do not include ongoing expenses at the Contract level, or transaction expenses at either the Fund or Contract levels. While the Fund does not have transaction expenses, if the transaction and ongoing expenses at the Contract level were included, the expenses shown below would be higher. You should consult your Contract prospectus or disclosure document for more information.
The table shows Fund-level ongoing expenses and can help you understand these expenses and compare them with those of other mutual funds offered through the Contract. The table assumes a $1,000 investment held for the six months indicated. Please refer to the Fund prospectus for additional information on operating expenses.
Actual Fund Expenses
The first line (Actual) of the table provides actual account values and expenses. The “Ending Account Value” is derived from the Fund’s actual return, which includes the effect of ongoing Fund expenses, but does not include the effect of ongoing Contract expenses.
You can estimate the Fund-level expenses you incurred during the period by following these steps. Of course, your account value and expenses will differ from those in this illustration:
| 1. | Divide your account value by $1,000. |
If an account had an $8,600 value, then $8,600 ÷ $1,000 = 8.6.
| 2. | Multiply the result by the number under the heading “Fund-Level Expenses Incurred During Period.” |
If Fund-Level Expenses Incurred During Period were $7.50, then 8.6 x $7.50 = $64.50.
In this illustration, the estimated expenses incurred this period at the Fund level are $64.50.
Franklin High Income Securities Fund – Class 4
FH-6
Hypothetical Example for Comparison with Other Mutual Funds
Information in the second line (Hypothetical) of the table can help you compare ongoing expenses of the Fund with those of other mutual funds offered through the Contract. This information may not be used to estimate the actual ending account balance or expenses you incurred during the period. The hypothetical “Ending Account Value” is based on the Fund’s actual expense ratio and an assumed 5% annual rate of return before expenses, which does not represent the Fund’s actual return. The figure under the heading “Fund-Level Expenses Incurred During Period” shows the hypothetical expenses your account would have incurred under this scenario. You can compare this figure with the 5% hypothetical examples that appear in shareholder reports of other funds offered through a Contract.
| Class 4 | Beginning Account Value 1/1/12 | Ending Account Value 6/30/12 | Fund-Level 1/1/12–6/30/12 | |||||||||
Actual | $ | 1,000 | $ | 1,068.40 | $ | 4.78 | ||||||
Hypothetical (5% return before expenses) | $ | 1,000 | $ | 1,020.24 | $ | 4.67 | ||||||
*Expenses are calculated using the most recent six-month annualized expense ratio for the Fund’s Class 4 shares (0.93%), which does not include any ongoing expenses of the Contract for which the Fund is an investment option, multiplied by the average account value over the period, multiplied by 182/366 to reflect the one-half year period.
FH-7
Franklin Templeton Variable Insurance Products Trust
Financial Highlights
Franklin High Income Securities Fund
| Six Months Ended June 30, 2012 (unaudited) | Year Ended December 31, | |||||||||||||||||||||||
| Class 1 | 2011 | 2010 | 2009 | 2008 | 2007 | |||||||||||||||||||
| ||||||||||||||||||||||||
Per share operating performance | ||||||||||||||||||||||||
(for a share outstanding throughout the period) | ||||||||||||||||||||||||
Net asset value, beginning of period | $ | 6.52 | $ | 6.63 | $ | 6.26 | $ | 4.68 | $ | 6.72 | $ | 6.96 | ||||||||||||
|
| |||||||||||||||||||||||
Income from investment operationsa: | ||||||||||||||||||||||||
Net investment incomeb | 0.25 | 0.50 | 0.49 | 0.46 | 0.50 | 0.51 | ||||||||||||||||||
Net realized and unrealized gains (losses) | 0.21 | (0.19 | ) | 0.32 | 1.50 | (1.92 | ) | (0.30 | ) | |||||||||||||||
|
| |||||||||||||||||||||||
Total from investment operations | 0.46 | 0.31 | 0.81 | 1.96 | (1.42 | ) | 0.21 | |||||||||||||||||
|
| |||||||||||||||||||||||
Less distributions from net investment income | (0.50 | ) | (0.42 | ) | (0.44 | ) | (0.38 | ) | (0.62 | ) | (0.45 | ) | ||||||||||||
|
| |||||||||||||||||||||||
Net asset value, end of period | $ | 6.48 | $ | 6.52 | $ | 6.63 | $ | 6.26 | $ | 4.68 | $ | 6.72 | ||||||||||||
|
| |||||||||||||||||||||||
Total returnc | 7.17% | 4.63% | 13.71% | 42.99% | (23.16)% | 3.02% | ||||||||||||||||||
Ratios to average net assetsd | ||||||||||||||||||||||||
Expenses | 0.58% | 0.58% | 0.61% | 0.63% | e | 0.66% | e | 0.61% | e | |||||||||||||||
Net investment income | 7.35% | 7.52% | 7.71% | 8.33% | 8.30% | 7.38% | ||||||||||||||||||
Supplemental data | ||||||||||||||||||||||||
Net assets, end of period (000’s) | $ | 41,075 | $ | 41,971 | $ | 48,051 | $ | 48,855 | $ | 38,225 | $ | 61,286 | ||||||||||||
Portfolio turnover rate | 15.50% | 45.11% | 60.80% | 26.41% | 21.75% | 40.65% | ||||||||||||||||||
aThe amount shown for a share outstanding throughout the period may not correlate with the Statement of Operations for the period due to the timing of sales and repurchases of the Fund shares in relation to income earned and/or fluctuating market value of the investments of the Fund.
bBased on average daily shares outstanding.
cTotal return does not include fees, charges or expenses imposed by the variable annuity and life insurance contracts for which the Franklin Templeton Variable Insurance Products Trust serves as an underlying investment vehicle. Total return is not annualized for periods less than one year.
dRatios are annualized for periods less than one year.
eBenefit of expense reduction rounds to less than 0.01%.
The accompanying notes are an integral part of these financial statements.
FH-8
Franklin Templeton Variable Insurance Products Trust
Financial Highlights (continued)
Franklin High Income Securities Fund
Six Months (unaudited) | Year Ended December 31, | |||||||||||||||||||||||
| Class 2 | 2011 | 2010 | 2009 | 2008 | 2007 | |||||||||||||||||||
| ||||||||||||||||||||||||
Per share operating performance | ||||||||||||||||||||||||
(for a share outstanding throughout the period) | ||||||||||||||||||||||||
Net asset value, beginning of period | $ | 6.36 | $ | 6.47 | $ | 6.13 | $ | 4.59 | $ | 6.60 | $ | 6.85 | ||||||||||||
|
| |||||||||||||||||||||||
Income from investment operationsa: | ||||||||||||||||||||||||
Net investment incomeb | 0.23 | 0.47 | 0.47 | 0.44 | 0.47 | 0.48 | ||||||||||||||||||
Net realized and unrealized gains (losses) | 0.20 | (0.18 | ) | 0.30 | 1.47 | (1.88 | ) | (0.29 | ) | |||||||||||||||
|
| |||||||||||||||||||||||
Total from investment operations | 0.43 | 0.29 | 0.77 | 1.91 | (1.41 | ) | 0.19 | |||||||||||||||||
|
| |||||||||||||||||||||||
Less distributions from net investment income | (0.48 | ) | (0.40 | ) | (0.43 | ) | (0.37 | ) | (0.60 | ) | (0.44 | ) | ||||||||||||
|
| |||||||||||||||||||||||
Net asset value, end of period | $ | 6.31 | $ | 6.36 | $ | 6.47 | $ | 6.13 | $ | 4.59 | $ | 6.60 | ||||||||||||
|
| |||||||||||||||||||||||
Total returnc | 6.92% | 4.56% | 13.26% | 42.70% | (23.38)% | 2.72% | ||||||||||||||||||
Ratios to average net assetsd | ||||||||||||||||||||||||
Expenses | 0.83% | 0.83% | 0.86% | 0.88% | e | 0.91% | e | 0.86% | e | |||||||||||||||
Net investment income | 7.10% | 7.27% | 7.46% | 8.08% | 8.05% | 7.13% | ||||||||||||||||||
Supplemental data | ||||||||||||||||||||||||
Net assets, end of period (000’s) | $ | 267,041 | $ | 249,452 | $ | 239,824 | $ | 198,567 | $ | 84,396 | $ | 155,777 | ||||||||||||
Portfolio turnover rate | 15.50% | 45.11% | 60.80% | 26.41% | 21.75% | 40.65% | ||||||||||||||||||
aThe amount shown for a share outstanding throughout the period may not correlate with the Statement of Operations for the period due to the timing of sales and repurchases of the Fund shares in relation to income earned and/or fluctuating market value of the investments of the Fund.
bBased on average daily shares outstanding.
cTotal return does not include fees, charges or expenses imposed by the variable annuity and life insurance contracts for which the Franklin Templeton Variable Insurance Products Trust serves as an underlying investment vehicle. Total return is not annualized for periods less than one year.
dRatios are annualized for periods less than one year.
eBenefit of expense reduction rounds to less than 0.01%.
The accompanying notes are an integral part of these financial statements.
FH-9
Franklin Templeton Variable Insurance Products Trust
Financial Highlights (continued)
Franklin High Income Securities Fund
Six Months (unaudited) | Year Ended December 31, | |||||||||||||||||||
| Class 4 | 2011 | 2010 | 2009 | 2008a | ||||||||||||||||
| ||||||||||||||||||||
Per share operating performance | ||||||||||||||||||||
(for a share outstanding throughout the period) | ||||||||||||||||||||
Net asset value, beginning of period | $ | 6.46 | $ | 6.57 | $ | 6.22 | $ | 4.67 | $ | 6.55 | ||||||||||
|
| |||||||||||||||||||
Income from investment operationsb: | ||||||||||||||||||||
Net investment incomec | 0.23 | 0.47 | 0.47 | 0.45 | 0.39 | |||||||||||||||
Net realized and unrealized gains (losses) | 0.20 | (0.18 | ) | 0.31 | 1.48 | (1.65 | ) | |||||||||||||
|
| |||||||||||||||||||
Total from investment operations | 0.43 | 0.29 | 0.78 | 1.93 | (1.26 | ) | ||||||||||||||
|
| |||||||||||||||||||
Less distributions from net investment income | (0.47 | ) | (0.40 | ) | (0.43 | ) | (0.38 | ) | (0.62 | ) | ||||||||||
|
| |||||||||||||||||||
Net asset value, end of period | $ | 6.42 | $ | 6.46 | $ | 6.57 | $ | 6.22 | $ | 4.67 | ||||||||||
|
| |||||||||||||||||||
Total returnd | 6.84% | 4.39% | 13.31% | 42.36% | (21.34)% | |||||||||||||||
Ratios to average net assetse | ||||||||||||||||||||
Expenses | 0.93% | 0.93% | 0.96% | 0.98% | f | 1.01% | f | |||||||||||||
Net investment income | 7.00% | 7.17% | 7.36% | 7.98% | 7.95% | |||||||||||||||
Supplemental data | ||||||||||||||||||||
Net assets, end of period (000’s) | $ | 26,906 | $ | 27,055 | $ | 25,934 | $ | 15,105 | $ | 2,244 | ||||||||||
Portfolio turnover rate | 15.50% | 45.11% | 60.80% | 26.41% | 21.75% | |||||||||||||||
aFor the period February 29, 2008 (effective date) to December 31, 2008.
bThe amount shown for a share outstanding throughout the period may not correlate with the Statement of Operations for the period due to the timing of sales and repurchases of the Fund shares in relation to income earned and/or fluctuating market value of the investments of the Fund.
cBased on average daily shares outstanding.
dTotal return does not include fees, charges or expenses imposed by the variable annuity and life insurance contracts for which the Franklin Templeton Variable Insurance Products Trust serves as an underlying investment vehicle. Total return is not annualized for periods less than one year.
eRatios are annualized for periods less than one year.
fBenefit of expense reduction rounds to less than 0.01%.
The accompanying notes are an integral part of these financial statements.
FH-10
Franklin Templeton Variable Insurance Products Trust
Statement of Investments, June 30, 2012 (unaudited)
| Franklin High Income Securities Fund | Country | Shares | Value | |||||||||
Preferred Stocks (Cost $770,000) 0.2% | ||||||||||||
Diversified Financials 0.2% | ||||||||||||
GMAC Capital Trust I, 8.125%, pfd. | United States | 30,800 | $ | 740,740 | ||||||||
|
| |||||||||||
| Principal Amount* | ||||||||||||
Corporate Bonds 93.7% | ||||||||||||
Automobiles & Components 3.1% | ||||||||||||
aAllison Transmission Holdings Inc., senior note, 144A, 7.125%, 5/15/19 | United States | 1,000,000 | 1,047,500 | |||||||||
Exide Technologies, senior secured note, 8.625%, 2/01/18 | United States | 1,000,000 | 793,751 | |||||||||
Ford Motor Credit Co. LLC, senior note, | ||||||||||||
7.00%, 4/15/15 | United States | 1,000,000 | 1,113,879 | |||||||||
6.625%, 8/15/17 | United States | 1,000,000 | 1,139,224 | |||||||||
5.00%, 5/15/18 | United States | 1,000,000 | 1,064,922 | |||||||||
8.125%, 1/15/20 | United States | 1,000,000 | 1,225,881 | |||||||||
The Goodyear Tire & Rubber Co., senior note, 8.25%, 8/15/20 | United States | 2,200,000 | 2,340,250 | |||||||||
aInternational Automotive Components Group SL, senior secured note, 144A, 9.125%, 6/01/18 | United States | 1,600,000 | 1,470,000 | |||||||||
|
| |||||||||||
| 10,195,407 | ||||||||||||
|
| |||||||||||
Banks 1.6% | ||||||||||||
CIT Group Inc., senior note, | ||||||||||||
5.375%, 5/15/20 | United States | 1,700,000 | 1,735,062 | |||||||||
a144A, 7.00%, 5/02/17 | United States | 2,303,465 | 2,310,664 | |||||||||
Regions Bank, sub. note, 7.50%, 5/15/18 | United States | 1,250,000 | 1,403,125 | |||||||||
|
| |||||||||||
| 5,448,851 | ||||||||||||
|
| |||||||||||
Capital Goods 2.8% | ||||||||||||
aAbengoa Finance SAU, senior note, 144A, 8.875%, 11/01/17 | Spain | 3,000,000 | 2,700,000 | |||||||||
The Manitowoc Co. Inc., senior note, | ||||||||||||
9.50%, 2/15/18 | United States | 1,400,000 | 1,540,000 | |||||||||
8.50%, 11/01/20 | United States | 500,000 | 542,500 | |||||||||
Meritor Inc., senior note, 10.625%, 3/15/18 | United States | 1,900,000 | 2,028,250 | |||||||||
RBS Global & Rexnord Corp., senior note, 8.50%, 5/01/18 | United States | 2,500,000 | 2,725,000 | |||||||||
|
| |||||||||||
| 9,535,750 | ||||||||||||
|
| |||||||||||
Commercial & Professional Services 1.3% | ||||||||||||
b,cGoss Graphic Systems Inc., senior sub. note, 12.25%, 11/19/05 | United States | 1,912,374 | 191 | |||||||||
RSC Equipment Rental Inc./RSC Holdings III LLC, senior note, 10.25%, 11/15/19 | United States | 1,000,000 | 1,130,000 | |||||||||
United Rentals North America Inc., senior sub. note, 8.375%, 9/15/20 | United States | 2,900,000 | 3,066,750 | |||||||||
|
| |||||||||||
| 4,196,941 | ||||||||||||
|
| |||||||||||
Consumer Durables & Apparel 2.3% | ||||||||||||
M/I Homes Inc., senior note, 8.625%, 11/15/18 | United States | 1,500,000 | 1,556,250 | |||||||||
Shea Homes LP/Funding Corp., senior secured note, 8.625%, 5/15/19 | United States | 1,600,000 | 1,728,000 | |||||||||
aTaylor Morrison Communities/Monarch Communities Inc., senior note, 144A, 7.75%, 4/15/20 | United States | 1,200,000 | 1,257,000 | |||||||||
Visant Corp., senior note, 10.00%, 10/01/17 | United States | 3,100,000 | 3,092,250 | |||||||||
|
| |||||||||||
| 7,633,500 | ||||||||||||
|
| |||||||||||
Consumer Services 4.2% | ||||||||||||
Choice Hotels International Inc., 5.75%, 7/01/22 | United States | 600,000 | 629,019 | |||||||||
ClubCorp Club Operations Inc., senior note, 10.00%, 12/01/18 | United States | 2,200,000 | 2,343,000 | |||||||||
a,bFontainebleau Las Vegas, 144A, 11.00%, 6/15/15 | United States | 1,700,000 | 1,063 | |||||||||
Harrah’s Operating Co. Inc., senior secured note, 11.25%, 6/01/17 | United States | 3,000,000 | 3,288,750 | |||||||||
MGM Resorts International, | United States | 2,000,000 | 2,070,000 | |||||||||
senior note, 6.875%, 4/01/16 | United States | 1,200,000 | 1,212,000 | |||||||||
asenior note, 144A, 8.625%, 2/01/19 | United States | 400,000 | 430,000 | |||||||||
senior secured note, 9.00%, 3/15/20 | United States | 600,000 | 669,000 | |||||||||
FH-11
Franklin Templeton Variable Insurance Products Trust
Statement of Investments, June 30, 2012 (unaudited) (continued)
| Franklin High Income Securities Fund | Country | Principal Amount* | Value | |||||||
Corporate Bonds (continued) | ||||||||||
Consumer Services (continued) | ||||||||||
Pinnacle Entertainment Inc., | ||||||||||
senior note, 8.625%, 8/01/17 | United States | 2,200,000 | $ | 2,403,500 | ||||||
senior sub. note, 7.75%, 4/01/22 | United States | 100,000 | 107,125 | |||||||
aShingle Springs Tribal Gaming Authority, senior note, 144A, 9.375%, 6/15/15 | United States | 1,300,000 | 1,001,000 | |||||||
|
| |||||||||
| 14,154,457 | ||||||||||
|
| |||||||||
Diversified Financials 3.5% | ||||||||||
Ally Financial Inc., senior note, 7.50%, 9/15/20 | United States | 1,500,000 | 1,691,250 | |||||||
dBank of America Corp., pfd., sub. bond, M, 8.125% to 5/15/18, FRN thereafter, Perpetual | United States | 2,500,000 | 2,626,400 | |||||||
GMAC Inc., | ||||||||||
senior note, 6.875%, 8/28/12 | United States | 2,000,000 | 2,015,000 | |||||||
sub. note, 8.00%, 12/31/18 | United States | 800,000 | 890,000 | |||||||
International Lease Finance Corp., | ||||||||||
senior note, R, 5.65%, 6/01/14 | United States | 2,000,000 | 2,060,000 | |||||||
asenior secured note, 144A, 6.75%, 9/01/16 | United States | 1,200,000 | 1,296,000 | |||||||
aNeuberger Berman Group LLC/Finance Corp., senior note, 144A, | ||||||||||
5.625%, 3/15/20 | United States | 500,000 | 522,500 | |||||||
5.875%, 3/15/22 | United States | 600,000 | 628,500 | |||||||
|
| |||||||||
| 11,729,650 | ||||||||||
|
| |||||||||
Energy 22.9% | ||||||||||
Alpha Natural Resources Inc., senior note, | ||||||||||
6.00%, 6/01/19 | United States | 1,100,000 | 943,250 | |||||||
6.25%, 6/01/21 | United States | 2,000,000 | 1,700,000 | |||||||
Antero Resources Finance Corp., senior note, 9.375%, 12/01/17 | United States | 2,600,000 | 2,886,000 | |||||||
Arch Coal Inc., senior note, | ||||||||||
7.00%, 6/15/19 | United States | 700,000 | 595,000 | |||||||
7.25%, 6/15/21 | United States | 1,000,000 | 842,500 | |||||||
aBreitBurn Energy Partners LP/Finance Corp., senior note, 144A, 7.875%, 4/15/22 | United States | 1,600,000 | 1,608,000 | |||||||
Calumet Specialty Products Partners LP/Finance Corp., senior note, | ||||||||||
9.375%, 5/01/19 | United States | 1,700,000 | 1,712,750 | |||||||
a144A, 9.625%, 8/01/20 | United States | 600,000 | 612,000 | |||||||
Carrizo Oil & Gas Inc., senior note, 8.625%, 10/15/18 | United States | 2,000,000 | 2,100,000 | |||||||
Chaparral Energy Inc., senior note, | ||||||||||
9.875%, 10/01/20 | United States | 1,400,000 | 1,562,750 | |||||||
8.25%, 9/01/21 | United States | 600,000 | 637,500 | |||||||
a144A, 7.625%, 11/15/22 | United States | 400,000 | 407,000 | |||||||
CHC Helicopter SA, senior secured note, first lien, 9.25%, 10/15/20 | Canada | 3,000,000 | 2,947,500 | |||||||
Chesapeake Energy Corp., senior note, | ||||||||||
6.625%, 8/15/20 | United States | 3,000,000 | 2,985,000 | |||||||
6.125%, 2/15/21 | United States | 1,000,000 | 972,500 | |||||||
Chesapeake Midstream Partners LP/CHKM Finance Corp., senior note, 6.125%, 7/15/22 | United States | 700,000 | 689,500 | |||||||
Clayton Williams Energy Inc., senior note, 7.75%, 4/01/19 | United States | 2,000,000 | 1,970,000 | |||||||
Compagnie Generale de Geophysique-Veritas, senior note, 6.50%, 6/01/21 | France | 2,500,000 | 2,512,500 | |||||||
CONSOL Energy Inc., senior note, | ||||||||||
8.00%, 4/01/17 | United States | 500,000 | 521,250 | |||||||
8.25%, 4/01/20 | United States | 1,000,000 | 1,055,000 | |||||||
6.375%, 3/01/21 | United States | 300,000 | 283,500 | |||||||
Eagle Rock Energy Partners LP/Finance Corp., senior note, 8.375%, 6/01/19 | United States | 1,800,000 | 1,804,500 | |||||||
Energy Transfer Equity LP, senior note, 7.50%, 10/15/20 | United States | 3,000,000 | 3,307,500 | |||||||
Energy XXI Gulf Coast Inc., senior note, 9.25%, 12/15/17 | United States | 2,500,000 | 2,687,500 | |||||||
eEnterprise Products Operating LLC, junior sub. note, FRN, 7.034%, 1/15/68 | United States | 1,500,000 | 1,606,839 | |||||||
FH-12
Franklin Templeton Variable Insurance Products Trust
Statement of Investments, June 30, 2012 (unaudited) (continued)
| Franklin High Income Securities Fund | Country | Principal Amount* | Value | |||||||
Corporate Bonds (continued) | ||||||||||
Energy (continued) | ||||||||||
aExpro Finance Luxembourg, senior secured note, 144A, 8.50%, 12/15/16 | United Kingdom | 2,307,000 | $ | 2,220,487 | ||||||
Goodrich Petroleum Corp., senior note, 8.875%, 3/15/19 | United States | 2,200,000 | 2,106,500 | |||||||
aKinder Morgan Finance Co. LLC, senior secured note, 144A, 6.00%, 1/15/18 | United States | 1,500,000 | 1,567,500 | |||||||
aKodiak Oil & Gas Corp., senior note, 144A, 8.125%, 12/01/19 | United States | 1,400,000 | 1,442,000 | |||||||
Linn Energy LLC/Finance Corp., senior note, | ||||||||||
8.625%, 4/15/20 | United States | 2,000,000 | 2,165,000 | |||||||
7.75%, 2/01/21 | United States | 700,000 | 735,000 | |||||||
a144A, 6.50%, 5/15/19 | United States | 600,000 | 597,000 | |||||||
Martin Midstream Partners LP, senior note, 8.875%, 4/01/18 | United States | 1,316,000 | 1,335,740 | |||||||
Offshore Group Investment Ltd., senior secured note, | ||||||||||
11.50%, 8/01/15 | United States | 1,700,000 | 1,853,000 | |||||||
afirst lien, 144A, 11.50%, 8/01/15 | United States | 1,300,000 | 1,417,000 | |||||||
aPBF Holding Co. LLC, senior secured note, 144A, 8.25%, 2/15/20 | United States | 2,000,000 | 2,005,000 | |||||||
Peabody Energy Corp., senior note, | ||||||||||
6.50%, 9/15/20 | United States | 1,700,000 | 1,729,750 | |||||||
a144A, 6.25%, 11/15/21 | United States | 1,700,000 | 1,691,500 | |||||||
aPenn Virginia Resource Partners LP/Finance Corp. II, senior note, 144A, 8.375%, 6/01/20 | United States | 1,300,000 | 1,326,000 | |||||||
a,b,fPetroplus Finance Ltd., senior note, 144A, 6.75%, 5/01/14 | Switzerland | 1,600,000 | 200,000 | |||||||
Plains Exploration & Production Co., senior note, | ||||||||||
7.625%, 6/01/18 | United States | 2,200,000 | 2,348,500 | |||||||
6.125%, 6/15/19 | United States | 600,000 | 606,000 | |||||||
QEP Resources Inc., senior note, 5.375%, 10/01/22 | United States | 1,500,000 | 1,507,500 | |||||||
Quicksilver Resources Inc., senior note, | ||||||||||
8.25%, 8/01/15 | United States | 2,000,000 | 1,880,000 | |||||||
9.125%, 8/15/19 | United States | 1,000,000 | 875,000 | |||||||
aSamson Investment Co., senior note, 144A, 9.75%, 2/15/20 | United States | 3,200,000 | 3,188,000 | |||||||
SandRidge Energy Inc., senior note, | ||||||||||
8.75%, 1/15/20 | United States | 300,000 | 314,250 | |||||||
7.50%, 3/15/21 | United States | 400,000 | 397,000 | |||||||
a144A, 8.00%, 6/01/18 | United States | 2,500,000 | 2,543,750 | |||||||
W&T Offshore Inc., senior note, 8.50%, 6/15/19 | United States | �� | 1,500,000 | 1,556,250 | ||||||
|
| |||||||||
| 76,557,566 | ||||||||||
|
| |||||||||
Food & Staples Retailing 0.9% | ||||||||||
Rite Aid Corp., senior secured note, | ||||||||||
9.75%, 6/12/16 | United States | 1,800,000 | 1,993,500 | |||||||
8.00%, 8/15/20 | United States | 1,000,000 | 1,137,500 | |||||||
|
| |||||||||
| 3,131,000 | ||||||||||
|
| |||||||||
Food, Beverage & Tobacco 2.8% | ||||||||||
aCEDC Finance Corp. International Inc., senior secured note, 144A, 9.125%, 12/01/16 | Russia | 700,000 | 445,813 | |||||||
Dean Foods Co., senior note, 9.75%, 12/15/18 | United States | 1,100,000 | 1,232,000 | |||||||
Del Monte Corp., senior note, 7.625%, 2/15/19 | United States | 2,900,000 | 2,939,875 | |||||||
aJBS USA LLC/Finance Inc., senior note, 144A, 8.25%, 2/01/20 | United States | 2,500,000 | 2,437,500 | |||||||
Pinnacle Foods Finance LLC/Corp., senior note, | ||||||||||
9.25%, 4/01/15 | United States | 1,300,000 | 1,342,250 | |||||||
8.25%, 9/01/17 | United States | 1,000,000 | 1,062,500 | |||||||
|
| |||||||||
| 9,459,938 | ||||||||||
|
| |||||||||
Health Care Equipment & Services 5.8% | ||||||||||
Amerigroup Corp., senior note, 7.50%, 11/15/19 | United States | 1,600,000 | 1,728,000 | |||||||
Aviv Healthcare Properties LP/Aviv Healthcare CapitalCorp., senior note, 7.75%, 2/15/19 | United States | 2,200,000 | 2,277,000 | |||||||
CHS/Community Health Systems Inc., senior note, 8.00%, 11/15/19 | United States | 1,700,000 | 1,810,500 | |||||||
FH-13
Franklin Templeton Variable Insurance Products Trust
Statement of Investments, June 30, 2012 (unaudited) (continued)
| Franklin High Income Securities Fund | Country | Principal Amount* | Value | |||||||
Corporate Bonds (continued) | ||||||||||
Health Care Equipment & Services (continued) | ||||||||||
aDJO Finance LLC/DJO Finance Corp., secured note, 144A, 8.75%, 3/15/18 | United States | 700,000 | $ | 717,500 | ||||||
Emergency Medical Services Corp., senior note, 8.125%, 6/01/19 | United States | 1,000,000 | 1,048,750 | |||||||
ExamWorks Group Inc., senior note, 9.00%, 7/15/19 | United States | 1,000,000 | 1,030,000 | |||||||
HCA Inc., | ||||||||||
senior note, 7.50%, 2/15/22 | United States | 800,000 | 874,000 | |||||||
senior secured bond, 7.25%, 9/15/20 | United States | 900,000 | 994,500 | |||||||
senior secured note, 7.875%, 2/15/20 | United States | 1,000,000 | 1,115,000 | |||||||
senior secured note, 5.875%, 3/15/22 | United States | 1,000,000 | 1,047,500 | |||||||
aHealth Management Associates Inc., senior note, 144A, 7.375%, 1/15/20 | United States | 2,100,000 | 2,244,375 | |||||||
MedAssets Inc., senior note, 8.00%, 11/15/18 | United States | 2,000,000 | 2,120,000 | |||||||
aUnited Surgical Partners International Inc., senior note, 144A, 9.00%, 4/01/20 | United States | 900,000 | 958,500 | |||||||
Vanguard Health Holding Co. II LLC/Inc., senior note, 8.00%, 2/01/18 | United States | 1,300,000 | 1,335,750 | |||||||
Vanguard Health Systems Inc., senior note, zero cpn., 2/01/16 | United States | 64,000 | 42,880 | |||||||
|
| |||||||||
| 19,344,255 | ||||||||||
|
| |||||||||
Materials 8.2% | ||||||||||
aCemex SAB de CV, senior secured note, 144A, 9.00%, 1/11/18 | Mexico | 3,500,000 | 3,141,250 | |||||||
Euramax International Inc., senior secured note, 9.50%, 4/01/16 | United States | 2,000,000 | 1,775,000 | |||||||
Exopack Holding Corp., senior note, 10.00%, 6/01/18 | United States | 1,600,000 | 1,612,000 | |||||||
aFMG Resources August 2006 Pty. Ltd., senior note, 144A, | ||||||||||
7.00%, 11/01/15 | Australia | 800,000 | 811,500 | |||||||
6.875%, 2/01/18 | Australia | 2,000,000 | 2,027,500 | |||||||
8.25%, 11/01/19 | Australia | 500,000 | 532,500 | |||||||
aIneos Finance PLC, senior secured note, 144A, | ||||||||||
9.00%, 5/15/15 | United Kingdom | 1,000,000 | 1,060,000 | |||||||
8.375%, 2/15/19 | United Kingdom | 200,000 | 206,625 | |||||||
7.50%, 5/01/20 | United Kingdom | 500,000 | 504,687 | |||||||
aIneos Group Holdings Ltd., senior secured note, 144A, 8.50%, 2/15/16 | United Kingdom | 1,500,000 | 1,383,750 | |||||||
aInmet Mining Corp., senior note, 144A, 8.75%, 6/01/20 | Canada | 2,300,000 | 2,288,500 | |||||||
aKinove German Bondco GmbH, senior secured note, 144A, 9.625%, 6/15/18 | Germany | 1,400,000 | 1,449,000 | |||||||
aMacDermid Inc., senior sub. note, 144A, 9.50%, 4/15/17 | United States | 2,500,000 | 2,625,000 | |||||||
b,fNewPage Corp., senior secured note, 11.375%, 12/31/14 | United States | 2,500,000 | 1,637,500 | |||||||
Novelis Inc., senior note, 8.75%, 12/15/20 | Canada | 1,300,000 | 1,407,250 | |||||||
aReynolds Group Issuer Inc./LLC/SA, senior note, 144A, | ||||||||||
8.50%, 5/15/18 | United States | 2,800,000 | 2,758,000 | |||||||
9.00%, 4/15/19 | United States | 200,000 | 200,500 | |||||||
9.875%, 8/15/19 | United States | 200,000 | 207,750 | |||||||
8.25%, 2/15/21 | United States | 400,000 | 380,000 | |||||||
aSealed Air Corp., senior note, 144A, | ||||||||||
8.125%, 9/15/19 | United States | 800,000 | 896,000 | |||||||
8.375%, 9/15/21 | United States | 400,000 | 454,000 | |||||||
|
| |||||||||
| 27,358,312 | ||||||||||
|
| |||||||||
Media 7.8% | ||||||||||
aBresnan Broadband Holdings LLC, senior note, 144A, 8.00%, 12/15/18 | United States | 1,200,000 | 1,260,000 | |||||||
Cablevision Systems Corp., senior note, 7.75%, 4/15/18 | United States | 1,000,000 | 1,070,000 | |||||||
CCO Holdings LLC/CCO Holdings Capital Corp., senior note, | ||||||||||
8.125%, 4/30/20 | United States | 700,000 | 784,000 | |||||||
6.50%, 4/30/21 | United States | 2,200,000 | 2,354,000 | |||||||
6.625%, 1/31/22 | United States | 300,000 | 322,500 | |||||||
Clear Channel Communications Inc., senior note, 9.00%, 3/01/21 | United States | 3,800,000 | 3,325,000 | |||||||
FH-14
Franklin Templeton Variable Insurance Products Trust
Statement of Investments, June 30, 2012 (unaudited) (continued)
| Franklin High Income Securities Fund | Country | Principal Amount* | Value | |||||||
Corporate Bonds (continued) | ||||||||||
Media (continued) | ||||||||||
aClear Channel Worldwide Holdings Inc., senior sub. note, 144A, 7.625%, | ||||||||||
3/15/20 | United States | 1,100,000 | $ | 1,080,750 | ||||||
3/15/20 | United States | 200,000 | 192,500 | |||||||
aCSC Holdings Inc., senior note, 144A, 6.75%, 11/15/21 | United States | 1,500,000 | 1,605,000 | |||||||
DISH DBS Corp., senior note, | ||||||||||
7.125%, 2/01/16 | United States | 3,000,000 | 3,307,500 | |||||||
6.75%, 6/01/21 | United States | 1,500,000 | 1,627,500 | |||||||
Media General Inc., senior secured note, 11.75%, 2/15/17 | United States | 1,400,000 | 1,512,000 | |||||||
gRadio One Inc., senior sub. note, PIK, 15.00%, 5/24/16 | United States | 1,676,514 | 1,337,020 | |||||||
aUnitymedia Hessen/NRW, senior secured note, 144A, 8.125%, 12/01/17 | Germany | 1,500,000 | 1,617,270 | |||||||
aUnivision Communications Inc., senior secured note, 144A, | ||||||||||
6.875%, 5/15/19 | United States | 2,500,000 | 2,587,500 | |||||||
7.875%, 11/01/20 | United States | 700,000 | 752,500 | |||||||
aUPCB Finance III Ltd., senior secured note, 144A, 6.625%, 7/01/20 | Netherlands | 1,000,000 | 1,020,000 | |||||||
aUPCB Finance VI Ltd., senior secured note, 144A, 6.875%, 1/15/22 | Netherlands | 500,000 | 506,562 | |||||||
|
| |||||||||
| 26,261,602 | ||||||||||
|
| |||||||||
Pharmaceuticals, Biotechnology & Life Sciences 2.3% | ||||||||||
Endo Health Solutions Inc., senior note, 7.00%, | ||||||||||
7/15/19 | United States | 1,000,000 | 1,092,500 | |||||||
12/15/20 | United States | 1,000,000 | 1,090,000 | |||||||
Giant Funding Corp., senior secured note, 8.25%, 2/01/18 | Spain | 2,300,000 | 2,484,000 | |||||||
ainVentiv Health Inc., senior note, 144A, 10.00%, | ||||||||||
8/15/18 | United States | 2,200,000 | 1,892,000 | |||||||
8/15/18 | United States | 200,000 | 173,000 | |||||||
aJaguar Holding Co. II/Merger Sub Inc., senior note, 144A, 9.50%, 12/01/19 | United States | 700,000 | 769,125 | |||||||
aMylan Inc., senior note, 144A, 7.875%, 7/15/20 | United States | 300,000 | 337,875 | |||||||
|
| |||||||||
| 7,838,500 | ||||||||||
|
| |||||||||
Real Estate 0.6% | ||||||||||
Forest City Enterprises Inc., senior note, | ||||||||||
7.625%, 6/01/15 | United States | 1,800,000 | 1,795,500 | |||||||
6.50%, 2/01/17 | United States | 300,000 | 288,750 | |||||||
|
| |||||||||
| 2,084,250 | ||||||||||
|
| |||||||||
Retailing 2.2% | ||||||||||
aAcademy Ltd./Finance Corp., senior note, 144A, 9.25%, 8/01/19 | United States | 1,500,000 | 1,635,000 | |||||||
Asbury Automotive Group Inc., senior sub. note, 8.375%, 11/15/20 | United States | 1,400,000 | 1,533,000 | |||||||
Michaels Stores Inc., senior note, 7.75%, 11/01/18 | United States | 1,500,000 | 1,590,000 | |||||||
aPetco Animal Supplies Inc., senior note, 144A, 9.25%, 12/01/18 | United States | 2,500,000 | 2,743,750 | |||||||
|
| |||||||||
| 7,501,750 | ||||||||||
|
| |||||||||
Semiconductors & Semiconductor Equipment 1.2% | ||||||||||
Advanced Micro Devices Inc., senior note, | ||||||||||
8.125%, 12/15/17 | United States | 300,000 | 327,000 | |||||||
7.75%, 8/01/20 | United States | 400,000 | 442,000 | |||||||
Freescale Semiconductor Inc., senior note, | United States | 2,000,000 | 1,985,000 | |||||||
10.75%, 8/01/20 | United States | 1,104,000 | 1,192,320 | |||||||
|
| |||||||||
| 3,946,320 | ||||||||||
|
| |||||||||
FH-15
Franklin Templeton Variable Insurance Products Trust
Statement of Investments, June 30, 2012 (unaudited) (continued)
| Franklin High Income Securities Fund | Country | Principal Amount* | Value | |||||||
Corporate Bonds (continued) | ||||||||||
Software & Services 4.3% | ||||||||||
a,hCeridian Corp., 144A, 8.875%, 7/15/19 | United States | 600,000 | $ | 622,500 | ||||||
First Data Corp., | United States | 1,000,000 | 1,006,250 | |||||||
senior note, 9.875%, 9/24/15 | United States | 111,000 | 112,942 | |||||||
senior note, 9.875%, 9/24/15 | United States | 71,000 | 71,888 | |||||||
asenior secured bond, 144A, 8.25%, 1/15/21 | United States | 2,500,000 | 2,512,500 | |||||||
aLawson Software Inc., senior note, 144A, 9.375%, 4/01/19 | United States | 600,000 | 643,500 | |||||||
Sitel LLC/Finance Corp., senior note, 11.50%, 4/01/18 | United States | 1,300,000 | 932,750 | |||||||
asenior secured note, 144A, 11.00%, 8/01/17 | United States | 700,000 | 680,750 | |||||||
Sterling International Inc., senior note, 11.00%, 10/01/19 | United States | 1,200,000 | 1,212,000 | |||||||
SunGard Data Systems Inc., senior note, 7.625%, 11/15/20 | United States | 2,300,000 | 2,461,000 | |||||||
West Corp., senior note, 7.875%, 1/15/19 | United States | 3,000,000 | 3,150,000 | |||||||
aZayo Escrow Corp., senior secured note, 144A, 8.125%, 1/01/20 | United States | 1,000,000 | 1,050,000 | |||||||
|
| |||||||||
| 14,456,080 | ||||||||||
|
| |||||||||
Technology Hardware & Equipment 1.8% | ||||||||||
CDW LLC/Finance Corp., senior note, 8.50%, 4/01/19 | United States | 3,200,000 | 3,424,000 | |||||||
aCommScope Inc., senior note, 144A, 8.25%, 1/15/19 | United States | 2,300,000 | 2,443,750 | |||||||
|
| |||||||||
| 5,867,750 | ||||||||||
|
| |||||||||
Telecommunication Services 9.0% | ||||||||||
CenturyLink Inc., senior note, | ||||||||||
6.45%, 6/15/21 | United States | 400,000 | 417,219 | |||||||
5.80%, 3/15/22 | United States | 3,000,000 | 2,994,192 | |||||||
Cricket Communications Inc., senior note, 7.75%, 10/15/20 | United States | 3,500,000 | 3,360,000 | |||||||
aDigicel Group Ltd., senior note, 144A, 8.875%, 1/15/15 | Jamaica | 2,000,000 | 2,030,000 | |||||||
aeAccess Ltd., senior note, 144A, 8.25%, 4/01/18 | Japan | 1,800,000 | 1,656,000 | |||||||
Frontier Communications Corp., senior note, | ||||||||||
8.25%, 4/15/17 | United States | 400,000 | 432,000 | |||||||
8.50%, 4/15/20 | United States | 2,500,000 | 2,662,500 | |||||||
8.75%, 4/15/22 | United States | 900,000 | 949,500 | |||||||
Intelsat Jackson Holdings SA, senior note, | ||||||||||
7.25%, 10/15/20 | Luxembourg | 900,000 | 951,750 | |||||||
7.50%, 4/01/21 | Luxembourg | 3,800,000 | 4,037,500 | |||||||
MetroPCS Wireless Inc., senior note, 7.875%, 9/01/18 | United States | 1,500,000 | 1,563,750 | |||||||
Sprint Nextel Corp., senior note, | ||||||||||
8.375%, 8/15/17 | United States | 3,000,000 | 3,090,000 | |||||||
a144A, 9.00%, 11/15/18 | United States | 3,000,000 | 3,360,000 | |||||||
a144A, 7.00%, 3/01/20 | United States | 300,000 | 312,750 | |||||||
aWind Acquisition Finance SA, senior secured note, 144A, 11.75%, 7/15/17 | Italy | 2,000,000 | 1,637,500 | |||||||
a,gWind Acquisition Holdings Finance SA, senior secured note, 144A, PIK, 12.25%, | ||||||||||
7/15/17 | Italy | 512,255 | EUR | 447,576 | ||||||
7/15/17 | Italy | 530,625 | 365,940 | |||||||
|
| |||||||||
| 30,268,177 | ||||||||||
|
| |||||||||
Transportation 2.5% | ||||||||||
a,bAmerican Airlines Inc., senior secured note, 144A, 7.50%, 3/15/16 | United States | 2,500,000 | 2,375,000 | |||||||
aCeva Group PLC, senior secured note, 144A, | ||||||||||
11.625%, 10/01/16 | United Kingdom | 200,000 | 209,500 | |||||||
8.375%, 12/01/17 | United Kingdom | 1,300,000 | 1,265,063 | |||||||
11.50%, 4/01/18 | United Kingdom | 1,000,000 | 927,500 | |||||||
Hertz Corp., senior note, | ||||||||||
7.50%, 10/15/18 | United States | 1,100,000 | 1,185,250 | |||||||
FH-16
Franklin Templeton Variable Insurance Products Trust
Statement of Investments, June 30, 2012 (unaudited) (continued)
| Franklin High Income Securities Fund | Country | Principal Amount* | Value | |||||||
Corporate Bonds (continued) | ||||||||||
Transportation (continued) | ||||||||||
6.75%, 4/15/19 | United States | 2,000,000 | $ | 2,090,000 | ||||||
a144A, 6.75%, 4/15/19 | United States | 200,000 | 209,000 | |||||||
|
| |||||||||
| 8,261,313 | ||||||||||
|
| |||||||||
Utilities 2.6% | ||||||||||
aCalpine Corp., senior secured note, 144A, | ||||||||||
7.875%, 7/31/20 | United States | 800,000 | 886,000 | |||||||
7.50%, 2/15/21 | United States | 1,500,000 | 1,627,500 | |||||||
7.875%, 1/15/23 | United States | 1,000,000 | 1,095,000 | |||||||
aIntergen NV, senior secured note, 144A, 9.00%, 6/30/17 | Netherlands | 2,500,000 | 2,482,813 | |||||||
Texas Competitive Electric Holdings Co. LLC/Texas Competitive Electric Holdings Finance Inc., | ||||||||||
a144A, 11.50%, 10/01/20 | United States | 3,500,000 | 2,406,250 | |||||||
B, 15.00%, 4/01/21 | United States | 852,000 | 293,940 | |||||||
|
| |||||||||
| 8,791,503 | ||||||||||
|
| |||||||||
Total Corporate Bonds (Cost $311,091,656) | 314,022,872 | |||||||||
|
| |||||||||
e,iSenior Floating Rate Interests 0.9% | ||||||||||
Media 0.6% | ||||||||||
Cumulus Media Holdings Inc., Second Lien Term Loan, 7.50%, 9/16/19 | United States | 1,500,000 | 1,503,750 | |||||||
Univision Communications Inc., Initial Term Loan, 2.245%, 9/29/14 | United States | 379,585 | 370,009 | |||||||
|
| |||||||||
| 1,873,759 | ||||||||||
|
| |||||||||
Utilities 0.3% | ||||||||||
Texas Competitive Electric Holdings Co. LLC, 2017 Term Loan, 4.741%, 10/10/17 | United States | 1,431,288 | 858,635 | |||||||
|
| |||||||||
Total Senior Floating Rate Interests (Cost $3,016,584) | 2,732,394 | |||||||||
|
| |||||||||
Total Investments before Short Term Investments (Cost $314,878,240) | 317,496,006 | |||||||||
|
| |||||||||
Short Term Investments (Cost $12,360,844) 3.7% | ||||||||||
Repurchase Agreements 3.7% | ||||||||||
jJoint Repurchase Agreement, 0.129%, 7/02/12 (Maturity Value $12,360,977) | United States | 12,360,844 | 12,360,844 | |||||||
BNP Paribas Securities Corp. (Maturity Value $2,414,717) | ||||||||||
Credit Suisse Securities (USA) LLC (Maturity Value $2,817,190) | ||||||||||
Deutsche Bank Securities Inc. (Maturity Value $1,897,163) | ||||||||||
HSBC Securities (USA) Inc. (Maturity Value $1,609,770) | ||||||||||
Merrill Lynch, Pierce, Fenner & Smith Inc. (Maturity Value $1,609,770) | ||||||||||
Morgan Stanley & Co. LLC (Maturity Value $804,947) | ||||||||||
UBS Securities LLC (Maturity Value $1,207,420) | ||||||||||
Collateralized by U.S. Government Agency Securities, 0.00% - 5.25%, 8/01/12 - 6/28/17; | ||||||||||
|
| |||||||||
Total Investments (Cost $327,239,084) 98.5% | 329,856,850 | |||||||||
Other Assets, less Liabilities 1.5% | 5,165,321 | |||||||||
|
| |||||||||
Net Assets 100.0% | $ | 335,022,171 | ||||||||
|
| |||||||||
FH-17
Franklin Templeton Variable Insurance Products Trust
Statement of Investments, June 30, 2012 (unaudited)
| Franklin High Income Securities Fund |
*The principal amount is stated in U.S. dollars unless otherwise indicated.
aSecurity was purchased pursuant to Rule 144A under the Securities Act of 1933 and may be sold in transactions exempt from registration only to qualified institutional buyers or in a public offering registered under the Securities Act of 1933. These securities have been deemed liquid under guidelines approved by the Trust’s Board of Trustees. At June 30, 2012, the aggregate value of these securities was $110,638,938, representing 33.02% of net assets.
bSee Note 7 regarding defaulted securities.
cSecurity has been deemed illiquid because it may not be able to be sold within seven days. At June 30, 2012, the value of this security was $191, representing less than 0.01% of net assets.
dPerpetual security with no stated maturity date.
eThe coupon rate shown represents the rate at period end.
fAt June 30, 2012, pursuant to the Fund’s policies and the requirements of applicable securities law, the Fund may be restricted from trading these securities for a limited or extended period of time due to ownership limits and/or potential possession of material non-public information.
gIncome may be received in additional securities and/or cash.
hSecurity purchased on a when-issued basis.
iSee Note 1(f) regarding senior floating rate interests.
jSee Note 1(c) regarding joint repurchase agreement.
kThe security is traded on a discount basis with no stated coupon rate.
FH-18
Franklin Templeton Variable Insurance Products Trust
Statement of Investments, June 30, 2012 (unaudited) (continued)
| Franklin High Income Securities Fund |
Forward Exchange Contracts
At June 30, 2012, the Fund had the following forward exchange contracts outstanding. See Note 1(e).
| Currency | Counterparty | Type | Quantity | Contract Amount | Settlement Date | Unrealized Appreciation | Unrealized Depreciation | |||||||||||||||||||||
Euro | DBAB | Sell | 400,000 | $ | 525,560 | 12/17/12 | $ | 18,310 | $ | — | ||||||||||||||||||
|
| |||||||||||||||||||||||||||
See Abbreviations on page FH-32.
The accompanying notes are an integral part of these financial statements.
FH-19
Franklin Templeton Variable Insurance Products Trust
Financial Statements
Statement of Assets and Liabilities
June 30, 2012 (unaudited)
| Franklin High Income Securities Fund | ||||
Assets: | ||||
Investments in securities: | ||||
Cost - Unaffiliated issuers | $ | 314,878,240 | ||
Cost - Repurchase agreements | 12,360,844 | |||
|
| |||
Total cost of investments | $ | 327,239,084 | ||
|
| |||
Value - Unaffiliated issuers | $ | 317,496,006 | ||
Value - Repurchase agreements | 12,360,844 | |||
|
| |||
Total value of investments | 329,856,850 | |||
Cash | 685 | |||
Receivables: | ||||
Capital shares sold | 71,237 | |||
Interest | 6,302,116 | |||
Unrealized appreciation on forward exchange contracts | 18,310 | |||
Other assets | 80 | |||
|
| |||
Total assets | 336,249,278 | |||
|
| |||
Liabilities: | ||||
Payables: | ||||
Investment securities purchased | 682,142 | |||
Capital shares redeemed | 180,373 | |||
Affiliates | 264,169 | |||
Reports to shareholders | 76,134 | |||
Accrued expenses and other liabilities | 24,289 | |||
|
| |||
Total liabilities | 1,227,107 | |||
|
| |||
Net assets, at value | $ | 335,022,171 | ||
|
| |||
Net assets consist of: | ||||
Paid-in capital | $ | 359,054,498 | ||
Undistributed net investment income | 10,924,405 | |||
Net unrealized appreciation (depreciation) | 2,636,076 | |||
Accumulated net realized gain (loss) | (37,592,808 | ) | ||
|
| |||
Net assets, at value | $ | 335,022,171 | ||
|
| |||
The accompanying notes are an integral part of these financial statements.
FH-20
Franklin Templeton Variable Insurance Products Trust
Financial Statements (continued)
Statement of Assets and Liabilities (continued)
June 30, 2012 (unaudited)
| Franklin High Income Securities Fund | ||||
Class 1: | ||||
Net assets, at value | $ | 41,074,988 | ||
|
| |||
Shares outstanding | 6,340,339 | |||
|
| |||
Net asset value and maximum offering price per share | $ | 6.48 | ||
|
| |||
Class 2: | ||||
Net assets, at value | $ | 267,040,937 | ||
|
| |||
Shares outstanding | 42,319,193 | |||
|
| |||
Net asset value and maximum offering price per share | $ | 6.31 | ||
|
| |||
Class 4: | ||||
Net assets, at value | $ | 26,906,246 | ||
|
| |||
Shares outstanding | 4,188,641 | |||
|
| |||
Net asset value and maximum offering price per share | $ | 6.42 | ||
|
| |||
The accompanying notes are an integral part of these financial statements.
FH-21
Franklin Templeton Variable Insurance Products Trust
Financial Statements (continued)
Statement of Operations
for the six months ended June 30, 2012 (unaudited)
| Franklin High Income Securities Fund | ||||
Investment income: | ||||
Dividends | $ | 70,781 | ||
Interest | 12,986,607 | |||
|
| |||
Total investment income | 13,057,388 | |||
|
| |||
Expenses: | ||||
Management fees (Note 3a) | 865,129 | |||
Distribution fees: (Note 3c) | ||||
Class 2 | 325,687 | |||
Class 4 | 47,664 | |||
Unaffiliated transfer agent fees | 15 | |||
Custodian fees (Note 4) | 2,367 | |||
Reports to shareholders | 51,742 | |||
Professional fees | 21,491 | |||
Trustees’ fees and expenses | 641 | |||
Other | 13,195 | |||
|
| |||
Total expenses | 1,327,931 | |||
|
| |||
Net investment income | 11,729,457 | |||
|
| |||
Realized and unrealized gains (losses): | ||||
Net realized gain (loss) from: | ||||
Investments | 1,315,912 | |||
Foreign currency transactions | 4 | |||
Swap Contracts | (236,015 | ) | ||
|
| |||
Net realized gain (loss) | 1,079,901 | |||
|
| |||
Net change in unrealized appreciation (depreciation) on: | ||||
Investments | 9,429,756 | |||
Translation of other assets and liabilities denominated in foreign currencies | 13,457 | |||
|
| |||
Net change in unrealized appreciation (depreciation) | 9,443,213 | |||
|
| |||
Net realized and unrealized gain (loss) | 10,523,114 | |||
|
| |||
Net increase (decrease) in net assets resulting from operations | $ | 22,252,571 | ||
|
| |||
The accompanying notes are an integral part of these financial statements.
FH-22
Franklin Templeton Variable Insurance Products Trust
Financial Statements (continued)
Statements of Changes in Net Assets
| Franklin High Income Securities Fund | ||||||||
| Six Months Ended June 30, 2012 (unaudited) | Year Ended December 31, 2011 | |||||||
| ||||||||
Increase (decrease) in net assets: | ||||||||
Operations: | ||||||||
Net investment income | $ | 11,729,457 | $ | 24,281,884 | ||||
Net realized gain (loss) from investments, foreign currency transactions and swap contracts | 1,079,901 | 7,087,968 | ||||||
Net change in unrealized appreciation (depreciation) on investments and translation of other assets and liabilities denominated in foreign currencies | 9,443,213 | (18,159,827 | ) | |||||
| ||||||||
Net increase (decrease) in net assets resulting from operations | 22,252,571 | 13,210,025 | ||||||
| ||||||||
Distributions to shareholders from: | ||||||||
Net investment income: | ||||||||
Class 1 | (2,935,357 | ) | (2,826,791 | ) | ||||
Class 2 | (18,731,686 | ) | (16,984,105 | ) | ||||
Class 4 | (1,858,828 | ) | (1,620,002 | ) | ||||
| ||||||||
Total distributions to shareholders | (23,525,871 | ) | (21,430,898 | ) | ||||
| ||||||||
Capital share transactions: (Note 2) | ||||||||
Class 1 | (869,092 | ) | (5,339,666 | ) | ||||
Class 2 | 18,811,914 | 16,598,368 | ||||||
Class 4 | (125,850 | ) | 1,632,254 | |||||
| ||||||||
Total capital share transactions | 17,816,972 | 12,890,956 | ||||||
| ||||||||
Net increase (decrease) in net assets | 16,543,672 | 4,670,083 | ||||||
Net assets: | ||||||||
Beginning of period | 318,478,499 | 313,808,416 | ||||||
| ||||||||
End of period | $ | 335,022,171 | $ | 318,478,499 | ||||
| ||||||||
Undistributed net investment income included in net assets: | ||||||||
End of period | $ | 10,924,405 | $ | 22,720,819 | ||||
| ||||||||
The accompanying notes are an integral part of these financial statements.
FH-23
Franklin Templeton Variable Insurance Products Trust
Notes to Financial Statements (unaudited)
Franklin High Income Securities Fund
1. ORGANIZATION AND SIGNIFICANT ACCOUNTING POLICIES
Franklin Templeton Variable Insurance Products Trust (Trust) is registered under the Investment Company Act of 1940, as amended, (1940 Act) as an open-end investment company, consisting of twenty separate funds. The Franklin High Income Securities Fund (Fund) is included in this report. The financial statements of the remaining funds in the Trust are presented separately. Shares of the Fund are generally sold only to insurance company separate accounts to fund the benefits of variable life insurance policies or variable annuity contracts. At June 30, 2012, 85.18% of the Fund’s shares were held through one insurance company. The Fund offers three classes of shares: Class 1, Class 2, and Class 4. Each class of shares differs by its distribution fees, voting rights on matters affecting a single class and its exchange privilege.
The following summarizes the Fund’s significant accounting policies.
a. Financial Instrument Valuation
The Fund’s investments in financial instruments are carried at fair value daily. Fair value is the price that would be received to sell an asset or paid to transfer a liability in an orderly transaction between market participants on the measurement date. Under procedures approved by the Trust’s Board of Trustees (the Board), the Fund’s administrator, investment manager and other affiliates have formed the Valuation and Liquidity Oversight Committee (VLOC). The VLOC provides administration and oversight of the Fund’s valuation policies and procedures, which are approved annually by the Board. Among other things, these procedures allow the Fund to utilize independent pricing services, quotations from securities and financial instrument dealers, and other market sources to determine fair value.
Equity securities listed on an exchange or on the NASDAQ National Market System are valued at the last quoted sale price or the official closing price of the day, respectively. Over-the-counter (OTC) securities are valued within the range of the most recent quoted bid and ask prices. Securities that trade in multiple markets or on multiple exchanges are valued according to the broadest and most representative market. Certain equity securities are valued based upon fundamental characteristics or relationships to similar securities.
Debt securities generally trade in the OTC market rather than on a securities exchange. The Fund’s pricing services use multiple valuation techniques to determine fair value. In instances where sufficient market activity exists, the pricing services may utilize a market-based approach through which quotes from market makers are used to determine fair value. In instances where sufficient market activity may not exist or is limited, the pricing services also utilize proprietary valuation models which may consider market characteristics such as benchmark yield curves, credit spreads, estimated default rates, anticipated market interest rate volatility, coupon rates, anticipated timing of principal repayments, underlying collateral, and other unique security features in order to estimate the relevant cash flows, which are then discounted to calculate the fair value. Securities denominated in a foreign currency are converted into their U.S. dollar equivalent at the foreign exchange rate in effect at the close of the NYSE on the date that the values of the foreign debt securities are determined. Repurchase agreements are valued at cost, which approximates market value.
Certain derivative financial instruments (derivatives) trade in the OTC market. The Fund’s pricing services use various techniques including industry standard option pricing models and proprietary discounted cash flow models to determine the fair value of those instruments. The Fund’s net benefit or obligation under the derivative contract, as measured by the fair market value of the contract, is included in net assets.
The Fund has procedures to determine the fair value of financial instruments for which market prices are not reliable or readily available. Under these procedures, the VLOC convenes on a regular basis to review such financial instruments and considers a number of factors, including significant unobservable valuation inputs, when arriving at fair value. The VLOC primarily employs a market-based approach which may use related or comparable assets or liabilities, recent transactions, market multiples, book values, and other relevant information for the investment to determine the fair value of the investment. An income-based valuation approach may also be used in which the anticipated future cash flows of the investment are discounted to calculate fair
FH-24
Franklin Templeton Variable Insurance Products Trust
Notes to Financial Statements (unaudited) (continued)
Franklin High Income Securities Fund
1. ORGANIZATION AND SIGNIFICANT ACCOUNTING POLICIES (continued)
a. Financial Instrument Valuation (continued)
value. Discounts may also be applied due to the nature or duration of any restrictions on the disposition of the investments. Due to the inherent uncertainty of valuations of such investments, the fair values may differ significantly from the values that would have been used had an active market existed. The VLOC employs various methods for calibrating these valuation approaches including a regular review of key inputs and assumptions, transactional back-testing or disposition analysis, and reviews of any related market activity.
Trading in securities on foreign securities stock exchanges and OTC markets may be completed before the daily close of business on the NYSE. Occasionally, events occur between the time at which trading in a foreign security is completed and the close of the NYSE that might call into question the reliability of the value of a portfolio security held by the Fund. As a result, differences may arise between the value of the Fund’s portfolio securities as determined at the foreign market close and the latest indications of value at the close of the NYSE. In order to minimize the potential for these differences, the VLOC monitors price movements following the close of trading in foreign stock markets through a series of country specific market proxies (such as baskets of American Depositary Receipts, futures contracts and exchange traded funds). These price movements are measured against established trigger thresholds for each specific market proxy to assist in determining if an event has occurred that may call into question the reliability of the values of the foreign securities held by the Fund. If such an event occurs, the securities may be valued using fair value procedures, which may include the use of independent pricing services.
b. Foreign Currency Translation
Portfolio securities and other assets and liabilities denominated in foreign currencies are translated into U.S. dollars based on the exchange rate of such currencies against U.S. dollars on the date of valuation. The Fund may enter into foreign currency exchange contracts to facilitate transactions denominated in a foreign currency. Purchases and sales of securities, income and expense items denominated in foreign currencies are translated into U.S. dollars at the exchange rate in effect on the transaction date. Portfolio securities and assets and liabilities denominated in foreign currencies contain risks that those currencies will decline in value relative to the U.S. dollar. Occasionally, events may impact the availability or reliability of foreign exchange rates used to convert the U.S. dollar equivalent value. If such an event occurs, the foreign exchange rate will be valued at fair value using procedures established and approved by the Board.
The Fund does not separately report the effect of changes in foreign exchange rates from changes in market prices on securities held. Such changes are included in net realized and unrealized gain or loss from investments on the Statement of Operations.
Realized foreign exchange gains or losses arise from sales of foreign currencies, currency gains or losses realized between the trade and settlement dates on securities transactions and the difference between the recorded amounts of dividends, interest, and foreign withholding taxes and the U.S. dollar equivalent of the amounts actually received or paid. Net unrealized foreign exchange gains and losses arise from changes in foreign exchange rates on foreign denominated assets and liabilities other than investments in securities held at the end of the reporting period.
c. Joint Repurchase Agreement
The Fund enters into a joint repurchase agreement whereby its uninvested cash balance is deposited into a joint cash account with other funds managed by the investment manager or an affiliate of the investment manager and is used to invest in one or more repurchase agreements. The value and face amount of the joint repurchase agreement are allocated to the funds based on their pro-rata interest. A repurchase agreement is accounted for as a loan by the fund to the seller, collateralized by securities which are delivered to the fund’s custodian. The market value, including accrued interest, of the initial collateralization is required to be at least 102% of the dollar amount invested by the funds, with the value of the underlying securities marked to market daily to maintain coverage of at least 100%. The joint repurchase agreement held by the Fund at period end had been entered into on 6/29/12.
FH-25
Franklin Templeton Variable Insurance Products Trust
Notes to Financial Statements (unaudited) (continued)
Franklin High Income Securities Fund
1. ORGANIZATION AND SIGNIFICANT ACCOUNTING POLICIES (continued)
d. Securities Purchased on a When-Issued Basis
The Fund purchases securities on a when-issued basis, with payment and delivery scheduled for a future date. These transactions are subject to market fluctuations and are subject to the risk that the value at delivery may be more or less than the trade date purchase price. Although the Fund will generally purchase these securities with the intention of holding the securities, it may sell the securities before the settlement date. Sufficient assets have been segregated for these securities.
e. Derivative Financial Instruments
The Fund invested in derivatives in order to manage risk or gain exposure to various other investments or markets. Derivatives are financial contracts based on an underlying or notional amount, require no initial investment or an initial net investment that is smaller than would normally be required to have a similar response to changes in market factors, and require or permit net settlement. Derivatives contain various risks including the potential inability of the counterparty to fulfill their obligations under the terms of the contract, the potential for an illiquid secondary market, and/or the potential for market movements which expose the Fund to gains or losses in excess of the amounts shown on the Statement of Assets and Liabilities. Realized gain and loss and unrealized appreciation and depreciation on these contracts for the period are included in the Statement of Operations.
The Fund entered into forward exchange contracts primarily to manage and/or gain exposure to certain foreign currencies. A forward exchange contract is an agreement between the Fund and a counterparty to buy or sell a foreign currency for a specific exchange rate on a future date. Pursuant to the terms of the forward exchange contracts, cash or securities may be required to be deposited as collateral. Unrestricted cash may be invested according to the Fund’s investment objectives.
The Fund entered into credit default swap contracts primarily to manage and/or gain exposure to credit risk. A credit default swap is an agreement between the Fund and a counterparty whereby the buyer of the contract receives credit protection and the seller of the contract guarantees the credit worthiness of a referenced debt obligation. The underlying referenced debt obligation may be a single issuer of corporate or sovereign debt, a credit index, or a tranche of a credit index. In the event of a default of the underlying referenced debt obligation, the buyer is entitled to receive the notional amount of the credit default swap contract from the seller in exchange for the referenced debt obligation, a net settlement amount equal to the notional amount of the credit default swap less the recovery value of the referenced debt obligation, or other agreed upon amount. Over the term of the contract, the buyer pays the seller a periodic stream of payments, provided that no event of default has occurred. Such periodic payments are accrued daily as an unrealized appreciation or depreciation until the payments are made, at which time they are realized. Payments received or paid to initiate a credit default swap contract are reflected on the Statement of Assets and Liabilities and represent compensating factors between stated terms of the credit default swap agreement and prevailing market conditions (credit spreads and other relevant factors). These upfront payments are amortized over the term of the contract as a realized gain or loss on the Statement of Operations. Pursuant to the terms of the credit default swap contract, cash or securities may be required to be deposited as collateral. Unrestricted cash may be invested according to the Fund’s investment objectives.
The Fund’s investments in OTC derivatives are subject to the terms of International Swaps and Derivatives Association Master Agreements and other related agreements between the Fund and certain derivative counterparties. These agreements contain various provisions, including but not limited to collateral requirements, events of default, requirements for the Fund to maintain certain net asset levels and/or limit the decline in net assets over various periods of time. Should the Fund fail to meet any of these provisions, the derivative counterparty has the right to terminate the derivative contract and require immediate payment by the Fund for those OTC derivatives with that particular counterparty that are in a net unrealized loss position. At June 30, 2012, the Fund had no OTC derivatives in a net unrealized loss position for such contracts.
See Note 8 regarding other derivative information.
FH-26
Franklin Templeton Variable Insurance Products Trust
Notes to Financial Statements (unaudited) (continued)
Franklin High Income Securities Fund
1. ORGANIZATION AND SIGNIFICANT ACCOUNTING POLICIES (continued)
f. Senior Floating Rate Interests
The Fund invests in senior secured corporate loans that pay interest at rates which are periodically reset by reference to a base lending rate plus a spread. These base lending rates are generally the prime rate offered by a designated U.S. bank or the London InterBank Offered Rate (LIBOR). Senior secured corporate loans often require prepayment of principal from excess cash flows or at the discretion of the borrower. As a result, actual maturity may be substantially less than the stated maturity.
Senior secured corporate loans in which the Fund invests are generally readily marketable, but may be subject to some restrictions on resale.
g. Income and Deferred Taxes
It is the Fund’s policy to qualify as a regulated investment company under the Internal Revenue Code. The Fund intends to distribute to shareholders substantially all of its taxable income and net realized gains to relieve it from federal income and if applicable, excise taxes. As a result, no provision for U.S. federal income taxes is required.
The Fund may be subject to foreign taxation related to income received, capital gains on the sale of securities and certain foreign currency transactions in the foreign jurisdictions in which it invests. Foreign taxes, if any, are recorded based on the tax regulations and rates that exist in the foreign markets in which the Fund invests. When a capital gain tax is determined to apply the Fund records an estimated deferred tax liability in an amount that would be payable if the securities were disposed of on the valuation date.
The Fund recognizes the tax benefits of uncertain tax positions only when the position is “more likely than not” to be sustained upon examination by the tax authorities based on the technical merits of the tax position. As of June 30, 2012, and for all open tax years, the Fund has determined that no liability for unrecognized tax benefits is required in the Fund’s financial statements related to uncertain tax positions taken on a tax return (or expected to be taken on future tax returns). Open tax years are those that remain subject to examination and are based on each tax jurisdiction statute of limitation.
h. Security Transactions, Investment Income, Expenses and Distributions
Security transactions are accounted for on trade date. Realized gains and losses on security transactions are determined on a specific identification basis. Interest income and estimated expenses are accrued daily. Amortization of premium and accretion of discount on debt securities are included in interest income. Facility fees are recognized as income over the expected term of the loan. Dividend income is recorded on the ex-dividend date except that certain dividends from foreign securities are recognized as soon as the Fund is notified of the ex-dividend date. Distributions to shareholders are recorded on the ex-dividend date and are determined according to income tax regulations (tax basis). Distributable earnings determined on a tax basis may differ from earnings recorded in accordance with accounting principles generally accepted in the United States of America. These differences may be permanent or temporary. Permanent differences are reclassified among capital accounts to reflect their tax character. These reclassifications have no impact on net assets or the results of operations. Temporary differences are not reclassified, as they may reverse in subsequent periods.
Common expenses incurred by the Trust are allocated among the funds based on the ratio of net assets of each fund to the combined net assets of the Trust. Fund specific expenses are charged directly to the fund that incurred the expense.
Realized and unrealized gains and losses and net investment income, not including class specific expenses, are allocated daily to each class of shares based upon the relative proportion of net assets of each class. Differences in per share distributions, by class, are generally due to differences in class specific expenses.
FH-27
Franklin Templeton Variable Insurance Products Trust
Notes to Financial Statements (unaudited) (continued)
Franklin High Income Securities Fund
1. ORGANIZATION AND SIGNIFICANT ACCOUNTING POLICIES (continued)
i. Accounting Estimates
The preparation of financial statements in accordance with accounting principles generally accepted in the United States of America requires management to make estimates and assumptions that affect the reported amounts of assets and liabilities at the date of the financial statements and the amounts of income and expenses during the reporting period. Actual results could differ from those estimates.
j. Guarantees and Indemnifications
Under the Trust’s organizational documents, its officers and trustees are indemnified by the Trust against certain liabilities arising out of the performance of their duties to the Trust. Additionally, in the normal course of business, the Trust, on behalf of the Fund, enters into contracts with service providers that contain general indemnification clauses. The Trust’s maximum exposure under these arrangements is unknown as this would involve future claims that may be made against the Trust that have not yet occurred. Currently, the Trust expects the risk of loss to be remote.
2. SHARES OF BENEFICIAL INTEREST
At June 30, 2012, there were an unlimited number of shares authorized (without par value). Transactions in the Fund’s shares were as follows:
| Year Ended June 30, | ||||||||||||||||
| 2012 | 2011 | |||||||||||||||
| Six Months Ended June 30, 2012 | Year Ended December 31, 2011 | |||||||||||||||
| Class 1 Shares: | Shares | Amount | Shares | Amount | ||||||||||||
Shares sold | 75,634 | $ | 504,520 | 351,292 | $ | 2,313,979 | ||||||||||
Shares issued in reinvestment of distributions | 461,534 | 2,935,357 | 434,223 | 2,826,791 | ||||||||||||
Shares redeemed | (632,655 | ) | (4,308,969 | ) | (1,598,692 | ) | (10,480,436 | ) | ||||||||
| ||||||||||||||||
Net increase (decrease) | (95,487 | ) | $ | (869,092 | ) | (813,177 | ) | $ | (5,339,666 | ) | ||||||
| ||||||||||||||||
Class 2 Shares: | ||||||||||||||||
Shares sold | 3,863,510 | $ | 25,457,450 | 12,499,502 | $ | 81,812,457 | ||||||||||
Shares issued in reinvestment of distributions | 3,021,240 | 18,731,686 | 2,674,662 | 16,984,105 | ||||||||||||
Shares redeemed | (3,811,299 | ) | (25,377,222 | ) | (12,968,695 | ) | (82,198,194 | ) | ||||||||
| ||||||||||||||||
Net increase (decrease) | 3,073,451 | $ | 18,811,914 | 2,205,469 | $ | 16,598,368 | ||||||||||
| ||||||||||||||||
Class 4 Shares: | ||||||||||||||||
Shares sold | 26,564 | $ | 178,396 | 337,849 | $ | 2,262,900 | ||||||||||
Shares issued on reinvestment of distributions | 294,584 | 1,858,828 | 250,774 | 1,620,002 | ||||||||||||
Shares redeemed | (321,849 | ) | (2,163,074 | ) | (344,910 | ) | (2,250,648 | ) | ||||||||
| ||||||||||||||||
Net increase (decrease) | (701 | ) | $ | (125,850 | ) | 243,713 | $ | 1,632,254 | ||||||||
| ||||||||||||||||
FH-28
Franklin Templeton Variable Insurance Products Trust
Notes to Financial Statements (unaudited) (continued)
Franklin High Income Securities Fund
3. TRANSACTIONS WITH AFFILIATES
Franklin Resources, Inc. is the holding company for various subsidiaries that together are referred to as Franklin Templeton Investments. Certain officers and trustees of the Fund are also officers and/or directors of the following subsidiaries:
| Subsidiary | Affiliation | |
Franklin Advisers, Inc. (Advisers) | Investment manager | |
Franklin Templeton Services, LLC (FT Services) | Administrative manager | |
Franklin Templeton Distributors, Inc. (Distributors) | Principal underwriter | |
Franklin Templeton Investor Services, LLC (Investor Services) | Transfer agent |
a. Management Fees
The Fund pays an investment management fee to Advisers based on the average daily net assets of the Fund as follows:
| Annualized Fee Rate | Net Assets | |
| 0.625% | Up to and including $100 million | |
| 0.500% | Over $100 million, up to and including $250 million | |
| 0.450% | Over $250 million, up to and including $7.5 billion | |
| 0.440% | Over $7.5 billion, up to and including $10 billion | |
| 0.430% | Over $10 billion, up to and including $12.5 billion | |
| 0.420% | Over $12.5 billion, up to and including $15 billion | |
| 0.400% | In excess of $15 billion |
b. Administrative Fees
Under an agreement with Advisers, FT Services provides administrative services to the Fund. The fee is paid by Advisers based on average daily net assets, and is not an additional expense of the Fund.
c. Distribution Fees
The Board adopted distribution plans for Class 2 and Class 4 shares pursuant to Rule 12b-1 under the 1940 Act. Under the Fund’s compensation distribution plans, the Fund pays Distributors for costs incurred in connection with the servicing, sale and distribution of the Fund’s shares up to 0.35% per year of its average daily net assets of each class. The Board has agreed to limit the current rate to 0.25% per year for Class 2.
d. Transfer Agent Fees
Investor Services, under terms of an agreement, performs shareholder servicing for the Fund and is not paid by the Fund for the services.
4. EXPENSE OFFSET ARRANGEMENT
The Fund has entered into an arrangement with its custodian whereby credits realized as a result of uninvested cash balances are used to reduce a portion of the Fund’s custodian expenses. During the period ended June 30, 2012, there were no credits earned.
FH-29
Franklin Templeton Variable Insurance Products Trust
Notes to Financial Statements (unaudited) (continued)
Franklin High Income Securities Fund
5. INCOME TAXES
For tax purposes, capital losses may be carried over to offset future capital gains, if any. Capital loss carryforwards with no expiration, if any, must be fully utilized before those losses with expiration dates.
At December 31, 2011, capital loss carryforwards were as follows:
Capital loss carryforwards expiring in: | ||||
2012 | $ | 9,009,590 | ||
2013 | 6,321,190 | |||
2014 | 40,420 | |||
2015 | 4,493,289 | |||
2016 | 8,150,741 | |||
2017 | 10,621,353 | |||
|
| |||
| $ | 38,636,583 | |||
|
|
At June 30, 2012, the cost of investments and net unrealized appreciation (depreciation) for income tax purposes were as follows:
Cost of investments | $ | 328,026,150 | ||
|
| |||
Unrealized appreciation | $ | 13,879,203 | ||
Unrealized depreciation | (12,048,503 | ) | ||
|
| |||
Net unrealized appreciation (depreciation) | $ | 1,830,700 | ||
|
| |||
Differences between income and/or capital gains as determined on a book basis and a tax basis are primarily due to differing treatments of defaulted securities, foreign currency transactions, payments-in-kind, bond discounts and premiums, and wash sales.
6. INVESTMENT TRANSACTIONS
Purchases and sales of investments (excluding short term securities) for the period ended June 30, 2012, aggregated $59,789,657 and $49,022,670, respectively.
7. CREDIT RISK AND DEFAULTED SECURITIES
At June 30, 2012, the Fund had 93.40% of its portfolio invested in high yield securities, senior secured floating rate notes, or other securities rated below investment grade. These securities may be more sensitive to economic conditions causing greater price volatility and are potentially subject to a greater risk of loss due to default than higher rated securities.
The Fund held defaulted securities and/or other securities for which the income has been deemed uncollectible. At June 30, 2012, the aggregate value of these securities was $4,213,754 representing 1.26% of the Fund’s net assets. The Fund discontinues accruing income on securities for which income has been deemed uncollectible and provides an estimate for losses on interest receivable. The securities have been identified on the accompanying Statement of Investments.
FH-30
Franklin Templeton Variable Insurance Products Trust
Notes to Financial Statements (unaudited) (continued)
Franklin High Income Securities Fund
8. OTHER DERIVATIVE INFORMATION
At June 30, 2012, the Fund has invested in derivative contracts which are reflected on the Statement of Assets and Liabilities as follows:
| Asset Derivatives | Liability Derivatives | |||||||||||
| Derivative Contracts Not Accounted for as Hedging Instruments | Statement of Assets and Liabilities Location | Fair Value Amount | Statement of Assets and Liabilities Location | Fair Value Amount | ||||||||
Foreign exchange contracts | Unrealized appreciation on forward exchange contracts | $ | 18,310 | Unrealized depreciation on forward exchange contracts | $ | — | ||||||
For the period ended June 30, 2012, the effect of derivative contracts on the Fund’s Statement of Operations was as follows:
| Derivative Contracts Not Accounted for as Hedging Instruments | Statement of Operations Locations | Realized Gain (Loss) for the Period | Change in Unrealized Appreciation (Depreciation) for the Period | |||||||
Foreign exchange contracts | Net realized gain (loss) from foreign currency transactions/ Net change in unrealized appreciation (depreciation) on translation of other assets and liabilities denominated in foreign currencies | $ | — | $ | 13,458 | |||||
Credit contracts | Net realized gain (loss) from swap contracts/Net change in unrealized appreciation (depreciation) on investments | ($ | 236,015 | ) | $ | — | ||||
For the period ended 6/30/12, the average month end market value of derivatives represented .01% of average month end net assets. The average month end number of open derivative contracts for the period was one.
See Note 1(e) regarding derivative financial instruments.
9. CREDIT FACILITY
The Fund, together with other U.S. registered and foreign investment funds (collectively, Borrowers), managed by Franklin Templeton Investments, are borrowers in a joint syndicated senior unsecured credit facility totaling $1.5 billion (Global Credit Facility) which matures on January 18, 2013. This Global Credit Facility provides a source of funds to the Borrowers for temporary and emergency purposes, including the ability to meet future unanticipated or unusually large redemption requests.
Under the terms of the Global Credit Facility, the Fund shall, in addition to interest charged on any borrowings made by the Fund and other costs incurred by the Fund, pay its share of fees and expenses incurred in connection with the implementation and maintenance of the Global Credit Facility, based upon its relative share of the aggregate net assets of all of the Borrowers, including an annual commitment fee of 0.08% based upon the unused portion of the Global Credit Facility, which is reflected in other expenses on the Statement of Operations. During the period ended June 30, 2012, the Fund did not use the Global Credit Facility.
FH-31
Franklin Templeton Variable Insurance Products Trust
Notes to Financial Statements (unaudited) (continued)
Franklin High Income Securities Fund
10. FAIR VALUE MEASUREMENTS
The Fund follows a fair value hierarchy that distinguishes between market data obtained from independent sources (observable inputs) and the Fund’s own market assumptions (unobservable inputs). These inputs are used in determining the value of the Fund’s financial instruments and are summarized in the following fair value hierarchy:
| • | Level 1 – quoted prices in active markets for identical financial instruments |
| • | Level 2 – other significant observable inputs (including quoted prices for similar financial instruments, interest rates, prepayment speed, credit risk, etc.) |
| • | Level 3 – significant unobservable inputs (including the Fund’s own assumptions in determining the fair value of financial instruments) |
The inputs or methodology used for valuing financial instruments are not an indication of the risk associated with investing in those financial instruments.
For movements between the levels within the fair value hierarchy, the Fund has adopted a policy of recognizing the transfers as of the date of the underlying event which caused the movement.
A summary of inputs used as of June 30, 2012, in valuing the Fund’s assets and liabilities carried at fair value, is as follows:
| Level 1 | Level 2 | Level 3 | Total | |||||||||||||
|
| |||||||||||||||
Assets: | ||||||||||||||||
Investments in Securities: | ||||||||||||||||
Equity Investments:a,b | $ | 740,740 | $ | — | $ | — | $ | 740,740 | ||||||||
Corporate Bonds | — | 314,022,681 | 191 | 314,022,872 | ||||||||||||
Senior Floating Rate Interests | — | 2,732,394 | — | 2,732,394 | ||||||||||||
Short Term Investments | — | 12,360,844 | — | 12,360,844 | ||||||||||||
|
| |||||||||||||||
Total Investments in Securities | $ | 740,740 | $ | 329,115,919 | $ | 191 | $ | 329,856,850 | ||||||||
|
| |||||||||||||||
Forward Exchange Contracts | — | 18,310 | — | 18,310 | ||||||||||||
aIncludes common and preferred stocks.
bFor detailed categories, see the accompanying Statement of Investments.
A reconciliation of assets in which Level 3 inputs are used in determining fair value is presented when there are significant Level 3 investments at the end of the period.
11. NEW ACCOUNTING PRONOUNCEMENTS
In December 2011, the Financial Accounting Standards Board (FASB) issued Accounting Standards Update (ASU) No. 2011-11, Balance Sheet (Topic 210): Disclosures about Offsetting Assets and Liabilities. The amendments in the ASU enhance disclosures about offsetting of financial assets and liabilities to enable investors to understand the effect of these arrangements on a fund’s financial position. The ASU is effective for interim and annual reporting periods beginning on or after January 1, 2013. The Fund believes the adoption of this ASU will not have a material impact on its financial statements.
12. SUBSEQUENT EVENTS
The Fund has evaluated subsequent events through the issuance of the financial statements and determined that no events have occurred that require disclosure.
ABBREVIATIONS | ||||
| Counterparty | Currency | Selected Portfolio | ||
| DBAB - Deutsche Bank AG | EUR - Euro | FRN - Floating Rate Note | ||
| PIK - Payment-In-Kind |
FH-32
FRANKLIN INCOME SECURITIES FUND
This semiannual report for Franklin Income Securities Fund covers the period ended June 30, 2012.
Performance Summary as of 6/30/12
Franklin Income Securities Fund – Class 4 delivered a +5.80% total return for the six-month period ended 6/30/12.
Performance reflects the Fund’s Class 4 operating expenses, but does not include any contract fees, expenses or sales charges. If they had been included, performance would be lower. These charges and deductions, particularly for variable life policies, can have a significant effect on contract values and insurance benefits. See the contract prospectus for a complete description of these expenses, including sales charges.
Franklin Income Securities Fund – Class 4
Performance data represent past performance, which does not guarantee future results. Investment return and principal value will fluctuate, and you may have a gain or loss when you sell your shares.
Current performance may differ from figures shown.
FI-1
Fund Goal and Main Investments: Franklin Income Securities Fund seeks to maximize income while maintaining prospects for capital appreciation. Under normal market conditions, the Fund invests in both equity and debt securities.
Performance Overview
You can find the Fund’s six-month total return in the Performance Summary. The Fund underperformed its equity benchmark, the Standard & Poor’s® 500 Index (S&P 500®), which produced a +9.49% total return, but outperformed its fixed income benchmark, the Barclays U.S. Aggregate Index, which posted a +2.37% total return for the same period.1
Economic and Market Overview
The U.S. economy, as measured by gross domestic product, grew modestly during the six-month period ended June 30, 2012. In the first quarter, personal income and spending rose, while federal, state and local government spending declined. The national unemployment rate for June 2012 stood at 8.2%, compared with 8.5% at the start of the period.2 Jobless claims touched a four-year low in February amid robust job creation; however, hiring slowed during the remainder of the period and jobless claims at period-end reached January’s level. Industrial production and manufacturing activity continued to increase, but the manufacturing sector shrank unexpectedly in June. Although gasoline prices hit a peak in early April, they plunged to a five-month low near period-end due to lower crude oil prices. In keeping with its goal to strengthen U.S. economic recovery by fostering increased employment while keeping inflation in check, during June the Federal Reserve Board (Fed) extended through 2012 its program (dubbed Operation Twist) to buy long-term Treasuries in an attempt to lower long-term yields. The Fed also reaffirmed its intention to keep the federal funds target rate low at least through late 2014.
During late March and early April 2012, improved economic reports helped U.S. stock markets reach multi-year highs. The Dow Jones Industrial Average exceeded 13,000 and the S&P 500 topped 1,400 for the first time since 2008, while the NASDAQ Composite Index hit an 11-year high.3 Global markets grew volatile, however, amid renewed concerns about eurozone debt and slowing global economic growth.
1. Source: © 2012 Morningstar. One cannot invest directly in an index, and an index is not representative of the Fund’s portfolio. Please see Index Descriptions following the Fund Summaries.
2. Source: Bureau of Labor Statistics.
3. Please see Index Descriptions following the Fund Summaries.
Fund Risks: All investments involve risks, including possible loss of principal. The Fund’s share price and yield will be affected by interest rate movements. Bond prices generally move in the opposite direction of interest rates. Thus, as the prices of bonds in the Fund adjust to a rise in interest rates, the Fund’s share price may decline. Changes in the financial strength of a bond issuer or in a bond’s credit rating may affect its value. The Fund’s portfolio includes a substantial portion of higher yielding, lower rated corporate bonds because of the relatively higher yields they offer. Floating rate loans are lower rated, higher yielding instruments, which are subject to increased risk of default and can potentially result in loss of principal. These securities carry a greater degree of credit risk relative to investment-grade securities. Stock prices fluctuate, sometimes rapidly and dramatically, due to factors affecting individual companies, particular industries or sectors, or general market conditions. The Fund is actively managed but there is no guarantee that the manager’s investment decisions will produce the desired results. The Fund’s prospectus also includes a description of the main investment risks.
FI-2
Fears of a Greek debt default and exit from the eurozone were somewhat mitigated by secured bailout financing and bondholder concessions in February, as well as elections in May and June that resulted in the formation of a new coalition government. Risk-averse investors seeking safety drove U.S. Treasury yields to historical lows during the period.
At the end of the reporting period, significant challenges to the U.S. economy remained, including weak jobs reports, lack of broad public and political agreement on how to achieve U.S. deficit reduction, and uncertainty surrounding deeply indebted European countries including Greece, Italy and Spain. Signs of China’s economic growth slowdown further contributed to pessimism. Although long-term resolution of European debt issues remained unclear, the European Central Bank’s latest plan to allow the European Stability Mechanism to directly recapitalize troubled banks throughout the eurozone, as well as a late-June proposal leaning toward fiscal and banking union, supported cautious optimism in U.S. and global markets.
For the six months under review, investment-grade fixed income markets, as measured by the Barclays U.S. Aggregate Index, posted modest returns. U.S. stocks, as measured by the S&P 500, faced bouts of risk aversion as investors shunned risk assets in light of uneven economic data but ended the period with robust gains. Overall, general investor concerns drove the 10-year U.S. Treasury yield from 1.89% on December 31, 2011, to 1.67% on June 30, 2012.
Investment Strategy
We search for undervalued or out-of-favor securities we believe offer opportunities for income today and growth tomorrow. We generally perform independent analysis of the debt securities being considered for the Fund’s portfolio, rather than relying principally on ratings assigned by rating agencies. In analyzing debt and equity securities, we consider a variety of factors, including: a security’s relative value based on such factors as anticipated cash flow, interest or dividend coverage, asset coverage, and earnings prospects; the experience and strength of a company’s management; a company’s sensitivity to changes in interest rates and business conditions; a company’s debt maturity schedules and borrowing requirements; and a company’s changing financial condition and market recognition of the change.
Manager’s Discussion
During the six-month period, the Fund’s equity and fixed income holdings contributed to performance, largely due to strong returns of securities
Portfolio Breakdown
Franklin Income Securities Fund
6/30/12
| % of Total Net Assets | ||||
Equity* | 41.3% | |||
| Utilities | 10.3% | |||
| Financials | 8.8% | |||
| Health Care | 6.5% | |||
| Energy | 5.8% | |||
| Telecommunication Services | 2.9% | |||
| Materials | 2.3% | |||
| Industrials | 1.4% | |||
| Consumer Discretionary | 1.2% | |||
| Information Technology | 1.1% | |||
| Consumer Staples | 1.0% | |||
Fixed Income | 47.4% | |||
| Consumer Discretionary | 8.7% | |||
| Information Technology | 8.2% | |||
| Energy | 7.4% | |||
| Utilities | 5.9% | |||
| Financials | 5.9% | |||
| Materials | 2.8% | |||
| Health Care | 2.8% | |||
| Industrials | 2.8% | |||
| Telecommunication Services | 2.0% | |||
| Consumer Staples | 0.9% | |||
| Short-Term Investments & Other Net Assets | 11.3% | |||
*Includes convertible bonds.
FI-3
in the S&P 500 and Barclays U.S. Aggregate Index driven by continued, albeit modest, economic growth, resilient corporate profits and continued low long-term interest rates.
Investor optimism regarding economic growth potential gave way to a more subdued outlook as challenges mounted, including Europe’s continued sovereign and fiscal imbalances, looming fiscal deadlines in the U.S., and a deteriorating labor market outlook. We believe weakening energy and select commodity prices may provide some relief to the recent slowdown in economic activity but could also challenge their respective sectors.
Within the Fund’s equity holdings, the financials, utilities and health care sectors were primary contributors while energy and materials struggled. Bank of America and Wells Fargo & Co. in financials provided strong gains early in the period following improved clarity on the banks’ pace of capital accumulation as well as improvement in key credit areas, particularly within the mortgage markets. Preferred stock of Ally Financial also helped performance. Utilities continued to stand out as strong performers, largely due to their historically consistent returns, high degree of visibility and predictability of results, as well as a favorable backdrop of declining interest rates and corporate bond yields. Sempra Energy and PG&E were strong performers during the period. In the health care sector, our holdings in major pharmaceutical companies including Merck & Co. and Roche Holding delivered strong returns. Select telecommunication services holdings including AT&T, Telstra Corp. and Vodafone Group also contributed to performance.
Weak energy prices and investor fears of slower global economic activity weighed on the performance of our positions in Canadian Oil Sands, Royal Dutch Shell, Chesapeake Energy and Weatherford International. In materials, metals and mining companies including Barrick Gold, Newmont Mining4 and BHP Billiton also performed poorly.
Within fixed income markets, a generally favorable backdrop prevailed, including low long-term interest rates, stable to declining credit spreads and functioning capital markets that provided ready access to capital at a near-record pace of issuance for investment-grade and high yield corporate bonds. We largely focused on high yield opportunities during the period and were attracted to the higher potential yields and returns as well as the opportunity to continue to benefit from the favorable environment for many individual credits. Key positive themes were low
4. Equity-linked security.
Top Five Equity Holdings
Franklin Income Securities Fund
6/30/12
Company Sector/Industry | % of Total Net Assets | |||
| Merck & Co. Inc. | 2.1% | |||
| Health Care | ||||
| Wells Fargo & Co. | 2.1% | |||
| Financials | ||||
| Bank of America Corp. | 1.7% | |||
| Financials | ||||
| Roche Holding AG (Switzerland) | 1.6% | |||
| Health Care | ||||
| Johnson & Johnson | 1.3% | |||
| Health Care | ||||
Top Five Fixed Income and Senior Floating Rate Interests Holdings*
Franklin Income Securities Fund
6/30/12
Issuer Sector/Industry | % of Total Net Assets | |||
| First Data Corp. | 4.4% | |||
| Information Technology | ||||
| Texas Competitive Electric Holdings Co. LLC | 3.1% | |||
| Utilities | ||||
| Freescale Semiconductor Inc. | 2.1% | |||
| Information Technology | ||||
| Dynegy Holdings Inc.** | 1.7% | |||
| Utilities | ||||
| CIT Group Inc. | 1.6% | |||
| Financials | ||||
*Does not include convertible bonds.
**Includes bonds issued by Dynegy Midwest Generation and Dynegy Power and defaulted securities issued by Dynegy Holdings.
The dollar value, number of shares or principal amount, and names of all portfolio holdings are listed in the Fund’s Statement of Investments (SOI).
FI-4
default rates, recent debt maturity extensions, interest cost reductions and stable corporate performance in terms of margins and cash flow.
The technology, communications, consumer cyclical and consumer non-cyclical sectors delivered strong performance, while the electric utility and energy sectors had poor results.5 Generally, these results had more to do with individual company dynamics than systemic risk. First Data in technology continued to reduce debt through improved performance and growth and by taking necessary actions to fix its overall capital structure, including extending debt maturities. Sprint Nextel in communications and Freescale Semiconductor in technology also showed improved credit trends despite challenging and competitive business environments. CIT Group in finance companies remained a strong performer, although the size of our position declined as the company called for redemption and refinancing of its debt at lower rates and longer maturities.
Among the key fixed income detractors was PetroPlus Finance in energy, as PetroPlus Holdings remained mired in weak European refining conditions resulting in disappointing bond recoveries and dimmed prospects for a successful corporate reorganization. The company defaulted on its bonds during the period. Other poor performers in the energy sector were oil and gas exploration and production companies such as ATP Oil & Gas, Chesapeake Energy and Quicksilver Resources. Arch Coal also hurt performance as low natural gas prices caused a substantial number of customers, particularly electric utilities, to switch from coal.
The Fund’s equity allocation did not change significantly during the period, however our fixed income allocation decreased. Among stock allocations, materials, financials and utilities increased while information technology and consumer discretionary decreased. However, within fixed income, our basic industry and consumer cyclical allocations rose while finance companies, consumer non-cyclicals and electric utilities declined.
We largely focused on corporate bonds within fixed income during the period, given the potential for higher yields and long-term total return relative to other fixed income securities. We maintained significant diversification with holdings across a range of sectors. While sector
5. Technology holdings are in information technology in the SOI. Communications holdings are in telecommunication services and consumer discretionary in the SOI. Consumer cyclical holdings are in consumer discretionary and financials in the SOI. Consumer non-cyclical holdings are in consumer discretionary, consumer staples, financials and health care in the SOI. Electric utility holdings are in utilities in the SOI.
FI-5
diversification remains important, we emphasize bottom-up fundamental research to identify what we believe are the most attractive investment opportunities to help us meet the Fund’s objective.
The Fund’s equity exposure continued to focus on dividend paying common stocks and convertible securities. We continued to seek what we considered to be attractive current yield as well as those companies with potential favorable outlooks for dividend growth. Convertible securities remained attractive to us given the possible opportunity for high, current income and the potential to participate in the appreciation of the underlying common stock. At period-end, we had limited holdings in other equity securities including preferred stocks and warrants. We remain largely focused on U.S. securities.
Thank you for your participation in Franklin Income Securities Fund. We look forward to serving your future investment needs.
The foregoing information reflects our analysis, opinions and portfolio holdings as of June 30, 2012, the end of the reporting period. The way we implement our main investment strategies and the resulting portfolio holdings may change depending on factors such as market and economic conditions. These opinions may not be relied upon as investment advice or an offer for a particular security. The information is not a complete analysis of every aspect of any market, country, industry, security or the Fund. Statements of fact are from sources considered reliable, but the investment manager makes no representation or warranty as to their completeness or accuracy. Although historical performance is no guarantee of future results, these insights may help you understand our investment management philosophy.
FI-6
Fund Expenses
As an investor in a variable insurance contract (Contract) that indirectly provides for investment in an underlying mutual fund, you can incur transaction and/or ongoing expenses at both the Fund level and the Contract level.
| • | Transaction expenses can include sales charges (loads) on purchases, surrender fees, transfer fees and premium taxes. |
| • | Ongoing expenses can include management fees, distribution and service (12b-1) fees, contract fees, annual maintenance fees, mortality and expense risk fees and other fees and expenses. All mutual funds and Contracts have some types of ongoing expenses. |
The expenses shown in the table are meant to highlight ongoing expenses at the Fund level only and do not include ongoing expenses at the Contract level, or transaction expenses at either the Fund or Contract levels. While the Fund does not have transaction expenses, if the transaction and ongoing expenses at the Contract level were included, the expenses shown below would be higher. You should consult your Contract prospectus or disclosure document for more information.
The table shows Fund-level ongoing expenses and can help you understand these expenses and compare them with those of other mutual funds offered through the Contract. The table assumes a $1,000 investment held for the six months indicated. Please refer to the Fund prospectus for additional information on operating expenses.
Actual Fund Expenses
The first line (Actual) of the table provides actual account values and expenses. The “Ending Account Value” is derived from the Fund’s actual return, which includes the effect of ongoing Fund expenses, but does not include the effect of ongoing Contract expenses.
You can estimate the Fund-level expenses you incurred during the period by following these steps. Of course, your account value and expenses will differ from those in this illustration:
| 1. | Divide your account value by $1,000. |
If an account had an $8,600 value, then $8,600 ÷ $1,000 = 8.6.
| 2. | Multiply the result by the number under the heading “Fund-Level Expenses Incurred During Period.” |
If Fund-Level Expenses Incurred During Period were $7.50, then 8.6 x $7.50 = $64.50.
In this illustration, the estimated expenses incurred this period at the Fund level are $64.50.
Franklin Income Securities Fund – Class 4
FI-7
Hypothetical Example for Comparison with Other Mutual Funds
Information in the second line (Hypothetical) of the table can help you compare ongoing expenses of the Fund with those of other mutual funds offered through the Contract. This information may not be used to estimate the actual ending account balance or expenses you incurred during the period. The hypothetical “Ending Account Value” is based on the Fund’s actual expense ratio and an assumed 5% annual rate of return before expenses, which does not represent the Fund’s actual return. The figure under the heading “Fund-Level Expenses Incurred During Period” shows the hypothetical expenses your account would have incurred under this scenario. You can compare this figure with the 5% hypothetical examples that appear in shareholder reports of other funds offered through a Contract.
| Class 4 | Beginning Account Value 1/1/12 | Ending Account Value 6/30/12 | Fund-Level Expenses Incurred During Period* 1/1/12–6/30/12 | |||||||||
Actual | $ | 1,000 | $ | 1,058.00 | $ | 4.20 | ||||||
Hypothetical (5% return before expenses) | $ | 1,000 | $ | 1,020.79 | $ | 4.12 | ||||||
*Expenses are calculated using the most recent six-month annualized expense ratio for the Fund’s Class 4 shares (0.82%), which does not include any ongoing expenses of the Contract for which the Fund is an investment option, multiplied by the average account value over the period, multiplied by 182/366 to reflect the one-half year period.
FI-8
Franklin Templeton Variable Insurance Products Trust
Financial Highlights
Franklin Income Securities Fund
| Six Months Ended June 30, 2012 (unaudited) | Year Ended December 31, | |||||||||||||||||||||||
| Class 1 | 2011 | 2010 | 2009 | 2008 | 2007 | |||||||||||||||||||
| ||||||||||||||||||||||||
Per share operating performance | ||||||||||||||||||||||||
(for a share outstanding throughout the period) | ||||||||||||||||||||||||
Net asset value, beginning of period | $ | 14.68 | $ | 15.16 | $ | 14.43 | $ | 11.53 | $ | 17.63 | $ | 17.65 | ||||||||||||
|
| |||||||||||||||||||||||
Income from investment operationsa: | ||||||||||||||||||||||||
Net investment incomeb | 0.47 | 0.96 | 0.89 | 0.91 | 1.10 | 1.03 | ||||||||||||||||||
Net realized and unrealized gains (losses) | 0.38 | (0.54 | ) | 0.85 | 3.08 | (5.99 | ) | (0.31 | ) | |||||||||||||||
|
| |||||||||||||||||||||||
Total from investment operations | 0.85 | 0.42 | 1.74 | 3.99 | (4.89 | ) | 0.72 | |||||||||||||||||
|
| |||||||||||||||||||||||
Less distributions from: | ||||||||||||||||||||||||
Net investment income | (1.02 | ) | (0.90 | ) | (1.01 | ) | (1.09 | ) | (0.86 | ) | (0.63 | ) | ||||||||||||
Net realized gains | — | — | — | — | (0.35 | ) | (0.11 | ) | ||||||||||||||||
|
| |||||||||||||||||||||||
Total distributions | (1.02 | ) | (0.90 | ) | (1.01 | ) | (1.09 | ) | (1.21 | ) | (0.74 | ) | ||||||||||||
|
| |||||||||||||||||||||||
Net asset value, end of period | $ | 14.51 | $ | 14.68 | $ | 15.16 | $ | 14.43 | $ | 11.53 | $ | 17.63 | ||||||||||||
|
| |||||||||||||||||||||||
Total returnc | 5.90% | 2.71% | 12.87% | 35.88% | (29.41)% | 4.01% | ||||||||||||||||||
Ratios to average net assetsd | ||||||||||||||||||||||||
Expenses | 0.47% | 0.47% | e | 0.47% | e | 0.47% | e | 0.47% | e | 0.47% | e | |||||||||||||
Net investment income | 6.23% | 6.35% | 6.28% | 7.23% | 7.28% | 5.77% | ||||||||||||||||||
Supplemental data | ||||||||||||||||||||||||
Net assets, end of period (000’s) | $ | 1,458,268 | $ | 1,300,935 | $ | 1,449,028 | $ | 910,504 | $ | 433,370 | $ | 455,932 | ||||||||||||
Portfolio turnover rate | 11.32% | 28.65% | 41.65% | 42.30% | 43.89% | 32.11% | ||||||||||||||||||
aThe amount shown for a share outstanding throughout the period may not correlate with the Statement of Operations for the period due to the timing of sales and repurchases of the Fund shares in relation to income earned and/or fluctuating market value of the investments of the Fund.
bBased on average daily shares outstanding.
cTotal return does not include fees, charges or expenses imposed by the variable annuity and life insurance contracts for which the Franklin Templeton Variable Insurance Products Trust serves as an underlying investment vehicle. Total return is not annualized for periods less than one year.
dRatios are annualized for periods less than one year.
eBenefit of expense reduction rounds to less than 0.01%.
The accompanying notes are an integral part of these financial statements.
FI-9
Franklin Templeton Variable Insurance Products Trust
Financial Highlights (continued)
Franklin Income Securities Fund
| Six Months Ended June 30, 2012 (unaudited) | Year Ended December 31, | |||||||||||||||||||||||
| Class 2 | 2011 | 2010 | 2009 | 2008 | 2007 | |||||||||||||||||||
| ||||||||||||||||||||||||
Per share operating performance | ||||||||||||||||||||||||
(for a share outstanding throughout the period) | ||||||||||||||||||||||||
Net asset value, beginning of period | $ | 14.32 | $ | 14.82 | $ | 14.12 | $ | 11.30 | $ | 17.31 | $ | 17.36 | ||||||||||||
|
| |||||||||||||||||||||||
Income from investment operationsa: | ||||||||||||||||||||||||
Net investment incomeb | 0.44 | 0.90 | 0.86 | 0.86 | 1.04 | 0.97 | ||||||||||||||||||
Net realized and unrealized gains (losses) | 0.37 | (0.53 | ) | 0.82 | 3.01 | (5.87 | ) | (0.30 | ) | |||||||||||||||
|
| |||||||||||||||||||||||
Total from investment operations | 0.81 | 0.37 | 1.68 | 3.87 | (4.83 | ) | 0.67 | |||||||||||||||||
|
| |||||||||||||||||||||||
Less distributions from: | ||||||||||||||||||||||||
Net investment income | (0.98 | ) | (0.87 | ) | (0.98 | ) | (1.05 | ) | (0.83 | ) | (0.61 | ) | ||||||||||||
Net realized gains | — | — | — | — | (0.35 | ) | (0.11 | ) | ||||||||||||||||
|
| |||||||||||||||||||||||
Total distributions | (0.98 | ) | (0.87 | ) | (0.98 | ) | (1.05 | ) | (1.18 | ) | (0.72 | ) | ||||||||||||
|
| |||||||||||||||||||||||
Net asset value, end of period | $ | 14.15 | $ | 14.32 | $ | 14.82 | $ | 14.12 | $ | 11.30 | $ | 17.31 | ||||||||||||
|
| |||||||||||||||||||||||
Total returnc | 5.78% | 2.38% | 12.67% | 35.59% | (29.66)% | 3.76% | ||||||||||||||||||
Ratios to average net assetsd | ||||||||||||||||||||||||
Expenses | 0.72% | 0.72% | e | 0.72% | e | 0.72% | e | 0.72% | e | 0.72% | e | |||||||||||||
Net investment income | 5.98% | 6.10% | 6.03% | 6.98% | 7.03% | 5.52% | ||||||||||||||||||
Supplemental data | ||||||||||||||||||||||||
Net assets, end of period (000’s) | $ | 6,038,574 | $ | 5,915,637 | $ | 6,309,207 | $ | 6,114,898 | $ | 4,944,457 | $ | 7,429,064 | ||||||||||||
Portfolio turnover rate | 11.32% | 28.65% | 41.65% | 42.30% | 43.89% | 32.11% | ||||||||||||||||||
aThe amount shown for a share outstanding throughout the period may not correlate with the Statement of Operations for the period due to the timing of sales and repurchases of the Fund shares in relation to income earned and/or fluctuating market value of the investments of the Fund.
bBased on average daily shares outstanding.
cTotal return does not include fees, charges or expenses imposed by the variable annuity and life insurance contracts for which the Franklin Templeton Variable Insurance Products Trust serves as an underlying investment vehicle. Total return is not annualized for periods less than one year.
dRatios are annualized for periods less than one year.
eBenefit of expense reduction rounds to less than 0.01%.
The accompanying notes are an integral part of these financial statements.
FI-10
Franklin Templeton Variable Insurance Products Trust
Financial Highlights (continued)
Franklin Income Securities Fund
| Six Months Ended June 30, 2012 (unaudited) | Year Ended December 31, | |||||||||||||||||||
| Class 4 | 2011 | 2010 | 2009 | 2008a | ||||||||||||||||
| ||||||||||||||||||||
Per share operating performance | ||||||||||||||||||||
(for a share outstanding throughout the period) | ||||||||||||||||||||
Net asset value, beginning of period | $ | 14.54 | $ | 15.04 | $ | 14.33 | $ | 11.49 | $ | 16.90 | ||||||||||
|
| |||||||||||||||||||
Income from investment operationsb: | ||||||||||||||||||||
Net investment incomec | 0.44 | 0.90 | 0.85 | 0.86 | 0.87 | |||||||||||||||
Net realized and unrealized gains (losses) | 0.39 | (0.54 | ) | 0.84 | 3.06 | (5.07 | ) | |||||||||||||
|
| |||||||||||||||||||
Total from investment operations | 0.83 | 0.36 | 1.69 | 3.92 | (4.20 | ) | ||||||||||||||
|
| |||||||||||||||||||
Less distributions from: | ||||||||||||||||||||
Net investment income | (0.97 | ) | (0.86 | ) | (0.98 | ) | (1.08 | ) | (0.86 | ) | ||||||||||
Net realized gains | — | — | — | — | (0.35 | ) | ||||||||||||||
|
| |||||||||||||||||||
Total distributions | (0.97 | ) | (0.86 | ) | (0.98 | ) | (1.08 | ) | (1.21 | ) | ||||||||||
|
| |||||||||||||||||||
Net asset value, end of period | $ | 14.40 | $ | 14.54 | $ | 15.04 | $ | 14.33 | $ | 11.49 | ||||||||||
|
| |||||||||||||||||||
Total returnd | 5.80% | 2.29% | 12.54% | 35.37% | (26.61)% | |||||||||||||||
Ratios to average net assetse | ||||||||||||||||||||
Expenses | 0.82% | 0.82% | f | 0.82% | f | 0.82% | f | 0.82% | f | |||||||||||
Net investment income | 5.88% | 6.00% | 5.93% | 6.88% | 6.93% | |||||||||||||||
Supplemental data | ||||||||||||||||||||
Net assets, end of period (000’s) | $ | 440,415 | $ | 431,435 | $ | 415,541 | $ | 347,733 | $ | 135,360 | ||||||||||
Portfolio turnover rate | 11.32% | 28.65% | 41.65% | 42.30% | 43.89% | |||||||||||||||
aFor the period February 29, 2008 (effective date) to December 31, 2008.
bThe amount shown for a share outstanding throughout the period may not correlate with the Statement of Operations for the period due to the timing of sales and repurchases of the Fund shares in relation to income earned and/or fluctuating market value of the investments of the Fund.
cBased on average daily shares outstanding.
dTotal return does not include fees, charges or expenses imposed by the variable annuity and life insurance contracts for which the Franklin Templeton Variable Insurance Products Trust serves as an underlying investment vehicle. Total return is not annualized for periods less than one year.
eRatios are annualized for periods less than one year.
fBenefit of expense reduction rounds to less than 0.01%.
The accompanying notes are an integral part of these financial statements.
FI-11
Franklin Templeton Variable Insurance Products Trust
Statement of Investments, June 30, 2012 (unaudited)
| Franklin Income Securities Fund | Country | Shares/ Warrants | Value | |||||||
Common Stocks and Other Equity Interests 36.5% | ||||||||||
Consumer Discretionary 0.9% | ||||||||||
aCharter Communications Inc., wts., 11/30/14 | United States | 311,018 | $ | 8,241,977 | ||||||
Comcast Corp., A | United States | 900,000 | 28,773,000 | |||||||
a,b,cDex One Corp. | United States | 2,642,381 | 2,470,626 | |||||||
aGeneral Motors Co., wts., 7/10/16 | United States | 129,731 | 1,429,636 | |||||||
aGeneral Motors Co., wts., 7/10/19 | United States | 129,731 | 879,576 | |||||||
aMotors Liquidation Co., GUC Trust | United States | 35,826 | 438,868 | |||||||
aSuperMedia Inc., Litigation Trust | United States | 3,472,135 | 65,103 | |||||||
Target Corp. | United States | 453,900 | 26,412,441 | |||||||
|
| |||||||||
| 68,711,227 | ||||||||||
|
| |||||||||
Consumer Staples 1.0% | ||||||||||
Diageo PLC | United Kingdom | 1,150,000 | 29,575,932 | |||||||
PepsiCo Inc. | United States | 672,500 | 47,518,850 | |||||||
|
| |||||||||
| 77,094,782 | ||||||||||
|
| |||||||||
Energy 5.6% | ||||||||||
aAlpha Natural Resources Inc. | United States | 135,000 | 1,175,850 | |||||||
BP PLC, ADR | United Kingdom | 1,300,000 | 52,702,000 | |||||||
aCallon Petroleum Co. | United States | 782,594 | 3,333,850 | |||||||
Canadian Oil Sands Ltd. | Canada | 3,700,000 | 71,670,350 | |||||||
Chesapeake Energy Corp. | United States | 900,000 | 16,740,000 | |||||||
Chevron Corp. | United States | 500,000 | 52,750,000 | |||||||
ConocoPhillips | United States | 750,000 | 41,910,000 | |||||||
Exxon Mobil Corp. | United States | 804,650 | 68,853,901 | |||||||
Phillips 66 | United States | 500,000 | 16,620,000 | |||||||
Royal Dutch Shell PLC, A, ADR | United Kingdom | 850,000 | 57,315,500 | |||||||
Schlumberger Ltd. | United States | 251,000 | 16,292,410 | |||||||
Spectra Energy Corp. | United States | 500,000 | 14,530,000 | |||||||
Total SA, B, ADR | France | 512,500 | 23,036,875 | |||||||
aWeatherford International Ltd. | United States | 750,000 | 9,472,500 | |||||||
|
| |||||||||
| 446,403,236 | ||||||||||
|
| |||||||||
Financials 5.5% | ||||||||||
Banco Santander SA | Spain | 2,205,480 | 14,573,144 | |||||||
Bank of America Corp. | United States | 6,000,000 | 49,080,000 | |||||||
Barclays PLC | United Kingdom | 4,000,000 | 10,205,810 | |||||||
BlackRock Inc. | United States | 240,800 | 40,892,656 | |||||||
aCIT Group Inc. | United States | 691,600 | 24,648,624 | |||||||
Citigroup Inc. | United States | 580,000 | 15,897,800 | |||||||
aFannie Mae | United States | 1,928,019 | 491,645 | |||||||
HSBC Holdings PLC | United Kingdom | 5,000,000 | 43,959,090 | |||||||
JPMorgan Chase & Co. | United States | 1,850,000 | 66,100,500 | |||||||
M&T Bank Corp. | United States | 500,000 | 41,285,000 | |||||||
QBE Insurance Group Ltd. | Australia | 1,000,000 | 13,696,437 | |||||||
Wells Fargo & Co. | United States | 2,909,600 | 97,297,024 | |||||||
Westfield Retail Trust | Australia | 6,384,600 | 18,626,448 | |||||||
|
| |||||||||
| 436,754,178 | ||||||||||
|
| |||||||||
Health Care 6.5% | ||||||||||
Johnson & Johnson | United States | 1,500,000 | 101,340,000 | |||||||
Merck & Co. Inc. | United States | 4,000,000 | 167,000,000 | |||||||
Pfizer Inc. | United States | 3,518,775 | 80,931,825 | |||||||
Roche Holding AG | Switzerland | 750,000 | 129,293,994 | |||||||
Sanofi, ADR | France | 1,000,000 | 37,780,000 | |||||||
|
| |||||||||
| 516,345,819 | ||||||||||
|
| |||||||||
FI-12
Franklin Templeton Variable Insurance Products Trust
Statement of Investments, June 30, 2012 (unaudited) (continued)
| Franklin Income Securities Fund | Country | Shares/ Warrants | Value | |||||||
Common Stocks and Other Equity Interests (continued) | ||||||||||
Industrials 1.4% | ||||||||||
Caterpillar Inc. | United States | 80,000 | $ | 6,792,800 | ||||||
General Electric Co. | United States | 4,853,782 | 101,152,817 | |||||||
|
| |||||||||
| 107,945,617 | ||||||||||
|
| |||||||||
Information Technology 0.8% | ||||||||||
Intel Corp. | United States | 2,500,000 | 66,625,000 | |||||||
|
| |||||||||
Materials 1.6% | ||||||||||
Barrick Gold Corp. | Canada | 700,000 | 26,299,000 | |||||||
BHP Billiton PLC | United Kingdom | 1,000,000 | 28,303,340 | |||||||
The Dow Chemical Co. | United States | 500,000 | 15,750,000 | |||||||
E. I. du Pont de Nemours and Co. | United States | 200,000 | 10,114,000 | |||||||
Freeport-McMoRan Copper & Gold Inc., B | United States | 237,286 | 8,084,334 | |||||||
LyondellBasell Industries NV, A | United States | 1,000,000 | 40,270,000 | |||||||
|
| |||||||||
| 128,820,674 | ||||||||||
|
| |||||||||
Telecommunication Services 2.9% | ||||||||||
AT&T Inc. | United States | 2,000,000 | 71,320,000 | |||||||
CenturyLink Inc. | United States | 500,000 | 19,745,000 | |||||||
France Telecom SA | France | 528,500 | 6,939,522 | |||||||
Frontier Communications Corp. | United States | 2,000,000 | 7,660,000 | |||||||
SK Telecom Co. Ltd., ADR | South Korea | 505,100 | 6,111,710 | |||||||
Telstra Corp. Ltd. | Australia | 8,000,000 | 30,218,148 | |||||||
Vivendi SA | France | 516,666 | 9,566,447 | |||||||
Vodafone Group PLC | United Kingdom | 27,500,000 | 77,230,985 | |||||||
|
| |||||||||
| 228,791,812 | ||||||||||
|
| |||||||||
Utilities 10.3% | ||||||||||
AGL Resources Inc. | United States | 450,000 | 17,437,500 | |||||||
American Electric Power Co. Inc. | United States | 1,523,800 | 60,799,620 | |||||||
Dominion Resources Inc. | United States | 637,600 | 34,430,400 | |||||||
Duke Energy Corp. | United States | 1,000,000 | 23,060,000 | |||||||
a,cDynegy Inc. | United States | 2,200,000 | 1,287,000 | |||||||
Entergy Corp. | United States | 850,000 | 57,706,500 | |||||||
Exelon Corp. | United States | 1,500,000 | 56,430,000 | |||||||
FirstEnergy Corp. | United States | 750,000 | 36,892,500 | |||||||
NextEra Energy Inc. | United States | 750,000 | 51,607,500 | |||||||
PG&E Corp. | United States | 1,750,000 | 79,222,500 | |||||||
Pinnacle West Capital Corp. | United States | 300,000 | 15,522,000 | |||||||
PPL Corp. | United States | 1,250,000 | 34,762,500 | |||||||
Progress Energy Inc. | United States | 1,200,000 | 72,204,000 | |||||||
Public Service Enterprise Group Inc. | United States | 2,100,000 | 68,250,000 | |||||||
Sempra Energy | United States | 1,000,000 | 68,880,000 | |||||||
The Southern Co. | United States | 1,000,000 | 46,300,000 | |||||||
TECO Energy Inc. | United States | 2,250,000 | 40,635,000 | |||||||
Xcel Energy Inc. | United States | 1,970,464 | 55,980,882 | |||||||
|
| |||||||||
| 821,407,902 | ||||||||||
|
| |||||||||
Total Common Stocks and Other Equity Interests | 2,898,900,247 | |||||||||
|
| |||||||||
dEquity-Linked Securities 0.9% | ||||||||||
Consumer Discretionary 0.2% | ||||||||||
eJPMorgan Chase & Co. into Target Corp., 6.25%, 144A | United States | 300,000 | 17,151,810 | |||||||
|
| |||||||||
FI-13
Franklin Templeton Variable Insurance Products Trust
Statement of Investments, June 30, 2012 (unaudited) (continued)
| Franklin Income Securities Fund | Country | Shares/ Warrants | Value | |||||||
dEquity-Linked Securities (continued) | ||||||||||
Information Technology 0.3% | ||||||||||
Credit Suisse New York into Intel Corp., 9.00% | United States | 750,000 | $ | 18,845,100 | ||||||
|
| |||||||||
Materials 0.4% | ||||||||||
eBarclays Bank PLC into Nucor Corp., 8.00%, 144A | United States | 300,000 | 11,421,540 | |||||||
eUBS AG into Newmont Mining Corp., 8.00%, 144A | United States | 400,000 | 19,746,040 | |||||||
|
| |||||||||
| 31,167,580 | ||||||||||
|
| |||||||||
Total Equity-Linked Securities (Cost $69,141,000) | 67,164,490 | |||||||||
|
| |||||||||
Convertible Preferred Stocks 3.0% | ||||||||||
Consumer Discretionary 0.1% | ||||||||||
General Motors Co., 4.75%, cvt. pfd., B | United States | 322,400 | 10,703,680 | |||||||
|
| |||||||||
Energy 0.2% | ||||||||||
ATP Oil & Gas Corp., 8.00%, cvt. pfd., B | United States | 50,000 | 874,500 | |||||||
SandRidge Energy Inc., 7.00%, cvt. pfd. | United States | 140,000 | 14,688,240 | |||||||
|
| |||||||||
| 15,562,740 | ||||||||||
|
| |||||||||
Financials 2.6% | ||||||||||
Bank of America Corp., 7.25%, cvt. pfd., L | United States | 90,000 | 87,750,000 | |||||||
Citigroup Inc., 7.50%, cvt. pfd. | United States | 54,200 | 4,637,352 | |||||||
aFannie Mae, 5.375%, cvt. pfd. | United States | 600 | 2,310,000 | |||||||
Felcor Lodging Trust Inc., 7.80%, cvt. pfd., A | United States | 400,000 | 10,476,000 | |||||||
MetLife Inc., 5.00%, cvt. pfd. | United States | 525,000 | 32,481,750 | |||||||
Wells Fargo & Co., 7.50%, cvt. pfd., A | United States | 61,000 | 68,777,500 | |||||||
|
| |||||||||
| 206,432,602 | ||||||||||
|
| |||||||||
Materials 0.1% | ||||||||||
AngloGold Ashanti Holdings Finance PLC, 6.00%, cvt. pfd. | South Africa | 200,000 | 8,240,000 | |||||||
|
| |||||||||
Total Convertible Preferred Stocks (Cost $285,434,927) | 240,953,022 | |||||||||
|
| |||||||||
Preferred Stocks 0.5% | ||||||||||
Consumer Discretionary 0.0%† | ||||||||||
aMotors Liquidation Co., Escrow pfd., C | United States | 1,400,000 | 14,000 | |||||||
|
| |||||||||
Financials 0.5% | ||||||||||
eAlly Financial Inc., 7.00%, pfd., 144A | United States | 36,265 | 32,310,984 | |||||||
Ally Financial Inc., 8.50%, pfd., A | United States | 75,000 | 1,721,250 | |||||||
aFannie Mae, 6.75%, pfd. | United States | 500,000 | 650,000 | |||||||
aFannie Mae, 7.625%, pfd., R | United States | 800,000 | 1,056,000 | |||||||
aFannie Mae, 8.25%, pfd. | United States | 851,500 | 1,387,945 | |||||||
aFreddie Mac, 8.375%, pfd., Z | United States | 1,549,200 | 3,361,764 | |||||||
|
| |||||||||
Total Preferred Stocks (Cost $107,210,325) | 40,487,943 | |||||||||
|
| |||||||||
| Principal Amount* | ||||||||||
Convertible Bonds 0.4% | ||||||||||
Financials 0.2% | ||||||||||
eForest City Enterprises Inc., cvt., senior note, 144A, 4.25%, 8/15/18 | United States | 20,000,000 | 19,850,000 | |||||||
|
| |||||||||
FI-14
Franklin Templeton Variable Insurance Products Trust
Statement of Investments, June 30, 2012 (unaudited) (continued)
| Franklin Income Securities Fund | Country | Principal Amount* | Value | |||||||
Convertible Bonds (continued) | ||||||||||
Materials 0.2% | ||||||||||
Cemex SAB de CV, cvt., sub. note, | ||||||||||
3.25%, 3/15/16 | Mexico | 9,100,000 | $ | 7,769,125 | ||||||
3.75%, 3/15/18 | Mexico | 7,920,000 | 6,662,700 | |||||||
|
| |||||||||
| 14,431,825 | ||||||||||
|
| |||||||||
Total Convertible Bonds (Cost $36,184,582) | 34,281,825 | |||||||||
|
| |||||||||
Corporate Bonds 39.7% | ||||||||||
Consumer Discretionary 6.4% | ||||||||||
eAcademy Ltd./Finance Corp., senior note, 144A, 9.25%, 8/01/19 | United States | 5,300,000 | 5,777,000 | |||||||
Cablevision Systems Corp., senior note, | ||||||||||
7.75%, 4/15/18 | United States | 20,000,000 | 21,400,000 | |||||||
8.00%, 4/15/20 | United States | 27,500,000 | 29,837,500 | |||||||
eCaesars Operating Escrow LLC/Corp., senior secured note, 144A, 8.50%, 2/15/20 | United States | 8,900,000 | 8,989,000 | |||||||
CCO Holdings LLC/CCO Holdings Capital Corp., senior note, 6.50%, 4/30/21 | United States | 15,000,000 | 16,050,000 | |||||||
eCequel Communications Holdings I LLC, senior note, 144A, 8.625%, 11/15/17 | United States | 10,000,000 | 10,825,000 | |||||||
Chrysler Group LLC/CG Co-Issuer Inc., senior secured note, | ||||||||||
8.00%, 6/15/19 | United States | 25,000,000 | 25,812,500 | |||||||
8.25%, 6/15/21 | United States | 12,800,000 | 13,216,000 | |||||||
CityCenter Holdings/Finance, senior secured note, | ||||||||||
7.625%, 1/15/16 | United States | 4,100,000 | 4,315,250 | |||||||
fPIK, 11.50%, 1/15/17 | United States | 7,144,187 | 7,535,631 | |||||||
Clear Channel Communications Inc., senior note, | ||||||||||
10.75%, 8/01/16 | United States | 12,000,000 | 7,620,000 | |||||||
9.00%, 3/01/21 | United States | 69,100,000 | 60,462,500 | |||||||
Clear Channel Worldwide Holdings Inc., | United States | 17,000,000 | 18,615,000 | |||||||
esenior sub. note, 144A, 7.625%, 3/15/20 | United States | 8,750,000 | 8,596,875 | |||||||
esenior sub. note, 144A, 7.625%, 3/15/20 | United States | 1,250,000 | 1,203,125 | |||||||
ClubCorp Club Operations Inc., senior note, 10.00%, 12/01/18 | United States | 15,000,000 | 15,975,000 | |||||||
eCSC Holdings Inc., senior note, 144A, 6.75%, 11/15/21 | United States | 23,000,000 | 24,610,000 | |||||||
Cumulus Media Holdings Inc., senior note, 7.75%, 5/01/19 | United States | 10,000,000 | 9,475,000 | |||||||
b,c,fDex One Corp., senior sub. note, PIK, 14.00%, 1/29/17 | United States | 13,930,135 | 3,354,181 | |||||||
The Goodyear Tire & Rubber Co., senior note, | ||||||||||
8.25%, 8/15/20 | United States | 9,700,000 | 10,318,375 | |||||||
7.00%, 5/15/22 | United States | 5,000,000 | 5,018,750 | |||||||
Harrah’s Operating Co. Inc., senior secured note, 11.25%, 6/01/17 | United States | 10,000,000 | 10,962,500 | |||||||
eHD Supply Inc., 144A, 8.125%, 4/15/19 | United States | 5,000,000 | 5,412,500 | |||||||
eJaguar Land Rover PLC, 144A, 8.125%, 5/15/21 | United Kingdom | 2,118,000 | 2,166,979 | |||||||
KB Home, senior note, | ||||||||||
5.75%, 2/01/14 | United States | 6,500,000 | 6,483,750 | |||||||
6.25%, 6/15/15 | United States | 15,000,000 | 14,925,000 | |||||||
7.25%, 6/15/18 | United States | 10,600,000 | 10,600,000 | |||||||
eLandry’s Inc., senior note, 144A, 9.375, 9.375%, 5/01/20 | United States | 7,500,000 | 7,659,375 | |||||||
MGM Resorts International, senior note, | ||||||||||
6.625%, 7/15/15 | United States | 5,000,000 | 5,175,000 | |||||||
10.00%, 11/01/16 | United States | 20,000,000 | 22,250,000 | |||||||
e144A, 8.625%, 2/01/19 | United States | 3,700,000 | 3,977,500 | |||||||
Shea Homes LP/Funding Corp., senior secured note, 8.625%, 5/15/19 | United States | 11,700,000 | 12,636,000 | |||||||
eUnitymedia Hessen/NRW, senior secured note, 144A, 8.125%, | ||||||||||
12/01/17 | Germany | 6,300,000 | 6,792,534 | |||||||
12/01/17 | Germany | 5,500,000 | EUR | 7,467,894 | ||||||
eUnivision Communications Inc., senior secured note, 144A, 6.875%, 5/15/19 | United States | 15,000,000 | 15,525,000 | |||||||
FI-15
Franklin Templeton Variable Insurance Products Trust
Statement of Investments, June 30, 2012 (unaudited) (continued)
| Franklin Income Securities Fund | Country | Principal Amount* | Value | |||||||
Corporate Bonds (continued) | ||||||||||
Consumer Discretionary (continued) | ||||||||||
eUPC Germany GmbH, senior secured note, 144A, 9.625%, 12/01/19 | Germany | 3,000,000 | EUR | $ | 4,145,099 | |||||
eUPCB Finance III Ltd., senior secured note, 144A, 6.625%, 7/01/20 | Netherlands | 12,500,000 | 12,750,000 | |||||||
eUPCB Finance V Ltd., senior secured note, 144A, 7.25%, 11/15/21 | Netherlands | 6,000,000 | 6,300,000 | |||||||
eUPCB Finance VI Ltd., senior secured note, 144A, 6.875%, 1/15/22 | Netherlands | 7,100,000 | 7,193,188 | |||||||
Virgin Media Secured Finance, senior secured note, 7.00%, 1/15/18 | United Kingdom | 2,100,000 | GBP | 3,541,693 | ||||||
Visant Corp., senior note, 10.00%, 10/01/17 | United States | 32,800,000 | 32,718,000 | |||||||
|
| |||||||||
| 507,688,699 | ||||||||||
|
| |||||||||
Consumer Staples 0.9% | ||||||||||
eBoparan Finance PLC, senior note, 144A, | ||||||||||
9.75%, 4/30/18 | United Kingdom | 7,000,000 | EUR | 9,357,530 | ||||||
9.875%, 4/30/18 | United Kingdom | 7,500,000 | GBP | 12,250,027 | ||||||
JBS USA LLC/Finance Inc., senior note, 11.625%, 5/01/14 | United States | 10,000,000 | 11,400,000 | |||||||
e144A, 8.25%, 2/01/20 | United States | 10,000,000 | 9,750,000 | |||||||
e144A, 7.25%, 6/01/21 | United States | 12,500,000 | 11,687,500 | |||||||
SUPERVALU Inc., senior note, 8.00%, 5/01/16 | United States | 17,500,000 | 17,806,250 | |||||||
|
| |||||||||
| 72,251,307 | ||||||||||
|
| |||||||||
Energy 7.2% | ||||||||||
Alpha Natural Resources Inc., senior note, 6.25%, 6/01/21 | United States | 2,500,000 | 2,125,000 | |||||||
Antero Resources Finance Corp., senior note, | ||||||||||
9.375%, 12/01/17 | United States | 14,600,000 | 16,206,000 | |||||||
7.25%, 8/01/19 | United States | 3,900,000 | 4,056,000 | |||||||
Arch Coal Inc., senior note, | United States | 5,500,000 | 4,675,000 | |||||||
7.25%, 6/15/21 | United States | 12,500,000 | 10,531,250 | |||||||
ATP Oil & Gas Corp., senior secured note, 11.875%, 5/01/15 | United States | 15,000,000 | 7,050,000 | |||||||
Bill Barrett Corp., senior note, 7.00%, 10/15/22 | United States | 5,000,000 | 4,787,500 | |||||||
Callon Petroleum Co., senior secured note, 13.00%, 9/15/16 | United States | 7,765,750 | 7,959,894 | |||||||
CHC Helicopter SA, senior secured note, first lien, 9.25%, 10/15/20 | Luxembourg | 25,000,000 | 24,562,500 | |||||||
Chesapeake Energy Corp., senior note, | United States | 34,000,000 | 34,000,000 | |||||||
6.875%, 8/15/18 | United States | 16,200,000 | 16,200,000 | |||||||
7.25%, 12/15/18 | United States | 33,000,000 | 33,825,000 | |||||||
g6.775%, 3/15/19 | United States | 17,500,000 | 17,084,375 | |||||||
Compagnie Generale de Geophysique-Veritas, senior note, 6.50%, 6/01/21 | France | 12,500,000 | 12,562,500 | |||||||
eConnacher Oil and Gas Ltd., secured note, 144A, 8.50%, 8/01/19 | Canada | 7,000,000 | 5,985,000 | |||||||
CONSOL Energy Inc., senior note, 8.25%, 4/01/20 | United States | 1,800,000 | 1,899,000 | |||||||
El Paso Corp., senior note, MTN, 7.75%, 1/15/32 | United States | 22,000,000 | 24,869,174 | |||||||
Energy XXI Gulf Coast Inc., senior note, 9.25%, 12/15/17 | United States | 15,000,000 | 16,125,000 | |||||||
eEverest Acquisition LLC/Finance Inc., senior note, 144A, 9.375%, 5/01/20 | United States | 10,000,000 | 10,375,000 | |||||||
EXCO Resources Inc., senior note, 7.50%, 9/15/18 | United States | 10,500,000 | 9,135,000 | |||||||
eExpro Finance Luxembourg, senior secured note, 144A, 8.50%, 12/15/16 | United Kingdom | 16,840,000 | 16,208,500 | |||||||
e,hHalcon Resources Corp., senior note, 144A, 9.75%, 7/15/20 | United States | 10,000,000 | 9,864,600 | |||||||
Linn Energy LLC/Finance Corp., senior note, 8.625%, 4/15/20 | United States | 20,000,000 | 21,650,000 | |||||||
eMagnum Hunter Resources Corp., senior note, 144A, 9.75%, 5/15/20 | United States | 5,000,000 | 4,875,000 | |||||||
eOffshore Group Investment Ltd., senior secured note, first lien, 144A, 11.50%, 8/01/15 | United States | 15,000,000 | 16,350,000 | |||||||
eOGX Petroleo e Gas Participacoes SA, senior note, 144A, 8.50%, 6/01/18 | Brazil | 15,000,000 | 13,395,000 | |||||||
ePeabody Energy Corp., senior note, 144A, 6.25%, 11/15/21 | United States | 10,000,000 | 9,950,000 | |||||||
ePetroBakken Energy Ltd., senior note, 144A, 8.625%, 2/01/20 | Canada | 5,000,000 | 4,990,500 | |||||||
c,e,iPetroplus Finance Ltd., senior note, 144A, | Switzerland | 17,515,000 | 2,189,375 | |||||||
7.00%, 5/01/17 | Switzerland | 30,000,000 | 3,750,000 | |||||||
9.375%, 9/15/19 | Switzerland | 5,000,000 | 625,000 | |||||||
Plains Exploration & Production Co., senior note, 6.125%, 6/15/19 | United States | 10,300,000 | 10,403,000 | |||||||
FI-16
Franklin Templeton Variable Insurance Products Trust
Statement of Investments, June 30, 2012 (unaudited) (continued)
| Franklin Income Securities Fund | Country | Principal Amount* | Value | |||||||
Corporate Bonds (continued) | ||||||||||
Energy (continued) | ||||||||||
Quicksilver Resources Inc., senior note, 9.125%, 8/15/19 | United States | 20,000,000 | $ | 17,500,000 | ||||||
Sabine Pass LNG LP, senior secured note, 7.50%, 11/30/16 | United States | 25,000,000 | 26,375,000 | |||||||
eSamson Investment Co., senior note, 144A, 9.75%, 2/15/20 | United States | 26,300,000 | 26,201,375 | |||||||
SandRidge Energy Inc., senior note, | ||||||||||
9.875%, 5/15/16 | United States | 17,500,000 | 19,250,000 | |||||||
8.75%, 1/15/20 | United States | 25,000,000 | 26,187,500 | |||||||
7.50%, 3/15/21 | United States | 13,300,000 | 13,200,250 | |||||||
e144A, 8.00%, 6/01/18 | United States | 21,800,000 | 22,181,500 | |||||||
W&T Offshore Inc., senior note, 8.50%, 6/15/19 | United States | 40,500,000 | 42,018,750 | |||||||
|
| |||||||||
| 571,178,543 | ||||||||||
|
| |||||||||
Financials 4.8% | ||||||||||
Ally Financial Inc., senior note, | ||||||||||
6.25%, 12/01/17 | United States | 5,000,000 | 5,287,715 | |||||||
8.00%, 3/15/20 | United States | 10,000,000 | 11,550,000 | |||||||
jBank of America Corp., pfd., sub. bond, M, 8.125% to 5/15/18, FRN thereafter, Perpetual | United States | 5,000,000 | 5,252,800 | |||||||
eCIT Group Inc., | United States | 47,988,861 | 48,138,826 | |||||||
secured bond, 144A, 7.00%, 5/02/16 | United States | 80,000,000 | 80,300,000 | |||||||
CNL Income Properties Inc., senior note, 7.25%, 4/15/19 | United States | 15,000,000 | 13,875,000 | |||||||
Hexion U.S. Finance Corp., senior secured note, 8.875%, 2/01/18 | United States | 8,000,000 | 8,200,000 | |||||||
International Lease Finance Corp., senior note, | ||||||||||
8.75%, 3/15/17 | United States | 15,000,000 | 16,912,500 | |||||||
8.875%, 9/01/17 | United States | 20,000,000 | 22,650,000 | |||||||
jJPMorgan Chase & Co., junior sub. note, 1, 7.90% to 4/30/18, FRN thereafter, Perpetual | United States | 85,000,000 | 93,508,160 | |||||||
eKinetic Concepts Inc./USA, senior note, 144A, 12.50%, 11/01/19 | United States | 5,000,000 | 4,575,000 | |||||||
e,kLiberty Mutual Group Inc., junior sub. note, 144A, FRN, 10.75%, 6/15/88 | United States | 25,000,000 | 34,250,000 | |||||||
e,jM&T Bank Corp., 144A, 6.875% to 6/15/16, FRN thereafter, Perpetual | United States | 12,000,000 | 11,850,000 | |||||||
Morgan Stanley, senior note, 5.50%, 1/26/20 | United States | 15,000,000 | 14,722,665 | |||||||
eNationstar Mort/Cap Corp., senior note, 144A, 9.625%, 5/01/19 | United States | 10,000,000 | 10,625,000 | |||||||
|
| |||||||||
| 381,697,666 | ||||||||||
|
| |||||||||
Health Care 2.8% | ||||||||||
CHS/Community Health Systems Inc., senior note, 8.875%, 7/15/15 | United States | 11,267,000 | 11,576,842 | |||||||
Giant Funding Corp., senior secured note, 8.25%, 2/01/18 | Spain | 4,900,000 | 5,292,000 | |||||||
HCA Holdings Inc., senior note, 7.75%, 5/15/21 | United States | 10,000,000 | 10,775,000 | |||||||
HCA Inc., | United States | 12,000,000 | 13,500,000 | |||||||
senior note, 7.50%, 2/15/22 | United States | 34,500,000 | 37,691,250 | |||||||
senior secured note, 8.50%, 4/15/19 | United States | 10,000,000 | 11,250,000 | |||||||
senior secured note, 6.50%, 2/15/20 | United States | 20,000,000 | 21,725,000 | |||||||
eHealth Management Associates Inc., senior note, 144A, 7.375%, 1/15/20 | United States | 4,300,000 | 4,595,625 | |||||||
Tenet Healthcare Corp., | United States | 24,600,000 | 25,584,000 | |||||||
esenior note, 144A, 8.00%, 8/01/20 | United States | 6,779,377 | 7,033,604 | |||||||
ksenior note, FRN, 9.25%, 2/01/15 | United States | 13,500,000 | 15,086,250 | |||||||
senior secured note, 10.00%, 5/01/18 | United States | 21,250,000 | 24,437,500 | |||||||
esenior secured note, 144A, 6.25%, 11/01/18 | United States | 6,381,654 | 6,636,920 | |||||||
Vanguard Health Holding Co. II LLC/Inc., senior note, | ||||||||||
8.00%, 2/01/18 | United States | 23,100,000 | 23,735,250 | |||||||
7.75%, 2/01/19 | United States | 4,000,000 | 4,060,000 | |||||||
|
| |||||||||
| 222,979,241 | ||||||||||
|
| |||||||||
FI-17
Franklin Templeton Variable Insurance Products Trust
Statement of Investments, June 30, 2012 (unaudited) (continued)
| Franklin Income Securities Fund | Country | Principal Amount* | Value | |||||||
Corporate Bonds (continued) | ||||||||||
Industrials 2.3% | ||||||||||
eAbengoa Finance SAU, senior note, 144A, 8.875%, 11/01/17 | Spain | 12,900,000 | $ | 11,610,000 | ||||||
e,iAmerican Airlines Inc., senior secured note, 144A, 7.50%, 3/15/16 | United States | 15,000,000 | 14,250,000 | |||||||
eCeva Group PLC, | United Kingdom | 15,000,000 | 13,687,500 | |||||||
senior secured note, 144A, 8.375%, 12/01/17 | United Kingdom | 7,500,000 | 7,298,437 | |||||||
senior secured note, 144A, 11.50%, 4/01/18 | United Kingdom | 30,300,000 | 28,103,250 | |||||||
eDelta Air Lines Inc., senior secured note, 144A, 9.50%, 9/15/14 | United States | 2,168,000 | 2,300,790 | |||||||
Hertz Corp., senior note, 6.75%, 4/15/19 | United States | 7,500,000 | 7,837,500 | |||||||
The Manitowoc Co. Inc., senior note, 9.50%, 2/15/18 | United States | 10,000,000 | 11,000,000 | |||||||
RBS Global & Rexnord Corp., senior note, 8.50%, 5/01/18 | United States | 18,900,000 | 20,601,000 | |||||||
Terex Corp., senior sub. note, 8.00%, 11/15/17 | United States | 45,000,000 | 46,912,500 | |||||||
United Rentals North America Inc., senior sub. note, 8.375%, 9/15/20 | United States | 8,800,000 | 9,306,000 | |||||||
eUR Financing Escrow Corp., senior note, 144A, 7.625%, 4/15/22 | United States | 8,000,000 | 8,400,000 | |||||||
|
| |||||||||
| 181,306,977 | ||||||||||
|
| |||||||||
Information Technology 6.8% | ||||||||||
CDW LLC/Finance Corp., | United States | 28,725,000 | 30,735,750 | |||||||
senior sub. note, 12.535%, 10/12/17 | United States | 5,000,000 | 5,450,000 | |||||||
Ceridian Corp., senior note, 11.25%, 11/15/15 | United States | 4,500,000 | 4,342,500 | |||||||
eCommScope Inc., senior note, 144A, 8.25%, 1/15/19 | United States | 4,000,000 | 4,250,000 | |||||||
First Data Corp., | United States | 80,000,000 | 80,500,000 | |||||||
senior note, 9.875%, 9/24/15 | United States | 7,500,000 | 7,631,250 | |||||||
senior note, 9.875%, 9/24/15 | United States | 4,645,000 | 4,703,062 | |||||||
fsenior note, PIK, 10.55%, 9/24/15 | United States | 13,500,000 | 13,871,250 | |||||||
esenior secured bond, 144A, 8.25%, 1/15/21 | United States | 45,000,000 | 45,225,000 | |||||||
e,fsenior secured note, 144A, PIK, 8.75%, 1/15/22 | United States | 33,188,000 | 33,602,850 | |||||||
senior sub. note, 11.25%, 3/31/16 | United States | 90,000,000 | 85,275,000 | |||||||
Freescale Semiconductor Inc., | United States | 35,000,000 | 34,737,500 | |||||||
senior note, 10.75%, 8/01/20 | United States | 64,846,000 | 70,033,680 | |||||||
esenior secured note, 144A, 10.125%, 3/15/18 | United States | 4,438,000 | 4,870,705 | |||||||
esenior secured note, 144A, 9.25%, 4/15/18 | United States | 51,700,000 | 55,577,500 | |||||||
eLawson Software Inc., senior note, 144A, 9.375%, 4/01/19 | United States | 4,100,000 | 4,397,250 | |||||||
eSanmina-SCI Corp., senior note, 144A, 7.00%, 5/15/19 | United States | 15,000,000 | 14,625,000 | |||||||
eSophia LP/Finance Inc., senior note, 144A, 9.75%, 1/15/19 | United States | 5,000,000 | 5,387,500 | |||||||
Sterling International Inc., senior note, 11.00%, 10/01/19 | United States | 7,500,000 | 7,575,000 | |||||||
SunGard Data Systems Inc., senior note, 7.625%, 11/15/20 | United States | 10,000,000 | 10,700,000 | |||||||
eViaSat Inc., senior note, 144A, 6.875%, 6/15/20 | United States | 12,500,000 | 12,687,500 | |||||||
|
| |||||||||
| 536,178,297 | ||||||||||
|
| |||||||||
Materials 2.7% | ||||||||||
Berry Plastics Corp., senior secured note, 9.75%, 1/15/21 | United States | 5,000,000 | 5,462,500 | |||||||
eCemex Finance LLC, senior secured note, 144A, 9.50%, 12/14/16 | United States | 3,000,000 | 2,940,000 | |||||||
eCemex SAB de CV, senior secured note, 144A, 9.00%, 1/11/18 | Mexico | 26,000,000 | 23,335,000 | |||||||
eDynacast International LLC/Finance Inc., secured note, 144A, 9.25%, 7/15/19 | United States | 10,000,000 | 10,425,000 | |||||||
eFMG Resources August 2006 Pty. Ltd., senior note, 144A, | ||||||||||
7.00%, 11/01/15 | Australia | 10,000,000 | 10,143,750 | |||||||
6.875%, 2/01/18 | Australia | 11,900,000 | 12,063,625 | |||||||
8.25%, 11/01/19 | Australia | 15,000,000 | 15,975,000 | |||||||
Huntsman International LLC, senior note, 5.50%, 6/30/16 | United States | 1,750,000 | 1,754,375 | |||||||
eIneos Finance PLC, senior secured note, 144A, 8.375%, 2/15/19 | United Kingdom | 5,100,000 | 5,268,938 | |||||||
FI-18
Franklin Templeton Variable Insurance Products Trust
Statement of Investments, June 30, 2012 (unaudited) (continued)
| Franklin Income Securities Fund | Country | Principal Amount* | Value | |||||||
Corporate Bonds (continued) | ||||||||||
Materials (continued) | ||||||||||
eIneos Group Holdings Ltd., | United Kingdom | 30,000,000 | EUR | $ | 33,127,079 | |||||
senior secured note, 144A, 8.50%, 2/15/16 | United Kingdom | 5,000,000 | 4,612,500 | |||||||
eInmet Mining Corp., senior note, 144A, 8.75%, 6/01/20 | Canada | 4,500,000 | 4,477,500 | |||||||
eKerling PLC, senior secured note, 144A, 10.625%, 1/28/17 | United Kingdom | 9,400,000 | EUR | 10,546,906 | ||||||
eKinove German Bondco GmbH, | Germany | 8,910,000 | EUR | 11,579,551 | ||||||
senior secured note, 144A, 9.625%, 6/15/18 | Germany | 11,100,000 | 11,488,500 | |||||||
eReynolds Group Issuer Inc./LLC/SA, senior note, 144A, 9.00%, 4/15/19 | United States | 5,000,000 | 5,012,500 | |||||||
senior note, 144A, 9.875%, 8/15/19 | United States | 16,800,000 | 17,451,000 | |||||||
senior note, 144A, 8.25%, 2/15/21 | United States | 5,200,000 | 4,940,000 | |||||||
senior secured note, 144A, 7.875%, 8/15/19 | United States | 10,000,000 | 10,875,000 | |||||||
senior secured note, 144A, 6.875%, 2/15/21 | United States | 10,000,000 | 10,475,000 | |||||||
Vulcan Materials Co., senior note, 6.50%, 12/01/16 | United States | 6,200,000 | 6,556,500 | |||||||
|
| |||||||||
| 218,510,224 | ||||||||||
|
| |||||||||
Telecommunication Services 2.0% | ||||||||||
Cricket Communications Inc., senior note, 7.75%, 10/15/20 | United States | 45,000,000 | 43,200,000 | |||||||
Frontier Communications Corp., senior note, | ||||||||||
8.25%, 4/15/17 | United States | 1,200,000 | 1,296,000 | |||||||
8.50%, 4/15/20 | United States | 12,900,000 | 13,738,500 | |||||||
9.25%, 7/01/21 | United States | 7,400,000 | 7,992,000 | |||||||
Intelsat Jackson Holdings SA, senior note, 7.50%, 4/01/21 | Luxembourg | 1,700,000 | 1,806,250 | |||||||
Sprint Nextel Corp., | ||||||||||
6.00%, 12/01/16 | United States | 10,000,000 | 9,625,000 | |||||||
e144A, 11.50%, 11/15/21 | United States | 30,000,000 | 33,525,000 | |||||||
senior note, 8.375%, 8/15/17 | United States | 12,700,000 | 13,081,000 | |||||||
esenior note, 144A, 9.125%, 3/01/17 | United States | 13,300,000 | 13,998,250 | |||||||
esenior note, 144A, 9.00%, 11/15/18 | United States | 20,000,000 | 22,400,000 | |||||||
|
| |||||||||
| 160,662,000 | ||||||||||
|
| |||||||||
Utilities 3.8% | ||||||||||
eCalpine Corp., senior secured note, 144A, | ||||||||||
7.875%, 7/31/20 | United States | 5,700,000 | 6,312,750 | |||||||
7.50%, 2/15/21 | United States | 15,000,000 | 16,275,000 | |||||||
7.875%, 1/15/23 | United States | 11,200,000 | 12,264,000 | |||||||
c,i,lDynegy Holdings Inc., senior note, | ||||||||||
7.50%, 6/01/15 | United States | 20,000,000 | 13,500,000 | |||||||
7.50%, 6/01/15 | United States | 15,000,000 | 9,525,000 | |||||||
8.375%, 5/01/16 | United States | 64,699,000 | 43,995,320 | |||||||
7.75%, 6/01/19 | United States | 50,000,000 | 33,750,000 | |||||||
GenOn Energy Inc., senior note, | ||||||||||
7.625%, 6/15/14 | United States | 14,500,000 | 14,862,500 | |||||||
7.875%, 6/15/17 | United States | 25,000,000 | 23,375,000 | |||||||
eIntergen NV, senior secured note, 144A, 9.00%, 6/30/17 | Netherlands | 7,500,000 | 7,448,438 | |||||||
Niska Gas Storage U.S./Canada, senior note, 8.875%, 3/15/18 | United States | 15,000,000 | 14,700,000 | |||||||
fTexas Competitive Electric Holdings Co. LLC, senior note, PIK, 11.25%, 11/01/16 | United States | 15,319,477 | 2,839,205 | |||||||
Texas Competitive Electric Holdings Co. LLC/Texas Competitive Electric Holdings Finance Inc., | United States | 152,939,000 | 40,146,487 | |||||||
senior note, B, 10.25%, 11/01/15 | United States | 64,193,000 | 15,727,285 | |||||||
esenior secured note, 144A, 11.50%, 10/01/20 | United States | 20,000,000 | 13,750,000 | |||||||
senior secured note, B, 15.00%, 4/01/21 | United States | 93,125,000 | 32,128,125 | |||||||
|
| |||||||||
| 300,599,110 | ||||||||||
|
| |||||||||
Total Corporate Bonds (Cost $3,268,111,308) | 3,153,052,064 | |||||||||
|
| |||||||||
FI-19
Franklin Templeton Variable Insurance Products Trust
Statement of Investments, June 30, 2012 (unaudited) (continued)
| Franklin Income Securities Fund | Country | Principal Amount* | Value | |||||||
k,mSenior Floating Rate Interests 7.2% | ||||||||||
Consumer Discretionary 2.3% | ||||||||||
Chrysler Group LLC, Tranche B Term Loan, 6.00%, 5/24/17 | United States | 44,253,000 | $ | 44,637,470 | ||||||
Clear Channel Communications Inc., Tranche B Term Loan, 3.895%, 1/29/16 | United States | 71,118,109 | 56,750,046 | |||||||
ClubCorp Club Operations Inc., Term B Loan, 6.00%, 11/30/16 | United States | 9,850,000 | 9,899,250 | |||||||
Cumulus Media Holdings Inc., Second Lien Term Loan, 7.50%, 9/16/19 | United States | 40,000,000 | 40,100,000 | |||||||
bDex Media West LLC, Term Loan B, 7.25%, 10/24/14 | United States | 3,837,056 | 2,385,371 | |||||||
HD Supply Inc., Term Loan Facility, 7.25%, 10/12/17 | United States | 7,000,000 | 7,035,000 | |||||||
Landry’s Inc., B Term Loan, 6.50%, 4/24/18 | United States | 14,962,500 | 15,018,610 | |||||||
SuperMedia Inc., Exit Term Loan, 11.00%, 12/31/15 | United States | 2,416,166 | 1,379,802 | |||||||
|
| |||||||||
| 177,205,549 | ||||||||||
|
| |||||||||
Energy 0.2% | ||||||||||
Chesapeake Energy Corp., Unsecured Term Loan, 8.50%, 12/02/17 | United States | 15,000,000 | 14,909,400 | |||||||
|
| |||||||||
Financials 0.6% | ||||||||||
iStar Financial Inc., Tranche A2 Term Loan, 7.00%, 6/30/14 | United States | 50,000,000 | 50,050,000 | |||||||
|
| |||||||||
Industrials 0.5% | ||||||||||
Altegrity Inc., | ||||||||||
Term Loan B, 2.994%, 2/21/15 | United States | 12,476,821 | 11,821,788 | |||||||
Tranche D Term Loan, 7.75%, 2/21/15 | United States | 12,585,755 | 12,522,826 | |||||||
Ceva Group PLC, | ||||||||||
Dollar Tranche B L/C, 5.461%, 8/31/16 | United Kingdom | 2,105,263 | 1,987,720 | |||||||
EGL Tranche B Term Loans, 5.466%, 8/31/16 | United Kingdom | 12,291,882 | 11,677,288 | |||||||
|
| |||||||||
| 38,009,622 | ||||||||||
|
| |||||||||
Information Technology 1.4% | ||||||||||
First Data Corp., | ||||||||||
2017 Term Loan, 5.245%, 3/24/17 | United States | 57,510,381 | 54,868,527 | |||||||
2018 Term Loan, 4.245%, 3/24/18 | United States | 22,436,455 | 20,667,834 | |||||||
Freescale Semiconductor Inc., Tranche B-1 Term Loan, 4.489%, 12/01/16 | United States | 2,581,931 | 2,447,670 | |||||||
Lawson Software Inc., Tranche B Term Loan, 6.25%, 4/05/18 | United States | 15,000,000 | 15,094,650 | |||||||
Sophia LP (Datatel), Initial Term Loan, 6.25%, 7/19/18 | United States | 7,481,250 | 7,539,701 | |||||||
SRA International Inc., Term Loan, 6.50%, 7/20/18 | United States | 8,400,000 | 8,142,750 | |||||||
|
| |||||||||
| 108,761,132 | ||||||||||
|
| |||||||||
Materials 0.1% | ||||||||||
Ineos US Finance LLC, Dollar Term Loan, 6.50%, 4/27/18 | United States | 9,975,000 | 9,780,487 | |||||||
|
| |||||||||
Utilities 2.1% | ||||||||||
Dynegy Midwest Generation LLC, Term Loan, 9.25%, 8/05/16 | United States | 10,421,250 | 10,681,781 | |||||||
Dynegy Power LLC, Term Loan, 9.25%, 8/05/16 | United States | 19,402,500 | 20,033,082 | |||||||
Texas Competitive Electric Holdings Co. LLC, | ||||||||||
2014 Term Loan, 3.741%, 10/10/14 | United States | 15,000,000 | 9,448,290 | |||||||
2017 Term Loan, 4.741%, 10/10/17 | United States | 214,606,875 | 128,743,523 | |||||||
|
| |||||||||
| 168,906,676 | ||||||||||
|
| |||||||||
Total Senior Floating Rate Interests (Cost $629,532,232) | 567,622,866 | |||||||||
|
| |||||||||
Asset-Backed Securities and Commercial Mortgage-Backed Securities (Cost $32,561,606) 0.5% | ||||||||||
Financials 0.5% | ||||||||||
e,kBanc of America Large Loan, 2010-HLTN, 144A, FRN, 1.992%, 11/15/15 | United States | 37,427,134 | 35,482,813 | |||||||
|
| |||||||||
Total Investments before Short Term Investments | 7,037,945,270 | |||||||||
|
| |||||||||
FI-20
Franklin Templeton Variable Insurance Products Trust
Statement of Investments, June 30, 2012 (unaudited) (continued)
| Franklin Income Securities Fund | Country | Principal Amount* | Value | |||||||
Short Term Investments 10.0% | ||||||||||
U.S. Government and Agency Securities (Cost $194,392,039) 2.4% | ||||||||||
nFHLB, 7/20/12 | United States | 194,400,000 | $ | 194,398,056 | ||||||
|
| |||||||||
Total Investments before Money Market Funds and Repurchase Agreements (Cost $7,281,601,665) | 7,232,343,326 | |||||||||
|
| |||||||||
Repurchase Agreements (Cost $596,531,702) 7.5% | ||||||||||
oJoint Repurchase Agreement, 0.129%, 7/02/12 (Maturity Value $596,538,111) | United States | 596,531,702 | 596,531,702 | |||||||
BNP Paribas Securities Corp. (Maturity Value $116,533,720) Credit Suisse Securities (USA) LLC (Maturity Value $135,957,001) Deutsche Bank Securities Inc. (Maturity Value $91,556,669) HSBC Securities (USA) Inc. (Maturity Value $77,687,158) Merrill Lynch, Pierce, Fenner & Smith Inc. (Maturity Value $77,687,158) Morgan Stanley & Co. LLC (Maturity Value $38,846,562) UBS Securities LLC (Maturity Value $58,269,843) | ||||||||||
Collateralized by U.S. Government Agency Securities, 0.00% - 5.25%, 8/01/12 - 6/28/17; nU.S. Treasury Bills, 7/26/12; and U.S. Treasury Notes, 1.125% - 3.00%, 12/15/12 - 2/15/22 (valued at $608,686,621) | ||||||||||
| Shares | ||||||||||
pInvestments from Cash Collateral Received for Loaned Securities (Cost $6,426,000) 0.1% | ||||||||||
Money Market Funds 0.1% | ||||||||||
qBNY Mellon Overnight Government Fund, 0.182% | United States | 6,426,000 | 6,426,000 | |||||||
|
| |||||||||
Total Investments (Cost $7,884,559,367) 98.7% | 7,835,301,028 | |||||||||
Other Assets, less Liabilities 1.3% | 101,955,942 | |||||||||
|
| |||||||||
Net Assets 100.0% | $ | 7,937,256,970 | ||||||||
|
| |||||||||
See Abbreviations on page FI-34.
†Rounds to less than 0.1% of net assets.
*The principal amount is stated in U.S. dollars unless otherwise indicated.
aNon-income producing.
bSee Note 8 regarding holdings of 5% voting securities.
cAt June 30, 2012, pursuant to the Fund’s policies and the requirements of applicable securities law, the Fund may be restricted from trading these securities for a limited or extended period of time due to ownership limits and/or potential possession of material non-public information.
dSee Note 1(e) regarding equity-linked securities.
eSecurity was purchased pursuant to Rule 144A under the Securities Act of 1933 and may be sold in transactions exempt from registration only to qualified institutional buyers or in a public offering registered under the Securities Act of 1933. These securities have been deemed liquid under guidelines approved by the Trust’s Board of Trustees. At June 30, 2012, the aggregate value of these securities was $1,270,328,707, representing 16.00% of net assets.
fIncome may be received in additional securities and/or cash.
gA portion or all of the security is on loan at June 30, 2012. See Note 1(f).
hSecurity purchased on a when-issued basis. See Note 1(d).
iSee Note 7 regarding defaulted securities.
jPerpetual security with no stated maturity date.
kThe coupon rate shown represents the rate at period end.
lSecurity has been deemed illiquid because it may not be able to be sold within seven days. At June 30, 2012, the aggregate value of these securities was $100,770,320, representing 1.27% of net assets.
mSee Note 1(g) regarding senior floating rate interests.
nThe security is traded on a discount basis with no stated coupon rate.
oSee Note 1(c) regarding joint repurchase agreement.
pSee Note 1(f) regarding securities on loan.
qThe rate shown is the annualized seven-day yield at period end.
The accompanying notes are an integral part of these financial statements.
FI-21
Franklin Templeton Variable Insurance Products Trust
Financial Statements
Statement of Assets and Liabilities
June 30, 2012 (unaudited)
| Franklin Income Securities Fund | ||||
Assets: | ||||
Investments in securities: | ||||
Cost - Unaffiliated issuers | $ | 7,163,163,902 | ||
Cost - Non-controlled affiliated issuers (Note 8) | 124,863,763 | |||
Cost - Repurchase agreements | 596,531,702 | |||
|
| |||
Total cost of investments | $ | 7,884,559,367 | ||
|
| |||
Value - Unaffiliated issuers | $ | 7,230,559,148 | ||
Value - Non-controlled affiliated issuers (Note 8) | 8,210,178 | |||
Value - Repurchase agreements | 596,531,702 | |||
|
| |||
Total value of investments (Includes securities loaned in the amount of $6,150,375) | 7,835,301,028 | |||
Cash | 1,229,845 | |||
Receivables: | ||||
Investment securities sold | 38,745,733 | |||
Capital shares sold | 2,807,079 | |||
Dividends and interest | 87,694,627 | |||
Other assets | 22,753 | |||
|
| |||
Total assets | 7,965,801,065 | |||
|
| |||
Liabilities: | ||||
Payables: | ||||
Investment securities purchased | 9,878,676 | |||
Capital shares redeemed | 5,551,969 | |||
Affiliates | 5,594,180 | |||
Payable upon return of securities loaned | 6,426,000 | |||
Accrued expenses and other liabilities | 1,093,270 | |||
|
| |||
Total liabilities | 28,544,095 | |||
|
| |||
Net assets, at value | $ | 7,937,256,970 | ||
|
| |||
Net assets consist of: | ||||
Paid-in capital | $ | 8,721,946,702 | ||
Undistributed net investment income | 220,043,025 | |||
Net unrealized appreciation (depreciation) | (49,381,590 | ) | ||
Accumulated net realized gain (loss) | (955,351,167 | ) | ||
|
| |||
Net assets, at value | $ | 7,937,256,970 | ||
|
| |||
The accompanying notes are an integral part of these financial statements.
FI-22
Franklin Templeton Variable Insurance Products Trust
Financial Statements (continued)
Statement of Assets and Liabilities (continued)
June 30, 2012 (unaudited)
| Franklin Income Securities Fund | ||||
Class 1: | ||||
Net assets, at value | $ | 1,458,268,056 | ||
|
| |||
Shares outstanding | 100,489,410 | |||
|
| |||
Net asset value and maximum offering price per share | $ | 14.51 | ||
|
| |||
Class 2: | ||||
Net assets, at value | $ | 6,038,574,358 | ||
|
| |||
Shares outstanding | 426,685,160 | |||
|
| |||
Net asset value and maximum offering price per share | $ | 14.15 | ||
|
| |||
Class 4: | ||||
Net assets, at value | $ | 440,414,556 | ||
|
| |||
Shares outstanding | 30,590,495 | |||
|
| |||
Net asset value and maximum offering price per share | $ | 14.40 | ||
|
| |||
The accompanying notes are an integral part of these financial statements.
FI-23
Franklin Templeton Variable Insurance Products Trust
Financial Statements (continued)
Statement of Operations
for the six months ended June 30, 2012 (unaudited)
| Franklin Income Securities Fund | ||||
Investment income: | ||||
Dividends | $ | 68,215,311 | ||
Interest: | ||||
Unaffiliated issuers | 196,207,854 | |||
Non-controlled affiliated issuers (Note 8) | 1,141,651 | |||
Income from securities loaned | 461,297 | |||
|
| |||
Total investment income | 266,026,113 | |||
|
| |||
Expenses: | ||||
Management fees (Note 3a) | 17,976,669 | |||
Distribution fees: (Note 3c) | ||||
Class 2 | 7,518,287 | |||
Class 4 | 766,549 | |||
Unaffiliated transfer agent fees | 2,229 | |||
Custodian fees (Note 4) | 109,655 | |||
Reports to shareholders | 349,360 | |||
Professional fees | 89,697 | |||
Trustees’ fees and expenses | 15,890 | |||
Other | 81,764 | |||
|
| |||
Total expenses | 26,910,100 | |||
|
| |||
Net investment income | 239,116,013 | |||
|
| |||
Realized and unrealized gains (losses): | ||||
Net realized gain (loss) from: | ||||
Investments: | ||||
Unaffiliated issuers | 49,255,756 | |||
Non-controlled affiliated issuers (Note 8) | (14,465,746 | ) | ||
Foreign currency transactions | 252,953 | |||
|
| |||
Net realized gain (loss) | 35,042,963 | |||
|
| |||
Net change in unrealized appreciation (depreciation) on: | ||||
Investments | 167,156,406 | |||
Translation of other assets and liabilities denominated in foreign currencies | 70,473 | |||
|
| |||
Net change in unrealized appreciation (depreciation) | 167,226,879 | |||
|
| |||
Net realized and unrealized gain (loss) | 202,269,842 | |||
|
| |||
Net increase (decrease) in net assets resulting from operations | $ | 441,385,855 | ||
|
| |||
The accompanying notes are an integral part of these financial statements.
FI-24
Franklin Templeton Variable Insurance Products Trust
Financial Statements (continued)
Statements of Changes in Net Assets
| Franklin Income Securities Fund | ||||||||
| Six Months Ended June 30, 2012 (unaudited) | Year Ended December 31, 2011 | |||||||
| ||||||||
Increase (decrease) in net assets: | ||||||||
Operations: | ||||||||
Net investment income | $ | 239,116,013 | $ | 498,525,907 | ||||
Net realized gain (loss) from investments, written options and foreign currency transactions | 35,042,963 | 224,314,451 | ||||||
Net change in unrealized appreciation (depreciation) on investments and translation of other assets and liabilities denominated in foreign currencies | 167,226,879 | (562,321,188 | ) | |||||
| ||||||||
Net increase (decrease) in net assets resulting from operations | 441,385,855 | 160,519,170 | ||||||
| ||||||||
Distributions to shareholders from: | ||||||||
Net investment income: | ||||||||
Class 1 | (90,282,701 | ) | (96,601,395 | ) | ||||
Class 2 | (392,684,736 | ) | (356,087,463 | ) | ||||
Class 4 | (28,048,130 | ) | (24,430,578 | ) | ||||
| ||||||||
Total distributions to shareholders | (511,015,567 | ) | (477,119,436 | ) | ||||
| ||||||||
Capital share transactions: (Note 2) | ||||||||
Class 1 | 169,283,441 | (55,103,339 | ) | |||||
Class 2 | 177,049,271 | (185,660,731 | ) | |||||
Class 4 | 12,547,008 | 31,595,919 | ||||||
| ||||||||
Total capital share transactions | 358,879,720 | (209,168,151 | ) | |||||
| ||||||||
Net increase (decrease) in net assets | 289,250,008 | (525,768,417 | ) | |||||
Net assets: | ||||||||
Beginning of period | 7,648,006,962 | 8,173,775,379 | ||||||
| ||||||||
End of period | $ | 7,937,256,970 | $ | 7,648,006,962 | ||||
| ||||||||
Undistributed net investment income included in net assets: | ||||||||
End of period | $ | 220,043,025 | $ | 491,942,579 | ||||
| ||||||||
The accompanying notes are an integral part of these financial statements.
FI-25
Franklin Templeton Variable Insurance Products Trust
Notes to Financial Statements (unaudited)
Franklin Income Securities Fund
1. ORGANIZATION AND SIGNIFICANT ACCOUNTING POLICIES
Franklin Templeton Variable Insurance Products Trust (Trust) is registered under the Investment Company Act of 1940, as amended, (1940 Act) as an open-end investment company, consisting of twenty separate funds. The Franklin Income Securities Fund (Fund) is included in this report. The financial statements of the remaining funds in the Trust are presented separately. Shares of the Fund are generally sold only to insurance company separate accounts to fund the benefits of variable life insurance policies or variable annuity contracts. The Fund offers three classes of shares: Class 1, Class 2 and Class 4. Each class of shares differs by its distribution fees, voting rights on matters affecting a single class and its exchange privilege.
The following summarizes the Fund’s significant accounting policies.
a. Financial Instrument Valuation
The Fund’s investments in financial instruments are carried at fair value daily. Fair value is the price that would be received to sell an asset or paid to transfer a liability in an orderly transaction between market participants on the measurement date. Under procedures approved by the Trust’s Board of Trustees (the Board), the Fund’s administrator, investment manager and other affiliates have formed the Valuation and Liquidity Oversight Committee (VLOC). The VLOC provides administration and oversight of the Fund’s valuation policies and procedures, which are approved annually by the Board. Among other things, these procedures allow the Fund to utilize independent pricing services, quotations from securities and financial instrument dealers, and other market sources to determine fair value.
Equity securities listed on an exchange or on the NASDAQ National Market System are valued at the last quoted sale price or the official closing price of the day, respectively. Foreign equity securities are valued as of the close of trading on the foreign stock exchange on which the security is primarily traded, or the NYSE, whichever is earlier. The value is then converted into its U.S. dollar equivalent at the foreign exchange rate in effect at the close of the NYSE on the day that the value of the security is determined. Over-the-counter (OTC) securities are valued within the range of the most recent quoted bid and ask prices. Securities that trade in multiple markets or on multiple exchanges are valued according to the broadest and most representative market. Certain equity securities are valued based upon fundamental characteristics or relationships to similar securities. Investments in non-registered money market funds are valued at the closing net asset value.
Debt securities generally trade in the OTC market rather than on a securities exchange. The Fund’s pricing services use multiple valuation techniques to determine fair value. In instances where sufficient market activity exists, the pricing services may utilize a market-based approach through which quotes from market makers are used to determine fair value. In instances where sufficient market activity may not exist or is limited, the pricing services also utilize proprietary valuation models which may consider market characteristics such as benchmark yield curves, credit spreads, estimated default rates, anticipated market interest rate volatility, coupon rates, anticipated timing of principal repayments, underlying collateral, and other unique security features in order to estimate the relevant cash flows, which are then discounted to calculate the fair value. Securities denominated in a foreign currency are converted into their U.S. dollar equivalent at the foreign exchange rate in effect at the close of the NYSE on the date that the values of the foreign debt securities are determined. Repurchase agreements are valued at cost, which approximates market value.
The Fund has procedures to determine the fair value of financial instruments for which market prices are not reliable or readily available. Under these procedures, the VLOC convenes on a regular basis to review such financial instruments and considers a number of factors, including significant unobservable valuation inputs, when arriving at fair value. The VLOC primarily employs a market-based approach which may use related or comparable assets or liabilities, recent transactions, market multiples, book values, and other relevant information for the investment to determine the fair value of the investment. An income-based valuation approach may also be used in which the anticipated future cash flows of the investment are discounted to calculate fair value. Discounts may also be applied due to the nature or duration of any restrictions on the disposition of the investments. Due to the inherent uncertainty of valuations of such investments, the fair values may differ significantly from the values that would have been used had an active market existed. The VLOC employs various methods for calibrating these valuation approaches including a regular review of key inputs and assumptions, transactional back-testing or disposition analysis, and reviews of any related market activity.
FI-26
Franklin Templeton Variable Insurance Products Trust
Notes to Financial Statements (unaudited) (continued)
Franklin Income Securities Fund
1. ORGANIZATION AND SIGNIFICANT ACCOUNTING POLICIES (continued)
a. Financial Instrument Valuation (continued)
Trading in securities on foreign securities stock exchanges and OTC markets may be completed before the daily close of business on the NYSE. Occasionally, events occur between the time at which trading in a foreign security is completed and the close of the NYSE that might call into question the reliability of the value of a portfolio security held by the Fund. As a result, differences may arise between the value of the Fund’s portfolio securities as determined at the foreign market close and the latest indications of value at the close of the NYSE. In order to minimize the potential for these differences, the VLOC monitors price movements following the close of trading in foreign stock markets through a series of country specific market proxies (such as baskets of American Depositary Receipts, futures contracts and exchange traded funds). These price movements are measured against established trigger thresholds for each specific market proxy to assist in determining if an event has occurred that may call into question the reliability of the values of the foreign securities held by the Fund. If such an event occurs, the securities may be valued using fair value procedures, which may include the use of independent pricing services.
b. Foreign Currency Translation
Portfolio securities and other assets and liabilities denominated in foreign currencies are translated into U.S. dollars based on the exchange rate of such currencies against U.S. dollars on the date of valuation. The Fund may enter into foreign currency exchange contracts to facilitate transactions denominated in a foreign currency. Purchases and sales of securities, income and expense items denominated in foreign currencies are translated into U.S. dollars at the exchange rate in effect on the transaction date. Portfolio securities and assets and liabilities denominated in foreign currencies contain risks that those currencies will decline in value relative to the U.S. dollar. Occasionally, events may impact the availability or reliability of foreign exchange rates used to convert the U.S. dollar equivalent value. If such an event occurs, the foreign exchange rate will be valued at fair value using procedures established and approved by the Board.
The Fund does not separately report the effect of changes in foreign exchange rates from changes in market prices on securities held. Such changes are included in net realized and unrealized gain or loss from investments on the Statement of Operations.
Realized foreign exchange gains or losses arise from sales of foreign currencies, currency gains or losses realized between the trade and settlement dates on securities transactions and the difference between the recorded amounts of dividends, interest, and foreign withholding taxes and the U.S. dollar equivalent of the amounts actually received or paid. Net unrealized foreign exchange gains and losses arise from changes in foreign exchange rates on foreign denominated assets and liabilities other than investments in securities held at the end of the reporting period.
c. Joint Repurchase Agreement
The Fund enters into a joint repurchase agreement whereby its uninvested cash balance is deposited into a joint cash account with other funds managed by the investment manager or an affiliate of the investment manager and is used to invest in one or more repurchase agreements. The value and face amount of the joint repurchase agreement are allocated to the funds based on their pro-rata interest. A repurchase agreement is accounted for as a loan by the fund to the seller, collateralized by securities which are delivered to the fund’s custodian. The market value, including accrued interest, of the initial collateralization is required to be at least 102% of the dollar amount invested by the funds, with the value of the underlying securities marked to market daily to maintain coverage of at least 100%. The joint repurchase agreement held by the Fund at period end had been entered into on June 29, 2012.
d. Securities Purchased on a When-Issued Basis
The Fund purchases securities on a when-issued basis, with payment and delivery scheduled for a future date. These transactions are subject to market fluctuations and are subject to the risk that the value at delivery may be more or less than the trade date
FI-27
Franklin Templeton Variable Insurance Products Trust
Notes to Financial Statements (unaudited) (continued)
Franklin Income Securities Fund
1. ORGANIZATION AND SIGNIFICANT ACCOUNTING POLICIES (continued)
d. Securities Purchased on a When-Issued Basis (continued)
purchase price. Although the Fund will generally purchase these securities with the intention of holding the securities, it may sell the securities before the settlement date. Sufficient assets have been segregated for these securities.
e. Equity-Linked Securities
The Fund invests in equity-linked securities. Equity-linked securities are hybrid financial instruments that generally combine both debt and equity characteristics into a single note form. Income received from equity linked securities is recorded as realized gains in the Statement of Operations and may be based on the performance of an underlying equity security, an equity index, or an option position. The risks of investing in equity-linked securities include unfavorable price movements in the underlying security and the credit risk of the issuing financial institution. There may be no guarantee of a return of principal with equity linked securities and the appreciation potential may be limited. Equity-linked securities may be more volatile and less liquid than other investments held by the Fund.
f. Securities Lending
The Fund participates in an agency based securities lending program. The fund receives cash collateral against the loaned securities in an amount equal to at least 102% of the market value of the loaned securities. Collateral is maintained over the life of the loan in an amount not less than 100% of the market value of loaned securities, as determined at the close of fund business each day; any additional collateral required due to changes in security values is delivered to the fund on the next business day. The collateral is invested in a non-registered money fund as indicated on the Statement of Investments. The fund receives income from the investment of cash collateral, in addition to lending fees and rebates paid by the borrower. The fund bears the market risk with respect to the collateral investment, securities loaned, and the risk that the agent may default on its obligations to the fund. The securities lending agent has agreed to indemnify the fund in the event of default by a third party borrower.
g. Senior Floating Rate Interests
The Fund invests in senior secured corporate loans that pay interest at rates which are periodically reset by reference to a base lending rate plus a spread. These base lending rates are generally the prime rate offered by a designated U.S. bank or the London InterBank Offered Rate (LIBOR). Senior secured corporate loans often require prepayment of principal from excess cash flows or at the discretion of the borrower. As a result, actual maturity may be substantially less than the stated maturity.
Senior secured corporate loans in which the Fund invests are generally readily marketable, but may be subject to some restrictions on resale.
h. Income and Deferred Taxes
It is the Fund’s policy to qualify as a regulated investment company under the Internal Revenue Code. The Fund intends to distribute to shareholders substantially all of its taxable income and net realized gains to relieve it from federal income and if applicable, excise taxes. As a result, no provision for U.S. federal income taxes is required.
The Fund may be subject to foreign taxation related to income received, capital gains on the sale of securities and certain foreign currency transactions in the foreign jurisdictions in which it invests. Foreign taxes, if any, are recorded based on the tax regulations and rates that exist in the foreign markets in which the Fund invests. When a capital gain tax is determined to apply the Fund records an estimated deferred tax liability in an amount that would be payable if the securities were disposed of on the valuation date.
FI-28
Franklin Templeton Variable Insurance Products Trust
Notes to Financial Statements (unaudited) (continued)
Franklin Income Securities Fund
1. ORGANIZATION AND SIGNIFICANT ACCOUNTING POLICIES (continued)
h. Income and Deferred Taxes (continued)
The Fund recognizes the tax benefits of uncertain tax positions only when the position is “more likely than not” to be sustained upon examination by the tax authorities based on the technical merits of the tax position. As of June 30, 2012, and for all open tax years, the Fund has determined that no liability for unrecognized tax benefits is required in the Fund’s financial statements related to uncertain tax positions taken on a tax return (or expected to be taken on future tax returns). Open tax years are those that remain subject to examination and are based on each tax jurisdiction statute of limitation.
i. Security Transactions, Investment Income, Expenses and Distributions
Security transactions are accounted for on trade date. Realized gains and losses on security transactions are determined on a specific identification basis. Interest income and estimated expenses are accrued daily. Amortization of premium and accretion of discount on debt securities are included in interest income. Facility fees are recognized as income over the expected term of the loan. Dividend income is recorded on the ex-dividend date except that certain dividends from foreign securities are recognized as soon as the Fund is notified of the ex-dividend date. Distributions to shareholders are recorded on the ex-dividend date and are determined according to income tax regulations (tax basis). Distributable earnings determined on a tax basis may differ from earnings recorded in accordance with accounting principles generally accepted in the United States of America. These differences may be permanent or temporary. Permanent differences are reclassified among capital accounts to reflect their tax character. These reclassifications have no impact on net assets or the results of operations. Temporary differences are not reclassified, as they may reverse in subsequent periods.
Common expenses incurred by the Trust are allocated among the funds based on the ratio of net assets of each fund to the combined net assets of the Trust. Fund specific expenses are charged directly to the fund that incurred the expense.
Realized and unrealized gains and losses and net investment income, not including class specific expenses, are allocated daily to each class of shares based upon the relative proportion of net assets of each class. Differences in per share distributions, by class, are generally due to differences in class specific expenses.
j. Accounting Estimates
The preparation of financial statements in accordance with accounting principles generally accepted in the United States of America requires management to make estimates and assumptions that affect the reported amounts of assets and liabilities at the date of the financial statements and the amounts of income and expenses during the reporting period. Actual results could differ from those estimates.
k. Guarantees and Indemnifications
Under the Trust’s organizational documents, its officers and trustees are indemnified by the Trust against certain liabilities arising out of the performance of their duties to the Trust. Additionally, in the normal course of business, the Trust, on behalf of the Fund, enters into contracts with service providers that contain general indemnification clauses. The Trust’s maximum exposure under these arrangements is unknown as this would involve future claims that may be made against the Trust that have not yet occurred. Currently, the Trust expects the risk of loss to be remote.
FI-29
Franklin Templeton Variable Insurance Products Trust
Notes to Financial Statements (unaudited) (continued)
Franklin Income Securities Fund
2. SHARES OF BENEFICIAL INTEREST
At June 30, 2012, there were an unlimited number of shares authorized (without par value). Transactions in the Fund’s shares were as follows:
| Six Months Ended June 30, 2012 | Year Ended December 31, 2011 | |||||||||||||||
| Class 1 Shares: | Shares | Amount | Shares | Amount | ||||||||||||
Shares sold | 27,538,904 | $ | 411,875,595 | 46,373,672 | $ | 684,944,435 | ||||||||||
Shares issued in reinvestment of distributions | 6,331,185 | 90,282,701 | 6,487,669 | 96,601,395 | ||||||||||||
Shares redeemed | (22,023,892 | ) | (332,874,855 | ) | (59,777,035 | ) | (836,649,169 | ) | ||||||||
| ||||||||||||||||
Net increase (decrease) | 11,846,197 | $ | 169,283,441 | (6,915,694 | ) | $ | (55,103,339 | ) | ||||||||
| ||||||||||||||||
Class 2 Shares: | ||||||||||||||||
Shares sold | 20,484,213 | $ | 302,385,786 | 36,881,385 | $ | 540,163,327 | ||||||||||
Shares issued in reinvestment of distributions | 28,230,391 | 392,684,736 | 24,473,365 | 356,087,463 | ||||||||||||
Shares redeemed | (35,207,233 | ) | (518,021,251 | ) | (74,034,875 | ) | (1,081,911,521 | ) | ||||||||
| ||||||||||||||||
Net increase (decrease) | 13,507,371 | $ | 177,049,271 | (12,680,125 | ) | $ | (185,660,731 | ) | ||||||||
| ||||||||||||||||
Class 4 Shares: | ||||||||||||||||
Shares sold | 1,645,372 | $ | 24,664,850 | 4,165,273 | $ | 62,663,608 | ||||||||||
Shares issued on reinvestment of distributions | 1,982,200 | 28,048,130 | 1,652,948 | 24,430,578 | ||||||||||||
Shares redeemed | (2,703,715 | ) | (40,165,972 | ) | (3,777,871 | ) | (55,498,267 | ) | ||||||||
| ||||||||||||||||
Net increase (decrease) | 923,857 | $ | 12,547,008 | 2,040,350 | $ | 31,595,919 | ||||||||||
| ||||||||||||||||
3. TRANSACTIONS WITH AFFILIATES
Franklin Resources, Inc. is the holding company for various subsidiaries that together are referred to as Franklin Templeton Investments. Certain officers and trustees of the Fund are also officers and/or directors of the following subsidiaries:
| Subsidiary | Affiliation | |
Franklin Advisers, Inc. (Advisers) | Investment manager | |
Franklin Templeton Services, LLC (FT Services) | Administrative manager | |
Franklin Templeton Distributors, Inc. (Distributors) | Principal underwriter | |
Franklin Templeton Investor Services, LLC (Investor Services) | Transfer agent |
a. Management Fees
The Fund pays an investment management fee to Advisers based on the average daily net assets of the Fund as follows:
| Annualized Fee Rate | Net Assets | |
| 0.625% | Up to and including $100 million | |
| 0.500% | Over $100 million, up to and including $250 million | |
| 0.450% | Over $250 million, up to and including $7.5 billion | |
| 0.440% | Over $7.5 billion, up to and including $10 billion | |
| 0.430% | Over $10 billion, up to and including $12.5 billion | |
| 0.420% | Over $12.5 billion, up to and including $15 billion | |
| 0.400% | In excess of $15 billion |
FI-30
Franklin Templeton Variable Insurance Products Trust
Notes to Financial Statements (unaudited) (continued)
Franklin Income Securities Fund
3. TRANSACTIONS WITH AFFILIATES (continued)
b. Administrative Fees
Under an agreement with Advisers, FT Services provides administrative services to the Fund. The fee is paid by Advisers based on average daily net assets, and is not an additional expense of the Fund.
c. Distribution Fees
The Board has adopted distribution plans for Class 2 and Class 4 shares pursuant to Rule 12b-1 under the 1940 Act. Under the Fund’s compensation distribution plans, the Fund pays Distributors for costs incurred in connection with the servicing, sale and distribution of the Fund’s shares up to 0.35% per year of its average daily net assets of each class. The Board has agreed to limit the current rate to 0.25% per year for Class 2.
d. Transfer Agent Fees
Investor Services, under terms of an agreement, performs shareholder servicing for the Fund and is not paid by the Fund for the services.
e. Other Affiliated Transactions
At June 30, 2012, Franklin Templeton Variable Insurance Products Trust – Franklin Templeton VIP Founding Funds Allocation Fund owned 14.79% of the Fund’s outstanding shares.
4. EXPENSE OFFSET ARRANGEMENT
The Fund has entered into an arrangement with its custodian whereby credits realized as a result of uninvested cash balances are used to reduce a portion of the Fund’s custodian expenses. During the period ended June 30, 2012, there were no credits earned.
5. INCOME TAXES
For tax purposes, capital losses may be carried over to offset future capital gains, if any. Capital loss carryforwards with no expiration, if any, must be fully utilized before those losses with expiration dates.
At December 31, 2011, capital loss carryforwards were as follows:
Capital loss carryforwards subject to expiration: | ||||
2016 | $ | 310,696,517 | ||
2017 | 521,405,875 | |||
2018 | 157,561,044 | |||
|
| |||
| $ | 989,663,436 | |||
|
|
At June 30, 2012, the cost of investments and net unrealized appreciation (depreciation) for income tax purposes were as follows:
Cost of investments | $ | 7,899,734,495 | ||
|
| |||
Unrealized appreciation | $ | 806,993,761 | ||
Unrealized depreciation | (871,427,228 | ) | ||
|
| |||
Net unrealized appreciation (depreciation) | $ | (64,433,467 | ) | |
|
| |||
FI-31
Franklin Templeton Variable Insurance Products Trust
Notes to Financial Statements (unaudited) (continued)
Franklin Income Securities Fund
5. INCOME TAXES (continued)
Differences between income and/or capital gains as determined on a book basis and a tax basis are primarily due to differing treatments of defaulted securities, foreign currency transactions, payments-in-kind, bond discounts and premiums, and wash sales.
6. INVESTMENT TRANSACTIONS
Purchases and sales of investments (excluding short term securities) for the period ended June 30, 2012, aggregated $839,295,505 and $1,405,524,417, respectively.
7. CREDIT RISK AND DEFAULTED SECURITIES
At June 30, 2012, the Fund had 45.87% of its portfolio invested in high yield, senior secured floating rate notes, or other securities rated below investment grade. These securities may be more sensitive to economic conditions causing greater price volatility and are potentially subject to a greater risk of loss due to default than higher rated securities.
The Fund held defaulted securities and/or other securities for which the income has been deemed uncollectible. At June 30, 2012, the aggregate value of these securities was $121,584,695, representing 1.53% of the Fund’s net assets. The Fund discontinues accruing income on securities for which income has been deemed uncollectible and provides an estimate for losses on interest receivable. The securities have been identified on the accompanying Statement of Investments.
8. HOLDINGS OF 5% VOTING SECURITIES OF PORTFOLIO COMPANIES
The 1940 Act defines “affiliated companies” to include investments in portfolio companies in which a fund owns 5% or more of the outstanding voting securities. Investments in “affiliated companies” for the Fund for the period ended June 30, 2012, were as shown below.
| Name of Issuer | Number of Shares/Principal Amount Held at Beginning of Period | Gross Additions | Gross Reductions | Number of Shares/Principal Amount Held at End of Period | Value at End of Period | Investment Income | Realized Capital Gain (Loss) | |||||||||||||||||||||
Non-Controlled Affiliates | ||||||||||||||||||||||||||||
aDex Media West LLC, Term | 4,265,968 | — | 428,912 | 3,837,056 | $ | 2,385,371 | $ | 122,839 | $ | 96,150 | ||||||||||||||||||
Dex One Corp. | 2,642,381 | — | — | 2,642,381 | 2,470,626 | — | — | |||||||||||||||||||||
Dex One Corp., senior sub. note, PIK, 14.00%, 1/29/17 | 32,511,674 | 1,137,910 | 19,719,449 | 13,930,135 | 3,354,181 | 1,018,812 | (14,561,896 | ) | ||||||||||||||||||||
|
| |||||||||||||||||||||||||||
Total Affiliated Securities (0.10% of Net Assets) |
| $ | 8,210,178 | $ | 1,141,651 | $ | (14,465,746 | ) | ||||||||||||||||||||
|
| |||||||||||||||||||||||||||
aCompany is a wholly owned subsidiary of Dex One Corp.
9. CREDIT FACILITY
The Fund, together with other U.S. registered and foreign investment funds (collectively, Borrowers), managed by Franklin Templeton Investments, are borrowers in a joint syndicated senior unsecured credit facility totaling $1.5 billion (Global Credit Facility) which matures on January 18, 2013. This Global Credit Facility provides a source of funds to the Borrowers for temporary and emergency purposes, including the ability to meet future unanticipated or unusually large redemption requests.
FI-32
Franklin Templeton Variable Insurance Products Trust
Notes to Financial Statements (unaudited) (continued)
Franklin Income Securities Fund
9. CREDIT FACILITY (continued)
Under the terms of the Global Credit Facility, the Fund shall, in addition to interest charged on any borrowings made by the Fund and other costs incurred by the Fund, pay its share of fees and expenses incurred in connection with the implementation and maintenance of the Global Credit Facility, based upon its relative share of the aggregate net assets of all of the Borrowers, including an annual commitment fee of 0.08% based upon the unused portion of the Global Credit Facility, which is reflected in other expenses on the Statement of Operations. During the period ended June 30, 2012, the Fund did not use the Global Credit Facility.
10. FAIR VALUE MEASUREMENTS
The Fund follows a fair value hierarchy that distinguishes between market data obtained from independent sources (observable inputs) and the Fund’s own market assumptions (unobservable inputs). These inputs are used in determining the value of the Fund’s financial instruments and are summarized in the following fair value hierarchy:
| • | Level 1 – quoted prices in active markets for identical financial instruments |
| • | Level 2 – other significant observable inputs (including quoted prices for similar financial instruments, interest rates, prepayment speed, credit risk, etc.) |
| • | Level 3 – significant unobservable inputs (including the Fund’s own assumptions in determining the fair value of financial instruments) |
The inputs or methodology used for valuing financial instruments are not an indication of the risk associated with investing in those financial instruments.
For movements between the levels within the fair value hierarchy, the Fund has adopted a policy of recognizing the transfers as of the date of the underlying event which caused the movement.
A summary of inputs used as of June 30, 2012, in valuing the Fund’s assets carried at fair value, is as follows:
| Level 1 | Level 2 | Level 3 | Total | |||||||||||||
|
| |||||||||||||||
Assets: | ||||||||||||||||
Investments in Securities: | ||||||||||||||||
Equity Investments:a | ||||||||||||||||
Consumer Discretionary | $ | 70,668,959 | $ | 8,759,948 | $ | — | $ | 79,428,907 | ||||||||
Energy | 447,277,736 | 14,688,240 | — | 461,965,976 | ||||||||||||
Financials | 580,276,239 | 103,398,484 | — | 683,674,723 | ||||||||||||
All Other Equity Investmentsb | 1,955,271,606 | — | — | 1,955,271,606 | ||||||||||||
Equity-Linked Securities | — | 67,164,490 | — | 67,164,490 | ||||||||||||
Convertible Bonds | — | 34,281,825 | — | 34,281,825 | ||||||||||||
Corporate Bonds | — | 3,153,052,064 | — | 3,153,052,064 | ||||||||||||
Senior Floating Rate Interests | — | 567,622,866 | — | 567,622,866 | ||||||||||||
Asset-Backed Securities and Commercial Mortgage-Backed Securities | — | 35,482,813 | — | 35,482,813 | ||||||||||||
Short Term Investments | — | 797,355,758 | — | 797,355,758 | ||||||||||||
|
| |||||||||||||||
Total Investments in Securities | $ | 3,053,494,540 | $ | 4,781,806,488 | $ | — | $ | 7,835,301,028 | ||||||||
|
| |||||||||||||||
aIncludes common, preferred, and convertible preferred stocks as well as other equity investments.
bFor detailed categories, see the accompanying Statement of Investments.
FI-33
Franklin Templeton Variable Insurance Products Trust
Notes to Financial Statements (unaudited) (continued)
Franklin Income Securities Fund
11. NEW ACCOUNTING PRONOUNCEMENTS
In December 2011, the Financial Accounting Standards Board (FASB) issued Accounting Standards Update (ASU) No. 2011-11, Balance Sheet (Topic 210): Disclosures about Offsetting Assets and Liabilities. The amendments in the ASU enhance disclosures about offsetting of financial assets and liabilities to enable investors to understand the effect of these arrangements on a fund’s financial position. The ASU is effective for interim and annual reporting periods beginning on or after January 1, 2013. The Fund believes the adoption of this ASU will not have a material impact on its financial statements.
12. SUBSEQUENT EVENTS
The Fund has evaluated subsequent events through the issuance of the financial statements and determined that no events have occurred that require disclosure.
ABBREVIATIONS | ||||
| Currency | Selected Portfolio | |||
| EUR - Euro | ADR - American Depositary Receipt | |||
| GBP - British Pound | FHLB - Federal Home Loan Bank | |||
| FRN - Floating Rate Note | ||||
| L/C - Letter of Credit | ||||
| MTN - Medium Term Note | ||||
| PIK - Payment-In-Kind |
FI-34
FRANKLIN RISING DIVIDENDS SECURITIES FUND
This semiannual report for Franklin Rising Dividends Securities Fund covers the period ended June 30, 2012.
Performance Summary as of 6/30/12
Franklin Rising Dividends Securities Fund – Class 4 delivered a +4.39% total return for the six-month period ended 6/30/12.
Performance reflects the Fund’s Class 4 operating expenses, but does not include any contract fees, expenses or sales charges. If they had been included, performance would be lower. These charges and deductions, particularly for variable life policies, can have a significant effect on contract values and insurance benefits. See the contract prospectus for a complete description of these expenses, including sales charges.
Franklin Rising Dividends Securities Fund – Class 4
Performance data represent past performance, which does not guarantee future results. Investment return and principal value will fluctuate, and you may have a gain or loss when you sell your shares. Current performance may differ from figures shown.
FRD-1
Fund Goal and Main Investments: Franklin Rising Dividends Securities Fund seeks long-term capital appreciation, with preservation of capital as an important consideration. Under normal market conditions, the Fund invests at least 80% of its net assets in investments of companies that have paid rising dividends.
Performance Overview
You can find the Fund’s six-month total return in the Performance Summary. The Fund underperformed its benchmark, the Standard & Poor’s® 500 Index (S&P 500®), which rose 9.49% for the same period.1 Please note the Fund employs a bottom-up stock selection process, and the managers invest in securities without regard to benchmark comparisons.
Economic and Market Overview
The U.S. economy, as measured by gross domestic product, grew modestly during the six-month period ended June 30, 2012. In the first quarter, personal income and spending rose, while federal, state and local government spending declined. The national unemployment rate for June 2012 stood at 8.2%, compared with 8.5% at the start of the period.2 Jobless claims touched a four-year low in February amid robust job creation; however, hiring slowed during the remainder of the period and jobless claims at period-end reached January’s level. Industrial production and manufacturing activity continued to increase, but the manufacturing sector shrank unexpectedly in June. Although gasoline prices hit a peak in early April, they plunged to a five-month low near period-end due to lower crude oil prices. In keeping with its goal to strengthen U.S. economic recovery by fostering increased employment while keeping inflation in check, during June the Federal Reserve Board (Fed) extended through 2012 its program (dubbed Operation Twist) to buy long-term Treasuries in an attempt to lower long-term yields. The Fed also reaffirmed its intention to keep the federal funds target rate low at least through late 2014.
During late March and early April 2012, improved economic reports helped U.S. stock markets reach multi-year highs. The Dow Jones Industrial Average exceeded 13,000 and the S&P 500 topped 1,400 for the first time since 2008, while the NASDAQ Composite Index hit an
1. Source: © 2012 Morningstar. One cannot invest directly in an index, and an index is not representative of the Fund’s portfolio. Please see Index Descriptions following the Fund Summaries.
2. Source: Bureau of Labor Statistics.
Fund Risks: All investments involve risks, including possible loss of principal. Stock prices fluctuate, sometimes rapidly and dramatically, due to factors affecting individual companies, particular industries or sectors, or general market conditions. Value securities may not increase in price as anticipated, or may decline further in value. While smaller and midsized companies may offer substantial opportunities for capital growth, they also involve heightened risks and should be considered speculative. Historically, smaller- and midsized-company securities have been more volatile in price than larger company securities, especially over the short term. Smaller companies often have relatively small revenues, limited product lines and a small market share. The Fund is actively managed but there is no guarantee that the manager’s investment decisions will produce the desired results. The Fund’s prospectus also includes a description of the main investment risks.
FRD-2
11-year high.3 Global markets grew volatile, however, amid renewed concerns about eurozone debt and slowing global economic growth. Fears of a Greek debt default and exit from the eurozone were somewhat mitigated by secured bailout financing and bondholder concessions in February, as well as elections in May and June that resulted in the formation of a new coalition government. Risk-averse investors seeking safety drove U.S. Treasury yields to historical lows during the period.
At the end of the reporting period, significant challenges to the U.S. economy remained, including weak jobs reports, lack of broad public and political agreement on how to achieve U.S. deficit reduction, and uncertainty surrounding deeply indebted European countries including Greece, Italy and Spain. Signs of China’s economic growth slowdown further contributed to pessimism. Although long-term resolution of European debt issues remained unclear, the European Central Bank’s latest plan to allow the European Stability Mechanism to directly recapitalize troubled banks throughout the eurozone, as well as a late-June proposal leaning toward fiscal and banking union, supported cautious optimism in U.S. and global markets.
Investment Strategy
We are a research-driven, fundamental investment adviser, pursuing a disciplined value-oriented strategy. As bottom-up investors concentrating primarily on individual securities, we seek fundamentally sound companies that we believe meet our screening criteria, which include consistent, substantial dividend increases; reinvested earnings; and strong balance sheets. We attempt to acquire such stocks at attractive prices, often when they are out of favor with other investors. In following these criteria, we do not necessarily focus on companies whose securities pay a high dividend but rather on companies that consistently raise their dividends.
Manager’s Discussion
During the six months under review, three holdings that helped absolute Fund performance were West Pharmaceutical Services, Wal-Mart Stores and Abbott Laboratories. The stock price of West Pharmaceutical Services, a manufacturer of delivery system components for injection drugs and other health care products, increased after a favorable first-quarter earnings report showed higher sales and earnings per share compared with last year’s first-quarter results. West Pharmaceutical
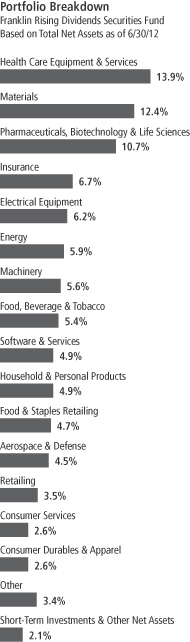
FRD-3
3. Please see Index Descriptions following the Fund Summaries.
Services has raised its dividend for the past 19 years. General merchandise discount retailer Wal-Mart’s shares appreciated after better-than-expected domestic comparable store sales in the first quarter of 2012. Wal-Mart has had 38 consecutive years of dividend increases. Investors placed a higher valuation on diversified health care products manufacturer Abbott Laboratories prior to its expected split into two separate companies in late 2012. Abbott has increased its dividend for the 40th year in a row.
Detractors from performance included Procter & Gamble, Hillenbrand and Dover. Shares of household products manufacturer and marketer Procter & Gamble declined after it provided the lowest quarterly earnings guidance in over 10 years based on falling demand in Europe and China as well as unfavorable foreign exchange rates. The stock price of casket and memorialization products manufacturer Hillenbrand decreased after lower earnings estimates based on generally improved life expectancy and a growing preference for cremation. Dover, a manufacturer of equipment and industrial products, suffered largely from concern that its sales growth would slow as the economic cycle matured.
During the period, we initiated new positions in publisher John Wiley & Sons (19 years of consecutive dividend increases) and oil and gas exploration and production company Occidental Petroleum (10 years). We made significant additions to holdings of large integrated energy company Chevron (25 years), integrated energy company Exxon Mobil (30 years), health care products manufacturer Johnson & Johnson (50 years), therapeutic and diagnostics products manufacturer Medtronic (35 years) and water and electronic end markets manufacturer Pentair (36 years) and made smaller additions to 10 other positions. We liquidated our positions in Hudson City Bancorp, People’s Bancorp, Trustco Bank and U.S. Bancorp during the period. We also reduced our positions in Abbott Laboratories, Old Republic International, State Street and Wal-Mart Stores and made smaller reductions in other holdings.
Our 10 largest positions on June 30, 2012, represented 44.2% of the Fund’s total net assets. It is interesting to note how these 10 companies would respond, in aggregate, to the Fund’s screening criteria based on a simple average of statistical measures. On average, these 10 companies have raised their dividends 31 years in a row and by 300% in the past 10 years. Their most recent year-over-year dividend increases averaged 12.4% with a yield of 2.3% on June 30, 2012, and a dividend payout
Top 10 Holdings
Franklin Rising Dividends Securities Fund 6/30/12
| Company Sector/Industry | % of Total Net Assets | |||
| International Business Machines Corp. | 4.9% | |||
| Software & Services | ||||
| Praxair Inc. | 4.9% | |||
| Materials | ||||
| Abbott Laboratories | 4.8% | |||
| Pharmaceuticals, Biotechnology & Life Sciences | ||||
| Roper Industries Inc. | 4.7% | |||
| Electrical Equipment | ||||
| Wal-Mart Stores Inc. | 4.7% | |||
| Food & Staples Retailing | ||||
| United Technologies Corp. | 4.3% | |||
| Aerospace & Defense | ||||
| The Procter & Gamble Co. | 4.3% | |||
| Household & Personal Products | ||||
| Becton, Dickinson and Co. | 4.3% | |||
| Health Care Equipment & Services | ||||
| Chevron Corp. | 3.8% | |||
| Energy | ||||
| Family Dollar Stores Inc. | 3.5% | |||
| Retailing | ||||
The dollar value, number of shares or principal amount, and names of all portfolio holdings are listed in the Fund’s Statement of Investments.
FRD-4
ratio of 32.3%, based on estimates of calendar year 2012 operating earnings. The average price/earnings ratio was 14.7 times calendar year 2012 estimates versus 13.1 for that of the unmanaged S&P 500.
Thank you for your participation in Franklin Rising Dividends Securities Fund. We look forward to serving your future investment needs.
The foregoing information reflects our analysis, opinions and portfolio holdings as of June 30, 2012, the end of the reporting period. The way we implement our main investment strategies and the resulting portfolio holdings may change depending on factors such as market and economic conditions. These opinions may not be relied upon as investment advice or an offer for a particular security. The information is not a complete analysis of every aspect of any market, country, industry, security or the Fund. Statements of fact are from sources considered reliable, but the investment manager makes no representation or warranty as to their completeness or accuracy. Although historical performance is no guarantee of future results, these insights may help you understand our investment management philosophy.
FRD-5
Fund Expenses
As an investor in a variable insurance contract (Contract) that indirectly provides for investment in an underlying mutual fund, you can incur transaction and/or ongoing expenses at both the Fund level and the Contract level.
| • | Transaction expenses can include sales charges (loads) on purchases, surrender fees, transfer fees and premium taxes. |
| • | Ongoing expenses can include management fees, distribution and service (12b-1) fees, contract fees, annual maintenance fees, mortality and expense risk fees and other fees and expenses. All mutual funds and Contracts have some types of ongoing expenses. |
The expenses shown in the table are meant to highlight ongoing expenses at the Fund level only and do not include ongoing expenses at the Contract level, or transaction expenses at either the Fund or Contract levels. While the Fund does not have transaction expenses, if the transaction and ongoing expenses at the Contract level were included, the expenses shown below would be higher. You should consult your Contract prospectus or disclosure document for more information.
The table shows Fund-level ongoing expenses and can help you understand these expenses and compare them with those of other mutual funds offered through the Contract. The table assumes a $1,000 investment held for the six months indicated. Please refer to the Fund prospectus for additional information on operating expenses.
Actual Fund Expenses
The first line (Actual) of the table provides actual account values and expenses. The “Ending Account Value” is derived from the Fund’s actual return, which includes the effect of ongoing Fund expenses, but does not include the effect of ongoing Contract expenses.
You can estimate the Fund-level expenses you incurred during the period by following these steps. Of course, your account value and expenses will differ from those in this illustration:
| 1. | Divide your account value by $1,000. |
If an account had an $8,600 value, then $8,600 ÷ $1,000 = 8.6.
| 2. | Multiply the result by the number under the heading “Fund-Level Expenses Incurred During Period.” |
If Fund-Level Expenses Incurred During Period were $7.50, then 8.6 x $7.50 = $64.50.
In this illustration, the estimated expenses incurred this period at the Fund level are $64.50.
Franklin Rising Dividends Securities Fund – Class 4
FRD-6
Hypothetical Example for Comparison with Other Mutual Funds
Information in the second line (Hypothetical) of the table can help you compare ongoing expenses of the Fund with those of other mutual funds offered through the Contract. This information may not be used to estimate the actual ending account balance or expenses you incurred during the period. The hypothetical “Ending Account Value” is based on the Fund’s actual expense ratio and an assumed 5% annual rate of return before expenses, which does not represent the Fund’s actual return. The figure under the heading “Fund-Level Expenses Incurred During Period” shows the hypothetical expenses your account would have incurred under this scenario. You can compare this figure with the 5% hypothetical examples that appear in shareholder reports of other funds offered through a Contract.
| Class 4 | Beginning Account Value 1/1/12 | Ending Account Value 6/30/12 | Fund-Level Expenses Incurred During Period* 1/1/12–6/30/12 | |||||||||
Actual | $ | 1,000 | $ | 1,043.90 | $ | 4.98 | ||||||
Hypothetical (5% return before expenses) | $ | 1,000 | $ | 1,019.99 | $ | 4.92 | ||||||
*Expenses are calculated using the most recent six-month annualized expense ratio for the Fund’s Class 4 shares (0.98%), which does not include any ongoing expenses of the Contract for which the Fund is an investment option, multiplied by the average account value over the period, multiplied by 182/366 to reflect the one-half year period.
FRD-7
Franklin Templeton Variable Insurance Products Trust
Financial Highlights
Franklin Rising Dividends Securities Fund
Six Months (unaudited) | Year Ended December 31, | |||||||||||||||||||||||
| Class 1 | 2011 | 2010 | 2009 | 2008 | 2007 | |||||||||||||||||||
| ||||||||||||||||||||||||
Per share operating performance | ||||||||||||||||||||||||
(for a share outstanding throughout the period) | ||||||||||||||||||||||||
Net asset value, beginning of period | $ | 20.01 | $ | 19.15 | $ | 16.13 | $ | 13.96 | $ | 19.61 | $ | 20.88 | ||||||||||||
|
| |||||||||||||||||||||||
Income from investment operationsa: | ||||||||||||||||||||||||
Net investment incomeb | 0.18 | 0.36 | 0.32 | 0.14 | c | 0.35 | 0.36 | |||||||||||||||||
Net realized and unrealized gains (losses) | 0.74 | 0.83 | 3.01 | 2.28 | (5.51 | ) | (0.80 | ) | ||||||||||||||||
|
| |||||||||||||||||||||||
Total from investment operations | 0.92 | 1.19 | 3.33 | 2.42 | (5.16 | ) | (0.44 | ) | ||||||||||||||||
|
| |||||||||||||||||||||||
Less distributions from: | ||||||||||||||||||||||||
Net investment income | (0.39 | ) | (0.33 | ) | (0.31 | ) | (0.25 | ) | (0.36 | ) | (0.53 | ) | ||||||||||||
Net realized gains | — | — | — | — | (0.13 | ) | (0.30 | ) | ||||||||||||||||
|
| |||||||||||||||||||||||
Total distributions | (0.39 | ) | (0.33 | ) | (0.31 | ) | (0.25 | ) | (0.49 | ) | (0.83 | ) | ||||||||||||
|
| |||||||||||||||||||||||
Net asset value, end of period | $ | 20.54 | $ | 20.01 | $ | 19.15 | $ | 16.13 | $ | 13.96 | $ | 19.61 | ||||||||||||
|
| |||||||||||||||||||||||
Total returnd | 4.59% | 6.29% | 20.94% | 17.67% | (26.94)% | (2.41)% | ||||||||||||||||||
Ratios to average net assetse | ||||||||||||||||||||||||
Expenses | 0.63% | 0.63% | 0.64% | 0.65% | f | 0.61% | f | 0.59% | f | |||||||||||||||
Net investment income | 1.74% | 1.87% | 1.88% | 0.99% | c | 2.05% | 1.72% | |||||||||||||||||
Supplemental data | ||||||||||||||||||||||||
Net assets, end of period (000’s) | $ | 138,525 | $ | 140,297 | $ | 148,544 | $ | 139,816 | $ | 142,862 | $ | 235,946 | ||||||||||||
Portfolio turnover rate | 5.74% | 12.76% | 8.97% | 16.99% | 5.39% | 3.29% | ||||||||||||||||||
aThe amount shown for a share outstanding throughout the period may not correlate with the Statement of Operations for the period due to the timing of sales and repurchases of the Fund shares in relation to income earned and/or fluctuating market value of the investments of the Fund.
bBased on average daily shares outstanding.
cNet investment income per share includes approximately $(0.15) per share as a return of capital adjustment to a previously recorded special dividend received by the Fund. Excluding this non-recurring amount, the ratio of net investment income to average net assets would have been 2.07%. See Note 1(c).
dTotal return does not include fees, charges or expenses imposed by the variable annuity and life insurance contracts for which the Franklin Templeton Variable Insurance Products Trust serves as an underlying investment vehicle. Total return is not annualized for periods less than one year.
eRatios are annualized for periods less than one year.
fBenefit of expense reduction rounds to less than 0.01%.
The accompanying notes are an integral part of these financial statements.
FRD-8
Franklin Templeton Variable Insurance Products Trust
Financial Highlights (continued)
Franklin Rising Dividends Securities Fund
Six Months (unaudited) | Year Ended December 31, | |||||||||||||||||||||||
| Class 2 | 2011 | 2010 | 2009 | 2008 | 2007 | |||||||||||||||||||
| ||||||||||||||||||||||||
Per share operating performance | ||||||||||||||||||||||||
(for a share outstanding throughout the period) | ||||||||||||||||||||||||
Net asset value, beginning of period | $ | 19.65 | $ | 18.82 | $ | 15.86 | $ | 13.72 | $ | 19.27 | $ | 20.55 | ||||||||||||
|
| |||||||||||||||||||||||
Income from investment operationsa: | ||||||||||||||||||||||||
Net investment incomeb | 0.15 | 0.31 | 0.28 | 0.10 | c | 0.31 | 0.30 | |||||||||||||||||
Net realized and unrealized gains (losses) | 0.73 | 0.81 | 2.95 | 2.24 | (5.42 | ) | (0.79 | ) | ||||||||||||||||
|
| |||||||||||||||||||||||
Total from investment operations | 0.88 | 1.12 | 3.23 | 2.34 | (5.11 | ) | (0.49 | ) | ||||||||||||||||
|
| |||||||||||||||||||||||
Less distributions from: | ||||||||||||||||||||||||
Net investment income | (0.34 | ) | (0.29 | ) | (0.27 | ) | (0.20 | ) | (0.31 | ) | (0.49 | ) | ||||||||||||
Net realized gains | — | — | — | — | (0.13 | ) | (0.30 | ) | ||||||||||||||||
|
| |||||||||||||||||||||||
Total distributions | (0.34 | ) | (0.29 | ) | (0.27 | ) | (0.20 | ) | (0.44 | ) | (0.79 | ) | ||||||||||||
|
| |||||||||||||||||||||||
Net asset value, end of period | $ | 20.19 | $ | 19.65 | $ | 18.82 | $ | 15.86 | $ | 13.72 | $ | 19.27 | ||||||||||||
|
| |||||||||||||||||||||||
Total returnd | 4.46% | 6.00% | 20.64% | 17.34% | (27.10)% | (2.69)% | ||||||||||||||||||
Ratios to average net assetse | ||||||||||||||||||||||||
Expenses | 0.88% | 0.88% | 0.89% | 0.90% | f | 0.86% | f | 0.84% | f | |||||||||||||||
Net investment income | 1.49% | 1.62% | 1.63% | 0.74% | c | 1.80% | 1.47% | |||||||||||||||||
Supplemental data | ||||||||||||||||||||||||
Net assets, end of period (000’s) | $ | 1,522,994 | $ | 1,523,396 | $ | 1,572,732 | $ | 1,371,351 | $ | 1,286,878 | $ | 2,079,366 | ||||||||||||
Portfolio turnover rate | 5.74% | 12.76% | 8.97% | 16.99% | 5.39% | 3.29% | ||||||||||||||||||
aThe amount shown for a share outstanding throughout the period may not correlate with the Statement of Operations for the period due to the timing of sales and repurchases of the Fund shares in relation to income earned and/or fluctuating market value of the investments of the Fund.
bBased on average daily shares outstanding.
cNet investment income per share includes approximately $(0.15) per share as a return of capital adjustment to a previously recorded special dividend received by the Fund. Excluding this non-recurring amount, the ratio of net investment income to average net assets would have been 1.82%. See Note 1(c).
dTotal return does not include fees, charges or expenses imposed by the variable annuity and life insurance contracts for which the Franklin Templeton Variable Insurance Products Trust serves as an underlying investment vehicle. Total return is not annualized for periods less than one year.
eRatios are annualized for periods less than one year.
fBenefit of expense reduction rounds to less than 0.01%.
The accompanying notes are an integral part of these financial statements.
FRD-9
Franklin Templeton Variable Insurance Products Trust
Financial Highlights (continued)
Franklin Rising Dividends Securities Fund
Six Months (unaudited) | Year Ended December 31, | |||||||||||||||||||
| Class 4 | 2011 | 2010 | 2009 | 2008a | ||||||||||||||||
| ||||||||||||||||||||
Per share operating performance | ||||||||||||||||||||
(for a share outstanding throughout the period) | ||||||||||||||||||||
Net asset value, beginning of period | $ | 19.83 | $ | 19.04 | $ | 16.09 | $ | 13.92 | $ | 18.51 | ||||||||||
|
| |||||||||||||||||||
Income from investment operationsb: | ||||||||||||||||||||
Net investment incomec | 0.14 | 0.31 | 0.32 | 0.13 | d | 0.26 | ||||||||||||||
Net realized and unrealized gains (losses) | 0.73 | 0.80 | 2.94 | 2.24 | (4.36 | ) | ||||||||||||||
|
| |||||||||||||||||||
Total from investment operations | 0.87 | 1.11 | 3.26 | 2.37 | (4.10 | ) | ||||||||||||||
|
| |||||||||||||||||||
Less distributions from: | ||||||||||||||||||||
Net investment income | (0.36 | ) | (0.32 | ) | (0.31 | ) | (0.20 | ) | (0.36 | ) | ||||||||||
Net realized gains | — | — | — | — | (0.13 | ) | ||||||||||||||
|
| |||||||||||||||||||
Total distributions | (0.36 | ) | (0.32 | ) | (0.31 | ) | (0.20 | ) | (0.49 | ) | ||||||||||
|
| |||||||||||||||||||
Net asset value, end of period | $ | 20.34 | $ | 19.83 | $ | 19.04 | $ | 16.09 | $ | 13.92 | ||||||||||
|
| |||||||||||||||||||
Total returne | 4.39% | 5.89% | 20.62% | 17.22% | (22.82)% | |||||||||||||||
Ratios to average net assetsf | ||||||||||||||||||||
Expenses | 0.98% | 0.98% | 0.99% | 1.00% | g | 0.96% | g | |||||||||||||
Net investment income | 1.39% | 1.52% | 1.53% | 0.64% | d | 1.70% | ||||||||||||||
Supplemental data | ||||||||||||||||||||
Net assets, end of period (000’s) | $ | 5,053 | $ | 3,020 | $ | 1,007 | $ | 15 | $ | 4 | ||||||||||
Portfolio turnover rate | 5.74% | 12.76% | 8.97% | 16.99% | 5.39% | |||||||||||||||
aFor the period February 29, 2008 (effective date) to December 31, 2008.
bThe amount shown for a share outstanding throughout the period may not correlate with the Statement of Operations for the period due to the timing of sales and repurchases of the Fund shares in relation to income earned and/or fluctuating market value of the investments of the Fund.
cBased on average daily shares outstanding.
dNet investment income per share includes approximately $(0.15) per share as a return of capital adjustment to a previously recorded special dividend received by the Fund. Excluding this non-recurring amount, the ratio of net investment income to average net assets would have been 1.72%. See Note 1(c).
eTotal return does not include fees, charges or expenses imposed by the variable annuity and life insurance contracts for which the Franklin Templeton Variable Insurance Products Trust serves as an underlying investment vehicle. Total return is not annualized for periods less than one year.
fRatios are annualized for periods less than one year.
gBenefit of expense reduction rounds to less than 0.01%.
The accompanying notes are an integral part of these financial statements.
FRD-10
Franklin Templeton Variable Insurance Products Trust
Statement of Investments, June 30, 2012 (unaudited)
| Franklin Rising Dividends Securities Fund | Shares | Value | ||||||
Common Stocks 97.9% | ||||||||
Aerospace & Defense 4.5% | ||||||||
General Dynamics Corp. | 38,000 | $ | 2,506,480 | |||||
United Technologies Corp. | 951,400 | 71,859,242 | ||||||
|
| |||||||
| 74,365,722 | ||||||||
|
| |||||||
Automobiles & Components 0.9% | ||||||||
Johnson Controls Inc. | 529,500 | 14,672,445 | ||||||
|
| |||||||
Commercial & Professional Services 1.7% | ||||||||
ABM Industries Inc. | 951,288 | 18,607,193 | ||||||
Cintas Corp. | 267,700 | 10,335,897 | ||||||
|
| |||||||
| 28,943,090 | ||||||||
|
| |||||||
Consumer Durables & Apparel 2.6% | ||||||||
aKid Brands Inc. | 265,947 | 531,894 | ||||||
Leggett & Platt Inc. | 711,800 | 15,040,334 | ||||||
NIKE Inc., B | 277,000 | 24,315,060 | ||||||
Superior Uniform Group Inc. | 237,100 | 2,904,475 | ||||||
|
| |||||||
| 42,791,763 | ||||||||
|
| |||||||
Consumer Services 2.6% | ||||||||
Hillenbrand Inc. | 1,191,300 | 21,896,094 | ||||||
Matthews International Corp., A | 39,000 | 1,267,110 | ||||||
McDonald’s Corp. | 234,345 | 20,746,563 | ||||||
|
| |||||||
| 43,909,767 | ||||||||
|
| |||||||
Diversified Financials 0.4% | ||||||||
State Street Corp. | 128,500 | 5,736,240 | ||||||
|
| |||||||
Electrical Equipment 6.2% | ||||||||
Brady Corp., A | 889,579 | 24,472,318 | ||||||
Roper Industries Inc. | 799,250 | 78,790,065 | ||||||
|
| |||||||
| 103,262,383 | ||||||||
|
| |||||||
Energy 5.9% | ||||||||
Chevron Corp. | 601,000 | 63,405,500 | ||||||
Exxon Mobil Corp. | 330,500 | 28,280,885 | ||||||
Occidental Petroleum Corp. | 69,790 | 5,985,888 | ||||||
|
| |||||||
| 97,672,273 | ||||||||
|
| |||||||
Food & Staples Retailing 4.7% | ||||||||
Wal-Mart Stores Inc. | 1,125,100 | 78,441,972 | ||||||
|
| |||||||
Food, Beverage & Tobacco 5.4% | ||||||||
Archer-Daniels-Midland Co. | 516,000 | 15,232,320 | ||||||
McCormick & Co. Inc. | 792,000 | 48,034,800 | ||||||
PepsiCo Inc. | 363,900 | 25,713,174 | ||||||
|
| |||||||
| 88,980,294 | ||||||||
|
| |||||||
Health Care Equipment & Services 13.9% | ||||||||
Becton, Dickinson and Co. | 949,143 | 70,948,439 | ||||||
Hill-Rom Holdings Inc. | 375,103 | 11,571,928 | ||||||
Medtronic Inc. | 730,000 | 28,272,900 | ||||||
Stryker Corp. | 630,400 | 34,735,040 | ||||||
Teleflex Inc. | 506,753 | 30,866,325 | ||||||
West Pharmaceutical Services Inc. | 1,087,600 | 54,912,924 | ||||||
|
| |||||||
| 231,307,556 | ||||||||
|
| |||||||
FRD-11
Franklin Templeton Variable Insurance Products Trust
Statement of Investments, June 30, 2012 (unaudited) (continued)
| Franklin Rising Dividends Securities Fund | Shares | Value | ||||||
Common Stocks (continued) | ||||||||
Household & Personal Products 4.9% | ||||||||
Colgate-Palmolive Co. | 95,500 | $ | 9,941,550 | |||||
The Procter & Gamble Co. | 1,171,600 | 71,760,500 | ||||||
|
| |||||||
| 81,702,050 | ||||||||
|
| |||||||
Industrial Conglomerates 0.3% | ||||||||
Carlisle Cos. Inc. | 96,261 | 5,103,758 | ||||||
|
| |||||||
Insurance 6.7% | ||||||||
Aflac Inc. | 309,200 | 13,168,828 | ||||||
Arthur J. Gallagher & Co. | 753,000 | 26,407,710 | ||||||
The Chubb Corp. | 45,000 | 3,276,900 | ||||||
Erie Indemnity Co., A | 613,585 | 43,938,822 | ||||||
Mercury General Corp. | 154,200 | 6,425,514 | ||||||
Old Republic International Corp. | 1,069,708 | 8,867,880 | ||||||
RLI Corp. | 147,571 | 10,064,342 | ||||||
|
| |||||||
| 112,149,996 | ||||||||
|
| |||||||
Machinery 5.6% | ||||||||
Donaldson Co. Inc. | 350,068 | 11,681,769 | ||||||
Dover Corp. | 1,096,700 | 58,794,087 | ||||||
Pentair Inc. | 593,000 | 22,700,040 | ||||||
|
| |||||||
| 93,175,896 | ||||||||
|
| |||||||
Materials 12.4% | ||||||||
Air Products and Chemicals Inc. | 559,700 | 45,184,581 | ||||||
Albemarle Corp. | 435,000 | 25,943,400 | ||||||
Bemis Co. Inc. | 986,200 | 30,907,508 | ||||||
Ecolab Inc. | 66,000 | 4,522,980 | ||||||
Nucor Corp. | 499,002 | 18,912,176 | ||||||
Praxair Inc. | 746,260 | 81,140,850 | ||||||
|
| |||||||
| 206,611,495 | ||||||||
|
| |||||||
Media 0.1% | ||||||||
John Wiley & Sons Inc., A | 37,000 | 1,812,630 | ||||||
|
| |||||||
Pharmaceuticals, Biotechnology & Life Sciences 10.7% | ||||||||
Abbott Laboratories | 1,239,800 | 79,929,906 | ||||||
Johnson & Johnson | 726,100 | 49,055,316 | ||||||
Pfizer Inc. | 2,158,100 | 49,636,300 | ||||||
|
| |||||||
| 178,621,522 | ||||||||
|
| |||||||
Retailing 3.5% | ||||||||
Family Dollar Stores Inc. | 886,335 | 58,923,551 | ||||||
|
| |||||||
Semiconductors & Semiconductor Equipment 0.0%† | ||||||||
Cohu Inc. | 50,300 | 511,048 | ||||||
|
| |||||||
Software & Services 4.9% | ||||||||
International Business Machines Corp. | 419,500 | 82,045,810 | ||||||
|
| |||||||
Total Common Stocks (Cost $1,115,472,033) | 1,630,741,261 | |||||||
|
| |||||||
FRD-12
Franklin Templeton Variable Insurance Products Trust
Statement of Investments, June 30, 2012 (unaudited) (continued)
| Franklin Rising Dividends Securities Fund | Shares | Value | ||||||
Short Term Investments (Cost $33,929,710) 2.0% | ||||||||
Money Market Funds 2.0% | ||||||||
a,bInstitutional Fiduciary Trust Money Market Portfolio | 33,929,710 | $ | 33,929,710 | |||||
|
| |||||||
Total Investments (Cost $1,149,401,743) 99.9% | 1,664,670,971 | |||||||
Other Assets, less Liabilities 0.1% | 1,900,640 | |||||||
|
| |||||||
Net Assets 100.0% | $ | 1,666,571,611 | ||||||
|
| |||||||
†Rounds to less than 0.1% of net assets.
aNon-income producing.
bSee Note 7 regarding investments in the Institutional Fiduciary Trust Money Market Portfolio.
The accompanying notes are an integral part of these financial statements.
FRD-13
Franklin Templeton Variable Insurance Products Trust
Financial Statements
Statement of Assets and Liabilities
June 30, 2012 (unaudited)
| Franklin Rising Dividends Securities Fund | ||||
Assets: | ||||
Investments in securities: | ||||
Cost - Unaffiliated issuers | $ | 1,115,472,033 | ||
Cost - Sweep Money Fund (Note 7) | 33,929,710 | |||
|
| |||
Total cost of investments | $ | 1,149,401,743 | ||
|
| |||
Value - Unaffiliated issuers | $ | 1,630,741,261 | ||
Value - Sweep Money Fund (Note 7) | 33,929,710 | |||
|
| |||
Total value of investments | 1,664,670,971 | |||
Receivables: | ||||
Investment securities sold | 6,039,812 | |||
Capital shares sold | 189,445 | |||
Dividends | 1,642,616 | |||
Other assets | 423 | |||
|
| |||
Total assets | 1,672,543,267 | |||
|
| |||
Liabilities: | ||||
Payables: | ||||
Investment securities purchased | 2,426,499 | |||
Capital shares redeemed | 1,745,686 | |||
Affiliates | 1,461,857 | |||
Accrued expenses and other liabilities | 337,614 | |||
|
| |||
Total liabilities | 5,971,656 | |||
|
| |||
Net assets, at value | $ | 1,666,571,611 | ||
|
| |||
Net assets consist of: | ||||
Paid-in capital | $ | 1,262,405,996 | ||
Undistributed net investment income | 12,798,936 | |||
Net unrealized appreciation (depreciation) | 515,269,228 | |||
Accumulated net realized gain (loss) | (123,902,549 | ) | ||
|
| |||
Net assets, at value | $ | 1,666,571,611 | ||
|
| |||
Class 1: | ||||
Net assets, at value | $ | 138,524,624 | ||
|
| |||
Shares outstanding | 6,745,382 | |||
|
| |||
Net asset value and maximum offering price per share | $ | 20.54 | ||
|
| |||
Class 2: | ||||
Net assets, at value | $ | 1,522,994,113 | ||
|
| |||
Shares outstanding | 75,420,118 | |||
|
| |||
Net asset value and maximum offering price per share | $ | 20.19 | ||
|
| |||
Class 4: | ||||
Net assets, at value | $ | 5,052,874 | ||
|
| |||
Shares outstanding | 248,435 | |||
|
| |||
Net asset value and maximum offering price per share | $ | 20.34 | ||
|
| |||
The accompanying notes are an integral part of these financial statements.
FRD-14
Franklin Templeton Variable Insurance Products Trust
Financial Statements (continued)
Statement of Operations
for the six months ended June 30, 2012 (unaudited)
| Franklin Rising Dividends Securities Fund | ||||
Investment income: | ||||
Dividends | $ | 20,076,533 | ||
|
| |||
Expenses: | ||||
Management fees (Note 3a) | 5,128,549 | |||
Distribution fees: (Note 3c) | ||||
Class 2 | 1,941,600 | |||
Class 4 | 7,194 | |||
Unaffiliated transfer agent fees | 878 | |||
Custodian fees (Note 4) | 11,559 | |||
Reports to shareholders | 135,545 | |||
Professional fees | 26,270 | |||
Trustees’ fees and expenses | 3,317 | |||
Other | 17,748 | |||
|
| |||
Total expenses | 7,272,660 | |||
|
| |||
Net investment income | 12,803,873 | |||
|
| |||
Realized and unrealized gains (losses): | ||||
Net realized gain (loss) from investments | 1,851,212 | |||
Net change in unrealized appreciation (depreciation) on investments | 59,793,730 | |||
|
| |||
Net realized and unrealized gain (loss) | 61,644,942 | |||
|
| |||
Net increase (decrease) in net assets resulting from operations | $ | 74,448,815 | ||
|
| |||
The accompanying notes are an integral part of these financial statements.
FRD-15
Franklin Templeton Variable Insurance Products Trust
Financial Statements (continued)
Statements of Changes in Net Assets
| Franklin Rising Dividends Securities Fund | ||||||||
| Six Months Ended June 30, 2012 (unaudited) | Year Ended December 31, 2011 | |||||||
| ||||||||
Increase (decrease) in net assets: | ||||||||
Operations: | ||||||||
Net investment income | $ | 12,803,873 | $ | 27,655,892 | ||||
Net realized gain (loss) from investments | 1,851,212 | 120,463,536 | ||||||
Net change in unrealized appreciation (depreciation) on investments | 59,793,730 | (50,218,731 | ) | |||||
| ||||||||
Net increase (decrease) in net assets resulting from operations | 74,448,815 | 97,900,697 | ||||||
| ||||||||
Distributions to shareholders from: | ||||||||
Net investment income: | ||||||||
Class 1 | (2,577,724 | ) | (2,458,866 | ) | ||||
Class 2 | (24,994,784 | ) | (23,318,584 | ) | ||||
Class 4 | (85,528 | ) | (30,729 | ) | ||||
| ||||||||
Total distributions to shareholders | (27,658,036 | ) | (25,808,179 | ) | ||||
| ||||||||
Capital share transactions: (Note 2) | ||||||||
Class 1 | (5,622,418 | ) | (14,479,695 | ) | ||||
Class 2 | (43,298,658 | ) | (115,088,554 | ) | ||||
Class 4 | 1,989,628 | 1,904,859 | ||||||
| ||||||||
Total capital share transactions | (46,931,448 | ) | (127,663,390 | ) | ||||
| ||||||||
Net increase (decrease) in net assets | (140,669 | ) | (55,570,872 | ) | ||||
Net assets: | ||||||||
Beginning of period | 1,666,712,280 | 1,722,283,152 | ||||||
| ||||||||
End of period | $ | 1,666,571,611 | $ | 1,666,712,280 | ||||
| ||||||||
Undistributed net investment income included in net assets: | ||||||||
End of period | $ | 12,798,936 | $ | 27,653,099 | ||||
| ||||||||
The accompanying notes are an integral part of these financial statements.
FRD-16
Franklin Templeton Variable Insurance Products Trust
Notes to Financial Statements (unaudited)
Franklin Rising Dividends Securities Fund
1. ORGANIZATION AND SIGNIFICANT ACCOUNTING POLICIES
Franklin Templeton Variable Insurance Products Trust (Trust) is registered under the Investment Company Act of 1940, as amended, (1940 Act) as an open-end investment company, consisting of twenty separate funds. The Franklin Rising Dividends Securities Fund (Fund) is included in this report. The financial statements of the remaining funds in the Trust are presented separately. Shares of the Fund are generally sold only to insurance company separate accounts to fund the benefits of variable life insurance policies or variable annuity contracts. At June 30, 2012, 57.99% of the Fund’s shares were held through one insurance company. The Fund offers three classes of shares: Class 1, Class 2, and Class 4. Each class of shares differs by its distribution fees, voting rights on matters affecting a single class and its exchange privilege.
The following summarizes the Fund’s significant accounting policies.
a. Financial Instrument Valuation
The Fund’s investments in financial instruments are carried at fair value daily. Fair value is the price that would be received to sell an asset or paid to transfer a liability in an orderly transaction between market participants on the measurement date. Under procedures approved by the Trust’s Board of Trustees (the Board), the Fund’s administrator, investment manager and other affiliates have formed the Valuation and Liquidity Oversight Committee (VLOC). The VLOC provides administration and oversight of the Fund’s valuation policies and procedures, which are approved annually by the Board. Among other things, these procedures allow the Fund to utilize independent pricing services, quotations from securities and financial instrument dealers, and other market sources to determine fair value.
Equity securities listed on an exchange or on the NASDAQ National Market System are valued at the last quoted sale price or the official closing price of the day, respectively. Over-the-counter securities are valued within the range of the most recent quoted bid and ask prices. Securities that trade in multiple markets or on multiple exchanges are valued according to the broadest and most representative market. Certain equity securities are valued based upon fundamental characteristics or relationships to similar securities. Investments in open-end mutual funds are valued at the closing net asset value.
The Fund has procedures to determine the fair value of financial instruments for which market prices are not reliable or readily available. Under these procedures, the VLOC convenes on a regular basis to review such financial instruments and considers a number of factors, including significant unobservable valuation inputs, when arriving at fair value. The VLOC primarily employs a market-based approach which may use related or comparable assets or liabilities, recent transactions, market multiples, book values, and other relevant information for the investment to determine the fair value of the investment. An income-based valuation approach may also be used in which the anticipated future cash flows of the investment are discounted to calculate fair value. Discounts may also be applied due to the nature or duration of any restrictions on the disposition of the investments. Due to the inherent uncertainty of valuations of such investments, the fair values may differ significantly from the values that would have been used had an active market existed. The VLOC employs various methods for calibrating these valuation approaches including a regular review of key inputs and assumptions, transactional back-testing or disposition analysis, and reviews of any related market activity.
b. Income Taxes
It is the Fund’s policy to qualify as a regulated investment company under the Internal Revenue Code. The Fund intends to distribute to shareholders substantially all of its taxable income and net realized gains to relieve it from federal income and if applicable, excise taxes. As a result, no provision for U.S. federal income taxes is required.
The Fund recognizes the tax benefits of uncertain tax positions only when the position is “more likely than not” to be sustained upon examination by the tax authorities based on the technical merits of the tax position. As of June 30, 2012, and for all open tax years, the Fund has determined that no liability for unrecognized tax benefits is required in the Fund’s financial statements related to uncertain tax positions taken on a tax return (or expected to be taken on future tax returns). Open tax years are those that remain subject to examination and are based on each tax jurisdiction statute of limitation.
FRD-17
Franklin Templeton Variable Insurance Products Trust
Notes to Financial Statements (unaudited) (continued)
Franklin Rising Dividends Securities Fund
1. ORGANIZATION AND SIGNIFICANT ACCOUNTING POLICIES (continued)
c. Security Transactions, Investment Income, Expenses and Distributions
Security transactions are accounted for on trade date. Realized gains and losses on security transactions are determined on a specific identification basis. Estimated expenses are accrued daily. Dividend income is recorded on the ex-dividend date. Distributions to shareholders are recorded on the ex-dividend date and are determined according to income tax regulations (tax basis). Distributable earnings determined on a tax basis may differ from earnings recorded in accordance with accounting principles generally accepted in the United States of America. These differences may be permanent or temporary. Permanent differences are reclassified among capital accounts to reflect their tax character. These reclassifications have no impact on net assets or the results of operations. Temporary differences are not reclassified, as they may reverse in subsequent periods.
Common expenses incurred by the Trust are allocated among the funds based on the ratio of net assets of each fund to the combined net assets of the Trust. Fund specific expenses are charged directly to the fund that incurred the expense.
Realized and unrealized gains and losses and net investment income, not including class specific expenses, are allocated daily to each class of shares based upon the relative proportion of net assets of each class. Differences in per share distributions, by class, are generally due to differences in class specific expenses.
Distributions received by the Fund from certain securities may be a return of capital (ROC). Such distributions reduce the cost basis of the securities, and any distributions in excess of the cost basis are recognized as capital gains.
d. Accounting Estimates
The preparation of financial statements in accordance with accounting principles generally accepted in the United States of America requires management to make estimates and assumptions that affect the reported amounts of assets and liabilities at the date of the financial statements and the amounts of income and expenses during the reporting period. Actual results could differ from those estimates.
e. Guarantees and Indemnifications
Under the Trust’s organizational documents, its officers and trustees are indemnified by the Trust against certain liabilities arising out of the performance of their duties to the Trust. Additionally, in the normal course of business, the Trust, on behalf of the Fund, enters into contracts with service providers that contain general indemnification clauses. The Trust’s maximum exposure under these arrangements is unknown as this would involve future claims that may be made against the Trust that have not yet occurred. Currently, the Trust expects the risk of loss to be remote.
2. SHARES OF BENEFICIAL INTEREST
At June 30, 2012, there were an unlimited number of shares authorized (without par value). Transactions in the Fund’s shares were as follows:
| Six Months Ended June 30, 2012 | Year Ended December 31, 2011 | |||||||||||||||
| Class 1 Shares: | Shares | Amount | Shares | Amount | ||||||||||||
Shares sold | 132,607 | $ | 2,733,022 | 601,890 | $ | 11,765,470 | ||||||||||
Shares issued in reinvestment of distributions | 125,681 | 2,577,724 | 126,876 | 2,458,866 | ||||||||||||
Shares redeemed | (525,109 | ) | (10,933,164 | ) | (1,473,505 | ) | (28,704,031 | ) | ||||||||
| ||||||||||||||||
Net increase (decrease) | (266,821 | ) | $ | (5,622,418 | ) | (744,739 | ) | $ | (14,479,695 | ) | ||||||
| ||||||||||||||||
FRD-18
Franklin Templeton Variable Insurance Products Trust
Notes to Financial Statements (unaudited) (continued)
Franklin Rising Dividends Securities Fund
2. SHARES OF BENEFICIAL INTEREST (continued)
| Six Months Ended June 30, 2012 | Year Ended December 31, 2011 | |||||||||||||||
| Class 2 Shares: | Shares | Amount | Shares | Amount | ||||||||||||
Shares sold | 2,693,575 | $ | 54,837,316 | 5,855,934 | $ | 111,121,703 | ||||||||||
Shares issued in reinvestment of distributions | 1,239,206 | 24,994,784 | 1,222,789 | 23,318,584 | ||||||||||||
Shares redeemed | (6,021,444 | ) | (123,130,758 | ) | (13,131,700 | ) | (249,528,841 | ) | ||||||||
| ||||||||||||||||
Net increase (decrease) | (2,088,663 | ) | $ | (43,298,658 | ) | (6,052,977 | ) | $ | (115,088,554 | ) | ||||||
| ||||||||||||||||
Class 4 Shares: | ||||||||||||||||
Shares sold | 106,225 | $ | 2,197,508 | 125,061 | $ | 2,400,178 | ||||||||||
Shares issued on reinvestment of distributions | 4,211 | 85,528 | 1,596 | 30,729 | ||||||||||||
Shares redeemed | (14,281 | ) | (293,408 | ) | (27,259 | ) | (526,048 | ) | ||||||||
| ||||||||||||||||
Net increase (decrease) | 96,155 | $ | 1,989,628 | 99,398 | $ | 1,904,859 | ||||||||||
| ||||||||||||||||
3. TRANSACTIONS WITH AFFILIATES
Franklin Resources, Inc. is the holding company for various subsidiaries that together are referred to as Franklin Templeton Investments. Certain officers and trustees of the Fund are also officers and/or directors of the following subsidiaries:
| Subsidiary | Affiliation | |
Franklin Advisory Services, LLC (Advisory Services) | Investment manager | |
Franklin Templeton Services, LLC (FT Services) | Administrative manager | |
Franklin Templeton Distributors, Inc. (Distributors) | Principal underwriter | |
Franklin Templeton Investor Services, LLC (Investor Services) | Transfer agent |
a. Management Fees
The Fund pays an investment management fee to Advisory Services based on the average daily net assets of the Fund as follows:
| Annualized Fee Rate | Net Assets | |
| 0.750% | Up to and including $500 million | |
| 0.625% | Over $500 million, up to and including $1 billion | |
| 0.500% | In excess of $1 billion |
b. Administrative Fees
Under an agreement with Advisory Services, FT Services provides administrative services to the Fund. The fee is paid by Advisory Services based on average daily net assets, and is not an additional expense of the Fund.
c. Distribution Fees
The Board has adopted distribution plans for Class 2 and Class 4 shares pursuant to Rule 12b-1 under the 1940 Act. Under the Fund’s compensation distribution plans, the Fund pays Distributors for costs incurred in connection with the servicing, sale and distribution of the Fund’s shares up to 0.35% per year of its average daily net assets of each class. The Board has agreed to limit the current rate to 0.25% per year for Class 2.
FRD-19
Franklin Templeton Variable Insurance Products Trust
Notes to Financial Statements (unaudited) (continued)
Franklin Rising Dividends Securities Fund
3. TRANSACTIONS WITH AFFILIATES (continued)
d. Transfer Agent Fees
Investor Services, under terms of an agreement, performs shareholder servicing for the Fund and is not paid by the Fund for the services.
4. EXPENSE OFFSET ARRANGEMENT
The Fund has entered into an arrangement with its custodian whereby credits realized as a result of uninvested cash balances are used to reduce a portion of the Fund’s custodian expenses. During the period ended June 30, 2012, there were no credits earned.
5. INCOME TAXES
For tax purposes, capital losses may be carried over to offset future capital gains, if any. Capital loss carryforwards with no expiration, if any, must be fully utilized before those losses with expiration dates.
At December 31, 2011, capital loss carryforwards were as follows:
Capital loss carryforwards subject to expiration: | ||||
2016 | $ | 16,233,576 | ||
2017 | 107,931,803 | |||
|
| |||
Total capital loss carryforwards | $ | 124,165,379 | ||
|
|
At June 30, 2012, the cost of investments and net unrealized appreciation (depreciation) for income tax purposes were as follows:
Cost of investments | $ | 1,150,990,124 | ||
|
| |||
Unrealized appreciation | $ | 545,480,474 | ||
Unrealized depreciation | (31,799,627 | ) | ||
|
| |||
Net unrealized appreciation (depreciation) | $ | 513,680,847 | ||
|
| |||
Differences between income and/or capital gains as determined on a book basis and a tax basis are primarily due to differing treatment of wash sales.
6. INVESTMENT TRANSACTIONS
Purchases and sales of investments (excluding short term securities) for the period ended June 30, 2012, aggregated $93,510,638 and $108,421,104 , respectively.
7. INVESTMENTS IN INSTITUTIONAL FIDUCIARY TRUST MONEY MARKET PORTFOLIO
The Fund invests in the Institutional Fiduciary Trust Money Market Portfolio (Sweep Money Fund), an open-end investment company managed by Franklin Advisers, Inc. (an affiliate of the investment manager). Management fees paid by the Fund are reduced on assets invested in the Sweep Money Fund, in an amount not to exceed the management and administrative fees paid by the Sweep Money Fund.
FRD-20
Franklin Templeton Variable Insurance Products Trust
Notes to Financial Statements (unaudited) (continued)
Franklin Rising Dividends Securities Fund
8. CREDIT FACILITY
The Fund, together with other U.S. registered and foreign investment funds (collectively, Borrowers), managed by Franklin Templeton Investments, are borrowers in a joint syndicated senior unsecured credit facility totaling $1.5 billion (Global Credit Facility) which matures on January 18, 2013. This Global Credit Facility provides a source of funds to the Borrowers for temporary and emergency purposes, including the ability to meet future unanticipated or unusually large redemption requests.
Under the terms of the Global Credit Facility, the Fund shall, in addition to interest charged on any borrowings made by the Fund and other costs incurred by the Fund, pay its share of fees and expenses incurred in connection with the implementation and maintenance of the Global Credit Facility, based upon its relative share of the aggregate net assets of all of the Borrowers, including an annual commitment fee of 0.08% based upon the unused portion of the Global Credit Facility, which is reflected in other expenses on the Statement of Operations. During the period ended June 30, 2012, the Fund did not use the Global Credit Facility.
9. FAIR VALUE MEASUREMENTS
The Fund follows a fair value hierarchy that distinguishes between market data obtained from independent sources (observable inputs) and the Fund’s own market assumptions (unobservable inputs). These inputs are used in determining the value of the Fund’s financial instruments and are summarized in the following fair value hierarchy:
| • | Level 1 – quoted prices in active markets for identical financial instruments |
| • | Level 2 – other significant observable inputs (including quoted prices for similar financial instruments, interest rates, prepayment speed, credit risk, etc.) |
| • | Level 3 – significant unobservable inputs (including the Fund’s own assumptions in determining the fair value of financial instruments) |
The inputs or methodology used for valuing financial instruments are not an indication of the risk associated with investing in those financial instruments.
For movements between the levels within the fair value hierarchy, the Fund has adopted a policy of recognizing the transfers as of the date of the underlying event which caused the movement.
At June 30, 2012, all of the Fund’s investments in financial instruments carried at fair value were valued using Level 1 inputs. For detailed categories, see the accompanying Statement of Investments.
10. NEW ACCOUNTING PRONOUNCEMENTS
In December 2011, the Financial Accounting Standards Board issued Accounting Standards Update (ASU) No. 2011-11, Balance Sheet (Topic 210): Disclosures about Offsetting Assets and Liabilities. The amendments in the ASU enhance disclosures about offsetting of financial assets and liabilities to enable investors to understand the effect of these arrangements on a fund’s financial position. The ASU is effective for interim and annual reporting periods beginning on or after January 1, 2013. The Fund believes the adoption of this ASU will not have a material impact on its financial statements.
11. SUBSEQUENT EVENTS
The Fund has evaluated subsequent events through the issuance of the financial statements and determined that no events have occurred that require disclosure.
FRD-21
FRANKLIN SMALL CAP VALUE SECURITIES FUND
This semiannual report for Franklin Small Cap Value Securities Fund covers the period ended June 30, 2012.
Performance Summary as of 6/30/12
Franklin Small Cap Value Securities Fund – Class 4 delivered a +1.34% total return for the six-month period ended 6/30/12.
Performance reflects the Fund’s Class 4 operating expenses, but does not include any contract fees, expenses or sales charges. If they had been included, performance would be lower. These charges and deductions, particularly for variable life policies, can have a significant effect on contract values and insurance benefits. See the contract prospectus for a complete description of these expenses, including sales charges.
Franklin Small Cap Value Securities Fund – Class 4
Performance data represent past performance, which does not guarantee future results. Investment return and principal value will fluctuate, and you may have a gain or loss when you sell your shares. Current performance may differ from figures shown.
FSV-1
Fund Goal and Main Investments: Franklin Small Cap Value Securities Fund seeks long-term total return. Under normal market conditions, the Fund invests at least 80% of its net assets in investments of small capitalization companies. For this Fund, small capitalization companies are those with market capitalizations under $3.5 billion at the time of purchase. The Fund invests generally in equity securities of companies that the manager believes are undervalued and have the potential for capital appreciation.
Performance Overview
You can find the Fund’s six-month total return in the Performance Summary. The Fund underperformed its benchmark, the Russell 2500TM Value Index, which rose 8.15% for the same period.1 Please note the Fund employs a bottom-up stock selection process, and the managers invest in securities without regard to benchmark comparisons.
Economic and Market Overview
The U.S. economy, as measured by gross domestic product, grew modestly during the six-month period ended June 30, 2012. In the first quarter, personal income and spending rose, while federal, state and local government spending declined. The national unemployment rate for June 2012 stood at 8.2%, compared with 8.5% at the start of the period.2 Jobless claims touched a four-year low in February amid robust job creation; however, hiring slowed during the remainder of the period and jobless claims at period-end reached January’s level. Industrial production and manufacturing activity continued to increase, but the manufacturing sector shrank unexpectedly in June. Although gasoline prices hit a peak in early April, they plunged to a five-month low near period-end due to lower crude oil prices. In keeping with its goal to strengthen U.S. economic recovery by fostering increased employment while keeping inflation in check, during June the Federal Reserve Board (Fed) extended through 2012 its program (dubbed Operation Twist) to buy long-term Treasuries in an attempt to lower long-term yields. The Fed also reaffirmed its intention to keep the federal funds target rate low at least through late 2014.
During late March and early April 2012, improved economic reports helped U.S. stock markets reach multi-year highs. The Dow Jones Industrial Average exceeded 13,000 and the Standard & Poor’s® 500
1. Source: © 2012 Morningstar. One cannot invest directly in an index, and an index is not representative of the Fund’s portfolio. Please see Index Descriptions following the Fund Summaries.
2. Source: Bureau of Labor Statistics.
Fund Risks: All investments involve risks, including possible loss of principal. Stock prices fluctuate, sometimes rapidly and dramatically, due to factors affecting individual companies, particular industries or sectors, or general market conditions. Value securities may not increase in price as anticipated, or may decline further in value. Smaller-company stocks have historically exhibited special risks, including greater price volatility, particularly over the short term. Smaller companies often have relatively small revenues, limited product lines and a small market share. Investments in foreign securities may involve special risks including currency fluctuations and economic and political uncertainty. The Fund is actively managed but there is no guarantee that the manager’s investment decisions will produce the desired results. The Fund’s prospectus also includes a description of the main investment risks.
FSV-2
Index topped 1,400 for the first time since 2008, while the NASDAQ Composite Index hit an 11-year high.3 Global markets grew volatile, however, amid renewed concerns about eurozone debt and slowing global economic growth. Fears of a Greek debt default and exit from the eurozone were somewhat mitigated by secured bailout financing and bondholder concessions in February, as well as elections in May and June that resulted in the formation of a new coalition government. Risk-averse investors seeking safety drove U.S. Treasury yields to historical lows during the period.
At the end of the reporting period, significant challenges to the U.S. economy remained, including weak jobs reports, lack of broad public and political agreement on how to achieve U.S. deficit reduction, and uncertainty surrounding deeply indebted European countries including Greece, Italy and Spain. Signs of China’s economic growth slowdown further contributed to pessimism. Although long-term resolution of European debt issues remained unclear, the European Central Bank’s latest plan to allow the European Stability Mechanism to directly recapitalize troubled banks throughout the eurozone, as well as a late-June proposal leaning toward fiscal and banking union, supported cautious optimism in U.S. and global markets.
Investment Strategy
We are a research-driven, fundamental investment adviser, pursuing a disciplined, value-oriented strategy for the Fund. As a bottom-up adviser concentrating primarily on individual securities, we focus on the market price of a company’s securities relative to our evaluation of the company’s potential long-term earnings, asset value or cash flow. We seek bargains among the “unloved,” out-of-favor companies that offer, in our opinion, attractive long-term potential. These might include current growth companies that are being ignored by the market, former growth companies that have stumbled recently, dropping sharply in price but that still have significant growth potential, in our opinion, or companies that may be potential turnaround candidates or takeover targets.
Manager’s Discussion
During the six months under review, significant contributors to Fund performance came from positions in the financials sector, including insurer Protective Life.4 Several consumer discretionary sector holdings also boosted performance, such as footwear manufacturer and marketer
3. Please see Index Descriptions following the Fund Summaries.
4. The financials sector comprises banks and insurance in the SOI.
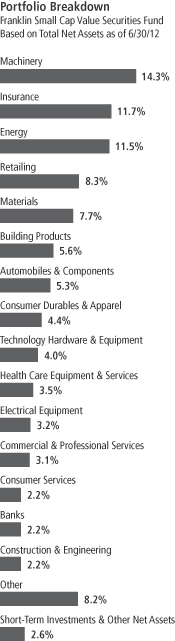
FSV-3
Brown Shoe, and single-family home builders M/I Homes and M.D.C. Holdings.5 Industrials sector holdings also helped performance, notably lumber products manufacturer Universal Forest Products.6
Most market sectors represented in the Fund contributed to performance with the exception of the Fund’s energy and information technology (IT) holdings.7 Key individual detractors from performance included regional airline company SkyWest, auto components supplier Gentex, industrial compressor and blower manufacturer Gardner Denver, aircraft-related aftermarket service provider AAR, and railcar manufacturer and lessor Trinity Industries.
The Fund initiated a position in IT products distributor Ingram Micro, which we considered an attractively valued security. In addition to increasing existing positions in AAR and Gentex, we also added to our positions in road construction equipment manufacturer Astec Industries, medical equipment manufacturer Hill-Rom Holdings, branded women’s apparel manufacturer Maidenform Brands, laser equipment producer Rofin-Sinar Technologies and brand marketing consultant Schawk. We liquidated eight positions during the period: American National Insurance, Casey’s General Stores, D.R. Horton, Mettler-Toledo International, J.C. Penney, PNM Resources, Transatlantic Holdings and Tuesday Morning. An additional security, a Mueller Industries corporate bond, was redeemed via the company’s call option. We also made significant reductions to holdings in AptarGroup, Fred’s, NV Energy, RLI, Roper Industries and Steel Dynamics, and made smaller reductions to eight other positions.
Thank you for your participation in Franklin Small Cap Value Securities Fund. We look forward to serving your future investment needs.
5. The consumer discretionary sector comprises automobiles and components, consumer durables and apparel, consumer services and retailing in the SOI.
6. The industrials sector comprises aerospace and defense, building products, commercial and professional services, construction and engineering, electrical equipment, industrial conglomerates, machinery, trading companies and distributors, and transportation in the SOI.
7. The information technology sector comprises semiconductors and semiconductor equipment, and technology hardware and equipment in the SOI.
The foregoing information reflects our analysis, opinions and portfolio holdings as of June 30, 2012, the end of the reporting period. The way we implement our main investment strategies and the resulting portfolio holdings may change depending on factors such as market and economic conditions. These opinions may not be relied upon as investment advice or an offer for a particular security. The information is not a complete analysis of every aspect of any market, country, industry, security or the Fund. Statements of fact are from sources considered reliable, but the investment manager makes no representation or warranty as to their completeness or accuracy. Although historical performance is no guarantee of future results, these insights may help you understand our investment management philosophy.
Top 10 Holdings
Franklin Small Cap Value Securities Fund
6/30/12
| Company Sector/Industry | % of Total Net Assets | |||
| Protective Life Corp. | 2.7% | |||
| Insurance | ||||
| Thor Industries Inc. | 1.8% | |||
| Automobiles & Components | ||||
| Group 1 Automotive Inc. | 1.8% | |||
| Retailing | ||||
| Universal Forest Products Inc. | 1.8% | |||
| Building Products | ||||
| Reliance Steel & Aluminum Co. | 1.8% | |||
| Materials | ||||
| Rowan Cos. PLC | 1.6% | |||
| Energy | ||||
| Tidewater Inc. | 1.6% | |||
| Energy | ||||
| RPM International Inc. | 1.6% | |||
| Materials | ||||
| Bristow Group Inc. | 1.6% | |||
| Energy | ||||
| Granite Construction Inc. | 1.6% | |||
| Construction & Engineering | ||||
The dollar value, number of shares or principal amount, and names of all portfolio holdings are listed in the Fund’s Statement of Investments (SOI).
FSV-4
Fund Expenses
As an investor in a variable insurance contract (Contract) that indirectly provides for investment in an underlying mutual fund, you can incur transaction and/or ongoing expenses at both the Fund level and the Contract level.
| • | Transaction expenses can include sales charges (loads) on purchases, surrender fees, transfer fees and premium taxes. |
| • | Ongoing expenses can include management fees, distribution and service (12b-1) fees, contract fees, annual maintenance fees, mortality and expense risk fees and other fees and expenses. All mutual funds and Contracts have some types of ongoing expenses. |
The expenses shown in the table are meant to highlight ongoing expenses at the Fund level only and do not include ongoing expenses at the Contract level, or transaction expenses at either the Fund or Contract levels. While the Fund does not have transaction expenses, if the transaction and ongoing expenses at the Contract level were included, the expenses shown below would be higher. You should consult your Contract prospectus or disclosure document for more information.
The table shows Fund-level ongoing expenses and can help you understand these expenses and compare them with those of other mutual funds offered through the Contract. The table assumes a $1,000 investment held for the six months indicated. Please refer to the Fund prospectus for additional information on operating expenses.
Actual Fund Expenses
The first line (Actual) of the table provides actual account values and expenses. The “Ending Account Value” is derived from the Fund’s actual return, which includes the effect of ongoing Fund expenses, but does not include the effect of ongoing Contract expenses.
You can estimate the Fund-level expenses you incurred during the period by following these steps. Of course, your account value and expenses will differ from those in this illustration:
| 1. | Divide your account value by $1,000. |
If an account had an $8,600 value, then $8,600 ÷ $1,000 = 8.6.
| 2. | Multiply the result by the number under the heading “Fund-Level Expenses Incurred During Period.” |
If Fund-Level Expenses Incurred During Period were $7.50, then 8.6 x $7.50 = $64.50.
In this illustration, the estimated expenses incurred this period at the Fund level are $64.50.
Franklin Small Cap Value Securities Fund – Class 4
FSV-5
Hypothetical Example for Comparison with Other Mutual Funds
Information in the second line (Hypothetical) of the table can help you compare ongoing expenses of the Fund with those of other mutual funds offered through the Contract. This information may not be used to estimate the actual ending account balance or expenses you incurred during the period. The hypothetical “Ending Account Value” is based on the Fund’s actual expense ratio and an assumed 5% annual rate of return before expenses, which does not represent the Fund’s actual return. The figure under the heading “Fund-Level Expenses Incurred During Period” shows the hypothetical expenses your account would have incurred under this scenario. You can compare this figure with the 5% hypothetical examples that appear in shareholder reports of other funds offered through a Contract.
| Class 4 | Beginning Account Value 1/1/12 | Ending Account Value 6/30/12 | Fund-Level Expenses Incurred During Period* 1/1/12–6/30/12 | |||||||||
Actual | $ | 1,000 | $ | 1,013.40 | $ | 5.11 | ||||||
Hypothetical (5% return before expenses) | $ | 1,000 | $ | 1,019.79 | $ | 5.12 | ||||||
*Expenses are calculated using the most recent six-month annualized expense ratio for the Fund’s Class 4 shares (1.02%), which does not include any ongoing expenses of the Contract for which the Fund is an investment option, multiplied by the average account value over the period, multiplied by 182/366 to reflect the one-half year period.
FSV-6
SUPPLEMENT DATED JULY 2, 2012
TO THE PROSPECTUSES
DATED MAY 1, 2012OF
FRANKLIN SMALL CAP VALUE SECURITIES FUND
(A series of Franklin Templeton Variable Insurance Products Trust)
The Prospectus is amended as follows:
I. The portfolio management team under the “Fund Summary — Portfolio Managers” section on page FSV-S4 is revised as follows:
PORTFOLIO MANAGERS
William J. Lippman President of Advisory Services and portfolio manager of the Fund since inception (1998).
Steven B. Raineri Portfolio Manager of Advisory Services and portfolio manager of the Fund since July 2012.
Bruce C. Baughman, CPA Senior Vice President of Advisory Services and portfolio manager of the Fund since inception (1998).
Margaret McGee Vice President of Advisory Services and portfolio manager of the Fund since inception (1998).
Donald G. Taylor, CPA Senior Vice President of Advisory Services and portfolio manager of the Fund since inception (1998).
II. The portfolio management team under the “Fund Details — Management” section beginning on page FSV-D5 is revised as follows:
William Lippman PRESIDENT OF ADVISORY SERVICES | Mr. Lippman has been the lead portfolio manager of the Fund since its inception and became a co-lead in 2007. He joined Franklin Templeton Investments in 1988. | |
Steven B. Raineri PORTFOLIO MANAGER OF ADVISORY SERVICES | Mr. Raineri has been a co-lead portfolio manager of the Fund since July 2012. He joined Franklin Templeton Investments in 2005. | |
Bruce Baughman SENIOR VICE PRESIDENT OF ADVISORY SERVICES | Mr. Baughman has been a portfolio manager of the Fund since its inception. He joined Franklin Templeton Investments in 1988. | |
FSV-7
Margaret McGee VICE PRESIDENT OF ADVISORY SERVICES | Ms. McGee has been a portfolio manager of the Fund since its inception. She joined Franklin Templeton Investments in 1988. | |
Donald G. Taylor, CPA SENIOR VICE PRESIDENT OF ADVISORY SERVICES | Mr. Taylor has been a portfolio manager of the Fund since its inception. He joined Franklin Templeton Investments in 1996. | |
Please keep this supplement for future reference.
FSV-8
Franklin Templeton Variable Insurance Products Trust
Financial Highlights
Franklin Small Cap Value Securities Fund
Six Months (unaudited) | Year Ended December 31, | |||||||||||||||||||||||
| Class 1 | 2011 | 2010 | 2009 | 2008 | 2007 | |||||||||||||||||||
| ||||||||||||||||||||||||
Per share operating performance | ||||||||||||||||||||||||
(for a share outstanding throughout the period) | ||||||||||||||||||||||||
Net asset value, beginning of period | $ | 15.82 | $ | 16.55 | $ | 13.00 | $ | 10.73 | $ | 17.38 | $ | 19.07 | ||||||||||||
|
| |||||||||||||||||||||||
Income from investment operationsa: | ||||||||||||||||||||||||
Net investment incomeb | 0.14 | 0.16 | 0.14 | 0.15 | 0.24 | 0.22 | ||||||||||||||||||
Net realized and unrealized gains (losses) | 0.10 | (0.74 | ) | 3.54 | 2.86 | (5.44 | ) | (0.44 | ) | |||||||||||||||
|
| |||||||||||||||||||||||
Total from investment operations | 0.24 | (0.58 | ) | 3.68 | 3.01 | (5.20 | ) | (0.22 | ) | |||||||||||||||
|
| |||||||||||||||||||||||
Less distributions from: | ||||||||||||||||||||||||
Net investment income | (0.17 | ) | (0.15 | ) | (0.13 | ) | (0.22 | ) | (0.23 | ) | (0.17 | ) | ||||||||||||
Net realized gains | — | — | — | (0.52 | ) | (1.22 | ) | (1.30 | ) | |||||||||||||||
|
| |||||||||||||||||||||||
Total distributions | (0.17 | ) | (0.15 | ) | (0.13 | ) | (0.74 | ) | (1.45 | ) | (1.47 | ) | ||||||||||||
|
| |||||||||||||||||||||||
Net asset value, end of period | $ | 15.89 | $ | 15.82 | $ | 16.55 | $ | 13.00 | $ | 10.73 | $ | 17.38 | ||||||||||||
|
| |||||||||||||||||||||||
Total returnc | 1.56% | (3.53)% | 28.49% | 29.54% | (32.87)% | (2.14)% | ||||||||||||||||||
Ratios to average net assetsd | ||||||||||||||||||||||||
Expenses | 0.67% | 0.66% | 0.67% | 0.68% | e | 0.67% | e | 0.64% | e | |||||||||||||||
Net investment income | 1.63% | 1.02% | 0.98% | 1.29% | 1.62% | 1.13% | ||||||||||||||||||
Supplemental data | ||||||||||||||||||||||||
Net assets, end of period (000’s) | $ | 37,775 | $ | 39,374 | $ | 47,300 | $ | 42,428 | $ | 34,901 | $ | 57,045 | ||||||||||||
Portfolio turnover rate | 2.88% | 14.39% | 15.92% | 6.68% | 16.98% | 16.27% | ||||||||||||||||||
aThe amount shown for a share outstanding throughout the period may not correlate with the Statement of Operations for the period due to the timing of sales and repurchases of the Fund shares in relation to income earned and/or fluctuating market value of the investments of the Fund.
bBased on average daily shares outstanding.
cTotal return does not include fees, charges or expenses imposed by the variable annuity and life insurance contracts for which the Franklin Templeton Variable Insurance Products Trust serves as an underlying investment vehicle. Total return is not annualized for periods less than one year.
dRatios are annualized for periods less than one year.
eBenefit of expense reduction rounds to less than 0.01%.
The accompanying notes are an integral part of these financial statements.
FSV-9
Franklin Templeton Variable Insurance Products Trust
Financial Highlights (continued)
Franklin Small Cap Value Securities Fund
Six Months (unaudited) | Year Ended December 31, | |||||||||||||||||||||||
| Class 2 | 2011 | 2010 | 2009 | 2008 | 2007 | |||||||||||||||||||
| ||||||||||||||||||||||||
Per share operating performance | ||||||||||||||||||||||||
(for a share outstanding throughout the period) | ||||||||||||||||||||||||
Net asset value, beginning of period | $ | 15.53 | $ | 16.25 | $ | 12.77 | $ | 10.55 | $ | 17.10 | $ | 18.79 | ||||||||||||
|
| |||||||||||||||||||||||
Income from investment operationsa: | ||||||||||||||||||||||||
Net investment incomeb | 0.11 | 0.12 | 0.10 | 0.12 | 0.20 | 0.17 | ||||||||||||||||||
Net realized and unrealized gains (losses) | 0.10 | (0.73 | ) | 3.48 | 2.81 | (5.35 | ) | (0.43 | ) | |||||||||||||||
|
| |||||||||||||||||||||||
Total from investment operations | 0.21 | (0.61 | ) | 3.58 | 2.93 | (5.15 | ) | (0.26 | ) | |||||||||||||||
|
| |||||||||||||||||||||||
Less distributions from: | ||||||||||||||||||||||||
Net investment income | (0.13 | ) | (0.11 | ) | (0.10 | ) | (0.19 | ) | (0.18 | ) | (0.13 | ) | ||||||||||||
Net realized gains | — | — | — | (0.52 | ) | (1.22 | ) | (1.30 | ) | |||||||||||||||
|
| |||||||||||||||||||||||
Total distributions | (0.13 | ) | (0.11 | ) | (0.10 | ) | (0.71 | ) | (1.40 | ) | (1.43 | ) | ||||||||||||
|
| |||||||||||||||||||||||
Net asset value, end of period | $ | 15.61 | $ | 15.53 | $ | 16.25 | $ | 12.77 | $ | 10.55 | $ | 17.10 | ||||||||||||
|
| |||||||||||||||||||||||
Total returnc | 1.37% | (3.76)% | 28.22% | 29.16% | (33.02)% | (2.38)% | ||||||||||||||||||
Ratios to average net assetsd | ||||||||||||||||||||||||
Expenses | 0.92% | 0.91% | 0.92% | 0.93% | e | 0.92% | e | 0.89% | e | |||||||||||||||
Net investment income | 1.38% | 0.77% | 0.73% | 1.04% | 1.37% | 0.88% | ||||||||||||||||||
Supplemental data | ||||||||||||||||||||||||
Net assets, end of period (000’s) | $ | 1,183,480 | $ | 1,211,168 | $ | 1,362,292 | $ | 1,109,855 | $ | 784,773 | $ | 1,177,367 | ||||||||||||
Portfolio turnover rate | 2.88% | 14.39% | 15.92% | 6.68% | 16.98% | 16.27% | ||||||||||||||||||
aThe amount shown for a share outstanding throughout the period may not correlate with the Statement of Operations for the period due to the timing of sales and repurchases of the Fund shares in relation to income earned and/or fluctuating market value of the investments of the Fund.
bBased on average daily shares outstanding.
cTotal return does not include fees, charges or expenses imposed by the variable annuity and life insurance contracts for which the Franklin Templeton Variable Insurance Products Trust serves as an underlying investment vehicle. Total return is not annualized for periods less than one year.
dRatios are annualized for periods less than one year.
eBenefit of expense reduction rounds to less than 0.01%.
The accompanying notes are an integral part of these financial statements.
FSV-10
Franklin Templeton Variable Insurance Products Trust
Financial Highlights (continued)
Franklin Small Cap Value Securities Fund
Six Months (unaudited) | Year Ended December 31, | |||||||||||||||||||
| Class 4 | 2011 | 2010 | 2009 | 2008a | ||||||||||||||||
| ||||||||||||||||||||
Per share operating performance | ||||||||||||||||||||
(for a share outstanding throughout the period) | ||||||||||||||||||||
Net asset value, beginning of period | $ | 15.71 | $ | 16.44 | $ | 12.92 | $ | 10.70 | $ | 16.42 | ||||||||||
|
| |||||||||||||||||||
Income from investment operationsb: | ||||||||||||||||||||
Net investment incomec | 0.11 | 0.11 | 0.09 | 0.11 | 0.15 | |||||||||||||||
Net realized and unrealized gains (losses) | 0.10 | (0.75 | ) | 3.53 | 2.84 | (4.42 | ) | |||||||||||||
|
| |||||||||||||||||||
Total from investment operations | 0.21 | (0.64 | ) | 3.62 | 2.95 | (4.27 | ) | |||||||||||||
|
| |||||||||||||||||||
Less distributions from: | ||||||||||||||||||||
Net investment income | (0.12 | ) | (0.09 | ) | (0.10 | ) | (0.21 | ) | (0.23 | ) | ||||||||||
Net realized gains | — | — | — | (0.52 | ) | (1.22 | ) | |||||||||||||
|
| |||||||||||||||||||
Total distributions | (0.12 | ) | (0.09 | ) | (0.10 | ) | (0.73 | ) | (1.45 | ) | ||||||||||
|
| |||||||||||||||||||
Net asset value, end of period | $ | 15.80 | $ | 15.71 | $ | 16.44 | $ | 12.92 | $ | 10.70 | ||||||||||
|
| |||||||||||||||||||
Total returnd | 1.34% | (3.87)% | 28.14% | 29.04% | (29.14)% | |||||||||||||||
Ratios to average net assetse | ||||||||||||||||||||
Expenses | 1.02% | 1.01% | 1.02% | 1.03% | f | 1.02% | f | |||||||||||||
Net investment income | 1.28% | 0.67% | 0.63% | 0.94% | 1.27% | |||||||||||||||
Supplemental data | ||||||||||||||||||||
Net assets, end of period (000’s) | $ | 34,025 | $ | 34,284 | $ | 39,075 | $ | 28,599 | $ | 14,850 | ||||||||||
Portfolio turnover rate | 2.88% | 14.39% | 15.92% | 6.68% | 16.98% | |||||||||||||||
aFor the period February 29, 2008 (effective date) to December 31, 2008.
bThe amount shown for a share outstanding throughout the period may not correlate with the Statement of Operations for the period due to the timing of sales and repurchases of the Fund shares in relation to income earned and/or fluctuating market value of the investments of the Fund.
cBased on average daily shares outstanding.
dTotal return does not include fees, charges or expenses imposed by the variable annuity and life insurance contracts for which the Franklin Templeton Variable Insurance Products Trust serves as an underlying investment vehicle. Total return is not annualized for periods less than one year.
eRatios are annualized for periods less than one year.
fBenefit of expense reduction rounds to less than 0.01%.
The accompanying notes are an integral part of these financial statements.
FSV-11
Franklin Templeton Variable Insurance Products Trust
Statement of Investments, June 30, 2012 (unaudited)
| Franklin Small Cap Value Securities Fund | Shares | Value | ||||||
Common Stocks 97.4% | ||||||||
Aerospace & Defense 1.9% | ||||||||
AAR Corp. | 1,017,000 | $ | 13,709,160 | |||||
Ceradyne Inc. | 397,500 | 10,195,875 | ||||||
|
| |||||||
| 23,905,035 | ||||||||
|
| |||||||
Automobiles & Components 5.3% | ||||||||
Autoliv Inc. | 326,800 | 17,862,888 | ||||||
aDrew Industries Inc. | 251,400 | 7,001,490 | ||||||
Gentex Corp. | 725,000 | 15,130,750 | ||||||
Thor Industries Inc. | 820,000 | 22,476,200 | ||||||
aWinnebago Industries Inc. | 423,100 | 4,311,389 | ||||||
|
| |||||||
| 66,782,717 | ||||||||
|
| |||||||
Banks 2.2% | ||||||||
Chemical Financial Corp. | 360,854 | 7,758,361 | ||||||
Oriental Financial Group Inc. | 602,000 | 6,670,160 | ||||||
Peoples Bancorp Inc. | 158,000 | 3,472,840 | ||||||
TrustCo Bank Corp. NY | 1,690,000 | 9,227,400 | ||||||
|
| |||||||
| 27,128,761 | ||||||||
|
| |||||||
Building Products 5.6% | ||||||||
A.O. Smith Corp. | 126,700 | 6,194,363 | ||||||
aAmerican Woodmark Corp. | 431,300 | 7,375,230 | ||||||
Apogee Enterprises Inc. | 778,100 | 12,504,067 | ||||||
aGibraltar Industries Inc. | 900,100 | 9,343,038 | ||||||
Simpson Manufacturing Co. Inc. | 433,400 | 12,789,634 | ||||||
Universal Forest Products Inc. | 566,000 | 22,062,680 | ||||||
|
| |||||||
| 70,269,012 | ||||||||
|
| |||||||
Commercial & Professional Services 3.1% | ||||||||
ABM Industries Inc. | 633,200 | 12,385,392 | ||||||
Insperity Inc. | 296,100 | 8,009,505 | ||||||
Mine Safety Appliances Co. | 328,300 | 13,210,792 | ||||||
Schawk Inc. | 440,800 | 5,598,160 | ||||||
|
| |||||||
| 39,203,849 | ||||||||
|
| |||||||
Construction & Engineering 2.2% | ||||||||
EMCOR Group Inc. | 272,700 | 7,586,514 | ||||||
Granite Construction Inc. | 747,000 | 19,504,170 | ||||||
|
| |||||||
| 27,090,684 | ||||||||
|
| |||||||
Consumer Durables & Apparel 4.4% | ||||||||
Brunswick Corp. | 500,000 | 11,110,000 | ||||||
Ethan Allen Interiors Inc. | 159,000 | 3,168,870 | ||||||
Hooker Furniture Corp. | 509,700 | 6,009,363 | ||||||
aLa-Z-Boy Inc. | 1,089,000 | 13,383,810 | ||||||
M.D.C. Holdings Inc. | 213,800 | 6,984,846 | ||||||
aM/I Homes Inc. | 435,900 | 7,549,788 | ||||||
aMaidenform Brands Inc. | 347,600 | 6,924,192 | ||||||
|
| |||||||
| 55,130,869 | ||||||||
|
| |||||||
Consumer Services 2.2% | ||||||||
Hillenbrand Inc. | 539,000 | 9,906,820 | ||||||
Regis Corp. | 992,000 | 17,816,320 | ||||||
|
| |||||||
| 27,723,140 | ||||||||
|
| |||||||
FSV-12
Franklin Templeton Variable Insurance Products Trust
Statement of Investments, June 30, 2012 (unaudited) (continued)
| Franklin Small Cap Value Securities Fund | Shares | Value | ||||||
Common Stocks (continued) | ||||||||
Electrical Equipment 3.2% | ||||||||
Brady Corp., A | 453,000 | $ | 12,462,030 | |||||
aEnerSys | 24,100 | 845,187 | ||||||
Franklin Electric Co. Inc. | 199,232 | 10,186,732 | ||||||
aGeneral Cable Corp. | 103,500 | 2,684,790 | ||||||
aPowell Industries Inc. | 220,500 | 8,237,880 | ||||||
Roper Industries Inc. | 57,000 | 5,619,060 | ||||||
|
| |||||||
| 40,035,679 | ||||||||
|
| |||||||
Energy 11.5% | ||||||||
Arch Coal Inc. | 111,500 | 768,235 | ||||||
aAtwood Oceanics Inc. | 405,400 | 15,340,336 | ||||||
Bristow Group Inc. | 480,000 | 19,521,600 | ||||||
CONSOL Energy Inc. | 68,500 | 2,071,440 | ||||||
Energen Corp. | 219,000 | 9,883,470 | ||||||
aHelix Energy Solutions Group Inc. | 819,500 | 13,447,995 | ||||||
aOil States International Inc. | 255,200 | 16,894,240 | ||||||
bOverseas Shipholding Group Inc. | 371,000 | 4,121,810 | ||||||
Peabody Energy Corp. | 103,200 | 2,530,464 | ||||||
aRowan Cos. PLC | 638,100 | 20,629,773 | ||||||
Teekay Corp. (Canada) | 226,831 | 6,641,612 | ||||||
Tidewater Inc. | 443,700 | 20,569,932 | ||||||
aUnit Corp. | 333,900 | 12,317,571 | ||||||
|
| |||||||
| 144,738,478 | ||||||||
|
| |||||||
Food, Beverage & Tobacco 1.1% | ||||||||
Lancaster Colony Corp. | 194,800 | 13,871,708 | ||||||
|
| |||||||
Health Care Equipment & Services 3.5% | ||||||||
Hill-Rom Holdings Inc. | 306,000 | 9,440,100 | ||||||
STERIS Corp. | 382,500 | 11,999,025 | ||||||
Teleflex Inc. | 227,900 | 13,881,389 | ||||||
West Pharmaceutical Services Inc. | 157,500 | 7,952,175 | ||||||
|
| |||||||
| 43,272,689 | ||||||||
|
| |||||||
Industrial Conglomerates 1.5% | ||||||||
Carlisle Cos. Inc. | 353,400 | 18,737,268 | ||||||
|
| |||||||
Insurance 11.7% | ||||||||
Arthur J. Gallagher & Co. | 168,200 | 5,898,774 | ||||||
Aspen Insurance Holdings Ltd. | 550,100 | 15,897,890 | ||||||
The Hanover Insurance Group Inc. | 372,200 | 14,564,186 | ||||||
HCC Insurance Holdings Inc. | 188,200 | 5,909,480 | ||||||
Montpelier Re Holdings Ltd. | 649,000 | 13,817,210 | ||||||
Old Republic International Corp. | 1,401,500 | 11,618,435 | ||||||
Protective Life Corp. | 1,135,000 | 33,380,350 | ||||||
RLI Corp. | 45,000 | 3,069,000 | ||||||
StanCorp Financial Group Inc. | 401,000 | 14,901,160 | ||||||
Tower Group Inc. | 700,000 | 14,609,000 | ||||||
Validus Holdings Ltd. (Bermuda) | 422,700 | 13,539,081 | ||||||
|
| |||||||
| 147,204,566 | ||||||||
|
| |||||||
Machinery 14.3% | ||||||||
aAstec Industries Inc. | 359,100 | 11,017,188 | ||||||
Briggs & Stratton Corp. | 588,900 | 10,299,861 | ||||||
CIRCOR International Inc. | 122,102 | 4,162,457 | ||||||
FSV-13
Franklin Templeton Variable Insurance Products Trust
Statement of Investments, June 30, 2012 (unaudited) (continued)
| Franklin Small Cap Value Securities Fund | Shares | Value | ||||||
Common Stocks (continued) | ||||||||
Machinery (continued) | ||||||||
aEnPro Industries Inc. | 402,000 | $ | 15,022,740 | |||||
Gardner Denver Inc. | 238,800 | 12,634,908 | ||||||
Graco Inc. | 214,900 | 9,902,592 | ||||||
Kaydon Corp. | 399,000 | 8,534,610 | ||||||
Kennametal Inc. | 397,300 | 13,170,495 | ||||||
Lincoln Electric Holdings Inc. | 419,000 | 18,348,010 | ||||||
Mueller Industries Inc. | 409,000 | 17,419,310 | ||||||
Nordson Corp. | 209,800 | 10,760,642 | ||||||
Pentair Inc. | 214,800 | 8,222,544 | ||||||
Timken Co. | 80,200 | 3,672,358 | ||||||
Trinity Industries Inc. | 764,400 | 19,094,712 | ||||||
aWabash National Corp. | 1,350,000 | 8,937,000 | ||||||
Watts Water Technologies Inc., A | 257,200 | 8,575,048 | ||||||
|
| |||||||
| 179,774,475 | ||||||||
|
| |||||||
Materials 7.7% | ||||||||
A. Schulman Inc. | 459,000 | 9,111,150 | ||||||
AptarGroup Inc. | 70,000 | 3,573,500 | ||||||
Cabot Corp. | 324,100 | 13,190,870 | ||||||
Commercial Metals Co. | 389,000 | 4,916,960 | ||||||
H.B. Fuller Co. | 202,100 | 6,204,470 | ||||||
Reliance Steel & Aluminum Co. | 436,000 | 22,018,000 | ||||||
RPM International Inc. | 753,600 | 20,497,920 | ||||||
Sensient Technologies Corp. | 195,300 | 7,173,369 | ||||||
Steel Dynamics Inc. | 850,000 | 9,987,500 | ||||||
|
| |||||||
| 96,673,739 | ||||||||
|
| |||||||
Retailing 8.3% | ||||||||
Brown Shoe Co. Inc. | 982,000 | 12,677,620 | ||||||
The Cato Corp., A | 460,000 | 14,011,600 | ||||||
Christopher & Banks Corp. | 1,183,304 | 1,396,299 | ||||||
Fred’s Inc. | 300,000 | 4,587,000 | ||||||
bGameStop Corp., A | 690,000 | 12,668,400 | ||||||
Group 1 Automotive Inc. | 485,900 | 22,161,899 | ||||||
The Men’s Wearhouse Inc. | 526,317 | 14,810,560 | ||||||
Pier 1 Imports Inc. | 581,000 | 9,545,830 | ||||||
a,bSaks Inc. | 532,548 | 5,671,636 | ||||||
aWest Marine Inc. | 610,700 | 7,175,725 | ||||||
|
| |||||||
| 104,706,569 | ||||||||
|
| |||||||
Semiconductors & Semiconductor Equipment 0.7% | ||||||||
Cohu Inc. | 826,500 | 8,397,240 | ||||||
|
| |||||||
Technology Hardware & Equipment 4.0% | ||||||||
aBenchmark Electronics Inc. | 1,271,000 | 17,730,450 | ||||||
aIngram Micro Inc., A | 700,000 | 12,229,000 | ||||||
aMulti-Fineline Electronix Inc. | 274,100 | 6,753,824 | ||||||
aRofin-Sinar Technologies Inc. | 705,000 | 13,345,650 | ||||||
|
| |||||||
| 50,058,924 | ||||||||
|
| |||||||
Trading Companies & Distributors 0.5% | ||||||||
Applied Industrial Technologies Inc. | 178,700 | 6,585,095 | ||||||
|
| |||||||
Transportation 1.6% | ||||||||
aGenesee & Wyoming Inc. | 260,300 | 13,754,252 | ||||||
SkyWest Inc. | 990,000 | 6,464,700 | ||||||
|
| |||||||
| 20,218,952 | ||||||||
|
| |||||||
FSV-14
Franklin Templeton Variable Insurance Products Trust
Statement of Investments, June 30, 2012 (unaudited) (continued)
| Franklin Small Cap Value Securities Fund | Shares | Value | ||||||
Common Stocks (continued) | ||||||||
Utilities 0.9% | ||||||||
NV Energy Inc. | 630,000 | $ | 11,075,400 | |||||
|
| |||||||
Total Common Stocks (Cost $1,031,433,152) | 1,222,584,849 | |||||||
|
| |||||||
Short Term Investments 3.9% | ||||||||
Money Market Funds (Cost $29,543,419) 2.3% | ||||||||
a,cInstitutional Fiduciary Trust Money Market Portfolio | 29,543,419 | 29,543,419 | ||||||
|
| |||||||
| Principal Amount | ||||||||
dInvestments from Cash Collateral Received for Loaned Securities 1.6% | ||||||||
eRepurchase Agreements 1.6% | ||||||||
BNP Paribas Securities Corp., 0.16%, 7/02/12 (Maturity Value $4,702,089) Collateralized by fU.S. Government Agency Discount Notes, 7/18/12 - 12/26/12; U.S Government Agency Securities, 0.125% - 10.35%, 7/03/12 - 8/06/38; and U.S. Government Agency Strips, zero cpn., 5/15/22 (valued at $4,796,075) | $ | 4,702,026 | 4,702,026 | |||||
Credit Suisse Securities (USA) LLC, 0.15%, 7/02/12 (Maturity Value $989,910) Collateralized by U.S. Treasury Notes, 0.625% - 2.00%, 4/15/14 - 7/15/21 (valued at $1,009,698) | 989,898 | 989,898 | ||||||
Deutsche Bank Securities Inc., 0.15%, 7/02/12 (Maturity Value $4,702,085) Collateralized by U.S. Government Agency Securities, zero cpn. - 5.27%, 8/28/12 - 11/02/40 (valued at $4,796,074) | 4,702,026 | 4,702,026 | ||||||
HSBC Securities (USA) Inc., 0.16%, 7/02/12 (Maturity Value $4,702,089) Collateralized by U.S. Government Agency Securities, zero cpn. - 0.40%, 5/22/14 - 3/17/31; U.S. Government Agency Strips, zero cpn., 10/15/12 - 4/15/30 (valued at $4,796,116) | 4,702,026 | 4,702,026 | ||||||
Merrill Lynch, Pierce, Fenner & Smith Inc., 0.14%, 7/02/12 (Maturity Value $4,702,081) Collateralized by U.S. Treasury Bonds, 4.25% - 4.50%, 2/15/36 - 11/15/40; and U.S. Treasury Notes, 0.125% - 2.00%, 4/15/15 - 1/15/22 (valued at $4,805,924) | 4,702,026 | 4,702,026 | ||||||
|
| |||||||
Total Repurchase Agreements (Cost $19,798,002) | 19,798,002 | |||||||
|
| |||||||
Total Investments (Cost $1,080,774,573) 101.3% | 1,271,926,270 | |||||||
Other Assets, less Liabilities (1.3)% | (16,646,490 | ) | ||||||
|
| |||||||
Net Assets 100.0% | $ | 1,255,279,780 | ||||||
|
| |||||||
aNon-income producing.
bA portion or all of the security is on loan at June 30, 2012. See Note 1(c).
cSee Note 7 regarding investments in the Institutional Fiduciary Trust Money Market Portfolio.
dSee Note 1(c) regarding securities on loan.
eSee Note 1(b) regarding repurchase agreements.
fThe security is traded on a discount basis with no stated coupon rate.
FSV-15
Franklin Templeton Variable Insurance Products Trust
Financial Statements
Statement of Assets and Liabilities
June 30, 2012 (unaudited)
| Franklin Small Cap Value Securities Fund | ||||
Assets: | ||||
Investments in securities: | ||||
Cost - Unaffiliated issuers | $ | 1,031,433,152 | ||
Cost - Sweep Money Fund (Note 7) | 29,543,419 | |||
Cost - Repurchase agreements | 19,798,002 | |||
|
| |||
Total cost of investments | $ | 1,080,774,573 | ||
|
| |||
Value - Unaffiliated issuers | $ | 1,222,584,849 | ||
Value - Sweep Money Fund (Note 7) | 29,543,419 | |||
Value - Repurchase agreements | 19,798,002 | |||
|
| |||
Total value of investments (includes securities loaned in the amount of $19,975,247) | 1,271,926,270 | |||
Receivables: | ||||
Investment securities sold | 5,971,220 | |||
Capital shares sold | 321,136 | |||
Dividends | 886,056 | |||
Other assets | 327 | |||
|
| |||
Total assets | 1,279,105,009 | |||
|
| |||
Liabilities: | ||||
Payables: | ||||
Investment securities purchased | 379,443 | |||
Capital shares redeemed | 2,150,625 | |||
Affiliates | 1,149,201 | |||
Payable upon return of securities loaned | 19,798,002 | |||
Accrued expenses and other liabilities | 347,958 | |||
|
| |||
Total liabilities | 23,825,229 | |||
|
| |||
Net assets, at value | $ | 1,255,279,780 | ||
|
| |||
Net assets consist of: | ||||
Paid-in capital | $ | 1,041,515,093 | ||
Undistributed net investment income | 9,258,289 | |||
Net unrealized appreciation (depreciation) | 191,151,697 | |||
Accumulated net realized gain (loss) | 13,354,701 | |||
|
| |||
Net assets, at value | $ | 1,255,279,780 | ||
|
| |||
The accompanying notes are an integral part of these financial statements.
FSV-16
Franklin Templeton Variable Insurance Products Trust
Financial Statements (continued)
Statement of Assets and Liabilities (continued)
June 30, 2012 (unaudited)
| Franklin Small Cap Value Securities Fund | ||||
Class 1: | ||||
Net assets, at value | $ | 37,774,802 | ||
|
| |||
Shares outstanding | 2,377,430 | |||
|
| |||
Net asset value and maximum offering price per share | $ | 15.89 | ||
|
| |||
Class 2: | ||||
Net assets, at value | $ | 1,183,479,775 | ||
|
| |||
Shares outstanding | 75,798,581 | |||
|
| |||
Net asset value and maximum offering price per share | $ | 15.61 | ||
|
| |||
Class 4: | ||||
Net assets, at value | $ | 34,025,203 | ||
|
| |||
Shares outstanding | 2,152,906 | |||
|
| |||
Net asset value and maximum offering price per share | $ | 15.80 | ||
|
| |||
The accompanying notes are an integral part of these financial statements.
FSV-17
Franklin Templeton Variable Insurance Products Trust
Financial Statements (continued)
Statement of Operations
for the six months ended June 30, 2012 (unaudited)
| Franklin Small Cap Value Securities Fund | ||||
Investment income: | ||||
Dividends | $ | 14,909,998 | ||
Interest | 44,808 | |||
Income from securities loaned | 360,530 | |||
|
| |||
Total investment income | 15,315,336 | |||
|
| |||
Expenses: | ||||
Management fees (Note 3a) | 3,372,664 | |||
Administrative fees (Note 3b) | 785,321 | |||
Distribution fees: (Note 3c) | ||||
Class 2 | 1,569,151 | |||
Class 4 | 65,311 | |||
Unaffiliated transfer agent fees | 2,893 | |||
Custodian fees (Note 4) | 9,371 | |||
Reports to shareholders | 218,962 | |||
Professional fees | 23,287 | |||
Trustees’ fees and expenses | 2,671 | |||
Other | 16,369 | |||
|
| |||
Total expenses | 6,066,000 | |||
|
| |||
Net investment income | 9,249,336 | |||
|
| |||
Realized and unrealized gains (losses): | ||||
Net realized gain (loss) from investments | 32,216,798 | |||
Net change in unrealized appreciation (depreciation) on investments | (20,833,755 | ) | ||
|
| |||
Net realized and unrealized gain (loss) | 11,383,043 | |||
|
| |||
Net increase (decrease) in net assets resulting from operations | $ | 20,632,379 | ||
|
| |||
The accompanying notes are an integral part of these financial statements.
FSV-18
Franklin Templeton Variable Insurance Products Trust
Financial Statements (continued)
Statements of Changes in Net Assets
| Franklin Small Cap Value Securities Fund | ||||||||
| Six Months Ended June 30, 2012 (unaudited) | Year Ended December 31, 2011 | |||||||
| ||||||||
Increase (decrease) in net assets: | ||||||||
Operations: | ||||||||
Net investment income | $ | 9,249,336 | $ | 10,424,838 | ||||
Net realized gain (loss) from investments | 32,216,798 | 79,690,343 | ||||||
Net change in unrealized appreciation (depreciation) on investments | (20,833,755 | ) | (139,845,262 | ) | ||||
| ||||||||
Net increase (decrease) in net assets resulting from operations | 20,632,379 | (49,730,081 | ) | |||||
| ||||||||
Distributions to shareholders from: | ||||||||
Net investment income: | ||||||||
Class 1 | (407,505 | ) | (392,860 | ) | ||||
Class 2 | (9,757,412 | ) | (8,773,166 | ) | ||||
Class 4 | (256,129 | ) | (201,936 | ) | ||||
| ||||||||
Total distributions to shareholders | (10,421,046 | ) | (9,367,962 | ) | ||||
| ||||||||
Capital share transactions: (Note 2) | ||||||||
Class 1 | (1,899,795 | ) | (5,885,116 | ) | ||||
Class 2 | (37,441,162 | ) | (95,600,673 | ) | ||||
Class 4 | (416,807 | ) | (3,256,590 | ) | ||||
| ||||||||
Total capital share transactions | (39,757,764 | ) | (104,742,379 | ) | ||||
| ||||||||
Net increase (decrease) in net assets | (29,546,431 | ) | (163,840,422 | ) | ||||
Net assets: | ||||||||
Beginning of period | 1,284,826,211 | 1,448,666,633 | ||||||
| ||||||||
End of period | $ | 1,255,279,780 | $ | 1,284,826,211 | ||||
| ||||||||
Undistributed net investment income included in net assets: | ||||||||
End of period | $ | 9,258,289 | $ | 10,429,999 | ||||
| ||||||||
The accompanying notes are an integral part of these financial statements.
FSV-19
Franklin Templeton Variable Insurance Products Trust
Notes to Financial Statements (unaudited)
Franklin Small Cap Value Securities Fund
1. ORGANIZATION AND SIGNIFICANT ACCOUNTING POLICIES
Franklin Templeton Variable Insurance Products Trust (Trust) is registered under the Investment Company Act of 1940, as amended, (1940 Act) as an open-end investment company, consisting of twenty separate funds. The Franklin Small Cap Value Securities Fund (Fund) is included in this report. The financial statements of the remaining funds in the Trust are presented separately. Shares of the Fund are generally sold only to insurance company separate accounts to fund the benefits of variable life insurance policies or variable annuity contracts. The Fund offers three classes of shares: Class 1, Class 2 and Class 4. Each class of shares differs by its distribution fees, voting rights on matters affecting a single class and its exchange privilege.
The following summarizes the Fund’s significant accounting policies.
a. Financial Instrument Valuation
The Fund’s investments in financial instruments are carried at fair value daily. Fair value is the price that would be received to sell an asset or paid to transfer a liability in an orderly transaction between market participants on the measurement date. Under procedures approved by the Trust’s Board of Trustees (the Board), the Fund’s administrator, investment manager and other affiliates have formed the Valuation and Liquidity Oversight Committee (VLOC). The VLOC provides administration and oversight of the Fund’s valuation policies and procedures, which are approved annually by the Board. Among other things, these procedures allow the Fund to utilize independent pricing services, quotations from securities and financial instrument dealers, and other market sources to determine fair value.
Equity securities listed on an exchange or on the NASDAQ National Market System are valued at the last quoted sale price or the official closing price of the day, respectively. Over-the-counter securities are valued within the range of the most recent quoted bid and ask prices. Securities that trade in multiple markets or on multiple exchanges are valued according to the broadest and most representative market. Certain equity securities are valued based upon fundamental characteristics or relationships to similar securities. Investments in open-end mutual funds are valued at the closing net asset value. Repurchase agreements are valued at cost, which approximates market value.
The Fund has procedures to determine the fair value of financial instruments for which market prices are not reliable or readily available. Under these procedures, the VLOC convenes on a regular basis to review such financial instruments and considers a number of factors, including significant unobservable valuation inputs, when arriving at fair value. The VLOC primarily employs a market-based approach which may use related or comparable assets or liabilities, recent transactions, market multiples, book values, and other relevant information for the investment to determine the fair value of the investment. An income-based valuation approach may also be used in which the anticipated future cash flows of the investment are discounted to calculate fair value. Discounts may also be applied due to the nature or duration of any restrictions on the disposition of the investments. Due to the inherent uncertainty of valuations of such investments, the fair values may differ significantly from the values that would have been used had an active market existed. The VLOC employs various methods for calibrating these valuation approaches including a regular review of key inputs and assumptions, transactional back-testing or disposition analysis, and reviews of any related market activity.
b. Repurchase Agreements
The Fund enters into repurchase agreements, which are accounted for as a loan by the fund to the seller, collateralized by securities which are delivered to the fund’s custodian. The market value, including accrued interest, of the initial collateralization is required to be at least 102% of the dollar amount invested by the fund, with the value of the underlying securities marked to market daily to maintain coverage of at least 100%. All repurchase agreements held by the Fund at period end had been entered into on June 29, 2012.
c. Securities Lending
The Fund participates in a principal based securities lending program. The fund receives cash collateral against the loaned securities in an amount equal to at least 102% of the market value of the loaned securities. Collateral is maintained over the life
FSV-20
Franklin Templeton Variable Insurance Products Trust
Notes to Financial Statements (unaudited) (continued)
Franklin Small Cap Value Securities Fund
1. ORGANIZATION AND SIGNIFICANT ACCOUNTING POLICIES (continued)
c. Securities Lending (continued)
of the loan in an amount not less than 100% of the market value of loaned securities, as determined at the close of fund business each day; any additional collateral required due to changes in security values is delivered to the fund on the next business day. The collateral is invested in repurchase agreements as indicated on the Statement of Investments. The fund receives income from the investment of cash collateral, in addition to lending fees and rebates paid by the borrower. The fund bears the market risk with respect to the collateral investment, securities loaned, and the risk that the principal may default on its obligations to the fund.
d. Income Taxes
It is the Fund’s policy to qualify as a regulated investment company under the Internal Revenue Code. The Fund intends to distribute to shareholders substantially all of its taxable income and net realized gains to relieve it from federal income and if applicable, excise taxes. As a result, no provision for U.S. federal income taxes is required.
The Fund recognizes the tax benefits of uncertain tax positions only when the position is “more likely than not” to be sustained upon examination by the tax authorities based on the technical merits of the tax position. As of June 30, 2012, and for all open tax years, the Fund has determined that no liability for unrecognized tax benefits is required in the Fund’s financial statements related to uncertain tax positions taken on a tax return (or expected to be taken on future tax returns). Open tax years are those that remain subject to examination and are based on each tax jurisdiction statute of limitation.
e. Security Transactions, Investment Income, Expenses and Distributions
Security transactions are accounted for on trade date. Realized gains and losses on security transactions are determined on a specific identification basis. Interest income and estimated expenses are accrued daily. Dividend income is recorded on the ex-dividend date. Distributions to shareholders are recorded on the ex-dividend date and are determined according to income tax regulations (tax basis). Distributable earnings determined on a tax basis may differ from earnings recorded in accordance with accounting principles generally accepted in the United States of America. These differences may be permanent or temporary. Permanent differences are reclassified among capital accounts to reflect their tax character. These reclassifications have no impact on net assets or the results of operations. Temporary differences are not reclassified, as they may reverse in subsequent periods.
Common expenses incurred by the Trust are allocated among the funds based on the ratio of net assets of each fund to the combined net assets of the Trust. Fund specific expenses are charged directly to the fund that incurred the expense.
Realized and unrealized gains and losses and net investment income, not including class specific expenses, are allocated daily to each class of shares based upon the relative proportion of net assets of each class. Differences in per share distributions, by class, are generally due to differences in class specific expenses.
f. Accounting Estimates
The preparation of financial statements in accordance with accounting principles generally accepted in the United States of America requires management to make estimates and assumptions that affect the reported amounts of assets and liabilities at the date of the financial statements and the amounts of income and expenses during the reporting period. Actual results could differ from those estimates.
g. Guarantees and Indemnifications
Under the Trust’s organizational documents, its officers and trustees are indemnified by the Trust against certain liabilities arising out of the performance of their duties to the Trust. Additionally, in the normal course of business, the Trust, on behalf of the
FSV-21
Franklin Templeton Variable Insurance Products Trust
Notes to Financial Statements (unaudited) (continued)
Franklin Small Cap Value Securities Fund
1. ORGANIZATION AND SIGNIFICANT ACCOUNTING POLICIES (continued)
g. Guarantees and Indemnifications (continued)
Fund, enters into contracts with service providers that contain general indemnification clauses. The Trust’s maximum exposure under these arrangements is unknown as this would involve future claims that may be made against the Trust that have not yet occurred. Currently, the Trust expects the risk of loss to be remote.
2. SHARES OF BENEFICIAL INTEREST
At June 30, 2012, there were an unlimited number of shares authorized (without par value). Transactions in the Fund’s shares were as follows:
| Six Months Ended June 30, 2012 | Year Ended December 31, 2011 | |||||||||||||||
| Class 1 Shares: | Shares | Amount | Shares | Amount | ||||||||||||
Shares sold | 68,830 | $ | 1,158,423 | 385,043 | $ | 6,445,781 | ||||||||||
Shares issued in reinvestment of distributions | 26,308 | 407,505 | 24,646 | 392,860 | ||||||||||||
Shares redeemed | (205,972 | ) | (3,465,723 | ) | (778,610 | ) | (12,723,757 | ) | ||||||||
| ||||||||||||||||
Net increase (decrease) | (110,834 | ) | $ | (1,899,795 | ) | (368,921 | ) | $ | (5,885,116 | ) | ||||||
| ||||||||||||||||
Class 2 Shares: | ||||||||||||||||
Shares sold | 5,290,373 | $ | 86,796,323 | 12,352,861 | $ | 192,000,345 | ||||||||||
Shares issued in reinvestment of distributions | 641,091 | 9,757,412 | 559,870 | 8,773,166 | ||||||||||||
Shares redeemed | (8,127,115 | ) | (133,994,897 | ) | (18,752,469 | ) | (296,374,184 | ) | ||||||||
| ||||||||||||||||
Net increase (decrease) | (2,195,651 | ) | $ | (37,441,162 | ) | (5,839,738 | ) | $ | (95,600,673 | ) | ||||||
| ||||||||||||||||
Class 4 Shares: | ||||||||||||||||
Shares sold | 341,712 | $ | 5,813,731 | 385,949 | $ | 6,104,316 | ||||||||||
Shares issued on reinvestment of distributions | 16,621 | 256,129 | 12,732 | 201,936 | ||||||||||||
Shares redeemed | (387,526 | ) | (6,486,667 | ) | (593,170 | ) | (9,562,842 | ) | ||||||||
| ||||||||||||||||
Net increase (decrease) | (29,193 | ) | $ | (416,807 | ) | (194,489 | ) | $ | (3,256,590 | ) | ||||||
| ||||||||||||||||
3. TRANSACTIONS WITH AFFILIATES
Franklin Resources, Inc. is the holding company for various subsidiaries that together are referred to as Franklin Templeton Investments. Certain officers and trustees of the Fund are also officers and/or directors of the following subsidiaries:
| Subsidiary | Affiliation | |
Franklin Advisory Services, LLC (Advisory Services) | Investment manager | |
Franklin Templeton Services, LLC (FT Services) | Administrative manager | |
Franklin Templeton Distributors, Inc. (Distributors) | Principal underwriter | |
Franklin Templeton Investor Services, LLC (Investor Services) | Transfer agent |
a. Management Fees
The Fund pays an investment management fee to Advisory Services based on the average daily net assets of the Fund as follows:
| Annualized Fee Rate | Net Assets | |
| 0.600% | Up to and including $200 million | |
| 0.500% | Over $200 million, up to and including $1.3 billion | |
| 0.400% | In excess of $1.3 billion |
FSV-22
Franklin Templeton Variable Insurance Products Trust
Notes to Financial Statements (unaudited) (continued)
Franklin Small Cap Value Securities Fund
3. TRANSACTIONS WITH AFFILIATES (continued)
b. Administrative Fees
The Fund pays an administrative fee to FT Services based on the Fund’s average daily net assets as follows:
| Annualized Fee Rate | Net Assets | |
| 0.150% | Up to and including $200 million | |
| 0.135% | Over $200 million, up to and including $700 million | |
| 0.100% | Over $700 million, up to and including $1.2 billion | |
| 0.075% | In excess of $1.2 billion |
c. Distribution Fees
The Board has adopted distribution plans for Class 2 and Class 4 shares pursuant to Rule 12b-1 under the 1940 Act. Under the Fund’s compensation distribution plans, the Fund pays Distributors for costs incurred in connection with the servicing, sale and distribution of the Fund’s shares up to 0.35% per year of its average daily net assets of each class. The Board has agreed to limit the current rate to 0.25% per year for Class 2.
d. Transfer Agent Fees
Investor Services, under terms of an agreement, performs shareholder servicing for the Fund and is not paid by the Fund for the services.
4. EXPENSE OFFSET ARRANGEMENT
The Fund has entered into an arrangement with its custodian whereby credits realized as a result of uninvested cash balances are used to reduce a portion of the Fund’s custodian expenses. During the period ended June 30, 2012, there were no credits earned.
5. INCOME TAXES
For tax purposes, capital losses may be carried over to offset future capital gains, if any. Capital loss carryforwards with no expiration, if any, must be fully utilized before those losses with expiration dates.
At December 31, 2011, the Fund had capital loss carryforwards of $18,771,926 expiring in 2018.
At June 30, 2012, the cost of investments and net unrealized appreciation (depreciation) for income tax purposes were as follows:
Cost of investments | $ | 1,080,864,744 | ||
|
| |||
Unrealized appreciation | $ | 318,050,369 | ||
Unrealized depreciation | (126,988,843 | ) | ||
|
| |||
Net unrealized appreciation (depreciation) | $ | 191,061,526 | ||
|
| |||
Differences between income and/or capital gains as determined on a book basis and a tax basis are primarily due to differing treatments of bond discounts and premiums and wash sales.
FSV-23
Franklin Templeton Variable Insurance Products Trust
Notes to Financial Statements (unaudited) (continued)
Franklin Small Cap Value Securities Fund
6. INVESTMENT TRANSACTIONS
Purchases and sales of investments (excluding short term securities) for the period ended June 30, 2012, aggregated $37,060,769 and $68,404,240, respectively.
7. INVESTMENTS IN INSTITUTIONAL FIDUCIARY TRUST MONEY MARKET PORTFOLIO
The Fund invests in the Institutional Fiduciary Trust Money Market Portfolio (Sweep Money Fund), an open-end investment company managed by Franklin Advisers, Inc. (an affiliate of the investment manager). Management fees paid by the Fund are reduced on assets invested in the Sweep Money Fund, in an amount not to exceed the management and administrative fees paid by the Sweep Money Fund.
8. CREDIT FACILITY
The Fund, together with other U.S. registered and foreign investment funds (collectively, Borrowers), managed by Franklin Templeton Investments, are borrowers in a joint syndicated senior unsecured credit facility totaling $1.5 billion (Global Credit Facility) which matures on January 18, 2013. This Global Credit Facility provides a source of funds to the Borrowers for temporary and emergency purposes, including the ability to meet future unanticipated or unusually large redemption requests.
Under the terms of the Global Credit Facility, the Fund shall, in addition to interest charged on any borrowings made by the Fund and other costs incurred by the Fund, pay its share of fees and expenses incurred in connection with the implementation and maintenance of the Global Credit Facility, based upon its relative share of the aggregate net assets of all of the Borrowers, including an annual commitment fee of 0.08% based upon the unused portion of the Global Credit Facility, which is reflected in other expenses on the Statement of Operations. During the period ended June 30, 2012, the Fund did not use the Global Credit Facility.
9. FAIR VALUE MEASUREMENTS
The Fund follows a fair value hierarchy that distinguishes between market data obtained from independent sources (observable inputs) and the Fund’s own market assumptions (unobservable inputs). These inputs are used in determining the value of the Fund’s financial instruments and are summarized in the following fair value hierarchy:
| • | Level 1 – quoted prices in active markets for identical financial instruments |
| • | Level 2 – other significant observable inputs (including quoted prices for similar financial instruments, interest rates, prepayment speed, credit risk, etc.) |
| • | Level 3 – significant unobservable inputs (including the Fund’s own assumptions in determining the fair value of financial instruments) |
The inputs or methodology used for valuing financial instruments are not an indication of the risk associated with investing in those financial instruments.
For movements between the levels within the fair value hierarchy, the Fund has adopted a policy of recognizing the transfers as of the date of the underlying event which caused the movement.
FSV-24
Franklin Templeton Variable Insurance Products Trust
Notes to Financial Statements (unaudited) (continued)
Franklin Small Cap Value Securities Fund
9. FAIR VALUE MEASUREMENTS (continued)
A summary of inputs used as of June 30, 2012, in valuing the Fund’s assets and liabilities carried at fair value, is as follows:
| Level 1 | Level 2 | Level 3 | Total | |||||||||||||
|
| |||||||||||||||
Assets: | ||||||||||||||||
Investments in Securities: | ||||||||||||||||
Equity Investmentsa | $ | 1,222,584,849 | $ | — | $ | — | $ | 1,222,584,849 | ||||||||
Short Term Investments | 29,543,419 | 19,798,002 | — | 49,341,421 | ||||||||||||
|
| |||||||||||||||
Total Investments in Securities | $ | 1,252,128,268 | $ | 19,798,002 | $ | — | $ | 1,271,926,270 | ||||||||
|
| |||||||||||||||
aFor detailed categories, see the accompanying Statement of Investments.
10. NEW ACCOUNTING PRONOUNCEMENTS
In December 2011, the Financial Accounting Standards Board issued Accounting Standards Update (ASU) No. 2011-11, Balance Sheet (Topic 210): Disclosures about Offsetting Assets and Liabilities. The amendments in the ASU enhance disclosures about offsetting of financial assets and liabilities to enable investors to understand the effect of these arrangements on a fund’s financial position. The ASU is effective for interim and annual reporting periods beginning on or after January 1, 2013. The Fund believes the adoption of this ASU will not have a material impact on its financial statements.
11. SUBSEQUENT EVENTS
The Fund has evaluated subsequent events through the issuance of the financial statements and determined that no events have occurred that require disclosure.
FSV-25
FRANKLIN SMALL-MID CAP GROWTH SECURITIES FUND
This semiannual report for Franklin Small-Mid Cap Growth Securities Fund covers the period ended June 30, 2012.
Performance Summary as of 6/30/12
Franklin Small-Mid Cap Growth Securities Fund – Class 4 delivered a +5.83% total return for the six-month period ended 6/30/12.
Performance reflects the Fund’s Class 4 operating expenses, but does not include any contract fees, expenses or sales charges. If they had been included, performance would be lower. These charges and deductions, particularly for variable life policies, can have a significant effect on contract values and insurance benefits. See the contract prospectus for a complete description of these expenses, including sales charges.
Franklin Small-Mid Cap Growth Securities Fund Class 4
Performance data represent past performance, which does not guarantee future results. Investment return and principal value will fluctuate, and you may have a gain or loss when you sell your shares. Current performance may differ from figures shown.
FSC-1
Fund Goal and Main Investments: Franklin Small-Mid Cap Growth Securities Fund seeks long-term capital growth. Under normal market conditions, the Fund invests at least 80% of its net assets in investments of small capitalization and mid-capitalization companies. For this Fund, small cap companies are those within the market capitalization range of companies in the Russell 2500TM Index at the time of purchase, and midcap companies are companies within the market capitalization range of companies in the Russell Midcap® Index at the time of purchase.1
Performance Overview
You can find the Fund’s six-month total return in the Performance Summary. The Fund underperformed its narrow benchmark, the Russell Midcap® Growth Index, which generated a total return of +8.10%, and its broad benchmark, the Standard & Poor’s® 500 Index (S&P 500®), which posted a +9.49% total return, for the same period.2
Economic and Market Overview
The U.S. economy, as measured by gross domestic product, grew modestly during the six-month period ended June 30, 2012. In the first quarter, personal income and spending rose, while federal, state and local government spending declined. The national unemployment rate for June 2012 stood at 8.2%, compared with 8.5% at the start of the period.3 Jobless claims touched a four-year low in February amid robust job creation; however, hiring slowed during the remainder of the period and jobless claims at period-end reached January’s level. Industrial production and manufacturing activity continued to increase, but the manufacturing sector shrank unexpectedly in June. Although gasoline prices hit a peak in early April, they plunged to a five-month low near period-end due to lower crude oil prices. In keeping with its goal to strengthen U.S. economic recovery by fostering increased employment while keeping inflation in check, during June the Federal Reserve Board (Fed) extended through 2012 its program (dubbed Operation Twist) to buy long-term Treasuries in an attempt to lower long-term yields. The Fed also reaffirmed its intention to keep the federal funds target rate low at least through late 2014.
During late March and early April 2012, improved economic reports helped U.S. stock markets reach multi-year highs. The Dow Jones
1. Please see Index Descriptions following the Fund Summaries.
2. Source: © 2012 Morningstar. One cannot invest directly in an index, and an index is not representative of the Fund’s portfolio. Please see Index Descriptions following the Fund Summaries.
3. Source: Bureau of Labor Statistics.
Fund Risks: All investments involve risks, including possible loss of principal. Investors should be comfortable with fluctuations in the value of their investment, as small- and midsized-company stocks can be volatile, especially over the short term. Smaller or relatively new or unseasoned companies can be particularly sensitive to changing economic conditions, and their prospects for growth are less certain than those of larger, more established companies. The Fund may focus on particular sectors of the market from time to time, which can carry greater risks of adverse developments in such sectors. The Fund is actively managed but there is no guarantee that the manager’s investment decisions will produce the desired results. The Fund’s prospectus also includes a description of the main investment risks.
FSC-2
Industrial Average exceeded 13,000 and the S&P 500 topped 1,400 for the first time since 2008, while the NASDAQ Composite Index hit an 11-year high.1 Global markets grew volatile, however, amid renewed concerns about eurozone debt and slowing global economic growth. Fears of a Greek debt default and exit from the eurozone were somewhat mitigated by secured bailout financing and bondholder concessions in February, as well as elections in May and June that resulted in the formation of a new coalition government. Risk-averse investors seeking safety drove U.S. Treasury yields to historical lows during the period.
At the end of the reporting period, significant challenges to the U.S. economy remained, including weak jobs reports, lack of broad public and political agreement on how to achieve U.S. deficit reduction, and uncertainty surrounding deeply indebted European countries including Greece, Italy and Spain. Signs of China’s economic growth slowdown further contributed to pessimism. Although long-term resolution of European debt issues remained unclear, the European Central Bank’s latest plan to allow the European Stability Mechanism to directly recapitalize troubled banks throughout the eurozone, as well as a late-June proposal leaning toward fiscal and banking union, supported cautious optimism in U.S. and global markets.
Investment Strategy
We use fundamental, bottom-up research to seek companies meeting our criteria of growth potential, quality and valuation. In seeking sustainable growth characteristics, we look for companies we believe can produce sustainable earnings and cash flow growth, evaluating the long-term market opportunity and competitive structure of an industry to target leaders and emerging leaders. We define quality companies as those with strong and improving competitive positions in attractive markets. We also believe important attributes of quality are experienced and talented management teams as well as financial strength reflected in the capital structure, gross and operating margins, free cash flow generation and returns on capital employed. Our valuation analysis includes a range of potential outcomes based on an assessment of multiple scenarios. In assessing value, we consider whether security prices fully reflect the balance of the sustainable growth opportunities relative to business and financial risks.
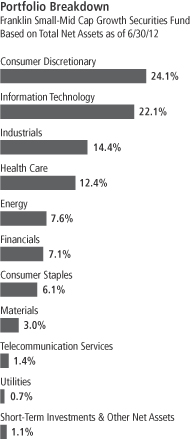
FSC-3
Manager’s Discussion
During the six months under review, most sectors represented in the Fund’s portfolio produced positive returns as the broad market’s first- quarter rally largely offset the volatility experienced later in the reporting period. Stock selection in the consumer discretionary and consumer staples sectors was a key contributor to the Fund’s performance relative to the benchmark Russell Midcap® Growth Index. Diverse consumer products company Jarden and discount retailer Dollar General in the consumer discretionary sector boosted relative results. Jarden, whose numerous brands include Coleman, Crockpot, Sunbeam and First Alert, continued to improve its gross margins by introducing new products, which commanded higher price points. Dollar General delivered strong profit growth in recent quarters by opening new stores and selling well-known brands. In the consumer staples sector, Monster Beverage aided relative returns as the company benefited from U.S. market share gains and international expansion. Although our information technology (IT) holdings generally detracted from relative returns, Netherlands-based NXP Semiconductors4 and open source software solutions provider Red Hat were key contributors. NXP Semiconductors, whose products are used in a wide array of applications including automotive, security identification and wireless infrastructure, won new contracts to supply more chips to top smartphone manufacturers, as well as significant design deals in leading handsets beyond near-field communication. Red Hat benefited from enterprise customers’ broad migration to cloud computing and storage, as well as improved IT spending.
In contrast, key detractors from the Fund’s relative performance included stock selection in the materials and health care sectors. Within the materials sector, global technology and specialty materials manufacturer Celanese’s share price was pressured by lower profit margins resulting from higher costs and softer demand from Asia and Europe. In an effort to counteract weak demand and improve margins, the company planned to cut costs, run its plants more efficiently and expand customer relationships. Our underweighted allocation to outperforming health care equipment and supplies company Edwards Lifesciences in the health care sector also hurt relative results.5 Stock selection largely offset the positive effects of overweighting in the IT sector, particularly our position in Higher One Holdings, a technology and payment services company that offers disbursement and payment solutions for
4. This holding is not an index component.
5. Sold by period-end.
Top 10 Holdings
Franklin Small-Mid Cap Growth Securities Fund
6/30/12
| Company Sector/Industry | % of Total Net Assets | |||
| Whiting Petroleum Corp. | 1.8% | |||
| Energy | ||||
| QEP Resources Inc. | 1.8% | |||
| Energy | ||||
| Trimble Navigation Ltd. | 1.7% | |||
| Information Technology | ||||
| Dollar General Corp. | 1.7% | |||
| Consumer Discretionary | ||||
| AMETEK Inc. | 1.6% | |||
| Industrials | ||||
| BorgWarner Inc. | 1.6% | |||
| Consumer Discretionary | ||||
| Dick’s Sporting Goods Inc. | 1.6% | |||
| Consumer Discretionary | ||||
| Nuance Communications Inc. | 1.5% | |||
| Information Technology | ||||
| Cerner Corp. | 1.5% | |||
| Health Care | ||||
| Roper Industries Inc. | 1.5% | |||
| Industrials | ||||
The dollar value, number of shares or principal amount, and names of all portfolio holdings are listed in the Fund’s Statement of Investments.
FSC-4
higher education institutions and their students.4 Other key individual detractors included oil and gas explorer and producer SM Energy in the energy sector and industrial compressor and blower manufacturer Gardner Denver in the industrials sector. Despite SM Energy’s strong revenue and income growth in recent quarters, its share price declined along with crude oil and natural gas prices. A slightly lower-than-expected full year 2012 earnings guidance weighed on Gardner Denver’s stock price. With a strong balance sheet and a sizable amount of shares available for repurchase, the company continued its strategy of opportunistically purchasing its own common stock while focusing on selective acquisitions and organic growth.
Thank you for your participation in Franklin Small-Mid Cap Growth Securities Fund. We look forward to serving your future investment needs.
The foregoing information reflects our analysis, opinions and portfolio holdings as of June 30, 2012, the end of the reporting period. The way we implement our main investment strategies and the resulting portfolio holdings may change depending on factors such as market and economic conditions. These opinions may not be relied upon as investment advice or an offer for a particular security. The information is not a complete analysis of every aspect of any market, country, industry, security or the Fund. Statements of fact are from sources considered reliable, but the investment manager makes no representation or warranty as to their completeness or accuracy. Although historical performance is no guarantee of future results, these insights may help you understand our investment management philosophy.
FSC-5
Fund Expenses
As an investor in a variable insurance contract (Contract) that indirectly provides for investment in an underlying mutual fund, you can incur transaction and/or ongoing expenses at both the Fund level and the Contract level.
| • | Transaction expenses can include sales charges (loads) on purchases, surrender fees, transfer fees and premium taxes. |
| • | Ongoing expenses can include management fees, distribution and service (12b-1) fees, contract fees, annual maintenance fees, mortality and expense risk fees and other fees and expenses. All mutual funds and Contracts have some types of ongoing expenses. |
The expenses shown in the table are meant to highlight ongoing expenses at the Fund level only and do not include ongoing expenses at the Contract level, or transaction expenses at either the Fund or Contract levels. While the Fund does not have transaction expenses, if the transaction and ongoing expenses at the Contract level were included, the expenses shown below would be higher. You should consult your Contract prospectus or disclosure document for more information.
The table shows Fund-level ongoing expenses and can help you understand these expenses and compare them with those of other mutual funds offered through the Contract. The table assumes a $1,000 investment held for the six months indicated. Please refer to the Fund prospectus for additional information on operating expenses.
Actual Fund Expenses
The first line (Actual) of the table provides actual account values and expenses. The “Ending Account Value” is derived from the Fund’s actual return, which includes the effect of ongoing Fund expenses, but does not include the effect of ongoing Contract expenses.
You can estimate the Fund-level expenses you incurred during the period by following these steps. Of course, your account value and expenses will differ from those in this illustration:
| 1. | Divide your account value by $1,000. |
If an account had an $8,600 value, then $8,600 ÷ $1,000 = 8.6.
| 2. | Multiply the result by the number under the heading “Fund-Level Expenses Incurred During Period.” |
If Fund-Level Expenses Incurred During Period were $7.50, then 8.6 x $7.50 = $64.50.
In this illustration, the estimated expenses incurred this period at the Fund level are $64.50.
Franklin Small-Mid Cap Growth Securities Fund Class 4
FSC-6
Hypothetical Example for Comparison with Other Mutual Funds
Information in the second line (Hypothetical) of the table can help you compare ongoing expenses of the Fund with those of other mutual funds offered through the Contract. This information may not be used to estimate the actual ending account balance or expenses you incurred during the period. The hypothetical “Ending Account Value” is based on the Fund’s actual expense ratio and an assumed 5% annual rate of return before expenses, which does not represent the Fund’s actual return. The figure under the heading “Fund-Level Expenses Incurred During Period” shows the hypothetical expenses your account would have incurred under this scenario. You can compare this figure with the 5% hypothetical examples that appear in shareholder reports of other funds offered through a Contract.
| Class 4 | Beginning Account Value 1/1/12 | Ending Account Value 6/30/12 | Fund-Level Expenses Incurred During Period* 1/1/12–6/30/12 | |||||||||
Actual | $ | 1,000 | $ | 1,058.30 | $ | 5.83 | ||||||
Hypothetical (5% return before expenses) | $ | 1,000 | $ | 1,019.19 | $ | 5.72 | ||||||
*Expenses are calculated using the most recent six-month annualized expense ratio for the Fund’s Class 4 shares (1.14%), which does not include any ongoing expenses of the Contract for which the Fund is an investment option, multiplied by the average account value over the period, multiplied by 182/366 to reflect the one-half year period.
FSC-7
Franklin Templeton Variable Insurance Products Trust
Financial Highlights
Franklin Small-Mid Cap Growth Securities Fund
| Six Months Ended June 30, 2012 (unaudited) | Year Ended December 31, | |||||||||||||||||||||||
| Class 1 | 2011 | 2010 | 2009 | 2008 | 2007 | |||||||||||||||||||
| ||||||||||||||||||||||||
Per share operating performance | ||||||||||||||||||||||||
(for a share outstanding throughout the period) | ||||||||||||||||||||||||
Net asset value, beginning of period | $ | 21.19 | $ | 22.21 | $ | 17.36 | $ | 12.06 | $ | 23.39 | $ | 22.51 | ||||||||||||
|
| |||||||||||||||||||||||
Income from investment operationsa: | ||||||||||||||||||||||||
Net investment income (loss)b | (0.03 | ) | (0.05 | ) | (0.01 | ) | (0.10 | )c | 0.01 | (0.02 | ) | |||||||||||||
Net realized and unrealized gains (losses) | 1.28 | (0.97 | ) | 4.86 | 5.40 | (8.98 | ) | 2.65 | ||||||||||||||||
|
| |||||||||||||||||||||||
Total from investment operations | 1.25 | (1.02 | ) | 4.85 | 5.30 | (8.97 | ) | 2.63 | ||||||||||||||||
|
| |||||||||||||||||||||||
Less distributions from net realized gains | (1.58 | ) | — | — | — | (2.36 | ) | (1.75 | ) | |||||||||||||||
|
| |||||||||||||||||||||||
Net asset value, end of period | $ | 20.86 | $ | 21.19 | $ | 22.21 | $ | 17.36 | $ | 12.06 | $ | 23.39 | ||||||||||||
|
| |||||||||||||||||||||||
Total returnd | 5.98% | (4.59)% | 27.94% | 43.95% | (42.34)% | 11.51% | ||||||||||||||||||
Ratios to average net assetse | ||||||||||||||||||||||||
Expenses | 0.79% | 0.79% | 0.79% | 0.80% | f | 0.76% | f | 0.74% | f | |||||||||||||||
Net investment income (loss) | (0.22)% | (0.21)% | (0.07)% | (0.72)% | c | 0.06% | (0.10)% | |||||||||||||||||
Supplemental data | ||||||||||||||||||||||||
Net assets, end of period (000’s) | $ | 76,517 | $ | 76,384 | $ | 89,826 | $ | 79,670 | $ | 63,531 | $ | 127,602 | ||||||||||||
Portfolio turnover rate | 20.40% | 45.00% | 46.69% | 63.93% | 60.12% | 66.94% | ||||||||||||||||||
aThe amount shown for a share outstanding throughout the period may not correlate with the Statement of Operations for the period due to the timing of sales and repurchases of the Fund shares in relation to income earned and/or fluctuating market value of the investments of the Fund.
bBased on average daily shares outstanding.
cNet investment income per share includes approximately $(0.06) per share as a return of capital adjustment to a previously recorded special dividend received by the Fund. Excluding this non-recurring amount, the ratio of net investment income to average net assets would have been (0.22)%.
dTotal return does not include fees, charges or expenses imposed by the variable annuity and life insurance contracts for which the Franklin Templeton Variable Insurance Products Trust serves as an underlying investment vehicle. Total return is not annualized for periods less than one year.
eRatios are annualized for periods less than one year.
fBenefit of expense reduction rounds to less than 0.01%.
The accompanying notes are an integral part of these financial statements.
FSC-8
Franklin Templeton Variable Insurance Products Trust
Financial Highlights (continued)
Franklin Small-Mid Cap Growth Securities Fund
| Six Months Ended June 30, 2012 (unaudited) | Year Ended December 31, | |||||||||||||||||||||||
| Class 2 | 2011 | 2010 | 2009 | 2008 | 2007 | |||||||||||||||||||
| ||||||||||||||||||||||||
Per share operating performance | ||||||||||||||||||||||||
(for a share outstanding throughout the period) | ||||||||||||||||||||||||
Net asset value, beginning of period | $ | 20.49 | $ | 21.54 | $ | 16.87 | $ | 11.75 | $ | 22.91 | $ | 22.13 | ||||||||||||
|
| |||||||||||||||||||||||
Income from investment operationsa: | ||||||||||||||||||||||||
Net investment income (loss)b | (0.05 | ) | (0.10 | ) | (0.06 | ) | (0.13 | )c | (0.03 | ) | (0.08 | ) | ||||||||||||
Net realized and unrealized gains (losses) | 1.23 | (0.95 | ) | 4.73 | 5.25 | (8.77 | ) | 2.61 | ||||||||||||||||
|
| |||||||||||||||||||||||
Total from investment operations | 1.18 | (1.05 | ) | 4.67 | 5.12 | (8.80 | ) | 2.53 | ||||||||||||||||
|
| |||||||||||||||||||||||
Less distributions from net realized gains | (1.58 | ) | — | — | — | (2.36 | ) | (1.75 | ) | |||||||||||||||
|
| |||||||||||||||||||||||
Net asset value, end of period | $ | 20.09 | $ | 20.49 | $ | 21.54 | $ | 16.87 | $ | 11.75 | $ | 22.91 | ||||||||||||
|
| |||||||||||||||||||||||
Total returnd | 5.85% | (4.87)% | 27.68% | 43.57% | (42.49)% | 11.24% | ||||||||||||||||||
Ratios to average net assetse | ||||||||||||||||||||||||
Expenses | 1.04% | 1.04% | 1.04% | 1.05% | f | 1.01% | f | 0.99% | f | |||||||||||||||
Net investment income (loss) | (0.47)% | (0.46)% | (0.32)% | (0.97)% | c | (0.19)% | (0.35)% | |||||||||||||||||
Supplemental data | ||||||||||||||||||||||||
Net assets, end of period (000’s) | $ | 705,616 | $ | 717,086 | $ | 939,481 | $ | 813,480 | $ | 614,053 | $ | 1,217,177 | ||||||||||||
Portfolio turnover rate | 20.40% | 45.00% | 46.69% | 63.93% | 60.12% | 66.94% | ||||||||||||||||||
aThe amount shown for a share outstanding throughout the period may not correlate with the Statement of Operations for the period due to the timing of sales and repurchases of the Fund shares in relation to income earned and/or fluctuating market value of the investments of the Fund.
bBased on average daily shares outstanding.
cNet investment income per share includes approximately $(0.06) per share as a return of capital adjustment to a previously recorded special dividend received by the Fund. Excluding this non-recurring amount, the ratio of net investment income to average net assets would have been (0.47)%.
dTotal return does not include fees, charges or expenses imposed by the variable annuity and life insurance contracts for which the Franklin Templeton Variable Insurance Products Trust serves as an underlying investment vehicle. Total return is not annualized for periods less than one year.
eRatios are annualized for periods less than one year.
fBenefit of expense reduction rounds to less than 0.01%.
The accompanying notes are an integral part of these financial statements.
FSC-9
Franklin Templeton Variable Insurance Products Trust
Financial Highlights (continued)
Franklin Small-Mid Cap Growth Securities Fund
| Six Months Ended June 30, 2012 (unaudited) | Year Ended December 31, | |||||||||||||||||||
| Class 4 | 2011 | 2010 | 2009 | 2008a | ||||||||||||||||
| ||||||||||||||||||||
Per share operating performance | ||||||||||||||||||||
(for a share outstanding throughout the period) | ||||||||||||||||||||
Net asset value, beginning of period | $ | 20.90 | $ | 21.98 | $ | 17.24 | $ | 12.02 | $ | 20.60 | ||||||||||
|
| |||||||||||||||||||
Income from investment operationsb: | ||||||||||||||||||||
Net investment income (loss)c | (0.06 | ) | (0.12 | ) | (0.07 | ) | (0.15 | )d | 0.02 | |||||||||||
Net realized and unrealized gains (losses) | 1.25 | (0.96 | ) | 4.81 | 5.37 | (6.24 | ) | |||||||||||||
|
| |||||||||||||||||||
Total from investment operations | 1.19 | (1.08 | ) | 4.74 | 5.22 | (6.22 | ) | |||||||||||||
|
| |||||||||||||||||||
Less distributions from net realized gains | (1.58 | ) | — | — | — | (2.36 | ) | |||||||||||||
|
| |||||||||||||||||||
Net asset value, end of period | $ | 20.51 | $ | 20.90 | $ | 21.98 | $ | 17.24 | $ | 12.02 | ||||||||||
|
| |||||||||||||||||||
Total returne | 5.83% | (4.91)% | 27.49% | 43.43% | (34.74)% | |||||||||||||||
Ratios to average net assetsf | ||||||||||||||||||||
Expenses | 1.14% | 1.14% | 1.14% | 1.15% | g | 1.11% | g | |||||||||||||
Net investment income (loss) | (0.57)% | (0.56)% | (0.42)% | (1.07)% | d | (0.29)% | ||||||||||||||
Supplemental data | ||||||||||||||||||||
Net assets, end of period (000’s) | $ | 15,776 | $ | 12,664 | $ | 15,413 | $ | 11,029 | $ | 3,538 | ||||||||||
Portfolio turnover rate | 20.40% | 45.00% | 46.69% | 63.93% | 60.12% | |||||||||||||||
aFor the period February 29, 2008 (effective date) to December 31, 2008.
bThe amount shown for a share outstanding throughout the period may not correlate with the Statement of Operations for the period due to the timing of sales and repurchases of the Fund shares in relation to income earned and/or fluctuating market value of the investments of the Fund.
cBased on average daily shares outstanding.
dNet investment income per share includes approximately $(0.06) per share as a return of capital adjustment to a previously recorded special dividend received by the Fund. Excluding this non-recurring amount, the ratio of net investment income to average net assets would have been (0.57)%.
eTotal return does not include fees, charges or expenses imposed by the variable annuity and life insurance contracts for which the Franklin Templeton Variable Insurance Products Trust serves as an underlying investment vehicle. Total return is not annualized for periods less than one year.
fRatios are annualized for periods less than one year.
gBenefit of expense reduction rounds to less than 0.01%.
The accompanying notes are an integral part of these financial statements.
FSC-10
Franklin Templeton Variable Insurance Products Trust
Statement of Investments, June 30, 2012 (unaudited)
| Franklin Small-Mid Cap Growth Securities Fund | Shares/ Warrants | Value | ||||||
Common Stocks and Other Equity Interests 98.9% | ||||||||
Consumer Discretionary 24.1% | ||||||||
a,bBlue Nile Inc. | 40,900 | $ | 1,215,139 | |||||
aBorgWarner Inc. | 192,000 | 12,593,280 | ||||||
aBuffalo Wild Wings Inc. | 110,000 | 9,530,400 | ||||||
aChipotle Mexican Grill Inc. | 21,000 | 7,978,950 | ||||||
Dick’s Sporting Goods Inc. | 259,300 | 12,446,400 | ||||||
aDiscovery Communications Inc., A | 142,700 | 7,705,800 | ||||||
aDiscovery Communications Inc., C | 62,400 | 3,125,616 | ||||||
aDollar General Corp. | 250,000 | 13,597,500 | ||||||
Guess? Inc. | 240,100 | 7,291,837 | ||||||
a,bHomeAway Inc. | 85,000 | 1,847,900 | ||||||
aIconix Brand Group Inc. | 168,100 | 2,936,707 | ||||||
International Game Technology | 360,200 | 5,673,150 | ||||||
Jarden Corp. | 250,000 | 10,505,000 | ||||||
aLululemon Athletica Inc. (Canada) | 76,000 | 4,531,880 | ||||||
Marriott International Inc., A | 250,000 | 9,800,000 | ||||||
Nordstrom Inc. | 85,000 | 4,223,650 | ||||||
a,bPeet’s Coffee & Tea Inc. | 168,500 | 10,116,740 | ||||||
Ralph Lauren Corp. | 63,200 | 8,851,792 | ||||||
Starwood Hotels & Resorts Worldwide Inc. | 96,100 | 5,097,144 | ||||||
aTenneco Inc. | 195,800 | 5,251,356 | ||||||
Tiffany & Co. | 85,000 | 4,500,750 | ||||||
Tractor Supply Co. | 105,000 | 8,721,300 | ||||||
Ulta Salon Cosmetics & Fragrance Inc. | 75,000 | 7,003,500 | ||||||
aUnder Armour Inc., A | 87,794 | 8,294,777 | ||||||
aUrban Outfitters Inc. | 200,000 | 5,518,000 | ||||||
Wolverine World Wide Inc. | 225,000 | 8,725,500 | ||||||
Wynn Resorts Ltd. | 48,000 | 4,978,560 | ||||||
|
| |||||||
| 192,062,628 | ||||||||
|
| |||||||
Consumer Staples 6.1% | ||||||||
a,bBoston Beer Inc., A | 85,000 | 10,285,000 | ||||||
Mead Johnson Nutrition Co., A | 110,400 | 8,888,304 | ||||||
aMonster Beverage Corp. | 131,500 | 9,362,800 | ||||||
aTreeHouse Foods Inc. | 143,900 | 8,963,531 | ||||||
Whole Foods Market Inc. | 115,000 | 10,961,800 | ||||||
|
| |||||||
| 48,461,435 | ||||||||
|
| |||||||
Energy 7.6% | ||||||||
aCameron International Corp. | 153,700 | 6,564,527 | ||||||
aFMC Technologies Inc. | 120,000 | 4,707,600 | ||||||
aOil States International Inc. | 87,000 | 5,759,400 | ||||||
QEP Resources Inc. | 475,000 | 14,235,750 | ||||||
SM Energy Co. | 176,500 | 8,667,915 | ||||||
aSuperior Energy Services Inc. | 310,000 | 6,271,300 | ||||||
aWhiting Petroleum Corp. | 355,000 | 14,597,600 | ||||||
|
| |||||||
| 60,804,092 | ||||||||
|
| |||||||
Financials 7.1% | ||||||||
aAffiliated Managers Group Inc. | 96,100 | 10,518,145 | ||||||
Comerica Inc. | 360,000 | 11,055,600 | ||||||
Hancock Holding Co. | 156,000 | 4,748,640 | ||||||
aIntercontinentalExchange Inc. | 49,908 | 6,786,490 | ||||||
Jones Lang LaSalle Inc. | 125,000 | 8,796,250 | ||||||
FSC-11
Franklin Templeton Variable Insurance Products Trust
Statement of Investments, June 30, 2012 (unaudited) (continued)
| Franklin Small-Mid Cap Growth Securities Fund | Shares/ Warrants | Value | ||||||
Common Stocks and Other Equity Interests (continued) | ||||||||
Financials (continued) | ||||||||
Lazard Ltd., A | 200,000 | $ | 5,198,000 | |||||
aSignature Bank | 105,000 | 6,401,850 | ||||||
T. Rowe Price Group Inc. | 50,000 | 3,148,000 | ||||||
|
| |||||||
| 56,652,975 | ||||||||
|
| |||||||
Health Care 12.4% | ||||||||
Agilent Technologies Inc. | 150,000 | 5,886,000 | ||||||
aAlexion Pharmaceuticals Inc. | 90,000 | 8,937,000 | ||||||
aAllscripts Healthcare Solutions Inc. | 275,600 | 3,012,308 | ||||||
aBioMarin Pharmaceutical Inc. | 12,000 | 474,960 | ||||||
aCareFusion Corp. | 149,300 | 3,834,024 | ||||||
aCerner Corp. | 144,000 | 11,903,040 | ||||||
aDaVita Inc. | 111,700 | 10,970,057 | ||||||
aHospira Inc. | 60,000 | 2,098,800 | ||||||
aIDEXX Laboratories Inc. | 4,272 | 410,667 | ||||||
aIllumina Inc. | 40,000 | 1,615,600 | ||||||
aIntuitive Surgical Inc. | 17,000 | 9,414,430 | ||||||
aMedivation Inc. | 35,000 | 3,199,000 | ||||||
aMettler-Toledo International Inc. | 38,300 | 5,969,055 | ||||||
aOnyx Pharmaceuticals Inc. | 35,600 | 2,365,620 | ||||||
aRegeneron Pharmaceuticals Inc. | 13,400 | 1,530,548 | ||||||
a,bStereotaxis Inc. | 631,400 | 132,594 | ||||||
a,cStereotaxis Inc., 144A | 1,228,433 | 232,174 | ||||||
a,cStereotaxis Inc., wts., 144A, 5/07/18 | 1,228,433 | 195,689 | ||||||
aThoratec Corp. | 90,000 | 3,022,200 | ||||||
aVarian Medical Systems Inc. | 115,000 | 6,988,550 | ||||||
aVertex Pharmaceuticals Inc. | 50,000 | 2,796,000 | ||||||
aWaters Corp. | 73,100 | 5,809,257 | ||||||
aWatson Pharmaceuticals Inc. | 105,000 | 7,768,950 | ||||||
|
| |||||||
| 98,566,523 | ||||||||
|
| |||||||
Industrials 14.4% | ||||||||
aAllegiant Travel Co. | 86,500 | 6,027,320 | ||||||
AMETEK Inc. | 253,200 | 12,637,212 | ||||||
aBE Aerospace Inc. | 135,000 | 5,894,100 | ||||||
Cummins Inc. | 60,000 | 5,814,600 | ||||||
Fastenal Co. | 192,000 | 7,739,520 | ||||||
Flowserve Corp. | 50,000 | 5,737,500 | ||||||
Fluor Corp. | 90,300 | 4,455,402 | ||||||
Gardner Denver Inc. | 45,000 | 2,380,950 | ||||||
aHexcel Corp. | 185,000 | 4,771,150 | ||||||
aIHS Inc., A | 24,500 | 2,639,385 | ||||||
J.B. Hunt Transport Services Inc. | 124,300 | 7,408,280 | ||||||
Kansas City Southern | 85,000 | 5,912,600 | ||||||
The Manitowoc Co. Inc. | 100,000 | 1,170,000 | ||||||
Pall Corp. | 91,500 | 5,015,115 | ||||||
Robert Half International Inc. | 192,000 | 5,485,440 | ||||||
Rockwell Automation Inc. | 160,000 | 10,569,600 | ||||||
Roper Industries Inc. | 118,000 | 11,632,440 | ||||||
aSensata Technologies Holding NV | 250,000 | 6,695,000 | ||||||
aVerisk Analytics Inc., A | 66,000 | 3,251,160 | ||||||
|
| |||||||
| 115,236,774 | ||||||||
|
| |||||||
FSC-12
Franklin Templeton Variable Insurance Products Trust
Statement of Investments, June 30, 2012 (unaudited) (continued)
| Franklin Small-Mid Cap Growth Securities Fund | Shares/ Warrants | Value | ||||||
Common Stocks and Other Equity Interests (continued) | ||||||||
Information Technology 22.1% | ||||||||
aAcme Packet Inc. | 165,000 | $ | 3,077,250 | |||||
aAlliance Data Systems Corp. | 55,000 | 7,425,000 | ||||||
aANSYS Inc. | 165,000 | 10,413,150 | ||||||
Avago Technologies Ltd. (Singapore) | 260,000 | 9,334,000 | ||||||
aBottomline Technologies Inc. | 145,000 | 2,617,250 | ||||||
aCheck Point Software Technologies Ltd. (Israel) | 75,000 | 3,719,250 | ||||||
aCitrix Systems Inc. | 105,000 | 8,813,700 | ||||||
aCommVault Systems Inc. | 110,000 | 5,452,700 | ||||||
aElectronic Arts Inc. | 275,000 | 3,396,250 | ||||||
aEquinix Inc. | 30,000 | 5,269,500 | ||||||
aF5 Networks Inc. | 70,000 | 6,969,200 | ||||||
FactSet Research Systems Inc. | 60,000 | 5,576,400 | ||||||
aFortinet Inc. | 40,600 | 942,732 | ||||||
a,bHigher One Holdings Inc. | 350,000 | 4,277,000 | ||||||
aHittite Microwave Corp. | 165,800 | 8,475,696 | ||||||
aInformatica Corp. | 150,000 | 6,354,000 | ||||||
aLinkedIn Corp., A | 26,700 | 2,837,409 | ||||||
aNuance Communications Inc. | 500,000 | 11,910,000 | ||||||
aNXP Semiconductors NV (Netherlands) | 125,000 | 2,906,250 | ||||||
aRed Hat Inc. | 183,700 | 10,375,376 | ||||||
aRiverbed Technology Inc. | 150,000 | 2,422,500 | ||||||
aShoretel Inc. | 288,100 | 1,261,878 | ||||||
aSilicon Laboratories Inc. | 171,300 | 6,492,270 | ||||||
aTeradata Corp. | 70,000 | 5,040,700 | ||||||
aTrimble Navigation Ltd. | 300,000 | 13,803,000 | ||||||
aVeriFone Systems Inc. | 150,000 | 4,963,500 | ||||||
aViaSat Inc. | 163,300 | 6,167,841 | ||||||
Western Union Co. | 350,000 | 5,894,000 | ||||||
Xilinx Inc. | 264,200 | 8,869,194 | ||||||
a,bZynga Inc. | 300,000 | 1,632,000 | ||||||
|
| |||||||
| 176,688,996 | ||||||||
|
| |||||||
Materials 3.0% | ||||||||
Albemarle Corp. | 60,000 | 3,578,400 | ||||||
Celanese Corp., A | 217,800 | 7,540,236 | ||||||
The Sherwin-Williams Co. | 50,000 | 6,617,500 | ||||||
Walter Energy Inc. | 150,000 | 6,624,000 | ||||||
|
| |||||||
| 24,360,136 | ||||||||
|
| |||||||
Telecommunication Services 1.4% | ||||||||
aSBA Communications Corp. | 192,000 | 10,953,600 | ||||||
|
| |||||||
Utilities 0.7% | ||||||||
aCalpine Corp. | 336,200 | 5,550,662 | ||||||
|
| |||||||
Total Common Stocks and Other Equity Interests (Cost $597,990,506) | 789,337,821 | |||||||
|
| |||||||
Short Term Investments 3.3% | ||||||||
Money Market Funds (Cost $5,211,736) 0.6% | ||||||||
a,dInstitutional Fiduciary Trust Money Market Portfolio | 5,211,736 | 5,211,736 | ||||||
|
| |||||||
FSC-13
Franklin Templeton Variable Insurance Products Trust
Statement of Investments, June 30, 2012 (unaudited) (continued)
| Franklin Small-Mid Cap Growth Securities Fund | Shares/ Warrants | Value | ||||||
Short Term Investments (continued) | ||||||||
eInvestments from Cash Collateral Received for Loaned Securities | ||||||||
Money Market Funds 2.7% | ||||||||
fBNY Mellon Overnight Government Fund, 0.182% | 21,258,325 | $ | 21,258,325 | |||||
|
| |||||||
Total Investments (Cost $624,460,567) 102.2% | 815,807,882 | |||||||
Other Assets, less Liabilities (2.2)% | (17,898,121 | ) | ||||||
|
| |||||||
Net Assets 100.0% | $ | 797,909,761 | ||||||
|
| |||||||
aNon-income producing.
bA portion or all of the security is on loan at June 30, 2012. See Note 1(b).
cSee Note 8 regarding restricted securities.
dSee Note 7 regarding investments in the Institutional Fiduciary Trust Money Market Portfolio.
eSee Note 1(b) regarding securities on loan.
fThe rate shown is the annualized seven-day yield at period end.
The accompanying notes are an integral part of these financial statements.
FSC-14
Franklin Templeton Variable Insurance Products Trust
Financial Statements
Statement of Assets and Liabilities
June 30, 2012 (unaudited)
| Franklin Small-Mid Cap Growth Securities Fund | ||||
Assets: | ||||
Investments in securities: | ||||
Cost - Unaffiliated issuers | $ | 619,248,831 | ||
Cost - Sweep Money Fund (Note 7) | 5,211,736 | |||
|
| |||
Total cost of investments | $ | 624,460,567 | ||
|
| |||
Value - Unaffiliated issuers | $ | 810,596,146 | ||
Value - Sweep Money Fund (Note 7) | 5,211,736 | |||
|
| |||
Total value of investments (includes securities loaned in the amount of $21,297,578) | 815,807,882 | |||
Receivables: | ||||
Investment securities sold | 5,100,748 | |||
Capital shares sold | 29,079 | |||
Dividends and interest | 341,280 | |||
Other assets | 197,882 | |||
|
| |||
Total assets | 821,476,871 | |||
|
| |||
Liabilities: | ||||
Payables: | ||||
Investment securities purchased | 377,983 | |||
Capital shares redeemed | 813,936 | |||
Affiliates | 788,564 | |||
Payable upon return of securities loaned | 21,258,325 | |||
Accrued expenses and other liabilities | 328,302 | |||
|
| |||
Total liabilities | 23,567,110 | |||
|
| |||
Net assets, at value | $ | 797,909,761 | ||
|
| |||
Net assets consist of: | ||||
Paid-in capital | $ | 575,028,439 | ||
Undistributed net investment income (loss) | (1,924,103 | ) | ||
Net unrealized appreciation (depreciation) | 191,347,315 | |||
Accumulated net realized gain (loss) | 33,458,110 | |||
|
| |||
Net assets, at value | $ | 797,909,761 | ||
|
| |||
Class 1: | ||||
Net assets, at value | $ | 76,517,205 | ||
|
| |||
Shares outstanding | 3,667,404 | |||
|
| |||
Net asset value and maximum offering price per share | $ | 20.86 | ||
|
| |||
Class 2: | ||||
Net assets, at value | $ | 705,616,300 | ||
|
| |||
Shares outstanding | 35,115,229 | |||
|
| |||
Net asset value and maximum offering price per share | $ | 20.09 | ||
|
| |||
Class 4: | ||||
Net assets, at value | $ | 15,776,256 | ||
|
| |||
Shares outstanding | 769,234 | |||
|
| |||
Net asset value and maximum offering price per share | $ | 20.51 | ||
|
| |||
The accompanying notes are an integral part of these financial statements.
FSC-15
Franklin Templeton Variable Insurance Products Trust
Financial Statements (continued)
Statement of Operations
for the six months ended June 30, 2012 (unaudited)
| Franklin Small-Mid Cap Growth Securities Fund | ||||
Investment income: | ||||
Dividends | $ | 2,072,528 | ||
Income from securities loaned | 361,673 | |||
|
| |||
Total investment income | 2,434,201 | |||
|
| |||
Expenses: | ||||
Management fees (Note 3a) | 2,151,202 | |||
Administrative fees (Note 3b) | 1,066,065 | |||
Distribution fees: (Note 3c) | ||||
Class 2 | 947,155 | |||
Class 4 | 27,378 | |||
Unaffiliated transfer agent fees | 1,710 | |||
Custodian fees (Note 4) | 6,031 | |||
Reports to shareholders | 123,328 | |||
Professional fees | 21,069 | |||
Trustees’ fees and expenses | 1,908 | |||
Other | 12,458 | |||
|
| |||
Total expenses | 4,358,304 | |||
|
| |||
Net investment income (loss) | (1,924,103 | ) | ||
|
| |||
Realized and unrealized gains (losses): | ||||
Net realized gain (loss) from investments | 35,605,476 | |||
Net change in unrealized appreciation (depreciation) on investments | 14,688,589 | |||
|
| |||
Net realized and unrealized gain (loss) | 50,294,065 | |||
|
| |||
Net increase (decrease) in net assets resulting from operations | $ | 48,369,962 | ||
|
| |||
The accompanying notes are an integral part of these financial statements.
FSC-16
Franklin Templeton Variable Insurance Products Trust
Financial Statements (continued)
Statements of Changes in Net Assets
| Franklin Small-Mid Cap Growth Securities Fund | ||||||||
| Six Months Ended June 30, 2012 (unaudited) | Year Ended December 31, 2011 | |||||||
| ||||||||
Increase (decrease) in net assets: | ||||||||
Operations: | ||||||||
Net investment income (loss) | $ | (1,924,103 | ) | $ | (4,181,310 | ) | ||
Net realized gain (loss) from investments | 35,605,476 | 95,464,105 | ||||||
Net change in unrealized appreciation (depreciation) on investments | 14,688,589 | (133,141,452 | ) | |||||
| ||||||||
Net increase (decrease) in net assets resulting from operations | 48,369,962 | (41,858,657 | ) | |||||
| ||||||||
Distributions to shareholders from: | ||||||||
Net realized gains: | ||||||||
Class 1 | (5,398,642 | ) | — | |||||
Class 2 | (51,973,132 | ) | — | |||||
Class 4 | (1,174,175 | ) | — | |||||
| ||||||||
Total distributions to shareholders | (58,545,949 | ) | — | |||||
| ||||||||
Capital share transactions: (Note 2) | ||||||||
Class 1 | 785,241 | (9,862,944 | ) | |||||
Class 2 | (2,587,712 | ) | (184,782,471 | ) | ||||
Class 4 | 3,753,871 | (2,082,119 | ) | |||||
| ||||||||
Total capital share transactions | 1,951,400 | (196,727,534 | ) | |||||
| ||||||||
Net increase (decrease) in net assets | (8,224,587 | ) | (238,586,191 | ) | ||||
Net assets: | ||||||||
Beginning of period | 806,134,348 | 1,044,720,539 | ||||||
| ||||||||
End of period | $ | 797,909,761 | $ | 806,134,348 | ||||
| ||||||||
Undistributed net investment income (loss) included in net assets: | ||||||||
End of period | $ | (1,924,103 | ) | $ | — | |||
| ||||||||
The accompanying notes are an integral part of these financial statements.
FSC-17
Franklin Templeton Variable Insurance Products Trust
Notes to Financial Statements (unaudited)
Franklin Small-Mid Cap Growth Securities Fund
1. ORGANIZATION AND SIGNIFICANT ACCOUNTING POLICIES
Franklin Templeton Variable Insurance Products Trust (Trust) is registered under the Investment Company Act of 1940, as amended, (1940 Act) as an open-end investment company, consisting of twenty separate funds. The Franklin Small-Mid Cap Growth Securities Fund (Fund) is included in this report. The financial statements of the remaining funds in the Trust are presented separately. Shares of the Fund are generally sold only to insurance company separate accounts to fund the benefits of variable life insurance policies or variable annuity contracts. The Fund offers three classes of shares: Class 1, Class 2, and Class 4. Each class of shares differs by its distribution fees, voting rights on matters affecting a single class and its exchange privilege.
The following summarizes the Fund’s significant accounting policies.
a. Financial Instrument Valuation
The Fund’s investments in financial instruments are carried at fair value daily. Fair value is the price that would be received to sell an asset or paid to transfer a liability in an orderly transaction between market participants on the measurement date. Under procedures approved by the Trust’s Board of Trustees (the Board), the Fund’s administrator, investment manager and other affiliates have formed the Valuation and Liquidity Oversight Committee (VLOC). The VLOC provides administration and oversight of the Fund’s valuation policies and procedures, which are approved annually by the Board. Among other things, these procedures allow the Fund to utilize independent pricing services, quotations from securities and financial instrument dealers, and other market sources to determine fair value.
Equity securities listed on an exchange or on the NASDAQ National Market System are valued at the last quoted sale price or the official closing price of the day, respectively. Foreign equity securities are valued as of the close of trading on the foreign stock exchange on which the security is primarily traded, or the NYSE, whichever is earlier. The value is then converted into its U.S. dollar equivalent at the foreign exchange rate in effect at the close of the NYSE on the day that the value of the security is determined. Over-the-counter securities are valued within the range of the most recent quoted bid and ask prices. Securities that trade in multiple markets or on multiple exchanges are valued according to the broadest and most representative market. Certain equity securities are valued based upon fundamental characteristics or relationships to similar securities. Investments in open-end mutual funds and non-registered money market funds are valued at the closing net asset value.
The Fund has procedures to determine the fair value of financial instruments for which market prices are not reliable or readily available. Under these procedures, the VLOC convenes on a regular basis to review such financial instruments and considers a number of factors, including significant unobservable valuation inputs, when arriving at fair value. The VLOC primarily employs a market-based approach which may use related or comparable assets or liabilities, recent transactions, market multiples, book values, and other relevant information for the investment to determine the fair value of the investment. An income-based valuation approach may also be used in which the anticipated future cash flows of the investment are discounted to calculate fair value. Discounts may also be applied due to the nature or duration of any restrictions on the disposition of the investments. Due to the inherent uncertainty of valuations of such investments, the fair values may differ significantly from the values that would have been used had an active market existed. The VLOC employs various methods for calibrating these valuation approaches including a regular review of key inputs and assumptions, transactional back-testing or disposition analysis, and reviews of any related market activity.
b. Securities Lending
The Fund participates in an agency based securities lending program. The fund receives cash collateral against the loaned securities in an amount equal to at least 102% of the market value of the loaned securities. Collateral is maintained over the life of the loan in an amount not less than 100% of the market value of loaned securities, as determined at the close of fund business each day; any additional collateral required due to changes in security values is delivered to the fund on the next business day. The collateral is invested in a non-registered money fund as indicated on the Statement of Investments. The fund receives income from the investment of cash collateral, in addition to lending fees and rebates paid by the borrower. The fund bears the
FSC-18
Franklin Templeton Variable Insurance Products Trust
Notes to Financial Statements (unaudited) (continued)
Franklin Small-Mid Cap Growth Securities Fund
1. ORGANIZATION AND SIGNIFICANT ACCOUNTING POLICIES (continued)
b. Securities Lending (continued)
market risk with respect to the collateral investment, securities loaned, and the risk that the agent may default on its obligations to the fund. The securities lending agent has agreed to indemnify the fund in the event of default by a third party borrower.
c. Income Taxes
It is the Fund’s policy to qualify as a regulated investment company under the Internal Revenue Code. The Fund intends to distribute to shareholders substantially all of its taxable income and net realized gains to relieve it from federal income and if applicable, excise taxes. As a result, no provision for U.S. federal income taxes is required.
The Fund recognizes the tax benefits of uncertain tax positions only when the position is “more likely than not” to be sustained upon examination by the tax authorities based on the technical merits of the tax position. As of June 30, 2012, and for all open tax years, the Fund has determined that no liability for unrecognized tax benefits is required in the Fund’s financial statements related to uncertain tax positions taken on a tax return (or expected to be taken on future tax returns). Open tax years are those that remain subject to examination and are based on each tax jurisdiction statute of limitation.
d. Security Transactions, Investment Income, Expenses and Distributions
Security transactions are accounted for on trade date. Realized gains and losses on security transactions are determined on a specific identification basis. Estimated expenses are accrued daily. Dividend income is recorded on the ex-dividend date. Distributions to shareholders are recorded on the ex-dividend date and are determined according to income tax regulations (tax basis). Distributable earnings determined on a tax basis may differ from earnings recorded in accordance with accounting principles generally accepted in the United States of America. These differences may be permanent or temporary. Permanent differences are reclassified among capital accounts to reflect their tax character. These reclassifications have no impact on net assets or the results of operations. Temporary differences are not reclassified, as they may reverse in subsequent periods.
Common expenses incurred by the Trust are allocated among the funds based on the ratio of net assets of each fund to the combined net assets of the Trust. Fund specific expenses are charged directly to the fund that incurred the expense.
Realized and unrealized gains and losses and net investment income, not including class specific expenses, are allocated daily to each class of shares based upon the relative proportion of net assets of each class. Differences in per share distributions, by class, are generally due to differences in class specific expenses.
e. Accounting Estimates
The preparation of financial statements in accordance with accounting principles generally accepted in the United States of America requires management to make estimates and assumptions that affect the reported amounts of assets and liabilities at the date of the financial statements and the amounts of income and expenses during the reporting period. Actual results could differ from those estimates.
f. Guarantees and Indemnifications
Under the Trust’s organizational documents, its officers and trustees are indemnified by the Trust against certain liabilities arising out of the performance of their duties to the Trust. Additionally, in the normal course of business, the Trust, on behalf of the Fund, enters into contracts with service providers that contain general indemnification clauses. The Trust’s maximum exposure under these arrangements is unknown as this would involve future claims that may be made against the Trust that have not yet occurred. Currently, the Trust expects the risk of loss to be remote.
FSC-19
Franklin Templeton Variable Insurance Products Trust
Notes to Financial Statements (unaudited) (continued)
Franklin Small-Mid Cap Growth Securities Fund
2. SHARES OF BENEFICIAL INTEREST
At June 30, 2012, there were an unlimited number of shares authorized (without par value). Transactions in the Fund’s shares were as follows:
| Six Months Ended June 30, 2012 | Year Ended December 31, 2011 | |||||||||||||||
| Class 1 Shares: | Shares | Amount | Shares | Amount | ||||||||||||
Shares sold | 55,275 | $ | 1,273,885 | 213,179 | $ | 4,851,501 | ||||||||||
Shares issued in reinvestment of distributions | 261,943 | 5,398,642 | — | — | ||||||||||||
Shares redeemed | (253,894 | ) | (5,887,286 | ) | (652,643 | ) | (14,714,445 | ) | ||||||||
| ||||||||||||||||
Net increase (decrease) | 63,324 | $ | 785,241 | (439,464 | ) | $ | (9,862,944 | ) | ||||||||
| ||||||||||||||||
Class 2 Shares: | ||||||||||||||||
Shares sold | 1,228,507 | $ | 27,765,708 | 3,213,965 | $ | 70,946,756 | ||||||||||
Shares issued in reinvestment of distributions | 2,618,294 | 51,973,132 | — | — | ||||||||||||
Shares redeemed | (3,722,093 | ) | (82,326,552 | ) | (11,848,847 | ) | (255,729,227 | ) | ||||||||
| ||||||||||||||||
Net increase (decrease) | 124,708 | $ | (2,587,712 | ) | (8,634,882 | ) | $ | (184,782,471 | ) | |||||||
| ||||||||||||||||
Class 4 Shares: | ||||||||||||||||
Shares sold | 189,962 | $ | 4,425,936 | 311,193 | $ | 7,039,340 | ||||||||||
Shares issued on reinvestment of distributions | 57,955 | 1,174,175 | — | — | ||||||||||||
Shares redeemed | (84,745 | ) | (1,846,240 | ) | (406,340 | ) | (9,121,459 | ) | ||||||||
| ||||||||||||||||
Net increase (decrease) | 163,172 | $ | 3,753,871 | (95,147 | ) | $ | (2,082,119 | ) | ||||||||
| ||||||||||||||||
3. TRANSACTIONS WITH AFFILIATES
Franklin Resources, Inc. is the holding company for various subsidiaries that together are referred to as Franklin Templeton Investments. Certain officers and trustees of the Fund are also officers and/or directors of the following subsidiaries:
| Subsidiary | Affiliation | |
Franklin Advisers, Inc. (Advisers) | Investment manager | |
Franklin Templeton Services, LLC (FT Services) | Administrative manager | |
Franklin Templeton Distributors, Inc. (Distributors) | Principal underwriter | |
Franklin Templeton Investor Services, LLC (Investor Services) | Transfer agent |
a. Management Fees
The Fund pays an investment management fee to Advisers based on the average daily net assets of the Fund as follows:
| Annualized Fee Rate | Net Assets | |
| 0.550% | Up to and including $500 million | |
| 0.450% | Over $500 million, up to and including $1 billion | |
| 0.400% | Over $1 billion, up to and including $1.5 billion | |
| 0.350% | Over $1.5 billion, up to and including $6.5 billion | |
| 0.325% | Over $6.5 billion, up to and including $11.5 billion | |
| 0.300% | Over $11.5 billion, up to and including $16.5 billion | |
| 0.290% | Over $16.5 billion, up to and including $19 billion | |
| 0.280% | Over $19 billion, up to and including $21.5 billion | |
| 0.270% | In excess of $21.5 billion |
FSC-20
Franklin Templeton Variable Insurance Products Trust
Notes to Financial Statements (unaudited) (continued)
Franklin Small-Mid Cap Growth Securities Fund
3. TRANSACTIONS WITH AFFILIATES (continued)
b. Administrative Fees
The Fund pays an administrative fee to FT Services of 0.25% per year of the average daily net assets of the Fund.
c. Distribution Fees
The Board adopted distribution plans for Class 2 and Class 4 shares pursuant to Rule 12b-1 under the 1940 Act. Under the Fund’s compensation distribution plans, the Fund pays Distributors for costs incurred in connection with the servicing, sale and distribution of the Fund’s shares up to 0.35% per year of its average daily net assets of each class. The Board has agreed to limit the current rate to 0.25% per year for Class 2.
d. Transfer Agent Fees
Investor Services, under terms of an agreement, performs shareholder servicing for the Fund and is not paid by the Fund for the services.
4. EXPENSE OFFSET ARRANGEMENT
The Fund has entered into an arrangement with its custodian whereby credits realized as a result of uninvested cash balances are used to reduce a portion of the Fund’s custodian expenses. During the period ended June 30, 2012, there were no credits earned.
5. INCOME TAXES
At June 30, 2012, the cost of investments and net unrealized appreciation (depreciation) for income tax purposes were as follows:
Cost of investments | $ | 626,779,632 | ||
|
| |||
Unrealized appreciation | $ | 232,971,272 | ||
Unrealized depreciation | (43,943,022 | ) | ||
|
| |||
Net unrealized appreciation (depreciation) | $ | 189,028,250 | ||
|
| |||
Differences between income and/or capital gains as determined on a book basis and a tax basis are primarily due to differing treatment of wash sales.
6. INVESTMENT TRANSACTIONS
Purchases and sales of investments (excluding short term securities) for the period ended June 30, 2012, aggregated $168,976,531 and $223,886,828, respectively.
7. INVESTMENTS IN INSTITUTIONAL FIDUCIARY TRUST MONEY MARKET PORTFOLIO
The Fund invests in the Institutional Fiduciary Trust Money Market Portfolio (Sweep Money Fund), an open-end investment company managed by Advisers. Management fees paid by the Fund are reduced on assets invested in the Sweep Money Fund, in an amount not to exceed the management and administrative fees paid by the Sweep Money Fund.
FSC-21
Franklin Templeton Variable Insurance Products Trust
Notes to Financial Statements (unaudited) (continued)
Franklin Small-Mid Cap Growth Securities Fund
8. RESTRICTED SECURITIES
The Fund invests in securities that are restricted under the Securities Act of 1933 (1933 Act) or which are subject to legal, contractual, or other agreed upon restrictions on resale. Restricted securities are often purchased in private placement transactions, and cannot be sold without prior registration unless the sale is pursuant to an exemption under the 1933 Act. Disposal of these securities may require greater effort and expense, and prompt sale at an acceptable price may be difficult. The Fund may have registration rights for restricted securities. The issuer generally incurs all registration costs.
At June 30, 2012, the Fund held investments in restricted securities, excluding certain securities exempt from registration under the 1933 Act deemed to be liquid, as follows:
| Shares/ Warrants | Issuer | Acquisition Date | Cost | Value | ||||||||||||
| 1,228,433 | aStereotaxis Inc., 144A | 5/07/12 | $ | 412,876 | $ | 232,174 | ||||||||||
| 1,228,433 | aStereotaxis Inc., wts.,144A, 5/07/18 | 5/07/12 | 153,554 | 195,689 | ||||||||||||
|
| |||||||||||||||
Total Restricted Securities (0.05% of Net Assets) |
| $ | 427,863 | |||||||||||||
|
| |||||||||||||||
aThe Fund also invests in an unrestricted security of the issuer, valued at $132,594 as of June 30, 2012.
9. CREDIT FACILITY
The Fund, together with other U.S. registered and foreign investment funds (collectively, Borrowers), managed by Franklin Templeton Investments, are borrowers in a joint syndicated senior unsecured credit facility totaling $1.5 billion (Global Credit Facility) which matures on January 18, 2013. This Global Credit Facility provides a source of funds to the Borrowers for temporary and emergency purposes, including the ability to meet future unanticipated or unusually large redemption requests.
Under the terms of the Global Credit Facility, the Fund shall, in addition to interest charged on any borrowings made by the Fund and other costs incurred by the Fund, pay its share of fees and expenses incurred in connection with the implementation and maintenance of the Global Credit Facility, based upon its relative share of the aggregate net assets of all of the Borrowers, including an annual commitment fee of 0.08% based upon the unused portion of the Global Credit Facility, which is reflected in other expenses on the Statement of Operations. During the period ended June 30, 2012, the Fund did not use the Global Credit Facility.
10. FAIR VALUE MEASUREMENTS
The Fund follows a fair value hierarchy that distinguishes between market data obtained from independent sources (observable inputs) and the Fund’s own market assumptions (unobservable inputs). These inputs are used in determining the value of the Fund’s financial instruments and are summarized in the following fair value hierarchy:
| • | Level 1 – quoted prices in active markets for identical financial instruments |
| • | Level 2 – other significant observable inputs (including quoted prices for similar financial instruments, interest rates, prepayment speed, credit risk, etc.) |
| • | Level 3 – significant unobservable inputs (including the Fund’s own assumptions in determining the fair value of financial instruments) |
The inputs or methodology used for valuing financial instruments are not an indication of the risk associated with investing in those financial instruments.
For movements between the levels within the fair value hierarchy, the Fund has adopted a policy of recognizing the transfers as of the date of the underlying event which caused the movement.
FSC-22
Franklin Templeton Variable Insurance Products Trust
Notes to Financial Statements (unaudited) (continued)
Franklin Small-Mid Cap Growth Securities Fund
10. FAIR VALUE MEASUREMENTS (continued)
A summary of inputs used as of June 30, 2012, in valuing the Fund’s assets carried at fair value, is as follows:
| Level 1 | Level 2 | Level 3 | Total | |||||||||||||
|
| |||||||||||||||
Assets: | ||||||||||||||||
Investments in Securities: | ||||||||||||||||
Equity Securities: | ||||||||||||||||
Health Care | $ | 98,138,660 | $ | — | $ | 427,863 | $ | 98,566,523 | ||||||||
Other Equity Investmentsa | 690,771,298 | — | — | 690,771,298 | ||||||||||||
Short Term Investments | 5,211,736 | 21,258,325 | — | 26,470,061 | ||||||||||||
|
| |||||||||||||||
Total Investments in Securities | $ | 794,121,694 | $ | 21,258,325 | $ | 427,863 | $ | 815,807,882 | ||||||||
|
| |||||||||||||||
aFor detailed categories, see the accompanying Statement of Investments.
A reconciliation of assets in which Level 3 inputs are used in determining fair value is presented when there are significant Level 3 investments at the end of the period.
11. NEW ACCOUNTING PRONOUNCEMENTS
In December 2011, the Financial Accounting Standards Board (FASB) issued Accounting Standards Update (ASU) No. 2011-11, Balance Sheet (Topic 210): Disclosures about Offsetting Assets and Liabilities. The amendments in the ASU enhance disclosures about offsetting of financial assets and liabilities to enable investors to understand the effect of these arrangements on a fund’s financial position. The ASU is effective for interim and annual reporting periods beginning on or after January 1, 2013. The Fund believes the adoption of this ASU will not have a material impact on its financial statements.
12. SUBSEQUENT EVENTS
The Fund has evaluated subsequent events through the issuance of the financial statements and determined that no events have occurred that require disclosure.
FSC-23
FRANKLIN STRATEGIC INCOME SECURITIES FUND
We are pleased to bring you Franklin Strategic Income Securities Fund’s semiannual report for the period ended June 30, 2012.
Performance Summary as of 6/30/12
Franklin Strategic Income Securities Fund – Class 4 delivered a +5.58% total return for the six-month period ended 6/30/12.
Performance reflects the Fund’s Class 4 operating expenses, but does not include any contract fees, expenses or sales charges. If they had been included, performance would be lower. These charges and deductions, particularly for variable life policies, can have a significant effect on contract values and insurance benefits. See the contract prospectus for a complete description of these expenses, including sales charges.
Franklin Strategic Income Securities Fund – Class 4
Performance data represent past performance, which does not guarantee future results. Investment return and principal value will fluctuate, and you may have a gain or loss when you sell your shares.
Current performance may differ from figures shown.
FSI-1
Fund Goals and Main Investments: Franklin Strategic Income Securities Fund seeks a high level of current income, with capital appreciation over the long term as a secondary goal. Under normal market conditions, the Fund invests primarily to predominantly in U.S. and foreign debt securities, including those in emerging markets.
Performance Overview
You can find the Fund’s six-month total return in the Performance Summary. The Fund outperformed the +2.37% total return of its benchmark, the Barclays U.S. Aggregate Index.1 The Fund also outperformed the +5.03% total return of its peers, as measured by the Lipper Multi-Sector Income Funds Classification Average.2
Economic and Market Overview
During the six months under review, uncertainty regarding the eurozone’s future continued to influence financial markets, and U.S. economic data appeared mixed. U.S. manufacturing indicators look to have weakened, employment gains slowed and wage growth was sluggish during the period. However, energy prices declined significantly over the period and housing data strengthened with new and existing home sales as well as house prices pointing toward a gradual strengthening trend, albeit from a low base. The U.S. consumer showed resilience as consumption remained steady even as consumer confidence declined.
The global economic recovery was mixed during the first half of 2012. Emerging markets continued to lead the recovery with many economies returning to and exceeding pre-crisis activity levels. Although some developed economies, such as those of Australia and some Scandinavian countries, also enjoyed relatively strong recoveries, growth in the G-3 (U.S., eurozone and Japan) continued to trail the pace of previous recoveries. Policymakers in the largest developed economies increased their already unprecedented efforts to supply liquidity and with few exceptions, policymakers elsewhere in the world either paused their monetary tightening cycles or reversed previous tightening efforts in response to the external environment. Positive economic data, including first-quarter year-over-year real gross domestic product growth of 2.0% in the U.S. and 8.1% in China, challenged more dire predictions of a severe global economic slowdown.3
1. Source: © 2012 Morningstar.
2. Lipper Inc.
One cannot invest directly in an index, and an index is not representative of the Fund’s portfolio. Please see Index Descriptions following the Fund Summaries.
3. Sources: Bureau of Economic Analysis (U.S.); the website of the National Bureau of Statistics of the People’s Republic of China (www.stats.gov.cn).
Fund Risks: All investments involve risks, including possible loss of principal. As the prices of bonds in the Fund adjust to a rise in interest rates, the Fund’s share price may decline. Risks associated with higher yielding, lower rated securities (junk bonds) include higher risk of default and loss of principal. Floating rate loans and high yield corporate bonds are rated below investment grade and are subject to greater risk of default, which could result in loss of principal. Investments in foreign securities involve risks such as currency fluctuations and political uncertainty. Investments in developing markets involve heightened risks related to the same factors, in addition to those associated with their relatively small size and lesser liquidity. Investing in derivative securities and the use of foreign currency techniques involve special risks as such may not achieve the anticipated benefits and/or may result in losses to the Fund. The Fund is actively managed but there is no guarantee that the manager’s investment decisions will produce the desired results. The Fund’s prospectus also includes a description of the main investment risks.
FSI-2
Financial markets seemed to be largely influenced by politics, sentiment and uncertainty in the eurozone, and they were quick to discount the latest Greek election results. The June 2012 Federal Open Market Committee meeting concluded with the extension of its plan designed to boost the economy by driving down long-term interest rates (dubbed Operation Twist) but made no formal announcement of an additional round of quantitative easing. Increased liquidity creation, particularly from the European Central Bank’s Long-Term Refinancing Operation, and meaningful progress toward coordinated action to address persistent banking and structural economic issues alleviated investor fears of a disorderly sovereign credit event and the potential for financial contagion.
Overall, investor concerns about ongoing eurozone uncertainty, weak U.S. employment gains and a lack of broad public and political agreement on how to achieve U.S. deficit reduction drove the 10-year U.S. Treasury yield from 1.89% on December 31, 2011, to 1.67% on June 30, 2012. In the latter part of the period, commodities extended recent losses, with oil falling back below $100, while the euro dipped and traditional safe havens like U.S. Treasuries, the U.S. dollar and the Japanese yen made gains.
Investment Strategy
We allocate our investments among the various types of debt available based on our assessment of changing economic, global market, industry and issuer conditions. We use a top-down analysis of macroeconomic trends, combined with a bottom-up fundamental analysis of market sectors, industries and issuers, seeking to take advantage of varying sector reactions to economic events. For example, we may evaluate business cycles, yield curves, country risk, and the relative interest rates among currencies, and values between and within markets. In selecting debt securities, we generally conduct our own analysis of the security’s intrinsic value rather than simply relying on the coupon rate or rating. We may also enter into various transactions involving certain currency-, interest rate- or credit-related derivative instruments for hedging purposes, to enhance returns or to obtain exposure to various market sectors.
Manager’s Discussion
During the six-month period ended June 30, 2012, macroeconomic and political headlines continued to drive financial market volatility. Financial markets began to rally in the first quarter of 2012 from their second-half 2011 lows amid healthier U.S. economic data as well as eurozone liquidity backstop measures that helped ease concerns regarding the European banking system. Consequently, during the first quarter the risk aversion that had driven down financial markets in the second half of 2011 had
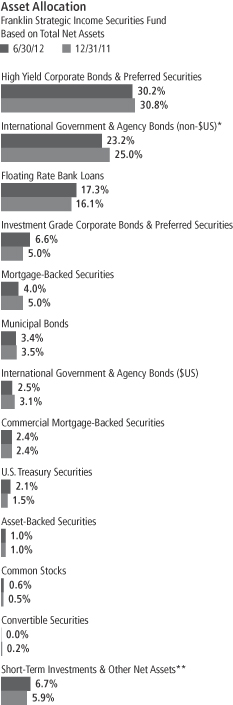
*Includes short-term foreign government securities.
**Includes unrealized gains/losses on forward currency contracts.
The dollar value, number of shares or principal amount, and names of all portfolio holdings are listed in the Fund’s Statement of Investments (SOI).
FSI-3
largely dissipated, allowing stock markets to rally as indicated by the Standard & Poor’s® 500 Index’s (S&P 500®’s) 12.59% gain in the first quarter.1 However, weaker economic data along with renewed concerns regarding the eurozone again pressured financial markets in the second quarter of 2012, and the S&P 500 fell 2.75%.1 Given investors’ generally more tempered view toward domestic economic growth and seemingly little concern regarding domestic inflationary pressures, U.S. longer term rates further declined during the period. As a result of this decline in long-dated U.S. Treasury rates, most fixed income sectors delivered positive total returns during the period. Strong performance during the first quarter of the year led many of the spread sectors to outperform the U.S. Treasury market for the full six-month period. Similarly, while the U.S. dollar strengthened compared to the euro and yen during the six-month period in review, a rebound in certain international fixed income currency markets drove relative outperformance from that sector during the period.
In this environment, the Fund posted a positive total return, outpacing the performance of the Barclays U.S. Aggregate Index as well as the Lipper Multi-Sector Income Funds Classification Average. The Fund’s higher exposure to high yield credit sectors positively impacted performance compared to the index. Compared to the Lipper peer average, the Fund’s higher exposure to certain non-U.S. dollar holdings also boosted returns.
While financial market volatility contributed to spread widening in the corporate credit sectors during the second quarter of 2012, overall corporate credit fundamentals remained fairly supportive during the six-month reporting period. Many companies have built up significant liquidity over the past few years and extended debt maturities given the relative openness of the new-issue debt markets. Major banks, particularly in the U.S., raised their capital ratios materially since 2008. Although the pace of gains began to slow as operating margins reached historical highs, improvements in corporate earnings furthered credit improvement. Nonetheless, the slowdown in eurozone economic growth is likely to be a headwind for certain corporates during the second half of 2012, and global default rates have begun to edge higher. Overall, however, with an expectation for positive U.S. economic growth and a soft landing in China, and considering spread valuations in line to somewhat cheap compared to historical averages, the Fund’s largest sector weighting remained in corporate bonds. During the period the Fund incrementally added to its leveraged bank loan and investment-grade corporate weighting, while maintaining its largest weighting in high yield corporate bonds. Within investment-grade corporate bonds, the Fund’s exposure was largely in financials, which offered a yield spread pick-up relative to the overall sector.4
4. The financials sector comprises banks, diversified financials, insurance and real estate in the SOI.
FSI-4
In the global markets, many of the currencies under pressure during the second half of 2011 experienced a rebound during the reporting period, particularly during the first four months of 2012. Non-U.S. dollar holdings in Mexico, the Philippines and Singapore performed well. The Fund’s long currency positions in Sweden and Poland also outperformed the euro, which the Fund sold forward as a proxy hedge. On the other hand, currency positions in countries such as Brazil and India underperformed as those currencies declined in value. We maintained only a modest weighting in hard currency (U.S. dollar and euro) emerging market sovereign bonds, given valuations that remained somewhat rich to longer term averages.
The continued decline in longer term U.S. Treasury yields drove positive returns for the more interest rate-sensitive sectors of the domestic fixed income market, with the longest maturity bonds generally delivering the greatest total returns. Given their higher current yield, offset by their shorter effective maturities, agency mortgage-backed securities generally performed in line with Treasuries. While the slack in the U.S. economy could keep longer term inflationary pressures subdued, with five- to 10-year Treasury yields lower than the inflation rate, we did not find significant value in fixed income U.S. government securities at recent yield levels. Consequently, we maintained a relatively low weighting in these sectors, while favoring the higher current yield of agency mortgages relative to Treasuries. Commercial mortgage-backed securities (CMBS) generally performed well in the first half of 2012, with healthy demand for CMBS. The Fund modestly added exposure to certain less highly rated (by the national rating agencies) CMBS tranches while reducing exposure to higher priced CMBS, favoring the yield pickup in those less highly rated securities. Given the longer maturity profile for the Fund’s municipal bond holdings, with a combination of a decline in long-term U.S. rates and healthy sector performance over the past year, the Fund continued to pare its municipal bond holdings.
Thank you for your participation in Franklin Strategic Income Securities Fund. We look forward to serving your future investment needs.
The foregoing information reflects our analysis, opinions and portfolio holdings as of June 30, 2012, the end of the reporting period. The way we implement our main investment strategies and the resulting portfolio holdings may change depending on factors such as market and economic conditions. These opinions may not be relied upon as investment advice or an offer for a particular security. The information is not a complete analysis of every aspect of any market, country, industry, security or the Fund. Statements of fact are from sources considered reliable, but the investment manager makes no representation or warranty as to their completeness or accuracy. Although historical performance is no guarantee of future results, these insights may help you understand our investment management philosophy.
FSI-5
Fund Expenses
As an investor in a variable insurance contract (Contract) that indirectly provides for investment in an underlying mutual fund, you can incur transaction and/or ongoing expenses at both the Fund level and the Contract level.
| • | Transaction expenses can include sales charges (loads) on purchases, surrender fees, transfer fees and premium taxes. |
| • | Ongoing expenses can include management fees, distribution and service (12b-1) fees, contract fees, annual maintenance fees, mortality and expense risk fees and other fees and expenses. All mutual funds and Contracts have some types of ongoing expenses. |
The expenses shown in the table are meant to highlight ongoing expenses at the Fund level only and do not include ongoing expenses at the Contract level, or transaction expenses at either the Fund or Contract levels. While the Fund does not have transaction expenses, if the transaction and ongoing expenses at the Contract level were included, the expenses shown below would be higher. You should consult your Contract prospectus or disclosure document for more information.
The table shows Fund-level ongoing expenses and can help you understand these expenses and compare them with those of other mutual funds offered through the Contract. The table assumes a $1,000 investment held for the six months indicated. Please refer to the Fund prospectus for additional information on operating expenses.
Actual Fund Expenses
The first line (Actual) of the table provides actual account values and expenses. The “Ending Account Value” is derived from the Fund’s actual return, which includes the effect of ongoing Fund expenses, but does not include the effect of ongoing Contract expenses.
You can estimate the Fund-level expenses you incurred during the period by following these steps. Of course, your account value and expenses will differ from those in this illustration:
| 1. | Divide your account value by $1,000. |
If an account had an $8,600 value, then $8,600 ÷ $1,000 = 8.6.
| 2. | Multiply the result by the number under the heading “Fund-Level Expenses Incurred During Period.” |
If Fund-Level Expenses Incurred During Period were $7.50, then 8.6 x $7.50 = $64.50.
In this illustration, the estimated expenses incurred this period at the Fund level are $64.50.
Franklin Strategic Income Securities Fund – Class 4
FSI-6
Hypothetical Example for Comparison with Other Mutual Funds
Information in the second line (Hypothetical) of the table can help you compare ongoing expenses of the Fund with those of other mutual funds offered through the Contract. This information may not be used to estimate the actual ending account balance or expenses you incurred during the period. The hypothetical “Ending Account Value” is based on the Fund’s actual expense ratio and an assumed 5% annual rate of return before expenses, which does not represent the Fund’s actual return. The figure under the heading “Fund-Level Expenses Incurred During Period” shows the hypothetical expenses your account would have incurred under this scenario. You can compare this figure with the 5% hypothetical examples that appear in shareholder reports of other funds offered through a Contract.
| Class 4 | Beginning Account Value 1/1/12 | Ending Account Value 6/30/12 | Fund-Level Expenses Incurred During Period* 1/1/12–6/30/12 | |||||||||
Actual | $ | 1,000 | $ | 1,055.80 | $ | 4.80 | ||||||
Hypothetical (5% return before expenses) | $ | 1,000 | $ | 1,020.19 | $ | 4.72 | ||||||
*Expenses are calculated using the most recent six-month annualized expense ratio for the Fund’s Class 4 shares (0.94%), which does not include any ongoing expenses of the Contract for which the Fund is an investment option, multiplied by the average account value over the period, multiplied by 182/366 to reflect the one-half year period.
FSI-7
Franklin Templeton Variable Insurance Products Trust
Financial Highlights
Franklin Strategic Income Securities Fund
Six Months (unaudited) | Year Ended December 31, | |||||||||||||||||||||||
| Class 1 | 2011 | 2010 | 2009 | 2008 | 2007 | |||||||||||||||||||
| ||||||||||||||||||||||||
Per share operating performance | ||||||||||||||||||||||||
(for a share outstanding throughout the period) | ||||||||||||||||||||||||
Net asset value, beginning of period | $ | 12.55 | $ | 12.99 | $ | 12.28 | $ | 10.58 | $ | 12.78 | $ | 12.73 | ||||||||||||
|
| |||||||||||||||||||||||
Income from investment operationsa: | ||||||||||||||||||||||||
Net investment incomeb | 0.34 | 0.69 | 0.72 | 0.70 | 0.69 | 0.73 | ||||||||||||||||||
Net realized and unrealized gains (losses) | 0.38 | (0.32 | ) | 0.61 | 1.95 | (1.99 | ) | 0.04 | ||||||||||||||||
|
| |||||||||||||||||||||||
Total from investment operations | 0.72 | 0.37 | 1.33 | 2.65 | (1.30 | ) | 0.77 | |||||||||||||||||
|
| |||||||||||||||||||||||
Less distributions from: | ||||||||||||||||||||||||
Net investment income and net foreign currency gains | (0.93 | ) | (0.81 | ) | (0.62 | ) | (0.95 | ) | (0.87 | ) | (0.68 | ) | ||||||||||||
Net realized gains | (0.02 | ) | — | — | — | (0.03 | ) | (0.04 | ) | |||||||||||||||
|
| |||||||||||||||||||||||
Total distributions | (0.95 | ) | (0.81 | ) | (0.62 | ) | (0.95 | ) | (0.90 | ) | (0.72 | ) | ||||||||||||
|
| |||||||||||||||||||||||
Net asset value, end of period | $ | 12.32 | $ | 12.55 | $ | 12.99 | $ | 12.28 | $ | 10.58 | $ | 12.78 | ||||||||||||
|
| |||||||||||||||||||||||
Total returnc | 5.82% | 2.78% | 11.21% | 26.11% | (11.03)% | 6.20% | ||||||||||||||||||
Ratios to average net assetsd | ||||||||||||||||||||||||
Expenses | 0.59% | 0.60% | e | 0.59% | e | 0.58% | e | 0.61% | e | 0.62% | e | |||||||||||||
Net investment income | 5.23% | 5.36% | 5.71% | 6.13% | 5.83% | 5.72% | ||||||||||||||||||
Supplemental data | ||||||||||||||||||||||||
Net assets, end of period (000’s) | $ | 1,032,236 | $ | 1,043,690 | $ | 1,195,149 | $ | 1,173,313 | $ | 903,358 | $ | 1,086,850 | ||||||||||||
Portfolio turnover rate | 24.60% | 55.65% | 56.46% | 56.19% | 47.68% | 46.88% | ||||||||||||||||||
Portfolio turnover rate excluding mortgage dollar rollsf | 24.60% | 55.65% | 56.46% | 56.19% | 47.68% | 46.43% | ||||||||||||||||||
aThe amount shown for a share outstanding throughout the period may not correlate with the Statement of Operations for the period due to the timing of sales and repurchases of the Fund shares in relation to income earned and/or fluctuating market value of the investments of the Fund.
bBased on average daily shares outstanding.
cTotal return does not include fees, charges or expenses imposed by the variable annuity and life insurance contracts for which the Franklin Templeton Variable Insurance Products Trust serves as an underlying investment vehicle. Total return is not annualized for periods less than one year.
dRatios are annualized for periods less than one year.
eBenefit of expense reduction rounds to less than 0.01%.
fSee Note 1(g) regarding mortgage dollar rolls.
The accompanying notes are an integral part of these financial statements.
FSI-8
Franklin Templeton Variable Insurance Products Trust
Financial Highlights (continued)
Franklin Strategic Income Securities Fund
Six Months (unaudited) | Year Ended December 31, | |||||||||||||||||||||||
| Class 2 | 2011 | 2010 | 2009 | 2008 | 2007 | |||||||||||||||||||
| ||||||||||||||||||||||||
Per share operating performance | ||||||||||||||||||||||||
(for a share outstanding throughout the period) | ||||||||||||||||||||||||
Net asset value, beginning of period | $ | 12.27 | $ | 12.72 | $ | 12.05 | $ | 10.41 | $ | 12.60 | $ | 12.56 | ||||||||||||
|
| |||||||||||||||||||||||
Income from investment operationsa: | ||||||||||||||||||||||||
Net investment incomeb | 0.31 | 0.64 | 0.68 | 0.66 | 0.65 | 0.69 | ||||||||||||||||||
Net realized and unrealized gains (losses) | 0.37 | (0.30 | ) | 0.59 | 1.91 | (1.96 | ) | 0.05 | ||||||||||||||||
|
| |||||||||||||||||||||||
Total from investment operations | 0.68 | 0.34 | 1.27 | 2.57 | (1.31 | ) | 0.74 | |||||||||||||||||
|
| |||||||||||||||||||||||
Less distributions from: | ||||||||||||||||||||||||
Net investment income and net foreign currency gains | (0.90 | ) | (0.79 | ) | (0.60 | ) | (0.93 | ) | (0.85 | ) | (0.66 | ) | ||||||||||||
Net realized gains | (0.02 | ) | — | — | — | (0.03 | ) | (0.04 | ) | |||||||||||||||
|
| |||||||||||||||||||||||
Total distributions | (0.92 | ) | (0.79 | ) | (0.60 | ) | (0.93 | ) | (0.88 | ) | (0.70 | ) | ||||||||||||
|
| |||||||||||||||||||||||
Net asset value, end of period | $ | 12.03 | $ | 12.27 | $ | 12.72 | $ | 12.05 | $ | 10.41 | $ | 12.60 | ||||||||||||
|
| |||||||||||||||||||||||
Total returnc | 5.64% | 2.57% | 10.91% | 25.75% | (11.24)% | 5.91% | ||||||||||||||||||
Ratios to average net assetsd | ||||||||||||||||||||||||
Expenses | 0.84% | 0.85% | e | 0.84% | e | 0.83% | e | 0.86% | e | 0.87% | e | |||||||||||||
Net investment income | 4.98% | 5.11% | 5.46% | 5.88% | 5.58% | 5.47% | ||||||||||||||||||
Supplemental data | ||||||||||||||||||||||||
Net assets, end of period (000’s) | $ | 137,230 | $ | 123,749 | $ | 101,347 | $ | 68,240 | $ | 33,155 | $ | 24,613 | ||||||||||||
Portfolio turnover rate | 24.60% | 55.65% | 56.46% | 56.19% | 47.68% | 46.88% | ||||||||||||||||||
Portfolio turnover rate excluding mortgage dollar rollsf | 24.60% | 55.65% | 56.46% | 56.19% | 47.68% | 46.43% | ||||||||||||||||||
aThe amount shown for a share outstanding throughout the period may not correlate with the Statement of Operations for the period due to the timing of sales and repurchases of the Fund shares in relation to income earned and/or fluctuating market value of the investments of the Fund.
bBased on average daily shares outstanding.
cTotal return does not include fees, charges or expenses imposed by the variable annuity and life insurance contracts for which the Franklin Templeton Variable Insurance Products Trust serves as an underlying investment vehicle. Total return is not annualized for periods less than one year.
dRatios are annualized for periods less than one year.
eBenefit of expense reduction rounds to less than 0.01%.
fSee Note 1(g) regarding mortgage dollar rolls.
The accompanying notes are an integral part of these financial statements.
FSI-9
Franklin Templeton Variable Insurance Products Trust
Financial Highlights (continued)
Franklin Strategic Income Securities Fund
Six Months (unaudited) | Year Ended December 31, | |||||||||||||||||||
| Class 4 | 2011 | 2010 | 2009 | 2008a | ||||||||||||||||
| ||||||||||||||||||||
Per share operating performance | ||||||||||||||||||||
(for a share outstanding throughout the period) | ||||||||||||||||||||
Net asset value, beginning of period | $ | 12.44 | $ | 12.88 | $ | 12.20 | $ | 10.54 | $ | 12.84 | ||||||||||
|
| |||||||||||||||||||
Income from investment operationsb: | ||||||||||||||||||||
Net investment incomec | 0.31 | 0.64 | 0.67 | 0.66 | 0.53 | |||||||||||||||
Net realized and unrealized gains (losses) | 0.38 | (0.31 | ) | 0.60 | 1.94 | (1.93 | ) | |||||||||||||
|
| |||||||||||||||||||
Total from investment operations | 0.69 | 0.33 | 1.27 | 2.60 | (1.40 | ) | ||||||||||||||
|
| |||||||||||||||||||
Less distributions from: | ||||||||||||||||||||
Net investment income and net foreign currency gains | (0.89 | ) | (0.77 | ) | (0.59 | ) | (0.94 | ) | (0.87 | ) | ||||||||||
Net realized gains | (0.02 | ) | — | — | — | (0.03 | ) | |||||||||||||
|
| |||||||||||||||||||
Total distributions | (0.91 | ) | (0.77 | ) | (0.59 | ) | (0.94 | ) | (0.90 | ) | ||||||||||
|
| |||||||||||||||||||
Net asset value, end of period | $ | 12.22 | $ | 12.44 | $ | 12.88 | $ | 12.20 | $ | 10.54 | ||||||||||
|
| |||||||||||||||||||
Total returnd | 5.58% | 2.46% | 10.88% | 25.52% | (11.69)% | |||||||||||||||
Ratios to average net assetse | ||||||||||||||||||||
Expenses | 0.94% | 0.95% | f | 0.94% | f | 0.93% | f | 0.96% | f | |||||||||||
Net investment income | 4.88% | 5.01% | 5.36% | 5.78% | 5.48% | |||||||||||||||
Supplemental data | ||||||||||||||||||||
Net assets, end of period (000’s) | $ | 202,257 | $ | 188,786 | $ | 188,178 | $ | 162,074 | $ | 59,766 | ||||||||||
Portfolio turnover rate | 24.60% | 55.65% | 56.46% | 56.19% | 47.68% | |||||||||||||||
aFor the period February 29, 2008 (effective date) to December 31, 2008.
bThe amount shown for a share outstanding throughout the period may not correlate with the Statement of Operations for the period due to the timing of sales and repurchases of the Fund shares in relation to income earned and/or fluctuating market value of the investments of the Fund.
cBased on average daily shares outstanding.
dTotal return does not include fees, charges or expenses imposed by the variable annuity and life insurance contracts for which the Franklin Templeton Variable Insurance Products Trust serves as an underlying investment vehicle. Total return is not annualized for periods less than one year.
eRatios are annualized for periods less than one year.
fBenefit of expense reduction rounds to less than 0.01%.
The accompanying notes are an integral part of these financial statements.
FSI-10
Franklin Templeton Variable Insurance Products Trust
Statement of Investments, June 30, 2012 (unaudited)
| Franklin Strategic Income Securities Fund | Country | Shares | Value | |||||||
Common Stocks 0.6% | ||||||||||
Consumer Durables & Apparel 0.1% | ||||||||||
a,bComfort Co. Inc. | United States | 13,427 | $ | 720,359 | ||||||
|
| |||||||||
Consumer Services 0.1% | ||||||||||
a,c,dTurtle Bay Resort | United States | 1,901,449 | 1,711,304 | |||||||
|
| |||||||||
Media 0.4% | ||||||||||
aMGM Holdings Inc., A | United States | 216,185 | 5,458,671 | |||||||
|
| |||||||||
Total Common Stocks (Cost $8,590,364) | 7,890,334 | |||||||||
|
| |||||||||
Preferred Stocks (Cost $865,000) 0.1% | ||||||||||
Diversified Financials 0.1% | ||||||||||
GMAC Capital Trust I, 8.125%, pfd. | United States | 34,600 | 832,130 | |||||||
|
| |||||||||
| Principal Amount* | ||||||||||
Corporate Bonds 37.2% | ||||||||||
Automobiles & Components 0.7% | ||||||||||
Exide Technologies, senior secured note, 8.625%, 2/01/18 | United States | 1,400,000 | 1,111,250 | |||||||
Ford Motor Credit Co. LLC, senior note, | ||||||||||
7.00%, 4/15/15 | United States | 500,000 | 556,940 | |||||||
6.625%, 8/15/17 | United States | 1,000,000 | 1,139,224 | |||||||
5.00%, 5/15/18 | United States | 1,000,000 | 1,064,922 | |||||||
8.125%, 1/15/20 | United States | 1,200,000 | 1,471,057 | |||||||
5.75%, 2/01/21 | United States | 600,000 | 661,050 | |||||||
The Goodyear Tire & Rubber Co., senior note, 8.25%, 8/15/20 | United States | 3,000,000 | 3,191,250 | |||||||
|
| |||||||||
| 9,195,693 | ||||||||||
|
| |||||||||
Banks 1.4% | ||||||||||
eBanco do Brasil SA, sub. note, 144A, 5.875%, 1/26/22 | Brazil | 3,500,000 | 3,603,985 | |||||||
CIT Group Inc., senior note, | ||||||||||
e144A, 7.00%, 5/02/17 | United States | 2,303,465 | 2,310,664 | |||||||
e144A, 6.625%, 4/01/18 | United States | 500,000 | 542,500 | |||||||
5.375%, 5/15/20 | United States | 1,600,000 | 1,633,000 | |||||||
HSBC USA Inc., sub. note, 5.00%, 9/27/20 | United States | 4,500,000 | 4,583,233 | |||||||
Regions Bank, sub. note, 7.50%, 5/15/18 | United States | 1,000,000 | 1,122,500 | |||||||
Regions Financial Corp., senior note, | ||||||||||
7.75%, 11/10/14 | United States | 2,500,000 | 2,706,250 | |||||||
5.75%, 6/15/15 | United States | 300,000 | 315,750 | |||||||
UBS AG Stamford, senior note, 5.875%, 12/20/17 | United States | 2,400,000 | 2,685,240 | |||||||
|
| |||||||||
| 19,503,122 | ||||||||||
|
| |||||||||
Capital Goods 1.0% | ||||||||||
eAbengoa Finance SAU, senior note, 144A, 8.875%, 11/01/17 | Spain | 3,500,000 | 3,150,000 | |||||||
The Manitowoc Co. Inc., senior note, | ||||||||||
9.50%, 2/15/18 | United States | 2,000,000 | 2,200,000 | |||||||
8.50%, 11/01/20 | United States | 1,500,000 | 1,627,500 | |||||||
Meritor Inc., senior note, 10.625%, 3/15/18 | United States | 3,000,000 | 3,202,500 | |||||||
RBS Global & Rexnord Corp., senior note, 8.50%, 5/01/18 | United States | 3,000,000 | 3,270,000 | |||||||
|
| |||||||||
| 13,450,000 | ||||||||||
|
| |||||||||
Commercial & Professional Services 0.3% | ||||||||||
United Rentals North America Inc., senior sub. note, 8.375%, 9/15/20 | United States | 4,000,000 | 4,230,000 | |||||||
|
| |||||||||
Consumer Durables & Apparel 0.8% | ||||||||||
Jarden Corp., senior sub. note, 7.50%, 5/01/17 | United States | 3,000,000 | 3,375,000 | |||||||
FSI-11
Franklin Templeton Variable Insurance Products Trust
Statement of Investments, June 30, 2012 (unaudited) (continued)
| Franklin Strategic Income Securities Fund | Country | Principal Amount* | Value | |||||||
Corporate Bonds (continued) | ||||||||||
Consumer Durables & Apparel (continued) | ||||||||||
M/I Homes Inc., senior note, 8.625%, 11/15/18 | United States | 2,400,000 | $ | 2,490,000 | ||||||
Shea Homes LP/Funding Corp., senior secured note, 8.625%, 5/15/19 | United States | 2,000,000 | 2,160,000 | |||||||
Visant Corp., senior note, 10.00%, 10/01/17 | United States | 3,500,000 | 3,491,250 | |||||||
|
| |||||||||
| 11,516,250 | ||||||||||
|
| |||||||||
Consumer Services 2.0% | ||||||||||
CKE Restaurants Inc., senior secured note, 11.375%, 7/15/18 | United States | 1,432,000 | 1,643,220 | |||||||
ClubCorp Club Operations Inc., senior note, 10.00%, 12/01/18 | United States | 2,900,000 | 3,088,500 | |||||||
e,fFontainebleau Las Vegas, 144A, 11.00%, 6/15/15 | United States | 2,500,000 | 1,563 | |||||||
eGala Group Finance Ltd., senior secured bond, 144A, 8.875%, 9/01/18 | United Kingdom | 2,000,000 | GBP | 2,760,535 | ||||||
Harrah’s Operating Co. Inc., senior secured note, 11.25%, 6/01/17 | United States | 5,000,000 | 5,481,250 | |||||||
MGM Resorts International, senior note, 6.625%, 7/15/15 | United States | 4,500,000 | 4,657,500 | |||||||
Pinnacle Entertainment Inc., | ||||||||||
senior note, 8.625%, 8/01/17 | United States | 1,500,000 | 1,638,750 | |||||||
senior sub. note, 7.75%, 4/01/22 | United States | 400,000 | 428,500 | |||||||
Royal Caribbean Cruises Ltd., senior deb., 7.25%, 3/15/18 | United States | 1,500,000 | 1,627,500 | |||||||
eShingle Springs Tribal Gaming Authority, senior note, 144A, 9.375%, 6/15/15 | United States | 2,000,000 | 1,540,000 | |||||||
Starwood Hotels & Resorts Worldwide Inc., senior note, | ||||||||||
6.75%, 5/15/18 | United States | 2,000,000 | 2,327,130 | |||||||
7.15%, 12/01/19 | United States | 500,000 | 590,402 | |||||||
Universal City Development, | ||||||||||
senior note, 8.875%, 11/15/15 | United States | 1,286,000 | 1,378,125 | |||||||
senior sub. note, 10.875%, 11/15/16 | United States | 284,000 | 334,139 | |||||||
|
| |||||||||
| 27,497,114 | ||||||||||
|
| |||||||||
Diversified Financials 4.0% | ||||||||||
Ally Financial Inc., senior note, 7.50%, 9/15/20 | United States | 2,500,000 | 2,818,750 | |||||||
Bank of America Corp., | ||||||||||
gpfd., sub. bond, M, 8.125% to 5/15/18, FRN thereafter, Perpetual | United States | 4,500,000 | 4,727,520 | |||||||
senior note, 5.65%, 5/01/18 | United States | 1,500,000 | 1,606,731 | |||||||
Capital One Capital VI, pfd., junior sub. bond, 8.875%, 5/15/40 | United States | 3,000,000 | 3,066,603 | |||||||
Citigroup Inc., | ||||||||||
senior note, 6.125%, 11/21/17 | United States | 1,500,000 | 1,664,573 | |||||||
senior note, 5.375%, 8/09/20 | United States | 1,000,000 | 1,083,094 | |||||||
sub. note, 5.00%, 9/15/14 | United States | 3,000,000 | 3,077,109 | |||||||
General Electric Capital Corp., | ||||||||||
senior note, A, 8.50%, 4/06/18 | United States | 64,000,000 | MXN | 5,012,606 | ||||||
sub. note, 5.30%, 2/11/21 | United States | 1,000,000 | 1,125,134 | |||||||
GMAC Inc., | ||||||||||
senior note, 6.875%, 8/28/12 | United States | 2,000,000 | 2,015,000 | |||||||
sub. note, 8.00%, 12/31/18 | United States | 900,000 | 1,001,250 | |||||||
International Lease Finance Corp., | ||||||||||
senior note, 8.25%, 12/15/20 | United States | 1,000,000 | 1,148,385 | |||||||
esenior secured note, 144A, 6.75%, 9/01/16 | United States | 3,500,000 | 3,780,000 | |||||||
JPMorgan Chase & Co., | ||||||||||
6.00%, 1/15/18 | United States | 1,500,000 | 1,724,669 | |||||||
senior note, 4.25%, 10/15/20 | United States | 2,500,000 | 2,632,707 | |||||||
JPMorgan Chase Capital XXII, sub. bond, 6.45%, 2/02/37 | United States | 3,000,000 | 3,015,000 | |||||||
eKKR Group Finance Co., senior note, 144A, 6.375%, 9/29/20 | United States | 3,000,000 | 3,259,515 | |||||||
Merrill Lynch & Co. Inc., senior note, 6.40%, 8/28/17 | United States | 2,000,000 | 2,178,854 | |||||||
Moody’s Corp., senior note, 5.50%, 9/01/20 | United States | 2,600,000 | 2,817,209 | |||||||
Morgan Stanley, senior note, | ||||||||||
6.00%, 4/28/15 | United States | 3,000,000 | 3,103,515 | |||||||
FSI-12
Franklin Templeton Variable Insurance Products Trust
Statement of Investments, June 30, 2012 (unaudited) (continued)
| Franklin Strategic Income Securities Fund | Country | Principal Amount* | Value | |||||||
Corporate Bonds (continued) | ||||||||||
Diversified Financials (continued) | ||||||||||
Morgan Stanley, senior note, (continued) | ||||||||||
5.50%, 7/24/20 | United States | 1,500,000 | $ | 1,470,845 | ||||||
5.50%, 7/28/21 | United States | 800,000 | 790,151 | |||||||
eNeuberger Berman Group LLC/Finance Corp., senior note, 144A, | ||||||||||
5.625%, 3/15/20 | United States | 600,000 | 627,000 | |||||||
5.875%, 3/15/22 | United States | 600,000 | 628,500 | |||||||
|
| |||||||||
| 54,374,720 | ||||||||||
|
| |||||||||
Energy 6.8% | ||||||||||
Alpha Natural Resources Inc., senior note, | ||||||||||
6.00%, 6/01/19 | United States | 1,500,000 | 1,286,250 | |||||||
6.25%, 6/01/21 | United States | 2,000,000 | 1,700,000 | |||||||
Antero Resources Finance Corp., senior note, | ||||||||||
9.375%, 12/01/17 | United States | 2,500,000 | 2,775,000 | |||||||
7.25%, 8/01/19 | United States | 300,000 | 312,000 | |||||||
Arch Coal Inc., senior note, | ||||||||||
7.00%, 6/15/19 | United States | 800,000 | 680,000 | |||||||
7.25%, 6/15/21 | United States | 2,000,000 | 1,685,000 | |||||||
Atlas Pipeline Partners LP, senior note, 8.75%, 6/15/18 | United States | 2,500,000 | 2,681,250 | |||||||
Chaparral Energy Inc., senior note, | ||||||||||
9.875%, 10/01/20 | United States | 2,000,000 | 2,232,500 | |||||||
8.25%, 9/01/21 | United States | 1,000,000 | 1,062,500 | |||||||
e144A, 7.625%, 11/15/22 | United States | 300,000 | 305,250 | |||||||
CHC Helicopter SA, senior secured note, first lien, 9.25%, 10/15/20 | Canada | 3,500,000 | 3,438,750 | |||||||
Chesapeake Energy Corp., senior note, | ||||||||||
7.25%, 12/15/18 | United States | 300,000 | 307,500 | |||||||
6.625%, 8/15/20 | United States | 4,000,000 | 3,980,000 | |||||||
6.125%, 2/15/21 | United States | 1,500,000 | 1,458,750 | |||||||
Chesapeake Midstream Partners LP/CHKM Finance Corp., senior note, 6.125%, 7/15/22 | United States | 700,000 | 689,500 | |||||||
Compagnie Generale de Geophysique-Veritas, senior note, | ||||||||||
7.75%, 5/15/17 | France | 2,100,000 | 2,174,813 | |||||||
6.50%, 6/01/21 | France | 2,000,000 | 2,010,000 | |||||||
CONSOL Energy Inc., senior note, | ||||||||||
8.00%, 4/01/17 | United States | 1,500,000 | 1,563,750 | |||||||
8.25%, 4/01/20 | United States | 1,500,000 | 1,582,500 | |||||||
6.375%, 3/01/21 | United States | 200,000 | 189,000 | |||||||
Crosstex Energy LP/Crosstex Energy Finance Corp., senior note, 8.875%, 2/15/18 | United States | 3,500,000 | 3,703,437 | |||||||
El Paso Corp., senior bond, 6.50%, 9/15/20 | United States | 2,300,000 | 2,532,824 | |||||||
Energy Transfer Equity LP, senior note, 7.50%, 10/15/20 | United States | 3,500,000 | 3,858,750 | |||||||
Energy Transfer Partners LP, senior note, 5.20%, 2/01/22 | United States | 900,000 | 966,327 | |||||||
Energy XXI Gulf Coast Inc., senior note, 9.25%, 12/15/17 | United States | 3,000,000 | 3,225,000 | |||||||
hEnterprise Products Operating LLC, junior sub. note, FRN, 7.034%, 1/15/68 | United States | 2,000,000 | 2,142,452 | |||||||
eExpro Finance Luxembourg, senior secured note, 144A, 8.50%, 12/15/16 | United Kingdom | 3,113,000 | 2,996,263 | |||||||
eGaz Capital SA, | ||||||||||
GAZPROM, loan participation, senior note, 144A, 5.092%, 11/29/15 | Russia | 3,000,000 | 3,164,565 | |||||||
OJSC GAZPROM, loan participation, senior note, 144A, 6.51%, 3/07/22 | Russia | 500,000 | 556,880 | |||||||
eKinder Morgan Finance Co. LLC, senior secured note, 144A, 6.00%, 1/15/18 | United States | 3,500,000 | 3,657,500 | |||||||
Linn Energy LLC/Finance Corp., senior note, | ||||||||||
8.625%, 4/15/20 | United States | 3,000,000 | 3,247,500 | |||||||
7.75%, 2/01/21 | United States | 1,000,000 | 1,050,000 | |||||||
Martin Midstream Partners LP, senior note, 8.875%, 4/01/18 | United States | 1,754,000 | 1,780,310 | |||||||
Offshore Group Investment Ltd., senior secured note, | ||||||||||
efirst lien, 144A, 11.50%, 8/01/15 | United States | 900,000 | 981,000 | |||||||
11.50%, 8/01/15 | United States | 2,100,000 | 2,289,000 | |||||||
FSI-13
Franklin Templeton Variable Insurance Products Trust
Statement of Investments, June 30, 2012 (unaudited) (continued)
| Franklin Strategic Income Securities Fund | Country | Principal Amount* | Value | |||||||
Corporate Bonds (continued) | ||||||||||
Energy (continued) | ||||||||||
ePBF Holding Co. LLC, senior secured note, 144A, 8.25%, 2/15/20 | United States | 2,100,000 | $ | 2,105,250 | ||||||
Peabody Energy Corp., senior note, | ||||||||||
6.50%, 9/15/20 | United States | 2,500,000 | 2,543,750 | |||||||
e144A, 6.00%, 11/15/18 | United States | 700,000 | 700,000 | |||||||
e144A, 6.25%, 11/15/21 | United States | 1,000,000 | 995,000 | |||||||
ePenn Virginia Resource Partners LP/Finance Corp. II, senior note, 144A, 8.375%, 6/01/20 | United States | 1,400,000 | 1,428,000 | |||||||
c,e,fPetroplus Finance Ltd., senior note, 144A, 6.75%, 5/01/14 | Switzerland | 2,100,000 | 262,500 | |||||||
Plains Exploration & Production Co., senior note, | ||||||||||
7.625%, 6/01/18 | United States | 3,000,000 | 3,202,500 | |||||||
6.125%, 6/15/19 | United States | 600,000 | 606,000 | |||||||
Quicksilver Resources Inc., senior note, | ||||||||||
8.25%, 8/01/15 | United States | 3,000,000 | 2,820,000 | |||||||
9.125%, 8/15/19 | United States | 500,000 | 437,500 | |||||||
eSamson Investment Co., senior note, 144A, 9.75%, 2/15/20 | United States | 3,500,000 | 3,486,875 | |||||||
SandRidge Energy Inc., senior note, | ||||||||||
8.75%, 1/15/20 | United States | 1,000,000 | 1,047,500 | |||||||
e144A, 8.00%, 6/01/18 | United States | 3,000,000 | 3,052,500 | |||||||
W&T Offshore Inc., senior note, 8.50%, 6/15/19 | United States | 2,000,000 | 2,075,000 | |||||||
|
| |||||||||
| 93,028,496 | ||||||||||
|
| |||||||||
Food & Staples Retailing 0.5% | ||||||||||
Rite Aid Corp., senior secured note, | ||||||||||
9.75%, 6/12/16 | United States | 2,200,000 | 2,436,500 | |||||||
8.00%, 8/15/20 | United States | 1,300,000 | 1,478,750 | |||||||
Safeway Inc., senior bond, 3.95%, 8/15/20 | United States | 3,500,000 | 3,385,277 | |||||||
|
| |||||||||
| 7,300,527 | ||||||||||
|
| |||||||||
Food, Beverage & Tobacco 1.8% | ||||||||||
eBoparan Finance PLC, senior note, 144A, 9.75%, 4/30/18 | United Kingdom | 2,500,000 | EUR | 3,341,975 | ||||||
eCampofrio Food Group SA, senior note, 144A, 8.25%, 10/31/16 | Spain | 3,000,000 | EUR | 3,739,848 | ||||||
eCEDC Finance Corp. International Inc., senior secured note, 144A, 9.125%, 12/01/16 | Russia | 1,800,000 | 1,146,375 | |||||||
Dean Foods Co., senior note, 9.75%, 12/15/18 | United States | 1,300,000 | 1,456,000 | |||||||
Del Monte Corp., senior note, 7.625%, 2/15/19 | United States | 4,000,000 | 4,055,000 | |||||||
JBS USA LLC/Finance Inc., senior note, | ||||||||||
11.625%, 5/01/14 | United States | 1,500,000 | 1,710,000 | |||||||
e144A, 8.25%, 2/01/20 | United States | 1,500,000 | 1,462,500 | |||||||
eKraft Foods Inc., senior bond, 144A, 3.50%, 6/06/22 | United States | 3,000,000 | 3,087,504 | |||||||
Pinnacle Foods Finance LLC/Corp., senior note, 9.25%, 4/01/15 | United States | 2,500,000 | 2,581,250 | |||||||
eRefresco Group BV, senior secured sub. bond, 144A, 7.375%, 5/15/18 | Netherlands | 2,000,000 | EUR | 2,391,984 | ||||||
|
| |||||||||
| 24,972,436 | ||||||||||
|
| |||||||||
Health Care Equipment & Services 1.4% | ||||||||||
Amerigroup Corp., senior note, 7.50%, 11/15/19 | United States | 2,500,000 | 2,700,000 | |||||||
CHS/Community Health Systems Inc., senior note, | ||||||||||
8.875%, 7/15/15 | United States | 1,125,000 | 1,155,937 | |||||||
8.00%, 11/15/19 | United States | 2,100,000 | 2,236,500 | |||||||
Emergency Medical Services Corp., senior note, 8.125%, 6/01/19 | United States | 2,500,000 | 2,621,875 | |||||||
HCA Inc., | United States | 800,000 | 866,000 | |||||||
senior note, 7.50%, 2/15/22 | United States | 2,000,000 | 2,185,000 | |||||||
senior secured bond, 7.25%, 9/15/20 | United States | 300,000 | 331,500 | |||||||
senior secured note, 5.875%, 3/15/22 | United States | 1,900,000 | 1,990,250 | |||||||
eHealth Management Associates Inc., senior note, 144A, 7.375%, 1/15/20 | United States | 2,800,000 | 2,992,500 | |||||||
FSI-14
Franklin Templeton Variable Insurance Products Trust
Statement of Investments, June 30, 2012 (unaudited) (continued)
| Franklin Strategic Income Securities Fund | Country | Principal Amount* | Value | |||||||
Corporate Bonds (continued) | ||||||||||
Health Care Equipment & Services (continued) | ||||||||||
Vanguard Health Holding Co. II LLC/Inc., senior note, 8.00%, 2/01/18 | United States | 2,500,000 | $ | 2,568,750 | ||||||
Vanguard Health Systems Inc., senior note, zero cpn., 2/01/16 | United States | 30,000 | 20,100 | |||||||
|
| |||||||||
| 19,668,412 | ||||||||||
|
| |||||||||
Insurance 0.5% | ||||||||||
hMetLife Inc., junior sub. note, FRN, 6.40%, 12/15/66 | United States | 3,500,000 | 3,473,750 | |||||||
e,hMitsui Sumitomo Insurance Co. Ltd., sub. note, 144A, FRN, 7.00%, 3/15/72 | Japan | 3,000,000 | 3,137,535 | |||||||
|
| |||||||||
| 6,611,285 | ||||||||||
|
| |||||||||
Materials 3.5% | ||||||||||
ArcelorMittal, senior note, | ||||||||||
5.50%, 3/01/21 | Luxembourg | 4,000,000 | 3,802,520 | |||||||
6.25%, 2/25/22 | Luxembourg | 1,000,000 | 983,020 | |||||||
eCemex SAB de CV, senior secured note, 144A, 9.00%, 1/11/18 | Mexico | 4,000,000 | 3,590,000 | |||||||
Euramax International Inc., senior secured note, 9.50%, 4/01/16 | United States | 2,000,000 | 1,775,000 | |||||||
eFMG Resources August 2006 Pty. Ltd., senior note, 144A, | ||||||||||
7.00%, 11/01/15 | Australia | 700,000 | 710,062 | |||||||
6.00%, 4/01/17 | Australia | 500,000 | 499,850 | |||||||
6.875%, 2/01/18 | Australia | 3,000,000 | 3,041,250 | |||||||
Huntsman International LLC, senior sub. note, 8.625%, 3/15/21 | United States | 1,100,000 | 1,245,750 | |||||||
eIneos Finance PLC, senior secured note, 144A, | ||||||||||
9.00%, 5/15/15 | United Kingdom | 300,000 | 318,000 | |||||||
9.25%, 5/15/15 | United Kingdom | 100,000 | EUR | 135,407 | ||||||
8.375%, 2/15/19 | United Kingdom | 200,000 | 206,625 | |||||||
7.50%, 5/01/20 | United Kingdom | 300,000 | 302,812 | |||||||
eIneos Group Holdings Ltd., | United Kingdom | 1,500,000 | EUR | 1,656,354 | ||||||
senior secured note, 144A, 8.50%, 2/15/16 | United Kingdom | 1,500,000 | 1,383,750 | |||||||
eInmet Mining Corp., senior note, 144A, 8.75%, 6/01/20 | Canada | 2,700,000 | 2,686,500 | |||||||
eKerling PLC, senior secured note, 144A, 10.625%, 1/28/17 | United Kingdom | 3,000,000 | EUR | 3,366,034 | ||||||
eKinove German Bondco GmbH, senior secured bond, 144A, 10.00%, 6/15/18 | Germany | 2,250,000 | EUR | 2,924,129 | ||||||
eMacDermid Inc., senior sub. note, 144A, 9.50%, 4/15/17 | United States | 3,000,000 | 3,150,000 | |||||||
c,fNewPage Corp., senior secured note, 11.375%, 12/31/14 | United States | 3,500,000 | 2,292,500 | |||||||
Novelis Inc., senior note, | ||||||||||
8.375%, 12/15/17 | Canada | 1,500,000 | 1,612,500 | |||||||
8.75%, 12/15/20 | Canada | 1,600,000 | 1,732,000 | |||||||
eReynolds Group Issuer Inc./LLC/SA, | United States | 3,500,000 | 3,447,500 | |||||||
senior note, 144A, 9.875%, 8/15/19 | United States | 100,000 | 103,875 | |||||||
senior note, 144A, 8.25%, 2/15/21 | United States | 500,000 | 475,000 | |||||||
senior secured note, 144A, 7.125%, 4/15/19 | United States | 1,000,000 | 1,052,500 | |||||||
eSealed Air Corp., senior note, 144A, | ||||||||||
8.125%, 9/15/19 | United States | 1,000,000 | 1,120,000 | |||||||
8.375%, 9/15/21 | United States | 500,000 | 567,500 | |||||||
eXstrata Finance Canada Ltd., senior note, 144A, 4.95%, 11/15/21 | Canada | 4,000,000 | 4,143,796 | |||||||
|
| |||||||||
| 48,324,234 | ||||||||||
|
| |||||||||
Media 3.6% | ||||||||||
eAMC Networks Inc., senior note, 144A, 7.75%, 7/15/21 | United States | 1,300,000 | 1,439,750 | |||||||
Cablevision Systems Corp., senior note, 8.625%, 9/15/17 | United States | 500,000 | 560,000 | |||||||
CCH II LLC/CCH II Capital Corp., senior note, 13.50%, 11/30/16 | United States | 1,500,000 | 1,676,250 | |||||||
CCO Holdings LLC/CCO Holdings Capital Corp., senior note, | ||||||||||
8.125%, 4/30/20 | United States | 900,000 | 1,008,000 | |||||||
FSI-15
Franklin Templeton Variable Insurance Products Trust
Statement of Investments, June 30, 2012 (unaudited) (continued)
| Franklin Strategic Income Securities Fund | Country | Principal Amount* | Value | |||||||
Corporate Bonds (continued) | ||||||||||
Media (continued) | ||||||||||
CCO Holdings LLC/CCO Holdings Capital Corp., senior note, (continued) | ||||||||||
6.50%, 4/30/21 | United States | 2,000,000 | $ | 2,140,000 | ||||||
eCet 21 Spol SRO, senior secured note, 144A, 9.00%, 11/01/17 | Czech Republic | 300,000 | EUR | 399,613 | ||||||
Clear Channel Communications Inc., senior note, 9.00%, 3/01/21 | United States | 4,700,000 | 4,112,500 | |||||||
eClear Channel Worldwide Holdings Inc., senior sub. note, 144A, 7.625%, | ||||||||||
3/15/20 | United States | 1,300,000 | 1,277,250 | |||||||
3/15/20 | United States | 200,000 | 192,500 | |||||||
CSC Holdings Inc., | ||||||||||
senior deb., 7.625%, 7/15/18 | United States | 1,500,000 | 1,683,750 | |||||||
esenior note, 144A, 6.75%, 11/15/21 | United States | 2,000,000 | 2,140,000 | |||||||
DIRECTV Holdings LLC/DIRECTV Financing Co. Inc., senior note, 4.60%, 2/15/21 | United States | 2,000,000 | 2,132,390 | |||||||
DISH DBS Corp., senior note, | ||||||||||
7.75%, 5/31/15 | United States | 500,000 | 557,500 | |||||||
7.125%, 2/01/16 | United States | 4,000,000 | 4,410,000 | |||||||
6.75%, 6/01/21 | United States | 500,000 | 542,500 | |||||||
e144A, 5.875%, 7/15/22 | United States | 500,000 | 507,500 | |||||||
Media General Inc., senior secured note, 11.75%, 2/15/17 | United States | 2,000,000 | 2,160,000 | |||||||
eNara Cable Funding Ltd., senior note, 144A, 8.875%, 12/01/18 | Spain | 800,000 | 692,000 | |||||||
iRadio One Inc., senior sub. note, PIK, 15.00%, 5/24/16 | United States | 2,280,619 | 1,799,005 | |||||||
e,fSeat Pagine Gialle SpA, senior secured note, 144A, 10.50%, 1/31/17 | Italy | 2,000,000 | EUR | 1,645,280 | ||||||
Time Warner Inc., | ||||||||||
7.625%, 4/15/31 | United States | 2,500,000 | 3,241,240 | |||||||
senior bond, 3.40%, 6/15/22 | United States | 500,000 | 505,685 | |||||||
eUnitymedia Hessen/NRW, senior secured note, 144A, 9.50%, 3/15/21 | Germany | 1,500,000 | EUR | 2,068,069 | ||||||
eUnivision Communications Inc., senior secured note, 144A, | ||||||||||
6.875%, 5/15/19 | United States | 1,000,000 | 1,035,000 | |||||||
7.875%, 11/01/20 | United States | 2,500,000 | 2,687,500 | |||||||
eUPCB Finance II Ltd., senior secured note, 144A, 6.375%, 7/01/20 | Netherlands | 2,000,000 | EUR | 2,500,319 | ||||||
eUPCB Finance VI Ltd., senior secured note, 144A, 6.875%, 1/15/22 | Netherlands | 500,000 | 506,563 | |||||||
WMG Acquisition Corp., senior secured note, 9.50%, 6/15/16 | United States | 2,000,000 | 2,190,000 | |||||||
eZiggo Bond Co., senior bond, 144A, 8.00%, 5/15/18 | Netherlands | 2,500,000 | EUR | 3,446,782 | ||||||
|
| |||||||||
| 49,256,946 | ||||||||||
|
| |||||||||
Pharmaceuticals, Biotechnology & Life Sciences 1.1% | ||||||||||
eCapsugel FinanceCo SCA, senior note, 144A, 9.875%, 8/01/19 | United States | 2,000,000 | EUR | 2,784,320 | ||||||
Endo Health Solutions Inc., senior note, 7.00%, 7/15/19 | United States | 2,000,000 | 2,185,000 | |||||||
Giant Funding Corp., senior secured note, 8.25%, 2/01/18 | Spain | 3,300,000 | 3,564,000 | |||||||
Gilead Sciences Inc., senior note, | ||||||||||
4.50%, 4/01/21 | United States | 2,000,000 | 2,228,220 | |||||||
4.40%, 12/01/21 | United States | 1,000,000 | 1,106,721 | |||||||
einVentiv Health Inc., senior note, 144A, 10.00%, | ||||||||||
8/15/18 | United States | 1,200,000 | 1,032,000 | |||||||
8/15/18 | United States | 1,100,000 | 951,500 | |||||||
eMylan Inc., senior note, 144A, 7.875%, 7/15/20 | United States | 500,000 | 563,125 | |||||||
|
| |||||||||
| 14,414,886 | ||||||||||
|
| |||||||||
Real Estate 0.1% | ||||||||||
Forest City Enterprises Inc., senior note, 7.625%, 6/01/15 | United States | 2,000,000 | 1,995,000 | |||||||
|
| |||||||||
Retailing 1.2% | ||||||||||
eAcademy Ltd./Finance Corp., senior note, 144A, 9.25%, 8/01/19 | United States | 2,500,000 | 2,725,000 | |||||||
e,hEdcon Pty. Ltd., senior secured note, 144A, FRN, 3.912%, 6/15/14 | South Africa | 3,000,000 | EUR | 3,467,731 | ||||||
eMatalan Finance Ltd., senior secured note, 144A, 8.875%, 4/29/16 | United Kingdom | 2,300,000 | GBP | 3,095,807 | ||||||
Michaels Stores Inc., senior note, 7.75%, 11/01/18 | United States | 3,500,000 | 3,710,000 | |||||||
FSI-16
Franklin Templeton Variable Insurance Products Trust
Statement of Investments, June 30, 2012 (unaudited) (continued)
| Franklin Strategic Income Securities Fund | Country | Principal Amount* | Value | |||||||
Corporate Bonds (continued) | ||||||||||
Retailing (continued) | ||||||||||
ePetco Animal Supplies Inc., senior note, 144A, 9.25%, 12/01/18 | United States | 3,000,000 | $ | 3,292,500 | ||||||
|
| |||||||||
| 16,291,038 | ||||||||||
|
| |||||||||
Semiconductors & Semiconductor Equipment 0.5% | ||||||||||
Advanced Micro Devices Inc., senior note, | ||||||||||
8.125%, 12/15/17 | United States | 800,000 | 872,000 | |||||||
7.75%, 8/01/20 | United States | 900,000 | 994,500 | |||||||
Freescale Semiconductor Inc., | ||||||||||
senior note, 8.875%, 12/15/14 | United States | 660,000 | 681,450 | |||||||
senior note, 8.05%, 2/01/20 | United States | 1,600,000 | 1,588,000 | |||||||
senior note, 10.75%, 8/01/20 | United States | 1,382,000 | 1,492,560 | |||||||
esenior secured note, 144A, 9.25%, 4/15/18 | United States | 500,000 | 537,500 | |||||||
|
| |||||||||
| 6,166,010 | ||||||||||
|
| |||||||||
Software & Services 1.2% | ||||||||||
e,jCeridian Corp., 144A, 8.875%, 7/15/19 | United States | 600,000 | 622,500 | |||||||
First Data Corp., | United States | 300,000 | 301,875 | |||||||
esenior secured bond, 144A, 8.25%, 1/15/21 | United States | 4,500,000 | 4,522,500 | |||||||
eLawson Software Inc., senior note, 144A, 9.375%, 4/01/19 | United States | 700,000 | 750,750 | |||||||
Sitel LLC/Finance Corp., senior note, 11.50%, 4/01/18 | United States | 2,500,000 | 1,793,750 | |||||||
Sterling International Inc., senior note, 11.00%, 10/01/19 | United States | 800,000 | 808,000 | |||||||
SunGard Data Systems Inc., senior note, 7.625%, 11/15/20 | United States | 3,000,000 | 3,210,000 | |||||||
West Corp., senior note, 7.875%, 1/15/19 | United States | 3,500,000 | 3,675,000 | |||||||
eZayo Escrow Corp., first lien, 144A, 8.125%, 1/01/20 | United States | 1,000,000 | 1,050,000 | |||||||
|
| |||||||||
| 16,734,375 | ||||||||||
|
| |||||||||
Technology Hardware & Equipment 0.5% | ||||||||||
CDW LLC/Finance Corp., senior note, 8.50%, 4/01/19 | United States | 3,800,000 | 4,066,000 | |||||||
eCommScope Inc., senior note, 144A, 8.25%, 1/15/19 | United States | 3,000,000 | 3,187,500 | |||||||
|
| |||||||||
| 7,253,500 | ||||||||||
|
| |||||||||
Telecommunication Services 2.7% | ||||||||||
CenturyLink Inc., senior note, | ||||||||||
6.00%, 4/01/17 | United States | 3,000,000 | 3,191,727 | |||||||
6.45%, 6/15/21 | United States | 1,000,000 | 1,043,049 | |||||||
Cricket Communications Inc., senior note, 7.75%, 10/15/20 | United States | 3,500,000 | 3,360,000 | |||||||
eDigicel Group Ltd., senior note, 144A, 8.875%, 1/15/15 | Jamaica | 2,500,000 | 2,537,500 | |||||||
eDigicel Ltd., senior note, 144A, 8.25%, 9/01/17 | Jamaica | 300,000 | 308,250 | |||||||
eeAccess Ltd., senior note, 144A, | ||||||||||
8.25%, 4/01/18 | Japan | 1,400,000 | 1,288,000 | |||||||
8.375%, 4/01/18 | Japan | 600,000 | EUR | 664,440 | ||||||
Frontier Communications Corp., senior note, | ||||||||||
8.50%, 4/15/20 | United States | 3,500,000 | 3,727,500 | |||||||
8.75%, 4/15/22 | United States | 1,500,000 | 1,582,500 | |||||||
Intelsat Jackson Holdings SA, senior note, | ||||||||||
11.25%, 6/15/16 | Luxembourg | 1,185,000 | 1,244,250 | |||||||
7.50%, 4/01/21 | Luxembourg | 2,000,000 | 2,125,000 | |||||||
e144A, 7.25%, 10/15/20 | Luxembourg | 1,600,000 | 1,692,000 | |||||||
Intelsat Luxembourg SA, senior note, 11.25%, 2/04/17 | Luxembourg | 700,000 | 723,625 | |||||||
MetroPCS Wireless Inc., senior note, 7.875%, 9/01/18 | United States | 2,500,000 | 2,606,250 | |||||||
Sprint Nextel Corp., senior note, | ||||||||||
8.375%, 8/15/17 | United States | 4,000,000 | 4,120,000 | |||||||
FSI-17
Franklin Templeton Variable Insurance Products Trust
Statement of Investments, June 30, 2012 (unaudited) (continued)
| Franklin Strategic Income Securities Fund | Country | Principal Amount* | Value | |||||||
Corporate Bonds (continued) | ||||||||||
Telecommunication Services (continued) | ||||||||||
Sprint Nextel Corp., senior note, (continued) | ||||||||||
e144A, 9.00%, 11/15/18 | United States | 2,000,000 | $ | 2,240,000 | ||||||
e144A, 7.00%, 3/01/20 | United States | 800,000 | 834,000 | |||||||
eWind Acquisition Finance SA, senior secured note, 144A, 11.75%, 7/15/17 | Italy | 3,500,000 | 2,865,625 | |||||||
e,iWind Acquisition Holdings Finance SA, senior secured note, 144A, PIK, 12.25%, 7/15/17 | Italy | 640,321 | EUR | 559,471 | ||||||
|
| |||||||||
| 36,713,187 | ||||||||||
|
| |||||||||
Transportation 0.6% | ||||||||||
e,fAmerican Airlines Inc., senior secured note, 144A, 7.50%, 3/15/16 | United States | 3,000,000 | 2,850,000 | |||||||
eCeva Group PLC, senior secured note, 144A, | ||||||||||
11.625%, 10/01/16 | United Kingdom | 300,000 | 314,250 | |||||||
8.375%, 12/01/17 | United Kingdom | 1,500,000 | 1,459,688 | |||||||
11.50%, 4/01/18 | United Kingdom | 1,000,000 | 927,500 | |||||||
eHertz Corp., senior note, 144A, 6.75%, 4/15/19 | United States | 2,000,000 | 2,090,000 | |||||||
|
| |||||||||
| 7,641,438 | ||||||||||
|
| |||||||||
Utilities 1.0% | ||||||||||
eCalpine Corp., senior secured note, 144A, | ||||||||||
7.875%, 7/31/20 | United States | 1,100,000 | 1,218,250 | |||||||
7.50%, 2/15/21 | United States | 2,500,000 | 2,712,500 | |||||||
7.875%, 1/15/23 | United States | 500,000 | 547,500 | |||||||
CMS Energy Corp., senior note, 8.75%, 6/15/19 | United States | 2,000,000 | 2,478,444 | |||||||
eIntergen NV, senior secured note, 144A, 9.00%, 6/30/17 | Netherlands | 3,000,000 | 2,979,375 | |||||||
Texas Competitive Electric Holdings Co. LLC/Texas Competitive Electric Holdings | United States | 4,600,000 | 3,162,500 | |||||||
B, 15.00%, 4/01/21 | United States | 1,830,000 | 631,350 | |||||||
|
| |||||||||
| 13,729,919 | ||||||||||
|
| |||||||||
Total Corporate Bonds (Cost $499,634,693) | 509,868,588 | |||||||||
|
| |||||||||
h,kSenior Floating Rate Interests 17.3% | ||||||||||
Automobiles & Components 0.1% | ||||||||||
August Lux U.K. Holding Co., Lux Second Lien, 10.50%, 4/27/19 | Luxembourg | 532,023 | 532,023 | |||||||
August U.S. Holding Co. Inc., U.S. Second Lien, 10.50%, 4/27/19 | United States | 409,610 | 409,610 | |||||||
Federal-Mogul Corp., | ||||||||||
Tranche B Term Loan, 2.178% - 2.188%, 12/27/14 | United States | 415,296 | 396,175 | |||||||
Tranche C Term Loan, 2.178% - 2.188%, 12/27/15 | United States | 211,886 | 202,130 | |||||||
|
| |||||||||
| 1,539,938 | ||||||||||
|
| |||||||||
Capital Goods 1.1% | ||||||||||
Goodman Global Inc., Initial Term Loan, 5.75%, 10/28/16 | United States | 1,243,704 | 1,245,570 | |||||||
jRBS Global Inc. (Rexnord), Term B Loan, 5.00%, 4/01/18 | United States | 4,028,902 | 4,054,921 | |||||||
Sensus USA Inc., Second Lien Term Loan, 8.50%, 5/09/18 | United States | 2,345,433 | 2,348,130 | |||||||
Terex Corp., U.S. Term Loan, 5.50%, 4/28/17 | United States | 3,594,437 | 3,616,902 | |||||||
Tomkins LLC and Tomkins Inc., Term B-1 Loan, 4.25%, 9/21/16 | United States | 2,098,041 | 2,099,788 | |||||||
TransDigm Inc., | ||||||||||
Tranche B1 Term Loan, 4.00%, 2/14/17 | United States | 1,809,040 | 1,810,547 | |||||||
Tranche B2 Term Loan, 4.00%, 2/14/17 | United States | 510,137 | 508,861 | |||||||
|
| |||||||||
| 15,684,719 | ||||||||||
|
| |||||||||
Commercial & Professional Services 1.2% | ||||||||||
ARAMARK Corp., | ||||||||||
Extended Synthetic L/C, 3.346%, 7/26/16 | United States | 186,538 | 185,101 | |||||||
FSI-18
Franklin Templeton Variable Insurance Products Trust
Statement of Investments, June 30, 2012 (unaudited) (continued)
| Franklin Strategic Income Securities Fund | Country | Principal Amount* | Value | |||||||
h,kSenior Floating Rate Interests (continued) | ||||||||||
Commercial & Professional Services (continued) | ||||||||||
ARAMARK Corp., (continued) | ||||||||||
Extended US Term Loan B-3, 3.495% - 3.711%, 7/26/16 | United States | 1,138,629 | $ | 1,129,853 | ||||||
Synthetic L/C-3, 3.346%, 7/26/16 | United States | 91,726 | 90,923 | |||||||
Term Loan B Extended, 3.495%, 7/26/16 | United States | 2,834,838 | 2,812,987 | |||||||
Brock Holdings III Inc., Second Lien Term Loan, 10.00%, 3/16/18 | United States | 1,187,270 | 1,175,397 | |||||||
EnviroSolutions Real Property Holdings, Second Lien Term Loan, 8.00%, 7/29/14 | United States | 502,938 | 499,795 | |||||||
Interactive Data Corp., Term B Loans, 4.50%, 2/11/18 | United States | 5,573,824 | 5,492,490 | |||||||
KAR Auction Services Inc. (Adesa), Term Loan, 5.00%, 5/19/17 | United States | 5,314,146 | 5,330,089 | |||||||
|
| |||||||||
| 16,716,635 | ||||||||||
|
| |||||||||
Consumer Durables & Apparel 0.3% | ||||||||||
b,iSleep Innovations Inc., Term Loan, PIK, 11.50%, 3/05/15 | United States | 1,161,736 | 1,161,736 | |||||||
Visant Corp. (Jostens), New Loan, 5.25%, 12/22/16 | United States | 3,675,384 | 3,565,122 | |||||||
|
| |||||||||
| 4,726,858 | ||||||||||
|
| |||||||||
Consumer Services 1.6% | ||||||||||
Ameristar Casinos Inc., B Term Loan, 4.00%, 4/14/18 | United States | 2,295,714 | 2,298,584 | |||||||
Burger King Holdings Inc., Tranche B Term Loan, 4.50%, 10/19/16 | United States | 8,284,169 | 8,259,971 | |||||||
DineEquity Inc., Term B-1 Loan, 4.25%, 10/19/17 | United States | 2,714,165 | 2,705,118 | |||||||
Revel AC Inc., Tranche B Loan, 9.00%, 2/17/17 | United States | 1,206,407 | 1,037,510 | |||||||
c,iTurtle Bay Holdings LLC, | ||||||||||
Term Loan A, PIK, 10.25%, 3/01/13 | United States | 2,062,925 | 2,011,352 | |||||||
Term Loan B, PIK, 3.00%, 2/09/15 | United States | 4,096,039 | 3,297,312 | |||||||
Weight Watchers International Inc., Term F Loan, 3.75%, 3/15/19 | United States | 1,322,339 | 1,295,231 | |||||||
jWendy’s International Inc., Closing date Term Loan, 4.75%, 5/15/19 | United States | 1,379,064 | 1,371,882 | |||||||
|
| |||||||||
| 22,276,960 | ||||||||||
|
| |||||||||
Diversified Financials 0.9% | ||||||||||
Asurion LLC, Second Lien Term Loan, 9.00%, 5/24/19 | United States | 3,651,257 | 3,744,820 | |||||||
MoneyGram Payment Systems Worldwide Inc., | ||||||||||
Term Loan, 4.25%, 11/18/17 | United States | 3,357,159 | 3,319,391 | |||||||
Tranche B-1 Loan, 4.25%, 11/18/17 | United States | 1,078,823 | 1,066,686 | |||||||
TransUnion LLC/TransUnion FICO, Term Loan, 5.50%, 2/10/18 | United States | 3,830,308 | 3,839,884 | |||||||
|
| |||||||||
| 11,970,781 | ||||||||||
|
| |||||||||
Energy 0.3% | ||||||||||
Arch Coal Inc., Term Loan B, 5.75%, 5/16/18 | United States | 3,712,107 | 3,653,111 | |||||||
|
| |||||||||
Food, Beverage & Tobacco 0.6% | ||||||||||
Del Monte Foods Co., Initial Term Loan, 4.50%, 3/08/18 | United States | 8,434,949 | 8,318,968 | |||||||
|
| |||||||||
Health Care Equipment & Services 2.1% | ||||||||||
Bausch & Lomb Inc., Parent Term Loan, 5.25%, 5/18/19 | United States | 5,625,945 | 5,601,332 | |||||||
Community Health Systems Inc., | ||||||||||
Extended Term Loan, 3.961% - 3.967%, 1/25/17 | United States | 6,114,635 | 6,024,346 | |||||||
Term Loan, 2.495% - 2.717%, 7/25/14 | United States | 2,543,553 | 2,511,043 | |||||||
DaVita Inc., Tranche B Term Loan, 4.50%, 10/20/16 | United States | 1,973,890 | 1,983,759 | |||||||
HCA Inc., Tranche B-2 Term Loan, 3.711%, 3/31/17 | United States | 8,318,841 | 8,099,731 | |||||||
Universal Health Services Inc., New Tranche B Term Loan, 3.75%, 11/15/16 | United States | 4,357,005 | 4,304,359 | |||||||
|
| |||||||||
| 28,524,570 | ||||||||||
|
| |||||||||
Materials 2.9% | ||||||||||
jAmerican Rock Salt Co. LLC, Initial Loan, 5.50%, 4/25/17 | United States | 3,893,001 | 3,695,108 | |||||||
Anchor Glass Container Corp., Second Lien Term Loan, 10.00%, 9/02/16 | United States | 5,813,900 | 5,806,633 | |||||||
Consolidated Container Co. LLC, Second Lien Term Loan, 5.75%, 9/28/14 | United States | 1,686,399 | 1,680,075 | |||||||
FSI-19
Franklin Templeton Variable Insurance Products Trust
Statement of Investments, June 30, 2012 (unaudited) (continued)
| Franklin Strategic Income Securities Fund | Country | Principal Amount* | Value | |||||||
h,kSenior Floating Rate Interests (continued) | ||||||||||
Materials (continued) | ||||||||||
jIneos US Finance LLC, Dollar Term Loan, 6.50%, 4/27/18 | United States | 3,115,586 | $ | 3,054,832 | ||||||
cNewPage Corp., DIP Term Loan, 8.00%, 3/07/13 | United States | 3,410,423 | 3,448,790 | |||||||
PL Propylene LLC, Tranche B Term Loan, 7.00%, 3/27/17 | United States | 2,317,593 | 2,343,666 | |||||||
Potters Holdings II LP, Second Lien Term Loan, 10.25%, 11/06/17 | United States | 247,452 | 250,081 | |||||||
Reynolds Group Holdings Inc., | ||||||||||
Tranche B Term Loan, 6.50%, 2/09/18 | United States | 2,854,501 | 2,876,703 | |||||||
Tranche C Term Loan, 6.50%, 8/09/18 | United States | 4,927,779 | 4,966,108 | |||||||
Road Infrastructure Investment LLC, Second Lien Term Loan, 10.25%, 9/30/18 | United States | 5,707,888 | 5,693,618 | |||||||
Tronox Pigments (Netherlands) BV, | ||||||||||
Closing Date Term Loan, 4.25%, 2/08/18 | Netherlands | 1,392,303 | 1,372,725 | |||||||
Delayed Draw Term Loan, 4.25%, 2/08/18 | Netherlands | 379,719 | 373,667 | |||||||
Walter Energy Inc., B Term Loan, 4.00%, 4/01/18 | United States | 4,478,059 | 4,394,096 | |||||||
|
| |||||||||
| 39,956,102 | ||||||||||
|
| |||||||||
Media 2.7% | ||||||||||
Atlantic Broadband Finance LLC, Second Lien Term Loan, 9.75%, 10/04/19 | United States | 1,892,400 | 1,877,418 | |||||||
Cinemark USA Inc., Extended Term Loan, 3.50% - 3.72%, 4/30/16 | United States | 1,899,045 | 1,891,924 | |||||||
Clear Channel Communications Inc., | ||||||||||
Tranche A Term Loan, 3.645%, 5/13/14 | United States | 1,893,112 | 1,723,915 | |||||||
Tranche B Term Loan, 3.895%, 1/29/16 | United States | 5,014,627 | 4,001,517 | |||||||
CSC Holdings Inc. (Cablevision), Incremental T-2 Extended TL, 1.995%, 3/29/16 | United States | 4,952,553 | 4,917,474 | |||||||
Cumulus Media Holdings Inc., Second Lien Term Loan, 7.50%, 9/16/19 | United States | 5,450,000 | 5,463,625 | |||||||
jHubbard Radio LLC, Second Lien Term Loan, 8.75%, 4/29/18 | United States | 1,433,484 | 1,437,068 | |||||||
R.H. Donnelley Inc., Term Loan B, 9.00%, 10/24/14 | United States | 195,333 | 86,630 | |||||||
Regal Cinemas Corp., Term Loan, 3.245% - 3.461%, 8/23/17 | United States | 2,886,382 | 2,864,734 | |||||||
Sinclair Television Group Inc., New Tranche B Term Loan, 4.00%, 10/29/16 | United States | 1,041,357 | 1,039,187 | |||||||
Telesat Canada, U.S. Term B Loan, 4.25%, 3/28/19 | Canada | 2,650,635 | 2,627,442 | |||||||
TWCC Holding Corp., Term Loan, 4.25%, 2/11/17 | United States | 2,769,495 | 2,771,226 | |||||||
Univision Communications Inc., Extended First Lien Term Loan, 4.495%, 3/31/17 | United States | 2,141,315 | 2,022,875 | |||||||
UPC Financing Partnership, | ||||||||||
Term Loan T, 3.739%, 12/31/16 | Netherlands | 2,935,799 | 2,902,771 | |||||||
Term Loan X, 3.739%, 12/31/17 | Netherlands | 1,384,751 | 1,360,518 | |||||||
|
| |||||||||
| 36,988,324 | ||||||||||
|
| |||||||||
Pharmaceuticals, Biotechnology & Life Sciences 0.6% | ||||||||||
Valeant Pharmaceuticals International Inc., | ||||||||||
Series A Tranche B Term Loan, 4.75%, 2/13/19 | Canada | 1,850,003 | 1,826,415 | |||||||
Series B Tranche B Term Loan, 6.00%, 2/13/19 | Canada | 615,000 | 602,700 | |||||||
Warner Chilcott Co. LLC, Term B-2 Loan, 4.25%, 3/15/18 | Puerto Rico | 1,310,145 | 1,306,168 | |||||||
Warner Chilcott Corp., Term B-1 Loan, 4.25%, 3/15/18 | United States | 2,620,291 | 2,612,335 | |||||||
WC Luxco S.A.R.L., Term B-3 Loan, 4.25%, 3/15/18 | Luxembourg | 1,801,450 | 1,795,981 | |||||||
|
| |||||||||
| 8,143,599 | ||||||||||
|
| |||||||||
Retailing 0.8% | ||||||||||
BJ’s Wholesale Club Inc., | ||||||||||
Replacement Loans, 5.25%, 9/30/18 | United States | 6,032,976 | 6,057,488 | |||||||
Second Lien Term Loan, 10.00%, 3/30/19 | United States | 4,648,792 | 4,794,067 | |||||||
Savers Inc., Term Loan B, 7.25%, 7/09/19 | United States | 500,000 | 500,000 | |||||||
|
| |||||||||
| 11,351,555 | ||||||||||
|
| |||||||||
Software & Services 0.7% | ||||||||||
AVG Technologies NV, Term Loan, 7.50%, 3/15/16 | Netherlands | 4,207,997 | 4,144,877 | |||||||
Fidelity National Information Services Inc., Term A-2 Loans, 2.489%, 7/18/14 | United States | 330,313 | 330,519 | |||||||
FSI-20
Franklin Templeton Variable Insurance Products Trust
Statement of Investments, June 30, 2012 (unaudited) (continued)
| Franklin Strategic Income Securities Fund | Country | Principal Amount* | Value | |||||||
h,kSenior Floating Rate Interests (continued) | ||||||||||
Software & Services (continued) | ||||||||||
SunGard Data Systems Inc., Tranche B U.S. Term Loan, 3.866% - 4.091%, 2/28/16 | United States | 2,942,137 | $ | 2,920,807 | ||||||
Vertafore Inc., Second Lien Term Loan, 9.75%, 10/27/17 | United States | 1,832,000 | 1,822,840 | |||||||
|
| |||||||||
| 9,219,043 | ||||||||||
|
| |||||||||
Technology Hardware & Equipment 0.1% | ||||||||||
Flextronics International USA Inc., | ||||||||||
A Closing Date Loan, 2.489% - 2.495%, 10/01/14 | United States | 95,629 | 93,896 | |||||||
A-1-A Delayed Draw Term Loan, 2.495%, 10/01/14 | United States | 27,480 | 27,111 | |||||||
A-1-B Delayed Draw TL, 2.495%, 10/01/14 | United States | 196,420 | 192,860 | |||||||
A-2 Delayed Draw Term Loan, 2.495%, 10/01/14 | United States | 673,510 | 661,302 | |||||||
A-3 Delayed Draw Term Loan, 2.489%, 10/01/14 | United States | 214,700 | 211,816 | |||||||
|
| |||||||||
| 1,186,985 | ||||||||||
|
| |||||||||
Telecommunication Services 0.6% | ||||||||||
Intelsat Jackson Holdings SA, Tranche B Term Loan, 5.25%, 4/02/18 | Luxembourg | 8,743,722 | 8,716,354 | |||||||
|
| |||||||||
Transportation 0.7% | ||||||||||
jAvis Budget Car Rental LLC, Tranche C Term Loan, 4.25%, 3/15/19 | United States | 3,092,073 | 3,085,632 | |||||||
Evergreen International Aviation Inc., Term Loan, 11.50%, 6/30/15 | United States | 1,120,226 | 971,796 | |||||||
Hertz Corp., | ||||||||||
Credit Linked Deposit, 3.75%, 3/11/18 | United States | 1,736,300 | 1,666,848 | |||||||
Tranche B Term Loan, 3.75%, 3/11/18 | United States | 3,347,280 | 3,313,807 | |||||||
|
| |||||||||
| 9,038,083 | ||||||||||
|
| |||||||||
Total Senior Floating Rate Interests (Cost $237,913,875) | 238,012,585 | |||||||||
|
| |||||||||
Foreign Government and Agency Securities 22.3% | ||||||||||
eArab Republic of Egypt, 144A, 5.75%, 4/29/20 | Egypt | 2,000,000 | 1,928,260 | |||||||
h,lGovernment of Argentina, senior bond, FRN, 0.785%, 8/03/12 | Argentina | 23,000,000 | 2,770,697 | |||||||
Government of Australia, senior bond, 6.50%, 5/15/13 | Australia | 5,700,000 | AUD | 6,016,833 | ||||||
Government of Hungary, | ||||||||||
5.50%, 2/12/14 | Hungary | 1,443,700,000 | HUF | 6,221,173 | ||||||
5.50%, 2/12/16 | Hungary | 1,864,700,000 | HUF | 7,754,026 | ||||||
6.50%, 6/24/19 | Hungary | 206,000,000 | HUF | 850,259 | ||||||
7.50%, 11/12/20 | Hungary | 312,600,000 | HUF | 1,355,554 | ||||||
senior note, 6.25%, 1/29/20 | Hungary | 5,507,000 | 5,414,069 | |||||||
senior note, 6.375%, 3/29/21 | Hungary | 1,550,000 | 1,526,750 | |||||||
eGovernment of Iceland, 144A, 5.875%, 5/11/22 | Iceland | 1,890,000 | 1,858,239 | |||||||
Government of Indonesia, | ||||||||||
FR19, 14.25%, 6/15/13 | Indonesia | 35,480,000,000 | IDR | 4,118,476 | ||||||
FR20, 14.275%, 12/15/13 | Indonesia | 23,637,000,000 | IDR | 2,852,005 | ||||||
FR26, 11.00%, 10/15/14 | Indonesia | 1,800,000,000 | IDR | 216,263 | ||||||
FR34, 12.80%, 6/15/21 | Indonesia | 37,155,000,000 | IDR | 5,754,722 | ||||||
FR42, 10.25%, 7/15/27 | Indonesia | 2,000,000,000 | IDR | 283,737 | ||||||
FR44, 10.00%, 9/15/24 | Indonesia | 9,300,000,000 | IDR | 1,268,265 | ||||||
Government of Ireland, | ||||||||||
4.60%, 4/18/16 | Ireland | 383,000 | EUR | 473,843 | ||||||
5.90%, 10/18/19 | Ireland | 2,228,000 | EUR | 2,765,758 | ||||||
4.50%, 4/18/20 | Ireland | 1,987,000 | EUR | 2,254,031 | ||||||
5.00%, 10/18/20 | Ireland | 3,562,000 | EUR | 4,151,930 | ||||||
senior bond, 4.50%, 10/18/18 | Ireland | 748,000 | EUR | 871,981 | ||||||
senior bond, 4.40%, 6/18/19 | Ireland | 3,338,000 | EUR | 3,819,964 | ||||||
senior bond, 5.40%, 3/13/25 | Ireland | 2,534,000 | EUR | 2,948,111 | ||||||
FSI-21
Franklin Templeton Variable Insurance Products Trust
Statement of Investments, June 30, 2012 (unaudited) (continued)
| Franklin Strategic Income Securities Fund | Country | Principal Amount* | Value | |||||||
Foreign Government and Agency Securities (continued) | ||||||||||
Government of Israel, | ||||||||||
5.00%, 3/31/13 | Israel | 4,370,000 | ILS | $ | 1,140,687 | |||||
3.50%, 9/30/13 | Israel | 16,505,000 | ILS | 4,287,246 | ||||||
Government of Malaysia, senior bond, | ||||||||||
2.509%, 8/27/12 | Malaysia | 19,455,000 | MYR | 6,131,654 | ||||||
3.702%, 2/25/13 | Malaysia | 20,473,000 | MYR | 6,487,284 | ||||||
3.70%, 5/15/13 | Malaysia | 2,695,000 | MYR | 855,317 | ||||||
3.21%, 5/31/13 | Malaysia | 15,055,000 | MYR | 4,758,762 | ||||||
3.461%, 7/31/13 | Malaysia | 14,715,000 | MYR | 4,665,377 | ||||||
8.00%, 10/30/13 | Malaysia | 50,000 | MYR | 16,793 | ||||||
5.094%, 4/30/14 | Malaysia | 2,290,000 | MYR | 749,193 | ||||||
3.814%, 2/15/17 | Malaysia | 11,400,000 | MYR | 3,692,845 | ||||||
4.24%, 2/07/18 | Malaysia | 600,000 | MYR | 198,454 | ||||||
Government of Mexico, | ||||||||||
9.00%, 12/20/12 | Mexico | 58,000 | m MXN | 443,631 | ||||||
9.00%, 6/20/13 | Mexico | 1,074,360 | m MXN | 8,387,470 | ||||||
8.00%, 12/19/13 | Mexico | 1,062,700 | m MXN | 8,352,538 | ||||||
7.00%, 6/19/14 | Mexico | 120,000 | m MXN | 939,338 | ||||||
9.50%, 12/18/14 | Mexico | 283,300 | m MXN | 2,362,878 | ||||||
8.00%, 12/17/15 | Mexico | 140,000 | m MXN | 1,157,428 | ||||||
Government of Poland, | ||||||||||
5.25%, 4/25/13 | Poland | 7,895,000 | PLN | 2,380,729 | ||||||
5.00%, 10/24/13 | Poland | 3,845,000 | PLN | 1,159,860 | ||||||
5.75%, 4/25/14 | Poland | 32,105,000 | PLN | 9,830,994 | ||||||
5.50%, 4/25/15 | Poland | 5,975,000 | PLN | 1,836,820 | ||||||
6.25%, 10/24/15 | Poland | 15,760,000 | PLN | 4,965,348 | ||||||
5.75%, 9/23/22 | Poland | 4,300,000 | PLN | 1,347,905 | ||||||
senior note, 6.375%, 7/15/19 | Poland | 785,000 | 928,361 | |||||||
Strip, 1/25/13 | Poland | 3,400,000 | PLN | 994,571 | ||||||
Strip, 7/25/13 | Poland | 9,270,000 | PLN | 2,652,885 | ||||||
Strip, 1/25/14 | Poland | 12,960,000 | PLN | 3,627,287 | ||||||
eGovernment of Russia, 144A, 7.50%, 3/31/30 | Russia | 3,816,505 | 4,582,668 | |||||||
Government of Sri Lanka, | ||||||||||
A, 6.90%, 8/01/12 | Sri Lanka | 1,900,000 | LKR | 14,207 | ||||||
A, 8.50%, 1/15/13 | Sri Lanka | 50,900,000 | LKR | 374,963 | ||||||
A, 13.50%, 2/01/13 | Sri Lanka | 59,500,000 | LKR | 449,123 | ||||||
A, 7.50%, 8/01/13 | Sri Lanka | 48,640,000 | LKR | 345,709 | ||||||
A, 7.00%, 3/01/14 | Sri Lanka | 7,020,000 | LKR | 47,939 | ||||||
A, 11.25%, 7/15/14 | Sri Lanka | 176,100,000 | LKR | 1,274,412 | ||||||
A, 11.75%, 3/15/15 | Sri Lanka | 1,160,000 | LKR | 8,345 | ||||||
A, 6.50%, 7/15/15 | Sri Lanka | 28,980,000 | LKR | 179,845 | ||||||
A, 11.00%, 8/01/15 | Sri Lanka | 200,400,000 | LKR | 1,405,996 | ||||||
A, 6.40%, 8/01/16 | Sri Lanka | 19,500,000 | LKR | 112,792 | ||||||
B, 8.50%, 7/15/13 | Sri Lanka | 1,110,000 | LKR | 8,009 | ||||||
B, 6.60%, 6/01/14 | Sri Lanka | 7,100,000 | LKR | 47,455 | ||||||
B, 6.40%, 10/01/16 | Sri Lanka | 16,000,000 | LKR | 92,020 | ||||||
Government of Sweden, | ||||||||||
5.50%, 10/08/12 | Sweden | 171,395,000 | SEK | 25,057,433 | ||||||
1.50%, 8/30/13 | Sweden | 106,380,000 | SEK | 15,482,465 | ||||||
Government of the Philippines, | Philippines | 57,170,000 | PHP | 1,409,792 | ||||||
senior note, 6.25%, 1/27/14 | Philippines | 141,200,000 | PHP | 3,509,203 | ||||||
FSI-22
Franklin Templeton Variable Insurance Products Trust
Statement of Investments, June 30, 2012 (unaudited) (continued)
| Franklin Strategic Income Securities Fund | Country | Principal Amount* | Value | |||||||
Foreign Government and Agency Securities (continued) | ||||||||||
eGovernment of Ukraine, | ||||||||||
144A, 7.75%, 9/23/20 | Ukraine | 6,000,000 | $ | 5,448,750 | ||||||
senior note, 144A, 7.95%, 2/23/21 | Ukraine | 1,500,000 | 1,372,477 | |||||||
nGovernment of Uruguay, senior note, Index Linked, 4.375%, 12/15/28 | Uruguay | 124,986,112 | UYU | 6,331,272 | ||||||
eGovernment of Vietnam, 144A, 6.75%, 1/29/20 | Vietnam | 1,500,000 | 1,605,000 | |||||||
Indonesia Retail Bond, senior bond, ORI7, 7.95%, 8/15/13 | Indonesia | 8,300,000,000 | IDR | 913,168 | ||||||
Korea Monetary Stabilization Bond, | South Korea | 707,150,000 | KRW | 622,204 | ||||||
senior bond, 3.90%, 8/02/13 | South Korea | 1,325,900,000 | KRW | 1,169,471 | ||||||
senior bond, 3.59%, 10/02/13 | South Korea | 1,237,510,000 | KRW | 1,088,247 | ||||||
senior bond, 3.48%, 12/02/13 | South Korea | 2,121,430,000 | KRW | 1,863,598 | ||||||
senior bond, 3.47%, 2/02/14 | South Korea | 2,916,950,000 | KRW | 2,562,802 | ||||||
senior bond, 3.59%, 4/02/14 | South Korea | 4,287,030,000 | KRW | 3,808,824 | ||||||
senior note, 3.28%, 6/02/14 | South Korea | 5,082,540,000 | KRW | 4,453,972 | ||||||
Korea Treasury Bond, | ||||||||||
5.25%, 9/10/12 | South Korea | 2,850,000,000 | KRW | 2,506,204 | ||||||
5.25%, 3/10/13 | South Korea | 346,570,000 | KRW | 307,620 | ||||||
senior bond, 4.25%, 12/10/12 | South Korea | 3,560,000,000 | KRW | 3,131,736 | ||||||
senior bond, 5.00%, 3/26/13 | South Korea | 1,163,000,000 | KRW | 1,031,311 | ||||||
senior bond, 3.75%, 6/10/13 | South Korea | 5,340,340,000 | KRW | 4,699,573 | ||||||
senior bond, 3.00%, 12/10/13 | South Korea | 15,972,210,000 | KRW | 13,935,560 | ||||||
New South Wales Treasury Corp., | ||||||||||
5.25%, 5/01/13 | Australia | 1,605,000 | AUD | 1,672,765 | ||||||
5.50%, 8/01/13 | Australia | 9,925,000 | AUD | 10,416,737 | ||||||
senior note, 5.50%, 3/01/17 | Australia | 1,240,000 | AUD | 1,396,458 | ||||||
Nota Do Tesouro Nacional, | ||||||||||
10.00%, 1/01/14 | Brazil | 2,700 | o BRL | 1,380,674 | ||||||
10.00%, 1/01/17 | Brazil | 7,400 | o BRL | 3,782,802 | ||||||
pIndex Linked, 6.00%, 5/15/15 | Brazil | 3,890 | o BRL | 4,454,664 | ||||||
pIndex Linked, 6.00%, 8/15/16 | Brazil | 1,604 | o BRL | 1,857,921 | ||||||
pIndex Linked, 6.00%, 8/15/18 | Brazil | 1,525 | o BRL | 1,789,374 | ||||||
Queensland Treasury Corp., | ||||||||||
6.00%, 8/14/13 | Australia | 600,000 | AUD | 633,971 | ||||||
6.00%, 9/14/17 | Australia | 1,200,000 | AUD | 1,370,592 | ||||||
senior note, 6.00%, 8/21/13 | Australia | 2,705,000 | AUD | 2,855,373 | ||||||
Western Australia Treasury Corp., | ||||||||||
5.50%, 7/17/12 | Australia | 6,714,000 | AUD | 6,879,411 | ||||||
8.00%, 6/15/13 | Australia | 4,602,000 | AUD | 4,927,668 | ||||||
|
| |||||||||
Total Foreign Government and Agency Securities | 306,499,176 | |||||||||
|
| |||||||||
U.S. Government and Agency Securities 2.1% | ||||||||||
U.S. Treasury Bond, | ||||||||||
4.50%, 2/15/16 | United States | 3,000,000 | 3,428,205 | |||||||
7.875%, 2/15/21 | United States | 900,000 | 1,377,774 | |||||||
7.125%, 2/15/23 | United States | 1,980,000 | 3,030,329 | |||||||
U.S. Treasury Note, | ||||||||||
2.375%, 3/31/16 | United States | 3,500,000 | 3,738,164 | |||||||
4.625%, 2/15/17 | United States | 600,000 | 707,203 | |||||||
4.75%, 8/15/17 | United States | 2,900,000 | 3,481,134 | |||||||
3.75%, 11/15/18 | United States | 7,000,000 | 8,205,862 | |||||||
nIndex Linked, 0.125%, 4/15/16 | United States | 2,397,000 | 2,497,748 | |||||||
FSI-23
Franklin Templeton Variable Insurance Products Trust
Statement of Investments, June 30, 2012 (unaudited) (continued)
| Franklin Strategic Income Securities Fund | Country | Principal Amount* | Value | |||||||
U.S. Government and Agency Securities (continued) | ||||||||||
U.S. Treasury Note, (continued) | ||||||||||
nIndex Linked, 0.625%, 7/15/21 | United States | 2,551,634 | $ | 2,847,065 | ||||||
|
| |||||||||
Total U.S. Government and Agency Securities | 29,313,484 | |||||||||
|
| |||||||||
Asset-Backed Securities and Commercial Mortgage-Backed Securities 3.4% | ||||||||||
Banks 1.3% | ||||||||||
e,hBanc of America Large Loan, 2010-HLTN, 144A, FRN, 1.992%, 11/15/15 | United States | 4,210,553 | 3,991,816 | |||||||
Bear Stearns Commercial Mortgage Securities Inc., | ||||||||||
h2006-PW11, AJ, FRN, 5.451%, 3/11/39 | United States | 500,000 | 466,243 | |||||||
2006-PW13, AJ, 5.611%, 9/11/41 | United States | 2,100,000 | 1,792,640 | |||||||
Countrywide Asset-Backed Certificates, 2005-11, AF4, 5.21%, 3/25/34 | United States | 1,275,000 | 757,438 | |||||||
hGS Mortgage Securities Corp. II, 2006-GG6, A4, FRN, 5.553%, 4/10/38 | United States | 2,405,000 | 2,683,914 | |||||||
e,hWachovia Bank Commercial Mortgage Trust, 2007-WHL8, A1, 144A, FRN, 0.322%, 6/15/20 | United States | 4,803,918 | 4,475,419 | |||||||
Wells Fargo Mortgage Backed Securities Trust, | ||||||||||
h2004-W, A9, FRN, 2.762%, 11/25/34 | United States | 1,999,697 | 2,019,549 | |||||||
2007-3, 3A1, 5.50%, 4/25/37 | United States | 1,958,865 | 2,034,621 | |||||||
|
| |||||||||
| 18,221,640 | ||||||||||
|
| |||||||||
Diversified Financials 2.1% | ||||||||||
e,hARES CLO Funds, 2007-12A, B, 144A, FRN, 1.467%, 11/25/20 | Cayman Islands | 1,380,000 | 1,164,686 | |||||||
e,hArmstrong Loan Funding Ltd., 2008-1A, B, 144A, FRN, 1.466%, 8/01/16 | Cayman Islands | 2,324,510 | 2,306,890 | |||||||
e,hCent CDO Ltd., 2007-15A, A2B, 144A, FRN, 0.808%, 3/11/21 | Cayman Islands | 1,251,000 | 1,042,083 | |||||||
Citigroup Commercial Mortgage Trust, | ||||||||||
2006-C5, AJ, 5.482%, 10/15/49 | United States | 800,000 | 697,809 | |||||||
h2007-C6, AM, FRN, 5.70%, 6/10/17 | United States | 1,700,000 | 1,803,333 | |||||||
h2008-C7, A4, FRN, 6.073%, 12/10/49 | United States | 8,700,000 | 10,201,877 | |||||||
hCitigroup/Deutsche Bank Commercial Mortgage Trust, | ||||||||||
2005-CD1, AJ, FRN, 5.399%, 7/15/44 | United States | 2,230,000 | 2,180,137 | |||||||
2006-CD3, AJ, FRN, 5.688%, 10/15/48 | United States | 420,000 | 295,549 | |||||||
e,hColumbus Nova CLO Ltd., 2007-2A, A2, 144A, FRN, 1.467%, 10/15/21 | Cayman Islands | 860,000 | 752,539 | |||||||
e,hCommercial Industrial Finance Corp., 2007-3A, A1J, 144A, FRN, 0.866%, 7/26/21 | Cayman Islands | 960,000 | 799,958 | |||||||
e,hCredit Suisse Mortgage Capital Certificates, 2006-TF2A, A2, 144A, FRN, 0.412%, 10/15/21 | United States | 399,033 | 373,853 | |||||||
e,hGleneagles CLO Ltd., 2005-1A, A2, 144A, FRN, 0.866%, 11/01/17 | Cayman Islands | 1,000,000 | 817,000 | |||||||
e,hMAPS CLO Fund LLC, 2005-1A, B, 144A, FRN, 0.968%, 12/21/17 | United States | 1,400,000 | 1,320,410 | |||||||
Residential Asset Securities Corp., 2004-KS1, AI4, 4.213%, 4/25/32 | United States | 70,813 | 69,485 | |||||||
e,hWestchester CLO Ltd., 2007-1A, A1A, 144A, FRN, 0.691%, 8/01/22 | Cayman Islands | 4,379,921 | 3,999,349 | |||||||
|
| |||||||||
| 27,824,958 | ||||||||||
|
| |||||||||
Total Asset-Backed Securities and Commercial Mortgage-Backed Securities (Cost $43,029,031) | 46,046,598 | |||||||||
|
| |||||||||
Mortgage-Backed Securities 4.0% | ||||||||||
hFederal Home Loan Mortgage Corp. (FHLMC) Adjustable Rate 0.0%† | ||||||||||
FHLMC, 2.348%, 1/01/33 | United States | 79,300 | 84,086 | |||||||
|
| |||||||||
Federal Home Loan Mortgage Corp. (FHLMC) Fixed Rate 1.1% | ||||||||||
FHLMC Gold 15 Year, 4.50%, 10/01/18 - 6/01/19 | United States | 912,674 | 972,147 | |||||||
FHLMC Gold 15 Year, 5.00%, 12/01/17 - 9/01/19 | United States | 1,163,738 | 1,249,885 | |||||||
FHLMC Gold 15 Year, 5.50%, 7/01/17 - 7/01/19 | United States | 289,586 | 316,551 | |||||||
FHLMC Gold 15 Year, 6.00%, 5/01/17 | United States | 11,638 | 12,683 | |||||||
FHLMC Gold 15 Year, 6.50%, 5/01/16 | United States | 3,064 | 3,241 | |||||||
FHLMC Gold 30 Year, 3.50%, 1/01/41 | United States | 700,000 | 735,392 | |||||||
FSI-24
Franklin Templeton Variable Insurance Products Trust
Statement of Investments, June 30, 2012 (unaudited) (continued)
| Franklin Strategic Income Securities Fund | Country | Principal Amount* | Value | |||||||
Mortgage-Backed Securities (continued) | ||||||||||
Federal Home Loan Mortgage Corp. (FHLMC) Fixed Rate (continued) | ||||||||||
FHLMC Gold 30 Year, 4.00%, 9/01/40 | United States | 1,847,218 | $ | 1,963,336 | ||||||
FHLMC Gold 30 Year, 4.50%, 10/01/40 | United States | 2,728,451 | 2,919,458 | |||||||
FHLMC Gold 30 Year, 5.00%, 4/01/34 - 8/01/35 | United States | 1,203,157 | 1,299,851 | |||||||
FHLMC Gold 30 Year, 5.50%, 3/01/33 - 6/01/36 | United States | 3,113,017 | 3,421,199 | |||||||
FHLMC Gold 30 Year, 6.00%, 4/01/33 - 2/01/36 | United States | 1,004,523 | 1,117,314 | |||||||
FHLMC Gold 30 Year, 6.50%, 12/01/23 - 6/01/36 | United States | 197,410 | 223,062 | |||||||
FHLMC Gold 30 Year, 7.00%, 9/01/21 - 4/01/30 | United States | 59,073 | 68,790 | |||||||
FHLMC Gold 30 Year, 7.50%, 3/01/30 - 7/01/31 | United States | 1,851 | 2,014 | |||||||
|
| |||||||||
| 14,304,923 | ||||||||||
|
| |||||||||
hFederal National Mortgage Association (FNMA) Adjustable Rate 0.0%† | ||||||||||
FNMA, 2.31%, 12/01/34 | United States | 263,376 | 278,843 | |||||||
FNMA, 2.33%, 4/01/20 | United States | 58,222 | 59,452 | |||||||
|
| |||||||||
| 338,295 | ||||||||||
|
| |||||||||
Federal National Mortgage Association (FNMA) Fixed Rate 2.7% | ||||||||||
FNMA 15 Year, 3.00%, 10/01/26 - 6/01/27 | United States | 3,899,652 | 4,092,712 | |||||||
FNMA 15 Year, 4.50%, 6/01/19 - 3/01/20 | United States | 219,683 | 236,449 | |||||||
FNMA 15 Year, 5.00%, 10/01/17 - 6/01/18 | United States | 248,095 | 268,661 | |||||||
FNMA 15 Year, 5.50%, 11/01/13 - 11/01/18 | United States | 2,190,035 | 2,376,592 | |||||||
FNMA 15 Year, 6.00%, 4/01/16 - 7/01/16 | United States | 4,170 | 4,491 | |||||||
FNMA 30 Year, 3.50%, 2/01/41 - 6/01/42 | United States | 6,849,932 | 7,225,715 | |||||||
FNMA 30 Year, 4.00%, 1/01/41 | United States | 949,187 | 1,012,117 | |||||||
FNMA 30 Year, 4.50%, 12/01/40 | United States | 5,120,787 | 5,512,874 | |||||||
FNMA 30 Year, 5.00%, 4/01/30 - 7/01/41 | United States | 9,907,788 | 10,806,324 | |||||||
FNMA 30 Year, 5.50%, 8/01/33 - 9/01/35 | United States | 1,655,079 | 1,818,107 | |||||||
FNMA 30 Year, 6.00%, 6/01/34 - 5/01/38 | United States | 2,288,396 | 2,537,352 | |||||||
FNMA 30 Year, 6.50%, 6/01/28 - 10/01/37 | United States | 1,193,642 | 1,352,415 | |||||||
|
| |||||||||
| 37,243,809 | ||||||||||
|
| |||||||||
Government National Mortgage Association (GNMA) Fixed Rate 0.2% | ||||||||||
GNMA I SF 30 Year, 5.00%, 11/15/33 - 7/15/34 | United States | 924,662 | 1,024,459 | |||||||
GNMA I SF 30 Year, 5.50%, 12/15/32 - 6/15/36 | United States | 983,164 | 1,097,903 | |||||||
GNMA I SF 30 Year, 6.50%, 11/15/31 - 2/15/32 | United States | 6,608 | 7,671 | |||||||
GNMA I SF 30 Year, 7.00%, 10/15/28 - 6/15/32 | United States | 62,061 | 74,357 | |||||||
GNMA I SF 30 Year, 7.50%, 9/15/30 | United States | 1,960 | 2,405 | |||||||
GNMA II SF 30 Year, 5.00%, 9/20/33 - 11/20/33 | United States | 247,560 | 275,293 | |||||||
GNMA II SF 30 Year, 6.00%, 11/20/34 | United States | 282,110 | 318,783 | |||||||
GNMA II SF 30 Year, 6.50%, 4/20/31 - 2/20/34 | United States | 110,056 | 127,364 | |||||||
GNMA II SF 30 Year, 7.50%, 1/20/28 - 4/20/32 | United States | 30,496 | 37,275 | |||||||
|
| |||||||||
| 2,965,510 | ||||||||||
|
| |||||||||
Total Mortgage-Backed Securities (Cost $52,862,462) | 54,936,623 | |||||||||
|
| |||||||||
Municipal Bonds 3.4% | ||||||||||
Bay Area Toll Authority Toll Bridge Revenue, Build America Bonds, Series S1, 7.043%, 4/01/50 | United States | 4,000,000 | 5,661,880 | |||||||
California State GO, | ||||||||||
Build America Bonds, Various Purpose, 7.625%, 3/01/40 | United States | 1,500,000 | 1,940,760 | |||||||
Refunding, 5.00%, 4/01/38 | United States | 9,700,000 | 10,182,284 | |||||||
Various Purpose, 6.00%, 4/01/38 | United States | 2,500,000 | 2,898,175 | |||||||
Various Purpose, 6.00%, 11/01/39 | United States | 160,000 | 186,982 | |||||||
Various Purpose, 5.25%, 11/01/40 | United States | 560,000 | 612,007 | |||||||
Various Purpose, Refunding, 5.25%, 3/01/38 | United States | 1,500,000 | 1,598,670 | |||||||
FSI-25
Franklin Templeton Variable Insurance Products Trust
Statement of Investments, June 30, 2012 (unaudited) (continued)
| Franklin Strategic Income Securities Fund | Country | Principal Amount* | Value | |||||||
Municipal Bonds (continued) | ||||||||||
California State GO, (continued) | ||||||||||
Various Purpose, Refunding, NATL Insured, 4.50%, 12/01/32 | United States | 300,000 | $ | 308,559 | ||||||
Various Purpose, Refunding, Series 1, AGMC Insured, 4.75%, 9/01/31 | United States | 290,000 | 300,109 | |||||||
Chicago Waterworks Revenue, second lien, Refunding, 5.25%, 11/01/38 | United States | 1,895,000 | 2,087,172 | |||||||
Clovis USD, GO, Capital Appreciation, Election of 2004, Series A, NATL RE, FGIC | United States | 2,500,000 | 1,404,500 | |||||||
8/01/26 | United States | 1,290,000 | 682,088 | |||||||
8/01/27 | United States | 1,720,000 | 859,002 | |||||||
8/01/29 | United States | 1,720,000 | 764,041 | |||||||
Illinois State GO, | ||||||||||
5.877%, 3/01/19 | United States | 3,575,000 | 3,967,893 | |||||||
Build America Bonds, 7.35%, 7/01/35 | United States | 3,000,000 | 3,489,360 | |||||||
eNew York City IDA Rental Revenue, Yankee Stadium Project, 144A, 11.00%, 3/01/29 | United States | 600,000 | 859,062 | |||||||
Poway USD, GO, Election of 2008, ID No. 2007-1, Series A, zero cpn., | ||||||||||
8/01/27 | United States | 370,000 | 185,059 | |||||||
8/01/30 | United States | 370,000 | 155,078 | |||||||
8/01/32 | United States | 460,000 | 168,714 | |||||||
8/01/33 | United States | 245,000 | 84,258 | |||||||
Redondo Beach USD, GO, Build America Bonds, Election of 2008, Direct Payment to District, Series D, 6.461%, 8/01/40 | United States | 1,510,000 | 1,638,290 | |||||||
San Francisco City and County GO, Build America Bonds, | ||||||||||
5.75%, 6/15/27 | United States | 1,700,000 | 2,077,485 | |||||||
5.93%, 6/15/28 | United States | 1,520,000 | 1,863,338 | |||||||
Sonoma County Pension Obligation Revenue, Series A, 6.00%, 12/01/29 | United States | 2,100,000 | 2,367,897 | |||||||
|
| |||||||||
Total Municipal Bonds (Cost $39,494,520) | 46,342,663 | |||||||||
|
| |||||||||
Total Investments before Short Term Investments | 1,239,742,181 | |||||||||
|
| |||||||||
Short Term Investments 6.5% | ||||||||||
Foreign Government and Agency Securities 2.9% | ||||||||||
qAustralia Treasury Bill, 8/10/12 | Australia | 4,010,000 | AUD | 4,088,499 | ||||||
qBank of Negara Monetary Note, 8/02/12 - 6/20/13 | Malaysia | 43,360,000 | MYR | 13,444,052 | ||||||
Korea Monetary Stabilization Bond, | ||||||||||
3.83%, 4/02/13 | South Korea | 441,970,000 | KRW | 388,787 | ||||||
senior bond, 3.38%, 5/09/13 | South Korea | 4,420,000,000 | KRW | 3,875,566 | ||||||
senior note, 3.28%, 6/09/13 | South Korea | 4,397,300,000 | KRW | 3,852,417 | ||||||
senior note, Strip, 12/18/12 | South Korea | 1,104,900,000 | KRW | 953,603 | ||||||
qMalaysia Treasury Bills, 7/27/12 - 5/31/13 | Malaysia | 700,000 | MYR | 217,068 | ||||||
qPhilippine Treasury Bills, 7/11/12 - 5/29/13 | Philippines | 167,980,000 | PHP | 3,957,779 | ||||||
qSingapore Treasury Bills, 7/05/12 - 5/02/13 | Singapore | 11,180,000 | SGD | 8,818,498 | ||||||
qSri Lanka Treasury Bills, 7/06/12 - 9/28/12 | Sri Lanka | 8,130,000 | LKR | 60,754 | ||||||
|
| |||||||||
Total Foreign Government and Agency Securities (Cost $39,837,672) | 39,657,023 | |||||||||
|
| |||||||||
Total Investments before Money Market Funds | 1,279,399,204 | |||||||||
|
| |||||||||
FSI-26
Franklin Templeton Variable Insurance Products Trust
Statement of Investments, June 30, 2012 (unaudited) (continued)
| Franklin Strategic Income Securities Fund | Country | Shares | Value | |||||||
Money Market Funds (Cost $50,165,155) 3.6% | ||||||||||
a,rInstitutional Fiduciary Trust Money Market Portfolio | United States | 50,165,155 | $ | 50,165,155 | ||||||
|
| |||||||||
Total Investments (Cost $1,306,745,029) 96.9% | 1,329,564,359 | |||||||||
Other Assets, less Liabilities 3.1% | 42,158,672 | |||||||||
|
| |||||||||
Net Assets 100.0% | $ | 1,371,723,031 | ||||||||
|
| |||||||||
See Abbreviations on page FSI-45.
†Rounds to less than 0.1% of net assets.
*The principal amount is stated in U.S. dollars unless otherwise indicated.
aNon-income producing.
bSecurity has been deemed illiquid because it may not be able to be sold within seven days. At June 30, 2012, the aggregate value of these securities was $1,882,095, representing 0.14% of net assets.
cAt June 30, 2012, pursuant to the Fund’s policies and the requirements of applicable securities law, the Fund may be restricted from trading these securities for a limited or extended period of time due to ownership limits and/or potential possession of material non-public information.
dSee Note 1(f) regarding investment in FT Holdings Corporation III.
eSecurity was purchased pursuant to Rule 144A under the Securities Act of 1933 and may be sold in transactions exempt from registration only to qualified institutional buyers or in a public offering registered under the Securities Act of 1933. These securities have been deemed liquid under guidelines approved by the Trust’s Board of Trustees. At June 30, 2012, the aggregate value of these securities was $221,147,177, representing 16.12% of net assets.
fSee Note 8 regarding defaulted securities.
gPerpetual security with no stated maturity date.
hThe coupon rate shown represents the rate at period end.
iIncome may be received in additional securities and/or cash.
jA portion or all of the security purchased on a when-issued or delayed delivery basis. See Note 1(c).
kSee Note 1(h) regarding senior floating rate interests.
lThe principal amount is stated in original face, and scheduled paydowns are reflected in the market price on ex-date.
mPrincipal amount is stated in 100 Mexican Peso Units.
n Principal amount of security is adjusted for inflation. See Note 1(j).
oPrincipal amount is stated in 1,000 Brazilian Real Units.
pRedemption price at maturity is adjusted for inflation. See Note 1(j).
qThe security is traded on a discount basis with no stated coupon rate.
rSee Note 7 regarding investments in the Institutional Fiduciary Trust Money Market Portfolio.
FSI-27
Franklin Templeton Variable Insurance Products Trust
Statement of Investments, June 30, 2012 (unaudited) (continued)
| Franklin Strategic Income Securities Fund |
At June 30, 2012, the Fund had the following forward exchange contracts outstanding. See Note 1(d).
Forward Exchange Contracts
| Currency | Counterparty | Type | Quantity | Contract Amount | Settlement Date | Unrealized Appreciation | Unrealized Depreciation | |||||||||||||||||||||
British Pound | DBAB | Sell | 297,656 | $ | 474,018 | 7/09/12 | $ | 7,676 | $ | — | ||||||||||||||||||
Euro | DBAB | Buy | 2,065,396 | 2,753,482 | 7/09/12 | — | (139,302 | ) | ||||||||||||||||||||
Euro | DBAB | Sell | 2,065,396 | 2,924,600 | 7/09/12 | 310,420 | — | |||||||||||||||||||||
Indian Rupee | JPHQ | Buy | 192,280,000 | 4,121,069 | 7/16/12 | — | (670,047 | ) | ||||||||||||||||||||
Euro | DBAB | Buy | 900,000 | 1,200,015 | 7/25/12 | — | (60,731 | ) | ||||||||||||||||||||
Euro | DBAB | Sell | 900,000 | 1,280,340 | 7/25/12 | 141,056 | — | |||||||||||||||||||||
Euro | BZWS | Buy | 3,140,000 | 3,946,069 | 8/01/12 | 29,030 | — | |||||||||||||||||||||
Euro | BZWS | Sell | 3,140,000 | 4,450,008 | 8/01/12 | 474,909 | — | |||||||||||||||||||||
Euro | DBAB | Sell | 1,056,111 | 1,501,209 | 8/06/12 | 164,146 | — | |||||||||||||||||||||
Euro | CITI | Sell | 317,220 | 445,361 | 8/08/12 | 43,743 | — | |||||||||||||||||||||
British Pound | DBAB | Sell | 169,385 | 275,589 | 8/09/12 | 10,234 | — | |||||||||||||||||||||
Euro | CITI | Sell | 92,411 | 130,027 | 8/09/12 | 13,028 | — | |||||||||||||||||||||
Chilean Peso | JPHQ | Buy | 1,141,336,600 | 2,333,745 | 8/20/12 | — | (71,671 | ) | ||||||||||||||||||||
Euro | DBAB | Sell | 193,056 | 276,726 | 8/20/12 | 32,275 | — | |||||||||||||||||||||
Japanese Yen | UBSW | Sell | 32,055,000 | 420,228 | 8/20/12 | 19,190 | — | |||||||||||||||||||||
Japanese Yen | JPHQ | Sell | 15,928,000 | 208,359 | 8/20/12 | 9,085 | — | |||||||||||||||||||||
Japanese Yen | DBAB | Sell | 19,550,000 | 255,887 | 8/20/12 | 11,298 | — | |||||||||||||||||||||
Japanese Yen | HSBC | Sell | 65,957,000 | 865,478 | 8/20/12 | 40,295 | — | |||||||||||||||||||||
Euro | BZWS | Buy | 40,000 | 50,281 | 8/22/12 | 369 | — | |||||||||||||||||||||
Euro | BZWS | Sell | 2,124,000 | 3,043,692 | 8/22/12 | 354,176 | — | |||||||||||||||||||||
Euro | UBSW | Sell | 3,500,000 | 4,984,525 | 8/22/12 | 552,648 | — | |||||||||||||||||||||
Japanese Yen | BZWS | Sell | 15,895,000 | 208,788 | 8/22/12 | 9,921 | — | |||||||||||||||||||||
Japanese Yen | MSCO | Sell | 12,500,000 | 164,184 | 8/22/12 | 7,793 | — | |||||||||||||||||||||
Japanese Yen | DBAB | Sell | 15,915,000 | 209,026 | 8/22/12 | 9,909 | — | |||||||||||||||||||||
Euro | BZWS | Sell | 263,159 | 378,423 | 8/23/12 | 45,194 | — | |||||||||||||||||||||
Japanese Yen | FBCO | Sell | 31,524,000 | 414,299 | 8/23/12 | 19,888 | — | |||||||||||||||||||||
Japanese Yen | CITI | Sell | 31,757,000 | 418,075 | 8/23/12 | 20,749 | — | |||||||||||||||||||||
Japanese Yen | DBAB | Sell | 15,708,000 | 207,130 | 8/23/12 | 10,600 | — | |||||||||||||||||||||
Singapore Dollar | DBAB | Buy | 578,000 | 460,796 | 8/23/12 | — | (4,591 | ) | ||||||||||||||||||||
Euro | BZWS | Sell | 441,303 | 633,093 | 8/24/12 | 74,281 | — | |||||||||||||||||||||
Japanese Yen | JPHQ | Sell | 31,689,000 | 415,403 | 8/24/12 | 18,922 | — | |||||||||||||||||||||
Singapore Dollar | DBAB | Buy | 580,000 | 461,196 | 8/24/12 | — | (3,411 | ) | ||||||||||||||||||||
Euro | BZWS | Sell | 3,068,753 | 4,414,138 | 8/27/12 | 528,113 | — | |||||||||||||||||||||
Euro | DBAB | Sell | 298,304 | 429,901 | 8/27/12 | 52,152 | — | |||||||||||||||||||||
Euro | UBSW | Sell | 2,085,332 | 3,000,000 | 8/27/12 | 359,301 | — | |||||||||||||||||||||
Japanese Yen | DBAB | Buy | 155,000,000 | 2,006,472 | 8/27/12 | — | (67,090 | ) | ||||||||||||||||||||
Japanese Yen | DBAB | Buy | 200,000,000 | 2,480,466 | 8/27/12 | 21,962 | — | |||||||||||||||||||||
Japanese Yen | BZWS | Sell | 44,152,000 | 578,929 | 8/27/12 | 26,493 | — | |||||||||||||||||||||
Japanese Yen | DBAB | Sell | 427,099,000 | 5,620,315 | 8/27/12 | 276,392 | — | |||||||||||||||||||||
Japanese Yen | UBSW | Sell | 34,903,000 | 459,054 | 8/27/12 | 22,342 | — | |||||||||||||||||||||
Japanese Yen | JPHQ | Sell | 15,991,000 | 210,270 | 8/27/12 | 10,188 | — | |||||||||||||||||||||
Japanese Yen | HSBC | Sell | 50,145,000 | 657,855 | 8/27/12 | 30,434 | — | |||||||||||||||||||||
Singapore Dollar | DBAB | Buy | 722,000 | 575,597 | 8/27/12 | — | (5,732 | ) | ||||||||||||||||||||
Euro | DBAB | Sell | 1,383,356 | 1,980,412 | 8/29/12 | 228,602 | — | |||||||||||||||||||||
Euro | DBAB | Sell | 690,000 | 991,530 | 8/30/12 | 117,740 | — | |||||||||||||||||||||
Japanese Yen | BZWS | Sell | 37,600,000 | 493,438 | 8/30/12 | 22,963 | — | |||||||||||||||||||||
Euro | DBAB | Sell | 12,470 | 18,035 | 8/31/12 | 2,244 | — | |||||||||||||||||||||
Japanese Yen | JPHQ | Sell | 15,743,000 | 206,317 | 8/31/12 | 9,328 | — | |||||||||||||||||||||
Singapore Dollar | DBAB | Buy | 361,500 | 287,635 | 8/31/12 | — | (2,304 | ) | ||||||||||||||||||||
Indian Rupee | HSBC | Buy | 32,771,000 | 569,015 | 9/04/12 | 13,091 | — | |||||||||||||||||||||
Euro | BZWS | Sell | 271,320 | 380,960 | 9/10/12 | 37,331 | — | |||||||||||||||||||||
FSI-28
Franklin Templeton Variable Insurance Products Trust
Statement of Investments, June 30, 2012 (unaudited)
| Franklin Strategic Income Securities Fund | ||||||||||||||
Forward Exchange Contracts (continued)
| Currency | Counterparty | Type | Quantity | Contract Amount | Settlement Date | Unrealized Appreciation | Unrealized Depreciation | |||||||||||||||||||||
Indian Rupee | HSBC | Buy | 5,576,000 | $ | 98,575 | 9/10/12 | $ | 367 | $ | — | ||||||||||||||||||
Euro | BZWS | Sell | 266,006 | 371,876 | 9/12/12 | 34,970 | — | |||||||||||||||||||||
Indian Rupee | HSBC | Buy | 14,080,000 | 250,251 | 9/13/12 | — | (541 | ) | ||||||||||||||||||||
Euro | BZWS | Sell | 759,073 | 1,038,279 | 9/14/12 | 76,864 | — | |||||||||||||||||||||
Euro | UBSW | Sell | 708,181 | 970,704 | 9/17/12 | 73,718 | — | |||||||||||||||||||||
Indian Rupee | DBAB | Buy | 14,156,000 | 249,032 | 9/18/12 | 1,808 | — | |||||||||||||||||||||
Euro | BZWS | Sell | 178,354 | 247,234 | 9/19/12 | 21,325 | — | |||||||||||||||||||||
Singapore Dollar | JPHQ | Buy | 1,394,000 | 1,100,671 | 9/19/12 | — | (307 | ) | ||||||||||||||||||||
Indian Rupee | DBAB | Buy | 12,894,000 | 227,733 | 9/20/12 | 666 | — | |||||||||||||||||||||
Euro | BZWS | Sell | 469,210 | 638,370 | 9/24/12 | 44,021 | — | |||||||||||||||||||||
Euro | DBAB | Sell | 185,654 | 249,909 | 10/04/12 | 14,711 | — | |||||||||||||||||||||
Philippine Peso | DBAB | Buy | 21,010,000 | 482,434 | 10/04/12 | 15,018 | — | |||||||||||||||||||||
Philippine Peso | HSBC | Buy | 16,853,000 | 382,319 | 10/04/12 | 16,708 | — | |||||||||||||||||||||
Euro | UBSW | Sell | 2,850,000 | 3,797,696 | 10/05/12 | 187,096 | — | |||||||||||||||||||||
Philippine Peso | DBAB | Buy | 25,119,000 | 576,785 | 10/05/12 | 17,915 | — | |||||||||||||||||||||
Philippine Peso | HSBC | Buy | 25,126,000 | 566,398 | 10/05/12 | 28,467 | — | |||||||||||||||||||||
Philippine Peso | DBAB | Buy | 20,621,000 | 473,774 | 10/09/12 | 14,301 | — | |||||||||||||||||||||
Philippine Peso | JPHQ | Buy | 6,636,000 | 152,132 | 10/09/12 | 4,934 | — | |||||||||||||||||||||
Euro | BZWS | Sell | 2,749,000 | 3,645,641 | 10/11/12 | 162,714 | — | |||||||||||||||||||||
Philippine Peso | DBAB | Buy | 16,501,000 | 379,072 | 10/11/12 | 11,434 | — | |||||||||||||||||||||
Philippine Peso | JPHQ | Buy | 8,232,000 | 188,721 | 10/11/12 | 6,094 | — | |||||||||||||||||||||
Philippine Peso | HSBC | Buy | 24,786,000 | 569,911 | 10/11/12 | 16,664 | — | |||||||||||||||||||||
Philippine Peso | DBAB | Buy | 4,913,000 | 112,554 | 10/12/12 | 3,707 | — | |||||||||||||||||||||
Euro | DBAB | Sell | 121,043 | 166,845 | 10/15/12 | 13,478 | — | |||||||||||||||||||||
Philippine Peso | JPHQ | Buy | 18,311,000 | 420,018 | 10/15/12 | 13,204 | — | |||||||||||||||||||||
Philippine Peso | HSBC | Buy | 8,192,000 | 187,739 | 10/15/12 | 6,076 | — | |||||||||||||||||||||
Euro | DBAB | Sell | 587,951 | 811,125 | 10/18/12 | 66,133 | — | |||||||||||||||||||||
Japanese Yen | DBAB | Buy | 238,000,000 | 3,000,504 | 10/22/12 | — | (20,068 | ) | ||||||||||||||||||||
Japanese Yen | DBAB | Sell | 382,080,000 | 5,015,687 | 10/22/12 | 230,960 | — | |||||||||||||||||||||
Philippine Peso | JPHQ | Buy | 237,550,000 | 5,469,721 | 10/22/12 | 147,815 | — | |||||||||||||||||||||
Euro | BZWS | Sell | 217,715 | 299,162 | 10/24/12 | 23,273 | — | |||||||||||||||||||||
Euro | BZWS | Sell | 1,659,340 | 2,302,168 | 10/25/12 | 199,421 | — | |||||||||||||||||||||
Euro | BZWS | Sell | 1,993,000 | 2,759,886 | 10/26/12 | 234,285 | — | |||||||||||||||||||||
Euro | CITI | Sell | 648,569 | 902,918 | 10/26/12 | 81,028 | — | |||||||||||||||||||||
Japanese Yen | JPHQ | Sell | 270,990,000 | 3,577,355 | 10/26/12 | 183,549 | — | |||||||||||||||||||||
Euro | UBSW | Sell | 2,679,000 | 3,729,168 | 10/29/12 | 334,105 | — | |||||||||||||||||||||
Singapore Dollar | DBAB | Buy | 6,168,500 | 4,955,415 | 10/29/12 | — | (84,483 | ) | ||||||||||||||||||||
Euro | DBAB | Sell | 1,494,524 | 2,106,995 | 10/31/12 | 212,952 | — | |||||||||||||||||||||
Japanese Yen | JPHQ | Sell | 360,360,000 | 4,785,340 | 10/31/12 | 271,888 | — | |||||||||||||||||||||
Euro | DBAB | Sell | 243,767 | 339,065 | 11/02/12 | 30,126 | — | |||||||||||||||||||||
Euro | BZWS | Sell | 529,706 | 730,253 | 11/05/12 | 58,900 | — | |||||||||||||||||||||
Euro | BZWS | Sell | 473,670 | 651,367 | 11/08/12 | 51,010 | — | |||||||||||||||||||||
Euro | BZWS | Sell | 227,970 | 311,031 | 11/15/12 | 22,061 | — | |||||||||||||||||||||
Euro | UBSW | Sell | 1,480,440 | 2,011,770 | 11/19/12 | 135,095 | — | |||||||||||||||||||||
Euro | BZWS | Sell | 63,419 | 86,938 | 11/19/12 | 6,545 | — | |||||||||||||||||||||
Euro | BZWS | Sell | 221,993 | 301,245 | 11/21/12 | 19,828 | — | |||||||||||||||||||||
Euro | BZWS | Sell | 201,376 | 273,328 | 11/23/12 | 18,040 | — | |||||||||||||||||||||
Euro | UBSW | Sell | 2,020,000 | 2,731,444 | 12/03/12 | 170,314 | — | |||||||||||||||||||||
Singapore Dollar | JPHQ | Buy | 4,945,200 | 3,849,303 | 12/05/12 | 57,160 | — | |||||||||||||||||||||
Japanese Yen | BZWS | Sell | 257,790,000 | 3,343,580 | 12/06/12 | 112,737 | — | |||||||||||||||||||||
Euro | UBSW | Sell | 3,400,000 | 4,552,566 | 12/10/12 | 241,346 | — | |||||||||||||||||||||
Euro | DBAB | Sell | 5,466,617 | 7,331,882 | 12/10/12 | 400,179 | — | |||||||||||||||||||||
Japanese Yen | UBSW | Sell | 351,760,000 | 4,586,778 | 12/12/12 | 177,754 | — | |||||||||||||||||||||
FSI-29
Franklin Templeton Variable Insurance Products Trust
Statement of Investments, June 30, 2012 (unaudited)
| Franklin Strategic Income Securities Fund |
Forward Exchange Contracts (continued)
| Currency | Counterparty | Type | Quantity | Contract Amount | Settlement Date | Unrealized Appreciation | Unrealized Depreciation | |||||||||||||||||||||
British Pound | DBAB | Sell | 600,000 | $ | 922,440 | 12/17/12 | $ | — | $ | (17,115 | ) | |||||||||||||||||
Euro | DBAB | Sell | 486,875 | 639,705 | 12/17/12 | 22,286 | — | |||||||||||||||||||||
Euro | CITI | Sell | 3,868,000 | 5,051,879 | 12/17/12 | 146,768 | — | |||||||||||||||||||||
Euro | UBSW | Sell | 2,137,312 | 2,799,559 | 12/20/12 | 89,068 | — | |||||||||||||||||||||
Euro | DBAB | Sell | 262,167 | 343,177 | 12/20/12 | 10,702 | — | |||||||||||||||||||||
Euro | DBAB | Sell | 239,450 | 305,897 | 1/03/13 | 2,173 | — | |||||||||||||||||||||
Chilean Peso | DBAB | Sell | 510,000,000 | 972,911 | 1/10/13 | — | (20,950 | ) | ||||||||||||||||||||
Chilean Peso | DBAB | Buy | 2,449,000,000 | 4,646,177 | 1/10/13 | 126,306 | — | |||||||||||||||||||||
Indian Rupee | HSBC | Buy | 94,400,000 | 1,702,318 | 1/10/13 | — | (58,375 | ) | ||||||||||||||||||||
Japanese Yen | HSBC | Sell | 183,560,000 | 2,402,932 | 1/10/13 | 100,975 | — | |||||||||||||||||||||
Euro | UBSW | Sell | 3,940,000 | 5,039,654 | 1/11/13 | 41,489 | — | |||||||||||||||||||||
Euro | BZWS | Sell | 1,691,484 | 2,164,339 | 1/11/13 | 18,573 | — | |||||||||||||||||||||
Euro | DBAB | Sell | 2,187,000 | 2,808,327 | 1/14/13 | 33,846 | — | |||||||||||||||||||||
Euro | JPHQ | Sell | 1,802,953 | 2,299,576 | 1/14/13 | 12,307 | — | |||||||||||||||||||||
Japanese Yen | BZWS | Sell | 460,675,000 | 6,026,228 | 1/15/13 | 248,563 | — | |||||||||||||||||||||
Euro | DBAB | Sell | 252,750 | 330,243 | 1/17/13 | 9,585 | — | |||||||||||||||||||||
Euro | BZWS | Sell | 2,912,410 | 3,716,235 | 1/22/13 | 21,059 | — | |||||||||||||||||||||
Euro | DBAB | Sell | 186,978 | 238,990 | 1/22/13 | 1,758 | — | |||||||||||||||||||||
Japanese Yen | DBAB | Sell | 271,680,000 | 3,556,021 | 1/22/13 | 148,259 | — | |||||||||||||||||||||
Euro | DBAB | Sell | 465,260 | 603,675 | 1/24/13 | 13,350 | — | |||||||||||||||||||||
Euro | BZWS | Sell | 1,007,118 | 1,313,231 | 1/28/13 | 35,322 | — | |||||||||||||||||||||
Euro | DBAB | Sell | 3,774,662 | 4,908,633 | 1/28/13 | 119,048 | — | |||||||||||||||||||||
Euro | DBAB | Sell | 4,032,721 | 5,311,900 | 1/30/13 | 194,723 | — | |||||||||||||||||||||
Euro | DBAB | Sell | 3,014,151 | 3,960,293 | 1/31/13 | 135,539 | — | |||||||||||||||||||||
Chilean Peso | DBAB | Buy | 725,000,000 | 1,434,167 | 2/07/13 | — | (24,913 | ) | ||||||||||||||||||||
Chilean Peso | JPHQ | Buy | 482,900,000 | 958,325 | 2/08/13 | — | (19,750 | ) | ||||||||||||||||||||
Indian Rupee | HSBC | Buy | 186,760,000 | 3,668,507 | 2/08/13 | — | (429,551 | ) | ||||||||||||||||||||
Chilean Peso | BZWS | Buy | 1,487,300,000 | 2,958,623 | 2/11/13 | — | (68,661 | ) | ||||||||||||||||||||
Euro | UBSW | Sell | 2,151,000 | 2,862,400 | 2/13/13 | 132,420 | — | |||||||||||||||||||||
Singapore Dollar | DBAB | Buy | 361,500 | 288,301 | 2/28/13 | — | (2,482 | ) | ||||||||||||||||||||
Euro | UBSW | Sell | 2,581,000 | 3,478,156 | 3/01/13 | 201,683 | — | |||||||||||||||||||||
Japanese Yen | HSBC | Sell | 85,800,000 | 1,073,070 | 3/01/13 | — | (3,869 | ) | ||||||||||||||||||||
Japanese Yen | JPHQ | Sell | 85,800,000 | 1,073,842 | 3/01/13 | — | (3,097 | ) | ||||||||||||||||||||
Euro | DBAB | Sell | 5,979,967 | 8,000,000 | 3/04/13 | 408,354 | — | |||||||||||||||||||||
Japanese Yen | UBSW | Sell | 95,700,000 | 1,194,048 | 3/04/13 | — | (7,217 | ) | ||||||||||||||||||||
Euro | DBAB | Sell | 324,000 | 424,084 | 3/18/13 | 12,679 | — | |||||||||||||||||||||
Singapore Dollar | HSBC | Buy | 1,113,000 | 880,747 | 3/19/13 | — | (586 | ) | ||||||||||||||||||||
Singapore Dollar | DBAB | Buy | 973,400 | 768,696 | 3/19/13 | 1,069 | — | |||||||||||||||||||||
Singapore Dollar | DBAB | Buy | 1,048,000 | 835,592 | 3/21/13 | — | (6,816 | ) | ||||||||||||||||||||
Singapore Dollar | HSBC | Buy | 837,000 | 667,251 | 3/21/13 | — | (5,338 | ) | ||||||||||||||||||||
Euro | DBAB | Sell | 333,108 | 440,136 | 3/26/13 | 17,118 | — | |||||||||||||||||||||
Euro | DBAB | Sell | 7,647,393 | 10,159,601 | 4/02/13 | 447,066 | — | |||||||||||||||||||||
Euro | DBAB | Sell | 222,456 | 297,469 | 4/03/13 | 14,935 | — | |||||||||||||||||||||
Indian Rupee | HSBC | Buy | 108,100,000 | 2,000,000 | 4/03/13 | — | (139,399 | ) | ||||||||||||||||||||
Euro | BZWS | Sell | 132,570 | 176,948 | 4/05/13 | 8,570 | — | |||||||||||||||||||||
British Pound | DBAB | Sell | 456,285 | 720,246 | 4/11/13 | 6,008 | — | |||||||||||||||||||||
Euro | DBAB | Sell | 949,814 | 1,251,011 | 4/11/13 | 44,542 | — | |||||||||||||||||||||
Indian Rupee | DBAB | Buy | 20,841,000 | 383,696 | 4/12/13 | — | (25,413 | ) | ||||||||||||||||||||
Chilean Peso | MSCO | Buy | 116,230,000 | 229,138 | 4/15/13 | — | (4,555 | ) | ||||||||||||||||||||
Indian Rupee | DBAB | Buy | 44,691,000 | 817,214 | 4/15/13 | — | (49,229 | ) | ||||||||||||||||||||
Euro | HSBC | Sell | 142,717 | 188,818 | 4/16/13 | 7,523 | — | |||||||||||||||||||||
FSI-30
Franklin Templeton Variable Insurance Products Trust
Statement of Investments, June 30, 2012 (unaudited) (continued)
| Franklin Strategic Income Securities Fund |
Forward Exchange Contracts (continued)
| Currency | Counterparty | Type | Quantity | Contract Amount | Settlement Date | Unrealized Appreciation | Unrealized Depreciation | |||||||||||||||||||||
Indian Rupee | JPHQ | Buy | 30,019,000 | $ | 550,585 | 4/16/13 | $ | — | $ | (34,797 | ) | |||||||||||||||||
Indian Rupee | JPHQ | Buy | 29,466,000 | 538,595 | 4/18/13 | — | (32,443 | ) | ||||||||||||||||||||
Chilean Peso | MSCO | Buy | 104,150,000 | 205,505 | 4/19/13 | — | (4,333 | ) | ||||||||||||||||||||
Euro | BZWS | Sell | 130,134 | 171,152 | 4/19/13 | 5,834 | — | |||||||||||||||||||||
Indian Rupee | JPHQ | Buy | 14,719,000 | 269,695 | 4/22/13 | — | (16,994 | ) | ||||||||||||||||||||
Indian Rupee | DBAB | Buy | 10,360,000 | 189,582 | 4/22/13 | — | (11,718 | ) | ||||||||||||||||||||
Euro | JPHQ | Sell | 36,314 | 48,058 | 4/23/13 | 1,923 | — | |||||||||||||||||||||
Indian Rupee | DBAB | Buy | 20,931,000 | 373,361 | 4/26/13 | — | (14,202 | ) | ||||||||||||||||||||
Chilean Peso | CITI | Buy | 377,668,000 | 747,857 | 4/29/13 | — | (18,995 | ) | ||||||||||||||||||||
Chilean Peso | JPHQ | Buy | 234,301,000 | 462,680 | 4/29/13 | — | (10,502 | ) | ||||||||||||||||||||
Indian Rupee | JPHQ | Buy | 17,801,000 | 319,386 | 4/29/13 | — | (14,057 | ) | ||||||||||||||||||||
Euro | DBAB | Sell | 753,750 | 1,000,000 | 4/30/13 | 42,303 | — | |||||||||||||||||||||
Euro | BZWS | Sell | 91,515 | 121,559 | 4/30/13 | 5,283 | — | |||||||||||||||||||||
Indian Rupee | JPHQ | Buy | 14,829,000 | 265,529 | 4/30/13 | — | (11,210 | ) | ||||||||||||||||||||
British Pound | DBAB | Sell | 453,906 | 732,877 | 5/02/13 | 22,390 | — | |||||||||||||||||||||
Euro | DBAB | Sell | 71,000 | 93,003 | 5/02/13 | 2,789 | — | |||||||||||||||||||||
Philippine Peso | JPHQ | Buy | 91,360,000 | 2,144,953 | 5/06/13 | — | (8,025 | ) | ||||||||||||||||||||
Chilean Peso | DBAB | Buy | 574,000,000 | 1,134,051 | 5/08/13 | — | (27,142 | ) | ||||||||||||||||||||
Singapore Dollar | DBAB | Buy | 3,707,640 | 2,984,016 | 5/10/13 | — | (50,699 | ) | ||||||||||||||||||||
Euro | DBAB | Sell | 429,000 | 557,357 | 5/13/13 | 12,174 | — | |||||||||||||||||||||
British Pound | DBAB | Buy | 640,000 | 997,664 | 5/17/13 | 4,082 | — | |||||||||||||||||||||
British Pound | DBAB | Sell | 2,287,500 | 3,654,968 | 5/17/13 | 74,511 | — | |||||||||||||||||||||
Euro | DBAB | Sell | 1,053,792 | 1,310,844 | 6/05/13 | — | (28,800 | ) | ||||||||||||||||||||
Euro | UBSW | Sell | 4,274,000 | 5,354,467 | 6/28/13 | — | (80,768 | ) | ||||||||||||||||||||
Euro | DBAB | Sell | 320,700 | 402,767 | 6/28/13 | — | (5,068 | ) | ||||||||||||||||||||
Japanese Yen | BZWS | Sell | 620,288,000 | 7,871,176 | 7/02/13 | 65,176 | — | |||||||||||||||||||||
|
| |||||||||||||||||||||||||||
Unrealized appreciation (depreciation) |
| 11,532,406 | (2,387,347 | ) | ||||||||||||||||||||||||
|
| |||||||||||||||||||||||||||
Net unrealized appreciation (depreciation) |
| $ | 9,145,059 | |||||||||||||||||||||||||
|
| |||||||||||||||||||||||||||
See Abbreviations on page FSI-45.
The accompanying notes are an integral part of these financial statements.
FSI-31
Franklin Templeton Variable Insurance Products Trust
Financial Statements
Statement of Assets and Liabilities
June 30, 2012 (unaudited)
| Franklin Strategic Income Securities Fund | ||||
Assets: | ||||
Investments in securities: | ||||
Cost - Unaffiliated issuers | $ | 1,256,579,874 | ||
Cost - Sweep Money Fund (Note 7) | �� | 50,165,155 | ||
|
| |||
Total cost of investments | $ | 1,306,745,029 | ||
|
| |||
Value - Unaffiliated issuers | $ | 1,279,399,204 | ||
Value - Sweep Money Fund (Note 7) | 50,165,155 | |||
|
| |||
Total value of investments | 1,329,564,359 | |||
Cash | 867,316 | |||
Restricted cash (Note 1e) | 7,520,000 | |||
Foreign currency, at value (cost $11,053,839) | 11,157,296 | |||
Receivables: | ||||
Investment securities sold | 7,871,007 | |||
Capital shares sold | 1,651,442 | |||
Interest | 16,721,658 | |||
Due from brokers | 890,000 | |||
Unrealized appreciation on forward exchange contracts | 11,532,406 | |||
Other assets | 345 | |||
|
| |||
Total assets | 1,387,775,829 | |||
|
| |||
Liabilities: | ||||
Payables: | ||||
Investment securities purchased | 4,268,648 | |||
Capital shares redeemed | 311,465 | |||
Affiliates | 772,657 | |||
Due to brokers | 7,520,000 | |||
Unrealized depreciation on forward exchange contracts | 2,387,347 | |||
Unrealized depreciation on unfunded loan commitments (Note 9) | 7,282 | |||
Deferred tax | 183,054 | |||
Accrued expenses and other liabilities | 602,345 | |||
|
| |||
Total liabilities | 16,052,798 | |||
|
| |||
Net assets, at value | $ | 1,371,723,031 | ||
|
| |||
Net assets consist of: | ||||
Paid-in capital | $ | 1,312,033,560 | ||
Undistributed net investment income | 24,122,344 | |||
Net unrealized appreciation (depreciation) | 31,678,833 | |||
Accumulated net realized gain (loss) | 3,888,294 | |||
|
| |||
Net assets, at value | $ | 1,371,723,031 | ||
|
| |||
The accompanying notes are an integral part of these financial statements.
FSI-32
Franklin Templeton Variable Insurance Products Trust
Financial Statements (continued)
Statement of Assets and Liabilities (continued)
June 30, 2012 (unaudited)
| Franklin Strategic Income Securities Fund | ||||
Class 1: | ||||
Net assets, at value | $ | 1,032,235,537 | ||
|
| |||
Shares outstanding | 83,806,611 | |||
|
| |||
Net asset value and maximum offering price per share | $ | 12.32 | ||
|
| |||
Class 2: | ||||
Net assets, at value | $ | 137,230,380 | ||
|
| |||
Shares outstanding | 11,409,924 | |||
|
| |||
Net asset value and maximum offering price per share | $ | 12.03 | ||
|
| |||
Class 4: | ||||
Net assets, at value | $ | 202,257,114 | ||
|
| |||
Shares outstanding | 16,553,851 | |||
|
| |||
Net asset value and maximum offering price per share | $ | 12.22 | ||
|
| |||
The accompanying notes are an integral part of these financial statements.
FSI-33
Franklin Templeton Variable Insurance Products Trust
Financial Statements (continued)
Statement of Operations
for the six months ended June 30, 2012 (unaudited)
| Franklin Strategic Income Securities Fund | ||||
Investment income: | ||||
Dividends | $ | 35,141 | ||
Interest | 40,082,040 | |||
|
| |||
Total investment income | 40,117,181 | |||
|
| |||
Expenses: | ||||
Management fees (Note 3a) | 2,372,711 | |||
Administrative fees (Note 3b) | 1,376,484 | |||
Distribution fees: (Note 3c) | ||||
Class 2 | 164,965 | |||
Class 4 | 341,950 | |||
Unaffiliated transfer agent fees | 750 | |||
Custodian fees (Note 4) | 164,564 | |||
Reports to shareholders | 98,059 | |||
Professional fees | 43,034 | |||
Trustees’ fees and expenses | 2,819 | |||
Other | 34,478 | |||
|
| |||
Total expenses | 4,599,814 | |||
|
| |||
Net investment income | 35,517,367 | |||
|
| |||
Realized and unrealized gains (losses): | ||||
Net realized gain (loss) from: | ||||
Investments | 1,081,911 | |||
Foreign currency transactions | 553,522 | |||
Swap contracts | 2,551,176 | |||
|
| |||
Net realized gain (loss) | 4,186,609 | |||
|
| |||
Net change in unrealized appreciation (depreciation) on: | ||||
Investments | 30,408,840 | |||
Translation of other assets and liabilities denominated in foreign currencies | 6,539,539 | |||
Change in deferred taxes on unrealized appreciation | 93,834 | |||
|
| |||
Net change in unrealized appreciation (depreciation) | 37,042,213 | |||
|
| |||
Net realized and unrealized gain (loss) | 41,228,822 | |||
|
| |||
Net increase (decrease) in net assets resulting from operations | $ | 76,746,189 | ||
|
| |||
The accompanying notes are an integral part of these financial statements.
FSI-34
Franklin Templeton Variable Insurance Products Trust
Financial Statements (continued)
Statements of Changes in Net Assets
| Franklin Strategic Income Securities Fund | ||||||||
| Six Months Ended June 30, 2012 (unaudited) | Year Ended December 31, 2011 | |||||||
| ||||||||
Increase (decrease) in net assets: | ||||||||
Operations: | ||||||||
Net investment income | $ | 35,517,367 | $ | 76,340,737 | ||||
Net realized gain (loss) from investments, foreign currency transactions and swap contracts | 4,186,609 | 33,514,759 | ||||||
Net change in unrealized appreciation (depreciation) on investments, translation of other assets and liabilities denominated in foreign currencies and deferred taxes | 37,042,213 | (71,081,939 | ) | |||||
| ||||||||
Net increase (decrease) in net assets resulting from operations | 76,746,189 | 38,773,557 | ||||||
| ||||||||
Distributions to shareholders from and net foreign currency gains: | ||||||||
Net investment income: | ||||||||
Class 1 | (72,486,947 | ) | (69,631,166 | ) | ||||
Class 2 | (9,567,293 | ) | (7,304,903 | ) | ||||
Class 4 | (13,446,008 | ) | (11,235,444 | ) | ||||
Net realized gains: | ||||||||
Class 1 | (1,182,191 | ) | — | |||||
Class 2 | (160,795 | ) | — | |||||
Class 4 | (230,338 | ) | — | |||||
| ||||||||
Total distributions to shareholders | (97,073,572 | ) | (88,171,513 | ) | ||||
| ||||||||
Capital share transactions: (Note 2) | ||||||||
Class 1 | 3,070,473 | (114,013,494 | ) | |||||
Class 2 | 16,128,195 | 27,304,975 | ||||||
Class 4 | 16,625,992 | 7,657,719 | ||||||
| ||||||||
Total capital share transactions | 35,824,660 | (79,050,800 | ) | |||||
| ||||||||
Net increase (decrease) in net assets | 15,497,277 | (128,448,756 | ) | |||||
Net assets: | ||||||||
Beginning of period | 1,356,225,754 | 1,484,674,510 | ||||||
| ||||||||
End of period | $ | 1,371,723,031 | $ | 1,356,225,754 | ||||
| ||||||||
Undistributed net investment income included in net assets: | ||||||||
End of period | $ | 24,122,344 | $ | 84,105,225 | ||||
| ||||||||
The accompanying notes are an integral part of these financial statements.
FSI-35
Franklin Templeton Variable Insurance Products Trust
Notes to Financial Statements (unaudited)
Franklin Strategic Income Securities Fund
1. ORGANIZATION AND SIGNIFICANT ACCOUNTING POLICIES
Franklin Templeton Variable Insurance Products Trust (Trust) is registered under the Investment Company Act of 1940, as amended, (1940 Act) as an open-end investment company, consisting of twenty separate funds. The Franklin Strategic Income Securities Fund (Fund) is included in this report. The financial statements of the remaining funds in the Trust are presented separately. Shares of the Fund are generally sold only to insurance company separate accounts to fund the benefits of variable life insurance policies or variable annuity contracts. At June 30, 2012, 91.09% of the Fund’s shares were held through one insurance company. The Fund offers three classes of shares: Class 1, Class 2, and Class 4. Each class of shares differs by its distribution fees, voting rights on matters affecting a single class and its exchange privilege.
The following summarizes the Fund’s significant accounting policies.
a. Financial Instrument Valuation
The Fund’s investments in financial instruments are carried at fair value daily. Fair value is the price that would be received to sell an asset or paid to transfer a liability in an orderly transaction between market participants on the measurement date. Under procedures approved by the Trust’s Board of Trustees (the Board), the Fund’s administrator, investment manager and other affiliates have formed the Valuation and Liquidity Oversight Committee (VLOC). The VLOC provides administration and oversight of the Fund’s valuation policies and procedures, which are approved annually by the Board. Among other things, these procedures allow the Fund to utilize independent pricing services, quotations from securities and financial instrument dealers, and other market sources to determine fair value.
Equity securities listed on an exchange or on the NASDAQ National Market System are valued at the last quoted sale price or the official closing price of the day, respectively. Over-the-counter (OTC) securities are valued within the range of the most recent quoted bid and ask prices. Securities that trade in multiple markets or on multiple exchanges are valued according to the broadest and most representative market. Certain equity securities are valued based upon fundamental characteristics or relationships to similar securities. Investments in open-end mutual funds are valued at the closing net asset value.
Debt securities generally trade in the OTC market rather than on a securities exchange. The Fund’s pricing services use multiple valuation techniques to determine fair value. In instances where sufficient market activity exists, the pricing services may utilize a market-based approach through which quotes from market makers are used to determine fair value. In instances where sufficient market activity may not exist or is limited, the pricing services also utilize proprietary valuation models which may consider market characteristics such as benchmark yield curves, credit spreads, estimated default rates, anticipated market interest rate volatility, coupon rates, anticipated timing of principal repayments, underlying collateral, and other unique security features in order to estimate the relevant cash flows, which are then discounted to calculate the fair value. Securities denominated in a foreign currency are converted into their U.S. dollar equivalent at the foreign exchange rate in effect at the close of the NYSE on the date that the values of the foreign debt securities are determined.
Certain derivative financial instruments (derivatives) trade in the OTC market. The Fund’s pricing services use various techniques including industry standard option pricing models and proprietary discounted cash flow models to determine the fair value of those instruments. The Fund’s net benefit or obligation under the derivative contract, as measured by the fair market value of the contract, is included in net assets.
The Fund has procedures to determine the fair value of financial instruments for which market prices are not reliable or readily available. Under these procedures, the VLOC convenes on a regular basis to review such financial instruments and considers a number of factors, including significant unobservable valuation inputs, when arriving at fair value. The VLOC primarily employs a market-based approach which may use related or comparable assets or liabilities, recent transactions, market multiples, book values, and other relevant information for the investment to determine the fair value of the investment. An income-based valuation approach may also be used in which the anticipated future cash flows of the investment are discounted to calculate fair value. Discounts may also be applied due to the nature or duration of any restrictions on the disposition of the investments. Due
FSI-36
Franklin Templeton Variable Insurance Products Trust
Notes to Financial Statements (unaudited) (continued)
Franklin Strategic Income Securities Fund
1. ORGANIZATION AND SIGNIFICANT ACCOUNTING POLICIES (continued)
a. Financial Instrument Valuation (continued)
to the inherent uncertainty of valuations of such investments, the fair values may differ significantly from the values that would have been used had an active market existed. The VLOC employs various methods for calibrating these valuation approaches including a regular review of key inputs and assumptions, transactional back-testing or disposition analysis, and reviews of any related market activity.
b. Foreign Currency Translation
Portfolio securities and other assets and liabilities denominated in foreign currencies are translated into U.S. dollars based on the exchange rate of such currencies against U.S. dollars on the date of valuation. The Fund may enter into foreign currency exchange contracts to facilitate transactions denominated in a foreign currency. Purchases and sales of securities, income and expense items denominated in foreign currencies are translated into U.S. dollars at the exchange rate in effect on the transaction date. Portfolio securities and assets and liabilities denominated in foreign currencies contain risks that those currencies will decline in value relative to the U.S. dollar. Occasionally, events may impact the availability or reliability of foreign exchange rates used to convert the U.S. dollar equivalent value. If such an event occurs, the foreign exchange rate will be valued at fair value using procedures established and approved by the Board.
The Fund does not separately report the effect of changes in foreign exchange rates from changes in market prices on securities held. Such changes are included in net realized and unrealized gain or loss from investments on the Statement of Operations.
Realized foreign exchange gains or losses arise from sales of foreign currencies, currency gains or losses realized between the trade and settlement dates on securities transactions and the difference between the recorded amounts of dividends, interest, and foreign withholding taxes and the U.S. dollar equivalent of the amounts actually received or paid. Net unrealized foreign exchange gains and losses arise from changes in foreign exchange rates on foreign denominated assets and liabilities other than investments in securities held at the end of the reporting period.
c. Securities Purchased on a When-Issued and Delayed Delivery Basis
The Fund purchases securities on a when-issued and delayed delivery basis, with payment and delivery scheduled for a future date. These transactions are subject to market fluctuations and are subject to the risk that the value at delivery may be more or less than the trade date purchase price. Although the Fund will generally purchase these securities with the intention of holding the securities, it may sell the securities before the settlement date. Sufficient assets have been segregated for these securities.
d. Derivative Financial Instruments
The Fund invested in derivatives in order to manage risk or gain exposure to various other investments or markets. Derivatives are financial contracts based on an underlying or notional amount, require no initial investment or an initial net investment that is smaller than would normally be required to have a similar response to changes in market factors, and require or permit net settlement. Derivatives contain various risks including the potential inability of the counterparty to fulfill their obligations under the terms of the contract, the potential for an illiquid secondary market, and/or the potential for market movements which expose the Fund to gains or losses in excess of the amounts shown on the Statement of Assets and Liabilities. Realized gain and loss and unrealized appreciation and depreciation on these contracts for the period are included in the Statement of Operations.
The Fund entered into OTC forward exchange contracts primarily to manage and/or gain exposure to certain foreign currencies. A forward exchange contract is an agreement between the Fund and a counterparty to buy or sell a foreign currency for a specific exchange rate on a future date. Pursuant to the terms of the forward exchange contracts, cash or securities may be required to be deposited as collateral. Unrestricted cash may be invested according to the Fund’s investment objectives.
FSI-37
Franklin Templeton Variable Insurance Products Trust
Notes to Financial Statements (unaudited) (continued)
Franklin Strategic Income Securities Fund
1. ORGANIZATION AND SIGNIFICANT ACCOUNTING POLICIES (continued)
d. Derivative Financial Instruments (continued)
The Fund entered into OTC credit default swap contracts primarily to manage and/or gain exposure to credit risk. A credit default swap is an agreement between the Fund and a counterparty whereby the buyer of the contract receives credit protection and the seller of the contract guarantees the credit worthiness of a referenced debt obligation. The underlying referenced debt obligation may be a single issuer of corporate or sovereign debt, a credit index, or a tranche of a credit index. In the event of a default of the underlying referenced debt obligation, the buyer is entitled to receive the notional amount of the credit default swap contract from the seller in exchange for the referenced debt obligation, a net settlement amount equal to the notional amount of the credit default swap less the recovery value of the referenced debt obligation, or other agreed upon amount. Over the term of the contract, the buyer pays the seller a periodic stream of payments, provided that no event of default has occurred. Such periodic payments are accrued daily as an unrealized appreciation or depreciation until the payments are made, at which time they are realized. Payments received or paid to initiate a credit default swap contract are reflected on the Statement of Assets and Liabilities and represent compensating factors between stated terms of the credit default swap agreement and prevailing market conditions (credit spreads and other relevant factors). These upfront payments are amortized over the term of the contract as a realized gain or loss on the Statement of Operations. Pursuant to the terms of the credit default swap contract, cash or securities may be required to be deposited as collateral. Unrestricted cash may be invested according to the Fund’s investment objectives.
The Fund’s investments in OTC derivatives are subject to the terms of International Swaps and Derivatives Association Master Agreements and other related agreements between the Fund and certain derivative counterparties. These agreements contain various provisions, including but not limited to collateral requirements, events of default, requirements for the Fund to maintain certain net asset levels and/or limit the decline in net assets over various periods of time. Should the Fund fail to meet any of these provisions, the derivative counterparty has the right to terminate the derivative contract and require immediate payment by the Fund for those OTC derivatives with that particular counterparty that are in a net unrealized loss position. At June 30, 2012, the Fund had OTC derivatives in a net unrealized loss position of $523,562 and the aggregate value of collateral pledged for such contracts was $890,000.
At June 30, 2012, the Fund holds $4,289,069 in U.S. treasury bills, bonds, and notes as collateral for derivatives.
See Note 10 regarding other derivative information.
e. Restricted Cash
At June 30, 2012, the Fund held restricted cash in connection with investments in certain derivative securities. Restricted cash is held in a segregated account with the Fund’s custodian / counterparty broker and is reflected in the Statement of Assets and Liabilities.
f. FT Holdings Corporation III (FT Subsidiary)
The Fund invests in certain securities through its investment in FT Subsidiary, a Delaware Corporation and a wholly-owned subsidiary of the Fund. The FT Subsidiary has the ability to invest in securities consistent with the investment objective of the Fund. At June 30, 2012, all FT Subsidiary investments as well as any other assets and liabilities are reflected in the Fund’s Statement of Investments and Statement of Assets and Liabilities. All income and expenses of the FT Subsidiary during the period ended June 30, 2012, have been included in the Fund’s Statement of Operations.
g. Mortgage Dollar Rolls
The Fund enters into mortgage dollar rolls, typically on a TBA basis. Mortgage dollar rolls are agreements between the Fund and a financial institution to simultaneously sell and repurchase mortgage-backed securities at a future date. Gains or losses are
FSI-38
Franklin Templeton Variable Insurance Products Trust
Notes to Financial Statements (unaudited) (continued)
Franklin Strategic Income Securities Fund
1. ORGANIZATION AND SIGNIFICANT ACCOUNTING POLICIES (continued)
g. Mortgage Dollar Rolls (continued)
realized on the initial sale, and the difference between the repurchase price and the sale price is recorded as an unrealized gain or loss to the fund upon entering into the mortgage dollar roll. In addition, the Fund may invest the cash proceeds that are received from the initial sale. During the period between the sale and repurchase, the Fund is not entitled to principal and interest paid on the mortgage backed securities. The risks of mortgage dollar roll transactions include the potential inability of the counterparty to fulfill its obligations.
h. Senior Floating Rate Interests
The Fund invests in senior secured corporate loans that pay interest at rates which are periodically reset by reference to a base lending rate plus a spread. These base lending rates are generally the prime rate offered by a designated U.S. bank or the London InterBank Offered Rate (LIBOR). Senior secured corporate loans often require prepayment of principal from excess cash flows or at the discretion of the borrower. As a result, actual maturity may be substantially less than the stated maturity.
Senior secured corporate loans in which the Fund invests are generally readily marketable, but may be subject to some restrictions on resale.
i. Income and Deferred Taxes
It is the Fund’s policy to qualify as a regulated investment company under the Internal Revenue Code. The Fund intends to distribute to shareholders substantially all of its taxable income and net realized gains to relieve it from federal income and if applicable, excise taxes. As a result, no provision for U.S. federal income taxes is required.
The Fund may be subject to foreign taxation related to income received, capital gains on the sale of securities and certain foreign currency transactions in the foreign jurisdictions in which it invests. Foreign taxes, if any, are recorded based on the tax regulations and rates that exist in the foreign markets in which the Fund invests. When a capital gain tax is determined to apply the Fund records an estimated deferred tax liability in an amount that would be payable if the securities were disposed of on the valuation date.
The Fund recognizes the tax benefits of uncertain tax positions only when the position is “more likely than not” to be sustained upon examination by the tax authorities based on the technical merits of the tax position. As of June 30, 2012, and for all open tax years, the Fund has determined that no liability for unrecognized tax benefits is required in the Fund’s financial statements related to uncertain tax positions taken on a tax return (or expected to be taken on future tax returns). Open tax years are those that remain subject to examination and are based on each tax jurisdiction statute of limitation.
j. Security Transactions, Investment Income, Expenses and Distributions
Security transactions are accounted for on trade date. Realized gains and losses on security transactions are determined on a specific identification basis. Interest income and estimated expenses are accrued daily. Amortization of premium and accretion of discount on debt securities are included in interest income. Facility fees are recognized as income over the expected term of the loan. Dividend income is recorded on the ex-dividend date. Distributions to shareholders are recorded on the ex-dividend date and are determined according to income tax regulations (tax basis). Distributable earnings determined on a tax basis may differ from earnings recorded in accordance with accounting principles generally accepted in the United States of America. These differences may be permanent or temporary. Permanent differences are reclassified among capital accounts to reflect their tax character. These reclassifications have no impact on net assets or the results of operations. Temporary differences are not reclassified, as they may reverse in subsequent periods.
Common expenses incurred by the Trust are allocated among the funds based on the ratio of net assets of each fund to the combined net assets of the Trust. Fund specific expenses are charged directly to the fund that incurred the expense.
FSI-39
Franklin Templeton Variable Insurance Products Trust
Notes to Financial Statements (unaudited) (continued)
Franklin Strategic Income Securities Fund
1. ORGANIZATION AND SIGNIFICANT ACCOUNTING POLICIES (continued)
j. Security Transactions, Investment Income, Expenses and Distributions (continued)
Realized and unrealized gains and losses and net investment income, not including class specific expenses, are allocated daily to each class of shares based upon the relative proportion of net assets of each class. Differences in per share distributions, by class, are generally due to differences in class specific expenses.
Inflation-indexed bonds are adjusted for inflation through periodic increases or decreases in the security’s interest accruals, face amount, or principal redemption value, by amounts corresponding to the rate of inflation as measured by an index. Any increase or decrease in the face amount or principal redemption value will be included as interest income on the Statement of Operations.
k. Accounting Estimates
The preparation of financial statements in accordance with accounting principles generally accepted in the United States of America requires management to make estimates and assumptions that affect the reported amounts of assets and liabilities at the date of the financial statements and the amounts of income and expenses during the reporting period. Actual results could differ from those estimates.
l. Guarantees and Indemnifications
Under the Trust’s organizational documents, its officers and trustees are indemnified by the Trust against certain liabilities arising out of the performance of their duties to the Trust. Additionally, in the normal course of business, the Trust, on behalf of the Fund, enters into contracts with service providers that contain general indemnification clauses. The Trust’s maximum exposure under these arrangements is unknown as this would involve future claims that may be made against the Trust that have not yet occurred. Currently, the Trust expects the risk of loss to be remote.
2. SHARES OF BENEFICIAL INTEREST
At June 30, 2012, there were an unlimited number of shares authorized (without par value). Transactions in the Fund’s shares were as follows:
| Six Months Ended June 30, 2012 | Year Ended December 31, 2011 | |||||||||||||||
| Class 1 Shares: | Shares | Amount | Shares | Amount | ||||||||||||
Shares sold | 2,071,510 | $ | 26,657,790 | 2,569,621 | $ | 33,265,626 | ||||||||||
Shares issued in reinvestment of distributions | 6,063,304 | 73,669,138 | 5,474,148 | 69,631,166 | ||||||||||||
Shares redeemed | (7,464,993 | ) | (97,256,455 | ) | (16,887,770 | ) | (216,910,286 | ) | ||||||||
| ||||||||||||||||
Net increase (decrease) | 669,821 | $ | 3,070,473 | (8,844,001 | ) | $ | (114,013,494 | ) | ||||||||
| ||||||||||||||||
Class 2 Shares: | ||||||||||||||||
Shares sold | 1,536,446 | $ | 19,516,632 | 3,778,943 | $ | 48,008,160 | ||||||||||
Shares issued in reinvestment of distributions | 819,552 | 9,728,088 | 586,739 | 7,304,903 | ||||||||||||
Shares redeemed | (1,032,899 | ) | (13,116,525 | ) | (2,243,563 | ) | (28,008,088 | ) | ||||||||
| ||||||||||||||||
Net increase (decrease) | 1,323,099 | $ | 16,128,195 | 2,122,119 | $ | 27,304,975 | ||||||||||
| ||||||||||||||||
Class 4 Shares: | ||||||||||||||||
Shares sold | 1,056,894 | $ | 13,440,584 | 2,126,744 | $ | 27,218,734 | ||||||||||
Shares issued on reinvestment of distributions | 1,134,025 | 13,676,346 | 889,584 | 11,235,444 | ||||||||||||
Shares redeemed | (814,338 | ) | (10,490,938 | ) | (2,444,718 | ) | (30,796,459 | ) | ||||||||
| ||||||||||||||||
Net increase (decrease) | 1,376,581 | $ | 16,625,992 | 571,610 | $ | 7,657,719 | ||||||||||
| ||||||||||||||||
FSI-40
Franklin Templeton Variable Insurance Products Trust
Notes to Financial Statements (unaudited) (continued)
Franklin Strategic Income Securities Fund
3. TRANSACTIONS WITH AFFILIATES
Franklin Resources, Inc. is the holding company for various subsidiaries that together are referred to as Franklin Templeton Investments. Certain officers and trustees of the Fund are also officers and/or directors of the following subsidiaries:
| Subsidiary | Affiliation | |
Franklin Advisers, Inc. (Advisers) | Investment manager | |
Franklin Templeton Services, LLC (FT Services) | Administrative manager | |
Franklin Templeton Distributors, Inc. (Distributors) | Principal underwriter | |
Franklin Templeton Investor Services, LLC (Investor Services) | Transfer agent |
a. Management Fees
The Fund pays an investment management fee to Advisers based on the average daily net assets of the Fund as follows:
| Annualized Fee Rate | Net Assets | |
| 0.425% | Up to and including $500 million | |
| 0.325% | Over $500 million, up to and including $1 billion | |
| 0.280% | Over $1 billion, up to and including $1.5 billion | |
| 0.235% | Over $1.5 billion, up to and including $6.5 billion | |
| 0.215% | Over $6.5 billion, up to and including $11.5 billion | |
| 0.200% | Over $11.5 billion, up to and including $16.5 billion | |
| 0.190% | Over $16.5 billion, up to and including $19 billion | |
| 0.180% | Over $19 billion, up to and including $21.5 billion | |
| 0.170% | In excess of $21.5 billion |
b. Administrative Fees
The Fund pays an administrative fee to FT Services of 0.20% per year of the net assets of the Fund.
c. Distribution Fees
The Board has adopted distribution plans for Class 2 and Class 4 shares pursuant to Rule 12b-1 under the 1940 Act. Under the Fund’s compensation distribution plans, the Fund pays Distributors for costs incurred in connection with the servicing, sale and distribution of the Fund’s shares up to 0.25% and 0.35% per year of its average daily net assets of Class 2 and Class 4, respectively.
d. Transfer Agent Fees
Investor Services, under terms of an agreement, performs shareholder servicing for the Fund and is not paid by the Fund for the services.
4. EXPENSE OFFSET ARRANGEMENT
The Fund has entered into an arrangement with its custodian whereby credits realized as a result of uninvested cash balances are used to reduce a portion of the Fund’s custodian expenses. During the period ended June 30, 2012, there were no credits earned.
FSI-41
Franklin Templeton Variable Insurance Products Trust
Notes to Financial Statements (unaudited) (continued)
Franklin Strategic Income Securities Fund
5. INCOME TAXES
At June 30, 2012, the cost of investments and net unrealized appreciation (depreciation) for income tax purposes were as follows:
Cost of investments | $ | 1,310,672,322 | ||
|
| |||
Unrealized appreciation | $ | 55,132,637 | ||
Unrealized depreciation | (36,240,600 | ) | ||
|
| |||
Net unrealized appreciation (depreciation) | $ | 18,892,037 | ||
|
| |||
Differences between income and/or capital gains as determined on a book basis and a tax basis are primarily due to differing treatments of defaulted securities, foreign currency transactions, paydown losses, payments-in-kind, bond discounts and premiums, swaps, tax straddles, inflation related adjustments on foreign securities and wash sales.
6. INVESTMENT TRANSACTIONS
Purchases and sales of investments (excluding short term securities) for the period ended June 30, 2012, aggregated $314,373,645 and $325,010,487, respectively.
7. INVESTMENTS IN INSTITUTIONAL FIDUCIARY TRUST MONEY MARKET PORTFOLIO
The Fund invests in the Institutional Fiduciary Trust Money Market Portfolio (Sweep Money Fund), an open-end investment company managed by Advisers. Management fees paid by the Fund are reduced on assets invested in the Sweep Money Fund, in an amount not to exceed the management and administrative fees paid by the Sweep Money Fund.
8. CREDIT RISK AND DEFAULTED SECURITIES
At June 30, 2012, the Fund had 52.45% of its portfolio invested in high yield , senior secured floating rate notes, or other securities rated below investment grade. These securities may be more sensitive to economic conditions causing greater price volatility and are potentially subject to a greater risk of loss due to default than higher rated securities.
The Fund held defaulted securities and/or other securities for which the income has been deemed uncollectible. At June 30, 2012, the aggregate value of these securities was $7,051,843, representing 0.51% of the Fund’s net assets. The Fund discontinues accruing income on securities for which income has been deemed uncollectible and provides an estimate for losses on interest receivable. The securities have been identified on the accompanying Statement of Investments.
9. UNFUNDED LOAN COMMITMENTS
The Fund enters into certain credit agreements, all or a portion of which may be unfunded. The Fund is obligated to fund these loan commitments at the borrowers’ discretion. Funded portions of credit agreements are presented on the Statement of Investments.
At June 30, 2012, unfunded commitments were as follows:
| Borrower | Unfunded Commitment | |||
Wendy’s International Inc., Delayed Draw Term Loan | $ | 964,282 | ||
|
| |||
Unfunded loan commitments and funded portions of credit agreements are marked to market daily and any unrealized appreciation or depreciation is included in the Statement of Assets and Liabilities and the Statement of Operations.
FSI-42
Franklin Templeton Variable Insurance Products Trust
Notes to Financial Statements (unaudited) (continued)
Franklin Strategic Income Securities Fund
10. OTHER DERIVATIVE INFORMATION
At June 30, 2012, the Fund has invested in derivative contracts which are reflected on the Statement of Assets and Liabilities as follows:
| Asset Derivatives | Liability Derivatives | |||||||||||
| Derivative Contracts Not Accounted for as Hedging Instruments | Statement of Assets and Liabilities Location | Fair Value Amount | Statement of Assets and Liabilities Location | Fair Value Amount | ||||||||
Foreign exchange contracts | Unrealized appreciation on forward exchange contracts | $ | 11,532,406 | Unrealized depreciation on forward exchange contracts | $ | 2,387,347 | ||||||
For the period ended June 30, 2012, the effect of derivative contracts on the Fund’s Statement of Operations was as follows:
| Derivative Contracts Not Accounted for as Hedging Instruments | Statement of Operations Locations | Realized Gain (Loss) for the Period | Change in Unrealized Appreciation (Depreciation) for the Period | |||||||
Foreign exchange contracts | Net realized gain (loss) from foreign currency transactions / Net change in unrealized appreciation (depreciation) on translation of other assets and liabilities denominated in foreign currencies | $ | 886,201 | $ | 6,309,110 | |||||
Credit contracts | Net realized gain (loss) from swap contracts / Net change in unrealized appreciation (depreciation) on investments | 2,551,176 | (776,779 | ) | ||||||
For the period ended June 30, 2012, the average month end market value of derivatives represented 0.93% of average month end net assets. The average month end number of open derivative contracts for the period was 202.
See Note 1(d) regarding derivative financial instruments.
11. CREDIT FACILITY
The Fund, together with other U.S. registered and foreign investment funds (collectively, Borrowers), managed by Franklin Templeton Investments, are borrowers in a joint syndicated senior unsecured credit facility totaling $1.5 billion (Global Credit Facility) which matures on January 18, 2013. This Global Credit Facility provides a source of funds to the Borrowers for temporary and emergency purposes, including the ability to meet future unanticipated or unusually large redemption requests.
Under the terms of the Global Credit Facility, the Fund shall, in addition to interest charged on any borrowings made by the Fund and other costs incurred by the Fund, pay its share of fees and expenses incurred in connection with the implementation and maintenance of the Global Credit Facility, based upon its relative share of the aggregate net assets of all of the Borrowers, including an annual commitment fee of 0.08% based upon the unused portion of the Global Credit Facility, which is reflected in other expenses on the Statement of Operations. During the period ended June 30, 2012, the Fund did not use the Global Credit Facility.
12. FAIR VALUE MEASUREMENTS
The Fund follows a fair value hierarchy that distinguishes between market data obtained from independent sources (observable inputs) and the Fund’s own market assumptions (unobservable inputs). These inputs are used in determining the value of the Fund’s financial instruments and are summarized in the following fair value hierarchy:
| • | Level 1 – quoted prices in active markets for identical financial instruments |
FSI-43
Franklin Templeton Variable Insurance Products Trust
Notes to Financial Statements (unaudited) (continued)
Franklin Strategic Income Securities Fund
12. FAIR VALUE MEASUREMENTS (continued)
| • | Level 2 – other significant observable inputs (including quoted prices for similar financial instruments, interest rates, prepayment speed, credit risk, etc.) |
| • | Level 3 – significant unobservable inputs (including the Fund’s own assumptions in determining the fair value of financial instruments) |
The inputs or methodology used for valuing financial instruments are not an indication of the risk associated with investing in those financial instruments.
For movements between the levels within the fair value hierarchy, the Fund has adopted a policy of recognizing the transfers as of the date of the underlying event which caused the movement.
A summary of inputs used as of June 30, 2012, in valuing the Fund’s assets and liabilities carried at fair value, is as follows:
| Level 1 | Level 2 | Level 3 | Total | |||||||||||||
|
| |||||||||||||||
Assets: | ||||||||||||||||
Investments in Securities: | ||||||||||||||||
Equity Investments:a | ||||||||||||||||
Consumer Durables & Apparel | $ | — | $ | — | $ | 720,359 | $ | 720,359 | ||||||||
Consumer Services | — | 1,711,304 | — | 1,711,304 | ||||||||||||
Media | — | 5,458,671 | — | 5,458,671 | ||||||||||||
Other Equity Investmentsb | 832,130 | — | — | 832,130 | ||||||||||||
Corporate Bonds | — | 509,868,588 | — | 509,868,588 | ||||||||||||
Senior Floating Rate Interests | — | 236,850,849 | 1,161,736 | 238,012,585 | ||||||||||||
Foreign Government and Agency Securities | — | 306,499,176 | — | 306,499,176 | ||||||||||||
U.S. Government and Agency Securities | — | 29,313,484 | — | 29,313,484 | ||||||||||||
Asset-Backed Securities and | ||||||||||||||||
Commercial Mortgage-Backed Securities | — | 46,046,598 | — | 46,046,598 | ||||||||||||
Mortgage-Backed Securities | — | 54,936,623 | — | 54,936,623 | ||||||||||||
Municipal Bonds | — | 46,342,663 | — | 46,342,663 | ||||||||||||
Short Term Investments | 50,165,155 | 39,657,023 | — | 89,822,178 | ||||||||||||
|
| |||||||||||||||
Total Investments in Securities | $ | 50,997,285 | $ | 1,276,684,979 | $ | 1,882,095 | $ | 1,329,564,359 | ||||||||
|
| |||||||||||||||
Forward Exchange Contracts | — | 11,532,406 | — | 11,532,406 | ||||||||||||
Liabilities: | ||||||||||||||||
Forward Exchange Contracts | — | 2,387,347 | — | 2,387,347 | ||||||||||||
Unfunded Loan Commitments | — | 7,282 | — | 7,282 | ||||||||||||
aIncludes common and preferred stocks.
bFor detailed categories, see the accompanying Statement of Investments.
A reconciliation of assets in which Level 3 inputs are used in determining fair value is presented when there are significant Level 3 investments at the end of the period.
13. NEW ACCOUNTING PRONOUNCEMENTS
In December 2011, the Financial Accounting Standards Board (FASB) issued Accounting Standards Update (ASU) No. 2011-11, Balance Sheet (Topic 210): Disclosures about Offsetting Assets and Liabilities. The amendments in the ASU enhance disclosures about offsetting of financial assets and liabilities to enable investors to understand the effect of these arrangements on a fund’s financial position. The ASU is effective for interim and annual reporting periods beginning on or after January 1, 2013. The Fund believes the adoption of this ASU will not have a material impact on its financial statements.
FSI-44
Franklin Templeton Variable Insurance Products Trust
Notes to Financial Statements (unaudited) (continued)
Franklin Strategic Income Securities Fund
14. SUBSEQUENT EVENTS
The Fund has evaluated subsequent events through the issuance of the financial statements and determined that no events have occurred that require disclosure.
ABBREVIATIONS | ||||
| Counterparty | Currency | Selected Portfolio | ||
| BZWS - Barclays Bank PLC | AUD - Australian Dollar | AGMC - Assured Guaranty Municipal Corp. | ||
| CITI - Citigroup, Inc. | BRL - Brazilian Real | CDO - Collateralized Debt Obligation | ||
| DBAB - Deutsche Bank AG | EUR - Euro | CLO - Collateralized Loan Obligation | ||
| FBCO - Credit Suisse Group AG | GBP - British Pound | DIP - Debtor-In-Possession | ||
| HSBC - HSBC Bank USA, N.A. | HUF - Hungarian Forint | FGIC - Financial Guaranty Insurance Co. | ||
| JPHQ - JPMorgan Chase & Co. | IDR - Indonesian Rupiah | FICO - Financing Corp. | ||
| MSCO - Morgan Stanley | ILS - New Israeli Shekel | FRN - Floating Rate Note | ||
| UBSW - UBS AG | KRW - South Korean Won | GO - General Obligation | ||
| LKR - Sri Lankan Rupee | ID - Improvement District | |||
| MXN - Mexican Peso | IDA - Industrial Development Authority/Agency | |||
| MYR - Malaysian Ringgit | L/C - Letter of Credit | |||
| PHP - Philippine Peso | NATL - National Public Financial Guarantee Corp. | |||
PLN - Polish Zloty SEK - Swedish Krona SGD - Singapore Dollar UYU - Uruguayan Peso | NATL RE - National Public Financial Guarantee Corp. Reinsured PIK - Payment-In-Kind PL - Project Loan SF - Single Family | |||
| USD - Unified/Union School District | ||||
FSI-45
FRANKLIN TEMPLETON VIP FOUNDING FUNDS ALLOCATION FUND
This semiannual report for Franklin Templeton VIP Founding Funds Allocation Fund covers the period ended June 30, 2012.
Performance Summary as of 6/30/12
Franklin Templeton VIP Founding Funds Allocation Fund – Class 4 delivered a +4.86% total return* for the six-month period ended 6/30/12.
*The administrator has contractually agreed to waive or assume certain expenses so that common expenses of the Fund (excluding Rule 12b-1 fees and acquired fund fees and expenses) do not exceed 0.10% (other than certain nonroutine expenses) until 4/30/13. Fund investment results reflect the expense reduction, without which the results would have been lower.
Performance reflects the Fund’s Class 4 operating expenses, but does not include any contract fees, expenses or sales charges. If they had been included, performance would be lower. These charges and deductions, particularly for variable life policies, can have a significant effect on contract values and insurance benefits. See the contract prospectus for a complete description of these expenses, including sales charges.
Franklin Templeton VIP Founding Funds Allocation Fund – Class 4
Performance data represent past performance, which does not guarantee future results. Investment return and principal value will fluctuate, and you may have a gain or loss when you sell your shares. Current performance may differ from figures shown.
FFA-1
Fund Goals and Main Investments: Franklin Templeton VIP Founding Funds Allocation Fund seeks capital appreciation, with income as a secondary goal. Under normal market conditions, the Fund invests equal portions in Class 1 shares of Franklin Income Securities Fund, Mutual Shares Securities Fund and Templeton Growth Securities Fund.
Performance Overview
You can find the Fund’s six-month total return in the Performance Summary. The Fund underperformed the Standard & Poor’s® 500 Index’s (S&P 500®’s) +9.49% total return and the MSCI World Index’s +6.29% total return for the same period.1
Economic and Market Overview
The U.S. economy, as measured by gross domestic product, grew modestly during the six-month period ended June 30, 2012, as personal income and spending rose. The national unemployment rate for June 2012 stood at 8.2%, compared with 8.5% at the start of the period.2 Job growth was more pronounced in the first quarter, and jobless claims touched a four-year low; however, hiring slowed in the second quarter. Industrial production and manufacturing activity expanded during most of the period under review, but the manufacturing sector shrank unexpectedly in June. In keeping with its goal to strengthen U.S. economic recovery by fostering increased employment while keeping inflation in check, during June the Federal Reserve Board (Fed) extended through 2012 its program (dubbed Operation Twist) to buy long-term Treasuries in an attempt to lower long-term yields. The Fed also reaffirmed its intention to keep the federal funds target rate low at least through late 2014.
Global growth trends generally moderated, led by Europe, which narrowly avoided recession mainly because of German export strength. Yet, even the more resilient economies of Germany and China showed signs of a slowdown at period-end. The combination of flagging growth, political uncertainty and populist unrest pressured investor confidence, and ratings agencies downgraded global banks and European sovereigns. Concerns about Italian and Spanish borrowing costs added to investor anxiety as bond yields climbed. Europe’s initial policy responses — including enhanced liquidity measures and an ineffective
1. Source: © 2012 Morningstar. One cannot invest directly in an index, and an index is not representative of the Funds’ portfolio. Please see Index Descriptions following the Fund Summaries.
2. Source: Bureau of Labor Statistics.
Fund Risks: All investments involve risks, including possible loss of principal. Because the Fund invests in underlying funds that may engage in a variety of investment strategies involving certain risks, the Fund may be subject to these same risks. Stock prices fluctuate, sometimes rapidly and dramatically, due to factors affecting individual companies, particular industries or sectors, or general market conditions. Bonds are affected by changes in interest rates and the creditworthiness of their issuers. Bond prices generally move in the opposite direction of interest rates. Thus, as the prices of bonds adjust to a rise in interest rates, the Fund’s share price may decline. Higher yielding, lower rated corporate bonds entail a greater degree of credit risk compared to investment-grade securities. Foreign investing carries additional risks such as currency and market volatility and political or social instability, risks that are heightened in developing countries. Value securities may not increase in price as anticipated or may decline further in value. These and other risks are described more fully in the Fund’s and underlying funds’ prospectuses.
FFA-2
Spanish banking bailout — did little to address the structural imbalances of eurozone economies or the solvency fears plaguing the region’s banking system.
Global developed stock markets, as measured by the MSCI World Index, delivered the best annual start in more than a decade, as signs of U.S. economic recovery and European policy relief underpinned a rally in cyclical stocks. During late March and early April 2012, U.S. stocks, as measured by the S&P 500, reached multi-year highs. However, stocks dropped sharply in late spring amid renewed global economic weakness and European debt concerns before additional policy action prompted a rebound in June. Politics largely drove the markets during the first half of 2012 as investors closely monitored developments in Europe, where German-led austerity demands were met with increasing resentment from some highly indebted eurozone members. Fears of a Greek debt default and exit from the eurozone were somewhat mitigated in February by secured bailout financing and bondholder concessions, as well as May and June elections that resulted in the formation of a new coalition government. The Fed’s Operation Twist purchases and risk-averse investors seeking safety drove U.S. Treasury yields to historical lows during the period. In the latter part of the period, the euro declined while the U.S. dollar and Japanese yen made gains.
At the end of the reporting period, significant challenges to the U.S. and global economies remained, including weak jobs reports, lack of broad public and political agreement on how to achieve U.S. deficit reduction, and uncertainty surrounding deeply indebted European countries including Greece, Italy and Spain. Although long-term resolution of European debt issues remained unclear, the European Central Bank’s plan to allow the European Stability Mechanism to directly recapitalize troubled banks throughout the eurozone, as well as a late-June proposal leaning toward fiscal and banking union, supported cautious optimism in U.S. and global markets.
FFA-3
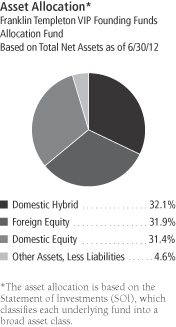
The dollar value, number of shares or principal amount, and names of all portfolio holdings are listed in the Fund’s SOI.
Investment Strategy
The Fund normally invests its assets in an equally weighted combination of Class 1 shares of Franklin Income Securities Fund, Mutual Shares Securities Fund and Templeton Growth Securities Fund. These underlying funds, in turn, invest in a variety of U.S. and foreign equity securities and, to a lesser extent, fixed income and money market securities. As market conditions affect the underlying funds, we rebalance the Fund’s allocations seeking to maintain equal weightings of approximately 33 1/3% of total net assets in each underlying fund whenever the actual allocations exceed plus or minus 3% of the fixed allocation percentages.
Manager’s Discussion
The Fund’s performance can be attributed largely to its allocation among the underlying funds and their investments in domestic and foreign equities, fixed income securities, and short-term investments and other net assets.
During the six months under review, Mutual Shares Securities Fund – Class 1 and Franklin Income Securities Fund – Class 1 underperformed the S&P 500. Templeton Growth Securities Fund – Class 1 underperformed the MSCI World Index.
Thank you for your participation in Franklin Templeton VIP Founding Funds Allocation Fund. We look forward to serving your future investment needs.
The foregoing information reflects our analysis, opinions and portfolio holdings as of June 30, 2012, the end of the reporting period. The way we implement our main investment strategies and the resulting portfolio holdings may change depending on factors such as market and economic conditions. These opinions may not be relied upon as investment advice or an offer for a particular security. The information is not a complete analysis of every aspect of any market, country, industry, security or the Fund. Statements of fact are from sources considered reliable, but the investment manager makes no representation or warranty as to their completeness or accuracy. Although historical performance is no guarantee of future results, these insights may help you understand our investment management philosophy.
FFA-4
Fund Expenses
As an investor in a variable insurance contract (Contract) that indirectly provides for investment in an underlying mutual fund, you can incur transaction and/or ongoing expenses at both the Fund level and the Contract level.
| • | Transaction expenses can include sales charges (loads) on purchases, surrender fees, transfer fees and premium taxes. |
| • | Ongoing expenses can include management fees, distribution and service (12b-1) fees, contract fees, annual maintenance fees, mortality and expense risk fees and other fees and expenses. All mutual funds and Contracts have some types of ongoing expenses. |
The expenses shown in the table are meant to highlight ongoing expenses at the Fund level only and do not include ongoing expenses at the Contract level, or transaction expenses at either the Fund or Contract levels. While the Fund does not have transaction expenses, if the transaction and ongoing expenses at the Contract level were included, the expenses shown below would be higher. You should consult your Contract prospectus or disclosure document for more information.
The table shows Fund-level ongoing expenses and can help you understand these expenses and compare them with those of other mutual funds offered through the Contract. The table assumes a $1,000 investment held for the six months indicated. Please refer to the Fund prospectus for additional information on operating expenses.
Actual Fund Expenses
The first line (Actual) of the table provides actual account values and expenses. The “Ending Account Value” is derived from the Fund’s actual return, which includes the effect of ongoing Fund expenses, but does not include the effect of ongoing Contract expenses.
You can estimate the Fund-level expenses you incurred during the period by following these steps. Of course, your account value and expenses will differ from those in this illustration:
| 1. | Divide your account value by $1,000. |
If an account had an $8,600 value, then $8,600 ÷ $1,000 = 8.6.
| 2. | Multiply the result by the number under the heading “Fund-Level Expenses Incurred During Period.” |
If Fund-Level Expenses Incurred During Period were $7.50, then 8.6 x $7.50 = $64.50.
In this illustration, the estimated expenses incurred this period at the Fund level are $64.50.
Franklin Templeton VIP Founding Funds Allocation Fund – Class 4
FFA-5
Hypothetical Example for Comparison with Other Mutual Funds
Information in the second line (Hypothetical) of the table can help you compare ongoing expenses of the Fund with those of other mutual funds offered through the Contract. This information may not be used to estimate the actual ending account balance or expenses you incurred during the period. The hypothetical “Ending Account Value” is based on the Fund’s actual expense ratio and an assumed 5% annual rate of return before expenses, which does not represent the Fund’s actual return. The figure under the heading “Fund-Level Expenses Incurred During Period” shows the hypothetical expenses your account would have incurred under this scenario. You can compare this figure with the 5% hypothetical examples that appear in shareholder reports of other funds offered through a Contract.
| Class 4 | Beginning Account Value 1/1/12 | Ending Account Value 6/30/12 | Fund-Level Expenses Incurred During Period* 1/1/12–6/30/12 | Fund-Level Expenses Incurred During Period** 1/1/12–6/30/12 | ||||||||||||
Actual | $ | 1,000 | $ | 1,048.60 | $ | 2.29 | $ | 5.65 | ||||||||
Hypothetical (5% return before expenses) | $ | 1,000 | $ | 1,022.63 | $ | 2.26 | $ | 5.57 | ||||||||
*Expenses are calculated using the most recent six-month annualized expense ratio excluding expenses of the underlying funds, net of expense waivers, for the Fund’s Class 4 shares (0.45%), which does not include any ongoing expenses of the Contract for which the Fund is an investment option, multiplied by the average account value over the period, multiplied by 182/366 to reflect the one-half year period.
**Expenses are calculated using the most recent six-month annualized expense ratio including expenses of the underlying funds, net of expense waivers, for the Fund’s Class 4 shares (1.11%), which does not include any ongoing expenses of the Contract for which the Fund is an investment option, multiplied by the average account value over the period, multiplied by 182/366 to reflect the one-half year period.
FFA-6
Franklin Templeton Variable Insurance Products Trust
Financial Highlights
Franklin Templeton VIP Founding Funds Allocation Fund
| Six Months Ended June 30, 2012 (unaudited) | Year Ended December 31, | |||||||||||||||||||||||
| Class 1 | 2011 | 2010 | 2009 | 2008 | 2007a | |||||||||||||||||||
| ||||||||||||||||||||||||
Per share operating performance | ||||||||||||||||||||||||
(for a share outstanding throughout the period) | ||||||||||||||||||||||||
Net asset value, beginning of period | $ | 7.63 | $ | 7.73 | $ | 7.15 | $ | 5.61 | $ | 9.33 | $ | 10.00 | ||||||||||||
|
| |||||||||||||||||||||||
Income from investment operationsb: | ||||||||||||||||||||||||
Net investment income (loss)c,d | 0.24 | 0.25 | 0.24 | 0.26 | 0.28 | (0.19 | ) | |||||||||||||||||
Net realized and unrealized gains (losses) | 0.14 | (0.35 | ) | 0.52 | 1.46 | (3.64 | ) | (0.48 | ) | |||||||||||||||
|
| |||||||||||||||||||||||
Total from investment operations | 0.38 | (0.10 | ) | 0.76 | 1.72 | (3.36 | ) | (0.67 | ) | |||||||||||||||
|
| |||||||||||||||||||||||
Less distributions from: | ||||||||||||||||||||||||
Net investment income | (0.24 | ) | — | e | (0.18 | ) | (0.18 | ) | (0.19 | ) | — | |||||||||||||
Net realized gains | — | — | — | e | — | (0.17 | ) | — | ||||||||||||||||
|
| |||||||||||||||||||||||
Total distributions | (0.24 | ) | — | e | (0.18 | ) | (0.18 | ) | (0.36 | ) | — | |||||||||||||
|
| |||||||||||||||||||||||
Net asset value, end of period | $ | 7.77 | $ | 7.63 | $ | 7.73 | $ | 7.15 | $ | 5.61 | $ | 9.33 | ||||||||||||
|
| |||||||||||||||||||||||
Total returnf | 5.01% | (1.28)% | 10.64% | 30.47% | (35.75)% | (6.70)% | ||||||||||||||||||
Ratios to average net assetsg | ||||||||||||||||||||||||
Expenses before waiver and payments by affiliatesh | 0.11% | 0.11% | 0.11% | 0.12% | 0.13% | 0.41% | ||||||||||||||||||
Expenses net of waiver and payments by affiliatesh | 0.10% | 0.10% | 0.10% | 0.10% | 0.13% | 0.41% | ||||||||||||||||||
Net investment income (loss)d | 5.08% | 3.44% | 3.04% | 4.16% | 3.81% | (0.41)% | ||||||||||||||||||
Supplemental data | ||||||||||||||||||||||||
Net assets, end of period (000’s) | $ | 520 | $ | 470 | $ | 437 | $ | 629 | $ | 339 | $ | 466 | ||||||||||||
Portfolio turnover rate | 21.04% | 58.42% | 17.81% | 4.23% | 22.09% | 0.04% | ||||||||||||||||||
aFor the period July 2, 2007 (commencement of operations) to December 31, 2007
bThe amount shown for a share outstanding throughout the period may not correlate with the Statement of Operations for the period due to the timing of sales and repurchases of the Fund shares in relation to income earned and/or fluctuating market value of the investments of the Fund.
cBased on average daily shares outstanding.
dRecognition of net investment income by the Fund is affected by the timing of declaration of dividends by the Underlying Funds in which the Fund invests.
eAmount rounds to less than $0.01 per share.
fTotal return does not include fees, charges or expenses imposed by the variable annuity and life insurance contracts for which the Franklin Templeton Variable Insurance Products Trust serves as an underlying investment vehicle. Total return is not annualized for periods less than one year.
gRatios are annualized for periods less than one year.
hDoes not include expenses of the Underlying Funds in which the Fund invests. The weighted average indirect expenses of the Underlying Funds were 0.66% for the period ended June 30, 2012.
The accompanying notes are an integral part of these financial statements.
FFA-7
Franklin Templeton Variable Insurance Products Trust
Financial Highlights (continued)
Franklin Templeton VIP Founding Funds Allocation Fund
Six Months June 30, 2012 | Year Ended December 31, | |||||||||||||||||||||||
| Class 2 | 2011 | 2010 | 2009 | 2008 | 2007a | |||||||||||||||||||
| ||||||||||||||||||||||||
Per share operating performance | ||||||||||||||||||||||||
(for a share outstanding throughout the period) | ||||||||||||||||||||||||
Net asset value, beginning of period | $ | 7.59 | $ | 7.71 | $ | 7.14 | $ | 5.61 | $ | 9.31 | $ | 10.00 | ||||||||||||
|
| |||||||||||||||||||||||
Income from investment operationsb: | ||||||||||||||||||||||||
Net investment income (loss)c,d | 0.20 | 0.23 | 0.21 | 0.26 | 0.27 | (0.03 | ) | |||||||||||||||||
Net realized and unrealized gains (losses) | 0.18 | (0.35 | ) | 0.52 | 1.44 | (3.63 | ) | (0.66 | ) | |||||||||||||||
|
| |||||||||||||||||||||||
Total from investment operations | 0.38 | (0.12 | ) | 0.73 | 1.70 | (3.36 | ) | (0.69 | ) | |||||||||||||||
|
| |||||||||||||||||||||||
Less distributions from: | ||||||||||||||||||||||||
Net investment income | (0.22 | ) | — | e | (0.16 | ) | (0.17 | ) | (0.17 | ) | — | |||||||||||||
Net realized gains | — | — | — | e | — | (0.17 | ) | — | ||||||||||||||||
|
| |||||||||||||||||||||||
Total distributions | (0.22 | ) | — | e | (0.16 | ) | (0.17 | ) | (0.34 | ) | — | |||||||||||||
|
| |||||||||||||||||||||||
Net asset value, end of period | $ | 7.75 | $ | 7.59 | $ | 7.71 | $ | 7.14 | $ | 5.61 | $ | 9.31 | ||||||||||||
|
| |||||||||||||||||||||||
Total returnf | 5.03% | (1.54)% | 10.25% | 30.25% | (35.87)% | (6.90)% | ||||||||||||||||||
Ratios to average net assetsg | ||||||||||||||||||||||||
Expenses before waiver and payments by affiliatesh | 0.36% | 0.36% | 0.36% | 0.37% | 0.38% | 0.66% | ||||||||||||||||||
Expenses net of waiver and payments by affiliatesh | 0.35% | 0.35% | 0.35% | 0.35% | 0.38% | 0.66% | ||||||||||||||||||
Net investment income (loss)d | 4.83% | 3.19% | 2.79% | 3.91% | 3.56% | (0.66)% | ||||||||||||||||||
Supplemental data | ||||||||||||||||||||||||
Net assets, end of period (000’s) | $ | 455,610 | $ | 448,101 | $ | 488,057 | $ | 474,176 | $ | 338,320 | $ | 131,710 | ||||||||||||
Portfolio turnover rate | 21.04% | 58.42% | 17.81% | 4.23% | 22.09% | 0.04% | ||||||||||||||||||
aFor the period July 2, 2007 (commencement of operations) to December 31, 2007.
bThe amount shown for a share outstanding throughout the period may not correlate with the Statement of Operations for the period due to the timing of sales and repurchases of the Fund shares in relation to income earned and/or fluctuating market value of the investments of the Fund.
cBased on average daily shares outstanding.
dRecognition of net investment income by the Fund is affected by the timing of declaration of dividends by the Underlying Funds in which the Fund invests.
eAmount rounds to less than $0.01 per share.
fTotal return does not include fees, charges or expenses imposed by the variable annuity and life insurance contracts for which the Franklin Templeton Variable Insurance Products Trust serves as an underlying investment vehicle. Total return is not annualized for periods less than one year.
gRatios are annualized for periods less than one year.
hDoes not include expenses of the Underlying Funds in which the Fund invests. The weighted average indirect expenses of the Underlying Funds were 0.66% for the period ended June 30, 2012.
The accompanying notes are an integral part of these financial statements.
FFA-8
Franklin Templeton Variable Insurance Products Trust
Financial Highlights (continued)
Franklin Templeton VIP Founding Funds Allocation Fund
| Six Months Ended June 30, 2012 (unaudited) | Year Ended December 31, | |||||||||||||||||||
| Class 4 | 2011 | 2010 | 2009 | 2008a | ||||||||||||||||
| ||||||||||||||||||||
Per share operating performance | ||||||||||||||||||||
(for a share outstanding throughout the period) | ||||||||||||||||||||
Net asset value, beginning of period | $ | 7.58 | $ | 7.71 | $ | 7.14 | $ | 5.62 | $ | 8.65 | ||||||||||
|
| |||||||||||||||||||
Income from investment operationsb: | ||||||||||||||||||||
Net investment incomec,d | 0.18 | 0.24 | 0.19 | 0.23 | 0.19 | |||||||||||||||
Net realized and unrealized gains (losses) | 0.19 | (0.37 | ) | 0.54 | 1.46 | (2.87 | ) | |||||||||||||
|
| |||||||||||||||||||
Total from investment operations | 0.37 | (0.13 | ) | 0.73 | 1.69 | (2.68 | ) | |||||||||||||
|
| |||||||||||||||||||
Less distributions from: | ||||||||||||||||||||
Net investment income | (0.22 | ) | — | e | (0.16 | ) | (0.17 | ) | (0.18 | ) | ||||||||||
Net realized gains | — | — | — | e | — | (0.17 | ) | |||||||||||||
|
| |||||||||||||||||||
Total distributions | (0.22 | ) | — | e | (0.16 | ) | (0.17 | ) | (0.35 | ) | ||||||||||
|
| |||||||||||||||||||
Net asset value, end of period | $ | 7.73 | $ | 7.58 | $ | 7.71 | $ | 7.14 | $ | 5.62 | ||||||||||
|
| |||||||||||||||||||
Total returnf | 4.86% | (1.67)% | 10.24% | 30.06% | (30.81)% | |||||||||||||||
Ratios to average net assetsg | ||||||||||||||||||||
Expenses before waiver and payments by affiliatesh | 0.46% | 0.46% | 0.46% | 0.47% | 0.48% | |||||||||||||||
Expenses net of waiver and payments by affiliatesh | 0.45% | 0.45% | 0.45% | 0.45% | 0.48% | |||||||||||||||
Net investment incomed | 4.73% | 3.09% | 2.69% | 3.81% | 3.46% | |||||||||||||||
Supplemental data | ||||||||||||||||||||
Net assets, end of period (000’s) | $ | 3,274,608 | $ | 2,860,928 | $ | 3,036,272 | $ | 1,424,479 | $ | 263,001 | ||||||||||
Portfolio turnover rate | 21.04% | 58.42% | 17.81% | 4.23% | 22.09% | |||||||||||||||
aFor the period February 29, 2008 (effective date) to December 31, 2008.
bThe amount shown for a share outstanding throughout the period may not correlate with the Statement of Operations for the period due to the timing of sales and repurchases of the Fund shares in relation to income earned and/or fluctuating market value of the investments of the Fund.
cBased on average daily shares outstanding.
dRecognition of net investment income by the Fund is affected by the timing of declaration of dividends by the Underlying Funds in which the Fund invests.
eAmount rounds to less than $0.01 per share.
fTotal return does not include fees, charges or expenses imposed by the variable annuity and life insurance contracts for which the Franklin Templeton Variable Insurance Products Trust serves as an underlying investment vehicle. Total return is not annualized for periods less than one year.
gRatios are annualized for periods less than one year.
hDoes not include expenses of the Underlying Funds in which the Fund invests. The weighted average indirect expenses of the Underlying Funds were 0.66% for the period ended June 30, 2012.
The accompanying notes are an integral part of these financial statements.
FFA-9
Franklin Templeton Variable Insurance Products Trust
Statement of Investments, June 30, 2012 (unaudited)
| Franklin Templeton VIP Founding Funds Allocation Fund | Shares | Value | ||||||||
Investments in Underlying Fundsa | ||||||||||
Domestic Equity 31.4% | ||||||||||
Mutual Shares Securities Fund, Class 1 | 71,040,810 | $ | 1,172,883,775 | |||||||
|
| |||||||||
Domestic Hybrid 32.1% | ||||||||||
Franklin Income Securities Fund, Class 1 | 82,484,463 | 1,196,849,551 | ||||||||
|
| |||||||||
Foreign Equity 31.9% | ||||||||||
Templeton Growth Securities Fund, Class 1 | 114,158,334 | 1,190,671,423 | ||||||||
|
| |||||||||
Total Investments in Underlying Funds (Cost $3,196,062,046) 95.4% | 3,560,404,749 | |||||||||
Other Assets, less Liabilities 4.6% | 170,333,927 | |||||||||
|
| |||||||||
Net Assets 100.0% | $ | 3,730,738,676 | ||||||||
|
| |||||||||
aSee Note 7 regarding investments in Underlying Funds.
The accompanying notes are an integral part of these financial statements.
FFA-10
Franklin Templeton Variable Insurance Products Trust
Financial Statements
Statement of Assets and Liabilities
June 30, 2012 (unaudited)
| Franklin Templeton VIP Founding Funds Allocation Fund | ||||
Assets: | ||||
Investments in Underlying Funds: (Note 7) | ||||
Cost | $ | 3,196,062,046 | ||
|
| |||
Value | $ | 3,560,404,749 | ||
Cash | 153,786,970 | |||
Receivables: | ||||
Investment securities sold | 258,729 | |||
Capital shares sold | 18,916,172 | |||
Other assets | 839 | |||
|
| |||
Total assets | 3,733,367,459 | |||
|
| |||
Liabilities: | ||||
Payables: | ||||
Capital shares redeemed | 135,778 | |||
Affiliates | 2,333,742 | |||
Accrued expenses and other liabilities | 159,263 | |||
|
| |||
Total liabilities | 2,628,783 | |||
|
| |||
Net assets, at value | $ | 3,730,738,676 | ||
|
| |||
Net assets consist of: | ||||
Paid-in capital | $ | 3,662,213,702 | ||
Undistributed net investment income | 92,030,092 | |||
Net unrealized appreciation (depreciation) | 364,342,703 | |||
Accumulated net realized gain (loss) | (387,847,821 | ) | ||
|
| |||
Net assets, at value | $ | 3,730,738,676 | ||
|
| |||
Class 1: | ||||
Net assets, at value | $ | 519,875 | ||
|
| |||
Shares outstanding | 66,881 | |||
|
| |||
Net asset value and maximum offering price per share | $ | 7.77 | ||
|
| |||
Class 2: | ||||
Net assets, at value | $ | 455,610,455 | ||
|
| |||
Shares outstanding | 58,822,807 | |||
|
| |||
Net asset value and maximum offering price per share | $ | 7.75 | ||
|
| |||
Class 4: | ||||
Net assets, at value | $ | 3,274,608,346 | ||
|
| |||
Shares outstanding | 423,587,104 | |||
|
| |||
Net asset value and maximum offering price per share | $ | 7.73 | ||
|
| |||
The accompanying notes are an integral part of these financial statements.
FFA-11
Franklin Templeton Variable Insurance Products Trust
Financial Statements (continued)
Statement of Operations
for the six months ended June 30, 2012 (unaudited)
| Franklin Templeton VIP Founding Funds Allocation Fund | ||||
Investment income: | ||||
Dividends from Underlying Funds (Note 7) | $ | 100,555,040 | ||
|
| |||
Expenses: | ||||
Administrative fees (Note 3a) | 1,939,183 | |||
Distribution fees: (Note 3b) | ||||
Class 2 | 574,673 | |||
Class 4 | 5,990,372 | |||
Unaffiliated transfer agent fees | 1,677 | |||
Custodian fees (Note 4) | 712 | |||
Reports to shareholders | 135,094 | |||
Professional fees | 31,200 | |||
Trustees’ fees and expenses | 7,218 | |||
Other | 11,977 | |||
|
| |||
Total expenses | 8,692,106 | |||
Expenses waived/paid by affiliates (Note 3d) | (187,878 | ) | ||
|
| |||
Net expenses | 8,504,228 | |||
|
| |||
Net investment income | 92,050,812 | |||
|
| |||
Realized and unrealized gains (losses): | ||||
Net realized gain (loss) from sale of investments in Underlying Funds (Note 7) | (24,035,425 | ) | ||
Net change in unrealized appreciation (depreciation) on investments in Underlying Funds | 73,154,870 | |||
|
| |||
Net realized and unrealized gain (loss) | 49,119,445 | |||
|
| |||
Net increase (decrease) in net assets resulting from operations | $ | 141,170,257 | ||
|
| |||
The accompanying notes are an integral part of these financial statements.
FFA-12
Franklin Templeton Variable Insurance Products Trust
Financial Statements (continued)
Statements of Changes in Net Assets
| Franklin Templeton VIP Founding Funds Allocation Fund | ||||||||
| Six Months Ended June 30, 2012 (unaudited) | Year Ended December 31, 2011 | |||||||
| ||||||||
Increase (decrease) in net assets: | ||||||||
Operations: | ||||||||
Net investment income | $ | 92,050,812 | $ | 115,027,209 | ||||
Net realized gain (loss) from Underlying Funds | (24,035,425 | ) | (183,417,581 | ) | ||||
Net change in unrealized appreciation (depreciation) on investments in Underlying Funds | 73,154,870 | (140,904,024 | ) | |||||
| ||||||||
Net increase (decrease) in net assets resulting from operations | 141,170,257 | (209,294,396 | ) | |||||
| ||||||||
Distributions to shareholders from: | ||||||||
Net investment income: | ||||||||
Class 1 | (14,007 | ) | (68 | ) | ||||
Class 2 | (12,894,473 | ) | (73,496 | ) | ||||
Class 4 | (102,116,912 | ) | (555,926 | ) | ||||
| ||||||||
Total distributions to shareholders | (115,025,392 | ) | (629,490 | ) | ||||
| ||||||||
Capital share transactions: (Note 2) | ||||||||
Class 1 | 38,753 | 45,474 | ||||||
Class 2 | (1,675,121 | ) | (32,955,021 | ) | ||||
Class 4 | 396,731,267 | 27,566,498 | ||||||
| ||||||||
Total capital share transactions | 395,094,899 | (5,343,049 | ) | |||||
| ||||||||
Net increase (decrease) in net assets | 421,239,764 | (215,266,935 | ) | |||||
Net assets: | ||||||||
Beginning of period | 3,309,498,912 | 3,524,765,847 | ||||||
| ||||||||
End of period | $ | 3,730,738,676 | $ | 3,309,498,912 | ||||
| ||||||||
Undistributed net investment income included in net assets: | ||||||||
End of period | $ | 92,030,092 | $ | 115,004,672 | ||||
| ||||||||
The accompanying notes are an integral part of these financial statements.
FFA-13
Franklin Templeton Variable Insurance Products Trust
Notes to Financial Statements (unaudited)
Franklin Templeton VIP Founding Funds Allocation Fund
1. ORGANIZATION AND SIGNIFICANT ACCOUNTING POLICIES
Franklin Templeton Variable Insurance Products Trust (Trust) is registered under the Investment Company Act of 1940, as amended, (1940 Act) as an open-end investment company, consisting of twenty separate funds. The Franklin Templeton VIP Founding Funds Allocation Fund (Fund) is included in this report. The financial statements of the remaining funds in the Trust are presented separately. The Fund invests primarily in other funds of the Trust (Underlying Funds). Shares of the Fund are generally sold only to insurance company separate accounts to fund the benefits of variable life insurance policies or variable annuity contracts. At June 30, 2012, 74.99% of the Fund’s shares were held through one insurance company. The Fund offers three classes of shares: Class 1, Class 2 and Class 4. Each class of shares differs by its distribution fees, voting rights on matters affecting a single class and its exchange privilege.
The following summarizes the Fund’s significant accounting policies.
a. Financial Instrument Valuation
The Fund’s investments in financial instruments are carried at fair value daily. Fair value is the price that would be received to sell an asset or paid to transfer a liability in an orderly transaction between market participants on the measurement date. Under procedures approved by the Fund’s Board of Trustees (the Board), the Fund’s administrator and other affiliates have formed the Valuation and Liquidity Oversight Committee (VLOC). The VLOC provides administration and oversight of the Fund’s valuation policies and procedures, which are approved annually by the Board. Investments in the Underlying Funds are valued at their closing net asset value each trading day.
b. Income Taxes
It is the Fund’s policy to qualify as a regulated investment company under the Internal Revenue Code. The Fund intends to distribute to shareholders substantially all of its taxable income and net realized gains to relieve it from federal income and if applicable, excise taxes. As a result, no provision for U.S. federal income taxes is required.
The Fund recognizes the tax benefits of uncertain tax positions only when the position is “more likely than not” to be sustained upon examination by the tax authorities based on the technical merits of the tax position. As of June 30, 2012, and for all open tax years, the Fund has determined that no liability for unrecognized tax benefits is required in the Fund’s financial statements related to uncertain tax positions taken on a tax return (or expected to be taken on future tax returns). Open tax years are those that remain subject to examination and are based on each tax jurisdiction statute of limitation.
c. Security Transactions, Investment Income, Expenses and Distributions
Security transactions are accounted for on trade date. Realized gains and losses on security transactions are determined on a specific identification basis. Estimated expenses are accrued daily. Dividend income and realized gain distributions by Underlying Funds are recorded on the ex-dividend date. Distributions to shareholders are recorded on the ex-dividend date and are determined according to income tax regulations (tax basis). Distributable earnings determined on a tax basis may differ from earnings recorded in accordance with accounting principles generally accepted in the United States of America. These differences may be permanent or temporary. Permanent differences are reclassified among capital accounts to reflect their tax character. These reclassifications have no impact on net assets or the results of operations. Temporary differences are not reclassified, as they may reverse in subsequent periods.
Common expenses incurred by the Trust are allocated among the funds based on the ratio of net assets of each fund to the combined net assets of the Trust. Fund specific expenses are charged directly to the fund that incurred the expense.
The Fund indirectly bears its proportionate share of expenses from the Underlying Funds. Since the Underlying Funds have varied expense levels and the Fund may own different proportions of the Underlying Funds at different times, the amount of expenses incurred indirectly by the Fund will vary.
FFA-14
Franklin Templeton Variable Insurance Products Trust
Notes to Financial Statements (unaudited) (continued)
Franklin Templeton VIP Founding Funds Allocation Fund
1. ORGANIZATION AND SIGNIFICANT ACCOUNTING POLICIES (continued)
Realized and unrealized gains and losses and net investment income, not including class specific expenses, are allocated daily to each class of shares based upon the relative proportion of net assets of each class. Differences in per share distributions, by class, are generally due to differences in class specific expenses.
d. Accounting Estimates
The preparation of financial statements in accordance with accounting principles generally accepted in the United States of America requires management to make estimates and assumptions that affect the reported amounts of assets and liabilities at the date of the financial statements and the amounts of income and expenses during the reporting period. Actual results could differ from those estimates.
e. Guarantees and Indemnifications
Under the Trust’s organizational documents, its officers and trustees are indemnified by the Trust against certain liabilities arising out of the performance of their duties to the Trust. Additionally, in the normal course of business, the Trust, on behalf of the Fund, enters into contracts with service providers that contain general indemnification clauses. The Trust’s maximum exposure under these arrangements is unknown as this would involve future claims that may be made against the Trust that have not yet occurred. Currently, the Trust expects the risk of loss to be remote.
2. SHARES OF BENEFICIAL INTEREST
At June 30, 2012, there were an unlimited number of shares authorized (without par value). Transactions in the Fund’s shares were as follows:
| Six Months Ended June 30, 2012 | Year Ended December 31, 2011 | |||||||||||||||
| Class 1 Shares: | Shares | Amount | Shares | Amount | ||||||||||||
Shares sold | 16,432 | $ | 125,266 | 12,893 | $ | 104,448 | ||||||||||
Shares issued in reinvestment of distributions | 1,805 | 14,007 | 9 | 68 | ||||||||||||
Shares redeemed | (12,992 | ) | (100,520 | ) | (7,764 | ) | (59,042 | ) | ||||||||
| ||||||||||||||||
Net increase (decrease) | 5,245 | $ | 38,753 | 5,138 | $ | 45,474 | ||||||||||
| ||||||||||||||||
Class 2 Shares: | ||||||||||||||||
Shares sold | 1,393,230 | $ | 10,909,309 | 6,091,791 | $ | 47,334,953 | ||||||||||
Shares issued in reinvestment of distributions | 1,665,953 | 12,894,473 | 9,187 | 73,496 | ||||||||||||
Shares redeemed | (3,257,921 | ) | (25,478,903 | ) | (10,341,627 | ) | (80,363,470 | ) | ||||||||
| ||||||||||||||||
Net increase (decrease) | (198,738 | ) | $ | (1,675,121 | ) | (4,240,649 | ) | $ | (32,955,021 | ) | ||||||
| ||||||||||||||||
Class 4 Shares: | ||||||||||||||||
Shares sold | 141,883,801 | $ | 1,115,892,339 | 298,702,307 | $ | 2,283,542,888 | ||||||||||
Shares issued on reinvestment of distributions | 13,227,579 | 102,116,912 | 69,578 | 555,926 | ||||||||||||
Shares redeemed | (109,036,136 | ) | (821,277,984 | ) | (315,059,008 | ) | (2,256,532,316 | ) | ||||||||
| ||||||||||||||||
Net increase (decrease) | 46,075,244 | $ | 396,731,267 | (16,287,123 | ) | $ | 27,566,498 | |||||||||
| ||||||||||||||||
FFA-15
Franklin Templeton Variable Insurance Products Trust
Notes to Financial Statements (unaudited) (continued)
Franklin Templeton VIP Founding Funds Allocation Fund
3. TRANSACTIONS WITH AFFILIATES
Franklin Resources, Inc. is the holding company for various subsidiaries that together are referred to as Franklin Templeton Investments. Certain officers and trustees of the Fund are also officers and/or directors of certain of the Underlying Funds and of the following subsidiaries:
| Subsidiary | Affiliation | |
Franklin Templeton Services, LLC (FT Services) | Administrative manager | |
Franklin Templeton Distributors, Inc. (Distributors) | Principal underwriter | |
Franklin Templeton Investor Services, LLC (Investor Services) | Transfer agent |
a. Administrative Fees
The Fund pays an administrative fee to FT Services of 0.10% per year of the average daily net assets of the Fund for administrative services including monitoring and rebalancing the percentage of each Fund’s investment in the Underlying Funds.
b. Distribution Fees
The Board has adopted distribution plans for Class 2 and Class 4 shares pursuant to Rule 12b-1 under the 1940 Act. Under the Fund’s compensation distribution plans, the Fund pays Distributors for costs incurred in connection with the servicing, sale and distribution of the Fund’s shares up to 0.35% per year of its average daily net assets of each class. The Board has agreed to limit the current rate to 0.25% per year for Class 2.
c. Transfer Agent Fees
Investor Services, under terms of an agreement, performs shareholder servicing for the Fund and is not paid by the Fund for the services.
d. Waiver and Expense Reimbursements
FT Services has contractually agreed in advance to waive or limit its fees and to assume as its own expense certain expenses otherwise payable by the Fund so that the common expenses (i.e. a combination of administrative fees and other expenses, but excluding distribution fees and acquired fund fees and expenses) for each class of the Fund do not exceed 0.10% (other than certain non-routine expenses or costs, including those relating to litigation, indemnification, reorganizations, and liquidations) until April 30, 2013.
4. EXPENSE OFFSET ARRANGEMENT
The Fund has entered into an arrangement with its custodian whereby credits realized as a result of uninvested cash balances are used to reduce a portion of the Fund’s custodian expenses. During the period ended June 30, 2012, there were no credits earned.
5. INCOME TAXES
For tax purposes, capital losses may be carried over to offset future capital gains, if any. At December 31, 2011, the Fund had capital loss carryforwards of $114,009,072.
FFA-16
Franklin Templeton Variable Insurance Products Trust
Notes to Financial Statements (unaudited) (continued)
Franklin Templeton VIP Founding Funds Allocation Fund
5. INCOME TAXES (continued)
At June 30, 2012, the cost of investments and net unrealized appreciation (depreciation) for income tax purposes were as follows:
Cost of investments | $ | 3,454,038,016 | ||
|
| |||
Unrealized appreciation | $ | 126,135,725 | ||
Unrealized depreciation | (19,768,992 | ) | ||
|
| |||
Net unrealized appreciation (depreciation) | $ | 106,366,733 | ||
|
| |||
Differences between income and/or capital gains as determined on a book basis and a tax basis are primarily due to differing treatment of wash sales.
6. INVESTMENT TRANSACTIONS
Purchases and sales of investments (excluding short term securities) for the period ended June 30, 2012, aggregated $1,147,555,040 and $779,265,307, respectively.
7. INVESTMENTS IN UNDERLYING FUNDS
The Fund invests primarily in the Underlying Funds which are managed by affiliates of the Fund’s administrative manager, FT Services. The Fund does not invest in the Underlying Funds for the purpose of exercising a controlling influence over the management or policies. Investments in Underlying Funds for the period ended June 30, 2012, were as follows:
| Underlying Funds | Number of Shares Held at Beginning of Period | Gross Additions | Gross Reductions | Number of Shares Held at End of Period | Value at End of Period | Investment Income | Realized Capital Gain (Loss) | % of Underlying Fund Shares Outstanding Held at End of Period | ||||||||||||||||||||||||
Franklin Income Securities Fund, Class 1 | 71,098,618 | 32,211,491 | 20,825,646 | 82,484,463 | $ | 1,196,849,551 | $ | 73,110,255 | $ | (274,482 | ) | 14.79% | ||||||||||||||||||||
Mutual Shares Securities Fund, Class 1 | 67,201,395 | 20,042,576 | 16,203,161 | 71,040,810 | 1,172,883,775 | — | (6,295,870 | ) | 21.42% | |||||||||||||||||||||||
Templeton Growth Securities Fund, Class 1 | 102,526,012 | 31,435,046 | 19,802,724 | 114,158,334 | 1,190,671,423 | 27,444,785 | (17,465,073 | ) | 44.81% | |||||||||||||||||||||||
|
| |||||||||||||||||||||||||||||||
Total | $ | 3,560,404,749 | $ | 100,555,040 | $ | (24,035,425 | ) | |||||||||||||||||||||||||
|
| |||||||||||||||||||||||||||||||
8. CREDIT FACILITY
The Fund, together with other U.S. registered and foreign investment funds (collectively, Borrowers), managed by Franklin Templeton Investments, are borrowers in a joint syndicated senior unsecured credit facility totaling $1.5 billion (Global Credit Facility) which matures on January 18, 2013. This Global Credit Facility provides a source of funds to the Borrowers for temporary and emergency purposes, including the ability to meet future unanticipated or unusually large redemption requests.
Under the terms of the Global Credit Facility, the Fund shall, in addition to interest charged on any borrowings made by the Fund and other costs incurred by the Fund, pay its share of fees and expenses incurred in connection with the implementation
FFA-17
Franklin Templeton Variable Insurance Products Trust
Notes to Financial Statements (unaudited) (continued)
Franklin Templeton VIP Founding Funds Allocation Fund
8. CREDIT FACILITY (continued)
and maintenance of the Global Credit Facility, based upon its relative share of the aggregate net assets of all of the Borrowers, including an annual commitment fee of 0.08% based upon the unused portion of the Global Credit Facility, which is reflected in other expenses on the Statement of Operations. During the period ended June 30, 2012, the Fund did not use the Global Credit Facility.
9. FAIR VALUE MEASUREMENTS
The Fund follows a fair value hierarchy that distinguishes between market data obtained from independent sources (observable inputs) and the Fund’s own market assumptions (unobservable inputs). These inputs are used in determining the value of the Fund’s financial instruments and are summarized in the following fair value hierarchy:
| • | Level 1 – quoted prices in active markets for identical financial instruments |
| • | Level 2 – other significant observable inputs (including quoted prices for similar financial instruments, interest rates, prepayment speed, credit risk, etc.) |
| • | Level 3 – significant unobservable inputs (including the Fund’s own assumptions in determining the fair value of financial instruments) |
The inputs or methodology used for valuing financial instruments are not an indication of the risk associated with investing in those financial instruments.
For movements between the levels within the fair value hierarchy, the Fund has adopted a policy of recognizing the transfers as of the date of the underlying event which caused the movement.
At June 30, 2012, all of the Fund’s investments in financial instruments carried at fair value were valued using Level 1 inputs. For detailed categories, see the accompanying Statement of Investments.
10. SUBSEQUENT EVENTS
The Fund has evaluated subsequent events through the issuance of the financial statements and determined that no events have occurred that require disclosure.
FFA-18
MUTUAL GLOBAL DISCOVERY SECURITIES FUND
This semiannual report for Mutual Global Discovery Securities Fund covers the period ended June 30, 2012.
Performance Summary as of 6/30/12
Mutual Global Discovery Securities Fund – Class 4 delivered a +5.23% total return for the six-month period ended 6/30/12.
Performance reflects the Fund’s Class 4 operating expenses, but does not include any contract fees, expenses or sales charges. If they had been included, performance would be lower. These charges and deductions, particularly for variable life policies, can have a significant effect on contract values and insurance benefits. See the contract prospectus for a complete description of these expenses, including sales charges.
Mutual Global Discovery Securities Fund – Class 4
Performance data represent past performance, which does not guarantee future results. Investment return and principal value will fluctuate, and you may have a gain or loss when you sell your shares.
Current performance may differ from figures shown.
MGD-1
Fund Goal and Main Investments: Mutual Global Discovery Securities Fund seeks capital appreciation. Under normal market conditions, the Fund invests primarily in U.S. and foreign equity securities that the investment manager believes are undervalued.
Performance Overview
You can find the Fund’s six-month total return in the Performance Summary. The Fund underperformed its benchmarks, the MSCI World Index, which generated a +6.29% total return, and the Standard & Poor’s® 500 Index, which posted a +9.49% total return for the same period.1
Economic and Market Overview
The six months under review encompassed two different market environments. The first quarter of 2012 delivered the best annual start for global developed stocks in more than a decade, as measured by the MSCI World Index, as signs of U.S. economic recovery and European policy relief underpinned a rally in cyclical stocks.2 Yet, renewed global economic weakness and European debt concerns led the market lower in the second quarter, and stocks dropped sharply in the spring before additional policy action prompted a rebound in June. Politics largely drove the markets during the first half of 2012 as investors closely monitored developments in Europe, where German-led austerity demands were met with increasing resentment from some highly indebted eurozone members. Coalition-building efforts in Greece collapsed amid anger over the terms of the country’s second bailout, forcing a new election that brought some relief when the pro-euro party won. Elsewhere in the region, France’s socialist candidate clinched the presidency on a pro-growth platform and the Dutch cabinet resigned in the wake of a contentious austerity deal.
On the economic front, global growth trends generally moderated, led by Europe, which narrowly avoided recession mainly because of German export strength. Yet, even the more resilient economies of Germany, the U.S. and China showed signs of a slowdown at period-end. The combination of flagging growth, political uncertainty and populist unrest pressured investor confidence, and ratings agencies downgraded global banks and European sovereigns. Concerns about Italian and Spanish borrowing costs added to investor anxiety as bond yields climbed. Europe’s initial policy responses — including enhanced
1. Source: © 2012 Morningstar. One cannot invest directly in an index, and an index is not representative of the Fund’s portfolio. Please see Index Descriptions following the Fund Summaries.
2. Please see Index Descriptions following the Fund Summaries.
Fund Risks: All investments involve risks, including possible loss of principal. Stock prices fluctuate, sometimes rapidly and dramatically, due to factors affecting individual companies, particular industries or sectors, or general market conditions. Value securities may not increase in price as anticipated, or may decline further in value. Investments in foreign securities involve certain risks including currency fluctuations, and economic and political uncertainties. Smaller company stocks have exhibited greater price volatility than larger company stocks, particularly over the short term. Investments in companies engaged in mergers, reorganizations or liquidations also involve special risks as pending deals may not be completed on time or on favorable terms. Investments in lower rated bonds entail higher credit risk. The Fund may from time to time enter into certain transactions involving derivatives; such techniques may not achieve the anticipated benefits and/or may result in losses to the Fund. The Fund is actively managed but there is no guarantee that the manager’s investment decisions will produce the desired results. The Fund’s prospectus also includes a description of the main investment risks.
MGD-2
liquidity measures and an ineffective Spanish banking bailout — did little to address the structural imbalances of eurozone economies or the solvency fears plaguing the region’s banking system. Yet, encouraging progress did emerge at period-end when leaders in Brussels agreed to ease conditions of sovereign bond purchases and permit the region’s bailout fund to directly recapitalize banks. Meanwhile, the U.S. Federal Reserve Board (Fed) opted to extend its strategy, dubbed Operation Twist, designed to lower systemically important interest rates, and the People’s Bank of China slashed interest rates for the first time since the global financial crisis began. In the latter part of the period, commodities extended recent losses, with oil falling back below $100, while the euro dipped and traditional safe havens like U.S. Treasuries, the U.S. dollar and the Japanese yen made gains.
Investment Strategy
At Mutual Series, we are committed to our distinctive value approach to investing. Our major investment strategy is investing in undervalued stocks. When selecting undervalued equities, we are attracted to fundamentally strong companies with healthy balance sheets, high-quality assets, substantial free cash flow and shareholder-oriented management teams and whose stocks are trading at discounts to our assessment of the companies’ intrinsic or business value. We also look for asset rich companies whose shares may be trading at depressed levels due to concerns over short-term earnings disappointments, litigation, management strategy or other perceived negatives. While the vast majority of our undervalued equity investments are made in publicly traded companies globally, we may invest occasionally in privately held companies as well.
We complement this more traditional investment strategy with two others. One is distressed investing, which is complex and can take many forms. The most common distressed investment the Fund undertakes is the purchase of financially troubled or bankrupt companies’ debt at a substantial discount to face value. After the financially distressed company is reorganized, often in bankruptcy court, the old debt is typically replaced with new securities issued by the financially stronger company.
The other piece of our investment strategy is participating in arbitrage situations, another highly specialized field. When companies announce proposed mergers or takeovers, commonly referred to as “deals,” the target company may trade at a discount to the bid it ultimately accepts.
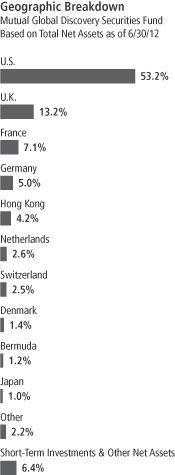
MGD-3
One form of arbitrage involves purchasing the target company’s stock when it is trading below the value we believe it would receive in a deal. In keeping with our commitment to a relatively conservative investment approach, we typically focus our arbitrage efforts on announced deals, and eschew rumored deals or other situations we consider relatively risky.
In addition, it is our practice to hedge the Fund’s currency exposure when we deem it advantageous for our shareholders.
Manager’s Discussion
In an environment of generally rising equity prices, many Fund holdings increased in value during the six-month period. Three particularly strong performers were U.S. drugstore chain and pharmacy benefits manager CVS Caremark, U.S.-based nationwide financial services company Wells Fargo, and U.S.-based tobacco company Lorillard.
CVS shares appreciated as management in May increased its 2012 guidance, reflecting strong first-quarter 2012 and fiscal year 2011 results. Strong growth in pharmacy network claims processed and increases in same-store sales led to revenue growth across business segments, supporting the stock price during the period.
Despite a difficult operating environment for banks, Wells Fargo communicated encouraging news to investors throughout the period. Early in the year, the bank released strong fourth-quarter 2011 results that included net interest margin (NIM) expansion, sequential loan growth, a continued inflow of deposits and solid mortgage banking results. In March 2012, the Fed announced summary results of its annual bank stress tests. Wells Fargo successfully met requirements and received no objections from the Fed with respect to its capital adequacy and planning. Consequently, Wells Fargo boosted its quarterly dividend and received permission to repurchase stock. Operational results were strong throughout the remainder of the period, led by robust performance in the mortgage banking segment and continued NIM expansion.
After a strong 2011, the Fund’s investment in Lorillard continued to boost performance in the first half of 2012. During the period, Lorillard reported fourth-quarter results that were well above consensus estimates on many metrics. Increased volumes and prices drove impressive top-line results, which in turn led to improved margins. Lorillard’s board of directors also approved a dividend increase due to the company’s
Top 10 Sectors/Industries
Mutual Global Discovery Securities Fund
6/30/12
| % of Total Net Assets | ||||
| Tobacco | 8.6% | |||
| Oil, Gas & Consumable Fuels | 7.0% | |||
| Commercial Banks | 6.9% | |||
| Pharmaceuticals | 6.6% | |||
| Insurance | 6.1% | |||
| Media | 4.8% | |||
| Diversified Financial Services | 3.9% | |||
| Industrial Conglomerates | 3.4% | |||
| Food & Staples Retailing | 3.4% | |||
| Software | 3.3% | |||
MGD-4
strong 2011 performance. Later in the period, Lorillard announced first-quarter 2012 results that met internal expectations, and the company continued to reward investors through share repurchases and dividends.
During the period under review, some of the Fund’s investments lost value and negatively impacted Fund performance. Key detractors included French media company Eutelsat Communications, German industrial conglomerate ThyssenKrupp and a new Fund holding, Netherlands-based financial services firm ING Groep.
Eutelsat’s share price declined in the first half of 2012 as the company announced fiscal third-quarter revenues that fell short of analyst estimates and also announced a downward revision to its revenue guidance. Despite the near-term weakness, we believe Eutelsat shares remain undervalued and we will continue monitoring the company’s fundamentals and strategy closely as it approaches the end of its fiscal year and a planned disclosure of its revised three-year outlook.
During the period, ThyssenKrupp’s operating performance was broadly in line with expectations, with the exception of the company’s Steel Europe and Americas businesses, which struggled due to cyclical pricing pressures and launch issues in the Americas. While the company continued to execute on its original restructuring plan, the uncertain and volatile macroeconomic environment weighed on operations, contributing to management’s recent announcement that it would explore all strategic options regarding the Steel Americas division. At period-end, we continued to see upside potential in our investment based on our view that ThyssenKrupp has a strong set of assets, manageable debt maturity ladder, ability to generate strong free cash flow and a restructuring plan designed to create value.
ING Groep’s shares declined in value during the period amid increased uncertainty regarding Europe’s political and economic outlook. Although the economic backdrop created headwinds, we believe our investment has upside potential as ING continues to divest insurance assets at attractive prices in its efforts to simplify its holding company structure while maintaining a well-capitalized banking operation.
During the period, the Fund held currency forwards and futures to somewhat hedge the currency risk of the portfolio’s non-U.S. dollar investments. The hedges had a minor positive impact on the Fund’s performance during the period.
Top 10 Holdings
Mutual Global Discovery Securities Fund 6/30/12
| Company Sector/Industry, Country | % of Total Net Assets | |||
| Merck & Co. Inc. | 2.6% | |||
| Pharmaceuticals, U.S. | ||||
| British American Tobacco PLC | 2.5% | |||
| Tobacco, U.K. | ||||
| Vodafone Group PLC | 2.3% | |||
| Wireless Telecommunication Services, U.K. | ||||
| ACE Ltd. | 2.3% | |||
| Insurance, U.S. | ||||
| Jardine Strategic Holdings Ltd. | 2.2% | |||
| Industrial Conglomerates, Hong Kong | ||||
| Microsoft Corp. | 2.1% | |||
| Software, U.S. | ||||
| Wells Fargo & Co. | 2.0% | |||
| Commercial Banks, U.S. | ||||
| Royal Dutch Shell PLC, A | 1.9% | |||
| Oil, Gas & Consumable Fuels, U.K. | ||||
| Pernod Ricard SA | 1.8% | |||
| Beverages, France | ||||
| Kraft Foods Inc., A | 1.8% | |||
| Food Products, U.S. | ||||
The dollar value, number of shares or principal amount, and names of all portfolio holdings are listed in the Fund’s Statement of Investments.
MGD-5
Thank you for your participation in Mutual Global Discovery Securities Fund. We look forward to serving your future investment needs.
The foregoing information reflects our analysis, opinions and portfolio holdings as of June 30, 2012, the end of the reporting period. The way we implement our main investment strategies and the resulting portfolio holdings may change depending on factors such as market and economic conditions. These opinions may not be relied upon as investment advice or an offer for a particular security. The information is not a complete analysis of every aspect of any market, country, industry, security or the Fund. Statements of fact are from sources considered reliable, but the investment manager makes no representation or warranty as to their completeness or accuracy. Although historical performance is no guarantee of future results, these insights may help you understand our investment management philosophy.
MGD-6
Fund Expenses
As an investor in a variable insurance contract (Contract) that indirectly provides for investment in an underlying mutual fund, you can incur transaction and/or ongoing expenses at both the Fund level and the Contract level.
| • | Transaction expenses can include sales charges (loads) on purchases, surrender fees, transfer fees and premium taxes. |
| • | Ongoing expenses can include management fees, distribution and service (12b-1) fees, contract fees, annual maintenance fees, mortality and expense risk fees and other fees and expenses. All mutual funds and Contracts have some types of ongoing expenses. |
The expenses shown in the table are meant to highlight ongoing expenses at the Fund level only and do not include ongoing expenses at the Contract level, or transaction expenses at either the Fund or Contract levels. While the Fund does not have transaction expenses, if the transaction and ongoing expenses at the Contract level were included, the expenses shown below would be higher. You should consult your Contract prospectus or disclosure document for more information.
The table shows Fund-level ongoing expenses and can help you understand these expenses and compare them with those of other mutual funds offered through the Contract. The table assumes a $1,000 investment held for the six months indicated. Please refer to the Fund prospectus for additional information on operating expenses.
Actual Fund Expenses
The first line (Actual) of the table provides actual account values and expenses. The “Ending Account Value” is derived from the Fund’s actual return, which includes the effect of ongoing Fund expenses, but does not include the effect of ongoing Contract expenses.
You can estimate the Fund-level expenses you incurred during the period by following these steps. Of course, your account value and expenses will differ from those in this illustration:
| 1. | Divide your account value by $1,000. |
If an account had an $8,600 value, then $8,600 ÷ $1,000 = 8.6.
| 2. | Multiply the result by the number under the heading “Fund-Level Expenses Incurred During Period.” |
If Fund-Level Expenses Incurred During Period were $7.50, then 8.6 x $7.50 = $64.50.
In this illustration, the estimated expenses incurred this period at the Fund level are $64.50.
Mutual Global Discovery Securities Fund – Class 4
MGD-7
Hypothetical Example for Comparison with Other Mutual Funds
Information in the second line (Hypothetical) of the table can help you compare ongoing expenses of the Fund with those of other mutual funds offered through the Contract. This information may not be used to estimate the actual ending account balance or expenses you incurred during the period. The hypothetical “Ending Account Value” is based on the Fund’s actual expense ratio and an assumed 5% annual rate of return before expenses, which does not represent the Fund’s actual return. The figure under the heading “Fund-Level Expenses Incurred During Period” shows the hypothetical expenses your account would have incurred under this scenario. You can compare this figure with the 5% hypothetical examples that appear in shareholder reports of other funds offered through a Contract.
| Class 4 | Beginning Account Value 1/1/12 | Ending Account Value 6/30/12 | Fund-Level Expenses Incurred During Period* 1/1/12–6/30/12 | |||||||||
Actual | $ | 1,000 | $ | 1,052.30 | $ | 6.89 | ||||||
Hypothetical (5% return before expenses) | $ | 1,000 | $ | 1,018.15 | $ | 6.77 | ||||||
*Expenses are calculated using the most recent six-month annualized expense ratio for the Fund’s Class 4 shares (1.35%), which does not include any ongoing expenses of the Contract for which the Fund is an investment option, multiplied by the average account value over the period, multiplied by 182/366 to reflect the one-half year period.
MGD-8
Franklin Templeton Variable Insurance Products Trust
Financial Highlights
Mutual Global Discovery Securities Fund
Six Months (unaudited) | Year Ended December 31, | |||||||||||||||||||||||
| Class 1 | 2011 | 2010 | 2009 | 2008 | 2007 | |||||||||||||||||||
| ||||||||||||||||||||||||
Per share operating performance | ||||||||||||||||||||||||
(for a share outstanding throughout the period) | ||||||||||||||||||||||||
Net asset value, beginning of period | $ | 19.66 | $ | 21.16 | $ | 19.14 | $ | 16.12 | $ | 24.08 | $ | 22.05 | ||||||||||||
|
| |||||||||||||||||||||||
Income from investment operationsa: | ||||||||||||||||||||||||
Net investment incomeb | 0.27 | 0.52 | 0.38 | 0.19 | c | 0.37 | 0.47 | |||||||||||||||||
Net realized and unrealized gains (losses) | 0.79 | (1.09 | ) | 1.94 | 3.57 | (6.95 | ) | 2.22 | ||||||||||||||||
|
| |||||||||||||||||||||||
Total from investment operations | 1.06 | (0.57 | ) | 2.32 | 3.76 | (6.58 | ) | 2.69 | ||||||||||||||||
|
| |||||||||||||||||||||||
Less distributions from: | ||||||||||||||||||||||||
Net investment income | — | (0.50 | ) | (0.30 | ) | (0.26 | ) | (0.52 | ) | (0.38 | ) | |||||||||||||
Net realized gains | — | (0.43 | ) | — | (0.48 | ) | (0.86 | ) | (0.28 | ) | ||||||||||||||
|
| |||||||||||||||||||||||
Total distributions | — | (0.93 | ) | (0.30 | ) | (0.74 | ) | (1.38 | ) | (0.66 | ) | |||||||||||||
|
| |||||||||||||||||||||||
Net asset value, end of period | $ | 20.72 | $ | 19.66 | $ | 21.16 | $ | 19.14 | $ | 16.12 | $ | 24.08 | ||||||||||||
|
| |||||||||||||||||||||||
Total returnd | 5.39% | (2.73)% | 12.24% | 23.63% | (28.29)% | 12.17% | ||||||||||||||||||
Ratios to average net assetse | ||||||||||||||||||||||||
Expensesf | 1.00% | 0.97% | g | 1.00% | g | 1.06% | g | 0.98% | g | 0.97% | g | |||||||||||||
Expenses incurred in connection with securities sold short | —% | —% | h | 0.02% | 0.09% | 0.01% | —% | h | ||||||||||||||||
Net investment income | 2.62% | 2.34% | 1.93% | 1.07% | c | 1.82% | 1.96% | |||||||||||||||||
Supplemental data | ||||||||||||||||||||||||
Net assets, end of period (000’s) | $ | 1,021 | $ | 974 | $ | 84,213 | $ | 86,755 | $ | 81,320 | $ | 142,751 | ||||||||||||
Portfolio turnover rate | 14.91% | 26.17% | i | 49.31% | 43.35% | 22.76% | 28.20% | |||||||||||||||||
aThe amount shown for a share outstanding throughout the period may not correlate with the Statement of Operations for the period due to the timing of sales and repurchases of the Fund shares in relation to income earned and/or fluctuating market value of the investments of the Fund.
bBased on average daily shares outstanding.
cNet investment income per share includes approximately $(0.03) per share related to an adjustment for uncollectible interest. Excluding the effect of this adjustment, the ratio of net investment income to average net assets would have been 1.26%.
dTotal return does not include fees, charges or expenses imposed by the variable annuity and life insurance contracts for which the Franklin Templeton Variable Insurance Products Trust serves as an underlying investment vehicle. Total return is not annualized for periods less than one year.
eRatios are annualized for periods less than one year.
fIncludes dividend or interest expense on securities sold short and security borrowing fees, if any. See below for the ratios of such expenses to average net assets for the periods presented. See Note 1(f).
gBenefit of expense reduction rounds to less than 0.01%.
hRounds to less than 0.01%.
iExcludes the value of portfolio securities delivered as a result of a redemption in-kind. See Note 13.
The accompanying notes are an integral part of these financial statements.
MGD-9
Franklin Templeton Variable Insurance Products Trust
Financial Highlights (continued)
Mutual Global Discovery Securities Fund
Six Months (unaudited) | Year Ended December 31, | |||||||||||||||||||||||
| Class 2 | 2011 | 2010 | 2009 | 2008 | 2007 | |||||||||||||||||||
| ||||||||||||||||||||||||
Per share operating performance | ||||||||||||||||||||||||
(for a share outstanding throughout the period) | ||||||||||||||||||||||||
Net asset value, beginning of period | $ | 19.30 | $ | 20.80 | $ | 18.81 | $ | 15.85 | $ | 23.69 | $ | 21.73 | ||||||||||||
|
| |||||||||||||||||||||||
Income from investment operationsa: | ||||||||||||||||||||||||
Net investment incomeb | 0.24 | 0.43 | 0.33 | 0.14 | c | 0.32 | 0.40 | |||||||||||||||||
Net realized and unrealized gains (losses) | 0.77 | (1.04 | ) | 1.91 | 3.50 | (6.84 | ) | 2.18 | ||||||||||||||||
|
| |||||||||||||||||||||||
Total from investment operations | 1.01 | (0.61 | ) | 2.24 | 3.64 | (6.52 | ) | 2.58 | ||||||||||||||||
|
| |||||||||||||||||||||||
Less distributions from: | ||||||||||||||||||||||||
Net investment income | — | (0.46 | ) | (0.25 | ) | (0.20 | ) | (0.46 | ) | (0.34 | ) | |||||||||||||
Net realized gains | — | (0.43 | ) | — | (0.48 | ) | (0.86 | ) | (0.28 | ) | ||||||||||||||
|
| |||||||||||||||||||||||
Total distributions | — | (0.89 | ) | (0.25 | ) | (0.68 | ) | (1.32 | ) | (0.62 | ) | |||||||||||||
|
| |||||||||||||||||||||||
Net asset value, end of period | $ | 20.31 | $ | 19.30 | $ | 20.80 | $ | 18.81 | $ | 15.85 | $ | 23.69 | ||||||||||||
|
| |||||||||||||||||||||||
Total returnd | 5.23% | (2.96)% | 11.96% | 23.31% | (28.45)% | 11.85% | ||||||||||||||||||
Ratios to average net assetse | ||||||||||||||||||||||||
Expensesf | 1.25% | 1.22% | g | 1.25% | g | 1.31% | g | 1.23% | g | 1.22% | g | |||||||||||||
Expenses incurred in connection with securities sold short | —% | —% | h | 0.02% | 0.09% | 0.01% | —% | h | ||||||||||||||||
Net investment income | 2.37% | 2.09% | 1.68% | 0.82% | c | 1.57% | 1.71% | |||||||||||||||||
Supplemental data | ||||||||||||||||||||||||
Net assets, end of period (000’s) | $ | 668,575 | $ | 712,161 | $ | 1,351,223 | $ | 1,309,852 | $ | 1,113,720 | $ | 1,867,484 | ||||||||||||
Portfolio turnover rate | 14.91% | 26.17% | i | 49.31% | 43.35% | 22.76% | 28.20% | |||||||||||||||||
aThe amount shown for a share outstanding throughout the period may not correlate with the Statement of Operations for the period due to the timing of sales and repurchases of the Fund shares in relation to income earned and/or fluctuating market value of the investments of the Fund.
bBased on average daily shares outstanding.
cNet investment income per share includes approximately $(0.03) per share related to an adjustment for uncollectible interest. Excluding the effect of this adjustment, the ratio of net investment income to average net assets would have been 1.01%.
dTotal return does not include fees, charges or expenses imposed by the variable annuity and life insurance contracts for which the Franklin Templeton Variable Insurance Products Trust serves as an underlying investment vehicle. Total return is not annualized for periods less than one year.
eRatios are annualized for periods less than one year.
fIncludes dividend or interest expense on securities sold short and security borrowing fees, if any. See below for the ratios of such expenses to average net assets for the periods presented. See Note 1(f).
gBenefit of expense reduction rounds to less than 0.01%.
hRounds to less than 0.01%.
iExcludes the value of portfolio securities delivered as a result of a redemption in-kind. See Note 13.
The accompanying notes are an integral part of these financial statements.
MGD-10
Franklin Templeton Variable Insurance Products Trust
Financial Highlights (continued)
Mutual Global Discovery Securities Fund
| Six Months Ended June 30, 2012 (unaudited) | Year Ended December 31, | |||||||||||||||||||
| Class 4 | 2011 | 2010 | 2009 | 2008a | ||||||||||||||||
| ||||||||||||||||||||
Per share operating performance | ||||||||||||||||||||
(for a share outstanding throughout the period) | ||||||||||||||||||||
Net asset value, beginning of period | $ | 19.50 | $ | 21.02 | $ | 19.02 | $ | 16.07 | $ | 22.50 | ||||||||||
|
| |||||||||||||||||||
Income from investment operationsb: | ||||||||||||||||||||
Net investment incomec | 0.23 | 0.40 | 0.31 | 0.11 | d | 0.09 | ||||||||||||||
Net realized and unrealized gains (losses) | 0.79 | (1.05 | ) | 1.94 | 3.56 | (5.14 | ) | |||||||||||||
|
| |||||||||||||||||||
Total from investment operations | 1.02 | (0.65 | ) | 2.25 | 3.67 | (5.05 | ) | |||||||||||||
|
| |||||||||||||||||||
Less distributions from: | ||||||||||||||||||||
Net investment income | — | (0.44 | ) | (0.25 | ) | (0.24 | ) | (0.52 | ) | |||||||||||
Net realized gains | — | (0.43 | ) | — | (0.48 | ) | (0.86 | ) | ||||||||||||
|
| |||||||||||||||||||
Total distributions | — | (0.87 | ) | (0.25 | ) | (0.72 | ) | (1.38 | ) | |||||||||||
|
| |||||||||||||||||||
Net asset value, end of period | $ | 20.52 | $ | 19.50 | $ | 21.02 | $ | 19.02 | $ | 16.07 | ||||||||||
|
| |||||||||||||||||||
Total returne | 5.23% | (3.08)% | 11.87% | 23.19% | (23.48)% | |||||||||||||||
Ratios to average net assetsf | ||||||||||||||||||||
Expensesg | 1.35% | 1.32% | h | 1.35% | h | 1.41% | h | 1.33% | h | |||||||||||
Expenses incurred in connection with securities sold short | —% | —%i | 0.02% | 0.09% | 0.01% | |||||||||||||||
Net investment income | 2.27% | 1.99% | 1.58% | 0.72% | d | 1.47% | ||||||||||||||
Supplemental data | ||||||||||||||||||||
Net assets, end of period (000’s) | $ | 65,475 | $ | 66,695 | $ | 70,613 | $ | 59,178 | $ | 23,981 | ||||||||||
Portfolio turnover rate | 14.91% | 26.17% | j | 49.31% | 43.35% | 22.76% | ||||||||||||||
aFor the period February 29, 2008 (effective date) to December 31, 2008.
bThe amount shown for a share outstanding throughout the period may not correlate with the Statement of Operations for the period due to the timing of sales and repurchases of the Fund shares in relation to income earned and/or fluctuating market value of the investments of the Fund.
cBased on average daily shares outstanding.
dNet investment income per share includes approximately $(0.03) per share related to an adjustment for uncollectible interest. Excluding the effect of this adjustment, the ratio of net investment income to average net assets would have been 0.91%.
eTotal return does not include fees, charges or expenses imposed by the variable annuity and life insurance contracts for which the Franklin Templeton Variable Insurance Products Trust serves as an underlying investment vehicle. Total return is not annualized for periods less than one year.
fRatios are annualized for periods less than one year.
gIncludes dividend or interest expense on securities sold short and security borrowing fees, if any. See below for the ratios of such expenses to average net assets for the periods presented. See Note 1(f).
hBenefit of expense reduction rounds to less than 0.01%.
iRounds to less than 0.01%.
jExcludes the value of portfolio securities delivered as a result of a redemption in-kind. See Note 13.
The accompanying notes are an integral part of these financial statements.
MGD-11
Franklin Templeton Variable Insurance Products Trust
Statement of Investments, June 30, 2012 (unaudited)
| Mutual Global Discovery Securities Fund | Country | Shares | Value | |||||||
Common Stocks and Other Equity Interests 86.7% | ||||||||||
Auto Components 0.9% | ||||||||||
a,b,cCollins & Aikman Products Co., Contingent Distribution | United States | 218,708 | $ | 525 | ||||||
Continental AG | Germany | 61,983 | 5,147,606 | |||||||
a,dInternational Automotive Components Group Brazil LLC | Brazil | 424,073 | 144,397 | |||||||
a,d,eInternational Automotive Components Group North America, LLC | United States | 3,000,220 | 1,480,758 | |||||||
|
| |||||||||
| 6,773,286 | ||||||||||
|
| |||||||||
Automobiles 0.4% | ||||||||||
Daimler AG | Germany | 161 | 7,202 | |||||||
aGeneral Motors Co. | United States | 136,940 | 2,700,457 | |||||||
|
| |||||||||
| 2,707,659 | ||||||||||
|
| |||||||||
Beverages 3.0% | ||||||||||
Coca-Cola Enterprises Inc. | United Kingdom | 107,220 | 3,006,449 | |||||||
Dr. Pepper Snapple Group Inc. | United States | 120,110 | 5,254,812 | |||||||
fPernod Ricard SA | France | 126,640 | 13,504,820 | |||||||
|
| |||||||||
| 21,766,081 | ||||||||||
|
| |||||||||
Biotechnology 0.6% | ||||||||||
Amgen Inc. | United States | 61,796 | 4,513,580 | |||||||
|
| |||||||||
Capital Markets 1.9% | ||||||||||
Morgan Stanley | United States | 450,600 | 6,574,254 | |||||||
UBS AG | Switzerland | 609,866 | 7,101,180 | |||||||
|
| |||||||||
| 13,675,434 | ||||||||||
|
| |||||||||
Chemicals 0.7% | ||||||||||
Linde AG | Germany | 32,336 | 5,019,383 | |||||||
|
| |||||||||
Commercial Banks 6.9% | ||||||||||
a,d,gThe Bankshares Inc. | United States | 800,000 | 2,636,792 | |||||||
Barclays PLC | United Kingdom | 277,170 | 707,186 | |||||||
fBNP Paribas SA | France | 138,020 | 5,298,860 | |||||||
a,dCapital Bank Financial Corp., A, 144A | United States | 78,494 | 1,295,151 | |||||||
a,dCapital Bank Financial Corp., B, 144A, non-voting | United States | 269,922 | 4,453,713 | |||||||
aCIT Group Inc. | United States | 81,872 | 2,917,918 | |||||||
a,dElephant Capital Holdings Ltd. | Japan | 1,903 | — | |||||||
HSBC Holdings PLC | United Kingdom | 687,585 | 6,045,122 | |||||||
KB Financial Group Inc. | South Korea | 101,400 | 3,278,362 | |||||||
a,dNCB Warrant Holdings Ltd., A | Japan | 9,306 | — | |||||||
PNC Financial Services Group Inc. | United States | 157,001 | 9,594,332 | |||||||
Wells Fargo & Co. | United States | 445,130 | 14,885,148 | |||||||
|
| |||||||||
| 51,112,584 | ||||||||||
|
| |||||||||
Communications Equipment 1.0% | ||||||||||
Cisco Systems Inc. | United States | 359,180 | 6,167,121 | |||||||
aResearch In Motion Ltd. | Canada | 156,132 | 1,153,815 | |||||||
|
| |||||||||
| 7,320,936 | ||||||||||
|
| |||||||||
Construction & Engineering 0.6% | ||||||||||
Vinci SA | France | 99,255 | 4,620,826 | |||||||
|
| |||||||||
Construction Materials 0.5% | ||||||||||
CRH PLC | Ireland | 211,723 | 4,048,824 | |||||||
|
| |||||||||
Consumer Finance 0.0%† | ||||||||||
aComdisco Holding Co. Inc. | United States | 44 | 220 | |||||||
|
| |||||||||
MGD-12
Franklin Templeton Variable Insurance Products Trust
Statement of Investments, June 30, 2012 (unaudited) (continued)
| Mutual Global Discovery Securities Fund | Country | Shares | Value | |||||||
Common Stocks and Other Equity Interests (continued) | ||||||||||
Containers & Packaging 0.9% | ||||||||||
Rexam PLC | United Kingdom | 1,039,817 | $ | 6,855,393 | ||||||
|
| |||||||||
Diversified Financial Services 3.2% | ||||||||||
Citigroup Inc. | United States | 203,910 | 5,589,173 | |||||||
Deutsche Boerse AG | Germany | 131,677 | 7,087,642 | |||||||
aING Groep NV | Netherlands | 994,910 | 6,630,726 | |||||||
JPMorgan Chase & Co. | United States | 62,020 | 2,215,974 | |||||||
NYSE Euronext | United States | 77,522 | 1,983,013 | |||||||
|
| |||||||||
| 23,506,528 | ||||||||||
|
| |||||||||
Diversified Telecommunication Services 0.7% | ||||||||||
aAboveNet Inc. | United States | 19,329 | 1,623,636 | |||||||
Cable & Wireless Communications PLC | Panama | 942,775 | 437,811 | |||||||
a,b,cGlobal Crossing Holdings Ltd., Contingent Distribution | United States | 2,236,777 | — | |||||||
a,b,cMarconi Corp., Contingent Distribution | United Kingdom | 1,739,100 | 32,386 | |||||||
Vivendi SA | France | 183,456 | 3,396,821 | |||||||
|
| |||||||||
| 5,490,654 | ||||||||||
|
| |||||||||
Electric Utilities 1.5% | ||||||||||
a,dAET&D Holdings No. 1 Pty. Ltd. | Australia | 1,361,600 | — | |||||||
Exelon Corp. | United States | 288,450 | 10,851,489 | |||||||
|
| |||||||||
| 10,851,489 | ||||||||||
|
| |||||||||
Electrical Equipment 0.3% | ||||||||||
Alstom SA | France | 82,608 | 2,606,399 | |||||||
|
| |||||||||
Electronic Equipment, Instruments & Components 0.5% | ||||||||||
Hoya Corp. | Japan | 169,554 | 3,703,098 | |||||||
|
| |||||||||
Energy Equipment & Services 2.6% | ||||||||||
Baker Hughes Inc. | United States | 156,156 | 6,418,012 | |||||||
Ensco PLC, A | United States | 95,904 | 4,504,611 | |||||||
Petroleum Geo-Services ASA | Norway | 7,349 | 89,128 | |||||||
aSBM Offshore NV | Netherlands | 325,498 | 4,484,078 | |||||||
Transocean Ltd. | United States | 73,643 | 3,294,051 | |||||||
|
| |||||||||
| �� | 18,789,880 | |||||||||
|
| |||||||||
Food & Staples Retailing 3.4% | ||||||||||
CVS Caremark Corp. | United States | 206,846 | 9,665,914 | |||||||
Koninklijke Ahold NV | Netherlands | 647,986 | 8,015,570 | |||||||
Metro AG | Germany | 126,985 | 3,697,184 | |||||||
Walgreen Co. | United States | 118,419 | 3,502,834 | |||||||
|
| |||||||||
| 24,881,502 | ||||||||||
|
| |||||||||
Food Products 1.8% | ||||||||||
aFarmer Brothers Co. | United States | 19,353 | 154,050 | |||||||
Kraft Foods Inc., A | United States | 337,176 | 13,021,737 | |||||||
|
| |||||||||
| 13,175,787 | ||||||||||
|
| |||||||||
Health Care Equipment & Supplies 2.0% | ||||||||||
aBoston Scientific Corp. | United States | 777,474 | 4,408,277 | |||||||
Medtronic Inc. | United States | 257,934 | 9,989,784 | |||||||
|
| |||||||||
| 14,398,061 | ||||||||||
|
| |||||||||
Health Care Providers & Services 1.1% | ||||||||||
Cigna Corp. | United States | 177,778 | 7,822,232 | |||||||
|
| |||||||||
MGD-13
Franklin Templeton Variable Insurance Products Trust
Statement of Investments, June 30, 2012 (unaudited) (continued)
| Mutual Global Discovery Securities Fund | Country | Shares | Value | |||||||
Common Stocks and Other Equity Interests (continued) | ||||||||||
Hotels, Restaurants & Leisure 1.6% | ||||||||||
Accor SA | France | 233,246 | $ | 7,285,440 | ||||||
Ladbrokes PLC | United Kingdom | 1,872,315 | 4,612,850 | |||||||
|
| |||||||||
| 11,898,290 | ||||||||||
|
| |||||||||
Independent Power Producers & Energy Traders 0.9% | ||||||||||
aNRG Energy Inc. | United States | 364,067 | 6,320,203 | |||||||
|
| |||||||||
Industrial Conglomerates 3.4% | ||||||||||
Jardine Matheson Holdings Ltd. | Hong Kong | 189,097 | 9,152,295 | |||||||
Jardine Strategic Holdings Ltd. | Hong Kong | 526,698 | 16,064,289 | |||||||
|
| |||||||||
| 25,216,584 | ||||||||||
|
| |||||||||
Insurance 6.1% | ||||||||||
ACE Ltd. | United States | 223,660 | 16,579,916 | |||||||
aAlleghany Corp. | United States | 2,730 | 927,517 | |||||||
aAmerican International Group Inc. | United States | 312,656 | 10,033,131 | |||||||
E-L Financial Corp. Ltd. | Canada | 5,378 | 2,192,299 | |||||||
a,dImagine Group Holdings Ltd. | Bermuda | 120,290 | 1,411,471 | |||||||
MetLife Inc. | United States | 78,866 | 2,433,016 | |||||||
a,dOlympus Re Holdings Ltd. | United States | 2,140 | — | |||||||
PartnerRe Ltd. | Bermuda | 94,940 | 7,184,110 | |||||||
Zurich Insurance Group AG | Switzerland | 17,558 | 3,950,087 | |||||||
|
| |||||||||
| 44,711,547 | ||||||||||
|
| |||||||||
Machinery 0.5% | ||||||||||
Stanley Black & Decker Inc. | United States | 58,667 | 3,775,808 | |||||||
|
| |||||||||
Marine 1.4% | ||||||||||
A.P. Moller - Maersk AS, B | Denmark | 1,565 | 10,241,331 | |||||||
|
| |||||||||
Media 4.8% | ||||||||||
CBS Corp., B | United States | 179,115 | 5,871,390 | |||||||
Comcast Corp., Special A | United States | 48,623 | 1,526,762 | |||||||
Daekyo Co. Ltd. | South Korea | 5,820 | 28,557 | |||||||
Eutelsat Communications | France | 220,746 | 6,779,062 | |||||||
News Corp., B | United States | 224,400 | 5,053,488 | |||||||
Reed Elsevier PLC | United Kingdom | 792,969 | 6,357,901 | |||||||
Time Warner Cable Inc. | United States | 66,570 | 5,465,397 | |||||||
Viacom Inc., B | United States | 92,770 | 4,362,045 | |||||||
|
| |||||||||
| 35,444,602 | ||||||||||
|
| |||||||||
Metals & Mining 0.6% | ||||||||||
ThyssenKrupp AG | Germany | 261,199 | 4,242,910 | |||||||
|
| |||||||||
Multi-Utilities 2.3% | ||||||||||
E.ON AG | Germany | 367,602 | 7,909,030 | |||||||
GDF Suez | France | 368,134 | 8,738,149 | |||||||
|
| |||||||||
| 16,647,179 | ||||||||||
|
| |||||||||
Multiline Retail 0.5% | ||||||||||
Kohl’s Corp. | United States | 79,740 | 3,627,373 | |||||||
|
| |||||||||
Office Electronics 1.3% | ||||||||||
Xerox Corp. | United States | 1,261,817 | 9,930,500 | |||||||
|
| |||||||||
Oil, Gas & Consumable Fuels 7.0% | ||||||||||
Apache Corp. | United States | 110,560 | 9,717,118 | |||||||
BP PLC | United Kingdom | 799,477 | 5,284,951 | |||||||
MGD-14
Franklin Templeton Variable Insurance Products Trust
Statement of Investments, June 30, 2012 (unaudited) (continued)
| Mutual Global Discovery Securities Fund | Country | Shares | Value | |||||||
Common Stocks and Other Equity Interests (continued) | ||||||||||
Oil, Gas & Consumable Fuels (continued) | ||||||||||
CONSOL Energy Inc. | United States | 205,976 | $ | 6,228,714 | ||||||
Marathon Oil Corp. | United States | 198,761 | 5,082,319 | |||||||
Marathon Petroleum Corp. | United States | 116,351 | 5,226,487 | |||||||
Murphy Oil Corp. | United States | 93,480 | 4,701,109 | |||||||
Royal Dutch Shell PLC, A | United Kingdom | 423,890 | 14,272,922 | |||||||
aWPX Energy Inc. | United States | 59,656 | 965,234 | |||||||
|
| |||||||||
| 51,478,854 | ||||||||||
|
| |||||||||
Personal Products 0.0%† | ||||||||||
Avon Products Inc. | United States | 10,284 | 166,704 | |||||||
|
| |||||||||
Pharmaceuticals 6.6% | ||||||||||
Eli Lilly & Co. | United States | 119,950 | 5,147,055 | |||||||
Merck & Co. Inc. | United States | 455,858 | 19,032,071 | |||||||
Novartis AG, ADR | Switzerland | 126,364 | 7,063,748 | |||||||
Pfizer Inc. | United States | 539,351 | 12,405,073 | |||||||
Teva Pharmaceutical Industries Ltd., ADR | Israel | 115,150 | 4,541,516 | |||||||
|
| |||||||||
| 48,189,463 | ||||||||||
|
| |||||||||
Real Estate Management & Development 1.0% | ||||||||||
cCanary Wharf Group PLC | United Kingdom | 487,324 | 1,765,285 | |||||||
Great Eagle Holdings Ltd. | Hong Kong | 1,012,524 | 2,589,355 | |||||||
Swire Pacific Ltd., B | Hong Kong | 1,224,472 | 2,798,351 | |||||||
Swire Properties Ltd. | Hong Kong | 171,426 | 513,741 | |||||||
|
| |||||||||
| 7,666,732 | ||||||||||
|
| |||||||||
Software 3.3% | ||||||||||
Microsoft Corp. | United States | 506,298 | 15,487,656 | |||||||
Nintendo Co. Ltd. | Japan | 29,900 | 3,457,620 | |||||||
aSymantec Corp. | United States | 347,270 | 5,073,614 | |||||||
|
| |||||||||
| 24,018,890 | ||||||||||
|
| |||||||||
Tobacco 8.6% | ||||||||||
Altria Group Inc. | United States | 278,254 | 9,613,676 | |||||||
British American Tobacco PLC | United Kingdom | 360,126 | 18,297,895 | |||||||
Imperial Tobacco Group PLC | United Kingdom | 337,446 | 12,992,644 | |||||||
Lorillard Inc. | United States | 79,726 | 10,519,846 | |||||||
Philip Morris International Inc. | United States | 83,471 | 7,283,679 | |||||||
Reynolds American Inc. | United States | 101,494 | 4,554,036 | |||||||
|
| |||||||||
| 63,261,776 | ||||||||||
|
| |||||||||
Wireless Telecommunication Services 2.3% | ||||||||||
Vodafone Group PLC | United Kingdom | 6,057,446 | 17,011,728 | |||||||
|
| |||||||||
Total Common Stocks and Other Equity Interests | 637,490,310 | |||||||||
|
| |||||||||
Preferred Stocks 1.2% | ||||||||||
Automobiles 0.5% | ||||||||||
Volkswagen AG, pfd. | Germany | 23,398 | 3,689,718 | |||||||
|
| |||||||||
Diversified Financial Services 0.7% | ||||||||||
a,dHightower Holding LLC, pfd., A, Series 2 | United States | 2,172,000 | 4,880,202 | |||||||
|
| |||||||||
Total Preferred Stocks (Cost $7,412,251) | 8,569,920 | |||||||||
|
| |||||||||
MGD-15
Franklin Templeton Variable Insurance Products Trust
Statement of Investments, June 30, 2012 (unaudited) (continued)
| Mutual Global Discovery Securities Fund | Country | Principal Amount* | Value | |||||||||
Corporate Bonds, Notes and Senior Floating Rate Interests 4.7% | ||||||||||||
Clear Channel Communications Inc., | ||||||||||||
h,iDelayed Draw 2 Term Loan, 3.895%, 1/29/16 | United States | 1,485,257 | $ | 1,143,648 | ||||||||
jsenior note, PIK, 11.00%, 8/01/16 | United States | 2,001,000 | 1,250,625 | |||||||||
h,iTranche B Term Loan, 3.895%, 1/29/16 | United States | 8,729,455 | 6,965,835 | |||||||||
h,iTranche C Term Loan, 3.895%, 1/29/16 | United States | 1,774,088 | 1,375,287 | |||||||||
kEnergy Future Intermediate Holding Co. LLC/Finance Inc., secured note, 144A, 11.75%, 3/01/22 | United States | 1,403,000 | 1,445,090 | |||||||||
hHilton Worldwide Inc., FRN, | ||||||||||||
Mezzanine D Loan, 3.492%, 11/12/15 | United States | 252,414 | 227,172 | |||||||||
Mezzanine E Loan, 3.742%, 11/12/15 | United States | 323,946 | 285,073 | |||||||||
Mezzanine F Loan, 3.992%, 11/12/15 | United States | 808,866 | 713,825 | |||||||||
Mezzanine G Loan, 4.242%, 11/12/15 | United States | 1,456,759 | 1,260,097 | |||||||||
h,iiStar Financial Inc., | ||||||||||||
New Tranche A-1 Term Loan, 5.25%, 3/19/16 | United States | 132,244 | 131,803 | |||||||||
New Tranche A-2 Term Loan, 7.00%, 3/19/17 | United States | 495,000 | 496,237 | |||||||||
NRG Energy Inc., senior note, 7.375%, 1/15/17 | United States | 810,000 | 844,425 | |||||||||
Realogy Corp., | ||||||||||||
h,iExtended First Lien Term Loan, 4.491%, 10/10/16 | United States | 5,315,596 | 5,033,205 | |||||||||
h,iExtended Synthetic Letter of Credit, 4.496%, 10/10/16 | United States | 331,081 | 313,492 | |||||||||
f,ksenior secured note, 144A, 7.875%, 2/15/19 | United States | 411,000 | 403,807 | |||||||||
ksenior secured note, 144A, 9.00%, 1/15/20 | United States | 365,000 | 377,775 | |||||||||
h,iTexas Competitive Electric Holdings Co. LLC, Extended Term Loan, 4.741%, 10/10/17 | United States | 12,912,264 | 7,746,119 | |||||||||
Texas Competitive Electric Holdings Co. LLC/Texas Competitive Electric Holdings Finance Inc., | ||||||||||||
senior note, A, 10.25%, 11/01/15 | United States | 1,428,000 | 374,850 | |||||||||
ksenior secured note, 144A, 11.50%, 10/01/20 | United States | 5,895,000 | 4,052,812 | |||||||||
|
| |||||||||||
Total Corporate Bonds, Notes and Senior Floating Rate Interests (Cost $40,527,438) | 34,441,177 | |||||||||||
|
| |||||||||||
Corporate Notes and Senior Floating Rate Interests in Reorganization 1.0% | ||||||||||||
d,lBroadband Ventures III LLC, secured promissory note, 5.00%, 2/01/12 | United States | 722 | — | |||||||||
lNewPage Corp., senior secured note, 11.375%, 12/31/14 | United States | 4,854,000 | 3,179,370 | |||||||||
h,i,lTribune Co., | ||||||||||||
Incremental Term Loan, 7.25%, 8/04/14 | United States | 761,000 | 497,979 | |||||||||
mInitial Tranche B Term Loan, 5.25%, 8/04/14 | United States | 5,361,000 | 3,584,542 | |||||||||
|
| |||||||||||
Total Corporate Notes and Senior Floating Rate Interests in Reorganization (Cost $8,900,834) | 7,261,891 | |||||||||||
|
| |||||||||||
| Shares | ||||||||||||
Companies in Liquidation 0.0%† | ||||||||||||
aAdelphia Recovery Trust | United States | 5,379,562 | 5,380 | |||||||||
a,bAdelphia Recovery Trust, Arahova Contingent Value Vehicle, Contingent Distribution | United States | 386,774 | 7,735 | |||||||||
a,b,cCentury Communications Corp., Contingent Distribution | United States | 1,074,000 | — | |||||||||
a,dFIM Coinvestor Holdings I, LLC | United States | 2,077,368 | — | |||||||||
|
| |||||||||||
Total Companies in Liquidation (Cost $481,248) | 13,115 | |||||||||||
|
| |||||||||||
Total Investments before Short Term Investments | 687,776,413 | |||||||||||
|
| |||||||||||
MGD-16
Franklin Templeton Variable Insurance Products Trust
Statement of Investments, June 30, 2012 (unaudited) (continued)
| Mutual Global Discovery Securities Fund | Country | Principal Amount* | Value | |||||||
Short Term Investments 6.7% | ||||||||||
Convertible Notes (Cost $2,757,068) 0.4% | ||||||||||
hiStar Financial Inc., cvt., senior note, FRN, 0.968%, 10/01/12 | United States | 2,829,000 | $ | 2,828,717 | ||||||
|
| |||||||||
U.S. Government and Agency Securities 4.7% | ||||||||||
nFHLB, 7/02/12 | United States | 15,000,000 | 15,000,000 | |||||||
n,oU.S. Treasury Bills, 9/20/12 - 12/27/12 | United States | 20,000,000 | 19,989,901 | |||||||
|
| |||||||||
Total U.S. Government and Agency Securities (Cost $34,989,222) | 34,989,901 | |||||||||
|
| |||||||||
Total Investments before Money Market Funds | 725,595,031 | |||||||||
|
| |||||||||
| Shares | ||||||||||
pInvestments from Cash Collateral Received for Loaned Securities (Cost $11,968,206) 1.6% | ||||||||||
Money Market Funds 1.6% | ||||||||||
qBNY Mellon Overnight Government Fund, 0.182% | 11,968,206 | 11,968,206 | ||||||||
|
| |||||||||
Total Investments (Cost $692,738,317) 100.3% | 737,563,237 | |||||||||
Other Assets, less Liabilities (0.3)% | (2,492,024 | ) | ||||||||
|
| |||||||||
Net Assets 100.0% | $ | 735,071,213 | ||||||||
|
| |||||||||
†Rounds to less than 0.1% of net assets.
*The principal amount is stated in U.S. dollars unless otherwise indicated.
aNon-income producing.
bContingent distributions represent the right to receive additional distributions, if any, during the reorganization of the underlying company. Shares represent total underlying principal of debt securities.
cSecurity has been deemed illiquid because it may not be able to be sold within seven days. At June 30, 2012, the aggregate value of these securities was $1,798,196, representing 0.24% of net assets.
dSee Note 9 regarding restricted securities.
eAt June 30, 2012, pursuant to the Fund’s policies and the requirements of applicable securities law, the Fund may be restricted from trading this security for a limited or extended period of time due to ownership limits and/or potential possession of material non-public information.
fA portion or all of the security is on loan at June 30, 2012. See Note 1(g).
gSee Note 11 regarding holdings of 5% voting securities.
hThe coupon rate shown represents the rate at period end.
iSee Note 1(h) regarding senior floating rate interests.
jIncome may be received in additional securities and/or cash.
kSecurity was purchased pursuant to Rule 144A under the Securities Act of 1933 and may be sold in transactions exempt from registration only to qualified institutional buyers or in a public offering registered under the Securities Act of 1933. These securities have been deemed liquid under guidelines approved by the Trust’s Board of Trustees. At June 30, 2012, the aggregate value of these securities was $6,279,484, representing 0.85% of net assets.
lSee Note 7 regarding credit risk and defaulted securities.
mA portion or all of the security purchased on a delayed delivery basis. See Note 1(c).
nThe security is traded on a discount basis with no stated coupon rate.
oSecurity or a portion of the security has been pledged as collateral for open futures contracts. At June 30, 2012, the value of this security pledged as collateral was $1,056,730, representing 0.14% of net assets.
pSee Note 1(g) regarding securities on loan.
qThe rate shown is the annualized seven-day yield at period end.
MGD-17
Franklin Templeton Variable Insurance Products Trust
Statement of Investments, June 30, 2012 (unaudited) (continued)
| Mutual Global Discovery Securities Fund |
At June 30, 2012, the Fund had the following futures contracts outstanding. See Note 1(d).
Futures Contracts
| Description | Type | Number of Contracts | Notional Value | Expiration Date | Unrealized Appreciation | Unrealized Depreciation | ||||||||||||||||||
Currency Contracts | ||||||||||||||||||||||||
EUR/USD | Short | 215 | $ | 34,045,250 | 9/17/12 | $ | — | $ | (364,078 | ) | ||||||||||||||
GBP/USD | Short | 129 | 12,639,581 | 9/17/12 | — | (122,600 | ) | |||||||||||||||||
|
| |||||||||||||||||||||||
Net unrealized appreciation (depreciation) | $ | (486,678 | ) | |||||||||||||||||||||
|
| |||||||||||||||||||||||
At June 30, 2012, the Fund had the following forward exchange contracts outstanding. See Note 1(d).
Forward Exchange Contracts
| Currency | Counterparty | Type | Quantity | Contract Amount | Settlement Date | Unrealized Appreciation | Unrealized Depreciation | |||||||||||||||||||||
Euro | DBAB | Buy | 4,478,513 | $ | 5,540,149 | 7/17/12 | $ | 128,698 | $ | — | ||||||||||||||||||
Euro | BZWS | Buy | 91,397 | 113,222 | 7/17/12 | 2,468 | — | |||||||||||||||||||||
Euro | HSBC | Buy | 2,549,025 | 3,156,710 | 7/17/12 | 69,814 | — | |||||||||||||||||||||
Euro | FBCO | Buy | 1,055,303 | 1,316,912 | 7/17/12 | 18,877 | — | |||||||||||||||||||||
Euro | HSBC | Sell | 6,491,546 | 8,272,010 | 7/17/12 | 55,090 | — | |||||||||||||||||||||
Euro | DBAB | Sell | 7,719,231 | 10,195,993 | 7/17/12 | 425,085 | — | |||||||||||||||||||||
Euro | BZWS | Sell | 3,725,586 | 4,909,864 | 7/17/12 | 194,063 | — | |||||||||||||||||||||
Euro | BOFA | Sell | 878,467 | 1,159,902 | 7/17/12 | 47,949 | — | |||||||||||||||||||||
Euro | HAND | Sell | 503,368 | 667,909 | 7/17/12 | 30,752 | — | |||||||||||||||||||||
Euro | SSBT | Sell | 155,008 | 206,415 | 7/17/12 | 10,208 | — | |||||||||||||||||||||
British Pound | BZWS | Sell | 6,596,096 | 10,314,316 | 7/19/12 | — | (19,612 | ) | ||||||||||||||||||||
British Pound | DBAB | Sell | 6,338,544 | 9,910,947 | 7/19/12 | — | (19,480 | ) | ||||||||||||||||||||
British Pound | DBAB | Buy | 130,000 | 207,672 | 7/19/12 | — | (4,005 | ) | ||||||||||||||||||||
British Pound | FBCO | Sell | 294,891 | 462,725 | 7/19/12 | 724 | — | |||||||||||||||||||||
Swiss Franc | BZWS | Buy | 3,012,319 | 3,317,642 | 8/10/12 | — | (140,088 | ) | ||||||||||||||||||||
Swiss Franc | DBAB | Buy | 2,599,215 | 2,870,138 | 8/10/12 | — | (128,348 | ) | ||||||||||||||||||||
Swiss Franc | BOFA | Buy | 1,632,757 | 1,794,126 | 8/10/12 | — | (71,808 | ) | ||||||||||||||||||||
Swiss Franc | HSBC | Buy | 1,360,096 | 1,486,566 | 8/10/12 | — | (51,864 | ) | ||||||||||||||||||||
Swiss Franc | SSBT | Buy | 214,000 | 233,579 | 8/10/12 | — | (7,840 | ) | ||||||||||||||||||||
Swiss Franc | DBAB | Sell | 95,941 | 100,790 | 8/10/12 | — | (414 | ) | ||||||||||||||||||||
Swiss Franc | DBAB | Buy | 126,135 | 130,866 | 8/10/12 | 2,188 | — | |||||||||||||||||||||
Swiss Franc | BOFA | Buy | 81,710 | 84,616 | 8/10/12 | 1,576 | — | |||||||||||||||||||||
Swiss Franc | FBCO | Buy | 74,969 | 77,879 | 8/10/12 | 1,203 | — | |||||||||||||||||||||
Swiss Franc | BOFA | Sell | 7,286,591 | 7,989,440 | 8/10/12 | 303,157 | — | |||||||||||||||||||||
Swiss Franc | DBAB | Sell | 7,487,867 | 8,217,183 | 8/10/12 | 318,582 | — | |||||||||||||||||||||
Swiss Franc | BZWS | Sell | 335,893 | 368,583 | 8/10/12 | 14,265 | — | |||||||||||||||||||||
British Pound | DBAB | Buy | 1,196,901 | 1,898,579 | 8/16/12 | — | (23,572 | ) | ||||||||||||||||||||
British Pound | BZWS | Buy | 625,527 | 987,062 | 8/16/12 | — | (7,142 | ) | ||||||||||||||||||||
British Pound | HSBC | Sell | 534,444 | 831,866 | 8/16/12 | — | (5,368 | ) | ||||||||||||||||||||
British Pound | BZWS | Sell | 149,825 | 233,111 | 8/16/12 | — | (1,597 | ) | ||||||||||||||||||||
British Pound | FBCO | Sell | 370,000 | 578,095 | 8/16/12 | — | (1,528 | ) | ||||||||||||||||||||
British Pound | DBAB | Buy | 331,223 | 513,400 | 8/16/12 | 5,478 | — | |||||||||||||||||||||
British Pound | BZWS | Sell | 6,336,893 | 10,100,408 | 8/16/12 | 173,345 | — | |||||||||||||||||||||
British Pound | DBAB | Sell | 7,140,629 | 11,392,081 | 8/16/12 | 205,925 | — | |||||||||||||||||||||
British Pound | HAND | Sell | 179,049 | 281,509 | 8/16/12 | 1,019 | — | |||||||||||||||||||||
British Pound | HSBC | Sell | 179,049 | 281,902 | 8/16/12 | 1,413 | — | |||||||||||||||||||||
Euro | DBAB | Buy | 614,947 | 806,646 | 8/31/12 | — | (27,893 | ) | ||||||||||||||||||||
Euro | BZWS | Sell | 11,774,495 | 15,765,036 | 8/31/12 | 854,105 | — | |||||||||||||||||||||
Euro | DBAB | Sell | 603,543 | 792,362 | 8/31/12 | 28,050 | — | |||||||||||||||||||||
Euro | BOFA | Sell | 11,032,225 | 14,491,572 | 8/31/12 | 520,633 | — | |||||||||||||||||||||
MGD-18
Franklin Templeton Variable Insurance Products Trust
Statement of Investments, June 30, 2012 (unaudited) (continued)
| Mutual Global Discovery Securities Fund |
Forward Exchange Contracts (continued)
| Currency | Counterparty | Type | Quantity | Contract Amount | Settlement Date | Unrealized Appreciation | Unrealized Depreciation | |||||||||||||||||||||
Euro | HSBC | Sell | 457,615 | $ | 600,569 | 8/31/12 | $ | 21,057 | $ | — | ||||||||||||||||||
Euro | BZWS | Sell | 6,049,944 | 7,982,750 | 10/16/12 | 317,077 | — | |||||||||||||||||||||
Euro | BOFA | Sell | 5,681,718 | 7,494,527 | 10/16/12 | 295,420 | — | |||||||||||||||||||||
Euro | DBAB | Sell | 1,396,475 | 1,843,604 | 10/16/12 | 74,179 | — | |||||||||||||||||||||
Japanese Yen | HSBC | Sell | 271,426,158 | 3,346,808 | 10/22/12 | — | (52,218 | ) | ||||||||||||||||||||
Japanese Yen | DBAB | Buy | 14,320,700 | 180,640 | 10/22/12 | — | (1,304 | ) | ||||||||||||||||||||
Japanese Yen | HSBC | Buy | 6,615,500 | 81,625 | 10/22/12 | 1,219 | — | |||||||||||||||||||||
Japanese Yen | DBAB | Buy | 16,678,718 | 207,894 | 10/22/12 | 971 | — | |||||||||||||||||||||
Japanese Yen | DBAB | Sell | 120,314,643 | 1,509,134 | 10/22/12 | 2,453 | — | |||||||||||||||||||||
Japanese Yen | HSBC | Sell | 3,040,000 | 38,138 | 10/22/12 | 71 | — | |||||||||||||||||||||
British Pound | HSBC | Buy | 68,479 | 106,146 | 11/21/12 | 1,097 | — | |||||||||||||||||||||
British Pound | BZWS | Buy | 281,621 | 436,749 | 11/21/12 | 4,289 | — | |||||||||||||||||||||
British Pound | DBAB | Buy | 1,561,907 | 2,399,318 | 11/21/12 | 46,735 | — | |||||||||||||||||||||
British Pound | HSBC | Sell | 3,440,676 | 5,444,285 | 11/21/12 | 55,951 | — | |||||||||||||||||||||
British Pound | BZWS | Sell | 6,249,284 | 9,886,367 | 11/21/12 | 99,562 | — | |||||||||||||||||||||
British Pound | BOFA | Sell | 3,124,642 | 4,944,215 | 11/21/12 | 50,812 | — | |||||||||||||||||||||
British Pound | HAND | Sell | 241,944 | 379,632 | 11/21/12 | 728 | — | |||||||||||||||||||||
Euro | BZWS | Sell | 7,099,580 | 8,919,202 | 11/30/12 | — | (81,892 | ) | ||||||||||||||||||||
Euro | DBAB | Sell | 6,678,342 | 8,394,009 | 11/30/12 | — | (73,026 | ) | ||||||||||||||||||||
Euro | HSBC | Sell | 2,389,518 | 3,019,789 | 11/30/12 | — | (9,680 | ) | ||||||||||||||||||||
Euro | HAND | Sell | 1,176,899 | 1,486,165 | 11/30/12 | — | (5,901 | ) | ||||||||||||||||||||
Euro | FBCO | Sell | 879,470 | 1,114,394 | 11/30/12 | — | (584 | ) | ||||||||||||||||||||
Euro | DBAB | Sell | 732,110 | 929,290 | 11/30/12 | 1,106 | — | |||||||||||||||||||||
Euro | BOFA | Sell | 219,868 | 279,240 | 11/30/12 | 496 | — | |||||||||||||||||||||
Euro | BZWS | Sell | 219,868 | 279,019 | 11/30/12 | 274 | — | |||||||||||||||||||||
Euro | SCBT | Sell | 234,901 | 298,352 | 11/30/12 | 547 | — | |||||||||||||||||||||
Canadian Dollar | DBAB | Sell | 1,935,100 | 1,881,972 | 12/17/12 | — | (11,721 | ) | ||||||||||||||||||||
Canadian Dollar | HAND | Sell | 45,609 | 44,573 | 12/17/12 | — | (63 | ) | ||||||||||||||||||||
|
| |||||||||||||||||||||||||||
Unrealized appreciation (depreciation) |
| 4,388,711 | (746,948 | ) | ||||||||||||||||||||||||
|
| |||||||||||||||||||||||||||
Net unrealized appreciation (depreciation) |
| $ | 3,641,763 | |||||||||||||||||||||||||
|
| |||||||||||||||||||||||||||
See Abbreviations on page MGD-36.
The accompanying notes are an integral part of these financial statements.
MGD-19
Franklin Templeton Variable Insurance Products Trust
Financial Statements
Statement of Assets and Liabilities
June 30, 2012 (unaudited)
| Mutual Global Discovery Securities Fund | ||||
Assets: | ||||
Investments in securities: | ||||
Cost - Unaffiliated issuers | $ | 684,738,317 | ||
Cost - Non-controlled affiliated issuers (Note 11) | 8,000,000 | |||
|
| |||
Total cost of investments | $ | 692,738,317 | ||
|
| |||
Value - Unaffiliated issuers | $ | 734,926,445 | ||
Value - Non-controlled affiliated issuers (Note 11) | 2,636,792 | |||
|
| |||
Total value of investments (includes securities loaned in the amount of $12,321,692) | 737,563,237 | |||
Cash | 65,469 | |||
Restricted cash (Note 1e) | 1,460,000 | |||
Foreign currency, at value (cost $1,782,289) | 1,785,287 | |||
Receivables: | ||||
Investment securities sold | 4,768,097 | |||
Capital shares sold | 50,420 | |||
Dividends and interest | 3,578,052 | |||
Unrealized appreciation on forward exchange contracts | 4,388,711 | |||
Other assets | 386 | |||
|
| |||
Total assets | 753,659,659 | |||
|
| |||
Liabilities: | ||||
Payables: | ||||
Investment securities purchased | 1,124,978 | |||
Capital shares redeemed | 1,259,842 | |||
Affiliates | 873,746 | |||
Variation margin | 771,850 | |||
Payable upon return of securities loaned | 11,968,206 | |||
Due to brokers | 1,460,000 | |||
Unrealized depreciation on forward exchange contracts | 746,948 | |||
Accrued expenses and other liabilities | 382,876 | |||
|
| |||
Total liabilities | 18,588,446 | |||
|
| |||
Net assets, at value | $ | 735,071,213 | ||
|
| |||
Net assets consist of: | ||||
Paid-in capital | $ | 578,543,327 | ||
Undistributed net investment income | 28,476,461 | |||
Net unrealized appreciation (depreciation) | 48,014,334 | |||
Accumulated net realized gain (loss) | 80,037,091 | |||
|
| |||
Net assets, at value | $ | 735,071,213 | ||
|
| |||
The accompanying notes are an integral part of these financial statements.
MGD-20
Franklin Templeton Variable Insurance Products Trust
Financial Statements (continued)
Statement of Assets and Liabilities (continued)
June 30, 2012 (unaudited)
| Mutual Global Discovery Securities Fund | ||||
Class 1: | ||||
Net assets, at value | $ | 1,021,152 | ||
|
| |||
Shares outstanding | 49,285 | |||
|
| |||
Net asset value and maximum offering price per share | $ | 20.72 | ||
|
| |||
Class 2: | ||||
Net assets, at value | $ | 668,575,074 | ||
|
| |||
Shares outstanding | 32,913,337 | |||
|
| |||
Net asset value and maximum offering price per share | $ | 20.31 | ||
|
| |||
Class 4: | ||||
Net assets, at value | $ | 65,474,987 | ||
|
| |||
Shares outstanding | 3,191,241 | |||
|
| |||
Net asset value and maximum offering price per share | $ | 20.52 | ||
|
| |||
The accompanying notes are an integral part of these financial statements.
MGD-21
Franklin Templeton Variable Insurance Products Trust
Financial Statements (continued)
Statement of Operations
for the six months ended June 30, 2012 (unaudited)
| Mutual Global Discovery Securities Fund | ||||
Investment income: | ||||
Dividends (net of foreign taxes of $792,472) | $ | 11,592,927 | ||
Interest | 2,082,909 | |||
Income from securities loaned | 369,222 | |||
|
| |||
Total investment income | 14,045,058 | |||
|
| |||
Expenses: | ||||
Management fees (Note 3a) | 3,096,673 | |||
Administrative fees (Note 3b) | 523,833 | |||
Distribution fees: (Note 3c) | ||||
Class 2 | 879,563 | |||
Class 4 | 117,563 | |||
Unaffiliated transfer agent fees | 991 | |||
Custodian fees (Note 4) | 38,094 | |||
Reports to shareholders | 150,073 | |||
Professional fees | 51,690 | |||
Trustees’ fees and expenses | 2,584 | |||
Other | 25,134 | |||
|
| |||
Total expenses | 4,886,198 | |||
|
| |||
Net investment income | 9,158,860 | |||
|
| |||
Realized and unrealized gains (losses): | ||||
Net realized gain (loss) from: | ||||
Investments | 48,426,709 | |||
Written options | 60,098 | |||
Foreign currency transactions | 11,170,419 | |||
Futures contracts | 1,281,349 | |||
Securities sold short | (1,024,968 | ) | ||
|
| |||
Net realized gain (loss) | 59,913,607 | |||
|
| |||
Net change in unrealized appreciation (depreciation) on: | ||||
Investments | (18,706,509 | ) | ||
Translation of other assets and liabilities denominated in foreign currencies | (10,004,891 | ) | ||
|
| |||
Net change in unrealized appreciation (depreciation) | (28,711,400 | ) | ||
|
| |||
Net realized and unrealized gain (loss) | 31,202,207 | |||
|
| |||
Net increase (decrease) in net assets resulting from operations | $ | 40,361,067 | ||
|
| |||
The accompanying notes are an integral part of these financial statements.
MGD-22
Franklin Templeton Variable Insurance Products Trust
Financial Statements (continued)
Statements of Changes in Net Assets
| Mutual Global Discovery Securities Fund | ||||||||
| Six Months Ended June 30, 2012 (unaudited) | Year Ended December 31, 2011 | |||||||
| ||||||||
Increase (decrease) in net assets: | ||||||||
Operations: | ||||||||
Net investment income | $ | 9,158,860 | $ | 26,618,951 | ||||
Net realized gain (loss) from investments, written options, foreign currency transactions, futures contracts and securities sold short | 59,913,607 | 68,619,465 | ||||||
Net change in unrealized appreciation (depreciation) on investments and translation of other assets and liabilities denominated in foreign currencies and deferred taxes | (28,711,400 | ) | (151,927,152 | ) | ||||
| ||||||||
Net increase (decrease) in net assets resulting from operations | 40,361,067 | (56,688,736 | ) | |||||
| ||||||||
Distributions to shareholders from: | ||||||||
Net investment income: | ||||||||
Class 1 | — | (1,808,753 | ) | |||||
Class 2 | — | (27,559,671 | ) | |||||
Class 4 | — | (1,533,102 | ) | |||||
Net realized gains: | ||||||||
Class 1 | — | (1,558,774 | ) | |||||
Class 2 | — | (25,603,997 | ) | |||||
Class 4 | — | (1,468,422 | ) | |||||
| ||||||||
Total distributions to shareholders | — | (59,532,719 | ) | |||||
| ||||||||
Capital share transactions: (Note 2) | ||||||||
Class 1 | (7,492 | ) | (75,411,767 | ) | ||||
Class 2 | (80,480,821 | ) | (536,023,097 | ) | ||||
Class 4 | (4,630,812 | ) | 1,436,142 | |||||
| ||||||||
Total capital share transactions | (85,119,125 | ) | (609,998,722 | ) | ||||
| ||||||||
Net increase (decrease) in net assets | (44,758,058 | ) | (726,220,177 | ) | ||||
Net assets: | ||||||||
Beginning of period | 779,829,271 | 1,506,049,448 | ||||||
| ||||||||
End of period | $ | 735,071,213 | $ | 779,829,271 | ||||
| ||||||||
Undistributed net investment income included in net assets: | ||||||||
End of period | $ | 28,476,461 | $ | 19,317,601 | ||||
| ||||||||
The accompanying notes are an integral part of these financial statements.
MGD-23
Franklin Templeton Variable Insurance Products Trust
Notes to Financial Statements (unaudited)
Mutual Global Discovery Securities Fund
1. ORGANIZATION AND SIGNIFICANT ACCOUNTING POLICIES
Franklin Templeton Variable Insurance Products Trust (Trust) is registered under the Investment Company Act of 1940, as amended, (1940 Act) as an open-end investment company, consisting of twenty separate funds. The Mutual Global Discovery Securities Fund (Fund) is included in this report. The financial statements of the remaining funds in the Trust are presented separately. Shares of the Fund are generally sold only to insurance company separate accounts to fund the benefits of variable life insurance policies or variable annuity contracts. At June 30, 2012, 84.96% of the Fund’s shares were held through one insurance company. The Fund offers three classes of shares: Class 1, Class 2, and Class 4. Each class of shares differs by its distribution fees, voting rights on matters affecting a single class and its exchange privilege.
The following summarizes the Fund’s significant accounting policies.
a. Financial Instrument Valuation
The Fund’s investments in financial instruments are carried at fair value daily. Fair value is the price that would be received to sell an asset or paid to transfer a liability in an orderly transaction between market participants on the measurement date. Under procedures approved by the Trust’s Board of Trustees (the Board), the Fund’s administrator, investment manager and other affiliates have formed the Valuation and Liquidity Oversight Committee (VLOC). The VLOC provides administration and oversight of the Fund’s valuation policies and procedures, which are approved annually by the Board. Among other things, these procedures allow the Fund to utilize independent pricing services, quotations from securities and financial instrument dealers, and other market sources to determine fair value.
Equity securities and derivative financial instruments (derivatives) listed on an exchange or on the NASDAQ National Market System are valued at the last quoted sale price or the official closing price of the day, respectively. Foreign equity securities are valued as of the close of trading on the foreign stock exchange on which the security is primarily traded, or the NYSE, whichever is earlier. The value is then converted into its U.S. dollar equivalent at the foreign exchange rate in effect at the close of the NYSE on the day that the value of the security is determined. Over-the-counter (OTC) securities are valued within the range of the most recent quoted bid and ask prices. Securities that trade in multiple markets or on multiple exchanges are valued according to the broadest and most representative market. Certain equity securities are valued based upon fundamental characteristics or relationships to similar securities. Investments in non-registered money market funds are valued at the closing net asset value.
Debt securities generally trade in the OTC market rather than on a securities exchange. The Fund’s pricing services use multiple valuation techniques to determine fair value. In instances where sufficient market activity exists, the pricing services may utilize a market-based approach through which quotes from market makers are used to determine fair value. In instances where sufficient market activity may not exist or is limited, the pricing services also utilize proprietary valuation models which may consider market characteristics such as benchmark yield curves, credit spreads, estimated default rates, anticipated market interest rate volatility, coupon rates, anticipated timing of principal repayments, underlying collateral, and other unique security features in order to estimate the relevant cash flows, which are then discounted to calculate the fair value. Securities denominated in a foreign currency are converted into their U.S. dollar equivalent at the foreign exchange rate in effect at the close of the NYSE on the date that the values of the foreign debt securities are determined.
Certain derivatives trade in the OTC market. The Fund’s pricing services use various techniques including industry standard option pricing models and proprietary discounted cash flow models to determine the fair value of those instruments. The Fund’s net benefit or obligation under the derivative contract, as measured by the fair market value of the contract, is included in net assets.
The Fund has procedures to determine the fair value of financial instruments for which market prices are not reliable or readily available. Under these procedures, the VLOC convenes on a regular basis to review such financial instruments and considers a number of factors, including significant unobservable valuation inputs, when arriving at fair value. The VLOC primarily employs a market-based approach which may use related or comparable assets or liabilities, recent transactions, market multiples, book
MGD-24
Franklin Templeton Variable Insurance Products Trust
Notes to Financial Statements (unaudited) (continued)
Mutual Global Discovery Securities Fund
1. ORGANIZATION AND SIGNIFICANT ACCOUNTING POLICIES (continued)
a. Financial Instrument Valuation (continued)
values, and other relevant information for the investment to determine the fair value of the investment. An income-based valuation approach may also be used in which the anticipated future cash flows of the investment are discounted to calculate fair value. Discounts may also be applied due to the nature or duration of any restrictions on the disposition of the investments. Due to the inherent uncertainty of valuations of such investments, the fair values may differ significantly from the values that would have been used had an active market existed. The VLOC employs various methods for calibrating these valuation approaches including a regular review of key inputs and assumptions, transactional back-testing or disposition analysis, and reviews of any related market activity.
Trading in securities on foreign securities stock exchanges and OTC markets may be completed before the daily close of business on the NYSE. Occasionally, events occur between the time at which trading in a foreign security is completed and the close of the NYSE that might call into question the reliability of the value of a portfolio security held by the Fund. As a result, differences may arise between the value of the Fund’s portfolio securities as determined at the foreign market close and the latest indications of value at the close of the NYSE. In order to minimize the potential for these differences, the VLOC monitors price movements following the close of trading in foreign stock markets through a series of country specific market proxies (such as baskets of American Depositary Receipts, futures contracts and exchange traded funds). These price movements are measured against established trigger thresholds for each specific market proxy to assist in determining if an event has occurred that may call into question the reliability of the values of the foreign securities held by the Fund. If such an event occurs, the securities may be valued using fair value procedures, which may include the use of independent pricing services.
b. Foreign Currency Translation
Portfolio securities and other assets and liabilities denominated in foreign currencies are translated into U.S. dollars based on the exchange rate of such currencies against U.S. dollars on the date of valuation. The Fund may enter into foreign currency exchange contracts to facilitate transactions denominated in a foreign currency. Purchases and sales of securities, income and expense items denominated in foreign currencies are translated into U.S. dollars at the exchange rate in effect on the transaction date. Portfolio securities and assets and liabilities denominated in foreign currencies contain risks that those currencies will decline in value relative to the U.S. dollar. Occasionally, events may impact the availability or reliability of foreign exchange rates used to convert the U.S. dollar equivalent value. If such an event occurs, the foreign exchange rate will be valued at fair value using procedures established and approved by the Board.
The Fund does not separately report the effect of changes in foreign exchange rates from changes in market prices on securities held. Such changes are included in net realized and unrealized gain or loss from investments on the Statement of Operations.
Realized foreign exchange gains or losses arise from sales of foreign currencies, currency gains or losses realized between the trade and settlement dates on securities transactions and the difference between the recorded amounts of dividends, interest, and foreign withholding taxes and the U.S. dollar equivalent of the amounts actually received or paid. Net unrealized foreign exchange gains and losses arise from changes in foreign exchange rates on foreign denominated assets and liabilities other than investments in securities held at the end of the reporting period.
c. Securities Purchased on a Delayed Delivery Basis
The Fund purchases securities on a delayed delivery basis, with payment and delivery scheduled for a future date. These transactions are subject to market fluctuations and are subject to the risk that the value at delivery may be more or less than the trade date purchase price. Although the Fund will generally purchase these securities with the intention of holding the securities, it may sell the securities before the settlement date. Sufficient assets have been segregated for these securities.
MGD-25
Franklin Templeton Variable Insurance Products Trust
Notes to Financial Statements (unaudited) (continued)
Mutual Global Discovery Securities Fund
1. ORGANIZATION AND SIGNIFICANT ACCOUNTING POLICIES (continued)
d. Derivative Financial Instruments
The Fund invested in derivatives in order to manage risk or gain exposure to various other investments or markets. Derivatives are financial contracts based on an underlying or notional amount, require no initial investment or an initial net investment that is smaller than would normally be required to have a similar response to changes in market factors, and require or permit net settlement. Derivatives contain various risks including the potential inability of the counterparty to fulfill their obligations under the terms of the contract, the potential for an illiquid secondary market, and/or the potential for market movements which expose the Fund to gains or losses in excess of the amounts shown on the Statement of Assets and Liabilities. Realized gain and loss and unrealized appreciation and depreciation on these contracts for the period are included in the Statement of Operations.
The Fund entered into exchange traded futures contracts primarily to manage exposure to certain foreign currencies. A futures contract is an agreement between the Fund and a counterparty to buy or sell an asset for a specified price on a future date. Required initial margin deposits of cash or securities are pledged by the Fund. Subsequent payments, known as variation margin, are made or received by the Fund, depending on fluctuations in the value of the underlying security. Such variation margin is accounted for as unrealized appreciation or depreciation until the contract is closed, at which time the gains or losses are realized.
The Fund entered into OTC forward exchange contracts primarily to manage exposure to certain foreign currencies. A forward exchange contract is an agreement between the Fund and a counterparty to buy or sell a foreign currency for a specific exchange rate on a future date. Pursuant to the terms of the forward exchange contracts, cash or securities may be required to be deposited as collateral. Unrestricted cash may be invested according to the Fund’s investment objectives.
The Fund purchased or wrote exchange traded option contracts primarily to manage exposure to equity price risk. An option is a contract entitling the holder to purchase or sell a specific amount of shares or units of an asset or notional amount of a swap (swaption), at a specified price. Options purchased are recorded as an asset while options written are recorded as a liability. Upon exercise of an option, the acquisition cost or sales proceeds of the underlying investment is adjusted by any premium received or paid. Upon expiration of an option, any premium received or paid is recorded as a realized gain or loss. Upon closing an option other than through expiration or exercise, the difference between the premium and the cost to close the position is recorded as a realized gain or loss. Pursuant to the terms of the written option contract, cash or securities may be required to be deposited as collateral.
The Fund’s investments in OTC derivatives are subject to the terms of International Swaps and Derivatives Association Master Agreements and other related agreements between the Fund and certain derivative counterparties. These agreements contain various provisions, including but not limited to collateral requirements, events of default, requirements for the Fund to maintain certain net asset levels and/or limit the decline in net assets over various periods of time. Should the Fund fail to meet any of these provisions, the derivative counterparty has the right to terminate the derivative contract and require immediate payment by the Fund for those OTC derivatives with that particular counterparty that are in a net unrealized loss position. At June 30, 2012, the Fund had no OTC derivatives in a net unrealized loss position for such contracts.
At June 30, 2012, the Fund held $3,551,525 in United Kingdom treasury bonds and U.S. treasury bills as collateral for derivatives.
See Notes 6 and 10 regarding investment transactions and other derivative information, respectively.
e. Restricted Cash
At June 30, 2012, the Fund held restricted cash in connection with investments in certain derivative securities. Restricted cash is held in a segregated account with the Fund’s custodian and is reflected in the Statement of Assets and Liabilities.
MGD-26
Franklin Templeton Variable Insurance Products Trust
Notes to Financial Statements (unaudited) (continued)
Mutual Global Discovery Securities Fund
1. ORGANIZATION AND SIGNIFICANT ACCOUNTING POLICIES (continued)
f. Securities Sold Short
The Fund is engaged in selling securities short, which obligates the fund to replace a borrowed security with the same security at current market value. The fund incurs a loss if the price of the security increases between the date of the short sale and the date on which the fund replaces the borrowed security. The fund realizes a gain if the price of the security declines between those dates. Gains are limited to the price at which the fund sold the security short, while losses are potentially unlimited in size.
The fund is required to establish a margin account with the broker lending the security sold short. While the short sale is outstanding, the broker retains the proceeds of the short sale and the fund must maintain a deposit with the broker consisting of cash and/or securities having a value equal to a specified percentage of the value of the securities sold short. The fund is obligated to pay fees for borrowing the securities sold short and is required to pay the counterparty any dividends or interest due on securities sold short. Such dividends or interest and any security borrowing fees are recorded as an expense to the fund.
g. Securities Lending
The Fund participates in an agency based securities lending program. The fund receives cash collateral against the loaned securities in an amount equal to at least 102% of the market value of the loaned securities. Collateral is maintained over the life of the loan in an amount not less than 100% of the market value of loaned securities, as determined at the close of fund business each day; any additional collateral required due to changes in security values is delivered to the fund on the next business day. The collateral is invested in a non-registered money fund as indicated on the Statement of Investments. The fund receives income from the investment of cash collateral, in addition to lending fees and rebates paid by the borrower. The fund bears the market risk with respect to the collateral investment, securities loaned, and the risk that the agent may default on its obligations to the fund. The securities lending agent has agreed to indemnify the fund in the event of default by a third party borrower.
h. Senior Floating Rate Interests
The Fund invests in senior secured corporate loans that pay interest at rates which are periodically reset by reference to a base lending rate plus a spread. These base lending rates are generally the prime rate offered by a designated U.S. bank or the London InterBank Offered Rate (LIBOR). Senior secured corporate loans often require prepayment of principal from excess cash flows or at the discretion of the borrower. As a result, actual maturity may be substantially less than the stated maturity.
Senior secured corporate loans in which the Fund invests are generally readily marketable, but may be subject to some restrictions on resale.
i. Income and Deferred Taxes
It is the Fund’s policy to qualify as a regulated investment company under the Internal Revenue Code. The Fund intends to distribute to shareholders substantially all of its taxable income and net realized gains to relieve it from federal income and if applicable, excise taxes. As a result, no provision for U.S. federal income taxes is required.
The Fund may be subject to foreign taxation related to income received, capital gains on the sale of securities and certain foreign currency transactions in the foreign jurisdictions in which it invests. Foreign taxes, if any, are recorded based on the tax regulations and rates that exist in the foreign markets in which the Fund invests. When a capital gain tax is determined to apply the Fund records an estimated deferred tax liability in an amount that would be payable if the securities were disposed of on the valuation date.
The Fund recognizes the tax benefits of uncertain tax positions only when the position is “more likely than not” to be sustained upon examination by the tax authorities based on the technical merits of the tax position. As of June 30, 2012, and for all open
MGD-27
Franklin Templeton Variable Insurance Products Trust
Notes to Financial Statements (unaudited) (continued)
Mutual Global Discovery Securities Fund
1. ORGANIZATION AND SIGNIFICANT ACCOUNTING POLICIES (continued)
i. Income and Deferred Taxes (continued)
tax years, the Fund has determined that no liability for unrecognized tax benefits is required in the Fund’s financial statements related to uncertain tax positions taken on a tax return (or expected to be taken on future tax returns). Open tax years are those that remain subject to examination and are based on each tax jurisdiction statute of limitation.
j. Security Transactions, Investment Income, Expenses and Distributions
Security transactions are accounted for on trade date. Realized gains and losses on security transactions are determined on a specific identification basis. Interest income and estimated expenses are accrued daily. Amortization of premium and accretion of discount on debt securities are included in interest income. Facility fees are recognized as income over the expected term of the loan. Dividend income and dividends declared on securities sold short are recorded on the ex-dividend date except that certain dividends from foreign securities are recognized as soon as the Fund is notified of the ex-dividend date. Distributions to shareholders are recorded on the ex-dividend date and are determined according to income tax regulations (tax basis). Distributable earnings determined on a tax basis may differ from earnings recorded in accordance with accounting principles generally accepted in the United States of America. These differences may be permanent or temporary. Permanent differences are reclassified among capital accounts to reflect their tax character. These reclassifications have no impact on net assets or the results of operations. Temporary differences are not reclassified, as they may reverse in subsequent periods.
Common expenses incurred by the Trust are allocated among the funds based on the ratio of net assets of each fund to the combined net assets of the Trust. Fund specific expenses are charged directly to the fund that incurred the expense.
Realized and unrealized gains and losses and net investment income, not including class specific expenses, are allocated daily to each class of shares based upon the relative proportion of net assets of each class. Differences in per share distributions, by class, are generally due to differences in class specific expenses.
k. Accounting Estimates
The preparation of financial statements in accordance with accounting principles generally accepted in the United States of America requires management to make estimates and assumptions that affect the reported amounts of assets and liabilities at the date of the financial statements and the amounts of income and expenses during the reporting period. Actual results could differ from those estimates.
l. Guarantees and Indemnifications
Under the Trust’s organizational documents, its officers and trustees are indemnified by the Trust against certain liabilities arising out of the performance of their duties to the Trust. Additionally, in the normal course of business, the Trust, on behalf of the Fund, enters into contracts with service providers that contain general indemnification clauses. The Trust’s maximum exposure under these arrangements is unknown as this would involve future claims that may be made against the Trust that have not yet occurred. Currently, the Trust expects the risk of loss to be remote.
MGD-28
Franklin Templeton Variable Insurance Products Trust
Notes to Financial Statements (unaudited) (continued)
Mutual Global Discovery Securities Fund
2. SHARES OF BENEFICIAL INTEREST
At June 30, 2012, there were an unlimited number of shares authorized (without par value). Transactions in the Fund’s shares were as follows:
| Six Months Ended June 30, 2012 | Year Ended December 31, 2011 | |||||||||||||||
| Class 1 Shares: | Shares | Amount | Shares | Amount | ||||||||||||
Shares sold | 4,516 | $ | 92,844 | 140,069 | $ | 3,084,356 | ||||||||||
Shares issued in reinvestment of distributions | — | — | 168,285 | 3,367,527 | ||||||||||||
Shares redeemed in-kind (Note 13) | — | — | (3,394,333 | ) | (67,951,585 | ) | ||||||||||
Shares redeemed | (4,778 | ) | (100,336 | ) | (843,405 | ) | (13,912,065 | ) | ||||||||
| ||||||||||||||||
Net increase (decrease) | (262 | ) | $ | (7,492 | ) | (3,929,384 | ) | $ | (75,411,767 | ) | ||||||
| ||||||||||||||||
Class 2 Shares: | ||||||||||||||||
Shares sold | 692,546 | $ | 14,025,028 | 1,990,050 | $ | 40,633,273 | ||||||||||
Shares issued in reinvestment of distributions | — | — | 2,709,831 | 53,163,668 | ||||||||||||
Shares redeemed in-kind (Note 13) | — | — | (21,446,416 | ) | (398,285,682 | ) | ||||||||||
Shares redeemed | (4,683,352 | ) | (94,505,849 | ) | (11,321,410 | ) | (231,534,356 | ) | ||||||||
| ||||||||||||||||
Net increase (decrease) | (3,990,806 | ) | $ | (80,480,821 | ) | (28,067,945 | ) | $ | (536,023,097 | ) | ||||||
| ||||||||||||||||
Class 4 Shares: | ||||||||||||||||
Shares sold | 47,161 | $ | 974,584 | 410,892 | $ | 8,602,556 | ||||||||||
Shares issued on reinvestment of distributions | — | — | 151,460 | 3,001,524 | ||||||||||||
Shares redeemed | (275,965 | ) | (5,605,396 | ) | (502,145 | ) | (10,167,938 | ) | ||||||||
| ||||||||||||||||
Net increase (decrease) | (228,804 | ) | $ | (4,630,812 | ) | 60,207 | $ | 1,436,142 | ||||||||
| ||||||||||||||||
3. TRANSACTIONS WITH AFFILIATES
Franklin Resources, Inc. is the holding company for various subsidiaries that together are referred to as Franklin Templeton Investments. Certain officers and trustees of the Fund are also officers and/or directors of the following subsidiaries:
| Subsidiary | Affiliation | |
Franklin Mutual Advisers, LLC (Franklin Mutual) | Investment manager | |
Franklin Templeton Services, LLC (FT Services) | Administrative manager | |
Franklin Templeton Distributors, Inc. (Distributors) | Principal underwriter | |
Franklin Templeton Investor Services, LLC (Investor Services) | Transfer agent |
a. Management Fees
The Fund pays an investment management fee to Franklin Mutual based on the average daily net assets of the Fund as follows:
| Annualized Fee Rate | Net Assets | |
| 0.800% | Up to and including $4 billion | |
| 0.770% | Over $4 billion, up to and including $7 billion | |
| 0.750% | Over $7 billion, up to and including $10 billion | |
| 0.730% | In excess of $10 billion |
MGD-29
Franklin Templeton Variable Insurance Products Trust
Notes to Financial Statements (unaudited) (continued)
Mutual Global Discovery Securities Fund
3. TRANSACTIONS WITH AFFILIATES (continued)
b. Administrative Fees
The Fund pays an administrative fee to FT Services based on the Fund’s average daily net assets as follows:
| Annualized Fee Rate | Net Assets | |
| 0.150% | Up to and including $200 million | |
| 0.135% | Over $200 million, up to and including $700 million | |
| 0.100% | Over $700 million, up to and including $1.2 billion | |
| 0.075% | In excess of $1.2 billion |
c. Distribution Fees
The Board adopted distribution plans for Class 2 and Class 4 shares pursuant to Rule 12b-1 under the 1940 Act. Under the Fund’s compensation distribution plans, the Fund pays Distributors for costs incurred in connection with the servicing, sale and distribution of the Fund’s shares up to 0.35% per year of its average daily net assets of each class. The Board has agreed to limit the current rate to 0.25% per year for Class 2.
d. Transfer Agent Fees
Investor Services, under terms of an agreement, performs shareholder servicing for the Fund and is not paid by the Fund for the services.
4. EXPENSE OFFSET ARRANGEMENT
The Fund has entered into an arrangement with its custodian whereby credits realized as a result of uninvested cash balances are used to reduce a portion of the Fund’s custodian expenses. During the period ended June 30, 2012, there were no credits earned.
5. INCOME TAXES
At June 30, 2012, the cost of investments and net unrealized appreciation (depreciation) for income tax purposes were as follows:
Cost of investments | $ | 694,400,814 | ||
|
| |||
Unrealized appreciation | $ | 128,797,790 | ||
Unrealized depreciation | (85,635,367 | ) | ||
|
| |||
Net unrealized appreciation (depreciation) | $ | 43,162,423 | ||
|
| |||
Differences between income and/or capital gains as determined on a book basis and a tax basis are primarily due to differing treatments of foreign currency transactions, passive foreign investment company shares, bond discounts and premiums and corporate actions.
6. INVESTMENT TRANSACTIONS
Purchases and sales of investments (excluding short term securities and securities sold short) for the period ended June 30, 2012, aggregated $109,310,723 and $158,407,792, respectively.
MGD-30
Franklin Templeton Variable Insurance Products Trust
Notes to Financial Statements (unaudited) (continued)
Mutual Global Discovery Securities Fund
6. INVESTMENT TRANSACTIONS (continued)
Transactions in options written during the period ended June 30, 2012, were as follows:
| Number of Contracts | Premiums Received | |||||||
Options outstanding at December 31, 2011 | 160 | $ | 62,276 | |||||
Options written | 39 | 5,007 | ||||||
Options expired | (39 | ) | (5,007 | ) | ||||
Options exercised | (57 | ) | (22,197 | ) | ||||
Options closed | (103 | ) | (40,079 | ) | ||||
| ||||||||
Options outstanding at June 30, 2012 | — | $ | — | |||||
| ||||||||
See Notes 1(d) and 10 regarding derivative financial instruments and other derivative information, respectively.
7. CREDIT RISK AND DEFAULTED SECURITIES
The Fund may purchase the pre-default or defaulted debt of distressed companies. Distressed companies are financially troubled and are about to be or are already involved in financial restructuring or bankruptcy. Risks associated with purchasing these securities include the possibility that the bankruptcy or other restructuring process takes longer than expected, or that distributions in restructuring are less than anticipated, either or both of which may result in unfavorable consequences to the Fund. If it becomes probable that the income on debt securities, including those of distressed companies, will not be collected, the Fund discontinues accruing income and recognizes an adjustment for uncollectible interest. At June 30, 2012, the aggregate value of distressed company securities for which interest recognition has been discontinued was $7,261,891, representing 0.99% of the Fund’s net assets. For information as to specific securities, see the accompanying Statement of Investments.
8. CONCENTRATION OF RISK
Investing in foreign securities may include certain risks and considerations not typically associated with investing in U.S. securities, such as fluctuating currency values and changing local and regional economic, political and social conditions, which may result in greater market volatility. In addition, certain foreign securities may not be as liquid as U.S. securities.
9. RESTRICTED SECURITIES
The Fund invests in securities that are restricted under the Securities Act of 1933 (1933 Act) or which are subject to legal, contractual, or other agreed upon restrictions on resale. Restricted securities are often purchased in private placement transactions, and cannot be sold without prior registration unless the sale is pursuant to an exemption under the 1933 Act. Disposal of these securities may require greater effort and expense, and prompt sale at an acceptable price may be difficult. The Fund may have registration rights for restricted securities. The issuer generally incurs all registration costs.
At June 30 2012, the Fund held investments in restricted securities, excluding certain securities exempt from registration under the 1933 Act deemed to be liquid, as follows:
| Principal Amount/ Shares | Issuer | Acquisition Dates | Cost | Value | ||||||||||||
| 1,361,600 | AET&D Holdings No. 1 Pty. Ltd. | 10/13/10 | $ | — | $ | — | ||||||||||
| 800,000 | The Bankshares Inc. | 3/22/07 | 8,000,000 | 2,636,792 | ||||||||||||
| 722 | Broadband Ventures III LLC, secured promissory note, 5.00%, 2/01/12 | 7/01/10 | 722 | — | ||||||||||||
| 78,494 | Capital Bank Financial Corp., A, 144A | 12/16/09 - 7/02/10 | 1,569,880 | 1,295,151 | ||||||||||||
MGD-31
Franklin Templeton Variable Insurance Products Trust
Notes to Financial Statements (unaudited) (continued)
Mutual Global Discovery Securities Fund
9. RESTRICTED SECURITIES (continued)
| Principal Amount/ Shares | Issuer | Acquisition Dates | Cost | Value | ||||||||||||
| 269,922 | Capital Bank Financial Corp., B, 144A, non-voting | 12/16/09 - 7/02/10 | $ | 5,398,440 | $ | 4,453,713 | ||||||||||
| 1,903 | Elephant Capital Holdings Ltd. | 8/23/04 - 3/10/08 | 294,226 | — | ||||||||||||
| 2,077,368 | FIM Coinvestor Holdings I, LLC | 11/20/06 - 6/02/09 | — | — | ||||||||||||
| 2,172,000 | Hightower Holding LLC, pfd., A, Series 2 | 6/10/10 - 5/10/12 | 5,430,000 | 4,880,202 | ||||||||||||
| 120,290 | Imagine Group Holdings Ltd. | 8/31/04 | 1,231,950 | 1,411,471 | ||||||||||||
| 424,073 | International Automotive Components Group Brazil LLC | 4/13/06 - 12/26/08 | 281,629 | 144,397 | ||||||||||||
| 3,000,220 | International Automotive Components Group North America, LLC | 1/12/06 - 10/10/07 | 2,879,270 | 1,480,758 | ||||||||||||
| 9,306 | NCB Warrant Holdings Ltd., A | 12/16/05 - 3/10/08 | 87,597 | — | ||||||||||||
| 2,140 | Olympus Re Holdings Ltd. | 12/19/01 | 201,741 | — | ||||||||||||
|
| |||||||||||||||
Total Restricted Securities (2.22% of Net Assets) | $ | 16,302,484 | ||||||||||||||
|
| |||||||||||||||
10. OTHER DERIVATIVE INFORMATION
At June 30, 2012, the Fund has invested in derivative contracts which are reflected on the Statement of Assets and Liabilities as follows:
| Asset Derivatives | Liability Derivatives | |||||||||||
| Derivative Contracts Not Accounted for as Hedging Instruments | Statement of Assets and Liabilities Location | Fair Value Amount | Statement of Assets and Liabilities Location | Fair Value Amount | ||||||||
Foreign exchange contracts | Unrealized appreciation on forward exchange contracts | $ | 4,388,711 | Unrealized depreciation on forward exchange contracts / Net assets consist of – net unrealized appreciation (depreciation) | $ | 1,233,626a | ||||||
aIncludes cumulative appreciation (depreciation) of futures contracts as reported in the Statement of Investments. Only current day’s variation margin is separately reported within the Statement of Assets and Liabilities.
For the period ended June 30, 2012, the effect of derivative contracts on the Fund’s Statement of Operations was as follows:
| Derivative Contracts Not Accounted for as Hedging Instruments | Statement of Operations Locations | Realized Gain (Loss) for the Period | Change in Unrealized Appreciation (Depreciation) for the Period | |||||||
Foreign exchange contracts | Net realized gain (loss) from foreign currency transactions and futures contracts / Net change in unrealized appreciation (depreciation) on translation of other assets and liabilities denominated in foreign currencies | $ | 12,669,385 | $ | (10,008,935 | ) | ||||
Equity contracts | Net realized gain (loss) from written options / Net change in unrealized appreciation (depreciation) on investments | 60,098 | 8,284 | |||||||
For the period ended June 30, 2012, the average month end market value of derivatives represented 0.98% of average month end net assets. The average month end number of open derivative contracts for the period was 113.
See Notes 1(d) and 6 regarding derivative financial instruments and investment transactions, respectively.
MGD-32
Franklin Templeton Variable Insurance Products Trust
Notes to Financial Statements (unaudited) (continued)
Mutual Global Discovery Securities Fund
11. HOLDINGS OF 5% VOTING SECURITIES OF PORTFOLIO COMPANIES
The 1940 Act defines “affiliated companies” to include investments in portfolio companies in which a fund owns 5% or more of the outstanding voting securities. Investments in “affiliated companies” for the Fund for the period ended June 30, 2012, were as shown below.
| Name of Issuer | Number of Shares Held at Beginning of Year | Gross Additions | Gross Reductions | Number of Shares Held at End of Year | Value at End of Year | Investment Income | Realized Capital Gain (Loss) | |||||||||||||||||||||
Non-Controlled Affiliates | ||||||||||||||||||||||||||||
The Bankshares Inc. (0.36% of Net Assets) | 800,000 | — | — | 800,000 | $ | 2,636,792 | $ | — | $ | — | ||||||||||||||||||
|
| |||||||||||||||||||||||||||
12. CREDIT FACILITY
The Fund, together with other U.S. registered and foreign investment funds (collectively, Borrowers), managed by Franklin Templeton Investments, are borrowers in a joint syndicated senior unsecured credit facility totaling $1.5 billion (Global Credit Facility) which matures on January 18, 2013. This Global Credit Facility provides a source of funds to the Borrowers for temporary and emergency purposes, including the ability to meet future unanticipated or unusually large redemption requests.
Under the terms of the Global Credit Facility, the Fund shall, in addition to interest charged on any borrowings made by the Fund and other costs incurred by the Fund, pay its share of fees and expenses incurred in connection with the implementation and maintenance of the Global Credit Facility, based upon its relative share of the aggregate net assets of all of the Borrowers, including an annual commitment fee of 0.08% based upon the unused portion of the Global Credit Facility, which is reflected in other expenses on the Statement of Operations. During the period ended June 30, 2012, the Fund did not use the Global Credit Facility.
13. REDEMPTION IN-KIND
During the year ended December 31, 2011, the Fund realized $45,310,078 of net gains resulting from a redemption in-kind in which a shareholder redeemed fund shares for securities held by the Fund rather than for cash. Because such gains are not taxable to the Fund, and are not netted with capital gains that are distributed to remaining shareholders, they have been reclassified from accumulated net realized gains to paid-in capital.
14. FAIR VALUE MEASUREMENTS
The Fund follows a fair value hierarchy that distinguishes between market data obtained from independent sources (observable inputs) and the Fund’s own market assumptions (unobservable inputs). These inputs are used in determining the value of the Fund’s financial instruments and are summarized in the following fair value hierarchy:
| • | Level 1 – quoted prices in active markets for identical financial instruments |
| • | Level 2 – other significant observable inputs (including quoted prices for similar financial instruments, interest rates, prepayment speed, credit risk, etc.) |
| • | Level 3 – significant unobservable inputs (including the Fund’s own assumptions in determining the fair value of financial instruments) |
The inputs or methodology used for valuing financial instruments are not an indication of the risk associated with investing in those financial instruments.
MGD-33
Franklin Templeton Variable Insurance Products Trust
Notes to Financial Statements (unaudited) (continued)
Mutual Global Discovery Securities Fund
14. FAIR VALUE MEASUREMENTS (continued)
For movements between the levels within the fair value hierarchy, the Fund has adopted a policy of recognizing the transfers as of the date of the underlying event which caused the movement.
A summary of inputs used as of June 30, 2012, in valuing the Fund’s assets and liabilities carried at fair value, is as follows:
| Level 1 | Level 2 | Level 3 | Total | |||||||||||||
|
| |||||||||||||||
Assets: | ||||||||||||||||
Investments in Securities: | ||||||||||||||||
Equity Investments:a | ||||||||||||||||
Auto Components | $ | 5,147,606 | $ | — | $ | 1,625,680 | $ | 6,773,286 | ||||||||
Commercial Banks | 42,726,928 | — | 8,385,656 | b | 51,112,584 | |||||||||||
Consumer Finance | — | 220 | — | 220 | ||||||||||||
Diversified Financial Services | 23,506,528 | — | 4,880,202 | 28,386,730 | ||||||||||||
Diversified Telecommunication Services | 5,458,268 | — | 32,386 | b | 5,490,654 | |||||||||||
Insurance | 43,300,076 | — | 1,411,471 | b | 44,711,547 | |||||||||||
Real Estate Management & Development | 5,901,447 | — | 1,765,285 | 7,666,732 | ||||||||||||
Other Equity Investmentsc | 501,918,477 | — | — | b | 501,918,477 | |||||||||||
Corporate Bonds, Notes and Senior Floating Rate Interests | — | 34,441,177 | — | 34,441,177 | ||||||||||||
Corporate Notes and Senior Floating Rate Interests in Reorganization | — | 7,261,891 | — | 7,261,891 | ||||||||||||
Companies in Liquidation | — | 13,115 | — | 13,115 | ||||||||||||
Short Term Investments | 19,989,901 | 29,796,923 | — | 49,786,824 | ||||||||||||
|
| |||||||||||||||
Total Investments in Securities | $ | 647,949,231 | $ | 71,513,326 | $ | 18,100,680 | $ | 737,563,237 | ||||||||
|
| |||||||||||||||
Forward Exchange Contracts | — | 4,388,711 | — | 4,388,711 | ||||||||||||
Liabilities: | ||||||||||||||||
Forward Exchange Contracts | — | 746,948 | — | 746,948 | ||||||||||||
Futures Contracts | 486,678 | — | — | 486,678 | ||||||||||||
aIncludes common and preferred stocks as well as other equity investments.
bIncludes securities determined to have no value at June 30, 2012.
cFor detailed categories, see the accompanying Statement of Investments.
At June 30, 2012, the reconciliation of assets in which significant unobservable inputs (Level 3) were used in determining fair value, is as follows:
| Balance at Beginning of Period | Purchases | Sales | Transfers Into Level 3a | Transfers Out of Level 3 | Cost Basis Adjustmentsb | Net Realized Gain (Loss) | Net Unrealized Gain (Loss) | Balance at End of Period | Net Change in Unrealized Appreciation (Depreciation) on Assets Held at Period End | |||||||||||||||||||||||||||||||
Assets | ||||||||||||||||||||||||||||||||||||||||
Investments in Securities: | ||||||||||||||||||||||||||||||||||||||||
Equity Investments:c | ||||||||||||||||||||||||||||||||||||||||
Auto Components | $ | 1,616,712 | $ | — | $ | — | $ | — | $ | — | $ | (720,173 | ) | $ | — | $ | 729,141 | $ | 1,625,680 | $ | 729,141 | |||||||||||||||||||
Commercial Banks | 2,859,392 | d | — | — | 5,748,864 | — | — | — | (222,600 | ) | 8,385,656 | d | (222,600 | ) | ||||||||||||||||||||||||||
Diversified Financial Services | 2,333,811 | 2,644,464 | — | — | — | — | — | (98,073 | ) | 4,880,202 | (98,073 | ) | ||||||||||||||||||||||||||||
Diversified Telecommunication Services | 32,340 | d | — | — | — | — | — | — | 46 | 32,386 | d | 46 | ||||||||||||||||||||||||||||
MGD-34
Franklin Templeton Variable Insurance Products Trust
Notes to Financial Statements (unaudited) (continued)
Mutual Global Discovery Securities Fund
14. FAIR VALUE MEASUREMENTS (continued)
| Balance at Beginning of Period | Purchases | Sales | Transfers Into Level 3a | Transfers Out of Level 3 | Cost Basis Adjustmentsb | Net Realized Gain (Loss) | Net Unrealized Gain (Loss) | Balance at End of Period | Net Change in Unrealized Appreciation (Depreciation) on Assets Held at Period End | |||||||||||||||||||||||||||||||
Insurance | $ | 1,505,983 | d | $ | — | $ | — | $ | — | $ | — | $ | — | $ | — | $ | (94,512 | ) | $ | 1,411,471 | d | $ | (94,512 | ) | ||||||||||||||||
Real Estate Management & Development | 1,789,048 | — | — | — | — | — | — | (23,763 | ) | 1,765,285 | (23,763 | ) | ||||||||||||||||||||||||||||
|
| |||||||||||||||||||||||||||||||||||||||
Total | $ | 10,137,286 | $ | 2,644,464 | $ | — | $ | 5,748,864 | $ | — | $ | (720,173 | ) | $ | — | $ | 290,239 | $ | 18,100,680 | $ | 290,239 | |||||||||||||||||||
|
| |||||||||||||||||||||||||||||||||||||||
aThe investments were transferred into Level 3 as a result of the unavailability of a quoted market price in an active market for identical securities and other significant observable valuation inputs.
bMay include accretion, amortization, partnership adjustments, and/or other cost basis adjustments.
cIncludes common and preferred stocks as well as other equity investments.
dIncludes securities determined to have no value.
Significant unobservable inputs developed by the VLOC for material Level 3 investments as of June 30, 2012, are as follows:
| Description | Fair Value at End of Period | Valuation Technique | Unobservable Inputs | Amount | ||||||||
Assets: | ||||||||||||
Investments in Securities: | ||||||||||||
Equity Investments:a | ||||||||||||
Auto Components | $ | 1,480,758 | Market comparables | Discount for lack of marketability | 15% | |||||||
| EV / EBITDA multiple | 3.3x | |||||||||||
Commercial Banks | 2,636,792 | Market comparables | Discount for lack of marketability | 10% | ||||||||
| Price / tangible book multiple | 0.99x | |||||||||||
Diversified Financial Services | 4,880,202 | Option pricing model | Stock price volatility | 28.6% | ||||||||
Insurance | 1,411,471 | Market comparables | Discount for lack of marketability | 5% | ||||||||
| Price / book multiple | 1.0x | |||||||||||
Real Estate Management & Development | 1,765,285 | Market comparables | Discount for lack of marketability | 8% | ||||||||
aIncludes common and preferred stocks as well as other equity investments.
The significant unobservable inputs used in the fair value measurement of the Fund's investment in auto components companies are an enterprise value (EV) to earnings before interest, taxes, depreciation and amortization (EBITDA) multiple and a discount for lack of marketability. A significant and reasonable increase or decrease in the EV to EBITDA multiple would result in a significant increase or decrease in the fair value measurement. A significant and reasonable increase or decrease in the discount for lack of marketability would result in a significant decrease or increase in the fair value measurement.
The significant unobservable inputs used in the fair value measurement of the Fund's investments in commercial banks companies are the price to tangible book multiple and a discount for lack of marketability. A significant and reasonable increase or decrease in the price to tangible book multiple would result in a significant increase or decrease in the fair value measurement. A significant and reasonable increase or decrease in the discount for lack of marketability would result in a significant decrease or increase in the fair value measurement.
The significant unobservable input used in the fair value measurement of the Fund's investment in diversified financial services companies is stock price volatility. A significant and reasonable increase or decrease in the input would result in a significant increase or decrease in the fair value measurement.
MGD-35
Franklin Templeton Variable Insurance Products Trust
Notes to Financial Statements (unaudited) (continued)
Mutual Global Discovery Securities Fund
14. FAIR VALUE MEASUREMENTS (continued)
The significant unobservable inputs used in the fair value measurement of the Fund's investment in insurance companies are the price to book multiple and a discount for lack of marketability. A significant and reasonable increase or decrease in the price to book multiple would not result in a significant increase or decrease in the fair value measurement. A significant and reasonable increase or decrease in the discount for lack of marketability would result in a significant decrease or increase in the fair value measurement.
The significant unobservable input used in the fair value measurement of the Fund's investment in real estate management & development companies is a discount for lack of marketability. A significant and reasonable increase or decrease in the input would result in a significant decrease or increase in the fair value measurement.
The difference in fair value measurements, caused by significant and reasonable changes in any of these inputs, except the EV to EBITDA multiple and the stock price volatility inputs, would not materially impact the net assets of the Fund.
15. NEW ACCOUNTING PRONOUNCEMENTS
In December 2011, the Financial Accounting Standards Board (FASB) issued Accounting Standards Update (ASU) No. 2011-11, Balance Sheet (Topic 210): Disclosures about Offsetting Assets and Liabilities. The amendments in the ASU enhance disclosures about offsetting of financial assets and liabilities to enable investors to understand the effect of these arrangements on a fund’s financial position. The ASU is effective for interim and annual reporting periods beginning on or after January 1, 2013. The Fund believes the adoption of this ASU will not have a material impact on its financial statements.
16. SUBSEQUENT EVENTS
The Fund has evaluated subsequent events through the issuance of the financial statements and determined that no events have occurred that require disclosure.
ABBREVIATIONS | ||||
| Counterparty | Currency | Selected Portfolio | ||
| BOFA - Bank of America Corp. | EUR - Euro | ADR - American Depositary Receipt | ||
| BZWS - Barclays Bank PLC | GBP - British Pound | FHLB - Federal Home Loan Bank | ||
DBAB - Deutsche Bank AG | USD - United States Dollar | FRN - Floating Rate Note | ||
FBCO - Credit Suisse Group AG | PIK - Payment-In-Kind | |||
| HAND - Svenska Handelsbanken | ||||
| HSBC - HSBC Bank USA, N.A. | ||||
| SCBT - Standard Chartered Bank | ||||
| SSBT - State Street Bank and Trust Co. |
MGD-36
MUTUAL INTERNATIONAL SECURITIES FUND
We are pleased to bring you Mutual International Securities Fund’s semiannual report for the period ended June 30, 2012.
Performance Summary as of 6/30/12
Mutual International Securities Fund – Class 4 delivered a +4.56% total return* for the six-month period ended 6/30/12.
*The investment manager and administrator have contractually agreed to waive or assume certain expenses so that common expenses of the Fund (excluding Rule 12b-1 fees and acquired fund fees and other expenses) do not exceed 0.95% (other than certain nonroutine expenses) until 4/30/13. Fund investment results reflect the expense reduction, without which the results would have been lower.
Performance reflects the Fund’s Class 4 operating expenses, but does not include any contract fees, expenses or sales charges. If they had been included, performance would be lower. These charges and deductions, particularly for variable life policies, can have a significant effect on contract values and insurance benefits. See the contract prospectus for a complete description of these expenses, including sales charges.
Mutual International Securities Fund – Class 4
Performance data represent past performance, which does not guarantee future results. Investment return and principal value will fluctuate, and you may have a gain or loss when you sell your shares.
Current performance may differ from figures shown.
MI-1
Fund Goals and Main Investments: Mutual International Securities Fund seeks capital appreciation, which may occasionally be short term, with income as a secondary goal. Under normal market conditions, the Fund invests at least 80% of its net assets in securities of non-U.S. issuers.
Performance Overview
You can find the Fund’s six-month total return in the Performance Summary. The Fund outperformed its benchmark, the MSCI Europe, Australasia, Far East (EAFE) Index Net Return (Local Currency), which posted a total return of +4.24% for the same period.1
Economic and Market Overview
The six months under review encompassed two different market environments. The first quarter of 2012 delivered the best annual start for global developed stocks in more than a decade, as measured by the MSCI World Index, as signs of U.S. economic recovery and European policy relief underpinned a rally in cyclical stocks.2 Yet, renewed global economic weakness and European debt concerns led the market lower in the second quarter, and stocks dropped sharply in the spring before additional policy action prompted a rebound in June. Politics largely drove the markets during the first half of 2012 as investors closely monitored developments in Europe, where German-led austerity demands were met with increasing resentment from some highly indebted eurozone members. Coalition-building efforts in Greece collapsed amid anger over the terms of the country’s second bailout, forcing a new election that brought some relief when the pro-euro party won. Elsewhere in the region, France’s socialist candidate clinched the presidency on a pro-growth platform and the Dutch cabinet resigned in the wake of a contentious austerity deal.
On the economic front, global growth trends generally moderated, led by Europe, which narrowly avoided recession mainly because of German export strength. Yet, even the more resilient economies of Germany, the U.S. and China showed signs of a slowdown at period-end. The combination of flagging growth, political uncertainty and populist unrest pressured investor confidence, and ratings agencies downgraded global banks and European sovereigns. Concerns about Italian and Spanish borrowing costs added to investor anxiety as bond yields climbed. Europe’s initial policy responses — including enhanced
1. Source: © 2012 Morningstar. One cannot invest directly in an index, and an index is not representative of the Fund’s portfolio. Please see Index Descriptions following the Fund Summaries.
2. Please see Index Descriptions following the Fund Summaries.
Fund Risks: All investments involve risks, including possible loss of principal. Value securities may not increase in price as anticipated or may decline further in value. Special risks are associated with foreign investing, including currency fluctuations, economic instability and political developments; investments in emerging markets involve heightened risks related to the same factors. Because the Fund invests its assets primarily in companies in a specific region, it is subject to greater risks of adverse developments in that region and/or the surrounding regions than a fund that is more broadly diversified geographically. Political, social or economic disruptions in the region, even in countries in which the Fund is not invested, may adversely affect the value of securities held by the Fund. Current political uncertainty surrounding the European Union (EU) and its membership may increase market volatility. The financial instability of some countries in the EU, including Greece, Italy and Spain, together with the risk of that impacting other more stable countries may increase the economic risk of investing in companies in Europe. The Fund’s investments in companies engaged in mergers, reorganizations or liquidations also involve special risks as pending deals may not be completed on time or on favorable terms. The Fund is actively managed but there is no guarantee that the manager’s investment decisions will produce the desired results. The Fund’s prospectus also includes a description of the main investment risks.
MI-2
liquidity measures and an ineffective Spanish banking bailout — did little to address the structural imbalances of eurozone economies or the solvency fears plaguing the region’s banking system. Yet, encouraging progress did emerge at period-end when leaders in Brussels agreed to ease conditions of sovereign bond purchases and permit the region’s bailout fund to directly recapitalize banks. Meanwhile, the U.S. Federal Reserve Board opted to extend its strategy, dubbed Operation Twist, designed to lower systemically important interest rates, and the People’s Bank of China slashed interest rates for the first time since the global financial crisis began. In the latter part of the period, commodities extended recent losses, with oil falling back below $100, while the euro dipped and traditional safe havens like U.S. Treasuries, the U.S. dollar and the Japanese yen made gains.
Investment Strategy
At Mutual Series, we are committed to our distinctive value approach to investing. Our major investment strategy is investing in undervalued stocks in Asia and Europe. When selecting undervalued equities, we are attracted to fundamentally strong companies with healthy balance sheets, high-quality assets, substantial free cash flow and shareholder-oriented management teams and whose stocks are trading at discounts to our assessment of the companies’ intrinsic or business value. We also look for asset rich companies whose shares may be trading at depressed levels due to concerns over short-term earnings disappointments, litigation, management strategy or other perceived negatives. While the vast majority of our undervalued equity investments are made in publicly traded companies internationally, we may invest occasionally in privately held companies as well.
We complement this more traditional investment strategy with two others. One is distressed investing, which is complex and can take many forms. The most common distressed investment the Fund undertakes is the purchase of financially troubled or bankrupt companies’ debt at a substantial discount to face value. After the financially distressed company is reorganized, often in bankruptcy court, the old debt is typically replaced with new securities issued by the financially stronger company.
The other piece of our investment strategy is participating in arbitrage situations, another highly specialized field. When companies announce proposed mergers or takeovers, commonly referred to as “deals,” the target company may trade at a discount to the bid it ultimately accepts. One
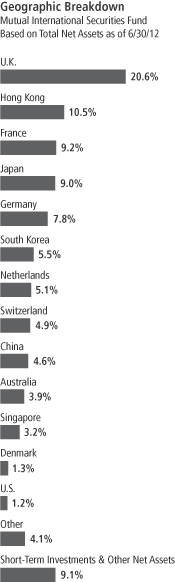
MI-3
form of arbitrage involves purchasing the target company’s stock when it is trading below the value we believe it would receive in a deal. In keeping with our commitment to a relatively conservative investment approach, we typically focus our arbitrage efforts on announced deals, and eschew rumored deals or other situations we consider relatively risky.
In addition, it is our practice to hedge the Fund’s currency exposure when we deem it advantageous for our shareholders.
Manager’s Discussion
During the six months under review, Fund performance benefited from several investments. Three of the largest contributors during the period were Beijing-based media advertising firm Sinomedia Holding, German tire and auto parts manufacturer Continental and Hong Kong-based real estate developer Franshion Properties China.
Sinomedia is a leading provider of nationwide television advertising coverage and campaign planning for advertisers and advertising agents. The company is the largest private sector operator of television advertisement time for CCTV, the predominant state television broadcaster in China, and also maintains integrated brand communication and creative production businesses. In an environment of rising Chinese consumer demand, companies have been increasing their advertising spending and we believe Sinomedia stands to benefit from this trend. In our view at period-end, Sinomedia traded at attractive multiples with considerable cash on the balance sheet and offered an attractive dividend payout to investors.
Continental posted strong operating results in fiscal year 2011, which included double-digit revenue growth and earnings growth. The company has also taken steps to strengthen its balance sheet and management expects net debt will continue to decline in 2012. Continental has demonstrated its ability to improve performance in certain business segments, and we continue to believe it is one of the best positioned auto suppliers globally, due to its focus on fuel efficiency, carbon dioxide emission reduction, vehicle electronics and technology solutions for global automotive original equipment manufacturers. We believe the company’s prospects could remain positive over the next several years, based on its improving balance sheet and cash flow profile.
Franshion Properties China is a developer and operator of large-scale and high-end commercial real estate projects. During the period, operating results testified to Franshion’s ability to execute in residential
Top 10 Sectors/Industries
Mutual International Securities Fund 6/30/12
| % of Total Net Assets | ||||
| Insurance | 11.4% | |||
| Commercial Banks | 7.9% | |||
| Construction & Engineering | 4.9% | |||
| Hotels, Restaurants & Leisure | 4.8% | |||
| Diversified Financial Services | 4.4% | |||
| Pharmaceuticals | 4.2% | |||
| Food & Staples Retailing | 4.2% | |||
| Chemicals | 3.7% | |||
| Media | 2.8% | |||
| Oil, Gas & Consumable Fuels | 2.8% | |||
MI-4
development, an area in which the company’s capabilities had previously been largely discounted. Franshion also reported a significant increase in rental revenues from its premium property portfolio, which benefited its share price.
Despite the Fund’s positive performance during the period, there were a few disappointments in the portfolio. Among the top detractors were German industrial conglomerate ThyssenKrupp, U.K. financial services restructuring company Resolution, and Australian infrastructure firm Transfield Services.
During the period, ThyssenKrupp’s operating performance was broadly in line with expectations, with the exception of the company’s Steel Europe and Americas businesses, which struggled due to cyclical pricing pressures and launch issues in the Americas. While the company continued to execute on its original restructuring plan, the uncertain and volatile macroeconomic environment weighed on operations, contributing to management’s recent announcement that it would explore all strategic options regarding the Steel Americas division. At period-end, we continued to see upside potential in our investment based on our view that ThyssenKrupp has a strong set of assets, manageable debt maturity ladder, ability to generate strong free cash flow and a restructuring plan designed to create value.
Resolution is a holding company formed to complete leveraged buyouts and mergers of U.K. life insurance operators. At its annual meeting of shareholders in May, the company announced it would delay the second stage of its share buyback plan until the second half of 2012, sending shares lower. Despite the stock’s near-term weakness, we continue to view our investment in Resolution favorably, as the underlying insurance operations have held up in a difficult operating environment, resulting in an increase in operating profit for the company’s most recent fiscal year. We also believe the share repurchase delay was only a cautionary step taken by management.
Transfield Services provides operations, maintenance and construction services to the resources, energy, industrial, property and defense sectors. The company’s share price declined as investors sold off after the company’s announcement that adverse weather conditions across northern Australia will negatively impact fiscal year 2012 earnings. Thinking like company owners and investing with a long-term perspective, we sought to capitalize on this short-term weakness arising from what we viewed as a nonrecurring event and added to our position.
Top 10 Holdings
Mutual International Securities Fund
6/30/12
| Company Sector/Industry, Country | % of Total Net Assets | |||
| Rexam PLC | 1.8% | |||
| Containers & Packaging, U.K. | ||||
| REXLot Holdings Ltd. | 1.8% | |||
| Hotels, Restaurants & Leisure, Hong Kong | ||||
| Sinomedia Holding Ltd. | 1.7% | |||
| Media, China | ||||
| Aozora Bank Ltd. | 1.6% | |||
| Commercial Banks, Japan | ||||
| Continental AG | 1.6% | |||
| Auto Components, Germany | ||||
| RSA Insurance Group PLC | 1.6% | |||
| Insurance, U.K. | ||||
| Boart Longyear Ltd. | 1.6% | |||
| Construction & Engineering, Australia | ||||
| Transfield Services Ltd. | 1.5% | |||
| Commercial Services & Supplies, Australia | ||||
| FamilyMart Co. Ltd. | 1.4% | |||
| Food & Staples Retailing, Japan | ||||
| Hoya Corp. | 1.4% | |||
| Electronic Equipment, Instruments & Components, Japan | ||||
The dollar value, number of shares or principal amount, and names of all portfolio holdings are listed in the Fund’s Statement of Investments.
MI-5
During the period, the Fund held currency forwards to somewhat hedge the currency risk of the portfolio’s non-U.S. dollar investments. The hedges had a positive impact on the Fund’s performance during the period.
Thank you for your participation in Mutual International Securities Fund. We look forward to serving your future investment needs.
The foregoing information reflects our analysis, opinions and portfolio holdings as of June 30, 2012, the end of the reporting period. The way we implement our main investment strategies and the resulting portfolio holdings may change depending on factors such as market and economic conditions. These opinions may not be relied upon as investment advice or an offer for a particular security. The information is not a complete analysis of every aspect of any market, country, industry, security or the Fund. Statements of fact are from sources considered reliable, but the investment manager makes no representation or warranty as to their completeness or accuracy. Although historical performance is no guarantee of future results, these insights may help you understand our investment management philosophy.
MI-6
Fund Expenses
As an investor in a variable insurance contract (Contract) that indirectly provides for investment in an underlying mutual fund, you can incur transaction and/or ongoing expenses at both the Fund level and the Contract level.
| • | Transaction expenses can include sales charges (loads) on purchases, surrender fees, transfer fees and premium taxes. |
| • | Ongoing expenses can include management fees, distribution and service (12b-1) fees, contract fees, annual maintenance fees, mortality and expense risk fees and other fees and expenses. All mutual funds and Contracts have some types of ongoing expenses. |
The expenses shown in the table are meant to highlight ongoing expenses at the Fund level only and do not include ongoing expenses at the Contract level, or transaction expenses at either the Fund or Contract levels. While the Fund does not have transaction expenses, if the transaction and ongoing expenses at the Contract level were included, the expenses shown below would be higher. You should consult your Contract prospectus or disclosure document for more information.
The table shows Fund-level ongoing expenses and can help you understand these expenses and compare them with those of other mutual funds offered through the Contract. The table assumes a $1,000 investment held for the six months indicated. Please refer to the Fund prospectus for additional information on operating expenses.
Actual Fund Expenses
The first line (Actual) of the table provides actual account values and expenses. The “Ending Account Value” is derived from the Fund’s actual return, which includes the effect of ongoing Fund expenses, but does not include the effect of ongoing Contract expenses.
You can estimate the Fund-level expenses you incurred during the period by following these steps. Of course, your account value and expenses will differ from those in this illustration:
| 1. | Divide your account value by $1,000. |
If an account had an $8,600 value, then $8,600 ÷ $1,000 = 8.6.
| 2. | Multiply the result by the number under the heading “Fund-Level Expenses Incurred During Period.” |
If Fund-Level Expenses Incurred During Period were $7.50, then 8.6 x $7.50 = $64.50.
In this illustration, the estimated expenses incurred this period at the Fund level are $64.50.
Mutual International Securities Fund – Class 4
MI-7
Hypothetical Example for Comparison with Other Mutual Funds
Information in the second line (Hypothetical) of the table can help you compare ongoing expenses of the Fund with those of other mutual funds offered through the Contract. This information may not be used to estimate the actual ending account balance or expenses you incurred during the period. The hypothetical “Ending Account Value” is based on the Fund’s actual expense ratio and an assumed 5% annual rate of return before expenses, which does not represent the Fund’s actual return. The figure under the heading “Fund-Level Expenses Incurred During Period” shows the hypothetical expenses your account would have incurred under this scenario. You can compare this figure with the 5% hypothetical examples that appear in shareholder reports of other funds offered through a Contract.
| Class 4 | Beginning Account Value 1/1/12 | Ending Account Value 6/30/12 | Fund-Level Expenses Incurred During Period* 1/1/12–6/30/12 | |||||||||
Actual | $ | 1,000 | $ | 1,045.60 | $ | 6.61 | ||||||
Hypothetical (5% return before expenses) | $ | 1,000 | $ | 1,018.40 | $ | 6.52 | ||||||
*Expenses are calculated using the most recent six-month annualized expense ratio, net of expense waivers, for the Fund’s Class 4 shares (1.30%), which does not include any ongoing expenses of the Contract for which the Fund is an investment option, multiplied by the average account value over the period, multiplied by 182/366 to reflect the one-half year period.
MI-8
Franklin Templeton Variable Insurance Products Trust
Financial Highlights
Mutual International Securities Fund
Six Months (unaudited) | Year Ended December 31, | |||||||||||||||
| Class 2 | 2011 | 2010 | 2009a | |||||||||||||
| ||||||||||||||||
Per share operating performance | ||||||||||||||||
(for a share outstanding throughout the period) | ||||||||||||||||
Net asset value, beginning of period | $ | 9.66 | $ | 12.04 | $ | 11.82 | $ | 10.00 | ||||||||
|
| |||||||||||||||
Income from investment operationsb: | ||||||||||||||||
Net investment incomec | 0.16 | 0.24 | 0.25 | 0.08 | ||||||||||||
Net realized and unrealized gains (losses) | 0.28 | (1.67 | ) | 1.51 | 2.30 | |||||||||||
|
| |||||||||||||||
Total from investment operations | 0.44 | (1.43 | ) | 1.76 | 2.38 | |||||||||||
|
| |||||||||||||||
Less distributions from: | ||||||||||||||||
Net investment income | — | (0.29 | ) | (0.67 | ) | (0.13 | ) | |||||||||
Net realized gains | — | (0.66 | ) | (0.87 | ) | (0.43 | ) | |||||||||
|
| |||||||||||||||
Total distributions | — | (0.95 | ) | (1.54 | ) | (0.56 | ) | |||||||||
|
| |||||||||||||||
Net asset value, end of period | $ | 10.10 | $ | 9.66 | $ | 12.04 | $ | 11.82 | ||||||||
|
| |||||||||||||||
Total returnd | 4.55% | (11.92)% | 15.49% | 23.91% | ||||||||||||
Ratios to average net assetse | ||||||||||||||||
Expenses before waiver and payments by affiliates | 6.31% | 5.13% | 4.97% | 8.61%f | ||||||||||||
Expenses net of waiver and payments by affiliates | 1.20% | 1.20% | 1.20% | g | 1.21% | f,g | ||||||||||
Expenses incurred in connection with securities sold short | —% | —% | —% | 0.01% | ||||||||||||
Net investment income | 3.14% | 2.12% | 2.07% | 1.27% | ||||||||||||
Supplemental data | ||||||||||||||||
Net assets, end of period (000’s) | $ | 1,010 | $ | 966 | $ | 1,204 | $ | 1,182 | ||||||||
Portfolio turnover rate | 13.24% | 67.91% | 41.11% | 41.84% | ||||||||||||
aFor the period June 15, 2009 (commencement of operations) to December 31, 2009.
bThe amount shown for a share outstanding throughout the period may not correlate with the Statement of Operations for the period due to the timing of sales and repurchases of the Fund shares in relation to income earned and/or fluctuating market value of the investments of the Fund.
cBased on average daily shares outstanding.
dTotal return does not include fees, charges or expenses imposed by the variable annuity and life insurance contracts for which the Franklin Templeton Variable Insurance Products Trust serves as an underlying investment vehicle. Total return is not annualized for periods less than one year.
eRatios are annualized for periods less than one year.
fIncludes dividend expense on securities sold short and borrowing fees, if any. See below for the ratios of such expenses to average net assets for the period
presented.
gBenefit of expense reduction round to less than 0.01%.
The accompanying notes are an integral part of these financial statements.
MI-9
Franklin Templeton Variable Insurance Products Trust
Financial Highlights (continued)
Mutual International Securities Fund
Six Months (unaudited) | Year Ended December 31, | |||||||||||||||
| Class 4 | 2011 | 2010 | 2009a | |||||||||||||
| ||||||||||||||||
Per share operating performance | ||||||||||||||||
(for a share outstanding throughout the period) | ||||||||||||||||
Net asset value, beginning of period | $ | 9.65 | $ | 12.04 | $ | 11.81 | $ | 10.00 | ||||||||
|
| |||||||||||||||
Income from investment operationsb: | ||||||||||||||||
Net investment incomec | 0.16 | 0.23 | 0.24 | 0.07 | ||||||||||||
Net realized and unrealized gains (losses) | 0.28 | (1.68 | ) | 1.51 | 2.29 | |||||||||||
|
| |||||||||||||||
Total from investment operations | 0.44 | (1.45 | ) | 1.75 | 2.36 | |||||||||||
|
| |||||||||||||||
Less distributions from: | ||||||||||||||||
Net investment income | — | (0.28 | ) | (0.65 | ) | (0.12 | ) | |||||||||
Net realized gains | — | (0.66 | ) | (0.87 | ) | (0.43 | ) | |||||||||
|
| |||||||||||||||
Total distributions | — | (0.94 | ) | (1.52 | ) | (0.55 | ) | |||||||||
|
| |||||||||||||||
Net asset value, end of period | $ | 10.09 | $ | 9.65 | $ | 12.04 | $ | 11.81 | ||||||||
|
| |||||||||||||||
Total returnd | 4.56% | (12.10)% | 15.49% | 23.76% | ||||||||||||
Ratios to average net assetse | ||||||||||||||||
Expenses before waiver and payments by affiliates | 6.41% | 5.23% | 5.07% | 8.71% | f | |||||||||||
Expenses net of waiver and payments by affiliates | 1.30% | 1.30% | 1.30% | g | 1.31% | f,g | ||||||||||
Expenses incurred in connection with securities sold short | —% | —% | —% | 0.01% | ||||||||||||
Net investment income | 3.04% | 2.02% | 1.97% | 1.17% | ||||||||||||
Supplemental data | ||||||||||||||||
Net assets, end of period (000’s) | $ | 1,009 | $ | 965 | $ | 1,204 | $ | 1,181 | ||||||||
Portfolio turnover rate | 13.24% | 67.91% | 41.11% | 41.84% | ||||||||||||
aFor the period June 15, 2009 (commencement of operations) to December 31, 2009.
bThe amount shown for a share outstanding throughout the period may not correlate with the Statement of Operations for the period due to the timing of sales and repurchases of the Fund shares in relation to income earned and/or fluctuating market value of the investments of the Fund.
cBased on average daily shares outstanding.
dTotal return does not include fees, charges or expenses imposed by the variable annuity and life insurance contracts for which the Franklin Templeton Variable Insurance Products Trust serves as an underlying investment vehicle. Total return is not annualized for periods less than one year.
eRatios are annualized for periods less than one year.
fIncludes dividend expense on securities sold short and borrowing fees, if any. See below for the ratios of such expenses to average net assets for the period presented.
gBenefit of expense reduction round to less than 0.01%.
The accompanying notes are an integral part of these financial statements.
MI-10
Franklin Templeton Variable Insurance Products Trust
Statement of Investments, June 30, 2012 (unaudited)
| Mutual International Securities Fund | Country | Shares/ Rights | Value | |||||||
Common Stocks and Other Equity Interests 90.4% | ||||||||||
Aerospace & Defense 1.0% | ||||||||||
Safran SA | France | 561 | $ | 20,732 | ||||||
|
| |||||||||
Air Freight & Logistics 0.3% | ||||||||||
PostNL NV | Netherlands | 813 | 3,344 | |||||||
TNT Express NV | Netherlands | 261 | 3,052 | |||||||
|
| |||||||||
| 6,396 | ||||||||||
|
| |||||||||
Auto Components 2.5% | ||||||||||
Continental AG | Germany | 395 | 32,804 | |||||||
Valeo SA | France | 415 | 17,065 | |||||||
|
| |||||||||
| 49,869 | ||||||||||
|
| |||||||||
Automobiles 0.0%† | ||||||||||
Daimler AG | Germany | 1 | 45 | |||||||
|
| |||||||||
Beverages 2.1% | ||||||||||
Asahi Group Holdings Ltd. | Japan | 1,093 | 23,352 | |||||||
aPernod Ricard SA | France | 180 | 19,195 | |||||||
|
| |||||||||
| 42,547 | ||||||||||
|
| |||||||||
Capital Markets 2.8% | ||||||||||
F&C Asset Management PLC | United Kingdom | 17,090 | 22,244 | |||||||
Sun Hung Kai & Co. Ltd. | Hong Kong | 28,298 | 14,007 | |||||||
UBS AG | Switzerland | 1,703 | 19,829 | |||||||
|
| |||||||||
| 56,080 | ||||||||||
|
| |||||||||
Chemicals 3.7% | ||||||||||
Akzo Nobel NV | Netherlands | 255 | 11,954 | |||||||
Huabao International Holdings Ltd. | Hong Kong | 40,000 | 19,489 | |||||||
Koninklijke DSM NV | Netherlands | 439 | 21,557 | |||||||
Linde AG | Germany | 141 | 21,887 | |||||||
|
| |||||||||
| 74,887 | ||||||||||
|
| |||||||||
Commercial Banks 7.9% | ||||||||||
Aozora Bank Ltd. | Japan | 13,951 | 32,963 | |||||||
Barclays PLC | United Kingdom | 6,340 | 16,176 | |||||||
Hana Financial Group Inc. | South Korea | 780 | 24,740 | |||||||
HSBC Holdings PLC | United Kingdom | 2,990 | 26,288 | |||||||
KB Financial Group Inc. | South Korea | 534 | 17,265 | |||||||
bKorea Exchange Bank | South Korea | 3,070 | 21,922 | |||||||
Woori Finance Holdings Co. Ltd. | South Korea | 1,740 | 18,981 | |||||||
|
| |||||||||
| 158,335 | ||||||||||
|
| |||||||||
Commercial Services & Supplies 1.8% | ||||||||||
Edenred | France | 248 | 7,013 | |||||||
Transfield Services Ltd. | Australia | 16,225 | 30,145 | |||||||
|
| |||||||||
| 37,158 | ||||||||||
|
| |||||||||
Construction & Engineering 4.9% | ||||||||||
Boart Longyear Ltd. | Australia | 11,034 | 32,304 | |||||||
Henderson Investment Ltd. | Hong Kong | 312,750 | 22,978 | |||||||
bKHD Humboldt Wedag International AG | Germany | 3,290 | 20,486 | |||||||
Vinci SA | France | 490 | 22,812 | |||||||
|
| |||||||||
| 98,580 | ||||||||||
|
| |||||||||
MI-11
Franklin Templeton Variable Insurance Products Trust
Statement of Investments, June 30, 2012 (unaudited) (continued)
| Mutual International Securities Fund | Country | Shares/ Rights | Value | |||||||
Common Stocks and Other Equity Interests (continued) | ||||||||||
Construction Materials 1.4% | ||||||||||
CRH PLC | Ireland | 872 | $ | 16,675 | ||||||
SA des Ciments Vicat | France | 236 | 11,410 | |||||||
|
| |||||||||
| 28,085 | ||||||||||
|
| |||||||||
Consumer Finance 0.9% | ||||||||||
Samsung Card Co. Ltd. | South Korea | 610 | 17,050 | |||||||
|
| |||||||||
Containers & Packaging 1.8% | ||||||||||
Rexam PLC | United Kingdom | 5,555 | 36,623 | |||||||
|
| |||||||||
Diversified Financial Services 4.4% | ||||||||||
Deutsche Boerse AG | Germany | 169 | 9,097 | |||||||
First Pacific Co. Ltd. | Hong Kong | 25,752 | 26,655 | |||||||
bING Groep NV | Netherlands | 3,629 | 24,186 | |||||||
Osaka Securities Exchange Co. Ltd. | Japan | 5 | 28,128 | |||||||
|
| |||||||||
| 88,066 | ||||||||||
|
| |||||||||
Diversified Telecommunication Services 0.8% | ||||||||||
Vivendi SA | France | 919 | 17,016 | |||||||
|
| |||||||||
Electric Utilities 0.0% | ||||||||||
b,cAET&D Holdings No. 1 Pty. Ltd. | Australia | 6,987 | — | |||||||
|
| |||||||||
Electronic Equipment, Instruments & Components 1.4% | ||||||||||
Hoya Corp. | Japan | 1,300 | 28,392 | |||||||
|
| |||||||||
Energy Equipment & Services 0.9% | ||||||||||
bDockwise Ltd. | Netherlands | 410 | 6,434 | |||||||
bSBM Offshore NV | Netherlands | 885 | 12,192 | |||||||
|
| |||||||||
| 18,626 | ||||||||||
|
| |||||||||
Food & Staples Retailing 4.2% | ||||||||||
FamilyMart Co. Ltd. | Japan | 625 | 28,519 | |||||||
Koninklijke Ahold NV | Netherlands | 1,634 | 20,213 | |||||||
Lawson Inc. | Japan | 306 | 21,346 | |||||||
Metro AG | Germany | 523 | 15,227 | |||||||
|
| |||||||||
| 85,305 | ||||||||||
|
| |||||||||
Food Products 1.4% | ||||||||||
China Fishery Group Ltd. | Singapore | 41,035 | 28,339 | |||||||
|
| |||||||||
Hotels, Restaurants & Leisure 4.8% | ||||||||||
Accor SA | France | 553 | 17,273 | |||||||
Ladbrokes PLC | United Kingdom | 8,018 | 19,754 | |||||||
Mandarin Oriental International Ltd. | Hong Kong | 18,000 | 23,220 | |||||||
REXLot Holdings Ltd. | Hong Kong | 510,168 | 36,168 | |||||||
|
| |||||||||
| 96,415 | ||||||||||
|
| |||||||||
Household Durables 2.1% | ||||||||||
bThe Berkeley Group Holdings PLC | United Kingdom | 1,024 | 22,629 | |||||||
Skyworth Digital Holdings Ltd. | Hong Kong | 44,861 | 19,776 | |||||||
|
| |||||||||
| 42,405 | ||||||||||
|
| |||||||||
Industrial Conglomerates 2.6% | ||||||||||
Jardine Matheson Holdings Ltd. | Hong Kong | 473 | 22,893 | |||||||
Jardine Strategic Holdings Ltd. | Hong Kong | 364 | 11,102 | |||||||
MI-12
Franklin Templeton Variable Insurance Products Trust
Statement of Investments, June 30, 2012 (unaudited) (continued)
| Mutual International Securities Fund | Country | Shares/ Rights | Value | |||||||
Common Stocks and Other Equity Interests (continued) | ||||||||||
Industrial Conglomerates (continued) | ||||||||||
Shanghai Industrial Holdings Ltd. | China | 6,650 | $ | 17,486 | ||||||
|
| |||||||||
| 51,481 | ||||||||||
|
| |||||||||
Insurance 11.4% | ||||||||||
ACE Ltd. | United States | 325 | 24,092 | |||||||
Ageas | Belgium | 9,527 | 18,810 | |||||||
AXA SA | France | 1,143 | 15,160 | |||||||
Catlin Group Ltd. | United Kingdom | 3,741 | 24,963 | |||||||
Great Eastern Holdings Ltd. | Singapore | 2,000 | 20,126 | |||||||
Hiscox Ltd. | United Kingdom | 3,383 | 22,680 | |||||||
Lancashire Holdings Ltd. | United Kingdom | 1,803 | 22,507 | |||||||
Resolution Ltd. | United Kingdom | 7,611 | 23,372 | |||||||
RSA Insurance Group PLC | United Kingdom | 19,320 | 32,707 | |||||||
Zurich Insurance Group AG | Switzerland | 115 | 25,872 | |||||||
|
| |||||||||
| 230,289 | ||||||||||
|
| |||||||||
Internet Software & Services 0.4% | ||||||||||
Gree Inc. | Japan | 400 | 7,906 | |||||||
|
| |||||||||
IT Services 0.6% | ||||||||||
Polaris Financial Technology Ltd. | India | 5,415 | 12,428 | |||||||
|
| |||||||||
Machinery 1.6% | ||||||||||
Bradken Ltd. | Australia | 3,031 | 16,103 | |||||||
bKUKA AG | Germany | 690 | 15,487 | |||||||
|
| |||||||||
| 31,590 | ||||||||||
|
| |||||||||
Marine 1.3% | ||||||||||
A.P. Moller - Maersk AS, B | Denmark | 4 | 26,176 | |||||||
|
| |||||||||
Media 2.8% | ||||||||||
Eutelsat Communications | France | 233 | 7,155 | |||||||
Reed Elsevier PLC | United Kingdom | 1,960 | 15,715 | |||||||
Sinomedia Holding Ltd. | China | 88,017 | 34,036 | |||||||
|
| |||||||||
| 56,906 | ||||||||||
|
| |||||||||
Metals & Mining 0.6% | ||||||||||
ThyssenKrupp AG | Germany | 746 | 12,118 | |||||||
|
| |||||||||
Multi-Utilities 1.9% | ||||||||||
E.ON AG | Germany | 927 | 19,944 | |||||||
GDF Suez | France | 798 | 18,942 | |||||||
|
| |||||||||
| 38,886 | ||||||||||
|
| |||||||||
Multiline Retail 2.0% | ||||||||||
Hyundai Department Store Co. Ltd. | South Korea | 86 | 10,700 | |||||||
Marks & Spencer Group PLC | United Kingdom | 2,614 | 13,310 | |||||||
New World Department Store China | China | 32,000 | 17,159 | |||||||
|
| |||||||||
| 41,169 | ||||||||||
|
| |||||||||
Oil, Gas & Consumable Fuels 2.8% | ||||||||||
BP PLC | United Kingdom | 2,920 | 19,302 | |||||||
Repsol YPF SA | Spain | 953 | 15,245 | |||||||
Repsol YPF SA, rts., 7/05/12 | Spain | 937 | 657 | |||||||
Royal Dutch Shell PLC, A | United Kingdom | 634 | 21,348 | |||||||
|
| |||||||||
| 56,552 | ||||||||||
|
| |||||||||
MI-13
Franklin Templeton Variable Insurance Products Trust
Statement of Investments, June 30, 2012 (unaudited) (continued)
| Mutual International Securities Fund | Country | Shares/ Rights | Value | |||||||
Common Stocks and Other Equity Interests (continued) | ||||||||||
Pharmaceuticals 4.2% | ||||||||||
Novartis AG | Switzerland | 495 | $ | 27,593 | ||||||
Roche Holding AG | Switzerland | 144 | 24,824 | |||||||
Sanofi | France | 167 | 12,626 | |||||||
Teva Pharmaceutical Industries Ltd., ADR | Israel | 520 | 20,509 | |||||||
|
| |||||||||
| 85,552 | ||||||||||
|
| |||||||||
Real Estate Investment Trusts (REITs) 1.6% | ||||||||||
The Link REIT | Hong Kong | 4,000 | 16,293 | |||||||
Parkway Life REIT | Singapore | 11,000 | 16,322 | |||||||
|
| |||||||||
| 32,615 | ||||||||||
|
| |||||||||
Real Estate Management & Development 1.2% | ||||||||||
Franshion Properties China Ltd. | China | 80,390 | 24,144 | |||||||
|
| |||||||||
Software 0.6% | ||||||||||
Nintendo Co. Ltd. | Japan | 100 | 11,564 | |||||||
|
| |||||||||
Tobacco 2.6% | ||||||||||
British American Tobacco PLC | United Kingdom | 521 | 26,472 | |||||||
Imperial Tobacco Group PLC | United Kingdom | 670 | 25,797 | |||||||
|
| |||||||||
| 52,269 | ||||||||||
|
| |||||||||
Wireless Telecommunication Services 1.1% | ||||||||||
Vodafone Group PLC | United Kingdom | 8,056 | 22,624 | |||||||
|
| |||||||||
Total Common Stocks and Other Equity Interests (Cost $1,829,753) | 1,825,220 | |||||||||
|
| |||||||||
Preferred Stocks (Cost $4,983) 0.5% | ||||||||||
Automobiles 0.5% | ||||||||||
Volkswagen AG, pfd. | Germany | 61 | 9,619 | |||||||
|
| |||||||||
Total Investments before Short Term Investments (Cost $1,834,736) | 1,834,839 | |||||||||
|
| |||||||||
Short Term Investments (Cost $18,974) 0.9% | ||||||||||
dInvestments from Cash Collateral Received for Loaned Securities 0.9% | ||||||||||
Money Market Funds 0.9% | ||||||||||
eBNY Mellon Overnight Government Fund, 0.182% | United States | 18,974 | 18,974 | |||||||
|
| |||||||||
Total Investments (Cost $1,853,710) 91.8% | 1,853,813 | |||||||||
Other Assets, less Liabilities 8.2% | 164,848 | |||||||||
|
| |||||||||
Net Assets 100.0% | $ | 2,018,661 | ||||||||
|
| |||||||||
†Rounds to less than 0.1% of net assets.
aA portion or all of the security is on loan at June 30, 2012. See Note 1(d).
bNon-income producing.
cSee Note 8 regarding restricted securities.
dSee Note 1(d) regarding securities on loan.
eThe rate shown is the annualized seven-day yield at period end.
MI-14
Franklin Templeton Variable Insurance Products Trust
Statement of Investments, June 30, 2012 (unaudited) (continued)
| Mutual International Securities Fund |
At June 30, 2012, the Fund had the following forward exchange contracts outstanding. See Note 1(c).
Forward Exchange Contracts
| Currency | Counterparty | Type | Quantity | Contract Amount | Settlement Date | Unrealized Appreciation | Unrealized Depreciation | |||||||||||||||||||||
Euro | DBAB | Buy | 36,488 | $ | 47,697 | 7/17/12 | $ | — | $ | (1,511 | ) | |||||||||||||||||
Euro | SSBT | Buy | 20,600 | 27,156 | 7/17/12 | — | (1,081 | ) | ||||||||||||||||||||
Euro | BOFA | Buy | 10,706 | 14,054 | 7/17/12 | — | (502 | ) | ||||||||||||||||||||
Euro | HSBC | Sell | 17,187 | 21,678 | 7/17/12 | — | (77 | ) | ||||||||||||||||||||
Euro | FBCO | Sell | 4,487 | 5,677 | 7/17/12 | — | (3 | ) | ||||||||||||||||||||
Euro | BZWS | Buy | 277 | 343 | 7/17/12 | 7 | — | |||||||||||||||||||||
Euro | HSBC | Buy | 5,003 | 6,193 | 7/17/12 | 140 | — | |||||||||||||||||||||
Euro | DBAB | Buy | 255 | 316 | 7/17/12 | 7 | — | |||||||||||||||||||||
Euro | SSBT | Buy | 650 | 807 | 7/17/12 | 15 | — | |||||||||||||||||||||
Euro | SSBT | Sell | 404,626 | 530,376 | 7/17/12 | 18,205 | — | |||||||||||||||||||||
Euro | BZWS | Sell | 7,586 | 9,900 | 7/17/12 | 298 | — | |||||||||||||||||||||
Euro | HSBC | Sell | 18,794 | 24,658 | 7/17/12 | 869 | — | |||||||||||||||||||||
Euro | DBAB | Sell | 17,777 | 23,315 | 7/17/12 | 814 | — | |||||||||||||||||||||
Euro | BOFA | Sell | 1,122 | 1,423 | 7/17/12 | 3 | — | |||||||||||||||||||||
South Korean Won | BOFA | Sell | 27,086,840 | 23,331 | 8/10/12 | — | (331 | ) | ||||||||||||||||||||
South Korean Won | DBAB | Sell | 8,221,500 | 7,152 | 8/10/12 | — | (30 | ) | ||||||||||||||||||||
South Korean Won | BOFA | Buy | 16,736,780 | 14,388 | 8/10/12 | 233 | — | |||||||||||||||||||||
South Korean Won | BOFA | Sell | 81,077,040 | 71,731 | 8/10/12 | 905 | — | |||||||||||||||||||||
Swiss Franc | DBAB | Buy | 2,825 | 3,110 | 8/10/12 | — | (130 | ) | ||||||||||||||||||||
Swiss Franc | SSBT | Buy | 960 | 1,066 | 8/10/12 | — | (53 | ) | ||||||||||||||||||||
Swiss Franc | BOFA | Buy | 621 | 676 | 8/10/12 | — | (21 | ) | ||||||||||||||||||||
Swiss Franc | HSBC | Sell | 1,700 | 1,785 | 8/10/12 | — | (8 | ) | ||||||||||||||||||||
Swiss Franc | HSBC | Buy | 248 | 268 | 8/10/12 | — | (6 | ) | ||||||||||||||||||||
Swiss Franc | BZWS | Buy | 595 | 631 | 8/10/12 | — | (3 | ) | ||||||||||||||||||||
Swiss Franc | DBAB | Sell | 587 | 617 | 8/10/12 | — | (3 | ) | ||||||||||||||||||||
Swiss Franc | SSBT | Buy | 470 | 485 | 8/10/12 | 11 | — | |||||||||||||||||||||
Swiss Franc | DBAB | Buy | 621 | 644 | 8/10/12 | 11 | — | |||||||||||||||||||||
Swiss Franc | BOFA | Buy | 202 | 209 | 8/10/12 | 4 | — | |||||||||||||||||||||
Swiss Franc | BOFA | Sell | 33,432 | 36,639 | 8/10/12 | 1,373 | — | |||||||||||||||||||||
Swiss Franc | DBAB | Sell | 31,187 | 34,211 | 8/10/12 | 1,314 | — | |||||||||||||||||||||
Swiss Franc | SSBT | Sell | 8,010 | 8,874 | 8/10/12 | 425 | — | |||||||||||||||||||||
British Pound | HSBC | Sell | 6,762 | 10,559 | 8/16/12 | — | (34 | ) | ||||||||||||||||||||
British Pound | SSBT | Sell | 1,800 | 2,807 | 8/16/12 | — | (13 | ) | ||||||||||||||||||||
British Pound | BZWS | Sell | 820 | 1,276 | 8/16/12 | — | (9 | ) | ||||||||||||||||||||
British Pound | SSBT | Sell | 179,969 | 284,711 | 8/16/12 | 2,780 | — | |||||||||||||||||||||
British Pound | DBAB | Sell | 3,000 | 4,719 | 8/16/12 | 19 | — | |||||||||||||||||||||
Japanese Yen | HSBC | Sell | 15,795,735 | 194,769 | 10/22/12 | — | (3,038 | ) | ||||||||||||||||||||
Japanese Yen | HSBC | Buy | 734,534 | 9,313 | 10/22/12 | — | (115 | ) | ||||||||||||||||||||
Japanese Yen | DBAB | Buy | 622,242 | 7,831 | 10/22/12 | — | (39 | ) | ||||||||||||||||||||
Japanese Yen | DBAB | Buy | 318,000 | 3,971 | 10/22/12 | 11 | — | |||||||||||||||||||||
Japanese Yen | HSBC | Buy | 1,371,366 | 17,075 | 10/22/12 | 99 | — | |||||||||||||||||||||
Japanese Yen | DBAB | Sell | 963,400 | 12,271 | 10/22/12 | 207 | — | |||||||||||||||||||||
|
| |||||||||||||||||||||||||||
Unrealized appreciation (depreciation) |
| 27,750 | (7,007 | ) | ||||||||||||||||||||||||
|
| |||||||||||||||||||||||||||
Net unrealized appreciation (depreciation) |
| $ | 20,743 | |||||||||||||||||||||||||
|
| |||||||||||||||||||||||||||
See Abbreviations on page MI-26.
The accompanying notes are an integral part of these financial statements.
MI-15
Franklin Templeton Variable Insurance Products Trust
Financial Statements
Statement of Assets and Liabilities
June 30, 2012 (unaudited)
| Mutual International Securities Fund | ||||
Assets: | ||||
Investments in securities: | ||||
Cost | $ | 1,853,710 | ||
|
| |||
Value (includes securities loaned in the amount of $19,088) | $ | 1,853,813 | ||
Cash | 57,131 | |||
Foreign currency, at value (cost $94,063) | 95,058 | |||
Receivables: | ||||
Investment securities sold | 6,101 | |||
Dividends | 5,150 | |||
Affiliates | 40,853 | |||
Unrealized appreciation on forward exchange contracts | 27,750 | |||
|
| |||
Total assets | 2,085,856 | |||
|
| |||
Liabilities: | ||||
Payables: | ||||
Investment securities purchased | 3,068 | |||
Reports to shareholders | 5,341 | |||
Professional fees | 26,107 | |||
Pricing fees | 5,440 | |||
Payable upon return of securities loaned | 18,974 | |||
Unrealized depreciation on forward exchange contracts | 7,007 | |||
Accrued expenses and other liabilities | 1,258 | |||
|
| |||
Total liabilities | 67,195 | |||
|
| |||
Net assets, at value | $ | 2,018,661 | ||
|
| |||
Net assets consist of: | ||||
Paid-in capital | $ | 1,997,140 | ||
Undistributed net investment income | 391 | |||
Net unrealized appreciation (depreciation) | 21,953 | |||
Accumulated net realized gain (loss) | (823 | ) | ||
|
| |||
Net assets, at value | $ | 2,018,661 | ||
|
| |||
Class 2: | ||||
Net assets, at value | $ | 1,009,733 | ||
|
| |||
Shares outstanding | 100,000 | |||
|
| |||
Net asset value and maximum offering price per share | $ | 10.10 | ||
|
| |||
Class 4: | ||||
Net assets, at value | $ | 1,008,928 | ||
|
| |||
Shares outstanding | 100,000 | |||
|
| |||
Net asset value and maximum offering price per share | $ | 10.09 | ||
|
| |||
The accompanying notes are an integral part of these financial statements.
MI-16
Franklin Templeton Variable Insurance Products Trust
Financial Statements (continued)
Statement of Operations
for the six months ended June 30, 2012 (unaudited)
| Mutual International Securities Fund | ||||
Investment income: | ||||
Dividends (net of foreign taxes of $3,282) | $ | 43,859 | ||
Income from securities loaned | 838 | |||
|
| |||
Total investment income | 44,697 | |||
|
| |||
Expenses: | ||||
Management fees (Note 3a) | 8,234 | |||
Administrative fees (Note 3b) | 2,573 | |||
Distribution fees: (Note 3c) | ||||
Class 2 | 1,287 | |||
Class 4 | 1,801 | |||
Custodian fees (Note 4) | 825 | |||
Reports to shareholders | 5,917 | |||
Professional fees | 31,497 | |||
Pricing fees | 12,644 | |||
Other | 748 | |||
|
| |||
Total expenses | 65,526 | |||
Expenses waived/paid by affiliates (Note 3e) | (52,660 | ) | ||
|
| |||
Net expenses | 12,866 | |||
|
| |||
Net investment income | 31,831 | |||
|
| |||
Realized and unrealized gains (losses): | ||||
Net realized gain (loss) from: | ||||
Investments | 1,711 | |||
Foreign currency transactions | 43,203 | |||
|
| |||
Net realized gain (loss) | 44,914 | |||
|
| |||
Net change in unrealized appreciation (depreciation) on: | ||||
Investments | 41,382 | |||
Translation of other assets and liabilities denominated in foreign currencies | (30,629 | ) | ||
|
| |||
Net change in unrealized appreciation (depreciation) | 10,753 | |||
|
| |||
Net realized and unrealized gain (loss) | 55,667 | |||
|
| |||
Net increase (decrease) in net assets resulting from operations | $ | 87,498 | ||
|
| |||
The accompanying notes are an integral part of these financial statements.
MI-17
Franklin Templeton Variable Insurance Products Trust
Financial Statements (continued)
Statements of Changes in Net Assets
| Mutual International Securities Fund | ||||||||
| Six Months Ended June 30, 2012 (unaudited) | Year Ended December 31, 2011 | |||||||
| ||||||||
Increase (decrease) in net assets: | ||||||||
Operations: | ||||||||
Net investment income | $ | 31,831 | $ | 47,727 | ||||
Net realized gain (loss) from investments, foreign currency transactions | 44,914 | 27,154 | ||||||
Net change in unrealized appreciation (depreciation) on investments and translation of other assets and liabilities denominated in foreign currencies | 10,753 | (363,298 | ) | |||||
| ||||||||
Net increase (decrease) in net assets resulting from operations | 87,498 | (288,417 | ) | |||||
| ||||||||
Distributions to shareholders from: | ||||||||
Net investment income: | ||||||||
Class 2 | — | (28,830 | ) | |||||
Class 4 | — | (27,670 | ) | |||||
Net realized gains: | ||||||||
Class 2 | — | (65,960 | ) | |||||
Class 4 | — | (65,960 | ) | |||||
| ||||||||
Total distributions to shareholders | — | (188,420 | ) | |||||
| ||||||||
Net increase (decrease) in net assets | 87,498 | (476,837 | ) | |||||
Net assets: | ||||||||
Beginning of period | 1,931,163 | 2,408,000 | ||||||
| ||||||||
End of period | $ | 2,018,661 | $ | 1,931,163 | ||||
| ||||||||
Undistributed net investment income (distributions in excess of net investment income) included in net assets: | ||||||||
End of period | $ | 391 | $ | (31,440 | ) | |||
| ||||||||
The accompanying notes are an integral part of these financial statements.
MI-18
Franklin Templeton Variable Insurance Products Trust
Notes to Financial Statements (unaudited)
Mutual International Securities Fund
1. ORGANIZATION AND SIGNIFICANT ACCOUNTING POLICIES
Franklin Templeton Variable Insurance Products Trust (Trust) is registered under the Investment Company Act of 1940, as amended, (1940 Act) as an open-end investment company, consisting of twenty separate funds. The Mutual International Securities Fund (Fund) is included in this report. The financial statements of the remaining funds in the Trust are presented separately. Shares of the Fund are generally sold only to insurance company separate accounts to fund the benefits of variable life insurance policies or variable annuity contracts. The Fund offers two classes of shares: Class 2 and Class 4. Each class of shares differs by its distribution fees, voting rights on matters affecting a single class and its exchange privilege.
The following summarizes the Fund’s significant accounting policies.
a. Financial Instrument Valuation
The Fund’s investments in financial instruments are carried at fair value daily. Fair value is the price that would be received to sell an asset or paid to transfer a liability in an orderly transaction between market participants on the measurement date. Under procedures approved by the Trust’s Board of Trustees (the Board), the Fund’s administrator, investment manager and other affiliates have formed the Valuation and Liquidity Oversight Committee (VLOC). The VLOC provides administration and oversight of the Fund’s valuation policies and procedures, which are approved annually by the Board. Among other things, these procedures allow the Fund to utilize independent pricing services, quotations from securities and financial instrument dealers, and other market sources to determine fair value.
Equity securities listed on an exchange or on the NASDAQ National Market System are valued at the last quoted sale price or the official closing price of the day, respectively. Foreign equity securities are valued as of the close of trading on the foreign stock exchange on which the security is primarily traded, or the NYSE, whichever is earlier. The value is then converted into its U.S. dollar equivalent at the foreign exchange rate in effect at the close of the NYSE on the day that the value of the security is determined. Over-the-counter (OTC) securities are valued within the range of the most recent quoted bid and ask prices. Securities that trade in multiple markets or on multiple exchanges are valued according to the broadest and most representative market. Certain equity securities are valued based upon fundamental characteristics or relationships to similar securities. Investments in non-registered money market funds are valued at the closing net asset value.
Debt securities generally trade in the OTC market rather than on a securities exchange. The Fund’s pricing services use multiple valuation techniques to determine fair value. In instances where sufficient market activity exists, the pricing services may utilize a market-based approach through which quotes from market makers are used to determine fair value. In instances where sufficient market activity may not exist or is limited, the pricing services also utilize proprietary valuation models which may consider market characteristics such as benchmark yield curves, credit spreads, estimated default rates, anticipated market interest rate volatility, coupon rates, anticipated timing of principal repayments, underlying collateral, and other unique security features in order to estimate the relevant cash flows, which are then discounted to calculate the fair value. Securities denominated in a foreign currency are converted into their U.S. dollar equivalent at the foreign exchange rate in effect at the close of the NYSE on the date that the values of the foreign debt securities are determined.
Certain derivative financial instruments (derivatives) trade in the OTC market. The Fund’s pricing services use various techniques including industry standard option pricing models and proprietary discounted cash flow models to determine the fair value of those instruments. The Fund’s net benefit or obligation under the derivative contract, as measured by the fair market value of the contract, is included in net assets.
The Fund has procedures to determine the fair value of financial instruments for which market prices are not reliable or readily available. Under these procedures, the VLOC convenes on a regular basis to review such financial instruments and considers a number of factors, including significant unobservable valuation inputs, when arriving at fair value. The VLOC primarily employs a market-based approach which may use related or comparable assets or liabilities, recent transactions, market multiples, book values, and other relevant information for the investment to determine the fair value of the investment. An income-based
MI-19
Franklin Templeton Variable Insurance Products Trust
Notes to Financial Statements (unaudited) (continued)
Mutual International Securities Fund
1. ORGANIZATION AND SIGNIFICANT ACCOUNTING POLICIES (continued)
a. Financial Instrument Valuation (continued)
valuation approach may also be used in which the anticipated future cash flows of the investment are discounted to calculate fair value. Discounts may also be applied due to the nature or duration of any restrictions on the disposition of the investments. Due to the inherent uncertainty of valuations of such investments, the fair values may differ significantly from the values that would have been used had an active market existed. The VLOC employs various methods for calibrating these valuation approaches including a regular review of key inputs and assumptions, transactional back-testing or disposition analysis, and reviews of any related market activity.
Trading in securities on foreign securities stock exchanges and OTC markets may be completed before the daily close of business on the NYSE. Occasionally, events occur between the time at which trading in a foreign security is completed and the close of the NYSE that might call into question the reliability of the value of a portfolio security held by the Fund. As a result, differences may arise between the value of the Fund’s portfolio securities as determined at the foreign market close and the latest indications of value at the close of the NYSE. In order to minimize the potential for these differences, the VLOC monitors price movements following the close of trading in foreign stock markets through a series of country specific market proxies (such as baskets of American Depositary Receipts, futures contracts and exchange traded funds). These price movements are measured against established trigger thresholds for each specific market proxy to assist in determining if an event has occurred that may call into question the reliability of the values of the foreign securities held by the Fund. If such an event occurs, the securities may be valued using fair value procedures, which may include the use of independent pricing services.
b. Foreign Currency Translation
Portfolio securities and other assets and liabilities denominated in foreign currencies are translated into U.S. dollars based on the exchange rate of such currencies against U.S. dollars on the date of valuation. The Fund may enter into foreign currency exchange contracts to facilitate transactions denominated in a foreign currency. Purchases and sales of securities, income and expense items denominated in foreign currencies are translated into U.S. dollars at the exchange rate in effect on the transaction date. Portfolio securities and assets and liabilities denominated in foreign currencies contain risks that those currencies will decline in value relative to the U.S. dollar. Occasionally, events may impact the availability or reliability of foreign exchange rates used to convert the U.S. dollar equivalent value. If such an event occurs, the foreign exchange rate will be valued at fair value using procedures established and approved by the Board.
The Fund does not separately report the effect of changes in foreign exchange rates from changes in market prices on securities held. Such changes are included in net realized and unrealized gain or loss from investments on the Statement of Operations.
Realized foreign exchange gains or losses arise from sales of foreign currencies, currency gains or losses realized between the trade and settlement dates on securities transactions and the difference between the recorded amounts of dividends, interest, and foreign withholding taxes and the U.S. dollar equivalent of the amounts actually received or paid. Net unrealized foreign exchange gains and losses arise from changes in foreign exchange rates on foreign denominated assets and liabilities other than investments in securities held at the end of the reporting period.
c. Derivative Financial Instruments
The Fund invested in derivatives in order to manage risk or gain exposure to various other investments or markets. Derivatives are financial contracts based on an underlying or notional amount, require no initial investment or an initial net investment that is smaller than would normally be required to have a similar response to changes in market factors, and require or permit net settlement. Derivatives contain various risks including the potential inability of the counterparty to fulfill their obligations under the terms of the contract, the potential for an illiquid secondary market, and/or the potential for market movements which expose the Fund to gains or losses in excess of the amounts shown on the Statement of Assets and Liabilities. Realized gain and loss and unrealized appreciation and depreciation on these contracts for the period are included in the Statement of Operations.
MI-20
Franklin Templeton Variable Insurance Products Trust
Notes to Financial Statements (unaudited) (continued)
Mutual International Securities Fund
1. ORGANIZATION AND SIGNIFICANT ACCOUNTING POLICIES (continued)
c. Derivative Financial Instruments (continued)
The Fund entered into forward exchange contracts primarily to manage exposure to certain foreign currencies. A forward exchange contract is an agreement between the Fund and a counterparty to buy or sell a foreign currency for a specific exchange rate on a future date. Pursuant to the terms of the forward exchange contracts, cash or securities may be required to be deposited as collateral. Unrestricted cash may be invested according to the Fund’s investment objectives.
The Fund’s investments in OTC derivatives are subject to the terms of International Swaps and Derivatives Association Master Agreements and other related agreements between the Fund and certain derivative counterparties. These agreements contain various provisions, including but not limited to collateral requirements, events of default, requirements for the Fund to maintain certain net asset levels and/or limit the decline in net assets over various periods of time. Should the Fund fail to meet any of these provisions, the derivative counterparty has the right to terminate the derivative contract and require immediate payment by the Fund for those OTC derivatives with that particular counterparty that are in a net unrealized loss position. At June 30, 2012, the Fund had OTC derivatives in a net unrealized loss position for such contracts of $2,173.
See Note 9 regarding other derivative information.
d. Securities Lending
The Fund participates in an agency based securities lending program. The fund receives cash collateral against the loaned securities in an amount equal to at least 102% of the market value of the loaned securities. Collateral is maintained over the life of the loan in an amount not less than 100% of the market value of loaned securities, as determined at the close of fund business each day; any additional collateral required due to changes in security values is delivered to the fund on the next business day. The collateral is invested in a non-registered money fund as indicated on the Statement of Investments. The fund receives income from the investment of cash collateral, in addition to lending fees and rebates paid by the borrower. The fund bears the market risk with respect to the collateral investment, securities loaned, and the risk that the agent may default on its obligations to the fund. The securities lending agent has agreed to indemnify the fund in the event of default by a third party borrower.
e. Income and Deferred Taxes
It is the Fund’s policy to qualify as a regulated investment company under the Internal Revenue Code. The Fund intends to distribute to shareholders substantially all of its taxable income and net realized gains to relieve it from federal income and if applicable, excise taxes. As a result, no provision for U.S. federal income taxes is required.
The Fund may be subject to foreign taxation related to income received, capital gains on the sale of securities and certain foreign currency transactions in the foreign jurisdictions in which it invests. Foreign taxes, if any, are recorded based on the tax regulations and rates that exist in the foreign markets in which the Fund invests. When a capital gain tax is determined to apply the Fund records an estimated deferred tax liability in an amount that would be payable if the securities were disposed of on the valuation date.
The Fund recognizes the tax benefits of uncertain tax positions only when the position is “more likely than not” to be sustained upon examination by the tax authorities based on the technical merits of the tax position. As of June 30, 2012, and for all open tax years, the Fund has determined that no liability for unrecognized tax benefits is required in the Fund’s financial statements related to uncertain tax positions taken on a tax return (or expected to be taken on future tax returns). Open tax years are those that remain subject to examination and are based on each tax jurisdiction statute of limitation.
MI-21
Franklin Templeton Variable Insurance Products Trust
Notes to Financial Statements (unaudited) (continued)
Mutual International Securities Fund
1. ORGANIZATION AND SIGNIFICANT ACCOUNTING POLICIES (continued)
f. Security Transactions, Investment Income, Expenses and Distributions
Security transactions are accounted for on trade date. Realized gains and losses on security transactions are determined on a specific identification basis. Interest income and estimated expenses are accrued daily. Dividend income is recorded on the ex-dividend date except that certain dividends from foreign securities are recognized as soon as the Fund is notified of the ex-dividend date. Distributions to shareholders are recorded on the ex-dividend date and are determined according to income tax regulations (tax basis). Distributable earnings determined on a tax basis may differ from earnings recorded in accordance with accounting principles generally accepted in the United States of America. These differences may be permanent or temporary. Permanent differences are reclassified among capital accounts to reflect their tax character. These reclassifications have no impact on net assets or the results of operations. Temporary differences are not reclassified, as they may reverse in subsequent periods.
Common expenses incurred by the Trust are allocated among the funds based on the ratio of net assets of each fund to the combined net assets of the Trust. Fund specific expenses are charged directly to the fund that incurred the expense.
Realized and unrealized gains and losses and net investment income, not including class specific expenses, are allocated daily to each class of shares based upon the relative proportion of net assets of each class. Differences in per share distributions, by class, are generally due to differences in class specific expenses.
g. Accounting Estimates
The preparation of financial statements in accordance with accounting principles generally accepted in the United States of America requires management to make estimates and assumptions that affect the reported amounts of assets and liabilities at the date of the financial statements and the amounts of income and expenses during the reporting period. Actual results could differ from those estimates.
h. Guarantees and Indemnifications
Under the Trust’s organizational documents, its officers and trustees are indemnified by the Trust against certain liabilities arising out of the performance of their duties to the Trust. Additionally, in the normal course of business, the Trust, on behalf of the Fund, enters into contracts with service providers that contain general indemnification clauses. The Trust’s maximum exposure under these arrangements is unknown as this would involve future claims that may be made against the Trust that have not yet occurred. Currently, the Trust expects the risk of loss to be remote.
2. SHARES OF BENEFICIAL INTEREST
At June 30, 2012, there were an unlimited number of shares authorized (without par value). During the period ended June 30, 2012 and the year ended December 31, 2011, there were no transactions of the Fund’s shares.
3. TRANSACTIONS WITH AFFILIATES
Franklin Resources, Inc. is the holding company for various subsidiaries that together are referred to as Franklin Templeton Investments. Certain officers and trustees of the Fund are also officers and/or directors of the following subsidiaries:
| Subsidiary | Affiliation | |
Franklin Mutual Advisers, LLC (Franklin Mutual) | Investment manager | |
Franklin Templeton Services, LLC (FT Services) | Administrative manager | |
Franklin Templeton Distributors, Inc. (Distributors) | Principal underwriter | |
Franklin Templeton Investor Services, LLC (Investor Services) | Transfer agent |
MI-22
Franklin Templeton Variable Insurance Products Trust
Notes to Financial Statements (unaudited) (continued)
Mutual International Securities Fund
3. TRANSACTIONS WITH AFFILIATES (continued)
a. Management Fees
The Fund pays an investment management fee to Franklin Mutual based on the average daily net assets of the Fund as follows:
| Annualized Fee Rate | Net Assets | |
| 0.800% | Up to and including $4 billion | |
| 0.770% | Over $4 billion, up to and including $7 billion | |
| 0.750% | Over $7 billion, up to and including $10 billion | |
| 0.730% | In excess of $10 billion |
b. Administrative Fees
The Fund pays an administrative fee to FT Services of 0.25% per year of the average daily net assets of the Fund.
c. Distribution Fees
The Board adopted distribution plans for Class 2 and Class 4 shares pursuant to Rule 12b-1 under the 1940 Act. Under the Fund’s compensation distribution plans, the Fund pays Distributors for costs incurred in connection with the servicing, sale and distribution of the Fund’s shares up to 0.35% per year of its average daily net assets of each class. The Board has agreed to limit the current rate to 0.25% per year for Class 2.
d. Transfer Agent Fees
Investor Services, under terms of an agreement, performs shareholder servicing for the Fund and is not paid by the Fund for the services.
e. Waiver and Expense Reimbursements
FT Services and Franklin Mutual have contractually agreed in advance to waive or limit their respective fees and to assume as their own expense certain expenses otherwise payable by the Fund so that the common expenses (i.e. a combination of management fees, administrative fees, and other expenses, but excluding distribution fees, and acquired fund fees and expenses) for each class of the Fund do not exceed 0.95% (other than certain non-routine expenses or costs, including those relating to litigation, indemnification, reorganizations, and liquidations) until April 30, 2013.
f. Other Affiliated Transactions
At June 30, 2012, Franklin Advisers, Inc., an affiliate of the Investment Manager, owned 100% of the Fund’s outstanding shares.
4. EXPENSE OFFSET ARRANGEMENT
The Fund has entered into an arrangement with its custodian whereby credits realized as a result of uninvested cash balances are used to reduce a portion of the Fund’s custodian expenses. During the period ended June 30, 2012, there were no credits earned.
5. INCOME TAXES
At December 31, 2011, the Fund deferred post-October capital losses and late-year ordinary losses of $22,965 and $2,737, respectively.
MI-23
Franklin Templeton Variable Insurance Products Trust
Notes to Financial Statements (unaudited) (continued)
Mutual International Securities Fund
5. INCOME TAXES (continued)
At June 30, 2012, the cost of investments and net unrealized appreciation (depreciation) for income tax purposes were as follows:
Cost of investments | $ | 1,875,153 | ||
|
| |||
Unrealized appreciation | $ | 225,682 | ||
Unrealized depreciation | (247,022 | ) | ||
|
| |||
Net unrealized appreciation (depreciation) | $ | (21,340 | ) | |
|
| |||
Differences between income and/or capital gains as determined on a book basis and a tax basis are primarily due to differing treatments of foreign currency transactions, passive foreign investment company shares, corporate actions, and wash sales.
6. INVESTMENT TRANSACTIONS
Purchases and sales of investments (excluding short term securities) for the period ended June 30, 2012, aggregated $362,130 and $242,187, respectively.
7. CONCENTRATION OF RISK
Investing in foreign securities may include certain risks and considerations not typically associated with investing in U.S. securities, such as fluctuating currency values and changing local and regional economic, political and social conditions, which may result in greater market volatility. In addition, certain foreign securities may not be as liquid as U.S. securities.
8. RESTRICTED SECURITIES
The Fund invests in securities that are restricted under the Securities Act of 1933 (1933 Act) or which are subject to legal, contractual, or other agreed upon restrictions on resale. Restricted securities are often purchased in private placement transactions, and cannot be sold without prior registration unless the sale is pursuant to an exemption under the 1933 Act. Disposal of these securities may require greater effort and expense, and prompt sale at an acceptable price may be difficult. The Fund may have registration rights for restricted securities. The issuer generally incurs all registration costs.
At June 30, 2012, the Fund held investments in restricted securities, excluding certain securities exempt from registration under the 1933 Act deemed to be liquid, as follows:
| Shares | Issuer | Acquisition Date | Cost | Value | ||||||||||||
| 6,987 | AET&D Holdings No. 1 Pty. Ltd. (0.00% of Net Assets) | 10/13/10 | $ | — | $ | — | ||||||||||
9. OTHER DERIVATIVE INFORMATION
At June 30, 2012, the Fund has invested in derivative contracts which are reflected on the Statement of Assets and Liabilities as follows:
| Asset Derivatives | Liability Derivatives | |||||||||||
| Derivative Contracts Not Accounted for as Hedging Instruments | Statement of Assets and Liabilities Location | Fair Value Amount | Statement of Assets and Liabilities Location | Fair Value Amount | ||||||||
Foreign exchange contracts | Unrealized appreciation on forward exchange contracts | $ | 27,750 | Unrealized depreciation on forward exchange contracts | $ | 7,007 | ||||||
MI-24
Franklin Templeton Variable Insurance Products Trust
Notes to Financial Statements (unaudited) (continued)
Mutual International Securities Fund
9. OTHER DERIVATIVE INFORMATION (continued)
For the period ended June 30, 2012, the effect of derivative contracts on the Fund’s Statement of Operations was as follows:
| Derivative Contracts Not Accounted for as Hedging Instruments | Statement of Operations Locations | Realized Gain (Loss) for the Period | Change in Unrealized Appreciation (Depreciation) for the Period | |||||||
Foreign exchange contracts | Net realized gain (loss) from foreign currency transactions/ Net change in unrealized appreciation (depreciation) on translation of other assets and liabilities denominated in foreign currencies | $ | 47,289 | $ | (31,557 | ) | ||||
For the period ended 6/30/12, the average month end market value of derivatives represented 1.97% of average month end net assets. The average month end number of open derivative contracts for the period was 56.
See Note 1(c) regarding derivative financial instruments.
10. CREDIT FACILITY
The Fund, together with other U.S. registered and foreign investment funds (collectively, Borrowers), managed by Franklin Templeton Investments, are borrowers in a joint syndicated senior unsecured credit facility totaling $1.5 billion (Global Credit Facility) which matures on January 18, 2013. This Global Credit Facility provides a source of funds to the Borrowers for temporary and emergency purposes, including the ability to meet future unanticipated or unusually large redemption requests.
Under the terms of the Global Credit Facility, the Fund shall, in addition to interest charged on any borrowings made by the Fund and other costs incurred by the Fund, pay its share of fees and expenses incurred in connection with the implementation and maintenance of the Global Credit Facility, based upon its relative share of the aggregate net assets of all of the Borrowers, including an annual commitment fee of 0.08% based upon the unused portion of the Global Credit Facility, which is reflected in other expenses on the Statement of Operations. During the period ended June 30, 2012, the Fund did not use the Global Credit Facility.
11. FAIR VALUE MEASUREMENTS
The Fund follows a fair value hierarchy that distinguishes between market data obtained from independent sources (observable inputs) and the Fund’s own market assumptions (unobservable inputs). These inputs are used in determining the value of the Fund’s financial instruments and are summarized in the following fair value hierarchy:
| • | Level 1 – quoted prices in active markets for identical financial instruments |
| • | Level 2 – other significant observable inputs (including quoted prices for similar financial instruments, interest rates, prepayment speed, credit risk, etc.) |
| • | Level 3 – significant unobservable inputs (including the Fund’s own assumptions in determining the fair value of financial instruments) |
The inputs or methodology used for valuing financial instruments are not an indication of the risk associated with investing in those financial instruments.
For movements between the levels within the fair value hierarchy, the Fund has adopted a policy of recognizing the transfers as of the date of the underlying event which caused the movement.
MI-25
Franklin Templeton Variable Insurance Products Trust
Notes to Financial Statements (unaudited) (continued)
Mutual International Securities Fund
11. FAIR VALUE MEASUREMENTS (continued)
A summary of inputs used as of June 30, 2012, in valuing the Fund’s assets and liabilities carried at fair value, is as follows:
| Level 1 | Level 2 | Level 3 | Total | |||||||||||||
|
| |||||||||||||||
Assets: | ||||||||||||||||
Investments in Securities: | ||||||||||||||||
Equity Investmentsa,b | $ | 1,834,839 | $ | — | $ | —c | $ | 1,834,839 | ||||||||
Short Term Investments | — | 18,974 | — | 18,974 | ||||||||||||
|
| |||||||||||||||
Total Investments in Securities | $ | 1,834,839 | $ | 18,974 | $ | — | $ | 1,853,813 | ||||||||
|
| |||||||||||||||
Forward Exchange Contracts | — | 27,750 | — | 27,750 | ||||||||||||
Liabilities: | ||||||||||||||||
Forward Exchange Contracts | — | 7,007 | — | 7,007 | ||||||||||||
aIncludes common and preferred stocks.
bFor detailed categories, see the accompanying Statement of Investments.
cIncludes securities determined to have no value at June 30, 2012.
A reconciliation of assets in which Level 3 inputs are used in determining fair value is presented when there are significant Level 3 investments at the end of the period.
12. NEW ACCOUNTING PRONOUNCEMENTS
In December 2011, the Financial Accounting Standards Board (FASB) issued Accounting Standards Update (ASU) No. 2011-11, Balance Sheet (Topic 210): Disclosures about Offsetting Assets and Liabilities. The amendments in the ASU enhance disclosures about offsetting of financial assets and liabilities to enable investors to understand the effect of these arrangements on a fund’s financial position. The ASU is effective for interim and annual reporting periods beginning on or after January 1, 2013. The Fund believes the adoption of this ASU will not have a material impact on its financial statements.
13. SUBSEQUENT EVENTS
The Fund has evaluated subsequent events through the issuance of the financial statements and determined that no events have occurred that require disclosure.
ABBREVIATIONS | ||||
| Counterparty | Selected Portfolio | |||
| BOFA - Bank of America Corp. | ADR - American Depositary Receipt | |||
| BZWS - Barclays Bank PLC | ||||
| DBAB - Deutsche Bank AG | ||||
| FBCO - Credit Suisse Group AG | ||||
| HSBC - HSBC Bank USA, NA | ||||
| SSBT - State Street Bank and Trust Co. |
MI-26
MUTUAL SHARES SECURITIES FUND
This semiannual report for Mutual Shares Securities Fund covers the period ended June 30, 2012.
Performance Summary as of 6/30/12
Mutual Shares Securities Fund – Class 4 delivered a +5.83% total return for the six-month period ended 6/30/12.
Performance reflects the Fund’s Class 4 operating expenses, but does not include any contract fees, expenses or sales charges. If they had been included, performance would be lower. These charges and deductions, particularly for variable life policies, can have a significant effect on contract values and insurance benefits. See the contract prospectus for a complete description of these expenses, including sales charges.
Mutual Shares Securities Fund – Class 4
Performance data represent past performance, which does not guarantee future results. Investment return and principal value will fluctuate, and you may have a gain or loss when you sell your shares.
Current performance may differ from figures shown.
MS-1
Fund Goals and Main Investments: Mutual Shares Securities Fund seeks capital appreciation, with income as a secondary goal. Under normal market conditions, the Fund invests primarily in U.S. and foreign equity securities that the investment manager believes are undervalued.
Performance Overview
You can find the Fund’s six-month total return in the Performance Summary. The Fund underperformed its benchmark, the Standard & Poor’s® 500 Index (S&P 500®), which delivered a +9.49% total return for the period under review.1
Economic and Market Overview
The U.S. economy, as measured by gross domestic product, grew modestly during the six-month period ended June 30, 2012, as personal income and spending rose. The national unemployment rate for June 2012 stood at 8.2%, compared with 8.5% at the start of the period.2 Job growth was more pronounced in the first quarter, and jobless claims touched a four-year low; however, hiring slowed in the second quarter. Industrial production and manufacturing activity expanded during most of the period under review, but the manufacturing sector shrank unexpectedly in June. In keeping with its goal to strengthen U.S. economic recovery by fostering increased employment while keeping inflation in check, during June the Federal Reserve Board (Fed) extended through 2012 its program (dubbed Operation Twist) to buy long-term Treasuries in an attempt to lower long-term yields. The Fed also reaffirmed its intention to keep the federal funds target rate low at least through late 2014.
Global growth trends generally moderated, led by Europe, which narrowly avoided recession mainly because of German export strength. Yet, even the more resilient economies of Germany and China showed signs of a slowdown at period-end. The combination of flagging growth, political uncertainty and populist unrest pressured investor confidence, and ratings agencies downgraded global banks and European sovereigns. Concerns about Italian and Spanish borrowing costs added to investor anxiety as bond yields climbed. Europe’s initial policy responses — including enhanced liquidity measures and an ineffective Spanish banking bailout — did little to address the structural imbalances of eurozone economies or the solvency fears plaguing the region’s banking system.
1. Source: © 2012 Morningstar. One cannot invest directly in an index, and an index is not representative of the Fund’s portfolio. Please see Index Descriptions following the Fund Summaries.
2. Source: Bureau of Labor Statistics.
Fund Risks: All investments involve risks, including possible loss of principal. Stock prices fluctuate, sometimes rapidly and dramatically, due to factors affecting individual companies, particular industries or sectors, or general market conditions. Value securities may not increase in price as anticipated or may decline further in value. The risks of investment in foreign securities include currency fluctuations and economic and political uncertainty. Investments in companies engaged in mergers, reorganizations or liquidations involve special risks as pending deals may not be completed on time or on favorable terms, as well as lower rated bonds, which entail higher credit risk. The Fund is actively managed but there is no guarantee that the manager’s investment decisions will produce the desired results. The Fund’s prospectus also includes a description of the main investment risks.
MS-2
Global developed stock markets, as measured by the MSCI World Index, delivered the best annual start in more than a decade, as signs of U.S. economic recovery and European policy relief underpinned a rally in cyclical stocks.3 During late March and early April 2012, U.S. stocks, as measured by the S&P 500, reached multi-year highs. However, stocks dropped sharply in late spring amid renewed global economic weakness and European debt concerns before additional policy action prompted a rebound in June. Politics largely drove the markets during the first half of 2012 as investors closely monitored developments in Europe, where German-led austerity demands were met with increasing resentment from some highly indebted eurozone members. Fears of a Greek debt default and exit from the eurozone were somewhat mitigated in February by secured bailout financing and bondholder concessions, as well as May and June elections that resulted in the formation of a new coalition government. The Fed’s Operation Twist purchases and risk-averse investors seeking safety drove U.S. Treasury yields to historical lows during the period. In the latter part of the period, the euro declined while the U.S. dollar and Japanese yen made gains.
At the end of the reporting period, significant challenges to the U.S. and global economies remained, including weak jobs reports, lack of broad public and political agreement on how to achieve U.S. deficit reduction, and uncertainty surrounding deeply indebted European countries including Greece, Italy and Spain. Although long-term resolution of European debt issues remained unclear, the European Central Bank’s plan to allow the European Stability Mechanism to directly recapitalize troubled banks throughout the eurozone, as well as a late-June proposal leaning toward fiscal and banking union, supported cautious optimism in U.S. and global markets.
Investment Strategy
At Mutual Series, we are committed to our distinctive value approach to investing. Our major investment strategy is investing in undervalued stocks. When selecting undervalued equities, we are attracted to fundamentally strong companies with healthy balance sheets, high-quality assets, substantial free cash flow and shareholder-oriented management teams and whose stocks are trading at discounts to our assessment of the companies’ intrinsic or business value. We also look for asset rich companies whose shares may be trading at depressed levels due to concerns over short-term earnings disappointments, litigation, management strategy or other perceived negatives. While the
3. Please see Index Descriptions following the Fund Summaries.
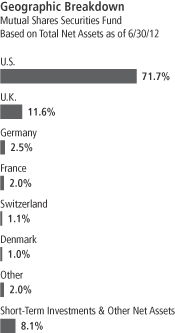
MS-3
vast majority of our undervalued equity investments are made in publicly traded companies globally, we may invest occasionally in privately held companies as well.
We complement this more traditional investment strategy with two others. One is distressed investing, which is complex and can take many forms. The most common distressed investment the Fund undertakes is the purchase of financially troubled or bankrupt companies’ debt at a substantial discount to face value. After the financially distressed company is reorganized, often in bankruptcy court, the old debt is typically replaced with new securities issued by the financially stronger company.
The other piece of our investment strategy is participating in arbitrage situations, another highly specialized field. When companies announce proposed mergers or takeovers, commonly referred to as “deals,” the target company may trade at a discount to the bid it ultimately accepts. One form of arbitrage involves purchasing the target company’s stock when it is trading below the value we believe it would receive in a deal. In keeping with our commitment to a relatively conservative investment approach, we typically focus our arbitrage efforts on announced deals, and eschew rumored deals or other situations we consider relatively risky.
In addition, it is our practice to hedge the Fund’s currency exposure when we deem it advantageous for our shareholders.
Manager’s Discussion
In an environment of generally rising U.S. equity prices, many Fund holdings increased in value during the six-month period. Three particularly strong performers were software company Microsoft, drugstore chain and pharmacy benefits manager CVS Caremark, and the second-largest U.S. cable company, Time Warner Cable (TWC).
Microsoft shares performed well as revenues grew, driven by sales of its Windows 7 operating system, the Office productivity suite, and strength in the Server and Tools division. Operating strength led company management to continue its policy of paying dividends and buying back shares. Also, the company released an early version of its next operating system, Windows 8, which will enable touch interaction and bring Windows to the world of tablets. Microsoft also announced it would be entering the hardware market with a tablet of its own, Surface. Given the potential stemming from the releases of Windows 8 and Surface and the ongoing success of Microsoft’s enterprise business, we consider this investment attractive at recent valuations.
Top 10 Sectors/Industries
Mutual Shares Securities Fund Based on Equity Securities 6/30/12
% of Total Net Assets | ||||
| Tobacco | 8.2% | |||
| Oil, Gas & Consumable Fuels | 8.2% | |||
| Media | 6.8% | |||
| Pharmaceuticals | 6.3% | |||
| Insurance | 6.0% | |||
| Food & Staples Retailing | 4.6% | |||
| Software | 3.4% | |||
| Food Products | 3.2% | |||
| Health Care Providers & Services | 3.2% | |||
| Beverages | 3.2% | |||
MS-4
CVS shares appreciated as management in May increased its 2012 guidance, reflecting strong first-quarter and 2011 results. Strong growth in pharmacy network claims processed and increases in same-store sales led to revenue growth across business segments, supporting the stock price during the period.
Positive operating results drove TWC’s share price higher as the company reported better-than-expected subscriber metrics and revenues and raised its 2012 free cash flow guidance. The company also raised its quarterly dividend and increased its share buyback authorization.
During the period under review, some of the Fund’s investments lost value and negatively impacted performance. These included U.S. oil and gas exploration and production company Marathon Oil, German industrial conglomerate ThyssenKrupp and U.S.-based integrated power company Texas Competitive Electric Holdings.
Marathon Oil hindered performance during the first half of 2012 as disappointing results combined with a sharp drop in oil prices to negatively impact investor sentiment. Based on our research, we viewed the high oil prices of the past year as unsustainable and took that into consideration in our valuation analyses. We were encouraged by continued progress in the company’s key underlying operating trends and continued to hold this position.
During the period, ThyssenKrupp’s operating performance was broadly in line with expectations, with the exception of the company’s Steel Europe and Americas businesses, which struggled due to cyclical pricing pressures and launch issues in the Americas. While the company continued to execute on its original restructuring plan, the uncertain and volatile macroeconomic environment weighed on operations, contributing to management’s recent announcement that it would explore all strategic options regarding the Steel Americas division. At period-end, we continued to see upside potential in our investment based on our view that ThyssenKrupp has a strong set of assets, manageable debt maturity ladder, ability to generate strong free cash flow and a restructuring plan designed to create value.
Our holdings of Texas Competitive Electric debt declined during the six months under review as depressed natural gas prices and uncertainty over the potential impact of the Cross-State Air Pollution Rule resulted in a challenging operating environment. Weak volumes and pricing continued to hinder performance, while depressed forward power curves diminished prospects for business to improve in the short term.
Top 10 Holdings
Mutual Shares Securities Fund 6/30/12
| Company Sector/Industry, Country | % of Total Net Assets | |||
| Merck & Co. Inc. | 3.0% | |||
| Pharmaceuticals, U.S. | ||||
| British American Tobacco PLC, ord. & ADR | 2.9% | |||
| Tobacco, U.K. | ||||
| Microsoft Corp. | 2.4% | |||
| Software, U.S. | ||||
| Kraft Foods Inc., A | 2.3% | |||
| Food Products, U.S. | ||||
| CVS Caremark Corp. | 2.2% | |||
| Food & Staples Retailing, U.S. | ||||
| Vodafone Group PLC | 2.0% | |||
| Wireless Telecommunication Services, U.K. | ||||
| Pfizer Inc. | 1.9% | |||
| Pharmaceuticals, U.S. | ||||
| Imperial Tobacco Group PLC | 1.8% | |||
| Tobacco, U.K. | ||||
| Royal Dutch Shell PLC, A | 1.8% | |||
| Oil, Gas & Consumable Fuels, U.K. | ||||
| Time Warner Cable Inc. | 1.7% | |||
| Media, U.S. | ||||
The dollar value, number of shares or principal amount, and names of all portfolio holdings are listed in the Fund’s Statement of Investments.
MS-5
During the period, the Fund held currency forwards and futures to somewhat hedge the currency risk of the portfolio’s non-U.S. dollar investments. The hedges had a negligible impact on the Fund’s performance.
Thank you for your participation in Mutual Shares Securities Fund. We look forward to serving your future investment needs.
The foregoing information reflects our analysis, opinions and portfolio holdings as of June 30, 2012, the end of the reporting period. The way we implement our main investment strategies and the resulting portfolio holdings may change depending on factors such as market and economic conditions. These opinions may not be relied upon as investment advice or an offer for a particular security. The information is not a complete analysis of every aspect of any market, country, industry, security or the Fund. Statements of fact are from sources considered reliable, but the investment manager makes no representation or warranty as to their completeness or accuracy. Although historical performance is no guarantee of future results, these insights may help you understand our investment management philosophy.
MS-6
Fund Expenses
As an investor in a variable insurance contract (Contract) that indirectly provides for investment in an underlying mutual fund, you can incur transaction and/or ongoing expenses at both the Fund level and the Contract level.
| • | Transaction expenses can include sales charges (loads) on purchases, surrender fees, transfer fees and premium taxes. |
| • | Ongoing expenses can include management fees, distribution and service (12b-1) fees, contract fees, annual maintenance fees, mortality and expense risk fees and other fees and expenses. All mutual funds and Contracts have some types of ongoing expenses. |
The expenses shown in the table are meant to highlight ongoing expenses at the Fund level only and do not include ongoing expenses at the Contract level, or transaction expenses at either the Fund or Contract levels. While the Fund does not have transaction expenses, if the transaction and ongoing expenses at the Contract level were included, the expenses shown below would be higher. You should consult your Contract prospectus or disclosure document for more information.
The table shows Fund-level ongoing expenses and can help you understand these expenses and compare them with those of other mutual funds offered through the Contract. The table assumes a $1,000 investment held for the six months indicated. Please refer to the Fund prospectus for additional information on operating expenses.
Actual Fund Expenses
The first line (Actual) of the table provides actual account values and expenses. The “Ending Account Value” is derived from the Fund’s actual return, which includes the effect of ongoing Fund expenses, but does not include the effect of ongoing Contract expenses.
You can estimate the Fund-level expenses you incurred during the period by following these steps. Of course, your account value and expenses will differ from those in this illustration:
| 1. | Divide your account value by $1,000. |
If an account had an $8,600 value, then $8,600 ÷ $1,000 = 8.6.
| 2. | Multiply the result by the number under the heading “Fund-Level Expenses Incurred During Period.” |
If Fund-Level Expenses Incurred During Period were $7.50, then 8.6 x $7.50 = $64.50.
In this illustration, the estimated expenses incurred this period at the Fund level are $64.50.
Mutual Shares Securities Fund – Class 4
MS-7
Hypothetical Example for Comparison with Other Mutual Funds
Information in the second line (Hypothetical) of the table can help you compare ongoing expenses of the Fund with those of other mutual funds offered through the Contract. This information may not be used to estimate the actual ending account balance or expenses you incurred during the period. The hypothetical “Ending Account Value” is based on the Fund’s actual expense ratio and an assumed 5% annual rate of return before expenses, which does not represent the Fund’s actual return. The figure under the heading “Fund-Level Expenses Incurred During Period” shows the hypothetical expenses your account would have incurred under this scenario. You can compare this figure with the 5% hypothetical examples that appear in shareholder reports of other funds offered through a Contract.
| Class 4 | Beginning Account Value 1/1/12 | Ending Account Value 6/30/12 | Fund-Level Expenses Incurred During Period* 1/1/12–6/30/12 | |||||||||
Actual | $ | 1,000 | $ | 1,058.30 | $ | 5.42 | ||||||
Hypothetical (5% return before expenses) | $ | 1,000 | $ | 1,019.59 | $ | 5.32 | ||||||
*Expenses are calculated using the most recent six-month annualized expense ratio for the Fund’s Class 4 shares (1.06%), which does not include any ongoing expenses of the Contract for which the Fund is an investment option, multiplied by the average account value over the period, multiplied by 182/366 to reflect the one-half year period.
MS-8
Franklin Templeton Variable Insurance Products Trust
Financial Highlights
Mutual Shares Securities Fund
| Six Months Ended June 30, 2012 (unaudited) | Year Ended December 31, | |||||||||||||||||||||||
| Class 1 | 2011 | 2010 | 2009 | 2008 | 2007 | |||||||||||||||||||
| ||||||||||||||||||||||||
Per share operating performance | ||||||||||||||||||||||||
(for a share outstanding throughout the period) | ||||||||||||||||||||||||
Net asset value, beginning of period | $ | 15.57 | $ | 16.14 | $ | 14.75 | $ | 11.92 | $ | 20.42 | $ | 20.67 | ||||||||||||
|
| |||||||||||||||||||||||
Income from investment operationsa: | ||||||||||||||||||||||||
Net investment incomeb | 0.18 | 0.38 | c | 0.40 | d | 0.23 | e | 0.34 | 0.54 | |||||||||||||||
Net realized and unrealized gains (losses) | 0.76 | (0.53 | ) | 1.27 | 2.89 | (7.54 | ) | 0.31 | ||||||||||||||||
|
| |||||||||||||||||||||||
Total from investment operations | 0.94 | (0.15 | ) | 1.67 | 3.12 | (7.20 | ) | 0.85 | ||||||||||||||||
|
| |||||||||||||||||||||||
Less distributions from: | ||||||||||||||||||||||||
Net investment income | — | (0.42 | ) | (0.28 | ) | (0.29 | ) | (0.57 | ) | (0.35 | ) | |||||||||||||
Net realized gains | — | — | — | — | (0.73 | ) | (0.75 | ) | ||||||||||||||||
|
| |||||||||||||||||||||||
Total distributions | — | (0.42 | ) | (0.28 | ) | (0.29 | ) | (1.30 | ) | (1.10 | ) | |||||||||||||
|
| |||||||||||||||||||||||
Net asset value, end of period | $ | 16.51 | $ | 15.57 | $ | 16.14 | $ | 14.75 | $ | 11.92 | $ | 20.42 | ||||||||||||
|
| |||||||||||||||||||||||
Total returnf | 6.04% | (0.79)% | 11.47% | 26.35% | (36.93)% | 3.72% | ||||||||||||||||||
Ratios to average net assetsg | ||||||||||||||||||||||||
Expensesh | 0.71% | 0.73% | i | 0.74% | i | 0.78% | i | 0.73% | i | 0.72% | i | |||||||||||||
Expenses incurred in connection with securities sold short | —% | —% | j | 0.02% | 0.06% | —% | j | —% | j | |||||||||||||||
Net investment income | 2.25% | 2.28% | c | 2.66% | d | 1.85% | e | 2.16% | 2.58% | |||||||||||||||
Supplemental data | ||||||||||||||||||||||||
Net assets, end of period (000’s) | $ | 1,301,298 | $ | 1,170,781 | $ | 1,301,520 | $ | 767,553 | $ | 319,703 | $ | 272,509 | ||||||||||||
Portfolio turnover rate | 20.49% | 41.02% | 32.05% | 49.33% | 44.11% | 41.73% | k | |||||||||||||||||
aThe amount shown for a share outstanding throughout the period may not correlate with the Statement of Operations for the period due to the timing of sales and repurchases of the Fund shares in relation to income earned and/or fluctuating market value of the investments of the Fund.
bBased on average daily shares outstanding.
cNet investment income per share includes approximately $0.02 per share related to interest income received that had previously been deemed uncollectible. Excluding this amount, the ratio of net investment income to average net assets would have been 2.14%.
dNet investment income per share includes approximately $0.11 per share received in the form of a special dividend paid in connection with a corporate real estate investment trust (REIT) conversion. Excluding this non-recurring amount, the ratio of the net investment income to average net assets would have been 1.93%.
eNet investment income per share includes approximately $(0.03) per share related to an adjustment for uncollectible interest. Excluding the effect of this
adjustment, the ratio of net investment income to average net assets would have been 2.08%.
fTotal return does not include fees, charges or expenses imposed by the variable annuity and life insurance contracts for which the Franklin Templeton Variable Insurance Products Trust serves as an underlying investment vehicle. Total return is not annualized for periods less than one year.
gRatios are annualized for periods less than one year.
hIncludes dividend expense on securities sold short and security borrowing fees, if any. See below for the ratios of such expenses to average net assets for the periods presented. See Note 1(f).
iBenefit of expense reduction rounds to less than 0.01%.
jRounds to less than 0.01%.
kExcludes the value of portfolio securities delivered as a result of redemption in-kind.
The accompanying notes are an integral part of these financial statements.
MS-9
Franklin Templeton Variable Insurance Products Trust
Financial Highlights (continued)
Mutual Shares Securities Fund
| Six Months Ended June 30, 2012 (unaudited) | Year Ended December 31, | |||||||||||||||||||||||
| Class 2 | 2011 | 2010 | 2009 | 2008 | 2007 | |||||||||||||||||||
| ||||||||||||||||||||||||
Per share operating performance | ||||||||||||||||||||||||
(for a share outstanding throughout the period) | ||||||||||||||||||||||||
Net asset value, beginning of period | $ | 15.38 | $ | 15.95 | $ | 14.58 | $ | 11.78 | $ | 20.19 | $ | 20.46 | ||||||||||||
|
| |||||||||||||||||||||||
Income from investment operationsa: | ||||||||||||||||||||||||
Net investment incomeb | 0.16 | 0.32 | c | 0.36 | d | 0.20 | e | 0.32 | 0.48 | |||||||||||||||
Net realized and unrealized gains (losses) | 0.74 | (0.51 | ) | 1.25 | 2.85 | (7.49 | ) | 0.31 | ||||||||||||||||
|
| |||||||||||||||||||||||
Total from investment operations | 0.90 | (0.19 | ) | 1.61 | 3.05 | (7.17 | ) | 0.79 | ||||||||||||||||
|
| |||||||||||||||||||||||
Less distributions from: | ||||||||||||||||||||||||
Net investment income | — | (0.38 | ) | (0.24 | ) | (0.25 | ) | (0.51 | ) | (0.31 | ) | |||||||||||||
Net realized gains | — | — | — | — | (0.73 | ) | (0.75 | ) | ||||||||||||||||
|
| |||||||||||||||||||||||
Total distributions | — | (0.38 | ) | (0.24 | ) | (0.25 | ) | (1.24 | ) | (1.06 | ) | |||||||||||||
|
| |||||||||||||||||||||||
Net asset value, end of period | $ | 16.28 | $ | 15.38 | $ | 15.95 | $ | 14.58 | $ | 11.78 | $ | 20.19 | ||||||||||||
|
| |||||||||||||||||||||||
Total returnf | 5.85% | (1.04)% | 11.19% | 26.05% | (37.11)% | 3.48% | ||||||||||||||||||
Ratios to average net assetsg | ||||||||||||||||||||||||
Expensesh | 0.96% | 0.98% | i | 0.99% | i | 1.03% | i | 0.98% | i | 0.97% | i | |||||||||||||
Expenses incurred in connection with securities sold short | —% | —% | j | 0.02% | 0.06% | —% | j | —% | j | |||||||||||||||
Net investment income | 2.00% | 2.03% | c | 2.41% | d | 1.60% | e | 1.91% | 2.33% | |||||||||||||||
Supplemental data | ||||||||||||||||||||||||
Net assets, end of period (000’s) | $ | 3,953,225 | $ | 3,913,220 | $ | 4,188,821 | $ | 3,953,435 | $ | 3,303,761 | $ | 5,925,551 | ||||||||||||
Portfolio turnover rate | 20.49% | 41.02% | 32.05% | 49.33% | 44.11% | 41.73% | k | |||||||||||||||||
aThe amount shown for a share outstanding throughout the period may not correlate with the Statement of Operations for the period due to the timing of sales and repurchases of the Fund shares in relation to income earned and/or fluctuating market value of the investments of the Fund.
bBased on average daily shares outstanding.
cNet investment income per share includes approximately $0.02 per share related to interest income received that had previously been deemed uncollectible. Excluding this amount, the ratio of net investment income to average net assets would have been 1.89%.
dNet investment income per share includes approximately $0.11 per share received in the form of a special dividend paid in connection with a corporate real estate investment trust (REIT) conversion. Excluding this non-recurring amount, the ratio of the net investment income to average net assets would have been 1.68%.
eNet investment income per share includes approximately $(0.03) per share related to an adjustment for uncollectible interest. Excluding the effect of this
adjustment, the ratio of net investment income to average net assets would have been 1.83%.
fTotal return does not include fees, charges or expenses imposed by the variable annuity and life insurance contracts for which the Franklin Templeton Variable Insurance Products Trust serves as an underlying investment vehicle. Total return is not annualized for periods less than one year.
gRatios are annualized for periods less than one year.
hIncludes dividend expense on securities sold short and security borrowing fees, if any. See below for the ratios of such expenses to average net assets for the periods presented. See Note 1(f).
iBenefit of expense reduction rounds to less than 0.01%.
jRounds to less than 0.01%.
kExcludes the value of portfolio securities delivered as a result of redemption in-kind.
The accompanying notes are an integral part of these financial statements.
MS-10
Franklin Templeton Variable Insurance Products Trust
Financial Highlights (continued)
Mutual Shares Securities Fund
| Six Months Ended June 30, 2012 (unaudited) | Year Ended December 31, | |||||||||||||||||||
| Class 4 | 2011 | 2010 | 2009 | 2008a | ||||||||||||||||
| ||||||||||||||||||||
Per share operating performance | ||||||||||||||||||||
(for a share outstanding throughout the period) | ||||||||||||||||||||
Net asset value, beginning of period | $ | 15.45 | $ | 16.03 | $ | 14.66 | $ | 11.88 | $ | 18.91 | ||||||||||
|
| |||||||||||||||||||
Income from investment operationsb: | ||||||||||||||||||||
Net investment incomec | 0.15 | 0.30 | d | 0.35 | e | 0.19 | f | 0.17 | ||||||||||||
Net realized and unrealized gains (losses) | 0.75 | (0.51 | ) | 1.26 | 2.87 | (5.90 | ) | |||||||||||||
|
| |||||||||||||||||||
Total from investment operations | 0.90 | (0.21 | ) | 1.61 | 3.06 | (5.73 | ) | |||||||||||||
|
| |||||||||||||||||||
Less distributions from: | ||||||||||||||||||||
Net investment income | — | (0.37 | ) | (0.24 | ) | (0.28 | ) | (0.57 | ) | |||||||||||
Net realized gains | — | — | — | — | (0.73 | ) | ||||||||||||||
|
| |||||||||||||||||||
Total distributions | — | (0.37 | ) | (0.24 | ) | (0.28 | ) | (1.30 | ) | |||||||||||
|
| |||||||||||||||||||
Net asset value, end of period | $ | 16.35 | $ | 15.45 | $ | 16.03 | $ | 14.66 | $ | 11.88 | ||||||||||
|
| |||||||||||||||||||
Total returng | 5.83% | (1.12)% | 11.06% | 25.94% | (32.12)% | |||||||||||||||
Ratios to average net assetsh | ||||||||||||||||||||
Expensesi | 1.06% | 1.08% | j | 1.09% | j | 1.13% | j | 1.08% | j | |||||||||||
Expenses incurred in connection with securities sold short | —% | —% | k | 0.02% | 0.06% | —% | k | |||||||||||||
Net investment income | 1.90% | 1.93% | d | 2.31% | e | 1.50% | f | 1.81% | ||||||||||||
Supplemental data | ||||||||||||||||||||
Net assets, end of period (000’s) | $ | 163,851 | $ | 162,049 | $ | 167,274 | $ | 141,446 | $ | 57,266 | ||||||||||
Portfolio turnover rate | 20.49% | 41.02% | 32.05% | 49.33% | 44.11% | |||||||||||||||
aFor the period February 29, 2008 (effective date) to December 31, 2008.
bThe amount shown for a share outstanding throughout the period may not correlate with the Statement of Operations for the period due to the timing of sales and repurchases of the Fund shares in relation to income earned and/or fluctuating market value of the investments of the Fund.
cBased on average daily shares outstanding.
dNet investment income per share includes approximately $0.02 per share related to interest income received that had previously been deemed uncollectible. Excluding this amount, the ratio of net investment income to average net assets would have been 1.79%.
eNet investment income per share includes approximately $0.11 per share received in the form of a special dividend paid in connection with a corporate real estate investment trust (REIT) conversion. Excluding this non-recurring amount, the ratio of the net investment income to average net assets would have been 1.58%.
fNet investment income per share includes approximately $(0.03) per share related to an adjustment for uncollectible interest. Excluding the effect of this
adjustment, the ratio of net investment income to average net assets would have been 1.73%.
gTotal return does not include fees, charges or expenses imposed by the variable annuity and life insurance contracts for which the Franklin Templeton Variable Insurance Products Trust serves as an underlying investment vehicle. Total return is not annualized for periods less than one year.
hRatios are annualized for periods less than one year.
iIncludes dividend expense on securities sold short and security borrowing fees, if any. See below for the ratios of such expenses to average net assets for the periods presented. See Note 1(f).
jBenefit of expense reduction rounds to less than 0.01%.
kRounds to less than 0.01%.
The accompanying notes are an integral part of these financial statements.
MS-11
Franklin Templeton Variable Insurance Products Trust
Statement of Investments, June 30, 2012 (unaudited)
| Mutual Shares Securities Fund | Country | Shares | Value | |||||||
Common Stocks and Other Equity Interests 87.3% | ||||||||||
Aerospace & Defense 2.2% | ||||||||||
aGenCorp Inc. | United States | 494,180 | $ | 3,217,112 | ||||||
Goodrich Corp. | United States | 237,930 | 30,193,317 | |||||||
aHuntington Ingalls Industries Inc. | United States | 852,088 | 34,288,021 | |||||||
Raytheon Co. | United States | 917,186 | 51,903,556 | |||||||
|
| |||||||||
| 119,602,006 | ||||||||||
|
| |||||||||
Auto Components 0.1% | ||||||||||
a,b,cCollins & Aikman Products Co., Contingent Distribution | United States | 929,505 | 2,231 | |||||||
a,dInternational Automotive Components Group Brazil LLC | Brazil | 1,730,515 | 589,240 | |||||||
a,d,eInternational Automotive Components Group North America, LLC | United States | 11,387,027 | 5,620,067 | |||||||
|
| |||||||||
| 6,211,538 | ||||||||||
|
| |||||||||
Automobiles 0.7% | ||||||||||
aGeneral Motors Co. | United States | 1,927,320 | 38,006,750 | |||||||
|
| |||||||||
Beverages 3.2% | ||||||||||
Coca-Cola Enterprises Inc. | United Kingdom | 1,190,962 | 33,394,574 | |||||||
Dr. Pepper Snapple Group Inc. | United States | 1,256,549 | 54,974,019 | |||||||
fPernod Ricard SA | France | 789,788 | 84,222,559 | |||||||
|
| |||||||||
| 172,591,152 | ||||||||||
|
| |||||||||
Biotechnology 0.9% | ||||||||||
Amgen Inc. | United States | 634,333 | 46,331,682 | |||||||
|
| |||||||||
Building Products 0.7% | ||||||||||
aOwens Corning Inc. | United States | 1,395,045 | 39,814,584 | |||||||
|
| |||||||||
Capital Markets 1.2% | ||||||||||
Morgan Stanley | United States | 2,763,478 | 40,319,144 | |||||||
UBS AG | Switzerland | 2,356,378 | 27,437,278 | |||||||
|
| |||||||||
| 67,756,422 | ||||||||||
|
| |||||||||
Chemicals 0.6% | ||||||||||
a,b,cDow Corning Corp., Contingent Distribution | United States | 100,000 | — | |||||||
Linde AG | Germany | 227,675 | 35,341,042 | |||||||
|
| |||||||||
| 35,341,042 | ||||||||||
|
| |||||||||
Commercial Banks 3.2% | ||||||||||
Barclays PLC | United Kingdom | 2,023,934 | 5,163,971 | |||||||
aCIT Group Inc. | United States | 517,223 | 18,433,828 | |||||||
a,dElephant Capital Holdings Ltd. | Japan | 11,728 | — | |||||||
a,dFirst Southern Bancorp Inc. | United States | 140,952 | 1,336,873 | |||||||
aGuaranty Bancorp | United States | 1,288,316 | 2,718,347 | |||||||
KB Financial Group Inc. | South Korea | 410,501 | 13,271,902 | |||||||
a,dNCB Warrant Holdings Ltd., A | Japan | 57,295 | — | |||||||
PNC Financial Services Group Inc. | United States | 1,499,989 | 91,664,328 | |||||||
aState Bank Financial Corp. | United States | 433,000 | 6,564,280 | |||||||
Wells Fargo & Co. | United States | 951,740 | 31,826,185 | |||||||
|
| |||||||||
| 170,979,714 | ||||||||||
|
| |||||||||
Communications Equipment 1.3% | ||||||||||
Cisco Systems Inc. | United States | 3,595,260 | 61,730,614 | |||||||
aResearch In Motion Ltd. | Canada | 1,193,030 | 8,816,492 | |||||||
|
| |||||||||
| 70,547,106 | ||||||||||
|
| |||||||||
Consumer Finance 0.1% | ||||||||||
a,dAlly Financial Inc. | United States | 194 | 1,127,868 | |||||||
dCerberus CG Investor I LLC | United States | 9,845,095 | 1,181,411 | |||||||
MS-12
Franklin Templeton Variable Insurance Products Trust
Statement of Investments, June 30, 2012 (unaudited) (continued)
| Mutual Shares Securities Fund | Country | Shares | Value | |||||||||
Common Stocks and Other Equity Interests (continued) | ||||||||||||
Consumer Finance (continued) | ||||||||||||
dCerberus CG Investor II LLC | United States | 9,845,012 | $ | 1,181,401 | ||||||||
dCerberus CG Investor III LLC | United States | 4,922,879 | 590,746 | |||||||||
aComdisco Holding Co. Inc. | United States | 180 | 900 | |||||||||
|
| |||||||||||
| 4,082,326 | ||||||||||||
|
| |||||||||||
Diversified Financial Services 2.8% | ||||||||||||
a,gBond Street Holdings LLC, A, 144A | United States | 493,723 | 9,627,598 | |||||||||
Citigroup Inc. | United States | 1,072,309 | 29,391,990 | |||||||||
Deutsche Boerse AG | Germany | 492,140 | 26,489,911 | |||||||||
aING Groep NV | Netherlands | 4,246,435 | 28,301,000 | |||||||||
JPMorgan Chase & Co. | United States | 881,890 | 31,509,930 | |||||||||
NYSE Euronext | United States | 987,020 | 25,247,971 | |||||||||
|
| |||||||||||
| 150,568,400 | ||||||||||||
|
| |||||||||||
Diversified Telecommunication Services 0.2% | ||||||||||||
aAboveNet Inc. | United States | 52,441 | 4,405,044 | |||||||||
Cable & Wireless Communications PLC | Panama | 14,125,048 | 6,559,457 | |||||||||
a,b,cGlobal Crossing Holdings Ltd., Contingent Distribution | United States | 9,005,048 | — | |||||||||
a,b,cMarconi Corp., Contingent Distribution | United Kingdom | 9,945,700 | 185,165 | |||||||||
|
| |||||||||||
| 11,149,666 | ||||||||||||
|
| |||||||||||
Electric Utilities 1.3% | ||||||||||||
a,dAET&D Holdings No. 1 Pty. Ltd. | Australia | 4,709,226 | — | |||||||||
Entergy Corp. | United States | 357,700 | 24,284,253 | |||||||||
Exelon Corp. | United States | 1,239,629 | 46,634,843 | |||||||||
|
| |||||||||||
| 70,919,096 | ||||||||||||
|
| |||||||||||
Electronic Equipment, Instruments & Components 0.8% | ||||||||||||
TE Connectivity Ltd. | United States | 1,388,012 | 44,291,463 | |||||||||
|
| |||||||||||
Energy Equipment & Services 2.5% | ||||||||||||
Baker Hughes Inc. | United States | 1,511,264 | 62,112,950 | |||||||||
Ensco PLC, A | United States | 448,574 | 21,069,521 | |||||||||
Transocean Ltd. | United States | 1,134,117 | 50,729,054 | |||||||||
|
| |||||||||||
| 133,911,525 | ||||||||||||
|
| |||||||||||
Food & Staples Retailing 4.6% | ||||||||||||
CVS Caremark Corp. | United States | 2,589,043 | 120,985,980 | |||||||||
The Kroger Co. | United States | 2,915,532 | 67,611,187 | |||||||||
Wal-Mart Stores Inc. | United States | 519,642 | 36,229,440 | |||||||||
Walgreen Co. | United States | 898,181 | 26,568,194 | |||||||||
|
| |||||||||||
| 251,394,801 | ||||||||||||
|
| |||||||||||
Food Products 3.2% | ||||||||||||
General Mills Inc. | United States | 1,323,944 | 51,024,802 | |||||||||
Kraft Foods Inc., A | United States | 3,234,429 | 124,913,648 | |||||||||
|
| |||||||||||
| 175,938,450 | ||||||||||||
|
| |||||||||||
Health Care Equipment & Supplies 2.1% | ||||||||||||
aBoston Scientific Corp. | United States | 5,962,490 | 33,807,318 | |||||||||
Medtronic Inc. | United States | 2,006,982 | 77,730,413 | |||||||||
|
| |||||||||||
| 111,537,731 | ||||||||||||
|
| |||||||||||
Health Care Providers & Services 3.2% | ||||||||||||
Cigna Corp. | United States | 1,367,104 | 60,152,576 | |||||||||
aCommunity Health Systems Inc. | United States | 1,277,022 | 35,794,927 | |||||||||
MS-13
Franklin Templeton Variable Insurance Products Trust
Statement of Investments, June 30, 2012 (unaudited) (continued)
| Mutual Shares Securities Fund | Country | Shares | Value | |||||||
Common Stocks and Other Equity Interests (continued) | ||||||||||
Health Care Providers & Services (continued) | ||||||||||
Coventry Health Care Inc. | United States | 1,414,284 | $ | 44,960,088 | ||||||
aTenet Healthcare Corp. | United States | 6,250,847 | 32,754,438 | |||||||
|
| |||||||||
| 173,662,029 | ||||||||||
|
| |||||||||
Hotels, Restaurants & Leisure 0.0%† | ||||||||||
a,d,hGLCP Harrah’s Investment LP | United States | 5,565,600 | 434,506 | |||||||
|
| |||||||||
Independent Power Producers & Energy Traders 0.6% | ||||||||||
aNRG Energy Inc. | United States | 1,941,240 | 33,699,926 | |||||||
|
| |||||||||
Insurance 6.0% | ||||||||||
ACE Ltd. | United States | 1,024,275 | 75,929,506 | |||||||
aAlleghany Corp. | United States | 85,147 | 28,928,693 | |||||||
aAmerican International Group Inc. | United States | 2,315,348 | 74,299,517 | |||||||
CNO Financial Group Inc. | United States | 964,957 | 7,526,665 | |||||||
MetLife Inc. | United States | 996,593 | 30,744,894 | |||||||
a,dOlympus Re Holdings Ltd. | United States | 16,280 | — | |||||||
White Mountains Insurance Group Ltd. | United States | 140,935 | 73,532,836 | |||||||
Zurich Insurance Group AG | Switzerland | 148,176 | 33,335,697 | |||||||
|
| |||||||||
| 324,297,808 | ||||||||||
|
| |||||||||
Internet Software & Services 0.7% | ||||||||||
aGoogle Inc., A | United States | 66,840 | 38,771,879 | |||||||
|
| |||||||||
Leisure Equipment & Products 0.7% | ||||||||||
Mattel Inc. | United States | 1,105,235 | 35,853,823 | |||||||
|
| |||||||||
Machinery 1.1% | ||||||||||
aFederal Signal Corp. | United States | 930,921 | 5,436,579 | |||||||
aOshkosh Corp. | United States | 1,098,890 | 23,021,745 | |||||||
Stanley Black & Decker Inc. | United States | 512,944 | 33,013,079 | |||||||
|
| |||||||||
| 61,471,403 | ||||||||||
|
| |||||||||
Marine 1.0% | ||||||||||
A.P. Moller-Maersk AS, B | Denmark | 8,589 | 56,206,255 | |||||||
|
| |||||||||
Media 6.8% | ||||||||||
British Sky Broadcasting Group PLC | United Kingdom | 4,240,555 | 46,291,302 | |||||||
CBS Corp., B | United States | 1,351,537 | 44,303,383 | |||||||
Comcast Corp., Special A | United States | 342,248 | 10,746,587 | |||||||
News Corp., B | United States | 3,792,649 | 85,410,455 | |||||||
Reed Elsevier PLC | United Kingdom | 6,998,940 | 56,116,405 | |||||||
Time Warner Cable Inc. | United States | 1,130,488 | 92,813,065 | |||||||
Viacom Inc., B | United States | 666,980 | 31,361,400 | |||||||
|
| |||||||||
| 367,042,597 | ||||||||||
|
| |||||||||
Metals & Mining 0.5% | ||||||||||
ThyssenKrupp AG | Germany | 1,664,698 | 27,041,313 | |||||||
|
| |||||||||
Multi-Utilities 1.3% | ||||||||||
E.ON AG | Germany | 2,163,963 | 46,558,094 | |||||||
GDF Suez | France | 1,065,032 | 25,279,948 | |||||||
|
| |||||||||
| 71,838,042 | ||||||||||
|
| |||||||||
Multiline Retail 0.6% | ||||||||||
Kohl’s Corp. | United States | 724,500 | 32,957,505 | |||||||
|
| |||||||||
Office Electronics 1.5% | ||||||||||
Xerox Corp. | United States | 10,553,594 | 83,056,785 | |||||||
|
| |||||||||
MS-14
Franklin Templeton Variable Insurance Products Trust
Statement of Investments, June 30, 2012 (unaudited) (continued)
| Mutual Shares Securities Fund | Country | Shares | Value | |||||||
Common Stocks and Other Equity Interests (continued) | ||||||||||
Oil, Gas & Consumable Fuels 8.2% | ||||||||||
Apache Corp. | United States | 851,890 | $ | 74,872,612 | ||||||
BP PLC | United Kingdom | 4,439,900 | 29,350,004 | |||||||
CONSOL Energy Inc. | United States | 1,916,130 | 57,943,771 | |||||||
Marathon Oil Corp. | United States | 3,352,318 | 85,718,771 | |||||||
Marathon Petroleum Corp. | United States | 954,870 | 42,892,761 | |||||||
Murphy Oil Corp. | United States | 663,080 | 33,346,293 | |||||||
Royal Dutch Shell PLC, A | United Kingdom | 2,817,116 | 94,855,920 | |||||||
The Williams Cos. Inc. | United States | 536,404 | 15,459,163 | |||||||
aWPX Energy Inc. | United States | 464,774 | 7,520,044 | |||||||
|
| |||||||||
| 441,959,339 | ||||||||||
|
| |||||||||
Paper & Forest Products 2.6% | ||||||||||
Domtar Corp. | United States | 239,069 | 18,338,983 | |||||||
International Paper Co. | United States | 2,488,136 | 71,932,012 | |||||||
MeadWestvaco Corp. | United States | 1,711,669 | 49,210,484 | |||||||
|
| |||||||||
| 139,481,479 | ||||||||||
|
| |||||||||
Personal Products 0.3% | ||||||||||
Avon Products Inc. | United States | 883,021 | 14,313,770 | |||||||
|
| |||||||||
Pharmaceuticals 6.3% | ||||||||||
Eli Lilly & Co. | United States | 494,428 | 21,215,905 | |||||||
aHospira Inc. | United States | 722,308 | 25,266,334 | |||||||
Merck & Co. Inc. | United States | 3,875,498 | 161,802,042 | |||||||
Pfizer Inc. | United States | 4,516,554 | 103,880,742 | |||||||
Teva Pharmaceutical Industries Ltd., ADR | Israel | 769,719 | 30,357,717 | |||||||
|
| |||||||||
| 342,522,740 | ||||||||||
|
| |||||||||
Real Estate Investment Trusts (REITs) 0.4% | ||||||||||
Alexander’s Inc. | United States | 49,326 | 21,264,932 | |||||||
|
| |||||||||
Real Estate Management & Development 0.2% | ||||||||||
cCanary Wharf Group PLC | United Kingdom | 1,535,898 | 5,563,644 | |||||||
aForestar Group Inc. | United States | 320,853 | 4,110,127 | |||||||
|
| |||||||||
| 9,673,771 | ||||||||||
|
| |||||||||
Software 3.4% | ||||||||||
Microsoft Corp. | United States | 4,312,607 | 131,922,648 | |||||||
Nintendo Co. Ltd. | Japan | 123,923 | 14,330,388 | |||||||
aSymantec Corp. | United States | 2,469,540 | 36,079,980 | |||||||
|
| |||||||||
| 182,333,016 | ||||||||||
|
| |||||||||
Tobacco 8.2% | ||||||||||
Altria Group Inc. | United States | 2,207,264 | 76,260,971 | |||||||
British American Tobacco PLC | United Kingdom | 3,072,790 | 156,127,551 | |||||||
British American Tobacco PLC, ADR | United Kingdom | 4,218 | 430,742 | |||||||
Imperial Tobacco Group PLC | United Kingdom | 2,507,227 | 96,535,467 | |||||||
Lorillard Inc. | United States | 353,117 | 46,593,788 | |||||||
Philip Morris International Inc. | United States | 443,310 | 38,683,231 | |||||||
Reynolds American Inc. | United States | 681,552 | 30,581,238 | |||||||
|
| |||||||||
| 445,212,988 | ||||||||||
|
| |||||||||
Wireless Telecommunication Services 2.0% | ||||||||||
Vodafone Group PLC | United Kingdom | 38,007,977 | 106,741,583 | |||||||
|
| |||||||||
Total Common Stocks and Other Equity Interests (Cost $4,315,092,049) | 4,730,812,943 | |||||||||
|
| |||||||||
MS-15
Franklin Templeton Variable Insurance Products Trust
Statement of Investments, June 30, 2012 (unaudited) (continued)
| Mutual Shares Securities Fund | Country | Shares | Value | |||||||
Convertible Preferred Stocks (Cost $241,000) 0.0%† | ||||||||||
Commercial Banks 0.0%† | ||||||||||
a,dFirst Southern Bancorp Inc., cvt. pfd., C | United States | 241 | $ | 866,123 | ||||||
|
| |||||||||
| Principal Amount* | ||||||||||
Corporate Bonds, Notes and Senior Floating Rate Interests 4.1% | ||||||||||
iCapmark Financial Group Inc., senior secured note, B, FRN, 9.00%, 9/30/17 | United States | 2,747,854 | 2,763,311 | |||||||
Clear Channel Communications Inc., | ||||||||||
i,jDelayed Draw 2 Term Loan, 3.895%, 1/29/16 | United States | 5,851,461 | 4,505,625 | |||||||
senior note, 9.00%, 3/01/21 | United States | 2,981,000 | 2,608,375 | |||||||
ksenior note, PIK, 11.00%, 8/01/16 | United States | 12,556,000 | 7,847,500 | |||||||
i,jTranche B Term Loan, 3.895%, 1/29/16 | United States | 34,848,922 | 27,808,359 | |||||||
i,jTranche C Term Loan, 3.895%, 1/29/16 | United States | 6,795,466 | 5,267,899 | |||||||
gEnergy Future Intermediate Holding Co. LLC/Finance Inc., secured note, 144A, | United States | 9,670,000 | 9,960,100 | |||||||
i,jHilton Worldwide Inc., FRN, | ||||||||||
Mezzanine D Loan, 3.492%, 11/12/15 | United States | 1,708,718 | 1,537,846 | |||||||
Mezzanine E Loan, 3.742%, 11/12/15 | United States | 2,190,638 | 1,927,762 | |||||||
Mezzanine F Loan, 3.992%, 11/12/15 | United States | 5,477,095 | 4,833,537 | |||||||
Mezzanine G Loan, 4.242%, 11/12/15 | United States | 9,858,372 | 8,527,491 | |||||||
i,jiStar Financial Inc., | ||||||||||
New Tranche A-1 Term Loan, 5.25%, 3/19/16 | United States | 938,528 | 935,400 | |||||||
New Tranche A-2 Term Loan, 7.00%, 3/19/17 | United States | 3,511,000 | 3,519,778 | |||||||
Tranche A-1 Term Loan, 5.00%, 6/28/13 | United States | 1,739,400 | 1,737,486 | |||||||
Tranche A-2 Term Loan, 7.00%, 6/30/14 | United States | 1,926,000 | 1,927,926 | |||||||
NRG Energy Inc., senior note, 7.375%, 1/15/17 | United States | 14,900,000 | 15,533,250 | |||||||
Realogy Corp., | ||||||||||
i,jExtended First Lien Term Loan, 4.491%, 10/10/16 | United States | 19,375,151 | 18,345,846 | |||||||
i,j,lExtended Revolver, 7.243%, 4/10/16 | United States | 2,415,984 | 2,083,786 | |||||||
i,jExtended Synthetic Letter of Credit, 4.496%, 10/10/16 | United States | 1,348,114 | 1,276,495 | |||||||
Second Lien Term Loan, 13.50%, 10/15/17 | United States | 5,314,000 | 5,466,778 | |||||||
senior note, 11.50%, 4/15/17 | United States | 3,654,000 | 3,480,435 | |||||||
f,gsenior secured note, 144A, 7.875%, 2/15/19 | United States | 4,388,000 | 4,311,210 | |||||||
gsenior secured note, 144A, 9.00%, 1/15/20 | United States | 1,956,000 | 2,024,460 | |||||||
i,jTexas Competitive Electric Holdings Co. LLC, Extended Term Loan, 4.741%, 10/10/17 | United States | 90,618,405 | 54,362,344 | |||||||
Texas Competitive Electric Holdings Co. LLC/Texas Competitive Electric Holdings Finance Inc., senior note, A, 10.25%, 11/01/15 | United States | 9,820,000 | 2,577,750 | |||||||
gsenior secured note, 144A, 11.50%, 10/01/20 | United States | 39,308,000 | 27,024,250 | |||||||
|
| |||||||||
Total Corporate Bonds, Notes and Senior Floating Rate Interests (Cost $256,884,059) | 222,194,999 | |||||||||
|
| |||||||||
Corporate Notes and Senior Floating Rate Interests in Reorganization 0.5% | ||||||||||
d,mBroadband Ventures III LLC, secured promissory note, 5.00%, 2/01/12 | United States | 2,128 | — | |||||||
i,j,mTribune Co., | ||||||||||
Incremental Term Loan, 7.25%, 6/04/14 | United States | 3,098,000 | 2,027,254 | |||||||
nInitial Tranche B Term Loan, 5.25%, 6/04/14 | United States | 39,280,000 | 26,263,904 | |||||||
|
| |||||||||
Total Corporate Notes and Senior Floating Rate Interests in Reorganization (Cost $28,349,364) | 28,291,158 | |||||||||
|
| |||||||||
MS-16
Franklin Templeton Variable Insurance Products Trust
Statement of Investments, June 30, 2012 (unaudited) (continued)
| Mutual Shares Securities Fund | Country | Shares | Value | |||||||
Companies in Liquidation 0.0%† | ||||||||||
aAdelphia Recovery Trust | United States | 29,283,354 | $ | 29,283 | ||||||
a,bAdelphia Recovery Trust, Arahova Contingent Value Vehicle, Contingent Distribution | United States | 1,955,453 | 39,109 | |||||||
a,d,e,hCB FIM Coinvestors LLC | United States | 6,400,507 | — | |||||||
a,b,cCentury Communications Corp., Contingent Distribution | United States | 5,487,000 | — | |||||||
a,dFIM Coinvestor Holdings I, LLC | United States | 8,006,950 | — | |||||||
a,b,cTropicana Litigation Trust, Contingent Distribution | United States | 18,305,000 | — | |||||||
| Principal Amount* | ||||||||||
c,mPeregrine Investments Holdings Ltd., 1/15/98 | Hong Kong | 5,000,000 | JPY | — | ||||||
c,mPIV Investment Finance (Cayman) Ltd., 12/01/00 | Hong Kong | 12,200,000 | — | |||||||
|
| |||||||||
Total Companies in Liquidation (Cost $2,704,974) | 68,392 | |||||||||
|
| |||||||||
Total Investments before Short Term Investments (Cost $4,603,271,446) | 4,982,233,615 | |||||||||
|
| |||||||||
Short Term Investments 8.0% | ||||||||||
Convertible Notes ($18,312,756) 0.4% | ||||||||||
iiStar Financial Inc., cvt., senior note, FRN, 0.968%, 10/01/12 | United States | 18,780,000 | 18,778,122 | |||||||
|
| |||||||||
U.S. Government and Agency Securities 7.0% | ||||||||||
oFHLB, 7/02/12 | United States | 110,000,000 | 110,000,000 | |||||||
o,pU.S. Treasury Bills, 7/05/12 - 12/27/12 | United States | 268,100,000 | 268,023,833 | |||||||
|
| |||||||||
Total U.S. Government and Agency Securities | 378,023,833 | |||||||||
|
| |||||||||
Total Investments before Money Market Funds | 5,379,035,570 | |||||||||
|
| |||||||||
| Shares | ||||||||||
qInvestments from Cash Collateral Received for Loaned Securities (Cost $32,800,522) 0.6% | ||||||||||
Money Market Funds 0.6% | ||||||||||
rBNY Mellon Overnight Government Fund, 0.182% | United States | 32,800,522 | 32,800,522 | |||||||
|
| |||||||||
Total Investments (Cost $5,032,387,821) 99.9% | 5,411,836,092 | |||||||||
Other Assets, less Liabilities 0.1% | 6,538,175 | |||||||||
|
| |||||||||
Net Assets 100.0% | $ | 5,418,374,267 | ||||||||
|
| |||||||||
MS-17
Franklin Templeton Variable Insurance Products Trust
Statement of Investments, June 30, 2012 (unaudited) (continued)
| Mutual Shares Securities Fund |
†Rounds to less than 0.1% of net assets.
*The principal amount is stated in U.S. dollars unless otherwise indicated.
aNon-income producing.
bContingent distributions represent the right to receive additional distributions, if any, during the reorganization of the underlying company. Shares represent total underlying principal of debt securities.
cSecurity has been deemed illiquid because it may not be able to be sold within seven days. At June 30, 2012, the aggregate value of these securities was $5,751,040, representing 0.11% of net assets.
dSee Note 8 regarding restricted securities.
eAt June 30, 2012, pursuant to the Fund’s policies and the requirements of applicable securities law, the Fund may be restricted from trading these securities for a limited or extended period of time due to ownership limits and/or potential possession of material non-public information.
fA portion or all of the security is on loan at June 30, 2012. See Note 1(g).
gSecurity was purchased pursuant to Rule 144A under the Securities Act of 1933 and may be sold in transactions exempt from registration only to qualified institutional buyers or in a public offering registered under the Securities Act of 1933. These securities have been deemed liquid under guidelines approved by the Trust’s Board of Trustees. At June 30, 2012, the aggregate value of these securities was $52,947,618, representing 0.98% of net assets.
hSee Note 12 regarding holdings of 5% voting securities.
iThe coupon rate shown represents the rate at period end.
jSee Note 1(h) regarding senior floating rate interests.
kIncome may be received in additional securities and/or cash.
lSee Note 9 regarding unfunded loan commitments.
mSee Note 7 regarding credit risk and defaulted securities.
nA portion or all of the security purchased on a delayed delivery basis. See Note 1(c).
oThe security is traded on a discount basis with no stated coupon rate.
pSecurity or a portion of the security has been pledged as collateral for open futures contracts. At June 30, 2012, the value of this security and/or cash pledged as collateral was $2,280,510, representing 0.04% of net assets.
qSee Note 1(g) regarding securities on loan.
rThe rate shown is the annualized seven-day yield at period end.
MS-18
Franklin Templeton Variable Insurance Products Trust
Statement of Investments, June 30, 2012 (unaudited) (continued)
| Mutual Shares Securities Fund |
At June 30, 2012, the Fund had the following futures contracts outstanding. See Note 1(d).
Futures Contracts
| Description | Type | Number of Contracts | Notional Value | Expiration Date | Unrealized Appreciation | Unrealized Depreciation | ||||||||||||||||||
Currency Contracts | ||||||||||||||||||||||||
EUR/USD | Short | 435 | $ | 68,882,250 | 9/18/12 | $ | — | $ | (736,913 | ) | ||||||||||||||
GBP/USD | Short | 472 | 46,247,150 | 9/18/12 | — | (448,598 | ) | |||||||||||||||||
|
| |||||||||||||||||||||||
Net unrealized appreciation (depreciation) | $ | (1,185,511 | ) | |||||||||||||||||||||
|
| |||||||||||||||||||||||
At June 30, 2012, the Fund had the following forward exchange contracts outstanding. See Note 1(d).
Forward Exchange Contracts
| Currency | Counterparty | Type | Quantity | Contract Amount | Settlement Date | Unrealized Appreciation | Unrealized Depreciation | |||||||||||||||||||||
Euro | BZWS | Buy | 455,171 | $ | 563,861 | 7/17/12 | $ | 12,289 | $ | — | ||||||||||||||||||
Euro | HSBC | Buy | 2,533,638 | 3,145,305 | 7/17/12 | 61,743 | — | |||||||||||||||||||||
Euro | DBAB | Buy | 3,118,358 | 3,881,289 | 7/17/12 | 65,891 | — | |||||||||||||||||||||
Euro | HSBC | Sell | 18,401,705 | 23,447,678 | 7/17/12 | 155,025 | — | |||||||||||||||||||||
Euro | DBAB | Sell | 9,674,338 | 12,778,980 | 7/17/12 | 533,321 | — | |||||||||||||||||||||
Euro | BZWS | Sell | 3,099,993 | 4,091,690 | 7/17/12 | 167,756 | — | |||||||||||||||||||||
Euro | BOFA | Sell | 1,246,624 | 1,654,022 | 7/17/12 | 76,061 | — | |||||||||||||||||||||
British Pound | DBAB | Sell | 36,194,505 | 56,566,017 | 7/19/12 | — | (138,948 | ) | ||||||||||||||||||||
British Pound | BZWS | Sell | 34,148,507 | 53,398,020 | 7/19/12 | — | (101,534 | ) | ||||||||||||||||||||
British Pound | SSBT | Buy | 3,455,091 | 5,423,940 | 7/19/12 | — | (10,941 | ) | ||||||||||||||||||||
British Pound | BZWS | Sell | 4,678,029 | 7,469,813 | 7/19/12 | 140,870 | — | |||||||||||||||||||||
British Pound | DBAB | Sell | 1,571,919 | 2,519,979 | 7/19/12 | 57,295 | — | |||||||||||||||||||||
British Pound | FBCO | Sell | 3,541,136 | 5,556,538 | 7/19/12 | 8,695 | — | |||||||||||||||||||||
Swiss Franc | DBAB | Buy | 2,573,687 | 2,826,042 | 8/10/12 | — | (111,180 | ) | ||||||||||||||||||||
Swiss Franc | BOFA | Buy | 1,216,603 | 1,328,607 | 8/10/12 | — | (45,269 | ) | ||||||||||||||||||||
Swiss Franc | HSBC | Buy | 203,502 | 219,575 | 8/10/12 | — | (4,910 | ) | ||||||||||||||||||||
Swiss Franc | HSBC | Sell | 481,000 | 503,929 | 8/10/12 | — | (3,456 | ) | ||||||||||||||||||||
Swiss Franc | BZWS | Buy | 363,754 | 385,823 | 8/10/12 | — | (2,116 | ) | ||||||||||||||||||||
Swiss Franc | DBAB | Sell | 326,012 | 342,489 | 8/10/12 | — | (1,406 | ) | ||||||||||||||||||||
Swiss Franc | DBAB | Buy | 443,291 | 459,917 | 8/10/12 | 7,690 | — | |||||||||||||||||||||
Swiss Franc | BOFA | Buy | 274,892 | 284,669 | 8/10/12 | 5,302 | — | |||||||||||||||||||||
Swiss Franc | FBCO | Buy | 244,796 | 254,297 | 8/10/12 | 3,927 | — | |||||||||||||||||||||
Swiss Franc | BOFA | Sell | 12,304,282 | 13,498,816 | 8/10/12 | 519,605 | — | |||||||||||||||||||||
Swiss Franc | DBAB | Sell | 13,160,321 | 14,441,866 | 8/10/12 | 559,660 | — | |||||||||||||||||||||
British Pound | SSBT | Buy | 6,160,033 | 9,724,043 | 8/16/12 | — | (74,041 | ) | ||||||||||||||||||||
British Pound | FBCO | Sell | 3,300,000 | 5,155,986 | 8/16/12 | — | (13,630 | ) | ||||||||||||||||||||
British Pound | HSBC | Sell | 691,394 | 1,076,066 | 8/16/12 | — | (7,037 | ) | ||||||||||||||||||||
British Pound | BZWS | Sell | 360,059 | 560,212 | 8/16/12 | — | (3,838 | ) | ||||||||||||||||||||
British Pound | BZWS | Sell | 35,730,696 | 56,969,148 | 8/16/12 | 995,211 | — | |||||||||||||||||||||
British Pound | DBAB | Sell | 42,401,616 | 67,652,599 | 8/16/12 | 1,228,330 | — | |||||||||||||||||||||
British Pound | HAND | Sell | 553,097 | 869,603 | 8/16/12 | 3,149 | — | |||||||||||||||||||||
British Pound | HSBC | Sell | 553,098 | 870,820 | 8/16/12 | 4,364 | — | |||||||||||||||||||||
Euro | BZWS | Buy | 1,944,418 | 2,554,621 | 8/31/12 | — | (92,258 | ) | ||||||||||||||||||||
Euro | DBAB | Buy | 664,678 | 873,879 | 8/31/12 | — | (32,147 | ) | ||||||||||||||||||||
Euro | BZWS | Sell | 27,763,917 | 37,156,453 | 8/31/12 | 1,996,910 | — | |||||||||||||||||||||
Euro | DBAB | Sell | 3,369,540 | 4,440,788 | 8/31/12 | 173,685 | — | |||||||||||||||||||||
Euro | BOFA | Sell | 25,157,292 | 32,979,322 | 8/31/12 | 1,120,746 | — | |||||||||||||||||||||
Euro | HSBC | Sell | 1,201,240 | 1,576,495 | 8/31/12 | 55,274 | — | |||||||||||||||||||||
Euro | BZWS | Sell | 27,798,847 | 36,659,738 | 10/16/12 | 1,436,789 | — | |||||||||||||||||||||
Euro | BOFA | Sell | 21,994,901 | 29,012,594 | 10/16/12 | 1,143,622 | — | |||||||||||||||||||||
MS-19
Franklin Templeton Variable Insurance Products Trust
Statement of Investments, June 30, 2012 (unaudited) (continued)
| Mutual Shares Securities Fund |
Forward Exchange Contracts (continued)
| Currency | Counterparty | Type | Quantity | Contract Amount | Settlement Date | Unrealized Appreciation | Unrealized Depreciation | |||||||||||||||||||||
Euro | DBAB | Sell | 7,296,641 | $ | 9,611,423 | 10/16/12 | $ | 366,104 | $ | — | ||||||||||||||||||
Euro | HSBC | Sell | 1,555,088 | 2,057,692 | 10/16/12 | 87,295 | — | |||||||||||||||||||||
Japanese Yen | HSBC | Sell | 626,740,572 | 7,727,997 | 10/22/12 | — | (120,575 | ) | ||||||||||||||||||||
Japanese Yen | DBAB | Buy | 21,687,100 | 273,559 | 10/22/12 | — | (1,975 | ) | ||||||||||||||||||||
Japanese Yen | HSBC | Buy | 33,707,056 | 423,200 | 10/22/12 | — | (1,092 | ) | ||||||||||||||||||||
Japanese Yen | HSBC | Buy | 37,393,700 | 461,383 | 10/22/12 | 6,892 | — | |||||||||||||||||||||
Japanese Yen | DBAB | Buy | 62,580,539 | 779,903 | 10/22/12 | 3,784 | — | |||||||||||||||||||||
British Pound | HAND | Sell | 4,084,112 | 6,355,143 | 11/21/12 | — | (40,854 | ) | ||||||||||||||||||||
British Pound | HSBC | Sell | 18,725,802 | 29,630,398 | 11/21/12 | 304,514 | — | |||||||||||||||||||||
British Pound | BZWS | Sell | 34,011,590 | 53,806,335 | 11/21/12 | 541,864 | — | |||||||||||||||||||||
British Pound | BOFA | Sell | 17,005,795 | 26,908,780 | 11/21/12 | 276,544 | — | |||||||||||||||||||||
British Pound | HAND | Sell | 1,863,712 | 2,924,332 | 11/21/12 | 5,601 | — | |||||||||||||||||||||
Euro | DBAB | Sell | 14,808,765 | 18,617,581 | 11/30/12 | — | (157,486 | ) | ||||||||||||||||||||
Euro | BZWS | Sell | 12,244,379 | 15,382,613 | 11/30/12 | — | (141,236 | ) | ||||||||||||||||||||
Euro | FBCO | Sell | 4,940,286 | 6,196,929 | 11/30/12 | — | (66,441 | ) | ||||||||||||||||||||
Euro | HAND | Sell | 2,784,955 | 3,516,767 | 11/30/12 | — | (13,980 | ) | ||||||||||||||||||||
Euro | HSBC | Sell | 4,559,246 | 5,775,089 | 11/30/12 | — | (5,177 | ) | ||||||||||||||||||||
Euro | DBAB | Sell | 1,672,616 | 2,123,133 | 11/30/12 | 2,561 | — | |||||||||||||||||||||
Euro | BOFA | Sell | 520,071 | 660,508 | 11/30/12 | 1,173 | — | |||||||||||||||||||||
Euro | BZWS | Sell | 520,072 | 659,986 | 11/30/12 | 650 | — | |||||||||||||||||||||
Euro | SCBT | Sell | 555,632 | 705,719 | 11/30/12 | 1,300 | — | |||||||||||||||||||||
|
| |||||||||||||||||||||||||||
Unrealized appreciation (depreciation) |
| 12,131,492 | (1,191,527 | ) | ||||||||||||||||||||||||
|
| |||||||||||||||||||||||||||
Net unrealized appreciation (depreciation) |
| $ | 10,939,965 | |||||||||||||||||||||||||
|
| |||||||||||||||||||||||||||
See Abbreviations on page MS-36.
The accompanying notes are an integral part of these financial statements.
MS-20
Franklin Templeton Variable Insurance Products Trust
Financial Statements
Statement of Assets and Liabilities
June 30, 2012 (unaudited)
| Mutual Shares Securities Fund | ||||
Assets: | ||||
Investments in securities: | ||||
Cost - Unaffiliated issuers | $ | 5,029,603,854 | ||
Cost - Non-controlled affiliated issuers (Note 12) | 2,783,967 | |||
|
| |||
Total cost of investments | $ | 5,032,387,821 | ||
|
| |||
Value - Unaffiliated issuers | $ | 5,411,401,586 | ||
Value - Non-controlled affiliated issuers (Note 12) | 434,506 | |||
|
| |||
Total value of investments (includes securities loaned in the amount of $32,945,227) | 5,411,836,092 | |||
Cash | 743,791 | |||
Restricted cash (Note 1e) | 5,342,000 | |||
Foreign currency, at value (cost $8,180,619) | 8,228,399 | |||
Receivables: | ||||
Investment securities sold | 38,309,134 | |||
Capital shares sold | 519,865 | |||
Dividends and interest | 15,866,925 | |||
Unrealized appreciation on forward exchange contracts | 12,131,492 | |||
Other assets | 200,739 | |||
|
| |||
Total assets | 5,493,178,437 | |||
|
| |||
Liabilities: | ||||
Payables: | ||||
Investment securities purchased | 24,491,889 | |||
Capital shares redeemed | 2,455,616 | |||
Affiliates | 4,642,712 | |||
Variation margin | 1,804,300 | |||
Payable upon return of securities loaned | 32,800,522 | |||
Due to brokers | 5,342,000 | |||
Unrealized depreciation on forward exchange contracts | 1,191,527 | |||
Unrealized depreciation on unfunded loan commitments (Note 9) | 676,537 | |||
Accrued expenses and other liabilities | 1,399,067 | |||
|
| |||
Total liabilities | 74,804,170 | |||
|
| |||
Net assets, at value | $ | 5,418,374,267 | ||
|
| |||
Net assets consist of: | ||||
Paid-in capital | $ | 5,336,614,577 | ||
Undistributed net investment income | 155,417,188 | |||
Net unrealized appreciation (depreciation) | 388,499,464 | |||
Accumulated net realized gain (loss) | (462,156,962 | ) | ||
|
| |||
Net assets, at value | $ | 5,418,374,267 | ||
|
| |||
The accompanying notes are an integral part of these financial statements.
MS-21
Franklin Templeton Variable Insurance Products Trust
Financial Statements (continued)
Statement of Assets and Liabilities (continued)
June 30, 2012 (unaudited)
| Mutual Shares Securities Fund | ||||
Class 1: | ||||
Net assets, at value | $ | 1,301,298,274 | ||
|
| |||
Shares outstanding | 78,827,299 | |||
|
| |||
Net asset value and maximum offering price per share | $ | 16.51 | ||
|
| |||
Class 2: | ||||
Net assets, at value | $ | 3,953,224,930 | ||
|
| |||
Shares outstanding | 242,769,970 | |||
|
| |||
Net asset value and maximum offering price per share | $ | 16.28 | ||
|
| |||
Class 4: | ||||
Net assets, at value | $ | 163,851,063 | ||
|
| |||
Shares outstanding | 10,020,289 | |||
|
| |||
Net asset value and maximum offering price per share | $ | 16.35 | ||
|
| |||
The accompanying notes are an integral part of these financial statements.
MS-22
Franklin Templeton Variable Insurance Products Trust
Financial Statements (continued)
Statement of Operations
for the six months ended June 30, 2012 (unaudited)
| Mutual Shares Securities Fund | ||||
Investment income: | ||||
Dividends | $ | 66,538,237 | ||
Interest | 14,044,163 | |||
Income from securities loaned | 837,069 | |||
|
| |||
Total investment income | 81,419,469 | |||
|
| |||
Expenses: | ||||
Management fees (Note 3a) | 16,429,313 | |||
Administrative fees (Note 3b) | 2,349,536 | |||
Distribution fees: (Note 3c) | ||||
Class 2 | 4,968,617 | |||
Class 4 | 287,623 | |||
Unaffiliated transfer agent fees | 2,470 | |||
Custodian fees (Note 4) | 136,121 | |||
Reports to shareholders | 402,967 | |||
Professional fees | 207,396 | |||
Trustees’ fees and expenses | 10,993 | |||
Other | 90,173 | |||
|
| |||
Total expenses | 24,885,209 | |||
|
| |||
Net investment income | 56,534,260 | |||
|
| |||
Realized and unrealized gains (losses): | ||||
Net realized gain (loss) from: | ||||
Investments | 114,265,382 | |||
Written options | 265,845 | |||
Foreign currency transactions | 21,269,564 | |||
Futures contracts | 2,220,149 | |||
Securities sold short | (10,276,834 | ) | ||
|
| |||
Net realized gain (loss) | 127,744,106 | |||
|
| |||
Net change in unrealized appreciation (depreciation) on: | ||||
Investments | 139,207,828 | |||
Translation of other assets and liabilities denominated in foreign currencies | (19,589,112 | ) | ||
|
| |||
Net change in unrealized appreciation (depreciation) | 119,618,716 | |||
|
| |||
Net realized and unrealized gain (loss) | 247,362,822 | |||
|
| |||
Net increase (decrease) in net assets resulting from operations | $ | 303,897,082 | ||
|
| |||
The accompanying notes are an integral part of these financial statements.
MS-23
Franklin Templeton Variable Insurance Products Trust
Financial Statements (continued)
Statements of Changes in Net Assets
| Mutual Shares Securities Fund | ||||||||
| Six Months Ended June 30, 2012 (unaudited) | Year Ended December 31, 2011 | |||||||
| ||||||||
Increase (decrease) in net assets: | ||||||||
Operations: | ||||||||
Net investment income | $ | 56,534,260 | $ | 116,919,415 | ||||
Net realized gain (loss) from investments, written options, foreign currency transactions, futures contracts and securities sold short | 127,744,106 | (69,197,475 | ) | |||||
Net change in unrealized appreciation (depreciation) on investments and translation of other assets and liabilities denominated in foreign currencies | 119,618,716 | (151,843,785 | ) | |||||
| ||||||||
Net increase (decrease) in net assets resulting from operations | 303,897,082 | (104,121,845 | ) | |||||
| ||||||||
Distributions to shareholders from: | ||||||||
Net investment income: | ||||||||
Class 1 | — | (32,920,483 | ) | |||||
Class 2 | — | (95,354,646 | ) | |||||
Class 4 | — | (3,732,632 | ) | |||||
| ||||||||
Total distributions to shareholders | — | (132,007,761 | ) | |||||
| ||||||||
Capital share transactions: (Note 2) | ||||||||
Class 1 | 64,679,377 | (34,519,147 | ) | |||||
Class 2 | (188,868,407 | ) | (141,255,692 | ) | ||||
Class 4 | (7,384,023 | ) | 339,468 | |||||
| ||||||||
Total capital share transactions | (131,573,053 | ) | (175,435,371 | ) | ||||
| ||||||||
Net increase (decrease) in net assets | 172,324,029 | (411,564,977 | ) | |||||
Net assets: | ||||||||
Beginning of period | 5,246,050,238 | 5,657,615,215 | ||||||
| ||||||||
End of period | $ | 5,418,374,267 | $ | 5,246,050,238 | ||||
| ||||||||
Undistributed net investment income included in net assets: | ||||||||
End of period | $ | 155,417,188 | $ | 98,882,928 | ||||
| ||||||||
The accompanying notes are an integral part of these financial statements.
MS-24
Franklin Templeton Variable Insurance Products Trust
Notes to Financial Statements (unaudited)
Mutual Shares Securities Fund
1. ORGANIZATION AND SIGNIFICANT ACCOUNTING POLICIES
Franklin Templeton Variable Insurance Products Trust (Trust) is registered under the Investment Company Act of 1940, as amended, (1940 Act) as an open-end investment company, consisting of twenty separate funds. The Mutual Shares Securities Fund (Fund) is included in this report. The financial statements of the remaining funds in the Trust are presented separately. Shares of the Fund are generally sold only to insurance company separate accounts to fund the benefits of variable life insurance policies or variable annuity contracts. The Fund offers three classes of shares: Class 1, Class 2, and Class 4. Each class of shares differs by its distribution fees, voting rights on matters affecting a single class and its exchange privilege.
The following summarizes the Fund’s significant accounting policies.
a. Financial Instrument Valuation
The Fund’s investments in financial instruments are carried at fair value daily. Fair value is the price that would be received to sell an asset or paid to transfer a liability in an orderly transaction between market participants on the measurement date. Under procedures approved by the Trust’s Board of Trustees (the Board), the Fund’s administrator, investment manager and other affiliates have formed the Valuation and Liquidity Oversight Committee (VLOC). The VLOC provides administration and oversight of the Fund’s valuation policies and procedures, which are approved annually by the Board. Among other things, these procedures allow the Fund to utilize independent pricing services, quotations from securities and financial instrument dealers, and other market sources to determine fair value.
Equity securities and derivative financial instruments (derivatives) listed on an exchange or on the NASDAQ National Market System are valued at the last quoted sale price or the official closing price of the day, respectively. Foreign equity securities are valued as of the close of trading on the foreign stock exchange on which the security is primarily traded, or the NYSE, whichever is earlier. The value is then converted into its U.S. dollar equivalent at the foreign exchange rate in effect at the close of the NYSE on the day that the value of the security is determined. Over-the-counter (OTC) securities are valued within the range of the most recent quoted bid and ask prices. Securities that trade in multiple markets or on multiple exchanges are valued according to the broadest and most representative market. Certain equity securities are valued based upon fundamental characteristics or relationships to similar securities. Investments in non-registered money market funds are valued at the closing net asset value.
Debt securities generally trade in the OTC market rather than on a securities exchange. The Fund’s pricing services use multiple valuation techniques to determine fair value. In instances where sufficient market activity exists, the pricing services may utilize a market-based approach through which quotes from market makers are used to determine fair value. In instances where sufficient market activity may not exist or is limited, the pricing services also utilize proprietary valuation models which may consider market characteristics such as benchmark yield curves, credit spreads, estimated default rates, anticipated market interest rate volatility, coupon rates, anticipated timing of principal repayments, underlying collateral, and other unique security features in order to estimate the relevant cash flows, which are then discounted to calculate the fair value. Securities denominated in a foreign currency are converted into their U.S. dollar equivalent at the foreign exchange rate in effect at the close of the NYSE on the date that the values of the foreign debt securities are determined.
Certain derivatives trade in the OTC market. The Fund’s pricing services use various techniques including industry standard option pricing models and proprietary discounted cash flow models to determine the fair value of those instruments. The Fund’s net benefit or obligation under the derivative contract, as measured by the fair market value of the contract, is included in net assets.
The Fund has procedures to determine the fair value of financial instruments for which market prices are not reliable or readily available. Under these procedures, the VLOC convenes on a regular basis to review such financial instruments and considers a number of factors, including significant unobservable valuation inputs, when arriving at fair value. The VLOC primarily employs a market-based approach which may use related or comparable assets or liabilities, recent transactions, market multiples, book
MS-25
Franklin Templeton Variable Insurance Products Trust
Notes to Financial Statements (unaudited) (continued)
Mutual Shares Securities Fund
1. ORGANIZATION AND SIGNIFICANT ACCOUNTING POLICIES (continued)
a. Financial Instrument Valuation (continued)
values, and other relevant information for the investment to determine the fair value of the investment. An income-based valuation approach may also be used in which the anticipated future cash flows of the investment are discounted to calculate fair value. Discounts may also be applied due to the nature or duration of any restrictions on the disposition of the investments. Due to the inherent uncertainty of valuations of such investments, the fair values may differ significantly from the values that would have been used had an active market existed. The VLOC employs various methods for calibrating these valuation approaches including a regular review of key inputs and assumptions, transactional back-testing or disposition analysis, and reviews of any related market activity.
Trading in securities on foreign securities stock exchanges and OTC markets may be completed before the daily close of business on the NYSE. Occasionally, events occur between the time at which trading in a foreign security is completed and the close of the NYSE that might call into question the reliability of the value of a portfolio security held by the Fund. As a result, differences may arise between the value of the Fund’s portfolio securities as determined at the foreign market close and the latest indications of value at the close of the NYSE. In order to minimize the potential for these differences, the VLOC monitors price movements following the close of trading in foreign stock markets through a series of country specific market proxies (such as baskets of American Depositary Receipts, futures contracts and exchange traded funds). These price movements are measured against established trigger thresholds for each specific market proxy to assist in determining if an event has occurred that may call into question the reliability of the values of the foreign securities held by the Fund. If such an event occurs, the securities may be valued using fair value procedures, which may include the use of independent pricing services.
b. Foreign Currency Translation
Portfolio securities and other assets and liabilities denominated in foreign currencies are translated into U.S. dollars based on the exchange rate of such currencies against U.S. dollars on the date of valuation. The Fund may enter into foreign currency exchange contracts to facilitate transactions denominated in a foreign currency. Purchases and sales of securities, income and expense items denominated in foreign currencies are translated into U.S. dollars at the exchange rate in effect on the transaction date. Portfolio securities and assets and liabilities denominated in foreign currencies contain risks that those currencies will decline in value relative to the U.S. dollar. Occasionally, events may impact the availability or reliability of foreign exchange rates used to convert the U.S. dollar equivalent value. If such an event occurs, the foreign exchange rate will be valued at fair value using procedures established and approved by the Board.
The Fund does not separately report the effect of changes in foreign exchange rates from changes in market prices on securities held. Such changes are included in net realized and unrealized gain or loss from investments on the Statement of Operations.
Realized foreign exchange gains or losses arise from sales of foreign currencies, currency gains or losses realized between the trade and settlement dates on securities transactions and the difference between the recorded amounts of dividends, interest, and foreign withholding taxes and the U.S. dollar equivalent of the amounts actually received or paid. Net unrealized foreign exchange gains and losses arise from changes in foreign exchange rates on foreign denominated assets and liabilities other than investments in securities held at the end of the reporting period.
c. Securities Purchased on a Delayed Delivery Basis
The Fund purchases securities on a delayed delivery basis, with payment and delivery scheduled for a future date. These transactions are subject to market fluctuations and are subject to the risk that the value at delivery may be more or less than the trade date purchase price. Although the Fund will generally purchase these securities with the intention of holding the securities, it may sell the securities before the settlement date. Sufficient assets have been segregated for these securities.
MS-26
Franklin Templeton Variable Insurance Products Trust
Notes to Financial Statements (unaudited) (continued)
Mutual Shares Securities Fund
1. ORGANIZATION AND SIGNIFICANT ACCOUNTING POLICIES (continued)
d. Derivative Financial Instruments
The Fund invested in derivatives in order to manage risk or gain exposure to various other investments or markets. Derivatives are financial contracts based on an underlying or notional amount, require no initial investment or an initial net investment that is smaller than would normally be required to have a similar response to changes in market factors, and require or permit net settlement. Derivatives contain various risks including the potential inability of the counterparty to fulfill their obligations under the terms of the contract, the potential for an illiquid secondary market, and/or the potential for market movements which expose the Fund to gains or losses in excess of the amounts shown on the Statement of Assets and Liabilities. Realized gain and loss and unrealized appreciation and depreciation on these contracts for the period are included in the Statement of Operations.
The Fund entered into exchange traded futures contracts primarily to manage exposure to certain foreign currencies. A futures contract is an agreement between the Fund and a counterparty to buy or sell an asset for a specified price on a future date. Required initial margin deposits of cash or securities are pledged by the Fund. Subsequent payments, known as variation margin, are made or received by the Fund, depending on fluctuations in the value of the underlying security. Such variation margin is accounted for as unrealized appreciation or depreciation until the contract is closed, at which time the gains or losses are realized.
The Fund entered into OTC forward exchange contracts primarily to manage exposure to certain foreign currencies. A forward exchange contract is an agreement between the Fund and a counterparty to buy or sell a foreign currency for a specific exchange rate on a future date. Pursuant to the terms of the forward exchange contracts, cash or securities may be required to be deposited as collateral. Unrestricted cash may be invested according to the Fund’s investment objectives.
The Fund purchased or wrote exchange traded option contracts primarily to manage exposure to equity price risk. An option is a contract entitling the holder to purchase or sell a specific amount of shares or units of an asset or notional amount of a swap (swaption), at a specified price. Options purchased are recorded as an asset while options written are recorded as a liability. Upon exercise of an option, the acquisition cost or sales proceeds of the underlying investment is adjusted by any premium received or paid. Upon expiration of an option, any premium received or paid is recorded as a realized gain or loss. Upon closing an option other than through expiration or exercise, the difference between the premium and the cost to close the position is recorded as a realized gain or loss. Pursuant to the terms of the written option contract, cash or securities may be required to be deposited as collateral.
The Fund’s investments in OTC derivatives are subject to the terms of International Swaps and Derivatives Association Master Agreements and other related agreements between the Fund and certain derivative counterparties. These agreements contain various provisions, including but not limited to collateral requirements, events of default, requirements for the Fund to maintain certain net asset levels and/or limit the decline in net assets over various periods of time. Should the Fund fail to meet any of these provisions, the derivative counterparty has the right to terminate the derivative contract and require immediate payment by the Fund for those OTC derivatives with that particular counterparty that are in a net unrealized loss position. At June 30, 2012, the Fund had OTC derivatives in a net unrealized loss position for such contracts of $198,515.
At June 30, 2012, the Fund held $11,593,374 in United Kingdom treasury bonds and U.S. treasury bills and bonds as collateral for derivatives.
See Notes 6 and 11 regarding investment transactions and other derivative information, respectively.
e. Restricted Cash
At June 30, 2012, the Fund held restricted cash in connection with investments in certain derivative securities. Restricted cash is held in a segregated account with the Fund’s custodian/counterparty broker and is reflected in the Statement of Assets and Liabilities.
MS-27
Franklin Templeton Variable Insurance Products Trust
Notes to Financial Statements (unaudited) (continued)
Mutual Shares Securities Fund
1. ORGANIZATION AND SIGNIFICANT ACCOUNTING POLICIES (continued)
MS-28
f. Securities Sold Short
The Fund is engaged in selling securities short, which obligates the fund to replace a borrowed security with the same security at current market value. The fund incurs a loss if the price of the security increases between the date of the short sale and the date on which the fund replaces the borrowed security. The fund realizes a gain if the price of the security declines between those dates. Gains are limited to the price at which the fund sold the security short, while losses are potentially unlimited in size.
The fund is required to establish a margin account with the broker lending the security sold short. While the short sale is outstanding, the broker retains the proceeds of the short sale and the fund must maintain a deposit with the broker consisting of cash and/or securities having a value equal to a specified percentage of the value of the securities sold short. The fund is obligated to pay fees for borrowing the securities sold short and is required to pay the counterparty any dividends or interest due on securities sold short. Such dividends or interest and any security borrowing fees are recorded as an expense to the fund.
g. Securities Lending
The Fund participates in an agency based securities lending program. The fund receives cash collateral against the loaned securities in an amount equal to at least 102% of the market value of the loaned securities. Collateral is maintained over the life of the loan in an amount not less than 100% of the market value of loaned securities, as determined at the close of fund business each day; any additional collateral required due to changes in security values is delivered to the fund on the next business day. The collateral is invested in a non-registered money fund as indicated on the Statement of Investments. The fund receives income from the investment of cash collateral, in addition to lending fees and rebates paid by the borrower. The fund bears the market risk with respect to the collateral investment, securities loaned, and the risk that the agent may default on its obligations to the fund. The securities lending agent has agreed to indemnify the fund in the event of default by a third party borrower.
h. Senior Floating Rate Interests
The Fund invests in senior secured corporate loans that pay interest at rates which are periodically reset by reference to a base lending rate plus a spread. These base lending rates are generally the prime rate offered by a designated U.S. bank or the London InterBank Offered Rate (LIBOR). Senior secured corporate loans often require prepayment of principal from excess cash flows or at the discretion of the borrower. As a result, actual maturity may be substantially less than the stated maturity.
Senior secured corporate loans in which the Fund invests are generally readily marketable, but may be subject to some restrictions on resale.
i. Income and Deferred Taxes
It is the Fund’s policy to qualify as a regulated investment company under the Internal Revenue Code. The Fund intends to distribute to shareholders substantially all of its taxable income and net realized gains to relieve it from federal income and if applicable, excise taxes. As a result, no provision for U.S. federal income taxes is required.
The Fund may be subject to foreign taxation related to income received, capital gains on the sale of securities and certain foreign currency transactions in the foreign jurisdictions in which it invests. Foreign taxes, if any, are recorded based on the tax regulations and rates that exist in the foreign markets in which the Fund invests. When a capital gain tax is determined to apply the Fund records an estimated deferred tax liability in an amount that would be payable if the securities were disposed of on the valuation date.
The Fund recognizes the tax benefits of uncertain tax positions only when the position is “more likely than not” to be sustained upon examination by the tax authorities based on the technical merits of the tax position. As of June 30, 2012, and for all open
Franklin Templeton Variable Insurance Products Trust
Notes to Financial Statements (unaudited) (continued)
Mutual Shares Securities Fund
1. ORGANIZATION AND SIGNIFICANT ACCOUNTING POLICIES (continued)
i. Income and Deferred Taxes (continued)
tax years, the Fund has determined that no liability for unrecognized tax benefits is required in the Fund’s financial statements related to uncertain tax positions taken on a tax return (or expected to be taken on future tax returns). Open tax years are those that remain subject to examination and are based on each tax jurisdiction statute of limitation.
j. Security Transactions, Investment Income, Expenses and Distributions
Security transactions are accounted for on trade date. Realized gains and losses on security transactions are determined on a specific identification basis. Interest income and estimated expenses are accrued daily. Amortization of premium and accretion of discount on debt securities are included in interest income. Facility fees are recognized as income over the expected term of the loan. Dividend income and dividends declared on securities sold short are recorded on the ex-dividend date except that certain dividends from foreign securities are recognized as soon as the Fund is notified of the ex-dividend date. Distributions to shareholders are recorded on the ex-dividend date and are determined according to income tax regulations (tax basis). Distributable earnings determined on a tax basis may differ from earnings recorded in accordance with accounting principles generally accepted in the United States of America. These differences may be permanent or temporary. Permanent differences are reclassified among capital accounts to reflect their tax character. These reclassifications have no impact on net assets or the results of operations. Temporary differences are not reclassified, as they may reverse in subsequent periods.
Common expenses incurred by the Trust are allocated among the funds based on the ratio of net assets of each fund to the combined net assets of the Trust. Fund specific expenses are charged directly to the fund that incurred the expense.
Realized and unrealized gains and losses and net investment income, not including class specific expenses, are allocated daily to each class of shares based upon the relative proportion of net assets of each class. Differences in per share distributions, by class, are generally due to differences in class specific expenses.
k. Accounting Estimates
The preparation of financial statements in accordance with accounting principles generally accepted in the United States of America requires management to make estimates and assumptions that affect the reported amounts of assets and liabilities at the date of the financial statements and the amounts of income and expenses during the reporting period. Actual results could differ from those estimates.
l. Guarantees and Indemnifications
Under the Trust’s organizational documents, its officers and trustees are indemnified by the Trust against certain liabilities arising out of the performance of their duties to the Trust. Additionally, in the normal course of business, the Trust, on behalf of the Fund, enters into contracts with service providers that contain general indemnification clauses. The Trust’s maximum exposure under these arrangements is unknown as this would involve future claims that may be made against the Trust that have not yet occurred. Currently, the Trust expects the risk of loss to be remote.
MS-29
Franklin Templeton Variable Insurance Products Trust
Notes to Financial Statements (unaudited) (continued)
Mutual Shares Securities Fund
MS-30
2. SHARES OF BENEFICIAL INTEREST
At June 30, 2012, there were an unlimited number of shares authorized (without par value). Transactions in the Fund’s shares were as follows:
| Six Months Ended June 30, 2012 | Year Ended December 31, 2011 | |||||||||||||||
| Class 1 Shares: | Shares | Amount | Shares | Amount | ||||||||||||
Shares sold | 20,593,792 | $ | 337,034,129 | 42,708,405 | $ | 674,448,160 | ||||||||||
Shares issued in reinvestment of distributions | — | — | 2,247,132 | 32,920,483 | ||||||||||||
Shares redeemed | (16,970,064 | ) | (272,354,752 | ) | (50,368,429 | ) | (741,887,790 | ) | ||||||||
| ||||||||||||||||
Net increase (decrease) | 3,623,728 | $ | 64,679,377 | (5,412,892 | ) | $ | (34,519,147 | ) | ||||||||
| ||||||||||||||||
Class 2 Shares: | ||||||||||||||||
Shares sold | 10,628,085 | $ | 171,374,350 | 25,072,748 | $ | 394,507,314 | ||||||||||
Shares issued in reinvestment of distributions | — | — | 6,585,266 | 95,354,646 | ||||||||||||
Shares redeemed | (22,365,077 | ) | (360,242,757 | ) | (39,735,152 | ) | (631,117,652 | ) | ||||||||
| ||||||||||||||||
Net increase (decrease) | (11,736,992 | ) | $ | (188,868,407 | ) | (8,077,138 | ) | $ | (141,255,692 | ) | ||||||
| ||||||||||||||||
Class 4 Shares: | ||||||||||||||||
Shares sold | 209,723 | $ | 3,447,432 | 534,093 | $ | 8,261,151 | ||||||||||
Shares issued on reinvestment of distributions | — | — | 256,538 | 3,732,632 | ||||||||||||
Shares redeemed | (679,561 | ) | (10,831,455 | ) | (736,961 | ) | (11,654,315 | ) | ||||||||
| ||||||||||||||||
Net increase (decrease) | (469,838 | ) | $ | (7,384,023 | ) | 53,670 | $ | 339,468 | ||||||||
| ||||||||||||||||
3. TRANSACTIONS WITH AFFILIATES
Franklin Resources, Inc. is the holding company for various subsidiaries that together are referred to as Franklin Templeton Investments. Certain officers and trustees of the Fund are also officers and/or directors of the following subsidiaries:
| Subsidiary | Affiliation | |
Franklin Mutual Advisers, LLC (Franklin Mutual) | Investment manager | |
Franklin Templeton Services, LLC (FT Services) | Administrative manager | |
Franklin Templeton Distributors, Inc. (Distributors) | Principal underwriter | |
Franklin Templeton Investor Services, LLC (Investor Services) | Transfer agent |
a. Management Fees
The Fund pays an investment management fee to Franklin Mutual based on the average daily net assets of the Fund as follows:
| Annualized Fee Rate | Net Assets | |
| 0.600% | Up to and including $5 billion | |
| 0.570% | Over $5 billion, up to and including $10 billion | |
| 0.550% | Over $10 billion, up to and including $15 billion | |
| 0.530% | Over $15 billion, up to and including $20 billion | |
| 0.510% | In excess of $20 billion |
Franklin Templeton Variable Insurance Products Trust
Notes to Financial Statements (unaudited) (continued)
Mutual Shares Securities Fund
3. TRANSACTIONS WITH AFFILIATES (continued)
MS-31
b. Administrative Fees
The Fund pays an administrative fee to FT Services based on the Fund’s average daily net assets as follows:
| Annualized Fee Rate | Net Assets | |
| 0.150% | Up to and including $200 million | |
| 0.135% | Over $200 million, up to and including $700 million | |
| 0.100% | Over $700 million, up to and including $1.2 billion | |
| 0.075% | In excess of $1.2 billion |
c. Distribution Fees
The Board adopted distribution plans for Class 2 and Class 4 shares pursuant to Rule 12b-1 under the 1940 Act. Under the Fund’s compensation distribution plans, the Fund pays Distributors for costs incurred in connection with the servicing, sale and distribution of the Fund’s shares up to 0.35% per year of its average daily net assets of each class. The Board has agreed to limit the current rate to 0.25% per year for Class 2.
d. Transfer Agent Fees
Investor Services, under terms of an agreement, performs shareholder servicing for the Fund and is not paid by the Fund for the services.
e. Other Affiliated Transactions
At June 30, 2012, Franklin Templeton Variable Insurance Products Trust – Franklin Templeton VIP Founding Funds Allocation Fund owned 21.42% of the Fund’s outstanding shares.
4. EXPENSE OFFSET ARRANGEMENT
The Fund has entered into an arrangement with its custodian whereby credits realized as a result of uninvested cash balances are used to reduce a portion of the Fund’s custodian expenses. During the period ended June 30, 2012, there were no credits earned.
5. INCOME TAXES
For tax purposes, capital losses may be carried over to offset future capital gains, if any. Capital loss carryforwards with no expiration, if any, must be fully utilized before those losses with expiration dates.
At December 31, 2011, the Fund had capital loss carryforwards of $508,530,121 expiring in 2017 and capital loss carryforwards of $11,314,074 not subject to expiration.
At June 30, 2012, the cost of investments and net unrealized appreciation (depreciation) for income tax purposes were as follows:
Cost of investments | $ | 5,081,659,863 | ||
|
| |||
Unrealized appreciation | $ | 855,050,119 | ||
Unrealized depreciation | (524,873,890 | ) | ||
|
| |||
Net unrealized appreciation (depreciation) | $ | 330,176,229 | ||
|
| |||
Franklin Templeton Variable Insurance Products Trust
Notes to Financial Statements (unaudited) (continued)
Mutual Shares Securities Fund
5. INCOME TAXES (continued)
Differences between income and/or capital gains as determined on a book basis and a tax basis are primarily due to differing treatments of foreign currency transactions, corporate actions, and wash sales.
6. INVESTMENT TRANSACTIONS
Purchases and sales of investments (excluding short term securities and securities sold short) for the period ended June 30, 2012, aggregated $1,048,135,724 and $1,103,205,965, respectively.
Transactions in options written during the period ended June 30, 2012, were as follows:
| Number of Contracts | Premiums Received | |||||||
Options outstanding at December 31, 2011 | 122 | $ | 247,051 | |||||
Options written | 254 | 32,609 | ||||||
Options expired | (254 | ) | (32,609 | ) | ||||
Options exercised | — | — | ||||||
Options closed | (122 | ) | (247,051 | ) | ||||
|
| |||||||
Options outstanding at June 30, 2012 | — | $ | — | |||||
|
| |||||||
See Notes 1(d) and 11 regarding derivative financial instruments and other derivative information, respectively.
7. CREDIT RISK AND DEFAULTED SECURITIES
The Fund may purchase the pre-default or defaulted debt of distressed companies. Distressed companies are financially troubled and are about to be or are already involved in financial restructuring or bankruptcy. Risks associated with purchasing these securities include the possibility that the bankruptcy or other restructuring process takes longer than expected, or that distributions in restructuring are less than anticipated, either or both of which may result in unfavorable consequences to the Fund. If it becomes probable that the income on debt securities, including those of distressed companies, will not be collected, the Fund discontinues accruing income and recognizes an adjustment for uncollectible interest.
At June 30, 2012, the aggregate value of distressed company securities for which interest recognition has been discontinued was $28,291,158, representing 0.52% of the Fund’s net assets. For information as to specific securities, see the accompanying Statement of Investments.
8. RESTRICTED SECURITIES
The Fund invests in securities that are restricted under the Securities Act of 1933 (1933 Act) or which are subject to legal, contractual, or other agreed upon restrictions on resale. Restricted securities are often purchased in private placement transactions, and cannot be sold without prior registration unless the sale is pursuant to an exemption under the 1933 Act. Disposal of these securities may require greater effort and expense, and prompt sale at an acceptable price may be difficult. The Fund may have registration rights for restricted securities. The issuer generally incurs all registration costs.
MS-32
Franklin Templeton Variable Insurance Products Trust
Notes to Financial Statements (unaudited) (continued)
Mutual Shares Securities Fund
8. RESTRICTED SECURITIES (continued)
At June 30, 2012, the Fund held investments in restricted securities, excluding certain securities exempt from registration under the 1933 Act deemed to be liquid, as follows:
| Principal Amount/ Shares | Issuer | Acquisition Dates | Cost | Value | ||||||||||||
| 4,709,226 | AET&D Holdings No. 1 Pty. Ltd. | 10/13/10 | $ | — | $ | — | ||||||||||
| 194 | Ally Financial Inc. | 1/15/09 | 905,185 | 1,127,868 | ||||||||||||
| 2,128 | Broadband Ventures III LLC, secured promissory note, 5.00%, 2/01/12 | 7/01/10 | 2,128 | — | ||||||||||||
| 6,400,507 | CB FIM Coinvestors LLC | 1/15/09 - 6/02/09 | — | — | ||||||||||||
| 9,845,095 | Cerberus CG Investor I LLC | 7/26/07 - 6/17/08 | 4,593,328 | 1,181,411 | ||||||||||||
| 9,845,012 | Cerberus CG Investor II LLC | 7/26/07 - 6/17/08 | 4,593,276 | 1,181,401 | ||||||||||||
| 4,922,879 | Cerberus CG Investor III LLC | 7/26/07 | 2,296,874 | 590,746 | ||||||||||||
| 11,728 | Elephant Capital Holdings Ltd. | 8/29/03 - 3/10/08 | 1,813,542 | — | ||||||||||||
| 8,006,950 | FIM Coinvestor Holdings I, LLC | 11/20/06 - 6/02/09 | — | — | ||||||||||||
| 140,952 | First Southern Bancorp Inc. | 1/27/10 - 7/07/10 | 2,974,087 | 1,336,873 | ||||||||||||
| 241 | First Southern Bancorp Inc., cvt. pfd., C | 1/27/10 - 7/07/10 | 241,000 | 866,123 | ||||||||||||
| 5,565,600 | GLCP Harrah’s Investment LP | 1/15/08 | 2,783,967 | 434,506 | ||||||||||||
| 1,730,515 | International Automotive Components Group Brazil LLC | 4/13/06 - 12/26/08 | 1,149,241 | 589,240 | ||||||||||||
| 11,387,027 | International Automotive Components Group North America, LLC | 1/12/06 - 10/10/07 | 11,193,197 | 5,620,067 | ||||||||||||
| 57,295 | NCB Warrant Holdings Ltd., A | 12/16/05 - 3/10/08 | 539,528 | — | ||||||||||||
| 16,280 | Olympus Re Holdings Ltd. | 12/19/01 | 1,534,738 | — | ||||||||||||
|
| |||||||||||||||
Total Restricted Securities (0.24% of Net Assets) | $ | 12,928,235 | ||||||||||||||
|
| |||||||||||||||
9. UNFUNDED LOAN COMMITMENTS
The Fund enters into certain credit agreements, all or a portion of which may be unfunded. The Fund is obligated to fund these loan commitments at the borrowers’ discretion. Funded portions of credit agreements are presented on the Statement of Investments.
At June 30, 2012, unfunded commitments were as follows:
| Borrower | Unfunded Commitment | |||
Realogy Corp., Extended Revolver, 7.243%, 4/10/16 | $ | 5,617,379 | ||
|
| |||
Unfunded loan commitments and funded portions of credit agreements are marked to market daily and any unrealized appreciation or depreciation is included in the Statement of Assets and Liabilities and the Statement of Operations.
10. UNFUNDED CAPITAL COMMITMENTS
The Fund enters into certain capital commitments and may be obligated to perform on such agreements at a future date. The Fund monitors these commitments and assesses the probability of required performance. For any agreements whose probability of performance is determined to be greater than remote, the Fund assesses the fair value of the commitment. In instances where the probability of performance is greater than remote and the performance under the commitment would result in an unrealized loss, the Fund recognizes such losses on the Statement of Assets and Liabilities and the Statement of Operations.
At June 30, 2012, the Fund had aggregate unfunded capital commitments of $198,418, for which no depreciation has been recognized.
MS-33
Franklin Templeton Variable Insurance Products Trust
Notes to Financial Statements (unaudited) (continued)
Mutual Shares Securities Fund
11. OTHER DERIVATIVE INFORMATION
At June 30, 2012, the Fund has invested in derivative contracts which are reflected on the Statement of Assets and Liabilities as follows:
| Asset Derivatives | Liability Derivatives | |||||||||||
| Derivative Contracts Not Accounted for as Hedging Instruments | Statement of Assets and Liabilities Location | Fair Value Amount | Statement of Assets and Liabilities Location | Fair Value Amount | ||||||||
Foreign exchange contracts | Unrealized appreciation on forward exchange contracts | $ | 12,131,492 | Unrealized depreciation on forward exchange contracts / Net assets consist of – net unrealized appreciation (depreciation) | $ | 2,377,038a | ||||||
aIncludes cumulative appreciation (depreciation) of futures contracts as reported in the Statement of Investments. Only current day’s variation margin is separately reported within the Statement of Assets and Liabilities.
For the period ended June 30, 2012, the effect of derivative contracts on the Fund’s Statement of Operations was as follows:
| Derivative Contracts Not Accounted for as Hedging Instruments | Statement of Operations Locations | Realized Gain (Loss) for the Period | Change in Unrealized Appreciation (Depreciation) for the Period | |||||||
Foreign exchange contracts | Net realized gain (loss) from foreign currency transactions and futures contracts/Net change in unrealized appreciation (depreciation) on translation of other assets and liabilities denominated in foreign currencies | $ | 23,799,389 | $ | (19,619,793 | ) | ||||
Equity contracts | Net realized gain (loss) from written options/Net change in unrealized appreciation (depreciation) on investments | 265,845 | 96,989 | |||||||
For the period ended June 30, 2012, the average month end market value of derivatives represented 0.38% of average month end net assets. The average month end number of open derivative contracts for the period was 109.
See Notes 1(d) and 6 regarding derivative financial instruments and investment transactions, respectively.
12. HOLDINGS OF 5% VOTING SECURITIES OF PORTFOLIO COMPANIES
The 1940 Act defines “affiliated companies” to include investments in portfolio companies in which a fund owns 5% or more of the outstanding voting securities. Investments in “affiliated companies” for the Fund for the period ended June 30, 2012, were as shown below.
| Name of Issuer | Number of Shares Held at Beginning of Period | Gross Additions | Gross Reductions | Number of Shares Held at End of Period | Value at End of Period | Investment Income | Realized Capital Gain (Loss) | |||||||||||||||||||||
Non-Controlled Affiliates | ||||||||||||||||||||||||||||
CB FIM Coinvestors LLC | 6,400,507 | — | — | 6,400,507 | $ | — | $ | — | $ | — | ||||||||||||||||||
GLCP Harrah’s Investment LP | 5,565,600 | — | — | 5,565,600 | 434,506 | — | — | |||||||||||||||||||||
|
| |||||||||||||||||||||||||||
Total Affiliated Securities (0.01% of Net Assets) |
| $ | 434,506 | $ | — | $ | — | |||||||||||||||||||||
|
| |||||||||||||||||||||||||||
MS-34
Franklin Templeton Variable Insurance Products Trust
Notes to Financial Statements (unaudited) (continued)
Mutual Shares Securities Fund
13. CREDIT FACILITY
The Fund, together with other U.S. registered and foreign investment funds (collectively, Borrowers), managed by Franklin Templeton Investments, are borrowers in a joint syndicated senior unsecured credit facility totaling $1.5 billion (Global Credit Facility) which matures on January 18, 2013. This Global Credit Facility provides a source of funds to the Borrowers for temporary and emergency purposes, including the ability to meet future unanticipated or unusually large redemption requests.
Under the terms of the Global Credit Facility, the Fund shall, in addition to interest charged on any borrowings made by the Fund and other costs incurred by the Fund, pay its share of fees and expenses incurred in connection with the implementation and maintenance of the Global Credit Facility, based upon its relative share of the aggregate net assets of all of the Borrowers, including an annual commitment fee of 0.08% based upon the unused portion of the Global Credit Facility, which is reflected in other expenses on the Statement of Operations. During the period ended June 30, 2012, the Fund did not use the Global Credit Facility.
14. FAIR VALUE MEASUREMENTS
The Fund follows a fair value hierarchy that distinguishes between market data obtained from independent sources (observable inputs) and the Fund’s own market assumptions (unobservable inputs). These inputs are used in determining the value of the Fund’s financial instruments and are summarized in the following fair value hierarchy:
| • | Level 1 – quoted prices in active markets for identical financial instruments |
| • | Level 2 – other significant observable inputs (including quoted prices for similar financial instruments, interest rates, prepayment speed, credit risk, etc.) |
| • | Level 3 – significant unobservable inputs (including the Fund’s own assumptions in determining the fair value of financial instruments) |
The inputs or methodology used for valuing financial instruments are not an indication of the risk associated with investing in those financial instruments.
For movements between the levels within the fair value hierarchy, the Fund has adopted a policy of recognizing the transfers as of the date of the underlying event which caused the movement.
A summary of inputs used as of June 30, 2012, in valuing the Fund’s assets and liabilities carried at fair value, is as follows:
| Level 1 | Level 2 | Level 3 | Total | |||||||||||||
|
| |||||||||||||||
Assets: | ||||||||||||||||
Investments in Securities: | ||||||||||||||||
Equity Investments:a | ||||||||||||||||
Auto Components | $ | — | $ | — | $ | 6,211,538 | $ | 6,211,538 | ||||||||
Commercial Banks | 169,642,841 | — | 2,202,996 | b | 171,845,837 | |||||||||||
Consumer Finance | — | 1,128,768 | 2,953,558 | 4,082,326 | ||||||||||||
Diversified Financial Services | 140,940,802 | 9,627,598 | — | 150,568,400 | ||||||||||||
Diversified Telecommunication Services | 10,964,501 | — | 185,165 | b | 11,149,666 | |||||||||||
Hotels, Restaurants & Leisure | — | — | 434,506 | 434,506 | ||||||||||||
Real Estate Management & Development | 4,110,127 | — | 5,563,644 | 9,673,771 | ||||||||||||
Other Equity Investmentsc | 4,377,713,022 | — | — | b | 4,377,713,022 | |||||||||||
Corporate Bonds, Notes and Senior Floating Rate Interests | — | 222,194,999 | — | 222,194,999 | ||||||||||||
Corporate Notes and Senior Floating Rate Interests in Reorganization | — | 28,291,158 | — | b | 28,291,158 | |||||||||||
Companies in Liquidation | — | 68,392 | — | b | 68,392 | |||||||||||
Short Term Investments | 268,023,833 | 161,578,644 | — | 429,602,477 | ||||||||||||
|
| |||||||||||||||
Total Investments in Securities | $ | 4,971,395,126 | $ | 422,889,559 | $ | 17,551,407 | $ | 5,411,836,092 | ||||||||
|
| |||||||||||||||
Forward Exchange Contracts | — | 12,131,492 | — | 12,131,492 | ||||||||||||
MS-35
Franklin Templeton Variable Insurance Products Trust
Notes to Financial Statements (unaudited) (continued)
Mutual Shares Securities Fund
14. FAIR VALUE MEASUREMENTS (continued)
| Level 1 | Level 2 | Level 3 | Total | |||||||||||||
|
| |||||||||||||||
Liabilities: | ||||||||||||||||
Forward Exchange Contracts | $ | — | $ | 1,191,527 | $ | — | $ | 1,191,527 | ||||||||
Futures Contracts | 1,185,511 | — | — | 1,185,511 | ||||||||||||
Unfunded Loan Commitments | — | 676,537 | — | 676,537 | ||||||||||||
aIncludes common and convertible preferred stocks as well as other equity investments.
bIncludes securities determined to have no value at June 30, 2012.
cFor detailed categories, see the accompanying Statement of Investments.
A reconciliation of assets in which Level 3 inputs are used in determining fair value is presented when there are significant Level 3 investments at the end of the period.
15. NEW ACCOUNTING PRONOUNCEMENTS
In December 2011, the Financial Accounting Standards Board (FASB) issued Accounting Standards Update (ASU) No. 2011-11, Balance Sheet (Topic 210): Disclosures about Offsetting Assets and Liabilities. The amendments in the ASU enhance disclosures about offsetting of financial assets and liabilities to enable investors to understand the effect of these arrangements on a fund’s financial position. The ASU is effective for interim and annual reporting periods beginning on or after January 1, 2013. The Fund believes the adoption of this ASU will not have a material impact on its financial statements.
16. SUBSEQUENT EVENTS
The Fund has evaluated subsequent events through the issuance of the financial statements and determined that no events have occurred that require disclosure.
ABBREVIATIONS | ||||
| Counterparty | Currency | Selected Portfolio | ||
| BOFA - Bank of America Corp. | EUR - Euro | ADR - American Depositary Receipt | ||
| BZWS - Barclays Bank PLC | GBP - British Pound | FHLB - Federal Home Loan Bank | ||
| DBAB - Deutsche Bank AG | JPY - Japanese Yen | FRN - Floating Rate Note | ||
| FBCO - Credit Suisse Group AG | USD - United States Dollar | PIK - Payment-In-Kind | ||
| HAND - Svenska Handelsbanken | ||||
| HSBC - HSBC Bank USA, N.A. | ||||
| SCBT - Standard Chartered Bank | ||||
| SSBT - State Street Bank and Trust Co. |
MS-36
TEMPLETON DEVELOPING MARKETS SECURITIES FUND
This semiannual report for Templeton Developing Markets Securities Fund covers the period ended June 30, 2012.
Performance Summary as of 6/30/12
Templeton Developing Markets Securities Fund – Class 4 delivered a +0.04% total return for the six-month period ended 6/30/12.
Performance reflects the Fund’s Class 4 operating expenses, but does not include any contract fees, expenses or sales charges. If they had been included, performance would be lower. These charges and deductions, particularly for variable life policies, can have a significant effect on contract values and insurance benefits. See the contract prospectus for a complete description of these expenses, including sales charges.
Templeton Developing Markets Securities Fund Class 4
Performance data represent past performance, which does not guarantee future results. Investment return and principal value will fluctuate, and you may have a gain or loss when you sell your shares. Current performance may differ from figures shown.
TD-1
Fund Goal and Main Investments: Templeton Developing Markets Securities Fund seeks long-term capital appreciation. Under normal market conditions, the Fund invests at least 80% of its net assets in emerging market investments.
Performance Overview
You can find the Fund’s six-month total return in the Performance Summary. In comparison, the MSCI Emerging Markets (EM) Index posted a +4.12% total return, and the Standard & Poor’s®/International Finance Corporation Investable Composite Index had a +4.48% total return for the same period.1 Please note index performance numbers are for reference and we do not attempt to track an index but rather undertake investments on the basis of fundamental research.
Economic and Market Overview
Emerging market economies generally continued to grow faster than developed market economies during the six months under review. Emerging market stocks had a solid start to 2012 as improved economic data, government and central bank efforts to stimulate growth and substantial investment inflows drove market performance. The European Union’s approval of a second bailout package for Greece and the European Central Bank’s additional issuance of low interest loans to the region’s banks worth more than 529 billion euros (approximately US$700 billion) to ease the credit crunch and contain the debt crisis provided investors with additional reasons to remain positive.
The tide changed in April, however, as it became evident the eurozone sovereign debt crisis was far from contained. Record-high unemployment in the region, speculation on Greece’s exit from the European Union and concerns about Spanish banks’ solvency worsened. Weaker-than-expected U.S. economic data raised fears of another recession in the world’s largest economy. Major emerging economies including China and India reported slowing gross domestic product growth. News that the Chinese government had no plans to implement a wide-scale stimulus package also weighed on investor confidence.
Global stock prices rebounded in the first three weeks of June as optimism on the victory of the pro-bailout New Democracy party in Greece
1. Source: © 2012 Morningstar. One cannot invest directly in an index, and an index is not representative of the Fund’s portfolio. Please see Index Descriptions following the Fund Summaries.
Fund Risks: All investments involve risks, including possible loss of principal. Stock prices fluctuate, sometimes rapidly and dramatically, due to factors affecting individual companies, particular industries or sectors, or general market conditions. Value securities may not increase in price as anticipated, or may decline further in value. Risks associated with foreign investing include currency fluctuations, economic instability and political developments. Investments in developing markets involve heightened risks related to the same factors, in addition to those associated with these markets’ smaller size and lesser liquidity. The Fund may focus on particular sectors of the market from time to time, which can carry greater risks of adverse developments in such sectors. Smaller or midsized companies can be particularly sensitive to changing economic conditions, and their prospects for growth are less certain than those of larger, more established companies. The Fund is designed for the aggressive portion of a well-diversified portfolio. The Fund is actively managed but there is no guarantee that the manager’s investment decisions will produce the desired results. The Fund’s prospectus also includes a description of the main investment risks.
TD-2
and expectations of a third quantitative easing (QE3) program from the U.S. Federal Reserve Board (Fed) fueled stock market performance. However, sentiment turned sour as investors focused on Spain’s banking crisis and the Fed’s decision to extend the maturity extension program, dubbed Operation Twist, rather than to implement QE3.
Financial markets received good news on the last trading day of June when European leaders agreed to directly recapitalize the region’s struggling banks and work toward budgetary and political union. Global stocks rallied, leading emerging market stocks, as measured by the MSCI EM Index, to post a +4.12% total return in U.S. dollar terms for the six-month period.1
Investment Strategy
We employ a fundamental research, value-oriented, long-term investment approach. We focus on the market price of a company’s securities relative to our evaluation of its long-term earnings, asset value and cash flow potential. We also consider a company’s profit and loss outlook, balance sheet strength, cash flow trends and asset value in relation to the current price. Our analysis considers the company’s corporate governance behavior as well as its position in its sector, the economic framework and political environment. We invest in securities without regard to benchmark comparisons.
Manager’s Discussion
During the six months under review, key contributors to the Fund’s absolute performance were Souza Cruz, a major Brazilian cigarette company; Brazil-based AmBev (Companhia de Bebidas das Americas), one of the world’s largest beer and soft drink producers; and Kasikornbank, one of Thailand’s leading commercial banks. The strong market positions of Souza Cruz and AmBev have allowed their businesses to achieve superior returns and build market share as consumers become wealthier and more discerning. In our view, these companies have strong operations, low debt levels, good dividend yields and popular brands that make them attractive investments. We believe Kasikornbank is well positioned to benefit from Thailand’s potentially strong economic growth as the country recovers from last year’s floods and the government’s fiscal stimulus measures, including minimum wage increases, work through the economy. The bank enjoyed strong earnings in the first half of 2012 as it benefited from strong loan growth.
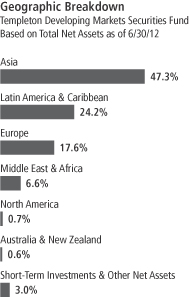
TD-3
In contrast, key detractors from absolute performance during the reporting period included Itau Unibanco Holding, one of Brazil’s largest financial conglomerates; Luk Fook Holdings (International), a major jewelry retail chain in Hong Kong and mainland China; and Astra International, Indonesia’s leading car and motorcycle company. Itau Unibanco’s share price weakened as ongoing central bank interest rate cuts threatened to hurt the bank’s profit margins. In our long-term view, the bank could benefit from its strong market position as Brazil’s economy grows and consumer wealth increases. Luk Fook’s sales growth eased recently as China’s slowing economic growth led Chinese tourists to cut spending on luxury items such as jewelry. However, we maintained a positive view of the company because we feel it has a solid market position, high return on equity, strong balance sheet and increasing presence in mainland China. Astra’s share price corrected largely due to investor expectations that new rules in Indonesia, which increased the minimum down payment required for vehicle purchases, could impact sales. As a leader in the Indonesian car and motorcycle markets, which have been enjoying strong secular growth trends, Astra could benefit from the potential continuation of the country’s robust economic growth, higher incomes and affordable credit in the long term.
It is important to recognize the effect of currency movements on the Fund’s performance. In general, if the value of the U.S. dollar goes up compared with a foreign currency, an investment traded in that foreign currency will go down in value because it will be worth fewer U.S. dollars. This can have a negative effect on Fund performance. Conversely, when the U.S. dollar weakens in relation to a foreign currency, an investment traded in that foreign currency will increase in value, which can contribute to Fund performance. For the six months ended June 30, 2012, the U.S. dollar rose in value relative to many currencies in which the Fund’s investments were traded. As a result, the Fund’s performance was negatively affected by the portfolio’s investment predominantly in securities with non-U.S. currency exposure.
In the past six months, we initiated positions in Colombia and Kenya and increased our holdings in Hong Kong, South Africa and South Korea as we continued to search for what we considered to be attractive investment opportunities. We added to casinos and gaming, catalog retail and specialty retail companies. Key purchases included additional shares of SJM Holdings, one of Macau’s largest casino operators, and the aforementioned Luk Fook, as well as a new position in South Korea-based Samsung Electronics, one of the world’s largest electronics manufacturers.
Top 10 Holdings
Templeton Developing Markets Securities Fund
6/30/12
| Company Sector/Industry, Country | % of Total Net Assets | |||
| AmBev (Companhia de Bebidas das Americas) | 7.8% | |||
| Beverages, Brazil | ||||
| PT Astra International Tbk | 6.0% | |||
| Automobiles, Indonesia | ||||
| Tata Consultancy Services Ltd. | 5.2% | |||
| IT Services, India | ||||
| Souza Cruz SA | 5.0% | |||
| Tobacco, Brazil | ||||
| LUKOIL Holdings, ADR | 3.4% | |||
| Oil, Gas & Consumable Fuels, Russia | ||||
| PetroChina Co. Ltd., H | 3.2% | |||
| Oil, Gas & Consumable Fuels, China | ||||
| Sberbank of Russia | 3.0% | |||
| Commercial Banks, Russia | ||||
| Kasikornbank PCL, fgn. | 3.0% | |||
| Commercial Banks, Thailand | ||||
| Vale SA, ADR, pfd., A | 2.9% | |||
| Metals & Mining, Brazil | ||||
| Gazprom, ADR | 2.9% | |||
| Oil, Gas & Consumable Fuels, Russia | ||||
The dollar value, number of shares or principal amount, and names of all portfolio holdings are listed in the Fund’s Statement of Investments.
TD-4
As certain stocks reached our sale targets, we reduced the Fund’s investments in Brazil, Indonesia and Taiwan to focus on stocks we considered to be more attractively valued within our investment universe. We reduced the Fund’s holdings largely in diversified metals and mining, diversified banking and food retail companies. Key reductions included Brazilian iron ore and nickel producer Vale, Indonesia-based Bank Central Asia and Taiwan-based convenience retail operator President Chain Store.
Thank you for your participation in Templeton Developing Markets Securities Fund. We look forward to serving your future investment needs.
The foregoing information reflects our analysis, opinions and portfolio holdings as of June 30, 2012, the end of the reporting period. The way we implement our main investment strategies and the resulting portfolio holdings may change depending on factors such as market and economic conditions. These opinions may not be relied upon as investment advice or an offer for a particular security. The information is not a complete analysis of every aspect of any market, country, industry, security or the Fund. Statements of fact are from sources considered reliable, but the investment manager makes no representation or warranty as to their completeness or accuracy. Although historical performance is no guarantee of future results, these insights may help you understand our investment management philosophy.
Top 10 Countries
Templeton Developing Markets Securities Fund
6/30/12
| % of Total Net Assets | ||||
| Brazil | 18.4% | |||
| Russia | 15.0% | |||
| China | 9.9% | |||
| India | 9.0% | |||
| Indonesia | 8.7% | |||
| Thailand | 6.7% | |||
| Hong Kong | 6.2% | |||
| Chile | 4.2% | |||
| South Africa | 4.1% | |||
| Singapore | 2.4% | |||
TD-5
Fund Expenses
As an investor in a variable insurance contract (Contract) that indirectly provides for investment in an underlying mutual fund, you can incur transaction and/or ongoing expenses at both the Fund level and the Contract level.
| • | Transaction expenses can include sales charges (loads) on purchases, surrender fees, transfer fees and premium taxes. |
| • | Ongoing expenses can include management fees, distribution and service (12b-1) fees, contract fees, annual maintenance fees, mortality and expense risk fees and other fees and expenses. All mutual funds and Contracts have some types of ongoing expenses. |
The expenses shown in the table are meant to highlight ongoing expenses at the Fund level only and do not include ongoing expenses at the Contract level, or transaction expenses at either the Fund or Contract levels. While the Fund does not have transaction expenses, if the transaction and ongoing expenses at the Contract level were included, the expenses shown below would be higher. You should consult your Contract prospectus or disclosure document for more information.
The table shows Fund-level ongoing expenses and can help you understand these expenses and compare them with those of other mutual funds offered through the Contract. The table assumes a $1,000 investment held for the six months indicated. Please refer to the Fund prospectus for additional information on operating expenses.
Actual Fund Expenses
The first line (Actual) of the table provides actual account values and expenses. The “Ending Account Value” is derived from the Fund’s actual return, which includes the effect of ongoing Fund expenses, but does not include the effect of ongoing Contract expenses.
You can estimate the Fund-level expenses you incurred during the period by following these steps. Of course, your account value and expenses will differ from those in this illustration:
| 1. | Divide your account value by $1,000. |
If an account had an $8,600 value, then $8,600 ÷ $1,000 = 8.6.
| 2. | Multiply the result by the number under the heading “Fund-Level Expenses Incurred During Period.” |
If Fund-Level Expenses Incurred During Period were $7.50, then 8.6 x $7.50 = $64.50.
In this illustration, the estimated expenses incurred this period at the Fund level are $64.50.
Templeton Developing Markets Securities Fund Class 4
TD-6
Hypothetical Example for Comparison with Other Mutual Funds
Information in the second line (Hypothetical) of the table can help you compare ongoing expenses of the Fund with those of other mutual funds offered through the Contract. This information may not be used to estimate the actual ending account balance or expenses you incurred during the period. The hypothetical “Ending Account Value” is based on the Fund’s actual expense ratio and an assumed 5% annual rate of return before expenses, which does not represent the Fund’s actual return. The figure under the heading “Fund-Level Expenses Incurred During Period” shows the hypothetical expenses your account would have incurred under this scenario. You can compare this figure with the 5% hypothetical examples that appear in shareholder reports of other funds offered through a Contract.
| Class 4 | Beginning Account Value 1/1/12 | Ending Account Value 6/30/12 | Fund-Level Expenses Incurred During Period* 1/1/12–6/30/12 | |||||||||
Actual | $ | 1,000 | $ | 1,000.40 | $ | 8.46 | ||||||
Hypothetical (5% return before expenses) | $ | 1,000 | $ | 1,016.41 | $ | 8.52 | ||||||
*Expenses are calculated using the most recent six-month annualized expense ratio for the Fund’s Class 4 shares (1.70%), which does not include any ongoing expenses of the Contract for which the Fund is an investment option, multiplied by the average account value over the period, multiplied by 182/366 to reflect the one-half year period.
TD-7
Franklin Templeton Variable Insurance Products Trust
Financial Highlights
Templeton Developing Markets Securities Fund
Six Months (unaudited) | Year Ended December 31, | |||||||||||||||||||||||
| Class 1 | 2011 | 2010 | 2009 | 2008 | 2007 | |||||||||||||||||||
| ||||||||||||||||||||||||
Per share operating performance | ||||||||||||||||||||||||
(for a share outstanding throughout the period) | ||||||||||||||||||||||||
Net asset value, beginning of period | $ | 9.50 | $ | 11.40 | $ | 9.86 | $ | 6.11 | $ | 16.16 | $ | 13.92 | ||||||||||||
|
| |||||||||||||||||||||||
Income from investment operationsa: | ||||||||||||||||||||||||
Net investment incomeb | 0.11 | 0.17 | 0.09 | 0.12 | 0.16 | 0.32 | ||||||||||||||||||
Net realized and unrealized gains (losses) | (0.08 | ) | (1.94 | ) | 1.63 | 4.02 | (7.40 | ) | 3.51 | |||||||||||||||
|
| |||||||||||||||||||||||
Total from investment operations | 0.03 | (1.77 | ) | 1.72 | 4.14 | (7.24 | ) | 3.83 | ||||||||||||||||
|
| |||||||||||||||||||||||
Less distributions from: | ||||||||||||||||||||||||
Net investment income | (0.17 | ) | (0.13 | ) | (0.18 | ) | (0.36 | ) | (0.37 | ) | (0.38 | ) | ||||||||||||
Net realized gains | — | — | — | (0.03 | ) | (2.44 | ) | (1.21 | ) | |||||||||||||||
|
| |||||||||||||||||||||||
Total distributions | (0.17 | ) | (0.13 | ) | (0.18 | ) | (0.39 | ) | (2.81 | ) | (1.59 | ) | ||||||||||||
|
| |||||||||||||||||||||||
Redemption feesc | — | — | — | — | — | — | ||||||||||||||||||
|
| |||||||||||||||||||||||
Net asset value, end of period | $ | 9.36 | $ | 9.50 | $ | 11.40 | $ | 9.86 | $ | 6.11 | $ | 16.16 | ||||||||||||
|
| |||||||||||||||||||||||
Total returnd | 0.33% | (15.67)% | 17.83% | 73.32% | (52.62)% | 29.09% | ||||||||||||||||||
Ratios to average net assetse | ||||||||||||||||||||||||
Expenses | 1.35% | 1.40% | 1.49% | f | 1.45% | f | 1.52% | f | 1.48% | f | ||||||||||||||
Net investment income | 2.25% | 1.57% | 0.87% | 1.64% | 1.52% | 2.07% | ||||||||||||||||||
Supplemental data | ||||||||||||||||||||||||
Net assets, end of period (000’s) | $ | 198,960 | $ | 232,544 | $ | 347,242 | $ | 325,927 | $ | 234,213 | $ | 753,843 | ||||||||||||
Portfolio turnover rate | 11.32% | 14.90% | 24.41% | 56.58% | g | 75.11% | g | 98.32% | ||||||||||||||||
aThe amount shown for a share outstanding throughout the period may not correlate with the Statement of Operations for the period due to the timing of sales and repurchases of the Fund shares in relation to income earned and/or fluctuating market value of the investments of the Fund.
bBased on average daily shares outstanding.
cAmount rounds to less than $0.01 per share.
dTotal return does not include fees, charges or expenses imposed by the variable annuity and life insurance contracts for which the Franklin Templeton Variable Insurance Products Trust serves as an underlying investment vehicle. Total return is not annualized for periods less than one year.
eRatios are annualized for periods less than one year.
fBenefit of expense reduction rounds to less than 0.01%.
gExcludes the value of portfolio securities delivered as a result of redemptions in-kind.
The accompanying notes are an integral part of these financial statements.
TD-8
Franklin Templeton Variable Insurance Products Trust
Financial Highlights (continued)
Templeton Developing Markets Securities Fund
Six Months (unaudited) | Year Ended December 31, | |||||||||||||||||||||||
| Class 2 | 2011 | 2010 | 2009 | 2008 | 2007 | |||||||||||||||||||
| ||||||||||||||||||||||||
Per share operating performance | ||||||||||||||||||||||||
(for a share outstanding throughout the period) | ||||||||||||||||||||||||
Net asset value, beginning of period | $ | 9.42 | $ | 11.30 | $ | 9.78 | $ | 6.04 | $ | 15.99 | $ | 13.79 | ||||||||||||
|
| |||||||||||||||||||||||
Income from investment operationsa: | ||||||||||||||||||||||||
Net investment incomeb | 0.10 | 0.14 | 0.06 | 0.11 | 0.15 | 0.27 | ||||||||||||||||||
Net realized and unrealized gains (losses) | (0.08 | ) | (1.92 | ) | 1.62 | 3.98 | (7.33 | ) | 3.49 | |||||||||||||||
|
| |||||||||||||||||||||||
Total from investment operations | 0.02 | (1.78 | ) | 1.68 | 4.09 | (7.18 | ) | 3.76 | ||||||||||||||||
|
| |||||||||||||||||||||||
Less distributions from: | ||||||||||||||||||||||||
Net investment income | (0.14 | ) | (0.10 | ) | (0.16 | ) | (0.32 | ) | (0.33 | ) | (0.35 | ) | ||||||||||||
Net realized gains | — | — | — | (0.03 | ) | (2.44 | ) | (1.21 | ) | |||||||||||||||
|
| |||||||||||||||||||||||
Total distributions | (0.14 | ) | (0.10 | ) | (0.16 | ) | (0.35 | ) | (2.77 | ) | (1.56 | ) | ||||||||||||
|
| |||||||||||||||||||||||
Redemption feesc | — | — | — | — | — | — | ||||||||||||||||||
|
| |||||||||||||||||||||||
Net asset value, end of period | $ | 9.30 | $ | 9.42 | $ | 11.30 | $ | 9.78 | $ | 6.04 | $ | 15.99 | ||||||||||||
|
| |||||||||||||||||||||||
Total returnd | 0.23% | (15.86)% | 17.58% | 72.59% | (52.70)% | 28.78% | ||||||||||||||||||
Ratios to average net assetse | ||||||||||||||||||||||||
Expenses | 1.60% | 1.65% | 1.74% | f | 1.70% | f | 1.77% | f | 1.73% | f | ||||||||||||||
Net investment income | 2.00% | 1.32% | 0.62% | 1.39% | 1.27% | 1.82% | ||||||||||||||||||
Supplemental data | ||||||||||||||||||||||||
Net assets, end of period (000’s) | $ | 281,185 | $ | 295,223 | $ | 392,546 | $ | 435,947 | $ | 264,186 | $ | 1,090,549 | ||||||||||||
Portfolio turnover rate | 11.32% | 14.90% | 24.41% | 56.58% | g | 75.11% | g | 98.32% | ||||||||||||||||
aThe amount shown for a share outstanding throughout the period may not correlate with the Statement of Operations for the period due to the timing of sales and repurchases of the Fund shares in relation to income earned and/or fluctuating market value of the investments of the Fund.
bBased on average daily shares outstanding.
cAmount rounds to less than $0.01 per share.
dTotal return does not include fees, charges or expenses imposed by the variable annuity and life insurance contracts for which the Franklin Templeton Variable Insurance Products Trust serves as an underlying investment vehicle. Total return is not annualized for periods less than one year.
eRatios are annualized for periods less than one year.
fBenefit of expense reduction rounds to less than 0.01%.
gExcludes the value of portfolio securities delivered as a result of redemptions in-kind.
The accompanying notes are an integral part of these financial statements.
TD-9
Franklin Templeton Variable Insurance Products Trust
Financial Highlights (continued)
Templeton Developing Markets Securities Fund
Six Months (unaudited) | Year Ended December 31, | |||||||||||||||||||||||
| Class 3 | 2011 | 2010 | 2009 | 2008 | 2007 | |||||||||||||||||||
| ||||||||||||||||||||||||
Per share operating performance | ||||||||||||||||||||||||
(for a share outstanding throughout the period) | ||||||||||||||||||||||||
Net asset value, beginning of period | $ | 9.36 | $ | 11.23 | $ | 9.73 | $ | 6.02 | $ | 15.96 | $ | 13.78 | ||||||||||||
|
| |||||||||||||||||||||||
Income from investment operationsa: | ||||||||||||||||||||||||
Net investment incomeb | 0.10 | 0.14 | 0.06 | 0.10 | 0.11 | 0.24 | ||||||||||||||||||
Net realized and unrealized gains (losses) | (0.08 | ) | (1.91 | ) | 1.60 | 3.97 | (7.27 | ) | 3.52 | |||||||||||||||
|
| |||||||||||||||||||||||
Total from investment operations | 0.02 | (1.77 | ) | 1.66 | 4.07 | (7.16 | ) | 3.76 | ||||||||||||||||
|
| |||||||||||||||||||||||
Less distributions from: | ||||||||||||||||||||||||
Net investment income | (0.14 | ) | (0.10 | ) | (0.16 | ) | (0.33 | ) | (0.34 | ) | (0.37 | ) | ||||||||||||
Net realized gains | — | — | — | (0.03 | ) | (2.44 | ) | (1.21 | ) | |||||||||||||||
|
| |||||||||||||||||||||||
Total distributions | (0.14 | ) | (0.10 | ) | (0.16 | ) | (0.36 | ) | (2.78 | ) | (1.58 | ) | ||||||||||||
|
| |||||||||||||||||||||||
Redemption feesc | — | — | — | — | — | — | ||||||||||||||||||
|
| |||||||||||||||||||||||
Net asset value, end of period | $ | 9.24 | $ | 9.36 | $ | 11.23 | $ | 9.73 | $ | 6.02 | $ | 15.96 | ||||||||||||
|
| |||||||||||||||||||||||
Total returnd | 0.25% | (15.86)% | 17.51% | 72.63% | (52.67)% | 28.70% | ||||||||||||||||||
Ratios to average net assetse | ||||||||||||||||||||||||
Expenses | 1.60% | 1.65% | 1.74% | f | 1.70% | f | 1.77% | f | 1.73% | f | ||||||||||||||
Net investment income | 2.00% | 1.32% | 0.62% | 1.39% | 1.27% | 1.82% | ||||||||||||||||||
Supplemental data | ||||||||||||||||||||||||
Net assets, end of period (000’s) | $ | 47,836 | $ | 44,702 | $ | 66,484 | $ | 66,718 | $ | 32,953 | $ | 100,961 | ||||||||||||
Portfolio turnover rate | 11.32% | 14.90% | 24.41% | 56.58% | g | 75.11% | g | 98.32% | ||||||||||||||||
aThe amount shown for a share outstanding throughout the period may not correlate with the Statement of Operations for the period due to the timing of sales and repurchases of the Fund shares in relation to income earned and/or fluctuating market value of the investments of the Fund.
bBased on average daily shares outstanding.
cAmount rounds to less than $0.01 per share.
dTotal return does not include fees, charges or expenses imposed by the variable annuity and life insurance contracts for which the Franklin Templeton Variable Insurance Products Trust serves as an underlying investment vehicle. Total return is not annualized for periods less than one year.
eRatios are annualized for periods less than one year.
fBenefit of expense reduction rounds to less than 0.01%.
gExcludes the value of portfolio securities delivered as a result of redemptions in-kind.
The accompanying notes are an integral part of these financial statements.
TD-10
Franklin Templeton Variable Insurance Products Trust
Financial Highlights (continued)
Templeton Developing Markets Securities Fund
Six Months (unaudited) | Year Ended December 31, | |||||||||||||||||||
| Class 4 | 2011 | 2010 | 2009 | 2008a | ||||||||||||||||
| ||||||||||||||||||||
Per share operating performance | ||||||||||||||||||||
(for a share outstanding throughout the period) | ||||||||||||||||||||
Net asset value, beginning of period | $ | 9.42 | $ | 11.30 | $ | 9.80 | $ | 6.09 | $ | 14.88 | ||||||||||
|
| |||||||||||||||||||
Income from investment operationsb: | ||||||||||||||||||||
Net investment income (loss)c | 0.10 | 0.13 | 0.05 | 0.09 | (0.33 | ) | ||||||||||||||
Net realized and unrealized gains (losses) | (0.10 | ) | (1.91 | ) | 1.61 | 4.00 | (5.65 | ) | ||||||||||||
|
| |||||||||||||||||||
Total from investment operations | — | (1.78 | ) | 1.66 | 4.09 | (5.98 | ) | |||||||||||||
|
| |||||||||||||||||||
Less distributions from: | ||||||||||||||||||||
Net investment income | (0.12 | ) | (0.10 | ) | (0.16 | ) | (0.35 | ) | (0.37 | ) | ||||||||||
Net realized gains | — | — | — | (0.03 | ) | (2.44 | ) | |||||||||||||
|
| |||||||||||||||||||
Total distributions | (0.12 | ) | (0.10 | ) | (0.16 | ) | (0.38 | ) | (2.81 | ) | ||||||||||
|
| |||||||||||||||||||
Redemption feesd | — | — | — | — | — | |||||||||||||||
|
| |||||||||||||||||||
Net asset value, end of period | $ | 9.30 | $ | 9.42 | $ | 11.30 | $ | 9.80 | $ | 6.09 | ||||||||||
|
| |||||||||||||||||||
Total returne | 0.04% | (15.88)% | 17.41% | 72.45% | (48.66)% | |||||||||||||||
Ratios to average net assetsf | ||||||||||||||||||||
Expenses | 1.70% | 1.75% | 1.84% | g | 1.80% | g | 1.87% | g | ||||||||||||
Net investment income | 1.90% | 1.22% | 0.52% | 1.29% | 1.17% | |||||||||||||||
Supplemental data | ||||||||||||||||||||
Net assets, end of period (000’s) | $ | 22,698 | $ | 24,380 | $ | 37,198 | $ | 26,362 | $ | 7,208 | ||||||||||
Portfolio turnover rate | 11.32% | 14.90% | 24.41% | 56.58% | h | 75.11% | h | |||||||||||||
aFor the period February 29, 2008 (effective date) to December 31, 2008.
bThe amount shown for a share outstanding throughout the period may not correlate with the Statement of Operations for the period due to the timing of sales and repurchases of the Fund shares in relation to income earned and/or fluctuating market value of the investments of the Fund.
cBased on average daily shares outstanding.
dAmount rounds to less than $0.01 per share.
eTotal return does not include fees, charges or expenses imposed by the variable annuity and life insurance contracts for which the Franklin Templeton Variable Insurance Products Trust serves as an underlying investment vehicle. Total return is not annualized for periods less than one year.
fRatios are annualized for periods less than one year.
gBenefit of expense reduction rounds to less than 0.01%.
hExcludes the value of portfolio securities delivered as a result of redemptions in-kind.
The accompanying notes are an integral part of these financial statements.
TD-11
Franklin Templeton Variable Insurance Products Trust
Statement of Investments, June 30, 2012 (unaudited)
| Templeton Developing Markets Securities Fund | Industry | Shares | Value | |||||||
Closed End Funds 0.4% | ||||||||||
Romania 0.4% | ||||||||||
SIF Banat-Crisana | Diversified Financial Services | 1,457,300 | $ | 373,071 | ||||||
SIF Moldova | Diversified Financial Services | 1,509,345 | 540,953 | |||||||
SIF Muntenia | Diversified Financial Services | 1,278,433 | 260,007 | |||||||
SIF Oltenia | Diversified Financial Services | 1,751,291 | 557,926 | |||||||
SIF Transilvania | Diversified Financial Services | 4,500,540 | 573,129 | |||||||
|
| |||||||||
Total Closed End Funds (Cost $2,899,996) | 2,305,086 | |||||||||
|
| |||||||||
Common Stocks 90.4% | ||||||||||
Australia 0.6% | ||||||||||
BHP Billiton Ltd. | Metals & Mining | 101,481 | 3,267,058 | |||||||
|
| |||||||||
Austria 0.2% | ||||||||||
aRaiffeisen Bank International AG | Commercial Banks | 40,018 | 1,304,154 | |||||||
|
| |||||||||
Brazil 14.5% | ||||||||||
Companhia de Bebidas das Americas (AmBev) | Beverages | 1,362,350 | 42,852,674 | |||||||
Itau Unibanco Holding SA, ADR | Commercial Banks | 653,674 | 9,099,142 | |||||||
Souza Cruz SA | Tobacco | 1,888,597 | 27,727,702 | |||||||
|
| |||||||||
| 79,679,518 | ||||||||||
|
| |||||||||
Chile 2.5% | ||||||||||
Antofagasta PLC | Metals & Mining | 794,779 | 13,554,220 | |||||||
|
| |||||||||
China 9.9% | ||||||||||
Anhui Conch Cement Co. Ltd., H | Construction Materials | 1,945,144 | 5,265,210 | |||||||
CNOOC Ltd. | Oil, Gas & Consumable Fuels | 7,181,000 | 14,254,444 | |||||||
aGreat Wall Motor Co. Ltd., H | Automobiles | 3,121,177 | 6,179,513 | |||||||
PetroChina Co. Ltd., H | Oil, Gas & Consumable Fuels | 13,880,000 | 17,801,523 | |||||||
Tencent Holdings Ltd. | Internet Software & Services | 82,000 | 2,388,729 | |||||||
Yantai Changyu Pioneer Wine Co. Ltd., B | Beverages | 614,262 | 4,140,950 | |||||||
Yanzhou Coal Mining Co. Ltd., H | Oil, Gas & Consumable Fuels | 3,038,000 | 4,691,257 | |||||||
|
| |||||||||
| 54,721,626 | ||||||||||
|
| |||||||||
Colombia 0.3% | ||||||||||
Ecopetrol SA, ADR | Oil, Gas & Consumable Fuels | 30,437 | 1,698,080 | |||||||
|
| |||||||||
Hong Kong 6.2% | ||||||||||
Dairy Farm International Holdings Ltd. | Food & Staples Retailing | 1,014,733 | 10,776,465 | |||||||
Giordano International Ltd. | Specialty Retail | 1,069,045 | 753,751 | |||||||
I.T Ltd. | Specialty Retail | 5,040,000 | 2,176,306 | |||||||
Luk Fook Holdings (International) Ltd. | Specialty Retail | 2,032,313 | 4,217,558 | |||||||
bLuk Fook Holdings (International) Ltd., 144A | Specialty Retail | 130,000 | 269,783 | |||||||
SJM Holdings Ltd. | Hotels, Restaurants & Leisure | 5,534,030 | 10,157,717 | |||||||
VTech Holdings Ltd. | Communications Equipment | 506,300 | 6,003,996 | |||||||
|
| |||||||||
| 34,355,576 | ||||||||||
|
| |||||||||
India 9.0% | ||||||||||
Grasim Industries Ltd. | Construction Materials | 28,924 | 1,379,426 | |||||||
Infosys Ltd. | IT Services | 165,015 | 7,439,349 | |||||||
National Aluminium Co. Ltd. | Metals & Mining | 180,606 | 193,913 | |||||||
Oil & Natural Gas Corp. Ltd. | Oil, Gas & Consumable Fuels | 1,572,924 | 8,067,222 | |||||||
Tata Chemicals Ltd. | Chemicals | 669,855 | 3,749,909 | |||||||
Tata Consultancy Services Ltd. | IT Services | 1,244,539 | 28,642,782 | |||||||
|
| |||||||||
| 49,472,601 | ||||||||||
|
| |||||||||
TD-12
Franklin Templeton Variable Insurance Products Trust
Statement of Investments, June 30, 2012 (unaudited) (continued)
| Templeton Developing Markets Securities Fund | Industry | Shares | Value | |||||||
Common Stocks (continued) | ||||||||||
Indonesia 8.7% | ||||||||||
PT Astra International Tbk | Automobiles | 45,325,000 | $ | 33,055,762 | ||||||
PT Bank Central Asia Tbk | Commercial Banks | 11,282,532 | 8,768,963 | |||||||
PT Bank Rakyat Indonesia (Persero) Tbk | Commercial Banks | 8,664,000 | 5,857,482 | |||||||
|
| |||||||||
| 47,682,207 | ||||||||||
|
| |||||||||
Kenya 0.2% | ||||||||||
British American Tobacco Kenya Ltd. Corp. | Tobacco | 45,200 | 199,459 | |||||||
Equity Bank Ltd. | Commercial Banks | 1,181,300 | 297,778 | |||||||
Kenya Commercial Bank Ltd. | Commercial Banks | 2,032,200 | 560,482 | |||||||
|
| |||||||||
| 1,057,719 | ||||||||||
|
| |||||||||
Malaysia 0.5% | ||||||||||
Kuala Lumpur Kepong Bhd. | Food Products | 394,500 | 2,854,386 | |||||||
|
| |||||||||
Mexico 0.7% | ||||||||||
Kimberly Clark de Mexico SAB de CV, A | Household Products | 1,952,613 | 3,823,001 | |||||||
|
| |||||||||
Nigeria 0.6% | ||||||||||
First Bank of Nigeria PLC | Commercial Banks | 7,297,629 | 489,199 | |||||||
Guinness Nigeria PLC | Beverages | 214,723 | 298,172 | |||||||
Nigerian Breweries PLC | Beverages | 4,294,577 | 2,684,935 | |||||||
|
| |||||||||
| 3,472,306 | ||||||||||
|
| |||||||||
Qatar 0.5% | ||||||||||
Industries Qatar QSC | Industrial Conglomerates | 77,085 | 2,646,423 | |||||||
|
| |||||||||
Russia 15.0% | ||||||||||
Gazprom, ADR | Oil, Gas & Consumable Fuels | 1,203,700 | 11,435,150 | |||||||
Gazprom, ADR (London Stock Exchange) | Oil, Gas & Consumable Fuels | 470,200 | 4,431,635 | |||||||
cLUKOIL Holdings, ADR | Oil, Gas & Consumable Fuels | 75,208 | 4,217,665 | |||||||
cLUKOIL Holdings, ADR (London Stock Exchange) | Oil, Gas & Consumable Fuels | 260,068 | 14,479,286 | |||||||
Mining and Metallurgical Co. Norilsk Nickel, ADR | Metals & Mining | 251,243 | 4,175,659 | |||||||
Sberbank of Russia | Commercial Banks | 6,150,040 | 16,400,739 | |||||||
TNK-BP Holding | Oil, Gas & Consumable Fuels | 5,340,274 | 12,335,629 | |||||||
dUralkali OJSC, GDR, Reg S | Chemicals | 401,096 | 15,351,949 | |||||||
|
| |||||||||
| 82,827,712 | ||||||||||
|
| |||||||||
Singapore 2.4% | ||||||||||
Keppel Corp. Ltd. | Industrial Conglomerates | 846,557 | 6,868,671 | |||||||
SembCorp Marine Ltd. | Machinery | 1,672,000 | 6,307,940 | |||||||
|
| |||||||||
| 13,176,611 | ||||||||||
|
| |||||||||
South Africa 4.1% | ||||||||||
Exxaro Resources Ltd. | Oil, Gas & Consumable Fuels | 272,483 | 6,339,188 | |||||||
Remgro Ltd. | Diversified Financial Services | 614,891 | 9,896,268 | |||||||
Tiger Brands Ltd. | Food Products | 212,099 | 6,360,153 | |||||||
|
| |||||||||
| 22,595,609 | ||||||||||
|
| |||||||||
South Korea 1.6% | ||||||||||
Samsung Electronics Co. Ltd. | Semiconductors & Semiconductor Equipment | 4,453 | 4,685,849 | |||||||
SK Innovation Co. Ltd. | Oil, Gas & Consumable Fuels | 35,682 | 4,314,404 | |||||||
|
| |||||||||
| 9,000,253 | ||||||||||
|
| |||||||||
Taiwan 2.1% | ||||||||||
President Chain Store Corp. | Food & Staples Retailing | 2,133,075 | 11,347,667 | |||||||
|
| |||||||||
TD-13
Franklin Templeton Variable Insurance Products Trust
Statement of Investments, June 30, 2012 (unaudited) (continued)
| Templeton Developing Markets Securities Fund | Industry | Shares | Value | |||||||
Common Stocks (continued) | ||||||||||
Thailand 6.7% | ||||||||||
Kasikornbank PCL, fgn. | Commercial Banks | 3,116,500 | $ | 16,290,908 | ||||||
PTT Exploration and Production PCL, fgn. | Oil, Gas & Consumable Fuels | 2,021,223 | 10,757,657 | |||||||
PTT PCL, fgn. | Oil, Gas & Consumable Fuels | 938,100 | 9,599,439 | |||||||
Supalai PCL, fgn. | Real Estate Management & Development | 184,644 | 100,029 | |||||||
|
| |||||||||
| 36,748,033 | ||||||||||
|
| |||||||||
Turkey 1.1% | ||||||||||
Tupras-Turkiye Petrol Rafinerileri AS | Oil, Gas & Consumable Fuels | 274,426 | 5,873,727 | |||||||
|
| |||||||||
United Arab Emirates 1.2% | ||||||||||
Emaar Properties PJSC | Real Estate Management & Development | 8,942,377 | 6,816,857 | |||||||
|
| |||||||||
United Kingdom 0.9% | ||||||||||
Anglo American PLC | Metals & Mining | 146,649 | 4,869,782 | |||||||
|
| |||||||||
United States 0.7% | ||||||||||
Avon Products Inc. | Personal Products | 246,420 | 3,994,468 | |||||||
|
| |||||||||
Vietnam 0.2% | ||||||||||
DHG Pharmaceutical JSC | Pharmaceuticals | 95,800 | 290,997 | |||||||
Dong Phu Rubber JSC | Chemicals | 88,000 | 218,895 | |||||||
Vinacafe Bien Hoa JSC | Food Products | 68,500 | 422,699 | |||||||
|
| |||||||||
| 932,591 | ||||||||||
|
| |||||||||
Total Common Stocks (Cost $339,459,761) | 497,772,185 | |||||||||
|
| |||||||||
Preferred Stocks 6.2% | ||||||||||
Brazil 3.9% | ||||||||||
Itausa - Investimentos Itau SA, ADR, pfd. | Commercial Banks | 17,790 | 74,422 | |||||||
Itausa - Investimentos Itau SA, pfd. | Commercial Banks | 1,241,305 | 5,254,659 | |||||||
Vale SA, ADR, pfd., A | Metals & Mining | 831,932 | 16,230,993 | |||||||
|
| |||||||||
| 21,560,074 | ||||||||||
|
| |||||||||
Chile 1.7% | ||||||||||
Embotelladora Andina SA, pfd., A | Beverages | 2,049,785 | 8,964,612 | |||||||
|
| |||||||||
Colombia 0.6% | ||||||||||
Bancolombia SA, ADR, pfd. | Commercial Banks | 53,200 | 3,289,888 | |||||||
|
| |||||||||
Total Preferred Stocks (Cost $18,650,704) | 33,814,574 | |||||||||
|
| |||||||||
Total Investments before Short Term Investments | 533,891,845 | |||||||||
|
| |||||||||
Short Term Investments 3.4% | ||||||||||
Money Market Funds (Cost $16,675,196) 3.0% | ||||||||||
United States 3.0% | ||||||||||
e,fInstitutional Fiduciary Trust Money Market Portfolio | 16,675,196 | 16,675,196 | ||||||||
|
| |||||||||
TD-14
Franklin Templeton Variable Insurance Products Trust
Statement of Investments, June 30, 2012 (unaudited) (continued)
| Templeton Developing Markets Securities Fund | Shares | Value | ||||||
Short Term Investments (continued) | ||||||||
gInvestments from Cash Collateral Received for Loaned Securities (Cost $2,583,471) 0.4% | ||||||||
Money Market Funds 0.4% | ||||||||
United States 0.4% | ||||||||
hBNY Mellon Overnight Government Fund, 0.182% | 2,583,471 | $ | 2,583,471 | |||||
|
| |||||||
Total Investments (Cost $380,269,128) 100.4% | 553,150,512 | |||||||
Other Assets, less Liabilities (0.4)% | (2,471,634 | ) | ||||||
|
| |||||||
Net Assets 100.0% | $ | 550,678,878 | ||||||
|
| |||||||
See Abbreviations on page TD-26.
aA portion or all of the security is on loan at June 30, 2012. See Note 1(c).
bSecurity was purchased pursuant to Rule 144A under the Securities Act of 1933 and may be sold in transactions exempt from registration only to qualified institutional buyers or in a public offering registered under the Securities Act of 1933. This security has been deemed liquid under guidelines approved by the Trust’s Board of Trustees. At June 30, 2012, the value of this security was $269,783, representing 0.05% of net assets.
cAt June 30, 2012, pursuant to the Fund’s policies and the requirements of applicable securities law, the Fund may be restricted from trading these securities for a limited or extended period of time due to ownership limits and/or potential possession of material non-public information.
dSecurity was purchased pursuant to Regulation S under the Securities Act of 1933, which exempts from registration securities offered and sold outside of the United States. Such a security cannot be sold in the United States without either an effective registration statement filed pursuant to the Securities Act of 1933, or pursuant to an exemption from registration. This security has been deemed liquid under guidelines approved by the Trust’s Board of Trustees. At June 30, 2012, the value of this security was $15,351,949, representing 2.79% of net assets.
eNon-income producing.
fSee Note 7 regarding investments in the Institutional Fiduciary Trust Money Market Portfolio.
gSee Note 1(c) regarding securities on loan.
hThe rate shown is the annualized seven-day yield at period end.
The accompanying notes are an integral part of these financial statements.
TD-15
Franklin Templeton Variable Insurance Products Trust
Financial Statements
Statement of Assets and Liabilities
June 30, 2012 (unaudited)
| Templeton Developing Markets Securities Fund | ||||
Assets: | ||||
Investments in securities: | ||||
Cost - Unaffiliated issuers | $ | 363,593,932 | ||
Cost - Sweep Money Fund (Note 7) | 16,675,196 | |||
|
| |||
Total cost of investments | $ | 380,269,128 | ||
|
| |||
Value - Unaffiliated issuers | $ | 536,475,316 | ||
Value - Sweep Money Fund (Note 7) | 16,675,196 | |||
|
| |||
Total value of investments (includes securities loaned in the amount of $2,509,564) | 553,150,512 | |||
Foreign currency, at value (cost $92,399) | 92,487 | |||
Receivables: | ||||
Investment securities sold | 2,499,526 | |||
Capital shares sold | 203,571 | |||
Dividends | 2,924,807 | |||
Foreign tax | 27,630 | |||
Other assets | 151 | |||
|
| |||
Total assets | 558,898,684 | |||
|
| |||
Liabilities: | ||||
Payables: | ||||
Investment securities purchased | 3,430,205 | |||
Capital shares redeemed | 1,099,997 | |||
Affiliates | 689,157 | |||
Payable upon return of securities loaned | 2,583,471 | |||
Accrued expenses and other liabilities | 416,976 | |||
|
| |||
Total liabilities | 8,219,806 | |||
|
| |||
Net assets, at value | $ | 550,678,878 | ||
|
| |||
Net assets consist of: | ||||
Paid-in capital | $ | 496,473,023 | ||
Undistributed net investment income | 5,595 | |||
Net unrealized appreciation (depreciation) | 172,853,271 | |||
Accumulated net realized gain (loss) | (118,653,011 | ) | ||
|
| |||
Net assets, at value | $ | 550,678,878 | ||
|
| |||
The accompanying notes are an integral part of these financial statements.
TD-16
Franklin Templeton Variable Insurance Products Trust
Financial Statements (continued)
Statement of Assets and Liabilities (continued)
June 30, 2012 (unaudited)
| Templeton Developing Markets Securities Fund | ||||
Class 1: | ||||
Net assets, at value | $ | 198,959,805 | ||
|
| |||
Shares outstanding | 21,265,537 | |||
|
| |||
Net asset value and maximum offering price per share | $ | 9.36 | ||
|
| |||
Class 2: | ||||
Net assets, at value | $ | 281,184,776 | ||
|
| |||
Shares outstanding | 30,250,841 | |||
|
| |||
Net asset value and maximum offering price per share | $ | 9.30 | ||
|
| |||
Class 3: | ||||
Net assets, at value | $ | 47,836,176 | ||
|
| |||
Shares outstanding | 5,179,618 | |||
|
| |||
Net asset value and maximum offering price per sharea | $ | 9.24 | ||
|
| |||
Class 4: | ||||
Net assets, at value | $ | 22,698,121 | ||
|
| |||
Shares outstanding | 2,439,605 | |||
|
| |||
Net asset value and maximum offering price per share | $ | 9.30 | ||
|
| |||
aRedemption price is equal to net asset value less redemption fees retained by the Fund.
The accompanying notes are an integral part of these financial statements.
TD-17
Franklin Templeton Variable Insurance Products Trust
Financial Statements (continued)
Statement of Operations
for the six months ended June 30, 2012 (unaudited)
| Templeton Developing Markets Securities Fund | ||||
Investment income: | ||||
Dividends (net of foreign taxes of $1,012,523) | $ | 10,949,427 | ||
Income from securities loaned | 43,857 | |||
|
| |||
Total investment income | 10,993,284 | |||
|
| |||
Expenses: | ||||
Management fees (Note 3a) | 3,342,776 | |||
Administrative fees (Note 3b) | 426,683 | |||
Distribution fees: (Note 3c) | ||||
Class 2 | 378,092 | |||
Class 3 | 64,343 | |||
Class 4 | 43,892 | |||
Unaffiliated transfer agent fees | 1,211 | |||
Custodian fees (Note 4) | 206,811 | |||
Reports to shareholders | 110,700 | |||
Professional fees | 28,338 | |||
Trustees’ fees and expenses | 1,439 | |||
Other | 9,817 | |||
|
| |||
Total expenses | 4,614,102 | |||
|
| |||
Net investment income | 6,379,182 | |||
|
| |||
Realized and unrealized gains (losses): | ||||
Net realized gain (loss) from: | ||||
Investments | 13,584,804 | |||
Foreign currency transactions | (560,713 | ) | ||
|
| |||
Net realized gain (loss) | 13,024,091 | |||
|
| |||
Net change in unrealized appreciation (depreciation) on: | ||||
Investments | (14,616,878 | ) | ||
Translation of other assets and liabilities denominated in foreign currencies | (5,476 | ) | ||
|
| |||
Net change in unrealized appreciation (depreciation) | (14,622,354 | ) | ||
|
| |||
Net realized and unrealized gain (loss) | (1,598,263 | ) | ||
|
| |||
Net increase (decrease) in net assets resulting from operations | $ | 4,780,919 | ||
|
| |||
The accompanying notes are an integral part of these financial statements.
TD-18
Franklin Templeton Variable Insurance Products Trust
Financial Statements (continued)
Statements of Changes in Net Assets
| Templeton Developing Markets Securities Fund | ||||||||
| Six Months Ended June 30, 2012 (unaudited) | Year Ended December 31, 2011 | |||||||
| ||||||||
Increase (decrease) in net assets: | ||||||||
Operations: | ||||||||
Net investment income | $ | 6,379,182 | $ | 10,217,132 | ||||
Net realized gain (loss) from investments and foreign currency transactions | 13,024,091 | 41,092,169 | ||||||
Net change in unrealized appreciation (depreciation) on investments, translation of other assets and liabilities denominated in foreign currencies and deferred taxes | (14,622,354 | ) | (168,736,087 | ) | ||||
| ||||||||
Net increase (decrease) in net assets resulting from operations | 4,780,919 | (117,426,786 | ) | |||||
| ||||||||
Distributions to shareholders from: | ||||||||
Net investment income: | ||||||||
Class 1 | (3,523,272 | ) | (3,575,470 | ) | ||||
Class 2 | (4,111,805 | ) | (3,331,863 | ) | ||||
Class 3 | (716,639 | ) | (556,039 | ) | ||||
Class 4 | (295,623 | ) | (314,405 | ) | ||||
| ||||||||
Total distributions to shareholders | (8,647,339 | ) | (7,777,777 | ) | ||||
| ||||||||
Capital share transactions: (Note 2) | ||||||||
Class 1 | (32,894,640 | ) | (64,505,854 | ) | ||||
Class 2 | (12,064,580 | ) | (37,899,841 | ) | ||||
Class 3 | 4,184,090 | (11,807,405 | ) | |||||
Class 4 | (1,529,976 | ) | (7,237,721 | ) | ||||
| ||||||||
Total capital share transactions | (42,305,106 | ) | (121,450,821 | ) | ||||
| ||||||||
Redemption fees | 929 | 34,912 | ||||||
| ||||||||
Net increase (decrease) in net assets | (46,170,597 | ) | (246,620,472 | ) | ||||
Net assets: | ||||||||
Beginning of period | 596,849,475 | 843,469,947 | ||||||
| ||||||||
End of period | $ | 550,678,878 | $ | 596,849,475 | ||||
| ||||||||
Undistributed net investment income included in net assets: | ||||||||
End of period | $ | 5,595 | $ | 2,273,752 | ||||
| ||||||||
The accompanying notes are an integral part of these financial statements.
TD-19
Franklin Templeton Variable Insurance Products Trust
Notes to Financial Statements (unaudited)
Templeton Developing Markets Securities Fund
1. ORGANIZATION AND SIGNIFICANT ACCOUNTING POLICIES
Franklin Templeton Variable Insurance Products Trust (Trust) is registered under the Investment Company Act of 1940, as amended, (1940 Act) as an open-end investment company, consisting of twenty separate funds. The Templeton Developing Markets Securities Fund (Fund) is included in this report. The financial statements of the remaining funds in the Trust are presented separately. Shares of the Fund are generally sold only to insurance company separate accounts to fund the benefits of variable life insurance policies or variable annuity contracts. The Fund offers four classes of shares: Class 1, Class 2, Class 3, and Class 4. Each class of shares differs by its distribution fees, voting rights on matters affecting a single class and its exchange privilege.
The following summarizes the Fund’s significant accounting policies.
a. Financial Instrument Valuation
The Fund’s investments in financial instruments are carried at fair value daily. Fair value is the price that would be received to sell an asset or paid to transfer a liability in an orderly transaction between market participants on the measurement date. Under procedures approved by the Trust’s Board of Trustees (the Board), the Fund’s administrator, investment manager and other affiliates have formed the Valuation and Liquidity Oversight Committee (VLOC). The VLOC provides administration and oversight of the Fund’s valuation policies and procedures, which are approved annually by the Board. Among other things, these procedures allow the Fund to utilize independent pricing services, quotations from securities and financial instrument dealers, and other market sources to determine fair value.
Equity securities and exchange traded funds listed on an exchange or on the NASDAQ National Market System are valued at the last quoted sale price or the official closing price of the day, respectively. Foreign equity securities are valued as of the close of trading on the foreign stock exchange on which the security is primarily traded, or the NYSE, whichever is earlier. The value is then converted into its U.S. dollar equivalent at the foreign exchange rate in effect at the close of the NYSE on the day that the value of the security is determined. Over-the-counter securities are valued within the range of the most recent quoted bid and ask prices. Securities that trade in multiple markets or on multiple exchanges are valued according to the broadest and most representative market. Certain equity securities are valued based upon fundamental characteristics or relationships to similar securities. Investments in open-end mutual funds and non-registered money market funds are valued at the closing net asset value.
The Fund has procedures to determine the fair value of financial instruments for which market prices are not reliable or readily available. Under these procedures, the VLOC convenes on a regular basis to review such financial instruments and considers a number of factors, including significant unobservable valuation inputs, when arriving at fair value. The VLOC primarily employs a market-based approach which may use related or comparable assets or liabilities, recent transactions, market multiples, book values, and other relevant information for the investment to determine the fair value of the investment. An income-based valuation approach may also be used in which the anticipated future cash flows of the investment are discounted to calculate fair value. Discounts may also be applied due to the nature or duration of any restrictions on the disposition of the investments. Due to the inherent uncertainty of valuations of such investments, the fair values may differ significantly from the values that would have been used had an active market existed. The VLOC employs various methods for calibrating these valuation approaches including a regular review of key inputs and assumptions, transactional back-testing or disposition analysis, and reviews of any related market activity.
Trading in securities on foreign securities stock exchanges and over-the-counter markets may be completed before the daily close of business on the NYSE. Occasionally, events occur between the time at which trading in a foreign security is completed and the close of the NYSE that might call into question the reliability of the value of a portfolio security held by the Fund. As a result, differences may arise between the value of the Fund’s portfolio securities as determined at the foreign market close and the latest indications of value at the close of the NYSE. In order to minimize the potential for these differences, the VLOC monitors price movements following the close of trading in foreign stock markets through a series of country specific market proxies (such as baskets of American Depositary Receipts, futures contracts and exchange traded funds). These price movements are measured
TD-20
Franklin Templeton Variable Insurance Products Trust
Notes to Financial Statements (unaudited) (continued)
Templeton Developing Markets Securities Fund
1. ORGANIZATION AND SIGNIFICANT ACCOUNTING POLICIES (continued)
a. Financial Instrument Valuation (continued)
against established trigger thresholds for each specific market proxy to assist in determining if an event has occurred that may call into question the reliability of the values of the foreign securities held by the Fund. If such an event occurs, the securities may be valued using fair value procedures, which may include the use of independent pricing services.
b. Foreign Currency Translation
Portfolio securities and other assets and liabilities denominated in foreign currencies are translated into U.S. dollars based on the exchange rate of such currencies against U.S. dollars on the date of valuation. The Fund may enter into foreign currency exchange contracts to facilitate transactions denominated in a foreign currency. Purchases and sales of securities, income and expense items denominated in foreign currencies are translated into U.S. dollars at the exchange rate in effect on the transaction date. Portfolio securities and assets and liabilities denominated in foreign currencies contain risks that those currencies will decline in value relative to the U.S. dollar. Occasionally, events may impact the availability or reliability of foreign exchange rates used to convert the U.S. dollar equivalent value. If such an event occurs, the foreign exchange rate will be valued at fair value using procedures established and approved by the Board.
The Fund does not separately report the effect of changes in foreign exchange rates from changes in market prices on securities held. Such changes are included in net realized and unrealized gain or loss from investments on the Statement of Operations.
Realized foreign exchange gains or losses arise from sales of foreign currencies, currency gains or losses realized between the trade and settlement dates on securities transactions and the difference between the recorded amounts of dividends, interest, and foreign withholding taxes and the U.S. dollar equivalent of the amounts actually received or paid. Net unrealized foreign exchange gains and losses arise from changes in foreign exchange rates on foreign denominated assets and liabilities other than investments in securities held at the end of the reporting period.
c. Securities Lending
The Fund participates in an agency based securities lending program. The fund receives cash collateral against the loaned securities in an amount equal to at least 102% of the market value of the loaned securities. Collateral is maintained over the life of the loan in an amount not less than 100% of the market value of loaned securities, as determined at the close of fund business each day; any additional collateral required due to changes in security values is delivered to the fund on the next business day. The collateral is invested in a non-registered money fund as indicated on the Statement of Investments. The fund receives income from the investment of cash collateral, in addition to lending fees and rebates paid by the borrower. The fund bears the market risk with respect to the collateral investment, securities loaned, and the risk that the agent may default on its obligations to the fund. The securities lending agent has agreed to indemnify the fund in the event of default by a third party borrower.
d. Income and Deferred Taxes
It is the Fund’s policy to qualify as a regulated investment company under the Internal Revenue Code. The Fund intends to distribute to shareholders substantially all of its taxable income and net realized gains to relieve it from federal income and if applicable, excise taxes. As a result, no provision for U.S. federal income taxes is required.
The Fund may be subject to foreign taxation related to income received, capital gains on the sale of securities and certain foreign currency transactions in the foreign jurisdictions in which it invests. Foreign taxes, if any, are recorded based on the tax regulations and rates that exist in the foreign markets in which the Fund invests. When a capital gain tax is determined to apply the Fund records an estimated deferred tax liability in an amount that would be payable if the securities were disposed of on the valuation date.
TD-21
Franklin Templeton Variable Insurance Products Trust
Notes to Financial Statements (unaudited) (continued)
Templeton Developing Markets Securities Fund
1. ORGANIZATION AND SIGNIFICANT ACCOUNTING POLICIES (continued)
d. Income and Deferred Taxes (continued)
The Fund recognizes the tax benefits of uncertain tax positions only when the position is “more likely than not” to be sustained upon examination by the tax authorities based on the technical merits of the tax position. As of June 30, 2012, and for all open tax years, the Fund has determined that no liability for unrecognized tax benefits is required in the Fund’s financial statements related to uncertain tax positions taken on a tax return (or expected to be taken on future tax returns). Open tax years are those that remain subject to examination and are based on each tax jurisdiction statute of limitation.
e. Security Transactions, Investment Income, Expenses and Distributions
Security transactions are accounted for on trade date. Realized gains and losses on security transactions are determined on a specific identification basis. Estimated expenses are accrued daily. Dividend income is recorded on the ex-dividend date except that certain dividends from foreign securities are recognized as soon as the Fund is notified of the ex-dividend date. Distributions to shareholders are recorded on the ex-dividend date and are determined according to income tax regulations (tax basis). Distributable earnings determined on a tax basis may differ from earnings recorded in accordance with accounting principles generally accepted in the United States of America. These differences may be permanent or temporary. Permanent differences are reclassified among capital accounts to reflect their tax character. These reclassifications have no impact on net assets or the results of operations. Temporary differences are not reclassified, as they may reverse in subsequent periods.
Common expenses incurred by the Trust are allocated among the funds based on the ratio of net assets of each fund to the combined net assets of the Trust. Fund specific expenses are charged directly to the fund that incurred the expense.
Realized and unrealized gains and losses and net investment income, not including class specific expenses, are allocated daily to each class of shares based upon the relative proportion of net assets of each class. Differences in per share distributions, by class, are generally due to differences in class specific expenses.
f. Accounting Estimates
The preparation of financial statements in accordance with accounting principles generally accepted in the United States of America requires management to make estimates and assumptions that affect the reported amounts of assets and liabilities at the date of the financial statements and the amounts of income and expenses during the reporting period. Actual results could differ from those estimates.
g. Redemption Fees
Redemptions and exchanges of interests in an insurance company subaccount that invests in Class 3 shares of the Fund will be subject to a 1.0% short term trading fee if the interest in the subaccount has been held for less than 60 days. Such fees are retained by the Fund and accounted for as an addition to paid-in capital, allocated to each class of shares based upon the relative proportion of net assets of each class.
h. Guarantees and Indemnifications
Under the Trust’s organizational documents, its officers and trustees are indemnified by the Trust against certain liabilities arising out of the performance of their duties to the Trust. Additionally, in the normal course of business, the Trust, on behalf of the Fund, enters into contracts with service providers that contain general indemnification clauses. The Trust’s maximum exposure under these arrangements is unknown as this would involve future claims that may be made against the Trust that have not yet occurred. Currently, the Trust expects the risk of loss to be remote.
TD-22
Franklin Templeton Variable Insurance Products Trust
Notes to Financial Statements (unaudited) (continued)
Templeton Developing Markets Securities Fund
2. SHARES OF BENEFICIAL INTEREST
At June 30, 2012, there were an unlimited number of shares authorized (without par value). Transactions in the Fund’s shares were as follows:
| Six Months Ended June 30, 2012 | Year Ended December 31, 2011 | |||||||||||||||
| Class 1 Shares: | Shares | Amount | Shares | Amount | ||||||||||||
Shares sold | 686,552 | $ | 6,995,534 | 2,813,987 | $ | 30,009,154 | ||||||||||
Shares issued in reinvestment of distributions | 385,901 | 3,523,272 | 324,453 | 3,575,470 | ||||||||||||
Shares redeemed | (4,283,973 | ) | (43,413,446 | ) | (9,124,103 | ) | (98,090,478 | ) | ||||||||
| ||||||||||||||||
Net increase (decrease) | (3,211,520 | ) | $ | (32,894,640 | ) | (5,985,663 | ) | $ | (64,505,854 | ) | ||||||
| ||||||||||||||||
Class 2 Shares: | ||||||||||||||||
Shares sold | 2,219,589 | $ | 21,763,966 | 6,746,331 | $ | 70,699,788 | ||||||||||
Shares issued in reinvestment of distributions | 453,341 | 4,111,805 | 304,558 | 3,331,863 | ||||||||||||
Shares redeemed | (3,756,025 | ) | (37,940,351 | ) | (10,448,699 | ) | (111,931,492 | ) | ||||||||
| ||||||||||||||||
Net increase (decrease) | (1,083,095 | ) | $ | (12,064,580 | ) | (3,397,810 | ) | $ | (37,899,841 | ) | ||||||
| ||||||||||||||||
Class 3 Shares: | ||||||||||||||||
Shares sold | 862,807 | $ | 8,748,041 | 848,211 | $ | 9,362,399 | ||||||||||
Shares issued in reinvestment of distributions | 79,538 | 716,639 | 51,154 | 556,039 | ||||||||||||
Shares redeemed | (536,540 | ) | (5,280,590 | ) | (2,043,372 | ) | (21,725,843 | ) | ||||||||
| ||||||||||||||||
Net increase (decrease) | 405,805 | $ | 4,184,090 | (1,144,007 | ) | $ | (11,807,405 | ) | ||||||||
| ||||||||||||||||
Class 4 Shares: | ||||||||||||||||
Shares sold | 183,124 | $ | 1,808,096 | 464,313 | $ | 5,040,717 | ||||||||||
Shares issued on reinvestment of distributions | 32,558 | 295,623 | 28,739 | 314,405 | ||||||||||||
Shares redeemed | (364,859 | ) | (3,633,695 | ) | (1,194,944 | ) | (12,592,843 | ) | ||||||||
| ||||||||||||||||
Net increase (decrease) | (149,177 | ) | $ | (1,529,976 | ) | (701,892 | ) | $ | (7,237,721 | ) | ||||||
| ||||||||||||||||
3. TRANSACTIONS WITH AFFILIATES
Franklin Resources, Inc. is the holding company for various subsidiaries that together are referred to as Franklin Templeton Investments. Certain officers and trustees of the Fund are also officers and/or directors of the following subsidiaries:
| Subsidiary | Affiliation | |
Templeton Asset Management Ltd. (TAML) | Investment manager | |
Franklin Templeton Services, LLC (FT Services) | Administrative manager | |
Franklin Templeton Distributors, Inc. (Distributors) | Principal underwriter | |
Franklin Templeton Investor Services, LLC (Investor Services) | Transfer agent |
TD-23
Franklin Templeton Variable Insurance Products Trust
Notes to Financial Statements (unaudited) (continued)
Templeton Developing Markets Securities Fund
3. TRANSACTIONS WITH AFFILIATES (continued)
a. Management Fees
The Fund pays an investment management fee to TAML based on the average daily net assets of the Fund as follows:
| Annualized Fee Rate | Net Assets | |
| 1.100% | Up to and including $1 billion | |
| 1.050% | Over $1 billion, up to and including $5 billion | |
| 1.000% | Over $5 billion, up to and including $10 billion | |
| 0.950% | Over $10 billion, up to and including $15 billion | |
| 0.900% | Over $15 billion, up to and including $20 billion | |
| 0.850% | In excess of $20 billion |
b. Administrative Fees
The Fund pays an administrative fee to FT Services based on the Fund’s average daily net assets as follows:
| Annualized Fee Rate | Net Assets | |
| 0.150% | Up to and including $200 million | |
| 0.135% | Over $200 million, up to and including $700 million | |
| 0.100% | Over $700 million, up to and including $1.2 billion | |
| 0.075% | In excess of $1.2 billion |
c. Distribution Fees
The Board has adopted distribution plans for Class 2, Class 3, and Class 4 shares pursuant to Rule 12b-1 under the 1940 Act. Under the Fund’s compensation distribution plans, the Fund pays Distributors for costs incurred in connection with the servicing, sale and distribution of the Fund’s shares up to 0.25%, 0.35%, and 0.35% per year of its average daily net assets of Class 2, Class 3, and Class 4, respectively. The Board has agreed to limit the current rate to 0.25% per year for Class 3.
d. Transfer Agent Fees
Investor Services, under terms of an agreement, performs shareholder servicing for the Fund and is not paid by the Fund for the services.
4. EXPENSE OFFSET ARRANGEMENT
The Fund has entered into an arrangement with its custodian whereby credits realized as a result of uninvested cash balances are used to reduce a portion of the Fund’s custodian expenses. During the period ended June 30, 2012, there were no credits earned.
5. INCOME TAXES
For tax purposes, capital losses may be carried over to offset future capital gains, if any. Capital loss carryforwards with no expiration, if any, must be fully utilized before those losses with expiration dates.
At December 31, 2011, the Fund had capital loss carryforwards of $125,392,863 expiring in 2017.
TD-24
Franklin Templeton Variable Insurance Products Trust
Notes to Financial Statements (unaudited) (continued)
Templeton Developing Markets Securities Fund
5. INCOME TAXES (continued)
At June 30, 2012, the cost of investments and net unrealized appreciation (depreciation) for income tax purposes were as follows:
Cost of investments | $ | 393,020,861 | ||
|
| |||
Unrealized appreciation | $ | 183,711,206 | ||
Unrealized depreciation | (23,581,555 | ) | ||
|
| |||
Net unrealized appreciation (depreciation) | $ | 160,129,651 | ||
|
| |||
Differences between income and/or capital gains as determined on a book basis and a tax basis are primarily due to differing treatments of foreign currency transactions, passive foreign investment company shares, corporate actions, and wash sales.
6. INVESTMENT TRANSACTIONS
Purchases and sales of investments (excluding short term securities) for the period ended June 30, 2012, aggregated $66,436,750 and $88,333,846, respectively.
7. INVESTMENTS IN INSTITUTIONAL FIDUCIARY TRUST MONEY MARKET PORTFOLIO
The Fund invests in the Institutional Fiduciary Trust Money Market Portfolio (Sweep Money Fund), an open-end investment company managed by Franklin Advisers, Inc. (an affiliate of the investment manager). Management fees paid by the Fund are reduced on assets invested in the Sweep Money Fund, in an amount not to exceed the management and administrative fees paid by the Sweep Money Fund.
8. CONCENTRATION OF RISK
Investing in foreign securities may include certain risks and considerations not typically associated with investing in U.S. securities, such as fluctuating currency values and changing local and regional economic, political and social conditions, which may result in greater market volatility. In addition, certain foreign securities may not be as liquid as U.S. securities.
9. CREDIT FACILITY
The Fund, together with other U.S. registered and foreign investment funds (collectively, Borrowers), managed by Franklin Templeton Investments, are borrowers in a joint syndicated senior unsecured credit facility totaling $1.5 billion (Global Credit Facility) which matures on January 18, 2013. This Global Credit Facility provides a source of funds to the Borrowers for temporary and emergency purposes, including the ability to meet future unanticipated or unusually large redemption requests.
Under the terms of the Global Credit Facility, the Fund shall, in addition to interest charged on any borrowings made by the Fund and other costs incurred by the Fund, pay its share of fees and expenses incurred in connection with the implementation and maintenance of the Global Credit Facility, based upon its relative share of the aggregate net assets of all of the Borrowers, including an annual commitment fee of 0.08% based upon the unused portion of the Global Credit Facility, which is reflected in other expenses on the Statement of Operations. During the period ended June 30, 2012, the Fund did not use the Global Credit Facility.
TD-25
Franklin Templeton Variable Insurance Products Trust
Notes to Financial Statements (unaudited) (continued)
Templeton Developing Markets Securities Fund
10. FAIR VALUE MEASUREMENTS
The Fund follows a fair value hierarchy that distinguishes between market data obtained from independent sources (observable inputs) and the Fund’s own market assumptions (unobservable inputs). These inputs are used in determining the value of the Fund’s financial instruments and are summarized in the following fair value hierarchy:
| • | Level 1 – quoted prices in active markets for identical financial instruments |
| • | Level 2 – other significant observable inputs (including quoted prices for similar financial instruments, interest rates, prepayment speed, credit risk, etc.) |
| • | Level 3 – significant unobservable inputs (including the Fund’s own assumptions in determining the fair value of financial instruments) |
The inputs or methodology used for valuing financial instruments are not an indication of the risk associated with investing in those financial instruments.
For movements between the levels within the fair value hierarchy, the Fund has adopted a policy of recognizing the transfers as of the date of the underlying event which caused the movement.
A summary of inputs used as of June 30, 2012, in valuing the Fund’s assets and liabilities carried at fair value, is as follows:
| Level 1 | Level 2 | Level 3 | Total | |||||||||||||
|
| |||||||||||||||
Assets: | ||||||||||||||||
Investments in Securities: | ||||||||||||||||
Closed End Funds | $ | 2,305,086 | $ | — | $ | — | $ | 2,305,086 | ||||||||
Equity Investmentsa,b | 531,586,759 | — | — | 531,586,759 | ||||||||||||
Short Term Investments | 16,675,196 | 2,583,471 | — | 19,258,667 | ||||||||||||
|
| |||||||||||||||
Total Investments in Securities | $ | 550,567,041 | $ | 2,583,471 | $ | — | $ | 553,150,512 | ||||||||
|
| |||||||||||||||
aIncludes common and preferred stocks.
bFor detailed categories, see the accompanying Statement of Investments.
11. NEW ACCOUNTING PRONOUNCEMENTS
In December 2011, the Financial Accounting Standards Board issued Accounting Standards Update (ASU) No. 2011-11, Balance Sheet (Topic 210): Disclosures about Offsetting Assets and Liabilities. The amendments in the ASU enhance disclosures about offsetting of financial assets and liabilities to enable investors to understand the effect of these arrangements on a fund’s financial position. The ASU is effective for interim and annual reporting periods beginning on or after January 1, 2013. The Fund believes the adoption of this ASU will not have a material impact on its financial statements.
12. SUBSEQUENT EVENTS
The Fund has evaluated subsequent events through the issuance of the financial statements and determined that no events have occurred that require disclosure.
ABBREVIATIONS | ||||
| Selected Portfolio | ||||
| ADR - American Depositary Receipt | ||||
| GDR - Global Depositary Receipt |
TD-26
Franklin Templeton Variable Insurance Products Trust
Tax Information (unaudited)
Templeton Developing Markets Securities Fund
At December 31, 2011, more than 50% of the Fund’s total assets were invested in securities of foreign issuers. In most instances, foreign taxes were withheld from income paid to the Fund on these investments. As shown in the table below, the Fund hereby reports to shareholders the foreign source income and foreign taxes paid, pursuant to Section 853 of the Internal Revenue Code. This written statement will allow shareholders of record on June 14, 2012, to treat their proportionate share of foreign taxes paid by the Fund as having been paid directly by them. The shareholder shall consider these amounts as foreign taxes paid in the tax year in which they receive the Fund distribution.
The following table provides a detailed analysis of foreign tax paid, and foreign source income as reported by the Fund, to Class 1, Class 2, Class 3, and Class 4 shareholders of record.
| Class | Foreign Tax Paid Per Share | Foreign Source Income Per Share | ||||||
Class 1 | $ | 0.0339 | $ | 0.2177 | ||||
Class 2 | $ | 0.0339 | $ | 0.1876 | ||||
Class 3 | $ | 0.0339 | $ | 0.1890 | ||||
Class 4 | $ | 0.0339 | $ | 0.1695 | ||||
Foreign Tax Paid Per Share (Column 1) is the amount per share available to you, as a tax credit (assuming you held your shares in the Fund for a minimum of 16 days during the 31-day period beginning 15 days before the ex-dividend date of the Fund’s distribution to which the foreign taxes relate), or, as a tax deduction.
Foreign Source Income Per Share (Column 2) is the amount per share of income dividends attributable to foreign securities held by the Fund, plus any foreign taxes withheld on these dividends.
TD-27
TEMPLETON FOREIGN SECURITIES FUND
This semiannual report for Templeton Foreign Securities Fund covers the period ended June 30, 2012.
Performance Summary as of 6/30/12
Templeton Foreign Securities Fund – Class 4 delivered a +1.25% total return for the six-month period ended 6/30/12.
Performance reflects the Fund’s Class 4 operating expenses, but does not include any contract fees, expenses or sales charges. If they had been included, performance would be lower. These charges and deductions, particularly for variable life policies, can have a significant effect on contract values and insurance benefits. See the contract prospectus for a complete description of these expenses, including sales charges.
Templeton Foreign Securities Fund – Class 4
Performance data represent past performance, which does not guarantee future results. Investment return and principal value will fluctuate, and you may have a gain or loss when you sell your shares. Current performance may differ from figures shown.
TF-1
Fund Goal and Main Investments: Templeton Foreign Securities Fund seeks long-term capital growth. Under normal market conditions, the Fund invests at least 80% of its net assets in investments of issuers located outside the U.S., including those in emerging markets.
Performance Overview
You can find the Fund’s six-month total return in the Performance Summary. The Fund underperformed its benchmark, the MSCI Europe, Australasia, Far East (EAFE) Index, which produced a +3.38% total return for the same period.1 Please note, index performance information is provided for reference and we do not attempt to track the index but rather undertake investments on the basis of fundamental research.
Economic and Market Overview
The six months under review encompassed two different market environments. The first quarter of 2012 delivered the best annual start for global developed stocks in more than a decade, as measured by the MSCI World Index, as signs of U.S. economic recovery and European policy relief underpinned a rally in cyclical stocks.2 Yet, renewed global economic weakness and European debt concerns led the market lower in the second quarter, and stocks dropped sharply in the spring before additional policy action prompted a rebound in June. Politics largely drove the markets during the first half of 2012 as investors closely monitored developments in Europe, where German-led austerity demands were met with increasing resentment from some highly indebted eurozone members. Coalition-building efforts in Greece collapsed amid anger over the terms of the country’s second bailout, forcing a new election that brought some relief when the pro-euro party won. Elsewhere in the region, France’s socialist candidate clinched the presidency on a pro-growth platform and the Dutch cabinet resigned in the wake of a contentious austerity deal.
On the economic front, global growth trends generally moderated, led by Europe, which narrowly avoided recession mainly because of German export strength. Yet, even the more resilient economies of Germany, the U.S. and China showed signs of a slowdown at period-end. The combination of flagging growth, political uncertainty and populist unrest pressured investor confidence, and ratings agencies
1. Source: © 2012 Morningstar. One cannot invest directly in an index, and an index is not representative of the Fund’s portfolio. Please see Index Descriptions following the Fund Summaries.
2. Please see Index Descriptions following the Fund Summaries.
Fund Risks: All investments involve risks, including possible loss of principal. Special risks are associated with foreign investing, including currency fluctuations, economic instability and political developments; investments in emerging markets involve heightened risks related to the same factors. To the extent the Fund focuses on particular countries, regions, industries, sectors or types of investment from time to time, it may be subject to greater risks of adverse developments in such areas of focus than a fund that invests in a wider variety of countries, regions, industries, sectors or investments. Current political uncertainty surrounding the European Union (EU) and its membership may increase market volatility. The financial instability of some countries in the EU, including Greece, Italy and Spain, together with the risk of that impacting other more stable countries, may increase the economic risk of investing in companies in Europe. The Fund is actively managed but there is no guarantee that the manager’s investment decisions will produce the desired results. The Fund’s prospectus also includes a description of the main investment risks.
TF-2
downgraded global banks and European sovereigns. Concerns about Italian and Spanish borrowing costs added to investor anxiety as bond yields climbed. Europe’s initial policy responses — including enhanced liquidity measures and an ineffective Spanish banking bailout — did little to address the structural imbalances of eurozone economies or the solvency fears plaguing the region’s banking system. Yet, encouraging progress did emerge at period-end when leaders in Brussels agreed to ease conditions of sovereign bond purchases and permit the region’s bailout fund to directly recapitalize banks. Meanwhile, the U.S. Federal Reserve Board opted to extend its strategy, dubbed Operation Twist, designed to lower systemically important interest rates, and the People’s Bank of China slashed interest rates for the first time since the global financial crisis began. In the latter part of the period, commodities extended recent losses, with oil falling back below $100, while the euro dipped and traditional safe havens like U.S. Treasuries, the U.S. dollar and the Japanese yen made gains.
Investment Strategy
Our investment philosophy is bottom up, value oriented and long term. In choosing investments, we generally focus on the market price of a company’s securities relative to our evaluation of the company’s potential long-term earnings, asset value and cash flow. Among factors we consider are a company’s historical value measures, including price/earnings ratio, profit margins and liquidation value. We do in-depth research to construct a bargain list from which we buy.
Manager’s Discussion
During the six months under review, underweighting and stock selection in the economically sensitive materials sector, which suffered from a global commodity price correction, was a major contributor to Fund performance relative to the MSCI EAFE Index.3 Beverage-can maker Rexam (U.K.) became a standout materials holding after agreeing to sell two of its personal care divisions in 2011. Our stock selection in information technology4 aided relative results, particularly in two companies that benefited from global demand for smartphones and tablet PCs: South Korean semiconductor, telecommunication and digital media products manufacturer Samsung Electronics5 and integrated circuit and semiconductor devices company Taiwan Semiconductor Manufacturing.5
3. The materials sector comprises chemicals, construction and engineering, construction materials, containers and packaging, and metals and mining in the SOI.
4. The information technology sector comprises communications equipment; computers and peripherals; electronic equipment, instruments and components; semiconductors and semiconductor equipment; and software in the SOI.
5. Not an index component.
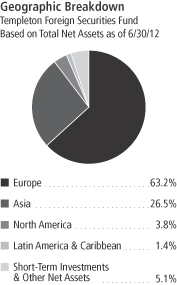
TF-3
Business management software developer SAP (Germany) was another key sector holding. Other individual contributors included reinsurer Swiss Re, oil services company Aker Solutions (Norway) and automobile manufacturer Toyota Motor (Japan).
In contrast, our underweighting and stock selection in the consumer staples sector was a key detractor from Fund performance, and supermarket chain Tesco (U.K.) led the Fund’s sector losses due to slowing sales growth and falling margins.6 The Fund’s overweighting in telecommunication services7 also weighed on relative results, including our positions in telecommunication and Internet services providers China Telecom5 and Telefonica5 (Spain). Our stock selection in health care hurt performance, notably our position in Lonza Group (Switzerland).8 The chemicals and biotechnology company underperformed as profits were squeezed by rising raw materials prices and a strong Swiss franc. Other individual detractors included European financial services providers UniCredit (Spain) and Credit Suisse Group (Switzerland).
From a geographic perspective, our stock selection in Asia boosted the Fund’s relative performance, as a number of our investments in Singapore, South Korea5 and Japan outperformed. Our China exposure, however, was detrimental.5 In Europe, our stock selection detracted from results, as investor concerns about the eurozone debt crisis weighed on market sentiment. During the period, our investments in the U.K., France and the Netherlands hindered relative performance, while an underweighting in the troubled Spanish market benefited results.
Thank you for your participation in Templeton Foreign Securities Fund. We look forward to serving your future investment needs.
6. The consumer staples sector comprises food and staples retailing in the SOI.
7. The telecommunication services sector comprises diversified telecommunication services and wireless telecommunication services in the SOI.
8. The health care sector comprises life sciences tools and services and pharmaceuticals in the SOI.
The foregoing information reflects our analysis, opinions and portfolio holdings as of June 30, 2012, the end of the reporting period. The way we implement our main investment strategies and the resulting portfolio holdings may change depending on factors such as market and economic conditions. These opinions may not be relied upon as investment advice or an offer for a particular security. The information is not a complete analysis of every aspect of any market, country, industry, security or the Fund. Statements of fact are from sources considered reliable, but the investment manager makes no representation or warranty as to their completeness or accuracy. Although historical performance is no guarantee of future results, these insights may help you understand our investment management philosophy.
Top 10 Holdings
Templeton Foreign Securities Fund
6/30/12
| Company Sector/Industry, Country | % of Total Net Assets | |||
| Sanofi | 3.7% | |||
| Pharmaceuticals, France | ||||
| Roche Holding AG | 3.5% | |||
| Pharmaceuticals, Switzerland | ||||
| Samsung Electronics Co. Ltd. | 3.3% | |||
| Semiconductors & Semiconductor Equipment, South Korea | ||||
| GlaxoSmithKline PLC | 2.7% | |||
| Pharmaceuticals, U.K. | ||||
| Swiss Re AG | 2.5% | |||
| Insurance, Switzerland | ||||
| Vodafone Group PLC, ADR | 2.3% | |||
| Wireless Telecommunication Services, U.K. | ||||
| Statoil ASA | 2.1% | |||
| Oil, Gas & Consumable Fuels, Norway | ||||
| Tesco PLC | 2.1% | |||
| Food & Staples Retailing, U.K. | ||||
| Telenor ASA | 2.1% | |||
| Diversified Telecommunication Services, Norway | ||||
| Royal Dutch Shell PLC, A & B | 2.0% | |||
| Oil, Gas & Consumable Fuels, U.K. | ||||
The dollar value, number of shares or principal amount, and names of all portfolio holdings are listed in the Fund’s Statement of Investments (SOI).
TF-4
Fund Expenses
As an investor in a variable insurance contract (Contract) that indirectly provides for investment in an underlying mutual fund, you can incur transaction and/or ongoing expenses at both the Fund level and the Contract level.
| • | Transaction expenses can include sales charges (loads) on purchases, surrender fees, transfer fees and premium taxes. |
| • | Ongoing expenses can include management fees, distribution and service (12b-1) fees, contract fees, annual maintenance fees, mortality and expense risk fees and other fees and expenses. All mutual funds and Contracts have some types of ongoing expenses. |
The expenses shown in the table are meant to highlight ongoing expenses at the Fund level only and do not include ongoing expenses at the Contract level, or transaction expenses at either the Fund or Contract levels. While the Fund does not have transaction expenses, if the transaction and ongoing expenses at the Contract level were included, the expenses shown below would be higher. You should consult your Contract prospectus or disclosure document for more information.
The table shows Fund-level ongoing expenses and can help you understand these expenses and compare them with those of other mutual funds offered through the Contract. The table assumes a $1,000 investment held for the six months indicated. Please refer to the Fund prospectus for additional information on operating expenses.
Actual Fund Expenses
The first line (Actual) of the table provides actual account values and expenses. The “Ending Account Value” is derived from the Fund’s actual return, which includes the effect of ongoing Fund expenses, but does not include the effect of ongoing Contract expenses.
You can estimate the Fund-level expenses you incurred during the period by following these steps. Of course, your account value and expenses will differ from those in this illustration:
| 1. | Divide your account value by $1,000. |
If an account had an $8,600 value, then $8,600 ÷ $1,000 = 8.6.
| 2. | Multiply the result by the number under the heading “Fund-Level Expenses Incurred During Period.” |
If Fund-Level Expenses Incurred During Period were $7.50, then 8.6 x $7.50 = $64.50.
In this illustration, the estimated expenses incurred this period at the Fund level are $64.50.
Templeton Foreign Securities Fund – Class 4
TF-5
Hypothetical Example for Comparison with Other Mutual Funds
Information in the second line (Hypothetical) of the table can help you compare ongoing expenses of the Fund with those of other mutual funds offered through the Contract. This information may not be used to estimate the actual ending account balance or expenses you incurred during the period. The hypothetical “Ending Account Value” is based on the Fund’s actual expense ratio and an assumed 5% annual rate of return before expenses, which does not represent the Fund’s actual return. The figure under the heading “Fund-Level Expenses Incurred During Period” shows the hypothetical expenses your account would have incurred under this scenario. You can compare this figure with the 5% hypothetical examples that appear in shareholder reports of other funds offered through a Contract.
| Class 4 | Beginning Account Value 1/1/12 | Ending Account Value 6/30/12 | Fund-Level Expenses Incurred During Period* 1/1/12–6/30/12 | |||||||||
Actual | $ | 1,000 | $ | 1,012.50 | $ | 5.75 | ||||||
Hypothetical (5% return before expenses) | $ | 1,000 | $ | 1,019.14 | $ | 5.77 | ||||||
*Expenses are calculated using the most recent six-month annualized expense ratio for the Fund’s Class 4 shares (1.15%), which does not include any ongoing expenses of the Contract for which the Fund is an investment option, multiplied by the average account value over the period, multiplied by 182/366 to reflect the one-half year period.
TF-6
Franklin Templeton Variable Insurance Products Trust
Financial Highlights
Templeton Foreign Securities Fund
| Six Months Ended June 30, 2012 (unaudited) | Year Ended December 31, | |||||||||||||||||||||||
| Class 1 | 2011 | 2010 | 2009 | 2008 | 2007 | |||||||||||||||||||
| ||||||||||||||||||||||||
Per share operating performance | ||||||||||||||||||||||||
(for a share outstanding throughout the period) | ||||||||||||||||||||||||
Net asset value, beginning of period | $ | 12.78 | $ | 14.54 | $ | 13.68 | $ | 10.95 | $ | 20.57 | $ | 19.00 | ||||||||||||
|
| |||||||||||||||||||||||
Income from investment operationsa: | ||||||||||||||||||||||||
Net investment incomeb | 0.29 | 0.42 | 0.28 | 0.25 | 0.45 | 0.45 | ||||||||||||||||||
Net realized and unrealized gains (losses) | (0.11 | ) | (1.90 | ) | 0.86 | 3.39 | (8.01 | ) | 2.46 | |||||||||||||||
|
| |||||||||||||||||||||||
Total from investment operations | 0.18 | (1.48 | ) | 1.14 | 3.64 | (7.56 | ) | 2.91 | ||||||||||||||||
|
| |||||||||||||||||||||||
Less distributions from: | ||||||||||||||||||||||||
Net investment income | (0.44 | ) | (0.28 | ) | (0.28 | ) | (0.43 | ) | (0.45 | ) | (0.44 | ) | ||||||||||||
Net realized gains | — | — | — | (0.48 | ) | (1.61 | ) | (0.90 | ) | |||||||||||||||
|
| |||||||||||||||||||||||
Total distributions | (0.44 | ) | (0.28 | ) | (0.28 | ) | (0.91 | ) | (2.06 | ) | (1.34 | ) | ||||||||||||
|
| |||||||||||||||||||||||
Redemption feesc | — | — | — | — | — | — | ||||||||||||||||||
|
| |||||||||||||||||||||||
Net asset value, end of period | $ | 12.52 | $ | 12.78 | $ | 14.54 | $ | 13.68 | $ | 10.95 | $ | 20.57 | ||||||||||||
|
| |||||||||||||||||||||||
Total returnd | 1.49% | (10.44)% | 8.67% | 37.34% | (40.23)% | 15.79% | ||||||||||||||||||
Ratios to average net assetse | ||||||||||||||||||||||||
Expenses | 0.80% | 0.79% | f | 0.78% | f | 0.78% | f | 0.77% | f | 0.75% | f | |||||||||||||
Net investment income | 4.36% | 2.92% | 2.10% | 2.28% | 2.82% | 2.22% | ||||||||||||||||||
Supplemental data | ||||||||||||||||||||||||
Net assets, end of period (000’s) | $ | 243,233 | $ | 254,292 | $ | 321,282 | $ | 318,173 | $ | 262,725 | $ | 531,377 | ||||||||||||
Portfolio turnover rate | 4.08% | 21.09% | 19.16% | 22.50% | 18.27% | 26.74% | ||||||||||||||||||
aThe amount shown for a share outstanding throughout the period may not correlate with the Statement of Operations for the period due to the timing of sales and repurchases of the Fund shares in relation to income earned and/or fluctuating market value of the investments of the Fund.
bBased on average daily shares outstanding.
cAmount rounds to less than $0.01 per share.
dTotal return does not include fees, charges or expenses imposed by the variable annuity and life insurance contracts for which the Franklin Templeton Variable Insurance Products Trust serves as an underlying investment vehicle. Total return is not annualized for periods less than one year.
eRatios are annualized for periods less than one year.
fBenefit of expense reduction rounds to less than 0.01%.
The accompanying notes are an integral part of these financial statements.
TF-7
Franklin Templeton Variable Insurance Products Trust
Financial Highlights (continued)
Templeton Foreign Securities Fund
Six Months (unaudited) | Year Ended December 31, | |||||||||||||||||||||||
| Class 2 | 2011 | 2010 | 2009 | 2008 | 2007 | |||||||||||||||||||
| ||||||||||||||||||||||||
Per share operating performance | ||||||||||||||||||||||||
(for a share outstanding throughout the period) | ||||||||||||||||||||||||
Net asset value, beginning of period | $ | 12.56 | $ | 14.29 | $ | 13.45 | $ | 10.76 | $ | 20.25 | $ | 18.73 | ||||||||||||
|
| |||||||||||||||||||||||
Income from investment operationsa: | ||||||||||||||||||||||||
Net investment incomeb | 0.27 | 0.37 | 0.25 | 0.22 | 0.40 | 0.38 | ||||||||||||||||||
Net realized and unrealized gains (losses) | (0.11 | ) | (1.86 | ) | 0.84 | 3.34 | (7.89 | ) | 2.44 | |||||||||||||||
|
| |||||||||||||||||||||||
Total from investment operations | 0.16 | (1.49 | ) | 1.09 | 3.56 | (7.49 | ) | 2.82 | ||||||||||||||||
|
| |||||||||||||||||||||||
Less distributions from: | ||||||||||||||||||||||||
Net investment income | (0.40 | ) | (0.24 | ) | (0.25 | ) | (0.39 | ) | (0.39 | ) | (0.40 | ) | ||||||||||||
Net realized gains | — | — | — | (0.48 | ) | (1.61 | ) | (0.90 | ) | |||||||||||||||
|
| |||||||||||||||||||||||
Total distributions | (0.40 | ) | (0.24 | ) | (0.25 | ) | (0.87 | ) | (2.00 | ) | (1.30 | ) | ||||||||||||
|
| |||||||||||||||||||||||
Redemption feesc | — | — | — | — | — | — | ||||||||||||||||||
|
| |||||||||||||||||||||||
Net asset value, end of period | $ | 12.32 | $ | 12.56 | $ | 14.29 | $ | 13.45 | $ | 10.76 | $ | 20.25 | ||||||||||||
|
| |||||||||||||||||||||||
Total returnd | 1.37% | (10.63)% | 8.41% | 37.04% | (40.38)% | 15.46% | ||||||||||||||||||
Ratios to average net assetse | ||||||||||||||||||||||||
Expenses | 1.05% | 1.04% | f | 1.03% | f | 1.03% | f | 1.02% | f | 1.00% | f | |||||||||||||
Net investment income | 4.11% | 2.67% | 1.85% | 2.03% | 2.57% | 1.97% | ||||||||||||||||||
Supplemental data | ||||||||||||||||||||||||
Net assets, end of period (000’s) | $ | 1,616,384 | $ | 1,679,412 | $ | 2,090,757 | $ | 2,010,268 | $ | 1,702,038 | $ | 3,255,154 | ||||||||||||
Portfolio turnover rate | 4.08% | 21.09% | 19.16% | 22.50% | 18.27% | 26.74% | ||||||||||||||||||
aThe amount shown for a share outstanding throughout the period may not correlate with the Statement of Operations for the period due to the timing of sales and repurchases of the Fund shares in relation to income earned and/or fluctuating market value of the investments of the Fund.
bBased on average daily shares outstanding.
cAmount rounds to less than $0.01 per share.
dTotal return does not include fees, charges or expenses imposed by the variable annuity and life insurance contracts for which the Franklin Templeton Variable Insurance Products Trust serves as an underlying investment vehicle. Total return is not annualized for periods less than one year.
eRatios are annualized for periods less than one year.
fBenefit of expense reduction rounds to less than 0.01%.
The accompanying notes are an integral part of these financial statements.
TF-8
Franklin Templeton Variable Insurance Products Trust
Financial Highlights (continued)
Templeton Foreign Securities Fund
| Six Months Ended June 30, 2012 (unaudited) | Year Ended December 31, | |||||||||||||||||||||||
| Class 3 | 2011 | 2010 | 2009 | 2008 | 2007 | |||||||||||||||||||
| ||||||||||||||||||||||||
Per share operating performance | ||||||||||||||||||||||||
(for a share outstanding throughout the period) | ||||||||||||||||||||||||
Net asset value, beginning of period | $ | 12.51 | $ | 14.24 | $ | 13.37 | $ | 10.70 | $ | 20.18 | $ | 18.68 | ||||||||||||
|
| |||||||||||||||||||||||
Income from investment operationsa: | ||||||||||||||||||||||||
Net investment incomeb | 0.27 | 0.37 | 0.25 | 0.25 | 0.39 | 0.37 | ||||||||||||||||||
Net realized and unrealized gains (losses) | (0.11 | ) | (1.86 | ) | 0.84 | 3.30 | (7.84 | ) | 2.45 | |||||||||||||||
|
| |||||||||||||||||||||||
Total from investment operations | 0.16 | (1.49 | ) | 1.09 | 3.55 | (7.45 | ) | 2.82 | ||||||||||||||||
|
| |||||||||||||||||||||||
Less distributions from: | ||||||||||||||||||||||||
Net investment income | (0.40 | ) | (0.24 | ) | (0.22 | ) | (0.40 | ) | (0.42 | ) | (0.42 | ) | ||||||||||||
Net realized gains | — | — | — | (0.48 | ) | (1.61 | ) | (0.90 | ) | |||||||||||||||
|
| |||||||||||||||||||||||
Total distributions | (0.40 | ) | (0.24 | ) | (0.22 | ) | (0.88 | ) | (2.03 | ) | (1.32 | ) | ||||||||||||
|
| |||||||||||||||||||||||
Redemption feesc | — | — | — | — | — | — | ||||||||||||||||||
|
| |||||||||||||||||||||||
Net asset value, end of period | $ | 12.27 | $ | 12.51 | $ | 14.24 | $ | 13.37 | $ | 10.70 | $ | 20.18 | ||||||||||||
|
| |||||||||||||||||||||||
Total returnd | 1.37% | (10.68)% | 8.41% | 37.20% | (40.39)% | 15.45% | ||||||||||||||||||
Ratios to average net assetse | ||||||||||||||||||||||||
Expenses | 1.05% | 1.04% | f | 1.03% | f | 1.03% | f | 1.02% | f | 1.00% | f | |||||||||||||
Net investment income | 4.11% | 2.67% | 1.85% | 2.03% | 2.57% | 1.97% | ||||||||||||||||||
Supplemental data | ||||||||||||||||||||||||
Net assets, end of period (000’s) | $ | 83,644 | $ | 88,380 | $ | 108,766 | $ | 115,364 | $ | 271,061 | $ | 313,505 | ||||||||||||
Portfolio turnover rate | 4.08% | 21.09% | 19.16% | 22.50% | 18.27% | 26.74% | ||||||||||||||||||
aThe amount shown for a share outstanding throughout the period may not correlate with the Statement of Operations for the period due to the timing of sales and repurchases of the Fund shares in relation to income earned and/or fluctuating market value of the investments of the Fund.
bBased on average daily shares outstanding.
cAmount rounds to less than $0.01 per share.
dTotal return does not include fees, charges or expenses imposed by the variable annuity and life insurance contracts for which the Franklin Templeton Variable Insurance Products Trust serves as an underlying investment vehicle. Total return is not annualized for periods less than one year.
eRatios are annualized for periods less than one year.
fBenefit of expense reduction rounds to less than 0.01%.
The accompanying notes are an integral part of these financial statements.
TF-9
Franklin Templeton Variable Insurance Products Trust
Financial Highlights (continued)
Templeton Foreign Securities Fund
| Six Months Ended June 30, 2012 (unaudited) | Year Ended December 31, | |||||||||||||||||||
| Class 4 | 2011 | 2010 | 2009 | 2008a | ||||||||||||||||
| ||||||||||||||||||||
Per share operating performance | ||||||||||||||||||||
(for a share outstanding throughout the period) | ||||||||||||||||||||
Net asset value, beginning of period | $ | 12.66 | $ | 14.43 | $ | 13.59 | $ | 10.91 | $ | 18.90 | ||||||||||
|
| |||||||||||||||||||
Income from investment operationsb: | ||||||||||||||||||||
Net investment incomec | 0.27 | 0.36 | 0.17 | 0.21 | 0.15 | |||||||||||||||
Net realized and unrealized gains (losses) | (0.12 | ) | (1.88 | ) | 0.92 | 3.37 | (6.08 | ) | ||||||||||||
|
| |||||||||||||||||||
Total from investment operations | 0.15 | (1.52 | ) | 1.09 | 3.58 | (5.93 | ) | |||||||||||||
|
| |||||||||||||||||||
Less distributions from: | ||||||||||||||||||||
Net investment income | (0.40 | ) | (0.25 | ) | �� | (0.25 | ) | (0.42 | ) | (0.45 | ) | |||||||||
Net realized gains | — | — | — | (0.48 | ) | (1.61 | ) | |||||||||||||
|
| |||||||||||||||||||
Total distributions | (0.40 | ) | (0.25 | ) | (0.25 | ) | (0.90 | ) | (2.06 | ) | ||||||||||
|
| |||||||||||||||||||
Redemption feesd | — | — | — | — | — | |||||||||||||||
|
| |||||||||||||||||||
Net asset value, end of period | $ | 12.41 | $ | 12.66 | $ | 14.43 | $ | 13.59 | $ | 10.91 | ||||||||||
|
| |||||||||||||||||||
Total returne | 1.25% | (10.74)% | 8.38% | 36.84% | (35.15)% | |||||||||||||||
Ratios to average net assetsf | ||||||||||||||||||||
Expenses | 1.15% | 1.14% | g | 1.13% | g | 1.13% | g | 1.12% | g | |||||||||||
Net investment income | 4.01% | 2.57% | 1.75% | 1.93% | 2.47% | |||||||||||||||
Supplemental data | ||||||||||||||||||||
Net assets, end of period (000’s) | $ | 369,919 | $ | 353,346 | $ | 305,505 | $ | 48,501 | $ | 14,287 | ||||||||||
Portfolio turnover rate | 4.08% | 21.09% | 19.16% | 22.50% | 18.27% | |||||||||||||||
aFor the period February 29, 2008 (effective date) to December 31, 2008.
bThe amount shown for a share outstanding throughout the period may not correlate with the Statement of Operations for the period due to the timing of sales and repurchases of the Fund shares in relation to income earned and/or fluctuating market value of the investments of the Fund.
cBased on average daily shares outstanding.
dAmount rounds to less than $0.01 per share.
eTotal return does not include fees, charges or expenses imposed by the variable annuity and life insurance contracts for which the Franklin Templeton Variable Insurance Products Trust serves as an underlying investment vehicle. Total return is not annualized for periods less than one year.
fRatios are annualized for periods less than one year.
gBenefit of expense reduction rounds to less than 0.01%.
The accompanying notes are an integral part of these financial statements.
TF-10
Franklin Templeton Variable Insurance Products Trust
Statement of Investments, June 30, 2012 (unaudited)
| Templeton Foreign Securities Fund | Country | Shares/ Units | Value | |||||||
Common Stocks and Other Equity Interests 93.5% | ||||||||||
Aerospace & Defense 1.0% | ||||||||||
BAE Systems PLC | United Kingdom | 5,263,730 | $ | 23,804,819 | ||||||
|
| |||||||||
Airlines 0.6% | ||||||||||
Deutsche Lufthansa AG | Germany | 1,161,930 | 13,401,018 | |||||||
|
| |||||||||
Automobiles 1.8% | ||||||||||
aMazda Motor Corp. | Japan | 5,453,000 | 7,294,299 | |||||||
Toyota Motor Corp., ADR | Japan | 440,460 | 35,448,221 | |||||||
|
| |||||||||
| 42,742,520 | ||||||||||
|
| |||||||||
Capital Markets 4.4% | ||||||||||
Credit Suisse Group AG | Switzerland | 1,969,870 | 35,827,140 | |||||||
KKR & Co., LP | United States | 1,155,000 | 14,887,950 | |||||||
Nomura Holdings Inc. | Japan | 5,636,100 | 20,715,257 | |||||||
UBS AG | Switzerland | 2,504,440 | 29,161,288 | |||||||
|
| |||||||||
| 100,591,635 | ||||||||||
|
| |||||||||
Chemicals 1.1% | ||||||||||
Akzo Nobel NV | Netherlands | 527,560 | 24,730,864 | |||||||
|
| |||||||||
Commercial Banks 8.3% | ||||||||||
BNP Paribas SA | France | 896,310 | 34,411,110 | |||||||
DBS Group Holdings Ltd. | Singapore | 2,993,520 | 32,770,420 | |||||||
HSBC Holdings PLC | United Kingdom | 4,015,600 | 35,481,546 | |||||||
KB Financial Group Inc., ADR | South Korea | 1,319,301 | 43,127,950 | |||||||
aUniCredit SpA | Italy | 8,365,386 | 31,549,951 | |||||||
United Overseas Bank Ltd. | Singapore | 985,000 | 14,506,788 | |||||||
|
| |||||||||
| 191,847,765 | ||||||||||
|
| |||||||||
Commercial Services & Supplies 1.0% | ||||||||||
G4S PLC | United Kingdom | 5,045,810 | 22,056,409 | |||||||
|
| |||||||||
Communications Equipment 0.7% | ||||||||||
Ericsson, B, ADR | Sweden | 1,675,840 | 15,300,419 | |||||||
|
| |||||||||
Computers & Peripherals 1.1% | ||||||||||
Compal Electronics Inc. | Taiwan | 28,536,431 | 26,195,589 | |||||||
|
| |||||||||
Construction & Engineering 0.7% | ||||||||||
Carillion PLC | United Kingdom | 3,750,730 | 16,227,835 | |||||||
|
| |||||||||
Construction Materials 0.5% | ||||||||||
CRH PLC | Ireland | 659,820 | 12,617,880 | |||||||
|
| |||||||||
Containers & Packaging 0.9% | ||||||||||
Rexam PLC | United Kingdom | 3,021,290 | 19,919,015 | |||||||
|
| |||||||||
Diversified Financial Services 1.7% | ||||||||||
aING Groep NV | Netherlands | 5,880,644 | 39,192,430 | |||||||
|
| |||||||||
Diversified Telecommunication Services 8.2% | ||||||||||
China Telecom Corp. Ltd., H | China | 47,482,357 | 20,503,203 | |||||||
France Telecom SA | France | 2,164,143 | 28,416,495 | |||||||
Singapore Telecommunications Ltd. | Singapore | 14,436,000 | 37,599,684 | |||||||
Telefonica SA, ADR | Spain | 1,813,382 | 23,755,304 | |||||||
bTelekom Austria AG | Austria | 1,468,891 | 14,424,201 | |||||||
bTelenor ASA | Norway | 2,880,414 | 47,852,070 | |||||||
bVivendi SA | France | 928,427 | 17,190,501 | |||||||
|
| |||||||||
| 189,741,458 | ||||||||||
|
| |||||||||
TF-11
Franklin Templeton Variable Insurance Products Trust
Statement of Investments, June 30, 2012 (unaudited) (continued)
| Templeton Foreign Securities Fund | Country | Shares/ Units | Value | |||||||
Common Stocks and Other Equity Interests (continued) | ||||||||||
Electrical Equipment 0.4% | ||||||||||
Shanghai Electric Group Co. Ltd. | China | 23,792,000 | $ | 9,660,200 | ||||||
|
| |||||||||
Electronic Equipment, Instruments & Components 1.3% | ||||||||||
aFlextronics International Ltd. | Singapore | 4,961,670 | 30,762,354 | |||||||
|
| |||||||||
Energy Equipment & Services 1.0% | ||||||||||
Aker Solutions ASA | Norway | 1,617,940 | 22,802,050 | |||||||
|
| |||||||||
Food & Staples Retailing 2.1% | ||||||||||
Tesco PLC | United Kingdom | 10,082,690 | 48,974,820 | |||||||
|
| |||||||||
Industrial Conglomerates 3.2% | ||||||||||
Hutchison Whampoa Ltd. | Hong Kong | 2,500,239 | 21,431,264 | |||||||
Koninklijke Philips Electronics NV | Netherlands | 1,473,320 | 29,032,347 | |||||||
Siemens AG | Germany | 285,414 | 23,891,087 | |||||||
|
| |||||||||
| 74,354,698 | ||||||||||
|
| |||||||||
Insurance 11.6% | ||||||||||
ACE Ltd. | United States | 377,449 | 27,980,294 | |||||||
AIA Group Ltd. | Hong Kong | 9,767,000 | 33,361,970 | |||||||
Aviva PLC | United Kingdom | 9,269,960 | 39,598,896 | |||||||
AXA SA | France | 2,547,968 | 33,794,941 | |||||||
Muenchener Rueckversicherungs-Gesellschaft AG | Germany | 249,150 | 35,048,288 | |||||||
NKSJ Holdings Inc. | Japan | 1,237,900 | 26,061,053 | |||||||
PartnerRe Ltd. | Bermuda | 196,480 | 14,867,642 | |||||||
Swiss Re AG | Switzerland | 917,340 | 57,563,327 | |||||||
|
| |||||||||
| 268,276,411 | ||||||||||
|
| |||||||||
Life Sciences Tools & Services 0.3% | ||||||||||
Lonza Group AG | Switzerland | 175,440 | 7,280,113 | |||||||
|
| |||||||||
Media 1.0% | ||||||||||
Reed Elsevier NV | Netherlands | 2,017,693 | 23,012,973 | |||||||
|
| |||||||||
Metals & Mining 1.0% | ||||||||||
POSCO | South Korea | 73,420 | 23,383,600 | |||||||
|
| |||||||||
Multi-Utilities 1.6% | ||||||||||
E.ON AG | Germany | 917,590 | 19,742,132 | |||||||
GDF Suez | France | 697,431 | 16,554,450 | |||||||
|
| |||||||||
| 36,296,582 | ||||||||||
|
| |||||||||
Multiline Retail 0.5% | ||||||||||
Marks & Spencer Group PLC | United Kingdom | 2,350,320 | 11,967,683 | |||||||
|
| |||||||||
Oil, Gas & Consumable Fuels 10.2% | ||||||||||
BP PLC | United Kingdom | 4,406,715 | 29,130,634 | |||||||
Gazprom, ADR | Russia | 2,623,000 | 24,918,500 | |||||||
Reliance Industries Ltd. | India | 998,145 | 13,260,350 | |||||||
Royal Dutch Shell PLC, A | United Kingdom | 16,803 | 565,419 | |||||||
Royal Dutch Shell PLC, B | United Kingdom | 1,292,973 | 45,078,347 | |||||||
Statoil ASA | Norway | 2,077,160 | 49,336,563 | |||||||
Suncor Energy Inc. | Canada | 413,300 | 11,951,822 | |||||||
Talisman Energy Inc. | Canada | 1,506,600 | 17,270,293 | |||||||
Total SA, B | France | 979,926 | 44,026,897 | |||||||
|
| |||||||||
| 235,538,825 | ||||||||||
|
| |||||||||
TF-12
Franklin Templeton Variable Insurance Products Trust
Statement of Investments, June 30, 2012 (unaudited) (continued)
| Templeton Foreign Securities Fund | Country | Shares/ Units | Value | |||||||
Common Stocks and Other Equity Interests (continued) | ||||||||||
Pharmaceuticals 11.6% | ||||||||||
GlaxoSmithKline PLC | United Kingdom | 2,772,585 | $ | 62,867,783 | ||||||
Merck KGaA | Germany | 287,310 | 28,624,129 | |||||||
Novartis AG | Switzerland | 210,500 | 11,733,878 | |||||||
Roche Holding AG | Switzerland | 468,100 | 80,696,691 | |||||||
Sanofi | France | 1,127,925 | 85,278,958 | |||||||
|
| |||||||||
| 269,201,439 | ||||||||||
|
| |||||||||
Professional Services 1.2% | ||||||||||
Hays PLC | United Kingdom | 11,353,070 | 13,095,990 | |||||||
Randstad Holding NV | Netherlands | 477,910 | 14,017,234 | |||||||
|
| |||||||||
| 27,113,224 | ||||||||||
|
| |||||||||
Real Estate Management & Development 0.0%† | ||||||||||
Cheung Kong (Holdings) Ltd. | Hong Kong | 922 | 11,255 | |||||||
|
| |||||||||
Semiconductors & Semiconductor Equipment 5.8% | ||||||||||
Infineon Technologies AG | Germany | 1,103,225 | 7,444,760 | |||||||
Samsung Electronics Co. Ltd. | South Korea | 72,608 | 76,404,696 | |||||||
Siliconware Precision Industries Co. | Taiwan | 14,515,000 | 15,199,973 | |||||||
Taiwan Semiconductor Manufacturing Co. Ltd. | Taiwan | 12,519,526 | 34,162,498 | |||||||
|
| |||||||||
| 133,211,927 | ||||||||||
|
| |||||||||
Software 1.9% | ||||||||||
Nintendo Co. Ltd. | Japan | 166,400 | 19,242,405 | |||||||
Trend Micro Inc. | Japan | 868,100 | 25,384,247 | |||||||
|
| |||||||||
| 44,626,652 | ||||||||||
|
| |||||||||
Specialty Retail 1.8% | ||||||||||
Kingfisher PLC | United Kingdom | 9,366,486 | 42,183,122 | |||||||
|
| |||||||||
Trading Companies & Distributors 0.9% | ||||||||||
Itochu Corp. | Japan | 2,102,500 | 21,868,734 | |||||||
|
| |||||||||
Wireless Telecommunication Services 4.1% | ||||||||||
China Mobile Ltd. | China | 2,340,000 | 25,592,477 | |||||||
Mobile TeleSystems, ADR | Russia | 914,865 | 15,735,678 | |||||||
Vodafone Group PLC, ADR | United Kingdom | 1,875,870 | 52,862,017 | |||||||
|
| |||||||||
| 94,190,172 | ||||||||||
|
| |||||||||
Total Common Stocks and Other Equity Interests (Cost $2,358,759,860) | 2,163,086,490 | |||||||||
|
| |||||||||
Preferred Stocks 1.4% | ||||||||||
Metals & Mining 1.0% | ||||||||||
Vale SA, ADR, pfd., A | Brazil | 1,210,222 | 23,611,431 | |||||||
|
| |||||||||
Oil, Gas & Consumable Fuels 0.4% | ||||||||||
Petroleo Brasileiro SA, ADR, pfd. | Brazil | 517,880 | 9,394,343 | |||||||
|
| |||||||||
Total Preferred Stocks (Cost $13,315,243) | 33,005,774 | |||||||||
|
| |||||||||
Total Investments before Short Term Investments (Cost $2,372,075,103) | 2,196,092,264 | |||||||||
|
| |||||||||
TF-13
Franklin Templeton Variable Insurance Products Trust
Statement of Investments, June 30, 2012 (unaudited) (continued)
| Templeton Foreign Securities Fund | Country | Shares/ Units | Value | |||||||
Short Term Investments 4.9% | ||||||||||
Money Market Funds (Cost $113,158,391) 4.9% | ||||||||||
a,cInstitutional Fiduciary Trust Money Market Portfolio | United States | 113,158,391 | $ | 113,158,391 | ||||||
|
| |||||||||
dInvestments from Cash Collateral Received for Loaned Securities (Cost $413,412) 0.0%† | ||||||||||
Money Market Funds 0.0%† | ||||||||||
eBNY Mellon Overnight Government Fund, 0.182% | United States | 413,412 | 413,412 | |||||||
|
| |||||||||
Total Investments (Cost $2,485,646,906) 99.8% | 2,309,664,067 | |||||||||
Other Assets, less Liabilities 0.2% | 3,516,460 | |||||||||
|
| |||||||||
Net Assets 100.0% | $ | 2,313,180,527 | ||||||||
|
| |||||||||
See Abbreviations on page TF-25.
†Rounds to less than 0.1% of net assets.
aNon-income producing.
bA portion or all of the security is on loan at June 30, 2012. See Note 1(c).
cSee Note 7 regarding investments in the Institutional Fiduciary Trust Money Market Portfolio.
dSee Note 1(c) regarding securities on loan.
eThe rate shown is the annualized seven-day yield at period end.
The accompanying notes are an integral part of these financial statements.
TF-14
Franklin Templeton Variable Insurance Products Trust
Financial Statements
Statements of Assets and Liabilities
June 30, 2012 (unaudited)
| Templeton Foreign Securities Fund | ||||
Assets: | ||||
Investments in securities: | ||||
Cost - Unaffiliated issuers | $ | 2,372,488,515 | ||
Cost - Sweep Money Fund (Note 7) | 113,158,391 | |||
|
| |||
Total cost of investments | $ | 2,485,646,906 | ||
|
| |||
Value - Unaffiliated issuers | $ | 2,196,505,676 | ||
Value - Sweep Money Fund (Note 7) | 113,158,391 | |||
|
| |||
Total value of investments (includes securities loaned in the amount $411,974) | 2,309,664,067 | |||
Receivables: | ||||
Capital shares sold | 902,268 | |||
Dividends and interest | 7,826,746 | |||
Other assets | 604 | |||
|
| |||
Total assets | 2,318,393,685 | |||
|
| |||
Liabilities: | ||||
Payables: | ||||
Capital shares redeemed | 1,662,182 | |||
Affiliates | 2,259,891 | |||
Reports to shareholders | 633,891 | |||
Payable upon return of securities loaned | 413,412 | |||
Accrued expenses and other liabilities | 243,782 | |||
|
| |||
Total liabilities | 5,213,158 | |||
|
| |||
Net assets, at value | $ | 2,313,180,527 | ||
|
| |||
Net assets consist of: | ||||
Paid-in capital | $ | 2,542,478,184 | ||
Undistributed net investment income | 48,939,068 | |||
Net unrealized appreciation (depreciation) | (176,117,336 | ) | ||
Accumulated net realized gain (loss) | (102,119,389 | ) | ||
|
| |||
Net assets, at value | $ | 2,313,180,527 | ||
|
| |||
The accompanying notes are an integral part of these financial statements.
TF-15
Franklin Templeton Variable Insurance Products Trust
Financial Statements (continued)
Statements of Assets and Liabilities (continued)
June 30, 2012 (unaudited)
| Templeton Foreign Securities Fund | ||||
Class 1: | ||||
Net assets, at value | $ | 243,233,377 | ||
|
| |||
Shares outstanding | 19,423,909 | |||
|
| |||
Net asset value and maximum offering price per share | $ | 12.52 | ||
|
| |||
Class 2: | ||||
Net assets, at value | $ | 1,616,384,141 | ||
|
| |||
Shares outstanding | 131,232,143 | |||
|
| |||
Net asset value and maximum offering price per share | $ | 12.32 | ||
|
| |||
Class 3: | ||||
Net assets, at value | $ | 83,643,830 | ||
|
| |||
Shares outstanding | 6,816,197 | |||
|
| |||
Net asset value and maximum offering price per sharea | $ | 12.27 | ||
|
| |||
Class 4: | ||||
Net assets, at value | $ | 369,919,179 | ||
|
| |||
Shares outstanding | 29,796,502 | |||
|
| |||
Net asset value and maximum offering price per share | $ | 12.41 | ||
|
| |||
aRedemption price is equal to net asset value less redemption fees retained by the fund.
The accompanying notes are an integral part of these financial statements.
TF-16
Franklin Templeton Variable Insurance Products Trust
Financial Statements (continued)
Statements of Operations
for the six months ended June 30, 2012 (unaudited)
| Templeton Foreign Securities Fund | ||||
Investment income: | ||||
Dividends (net of foreign taxes of $6,139,020) | $ | 59,651,465 | ||
Income from securities loaned | 2,684,917 | |||
|
| |||
Total investment income | 62,336,382 | |||
|
| |||
Expenses: | ||||
Management fees (Note 3a) | 7,764,148 | |||
Administrative fees (Note 3b) | 1,192,518 | |||
Distribution fees: (Note 3c) | ||||
Class 2 | 2,122,555 | |||
Class 3 | 111,429 | |||
Class 4 | 659,316 | |||
Unaffiliated transfer agent fees | 4,126 | |||
Custodian fees (Note 4) | 267,781 | |||
Reports to shareholders | 346,552 | |||
Professional fees | 68,885 | |||
Trustees’ fees and expenses | 5,009 | |||
Other | 26,941 | |||
|
| |||
Total expenses | 12,569,260 | |||
|
| |||
Net investment income | 49,767,122 | |||
|
| |||
Realized and unrealized gains (losses): | ||||
Net realized gain (loss) from: | ||||
Investments | 28,499,923 | |||
Foreign currency transactions | (769,828 | ) | ||
|
| |||
Net realized gain (loss) | 27,730,095 | |||
|
| |||
Net change in unrealized appreciation (depreciation) on: | ||||
Investments | (39,578,463 | ) | ||
Translation of other assets and liabilities denominated in foreign currencies | (121,547 | ) | ||
|
| |||
Net change in unrealized appreciation (depreciation) | (39,700,010 | ) | ||
|
| |||
Net realized and unrealized gain (loss) | (11,969,915 | ) | ||
|
| |||
Net increase (decrease) in net assets resulting from operations | $ | 37,797,207 | ||
|
| |||
The accompanying notes are an integral part of these financial statements.
TF-17
Franklin Templeton Variable Insurance Products Trust
Financial Statements (continued)
Statements of Changes in Net Assets
| Templeton Foreign Securities Fund | ||||||||
| Six Months Ended June 30, 2012 (unaudited) | Year Ended December 31, 2011 | |||||||
| ||||||||
Increase (decrease) in net assets: | ||||||||
Operations: | ||||||||
Net investment income | $ | 49,767,122 | $ | 72,239,766 | ||||
Net realized gain (loss) from investments and foreign currency transactions | 27,730,095 | 136,998,835 | ||||||
Net change in unrealized appreciation (depreciation) on investments and translation of other assets and liabilities denominated in foreign currencies | (39,700,010 | ) | (482,312,094 | ) | ||||
| ||||||||
Net increase (decrease) in net assets resulting from operations | 37,797,207 | (273,073,493 | ) | |||||
| ||||||||
Distributions to shareholders from: | ||||||||
Net investment income: | ||||||||
Class 1 | (8,240,958 | ) | (5,782,491 | ) | ||||
Class 2 | (51,055,721 | ) | (33,309,204 | ) | ||||
Class 3 | (2,656,996 | ) | (1,749,311 | ) | ||||
Class 4 | (11,448,483 | ) | (5,966,192 | ) | ||||
| ||||||||
Total distributions to shareholders | (73,402,158 | ) | (46,807,198 | ) | ||||
| ||||||||
Capital share transactions: (Note 2) | ||||||||
Class 1 | (7,189,761 | ) | (31,404,883 | ) | ||||
Class 2 | (39,809,077 | ) | (183,781,604 | ) | ||||
Class 3 | (3,469,186 | ) | (8,583,165 | ) | ||||
Class 4 | 23,821,462 | 92,765,363 | ||||||
| ||||||||
Total capital share transactions | (26,646,562 | ) | (131,004,289 | ) | ||||
| ||||||||
Redemption fees | 1,966 | 4,895 | ||||||
| ||||||||
Net increase (decrease) in net assets | (62,249,547 | ) | (450,880,085 | ) | ||||
Net assets: | ||||||||
Beginning of period | 2,375,430,074 | 2,826,310,159 | ||||||
| ||||||||
End of period | $ | 2,313,180,527 | $ | 2,375,430,074 | ||||
| ||||||||
Undistributed net investment income included in net assets: | ||||||||
End of period | $ | 48,939,068 | $ | 72,574,104 | ||||
| ||||||||
The accompanying notes are an integral part of these financial statements.
TF-18
Franklin Templeton Variable Insurance Products Trust
Notes to Financial Statements (unaudited)
Templeton Foreign Securities Fund
1. ORGANIZATION AND SIGNIFICANT ACCOUNTING POLICIES
Franklin Templeton Variable Insurance Products Trust (Trust) is registered under the Investment Company Act of 1940, as amended, (1940 Act) as an open-end investment company, consisting of twenty separate funds. The Templeton Foreign Securities Fund (Fund) is included in this report. The financial statements of the remaining funds in the Trust are presented separately. Shares of the Fund are generally sold only to insurance company separate accounts to fund the benefits of variable life insurance policies or variable annuity contracts. The Fund offers four classes of shares: Class 1, Class 2, Class 3, and Class 4. Each class of shares differs by its distribution fees, voting rights on matters affecting a single class and its exchange privilege.
The following summarizes the Fund’s significant accounting policies.
a. Financial Instrument Valuation
The Fund’s investments in financial instruments are carried at fair value daily. Fair value is the price that would be received to sell an asset or paid to transfer a liability in an orderly transaction between market participants on the measurement date. Under procedures approved by the Trust’s Board of Trustees (the Board), the Fund’s administrator, investment manager and other affiliates have formed the Valuation and Liquidity Oversight Committee (VLOC). The VLOC provides administration and oversight of the Fund’s valuation policies and procedures, which are approved annually by the Board. Among other things, these procedures allow the Fund to utilize independent pricing services, quotations from securities and financial instrument dealers, and other market sources to determine fair value.
Equity securities listed on an exchange or on the NASDAQ National Market System are valued at the last quoted sale price or the official closing price of the day, respectively. Foreign equity securities are valued as of the close of trading on the foreign stock exchange on which the security is primarily traded, or the NYSE, whichever is earlier. The value is then converted into its U.S. dollar equivalent at the foreign exchange rate in effect at the close of the NYSE on the day that the value of the security is determined. Over-the-counter securities are valued within the range of the most recent quoted bid and ask prices. Securities that trade in multiple markets or on multiple exchanges are valued according to the broadest and most representative market. Certain equity securities are valued based upon fundamental characteristics or relationships to similar securities. Investments in open-end mutual funds and non-registered money market funds are valued at the closing net asset value.
The Fund has procedures to determine the fair value of financial instruments for which market prices are not reliable or readily available. Under these procedures, the VLOC convenes on a regular basis to review such financial instruments and considers a number of factors, including significant unobservable valuation inputs, when arriving at fair value. The VLOC primarily employs a market-based approach which may use related or comparable assets or liabilities, recent transactions, market multiples, book values, and other relevant information for the investment to determine the fair value of the investment. An income-based valuation approach may also be used in which the anticipated future cash flows of the investment are discounted to calculate fair value. Discounts may also be applied due to the nature or duration of any restrictions on the disposition of the investments. Due to the inherent uncertainty of valuations of such investments, the fair values may differ significantly from the values that would have been used had an active market existed. The VLOC employs various methods for calibrating these valuation approaches including a regular review of key inputs and assumptions, transactional back-testing or disposition analysis, and reviews of any related market activity.
Trading in securities on foreign securities stock exchanges and over-the-counter markets may be completed before the daily close of business on the NYSE. Occasionally, events occur between the time at which trading in a foreign security is completed and the close of the NYSE that might call into question the reliability of the value of a portfolio security held by the Fund. As a result, differences may arise between the value of the Fund’s portfolio securities as determined at the foreign market close and the latest indications of value at the close of the NYSE. In order to minimize the potential for these differences, the VLOC monitors price movements following the close of trading in foreign stock markets through a series of country specific market proxies (such as baskets of American Depositary Receipts, futures contracts and exchange traded funds). These price movements are measured against established trigger thresholds for each specific market proxy to assist in determining if an event has occurred that may
TF-19
Franklin Templeton Variable Insurance Products Trust
Notes to Financial Statements (unaudited) (continued)
Templeton Foreign Securities Fund
1. ORGANIZATION AND SIGNIFICANT ACCOUNTING POLICIES (continued)
a. Financial Instrument Valuation (continued)
call into question the reliability of the values of the foreign securities held by the Fund. If such an event occurs, the securities may be valued using fair value procedures, which may include the use of independent pricing services.
b. Foreign Currency Translation
Portfolio securities and other assets and liabilities denominated in foreign currencies are translated into U.S. dollars based on the exchange rate of such currencies against U.S. dollars on the date of valuation. The Fund may enter into foreign currency exchange contracts to facilitate transactions denominated in a foreign currency. Purchases and sales of securities, income and expense items denominated in foreign currencies are translated into U.S. dollars at the exchange rate in effect on the transaction date. Portfolio securities and assets and liabilities denominated in foreign currencies contain risks that those currencies will decline in value relative to the U.S. dollar. Occasionally, events may impact the availability or reliability of foreign exchange rates used to convert the U.S. dollar equivalent value. If such an event occurs, the foreign exchange rate will be valued at fair value using procedures established and approved by the Board.
The Fund does not separately report the effect of changes in foreign exchange rates from changes in market prices on securities held. Such changes are included in net realized and unrealized gain or loss from investments on the Statement of Operations.
Realized foreign exchange gains or losses arise from sales of foreign currencies, currency gains or losses realized between the trade and settlement dates on securities transactions and the difference between the recorded amounts of dividends, interest, and foreign withholding taxes and the U.S. dollar equivalent of the amounts actually received or paid. Net unrealized foreign exchange gains and losses arise from changes in foreign exchange rates on foreign denominated assets and liabilities other than investments in securities held at the end of the reporting period.
c. Securities Lending
The Fund participates in an agency based securities lending program. The fund receives cash collateral against the loaned securities in an amount equal to at least 102% of the market value of the loaned securities. Collateral is maintained over the life of the loan in an amount not less than 100% of the market value of loaned securities, as determined at the close of fund business each day; any additional collateral required due to changes in security values is delivered to the fund on the next business day. The collateral is invested in a non-registered money fund as indicated on the Statement of Investments. The fund receives income from the investment of cash collateral, in addition to lending fees and rebates paid by the borrower. The fund bears the market risk with respect to the collateral investment, securities loaned, and the risk that the agent may default on its obligations to the fund. The securities lending agent has agreed to indemnify the fund in the event of default by a third party borrower.
d. Income and Deferred Taxes
It is the Fund’s policy to qualify as a regulated investment company under the Internal Revenue Code. The Fund intends to distribute to shareholders substantially all of its taxable income and net realized gains to relieve it from federal income and if applicable, excise taxes. As a result, no provision for U.S. federal income taxes is required.
The Fund may be subject to foreign taxation related to income received, capital gains on the sale of securities and certain foreign currency transactions in the foreign jurisdictions in which it invests. Foreign taxes, if any, are recorded based on the tax regulations and rates that exist in the foreign markets in which the Fund invests. When a capital gain tax is determined to apply the Fund records an estimated deferred tax liability in an amount that would be payable if the securities were disposed of on the valuation date.
TF-20
Franklin Templeton Variable Insurance Products Trust
Notes to Financial Statements (unaudited) (continued)
Templeton Foreign Securities Fund
1. ORGANIZATION AND SIGNIFICANT ACCOUNTING POLICIES (continued)
d. Income and Deferred Taxes (continued)
The Fund recognizes the tax benefits of uncertain tax positions only when the position is “more likely than not” to be sustained upon examination by the tax authorities based on the technical merits of the tax position. As of June 30, 2012, and for all open tax years, the Fund has determined that no liability for unrecognized tax benefits is required in the Fund’s financial statements related to uncertain tax positions taken on a tax return (or expected to be taken on future tax returns). Open tax years are those that remain subject to examination and are based on each tax jurisdiction statute of limitation.
e. Security Transactions, Investment Income, Expenses and Distributions
Security transactions are accounted for on trade date. Realized gains and losses on security transactions are determined on a specific identification basis. Estimated expenses are accrued daily. Dividend income is recorded on the ex-dividend date except that certain dividends from foreign securities are recognized as soon as the Fund is notified of the ex-dividend date. Distributions to shareholders are recorded on the ex-dividend date and are determined according to income tax regulations (tax basis). Distributable earnings determined on a tax basis may differ from earnings recorded in accordance with accounting principles generally accepted in the United States of America. These differences may be permanent or temporary. Permanent differences are reclassified among capital accounts to reflect their tax character. These reclassifications have no impact on net assets or the results of operations. Temporary differences are not reclassified, as they may reverse in subsequent periods.
Common expenses incurred by the Trust are allocated among the funds based on the ratio of net assets of each fund to the combined net assets of the Trust. Fund specific expenses are charged directly to the fund that incurred the expense.
Realized and unrealized gains and losses and net investment income, not including class specific expenses, are allocated daily to each class of shares based upon the relative proportion of net assets of each class. Differences in per share distributions, by class, are generally due to differences in class specific expenses.
f. Accounting Estimates
The preparation of financial statements in accordance with accounting principles generally accepted in the United States of America requires management to make estimates and assumptions that affect the reported amounts of assets and liabilities at the date of the financial statements and the amounts of income and expenses during the reporting period. Actual results could differ from those estimates.
g. Redemption Fees
Redemptions and exchanges of interests in an insurance company subaccount that invests in Class 3 shares of the Fund will be subject to a 1.0% short term trading fee if the interest in the subaccount has been held for less than 60 days. Such fees are retained by the Fund and accounted for as an addition to paid-in capital, allocated to each class of shares based upon the relative proportion of net assets of each class.
h. Guarantees and Indemnifications
Under the Trust’s organizational documents, its officers and trustees are indemnified by the Trust against certain liabilities arising out of the performance of their duties to the Trust. Additionally, in the normal course of business, the Trust, on behalf of the Fund, enters into contracts with service providers that contain general indemnification clauses. The Trust’s maximum exposure under these arrangements is unknown as this would involve future claims that may be made against the Trust that have not yet occurred. Currently, the Trust expects the risk of loss to be remote.
TF-21
Franklin Templeton Variable Insurance Products Trust
Notes to Financial Statements (unaudited) (continued)
Templeton Foreign Securities Fund
2. SHARES OF BENEFICIAL INTEREST
At June 30, 2012, there were an unlimited number of shares authorized (without par value). Transactions in the Fund’s shares were as follows:
| Six Months Ended June 30, 2012 | Year Ended December 31, 2011 | |||||||||||||||
| Class 1 Shares: | Shares | Amount | Shares | Amount | ||||||||||||
Shares sold | 303,241 | $ | 4,042,623 | 596,966 | $ | 8,620,768 | ||||||||||
Shares issued in reinvestment of distributions | 676,598 | 8,240,958 | 392,832 | 5,782,491 | ||||||||||||
Shares redeemed | (1,450,281 | ) | (19,473,342 | ) | (3,184,900 | ) | (45,808,142 | ) | ||||||||
| ||||||||||||||||
Net increase (decrease) | (470,442 | ) | $ | (7,189,761 | ) | (2,195,102 | ) | $ | (31,404,883 | ) | ||||||
| ||||||||||||||||
Class 2 Shares: | ||||||||||||||||
Shares sold | 6,894,340 | $ | 88,290,696 | 14,900,290 | $ | 201,768,631 | ||||||||||
Shares issued in reinvestment of distributions | 4,261,747 | 51,055,721 | 2,300,359 | 33,309,203 | ||||||||||||
Shares redeemed | (13,674,691 | ) | (179,155,494 | ) | (29,726,460 | ) | (418,859,438 | ) | ||||||||
| ||||||||||||||||
Net increase (decrease) | (2,518,604 | ) | $ | (39,809,077 | ) | (12,525,811 | ) | $ | (183,781,604 | ) | ||||||
| ||||||||||||||||
Class 3 Shares: | ||||||||||||||||
Shares sold | 109,026 | $ | 1,447,697 | 712,054 | $ | 9,594,087 | ||||||||||
Shares issued in reinvestment of distributions | 222,529 | 2,656,996 | 121,227 | 1,749,311 | ||||||||||||
Shares redeemed | (579,605 | ) | (7,573,879 | ) | (1,406,375 | ) | (19,926,563 | ) | ||||||||
| ||||||||||||||||
Net increase (decrease) | (248,050 | ) | $ | (3,469,186 | ) | (573,094 | ) | $ | (8,583,165 | ) | ||||||
| ||||||||||||||||
Class 4 Shares: | ||||||||||||||||
Shares sold | 3,429,020 | $ | 45,349,437 | 10,343,049 | $ | 143,108,311 | ||||||||||
Shares issued on reinvestment of distributions | 947,722 | 11,448,483 | 408,643 | 5,966,192 | ||||||||||||
Shares redeemed | (2,500,031 | ) | (32,976,458 | ) | (4,003,106 | ) | (56,309,140 | ) | ||||||||
| ||||||||||||||||
Net increase (decrease) | 1,876,711 | $ | 23,821,462 | 6,748,586 | $ | 92,765,363 | ||||||||||
| ||||||||||||||||
3. TRANSACTIONS WITH AFFILIATES
Franklin Resources, Inc. is the holding company for various subsidiaries that together are referred to as Franklin Templeton Investments. Certain officers and trustees of the Fund are also officers and/or directors of the following subsidiaries:
| Subsidiary | Affiliation | |
Templeton Investment Counsel, LLC (TIC) | Investment manager | |
Franklin Templeton Services, LLC (FT Services) | Administrative manager | |
Franklin Templeton Distributors, Inc. (Distributors) | Principal underwriter | |
Franklin Templeton Investor Services, LLC (Investor Services) | Transfer agent |
TF-22
Franklin Templeton Variable Insurance Products Trust
Notes to Financial Statements (unaudited) (continued)
Templeton Foreign Securities Fund
3. TRANSACTIONS WITH AFFILIATES (continued)
a. Management Fees
The Fund pays an investment management fee to TIC based on the average daily net assets of the Fund as follows:
| Annualized Fee Rate | Net Assets | |
| 0.750% | Up to and including $200 million | |
| 0.675% | Over $200 million, up to and including $1.3 billion | |
| 0.600% | Over $1.3 billion, up to and including $10 billion | |
| 0.580% | Over $10 billion, up to and including $15 billion | |
| 0.560% | Over $15 billion, up to and including $20 billion | |
| 0.540% | In excess of $20 billion |
b. Administrative Fees
The Fund pays an administrative fee to FT Services based on the Fund’s average daily net assets as follows:
| Annualized Fee Rate | Net Assets | |
| 0.150% | Up to and including $200 million | |
| 0.135% | Over $200 million, up to and including $700 million | |
| 0.100% | Over $700 million, up to and including $1.2 billion | |
| 0.075% | In excess of $1.2 billion |
c. Distribution Fees
The Board has adopted distribution plans for Class 2, Class 3, and Class 4 shares pursuant to Rule 12b-1 under the 1940 Act. Under the Fund’s compensation distribution plans, the Fund pays Distributors for costs incurred in connection with the servicing, sale and distribution of the Fund’s shares up to 0.25%, 0.35%, and 0.35% per year of its average daily net assets of Class 2, Class 3, and Class 4, respectively. The Board has agreed to limit the current rate to 0.25% per year for Class 3.
e. Transfer Agent Fees
Investor Services, under terms of an agreement, performs shareholder servicing for the Fund and is not paid by the Fund for the services.
4. EXPENSE OFFSET ARRANGEMENT
The Fund has entered into an arrangement with its custodian whereby credits realized as a result of uninvested cash balances are used to reduce a portion of the Fund’s custodian expenses. During the period ended June 30, 2012, there were no credits earned.
5. INCOME TAXES
For tax purposes, capital losses may be carried over to offset future capital gains, if any. Capital loss carryforwards with no expiration, if any, must be fully utilized before those losses with expiration dates. At December 31, 2011, the Fund had capital loss carryforwards of $128,971,444 expiring in 2017.
TF-23
Franklin Templeton Variable Insurance Products Trust
Notes to Financial Statements (unaudited) (continued)
Templeton Foreign Securities Fund
5. INCOME TAXES (continued)
At June 30, 2012, the cost of investments and net unrealized appreciation (depreciation) for income tax purposes were as follows:
Cost of investments | $ | 2,486,963,837 | ||
|
| |||
Unrealized appreciation | $ | 318,440,002 | ||
Unrealized depreciation | (495,739,772 | ) | ||
|
| |||
Net unrealized appreciation (depreciation) | $ | (177,299,770 | ) | |
|
| |||
Differences between income and/or capital gains as determined on a book basis and a tax basis are primarily due to differing treatment of pass-through entity income.
6. INVESTMENT TRANSACTIONS
Purchases and sales of investments (excluding short term securities) for the period ended June 30, 2012, aggregated $95,651,820 and $154,294,195, respectively.
7. INVESTMENTS IN INSTITUTIONAL FIDUCIARY TRUST MONEY MARKET PORTFOLIO
The Fund invests in the Institutional Fiduciary Trust Money Market Portfolio (Sweep Money Fund), an open-end investment company managed by Franklin Advisers, Inc. (an affiliate of the investment manager). Management fees paid by the Fund are reduced on assets invested in the Sweep Money Fund, in an amount not to exceed the management and administrative fees paid by the Sweep Money Fund.
8. CONCENTRATION OF RISK
Investing in foreign securities may include certain risks and considerations not typically associated with investing in U.S. securities, such as fluctuating currency values and changing local and regional economic, political and social conditions, which may result in greater market volatility. In addition, certain foreign securities may not be as liquid as U.S. securities.
9. CREDIT FACILITY
The Fund, together with other U.S. registered and foreign investment funds (collectively, Borrowers), managed by Franklin Templeton Investments, are borrowers in a joint syndicated senior unsecured credit facility totaling $1.5 billion (Global Credit Facility) which matures on January 18, 2013. This Global Credit Facility provides a source of funds to the Borrowers for temporary and emergency purposes, including the ability to meet future unanticipated or unusually large redemption requests.
Under the terms of the Global Credit Facility, the Fund shall, in addition to interest charged on any borrowings made by the Fund and other costs incurred by the Fund, pay its share of fees and expenses incurred in connection with the implementation and maintenance of the Global Credit Facility, based upon its relative share of the aggregate net assets of all of the Borrowers, including an annual commitment fee of 0.08% based upon the unused portion of the Global Credit Facility, which is reflected in other expenses on the Statement of Operations. During the period ended June 30, 2012, the Fund did not use the Global Credit Facility.
TF-24
Franklin Templeton Variable Insurance Products Trust
Notes to Financial Statements (unaudited) (continued)
Templeton Foreign Securities Fund
10. FAIR VALUE MEASUREMENTS
The Fund follows a fair value hierarchy that distinguishes between market data obtained from independent sources (observable inputs) and the Fund’s own market assumptions (unobservable inputs). These inputs are used in determining the value of the Fund’s financial instruments and are summarized in the following fair value hierarchy:
| • | Level 1 – quoted prices in active markets for identical financial instruments |
| • | Level 2 – other significant observable inputs (including quoted prices for similar financial instruments, interest rates, prepayment speed, credit risk, etc.) |
| • | Level 3 – significant unobservable inputs (including the Fund’s own assumptions in determining the fair value of financial instruments) |
The inputs or methodology used for valuing financial instruments are not an indication of the risk associated with investing in those financial instruments.
For movements between the levels within the fair value hierarchy, the Fund has adopted a policy of recognizing the transfers as of the date of the underlying event which caused the movement.
A summary of inputs used as of June 30, 2012, in valuing the Fund’s assets carried at fair value, is as follows:
| Level 1 | Level 2 | Level 3 | Total | |||||||||||||
|
| |||||||||||||||
Assets: | ||||||||||||||||
Investments in Securities | ||||||||||||||||
Other Equity Investmentsa,b | $ | 2,196,092,264 | $ | — | $ | — | $ | 2,196,092,264 | ||||||||
Short Term Investments | 113,158,391 | 413,412 | — | 113,571,803 | ||||||||||||
|
| |||||||||||||||
Total Investments in Securities | $ | 2,309,250,655 | $ | 413,412 | $ | — | $ | 2,309,664,067 | ||||||||
|
| |||||||||||||||
aIncludes common and preferred stock as well as other equity investments.
bFor detailed categories, see the accompanying Statement of Investments.
11. NEW ACCOUNTING PRONOUNCEMENTS
In December 2011, the Financial Accounting Standards Board (FASB) issued Accounting Standards Update (ASU) No. 2011-11, Balance Sheet (Topic 210): Disclosures about Offsetting Assets and Liabilities. The amendments in the ASU enhance disclosures about offsetting of financial assets and liabilities to enable investors to understand the effect of these arrangements on a fund’s financial position. The ASU is effective for interim and annual reporting periods beginning on or after January 1, 2013. The Fund believes the adoption of this ASU will not have a material impact on its financial statements.
12. SUBSEQUENT EVENTS
The Fund has evaluated subsequent events through the issuance of the financial statements and determined that no events have occurred that require disclosure.
ABBREVIATIONS | ||||
| Selected Portfolio | ||||
| ADR - American Depositary Receipt |
TF-25
Franklin Templeton Variable Insurance Products Trust
Tax Information (unaudited)
Templeton Foreign Securities Fund
At December 31, 2011, more than 50% of the Fund’s total assets were invested in securities of foreign issuers. In most instances, foreign taxes were withheld from income paid to the Fund on these investments. As shown in the table below, the Fund hereby reports to shareholders the foreign source income and foreign taxes paid, pursuant to Section 853 of the Internal Revenue Code. This written statement will allow shareholders of record on June 14, 2012, to treat their proportionate share of foreign taxes paid by the Fund as having been paid directly by them. The shareholder shall consider these amounts as foreign taxes paid in the tax year in which they receive the Fund distribution.
The following table provides a detailed analysis of foreign tax paid, and foreign source income as reported by the Fund, to Class 1, Class 2, Class 3, and Class 4 shareholders of record.
| Class | Foreign Tax Paid Per Share | Foreign Source Income Per Share | ||||||
Class 1 | $ | 0.0264 | $ | 0.4390 | ||||
Class 2 | $ | 0.0264 | $ | 0.4031 | ||||
Class 3 | $ | 0.0264 | $ | 0.4028 | ||||
Class 4 | $ | 0.0264 | $ | 0.4001 | ||||
Foreign Tax Paid Per Share (Column 1) is the amount per share available to you, as a tax credit (assuming you held your shares in the Fund for a minimum of 16 days during the 31-day period beginning 15 days before the ex-dividend date of the Fund’s distribution to which the foreign taxes relate), or, as a tax deduction.
Foreign Source Income Per Share (Column 2) is the amount per share of income dividends attributable to foreign securities held by the Fund, plus any foreign taxes withheld on these dividends.
TF-26
TEMPLETON GLOBAL BOND SECURITIES FUND
We are pleased to bring you Templeton Global Bond Securities Fund’s semiannual report for the period ended June 30, 2012.
Performance Summary as of 6/30/12
Templeton Global Bond Securities Fund – Class 4 delivered a +5.45% total return for the six-month period ended 6/30/12.
Performance reflects the Fund’s Class 4 operating expenses, but does not include any contract fees, expenses or sales charges. If they had been included, performance would be lower. These charges and deductions, particularly for variable life policies, can have a significant effect on contract values and insurance benefits. See the contract prospectus for a complete description of these expenses, including sales charges.
Templeton Global Bond Securities Fund – Class 4
Performance data represent past performance, which does not guarantee future results. Investment return and principal value will fluctuate, and you may have a gain or loss when you sell your shares.
Current performance may differ from figures shown.
TGB-1
Fund Goal and Main Investments: Templeton Global Bond Securities Fund seeks high current income, consistent with preservation of capital, with capital appreciation as a secondary consideration. Under normal market conditions, the Fund invests at least 80% of its net assets in bonds, which include debt securities of any maturity, such as bonds, notes, bills and debentures.
Performance Overview
You can find the Fund’s six-month total return in the Performance Summary. The Fund outperformed its benchmarks, the J.P. Morgan (JPM) Global Government Bond Index, which posted a +0.40% total return in U.S. dollar terms, and the Citigroup World Government Bond Index, which produced a +0.41% total return for the same period.1
Economic and Market Overview
The global economic recovery was mixed during the first half of 2012. Emerging markets continued to lead the recovery with many economies returning to and exceeding pre-crisis activity levels. Although some developed economies, such as those of Australia and some Scandinavian countries, also enjoyed relatively strong recoveries, growth in the G-3 (U.S., eurozone and Japan) continued to be slow by the standards of previous recoveries. Fears surrounding the issues of sovereign debt in Europe, the possibility of another recession in the U.S., and a potential “hard landing” in China dominated financial market headlines early in the period. Policymakers in the largest developed economies increased their already unprecedented efforts to supply liquidity and with few exceptions, policymakers elsewhere in the world either paused their monetary tightening cycles or reversed previous tightening efforts in response to the external environment.
The continuing eurozone sovereign debt crisis contributed to periods of market risk aversion, during which yields declined, equity markets sold off and perceived safe-haven assets such as U.S. Treasuries rallied. These alternated with periods of heightened risk appetite, during which yields increased and investors again favored risk assets. Increased liquidity creation, particularly from the European Central Bank’s Long-Term Refinancing Operation and meaningful progress toward coordinated action to address persistent banking and structural economic issues alleviated investor fears of a disorderly sovereign credit event and
1. Source: © 2012 Morningstar. One cannot invest directly in an index, and an index is not representative of the Fund’s portfolio. Please see Index Descriptions following the Fund Summaries.
Fund Risks: All investments involve risks, including possible loss of principal. Changes in interest rates will affect the value of the Fund’s portfolio and its share price and yield. Bond prices generally move in the opposite direction of interest rates. Thus, as the prices of bonds in the Fund adjust to a rise in interest rates, the Fund’s share price may decline. Special risks are associated with foreign investing, including currency fluctuations, economic instability and political developments. Investments in developing markets involve heightened risks related to the same factors, in addition to those associated with their relatively small size and lesser liquidity. The Fund’s use of derivatives and foreign currency techniques involves special risks as such usage may not achieve the anticipated benefits and/or may result in losses to the Fund. The Fund is also nondiversified, which involves the risk of greater price fluctuation than a more diversified portfolio. The Fund is actively managed but there is no guarantee that the manager’s investment decisions will produce the desired results. The Fund’s prospectus also includes a description of the main investment risks.
TGB-2
the potential for financial contagion. Positive economic data, including first quarter year-over-year real GDP growth of 2.0% in the U.S. and 8.1% in China challenged more dire predictions of a severe global economic slowdown.2
Investment Strategy
We allocate the Fund’s assets among issuers, geographic regions, and currencies based upon our assessment of relative interest rates among currencies, our outlook for changes in interest rates and currencies, and credit risks. In considering these factors, we may evaluate a country’s changing market, economic and political conditions, such as inflation rate, growth prospects, global trade patterns and government policies. We seek to manage the Fund’s exposure to various currencies and may utilize currency forward contracts.
Manager’s Discussion
The Fund’s total return was influenced by various factors, including interest rate developments, currency movements and exposure to sovereign debt markets. During the period under review, each of these sources of return benefited absolute and relative performance.
Interest Rate Strategy
We maintained a defensive posture with respect to interest rate risk in developed and emerging markets. At period-end, the Fund had a shorter duration position than the benchmark indexes, a stance arising from our assessment that there is limited scope for further global interest rate reductions. However, we maintained some duration exposure in countries where we believed long-term bond yields could benefit from declining risk premiums. Select duration exposures in Europe and Latin America contributed to absolute and relative performance. Underweighted duration exposures in the U.S. and Japan detracted from relative performance.
Currency Strategy
As part of the Fund’s investment strategy, we used currency forward contracts to hedge or gain exposure to various currencies. Overall, our diversified currency exposure contributed to absolute and relative performance and certain Latin American and Asia ex-Japan exposures were among the largest contributors. The Japanese yen depreciated 3.57% against the U.S. dollar, and the Fund’s net negative position in the
2. Sources: Bureau of Economic Analysis (U.S.); the website of the National Bureau of Statistics of the People’s Republic of China (www.stats.gov.cn).
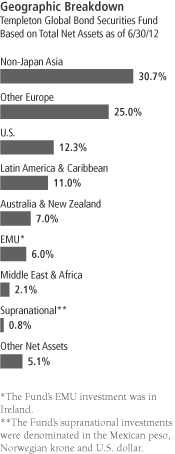
What is a currency forward contract?
A currency forward contract is an agreement between the Fund and a counterparty to buy or sell a foreign currency for a specific exchange rate on a future date.
What is duration?
Duration is a measure of a bond’s price sensitivity to interest rate changes. In general, a portfolio of securities with a lower duration can be expected to be less sensitive to interest rate changes than a portfolio with a higher duration.
TGB-3
currency helped absolute and relative performance.3 Our net negative position in the yen reflected our pessimistic view on the relative prospects for the Japanese economy and served as an implicit hedge against potential rising yields in the U.S., given the yen’s historically strong correlation to long-term U.S. Treasury yields. We also built positions in currencies of countries we believed to have attractive medium-term growth prospects and rising short-term interest rate differentials. In particular, we favored Asian, some Latin American, and non-euro European currencies.
Global Sovereign Debt Strategy
Sovereign credit exposures contributed to absolute and relative performance during the period. These exposures were concentrated in non-eurozone Europe and included select Latin American and Asian exposures.
Thank you for your participation in Templeton Global Bond Securities Fund. We look forward to serving your future investment needs.
3. Source: IDC/Exshare.
The foregoing information reflects our analysis, opinions and portfolio holdings as of June 30, 2012, the end of the reporting period. The way we implement our main investment strategies and the resulting portfolio holdings may change depending on factors such as market and economic conditions. These opinions may not be relied upon as investment advice or an offer for a particular security. The information is not a complete analysis of every aspect of any market, country, industry, security or the Fund. Statements of fact are from sources considered reliable, but the investment manager makes no representation or warranty as to their completeness or accuracy. Although historical performance is no guarantee of future results, these insights may help you understand our investment management philosophy.
Currency Breakdown
Templeton Global Bond Securities Fund 6/30/12
| % of Total Net Assets | ||||
Americas | 62.1% | |||
U.S. Dollar | 45.4% | |||
Mexican Peso | 8.5% | |||
Chilean Peso | 4.8% | |||
Brazilian Real | 3.2% | |||
Peruvian Nuevo Sol | 0.2% | |||
Asia Pacific | 32.4% | |||
South Korean Won | 15.2% | |||
Malaysian Ringgit | 11.9% | |||
Singapore Dollar | 8.3% | |||
Indonesian Rupiah | 4.7% | |||
Philippine Peso | 3.7% | |||
Indian Rupee | 3.1% | |||
Sri Lankan Rupee | 1.2% | |||
Japanese Yen* | -15.7% | |||
Australia & New Zealand | 9.0% | |||
Australian Dollar | 9.0% | |||
Middle East & Africa | 2.1% | |||
New Israeli Shekel | 2.1% | |||
Europe* | -5.6% | |||
Swedish Krona | 11.1% | |||
Polish Zloty | 10.4% | |||
Norwegian Krone | 3.1% | |||
Hungarian Forint | 1.4% | |||
British Pound Sterling | 0.1% | |||
Euro* | -31.7% | |||
*Holding is a negative percentage because of the Fund’s holdings of currency forward contracts.
The dollar value, number of shares or principal amount, and names of all portfolio holdings are listed in the Fund’s Statement of Investments.
TGB-4
Fund Expenses
As an investor in a variable insurance contract (Contract) that indirectly provides for investment in an underlying mutual fund, you can incur transaction and/or ongoing expenses at both the Fund level and the Contract level.
| • | Transaction expenses can include sales charges (loads) on purchases, surrender fees, transfer fees and premium taxes. |
| • | Ongoing expenses can include management fees, distribution and service (12b-1) fees, contract fees, annual maintenance fees, mortality and expense risk fees and other fees and expenses. All mutual funds and Contracts have some types of ongoing expenses. |
The expenses shown in the table are meant to highlight ongoing expenses at the Fund level only and do not include ongoing expenses at the Contract level, or transaction expenses at either the Fund or Contract levels. While the Fund does not have transaction expenses, if the transaction and ongoing expenses at the Contract level were included, the expenses shown below would be higher. You should consult your Contract prospectus or disclosure document for more information.
The table shows Fund-level ongoing expenses and can help you understand these expenses and compare them with those of other mutual funds offered through the Contract. The table assumes a $1,000 investment held for the six months indicated. Please refer to the Fund prospectus for additional information on operating expenses.
Actual Fund Expenses
The first line (Actual) of the table provides actual account values and expenses. The “Ending Account Value” is derived from the Fund’s actual return, which includes the effect of ongoing Fund expenses, but does not include the effect of ongoing Contract expenses.
You can estimate the Fund-level expenses you incurred during the period by following these steps. Of course, your account value and expenses will differ from those in this illustration:
| 1. | Divide your account value by $1,000. |
If an account had an $8,600 value, then $8,600 ÷ $1,000 = 8.6.
| 2. | Multiply the result by the number under the heading “Fund-Level Expenses Incurred During Period.” |
If Fund-Level Expenses Incurred During Period were $7.50, then 8.6 x $7.50 = $64.50.
In this illustration, the estimated expenses incurred this period at the Fund level are $64.50.
Templeton Global Bond Securities Fund – Class 4
TGB-5
Hypothetical Example for Comparison with Other Mutual Funds
Information in the second line (Hypothetical) of the table can help you compare ongoing expenses of the Fund with those of other mutual funds offered through the Contract. This information may not be used to estimate the actual ending account balance or expenses you incurred during the period. The hypothetical “Ending Account Value” is based on the Fund’s actual expense ratio and an assumed 5% annual rate of return before expenses, which does not represent the Fund’s actual return. The figure under the heading “Fund-Level Expenses Incurred During Period” shows the hypothetical expenses your account would have incurred under this scenario. You can compare this figure with the 5% hypothetical examples that appear in shareholder reports of other funds offered through a Contract.
| Class 4 | Beginning Account Value 1/1/12 | Ending Account Value 6/30/12 | Fund-Level Expenses Incurred During Period* 1/1/12–6/30/12 | |||||||||
Actual | $ | 1,000 | $ | 1,054.50 | $ | 4.60 | ||||||
Hypothetical (5% return before expenses) | $ | 1,000 | $ | 1,020.39 | $ | 4.52 | ||||||
*Expenses are calculated using the most recent six-month annualized expense ratio for the Fund’s Class 4 shares (0.90%), which does not include any ongoing expenses of the Contract for which the Fund is an investment option, multiplied by the average account value over the period, multiplied by 182/366 to reflect the one-half year period.
TGB-6
Franklin Templeton Variable Insurance Products Trust
Financial Highlights
Templeton Global Bond Securities Fund
Six Months (unaudited) | Year Ended December 31, | |||||||||||||||||||||||
| Class 1 | 2011 | 2010 | 2009 | 2008 | 2007 | |||||||||||||||||||
| ||||||||||||||||||||||||
Per share operating performance | ||||||||||||||||||||||||
(for a share outstanding throughout the period) | ||||||||||||||||||||||||
Net asset value, beginning of period | $ | 18.61 | $ | 19.94 | $ | 17.72 | $ | 17.42 | $ | 17.00 | $ | 15.73 | ||||||||||||
|
| |||||||||||||||||||||||
Income from investment operationsa: | ||||||||||||||||||||||||
Net investment incomeb | 0.37 | 0.87 | 1.00 | 0.99 | 0.80 | 0.77 | ||||||||||||||||||
Net realized and unrealized gains (losses) | 0.65 | (0.92 | ) | 1.58 | 2.01 | 0.27 | 0.97 | |||||||||||||||||
|
| |||||||||||||||||||||||
Total from investment operations | 1.02 | (0.05 | ) | 2.58 | 3.00 | 1.07 | 1.74 | |||||||||||||||||
|
| |||||||||||||||||||||||
Less distributions from: | ||||||||||||||||||||||||
Net investment income and net foreign currency gains | (1.28 | ) | (1.15 | ) | (0.31 | ) | (2.70 | ) | (0.65 | ) | (0.47 | ) | ||||||||||||
Net realized gains | (0.03 | ) | (0.13 | ) | (0.05 | ) | — | — | — | |||||||||||||||
|
| |||||||||||||||||||||||
Total distributions | (1.31 | ) | (1.28 | ) | (0.36 | ) | (2.70 | ) | (0.65 | ) | (0.47 | ) | ||||||||||||
|
| |||||||||||||||||||||||
Redemption feesc | — | — | — | — | — | — | ||||||||||||||||||
|
| |||||||||||||||||||||||
Net asset value, end of period | $ | 18.32 | $ | 18.61 | $ | 19.94 | $ | 17.72 | $ | 17.42 | $ | 17.00 | ||||||||||||
|
| |||||||||||||||||||||||
Total returnd | 5.63% | (0.61)% | 14.71% | 18.98% | 6.46% | 11.27% | ||||||||||||||||||
Ratios to average net assetse | ||||||||||||||||||||||||
Expensesf | 0.55% | 0.56% | 0.55% | 0.54% | 0.58% | 0.64% | ||||||||||||||||||
Net investment income | 3.84% | 4.40% | 5.27% | 5.73% | 4.66% | 4.70% | ||||||||||||||||||
Supplemental data | ||||||||||||||||||||||||
Net assets, end of period (000’s) | $ | 275,838 | $ | 269,819 | $ | 272,232 | $ | 195,662 | $ | 220,588 | $ | 137,700 | ||||||||||||
Portfolio turnover rate | 29.59% | 34.18% | 8.77% | 20.84% | 28.46% | 47.33% | ||||||||||||||||||
aThe amount shown for a share outstanding throughout the period may not correlate with the Statement of Operations for the period due to the timing of sales and repurchases of the Fund shares in relation to income earned and/or fluctuating market value of the investments of the Fund.
bBased on average daily shares outstanding.
cAmount rounds to less than $0.01 per share.
dTotal return does not include fees, charges or expenses imposed by the variable annuity and life insurance contracts for which the Franklin Templeton Variable Insurance Products Trust serves as an underlying investment vehicle. Total return is not annualized for periods less than one year.
eRatios are annualized for periods less than one year.
fBenefit of expense reduction rounds to less than 0.01%.
The accompanying notes are an integral part of these financial statements.
TGB-7
Franklin Templeton Variable Insurance Products Trust
Financial Highlights (continued)
Templeton Global Bond Securities Fund
Six Months (unaudited) | Year Ended December 31, | |||||||||||||||||||||||
| Class 2 | 2011 | 2010 | 2009 | 2008 | 2007 | |||||||||||||||||||
| ||||||||||||||||||||||||
Per share operating performance | ||||||||||||||||||||||||
(for a share outstanding throughout the period) | ||||||||||||||||||||||||
Net asset value, beginning of period | $ | 18.15 | $ | 19.49 | $ | 17.34 | $ | 17.10 | $ | 16.72 | $ | 15.50 | ||||||||||||
|
| |||||||||||||||||||||||
Income from investment operationsa: | ||||||||||||||||||||||||
Net investment incomeb | 0.34 | 0.79 | 0.93 | 0.93 | 0.74 | 0.72 | ||||||||||||||||||
Net realized and unrealized gains (losses) | 0.63 | (0.89 | ) | 1.54 | 1.98 | 0.27 | 0.96 | |||||||||||||||||
|
| |||||||||||||||||||||||
Total from investment operations | 0.97 | (0.10 | ) | 2.47 | 2.91 | 1.01 | 1.68 | |||||||||||||||||
|
| |||||||||||||||||||||||
Less distributions from: | ||||||||||||||||||||||||
Net investment income and net foreign currency gains | (1.24 | ) | (1.11 | ) | (0.27 | ) | (2.67 | ) | (0.63 | ) | (0.46 | ) | ||||||||||||
Net realized gains | (0.03 | ) | (0.13 | ) | (0.05 | ) | — | — | — | |||||||||||||||
|
| |||||||||||||||||||||||
Total distributions | (1.27 | ) | (1.24 | ) | (0.32 | ) | (2.67 | ) | (0.63 | ) | (0.46 | ) | ||||||||||||
|
| |||||||||||||||||||||||
Redemption feesc | — | — | — | — | — | — | ||||||||||||||||||
|
| |||||||||||||||||||||||
Net asset value, end of period | $ | 17.85 | $ | 18.15 | $ | 19.49 | $ | 17.34 | $ | 17.10 | $ | 16.72 | ||||||||||||
|
| |||||||||||||||||||||||
Total returnd | 5.49% | (0.87)% | 14.45% | 18.68% | 6.21% | 11.00% | ||||||||||||||||||
Ratios to average net assetse | ||||||||||||||||||||||||
Expensesf | 0.80% | 0.81% | 0.80% | 0.79% | 0.83% | 0.89% | ||||||||||||||||||
Net investment income | 3.59% | 4.15% | 5.02% | 5.48% | 4.41% | 4.45% | ||||||||||||||||||
Supplemental data | ||||||||||||||||||||||||
Net assets, end of period (000’s) | $ | 2,078,658 | $ | 1,812,814 | $ | 1,490,794 | $ | 1,262,783 | $ | 793,773 | $ | 480,649 | ||||||||||||
Portfolio turnover rate | 29.59% | 34.18% | 8.77% | 20.84% | 28.46% | 47.33% | ||||||||||||||||||
aThe amount shown for a share outstanding throughout the period may not correlate with the Statement of Operations for the period due to the timing of sales and repurchases of the Fund shares in relation to income earned and/or fluctuating market value of the investments of the Fund.
bBased on average daily shares outstanding.
cAmount rounds to less than $0.01 per share.
dTotal return does not include fees, charges or expenses imposed by the variable annuity and life insurance contracts for which the Franklin Templeton Variable Insurance Products Trust serves as an underlying investment vehicle. Total return is not annualized for periods less than one year.
eRatios are annualized for periods less than one year.
fBenefit of expense reduction rounds to less than 0.01%.
The accompanying notes are an integral part of these financial statements.
TGB-8
Franklin Templeton Variable Insurance Products Trust
Financial Highlights (continued)
Templeton Global Bond Securities Fund
Six Months (unaudited) | Year Ended December 31, | |||||||||||||||||||||||
| Class 3 | 2011 | 2010 | 2009 | 2008 | 2007 | |||||||||||||||||||
| ||||||||||||||||||||||||
Per share operating performance | ||||||||||||||||||||||||
(for a share outstanding throughout the period) | ||||||||||||||||||||||||
Net asset value, beginning of period | $ | 18.15 | $ | 19.48 | $ | 17.33 | $ | 17.08 | $ | 16.70 | $ | 15.49 | ||||||||||||
|
| |||||||||||||||||||||||
Income from investment operationsa: | ||||||||||||||||||||||||
Net investment incomeb | 0.34 | 0.80 | 0.93 | 0.93 | 0.74 | 0.72 | ||||||||||||||||||
Net realized and unrealized gains (losses) | 0.63 | (0.90 | ) | 1.54 | 1.98 | 0.27 | 0.95 | |||||||||||||||||
|
| |||||||||||||||||||||||
Total from investment operations | 0.97 | (0.10 | ) | 2.47 | 2.91 | 1.01 | 1.67 | |||||||||||||||||
|
| |||||||||||||||||||||||
Less distributions from: | ||||||||||||||||||||||||
Net investment income and net foreign currency gains | (1.23 | ) | (1.10 | ) | (0.27 | ) | (2.66 | ) | (0.63 | ) | (0.46 | ) | ||||||||||||
Net realized gains | (0.03 | ) | (0.13 | ) | (0.05 | ) | — | — | — | |||||||||||||||
|
| |||||||||||||||||||||||
Total distributions | (1.26 | ) | (1.23 | ) | (0.32 | ) | (2.66 | ) | (0.63 | ) | (0.46 | ) | ||||||||||||
|
| |||||||||||||||||||||||
Redemption feesc | — | — | — | — | — | — | ||||||||||||||||||
|
| |||||||||||||||||||||||
Net asset value, end of period | $ | 17.86 | $ | 18.15 | $ | 19.48 | $ | 17.33 | $ | 17.08 | $ | 16.70 | ||||||||||||
|
| |||||||||||||||||||||||
Total returnd | 5.43% | (0.83)% | 14.38% | 18.69% | 6.21% | 11.03% | ||||||||||||||||||
Ratios to average net assetse | ||||||||||||||||||||||||
Expensesf | 0.80% | 0.81% | 0.80% | 0.79% | 0.83% | 0.89% | ||||||||||||||||||
Net investment income | 3.59% | 4.15% | 5.02% | 5.48% | 4.41% | 4.45% | ||||||||||||||||||
Supplemental data | ||||||||||||||||||||||||
Net assets, end of period (000’s) | $ | 187,645 | $ | 185,811 | $ | 183,380 | $ | 143,264 | $ | 128,155 | $ | 91,162 | ||||||||||||
Portfolio turnover rate | 29.59% | 34.18% | 8.77% | 20.84% | 28.46% | 47.33% | ||||||||||||||||||
aThe amount shown for a share outstanding throughout the period may not correlate with the Statement of Operations for the period due to the timing of sales and repurchases of the Fund shares in relation to income earned and/or fluctuating market value of the investments of the Fund.
bBased on average daily shares outstanding.
cAmount rounds to less than $0.01 per share.
dTotal return does not include fees, charges or expenses imposed by the variable annuity and life insurance contracts for which the Franklin Templeton Variable Insurance Products Trust serves as an underlying investment vehicle. Total return is not annualized for periods less than one year.
eRatios are annualized for periods less than one year.
fBenefit of expense reduction rounds to less than 0.01%.
The accompanying notes are an integral part of these financial statements.
TGB-9
Franklin Templeton Variable Insurance Products Trust
Financial Highlights (continued)
Templeton Global Bond Securities Fund
Six Months (unaudited) | Year Ended December 31, | |||||||||||||||||||
| Class 4 | 2011 | 2010 | 2009 | 2008a | ||||||||||||||||
| ||||||||||||||||||||
Per share operating performance | ||||||||||||||||||||
(for a share outstanding throughout the period) | ||||||||||||||||||||
Net asset value, beginning of period | $ | 18.44 | $ | 19.78 | $ | 17.61 | $ | 17.37 | $ | 18.00 | ||||||||||
|
| |||||||||||||||||||
Income from investment operationsb: | ||||||||||||||||||||
Net investment incomec | 0.33 | 0.79 | 0.93 | 0.93 | 0.66 | |||||||||||||||
Net realized and unrealized gains (losses) | 0.65 | (0.91 | ) | 1.56 | 2.00 | (0.64 | ) | |||||||||||||
|
| |||||||||||||||||||
Total from investment operations | 0.98 | (0.12 | ) | 2.49 | 2.93 | 0.02 | ||||||||||||||
|
| |||||||||||||||||||
Less distributions from: | ||||||||||||||||||||
Net investment income and net foreign currency gains | (1.21 | ) | (1.09 | ) | (0.27 | ) | (2.69 | ) | (0.65 | ) | ||||||||||
Net realized gains | (0.03 | ) | (0.13 | ) | (0.05 | ) | — | — | ||||||||||||
|
| |||||||||||||||||||
Total distributions | (1.24 | ) | (1.22 | ) | (0.32 | ) | (2.69 | ) | (0.65 | ) | ||||||||||
|
| |||||||||||||||||||
Redemption feesd | — | — | — | — | — | |||||||||||||||
|
| |||||||||||||||||||
Net asset value, end of period | $ | 18.18 | $ | 18.44 | $ | 19.78 | $ | 17.61 | $ | 17.37 | ||||||||||
|
| |||||||||||||||||||
Total returne | 5.45% | (0.96)% | 14.28% | 18.58% | 0.26% | |||||||||||||||
Ratios to average net assetsf | ||||||||||||||||||||
Expensesg | 0.90% | 0.91% | 0.90% | 0.89% | 0.93% | |||||||||||||||
Net investment income | 3.49% | 4.05% | 4.92% | 5.38% | 4.31% | |||||||||||||||
Supplemental data | ||||||||||||||||||||
Net assets, end of period (000’s) | $ | 157,129 | $ | 151,695 | $ | 150,891 | $ | 108,910 | $ | 43,069 | ||||||||||
Portfolio turnover rate | 29.59% | 34.18% | 8.77% | 20.84% | 28.46% | |||||||||||||||
aFor the period February 29, 2008 (effective date) to December 31, 2008.
bThe amount shown for a share outstanding throughout the period may not correlate with the Statement of Operations for the period due to the timing of sales and repurchases of the Fund shares in relation to income earned and/or fluctuating market value of the investments of the Fund.
cBased on average daily shares outstanding.
dAmount rounds to less than $0.01 per share.
eTotal return does not include fees, charges or expenses imposed by the variable annuity and life insurance contracts for which the Franklin Templeton Variable Insurance Products Trust serves as an underlying investment vehicle. Total return is not annualized for periods less than one year.
fRatios are annualized for periods less than one year.
gBenefit of expense reduction rounds to less than 0.01%.
The accompanying notes are an integral part of these financial statements.
TGB-10
Franklin Templeton Variable Insurance Products Trust
Statement of Investments, June 30, 2012 (unaudited)
| Templeton Global Bond Securities Fund | Principal Amount* | Value | ||||||||
Foreign Government and Agency Securities 71.6% | ||||||||||
Argentina 0.5% | ||||||||||
a,bGovernment of Argentina, senior bond, FRN, 0.785%, 8/03/12 | 107,485,000 | $ | 12,948,192 | |||||||
|
| |||||||||
Australia 6.7% | ||||||||||
Government of Australia, senior bond, 6.50%, 5/15/13 | 12,260,000 | AUD | 12,941,471 | |||||||
New South Wales Treasury Corp., | ||||||||||
5.25%, 5/01/13 | 3,370,000 | AUD | 3,512,285 | |||||||
5.50%, 8/01/13 | 41,490,000 | AUD | 43,545,633 | |||||||
senior note, 5.50%, 3/01/17 | 32,225,000 | AUD | 36,291,012 | |||||||
Queensland Treasury Corp., | 24,450,000 | AUD | 25,834,302 | |||||||
6.00%, 9/14/17 | 13,160,000 | AUD | 15,030,826 | |||||||
senior note, 6.00%, 8/21/13 | 8,888,000 | AUD | 9,382,092 | |||||||
Western Australia Treasury Corp., | 19,612,000 | AUD | 20,095,177 | |||||||
8.00%, 6/15/13 | 13,794,000 | AUD | 14,770,154 | |||||||
|
| |||||||||
| 181,402,952 | ||||||||||
|
| |||||||||
Brazil 3.2% | ||||||||||
Nota Do Tesouro Nacional, | 7,100c | BRL | 3,630,662 | |||||||
10.00%, 1/01/17 | 22,490c | BRL | 11,496,652 | |||||||
dIndex Linked, 6.00%, 5/15/15 | 30,226c | BRL | 34,613,543 | |||||||
dIndex Linked, 6.00%, 8/15/16 | 11,218c | BRL | 12,993,867 | |||||||
dIndex Linked, 6.00%, 5/15/17 | 202c | BRL | 235,630 | |||||||
dIndex Linked, 6.00%, 8/15/18 | 8,425c | BRL | 9,885,559 | |||||||
dIndex Linked, 6.00%, 5/15/45 | 10,825c | BRL | 14,218,553 | |||||||
|
| |||||||||
| 87,074,466 | ||||||||||
|
| |||||||||
Hungary 2.9% | ||||||||||
Government of Hungary, | ||||||||||
5.50%, 2/12/14 | 628,240,000 | HUF | 2,707,203 | |||||||
7.75%, 8/24/15 | 114,950,000 | HUF | 513,157 | |||||||
5.50%, 2/12/16 | 436,800,000 | HUF | 1,816,356 | |||||||
6.50%, 6/24/19 | 389,700,000 | HUF | 1,608,476 | |||||||
7.50%, 11/12/20 | 28,000,000 | HUF | 121,419 | |||||||
A, 8.00%, 2/12/15 | 280,000,000 | HUF | 1,259,183 | |||||||
A, 6.75%, 11/24/17 | 1,582,950,000 | HUF | 6,735,208 | |||||||
A, 7.00%, 6/24/22 | 249,200,000 | HUF | 1,043,336 | |||||||
B, 6.75%, 2/24/17 | 394,700,000 | HUF | 1,689,535 | |||||||
D, 6.75%, 2/12/13 | 310,800,000 | HUF | 1,371,898 | |||||||
D, 6.75%, 8/22/14 | 1,760,900,000 | HUF | 7,724,840 | |||||||
E, 7.50%, 10/24/13 | 248,600,000 | HUF | 1,102,933 | |||||||
senior note, 3.50%, 7/18/16 | 1,055,000 | EUR | 1,183,495 | |||||||
senior note, 4.375%, 7/04/17 | 7,480,000 | EUR | 8,392,455 | |||||||
senior note, 5.75%, 6/11/18 | 14,475,000 | EUR | 16,910,144 | |||||||
senior note, 6.25%, 1/29/20 | 6,420,000 | 6,311,663 | ||||||||
senior note, 3.875%, 2/24/20 | 3,120,000 | EUR | 3,215,700 | |||||||
senior note, 6.375%, 3/29/21 | 14,820,000 | 14,597,700 | ||||||||
|
| |||||||||
| 78,304,701 | ||||||||||
|
| |||||||||
Iceland 0.3% | ||||||||||
eGovernment of Iceland, 144A, 5.875%, 5/11/22 | 7,660,000 | 7,531,274 | ||||||||
|
| |||||||||
TGB-11
Franklin Templeton Variable Insurance Products Trust
Statement of Investments, June 30, 2012 (unaudited) (continued)
| Templeton Global Bond Securities Fund | Principal Amount* | Value | ||||||||
Foreign Government and Agency Securities (continued) | ||||||||||
Indonesia 4.7% | ||||||||||
Government of Indonesia, | ||||||||||
FR20, 14.275%, 12/15/13 | 14,267,000,000 | IDR | $ | 1,721,435 | ||||||
FR31, 11.00%, 11/15/20 | 167,351,000,000 | IDR | 23,534,086 | |||||||
FR34, 12.80%, 6/15/21 | 207,810,000,000 | IDR | 32,186,486 | |||||||
FR35, 12.90%, 6/15/22 | 66,582,000,000 | IDR | 10,504,895 | |||||||
FR36, 11.50%, 9/15/19 | 30,075,000,000 | IDR | 4,227,023 | |||||||
FR39, 11.75%, 8/15/23 | 5,491,000,000 | IDR | 825,340 | |||||||
FR40, 11.00%, 9/15/25 | 46,856,000,000 | IDR | 6,875,996 | |||||||
FR43, 10.25%, 7/15/22 | 68,340,000,000 | IDR | 9,347,285 | |||||||
FR44, 10.00%, 9/15/24 | 4,454,000,000 | IDR | 607,404 | |||||||
FR46, 9.50%, 7/15/23 | 226,780,000,000 | IDR | 29,838,510 | |||||||
FR48, 9.00%, 9/15/18 | 16,920,000,000 | IDR | 2,095,863 | |||||||
FR49, 9.00%, 9/15/13 | 35,030,000,000 | IDR | 3,918,344 | |||||||
|
| |||||||||
| 125,682,667 | ||||||||||
|
| |||||||||
Ireland 6.0% | ||||||||||
Government of Ireland, | ||||||||||
4.60%, 4/18/16 | 7,582,000 | EUR | 9,380,354 | |||||||
5.90%, 10/18/19 | 20,597,000 | EUR | 25,568,368 | |||||||
4.50%, 4/18/20 | 18,676,000 | EUR | 21,185,846 | |||||||
5.00%, 10/18/20 | 29,743,000 | EUR | 34,668,963 | |||||||
senior bond, 4.50%, 10/18/18 | 8,090,000 | EUR | 9,430,921 | |||||||
senior bond, 4.40%, 6/18/19 | 20,943,000 | EUR | 23,966,899 | |||||||
senior bond, 5.40%, 3/13/25 | 32,362,000 | EUR | 37,650,654 | |||||||
|
| |||||||||
| 161,852,005 | ||||||||||
|
| |||||||||
Israel 2.1% | ||||||||||
Government of Israel, | ||||||||||
5.00%, 3/31/13 | 64,475,000 | ILS | 16,829,708 | |||||||
3.50%, 9/30/13 | 154,649,000 | ILS | 40,170,755 | |||||||
|
| |||||||||
| 57,000,463 | ||||||||||
|
| |||||||||
Lithuania 1.5% | ||||||||||
eGovernment of Lithuania, 144A, | ||||||||||
6.75%, 1/15/15 | 19,480,000 | 21,084,762 | ||||||||
7.375%, 2/11/20 | 12,690,000 | 15,119,818 | ||||||||
6.125%, 3/09/21 | 3,240,000 | 3,586,648 | ||||||||
|
| |||||||||
| 39,791,228 | ||||||||||
|
| |||||||||
Malaysia 2.4% | ||||||||||
Government of Malaysia, senior bond, | ||||||||||
2.509%, 8/27/12 | 29,695,000 | MYR | 9,359,006 | |||||||
3.702%, 2/25/13 | 48,883,000 | MYR | 15,489,566 | |||||||
3.70%, 5/15/13 | 7,855,000 | MYR | 2,492,955 | |||||||
3.21%, 5/31/13 | 7,710,000 | MYR | 2,437,068 | |||||||
3.461%, 7/31/13 | 26,885,000 | MYR | 8,523,864 | |||||||
8.00%, 10/30/13 | 250,000 | MYR | 83,965 | |||||||
5.094%, 4/30/14 | 13,850,000 | MYR | 4,531,145 | |||||||
3.814%, 2/15/17 | 18,885,000 | MYR | 6,117,489 | |||||||
4.24%, 2/07/18 | 44,360,000 | MYR | 14,672,379 | |||||||
|
| |||||||||
| 63,707,437 | ||||||||||
|
| |||||||||
TGB-12
Franklin Templeton Variable Insurance Products Trust
Statement of Investments, June 30, 2012 (unaudited) (continued)
| Templeton Global Bond Securities Fund | Principal Amount* | Value | ||||||||
Foreign Government and Agency Securities (continued) | ||||||||||
Mexico 6.6% | ||||||||||
Government of Mexico, | ||||||||||
9.00%, 12/20/12 | 265,000 | f MXN | $ | 2,026,934 | ||||||
9.00%, 6/20/13 | 4,178,160 | f MXN | 32,618,669 | |||||||
8.00%, 12/19/13 | 10,300,200 | f MXN | 80,956,825 | |||||||
8.00%, 12/17/15 | 726,000 | f MXN | 6,002,093 | |||||||
7.25%, 12/15/16 | 250,000 | f MXN | 2,056,403 | |||||||
7.75%, 12/14/17 | 4,473,000 | f MXN | 38,038,969 | |||||||
dMexican Udibonos, Index Linked, | ||||||||||
4.50%, 12/18/14 | 208,203 | f MXN | 1,714,899 | |||||||
5.00%, 6/16/16 | 533,378 | f MXN | 4,664,378 | |||||||
3.50%, 12/14/17 | 534,752 | f MXN | 4,553,570 | |||||||
4.00%, 6/13/19 | 367,041 | f MXN | 3,257,742 | |||||||
2.50%, 12/10/20 | 289,063 | f MXN | 2,343,217 | |||||||
|
| |||||||||
| 178,233,699 | ||||||||||
|
| |||||||||
Norway 0.3% | ||||||||||
Government of Norway, 6.50%, 5/15/13 | 49,400,000 | NOK | 8,654,252 | |||||||
|
| |||||||||
Peru 0.2% | ||||||||||
Government of Peru, 7.84%, 8/12/20 | 11,090,000 | PEN | 4,933,479 | |||||||
|
| |||||||||
Philippines 0.3% | ||||||||||
Government of the Philippines, | 61,770,000 | PHP | 1,491,032 | |||||||
senior bond, 8.75%, 3/03/13 | 163,600,000 | PHP | 4,034,318 | |||||||
senior bond, 7.00%, 1/27/16 | 53,190,000 | PHP | 1,367,734 | |||||||
senior bond, 9.125%, 9/04/16 | 31,840,000 | PHP | 868,977 | |||||||
senior bond, R3-7, 5.25%, 9/24/12 | 2,090,000 | PHP | 50,121 | |||||||
senior note, 6.25%, 1/27/14 | 30,480,000 | PHP | 757,511 | |||||||
|
| |||||||||
| 8,569,693 | ||||||||||
|
| |||||||||
Poland 9.2% | ||||||||||
Government of Poland, | ||||||||||
5.25%, 4/25/13 | 29,160,000 | PLN | 8,793,167 | |||||||
5.00%, 10/24/13 | 136,450,000 | PLN | 41,160,689 | |||||||
5.75%, 4/25/14 | 187,925,000 | PLN | 57,545,227 | |||||||
5.50%, 4/25/15 | 7,835,000 | PLN | 2,408,616 | |||||||
6.25%, 10/24/15 | 53,460,000 | PLN | 16,843,118 | |||||||
5.75%, 9/23/22 | 48,750,000 | PLN | 15,281,478 | |||||||
senior note, 6.375%, 7/15/19 | 10,060,000 | 11,897,207 | ||||||||
Strip, 7/25/12 | 11,905,000 | PLN | 3,563,495 | |||||||
Strip, 10/25/12 | 90,245,000 | PLN | 26,703,315 | |||||||
Strip, 1/25/13 | 121,425,000 | PLN | 35,519,355 | |||||||
Strip, 7/25/13 | 76,175,000 | PLN | 21,799,729 | |||||||
Strip, 1/25/14 | 25,330,000 | PLN | 7,089,442 | |||||||
|
| |||||||||
| 248,604,838 | ||||||||||
|
| |||||||||
Russia 2.5% | ||||||||||
eGovernment of Russia, 144A, 7.50%, 3/31/30 | 57,023,785 | 68,471,310 | ||||||||
|
| |||||||||
Singapore 1.2% | ||||||||||
Government of Singapore, senior bond, | ||||||||||
2.50%, 10/01/12 | 6,340,000 | SGD | 5,030,507 | |||||||
1.625%, 4/01/13 | 34,700,000 | SGD | 27,671,840 | |||||||
|
| |||||||||
| 32,702,347 | ||||||||||
|
| |||||||||
TGB-13
Franklin Templeton Variable Insurance Products Trust
Statement of Investments, June 30, 2012 (unaudited) (continued)
| Templeton Global Bond Securities Fund | Principal Amount* | Value | ||||||||
Foreign Government and Agency Securities (continued) | ||||||||||
South Korea 11.3% | ||||||||||
The Export-Import Bank of Korea, senior note, 4.625%, 2/20/17 | 230,000 | EUR | $ | 313,676 | ||||||
KDICB Redemption Fund Bond, senior bond, | ||||||||||
07-1, 5.57%, 9/14/12 | 6,600,000,000 | KRW | 5,807,017 | |||||||
08-1, 5.28%, 2/15/13 | 880,000,000 | KRW | 779,877 | |||||||
Korea Monetary Stabilization Bond, | 3,684,270,000 | KRW | 3,241,698 | |||||||
senior bond, 3.90%, 8/02/13 | 54,619,320,000 | KRW | 48,175,371 | |||||||
senior bond, 3.59%, 10/02/13 | 5,898,020,000 | KRW | 5,186,628 | |||||||
senior bond, 3.48%, 12/02/13 | 10,110,910,000 | KRW | 8,882,060 | |||||||
senior bond, 3.47%, 2/02/14 | 13,902,550,000 | KRW | 12,214,637 | |||||||
senior bond, 3.59%, 4/02/14 | 20,432,530,000 | KRW | 18,153,339 | |||||||
senior note, 3.28%, 6/02/14 | 24,224,170,000 | KRW | 21,228,316 | |||||||
Korea Treasury Bond, | ||||||||||
5.25%, 9/10/12 | 28,539,000,000 | KRW | 25,096,338 | |||||||
5.25%, 3/10/13 | 6,483,790,000 | KRW | 5,755,096 | |||||||
5.00%, 9/10/16 | 2,806,000,000 | KRW | 2,606,823 | |||||||
senior bond, 4.25%, 12/10/12 | 23,404,000,000 | KRW | 20,588,522 | |||||||
senior bond, 3.75%, 6/10/13 | 57,125,360,000 | KRW | 50,271,111 | |||||||
senior bond, 3.00%, 12/10/13 | 87,529,850,000 | KRW | 76,368,735 | |||||||
|
| |||||||||
| 304,669,244 | ||||||||||
|
| |||||||||
Sri Lanka 1.2% | ||||||||||
Government of Sri Lanka, | ||||||||||
A, 6.90%, 8/01/12 | 14,600,000 | LKR | 109,170 | |||||||
A, 8.50%, 1/15/13 | 694,400,000 | LKR | 5,115,403 | |||||||
A, 13.50%, 2/01/13 | 674,300,000 | LKR | 5,089,811 | |||||||
A, 7.50%, 8/01/13 | 350,190,000 | LKR | 2,488,974 | |||||||
A, 7.00%, 3/01/14 | 43,380,000 | LKR | 296,241 | |||||||
A, 11.25%, 7/15/14 | 773,000,000 | LKR | 5,594,099 | |||||||
A, 11.75%, 3/15/15 | 8,520,000 | LKR | 61,296 | |||||||
A, 6.50%, 7/15/15 | 218,480,000 | LKR | 1,355,852 | |||||||
A, 11.00%, 8/01/15 | 1,349,700,000 | LKR | 9,469,423 | |||||||
A, 6.40%, 8/01/16 | 109,200,000 | LKR | 631,633 | |||||||
B, 8.50%, 7/15/13 | 7,990,000 | LKR | 57,650 | |||||||
B, 6.60%, 6/01/14 | 56,800,000 | LKR | 379,636 | |||||||
B, 6.40%, 10/01/16 | 119,100,000 | LKR | 684,972 | |||||||
|
| |||||||||
| 31,334,160 | ||||||||||
|
| |||||||||
gSupranational 0.8% | ||||||||||
European Investment Bank, senior note, 4.50%, 5/15/13 | 33,700,000 | NOK | 5,772,148 | |||||||
Inter-American Development Bank, senior note, 7.50%, 12/05/24 | 200,000,000 | MXN | 16,883,036 | |||||||
|
| |||||||||
| 22,655,184 | ||||||||||
|
| |||||||||
Sweden 4.5% | ||||||||||
Government of Sweden, | ||||||||||
5.50%, 10/08/12 | 490,215,000 | SEK | 71,667,959 | |||||||
1.50%, 8/30/13 | 313,400,000 | SEK | 45,611,999 | |||||||
Kommuninvest I Sverige AB, senior note, 1.75%, 10/08/12 | 24,400,000 | SEK | 3,531,493 | |||||||
|
| |||||||||
| 120,811,451 | ||||||||||
|
| |||||||||
Ukraine 2.2% | ||||||||||
eFinancing of Infrastructure Projects State Enterprise, 144A, | 1,100,000 | 924,000 | ||||||||
7.40%, 4/20/18 | 840,000 | 672,525 | ||||||||
TGB-14
Franklin Templeton Variable Insurance Products Trust
Statement of Investments, June 30, 2012 (unaudited) (continued)
| Templeton Global Bond Securities Fund | Principal Amount* | Value | ||||||||
Foreign Government and Agency Securities (continued) | ||||||||||
Ukraine (continued) | ||||||||||
eGovernment of Ukraine, | 760,000 | $ | 747,916 | |||||||
144A, 6.25%, 6/17/16 | 8,760,000 | 7,894,950 | ||||||||
144A, 7.75%, 9/23/20 | 17,227,000 | 15,644,269 | ||||||||
senior bond, 144A, 6.58%, 11/21/16 | 12,541,000 | 11,321,701 | ||||||||
senior note, 144A, 4.95%, 10/13/15 | 290,000 | EUR | 313,839 | |||||||
senior note, 144A, 7.95%, 2/23/21 | 23,898,000 | 21,866,312 | ||||||||
|
| |||||||||
| 59,385,512 | ||||||||||
|
| |||||||||
Venezuela 0.5% | ||||||||||
Government of Venezuela, 10.75%, 9/19/13 | 13,570,000 | 13,996,776 | ||||||||
|
| |||||||||
Vietnam 0.5% | ||||||||||
eGovernment of Vietnam, 144A, 6.75%, 1/29/20 | 13,110,000 | 14,027,700 | ||||||||
|
| |||||||||
Total Foreign Government and Agency Securities | 1,932,345,030 | |||||||||
|
| |||||||||
Municipal Bonds 0.1% | ||||||||||
United States 0.1% | ||||||||||
Bexar County Revenue, Venue Project, Refunding, Series A, BHAC Insured, 5.25%, 8/15/47 | 1,450,000 | 1,615,460 | ||||||||
California State GO, Build America Bonds, Various Purpose, 7.625%, 3/01/40 | 1,320,000 | 1,707,869 | ||||||||
|
| |||||||||
Total Municipal Bonds (Cost $2,811,147) | 3,323,329 | |||||||||
|
| |||||||||
Total Investments before Short Term Investments | 1,935,668,359 | |||||||||
|
| |||||||||
Short Term Investments 23.2% | ||||||||||
Foreign Government and Agency Securities 11.1% | ||||||||||
Australia 0.3% | ||||||||||
hAustralia Treasury Bill, 8/10/12 | 8,680,000 | AUD | 8,849,919 | |||||||
|
| |||||||||
Hungary 0.1% | ||||||||||
hHungary Treasury Bill, 8/22/12 | 502,600,000 | HUF | 2,202,773 | |||||||
|
| |||||||||
Malaysia 5.7% | ||||||||||
hBank of Negara Monetary Note, | ||||||||||
2/26/13 | 143,400,000 | MYR | 44,362,998 | |||||||
7/26/12 - 6/20/13 | 344,027,000 | MYR | 106,911,062 | |||||||
hMalaysia Treasury Bills, 7/27/12 - 5/31/13 | 5,320,000 | MYR | 1,661,985 | |||||||
|
| |||||||||
| 152,936,045 | ||||||||||
|
| |||||||||
Norway 1.5% | ||||||||||
hNorway Treasury Bill, 3/20/13 | 242,890,000 | NOK | 40,384,563 | |||||||
|
| |||||||||
Philippines 0.2% | ||||||||||
hPhilippine Treasury Bills, 7/11/12 - 5/29/13 | 196,870,000 | PHP | 4,661,389 | |||||||
|
| |||||||||
Singapore 1.7% | ||||||||||
Government of Singapore, senior bond, 3.50%, 7/01/12 | 2,120,000 | SGD | 1,673,243 | |||||||
hSingapore Treasury Bills, 7/05/12 - 5/02/13 | 54,870,000 | SGD | 43,289,394 | |||||||
|
| |||||||||
| 44,962,637 | ||||||||||
|
| |||||||||
South Korea 1.6% | ||||||||||
Korea Monetary Stabilization Bond, | 3,166,620,000 | KRW | 2,785,579 | |||||||
TGB-15
Franklin Templeton Variable Insurance Products Trust
Statement of Investments, June 30, 2012 (unaudited) (continued)
| Templeton Global Bond Securities Fund | Principal Amount* | Value | ||||||||
Short Term Investments (continued) | ||||||||||
Foreign Government and Agency Securities (continued) | ||||||||||
South Korea (continued) | ||||||||||
senior bond, 3.38%, 5/09/13 | 21,273,320,000 | KRW | $ | 18,652,974 | ||||||
senior note, 3.28%, 6/09/13 | 20,958,260,000 | KRW | 18,361,257 | |||||||
senior note, Strip, 12/18/12 | 5,266,120,000 | KRW | 4,545,015 | |||||||
|
| |||||||||
| 44,344,825 | ||||||||||
|
| |||||||||
Sri Lanka 0.0%† | ||||||||||
hSri Lanka Treasury Bills, 7/06/12 - 9/28/12 | 78,400,000 | LKR | 585,823 | |||||||
|
| |||||||||
Total Foreign Government and Agency Securities (Cost $305,719,146) | 298,927,974 | |||||||||
|
| |||||||||
Total Investments before Repurchase Agreements (Cost $2,213,430,739) | 2,234,596,333 | |||||||||
|
| |||||||||
Repurchase Agreements (Cost $327,773,318) 12.1% | ||||||||||
United States 12.1% | ||||||||||
iJoint Repurchase Agreement, 0.129%, 7/02/12 (Maturity Value $327,776,840) BNP Paribas Securities Corp. (Maturity Value $64,031,206) Credit Suisse Securities (USA) LLC (Maturity Value $74,703,619) Deutsche Bank Securities Inc. (Maturity Value $50,307,189) HSBC Securities (USA) Inc. (Maturity Value $42,686,378) Merrill Lynch, Pierce, Fenner & Smith Inc. (Maturity Value $42,686,378) Morgan Stanley & Co. LLC (Maturity Value $21,344,828) UBS Securities LLC (Maturity Value $32,017,242) | 327,773,318 | 327,773,318 | ||||||||
Collateralized by U.S. Government Agency Securities, 0.00% - 5.25%, 8/01/12 - 6/28/17; | ||||||||||
|
| |||||||||
Total Investments (Cost $2,541,204,057) 94.9% | 2,562,369,651 | |||||||||
Other Assets, less Liabilities 5.1% | 136,901,203 | |||||||||
|
| |||||||||
Net Assets 100.0% | $ | 2,699,270,854 | ||||||||
|
| |||||||||
See Abbreviations on page TGB-38.
†Rounds to less than 0.1% of net assets.
*The principal amount is stated in U.S. dollars unless otherwise indicated.
aThe coupon rate shown represents the rate at period end.
bThe principal amount is stated in original face, and scheduled paydowns are reflected in the market price on ex-date.
cPrincipal amount is stated in 1,000 Brazilian Real Units.
dRedemption price at maturity is adjusted for inflation. See Note 1(g).
eSecurity was purchased pursuant to Rule 144A under the Securities Act of 1933 and may be sold in transactions exempt from registration only to qualified institutional buyers or in a public offering registered under the Securities Act of 1933. These securities have been deemed liquid under guidelines approved by the Trust’s Board of Trustees. At June 30, 2012, the aggregate value of these securities was $189,207,024, representing 7.01% of net assets.
fPrincipal amount is stated in 100 Mexican Peso Units.
gA supranational organization is an entity formed by two or more central governments through international treaties.
hThe security is traded on a discount basis with no stated coupon rate.
iSee Note 1(c) regarding joint repurchase agreement.
TGB-16
Franklin Templeton Variable Insurance Products Trust
Statement of Investments, June 30, 2012 (unaudited) (continued)
| Templeton Global Bond Securities Fund |
At June 30, 2012, the Fund had the following forward exchange contracts outstanding. See Note 1(d).
Forward Exchange Contracts
| Currency | Counterparty | Type | Quantity | Contract Amount* | Settlement Date | Unrealized Appreciation | Unrealized Depreciation | |||||||||||||||||||||||||
British Pound | FBCO | Buy | 3,431,879 | 5,452,913 | 7/02/12 | $ | — | $ | (76,055 | ) | ||||||||||||||||||||||
British Pound | FBCO | Sell | 3,431,879 | 5,304,072 | 7/02/12 | — | (72,785 | ) | ||||||||||||||||||||||||
Indian Rupee | DBAB | Buy | 79,423,000 | 1,704,455 | 7/11/12 | — | (277,421 | ) | ||||||||||||||||||||||||
Indian Rupee | JPHQ | Buy | 127,745,000 | 2,753,345 | 7/12/12 | — | (458,586 | ) | ||||||||||||||||||||||||
Indian Rupee | DBAB | Buy | 40,128,000 | 861,351 | 7/12/12 | — | (140,508 | ) | ||||||||||||||||||||||||
Malaysian Ringgit | DBAB | Buy | 18,006,622 | 5,897,043 | 7/12/12 | — | (222,813 | ) | ||||||||||||||||||||||||
Malaysian Ringgit | DBAB | Buy | 13,610,000 | 4,466,835 | 7/13/12 | — | (178,366 | ) | ||||||||||||||||||||||||
Euro | DBAB | Sell | 2,243,000 | 3,142,533 | 7/16/12 | 303,394 | — | |||||||||||||||||||||||||
Euro | UBSW | Sell | 8,965,000 | 12,558,620 | 7/16/12 | 1,210,927 | — | |||||||||||||||||||||||||
Euro | MSCO | Sell | 7,888,000 | 11,004,746 | 7/16/12 | 1,020,294 | — | |||||||||||||||||||||||||
Euro | UBSW | Sell | 8,965,000 | 12,571,171 | 7/18/12 | 1,223,290 | — | |||||||||||||||||||||||||
Euro | DBAB | Sell | 3,518,000 | 4,934,663 | 7/18/12 | 481,585 | — | |||||||||||||||||||||||||
Euro | MSCO | Sell | 1,791,000 | 2,507,400 | 7/18/12 | 240,355 | — | |||||||||||||||||||||||||
Malaysian Ringgit | DBAB | Buy | 2,637,000 | 865,896 | 7/18/12 | — | (35,278 | ) | ||||||||||||||||||||||||
Malaysian Ringgit | DBAB | Buy | 11,455,000 | 2,669,790 | EUR | 7/18/12 | 228,751 | — | ||||||||||||||||||||||||
Euro | BZWS | Sell | 2,638,000 | 3,696,102 | 7/19/12 | 356,899 | — | |||||||||||||||||||||||||
Indian Rupee | JPHQ | Buy | 39,422,000 | 848,332 | 7/19/12 | — | (141,253 | ) | ||||||||||||||||||||||||
Euro | MSCO | Sell | 12,182,000 | 16,976,226 | 7/20/12 | 1,556,018 | — | |||||||||||||||||||||||||
Euro | DBAB | Sell | 1,935,000 | 2,699,035 | 7/20/12 | 249,675 | — | |||||||||||||||||||||||||
Malaysian Ringgit | DBAB | Buy | 4,160,000 | 1,361,880 | 7/20/12 | — | (51,723 | ) | ||||||||||||||||||||||||
Malaysian Ringgit | DBAB | Buy | 12,933,000 | 3,036,058 | EUR | 7/20/12 | 230,042 | — | ||||||||||||||||||||||||
Euro | DBAB | Sell | 1,759,000 | 2,467,437 | 7/23/12 | 240,806 | — | |||||||||||||||||||||||||
Malaysian Ringgit | DBAB | Buy | 5,058,000 | 1,667,216 | 7/25/12 | — | (74,801 | ) | ||||||||||||||||||||||||
Malaysian Ringgit | DBAB | Buy | 16,628,000 | 3,885,501 | EUR | 7/25/12 | 316,467 | — | ||||||||||||||||||||||||
Malaysian Ringgit | JPHQ | Buy | 5,318,000 | 1,763,964 | 7/27/12 | — | (89,928 | ) | ||||||||||||||||||||||||
Malaysian Ringgit | JPHQ | Buy | 16,628,000 | 3,875,268 | EUR | 7/27/12 | 328,604 | — | ||||||||||||||||||||||||
Malaysian Ringgit | HSBC | Buy | 3,005,000 | 1,009,745 | 7/31/12 | — | (64,063 | ) | ||||||||||||||||||||||||
Euro | BZWS | Sell | 185,174 | 262,429 | 8/01/12 | 28,007 | — | |||||||||||||||||||||||||
Euro | BZWS | Sell | 97,724 | 139,325 | 8/02/12 | 15,610 | — | |||||||||||||||||||||||||
Euro | DBAB | Sell | 5,724,900 | 8,099,168 | 8/06/12 | 851,299 | — | |||||||||||||||||||||||||
Euro | BZWS | Sell | 2,762,518 | 3,924,433 | 8/06/12 | 427,015 | — | |||||||||||||||||||||||||
Malaysian Ringgit | JPHQ | Buy | 1,100,000 | 365,509 | 8/06/12 | — | (19,468 | ) | ||||||||||||||||||||||||
Euro | CITI | Sell | 1,210,637 | 1,699,674 | 8/08/12 | 166,942 | — | |||||||||||||||||||||||||
Euro | DBAB | Sell | 6,343,900 | 8,927,453 | 8/08/12 | 895,736 | — | |||||||||||||||||||||||||
Malaysian Ringgit | HSBC | Buy | 6,100,000 | 2,030,220 | 8/08/12 | — | (111,509 | ) | ||||||||||||||||||||||||
Australian Dollar | MSCO | Buy | 10,560,886 | 11,193,483 | 8/09/12 | — | (426,185 | ) | ||||||||||||||||||||||||
Australian Dollar | DBAB | Buy | 3,351,000 | 272,402,790 | JPY | 8/09/12 | 9,006 | — | ||||||||||||||||||||||||
Australian Dollar | CITI | Buy | 3,351,000 | 272,146,438 | JPY | 8/09/12 | 12,212 | — | ||||||||||||||||||||||||
Australian Dollar | BZWS | Buy | 3,351,000 | 272,000,670 | JPY | 8/09/12 | 14,036 | — | ||||||||||||||||||||||||
Euro | CITI | Sell | 351,512 | 494,595 | 8/09/12 | 49,557 | — | |||||||||||||||||||||||||
Euro | DBAB | Sell | 4,845,000 | 6,861,651 | 8/09/12 | 727,554 | — | |||||||||||||||||||||||||
South Korean Won | HSBC | Buy | 21,363,430,000 | 19,660,804 | 8/09/12 | — | (997,299 | ) | ||||||||||||||||||||||||
Euro | DBAB | Sell | 2,166,000 | 3,061,186 | 8/10/12 | 318,853 | — | |||||||||||||||||||||||||
Euro | DBAB | Sell | 4,115,000 | 5,828,152 | 8/13/12 | 618,052 | — | |||||||||||||||||||||||||
Polish Zloty | DBAB | Buy | 59,155,000 | 13,945,073 | EUR | 8/16/12 | — | (7,403 | ) | |||||||||||||||||||||||
Singapore Dollar | BZWS | Buy | 4,886,000 | 3,880,858 | 8/17/12 | — | (24,448 | ) | ||||||||||||||||||||||||
Singapore Dollar | HSBC | Buy | 7,334,000 | 5,803,363 | 8/17/12 | — | (14,802 | ) | ||||||||||||||||||||||||
Euro | BZWS | Sell | 19,627,000 | 28,201,112 | 8/20/12 | 3,348,965 | — | |||||||||||||||||||||||||
Euro | FBCO | Sell | 7,851,000 | 11,275,606 | 8/20/12 | 1,334,494 | — | |||||||||||||||||||||||||
TGB-17
Franklin Templeton Variable Insurance Products Trust
Statement of Investments, June 30, 2012 (unaudited) (continued)
| Templeton Global Bond Securities Fund |
Forward Exchange Contracts (continued)
| Currency | Counterparty | Type | Quantity | Contract Amount* | Settlement Date | Unrealized Appreciation | Unrealized Depreciation | |||||||||||||||||||||||||
Euro | DBAB | Sell | 7,851,000 | 11,258,098 | 8/20/12 | $ | 1,316,987 | $ | — | |||||||||||||||||||||||
Euro | MSCO | Sell | 3,925,000 | 5,631,786 | 8/20/12 | 661,863 | — | |||||||||||||||||||||||||
Japanese Yen | UBSW | Sell | 758,781,000 | 9,947,313 | 8/20/12 | 454,261 | — | |||||||||||||||||||||||||
Japanese Yen | JPHQ | Sell | 377,047,000 | 4,932,265 | 8/20/12 | 215,058 | — | |||||||||||||||||||||||||
Japanese Yen | DBAB | Sell | 461,885,000 | 6,045,536 | 8/20/12 | 266,928 | — | |||||||||||||||||||||||||
Japanese Yen | HSBC | Sell | 1,621,372,000 | 21,274,729 | 8/20/12 | 989,867 | — | |||||||||||||||||||||||||
Japanese Yen | BZWS | Sell | 376,247,000 | 4,942,165 | 8/22/12 | 234,836 | — | |||||||||||||||||||||||||
Japanese Yen | MSCO | Sell | 300,000,000 | 3,940,421 | 8/22/12 | 187,039 | — | |||||||||||||||||||||||||
Japanese Yen | DBAB | Sell | 376,727,000 | 4,947,885 | 8/22/12 | 234,551 | — | |||||||||||||||||||||||||
Euro | BZWS | Sell | 1,002,141 | 1,441,079 | 8/23/12 | 172,103 | — | |||||||||||||||||||||||||
Japanese Yen | FBCO | Sell | 746,218,000 | 9,807,044 | 8/23/12 | 470,778 | — | |||||||||||||||||||||||||
Japanese Yen | CITI | Sell | 751,731,000 | 9,896,406 | 8/23/12 | 491,164 | — | |||||||||||||||||||||||||
Japanese Yen | DBAB | Sell | 371,821,000 | 4,902,929 | 8/23/12 | 250,911 | — | |||||||||||||||||||||||||
Singapore Dollar | DBAB | Buy | 4,765,000 | 3,798,780 | 8/23/12 | — | (37,846 | ) | ||||||||||||||||||||||||
Euro | BZWS | Sell | 1,678,784 | 2,408,384 | 8/24/12 | 282,575 | — | |||||||||||||||||||||||||
Indian Rupee | HSBC | Buy | 143,891,000 | 3,048,648 | 8/24/12 | — | (487,471 | ) | ||||||||||||||||||||||||
Indian Rupee | DBAB | Buy | 124,700,000 | 2,639,248 | 8/24/12 | — | (419,660 | ) | ||||||||||||||||||||||||
Japanese Yen | JPHQ | Sell | 750,133,000 | 9,833,296 | 8/24/12 | 447,917 | — | |||||||||||||||||||||||||
Malaysian Ringgit | HSBC | Buy | 1,223,000 | 389,851 | 8/24/12 | — | (5,555 | ) | ||||||||||||||||||||||||
Singapore Dollar | DBAB | Buy | 4,782,000 | 3,802,481 | 8/24/12 | — | (28,125 | ) | ||||||||||||||||||||||||
Euro | BZWS | Sell | 8,738,369 | 12,570,326 | 8/27/12 | 1,504,748 | — | |||||||||||||||||||||||||
Euro | HSBC | Sell | 18,537,726 | 26,609,988 | 8/27/12 | 3,135,279 | — | |||||||||||||||||||||||||
Japanese Yen | BZWS | Sell | 1,085,075,000 | 14,227,693 | 8/27/12 | 651,080 | — | |||||||||||||||||||||||||
Japanese Yen | DBAB | Sell | 685,950,000 | 9,026,608 | 8/27/12 | 443,904 | — | |||||||||||||||||||||||||
Japanese Yen | UBSW | Sell | 937,086,000 | 12,324,808 | 8/27/12 | 599,855 | — | |||||||||||||||||||||||||
Japanese Yen | JPHQ | Sell | 751,903,000 | 9,886,956 | 8/27/12 | 479,038 | — | |||||||||||||||||||||||||
Japanese Yen | HSBC | Sell | 1,247,125,000 | 16,361,102 | 8/27/12 | 756,896 | — | |||||||||||||||||||||||||
Malaysian Ringgit | JPHQ | Buy | 8,340,000 | 2,788,645 | 8/27/12 | — | (168,515 | ) | ||||||||||||||||||||||||
Malaysian Ringgit | HSBC | Buy | 2,087,700 | 661,921 | 8/27/12 | — | (6,041 | ) | ||||||||||||||||||||||||
Singapore Dollar | DBAB | Buy | 5,952,000 | 4,745,087 | 8/27/12 | — | (47,252 | ) | ||||||||||||||||||||||||
Swedish Krona | UBSW | Buy | 30,000,000 | 3,253,973 | EUR | 8/27/12 | 206,383 | — | ||||||||||||||||||||||||
United States Dollar | CITI | Buy | 7,760,297 | 5,387,112 | EUR | 8/27/12 | 938,484 | — | ||||||||||||||||||||||||
United States Dollar | UBSW | Buy | 16,993,151 | 11,812,119 | EUR | 8/27/12 | 2,035,218 | — | ||||||||||||||||||||||||
United States Dollar | JPHQ | Buy | 11,099,031 | 7,711,034 | EUR | 8/27/12 | 1,334,388 | — | ||||||||||||||||||||||||
Euro | JPHQ | Sell | 6,190,317 | 8,900,685 | 8/29/12 | 1,061,587 | — | |||||||||||||||||||||||||
Euro | DBAB | Sell | 1,011,997 | 1,448,775 | 8/29/12 | 167,234 | — | |||||||||||||||||||||||||
Japanese Yen | BZWS | Sell | 890,300,000 | 11,683,727 | 8/30/12 | 543,716 | — | |||||||||||||||||||||||||
Euro | DBAB | Sell | 46,315 | 66,985 | 8/31/12 | 8,333 | — | |||||||||||||||||||||||||
Japanese Yen | JPHQ | Sell | 372,662,000 | 4,883,848 | 8/31/12 | 220,797 | — | |||||||||||||||||||||||||
Singapore Dollar | DBAB | Buy | 2,980,000 | 2,371,101 | 8/31/12 | — | (18,995 | ) | ||||||||||||||||||||||||
Indian Rupee | DBAB | Buy | 217,594,000 | 3,808,019 | 9/04/12 | 57,069 | — | |||||||||||||||||||||||||
Indian Rupee | HSBC | Buy | 251,448,000 | 4,365,985 | 9/04/12 | 100,446 | — | |||||||||||||||||||||||||
Euro | DBAB | Sell | 541,000 | 767,582 | 9/06/12 | 82,429 | — | |||||||||||||||||||||||||
Indian Rupee | DBAB | Buy | 88,183,000 | 1,858,088 | 9/06/12 | — | (292,252 | ) | ||||||||||||||||||||||||
Indian Rupee | DBAB | Buy | 160,277,000 | 2,831,174 | 9/07/12 | 14,317 | — | |||||||||||||||||||||||||
Euro | BZWS | Sell | 1,033,224 | 1,450,750 | 9/10/12 | 142,161 | — | |||||||||||||||||||||||||
Euro | DBAB | Sell | 1,191,000 | 1,665,983 | 9/10/12 | 157,569 | — | |||||||||||||||||||||||||
Indian Rupee | HSBC | Buy | 42,784,000 | 756,358 | 9/10/12 | 2,815 | — | |||||||||||||||||||||||||
Euro | DBAB | Sell | 8,105,300 | 10,238,615 | 9/11/12 | — | (26,943 | ) | ||||||||||||||||||||||||
Indian Rupee | DBAB | Buy | 43,392,000 | 772,168 | 9/11/12 | — | (2,340 | ) | ||||||||||||||||||||||||
TGB-18
Franklin Templeton Variable Insurance Products Trust
Statement of Investments, June 30, 2012 (unaudited) (continued)
| Templeton Global Bond Securities Fund |
Forward Exchange Contracts (continued)
| Currency | Counterparty | Type | Quantity | Contract Amount* | Settlement Date | Unrealized Appreciation | Unrealized Depreciation | |||||||||||||||||||||||
Euro | BZWS | Sell | 1,012,110 | 1,414,930 | 9/12/12 | $ | 133,054 | $ | — | |||||||||||||||||||||
Euro | DBAB | Sell | 541,000 | 740,256 | 9/13/12 | 55,052 | — | |||||||||||||||||||||||
Indian Rupee | HSBC | Buy | 108,000,000 | 1,919,539 | 9/13/12 | — | (4,150 | ) | ||||||||||||||||||||||
Euro | BZWS | Sell | 2,890,070 | 3,953,110 | 9/14/12 | 292,649 | — | |||||||||||||||||||||||
Euro | UBSW | Sell | 2,694,506 | 3,693,359 | 9/17/12 | 280,484 | — | |||||||||||||||||||||||
Singapore Dollar | BZWS | Buy | 21,427,761 | 17,004,000 | 9/17/12 | — | (89,973 | ) | ||||||||||||||||||||||
Indian Rupee | DBAB | Buy | 108,614,000 | 1,910,738 | 9/18/12 | 13,869 | — | |||||||||||||||||||||||
Japanese Yen | BZWS | Sell | 285,057,504 | 3,677,924 | 9/18/12 | 110,202 | — | |||||||||||||||||||||||
Australian Dollar | CITI | Buy | 16,742,000 | 17,246,269 | 9/19/12 | — | (240,023 | ) | ||||||||||||||||||||||
Euro | BZWS | Sell | 678,250 | 940,190 | 9/19/12 | 81,097 | — | |||||||||||||||||||||||
Singapore Dollar | JPHQ | Buy | 11,426,000 | 9,021,713 | 9/19/12 | — | (2,515 | ) | ||||||||||||||||||||||
Indian Rupee | DBAB | Buy | 98,937,000 | 1,747,417 | 9/20/12 | 5,109 | — | |||||||||||||||||||||||
Australian Dollar | DBAB | Buy | 8,729,942 | 9,032,871 | 9/21/12 | (166,611 | ) | |||||||||||||||||||||||
Euro | DBAB | Sell | 8,070,000 | 11,027,953 | 9/24/12 | 805,685 | — | |||||||||||||||||||||||
Euro | BZWS | Sell | 1,647,381 | 2,241,295 | 9/24/12 | 154,557 | — | |||||||||||||||||||||||
Indian Rupee | JPHQ | Buy | 79,054,000 | 1,388,898 | 9/24/12 | 10,458 | — | |||||||||||||||||||||||
Philippine Peso | DBAB | Buy | 165,158,000 | 3,711,833 | 9/24/12 | 201,215 | — | |||||||||||||||||||||||
Indian Rupee | DBAB | Buy | 119,627,000 | 2,080,549 | 9/25/12 | 36,634 | — | |||||||||||||||||||||||
Euro | DBAB | Sell | 3,753,000 | 5,077,396 | 9/26/12 | 323,370 | — | |||||||||||||||||||||||
Malaysian Ringgit | HSBC | Buy | 11,490,000 | �� | 3,605,271 | 9/26/12 | — | (515 | ) | |||||||||||||||||||||
Malaysian Ringgit | DBAB | Buy | 3,068,000 | 961,349 | 9/26/12 | 1,175 | — | |||||||||||||||||||||||
South Korean Won | HSBC | Buy | 21,510,000,000 | 18,213,995 | 9/26/12 | 522,068 | — | |||||||||||||||||||||||
Indian Rupee | DBAB | Buy | 25,000,000 | 485,692 | 9/27/12 | — | (43,390 | ) | ||||||||||||||||||||||
Indian Rupee | HSBC | Buy | 80,337,000 | 1,394,159 | 9/27/12 | 27,169 | — | |||||||||||||||||||||||
Euro | DBAB | Sell | 14,880,000 | 20,050,113 | 9/28/12 | 1,200,761 | — | |||||||||||||||||||||||
Euro | HSBC | Sell | 5,430,000 | 7,294,553 | 9/28/12 | 416,060 | — | |||||||||||||||||||||||
Euro | FBCO | Sell | 12,170,000 | 16,453,565 | 9/28/12 | 1,037,126 | — | |||||||||||||||||||||||
Euro | MSCO | Sell | 4,020,000 | 5,461,472 | 9/28/12 | 369,106 | — | |||||||||||||||||||||||
Hungary Forint | DBAB | Buy | 1,517,800,000 | 6,921,755 | 9/28/12 | — | (291,041 | ) | ||||||||||||||||||||||
Japanese Yen | JPHQ | Sell | 172,207,000 | 2,268,867 | 9/28/12 | 113,264 | — | |||||||||||||||||||||||
Philippine Peso | HSBC | Buy | 49,600,000 | 1,134,648 | 9/28/12 | 40,209 | — | |||||||||||||||||||||||
Philippine Peso | HSBC | Buy | 39,700,000 | 904,431 | 10/03/12 | 35,607 | — | |||||||||||||||||||||||
Swedish Krona | DBAB | Buy | 445,104,500 | 65,202,332 | 10/03/12 | — | (1,078,698 | ) | ||||||||||||||||||||||
Philippine Peso | DBAB | Buy | 195,560,000 | 4,490,471 | 10/04/12 | 139,788 | — | |||||||||||||||||||||||
Philippine Peso | HSBC | Buy | 156,866,000 | 3,558,585 | 10/04/12 | 155,518 | — | |||||||||||||||||||||||
Euro | UBSW | Sell | 6,370,000 | 8,488,184 | 10/05/12 | 418,177 | — | |||||||||||||||||||||||
Philippine Peso | DBAB | Buy | 233,811,000 | 5,368,794 | 10/05/12 | 166,751 | — | |||||||||||||||||||||||
Philippine Peso | HSBC | Buy | 233,867,000 | 5,271,906 | 10/05/12 | 264,966 | — | |||||||||||||||||||||||
Euro | DBAB | Sell | 12,680,000 | 16,748,632 | 10/09/12 | 683,763 | — | |||||||||||||||||||||||
Philippine Peso | DBAB | Buy | 191,936,000 | 4,409,787 | 10/09/12 | 133,112 | — | |||||||||||||||||||||||
Philippine Peso | JPHQ | Buy | 61,767,000 | 1,416,025 | 10/09/12 | 45,928 | — | |||||||||||||||||||||||
Mexican Peso | DBAB | Buy | 259,112,000 | 19,607,861 | 10/11/12 | — | (386,219 | ) | ||||||||||||||||||||||
Philippine Peso | DBAB | Buy | 153,588,000 | 3,528,325 | 10/11/12 | 106,425 | — | |||||||||||||||||||||||
Philippine Peso | JPHQ | Buy | 76,627,000 | 1,756,694 | 10/11/12 | 56,729 | — | |||||||||||||||||||||||
Philippine Peso | HSBC | Buy | 230,704,000 | 5,304,638 | 10/11/12 | 155,108 | — | |||||||||||||||||||||||
Malaysian Ringgit | DBAB | Buy | 11,434,805 | 3,598,680 | 10/12/12 | — | (13,155 | ) | ||||||||||||||||||||||
Philippine Peso | DBAB | Buy | 45,732,000 | 1,047,698 | 10/12/12 | 34,503 | — | |||||||||||||||||||||||
Philippine Peso | JPHQ | Buy | 108,152,000 | 2,500,624 | 10/12/12 | 58,682 | — | |||||||||||||||||||||||
Malaysian Ringgit | DBAB | Buy | 4,934,783 | 1,552,893 | 10/15/12 | — | (5,682 | ) | ||||||||||||||||||||||
Philippine Peso | JPHQ | Buy | 194,374,000 | 4,458,552 | 10/15/12 | 140,166 | — | |||||||||||||||||||||||
TGB-19
Franklin Templeton Variable Insurance Products Trust
Statement of Investments, June 30, 2012 (unaudited) (continued)
| Templeton Global Bond Securities Fund |
Forward Exchange Contracts (continued)
| Currency | Counterparty | Type | Quantity | Contract Amount* | Settlement Date | Unrealized Appreciation | Unrealized Depreciation | |||||||||||||||||||||||||
Philippine Peso | HSBC | Buy | 76,252,000 | 1,747,496 | 10/15/12 | $ | 56,559 | $ | — | |||||||||||||||||||||||
Euro | HSBC | Sell | 12,569,000 | 17,260,839 | 10/17/12 | 1,334,882 | — | |||||||||||||||||||||||||
Norwegian Krone | BZWS | Buy | 61,773,000 | 7,840,706 | EUR | 10/18/12 | 398,402 | — | ||||||||||||||||||||||||
Philippine Peso | DBAB | Buy | 41,880,000 | 959,011 | 10/19/12 | 31,562 | — | |||||||||||||||||||||||||
Philippine Peso | HSBC | Buy | 154,149,000 | 3,574,801 | 10/19/12 | 71,232 | — | |||||||||||||||||||||||||
Philippine Peso | DBAB | Buy | �� | 167,411,000 | 3,834,425 | 10/22/12 | 124,478 | — | ||||||||||||||||||||||||
Philippine Peso | JPHQ | Buy | 84,061,000 | 1,935,551 | 10/22/12 | 52,307 | — | |||||||||||||||||||||||||
Chilean Peso | CITI | Buy | 921,291,798 | 1,731,752 | 10/24/12 | 79,426 | — | |||||||||||||||||||||||||
Euro | BZWS | Sell | 649,907 | 893,037 | 10/24/12 | 69,474 | — | |||||||||||||||||||||||||
Euro | BZWS | Sell | 4,954,399 | 6,873,733 | 10/25/12 | 595,425 | — | |||||||||||||||||||||||||
Euro | CITI | Sell | 1,935,410 | 2,694,420 | 10/26/12 | 241,798 | — | |||||||||||||||||||||||||
Chilean Peso | BZWS | Buy | 199,342,000 | 382,028 | 10/29/12 | 9,630 | — | |||||||||||||||||||||||||
Chilean Peso | DBAB | Buy | 398,486,000 | 763,749 | 10/29/12 | 19,177 | — | |||||||||||||||||||||||||
Indian Rupee | HSBC | Buy | 213,392,000 | 4,137,549 | 10/29/12 | — | (380,577 | ) | ||||||||||||||||||||||||
Indian Rupee | DBAB | Buy | 208,500,000 | 4,036,434 | 10/29/12 | — | (365,592 | ) | ||||||||||||||||||||||||
Norwegian Krone | BZWS | Buy | 61,766,000 | 7,904,530 | EUR | 10/29/12 | 310,691 | — | ||||||||||||||||||||||||
Philippine Peso | JPHQ | Buy | 82,631,000 | 1,919,821 | 10/29/12 | 33,287 | — | |||||||||||||||||||||||||
Philippine Peso | MSCO | Buy | 17,610,000 | 407,639 | 10/29/12 | 8,600 | — | |||||||||||||||||||||||||
Euro | DBAB | Sell | 3,319,244 | 4,679,503 | 10/31/12 | 472,954 | — | |||||||||||||||||||||||||
Indian Rupee | DBAB | Buy | 440,314,000 | 8,559,792 | 10/31/12 | — | (809,999 | ) | ||||||||||||||||||||||||
Indian Rupee | HSBC | Buy | 317,880,000 | 6,178,426 | 10/31/12 | — | (583,545 | ) | ||||||||||||||||||||||||
Euro | DBAB | Sell | 224,556 | 312,344 | 11/02/12 | 27,752 | — | |||||||||||||||||||||||||
Euro | BZWS | Sell | 1,581,109 | 2,179,717 | 11/05/12 | 175,808 | — | |||||||||||||||||||||||||
Euro | BZWS | Sell | 8,969,211 | 12,334,011 | 11/08/12 | 965,909 | — | |||||||||||||||||||||||||
Japanese Yen | CITI | Sell | 341,992,119 | 4,415,023 | 11/08/12 | 131,018 | — | |||||||||||||||||||||||||
Norwegian Krone | UBSW | Buy | 47,173,200 | 5,985,687 | EUR | 11/08/12 | 298,405 | — | ||||||||||||||||||||||||
Japanese Yen | BZWS | Sell | 335,950,000 | 4,355,069 | 11/13/12 | 146,378 | — | |||||||||||||||||||||||||
Japanese Yen | BZWS | Sell | 429,663,000 | 5,572,802 | 11/14/12 | 190,004 | — | |||||||||||||||||||||||||
Japanese Yen | UBSW | Sell | 340,600,700 | 4,423,099 | 11/14/12 | 156,069 | — | |||||||||||||||||||||||||
Philippine Peso | DBAB | Buy | 48,500,000 | 1,121,647 | 11/14/12 | 23,473 | — | |||||||||||||||||||||||||
Euro | BZWS | Sell | 10,778,730 | 14,705,960 | 11/15/12 | 1,043,078 | — | |||||||||||||||||||||||||
Japanese Yen | DBAB | Sell | 796,770,000 | 10,433,980 | 11/16/12 | 451,728 | — | |||||||||||||||||||||||||
Euro | UBSW | Sell | 4,794,427 | 6,515,147 | 11/19/12 | 437,508 | — | |||||||||||||||||||||||||
Euro | BZWS | Sell | 3,019,521 | 4,139,310 | 11/19/12 | 311,625 | — | |||||||||||||||||||||||||
Euro | DBAB | Sell | 933,877 | 1,266,617 | 11/19/12 | 82,791 | — | |||||||||||||||||||||||||
Japanese Yen | JPHQ | Sell | 397,873,000 | 5,207,421 | 11/19/12 | 222,444 | — | |||||||||||||||||||||||||
Japanese Yen | HSBC | Sell | 207,909,000 | 2,723,818 | 11/19/12 | 118,912 | — | |||||||||||||||||||||||||
Japanese Yen | UBSW | Sell | 317,836,000 | 4,168,341 | 11/19/12 | 186,153 | — | |||||||||||||||||||||||||
Japanese Yen | BZWS | Sell | 986,239,000 | 12,942,769 | 11/19/12 | 586,117 | — | |||||||||||||||||||||||||
Euro | BZWS | Sell | 10,515,154 | 14,269,064 | 11/21/12 | 939,206 | — | |||||||||||||||||||||||||
Japanese Yen | BZWS | Sell | 1,107,834,000 | 14,557,608 | 11/21/12 | 676,992 | — | |||||||||||||||||||||||||
Euro | BZWS | Sell | 4,730,771 | 6,421,075 | 11/23/12 | 423,806 | — | |||||||||||||||||||||||||
Malaysian Ringgit | HSBC | Buy | 1,229,300 | 389,870 | 11/26/12 | — | (4,972 | ) | ||||||||||||||||||||||||
Euro | DBAB | Sell | 837,570 | 1,055,547 | 11/29/12 | — | (6,338 | ) | ||||||||||||||||||||||||
Euro | DBAB | Sell | 5,440,000 | 7,321,696 | 12/03/12 | 424,396 | — | |||||||||||||||||||||||||
Euro | UBSW | Sell | 1,057,200 | 1,320,020 | 12/07/12 | — | (20,462 | ) | ||||||||||||||||||||||||
Euro | HSBC | Sell | 2,155,292 | 2,897,574 | 12/07/12 | 164,762 | — | |||||||||||||||||||||||||
Euro | UBSW | Sell | 1,343,551 | 1,798,948 | 12/10/12 | 95,317 | — | |||||||||||||||||||||||||
Euro | BZWS | Sell | 5,095,000 | 6,861,437 | 12/12/12 | 400,772 | — | |||||||||||||||||||||||||
Swedish Krona | MSCO | Buy | 21,992,000 | 2,466,024 | EUR | 12/14/12 | 34,334 | — | ||||||||||||||||||||||||
TGB-20
Franklin Templeton Variable Insurance Products Trust
Statement of Investments, June 30, 2012 (unaudited) (continued)
| Templeton Global Bond Securities Fund |
Forward Exchange Contracts (continued)
| Currency | Counterparty | Type | Quantity | Contract Amount* | Settlement Date | Unrealized Appreciation | Unrealized Depreciation | |||||||||||||||||||||||||
Malaysian Ringgit | JPHQ | Buy | 13,361,013 | 4,138,330 | 12/17/12 | $ | 42,192 | $ | — | |||||||||||||||||||||||
Japanese Yen | JPHQ | Sell | 285,510,329 | 3,694,970 | 12/27/12 | 115,378 | — | |||||||||||||||||||||||||
Euro | DBAB | Sell | 2,285,618 | 2,971,738 | 1/07/13 | 72,437 | — | |||||||||||||||||||||||||
Japanese Yen | DBAB | Sell | 770,370,000 | 10,132,981 | 1/07/13 | 472,571 | — | |||||||||||||||||||||||||
Swedish Krona | DBAB | Buy | 136,332,733 | 15,072,885 | EUR | 1/09/13 | 463,498 | — | ||||||||||||||||||||||||
Euro | CITI | Sell | 5,040,000 | 6,455,232 | 1/10/13 | 61,732 | — | |||||||||||||||||||||||||
Japanese Yen | CITI | Sell | 138,680,000 | 1,817,801 | 1/10/13 | 78,666 | — | |||||||||||||||||||||||||
Euro | UBSW | Sell | 13,846,000 | 17,710,419 | 1/11/13 | 145,801 | — | |||||||||||||||||||||||||
Euro | BZWS | Sell | 1,726,000 | 2,208,503 | 1/11/13 | 18,952 | — | |||||||||||||||||||||||||
Japanese Yen | UBSW | Sell | 138,650,000 | 1,816,574 | 1/11/13 | 77,785 | — | |||||||||||||||||||||||||
Japanese Yen | BZWS | Sell | 277,330,000 | 3,636,161 | 1/11/13 | 158,207 | — | |||||||||||||||||||||||||
Chilean Peso | MSCO | Buy | 2,254,600,000 | 4,282,241 | 1/14/13 | 109,808 | — | |||||||||||||||||||||||||
Euro | DBAB | Sell | 9,460,000 | 12,147,586 | 1/14/13 | 146,401 | — | |||||||||||||||||||||||||
Euro | JPHQ | Sell | 937,000 | 1,195,097 | 1/14/13 | 6,396 | — | |||||||||||||||||||||||||
Japanese Yen | HSBC | Sell | 536,380,000 | 7,016,275 | 1/15/13 | 289,137 | — | |||||||||||||||||||||||||
Japanese Yen | DBAB | Sell | 139,110,000 | 1,822,720 | 1/15/13 | 78,039 | — | |||||||||||||||||||||||||
Japanese Yen | BZWS | Sell | 394,150,000 | 5,155,995 | 1/15/13 | 212,669 | — | |||||||||||||||||||||||||
Japanese Yen | UBSW | Sell | 313,510,000 | 4,098,599 | 1/15/13 | 166,638 | — | |||||||||||||||||||||||||
Euro | DBAB | Sell | 4,856,000 | 6,190,429 | 1/17/13 | 29,726 | — | |||||||||||||||||||||||||
Philippine Peso | DBAB | Buy | 41,372,000 | 944,609 | 1/22/13 | 28,186 | — | |||||||||||||||||||||||||
Philippine Peso | JPHQ | Buy | 165,119,000 | 3,774,321 | 1/22/13 | 108,183 | — | |||||||||||||||||||||||||
Chilean Peso | DBAB | Buy | 2,227,910,000 | 4,372,309 | 1/24/13 | — | (36,195 | ) | ||||||||||||||||||||||||
Chilean Peso | DBAB | Buy | 3,160,140,000 | 6,228,629 | 1/25/13 | — | (78,702 | ) | ||||||||||||||||||||||||
Chilean Peso | DBAB | Buy | 1,967,720,000 | 3,888,467 | 1/28/13 | — | (60,144 | ) | ||||||||||||||||||||||||
Euro | CITI | Sell | 4,998,400 | 6,496,071 | 1/28/13 | 153,711 | — | |||||||||||||||||||||||||
Japanese Yen | BZWS | Sell | 1,079,470,000 | 13,980,961 | 1/28/13 | 439,415 | — | |||||||||||||||||||||||||
Japanese Yen | DBAB | Sell | 897,860,782 | 11,614,224 | 1/28/13 | 350,897 | — | |||||||||||||||||||||||||
Japanese Yen | UBSW | Sell | 944,420,000 | 12,212,064 | 1/28/13 | 364,670 | — | |||||||||||||||||||||||||
Japanese Yen | HSBC | Sell | 1,162,462,488 | 15,025,301 | 1/28/13 | 442,645 | — | |||||||||||||||||||||||||
Philippine Peso | HSBC | Buy | 154,149,000 | 3,555,589 | 1/28/13 | 67,951 | — | |||||||||||||||||||||||||
Chilean Peso | DBAB | Buy | 635,690,000 | 1,256,255 | 1/29/13 | — | (19,592 | ) | ||||||||||||||||||||||||
Chilean Peso | JPHQ | Buy | 675,370,000 | 1,331,434 | 1/30/13 | — | (17,698 | ) | ||||||||||||||||||||||||
Chilean Peso | DBAB | Buy | 1,271,380,000 | 2,489,241 | 1/30/13 | — | (16,140 | ) | ||||||||||||||||||||||||
Chilean Peso | DBAB | Buy | 1,186,400,000 | 2,319,453 | 1/31/13 | — | (11,865 | ) | ||||||||||||||||||||||||
Euro | DBAB | Sell | 31,205,000 | 41,000,250 | 1/31/13 | 1,403,215 | — | |||||||||||||||||||||||||
Philippine Peso | DBAB | Buy | 128,745,000 | 2,983,662 | 1/31/13 | 42,286 | — | |||||||||||||||||||||||||
Euro | UBSW | Sell | 5,540,000 | 7,266,264 | 2/01/13 | 236,278 | — | |||||||||||||||||||||||||
Chilean Peso | MSCO | Buy | 1,963,430,000 | 3,895,496 | 2/04/13 | — | (77,945 | ) | ||||||||||||||||||||||||
Philippine Peso | DBAB | Buy | 155,800,000 | 3,620,393 | 2/04/13 | 40,751 | — | |||||||||||||||||||||||||
Philippine Peso | HSBC | Buy | 99,500,000 | 2,313,200 | 2/04/13 | 24,950 | — | |||||||||||||||||||||||||
Indian Rupee | JPHQ | Buy | 21,500,000 | 414,827 | 2/06/13 | — | (41,849 | ) | ||||||||||||||||||||||||
Philippine Peso | HSBC | Buy | 84,800,000 | 1,970,535 | 2/06/13 | 21,993 | — | |||||||||||||||||||||||||
Philippine Peso | JPHQ | Buy | 60,500,000 | 1,408,287 | 2/07/13 | 13,202 | — | |||||||||||||||||||||||||
Singapore Dollar | DBAB | Buy | 6,207,000 | 4,999,597 | 2/07/13 | — | (93,125 | ) | ||||||||||||||||||||||||
Singapore Dollar | HSBC | Buy | 6,206,000 | 4,996,779 | 2/07/13 | — | (91,097 | ) | ||||||||||||||||||||||||
Euro | UBSW | Sell | 4,929,000 | 6,444,175 | 2/08/13 | 188,892 | — | |||||||||||||||||||||||||
Euro | CITI | Sell | 6,572,000 | 8,595,650 | 2/08/13 | 255,273 | — | |||||||||||||||||||||||||
Euro | HSBC | Sell | 1,800,000 | 2,355,858 | 2/08/13 | 71,519 | — | |||||||||||||||||||||||||
Singapore Dollar | DBAB | Buy | 12,363,000 | 9,948,339 | 2/08/13 | — | (175,607 | ) | ||||||||||||||||||||||||
Chilean Peso | DBAB | Buy | 1,145,000,000 | 2,306,143 | 2/11/13 | — | (81,301 | ) | ||||||||||||||||||||||||
TGB-21
Franklin Templeton Variable Insurance Products Trust
Statement of Investments, June 30, 2012 (unaudited) (continued)
| Templeton Global Bond Securities Fund |
Forward Exchange Contracts (continued)
| Currency | Counterparty | Type | Quantity | Contract Amount* | Settlement Date | Unrealized Appreciation | Unrealized Depreciation | |||||||||||||||||||||||||
Chilean Peso | MSCO | Buy | 964,250,000 | 1,951,923 | 2/11/13 | $ | — | $ | (78,295 | ) | ||||||||||||||||||||||
Euro | DBAB | Sell | 28,210,000 | 37,280,037 | 2/11/13 | 1,477,827 | — | |||||||||||||||||||||||||
Euro | JPHQ | Sell | 300,000 | 397,358 | 2/11/13 | 16,618 | — | |||||||||||||||||||||||||
Euro | BZWS | Sell | 1,412,000 | 1,873,724 | 2/11/13 | 81,710 | — | |||||||||||||||||||||||||
Polish Zloty | DBAB | Buy | 17,528,000 | 4,057,877 | EUR | 2/11/13 | — | (17,317 | ) | |||||||||||||||||||||||
Polish Zloty | BZWS | Buy | 17,528,000 | 4,052,717 | EUR | 2/11/13 | — | (10,768 | ) | |||||||||||||||||||||||
Japanese Yen | HSBC | Sell | 413,563,000 | 5,406,052 | 2/12/13 | 216,681 | — | |||||||||||||||||||||||||
Japanese Yen | MSCO | Sell | 394,373,000 | 5,153,417 | 2/12/13 | 204,841 | — | |||||||||||||||||||||||||
Chilean Peso | MSCO | Buy | 2,590,220,000 | 5,248,673 | 2/13/13 | — | (216,546 | ) | ||||||||||||||||||||||||
Chilean Peso | BZWS | Buy | 1,142,900,000 | 2,305,628 | 2/13/13 | — | (85,270 | ) | ||||||||||||||||||||||||
Euro | UBSW | Sell | 657,000 | 874,290 | 2/13/13 | 40,446 | — | |||||||||||||||||||||||||
Singapore Dollar | BZWS | Buy | 1,717,028 | 1,383,919 | 2/13/13 | — | (26,569 | ) | ||||||||||||||||||||||||
Euro | DBAB | Sell | 1,738,000 | 2,296,246 | 2/14/13 | 90,400 | — | |||||||||||||||||||||||||
Malaysian Ringgit | DBAB | Buy | 97,443,480 | 31,832,831 | 2/14/13 | — | (1,388,668 | ) | ||||||||||||||||||||||||
Polish Zloty | DBAB | Buy | 17,528,000 | 4,026,463 | EUR | 2/14/13 | 20,983 | — | ||||||||||||||||||||||||
Singapore Dollar | HSBC | Buy | 10,521,600 | 8,478,324 | 2/14/13 | — | (160,671 | ) | ||||||||||||||||||||||||
Chilean Peso | DBAB | Buy | 2,188,820,000 | 4,399,461 | 2/15/13 | — | (147,922 | ) | ||||||||||||||||||||||||
Japanese Yen | DBAB | Sell | 123,057,280 | 1,593,470 | 2/15/13 | 49,270 | — | |||||||||||||||||||||||||
Japanese Yen | JPHQ | Sell | 144,920,000 | 1,877,932 | 2/15/13 | 59,385 | — | |||||||||||||||||||||||||
Euro | UBSW | Sell | 1,971,000 | 2,603,395 | 2/19/13 | 101,650 | — | |||||||||||||||||||||||||
Euro | JPHQ | Sell | 1,971,000 | 2,601,326 | 2/19/13 | 99,581 | — | |||||||||||||||||||||||||
Malaysian Ringgit | HSBC | Buy | 4,899,000 | 1,590,275 | 2/19/13 | — | (59,866 | ) | ||||||||||||||||||||||||
Singapore Dollar | DBAB | Buy | 7,334,000 | 5,843,825 | 2/19/13 | — | (45,770 | ) | ||||||||||||||||||||||||
Chilean Peso | JPHQ | Buy | 1,055,800,000 | 2,137,247 | 2/21/13 | — | (87,588 | ) | ||||||||||||||||||||||||
Euro | UBSW | Sell | 2,038,000 | 2,694,603 | 2/21/13 | 107,742 | — | |||||||||||||||||||||||||
Chilean Peso | JPHQ | Buy | 1,792,000,000 | 3,587,588 | 2/22/13 | — | (109,034 | ) | ||||||||||||||||||||||||
Japanese Yen | HSBC | Sell | 385,460,000 | 4,891,624 | 2/22/13 | 54,031 | — | |||||||||||||||||||||||||
Chilean Peso | CITI | Buy | 2,285,090,000 | 4,587,613 | 2/25/13 | — | (153,099 | ) | ||||||||||||||||||||||||
Chilean Peso | MSCO | Buy | 2,254,540,000 | 4,501,428 | 2/25/13 | — | (126,200 | ) | ||||||||||||||||||||||||
Chilean Peso | DBAB | Buy | 1,455,470,000 | 2,902,233 | 2/25/13 | — | (77,705 | ) | ||||||||||||||||||||||||
Japanese Yen | JPHQ | Sell | 385,700,000 | 4,865,342 | 2/25/13 | 24,480 | — | |||||||||||||||||||||||||
Chilean Peso | DBAB | Buy | 1,435,490,000 | 2,842,329 | 2/26/13 | — | (56,827 | ) | ||||||||||||||||||||||||
Chilean Peso | MSCO | Buy | 1,559,200,000 | 3,118,400 | 2/27/13 | — | (93,118 | ) | ||||||||||||||||||||||||
Chilean Peso | DBAB | Buy | 2,094,920,000 | 4,164,023 | 2/28/13 | — | (99,663 | ) | ||||||||||||||||||||||||
Chilean Peso | JPHQ | Buy | 593,800,000 | 1,184,284 | 2/28/13 | — | (32,251 | ) | ||||||||||||||||||||||||
Euro | DBAB | Sell | 1,530,900 | 2,059,581 | 2/28/13 | 116,195 | — | |||||||||||||||||||||||||
Singapore Dollar | DBAB | Buy | 2,980,000 | 2,376,585 | 2/28/13 | — | (20,462 | ) | ||||||||||||||||||||||||
Chilean Peso | BZWS | Buy | 3,010,700,000 | 6,047,240 | 3/01/13 | — | (206,702 | ) | ||||||||||||||||||||||||
Chilean Peso | DBAB | Buy | 790,050,000 | 1,575,217 | 3/01/13 | — | (42,578 | ) | ||||||||||||||||||||||||
Euro | DBAB | Sell | 2,579,651 | 3,473,500 | 3/01/13 | 198,740 | — | |||||||||||||||||||||||||
Japanese Yen | HSBC | Sell | 400,800,000 | 5,012,663 | 3/01/13 | — | (18,074 | ) | ||||||||||||||||||||||||
Japanese Yen | JPHQ | Sell | 401,100,000 | 5,020,025 | 3/01/13 | — | (14,477 | ) | ||||||||||||||||||||||||
Chilean Peso | DBAB | Buy | 1,253,970,000 | 2,504,934 | 3/04/13 | — | (72,984 | ) | ||||||||||||||||||||||||
Japanese Yen | UBSW | Sell | 447,200,000 | 5,579,712 | 3/04/13 | — | (33,723 | ) | ||||||||||||||||||||||||
Euro | DBAB | Sell | 1,536,000 | 2,051,405 | 3/05/13 | 101,405 | — | |||||||||||||||||||||||||
Chilean Peso | DBAB | Buy | 1,253,970,000 | 2,521,810 | 3/06/13 | — | (90,300 | ) | ||||||||||||||||||||||||
Chilean Peso | DBAB | Buy | 1,328,230,000 | 2,671,420 | 3/07/13 | — | (96,150 | ) | ||||||||||||||||||||||||
Euro | BZWS | Sell | 3,441,044 | 4,564,545 | 3/07/13 | 195,908 | — | |||||||||||||||||||||||||
Chilean Peso | DBAB | Buy | 1,320,220,000 | 2,629,920 | 3/08/13 | — | (70,412 | ) | ||||||||||||||||||||||||
Euro | MSCO | Sell | 5,225,000 | 6,874,559 | 3/08/13 | 240,974 | — | |||||||||||||||||||||||||
TGB-22
Franklin Templeton Variable Insurance Products Trust
Statement of Investments, June 30, 2012 (unaudited) (continued)
| Templeton Global Bond Securities Fund |
Forward Exchange Contracts (continued)
| Currency | Counterparty | Type | Quantity | Contract Amount* | Settlement Date | Unrealized Appreciation | Unrealized Depreciation | |||||||||||||||||||||||
Euro | HSBC | Sell | 1,844,000 | 2,428,087 | 3/08/13 | $ | 86,971 | $ | — | |||||||||||||||||||||
Euro | CITI | Sell | 31,404,613 | 41,303,033 | 3/08/13 | 1,432,190 | — | |||||||||||||||||||||||
Euro | DBAB | Sell | 21,480,000 | 28,273,909 | 3/08/13 | 1,003,212 | — | |||||||||||||||||||||||
Mexican Peso | HSBC | Buy | 135,500,950 | 10,103,190 | 3/08/13 | — | (175,944 | ) | ||||||||||||||||||||||
Chilean Peso | MSCO | Buy | 662,100,000 | 1,294,428 | 3/11/13 | — | (11,164 | ) | ||||||||||||||||||||||
Euro | BZWS | Sell | 3,785,232 | 4,977,202 | 3/11/13 | 171,320 | — | |||||||||||||||||||||||
Singapore Dollar | CITI | Buy | 21,075,381 | 16,733,000 | 3/11/13 | — | (67,954 | ) | ||||||||||||||||||||||
Chilean Peso | DBAB | Buy | 1,284,460,000 | 2,521,021 | 3/13/13 | — | (31,966 | ) | ||||||||||||||||||||||
Euro | BZWS | Sell | 1,161,439 | 1,524,273 | 3/15/13 | 49,579 | — | |||||||||||||||||||||||
Japanese Yen | CITI | Sell | 286,112,008 | 3,474,763 | 3/15/13 | — | (117,331 | ) | ||||||||||||||||||||||
Chilean Peso | DBAB | Buy | 2,600,220,000 | 5,142,840 | 3/18/13 | — | (106,355 | ) | ||||||||||||||||||||||
Euro | CITI | Sell | 861,168 | 1,130,826 | 3/19/13 | 37,327 | — | |||||||||||||||||||||||
Japanese Yen | MSCO | Sell | 575,230,000 | 6,940,377 | 3/19/13 | — | (282,062 | ) | ||||||||||||||||||||||
Japanese Yen | CITI | Sell | 407,702,000 | 4,906,161 | 3/19/13 | — | (212,840 | ) | ||||||||||||||||||||||
Singapore Dollar | HSBC | Buy | 9,120,000 | 7,216,903 | 3/19/13 | — | (4,802 | ) | ||||||||||||||||||||||
Singapore Dollar | DBAB | Buy | 7,978,100 | 6,300,324 | 3/19/13 | 8,762 | — | |||||||||||||||||||||||
Chilean Peso | JPHQ | Buy | 1,065,000,000 | 2,134,269 | 3/21/13 | — | (71,980 | ) | ||||||||||||||||||||||
Euro | BZWS | Sell | 744,197 | 987,847 | 3/21/13 | 42,850 | — | |||||||||||||||||||||||
Singapore Dollar | DBAB | Buy | 8,589,700 | 6,848,748 | 3/21/13 | — | (55,869 | ) | ||||||||||||||||||||||
Singapore Dollar | HSBC | Buy | 6,864,000 | 5,471,939 | 3/21/13 | — | (43,772 | ) | ||||||||||||||||||||||
Japanese Yen | BZWS | Sell | 242,774,840 | 2,918,598 | 3/25/13 | — | (129,944 | ) | ||||||||||||||||||||||
Euro | DBAB | Sell | 2,736,000 | 3,609,058 | 3/26/13 | 134,577 | — | |||||||||||||||||||||||
Euro | CITI | Sell | 1,532,964 | 2,022,531 | 3/26/13 | 75,801 | — | |||||||||||||||||||||||
Malaysian Ringgit | DBAB | Buy | 16,025,000 | 5,123,821 | 3/26/13 | — | (121,870 | ) | ||||||||||||||||||||||
Malaysian Ringgit | HSBC | Buy | 7,634,000 | 2,442,177 | 3/26/13 | — | (59,344 | ) | ||||||||||||||||||||||
Singapore Dollar | FBCO | Buy | 10,578,000 | 8,407,248 | 3/26/13 | — | (41,556 | ) | ||||||||||||||||||||||
Singapore Dollar | MSCO | Buy | 10,570,700 | 8,356,285 | 3/26/13 | 3,635 | — | |||||||||||||||||||||||
Chilean Peso | DBAB | Buy | 1,252,750,000 | 2,474,812 | 3/29/13 | — | (50,682 | ) | ||||||||||||||||||||||
Chilean Peso | DBAB | Buy | 1,330,940,000 | 2,619,445 | 4/03/13 | — | (45,121 | ) | ||||||||||||||||||||||
Euro | DBAB | Sell | 6,200,000 | 8,281,092 | 4/04/13 | 406,577 | — | |||||||||||||||||||||||
Euro | HSBC | Sell | 8,692,000 | 11,450,841 | 4/10/13 | 410,289 | — | |||||||||||||||||||||||
Euro | UBSW | Sell | 4,346,000 | 5,697,910 | 4/11/13 | 177,552 | — | |||||||||||||||||||||||
Euro | DBAB | Sell | 7,243,000 | 9,500,353 | 4/11/13 | 300,180 | — | |||||||||||||||||||||||
Euro | JPHQ | Sell | 3,907,000 | 5,129,696 | 4/12/13 | 166,888 | — | |||||||||||||||||||||||
Indian Rupee | DBAB | Buy | 159,915,000 | 2,944,133 | 4/12/13 | — | (195,000 | ) | ||||||||||||||||||||||
Chilean Peso | MSCO | Buy | 2,645,530,000 | 5,215,436 | 4/15/13 | — | (103,685 | ) | ||||||||||||||||||||||
Indian Rupee | DBAB | Buy | 342,913,000 | 6,270,466 | 4/15/13 | — | (377,731 | ) | ||||||||||||||||||||||
Euro | HSBC | Sell | 6,919,000 | 9,154,010 | 4/16/13 | 364,730 | — | |||||||||||||||||||||||
Indian Rupee | JPHQ | Buy | 230,330,000 | 4,224,533 | 4/16/13 | — | (266,990 | ) | ||||||||||||||||||||||
Indian Rupee | JPHQ | Buy | 226,092,000 | 4,132,629 | 4/18/13 | — | (248,938 | ) | ||||||||||||||||||||||
Chilean Peso | MSCO | Buy | 2,370,410,000 | 4,677,210 | 4/19/13 | — | (98,624 | ) | ||||||||||||||||||||||
Malaysian Ringgit | JPHQ | Buy | 4,069,213 | 1,307,000 | 4/19/13 | — | (37,863 | ) | ||||||||||||||||||||||
Indian Rupee | JPHQ | Buy | 112,941,000 | 2,069,407 | 4/22/13 | — | (130,398 | ) | ||||||||||||||||||||||
Indian Rupee | DBAB | Buy | 79,271,000 | 1,450,614 | 4/22/13 | — | (89,663 | ) | ||||||||||||||||||||||
Japanese Yen | CITI | Sell | 261,800,000 | 3,238,255 | 4/22/13 | — | (51,203 | ) | ||||||||||||||||||||||
Japanese Yen | BZWS | Sell | 261,900,000 | 3,240,535 | 4/22/13 | — | (50,181 | ) | ||||||||||||||||||||||
Euro | DBAB | Sell | 4,545,000 | 5,997,128 | 4/23/13 | 222,961 | — | |||||||||||||||||||||||
Malaysian Ringgit | JPHQ | Buy | 11,659,000 | 3,741,416 | 4/23/13 | — | (105,597 | ) | ||||||||||||||||||||||
Indian Rupee | DBAB | Buy | 160,601,000 | 2,864,754 | 4/26/13 | — | (108,969 | ) | ||||||||||||||||||||||
Chilean Peso | CITI | Buy | 2,420,966,000 | 4,793,992 | 4/29/13 | — | (121,766 | ) | ||||||||||||||||||||||
TGB-23
Franklin Templeton Variable Insurance Products Trust
Statement of Investments, June 30, 2012 (unaudited) (continued)
| Templeton Global Bond Securities Fund |
Forward Exchange Contracts (continued)
| Currency | Counterparty | Type | Quantity | Contract Amount* | Settlement Date | Unrealized Appreciation | Unrealized Depreciation | |||||||||||||||||||||||||
Chilean Peso | JPHQ | Buy | 1,501,938,000 | 2,965,912 | 4/29/13 | $ | — | $ | (67,320 | ) | ||||||||||||||||||||||
Indian Rupee | JPHQ | Buy | 136,582,000 | 2,450,561 | 4/29/13 | — | (107,856 | ) | ||||||||||||||||||||||||
Euro | BZWS | Sell | 6,575,679 | 8,734,474 | 4/30/13 | 379,572 | — | |||||||||||||||||||||||||
Indian Rupee | JPHQ | Buy | 113,782,000 | 2,037,388 | 4/30/13 | — | (86,017 | ) | ||||||||||||||||||||||||
Indian Rupee | DBAB | Buy | 71,377,981 | 1,277,184 | 4/30/13 | — | (53,046 | ) | ||||||||||||||||||||||||
Swedish Krona | BZWS | Buy | 122,773,200 | 13,605,940 | EUR | 4/30/13 | 296,464 | — | ||||||||||||||||||||||||
Euro | FBCO | Sell | 1,731,000 | 2,285,526 | 5/07/13 | 85,928 | — | |||||||||||||||||||||||||
Euro | BZWS | Sell | 1,259,000 | 1,664,209 | 5/07/13 | 64,386 | — | |||||||||||||||||||||||||
Euro | MSCO | Sell | 1,259,000 | 1,661,930 | 5/07/13 | 62,107 | — | |||||||||||||||||||||||||
Euro | DBAB | Sell | 2,045,000 | 2,695,351 | 5/08/13 | 96,711 | — | |||||||||||||||||||||||||
Euro | UBSW | Sell | 629,000 | 820,987 | 5/10/13 | 21,675 | — | |||||||||||||||||||||||||
Euro | DBAB | Sell | 1,259,000 | 1,643,184 | 5/10/13 | 43,289 | — | |||||||||||||||||||||||||
Japanese Yen | CITI | Sell | 733,721,000 | 9,247,923 | 5/10/13 | 25,222 | — | |||||||||||||||||||||||||
Chilean Peso | MSCO | Buy | 1,150,200,000 | 2,250,220 | 5/13/13 | — | (33,110 | ) | ||||||||||||||||||||||||
Euro | CITI | Sell | 5,658,426 | 7,373,382 | 5/13/13 | 182,522 | — | |||||||||||||||||||||||||
Japanese Yen | UBSW | Sell | 366,681,000 | 4,636,983 | 5/13/13 | 27,583 | — | |||||||||||||||||||||||||
Japanese Yen | DBAB | Sell | 490,555,000 | 6,201,707 | 5/13/13 | 35,137 | — | |||||||||||||||||||||||||
Japanese Yen | CITI | Sell | 366,680,000 | 4,613,923 | 5/14/13 | 4,434 | — | |||||||||||||||||||||||||
Euro | BZWS | Sell | 2,270,980 | 2,929,110 | 5/16/13 | 42,966 | — | |||||||||||||||||||||||||
Euro | DBAB | Sell | 1,812,000 | 2,323,618 | 5/20/13 | 20,646 | — | |||||||||||||||||||||||||
Euro | BZWS | Sell | 7,956,126 | 10,174,038 | 5/21/13 | 61,999 | — | |||||||||||||||||||||||||
Euro | DBAB | Sell | 2,642,000 | 3,368,814 | 5/21/13 | 10,898 | — | |||||||||||||||||||||||||
Chilean Peso | MSCO | Buy | 420,740,000 | 804,474 | 5/22/13 | 5,914 | — | |||||||||||||||||||||||||
Euro | BZWS | Sell | 3,419,406 | 4,377,866 | 5/22/13 | 31,820 | — | |||||||||||||||||||||||||
Malaysian Ringgit | HSBC | Buy | 298,500 | 93,568 | 5/22/13 | — | (570 | ) | ||||||||||||||||||||||||
Euro | BZWS | Sell | 2,836,669 | 3,594,485 | 5/29/13 | — | (11,282 | ) | ||||||||||||||||||||||||
Euro | DBAB | Sell | 463,000 | 586,042 | 5/29/13 | — | (2,490 | ) | ||||||||||||||||||||||||
Euro | BZWS | Sell | 4,907,308 | 6,102,238 | 6/05/13 | — | (136,228 | ) | ||||||||||||||||||||||||
Euro | DBAB | Sell | 785,200 | 976,734 | 6/05/13 | — | (21,460 | ) | ||||||||||||||||||||||||
Euro | BZWS | Sell | 2,203,083 | 2,756,718 | 6/06/13 | — | (44,016 | ) | ||||||||||||||||||||||||
Euro | DBAB | Sell | 2,033,100 | 2,544,628 | 6/07/13 | — | (40,048 | ) | ||||||||||||||||||||||||
Euro | DBAB | Sell | 8,105,300 | 10,281,573 | 6/11/13 | — | (23,297 | ) | ||||||||||||||||||||||||
Polish Zloty | CITI | Buy | 5,990,000 | 1,327,218 | EUR | 6/11/13 | 49,700 | — | ||||||||||||||||||||||||
Polish Zloty | DBAB | Buy | 30,704,000 | 6,820,838 | EUR | 6/11/13 | 232,273 | — | ||||||||||||||||||||||||
Swedish Krona | MSCO | Buy | 55,369,800 | 6,068,987 | EUR | 6/11/13 | 205,401 | — | ||||||||||||||||||||||||
Swedish Krona | DBAB | Buy | 41,300,000 | 4,543,554 | EUR | 6/11/13 | 131,933 | — | ||||||||||||||||||||||||
Euro | DBAB | Sell | 8,383,000 | 10,574,484 | 6/13/13 | — | (83,764 | ) | ||||||||||||||||||||||||
Swedish Krona | MSCO | Buy | 27,990,100 | 3,073,741 | EUR | 6/13/13 | 96,136 | — | ||||||||||||||||||||||||
Swedish Krona | BZWS | Buy | 24,372,000 | 2,707,398 | EUR | 6/13/13 | 44,321 | — | ||||||||||||||||||||||||
Japanese Yen | CITI | Sell | 310,702,000 | 3,930,002 | 6/14/13 | 21,530 | — | |||||||||||||||||||||||||
Euro | BZWS | Sell | 1,124,367 | 1,422,774 | 6/20/13 | — | (6,908 | ) | ||||||||||||||||||||||||
South Korean Won | DBAB | Buy | 21,440,000,000 | 18,216,577 | 6/27/13 | 286,269 | — | |||||||||||||||||||||||||
Malaysian Ringgit | JPHQ | Buy | 14,772,000 | 4,561,653 | 6/28/13 | 34,956 | — | |||||||||||||||||||||||||
Swedish Krona | UBSW | Buy | 302,991,000 | 33,837,108 | EUR | 6/28/13 | 296,625 | — | ||||||||||||||||||||||||
|
| |||||||||||||||||||||||||||||||
Unrealized appreciation (depreciation) |
| 78,068,001 | (18,393,991 | ) | ||||||||||||||||||||||||||||
|
| |||||||||||||||||||||||||||||||
Net unrealized appreciation (depreciation) |
| $ | 59,674,010 | |||||||||||||||||||||||||||||
|
| |||||||||||||||||||||||||||||||
*In U.S. dollars unless otherwise indicated.
TGB-24
Franklin Templeton Variable Insurance Products Trust
Statement of Investments, June 30, 2012 (unaudited) (continued)
| Templeton Global Bond Securities Fund |
At June 30, 2012, the Fund had the following interest rate swap contracts outstanding. See Note 1(d).
Interest Rate Swap Contracts
| Counterparty | Pay/Receive Floating Rate | Fixed Rate | Floating Rate | Notional Amount* | Expiration Date | Unrealized Appreciation | Unrealized Depreciation | |||||||||||||||||||
JPHQ | Receive | 3.558% | 3-month USD BBA LIBOR | 3,240,000 | 3/4/21 | $ | — | $ | (555,955 | ) | ||||||||||||||||
DBAB | Receive | 3.523% | 3-month USD BBA LIBOR | 14,630,000 | 3/28/21 | — | (2,447,165 | ) | ||||||||||||||||||
CITI | Receive | 4.347% | 3-month USD BBA LIBOR | 7,460,000 | 2/25/41 | — | (3,024,127 | ) | ||||||||||||||||||
JPHQ | Receive | 4.349% | 3-month USD BBA LIBOR | 7,460,000 | 2/25/41 | — | (3,028,361 | ) | ||||||||||||||||||
JPHQ | Receive | 4.320% | 3-month USD BBA LIBOR | 5,600,000 | 2/28/41 | — | (2,248,336 | ) | ||||||||||||||||||
JPHQ | Receive | 4.299% | 3-month USD BBA LIBOR | 1,870,000 | 3/1/41 | — | (738,662 | ) | ||||||||||||||||||
|
| |||||||||||||||||||||||||
Net unrealized appreciation (depreciation) |
| $ | — | $ | (12,042,606 | ) | ||||||||||||||||||||
|
| |||||||||||||||||||||||||
*In U.S. Dollars unless otherwise indicated.
The accompanying notes are an integral part of these financial statements.
TGB-25
Franklin Templeton Variable Insurance Products Trust
Financial Statements
Statement of Assets and Liabilities
June 30, 2012 (unaudited)
| Templeton Global Bond Securities Fund | ||||
Assets: | ||||
Investments in securities: | ||||
Cost - Unaffiliated issuers | $ | 2,213,430,739 | ||
Cost - Repurchase agreements | 327,773,318 | |||
|
| |||
Total cost of investments | $ | 2,541,204,057 | ||
|
| |||
Value - Unaffiliated issuers | $ | 2,234,596,333 | ||
Value - Repurchase agreements | 327,773,318 | |||
|
| |||
Total value of investments | 2,562,369,651 | |||
Cash | 870,000 | |||
Restricted cash (Note 1e) | 26,438,000 | |||
Foreign currency, at value (cost $31,250,335) | 32,229,987 | |||
Receivables: | ||||
Investment securities sold | 30,819,928 | |||
Capital shares sold | 1,881,493 | |||
Interest | 30,750,300 | |||
Due from brokers | 4,730,000 | |||
Unrealized appreciation on forward exchange contracts | 78,068,001 | |||
Other assets | 613 | |||
|
| |||
Total assets | 2,768,157,973 | |||
|
| |||
Liabilities: | ||||
Payables: | ||||
Investment securities purchased | 1,194,055 | |||
Capital shares redeemed | 2,472,775 | |||
Affiliates | 1,987,834 | |||
Due to brokers | 27,308,000 | |||
Unrealized depreciation on forward exchange contracts | 18,393,991 | |||
Unrealized depreciation on swap contracts | 12,042,606 | |||
Deferred tax | 4,216,921 | |||
Accrued expenses and other liabilities | 1,270,937 | |||
|
| |||
Total liabilities | 68,887,119 | |||
|
| |||
Net assets, at value | $ | 2,699,270,854 | ||
|
| |||
Net assets consist of: | ||||
Paid-in capital | $ | 2,588,531,966 | ||
Distributions in excess of net investment income | (8,849,902 | ) | ||
Net unrealized appreciation (depreciation) | 64,632,872 | |||
Accumulated net realized gain (loss) | 54,955,918 | |||
|
| |||
Net assets, at value | $ | 2,699,270,854 | ||
|
| |||
The accompanying notes are an integral part of these financial statements.
TGB-26
Franklin Templeton Variable Insurance Products Trust
Financial Statements (continued)
Statement of Assets and Liabilities (continued)
June 30, 2012 (unaudited)
| Templeton Global Bond Securities Fund | ||||
Class 1: | ||||
Net assets, at value | $ | 275,838,402 | ||
|
| |||
Shares outstanding | 15,057,922 | |||
|
| |||
Net asset value and maximum offering price per share | $ | 18.32 | ||
|
| |||
Class 2: | ||||
Net assets, at value | $ | 2,078,658,372 | ||
|
| |||
Shares outstanding | 116,453,606 | |||
|
| |||
Net asset value and maximum offering price per share | $ | 17.85 | ||
|
| |||
Class 3: | ||||
Net assets, at value | $ | 187,645,267 | ||
|
| |||
Shares outstanding | 10,508,556 | |||
|
| |||
Net asset value and maximum offering price per sharea | $ | 17.86 | ||
|
| |||
Class 4: | ||||
Net assets, at value | $ | 157,128,813 | ||
|
| |||
Shares outstanding | 8,643,925 | |||
|
| |||
Net asset value and maximum offering price per share | $ | 18.18 | ||
|
| |||
aRedemption price is equal to net asset value less redemption fees retained by the Fund.
The accompanying notes are an integral part of these financial statements.
TGB-27
Franklin Templeton Variable Insurance Products Trust
Financial Statements (continued)
Statement of Operations
for the six months ended June 30, 2012 (unaudited)
| Templeton Global Bond Securities Fund | ||||
Investment income: | ||||
Interest (net of foreign taxes of $1,393,167) | $ | 56,930,626 | ||
|
| |||
Expenses: | ||||
Management fees (Note 3a) | 5,964,836 | |||
Distribution fees: (Note 3c) | ||||
Class 2 | 2,468,418 | |||
Class 3 | 237,804 | |||
Class 4 | 274,577 | |||
Unaffiliated transfer agent fees | 2,165 | |||
Custodian fees (Note 4) | 892,420 | |||
Reports to shareholders | 189,007 | |||
Professional fees | 37,427 | |||
Trustees’ fees and expenses | 4,512 | |||
Other | 24,080 | |||
|
| |||
Total expenses | 10,095,246 | |||
|
| |||
Net investment income | 46,835,380 | |||
|
| |||
Realized and unrealized gains (losses): | ||||
Net realized gain (loss) from: | ||||
Investments | 37,853,334 | |||
Foreign currency transactions | 15,515,422 | |||
Swap contracts | 1,673,450 | |||
|
| |||
Net realized gain (loss) | 55,042,206 | |||
|
| |||
Net change in unrealized appreciation (depreciation) on: | ||||
Investments | (16,816,799 | ) | ||
Translation of other assets and liabilities denominated in foreign currencies | 46,199,837 | |||
Change in deferred taxes on unrealized appreciation | 1,180,177 | |||
|
| |||
Net change in unrealized appreciation (depreciation) | 30,563,215 | |||
|
| |||
Net realized and unrealized gain (loss) | 85,605,421 | |||
|
| |||
Net increase (decrease) in net assets resulting from operations | $ | 132,440,801 | ||
|
| |||
The accompanying notes are an integral part of these financial statements.
TGB-28
Franklin Templeton Variable Insurance Products Trust
Financial Statements (continued)
Statements of Changes in Net Assets
| Templeton Global Bond Securities Fund | ||||||||
| Six Months Ended June 30, 2012 (unaudited) | Year Ended December 31, 2011 | |||||||
| ||||||||
Increase (decrease) in net assets: | ||||||||
Operations: | ||||||||
Net investment income | $ | 46,835,380 | $ | 96,874,837 | ||||
Net realized gain (loss) from investments and foreign currency transactions, futures contracts and swap contracts | 55,042,206 | 52,604,567 | ||||||
Net change in unrealized appreciation (depreciation) on investments, translation of other assets and liabilities denominated in foreign currencies and deferred taxes | 30,563,215 | (180,068,912 | ) | |||||
| ||||||||
Net increase (decrease) in net assets resulting from operations | 132,440,801 | (30,589,508 | ) | |||||
| ||||||||
Distributions to shareholders from: | ||||||||
Net investment income: | ||||||||
Class 1 | (18,014,760 | ) | (15,683,467 | ) | ||||
Class 2 | (133,749,946 | ) | (93,946,669 | ) | ||||
Class 3 | (12,114,860 | ) | (10,753,201 | ) | ||||
Class 4 | (9,763,141 | ) | (8,615,701 | ) | ||||
Net realized gains: | ||||||||
Class 1 | (438,387 | ) | (1,762,080 | ) | ||||
Class 2 | (3,357,784 | ) | (10,925,216 | ) | ||||
Class 3 | (306,543 | ) | (1,252,885 | ) | ||||
Class 4 | (251,144 | ) | (1,020,280 | ) | ||||
| ||||||||
Total distributions to shareholders | (177,996,565 | ) | (143,959,499 | ) | ||||
| ||||||||
Capital share transactions: (Note 2) | ||||||||
Class 1 | 9,781,672 | 17,171,380 | ||||||
Class 2 | 303,278,145 | 451,366,379 | ||||||
Class 3 | 4,271,029 | 16,706,473 | ||||||
Class 4 | 7,356,340 | 12,126,720 | ||||||
| ||||||||
Total capital share transactions | 324,687,186 | 497,370,952 | ||||||
| ||||||||
Redemption fees | 1,873 | 18,113 | ||||||
| ||||||||
Net increase (decrease) in net assets | 279,133,295 | 322,840,058 | ||||||
Net assets: | ||||||||
Beginning of period | 2,420,137,559 | 2,097,297,501 | ||||||
| ||||||||
End of period | $ | 2,699,270,854 | $ | 2,420,137,559 | ||||
| ||||||||
Undistributed net investment income (distributions in excess of net investment income) included in net assets: | ||||||||
End of period | $ | (8,849,902 | ) | $ | 117,957,425 | |||
| ||||||||
The accompanying notes are an integral part of these financial statements.
TGB-29
Franklin Templeton Variable Insurance Products Trust
Notes to Financial Statements (unaudited)
Templeton Global Bond Securities Fund
1. ORGANIZATION AND SIGNIFICANT ACCOUNTING POLICIES
Franklin Templeton Variable Insurance Products Trust (Trust) is registered under the Investment Company Act of 1940, as amended, (1940 Act) as an open-end investment company, consisting of twenty separate funds. The Templeton Global Bond Securities Fund (Fund) is included in this report. The financial statements of the remaining funds in the Trust are presented separately. Shares of the Fund are generally sold only to insurance company separate accounts to fund the benefits of variable life insurance policies or variable annuity contracts. The Fund offers four classes of shares: Class 1, Class 2, Class 3, and Class 4. Each class of shares differs by its distribution fees, voting rights on matters affecting a single class and its exchange privilege.
The following summarizes the Fund’s significant accounting policies.
a. Financial Instrument Valuation
The Fund’s investments in financial instruments are carried at fair value daily. Fair value is the price that would be received to sell an asset or paid to transfer a liability in an orderly transaction between market participants on the measurement date. Under procedures approved by the Trust’s Board of Trustees (the Board), the Fund’s administrator, investment manager and other affiliates have formed the Valuation and Liquidity Oversight Committee (VLOC). The VLOC provides administration and oversight of the Fund’s valuation policies and procedures, which are approved annually by the Board. Among other things, these procedures allow the Fund to utilize independent pricing services, quotations from securities and financial instrument dealers, and other market sources to determine fair value.
Debt securities generally trade in the over-the-counter (OTC) market rather than on a securities exchange. The Fund’s pricing services use multiple valuation techniques to determine fair value. In instances where sufficient market activity exists, the pricing services may utilize a market-based approach through which quotes from market makers are used to determine fair value. In instances where sufficient market activity may not exist or is limited, the pricing services also utilize proprietary valuation models which may consider market characteristics such as benchmark yield curves, credit spreads, estimated default rates, anticipated market interest rate volatility, coupon rates, anticipated timing of principal repayments, underlying collateral, and other unique security features in order to estimate the relevant cash flows, which are then discounted to calculate the fair value. Securities denominated in a foreign currency are converted into their U.S. dollar equivalent at the foreign exchange rate in effect at the close of the NYSE on the date that the values of the foreign debt securities are determined. Repurchase agreements are valued at cost, which approximates market value.
Certain derivative financial instruments (derivatives) trade in the OTC market. The Fund’s pricing services use various techniques including industry standard option pricing models and proprietary discounted cash flow models to determine the fair value of those instruments. The Fund’s net benefit or obligation under the derivative contract, as measured by the fair market value of the contract, is included in net assets.
The Fund has procedures to determine the fair value of financial instruments for which market prices are not reliable or readily available. Under these procedures, the VLOC convenes on a regular basis to review such financial instruments and considers a number of factors, including significant unobservable valuation inputs, when arriving at fair value. The VLOC primarily employs a market-based approach which may use related or comparable assets or liabilities, recent transactions, market multiples, book values, and other relevant information for the investment to determine the fair value of the investment. An income-based valuation approach may also be used in which the anticipated future cash flows of the investment are discounted to calculate fair value. Discounts may also be applied due to the nature or duration of any restrictions on the disposition of the investments. Due to the inherent uncertainty of valuations of such investments, the fair values may differ significantly from the values that would have been used had an active market existed. The VLOC employs various methods for calibrating these valuation approaches including a regular review of key inputs and assumptions, transactional back-testing or disposition analysis, and reviews of any related market activity.
TGB-30
Franklin Templeton Variable Insurance Products Trust
Notes to Financial Statements (unaudited) (continued)
Templeton Global Bond Securities Fund
1. ORGANIZATION AND SIGNIFICANT ACCOUNTING POLICIES (continued)
a. Financial Instrument Valuation (continued)
Trading in securities on foreign securities stock exchanges and OTC markets may be completed before the daily close of business on the NYSE. Occasionally, events occur between the time at which trading in a foreign security is completed and the close of the NYSE that might call into question the reliability of the value of a portfolio security held by the Fund. As a result, differences may arise between the value of the Fund’s portfolio securities as determined at the foreign market close and the latest indications of value at the close of the NYSE. In order to minimize the potential for these differences, the VLOC monitors price movements following the close of trading in foreign stock markets through a series of country specific market proxies (such as baskets of American Depositary Receipts, futures contracts and exchange traded funds). These price movements are measured against established trigger thresholds for each specific market proxy to assist in determining if an event has occurred that may call into question the reliability of the values of the foreign securities held by the Fund. If such an event occurs, the securities may be valued using fair value procedures, which may include the use of independent pricing services.
b. Foreign Currency Translation
Portfolio securities and other assets and liabilities denominated in foreign currencies are translated into U.S. dollars based on the exchange rate of such currencies against U.S. dollars on the date of valuation. The Fund may enter into foreign currency exchange contracts to facilitate transactions denominated in a foreign currency. Purchases and sales of securities, income and expense items denominated in foreign currencies are translated into U.S. dollars at the exchange rate in effect on the transaction date. Portfolio securities and assets and liabilities denominated in foreign currencies contain risks that those currencies will decline in value relative to the U.S. dollar. Occasionally, events may impact the availability or reliability of foreign exchange rates used to convert the U.S. dollar equivalent value. If such an event occurs, the foreign exchange rate will be valued at fair value using procedures established and approved by the Board.
The Fund does not separately report the effect of changes in foreign exchange rates from changes in market prices on securities held. Such changes are included in net realized and unrealized gain or loss from investments on the Statement of Operations.
Realized foreign exchange gains or losses arise from sales of foreign currencies, currency gains or losses realized between the trade and settlement dates on securities transactions and the difference between the recorded amounts of dividends, interest, and foreign withholding taxes and the U.S. dollar equivalent of the amounts actually received or paid. Net unrealized foreign exchange gains and losses arise from changes in foreign exchange rates on foreign denominated assets and liabilities other than investments in securities held at the end of the reporting period.
c. Joint Repurchase Agreement
The Fund enters into a joint repurchase agreement whereby its uninvested cash balance is deposited into a joint cash account with other funds managed by the investment manager or an affiliate of the investment manager and is used to invest in one or more repurchase agreements. The value and face amount of the joint repurchase agreement are allocated to the funds based on their pro-rata interest. A repurchase agreement is accounted for as a loan by the fund to the seller, collateralized by securities which are delivered to the fund’s custodian. The market value, including accrued interest, of the initial collateralization is required to be at least 102% of the dollar amount invested by the funds, with the value of the underlying securities marked to market daily to maintain coverage of at least 100%. The joint repurchase agreement held by the Fund at period end had been entered into on June 29, 2012.
d. Derivative Financial Instruments
The Fund invested in derivatives in order to manage risk or gain exposure to various other investments or markets. Derivatives are financial contracts based on an underlying or notional amount, require no initial investment or an initial net investment that
TGB-31
Franklin Templeton Variable Insurance Products Trust
Notes to Financial Statements (unaudited) (continued)
Templeton Global Bond Securities Fund
1. ORGANIZATION AND SIGNIFICANT ACCOUNTING POLICIES (continued)
d. Derivative Financial Instruments (continued)
is smaller than would normally be required to have a similar response to changes in market factors, and require or permit net settlement. Derivatives contain various risks including the potential inability of the counterparty to fulfill their obligations under the terms of the contract, the potential for an illiquid secondary market, and/or the potential for market movements which expose the Fund to gains or losses in excess of the amounts shown on the Statement of Assets and Liabilities. Realized gain and loss and unrealized appreciation and depreciation on these contracts for the period are included in the Statement of Operations.
The Fund entered into OTC futures contracts primarily to manage interest rate and/or exposure to certain foreign currencies risk. A futures contract is an agreement between the Fund and a counterparty to buy or sell an asset for a specified price on a future date. Required initial margin deposits of cash or securities are pledged by the Fund. Subsequent payments, known as variation margin, are made or received by the Fund, depending on fluctuations in the value of the underlying security. Such variation margin is accounted for as unrealized appreciation or depreciation until the contract is closed, at which time the gains or losses are realized.
The Fund entered into OTC forward exchange contracts primarily to manage and/or gain exposure to certain foreign currencies. A forward exchange contract is an agreement between the Fund and a counterparty to buy or sell a foreign currency for a specific exchange rate on a future date. Pursuant to the terms of the forward exchange contracts, cash or securities may be required to be deposited as collateral. Unrestricted cash may be invested according to the Fund’s investment objectives.
The Fund entered into OTC interest rate swap contracts primarily to manage interest rate risk. An interest rate swap is an agreement between the Fund and a counterparty to exchange cash flows based on the difference between two interest rates, applied to a notional principal amount. Over the term of the contract, contractually required payments to be paid and to be received are accrued daily and recorded as unrealized depreciation and appreciation until the payments are made, at which time they are realized. Pursuant to the terms of the interest rate swap contract, cash or securities may be required to be deposited as collateral. Unrestricted cash may be invested according to the Fund’s investment objectives.
The Fund’s investments in OTC derivatives are subject to the terms of International Swaps and Derivatives Association Master Agreements and other related agreements between the Fund and certain derivative counterparties. These agreements contain various provisions, including but not limited to collateral requirements, events of default, requirements for the Fund to maintain certain net asset levels and/or limit the decline in net assets over various periods of time. Should the Fund fail to meet any of these provisions, the derivative counterparty has the right to terminate the derivative contract and require immediate payment by the Fund for those OTC derivatives with that particular counterparty that are in a net unrealized loss position. At June 30, 2012, the Fund had OTC derivatives in a net unrealized loss position of $3,369,521 and the aggregate value of collateral pledged for such contracts was $4,730,000.
At June 30, 2012, the Fund held $29,062,831 in United Kingdom treasury bonds and notes, and U.S. treasury bills, bonds, and notes, and $870,000 in unrestricted cash as collateral for derivatives.
See Note 9 regarding other derivative information.
e. Restricted Cash
At June 30, 2012, the Fund held restricted cash in connection with investments in certain derivative securities. Restricted cash is held in a segregated account with the Fund’s custodian/counterparty broker and is reflected in the Statement of Assets and Liabilities.
TGB-32
Franklin Templeton Variable Insurance Products Trust
Notes to Financial Statements (unaudited) (continued)
Templeton Global Bond Securities Fund
1. ORGANIZATION AND SIGNIFICANT ACCOUNTING POLICIES (continued)
f. Income and Deferred Taxes
It is the Fund’s policy to qualify as a regulated investment company under the Internal Revenue Code. The Fund intends to distribute to shareholders substantially all of its taxable income and net realized gains to relieve it from federal income and if applicable, excise taxes. As a result, no provision for U.S. federal income taxes is required.
The Fund may be subject to foreign taxation related to income received, capital gains on the sale of securities and certain foreign currency transactions in the foreign jurisdictions in which it invests. Foreign taxes, if any, are recorded based on the tax regulations and rates that exist in the foreign markets in which the Fund invests. When a capital gain tax is determined to apply the Fund records an estimated deferred tax liability in an amount that would be payable if the securities were disposed of on the valuation date.
The Fund recognizes the tax benefits of uncertain tax positions only when the position is “more likely than not” to be sustained upon examination by the tax authorities based on the technical merits of the tax position. As of June 30, 2012, and for all open tax years, the Fund has determined that no liability for unrecognized tax benefits is required in the Fund’s financial statements related to uncertain tax positions taken on a tax return (or expected to be taken on future tax returns). Open tax years are those that remain subject to examination and are based on each tax jurisdiction statute of limitation.
g. Security Transactions, Investment Income, Expenses and Distributions
Security transactions are accounted for on trade date. Realized gains and losses on security transactions are determined on a specific identification basis. Interest income and estimated expenses are accrued daily. Amortization of premium and accretion of discount on debt securities are included in interest income. Distributions to shareholders are recorded on the ex-dividend date and are determined according to income tax regulations (tax basis). Distributable earnings determined on a tax basis may differ from earnings recorded in accordance with accounting principles generally accepted in the United States of America. These differences may be permanent or temporary. Permanent differences are reclassified among capital accounts to reflect their tax character. These reclassifications have no impact on net assets or the results of operations. Temporary differences are not reclassified, as they may reverse in subsequent periods.
Common expenses incurred by the Trust are allocated among the funds based on the ratio of net assets of each fund to the combined net assets of the Trust. Fund specific expenses are charged directly to the fund that incurred the expense.
Realized and unrealized gains and losses and net investment income, not including class specific expenses, are allocated daily to each class of shares based upon the relative proportion of net assets of each class. Differences in per share distributions, by class, are generally due to differences in class specific expenses.
Inflation-indexed bonds are adjusted for inflation through periodic increases or decreases in the security’s interest accruals, face amount, or principal redemption value, by amounts corresponding to the rate of inflation as measured by an index. Any increase or decrease in the face amount or principal redemption value will be included as interest income on the Statement of Operations.
h. Accounting Estimates
The preparation of financial statements in accordance with accounting principles generally accepted in the United States of America requires management to make estimates and assumptions that affect the reported amounts of assets and liabilities at the date of the financial statements and the amounts of income and expenses during the reporting period. Actual results could differ from those estimates.
TGB-33
Franklin Templeton Variable Insurance Products Trust
Notes to Financial Statements (unaudited) (continued)
Templeton Global Bond Securities Fund
1. ORGANIZATION AND SIGNIFICANT ACCOUNTING POLICIES (continued)
i. Redemption Fees
Redemptions and exchanges of interests in an insurance company subaccount that invests in Class 3 shares of the Fund will be subject to a 1.0% short term trading fee if the interest in the subaccount has been held for less than 60 days. Such fees are retained by the Fund and accounted for as an addition to paid-in capital, allocated to each class of shares based upon the relative proportion of net assets of each class.
j. Guarantees and Indemnifications
Under the Trust’s organizational documents, its officers and trustees are indemnified by the Trust against certain liabilities arising out of the performance of their duties to the Trust. Additionally, in the normal course of business, the Trust, on behalf of the Fund, enters into contracts with service providers that contain general indemnification clauses. The Trust’s maximum exposure under these arrangements is unknown as this would involve future claims that may be made against the Trust that have not yet occurred. Currently, the Trust expects the risk of loss to be remote.
2. SHARES OF BENEFICIAL INTEREST
At June 30, 2012, there were an unlimited number of shares authorized (without par value). Transactions in the Fund’s shares were as follows:
| Six Months Ended June 30, 2012 | Year Ended December 31, 2011 | |||||||||||||||
| Class 1 Shares: | Shares | Amount | Shares | Amount | ||||||||||||
Shares sold | 1,288,275 | $ | 25,261,278 | 2,403,657 | $ | 47,343,365 | ||||||||||
Shares issued in reinvestment of distributions | 1,028,604 | 18,453,147 | 889,172 | 17,445,546 | ||||||||||||
Shares redeemed | (1,754,755 | ) | (33,932,753 | ) | (2,450,491 | ) | (47,617,531 | ) | ||||||||
| ||||||||||||||||
Net increase (decrease) | 562,124 | $ | 9,781,672 | 842,338 | $ | 17,171,380 | ||||||||||
| ||||||||||||||||
Class 2 Shares: | ||||||||||||||||
Shares sold | 14,810,451 | $ | 280,052,891 | 29,318,184 | $ | 564,580,203 | ||||||||||
Shares issued in reinvestment of distributions | 7,843,692 | 137,107,730 | 5,473,480 | 104,871,884 | ||||||||||||
Shares redeemed | (6,057,186 | ) | (113,882,476 | ) | (11,438,342 | ) | (218,085,708 | ) | ||||||||
| ||||||||||||||||
Net increase (decrease) | 16,596,957 | $ | 303,278,145 | 23,353,322 | $ | 451,366,379 | ||||||||||
| ||||||||||||||||
Class 3 Shares: | ||||||||||||||||
Shares sold | 423,619 | $ | 8,108,409 | 1,851,973 | $ | 36,090,442 | ||||||||||
Shares issued in reinvestment of distributions | 710,200 | 12,421,403 | 626,622 | 12,006,087 | ||||||||||||
Shares redeemed | (862,239 | ) | (16,258,783 | ) | (1,654,785 | ) | (31,390,056 | ) | ||||||||
| ||||||||||||||||
Net increase (decrease) | 271,580 | $ | 4,271,029 | 823,810 | $ | 16,706,473 | ||||||||||
| ||||||||||||||||
Class 4 Shares: | ||||||||||||||||
Shares sold | 524,460 | $ | 10,104,468 | 1,191,215 | $ | 23,562,082 | ||||||||||
Shares issued on reinvestment of distributions | 562,284 | 10,014,286 | 494,660 | 9,635,982 | ||||||||||||
Shares redeemed | (667,019 | ) | (12,762,414 | ) | (1,090,109 | ) | (21,071,344 | ) | ||||||||
| ||||||||||||||||
Net increase (decrease) | 419,725 | $ | 7,356,340 | 595,766 | $ | 12,126,720 | ||||||||||
| ||||||||||||||||
TGB-34
Franklin Templeton Variable Insurance Products Trust
Notes to Financial Statements (unaudited) (continued)
Templeton Global Bond Securities Fund
3. TRANSACTIONS WITH AFFILIATES
Franklin Resources, Inc. is the holding company for various subsidiaries that together are referred to as Franklin Templeton Investments. Certain officers and trustees of the Fund are also officers and/or directors of the following subsidiaries:
| Subsidiary | Affiliation | |
Franklin Advisers, Inc. (Advisers) | Investment manager | |
Franklin Templeton Services, LLC (FT Services) | Administrative manager | |
Franklin Templeton Distributors, Inc. (Distributors) | Principal underwriter | |
Franklin Templeton Investor Services, LLC (Investor Services) | Transfer agent |
a. Management Fees
The Fund pays an investment management fee to Advisers based on the average daily net assets of the Fund as follows:
| Annualized Fee Rate | Net Assets | |
| 0.625% | Up to and including $100 million | |
| 0.500% | Over $100 million, up to and including $250 million | |
| 0.450% | Over $250 million, up to and including $7.5 billion | |
| 0.440% | Over $7.5 billion, up to and including $10 billion | |
| 0.430% | Over $10 billion, up to and including $12.5 billion | |
| 0.420% | Over $12.5 billion, up to and including $15 billion | |
| 0.400% | In excess of $15 billion |
b. Administrative Fees
Under an agreement with Advisers, FT Services provides administrative services to the Fund. The fee is paid by Advisers based on average daily net assets, and is not an additional expense of the Fund.
c. Distribution Fees
The Board has adopted distribution plans for Class 2, Class 3, and Class 4 shares pursuant to Rule 12b-1 under the 1940 Act. Under the Fund’s compensation distribution plans, the Fund pays Distributors for costs incurred in connection with the servicing, sale and distribution of the Fund’s shares up to 0.25%, 0.35%, and 0.35% per year of its average daily net assets of Class 2, Class 3, and Class 4, respectively. The Board has agreed to limit the current rate to 0.25% per year for Class 3.
d. Transfer Agent Fees
Investor Services, under terms of an agreement, performs shareholder servicing for the Fund and is not paid by the Fund for the services.
4. EXPENSE OFFSET ARRANGEMENT
The Fund has entered into an arrangement with its custodian whereby credits realized as a result of uninvested cash balances are used to reduce a portion of the Fund’s custodian expenses. During the period ended June 30, 2012, there were no credits earned.
TGB-35
Franklin Templeton Variable Insurance Products Trust
Notes to Financial Statements (unaudited) (continued)
Templeton Global Bond Securities Fund
5. INCOME TAXES
At June 30, 2012, the cost of investments and net unrealized appreciation (depreciation) for income tax purposes were as follows:
Cost of investments | $ | 2,561,654,487 | ||
|
| |||
Unrealized appreciation | $ | 100,246,492 | ||
Unrealized depreciation | (99,531,328 | ) | ||
|
| |||
Net unrealized appreciation (depreciation) | $ | 715,164 | ||
|
| |||
Differences between income and/or capital gains as determined on a book basis and a tax basis are primarily due to differing treatments of foreign currency transactions, bond discounts and premiums, tax straddles, and inflation related adjustments on foreign securities.
6. INVESTMENT TRANSACTIONS
Purchases and sales of investments (excluding short term securities) for the period ended June 30, 2012, aggregated $640,583,662 and $596,190,508, respectively.
7. CREDIT RISK
At June 30, 2012, the Fund had 23.02% of its portfolio invested in high yield or other securities rated below investment grade. These securities may be more sensitive to economic conditions causing greater price volatility and are potentially subject to a greater risk of loss due to default than higher rated securities.
8. CONCENTRATION OF RISK
Investing in foreign securities may include certain risks and considerations not typically associated with investing in U.S. securities, such as fluctuating currency values and changing local and regional economic, political and social conditions, which may result in greater market volatility. In addition, certain foreign securities may not be as liquid as U.S. securities.
9. OTHER DERIVATIVE INFORMATION
At June 30, 2012, the Fund has invested in derivative contracts which are reflected on the Statement of Assets and Liabilities as follows:
| Asset Derivatives | Liability Derivatives | |||||||||||
| Derivative Contracts Not Accounted for as Hedging Instruments | Statement of Assets and Liabilities Location | Fair Value Amount | Statement of Assets and Liabilities Location | Fair Value Amount | ||||||||
Interest rate contracts | Unrealized appreciation on swap contracts | $ | — | Unrealized depreciation on swap contracts | $ | 12,042,606 | ||||||
Foreign exchange contracts | Unrealized appreciation on forward exchange contracts | 78,068,001 | Unrealized depreciation on forward exchange contracts | 18,393,991 | ||||||||
TGB-36
Franklin Templeton Variable Insurance Products Trust
Notes to Financial Statements (unaudited) (continued)
Templeton Global Bond Securities Fund
9. OTHER DERIVATIVE INFORMATION (continued)
For the period ended June 30, 2012, the effect of derivative contracts on the Fund’s Statement of Operations was as follows:
| Derivative Contracts Not Accounted for as Hedging Instruments | Statement of Operations Locations | Realized Gain (Loss) for the Period | Change in Unrealized Appreciation (Depreciation) for the Period | |||||||
Interest rate contracts | Net realized gain (loss) from swap contracts / Net change in unrealized appreciation (depreciation) on investments | $ | 1,186,164 | $ | 1,009,007 | |||||
Foreign exchange contracts | Net realized gain (loss) from foreign currency transactions / Net change in unrealized appreciation (depreciation) on translation of other assets and liabilities denominated in foreign currencies | 17,729,011 | 45,677,854 | |||||||
For the period ended June 30, 2012, the average month end market value of derivatives represented 3.84% of average month end net assets. The average month end number of open derivative contracts for the period was 455.
See Note 1(d) regarding derivative financial instruments.
10. CREDIT FACILITY
The Fund, together with other U.S. registered and foreign investment funds (collectively, Borrowers), managed by Franklin Templeton Investments, are borrowers in a joint syndicated senior unsecured credit facility totaling $1.5 billion (Global Credit Facility) which matures on January 18, 2013. This Global Credit Facility provides a source of funds to the Borrowers for temporary and emergency purposes, including the ability to meet future unanticipated or unusually large redemption requests.
Under the terms of the Global Credit Facility, the Fund shall, in addition to interest charged on any borrowings made by the Fund and other costs incurred by the Fund, pay its share of fees and expenses incurred in connection with the implementation and maintenance of the Global Credit Facility, based upon its relative share of the aggregate net assets of all of the Borrowers, including an annual commitment fee of 0.08% based upon the unused portion of the Global Credit Facility, which is reflected in other expenses on the Statement of Operations. During the period ended June 30, 2012, the Fund did not use the Global Credit Facility.
11. FAIR VALUE MEASUREMENTS
The Fund follows a fair value hierarchy that distinguishes between market data obtained from independent sources (observable inputs) and the Fund’s own market assumptions (unobservable inputs). These inputs are used in determining the value of the Fund’s financial instruments and are summarized in the following fair value hierarchy:
| • | Level 1 – quoted prices in active markets for identical financial instruments |
| • | Level 2 – other significant observable inputs (including quoted prices for similar financial instruments, interest rates, prepayment speed, credit risk, etc.) |
| • | Level 3 – significant unobservable inputs (including the Fund’s own assumptions in determining the fair value of financial instruments) |
The inputs or methodology used for valuing financial instruments are not an indication of the risk associated with investing in those financial instruments.
TGB-37
Franklin Templeton Variable Insurance Products Trust
Notes to Financial Statements (unaudited) (continued)
Templeton Global Bond Securities Fund
11. FAIR VALUE MEASUREMENTS (continued)
For movements between the levels within the fair value hierarchy, the Fund has adopted a policy of recognizing the transfers as of the date of the underlying event which caused the movement.
A summary of inputs used as of June 30, 2012, in valuing the Fund’s assets and liabilities carried at fair value, is as follows:
| Level 1 | Level 2 | Level 3 | Total | |||||||||||||
|
| |||||||||||||||
Assets: | ||||||||||||||||
Investments in Securities: | ||||||||||||||||
Foreign Government and Agency Securities | $ | — | $ | 1,932,345,030 | $ | — | $ | 1,932,345,030 | ||||||||
Municipal Bonds | — | 3,323,329 | — | 3,323,329 | ||||||||||||
Short Term Investments | — | 626,701,292 | — | 626,701,292 | ||||||||||||
|
| |||||||||||||||
Total Investments in Securities | $ | — | $ | 2,562,369,651 | $ | — | $ | 2,562,369,651 | ||||||||
|
| |||||||||||||||
Forward Exchange Contracts | — | 78,068,001 | — | 78,068,001 | ||||||||||||
Liabilities: | ||||||||||||||||
Swaps | — | 12,042,606 | — | 12,042,606 | ||||||||||||
Forward Exchange Contracts | — | 18,393,991 | — | 18,393,991 | ||||||||||||
12. NEW ACCOUNTING PRONOUNCEMENTS
In December 2011, the Financial Accounting Standards Board (FASB) issued Accounting Standards Update (ASU) No. 2011-11, Balance Sheet (Topic 210): Disclosures about Offsetting Assets and Liabilities. The amendments in the ASU enhance disclosures about offsetting of financial assets and liabilities to enable investors to understand the effect of these arrangements on a fund’s financial position. The ASU is effective for interim and annual reporting periods beginning on or after January 1, 2013. The Fund believes the adoption of this ASU will not have a material impact on its financial statements.
13. SUBSEQUENT EVENTS
The Fund has evaluated subsequent events through the issuance of the financial statements and determined that no events have occurred that require disclosure.
ABBREVIATIONS | ||||
| Counterparty | Currency | Selected Portfolio | ||
| BZWS - Barclays Bank PLC | AUD - Australian Dollar | BHAC - Berkshire Hathaway Assurance Corp. | ||
| CITI - Citigroup, Inc. | BRL - Brazilian Real | FRN - Floating Rate Note | ||
| DBAB - Deutsche Bank AG | EUR - Euro | GO - General Obligation | ||
| FBCO - Credit Suisse Group AG | HUF - Hungarian Forint | |||
| HSBC - HSBC Bank USA, N.A. | IDR - Indonesian Rupiah | |||
| JPHQ - JP Morgan Chase & Co. | ILS - New Israeli Shekel | |||
| MSCO - Morgan Stanley | JPY - Japanese Yen | |||
| UBSW - UBS AG | KRW - South Korean Won | |||
| LKR - Sri Lankan Rupee | ||||
| MXN - Mexican Peso | ||||
| MYR - Malaysian Ringgit | ||||
| NOK - Norwegian Krone | ||||
| PEN - Peruvian Nuevo Sol | ||||
| PHP - Philippine Peso | ||||
| PLN - Polish Zloty | ||||
| SEK - Swedish Krona | ||||
| SGD - Singapore Dollar |
TGB-38
Franklin Templeton Variable Insurance Products Trust
Tax Information (unaudited)
Templeton Global Bond Securities Fund
At December 31, 2011, more than 50% of the Fund’s total assets were invested in securities of foreign issuers. In most instances, foreign taxes were withheld from income paid to the Fund on these investments. As shown in the table below, the Fund hereby reports to shareholders the foreign source income and foreign taxes paid, pursuant to Section 853 of the Internal Revenue Code. This written statement will allow shareholders of record on June 14, 2012, to treat their proportionate share of foreign taxes paid by the Fund as having been paid directly by them. The shareholder shall consider these amounts as foreign taxes paid in the tax year in which they receive the Fund distribution.
The following table provides a detailed analysis of foreign tax paid, and foreign source income as reported by the Fund, to Class 1, Class 2, Class 3, and Class 4 shareholders of record.
| Class | Foreign Tax Paid Per Share | Foreign Source Income Per Share | ||||||
Class 1 | $ | 0.0301 | $ | 0.8773 | ||||
Class 2 | $ | 0.0301 | $ | 0.8509 | ||||
Class 3 | $ | 0.0301 | $ | 0.8446 | ||||
Class 4 | $ | 0.0301 | $ | 0.8309 | ||||
Foreign Tax Paid Per Share (Column 1) is the amount per share available to you, as a tax credit (assuming you held your shares in the Fund for a minimum of 16 days during the 31-day period beginning 15 days before the ex-dividend date of the Fund’s distribution to which the foreign taxes relate), or, as a tax deduction.
Foreign Source Income Per Share (Column 2) is the amount per share of income dividends attributable to foreign securities held by the Fund, plus any foreign taxes withheld on these dividends.
TGB-39
TEMPLETON GROWTH SECURITIES FUND
This semiannual report for Templeton Growth Securities Fund covers the period ended June 30, 2012.
Performance Summary as of 6/30/12
Templeton Growth Securities Fund – Class 4 delivered a +4.08% total return for the six-month period ended 6/30/12.
Performance reflects the Fund’s Class 4 operating expenses, but does not include any contract fees, expenses or sales charges. If they had been included, performance would be lower. These charges and deductions, particularly for variable life policies, can have a significant effect on contract values and insurance benefits. See the contract prospectus for a complete description of these expenses, including sales charges.
Templeton Growth Securities Fund – Class 4
Performance data represent past performance, which does not guarantee future results. Investment return and principal value will fluctuate, and you may have a gain or loss when you sell your shares.
Current performance may differ from figures shown.
TG-1
Fund Goal and Main Investments: Templeton Growth Securities Fund seeks long-term capital growth. Under normal market conditions, the Fund invests primarily in equity securities of companies located anywhere in the world, including those in the U.S. and in emerging markets.
Performance Overview
You can find the Fund’s six-month total return in the Performance Summary. The Fund underperformed the +6.29% total return of the MSCI World Index for the period under review.1
Economic and Market Overview
The six months under review encompassed two different market environments. The first quarter of 2012 delivered the best annual start for global developed stocks in more than a decade, as measured by the MSCI World Index, as signs of U.S. economic recovery and European policy relief underpinned a rally in cyclical stocks. Yet, renewed global economic weakness and European debt concerns led the market lower in the second quarter, and stocks dropped sharply in the spring before additional policy action prompted a rebound in June. Politics largely drove the markets during the first half of 2012 as investors closely monitored developments in Europe, where German-led austerity demands were met with increasing resentment from some highly indebted eurozone members. Coalition-building efforts in Greece collapsed amid anger over the terms of the country’s second bailout, forcing a new election that brought some relief when the pro-euro party won. Elsewhere in the region, France’s socialist candidate clinched the presidency on a pro-growth platform and the Dutch cabinet resigned in the wake of a contentious austerity deal.
On the economic front, global growth trends generally moderated, led by Europe, which narrowly avoided recession mainly because of German export strength. Yet, even the more resilient economies of Germany, the U.S. and China showed signs of a slowdown at period-end. The combination of flagging growth, political uncertainty and populist unrest pressured investor confidence, and ratings agencies downgraded global banks and European sovereigns. Concerns about the sustainability of Italian and Spanish borrowing costs added to investor anxiety as bond yields climbed. Europe’s initial policy responses — including enhanced liquidity measures and an ineffective Spanish banking bailout — did little to
1. Source: © 2012 Morningstar. One cannot invest directly in an index, and an index is not representative of the Fund’s portfolio. Please see Index Descriptions following the Fund Summaries.
All investments involve risks, including possible loss of principal. Special risks are associated with foreign investing, including currency fluctuations, economic instability and political developments; investments in emerging markets involve heightened risks related to the same factors. To the extent the Fund focuses on particular countries, regions, industries, sectors or types of investment from time to time, it may be subject to greater risks of adverse developments in such areas of focus than a fund that invests in a wider variety of countries, regions, industries, sectors or investments. Current political uncertainty surrounding the European Union (EU) and its membership may increase market volatility. The financial instability of some countries in the EU, including Greece, Italy and Spain, together with the risk of that impacting other more stable countries may increase the economic risk of investing in companies in Europe. The Fund is actively managed but there is no guarantee that the manager’s investment decisions will produce the desired results. The Fund’s prospectus also includes a description of the main investment risks.
TG-2
address the structural imbalances of eurozone economies or the solvency fears plaguing the region’s banking system. Yet, encouraging progress did emerge at period-end when leaders in Brussels agreed to ease conditions of sovereign bond purchases and permit the region’s bailout fund to directly recapitalize banks. Meanwhile, the U.S. Federal Reserve Board opted to extend its strategy, dubbed Operation Twist, designed to lower systemically important interest rates, and the People’s Bank of China slashed interest rates for the first time since the global financial crisis began. In the latter part of this period, commodities extended recent losses, with oil falling back below $100, while the euro dipped and traditional safe havens like U.S. Treasuries, the U.S. dollar and the Japanese yen made gains.
Investment Strategy
Our investment philosophy is bottom up, value oriented and long term. In choosing investments, we will focus on the market price of a company’s securities relative to our evaluation of the company’s potential long-term earnings, asset value and cash flow. Among factors we may consider are a company’s historical value measures, including price/earnings ratio, profit margins and liquidation value. We do in-depth research to construct a bargain list from which we buy.
Manager’s Discussion
Although the Fund delivered absolute gains for shareholders during the volatile six months under review, the seemingly “bipolar” market environment that has persisted since the global financial crisis began continued to challenge bottom-up investors. What we viewed as the market’s refusal to distinguish value at the stock level produced a negative “stock selection effect” for the Fund, offsetting allocation benefits and resulting in relative underperformance versus the benchmark. Although we find underperformance unacceptable, we note that such periods are not unprecedented or unexpected. Under Sir John Templeton’s tenure, we experienced periods of long-term underperformance far deeper than what we have undergone recently. As Sir John explained in a note to clients in 1950, “The investor who selects stocks on the basis of long-term intrinsic value must expect certain problems.” Yet, he also knew, “The most costly errors in selecting stocks are made by people whose thinking is dominated by the question of temporary short-term trend(s).” We believe our disciplined investment strategy can allow us to see past the market’s myopic focus and allow us to uncover long-term values.
TG-3
The financials sector is one area where we believe near-term worries created selective long-term opportunities.2 Fears abounded that a combination of asset impairment, funding seizure or deposit flight could possibly render European banks insolvent and spark a systemic contagion. Heavy investment outflows from financials accompanied this apprehension. By the end of the review period, the entire European banking sector’s market capitalization had shrunken considerably. It was perhaps unsurprising that many of the main European banks at period-end traded at all-time low valuations roughly in line with those of U.S. banks in 1932.
Stock-specific weakness among the Fund’s overweighting in European financials was a primary source of sector underperformance during the review period. Among the positions notably detracting from relative performance were French lender Credit Agricole, which fell to a record low following losses from its Greek operations, Italy’s UniCredit, which undertook an ill-timed rights offering at the beginning of the period, and Swiss financial services firm Credit Suisse Group, which the Swiss National Bank (SNB) asked to increase capital reserves. However, we believe Credit Agricole’s Greek exposure obscured the value of its core northern European businesses, where recent results confirmed to us encouraging operational progress. UniCredit, having already addressed capital adequacy concerns, is now progressing with cost-cutting and profit improvement initiatives. For Credit Suisse, the SNB is not the company’s regulator, capital ratios remained in line with Basel III targets, and we believe an equity issuance is unlikely given the firm’s various sources of available capital.
In our view, a stance against the European banking system at recent stock price levels reflected a bet that Europe’s political dysfunction will lead to an unraveling of the euro currency, a fate we believe will be avoided as forecasted break-up costs would handily exceed the costs of keeping the union intact. Furthermore, in our view, powerful policy tools still remained available as of period-end, and we believe depressed valuations failed to acknowledge such potentially supportive measures. As a result, our analysis led us to conclude certain deeply discounted regional banks with adequate capital positions, solid brands and good core businesses are likely to survive and can offer considerable upside potential should Europe ultimately establish a credible federal system of checks and balances on regional fiscal policy. In addition to holding
2. The financials sector comprises capital markets, commercial banks, diversified financial services and insurance in the SOI.
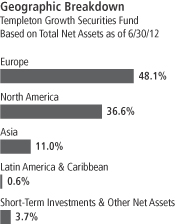
TG-4
deep-value European banks, we maintained exposure to financials stocks with what we viewed as defensive characteristics and attractive growth profiles in other regions. We believe our selective holdings represent a dynamic investing approach in the market’s most challenging and potentially rewarding environment.
Although financial holdings were the primary source of relative underperformance at the sector level, the period also featured more modest laggards. An underweighted position and stock selection in the defensive consumer staples sector, where we believe volatile input costs and intense competition were likely to pressure margins for the foreseeable future, also detracted from relative returns.3 The sector’s underperformance was primarily attributable to stock-specific weakness at U.K. food retailer Tesco, which dropped sharply after holiday sales disappointed and the firm reduced earnings guidance due to weakness in its domestic operations. In our view, Tesco maintained a highly dominant domestic market position and remained arguably the most efficient food merchandiser with the best track record for global market expansion. A new management team brought a breath of fresh air to a company that many feared rested on its laurels, and could help address near-term challenges and sustain Tesco’s historically strong record for maintaining long-term shareholder returns.
Energy holdings also lagged mainly due to stock-specific weakness; among these were three of the Fund’s biggest detractors.4 French oil company Total’s share price retreated as oil prices declined and a gas leak at a North Sea well led the company to downgrade earnings forecasts. With the firm having contained the leak, we believe Total remained well positioned for long-term production growth given its sizable investments in its upstream portfolio. U.S. oilfield services firm Baker Hughes also lost value as low natural gas prices shifted activity to more profitable oil drilling, crimping margins as pressure pumping supply increased and equipment relocation stalled production. From our perspective, most issues plaguing Baker appeared transitory and the company was aggressively working to mitigate their impact, creating what we viewed as an opportunity to buy one of the world’s highest quality oilfield services firms at multi-decade low valuation levels. Finally, Dutch drilling company SBM Offshore’s share price slumped after allegations of improper sales practices surfaced. The full extent of this
3. The consumer staples sector comprises food and staples retailing in the SOI.
4. The energy sector comprises energy equipment and services; and oil, gas and consumable fuels in the SOI.
TG-5
issue remained difficult to predict; however, our analysis of potential outcomes suggested the market priced in worst-case scenarios. According to our analysis, with its healthy backlog and favorable pipeline of future products, SBM offers considerable room for appreciation over a long-term investment horizon. Overall, we remained favorable toward our energy holdings and believe certain firms with the technology and expertise to extract hydrocarbons stand to benefit as new reserves are developed in increasingly remote and difficult locations.
Similar challenges and opportunities confronted the global mining industry; however, although energy multiples remained relatively reasonable in recent years, mining valuations hit a record high and profit margins reached peak levels as official stimulus debased the U.S. dollar and underpinned commodities strength. Although such positive momentum bolstered consensus optimism in the sector, it signaled caution to us, and our long-standing materials underweighting notably contributed to relative performance during the period as commodities extended their declines amid global growth concerns. Consumer discretionary stocks also significantly contributed to relative returns, driven by individual stock strength.5 In particular, media holdings strongly outperformed, led by U.S. cable providers Comcast and Time Warner Cable each beating profit and sales estimates on broadband subscriber gains. We think recent results supported our long-held view that the cable industry’s control of the valuable broadband pipeline represents a powerful secular growth driver to buffer more cyclical revenue sources such as video and advertising. Content producers like U.S.-based Disney and News Corp. also strongly outperformed the benchmark as the proliferation of media consumption services and devices enhanced demand for quality content. Disney rallied to its highest share price after growing earnings more than 20%, and News Corp. surged after its board agreed to split the company’s low-growth publishing assets from its high-growth entertainment assets.
Regionally, the Fund’s North American holdings significantly outperformed as stock selection overcame a detractive underweighting in the resilient U.S. market. Asian holdings also notably contributed to relative performance, led by an overweighting in Singapore and off-benchmark stock selection in South Korea. However, these contributors were largely offset by underperformance in Europe, where an overweighted position and stock-specific weakness weighed on
5. The consumer discretionary sector comprises auto components, automobiles, media, multiline retail and specialty retail in the SOI.
Top 10 Holdings
Templeton Growth Securities Fund 6/30/12
| Company Sector/Industry, Country | % of Total Net Assets | |||
| Amgen Inc. | 2.4% | |||
| Biotechnology, U.S. | ||||
| Pfizer Inc. | 2.3% | |||
| Pharmaceuticals, U.S. | ||||
| Sanofi | 2.2% | |||
| Pharmaceuticals, France | ||||
| Singapore Telecommunications Ltd. | 2.0% | |||
| Diversified Telecommunication Services, Singapore | ||||
| Microsoft Corp. | 2.0% | |||
| Software, U.S. | ||||
| GlaxoSmithKline PLC | 1.9% | |||
| Pharmaceuticals, U.K. | ||||
| Merck & Co. Inc. | 1.9% | |||
| Pharmaceuticals, U.S. | ||||
| Vodafone Group PLC | 1.9% | |||
| Wireless Telecommunication Services, U.K. | ||||
| Comcast Corp. | 1.8% | |||
| Media, U.S. | ||||
| Roche Holding AG | 1.8% | |||
| Pharmaceuticals, Switzerland | ||||
The dollar value, number of shares or principal amount, and names of all portfolio holdings are listed in the Fund’s Statement of Investments (SOI).
TG-6
relative results. Although the situation in Europe remained fluid, we found recent policy pronouncements encouraging and identified considerable valuation support. We believe restoring sustainable economic balance to the eurozone will likely ultimately require a combination of stimulus and structural reform to improve competitiveness and growth, spending cuts to restore fiscal sustainability and credible policy advancement toward banking and fiscal union. Recently announced measures, which included direct bank recapitalizations and easier conditions for sovereign bond purchases, could potentially serve to break the cycle between sovereigns and banks that has challenged the region’s private and public funding mechanisms.
Our bottom-up stock analysis indicated that European stocks at period-end traded at their lowest price-to-book levels since March 2009, offering what we believe were attractive entry points into some of the region’s highest quality global brands. Asian and emerging market stocks also remained below their long-term average price-to-earnings ratios and stood to potentially benefit should growth in these regions exceed diminished expectations. Keep in mind, we are not pinning our hopes on economic growth. In an era of low interest rates and investor uncertainty, we believe the assets most likely to outperform over the long term are the most undervalued stocks. Such discounts often exist for a reason, and investing in deeply undervalued stocks in times of crisis requires rigorous analysis, as well as patience and fortitude through periods of considerable adversity. Our discipline in such challenging environments has paid off in the past, and we are confident it will yet again if investors re-focus on fundamental value. We thank you for your patience and support as this process unfolds.
Thank you for your participation in Templeton Growth Securities Fund. We look forward to serving your future investment needs.
The foregoing information reflects our analysis, opinions and portfolio holdings as of June 30, 2012, the end of the reporting period. The way we implement our main investment strategies and the resulting portfolio holdings may change depending on factors such as market and economic conditions. These opinions may not be relied upon as investment advice or an offer for a particular security. The information is not a complete analysis of every aspect of any market, country, industry, security or the Fund. Statements of fact are from sources considered reliable, but the investment manager makes no representation or warranty as to their completeness or accuracy. Although historical performance is no guarantee of future results, these insights may help you understand our investment management philosophy.
TG-7
Fund Expenses
As an investor in a variable insurance contract (Contract) that indirectly provides for investment in an underlying mutual fund, you can incur transaction and/or ongoing expenses at both the Fund level and the Contract level.
| • | Transaction expenses can include sales charges (loads) on purchases, surrender fees, transfer fees and premium taxes. |
| • | Ongoing expenses can include management fees, distribution and service (12b-1) fees, contract fees, annual maintenance fees, mortality and expense risk fees and other fees and expenses. All mutual funds and Contracts have some types of ongoing expenses. |
The expenses shown in the table are meant to highlight ongoing expenses at the Fund level only and do not include ongoing expenses at the Contract level, or transaction expenses at either the Fund or Contract levels. While the Fund does not have transaction expenses, if the transaction and ongoing expenses at the Contract level were included, the expenses shown below would be higher. You should consult your Contract prospectus or disclosure document for more information.
The table shows Fund-level ongoing expenses and can help you understand these expenses and compare them with those of other mutual funds offered through the Contract. The table assumes a $1,000 investment held for the six months indicated. Please refer to the Fund prospectus for additional information on operating expenses.
Actual Fund Expenses
The first line (Actual) of the table provides actual account values and expenses. The “Ending Account Value” is derived from the Fund’s actual return, which includes the effect of ongoing Fund expenses, but does not include the effect of ongoing Contract expenses.
You can estimate the Fund-level expenses you incurred during the period by following these steps. Of course, your account value and expenses will differ from those in this illustration:
| 1. | Divide your account value by $1,000. |
If an account had an $8,600 value, then $8,600 ÷ $1,000 = 8.6.
| 2. | Multiply the result by the number under the heading “Fund-Level Expenses Incurred During Period.” |
If Fund-Level Expenses Incurred During Period were $7.50, then 8.6 x $7.50 = $64.50.
In this illustration, the estimated expenses incurred this period at the Fund level are $64.50.
Templeton Growth Securities Fund – Class 4
TG-8
Hypothetical Example for Comparison with Other Mutual Funds
Information in the second line (Hypothetical) of the table can help you compare ongoing expenses of the Fund with those of other mutual funds offered through the Contract. This information may not be used to estimate the actual ending account balance or expenses you incurred during the period. The hypothetical “Ending Account Value” is based on the Fund’s actual expense ratio and an assumed 5% annual rate of return before expenses, which does not represent the Fund’s actual return. The figure under the heading “Fund-Level Expenses Incurred During Period” shows the hypothetical expenses your account would have incurred under this scenario. You can compare this figure with the 5% hypothetical examples that appear in shareholder reports of other funds offered through a Contract.
| Class 4 | Beginning Account Value 1/1/12 | Ending Account Value 6/30/12 | Fund-Level Expenses Incurred During Period* Actual 1/1/12–6/30/12 | |||||||||
Actual | $ | 1,000 | $ | 1,040.80 | $ | 5.68 | ||||||
Hypothetical (5% return before expenses) | $ | 1,000 | $ | 1,019.29 | $ | 5.62 | ||||||
*Expenses are calculated using the most recent six-month annualized expense ratio for the Fund’s Class 4 shares (1.12%), which does not include any ongoing expenses of the Contract for which the Fund is an investment option, multiplied by the average account value over the period, multiplied 182/366 to reflect the one-half year period.
TG-9
Franklin Templeton Variable Insurance Products Trust
Financial Highlights
Templeton Growth Securities Fund
| Six Months Ended June 30, 2012 (unaudited) | Year Ended December 31, | |||||||||||||||||||||||
| Class 1 | 2011 | 2010 | 2009 | 2008 | 2007 | |||||||||||||||||||
| ||||||||||||||||||||||||
Per share operating performance | ||||||||||||||||||||||||
(for a share outstanding throughout the period) | ||||||||||||||||||||||||
Net asset value, beginning of period | $ | 10.27 | $ | 11.19 | $ | 10.56 | $ | 8.34 | $ | 15.68 | $ | 16.16 | ||||||||||||
|
| |||||||||||||||||||||||
Income from investment operationsa: | ||||||||||||||||||||||||
Net investment incomeb | 0.18 | 0.25 | 0.17 | 0.17 | 0.29 | 0.27 | ||||||||||||||||||
Net realized and unrealized gains (losses) | 0.24 | (0.99 | ) | 0.62 | 2.36 | (6.50 | ) | 0.19 | ||||||||||||||||
|
| |||||||||||||||||||||||
Total from investment operations | 0.42 | (0.74 | ) | 0.79 | 2.53 | (6.21 | ) | 0.46 | ||||||||||||||||
|
| |||||||||||||||||||||||
Less distributions from: | ||||||||||||||||||||||||
Net investment income | (0.26 | ) | (0.18 | ) | (0.16 | ) | (0.31 | ) | (0.26 | ) | (0.25 | ) | ||||||||||||
Net realized gains | — | — | — | — | (0.87 | ) | (0.69 | ) | ||||||||||||||||
|
| |||||||||||||||||||||||
Total distributions | (0.26 | ) | (0.18 | ) | (0.16 | ) | (0.31 | ) | (1.13 | ) | (0.94 | ) | ||||||||||||
|
| |||||||||||||||||||||||
Net asset value, end of period | $ | 10.43 | $ | 10.27 | $ | 11.19 | $ | 10.56 | $ | 8.34 | $ | 15.68 | ||||||||||||
|
| |||||||||||||||||||||||
Total returnc | 4.13% | (6.80)% | 7.74% | 31.33% | (42.13)% | 2.55% | ||||||||||||||||||
Ratios to average net assetsd | ||||||||||||||||||||||||
Expenses before expense reduction | 0.77% | 0.78% | 0.77% | 0.79% | 0.78% | 0.77% | ||||||||||||||||||
Expenses net of expense reduction | 0.77% | e | 0.78% | e | 0.77% | e | 0.79% | e | 0.78% | e | 0.76% | |||||||||||||
Net investment income | 3.26% | 2.22% | 1.71% | 2.00% | 2.64% | 1.64% | ||||||||||||||||||
Supplemental data | ||||||||||||||||||||||||
Net assets, end of period (000’s) | $ | 1,335,026 | $ | 1,200,682 | $ | 1,348,622 | $ | 824,575 | $ | 371,700 | $ | 406,538 | ||||||||||||
Portfolio turnover rate | 10.90% | 42.13% | f | 9.61% | 14.95% | 18.37% | 20.45% | |||||||||||||||||
aThe amount shown for a share outstanding throughout the period may not correlate with the Statement of Operations for the period due to the timing of sales and repurchases of the Fund shares in relation to income earned and/or fluctuating market value of the investments of the Fund.
bBased on average daily shares outstanding.
cTotal return does not include fees, charges or expenses imposed by the variable annuity and life insurance contracts for which the Franklin Templeton Variable Insurance Products Trust serves as an underlying investment vehicle. Total return is not annualized for periods less than one year.
dRatios are annualized for periods less than one year.
eBenefit of expense reduction rounds to less than 0.01%.
fExcludes the value of portfolio securities delivered as a result of a redemption in-kind.
The accompanying notes are an integral part of these financial statements.
TG-10
Franklin Templeton Variable Insurance Products Trust
Financial Highlights (continued)
Templeton Growth Securities Fund
| Six Months Ended June 30, 2012 (unaudited) | Year Ended December 31, | |||||||||||||||||||||||
| Class 2 | 2011 | 2010 | 2009 | 2008 | 2007 | |||||||||||||||||||
| ||||||||||||||||||||||||
Per share operating performance | ||||||||||||||||||||||||
(for a share outstanding throughout the period) | ||||||||||||||||||||||||
Net asset value, beginning of period | $ | 10.11 | $ | 11.01 | $ | 10.40 | $ | 8.20 | $ | 15.44 | $ | 15.93 | ||||||||||||
|
| |||||||||||||||||||||||
Income from investment operationsa: | ||||||||||||||||||||||||
Net investment incomeb | 0.16 | 0.21 | 0.15 | 0.16 | 0.29 | 0.22 | ||||||||||||||||||
Net realized and unrealized gains (losses) | 0.25 | (0.96 | ) | 0.60 | 2.32 | (6.44 | ) | 0.20 | ||||||||||||||||
|
| |||||||||||||||||||||||
Total from investment operations | 0.41 | (0.75 | ) | 0.75 | 2.48 | (6.15 | ) | 0.42 | ||||||||||||||||
|
| |||||||||||||||||||||||
Less distributions from: | ||||||||||||||||||||||||
Net investment income | (0.23 | ) | (0.15 | ) | (0.14 | ) | (0.28 | ) | (0.22 | ) | (0.22 | ) | ||||||||||||
Net realized gains | — | — | — | — | (0.87 | ) | (0.69 | ) | ||||||||||||||||
|
| |||||||||||||||||||||||
Total distributions | (0.23 | ) | (0.15 | ) | (0.14 | ) | (0.28 | ) | (1.09 | ) | (0.91 | ) | ||||||||||||
|
| |||||||||||||||||||||||
Net asset value, end of period | $ | 10.29 | $ | 10.11 | $ | 11.01 | $ | 10.40 | $ | 8.20 | $ | 15.44 | ||||||||||||
|
| |||||||||||||||||||||||
Total returnc | 4.07% | (6.97)% | 7.39% | 31.10% | (42.32)% | 2.35% | ||||||||||||||||||
Ratios to average net assetsd | ||||||||||||||||||||||||
Expenses before expense reduction | 1.02% | 1.03% | 1.02% | 1.04% | 1.03% | 1.02% | ||||||||||||||||||
Expenses net of expense reduction | 1.02% | e | 1.03% | e | 1.02% | e | 1.04% | e | 1.03% | e | 1.01% | |||||||||||||
Net investment income | 3.01% | 1.97% | 1.46% | 1.75% | 2.39% | 1.39% | ||||||||||||||||||
Supplemental data | ||||||||||||||||||||||||
Net assets, end of period (000’s) | $ | 1,245,299 | $ | 1,254,193 | $ | 1,626,885 | $ | 1,718,894 | $ | 1,513,557 | $ | 3,182,203 | ||||||||||||
Portfolio turnover rate | 10.90% | 42.13% | f | 9.61% | 14.95% | 18.37% | 20.45% | |||||||||||||||||
aThe amount shown for a share outstanding throughout the period may not correlate with the Statement of Operations for the period due to the timing of sales and repurchases of the Fund shares in relation to income earned and/or fluctuating market value of the investments of the Fund.
bBased on average daily shares outstanding.
cTotal return does not include fees, charges or expenses imposed by the variable annuity and life insurance contracts for which the Franklin Templeton Variable Insurance Products Trust serves as an underlying investment vehicle. Total return is not annualized for periods less than one year.
dRatios are annualized for periods less than one year.
eBenefit of expense reduction rounds to less than 0.01%.
fExcludes the value of portfolio securities delivered as a result of a redemption in-kind.
The accompanying notes are an integral part of these financial statements.
TG-11
Franklin Templeton Variable Insurance Products Trust
Financial Highlights (continued)
Templeton Growth Securities Fund
| Six Months Ended June 30, 2012 (unaudited) | Year Ended December 31, | |||||||||||||||||||
| Class 4 | 2011 | 2010 | 2009 | 2008a | ||||||||||||||||
| ||||||||||||||||||||
Per share operating performance | ||||||||||||||||||||
(for a share outstanding throughout the period) | ||||||||||||||||||||
Net asset value, beginning of period | $ | 10.19 | $ | 11.11 | $ | 10.50 | $ | 8.31 | $ | 14.08 | ||||||||||
|
| |||||||||||||||||||
Income from investment operationsb: | ||||||||||||||||||||
Net investment incomec | 0.15 | 0.20 | 0.14 | 0.14 | 0.09 | |||||||||||||||
Net realized and unrealized gains (losses) | 0.26 | (0.98 | ) | 0.61 | 2.36 | (4.73 | ) | |||||||||||||
|
| |||||||||||||||||||
Total from investment operations | 0.41 | (0.78 | ) | 0.75 | 2.50 | (4.64 | ) | |||||||||||||
|
| |||||||||||||||||||
Less distributions from: | ||||||||||||||||||||
Net investment income | (0.22 | ) | (0.14 | ) | (0.14 | ) | (0.31 | ) | (0.26 | ) | ||||||||||
Net realized gains | — | — | — | — | (0.87 | ) | ||||||||||||||
|
| |||||||||||||||||||
Total distributions | (0.22 | ) | (0.14 | ) | (0.14 | ) | (0.31 | ) | (1.13 | ) | ||||||||||
|
| |||||||||||||||||||
Net asset value, end of period | $ | 10.38 | $ | 10.19 | $ | 11.11 | $ | 10.50 | $ | 8.31 | ||||||||||
Total returnd | 4.08% | (7.14)% | 7.31% | 30.98% | (35.79)% | |||||||||||||||
Ratios to average net assetse | ||||||||||||||||||||
Expensesf | 1.12% | 1.13% | 1.12% | 1.14% | 1.13% | |||||||||||||||
Net investment income | 2.91% | 1.87% | 1.36% | 1.65% | 2.29% | |||||||||||||||
Supplemental data | ||||||||||||||||||||
Net assets, end of period (000’s) | $ | 59,682 | $ | 56,170 | $ | 60,569 | $ | 56,218 | $ | 24,877 | ||||||||||
Portfolio turnover rate | 10.90% | 42.13% | g | 9.61% | 14.95% | 18.37% | ||||||||||||||
aFor the period February 29, 2008 (effective date) to December 31, 2008.
bThe amount shown for a share outstanding throughout the period may not correlate with the Statement of Operations for the period due to the timing of sales and repurchases of the Fund shares in relation to income earned and/or fluctuating market value of the investments of the Fund.
cBased on average daily shares outstanding.
dTotal return does not include fees, charges or expenses imposed by the variable annuity and life insurance contracts for which the Franklin Templeton Variable Insurance Products Trust serves as an underlying investment vehicle. Total return is not annualized for periods less than one year.
eRatios are annualized for periods less than one year.
fBenefit of expense reduction rounds to less than 0.01%.
gExcludes the value of portfolio securities delivered as a result of a redemption in-kind.
The accompanying notes are an integral part of these financial statements.
TG-12
Franklin Templeton Variable Insurance Products Trust
Statement of Investments, June 30, 2012 (unaudited)
| Templeton Growth Securities Fund | Country | Shares | Value | |||||||
Common Stocks 95.2% | ||||||||||
Aerospace & Defense 0.5% | ||||||||||
BAE Systems PLC | United Kingdom | 2,750,373 | $ | 12,438,353 | ||||||
|
| |||||||||
Air Freight & Logistics 2.4% | ||||||||||
Deutsche Post AG | Germany | 884,414 | 15,603,241 | |||||||
FedEx Corp. | United States | 218,750 | 20,039,688 | |||||||
United Parcel Service Inc., B | United States | 339,990 | 26,777,612 | |||||||
|
| |||||||||
| 62,420,541 | ||||||||||
|
| |||||||||
Airlines 2.4% | ||||||||||
Deutsche Lufthansa AG | Germany | 2,401,614 | 27,698,804 | |||||||
aInternational Consolidated Airlines Group SA | United Kingdom | 14,226,980 | 35,541,599 | |||||||
|
| |||||||||
| 63,240,403 | ||||||||||
|
| |||||||||
Auto Components 1.2% | ||||||||||
Cie Generale des Etablissements Michelin, B | France | 483,672 | 31,512,723 | |||||||
|
| |||||||||
Automobiles 2.5% | ||||||||||
aMazda Motor Corp. | Japan | 9,367,690 | 12,530,852 | |||||||
Nissan Motor Co. Ltd. | Japan | 1,902,720 | 17,792,656 | |||||||
Toyota Motor Corp. | Japan | 870,120 | 34,700,372 | |||||||
|
| |||||||||
| 65,023,880 | ||||||||||
|
| |||||||||
Biotechnology 2.4% | ||||||||||
Amgen Inc. | United States | 852,780 | 62,287,051 | |||||||
|
| |||||||||
Capital Markets 2.5% | ||||||||||
Credit Suisse Group AG | Switzerland | 1,234,686 | 22,455,933 | |||||||
Morgan Stanley | United States | 1,565,950 | 22,847,210 | |||||||
UBS AG | Switzerland | 1,807,539 | 21,046,687 | |||||||
|
| |||||||||
| 66,349,830 | ||||||||||
|
| |||||||||
Chemicals 1.0% | ||||||||||
Akzo Nobel NV | Netherlands | 549,347 | 25,752,191 | |||||||
|
| |||||||||
Commercial Banks 7.1% | ||||||||||
BNP Paribas SA | France | 796,820 | 30,591,493 | |||||||
aCredit Agricole SA | France | 3,936,190 | 17,291,279 | |||||||
DBS Group Holdings Ltd. | Singapore | 1,481,690 | 16,220,237 | |||||||
HSBC Holdings PLC | United Kingdom | 3,042,424 | 26,882,634 | |||||||
ICICI Bank Ltd., ADR | India | 416,350 | 13,493,904 | |||||||
bIntesa Sanpaolo SpA | Italy | 19,904,741 | 28,164,029 | |||||||
KB Financial Group Inc. | South Korea | 657,984 | 21,273,271 | |||||||
aLloyds Banking Group PLC | United Kingdom | 15,290,520 | 7,451,645 | |||||||
aUniCredit SpA | Italy | 7,043,603 | 26,564,863 | |||||||
|
| |||||||||
| 187,933,355 | ||||||||||
|
| |||||||||
Communications Equipment 3.0% | ||||||||||
aBrocade Communications Systems Inc. | United States | 2,621,030 | 12,921,678 | |||||||
Cisco Systems Inc. | United States | 2,347,340 | 40,303,828 | |||||||
Ericsson, B | Sweden | 2,949,612 | 26,884,234 | |||||||
|
| |||||||||
| 80,109,740 | ||||||||||
|
| |||||||||
Computers & Peripherals 1.1% | ||||||||||
aDell Inc. | United States | 862,810 | 10,802,381 | |||||||
Hewlett-Packard Co. | United States | 903,940 | 18,178,234 | |||||||
|
| |||||||||
| 28,980,615 | ||||||||||
|
| |||||||||
TG-13
Franklin Templeton Variable Insurance Products Trust
Statement of Investments, June 30, 2012 (unaudited) (continued)
| Templeton Growth Securities Fund | Country | Shares | Value | |||||||
Common Stocks (continued) | ||||||||||
Construction & Engineering 0.1% | ||||||||||
Carillion PLC | United Kingdom | 805,720 | $ | 3,486,012 | ||||||
|
| |||||||||
Construction Materials 1.5% | ||||||||||
CRH PLC | Ireland | 2,030,641 | 38,832,385 | |||||||
|
| |||||||||
Consumer Finance 0.7% | ||||||||||
American Express Co. | United States | 319,770 | 18,613,812 | |||||||
|
| |||||||||
Diversified Financial Services 3.7% | ||||||||||
Bank of America Corp. | United States | 1,119,120 | 9,154,402 | |||||||
Citigroup Inc. | United States | 1,225,490 | 33,590,681 | |||||||
aING Groep NV | Netherlands | 5,404,750 | 36,020,763 | |||||||
JPMorgan Chase & Co. | United States | 556,770 | 19,893,392 | |||||||
|
| |||||||||
| 98,659,238 | ||||||||||
|
| |||||||||
Diversified Telecommunication Services 4.7% | ||||||||||
France Telecom SA | France | 1,949,580 | 25,599,154 | |||||||
Singapore Telecommunications Ltd. | Singapore | 20,718,470 | 53,962,866 | |||||||
Telefonica SA | Spain | 1,431,248 | 18,784,087 | |||||||
Telekom Austria AG | Austria | 466,837 | 4,584,241 | |||||||
Vivendi SA | France | 1,175,810 | 21,770,977 | |||||||
|
| |||||||||
| 124,701,325 | ||||||||||
|
| |||||||||
Electrical Equipment 1.1% | ||||||||||
bAlstom SA | France | 938,094 | 29,598,185 | |||||||
|
| |||||||||
Electronic Equipment, Instruments & Components 0.9% | ||||||||||
aFlextronics International Ltd. | Singapore | 1,972,800 | 12,231,360 | |||||||
TE Connectivity Ltd. | United States | 335,268 | 10,698,402 | |||||||
|
| |||||||||
| 22,929,762 | ||||||||||
|
| |||||||||
Energy Equipment & Services 3.3% | ||||||||||
Baker Hughes Inc. | United States | 945,650 | 38,866,215 | |||||||
Halliburton Co. | United States | 609,650 | 17,307,963 | |||||||
Noble Corp. | United States | 709,160 | 23,068,975 | |||||||
aSBM Offshore NV | Netherlands | 544,135 | 7,496,034 | |||||||
|
| |||||||||
| 86,739,187 | ||||||||||
|
| |||||||||
Food & Staples Retailing 2.2% | ||||||||||
CVS Caremark Corp. | United States | 619,220 | 28,936,151 | |||||||
Tesco PLC | United Kingdom | 5,839,748 | 28,365,506 | |||||||
|
| |||||||||
| 57,301,657 | ||||||||||
|
| |||||||||
Health Care Equipment & Supplies 1.2% | ||||||||||
Medtronic Inc. | United States | 790,840 | 30,629,233 | |||||||
|
| |||||||||
Industrial Conglomerates 3.1% | ||||||||||
Citic Pacific Ltd. | China | 3,983 | 6,017 | |||||||
General Electric Co. | United States | 1,198,610 | 24,979,033 | |||||||
Koninklijke Philips Electronics NV | Netherlands | 1,581,151 | 31,157,199 | |||||||
Siemens AG | Germany | 320,656 | 26,841,081 | |||||||
|
| |||||||||
| 82,983,330 | ||||||||||
|
| |||||||||
Insurance 4.6% | ||||||||||
Aviva PLC | United Kingdom | 6,320,965 | 27,001,545 | |||||||
AXA SA | France | 2,127,190 | 28,213,958 | |||||||
Muenchener Rueckversicherungs-Gesellschaft AG | Germany | 212,557 | 29,900,698 | |||||||
TG-14
Franklin Templeton Variable Insurance Products Trust
Statement of Investments, June 30, 2012 (unaudited) (continued)
| Templeton Growth Securities Fund | Country | Shares | Value | |||||||
Common Stocks (continued) | ||||||||||
Insurance (continued) | ||||||||||
Swiss Re AG | Switzerland | 599,142 | $ | 37,596,318 | ||||||
|
| |||||||||
| 122,712,519 | ||||||||||
|
| |||||||||
Life Sciences Tools & Services 0.3% | ||||||||||
Lonza Group AG | Switzerland | 191,947 | 7,965,093 | |||||||
|
| |||||||||
Machinery 1.1% | ||||||||||
aNavistar International Corp. | United States | 1,001,030 | 28,399,221 | |||||||
|
| |||||||||
Media 6.6% | ||||||||||
Comcast Corp., Special A | United States | 1,548,082 | 48,609,775 | |||||||
News Corp., A | United States | 1,219,192 | 27,175,790 | |||||||
Time Warner Cable Inc. | United States | 386,360 | 31,720,156 | |||||||
Time Warner Inc. | United States | 668,970 | 25,755,345 | |||||||
Viacom Inc., B | United States | 261,098 | 12,276,828 | |||||||
The Walt Disney Co. | United States | 584,750 | 28,360,375 | |||||||
|
| |||||||||
| 173,898,269 | ||||||||||
|
| |||||||||
Multiline Retail 0.7% | ||||||||||
Target Corp. | United States | 304,580 | 17,723,510 | |||||||
|
| |||||||||
Oil, Gas & Consumable Fuels 8.7% | ||||||||||
BP PLC | United Kingdom | 6,878,717 | 45,471,829 | |||||||
Chesapeake Energy Corp. | United States | 864,210 | 16,074,306 | |||||||
Chevron Corp. | United States | 310,030 | 32,708,165 | |||||||
Eni SpA | Italy | 1,234,795 | 26,223,054 | |||||||
Gazprom, ADR | Russia | 1,330,750 | 12,642,125 | |||||||
Royal Dutch Shell PLC, B | United Kingdom | 1,108,231 | 38,637,483 | |||||||
Talisman Energy Inc. | Canada | 1,299,000 | 14,890,555 | |||||||
Total SA, B | France | 983,466 | 44,185,945 | |||||||
|
| |||||||||
| 230,833,462 | ||||||||||
|
| |||||||||
Pharmaceuticals 10.9% | ||||||||||
GlaxoSmithKline PLC | United Kingdom | 2,255,452 | 51,141,901 | |||||||
Merck & Co. Inc. | United States | 1,220,811 | 50,968,859 | |||||||
Merck KGaA | Germany | 206,127 | 20,536,026 | |||||||
Pfizer Inc. | United States | 2,607,033 | 59,961,759 | |||||||
Roche Holding AG | Switzerland | 274,748 | 47,364,355 | |||||||
Sanofi | France | 757,937 | 57,305,298 | |||||||
|
| |||||||||
| 287,278,198 | ||||||||||
|
| |||||||||
Professional Services 1.3% | ||||||||||
Adecco SA | Switzerland | 140,580 | 6,221,665 | |||||||
Hays PLC | United Kingdom | 3,623 | 4,179 | |||||||
Randstad Holding NV | Netherlands | 1,007,471 | 29,549,405 | |||||||
|
| |||||||||
| 35,775,249 | ||||||||||
|
| |||||||||
Semiconductors & Semiconductor Equipment 2.4% | ||||||||||
Samsung Electronics Co. Ltd. | South Korea | 43,360 | 45,627,309 | |||||||
Taiwan Semiconductor Manufacturing Co. Ltd. | Taiwan | 6,826,005 | 18,626,374 | |||||||
|
| |||||||||
| 64,253,683 | ||||||||||
|
| |||||||||
Software 4.3% | ||||||||||
Microsoft Corp. | United States | 1,747,379 | 53,452,323 | |||||||
Nintendo Co. Ltd. | Japan | 157,640 | 18,229,404 | |||||||
Oracle Corp. | United States | 528,460 | 15,695,262 | |||||||
TG-15
Franklin Templeton Variable Insurance Products Trust
Statement of Investments, June 30, 2012 (unaudited) (continued)
| Templeton Growth Securities Fund | Country | Shares | Value | |||||||
Common Stocks (continued) | ||||||||||
Software (continued) | ||||||||||
SAP AG | Germany | 443,173 | $ | 26,106,147 | ||||||
|
| |||||||||
| 113,483,136 | ||||||||||
|
| |||||||||
Specialty Retail 1.0% | ||||||||||
Kingfisher PLC | United Kingdom | 5,739,648 | 25,849,211 | |||||||
|
| |||||||||
Trading Companies & Distributors 0.5% | ||||||||||
Itochu Corp. | Japan | 1,225,590 | 12,747,730 | |||||||
|
| |||||||||
Wireless Telecommunication Services 4.2% | ||||||||||
aSprint Nextel Corp. | United States | 9,717,860 | 31,680,223 | |||||||
aTurkcell Iletisim Hizmetleri AS, ADR | Turkey | 2,349,100 | 29,481,205 | |||||||
Vodafone Group PLC | United Kingdom | 18,096,428 | 50,822,000 | |||||||
|
| |||||||||
| 111,983,428 | ||||||||||
|
| |||||||||
Total Common Stocks (Cost $2,755,863,241) | 2,513,425,517 | |||||||||
|
| |||||||||
Preferred Stocks 0.6% | ||||||||||
Metals & Mining 0.4% | ||||||||||
Vale SA, ADR, pfd., A | Brazil | 592,750 | 11,564,553 | |||||||
|
| |||||||||
Oil, Gas & Consumable Fuels 0.2% | ||||||||||
Petroleo Brasileiro SA, ADR, pfd. | Brazil | 274,380 | 4,977,253 | |||||||
|
| |||||||||
Total Preferred Stocks (Cost $18,810,970) | 16,541,806 | |||||||||
|
| |||||||||
Non-Registered Mutual Funds (Cost $11,935,000) 0.5% | ||||||||||
Diversified Financial Services 0.5% | ||||||||||
a,c,d,eTempleton China Opportunities Fund, Ltd., Reg D | China | 1,194,518 | 12,745,505 | |||||||
|
| |||||||||
Total Investments before Short Term Investments | 2,542,712,828 | |||||||||
|
| |||||||||
| Principal Amount | ||||||||||
Short Term Investments 3.0% | ||||||||||
Time Deposits 1.3% | ||||||||||
Royal Bank of Canada, 0.11%, 7/02/12 | United States | $ | 35,000,000 | 35,000,000 | ||||||
|
| |||||||||
| Shares | ||||||||||
fInvestments from Cash Collateral Received for Loaned Securities 1.7% | ||||||||||
Money Market Funds 1.7% | ||||||||||
gBNY Mellon Overnight Government Fund, 0.182% | United States | 44,251,437 | 44,251,437 | |||||||
|
| |||||||||
Total Short Term Investments (Cost $79,251,437) | 79,251,437 | |||||||||
|
| |||||||||
Total Investments (Cost $2,865,860,648) 99.3% | 2,621,964,265 | |||||||||
Other Assets, less Liabilities 0.7% | 18,041,860 | |||||||||
|
| |||||||||
Net Assets 100.0% | $ | 2,640,006,125 | ||||||||
|
| |||||||||
See Abbreviations on page TG-28.
aNon-income producing.
bA portion or all of the security is on loan at June 30, 2012. See Note 1(d).
cSee Note 1(c) regarding investment in Templeton China Opportunities Fund, Ltd.
dSee Note 8 regarding restricted securities.
eSee Note 9 regarding holdings of 5% voting securities.
fSee Note 1(d) regarding securities on loan.
gThe rate shown is the annualized seven-day yield at period end.
The accompanying notes are an integral part of these financial statements.
TG-16
Franklin Templeton Variable Insurance Products Trust
Financial Statements
Statement of Assets and Liabilities
June 30, 2012 (unaudited)
| Templeton Growth Securities Fund | ||||
Assets: | ||||
Investments in securities: | ||||
Cost - Unaffiliated issuers | $ | 2,853,925,648 | ||
Cost - Non-controlled affiliated issuers (Note 9) | 11,935,000 | |||
|
| |||
Total cost of investments | $ | 2,865,860,648 | ||
|
| |||
Value - Unaffiliated issuers | $ | 2,609,218,760 | ||
Value - Non-controlled affiliated issuers (Note 9) | 12,745,505 | |||
|
| |||
Total value of investments (includes securities loaned in the amount $30,407,038) | 2,621,964,265 | |||
Cash | 57,749,394 | |||
Receivables: | ||||
Capital shares sold | 577,711 | |||
Dividends and interest | 7,382,327 | |||
Other assets | 638 | |||
|
| |||
Total assets | 2,687,674,335 | |||
|
| |||
Liabilities: | ||||
Payables: | ||||
Investment securities purchased | 42,110 | |||
Capital shares redeemed | 764,235 | |||
Affiliates | 2,052,886 | |||
Payable upon return of securities loaned | 44,251,437 | |||
Accrued expenses and other liabilities | 557,542 | |||
|
| |||
Total liabilities | 47,668,210 | |||
|
| |||
Net assets, at value | $ | 2,640,006,125 | ||
|
| |||
Net assets consist of: | ||||
Paid-in capital | $ | 3,150,537,284 | ||
Undistributed net investment income | 42,671,649 | |||
Net unrealized appreciation (depreciation) | (243,939,102 | ) | ||
Accumulated net realized gain (loss) | (309,263,706 | ) | ||
|
| |||
Net assets, at value | $ | 2,640,006,125 | ||
|
| |||
The accompanying notes are an integral part of these financial statements.
TG-17
Franklin Templeton Variable Insurance Products Trust
Financial Statements (continued)
Statement of Assets and Liabilities (continued)
June 30, 2012 (unaudited)
| Templeton Growth Securities Fund | ||||
Class 1: | ||||
Net assets, at value | $ | 1,335,026,028 | ||
|
| |||
Shares outstanding | 127,971,127 | |||
|
| |||
Net asset value and maximum offering price per share | $ | 10.43 | ||
|
| |||
Class 2: | ||||
Net assets, at value | $ | 1,245,298,541 | ||
|
| |||
Shares outstanding | 121,062,459 | |||
|
| |||
Net asset value and maximum offering price per share | $ | 10.29 | ||
|
| |||
Class 4: | ||||
Net assets, at value | $ | 59,681,556 | ||
|
| |||
Shares outstanding | 5,751,947 | |||
|
| |||
Net asset value and maximum offering price per share | $ | 10.38 | ||
|
| |||
The accompanying notes are an integral part of these financial statements.
TG-18
Franklin Templeton Variable Insurance Products Trust
Financial Statements (continued)
Statement of Operations
for the six months ended June 30, 2012 (unaudited)
| Templeton Growth Securities Fund | ||||
Investment income: | ||||
Dividends (net of foreign taxes $4,539,962) | $ | 52,919,819 | ||
Interest | 31,573 | |||
Income from securities loaned | 2,231,014 | |||
|
| |||
Total investment income | 55,182,406 | |||
|
| |||
Expenses: | ||||
Management fees (Note 3a) | 10,119,374 | |||
Distribution fees: (Note 3c) | ||||
Class 2 | 1,606,663 | |||
Class 4 | 105,559 | |||
Unaffiliated transfer agent fees | 1,668 | |||
Custodian fees (Note 4) | 162,033 | |||
Reports to shareholders | 157,023 | |||
Professional fees | 61,997 | |||
Trustees’ fees and expenses | 5,668 | |||
Other | 33,816 | |||
|
| |||
Total expenses | 12,253,801 | |||
Expense reductions (Note 4) | (154 | ) | ||
|
| |||
Net expenses | 12,253,647 | |||
|
| |||
Net investment income | 42,928,759 | |||
|
| |||
Realized and unrealized gains (losses): | ||||
Net realized gain (loss) from: | ||||
Investments | 43,975,124 | |||
Foreign currency transactions | (543,340 | ) | ||
|
| |||
Net realized gain (loss) | 43,431,784 | |||
|
| |||
Net change in unrealized appreciation (depreciation) on: | ||||
Investments | 4,037,860 | |||
Translation of other assets and liabilities denominated in foreign currencies | 30,842 | |||
|
| |||
Net change in unrealized appreciation (depreciation) | 4,068,702 | |||
|
| |||
Net realized and unrealized gain (loss) | 47,500,486 | |||
|
| |||
Net increase (decrease) in net assets resulting from operations | $ | 90,429,245 | ||
|
| |||
The accompanying notes are an integral part of these financial statements.
TG-19
Franklin Templeton Variable Insurance Products Trust
Financial Statements (continued)
Statements of Changes in Net Assets
| Templeton Growth Securities Fund | ||||||||
| Six Months Ended June 30, 2012 (unaudited) | Year Ended December 31, 2011 | |||||||
| ||||||||
Increase (decrease) in net assets: | ||||||||
Operations: | ||||||||
Net investment income | $ | 42,928,759 | $ | 60,824,912 | ||||
Net realized gain (loss) from investments and foreign currency transactions | 43,431,784 | 119,363,548 | ||||||
Net change in unrealized appreciation (depreciation) on investments and translation of other assets and liabilities denominated in foreign currencies | 4,068,702 | (404,407,949 | ) | |||||
| ||||||||
Net increase (decrease) in net assets resulting from operations | 90,429,245 | (224,219,489 | ) | |||||
| ||||||||
Distributions to shareholders from: | ||||||||
Net investment income: | ||||||||
Class 1 | (30,925,492 | ) | (23,962,804 | ) | ||||
Class 2 | (26,587,764 | ) | (19,367,342 | ) | ||||
Class 4 | (1,228,892 | ) | (766,075 | ) | ||||
| ||||||||
Total distributions to shareholders | (58,742,148 | ) | (44,096,221 | ) | ||||
| ||||||||
Capital share transactions: (Note 2) | ||||||||
Class 1 | 129,725,166 | 15,269,781 | ||||||
Class 2 | (34,951,195 | ) | (272,568,653 | ) | ||||
Class 4 | 2,499,938 | 582,974 | ||||||
| ||||||||
Total capital share transactions | 97,273,909 | (256,715,898 | ) | |||||
| ||||||||
Net increase (decrease) in net assets | 128,961,006 | (525,031,608 | ) | |||||
Net assets: | ||||||||
Beginning of period | 2,511,045,119 | 3,036,076,727 | ||||||
| ||||||||
End of period | $ | 2,640,006,125 | $ | 2,511,045,119 | ||||
| ||||||||
Undistributed net investment income included in net assets: | ||||||||
End of period | $ | 42,671,649 | $ | 58,485,038 | ||||
| ||||||||
The accompanying notes are an integral part of these financial statements.
TG-20
Franklin Templeton Variable Insurance Products Trust
Notes to Financial Statements (unaudited)
Templeton Growth Securities Fund
1. ORGANIZATION AND SIGNIFICANT ACCOUNTING POLICIES
Franklin Templeton Variable Insurance Products Trust (Trust) is registered under the Investment Company Act of 1940, as amended, (1940 Act) as an open-end investment company, consisting of twenty separate funds. The Templeton Growth Securities Fund (Fund) is included in this report. The financial statements of the remaining funds in the Trust are presented separately. Shares of the Fund are generally sold only to insurance company separate accounts to fund the benefits of variable life insurance policies or variable annuity contracts. The Fund offers three classes of shares: Class 1, Class 2, and Class 4. Each class of shares differs by its distribution fees, voting rights on matters affecting a single class and its exchange privilege.
The following summarizes the Fund’s significant accounting policies.
a. Financial Instrument Valuation
The Fund’s investments in financial instruments are carried at fair value daily. Fair value is the price that would be received to sell an asset or paid to transfer a liability in an orderly transaction between market participants on the measurement date. Under procedures approved by the Trust’s Board of Trustees (the Board), the Fund’s administrator, investment manager and other affiliates have formed the Valuation and Liquidity Oversight Committee (VLOC). The VLOC provides administration and oversight of the Fund’s valuation policies and procedures, which are approved annually by the Board. Among other things, these procedures allow the Fund to utilize independent pricing services, quotations from securities and financial instrument dealers, and other market sources to determine fair value.
Equity securities listed on an exchange or on the NASDAQ National Market System are valued at the last quoted sale price or the official closing price of the day, respectively. Foreign equity securities are valued as of the close of trading on the foreign stock exchange on which the security is primarily traded, or the NYSE, whichever is earlier. The value is then converted into its U.S. dollar equivalent at the foreign exchange rate in effect at the close of the NYSE on the day that the value of the security is determined. Over-the-counter securities are valued within the range of the most recent quoted bid and ask prices. Securities that trade in multiple markets or on multiple exchanges are valued according to the broadest and most representative market. Certain equity securities are valued based upon fundamental characteristics or relationships to similar securities.
Debt securities generally trade in the over-the-counter market rather than on a securities exchange. The Fund’s pricing services use multiple valuation techniques to determine fair value. In instances where sufficient market activity exists, the pricing services may utilize a market-based approach through which quotes from market makers are used to determine fair value. In instances where sufficient market activity may not exist or is limited, the pricing services also utilize proprietary valuation models which may consider market characteristics such as benchmark yield curves, credit spreads, estimated default rates, anticipated market interest rate volatility, coupon rates, anticipated timing of principal repayments, underlying collateral, and other unique security features in order to estimate the relevant cash flows, which are then discounted to calculate the fair value. Securities denominated in a foreign currency are converted into their U.S. dollar equivalent at the foreign exchange rate in effect at the close of the NYSE on the date that the values of the foreign debt securities are determined. Investments in non-registered money market funds are valued at the closing net asset value. Time deposits are valued at cost, which approximates market value.
The Fund has procedures to determine the fair value of financial instruments for which market prices are not reliable or readily available. Under these procedures, the VLOC convenes on a regular basis to review such financial instruments and considers a number of factors, including significant unobservable valuation inputs, when arriving at fair value. The VLOC primarily employs a market-based approach which may use related or comparable assets or liabilities, recent transactions, market multiples, book values, and other relevant information for the investment to determine the fair value of the investment. An income-based valuation approach may also be used in which the anticipated future cash flows of the investment are discounted to calculate fair value. Discounts may also be applied due to the nature or duration of any restrictions on the disposition of the investments. Due to the inherent uncertainty of valuations of such investments, the fair values may differ significantly from the values that would have been used had an active market existed. The VLOC employs various methods for calibrating these valuation approaches including a regular review of key inputs and assumptions, transactional back-testing or disposition analysis, and reviews of any related market activity.
TG-21
Franklin Templeton Variable Insurance Products Trust
Notes to Financial Statements (unaudited) (continued)
Templeton Growth Securities Fund
1. ORGANIZATION AND SIGNIFICANT ACCOUNTING POLICIES (continued)
a. Financial Instrument Valuation (continued)
Trading in securities on foreign securities stock exchanges and over-the-counter markets may be completed before the daily close of business on the NYSE. Occasionally, events occur between the time at which trading in a foreign security is completed and the close of the NYSE that might call into question the reliability of the value of a portfolio security held by the Fund. As a result, differences may arise between the value of the Fund’s portfolio securities as determined at the foreign market close and the latest indications of value at the close of the NYSE. In order to minimize the potential for these differences, the VLOC monitors price movements following the close of trading in foreign stock markets through a series of country specific market proxies (such as baskets of American Depositary Receipts, futures contracts and exchange traded funds). These price movements are measured against established trigger thresholds for each specific market proxy to assist in determining if an event has occurred that may call into question the reliability of the values of the foreign securities held by the Fund. If such an event occurs, the securities may be valued using fair value procedures, which may include the use of independent pricing services.
b. Foreign Currency Translation
Portfolio securities and other assets and liabilities denominated in foreign currencies are translated into U.S. dollars based on the exchange rate of such currencies against U.S. dollars on the date of valuation. The Fund may enter into foreign currency exchange contracts to facilitate transactions denominated in a foreign currency. Purchases and sales of securities, income and expense items denominated in foreign currencies are translated into U.S. dollars at the exchange rate in effect on the transaction date. Portfolio securities and assets and liabilities denominated in foreign currencies contain risks that those currencies will decline in value relative to the U.S. dollar. Occasionally, events may impact the availability or reliability of foreign exchange rates used to convert the U.S. dollar equivalent value. If such an event occurs, the foreign exchange rate will be valued at fair value using procedures established and approved by the Board.
The Fund does not separately report the effect of changes in foreign exchange rates from changes in market prices on securities held. Such changes are included in net realized and unrealized gain or loss from investments on the Statement of Operations.
Realized foreign exchange gains or losses arise from sales of foreign currencies, currency gains or losses realized between the trade and settlement dates on securities transactions and the difference between the recorded amounts of dividends, interest, and foreign withholding taxes and the U.S. dollar equivalent of the amounts actually received or paid. Net unrealized foreign exchange gains and losses arise from changes in foreign exchange rates on foreign denominated assets and liabilities other than investments in securities held at the end of the reporting period.
c. Investment in Templeton China Opportunities Fund, Ltd.
The Fund invests in Templeton China Opportunities Fund, Ltd. (China Fund), a private offering of unregistered shares in a Cayman Islands Exempt Company. The China Fund investment objective is to seek capital growth primarily through investments in A-shares of Chinese companies listed on the Shanghai and Shenzhen stock exchanges. Chinese A-shares are traded in Chinese Renminbi and are only available as an investment to domestic (Chinese) investors and holders of a Qualified Foreign Institutional Investors license. The China Fund is managed by Templeton Investment Counsel, LLC (an affiliate of the investment manager). No additional management or administrative fees are incurred on assets invested in the China Fund.
The China Fund may be subject to certain restrictions and administrative processes relating to its ability to repatriate cash balances, investment proceeds and earnings associated with its investment, as such activities are subject to approval by agencies of the Chinese government and thus the Fund may incur delays in redeeming its investment in the China Fund. The Fund’s investment in the China Fund is valued based upon the fair value of the China Fund’s portfolio securities and other assets and liabilities.
TG-22
Franklin Templeton Variable Insurance Products Trust
Notes to Financial Statements (unaudited) (continued)
Templeton Growth Securities Fund
1. ORGANIZATION AND SIGNIFICANT ACCOUNTING POLICIES (continued)
d. Securities Lending
The Fund participates in an agency based securities lending program. The fund receives cash collateral against the loaned securities in an amount equal to at least 102% of the market value of the loaned securities. Collateral is maintained over the life of the loan in an amount not less than 100% of the market value of loaned securities, as determined at the close of fund business each day; any additional collateral required due to changes in security values is delivered to the fund on the next business day. The collateral is invested in a non-registered money fund as indicated on the Statement of Investments. The fund receives income from the investment of cash collateral, in addition to lending fees and rebates paid by the borrower. The fund bears the market risk with respect to the collateral investment, securities loaned, and the risk that the agent may default on its obligations to the fund. The securities lending agent has agreed to indemnify the fund in the event of default by a third party borrower.
e. Income and Deferred Taxes
It is the Fund’s policy to qualify as a regulated investment company under the Internal Revenue Code. The Fund intends to distribute to shareholders substantially all of its taxable income and net realized gains to relieve it from federal income and if applicable, excise taxes. As a result, no provision for U.S. federal income taxes is required.
The Fund may be subject to foreign taxation related to income received, capital gains on the sale of securities and certain foreign currency transactions in the foreign jurisdictions in which it invests. Foreign taxes, if any, are recorded based on the tax regulations and rates that exist in the foreign markets in which the Fund invests. When a capital gain tax is determined to apply the Fund records an estimated deferred tax liability in an amount that would be payable if the securities were disposed of on the valuation date.
The Fund recognizes the tax benefits of uncertain tax positions only when the position is “more likely than not” to be sustained upon examination by the tax authorities based on the technical merits of the tax position. As of June 30, 2012, and for all open tax years, the Fund has determined that no liability for unrecognized tax benefits is required in the Fund’s financial statements related to uncertain tax positions taken on a tax return (or expected to be taken on future tax returns). Open tax years are those that remain subject to examination and are based on each tax jurisdiction statute of limitation.
f. Security Transactions, Investment Income, Expenses and Distributions
Security transactions are accounted for on trade date. Realized gains and losses on security transactions are determined on a specific identification basis. Interest income and estimated expenses are accrued daily. Amortization of premium and accretion of discount on debt securities are included in interest income. Dividend income is recorded on the ex-dividend date except that certain dividends from foreign securities are recognized as soon as the Fund is notified of the ex-dividend date. Distributions to shareholders are recorded on the ex-dividend date and are determined according to income tax regulations (tax basis). Distributable earnings determined on a tax basis may differ from earnings recorded in accordance with accounting principles generally accepted in the United States of America. These differences may be permanent or temporary. Permanent differences are reclassified among capital accounts to reflect their tax character. These reclassifications have no impact on net assets or the results of operations. Temporary differences are not reclassified, as they may reverse in subsequent periods.
Common expenses incurred by the Trust are allocated among the funds based on the ratio of net assets of each fund to the combined net assets of the Trust. Fund specific expenses are charged directly to the fund that incurred the expense.
Realized and unrealized gains and losses and net investment income, not including class specific expenses, are allocated daily to each class of shares based upon the relative proportion of net assets of each class. Differences in per share distributions, by class, are generally due to differences in class specific expenses.
TG-23
Franklin Templeton Variable Insurance Products Trust
Notes to Financial Statements (unaudited) (continued)
Templeton Growth Securities Fund
1. ORGANIZATION AND SIGNIFICANT ACCOUNTING POLICIES (continued)
g. Accounting Estimates
The preparation of financial statements in accordance with accounting principles generally accepted in the United States of America requires management to make estimates and assumptions that affect the reported amounts of assets and liabilities at the date of the financial statements and the amounts of income and expenses during the reporting period. Actual results could differ from those estimates.
h. Guarantees and Indemnifications
Under the Trust’s organizational documents, its officers and trustees are indemnified by the Trust against certain liabilities arising out of the performance of their duties to the Trust. Additionally, in the normal course of business, the Trust, on behalf of the Fund, enters into contracts with service providers that contain general indemnification clauses. The Trust’s maximum exposure under these arrangements is unknown as this would involve future claims that may be made against the Trust that have not yet occurred. Currently, the Trust expects the risk of loss to be remote.
2. SHARES OF BENEFICIAL INTEREST
At June 30, 2012, there were an unlimited number of shares authorized (without par value). Transactions in the Fund’s shares were as follows:
| Six Months Ended June 30, 2012 | Year Ended December 31, 2011 | |||||||||||||||
| Class 1 Shares: | Shares | Amount | Shares | Amount | ||||||||||||
Shares sold | 28,800,067 | $ | 314,802,820 | 64,351,377 | $ | 689,220,432 | ||||||||||
Shares issued in reinvestment of distributions | 3,052,862 | 30,925,492 | 2,081,912 | 23,962,804 | ||||||||||||
Shares redeemed in-kind (Note 11) | — | — | (62,046 | ) | (778,675 | ) | ||||||||||
Shares redeemed | (20,839,043 | ) | (216,003,146 | ) | (69,960,205 | ) | (697,134,780 | ) | ||||||||
| ||||||||||||||||
Net increase (decrease) | 11,013,886 | $ | 129,725,166 | (3,588,962 | ) | $ | 15,269,781 | |||||||||
| ||||||||||||||||
Class 2 Shares: | ||||||||||||||||
Shares sold | 5,694,749 | $ | 59,743,429 | 8,669,643 | $ | 93,168,510 | ||||||||||
Shares issued in reinvestment of distributions | 2,661,438 | 26,587,764 | 1,706,374 | 19,367,342 | ||||||||||||
Shares redeemed in-kind (Note 11) | — | — | (7,322,431 | ) | (90,358,797 | ) | ||||||||||
Shares redeemed | (11,384,703 | ) | (121,282,388 | ) | (26,665,336 | ) | (294,745,708 | ) | ||||||||
| ||||||||||||||||
Net increase (decrease) | (3,028,516 | ) | $ | (34,951,195 | ) | (23,611,750 | ) | $ | (272,568,653 | ) | ||||||
| ||||||||||||||||
Class 4 Shares: | ||||||||||||||||
Shares sold | 394,746 | $ | 4,211,926 | 552,161 | $ | 6,020,586 | ||||||||||
Shares issued on reinvestment of distributions | 121,914 | 1,228,892 | 66,906 | 766,075 | ||||||||||||
Shares redeemed | (276,019 | ) | (2,940,880 | ) | (559,011 | ) | (6,203,687 | ) | ||||||||
| ||||||||||||||||
Net increase (decrease) | 240,641 | $ | 2,499,938 | 60,056 | $ | 582,974 | ||||||||||
| ||||||||||||||||
TG-24
Franklin Templeton Variable Insurance Products Trust
Notes to Financial Statements (unaudited) (continued)
Templeton Growth Securities Fund
3. TRANSACTIONS WITH AFFILIATES
Franklin Resources, Inc. is the holding company for various subsidiaries that together are referred to as Franklin Templeton Investments. Certain officers and trustees of the Fund are also officers and/or directors of the following subsidiaries:
| Subsidiary | Affiliation | |
Templeton Global Advisors Limited (TGAL) | Investment manager | |
Franklin Templeton Services, LLC (FT Services) | Administrative manager | |
Franklin Templeton Distributors, Inc. (Distributors) | Principal underwriter | |
Franklin Templeton Investor Services, LLC (Investor Services) | Transfer agent |
a. Management Fees
The Fund pays an investment management fee to TGAL based on the average daily net assets of the Fund as follows:
| Annualized Fee Rate | Net Assets | |
| 1.000% | Up to and including $100 million | |
| 0.900% | over $100 million, up to and including $250 million | |
| 0.800% | over $250 million, up to and including $500 million | |
| 0.750% | over $500 million, up to and including $1 billion | |
| 0.700% | over $1 billion, up to and including $5 billion | |
| 0.675% | over $5 billion, up to and including $10 billion | |
| 0.655% | over $10 billion, up to and including $15 billion | |
| 0.635% | over $15 billion, up to and including $20 billion | |
| 0.615% | In excess of $20 billion |
b. Administrative Fees
Under an agreement with TGAL, FT Services provides administrative services to the Fund. The fee is paid by TGAL based on average daily net assets, and is not an additional expense of the Fund.
c. Distribution Fees
The Board adopted distribution plans for Class 2 and Class 4 shares pursuant to Rule 12b-1 under the 1940 Act. Under the Fund’s compensation distribution plans, the Fund pays Distributors for costs incurred in connection with the servicing, sale and distribution of the Fund’s shares up to 0.35% per year of its average daily net assets of each class. The Board has agreed to limit the current rate to 0.25% per year for Class 2.
e. Transfer Agent Fees
Investor Services, under terms of an agreement, performs shareholder servicing for the Fund and is not paid by the Fund for the services.
g. Other Affiliated Transactions
At June 30, 2012, Franklin Templeton Variable Insurance Product Trust – Franklin Templeton VIP Founding Funds Allocation Fund owned 44.81% of the Fund’s outstanding shares.
TG-25
Franklin Templeton Variable Insurance Products Trust
Notes to Financial Statements (unaudited) (continued)
Templeton Growth Securities Fund
4. EXPENSE OFFSET ARRANGEMENT
The Fund has entered into an arrangement with its custodian whereby credits realized as a result of uninvested cash balances are used to reduce a portion of the Fund’s custodian expenses. During the period ended June 30, 2012, the custodian fees were reduced as noted in the Statement of Operations.
5. INCOME TAXES
For tax purposes, capital losses may be carried over to offset future capital gains, if any. Capital loss carryforwards with no expiration, if any, must be fully utilized before those losses with expiration dates.
At December 31, 2011, capital loss carryforwards were as follows:
Capital loss carryforwards expiring in: | ||||
2017 | $ | 240,654,060 | ||
2018 | 55,299,629 | |||
|
| |||
| $295,953,689 | ||||
|
|
At June 30, 2012, the cost of investments and net unrealized appreciation (depreciation) for income tax purposes were as follows:
Cost of investments | $ | 2,917,028,655 | ||
|
| |||
Unrealized appreciation | $ | 289,138,328 | ||
Unrealized depreciation | (584,202,718 | ) | ||
|
| |||
Net unrealized appreciation (depreciation) | $ | (295,064,390 | ) | |
|
| |||
Differences between income and/or capital gains as determined on a book basis and a tax basis are primarily due to differing treatment of wash sales.
6. INVESTMENT TRANSACTIONS
Purchases and sales of investments (excluding short term securities) for the period ended June 30, 2012, aggregated $371,523,048 and $285,912,627, respectively.
7. CONCENTRATION OF RISK
Investing in foreign securities may include certain risks and considerations not typically associated with investing in U.S. securities, such as fluctuating currency values and changing local and regional economic, political and social conditions, which may result in greater market volatility. In addition, certain foreign securities may not be as liquid as U.S. securities.
8. RESTRICTED SECURITIES
The Fund invests in securities that are restricted under the Securities Act of 1933 (1933 Act) or which are subject to legal, contractual, or other agreed upon restrictions on resale. Restricted securities are often purchased in private placement transactions, and cannot be sold without prior registration unless the sale is pursuant to an exemption under the 1933 Act. Disposal of these securities may require greater effort and expense, and prompt sale at an acceptable price may be difficult. The Fund may have registration rights for restricted securities. The issuer generally incurs all registration costs.
TG-26
Franklin Templeton Variable Insurance Products Trust
Notes to Financial Statements (unaudited) (continued)
Templeton Growth Securities Fund
8. RESTRICTED SECURITIES (continued)
At June 30 2012, the Fund held investments in restricted securities, excluding certain securities exempt from registration under the 1933 Act deemed to be liquid, as follows:
| Shares | Issuer | Acquisition Dates | Cost | Value | ||||||||||||
| 1,194,518 | Templeton China Opportunities Fund, Ltd., Reg D (0.48% of Net Assets) | 3/17/10-12/1/11 | $ | 11,935,000 | $ | 12,745,505 | ||||||||||
|
| |||||||||||||||
9. HOLDINGS OF 5% VOTING SECURITIES OF PORTFOLIO COMPANIES
The 1940 Act defines “affiliated companies” to include investments in portfolio companies in which a fund owns 5% or more of the outstanding voting securities. Investments in “affiliated companies” for the Fund for the period ended June 30, 2012, were as shown below.
| Name of Issuer | Number of Shares Held at Beginning of Period | Gross Additions | Gross Reductions | Number of Shares Held at End of Period | Value at End of Period | Investment Income | Realized Capital Gain (Loss) | |||||||||||||||||||||
Non-Controlled Affiliates | ||||||||||||||||||||||||||||
Templeton China Opportunities Fund, Ltd., Reg D | 1,194,518 | — | — | 1,194,518 | $ | 12,745,505 | $ | — | $ | — | ||||||||||||||||||
|
| |||||||||||||||||||||||||||
| Total Affiliated Securities (0.48% of Net Assets) | ||||||||||||||||||||||||||||
10. CREDIT FACILITY
The Fund, together with other U.S. registered and foreign investment funds (collectively, Borrowers), managed by Franklin Templeton Investments, are borrowers in a joint syndicated senior unsecured credit facility totaling $1.5 billion (Global Credit Facility) which matures on January 18, 2013. This Global Credit Facility provides a source of funds to the Borrowers for temporary and emergency purposes, including the ability to meet future unanticipated or unusually large redemption requests.
Under the terms of the Global Credit Facility, the Fund shall, in addition to interest charged on any borrowings made by the Fund and other costs incurred by the Fund, pay its share of fees and expenses incurred in connection with the implementation and maintenance of the Global Credit Facility, based upon its relative share of the aggregate net assets of all of the Borrowers, including an annual commitment fee of 0.08% based upon the unused portion of the Global Credit Facility, which is reflected in other expenses on the Statement of Operations. During the period ended June 30, 2012, the Fund did not use the Global Credit Facility.
11. REDEMPTION IN-KIND
During the year ended December 31, 2011, the Fund realized $9,941,638 of net gains resulting from a redemption in-kind in which a shareholder redeemed fund shares for securities held by the Fund rather than for cash. Because such gains are not taxable to the Fund and are not distributed to remaining shareholders, they have been reclassified from accumulated net realized gains to paid-in capital.
TG-27
Franklin Templeton Variable Insurance Products Trust
Notes to Financial Statements (unaudited) (continued)
Templeton Growth Securities Fund
12. FAIR VALUE MEASUREMENTS
The Fund follows a fair value hierarchy that distinguishes between market data obtained from independent sources (observable inputs) and the Fund’s own market assumptions (unobservable inputs). These inputs are used in determining the value of the Fund’s financial instruments and are summarized in the following fair value hierarchy:
| • | Level 1 – quoted prices in active markets for identical financial instruments |
| • | Level 2 – other significant observable inputs (including quoted prices for similar financial instruments, interest rates, prepayment speed, credit risk, etc.) |
| • | Level 3 – significant unobservable inputs (including the Fund’s own assumptions in determining the fair value of financial instruments) |
The inputs or methodology used for valuing financial instruments are not an indication of the risk associated with investing in those financial instruments.
For movements between the levels within the fair value hierarchy, the Fund has adopted a policy of recognizing the transfers as of the date of the underlying event which caused the movement.
A summary of inputs used as of June 30, 2012, in valuing the Fund’s assets carried at fair value, is as follows:
| Assets: | Level 1 | Level 2 | Level 3 | Total | ||||||||||||
Investments in Securities | ||||||||||||||||
Equity Investments: | ||||||||||||||||
Diversified Financial Services | $ | 98,659,238 | $ | — | $ | 12,745,505 | $ | 111,404,743 | ||||||||
Other Equity Investmentsa,b | 2,431,308,085 | — | — | 2,431,308,085 | ||||||||||||
Short Term Investments | — | 79,251,437 | — | 79,251,437 | ||||||||||||
|
| |||||||||||||||
Total Investments in Securities | $ | 2,529,967,323 | $ | 79,251,437 | $ | 12,745,505 | $ | 2,621,964,265 | ||||||||
|
| |||||||||||||||
aIncludes common preferred stocks as well as other equity investments.
bFor detailed categories, see the accompanying Statement of Investments.
A reconciliation of assets in which Level 3 inputs are used in determining fair value is presented when there are significant Level 3 investments at the end of the period.
13. NEW ACCOUNTING PRONOUNCEMENTS
In December 2011, the Financial Accounting Standards Board (FASB) issued Accounting Standards Update (ASU) No. 2011-11, Balance Sheet (Topic 210): Disclosures about Offsetting Assets and Liabilities. The amendments in the ASU enhance disclosures about offsetting of financial assets and liabilities to enable investors to understand the effect of these arrangements on a fund’s financial position. The ASU is effective for interim and annual reporting periods beginning on or after January 1, 2013. The Fund believes the adoption of this ASU will not have a material impact on its financial statements.
14. SUBSEQUENT EVENTS
The Fund has evaluated subsequent events through the issuance of the financial statements and determined that no events have occurred that require disclosure.
ABBREVIATIONS | ||||
| Selected Portfolio | ||||
| ADR - American Depositary Receipt | ||||
TG-28
Franklin Templeton Variable Insurance Products Trust
Tax Information (unaudited)
Templeton Growth Securities Fund
At December 31, 2011, more than 50% of the Fund’s total assets were invested in securities of foreign issuers. In most instances, foreign taxes were withheld from income paid to the Fund on these investments. As shown in the table below, the Fund hereby reports to shareholders the foreign source income and foreign taxes paid, pursuant to Section 853 of the Internal Revenue Code. This written statement will allow shareholders of record on June 14, 2012, to treat their proportionate share of foreign taxes paid by the Fund as having been paid directly by them. The shareholder shall consider these amounts as foreign taxes paid in the tax year in which they receive the Fund distribution.
The following table provides a detailed analysis of foreign tax paid, and foreign source income as reported by the Fund, to Class 1, Class 2, and Class 4 shareholders of record.
| Class | Foreign Tax Paid Per Share | Foreign Source Income Per Share | ||||||
Class 1 | $ | 0.0106 | $ | 0.2085 | ||||
Class 2 | $ | 0.0106 | $ | 0.1843 | ||||
Class 4 | $ | 0.0106 | $ | 0.1792 | ||||
Foreign Tax Paid Per Share (Column 1) is the amount per share available to you, as a tax credit (assuming you held your shares in the Fund for a minimum of 16 days during the 31-day period beginning 15 days before the ex-dividend date of the Fund’s distribution to which the foreign taxes relate), or, as a tax deduction.
Foreign Source Income Per Share (Column 2) is the amount per share of income dividends attributable to foreign securities held by the Fund, plus any foreign taxes withheld on these dividends.
TG-29
INDEX DESCRIPTIONS
The indexes are unmanaged and include reinvested distributions.
For indexes sourced by Morningstar: © 2012 Morningstar. All Rights Reserved. The information contained herein: (1) is proprietary to Morningstar and/or its content providers; (2) may not be copied or distributed; and (3) is not warranted to be accurate, complete or timely. Neither Morningstar nor its content providers are responsible for any damages or losses arising from any use of this information.
Russell® is a trademark and Russell™ is a servicemark of the Frank Russell Company.
Barclays U.S. Aggregate Index is a market capitalization-weighted index representing the U.S. investment-grade, fixed-rate, taxable bond market with index components for government and corporate, mortgage pass-through and asset-backed securities. All issues included are SEC registered, taxable, dollar denominated and nonconvertible, must have at least one year to final maturity and must be rated investment grade (Baa3/BBB-/BBB- or higher) using the middle rating of Moody’s, Standard & Poor’s and Fitch, respectively.
Barclays U.S. Government Index: Intermediate Component is the intermediate component of the Barclays U.S. Government Index, which includes public obligations of the U.S. Treasury with at least one year to final maturity and publicly issued debt of U.S. government agencies, quasi-federal corporations, and corporate or foreign debt guaranteed by the U.S. government.
Citigroup World Government Bond Index is a market capitalization-weighted index consisting of investment-grade world government bond markets.
Consumer Price Index (CPI), calculated by the U.S. Bureau of Labor Statistics, is a commonly used measure of the inflation rate.
Credit Suisse (CS) High Yield Index is designed to mirror the investable universe of the U.S. dollar-denominated high yield debt market.
Dow Jones Industrial Average is a price-weighted average of blue-chip stocks that are generally the leaders in their industry.
FTSE EPRA/NAREIT Developed Index is a free float-adjusted index designed to measure the performance of publicly traded real estate securities in the North American, European and Asian real estate markets. FTSE® is a trademark of London Stock Exchange Plc and The Financial Times Limited and is used by FTSE under license.
J.P. Morgan (JPM) Global Government Bond Index (GGBI) tracks total returns for liquid, fixed-rate, domestic government bonds with maturities greater than one year issued by developed countries globally.
Lipper Multi-Sector Income Funds Classification Average is calculated by averaging the total returns of all funds within the Lipper Multi-Sector Income Funds classification in the Lipper Open-End underlying funds universe. Lipper Multi-Sector Income Funds are defined as funds that seek current income by allocating assets among different fixed income securities sectors (not primarily in one sector except for defensive purposes), including U.S. and foreign governments, with a significant portion rated below investment grade. For the six-month period ended 6/30/12, there were 231 funds in this category. Lipper calculations do not include contract fees, expenses or sales charges, and may have been different if such charges had been considered.
Lipper VIP Equity Income Funds Classification Average is an equally weighted average calculation of performance figures for all funds within the Lipper Equity Income Funds classification in the Lipper VIP underlying funds universe. Lipper Equity Income Funds seek relatively high current income and growth of income through investing 60% or more of their portfolios in equities. For the six-month period ended 6/30/12, there were 64 funds in this category. Lipper calculations do not include contract fees, expenses or sales charges, and may have been different if such charges had been considered.
Lipper VIP General U.S. Government Funds Classification Average is an equally weighted average calculation of performance figures for all funds within the Lipper General U.S. Government Funds classification in the Lipper VIP underlying funds universe. Lipper General U.S. Government Funds invest primarily in U.S. government and agency issues. For the six-month period ended 6/30/12, there were 84 funds in this category. Lipper calculations do not include contract fees, expenses or sales charges, and may have been different if such charges had been considered.
Lipper VIP High Current Yield Funds Classification Average is an equally weighted average calculation of performance figures for all funds within the Lipper High Current Yield Funds Classification in the Lipper VIP underlying funds universe. Lipper High Current Yield Funds aim at high (relative) current yield from fixed income securities, have no quality or maturity restrictions, and tend to invest in lower grade debt issues. For the six-month period ended 6/30/12, there were 123 funds in this
I-1
category. Lipper calculations do not include contract fees, expenses or sales charges, and may have been different if such charges had been considered.
MSCI All Country (AC) World Index is a free float-adjusted, market capitalization-weighted index designed to measure equity market performance in global developed and emerging markets.
MSCI Emerging Markets (EM) Index is a free float-adjusted, market capitalization-weighted index designed to measure equity market performance in global emerging markets.
MSCI Europe, Australasia, Far East (EAFE) Index is a free float-adjusted, market capitalization-weighted index designed to measure equity market performance in global developed markets excluding the U.S. and Canada.
MSCI Europe, Australasia, Far East (EAFE) Index Net Return (Local Currency) is a free float-adjusted, market capitalization-weighted index designed to measure equity market performance of global developed markets excluding the U.S. and Canada. The index is calculated in local currency and includes reinvested daily net dividends.
MSCI World Index is a free float-adjusted, market capitalization-weighted index designed to measure equity market performance in global developed markets.
NASDAQ Composite Index is a broad-based, market capitalization-weighted index designed to measure all NASDAQ domestic and international based common type stocks listed on The NASDAQ Stock Market.
Russell 1000® Growth Index is market capitalization weighted and measures performance of those Russell 1000® Index companies with higher price-to-book ratios and higher forecasted growth values.
Russell 1000® Index is market capitalization weighted and measures performance of the largest companies in the Russell 3000® Index, which represents the majority of the U.S. market’s total capitalization.
Russell 1000® Value Index is market capitalization weighted and measures performance of those Russell 1000® Index companies with lower price-to-book ratios and lower forecasted growth values.
Russell 2500™ Index is market capitalization weighted and measures performance of the smallest companies in the Russell 3000® Index, which represent a modest amount of the Russell 3000® Index’s total market capitalization.
Russell 2500™ Value Index is market capitalization weighted and measures performance of those Russell 2500™ Index companies with lower price-to-book ratios and lower forecasted growth values.
Russell 3000® Growth Index is market capitalization weighted and measures performance of those Russell 3000® Index companies with higher price-to-book ratios and higher forecasted growth values.
Russell 3000® Index is market capitalization weighted and measures performance of the largest U.S. companies based on total market capitalization and represents the majority of the investable U.S. equity market.
Russell Midcap® Growth Index is market capitalization weighted and measures performance of those Russell Midcap® Index companies with higher price-to-book ratios and higher forecasted growth values.
Russell Midcap® Index is market capitalization weighted and measures performance of the smallest companies in the Russell 1000® Index, which represent a modest amount of the Russell 1000® Index’s total market capitalization.
Standard & Poor’s® 500 Index (S&P 500®) is a market capitalization-weighted index of 500 stocks designed to measure total U.S. equity market performance. STANDARD & POOR’S®, S&P® and S&P 500® are registered trademarks of Standard & Poor’s Financial Services LLC.
Standard & Poor’s/International Finance Corporation Investable (S&P/IFCI) Composite Index is a free float-adjusted, market capitalization-weighted index designed to measure equity performance in global emerging markets.
I-2
Franklin Templeton Variable Insurance Products Trust
Shareholder Information
Board Review of Investment Management Agreement
At a meeting held April 17, 2012, the Board of Trustees (Board), including a majority of non-interested or independent Trustees, approved renewal of the investment management agreement for each of the separate funds within the Trust (Fund(s)). In reaching this decision, the Board took into account information furnished throughout the year at regular Board meetings, as well as information prepared specifically in connection with the annual renewal review process. Information furnished and discussed throughout the year included investment performance reports and related financial information for each Fund, as well as periodic reports on expenses, shareholder services, legal and compliance matters, pricing, brokerage commissions and execution and other services provided by the Investment Manager (Manager) and its affiliates. Information furnished specifically in connection with the renewal process included reports prepared by Lipper, Inc. (Lipper), an independent organization, as well as additional material, including a Fund profitability analysis prepared by management. The Lipper reports compared a Fund’s investment performance and expenses with those of other mutual funds deemed comparable to the Fund as selected by Lipper. The Fund profitability analysis discussed the profitability to Franklin Templeton Investments from its overall U.S. fund operations, as well as on an individual fund-by-fund basis. Additional material accompanying such profitability analysis included information on a fund-by-fund basis listing portfolio managers and other accounts they manage, as well as information on management fees charged by the Manager and its affiliates to U.S. mutual funds and other accounts, including management’s explanation of differences where relevant. Such material also included a memorandum prepared by management describing project initiatives and capital investments relating to the services provided to the Funds by the Franklin Templeton Investments organization, as well as a memorandum relating to economies of scale.
In considering such materials, the independent Trustees received assistance and advice from and met separately with independent counsel. While the investment management agreements for all Funds were considered at the same Board meeting, the Board dealt with each Fund separately. In approving continuance of the investment management agreement for each Fund, the Board, including a majority of independent Trustees, determined that the existing management fee structure was fair and reasonable and that continuance of the investment management agreement was in the best interests of each Fund and its shareholders. While attention was given to all information furnished, the following discusses some primary factors relevant to the Board’s decision.
NATURE, EXTENT AND QUALITY OF SERVICE. The Board was satisfied with the nature and quality of the overall services provided by the Manager and its affiliates to the Funds and their shareholders. In addition to investment performance and expenses discussed later, the Board’s opinion was based, in part, upon periodic reports furnished it showing that the investment policies and restrictions for each Fund were consistently complied with as well as other reports periodically furnished the Board covering matters such as the compliance of portfolio managers and other management personnel with the code of ethics adopted throughout the Franklin Templeton fund complex, the adherence to fair value pricing procedures established by the Board, and the accuracy of net asset value calculations. Favorable consideration was given to management’s continuous efforts and expenditures in establishing back-up systems and recovery procedures to function in the event of a natural disaster, it being noted that such systems and procedures had functioned smoothly during the Florida hurricanes and blackouts experienced in previous years. Among other factors taken into account by the Board were the Manager’s best execution trading policies, including a favorable report by an independent portfolio trading analytical firm, which also covered FOREX transactions. Consideration was also given to the experience of each Fund’s portfolio management team, the number of accounts managed and general method of compensation. In this latter respect, the Board noted that a primary factor in management’s determination of a portfolio manager’s bonus compensation was the relative investment performance of the funds he or she managed and that a portion of such bonus was required to be invested in a predesignated list of funds within such person’s fund management area so as to be aligned with the interests of shareholders. Particular attention was given to management’s conservative approach and diligent risk management procedures, including continuous monitoring of counterparty credit risk and attention given to derivatives and other complex instruments, including expanded collateralization requirements. The Board also took into account, among other things, management’s efforts in establishing a global credit facility for the benefit of the Funds and other accounts managed by Franklin Templeton Investments to provide a source of cash for temporary and emergency purposes or to meet unusual redemption requests as well as the strong financial position of the Manager’s parent company and its commitment to the mutual fund business as evidenced by its subsidization of money market funds.
SI-1
Franklin Templeton Variable Insurance Products Trust
Shareholder Information (continued)
Board Review of Investment Management Agreement (continued)
INVESTMENT PERFORMANCE. The Board placed significant emphasis on the investment performance of each of the Funds in view of its importance to shareholders. While consideration was given to performance reports and discussions with portfolio managers at Board meetings throughout the year, particular attention in assessing performance was given to the Lipper reports furnished for the agreement renewals of all Funds. The Lipper reports prepared for each of the individual Funds showed the investment performance of Class 1 shares for those Funds having such class of shares and Class 2 shares for those Funds that did not have Class 1 shares, in comparison to a performance universe selected by Lipper. Comparative performance for each Fund was shown for the one-year period ended January 31, 2012, and previous periods ended that date of up to 10 years unless otherwise noted. Performance was shown on a total return basis for each Fund and in certain cases, as indicated, on an income return basis as well. The following summarizes the performance results for each of the Funds and the Board’s view of such performance.
Franklin Flex Cap Growth Securities Fund – The performance universe for this Fund, which has been in operation for less than 10 full years, consisted of the Fund and all multi-cap growth funds underlying variable insurance products as selected by Lipper. The Lipper report showed the Fund’s comparative total return for the one-year period to be in the second-lowest quintile of its performance universe, and on an annualized basis to be in the second-lowest quintile of such universe for the previous three-year period and the middle quintile of such universe for the previous five-year period. The Board was not satisfied with the Fund’s recent underperformance and discussed the reasons for such performance and steps being taken to improve it, as well as the Fund’s portfolio management team with upper management. Based on such discussions and taking into account the Fund’s more acceptable longer term performance, the Board did not believe any immediate change in portfolio management was warranted, but intends to monitor future performance.
Franklin Global Real Estate Securities Fund – The performance universe for this Fund consisted of the Fund and all real estate funds underlying variable insurance products as selected by Lipper. The Lipper report showed the Fund’s total return to be in the second-lowest quintile of such universe for the one-year period, and on an annualized basis to be in the lowest quintile of such universe for the previous three-, five- and 10-year periods. The Lipper universe includes all real estate funds underlying variable annuities and is not limited to those having a global mandate such as the Fund. The Board noted, however, among the 14 global real estate funds with 26 share classes included in such universe, that the Fund’s Class 1 shares had the highest and second-highest total returns for the previous one and two years, respectively. The Board also noted steps that had been taken by management to improve the Fund’s performance, including the appointment of an additional portfolio manager in 2010. While the Board intends to continue monitoring the Fund’s results, it was satisfied with the efforts being made by management to improve performance and believed no change in portfolio management was warranted, noting the Fund’s favorable relative performance with respect to other global real estate funds as referred to above.
Franklin Growth and Income Securities Fund – The performance universe for this Fund consisted of the Fund and all equity income funds underlying variable insurance products as selected by Lipper. The Lipper report showed the Fund’s income return during the one-year period to be in the highest or best performing quintile of its performance universe, and on an annualized basis in each of the previous three-, five- and 10-year periods to also be in the highest quintile of such universe. The Lipper report showed the Fund’s total return for the one-year period to be in the second-highest quintile of its performance universe, and on an annualized basis to be in the highest quintile of such universe for the previous three-year period, the second-highest quintile of such universe for the previous five-year period, and the second-lowest quintile of such universe for the previous 10-year period. The Board was satisfied with the Fund’s performance as shown in the Lipper report.
Franklin High Income Securities Fund – The performance universe for this Fund consisted of the Fund and all high current yield funds underlying variable insurance products as selected by Lipper. The Lipper report showed the Fund’s income return for the one-year period to be in the second-lowest quintile of such universe, and on an annualized basis to also be in the second-lowest quintile for the previous three- and five-year periods, but to be in the highest quintile of such universe for the previous 10-year period. The Lipper report showed the Fund’s total return to be in the second-highest quintile of its performance universe for the one-year period, and on an annualized basis to be in the middle quintile of such universe for the previous three-year period, the second-highest quintile of such universe for the previous five-year period, and the middle quintile of such universe for the previous 10-year period. The Board believed the Fund’s performance as shown in the Lipper report to be acceptable and did not
SI-2
Franklin Templeton Variable Insurance Products Trust
Shareholder Information (continued)
Board Review of Investment Management Agreement (continued)
warrant any change in portfolio management. In reaching such conclusion, the Board noted that the Fund’s overall favorable comparative total returns and the level of its annualized income return, which amounted to 6.40%, 6.96%, and 7.53% for the one-, three- and five-year periods, respectively, appeared generally consistent with the Fund’s investment objective of earning a high level of current income with capital appreciation as a secondary goal.
Franklin Income Securities Fund – The performance universe for this Fund consisted of the Fund and all mixed-asset target allocation moderate funds underlying variable insurance products as selected by Lipper. The Lipper report showed the Fund’s income return to be in the highest or best performing quintile of such universe for the one-year period and to also be in the highest quintile of such universe for each of the previous three-, five- and 10-year periods on an annualized basis. The Lipper report showed the Fund’s total return to be in the middle quintile of its performance universe for the one-year period and on an annualized basis to be in the highest or second-highest quintile of such universe for each of the previous three-, five- and 10-year periods. The Board was satisfied with the Fund’s comparative performance as shown in the Lipper report.
Franklin Large Cap Growth Securities Fund – The performance universe for this Fund consisted of the Fund and all large-cap core funds underlying variable insurance products as selected by Lipper. The Lipper report showed the Fund’s comparative total return to be in the upper half of such universe for the one-year period, and on an annualized basis to be in the second-lowest quintile of such universe for the previous three-year period, the second-highest quintile of such universe for the previous five-year period, and the second-lowest quintile of such universe for the previous 10-year period. The Board believed the Fund’s overall performance as set forth in the Lipper report to be acceptable, noting that its three- and 10-year annualized returns in each case were within 50 basis points of the performance universe median.
Franklin Large Cap Value Securities Fund – The performance universe for this Fund, which has been in operation for less than 10 full years, consisted of the Fund and all large-cap value funds underlying variable insurance products as selected by Lipper. The Lipper report showed the Fund’s total return to be in the lowest quintile of such universe for the one-year period and on an annualized basis to be in the second-highest quintile and middle quintile of such universe for the previous three- and five-year periods, respectively. The Board discussed with management the reasons for the Fund’s one-year underperformance, including its holdings in energy stocks exposed to natural gas, which were hurt by lower gas prices, and also discussed steps being taken to improve performance, which included the addition of an experienced investment analyst to provide support for the Fund’s lead manager. Based on such discussions and the Fund’s longer term performance, the Board did not believe that any change in the Fund’s portfolio management was warranted.
Franklin Rising Dividends Securities Fund – The performance universe for this Fund consisted of the Fund and all multi-cap core funds underlying variable insurance products as selected by Lipper. The Lipper report showed the Fund’s comparative total return to be in the highest or best performing quintile of the performance universe for the one-year period, and on an annualized basis to be in the highest or second-highest quintile of such universe for each of the three-, five- and 10-year periods. The Board was satisfied with the Fund’s performance as set forth in the Lipper report.
Franklin Small Cap Value Securities Fund – The performance universe for this Fund consisted of the Fund and all small-cap value funds underlying variable insurance products as selected by Lipper. The Lipper report showed the Fund’s total return for the one-year period to be in the second-highest performing quintile of such performance universe, and on an annualized basis to also be in the second-highest quintile of such universe for each of the previous three- and five-year periods, and in the upper half of such universe for the previous 10-year period. The Board found the Fund’s comparative performance as set forth in the Lipper report to be satisfactory.
Franklin Small-Mid Cap Growth Securities Fund – The performance universe for this Fund consisted of the Fund and all mid-cap growth funds underlying variable insurance products as selected by Lipper. The Lipper report showed the Fund’s total return for the one-year period to be in the upper half of such universe, and on an annualized basis to also be in the upper half of such universe for each of the previous three- and five-year periods, and to be in the second-lowest quintile of such universe for the previous 10-year period. The Board found the Fund’s comparative investment performance as set forth in the Lipper report to be acceptable.
SI-3
Franklin Templeton Variable Insurance Products Trust
Shareholder Information (continued)
Board Review of Investment Management Agreement (continued)
Franklin Strategic Income Securities Fund – The performance universe for this Fund consisted of the Fund and all general bond funds underlying variable insurance products as selected by Lipper. The Lipper report showed the Fund’s income return to be in the second-highest quintile of such performance universe for the one-year period, and on an annualized basis to also be in the second-highest quintiles of such universe during the previous three- and five-year periods, and in the second-lowest quintile of such universe for the previous 10-year period. The Lipper report showed the Fund’s total return to be in the second-lowest quintile of such universe during the one-year period, and on an annualized basis to be in the upper half of such universe for each of the previous three- and five-year periods, and in the highest quintile of such universe for the previous 10-year period. The Board was generally satisfied with the Fund’s performance as shown in the Lipper report, noting its primary income objective and the fact that its total return for the one-year period exceeded 5%.
Franklin Templeton VIP Founding Funds Allocation Fund – The performance universe for this Fund consisted of the Fund and all mixed-asset target allocation growth funds underlying variable insurance products as selected by Lipper. The Fund has been in existence for only four full years and the Lipper report showed its income return to be in the lowest quintile of such performance universe for the one-year period, and on an annualized basis to be in the middle quintile of such universe for its four-year period of operation. The Lipper report showed the Fund’s total return for the one-year period to be in the second-lowest quintile of such universe and on an annualized basis to be in the lowest quintile of such universe for its four-year period of operation. In assessing the relevance of such comparative performance, the Board noted the Fund is not actively managed and that its performance reflects those of the three underlying funds in which it invests in equal portions. The Board reviewed and discussed the performance of such underlying funds with management and believes that each is being managed in accordance with its underlying investment mandate. The Board also notes management’s explanation that the performance of certain of the underlying funds reflects the general underperformance of value stocks during the past year. In view of the foregoing and taking into account the nature of the Fund and its short period of operation, the Board did not believe the Fund’s comparative investment performance as set forth in the Lipper report mandated any change in the investment strategy followed or manner in which the Fund operates.
Franklin U.S. Government Fund – The performance universe for this Fund consisted of the Fund and all general U.S. government funds underlying variable insurance products as selected by Lipper. The Lipper report showed the Fund’s income return for the one-year period to be in the second-highest quintile of such universe and on an annualized basis to be in the highest or second-highest quintile of such universe for each of the previous three-, five- and 10-year periods. The Lipper report showed the Fund’s total return to be in the lowest quintile of such universe for the one-year period, and on an annualized basis to be in the lowest quintile of such universe for the previous three-year period, the second-lowest quintile of such universe for the previous five-year period, and the middle quintile of such universe for the previous 10-year period. The Board found the Fund’s comparative performance as shown in the Lipper report to be acceptable, noting the Fund’s income objective, the nature of the Fund’s investments, which were primarily in U.S. mortgage-backed securities, and the fact that its total return exceeded 6% for the one-year period and exceeded 5% for all annualized periods shown in such report.
Mutual Global Discovery Securities Fund – The performance universe for this Fund consisted of the Fund and all global value funds underlying variable insurance products as selected by Lipper. The Lipper report showed the Fund’s total return to be in the highest quintile of such universe for the one-year period, and on an annualized basis to be in the lowest quintile of such universe for the three-year period, but to be in the highest quintile of such universe for each of the previous five- and 10-year periods. The Board found the Fund’s overall comparative performance as set forth in the Lipper report to be acceptable.
Mutual International Securities Fund – The performance universe for this Fund consisted of the Fund and all other international value funds underlying variable insurance products as selected by Lipper. The Fund has been in existence for only two full years at the date of the Lipper report, which showed its total return during each such year to be in either the highest or second-highest performing quintile of such universe. The Board was pleased with such comparative performance, but did not believe it to be particular meaningful in view of the Fund’s short period of operations.
Mutual Shares Securities Fund – The performance universe for this Fund consisted of the Fund and all large-cap value funds underlying variable insurance products as selected by Lipper. The Lipper report showed the Fund’s income return for the
SI-4
Franklin Templeton Variable Insurance Products Trust
Shareholder Information (continued)
Board Review of Investment Management Agreement (continued)
one-year period to be in the highest or best performing quintile of such universe, and on an annualized basis to be in either the highest or second-highest quintile of such universe for each of the previous three-, five- and 10-year periods. The Lipper report showed the Fund’s total return for the one-year period to be in the middle quintile of the performance universe, and on an annualized basis to be in the lowest quintile of such universe for the previous three-year period, the middle quintile of such universe for the previous five-year period, and the highest quintile of such universe for the previous 10-year period. The Board found the Fund’s overall performance as shown in the Lipper report to be acceptable, noting its annualized three-year total return exceeded 15%.
Templeton Developing Markets Securities Fund – The performance universe for this Fund consisted of the Fund and all emerging markets funds underlying variable insurance products as selected by Lipper. The Lipper report showed the Fund’s comparative total return for the one-year period to be in the highest or best performing quintile of such performance universe and on an annualized basis to be in the second-highest quintile of such universe during each of the previous three- and five-year periods, and the middle quintile of such universe during the previous 10-year period. The Board was satisfied with the comparative performance of the Fund as set forth in the Lipper report.
Templeton Foreign Securities Fund – The performance universe for this Fund consisted of the Fund and all international value funds underlying variable insurance products as selected by Lipper. The Lipper report showed the Fund’s comparative total return for the one-year period to be in the highest or best performing quintile of such performance universe and on an annualized basis to be in the highest or best performing quintile of such universe in each of the previous three- and five-year periods, and the second-highest quintile of such universe for the previous 10-year period. The Board was satisfied with the Fund’s comparative investment performance as set forth in the Lipper report.
Templeton Global Bond Securities Fund – The performance universe for this Fund consisted of the Fund and all global income funds underlying variable insurance products as selected by Lipper. The Lipper report showed the Fund’s income return for the one-year period to be in the highest or best performing quintile of such performance universe, and on an annualized basis to also be in the highest or best performing quintile of such universe for each of the previous three-, five- and 10-year periods. The Lipper report showed the Fund’s total return for the one-year period to be in the second-lowest performing quintile of its performance universe, but on an annualized basis to be in the highest or second-highest quintile of such universe during each of the previous three-, five- and 10-year periods. The Board discussed with management the reasons for the relative underperformance of the Fund’s total return as shown in the Lipper report for the one-year period, noting, however, that it exceeded 5%. The Board was satisfied with the Fund’s comparative performance as set forth in the Lipper report.
Templeton Growth Securities Fund – The performance universe for this Fund consisted of the Fund and all global value funds underlying variable insurance products as selected by Lipper. The Lipper report showed the Fund’s total return for the one-year period to be in the second-lowest quintile of such performance universe and on an annualized basis to also be in the second-lowest quintile of such universe for each of the previous three-, five- and 10-year periods. The Board was not satisfied with the Fund’s comparative performance as set forth in the Lipper report and discussed the Fund’s portfolio management team, performance and investment process in detail with upper management. Such discussion included the analytic process and reviews followed by the Fund’s portfolio managers in selecting securities for investment and the conviction of the Fund’s portfolio management team with the correctness of adhering to their disciplined, long-term, bottom-up, fundamental approach to investing. Based on such discussions, the Board did not believe any immediate change in portfolio management was warranted, but intends to continuously monitor future performance.
COMPARATIVE EXPENSES. Consideration was given to expense comparison information contained in the Lipper reports furnished for each Fund, which compared its management fee and total expense ratio with those of a group of other funds selected by Lipper as its appropriate Lipper expense group. Lipper expense data is based upon information taken from each fund’s most recent annual report, which reflects historical asset levels that may be quite different from those currently existing, particularly in a period of market volatility. While recognizing such inherent limitation and the fact that expense ratios generally increase as assets decline and decrease as assets grow, the Board believed the independent analysis conducted by Lipper to be an appropriate measure of comparative expenses. In reviewing comparative costs, Lipper provides information on a Fund’s
SI-5
Franklin Templeton Variable Insurance Products Trust
Shareholder Information (continued)
Board Review of Investment Management Agreement (continued)
contractual investment management fee rate in comparison with the contractual investment management fee rate that would have been charged by other funds within its Lipper expense group assuming they were similar in size to the Fund, as well as the actual total expense ratio of the Fund in comparison with those of its Lipper expense group. The Lipper contractual investment management fee analysis includes administrative charges at the fund level as being part of a management fee, and actual total expenses, for comparative consistency, are shown by Lipper for the same class of shares for all funds within a particular Lipper expense group. The results of such comparisons showed that both the contractual investment management fee rates and actual total expense ratios of the following Funds were in the least expensive quintile of their respective Lipper expense groups: Franklin Income Securities Fund, Franklin Small Cap Value Securities Fund, Franklin Growth and Income Securities Fund, Franklin High Income Securities Fund, Franklin Strategic Income Securities Fund and Templeton Global Bond Securities Fund. The Board was satisfied with the comparative contractual investment management fees and expenses of these Funds as shown in their Lipper reports. The contractual investment management fee rates and actual total expense ratios of each of Franklin Rising Dividend Securities Fund, Franklin Small-Mid Cap Growth Securities Fund and Franklin U.S. Government Fund were below the medians of their Lipper expense groups. The contractual investment management fee rate of Templeton Foreign Securities Fund was less than one-half of a basis point above the median of its Lipper expense group, while its actual total expense ratio was below the median of such group. The contractual investment fee rate and actual total expense ratio of Franklin Templeton VIP Founding Funds Allocation Fund were both at the median of its Lipper expense group. The Board was satisfied with the comparative contractual investment management fees and expenses of these Funds as shown in their Lipper reports. The contractual investment management fee rates for Mutual International Securities Fund, Templeton Growth Securities Fund and Franklin Large Cap Value Securities Fund were in the most expensive quintiles of their Lipper expense groups, but in each case their actual total expense ratios were below the median of such groups. The Board was satisfied with the comparative expenses of these Funds as shown in their Lipper reports, noting that, with the exception of Templeton Growth Securities Fund, the expenses of these Funds were subsidized through fee waivers. The contractual investment management fee rate of Franklin Flex Cap Growth Securities Fund was 13 basis points above its Lipper expense group median, while its actual total expense ratio was below its expense group median. The Board found the comparative expenses of this Fund as shown in its Lipper report to be acceptable, noting its expenses were subsidized through fee waivers. The contractual investment management fee rate and actual expense ratio for Franklin Large Cap Growth Securities Fund were in each case above but within eight basis points of the median of its Lipper expense group. The contractual investment fee rate of Franklin Global Real Estate Securities Fund was 20 basis points higher than the median of its Lipper expense group while its actual expense ratio was within nine basis points of its expense group median. The Board found the comparative expenses of these Funds as shown in their Lipper reports to be acceptable, noting with respect to Franklin Global Real Estate Securities Fund that a phased-in increase in its contractual investment fee rate had been approved by shareholders in 2007. The contractual investment management fee rate and actual total expense ratio of Templeton Developing Markets Securities Fund were both above the median of its Lipper expense group, but in each case were within 17 basis points of such median. The Board found the comparative expenses of this Fund to be acceptable, noting cost factors relating to the Fund’s operations, such as the quality and experience of its portfolio managers and research staff and the depth of its physical presence and coverage in developing markets geographical areas, as well as the fact that its investment management fee had been reduced effective May 1, 2011. The contractual investment management fee rates of both Mutual Global Discovery Securities Fund and Mutual Shares Securities Fund were in the most expensive quintiles of their Lipper expense groups, while the actual total expense ratio of Mutual Global Discovery Fund was 17 basis points above its expense group median, and the actual total expense ratio of Mutual Shares Securities Fund was four basis points above its expense group median. In discussing these comparative expenses, management stated its view that the expenses of these Funds were at an appropriate level in view of their overall favorable comparative investment performance, the quality and experience of their portfolio managers and the research-driven fundamental value strategy employed in their portfolio selections. The Board found the comparative expenses of these Funds to be acceptable noting the points raised by management.
MANAGEMENT PROFITABILITY. The Board also considered the level of profits realized by the Manager and its affiliates in connection with the operation of each Fund. In this respect, the Board reviewed the Fund profitability analysis that addresses the overall profitability of Franklin Templeton’s U.S. fund business, as well as its profits in providing management and other services to each of the individual funds during the 12-month period ended September 30, 2011, being the most recent fiscal year-end for Franklin Resources, Inc., the Manager’s parent. In reviewing the analysis, specific attention was given to the methodology
SI-6
Franklin Templeton Variable Insurance Products Trust
Shareholder Information (continued)
Board Review of Investment Management Agreement (continued)
followed in allocating costs to each Fund, it being recognized that allocation methodologies are inherently subjective and various allocation methodologies may each be reasonable while producing different results. In this respect, the Board noted that, while being continuously refined and reflecting changes in the Manager’s own cost accounting, the allocation methodology was consistent with that followed in profitability report presentations for the Funds made in prior years and that the Funds’ independent registered public accounting firm had been engaged by the Manager to review the reasonableness of the allocation methodologies solely for use by the Funds’ Board in reference to the profitability analysis. In reviewing and discussing such analysis, management discussed with the Board its belief that costs incurred in establishing the infrastructure necessary for the type of mutual fund operations conducted by the Manager and its affiliates may not be fully reflected in the expenses allocated to each Fund in determining its profitability, as well as the fact that the level of profits, to a certain extent, reflected operational cost savings and efficiencies initiated by management. The Board also took into account management’s expenditures in improving services provided the Funds, as well as the need to implement systems to meet additional regulatory and compliance requirements resulting from statutes such as the Sarbanes-Oxley and Dodd-Frank Acts and recent SEC and other regulatory requirements. In addition, the Board considered a third-party study comparing the profitability of the Manager’s parent on an overall basis to other publicly held managers broken down to show profitability from management operations exclusive of distribution expenses, as well as profitability including distribution expenses. The Board also considered the extent to which the Manager and its affiliates might derive ancillary benefits from Fund operations, including potential benefits resulting from allocation of fund brokerage and the use of commission dollars to pay for research. Based upon its consideration of all these factors, the Board determined that the level of profits realized by the Manager and its affiliates from providing services to each Fund was not excessive in view of the nature, quality and extent of services provided.
ECONOMIES OF SCALE. The Board also considered whether economies of scale are realized by the Manager as the Funds grow larger and the extent to which this is reflected in the level of management fees charged. While recognizing that any precise determination is inherently subjective, the Board noted that based upon the Fund profitability analysis, it appears that as some funds get larger, at some point economies of scale do result in the Manager realizing a larger profit margin on management services provided such a fund. The Board also noted that economies of scale are shared with a fund and its shareholders through management fee breakpoints so that as a fund grows in size, its effective management fee rate declines. In the case of Franklin Templeton VIP Founding Funds Allocation Fund, the management fees of the underlying funds in which it invests have management fee breakpoints that extend beyond their existing asset sizes, and in the case of each of the other Funds, their management fees contain breakpoints that extend beyond their existing asset sizes. To the extent economies of scale may be realized by the manager and its affiliates, the Board believed the schedule of investment management fees provides a sharing of benefits for each Fund and its shareholders.
Proxy Voting Policies and Procedures
The Trust’s investment manager has established Proxy Voting Policies and Procedures (Policies) that the Trust uses to determine how to vote proxies relating to portfolio securities. Shareholders may view the Trust’s complete Policies online at franklintempleton.com. Alternatively, shareholders may request copies of the Policies free of charge by calling the Proxy Group collect at (954) 527-7678 or by sending a written request to: Franklin Templeton Companies, LLC, 300 S.E. 2nd Street, Fort Lauderdale, FL 33301, Attention: Proxy Group. Copies of the Trust’s proxy voting records are also made available online at franklintempleton.com and posted on the U.S. Securities and Exchange Commission’s website at sec.gov and reflect the most recent 12-month period ended June 30.
Quarterly Statement of Investments
The Trust files a complete statement of investments with the U.S. Securities and Exchange Commission for the first and third quarters for each fiscal year on Form N-Q. Shareholders may view the filed Form N-Q by visiting the Commission’s website at sec.gov. The filed form may also be viewed and copied at the Commission’s Public Reference Room in Washington, DC. Information regarding the operations of the Public Reference Room may be obtained by calling (800) SEC-0330.
SI-7
| VALUE | BLEND | GROWTH | SECTOR | GLOBAL | INTERNATIONAL | HYBRID | ASSET ALLOCATION | FIXED INCOME |
 | < GAIN FROM OUR PERSPECTIVE® > |
Semiannual Report
FRANKLIN TEMPLETON
VARIABLE INSURANCE PRODUCTS TRUST
Investment Managers
Franklin Advisers, Inc.
Franklin Advisory Services, LLC
Franklin Mutual Advisers, LLC
Franklin Templeton Institutional, LLC
Templeton Asset Management, Ltd.
Templeton Global Advisors Limited
Templeton Investment Counsel, LLC
Fund Administrator
Franklin Templeton Services, LLC
Distributor
Franklin Templeton Distributors, Inc.
Franklin Templeton Variable Insurance Products Trust (FTVIP) shares are not offered to the public; they are offered and sold only to: (1) insurance company separate accounts (Separate Account) to serve as the underlying investment vehicle for variable contracts; (2) certain qualified plans; and (3) other mutual funds (funds of funds).
Authorized for distribution to investors in Separate Accounts only when accompanied or preceded by the current prospectus for the applicable contract, which includes the Separate Account and the FTVIP prospectuses. Investors should carefully consider a fund’s investment goals, risks, charges and expenses before investing. The prospectus contains this and other information; please read it carefully before investing.
To ensure the highest quality of service, telephone calls to or from our service departments may be monitored, recorded and accessed. These calls can be identified by the presence of a regular beeping tone.
| © 2012 Franklin Templeton Investments. All rights reserved. | VIP4 S 08/12 |
| Item 2. | Code of Ethics. |
| (a) | The Registrant has adopted a code of ethics that applies to its principal executive officers and principal financial and accounting officer. |
| (c) | N/A |
| (d) | N/A |
| (f) | Pursuant to Item 12(a)(1), the Registrant is attaching as an exhibit a copy of its code of ethics that applies to its principal executive officers and principal financial and accounting officer. |
| Item 3. | Audit Committee Financial Expert. |
| (a) | (1) The Registrant has an audit committee financial expert serving on its audit committee. |
| (2) The audit committee financial expert is John B. Wilson and he is “Independent” as defined under the relevant Securities and Exchange Commission Rules and Releases. |
Item 4. Principal Accountant Fees and Services. | N/A | |
Item 5. Audit Committee of Listed Registrants. | N/A | |
Item 6. Schedule of Investments. | N/A | |
Item 7. Disclosure of Proxy Voting Policies and Procedures for Closed-End Management Investment Companies. | N/A | |
Item 8. Portfolio Managers of Closed-End Management Investment Companies. | N/A | |
Item 9. Purchases of Equity Securities by Closed-End Management Investment Companies and Affiliated Purchasers. | N/A | |
| Item 10. | Submission of Matters to a vote of Security Holders. |
There have been no changes to the procedures by which shareholders may recommend nominees to the Registrant’s Board of Trustees that would require disclosure herein.
| Item 11. | Controls and Procedures. |
(a) Evaluation of Disclosure Controls and Procedures. The Registrant maintains disclosure controls and procedures that are designed to ensure that information required to be disclosed in the Registrant’s filings under the Securities Exchange Act of 1934 and the Investment Company Act of 1940 is recorded, processed, summarized and reported within the periods specified in the rules and forms of the Securities and Exchange Commission. Such information is accumulated and communicated to the Registrant’s management, including its principal executive officer and principal financial officer, as appropriate, to allow timely decisions regarding required disclosure. The Registrant’s management, including the principal executive officer and the principal financial officer, recognizes that any set of controls and procedures, no matter how well designed and operated, can provide only reasonable assurance of achieving the desired control objectives.
Within 90 days prior to the filing date of this Shareholder Report on Form N-CSR, the Registrant had carried out an evaluation, under the supervision and with the participation of the Registrant’s management, including the Registrant’s principal executive officer and the Registrant’s principal financial officer, of the effectiveness of the design and operation of the Registrant’s disclosure controls and procedures. Based on such evaluation, the Registrant’s principal executive officer and principal financial officer concluded that the Registrant’s disclosure controls and procedures are effective.
(b) Changes in Internal Controls. There have been no significant changes in the Registrant’s internal controls or in other factors that could significantly affect the internal controls subsequent to the date of their evaluation in connection with the preparation of this Shareholder Report on Form N-CSR.
| Item 12. | Exhibits. |
| (a) | (1) Code of Ethics |
| (a) | (2) Certifications pursuant to Section 302 of the Sarbanes-Oxley Act of 2002 of Laura F. Fergerson, Chief Executive Officer – Finance and Administration, and Gaston Gardey, Chief Financial Officer and Chief Accounting Officer |
| (b) | Certifications pursuant to Section 906 of the Sarbanes-Oxley Act of 2002 of Laura F. Fergerson, Chief Executive Officer – Finance and Administration, and Gaston Gardey, Chief Financial Officer and Chief Accounting Officer |
SIGNATURES
Pursuant to the requirements of the Securities Exchange Act of 1934 and the Investment Company Act of 1940, the registrant has duly caused this report to be signed on its behalf by the undersigned, thereunto duly authorized.
FRANKLIN TEMPLETON VARIABLE INSURANCE PRODUCTS TRUST
| By | /s/ LAURA F. FERGERSON | |
Laura F. Fergerson Chief Executive Officer – Finance and Administration | ||
Date August 24, 2012
Pursuant to the requirements of the Securities Exchange Act of 1934 and the Investment Company Act of 1940, this report has been signed below by the following persons on behalf of the registrant and in the capacities and on the dates indicated.
| By | /s/ LAURA F. FERGERSON | |
Laura F. Fergerson Chief Executive Officer – Finance and Administration | ||
Date August 24, 2012
| By | /s/ GASTON GARDEY | |
Gaston Gardey Chief Financial Officer and Chief Accounting Officer | ||
Date August 24, 2012