UNITED STATES
SECURITIES AND EXCHANGE COMMISSION
Washington, D.C. 20549
FORM N-CSR
CERTIFIED SHAREHOLDER REPORT OF REGISTERED
MANAGEMENT INVESTMENT COMPANIES
Investment Company Act file number 811-5639
Pacholder High Yield Fund, Inc
(Exact name of registrant as specified in charter)
8044 Montgomery Road, Ste. 555, Cincinnati, OH 45236
(Address of principal executive offices) (Zip code)
William J. Morgan
8044 Montgomery Road, Ste. 555
Cincinnati, OH 45236
(Name and address of agent for service)
Registrant’s telephone number, including area code: 513-985-3200
Date of fiscal year end: December 31, 2005
Date of reporting period: January 1, 2005 through December 31, 2005
| Item 1. | Reports to Stockholders. |
PACHOLDER HIGH YIELD FUND, INC.
Directors and Officers
| | |
William J. Morgan President and Director James P. Shanahan, Jr. Secretary James E. Gibson Treasurer David A. Groshoff, Esq. Chief Compliance Officer | | John F. Williamson Chairman and Director George D. Woodard Director Daniel A. Grant Director |
Investment Advisor
Pacholder & Company, LLC
Administrator
JPMorgan Funds Management, Inc.
Custodian
Bank One Trust Company, N.A.
Transfer Agent
Computershare, LLC
Legal Counsel
Kirkpatrick & Lockhart Nicholson Graham LLP
Independent Registered Public Accounting Firm
PricewaterhouseCoopers LLP
Executive Offices
Pacholder High Yield Fund, Inc.
8044 Montgomery Road
Suite 555
Cincinnati, Ohio 45236
(513) 985-3200
Please visit our web site, www.phf-hy.com, for information on the Fund’s NAV, share price, news releases, and SEC filings. We created this site to provide stockholders quick and easy access to the timeliest information available regarding the Fund.
This report is for the information of stockholders of Pacholder High Yield Fund, Inc. It is not a prospectus, offering circular or other representation intended for use in connection with the purchase or sale of shares of the Fund or any securities mentioned in this report.
PACHOLDER HIGH YIELD FUND, INC.
ANNUAL REPORT
DECEMBER 31, 2005
PACHOLDER HIGH YIELD FUND, INC.
Dear Stockholders:
Fourth Quarter and Annual Overview
The Pacholder High Yield Fund, Inc. (the “Fund”) and the high yield market finished a choppy 2005 on a positive note. For the year ended December 31, 2005, the Fund returned +3.33% based on Net Asset Value (i.e., net of expenses, including preferred stock dividends, and the effect of the Fund’s leveraged capital structure), and the Fund’s portfolio (gross of leverage, fees and expenses) returned +4.48%. This compares favorably to the average total return of all closed-end high yield funds of +2.37%, as reported by Morningstar, and the +2.03% return of the Credit Suisse First Boston High Yield Index, Developed Countries Only (the “Index”).
The strong relative performance of the Fund’s portfolio in 2005 was attributable primarily to the very strong returns of several individual securities, primarily distressed securities which the Fund purchased for total return. Total return investments in Mirant, Kaiser Group Holdings and Oglebay Norton were notable contributors in 2005.
For the fourth quarter, which ended December 31, 2005, the Fund posted a net total return of +1.44% based on Net Asset Value, outperforming the average total return of all closed-end high yield funds as reported by Morningstar of +0.91% and the Index’s total return of +0.54%. The Fund’s portfolio (gross of leverage, fees and expenses) returned +1.70% for the quarter.
The fourth quarter began on a weak tone. The market correction that began in September continued through October as rising interest rates, fears of higher inflation and weak equity markets moved the high yield market downward. A mid-November rally fueled by a drop in interest rates and rising stock prices brought positive performance back to the high yield market. This momentum continued through December and into January.
High yield issuers continue to report generally stable or improving results, and, with the consensus estimate of GDP growth rate of 3.5% for 2005, we expect this trend to continue into 2006. Nevertheless, we expect certain industries, such as Autos and Paper, to continue to face challenging industry conditions. The trailing twelve-month default rate for below investment grade issuers, as measured by Moody’s Investor Services, dropped from 2.3% in 2004 to 1.8% in 2005. Moody’s currently expects defaults to rise to 3.0% by the end of 2006, still well below the long-term average. Moody’s had originally predicted defaults to rise in 2005 but the default rate actually dropped to its lowest rate since 1997 because of the continued economic growth, strong corporate profits, low relative interest rates and liquidity available in the capital markets.
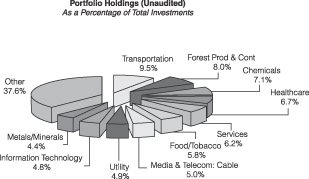
The fourth quarter showed mixed performance across most of the Index’s industry sectors as 13 of 19 sectors posted positive returns. Industry sectors of the high yield market that performed relatively well during the quarter were Aerospace (Airlines), Gaming/Leisure and Service. Sectors that provided weak relative performance included Transportation (Auto), Utility and Retail. The Fund’s portfolio is well diversified, with investments in 174 issuers in 19 different industries. As of December 31, 2005, the Fund’s largest industry sector concentration was in Transportation, which accounted for 9.49% of the portfolio’s long-term market value as of December 31, 2005 (see Figure 1 — Portfolio Holdings). We increased our exposure in this sector in a number of investments when the sector came under pressure in the market due to a number of downgrades from investment grade status.
The rising interest rate environment and its impact on the high yield market during the fourth quarter of 2005 were evident in the Index’s average price, yield, and spread over Treasuries. For the quarter, the average price of the Index dropped 1.97 points from 98.94 to 96.97, its average yield rose 27 basis points from 8.00% to 8.27% and its spread over the comparable Treasury increased by 10 basis points from 379 to 389 basis points, while Treasury yields rose modestly.
The high yield market saw a continued high level of new issues in the fourth quarter, including companies that sought to lock in long-term debt at relatively low interest rates to refinance existing debt with higher interest rates. Although this refinancing surge is fundamentally positive for the companies able to lower their cost of debt, it continued the trend towards refinancing the attractive high coupon bonds held by investors, including the Fund, and replacing them with lower coupon bonds. This puts pressure on the yield earned by the Fund and other high yield investors. In addition, the dividend rate on the Fund’s preferred stock has risen as the Fed has raised short-term interest rates, which reduces income available for dividends to common shareholders.
Fourth quarter returns for the broad equity indices were moderately positive. The Russell 2000 returned +1.15%, the S&P 500 returned +2.10%, the NASDAQ Composite returned +2.73%, and the Dow returned +2.06%. Positive momentum in equity markets generally is positive for high yield because a positive equity market can provide issuers with more financial flexibility and tends to reflect higher values for business assets to support leveraged capital structures.
Portfolio Strategy and Outlook
The Fund’s strategy for investing during the fourth quarter of 2005 continued to be driven by individual security selection with a general direction of upgrading the overall credit quality of the portfolio while maintaining a competitive yield. The sell discipline was directed toward
PACHOLDER HIGH YIELD FUND, INC.
underperforming credits and securities that were fully valued and presented little upside potential, particularly if the issuer had a weaker credit profile. Looking ahead, we believe that the underlying fundamentals in the high yield market appear stable. We believe that the expectations for continued solid economic growth, moderately rising interest rates, moderate inflation and below average default rates are likely to produce an environment that is favorable to higher-return, higher-risk credit relative to investment grade fixed income, where returns are driven primarily by interest rates. Because the strength and duration of the economic expansion is not known, we will change the composition of the portfolio gradually over time, predicated on bottom-up fundamental analysis of the opportunities available in the market.
As always, we appreciate your interest in the Fund and look forward to your continued support.
Sincerely,

William J. Morgan
President
February 13, 2005
Figure 1
PACHOLDER HIGH YIELD FUND, INC.
Statement of Net Assets Applicable to Common Stockholders
December 31, 2005
| | | | | | | |
| Description | | Par (000) | | Value | | Percent
of Net
Assets* | |
| | | | | | | | |
CORPORATE DEBT SECURITIES — 148.7% | | | |
AEROSPACE — 6.0% | | | | | | | |
American Airlines, Inc., Pass Thru Cert, 9.71%, 1/2/07 | | $383 | | $370,542 | | 0.3 | % |
American Airlines, Inc., Collateral Trust Notes, 10.18%, 1/2/13 | | 300 | | 242,649 | | 0.2 | |
American Airlines, Inc., Pass Thru Cert, 7.379%, 5/23/16 | | 387 | | 316,915 | | 0.3 | |
American Airlines, Inc., Pass Thru Cert, 7.8%, 10/1/06 | | 1,000 | | 987,027 | | 0.9 | |
American Airlines, Inc., Sec’d
7.25%, 2/5/09 | | 500 | | 488,750 | | 0.4 | |
Continental Airlines, Inc., Pass Thru Cert, 7.568%, 12/1/06 | | 385 | | 379,346 | | 0.3 | |
Continental Airlines, Inc., Pass Thru Cert, 9.798%, 4/1/21 | | 1,237 | | 1,236,788 | | 1.1 | |
Continental Airlines, Inc., Bank Debt, 5.562%, 12/31/069 | | 92 | | 83,770 | | 0.1 | |
Continental Airlines, Inc., FRN, Sec’d, 11.947%, 12/6/07 | | 750 | | 759,375 | | 0.7 | |
Northwest Airlines Corp., Bank Debt, 6.75%, 10/1/10 | | 1,000 | | 1,020,000 | | 0.9 | |
Wyle Laboratories, Inc., 1st Lien Bank Debt, 7.02%, 2/4/11 | | 496 | | 501,213 | | 0.4 | |
Wyle Laboratories, Inc., 2nd Lien Bank Debt, 10.77%, 8/4/11 | | 500 | | 505,000 | | 0.4 | |
| | |
| |
| |
|
|
| | | 7,029 | | 6,891,375 | | 6.0 | |
CHEMICALS — 10.6% | | | | | |
Basell Term Loan B, Bank Debt, 6.906%, 9/30/13 | | 500 | | 507,500 | | 0.4 | |
Basell Term Loan C, Bank Debt, 7.243%, 9/30/14 | | 500 | | 507,500 | | 0.4 | |
Crompton Corp., Sr Nt,
9.875%, 8/1/12 | | 500 | | 570,625 | | 0.5 | |
Ineos Bridge Loan, Bank Debt, 9.481%, 12/21/06 | | 1,000 | | 1,000,313 | | 0.9 | |
Koppers Industry, Inc., Sec’d Nt, 9.875%, 10/15/13 | | 175 | | 189,875 | | 0.2 | |
Lyondell Chemical Co., Co Guar, 10.5%, 6/1/136 | | 1,000 | | 1,136,250 | | 0.9 | |
Nova Chemicals, FRN, Sr Nt,
7.561%, 11/15/132 | | 1,500 | | 1,531,875 | | 1.3 | |
OM Group, Sr Sub Nt,
9.25%, 12/15/11 | | 1,200 | | 1,173,000 | | 1.0 | |
| | | | | | | |
| Description | | Par (000) | | Value | | Percent
of Net
Assets* | |
| | | | | | | | |
CHEMICALS (continued) | | | | | |
Polyone Corp., Sr Nt,
10.625%, 5/15/106 | | $1,900 | | $2,037,750 | | 1.8 | % |
Terra Capital, Inc., Sr Nt,
12.875%, 10/15/08 | | 1,025 | | 1,194,125 | | 1.0 | |
Tronox Worldwide/Finance, Sr Nt, 9.5%, 12/1/122 | | 1,000 | | 1,020,000 | | 0.9 | |
United Agri Products, Sr Disc Nt, 10.74%, 7/15/127 | | 1,350 | | 1,169,437 | | 1.0 | |
Westlake Chemical Corp., Co Guar, 8.75%, 7/15/11 | | 300 | | 321,000 | | 0.3 | |
| | |
| |
| |
|
|
| | | 11,950 | | 12,359,250 | | 10.6 | |
CONSUMER PRODUCTS — 5.5% | | | | | |
GSC Holdings Corp., FRN, Co Guar, 7.875%, 10/1/112 | | 550 | | 544,500 | | 0.5 | |
GSC Holdings Corp., Co Guar,
8%, 10/1/122 | | 300 | | 282,000 | | 0.3 | |
Broder Bros. Co., Sr Nt,
11.25%, 10/15/10 | | 1,335 | | 1,271,588 | | 1.1 | |
Fedders NA, Sr Nt, 9.875%, 3/1/14 | | 1,250 | | 893,750 | | 0.8 | |
General Nutrition Center, Sr Sub Nt, 8.5%, 12/1/10 | | 125 | | 107,500 | | 0.1 | |
General Nutrition Center, Sr Nt,
8.625, 1/15/11 | | 250 | | 241,250 | | 0.2 | |
Gregg Appliances, Inc., Sr Nt,
9%, 2/1/13 | | 1,950 | | 1,764,750 | | 1.5 | |
K2 Corp., Sr Nt, 7.375%, 7/1/14 | | 500 | | 497,500 | | 0.4 | |
Levi Straus and Co., FRN, Sr Nt, 8.804%, 4/1/12 | | 500 | | 503,750 | | 0.4 | |
Levi Straus and Co., Sr Nt,
12.25%, 12/15/12 | | 200 | | 223,000 | | 0.2 | |
Westpoint Stevens, Inc., Sr Nt, 7.875%, 6/15/051,4 | | 1,000 | | 100 | | 0.0 | |
| | |
| |
| |
|
|
| | | 7,960 | | 6,329,688 | | 5.5 | |
ENERGY — 6.8% | | | | | |
Atlas Pipeline Partners, Nt,
8.125%, 12/5/152 | | 500 | | 504,375 | | 0.4 | |
Chart Industries, Inc., Sr Sub Nt,
9.125%, 10/15/152 | | 1,400 | | 1,428,000 | | 1.2 | |
El Paso Corp., Sr Nt,
7.875%, 6/15/126 | | 1,250 | | 1,287,500 | | 1.1 | |
Secunda Int’l, Ltd., FRN, Sec’d,
12.150%, 9/1/12 | | 1,500 | | 1,575,000 | | 1.4 | |
Suburban Propane Partners, Sr Nt, 6.875%, 12/15/13 | | 335 | | 313,225 | | 0.3 | |
3
PACHOLDER HIGH YIELD FUND, INC.
Statement of Net Assets Applicable to Common Stockholders (continued)
December 31, 2005
| | | | | | | |
| Description | | Par (000) | | Value | | Percent
of Net
Assets* | |
| | | | | | | | |
ENERGY (continued) | | | | | |
Targa Resources, Inc., L/C Commitment, 4.402%, 10/31/12 | | $145 | | $145,887 | | 0.1 | % |
Targa Resources, Inc., Term Loan, 6.777%, 10/31/12 | | 603 | | 606,343 | | 0.5 | |
Transmontaigne, Inc., Sr Sub Nt, 9.125%, 6/1/10 | | 1,900 | | 1,866,750 | | 1.6 | |
Verasun Energy Corp., Sr Unsec’d Nt, 9.875%, 12/15/122 | | 250 | | 253,750 | | 0.2 | |
| | |
| |
| |
|
|
| | | 7,883 | | 7,980,830 | | 6.8 | |
FINANCE — 5.6% | | | | | |
Crum & Forster Holding, Inc., Sr Nt, 10.375%, 6/15/13 | | 2,000 | | 2,110,000 | | 1.8 | |
E*Trade Financial Corp., Nt,
8%, 6/15/112 | | 350 | | 364,000 | | 0.3 | |
Fairfax Financial, Nt, Add-on
7.75%, 4/26/126 | | 1,750 | | 1,632,894 | | 1.4 | |
Swett & Crawford, 1st Lien Bank Debt, 7.12%, 11/16/11 | | 500 | | 503,750 | | 0.4 | |
Swett & Crawford, 2nd Lien Bank Debt, 11.12%, 11/16/12 | | 500 | | 503,750 | | 0.4 | |
Thornburg Mortgage, Sr Nt,
8%, 5/15/13 | | 1,500 | | 1,477,500 | | 1.3 | |
| | |
| |
| |
|
|
| | | 6,600 | | 6,591,894 | | 5.6 | |
FOOD & DRUG — 0.7% | | | | | |
Southern States Coop, Inc., Sr Nt, 10.5%, 10/15/102 | | 750 | | 787,500 | | 0.7 | |
| | |
| |
| |
|
|
| | | 750 | | 787,500 | | 0.7 | |
FOOD & TOBACCO — 9.4% | | | | | |
Alliance One, Nt, 11%, 5/15/122 | | 2,000 | | 1,760,000 | | 1.5 | |
Chiquita Brands Int’l, Inc., Sr Nt, 8.875%, 12/1/152 | | 500 | | 465,000 | | 0.4 | |
Cosan SA Industria, Sr Nt,
9%, 11/1/092 | | 300 | | 320,250 | | 0.3 | |
EPL Finance Corp., Sr Nt,
11.75%, 11/15/132 | | 750 | | 747,188 | | 0.6 | |
Eurofresh, Inc., Nt, 11.5%, 11/15/132 | | 1,500 | | 1,503,750 | | 1.3 | |
Gold Kist, Inc., Sr Nt,
10.25%, 3/15/14 | | 487 | | 543,005 | | 0.5 | |
Golden State Foods, Sr Sub Nt,
9.24%, 1/10/128,9 | | 1,250 | | 1,218,750 | | 1.1 | |
National Beef Packaging, Sr Nt, 10.5%, 8/1/11 | | 1,000 | | 1,035,000 | | 0.9 | |
| | | | | | | |
| Description | | Par (000) | | Value | | Percent
of Net
Assets* | |
| | | | | | | | |
FOOD & TOBACCO (continued) | | | | | |
National Wine & Spirits, Inc., Sr Nt, 10.125%, 1/15/09 | | $1,750 | | $1,767,500 | | 1.5 | % |
Sbarro, Inc., Sr Nt, 11%, 9/15/096 | | 1,000 | | 995,000 | | 0.9 | |
Swift and Co., Sr Sub Nt,
12.5%, 1/1/10 | | 250 | | 263,125 | | 0.2 | |
Tom’s Foods, Inc., Sr Nt,
10.5%, 11/1/041,3,4,9 | | 1,000 | | 200,000 | | 0.2 | |
| | |
| |
| |
|
|
| | | 11,787 | | 10,818,568 | | 9.4 | |
FOREST PRODUCTS & CONTAINERS — 11.7% | | | | | |
Abitibi-Consolidated Inc., Sr Nt, 8.375%, 4/1/156 | | 2,250 | | 2,154,375 | | 1.9 | |
Ainsworth Lumber, Sr Nt,
6.75%, 3/15/14 | | 1,000 | | 850,000 | | 0.7 | |
Ainsworth Lumber, Co Guar,
7.25%, 10/1/12 | | 1,250 | | 1,125,000 | | 1.0 | |
Bowater, Inc., Sr Nt, 6.5%, 6/15/136 | | 500 | | 447,500 | | 0.4 | |
Buckeye Cellulose Corp., Sr Sub Nt, 9.25%, 9/15/08 | | 1,145 | | 1,145,000 | | 1.0 | |
Constar International, FRN, Nt,
7.715%, 2/15/12 | | 550 | | 528,000 | | 0.4 | |
Constar International, Sr Sub Nt,
11%, 12/1/126 | | 1,700 | | 1,241,000 | | 1.1 | |
Domtar, Inc., Nt, 7.875%, 10/15/11 | | 125 | | 115,000 | | 0.1 | |
Graphic Packaging Corp., Sr Sub Nt, 9.5%, 8/15/13 | | 72 | | 68,760 | | 0.1 | |
Norske Skog, Sr Nt, 8.625%, 6/15/11 | | 1,500 | | 1,432,500 | | 1.2 | |
Plastipak Holdings, Inc., Sr Nt,
8.5%, 12/15/152 | | 200 | | 202,000 | | 0.2 | |
Portola Packaging Inc., Sr Nt,
8.25%, 2/1/126 | | 2,825 | | 2,076,375 | | 1.8 | |
Stone Container, Sr Nt, 9.75%, 2/1/11 | | 1,450 | | 1,464,500 | | 1.2 | |
Tembec Industries, Sr Unsec’d Nt, 8.625%, 6/30/096 | | 535 | | 304,950 | | 0.3 | |
Tembec Industries, Sr Nt,
8.5%, 2/1/116 | | 725 | | 402,375 | | 0.3 | |
| | |
| |
| |
|
|
| | | 15,827 | | 13,557,335 | | 11.7 | |
GAMING & LEISURE — 6.5% | | | | | |
Bally Total Fitness Holding Corp., Sr Sub Nt, 9.875%, 10/15/076 | | 430 | | 419,250 | | 0.4 | |
Inn of the Mountain Gods, Sr Nt,
12%, 11/15/10 | | 1,675 | | 1,658,250 | | 1.4 | |
Majestic Star Casino, Co Guar,
9.5%, 10/15/10 | | 500 | | 526,250 | | 0.5 | |
4
PACHOLDER HIGH YIELD FUND, INC.
Statement of Net Assets Applicable to Common Stockholders (continued)
December 31, 2005
| | | | | | | |
| Description | | Par (000) | | Value | | Percent
of Net
Assets* | |
| | | | | | | | |
GAMING & LEISURE (continued) | | | | | |
Majestic Star Casino, Sr Nt,
9.75%, 1/15/112 | | $500 | | $503,750 | | 0.4 | % |
True Temper Sports, Inc., Sr Sub Nt, 8.375%, 9/15/11 | | 1,050 | | 945,000 | | 0.8 | |
Trump Entertainment, Sec’d Nt,
8.5%, 6/1/15 | | 1,750 | | 1,706,250 | | 1.5 | |
Wynn Las Vegas LLC, Mtg,
6.625%, 12/1/14 | | 1,750 | | 1,701,875 | | 1.5 | |
| | |
| |
| |
|
|
| | | 7,655 | | 7,460,625 | | 6.5 | |
HEALTH CARE — 10.1% | | | | | |
CDRV Investors, Inc., Sr Disc Nt,
9.75%, 1/1/157 | | 350 | | 214,375 | | 0.2 | |
Healthsouth Corp., Sr Nt,
8.5%, 2/1/08 | | 750 | | 755,625 | | 0.7 | |
Healthsouth Corp., Sr Nt,
8.375%, 10/1/11 | | 1,425 | | 1,449,938 | | 1.3 | |
Lifecare Holdings, Inc., Bank Debt, 6.43%, 8/11/12 | | 748 | | 712,589 | | 0.6 | |
Lifecare Holdings, Inc., Sr Sub Nt, 9.25%, 8/15/132,6 | | 1,300 | | 1,027,000 | | 0.9 | |
NDCHealth Corp., Sr Sub Nt,
10.5%, 12/1/12 | | 425 | | 485,562 | | 0.4 | |
Psychiatric Solutions, Sr Sub Nt, 10.625%, 6/15/13 | | 333 | | 378,788 | | 0.3 | |
Team Health, Inc., Sr Sub Nt,
11.25%, 12/1/132 | | 675 | | 688,500 | | 0.6 | |
Tenet Healthcare Corp., Sr Nt,
9.25%, 2/1/152 | | 250 | | 248,125 | | 0.2 | |
Tenet Healthcare Corp., Sr Nt,
9.875%, 7/1/14 | | 1,750 | | 1,771,875 | | 1.5 | |
US Oncology Inc, Co Guar,
10.75%, 8/15/14 | | 575 | | 638,250 | | 0.5 | |
US Oncology Inc, FRN, Sr Nt,
9.264%, 3/15/15 | | 1,250 | | 1,243,750 | | 1.1 | |
Vanguard Health Holdings II, Sr Sub Nt, 9%, 10/1/14 | | 1,400 | | 1,487,500 | | 1.3 | |
Vanguard Health Holdings I, Sr Disc Nt, 10.43%, 10/1/157 | | 750 | | 547,500 | | 0.5 | |
| | |
| |
| |
|
|
| | | 11,981 | | 11,649,377 | | 10.1 | |
HOUSING — 1.0% | | | | | |
Interface, Inc., Sr Nt, 10.375%, 2/1/10 | | 500 | | 541,250 | | 0.5 | |
Interface, Inc., Sr Sub Nt,
9.5%, 2/1/146 | | 535 | | 532,325 | | 0.5 | |
| | |
| |
| |
|
|
| | | 1,035 | | 1,073,575 | | 1.0 | |
| | | | | | | |
| Description | | Par (000) | | Value | | Percent
of Net
Assets* | |
| | | | | | | | |
INFORMATION TECHNOLOGY — 7.1% | | | | | |
Activant Solutions, FRN, Sr Nt, 10.054%, 4/1/102 | | $400 | | $412,500 | | 0.4 | % |
Activant Solutions, Sr Nt,
10.5%, 6/15/11 | | 200 | | 219,000 | | 0.2 | |
Advanced Micro Devices, Sr Nt,
7.75%, 11/1/12 | | 400 | | 404,000 | | 0.3 | |
Avago Technologies Finance, Sr Nt, 10.125%, 12/1/132 | | 750 | | 770,625 | | 0.7 | |
IKON Office Solutions, Sr Nt,
7.75%, 9/15/152,6 | | 500 | | 487,500 | | 0.4 | |
Intcomex, Inc., Sec’d Nt,
11.75%, 1/15/112 | | 750 | | 736,875 | | 0.6 | |
Magnachip Semiconductor, FRN, Sec’d Nt, 7.741%, 12/15/11 | | 1,000 | | 1,015,000 | | 0.9 | |
Magnachip Semiconductor, Sec’d Nt, 6.875%, 12/15/11 | | 750 | | 736,875 | | 0.6 | |
Smart Modular Tech, FRN, Sr Nt, 9.554%, 4/1/12 | | 650 | | 679,250 | | 0.6 | |
Spansion LLC, Sr Nt,
11.25%, 1/15/162 | | 1,000 | | 950,000 | | 0.8 | |
Stratus Technologies, Inc., Sr Nt, 10.375%, 12/1/08 | | 475 | | 479,750 | | 0.4 | |
Sungard Data Systems, Inc., Sr Unsec’d Nt, 9.125%, 8/15/132 | | 400 | | 414,000 | | 0.4 | |
Unisys Corp., Sr Nt, 8%, 10/15/126 | | 500 | | 462,500 | | 0.4 | |
Unisys Corp., Sr Nt, 8.5%, 10/15/15 | | 500 | | 462,500 | | 0.4 | |
| | |
| |
| |
|
|
| | | 8,275 | | 8,230,375 | | 7.1 | |
MANUFACTURING — 7.8% | | | | | |
Case New Holland, Inc., Sr Nt,
9.25%, 8/1/11 | | 500 | | 535,000 | | 0.5 | |
Eagle-Picher, Inc., Sr Nt,
9.75%, 9/1/131,4,6 | | 1,250 | | 950,000 | | 0.8 | |
Eagle-Picher Industries, Inc., 1st Lien Bank Debt, 9.027%, 12/30/10 | | 750 | | 761,250 | | 0.7 | |
Eagle-Picher Industries, Inc., 2nd Lien Bank Debt, 8.545%, 12/30/11 | | 750 | | 750,000 | | 0.6 | |
Gardner Denver, Sr Sub Nt,
8%, 5/1/13 | | 500 | | 525,000 | | 0.5 | |
Greenbrier Companies, Inc., Sr Nt, Add-on 8.375%, 5/15/152 | | 1,000 | | 1,020,000 | | 0.9 | |
Invensys PLC, Sr Nt,
9.875%, 3/15/112 | | 1,000 | | 990,000 | | 0.9 | |
Milacron Escrow Corp., Sec’d Nt, 11.5%, 5/15/11 | | 1,750 | | 1,496,250 | | 1.3 | |
5
PACHOLDER HIGH YIELD FUND, INC.
Statement of Net Assets Applicable to Common Stockholders (continued)
December 31, 2005
| | | | | | | |
| Description | | Par (000) | | Value | | Percent
of Net
Assets* | |
| | | | | | | | |
MANUFACTURING (continued) | | | | | |
Polypore, Inc., Sr Sub Nt,
8.75%, 5/15/12 | | $1,935 | | $1,702,800 | | 1.5 | % |
Thermadyne Holdings Corp., Sr Sub Nt, 9.25%, 2/1/14 | | 200 | | 175,000 | | 0.1 | |
| | |
| |
| |
|
|
| | | 9,635 | | 8,905,300 | | 7.8 | |
MEDIA & TELECOM: BROADCASTING — 1.5% | | | | | |
Fisher Communications, Inc, Sr Nt, 8.625%, 9/15/14 | | 300 | | 316,500 | | 0.3 | |
LBI Media, Inc., Sr Disc Nt,
11%, 10/15/137 | | 625 | | 457,031 | | 0.4 | |
Nexstar Fin Hldg LLC, Inc., Sr Disc Nt, 11.36%, 4/1/137 | | 250 | | 188,438 | | 0.2 | |
Nexstar Finance, Inc., Sr Sub Nt,
7%, 1/15/14 | | 725 | | 664,281 | | 0.6 | |
| | |
| |
| |
|
|
| | | 1,900 | | 1,626,250 | | 1.5 | |
MEDIA & TELECOM: CABLE — 8.0% | | | | | |
Adelphia Communications, Corp., Sr Nt, 9.375%, 11/15/091,4,6 | | 1,000 | | 585,000 | | 0.5 | |
Adelphia Communications, Corp., Sr Nt, 8.125%, 7/15/031,4,6 | | 750 | | 423,750 | | 0.4 | |
Adelphia Communications, Corp., Sr Nt, 6%, 2/15/061,4 | | 125 | | 1,719 | | 0.0 | |
CCH I LLC, Sec’d Nt, 11%, 10/1/152 | | 2,305 | | 1,936,200 | | 1.7 | |
Century Communications, Sr Nt,
9.5%, 3/1/051,4,6 | | 625 | | 603,125 | | 0.5 | |
Insight Communications, Inc., Sr Disc Nt, 12.52%, 2/15/117 | | 1,000 | | 1,045,000 | | 0.9 | |
Insight Midwest, Sr Nt,
10.5%, 11/1/10 | | 1,050 | | 1,103,812 | | 0.9 | |
Intelsat Bermuda Ltd., Sr Nt,
8.25%, 1/15/132 | | 500 | | 505,000 | | 0.4 | |
Mediacom LLC/Capital Corp., Sr Nt, 9.50%, 1/15/136 | | 2,000 | | 1,952,500 | | 1.7 | |
Panamsat Corp., Sr Nt, 9%, 8/15/14 | | 649 | | 679,828 | | 0.6 | |
Videotron Ltee, Sr Unsec’d Nt,
6.375%, 12/15/152 | | 500 | | 496,875 | | 0.4 | |
| | |
| |
| |
|
|
| | | 10,504 | | 9,332,809 | | 8.0 | |
MEDIA & TELECOM: FIXED COMMUNICATIONS — 5.7% | | | |
Alaska Comm Sys Hldgs, Inc., Co Guar, 9.875%, 8/15/11 | | 610 | | 663,375 | | 0.6 | |
Hawaiian Telecomm Communications, Sr Nt, 9.75%, 5/1/132 | | 425 | | 415,438 | | 0.4 | |
| | | | | | | |
| Description | | Par (000) | | Value | | Percent
of Net
Assets* | |
| | | | | | | | |
MEDIA & TELECOM: FIXED COMMUNICATIONS (continued) | | | |
Mastec, Inc., Sr Sub Nt,
7.75%, 2/1/086 | | $780 | | $774,150 | | 0.7 | % |
Primus Telecomm Group, Bank Debt, 10.67%, 2/18/11 | | 993 | | 925,506 | | 0.8 | |
Qwest Communications, FRN, Sr Nt, 7.84%, 2/15/09 | | 1,001 | | 1,014,764 | | 0.9 | |
Qwest Communications, Sr Nt, 7.875%, 9/1/11 | | 100 | | 107,750 | | 0.1 | |
Qwest Communications, Sr Nt, 7.625%, 6/15/152 | | 250 | | 267,500 | | 0.2 | |
Qwest Communications, FRN, Sr Nt, 7.741%, 6/15/132 | | 1,000 | | 1,078,750 | | 0.9 | |
Time Warner Communications, Sr Nt, 9.25%, 2/15/14 | | 1,250 | | 1,318,750 | | 1.1 | |
| | |
| |
| |
|
|
| | | 6,409 | | 6,565,983 | | 5.7 | |
MEDIA & TELECOM: WIRELESS COMMUNICATIONS — 4.3% | | | |
ACC Escrow Corp., Sr Nt, 10%, 8/1/11 | | 500 | | 542,500 | | 0.5 | |
Cleveland Unlimited, Inc., FRN, Sr Unsec’d Nt, 12.741%, 12/15/102 | | 1,000 | | 1,010,000 | | 0.9 | |
Dobson Cellular Systems, FRN, Sec’d Nt, 9%, 11/1/11 | | 500 | | 520,000 | | 0.5 | |
Dobson Cellular Systems, Sec’d, 9.875%, 11/1/12 | | 1,000 | | 1,102,500 | | 1.0 | |
Dobson Communications Corp., FRN, Sr Nt, 8.4%, 10/15/122 | | 500 | | 497,500 | | 0.4 | |
Horizon PCS, Inc., Sr Nt,
11.375%, 7/15/12 | | 350 | | 401,625 | | 0.3 | |
Rogers Wireless, Inc., Sec’d Nt, 6.375%, 3/1/14 | | 250 | | 250,625 | | 0.2 | |
Rural Cellular, Sr Nt, 9.875%, 2/1/10 | | 500 | | 527,500 | | 0.5 | |
| | |
| |
| |
|
|
| | | 4,600 | | 4,852,250 | | 4.3 | |
MEDIA & TELECOM: DIVERSIFIED — 5.4% | | | |
Cinemark USA, Inc., Sr Sub Nt,
9%, 2/1/13 | | 500 | | 528,750 | | 0.5 | |
IMAX Corp., Sr Nt, 9.625%, 12/1/10 | | 1,409 | | 1,451,270 | | 1.2 | |
Mail-Well I Corp., Sr Sub Nt,
7.875%, 12/1/13 | | 2,000 | | 1,930,000 | | 1.7 | |
Phoenix Color Corp., Sr Sub Nt, 10.375%, 2/1/09 | | 1,730 | | 1,593,762 | | 1.4 | |
Primedia, Inc., Sr Nt,
8.875%, 5/15/11 | | 375 | | 345,938 | | 0.3 | |
Six Flags, Inc., Sr Nt, 9.75%, 4/15/13 | | 400 | | 392,500 | | 0.3 | |
| | |
| |
| |
|
|
| | | 6,414 | | 6,242,220 | | 5.4 | |
6
PACHOLDER HIGH YIELD FUND, INC.
Statement of Net Assets Applicable to Common Stockholders (continued)
December 31, 2005
| | | | | | | |
| Description | | Par (000) | | Value | | Percent
of Net
Assets* | |
| | | | | | | | |
METALS & MINERALS — 3.7% | | | |
AK Steel Corp., Co Guar,
7.875%, 2/15/096 | | $1,705 | | $1,619,750 | | 1.4 | % |
Chaparral Steel Co., Sr Nt,
10%, 7/15/13 | | 600 | | 646,500 | | 0.6 | |
International Steel Group, Sr Nt,
6.5%, 4/15/14 | | 500 | | 500,000 | | 0.4 | |
Neenah Corp., Sr Sub Nt,
11%, 9/30/102 | | 200 | | 219,000 | | 0.2 | |
Oglebay Norton Co. Term Loan B, Bank Debt, 11.406%, 1/31/10 | | 1,000 | | 1,025,000 | | 0.9 | |
US Steel, LLC, Sr Nt, 9.75%, 5/15/10 | | 200 | | 217,500 | | 0.2 | |
| | |
| |
| |
|
|
| | | 4,205 | | 4,227,750 | | 3.7 | |
RETAIL — 1.3% | | | |
Brown Shoe Company, Inc., Sr Unsec’d Nt, 8.375%, 5/1/12 | | 750 | | 783,750 | | 0.7 | |
Stripes Acq./Susser Finance, Sr Nt, 10.625%, 12/15/132 | | 725 | �� | 735,875 | | 0.6 | |
| | |
| |
| |
|
|
| | | 1,475 | | 1,519,625 | | 1.3 | |
SERVICES — 7.3% | | | |
Allied Waste NA, Co Guar,
9.25%, 9/1/12 | | 1,824 | | 1,974,480 | | 1.7 | |
Dycom Industries, Nt,
8.125%, 10/15/152 | | 500 | | 500,000 | | 0.4 | |
Hertz Corp., Sr Notes,
8.875%, 1/1/142 | | 500 | | 509,375 | | 0.4 | |
Hertz Corp., Sr Notes, 10.5%, 1/1/162 | | 425 | | 437,750 | | 0.4 | |
Knowledge Learning Center, Sr Sub Nt, 7.75%, 2/1/152 | | 500 | | 475,000 | | 0.4 | |
Mac-Gray Corp., Sr Nt,
7.625%, 8/15/15 | | 500 | | 503,750 | | 0.4 | |
Nationsrent, Inc., Sr Sec’d Nt,
9.5%, 10/15/10 | | 500 | | 545,000 | | 0.5 | |
Sac Holdings, Sr Nt, 8.5%, 3/15/14 | | 1,323 | | 1,253,400 | | 1.1 | |
Stewart Enterprises, Sr Nt,
6.25%, 2/15/132 | | 500 | | 480,000 | | 0.4 | |
United Rentals, Inc., Sr Sub Nt,
7.75%, 11/15/136 | | 1,400 | | 1,365,000 | | 1.2 | |
United Rentals, Inc., Sr Nt,
6.5%, 2/15/12 | | 500 | | 486,875 | | 0.4 | |
| | |
| |
| |
|
|
| | | 8,472 | | 8,530,630 | | 7.3 | |
TRANSPORTATION — 14.7% | | | |
American Commercial Lines, Sr Nt, 9.50%, 2/15/15 | | 325 | | 351,000 | | 0.3 | |
| | | | | | | |
| Description | | Par (000) | | Value | | Percent
of Net
Assets* | |
| | | | | | | | |
TRANSPORTATION (continued) | | | |
Autocam Corp., Sr Sub Nt,
10.875%, 6/15/146 | | $675 | | $469,125 | | 0.4 | % |
Autocam Corp., Bank Debt,
12.937%, 12/16/11 | | 1,000 | | 1,010,000 | | 0.9 | |
Delco Remy International, Inc., Sr Sub Nt, 11%, 5/1/096 | | 550 | | 195,250 | | 0.2 | |
Dura Operating Corp., Co Guar,
9%, 5/1/096 | | 625 | | 353,125 | | 0.3 | |
Dura Operating Corp., Co Guar, 8.625%, 4/15/12 | | 750 | | 618,750 | | 0.5 | |
Ford Motor Co., Nt,
7.45%, 7/15/316 | | 2,975 | | 2,023,000 | | 1.7 | |
Ford Motor Credit Corp., FRN, Nt, 7.26%, 11/2/07 | | 700 | | 669,299 | | 0.6 | |
Ford Motor Credit Corp., Nt,
8.625%, 11/1/10 | | 250 | | 227,997 | | 0.2 | |
General Motors Acceptance Corp., Nt, 7.75%, 1/19/10 | | 1,000 | | 933,887 | | 0.8 | |
General Motors Acceptance Corp., Nt, 8%, 11/1/316 | | 1,800 | | 1,724,186 | | 1.5 | |
General Motors, Debentures,
8.25%, 7/15/236 | | 1,425 | | 915,563 | | 0.8 | |
Goodyear Tire and Rubber, Sr Nt,
9%, 7/1/152 | | 2,200 | | 2,167,000 | | 1.9 | |
IdleAire Technologies Corp., Sr Disc Nt, 11.92%, 12/15/127 | | 1,250 | | 916,513 | | 0.8 | |
Metaldyne Corp., Co Guar,
11%, 6/15/126 | | 1,000 | | 771,250 | | 0.7 | |
Metaldyne Corp., Sr Nt,
10%, 11/1/136 | | 950 | | 859,750 | | 0.7 | |
Quality Distribution, Co Guar,
9%, 11/15/10 | | 500 | | 445,625 | | 0.4 | |
Sea Containers, Sr Nt,
10.75%, 10/15/06 | | 625 | | 625,000 | | 0.5 | |
TFM SA DE CV, Sr Nt,
12.5%, 6/15/12 | | 1,100 | | 1,254,000 | | 1.1 | |
Ultrapetrol (Bahamas) Ltd., 1st Mtg, 9%, 11/24/14 | | 450 | | 418,500 | | 0.4 | |
| | |
| |
| |
|
|
| | | 20,150 | | 16,948,820 | | 14.7 | |
UTILITIES — 8.0% | | | |
Calpine Corp., Sr Nt,
8.5%, 5/1/081,4,6 | | 1,265 | | 471,212 | | 0.4 | |
Calpine Corp., Sr Nt,
8.5%, 2/15/111,4,6 | | 985 | | 300,425 | | 0.3 | |
7
PACHOLDER HIGH YIELD FUND, INC.
Statement of Net Assets Applicable to Common Stockholders (continued)
December 31, 2005
| | | | | | | |
| Description | | Shares/Par
(000) | | Value | | Percent
of Net
Assets* | |
| | | | | | | | |
UTILITIES (continued) | | | |
Calpine Corp., Sec’d Nt,
9.9%, 7/15/071,2,4 | | $904 | | $734,652 | | 0.6 | % |
Calpine Corp., Sec’d Nt,
9.875%, 12/1/111,2,4,6 | | 250 | | 201,250 | | 0.2 | |
Calpine Generating Co., 3rd FRN, Sec’d Nt, 13.216%, 4/1/11 | | 800 | | 812,000 | | 0.7 | |
Edison Mission, Inc., Sr Nt,
9.875%, 4/15/11 | | 1,750 | | 2,040,937 | | 1.8 | |
Midwest Generation LLC, Sec’d Nt, 8.75%, 5/1/34 | | 500 | | 550,625 | | 0.5 | |
Mirant Americas, Sr Nt,
7.90%, 7/15/091,2,4 | | 750 | | 945,000 | | 0.8 | |
Mirant Americas, Sr Nt,
8.3%, 5/1/111,4 | | 250 | | 316,250 | | 0.3 | |
Mirant Americas Generation LLC, Sr Nt, 8.5%, 10/1/211,4 | | 1,000 | | 1,245,000 | | 1.1 | |
Dynegy/NGC Corp., Debentures, 7.125%, 5/15/18 | | 1,750 | | 1,557,500 | | 1.3 | |
| | |
| |
| |
|
|
| | | 10,204 | | 9,174,851 | | 8.0 | |
Total Corporate Debt Securities | | | | | |
(amortized cost $175,100,979) | | 181,667 | | 171,656,880 | | 148.7 | |
| | | | |
| |
|
|
CORPORATE CONVERTIBLE DEBT SECURITIES — 0.2% | | | |
PACKAGING — 0.2% | | | | | | | |
Indesco International, Inc., Conv, Sr Sub Nt, 10%, 3/15/083,9 | | 291 | | 239,686 | | 0.2 | |
| | |
| |
| |
|
|
| | | 291 | | 239,686 | | 0.2 | |
Total Convertible Corporate Debt
Securities | | | | | |
(amortized cost $290,529) | | 291 | | 239,686 | | 0.2 | |
| | | | |
| |
|
|
Total Debt Securities | | | | | | | |
(amortized cost $175,391,508) | | | | 171,896,566 | | 148.9 | |
| | | | |
| |
|
|
PREFERRED STOCKS — 3.1% | | | |
Glasstech, Inc., Series C, Pfd1,3,9 | | 5 | | 0 | | 0.0 | |
HLI Operating Co., Inc., Series A, Pfd, 8%, 12/31/491 | | 74 | | 2,590 | | 0.0 | |
Oglebay Norton Company, Series A, Pfd, 14.8% | | 211,219 | | 3,221,096 | | 2.8 | |
Spanish Broadcasting Systems, Pfd, 10.75%, 10/15/13 | | 296 | | 319,680 | | 0.3 | |
| | | | |
| |
|
|
Total Preferred Stocks | | | | | | | |
(cost $2,468,662) | | 211,594 | | 3,543,366 | | 3.1 | |
| | | | | | | |
| Description | | Shares/Par
(000) | | Value | | Percent
of Net
Assets* | |
| | | | | | | | |
COMMON STOCKS — 2.6% | | | | | | | |
Abovenet, Inc., Common Stock1 | | $1,702 | | $48,507 | | 0.0 | % |
Avado Brands, Inc., Common Stock1,3 | | 9,063 | | 120,329 | | 0.1 | |
Bally Total Fitness Corp. Holding, Common Stock1,3,6,8,9 | | 3,969 | | 17,464 | | 0.0 | |
Glasstech, Inc., Class C, Common Stock1,3,9 | | 5 | | 0 | | 0.0 | |
Indesco International, Inc., Common Stock1,3,9 | | 60,345 | | 36,207 | | 0.0 | |
Kaiser Group Holdings, Inc., Common Stock1 | | 42,723 | | 1,666,197 | | 1.5 | |
Lexington Coal Company, Common Stock1 | | 25,311 | | 8,859 | | 0.0 | |
Mattress Discounters, Common Stock1,3,9 | | 8,329 | | 8,329 | | 0.0 | |
Oglebay Norton Company, Common Stock1 | | 32,625 | | 399,656 | | 0.4 | |
Simonds Industries, Inc., Common Stock1,3,9 | | 8,236 | | 280,024 | | 0.2 | |
Westpoint Stevens, Inc., Common Stock1,3,9 | | 14,277 | | 283,113 | | 0.2 | |
Westpoint Stevens, Inc., Subscription Rights1,3,9 | | 12,745 | | 138,410 | | 0.1 | |
Westpoint Stevens, Inc., Rights1,3,9 | | 6,631 | | 71,931 | | 0.1 | |
| | | | |
| |
|
|
Total Common Stocks | | | | | | | |
(cost $9,704,502) | | 225,961 | | 3,079,026 | | 2.6 | |
| | | | |
| |
|
|
WARRANTS — 0.0% | | | | | | | |
Abovenet, Inc., Warrants, 8/9/081,3,9 | | 584 | | 4,964 | | 0.0 | |
Abovenet, Inc., Warrants, 8/9/101,3,9 | | 687 | | 3,092 | | 0.0 | |
| | | | |
| |
|
|
Total Warrants | | | | | | | |
(cost $417,200) | | 1,271 | | 8,056 | | 0.0 | |
| | | | |
| |
|
|
Total Equity Investments | | | | | | | |
(cost $12,590,364) | | 438,826 | | 6,630,448 | | 5.7 | |
| | | | |
| |
|
|
INVESTMENTS OF CASH COLLATERAL FOR SECURITIES LOANED — 23.9% | |
Cantor Fitzgerald & Co. —
Repurchase Agreements5a
4.31%, dated 12/30/05,
matures 1/3/06 repurchase
price $7,003,352 | | 7,000 | | 7,000,000 | | 6.1 | |
Lehman Brothers, Inc. —
Repurchase Agreements5b
4.4%, dated 12/30/05,
matures 1/3/06 repurchase
price $5,002,444 | | 5,000 | | 5,000,000 | | 4.3 | |
8
PACHOLDER HIGH YIELD FUND, INC.
Statement of Net Assets Applicable to Common Stockholders (concluded)
December 31, 2005
| | | | | | | | |
| Description | | Shares/Par
(000) | | Value | | | Percent
of Net
Assets* | |
| | | | | | | | | |
INVESTMENTS OF CASH COLLATERAL FOR SECURITIES LOANED (continued) | |
WaMu Capital Corp. —
Repurchase Agreements5a
4.42%, dated 12/30/05,
matures 1/3/06 repurchase
price $7,003,438 | | $7,000 | | $7,000,000 | | | 6.1 | % |
HSBC Securities, Inc. —
Repurchase Agreements5c
3.6%, dated 12/30/05,
matures 1/3/06 repurchase
price $8,552,720 | | 8,549 | | 8,549,300 | | | 7.4 | |
| | | | |
|
| |
|
|
Total Investments of Cash Collateral for Securites Loaned | | | | | | |
(cost $27,549,300) | | 27,549,300 | | | 23.9 | |
| | | | |
|
| |
|
|
TOTAL INVESTMENTS | | | | | | | | |
(cost $215,531,172) | | | | $206,076,314 | | | 178.5 | |
| | | | |
|
| |
|
|
Payable Upon Return of Securities Loaned | | (27,549,300 | ) | | (23.9 | ) |
Payable to Advisor | | (1,208,263 | ) | | (1.0 | ) |
Payable to Administrator | | (15,405 | ) | | 0.0 | |
Accounting Fees Payable | | (3,160 | ) | | 0.0 | |
Custody Fees Payable | | (2,950 | ) | | 0.0 | |
Unrealized Appreciation on Swap Agreements | | 445,515 | | | 0.4 | |
Unrealized Depreciation on Swap Agreements | | (53,981 | ) | | (0.1 | ) |
Other Assets in Excess of Other Liabilities | | 3,739,927 | | | 3.2 | |
Less: Outstanding Preferred Stock (2,640 shares at $25,000 per share) at
liquidation value. | | (66,000,000 | ) | | (57.1 | ) |
| | | | |
|
| |
|
|
| | | | | | | | |
| Description | | Shares/Par
(000) | | | Value | | Percent
of Net
Assets* | |
Net Assets Applicable to Common Stockholders: | | | | | | | | |
Common Stock, $.01 par value;
49,996,320 shares
authorized 12,918,186
shares issued and
outstanding | | $129,182 | | | | | | |
Capital in excess of par value | | 179,679,468 | | | | | | |
Undistributed net investment income | | 1,013,224 | | | | | | |
Accumulated net realized loss from security transactions | | (56,329,853 | ) | | | | | |
Net unrealized depreciation on investments | | (9,063,324 | ) | | | | | |
Net Assets Applicable to Common Stockholders | | | | | $115,428,697 | | 100.0 | % |
| | | | | |
| |
|
|
Net Asset Value Per Common Share
($115,428,697/12,918,186) | | | $8.94 | | | |
| | | | | |
| | | |
| * | | Applicable to common stockholders. |
| 1 | | Non-income producing security. |
| 2 | | Security exempt from registration under Rule 144A of the Securities Act of 1933. These securities may be resold in transactions exempt from registration, normally to qualified institutional buyers. These securities amounted to $33,575,227. |
| 3 | | Board valued security. These securities amounted to $1,403,549. |
| 5a | | Fully collateralized by investment grade corporate bonds with a fair market value of $14,696,055. |
| 5b | | Fully collateralized by non-investment grade corporate bonds with a fair market value of $5,253,564. |
| 5c | | Fully collateralized by treasury notes with a fair market value of $8,720,353. |
| 6 | | All or a portion of the security is on loan. Securities on loan have a fair market value of $26,544,490. |
| 7 | | Step-up bond. Interest rate is effective rate. |
| 8 | | Restricted security. These securities amounted to $1,236,214. |
| 9 | | Security deemed to be illiquid. |
| FRN | | Floating Rate Note. Rate shown is rate in effect at December 31, 2005. |
| DIP | | Debtor in Possession Financing |
See accompanying Notes to Financial Statements.
9
PACHOLDER HIGH YIELD FUND, INC.
Statement of Operations
For the Year Ended December 31, 2005
| | | | |
| | | | |
INVESTMENT INCOME: | | | | |
Interest | | $ | 16,778,106 | |
Dividends | | | 340,520 | |
Securities lending | | | 245,606 | |
| | |
|
|
|
Total Income | | | 17,364,232 | |
EXPENSES: | | | | |
Investment advisory fees (Note 6) | | | 1,894,134 | |
Administrative fees (Note 6) | | | 190,589 | |
Printing and other | | | 119,466 | |
Stock exchange listing fees | | | 23,200 | |
Accounting fees (Note 6) | | | 40,793 | |
Custodian fees (Note 6) | | | 19,312 | |
Transfer agent fees | | | 40,909 | |
Legal fees | | | 188,775 | |
Directors’ fees and expenses | | | 106,341 | |
Audit fee | | | 96,333 | |
Insurance | | | 33,771 | |
| | |
|
|
|
Operating Expenses | | | 2,753,623 | |
Commissions on auction rate preferred stock | | | 167,915 | |
| | |
|
|
|
Expenses Related to Leverage | | | 167,915 | |
Total Expenses | | | 2,921,538 | |
| | |
|
|
|
Net Investment Income | | | 14,442,694 | |
NET REALIZED AND UNREALIZED GAIN/(LOSS) ON INVESTMENTS: | | | | |
Net realized gain/(loss): | | | | |
Investments | | | (7,953,919 | ) |
Swaps | | | (499,282 | ) |
| | |
|
|
|
Net realized gain/(loss) on investments | | | (8,453,201 | ) |
Net change in unrealized appreciation/(depreciation): | | | | |
Investments | | | (1,139,510 | ) |
Swaps | | | 962,368 | |
| | |
|
|
|
Net change in unrealized appreciation/(depreciation) on investments | | | (177,142 | ) |
| | |
|
|
|
Net realized and unrealized gain/(loss) on investments | | | (8,630,343 | ) |
| | |
|
|
|
Net Increase/(Decrease) Resulting from Operations | | | 5,812,351 | |
DISTRIBUTIONS TO PREFERRED STOCKHOLDERS FROM NET INVESTMENT INCOME | | | (2,157,713 | ) |
| | |
|
|
|
NET INCREASE/(DECREASE) IN NET ASSETS APPLICABLE TO COMMON STOCKHOLDERS RESULTING FROM OPERATIONS | | $ | 3,654,638 | |
| | |
|
|
|
See accompanying Notes to Financial Statements.
Statements of Changes in Net Assets Applicable to Common Stockholders
| | | | | | | | |
| | | For the
Year Ended
December 31,
2005 | | | For the
Year Ended
December 31,
2004 | |
INCREASE/(DECREASE) IN NET ASSETS: | | | | | | | | |
Operations: | | | | | | | | |
Net investment income | | $ | 14,442,694 | | | $ | 13,936,587 | |
Net realized gain/(loss) on investments | | | (8,453,201 | ) | | | (3,455,954 | ) |
Net change in unrealized appreciation/(depreciation) on investments | | | (177,142 | ) | | | 15,334,674 | |
Cumulative effect on change in fixed income valuation (Note 1) | | | 0 | | | | (854,808 | ) |
Distributions to preferred stockholders from net investment income | | | (2,157,713 | ) | | | (998,354 | ) |
| | |
|
|
| |
|
|
|
Net increase/(decrease) in net assets resulting from operations | | | 3,654,638 | | | | 23,962,145 | |
| | |
|
|
| �� |
|
|
|
DISTRIBUTIONS TO COMMON STOCKHOLDERS FROM: | | | | | | | | |
Net investment income | | | (11,615,091 | ) | | | (11,590,343 | ) |
| | |
|
|
| |
|
|
|
Total distributions to common stockholders | | | (11,615,091 | ) | | | (11,590,343 | ) |
| | |
|
|
| |
|
|
|
FUND SHARE TRANSACTIONS (NOTE 2): | | | | | | | | |
Value of 22,866 and 36,675 shares issued in reinvestment of dividends to common stockholders in 2005 and 2004, respectively | | | 209,289 | | | | 332,007 | |
| | |
|
|
| |
|
|
|
Total increase in net assets derived from fund share transactions | | | 209,289 | | | | 332,007 | |
| | |
|
|
| |
|
|
|
Total net increase/(decrease) in net assets applicable to common stockholders | | | (7,751,164 | ) | | | 12,703,809 | |
NET ASSETS APPLICABLE TO COMMON STOCKHOLDERS: | | | | | | | | |
Beginning of period | | | 123,179,861 | | | | 110,476,052 | |
| | |
|
|
| |
|
|
|
End of period | | $ | 115,428,697 | | | $ | 123,179,861 | |
| | |
|
|
| |
|
|
|
Undistributed Net Investment Income | | $ | 1,013,224 | | | $ | 630,772 | |
| | |
|
|
| |
|
|
|
See accompanying Notes to Financial Statements.
10
PACHOLDER HIGH YIELD FUND, INC.
Financial Highlights
(Contained below is per share operating performance data for a share of common stock outstanding, total return performance, ratios to average net assets and other supplemental data. This information has been derived from information provided in the financial statements and market price data for the Fund’s shares calculated using average shares outstanding.)
| | | | | | | | | | | | | | | | | | | | |
| | | Year Ended December 31,
| |
| | | 2005 | | | 2004 | | | 2003 | | | 2002 | | | 2001 | |
Net asset value, beginning of period | | $ | 9.55 | | | $ | 8.59 | | | $ | 5.73 | | | $ | 7.78 | | | $ | 10.03 | |
| | |
|
|
| |
|
|
| |
|
|
| |
|
|
| |
|
|
|
Net investment income | | | 1.12 | | | | 1.08 | | | | 1.10 | | | | 1.41 | | | | 1.87 | |
Net realized and unrealized gain/(loss) on investments | | | (0.67 | ) | | | 0.93 | | | | 2.77 | | | | (2.15 | ) | | | (1.78 | ) |
Cumulative effect on change in fixed income valuation (Note 1) | | | — | | | | (0.07 | ) | | | — | | | | — | | | | — | |
Distributions to preferred stockholders from net investment income | | | (0.16 | ) | | | (0.08 | ) | | | (0.07 | ) | | | (0.12 | ) | | | (0.37 | ) |
| | |
|
|
| |
|
|
| |
|
|
| |
|
|
| |
|
|
|
Net increase/(decrease) in net asset value resulting from operations | | | 0.29 | | | | 1.86 | | | | 3.80 | | | | (0.86 | ) | | | (0.28 | ) |
| | |
|
|
| |
|
|
| |
|
|
| |
|
|
| |
|
|
|
Distributions to Common Stockholders from: | | | | | | | | | | | | | | | | | | | | |
Net investment income | | | (0.90 | ) | | | (0.90 | ) | | | (0.89 | ) | | | (1.15 | ) | | | (1.65 | ) |
Return of capital | | | — | | | | — | | | | (0.05 | ) | | | (0.04 | ) | | | — | |
| | |
|
|
| |
|
|
| |
|
|
| |
|
|
| |
|
|
|
Total distributions to common stockholders | | | (0.90 | ) | | | (0.90 | ) | | | (0.94 | ) | | | (1.19 | ) | | | (1.65 | ) |
| | |
|
|
| |
|
|
| |
|
|
| |
|
|
| |
|
|
|
Common and Preferred Shares Offering Costs Charged to Paid-In Capital: | | | | | | | | | | | | | | | | | | | | |
Common Shares | | | — | | | | — | | | | — | | | | — | | | | (0.10 | ) |
Preferred Shares | | | — | | | | — | | | | — | | | | — | | | | (0.22 | ) |
| | |
|
|
| |
|
|
| |
|
|
| |
|
|
| |
|
|
|
| | | | 0.00 | | | | 0.00 | | | | 0.00 | | | | 0.00 | | | | (0.32 | ) |
| | |
|
|
| |
|
|
| |
|
|
| |
|
|
| |
|
|
|
Net asset value, end of period | | $ | 8.94 | | | $ | 9.55 | | | $ | 8.59 | | | $ | 5.73 | | | $ | 7.78 | |
| | |
|
|
| |
|
|
| |
|
|
| |
|
|
| |
|
|
|
Market value per share, end of period | | $ | 8.50 | | | $ | 9.82 | | | $ | 9.14 | | | $ | 6.16 | | | $ | 9.08 | |
| | |
|
|
| |
|
|
| |
|
|
| |
|
|
| |
|
|
|
TOTAL INVESTMENT RETURN(1): | | | | | | | | | | | | | | | | | | | | |
Based on market value per common share(2) | | | (4.46 | %) | | | 18.67 | % | | | 67.19 | % | | | (19.91 | %) | | | 1.37 | % |
Based on net asset value per common share(3) | | | 3.33 | % | | | 22.79 | % | | | 68.92 | % | | | (13.05 | %) | | | (8.07 | %) |
RATIOS TO AVERAGE NET ASSETS(4): | | | | | | | | | | | | | | | | | | | | |
Expenses (prior to expenses related to leverage)(5) | | | 1.50 | % | | | 1.83 | % | | | 1.80 | % | | | 0.83 | % | | | 0.75 | % |
Applicable to common stockholders only(6)(7) | | | 2.34 | % | | | 2.88 | % | | | 3.08 | % | | | 1.65 | % | | | 1.32 | % |
Expenses (including expenses related to leverage)(5) | | | 1.59 | % | | | 1.92 | % | | | 1.91 | % | | | 0.95 | % | | | 0.81 | % |
Applicable to common stockholders only(6)(7) | | | 2.48 | % | | | 3.03 | % | | | 3.26 | % | | | 1.90 | % | | | 1.43 | % |
Net investment income applicable to common stockholders only(6)(7) | | | 12.39 | % | | | 12.14 | % | | | 17.17 | % | | | 21.49 | % | | | 20.65 | % |
SUPPLEMENTAL DATA: | | | | | | | | | | | | | | | | | | | | |
Net assets at end of period, net of preferred stock (000) | | $ | 115,429 | | | $ | 123,180 | | | $ | 110,476 | | | $ | 73,307 | | | $ | 99,067 | |
Portfolio turnover rate | | | 95 | % | | | 73 | % | | | 51 | % | | | 40 | % | | | 32 | % |
SENIOR SECURITIES: | | | | | | | | | | | | | | | | | | | | |
Number of preferred shares outstanding at end of period | | | 2,640 | | | | 2,640 | | | | 2,640 | | | | 2,640 | | | | 3,680 | |
Asset coverage per share of preferred stock outstanding at end of period(8) | | $ | 68,723 | | | $ | 71,660 | | | $ | 66,853 | | | $ | 52,768 | | | $ | 51,920 | |
Involuntary liquidation preference and average market value per share of preferred stock | | $ | 25,000 | | | $ | 25,000 | | | $ | 25,000 | | | $ | 25,000 | | | $ | 25,000 | |
| 1 | | Total investment return excludes the effects of commissions. Dividends and distributions to common stockholders, if any, are assumed, for purposes of this calculation, to be reinvested at prices obtained under the Fund’s dividend reinvestment plan. Rights offerings, if any, are assumed, for purposes of this calculation, to be fully subscribed under the terms of the rights offering. |
| 2 | | Assumes an investment at the common share market value at the beginning of the period indicated and sale of all shares at the closing common share market value at the end of the period indicated. |
| 3 | | Assumes an investment at the common share net asset value at the beginning of the period indicated and sale of all shares at the closing common share net asset value at the end of the period indicated. |
| 4 | | Ratios calculated on an annualized basis of expenses and net investment income. Ratios do not include the effect of dividends to preferred stock. |
| 5 | | Ratios calculated relative to the average net assets of both common and preferred stockholders. |
| 6 | | Ratios calculated relative to the average net assets of common stockholders only. |
| 7 | | Information for the years 2001 through 2003 is not audited by previous auditors. Ratios have been derived from audited financial statements for the respective year. |
| 8 | | Calculated by subtracting the Fund’s total liabilities (not including the preferred stock) from the Fund’s total assets, and dividing this by the number of preferred shares outstanding. |
See accompanying Notes to Financial Statements.
11
PACHOLDER HIGH YIELD FUND, INC.
Notes to Financial Statements
| 1. | | SIGNIFICANT ACCOUNTING POLICIES — Pacholder High Yield Fund, Inc. (the “Fund”) is a closed-end, diversified management investment company with a leveraged capital structure. The Fund’s investment objective is to provide a high level of total return through current income and capital appreciation. Under normal circumstances, the Fund invests at least 80% of the value of its assets in high yield securities. The Fund invests primarily in fixed income securities of domestic companies. The Fund was incorporated under the laws of the State of Maryland in August 1988. |
The following is a summary of significant accounting policies followed by the Fund in the preparation of its financial statements.
| | A. | | SECURITY VALUATIONS — Fixed income securities with a maturity of 61 days or more are priced at the bid side of the market by an independent pricing service or broker. Equity securities listed on an exchange are valued at the closing prices as determined by the primary exchange where the securities are traded. Restricted securities, portfolio securities not priced by the independent pricing service and other assets are valued at fair value as determined under procedures established and monitored by the Board of Directors. At December 31, 2005, there were board-valued securities of $1,403,549. Original obligations with maturities of 60 days or less at the date of purchase are valued at amortized cost, which approximates market value. |
Prior to January 1, 2004, the Fund valued fixed income securities based on the mean of bid and asked prices. Effective January 1, 2004, the Fund changed its valuation policy to value fixed income securities based on bid prices, as bid prices are believed to be more representative of the price that could be obtained in sales transactions in the market for such securities. Bid prices generally are lower than those based on the mean of bid and asked prices. The cumulative effect of this accounting change on January 1, 2004 was to decrease the value of investments and net assets applicable to common stockholders by approximately $854,808 ($0.07 per common share). The effect of this change for the year ended December 31, 2004 was to increase the value of investments, change in unrealized appreciation/depreciation and net assets applicable to common stockholders by approximately $2,059 ($0.00 per common share). The cumulative effect of this accounting change had it been applied on January 1, 2003, would have been to decrease the value of investments and net assets applicable to common stockholders by approximately $900,459 ($0.07 per common share). The effect of this change for the year ended December 31, 2003 would have been to increase the value of investments, change in unrealized appreciation/depreciation and net assets applicable to common stockholders by approximately $45,651 ($0.00 per common share). The financial highlights for periods prior to December 31, 2004 have not been restated to reflect this change in accounting policy.
| | B. | | REPURCHASE AGREEMENTS — Each repurchase agreement is valued at amortized cost. In connection with transactions in repurchase agreements, it is the Fund’s policy that a tri-party custodian take possession of the underlying collateral securities in a manner sufficient to enable the Fund to obtain collateral in the event of a counterparty default. If the conterparty defaults and the fair value of the collateral declines, realization of the collateral by the Fund may be delayed or limited. The repurchase agreements are fully collateralized by either or all of the following: U.S. Government agency securities, investment grade corporate bonds, and non-investment grade corporate bonds. |
| | C. | | FEDERAL TAXES — It is the Fund’s policy to make sufficient distributions to stockholders of net investment income and net realized capital gains to comply with the requirements of the Internal Revenue Code of 1986, as amended, applicable to regulated investment companies. |
The Fund intends to continue to qualify as a regulated investment company by complying with the appropriate provisions of the Internal Revenue Code and to distribute to stockholders each year all of its taxable income, if any, and tax-exempt income, including realized gains on investments. A provision of $6,187 for federal excise tax was required at December 31, 2005, because the Fund distributed less than 98% of net investment income. There was no provision required at December 31, 2004.
The tax character of distributions paid during the years ended December 31, 2005 and 2004 was as follows:
| | | | | | |
| | | 2005
| | 2004
|
Common Stockholders | | | | | | |
Ordinary Income | | $ | 11,615,091 | | $ | 11,590,343 |
Return of Capital | | | 0 | | | 0 |
Preferred Stockholders | | | | | | |
Ordinary Income | | $ | 2,157,713 | | $ | 998,354 |
Return of Capital | | | 0 | | | 0 |
12
PACHOLDER HIGH YIELD FUND, INC.
Notes to Financial Statements (continued)
| | D. | | SECURITIES TRANSACTIONS AND INVESTMENT INCOME — Securities transactions are accounted for on the date the securities are purchased or sold (trade date). Realized gains and losses on securities transactions are determined on an identified cost basis. Interest income is recorded on an accrual basis. The Fund accretes discounts or amortizes premiums on all fixed income securities for financial reporting purposes. Dividend income is recorded on the ex-dividend date. |
| | E. | | SECURITY LENDING — To generate additional income, the Fund lends its securities, to approved brokers and receives cash as collateral to secure the loans. The Fund receives payments from borrowers equivalent to the dividends and interest that would have been earned on securities lent while simultaneously seeking to earn income on the investment of collateral. Although the risk of lending is mitigated by the collateral, the Fund could experience a delay in recovering its securities and a possible loss of income or value if the borrower fails to return them. Loans are subject to termination by the Fund or the borrower at any time, and are, therefore, not considered to be illiquid investments. As of December 31, 2005, the Fund loaned securities having a value of approximately $26,544,490. Collateral is marked to market daily to provide a level of collateral at not less than 102% of the value of loaned securities. The cash collateral received by the Fund at December 31, 2005 was invested in repurchase agreements (with interest rates ranging from 3.6% to 4.42% and maturity dates of January 3, 2006). Information on the investment of cash collateral is shown in the Statement of Net Assets Applicable to Common Stockholders. The Fund had received cash collateral of $27,549,300 for the loans and invested the collateral in repurchase agreements. |
Prior to November 15, 2005, the Fund lent its securities pursuant to an Amended and Restated Securities Lending Agreement, dated February 1, 2002 between the Fund, Pacholder & Company, LLC (the “Advisor”), and the Fund’s affiliated custodian, Bank One Trust Company, National Association (the “Custodian”). For custody services in connection with the securities lending program for the Fund, the Custodian was entitled to a fee calculated on an annual basis and accrued daily, equal to .05% of the value of the collateral received from the borrower for each loan of U.S. government and agency securities and .10% of the value of the collateral received from the borrower for each loan of equities and corporate bonds. For the period ended December 31, 2005, the Custodian retained $24,862 for services under the securities lending agreement.
On November 15, 2005, the Fund entered into a new securities lending agreement with JPMorgan Chase Bank, N.A. (“JPMorgan Chase Bank”) pursuant to which JPMorgan Chase Bank is entitled to a fee equal to .06% of the average dollar value of loans of U.S. securities outstanding during a given month; and .1142% of the average dollar value of loans of non-U.S. securities outstanding during a given month. JPMorgan Chase Bank is an affiliate of the adviser. For the period ended December 31, 2005, the Custodian retained $2,775 for services under the securities lending agreement.
| | F. | | EXPENSES AND DISTRIBUTIONS — Expenses are accrued as incurred. Dividends to common stockholders are paid from net investment income monthly, and distributions of net realized capital gains, if any, are paid at least annually. Dividends to preferred stockholders are accrued daily based on a variable interest rate set at weekly auctions and are paid weekly from net investment income. Distributions are determined in accordance with federal income tax regulations which may differ from generally accepted accounting principles. |
| | G. | | WHEN, AS AND IF ISSUED SECURITIES — The Fund may engage in “when-issued” or “delayed delivery” transactions. The Fund records when-issued securities on the trade date and maintains security positions such that sufficient liquid assets will be available to make payment for the securities purchased. Securities purchased on a when-issued or delayed delivery basis begin earning interest on the settlement date. |
The Fund had no when-issued or delayed-delivery purchase commitments as of December 31, 2005.
| | H. | | ESTIMATES — The preparation of financial statements in conformity with accounting principles generally accepted in the United States of America requires management to make estimates and assumptions that affect the reported amounts of assets and liabilities and disclosure of contingent assets and liabilities at the date of the financial statements and the reported amounts of revenues and expenses during the reporting period. Actual results could differ from these estimates. |
| | I. | | INTEREST RATE SWAPS — Unrealized gains are reported as an asset and unrealized losses are reported as a liability on the Statement of Net Assets Applicable to Common Stockholders. The change in value of swaps, including the periodic amounts of interest |
13
PACHOLDER HIGH YIELD FUND, INC.
Notes to Financial Statements (continued)
| | to be paid or received on swaps, is reported as unrealized gains or losses in the Statement of Operations. A realized gain or loss is recorded upon payment or receipt of a periodic payment or termination of swap agreements. Swap agreements are stated at fair value. |
| | J. | | INDEMNIFICATIONS — The Fund’s officers and directors are indemnified against certain liabilities arising out of the performance of their duties to the Fund. In addition, in the normal course of business, the Fund enters into contracts with its vendors and others that provide for general indemnifications. The Fund’s maximum exposure under these arrangements is unknown, as this would involve future claims that may be made against the Fund. However, based on experience, the Fund expects the risk of loss to be remote. |
| 2. | | COMMON STOCK — At December 31, 2005, there were 49,996,320 shares of common stock with a $.01 par value authorized and 12,918,186 shares outstanding. During the years ended December 31, 2005 and December 31, 2004, the Fund issued 22,866 and 36,675 shares of common stock, respectively, in connection with its dividend reinvestment plan. |
| 3. | | PREFERRED STOCK — On June 29, 2001, the Fund issued 3,680 shares of Series W Auction Rate Cumulative Preferred Stock “ARPS” at an offering price of $25,000 per share. Dividends on these shares are paid weekly at an annual rate determined by a weekly auction. The Fund is required to maintain certain asset coverages as set forth in the Fund’s Articles Supplementary Creating and Fixing the Rights of Auction Rate Cumulative Preferred Stock. The preferred stock is subject to mandatory redemption at a redemption price of $25,000 per share, plus accumulated and unpaid dividends, if the Fund is not in compliance with the required asset coverage (minimum 2 to 1) tests and restrictions. In general, the holders of the ARPS and the common stock vote together as a single class, except that the ARPS stockholders, as a separate class, vote to elect two members of the Board of Directors, and separate votes are required on certain matters that affect the respective interests of the ARPS and common stock. The ARPS has a liquidation preference of $25,000 per share, plus accumulated and unpaid dividends. During 2002, the Fund redeemed a total of $26,000,000 or 1,040 shares of Series W ARPS at various intervals and amounts. No redemptions have occurred since 2002. At December 31, 2005, accrued ARPS dividends were $24,088. |
| 4. | | INTEREST RATE SWAPS — The Fund entered into interest payment swap arrangements with Citibank, N. A. New York “Citibank” for the purpose of partially hedging its dividend payment obligations with respect to the ARPS. Pursuant to each of the swap arrangements, the Fund makes payments to Citibank on a monthly basis at fixed annual rates. In exchange for such payments Citibank makes payments to the Fund on a monthly basis at a variable rate determined with reference to the one month London Interbank Offered Rate (LIBOR). The variable rates ranged from 2.21% to 4.38% for the year ended December 31, 2005. The effective date, notional amount, maturity and fixed rates of the swaps are as follows: |
| | | | | | | | | | | | | | | |
Effective Date
| | Notional
Contract Amount
| | Maturity
| | Fixed
Annual Rate
| | | Floating
Annual Rate*
| | | Unrealized Mark to
Market
| |
7/16/2001 | | $ | 10 million | | 7/17/2006 | | 5.52 | % | | 4.37 | % | | $ | (51,157 | ) |
11/13/2001 | | $ | 5 million | | 11/13/2006 | | 4.07 | % | | 4.36 | % | | | 28,707 | |
10/1/2004 | | $ | 10 million | | 10/1/2007 | | 3.30 | % | | 4.29 | % | | | 251,282 | |
6/1/2005 | | $ | 5 million | | 6/2/2008 | | 4.10 | % | | 4.29 | % | | | 72,822 | |
6/1/2005 | | $ | 5 million | | 6/1/2009 | | 4.15 | % | | 4.29 | % | | | 92,704 | |
12/1/2005 | | $ | 5 million | | 12/1/2009 | | 4.74 | % | | 4.29 | % | | | (2,824 | ) |
| * | | Represents rate in effect at December 31, 2005. |
Swap transactions, which involve future settlement, give rise to credit risk. Credit risk is the amount of loss the Fund would incur in the event counterparties failed to perform according to the terms of the contractual commitments. The Fund is exposed to credit loss in the event of nonperformance by the counterparty on interest rate swaps, but the Fund does not anticipate nonperformance by the counterparty. While notional contract amounts are used to express the volume of interest rate swap agreements, the amounts potentially subject to credit risk, in the event of nonperformance by counterparties, are substantially smaller.
For the year ended December 31, 2005, the Fund’s receipts under the swap agreements were less than the amount paid and accrued to Citibank by $499,282 and are included as realized loss in the accompanying Statement of Operations.
The estimated fair value of the interest rate swap agreements at December 31, 2005, amounted to approximately $391,534 in unrealized appreciation and is included in the accompanying Statement of Net Assets Applicable to Common Stockholders. Swap transactions present risk of loss in excess of the related amounts included in the Statement of Net Assets Applicable to Common Stockholders.
| 5. | | PURCHASES AND SALES OF SECURITIES — Purchases and sales of securities (excluding short-term securities) for the year ended December 31, 2005 aggregated $171,825,842 and $174,131,584, respectively. |
14
PACHOLDER HIGH YIELD FUND, INC.
Notes to Financial Statements (continued)
| 6. | | TRANSACTIONS WITH INVESTMENT ADVISOR, ADMINISTRATOR, ACCOUNTING SERVICES AGENT AND CUSTODIAN — The Fund has an investment advisory agreement with Pacholder & Company, LLC (the “Advisor”), an Ohio limited liability company, which is wholly-owned by JPMorgan Investment Advisors, Inc., effective March 1, 2005, pursuant to which the Advisor serves as the Fund’s investment advisor. Prior to March 1, 2005, JPMorgan Investment Advisors, Inc. (formerly known as Banc One Investment Advisors Corporation) owned 49% of the Advisor. The Fund pays the Advisor an advisory fee that varies based on the total return investment performance of the Fund for the prior twelve-month period relative to the percentage change in the Credit Suisse First Boston High Yield Index, Developed Countries OnlyTM (formerly known as the Credit Suisse First Boston Domestic+ High Yield Index). The fee, which is accrued at least weekly and paid monthly, ranges from a maximum of 1.40% to a minimum of 0.40% (on an annualized basis) of the Fund’s average net assets. For purposes of calculating the amount of the advisory fee, the Fund’s average net assets are determined by taking the average of all determinations of such net assets during the applicable 12-month period and the Fund’s net assets mean the total assets of the Fund minus accrued liabilities of the Fund other than the principal amount of any outstanding senior securities representing indebtedness (within the meaning of Section 18 of the 1940 Act). Notwithstanding the foregoing, during the 12-month period following March 1, 2005, the date on which the investment advisory agreement took effect, the Fund is obligated to pay the Advisor the minimum fee payable under the investment advisory agreement and any balance due based on the Fund’s investment performance during the period will be paid to the Advisor upon completion of the 12-month period. For the year ended December 31, 2005, the advisory fee is calculated based on 1.03% of average weekly net assets (as defined above) of the Fund. At December 31, 2005, accrued advisory fees were $1,208,263. Certain officers and directors of the Fund are also officers and managers of the Advisor. |
Effective March 1, 2005, the Fund has an administrative services agreement with JPMorgan Funds Management, Inc. (“JPMFM”) (an affiliate of the Advisor) pursuant to which JPMFM provides administrative services to the Fund. Under the agreement, JPMFM receives from the Fund a fee, accrued at least weekly and paid monthly, at the annual rate of 0.10% of the average weekly net assets of the Fund. At December 31, 2005, accrued administrative fees were $15,405.
Effective March 1, 2005, the Fund also has an agreement with JPMFM to provide portfolio accounting and net asset value calculations for the Fund. Under the agreement, JPMFM receives from the Fund a fee, accrued at least weekly and paid monthly, at the annual rate of 0.025% of the first $100 million of the Fund’s average weekly net assets and 0.015% of such assets in excess of $100 million. At December 31, 2005, accrued accounting fees were $3,160.
Prior to March 1, 2005, administrative and accounting services to the Fund were provided at the same rates by Kenwood Administrative Management, Inc. and Pacholder Associates, Inc., which were affiliates of the Advisor.
The Fund has an agreement with Bank One Trust Company, N.A. (an affiliate of the Advisor) to provide custodial services for the Fund. Under the agreement, Bank One Trust Company, N.A. receives from the Fund a fee, accrued at least weekly and paid monthly, at the annual rate of 0.01% of the Fund’s average weekly net assets. At December 31, 2005, accrued custodial fees were $2,950.
As of December 31, 2005, liabilities for the Fund, other than those previously indentified, included:
| | | |
Securities purchased payable | | $ | 4,209,393 |
Other liabilities | | | 95,015 |
| 7. | | COMPONENTS OF ACCUMULATED EARNINGS (LOSSES) — At December 31, 2005, the components of net assets applicable to common stockholders (excluding paid in capital) on a tax basis were as follows: |
| | | | |
| | | December 31,
2005
| |
Undistributed net investment income | | $ | 437,627 | |
| | |
|
|
|
Accumulated net realized gain/(loss) on investments | | $ | (54,892,304 | ) |
| | |
|
|
|
Gross Unrealized appreciation on investments | | | 7,264,634 | |
Gross Unrealized depreciation on investments | | | (16,654,738 | ) |
| | |
|
|
|
Net Unrealized appreciation/(depreciation) on investments | | $ | (9,390,104 | ) |
| | |
|
|
|
Cost of investments for Federal Tax purposes | | $ | 215,466,418 | |
| | |
|
|
|
The differences between the book-basis and tax-basis unrealized appreciation/(depreciation) is attributable primarily to: the difference between book and tax amortization methods for premium and market discount, and differing treatment of swap payments.
15
PACHOLDER HIGH YIELD FUND, INC.
Notes to Financial Statements (concluded)
Net capital losses incurred after October 31, and within the taxable year are deemed to arise on the first business day of the Fund’s next taxable year. For the year ended December 31, 2005, the Fund deferred to January 1, 2006 post-October capital losses of $1,421,305.
At December 31, 2005, the Fund had available a capital loss carryforward of $54,892,304, of which $2,513,330 expires in 2006, $5,237,176 expires in 2007, $4,746,544 expires in 2008, $4,438,792 expires in 2009, $8,135,473 expires in 2010, $20,873,746 expires in 2011, $2,030,683 expires in 2012, and $6,916,560 expires in 2013, to offset any future net capital gains.
| 8. | | SCHEDULE OF RESTRICTED SECURITIES — A restricted security is a security which has been purchased through a private offering and cannot be resold to the general public without prior registration under the Securities Act of 1933 (the “Act”) or pursuant to the resale limitations provided by Rule under the Act, or an exemption from the registration requirements of the Act. At December 31, 2005, the Fund held restricted securities representing 0.69% of the Fund’s long-term market value. The restricted securities held as of December 31, 2005 are identified below: |
| | | | | | | |
Security
| | Description
| | Acquisition
Date
| | Cost of Security
|
Golden State Foods | | Bond | | 2/26/04 | | $ | 1,250,000 |
Bally Total Fitness1 | | Common Stock | | 12/30/05 | | | 26,830 |
| 1 | | Represents 6 percent of the Fund’s investment in this issuer. |
16
PACHOLDER HIGH YIELD FUND, INC.
Report of Independent Registered Public Accounting Firm
To the Board of Directors and Shareholders of
Pacholder High Yield Fund, Inc.:
In our opinion, the accompanying statement of net assets, and the related statements of operations and of changes in net assets and the financial highlights present fairly, in all material respects, the financial position of Pacholder High Yield Fund, Inc. (the “Fund”) at December 31, 2005, and the results of its operations for the year then ended and the changes in its net assets and financial highlights for each of the two years in the period then ended, in conformity with accounting principles generally accepted in the United States of America. These financial statements and financial highlights (hereafter referred to as “financial statements”) are the responsibility of the Fund’s management; our responsibility is to express an opinion on these financial statements based on our audits. We conducted our audits of these financial statements in accordance with the standards of the Public Company Accounting Oversight Board (United States). Those standards require that we plan and perform the audit to obtain reasonable assurance about whether the financial statements are free of material misstatement. An audit includes examining, on a test basis, evidence supporting the amounts and disclosures in the financial statements, assessing the accounting principles used and significant estimates made by management, and evaluating the overall financial statement presentation. We believe that our audits, which included confirmation of securities at December 31, 2005 by correspondence with the custodian and brokers, provide a reasonable basis for our opinion. The financial statements of the Fund as of December 31, 2003 and for each of the periods in the three years then ended were audited by other auditors whose report, dated February 20, 2004, expressed an unqualified opinion on those statements.
Columbus, Ohio
February 23, 2006
17
PACHOLDER HIGH YIELD FUND, INC.
Annual Meeting Results (Unaudited)
The Fund held its 2005 annual meeting of shareholders on December 9, 2005, to elect directors of the Fund.
The results of voting were as follows (by number of shares):
| | |
| For nominees to the Board of Directors: | | |
| |
William J. Morgan1 | | |
In favor: | | 2,510 |
Withheld: | | 2 |
| |
George D. Woodard1 | | |
In favor: | | 2,510 |
Withheld: | | 2 |
| |
John F. Williamson2 | | |
In favor: | | 11,860,404 |
Withheld: | | 186,820 |
| |
Daniel A. Grant2 | | |
In favor: | | 11,873,053 |
Withheld: | | 174,171 |
| 1 | | Elected by holders of the Fund’s Auction Rate Preferred Stock voting separately as a class. |
| 2 | | Elected by holders of the Fund’s Auction Rate Preferred Stock and Common Stock voting together as a single class. |
18
PACHOLDER HIGH YIELD FUND, INC.
Supplemental Information (Unaudited)
Portfolio Holdings Information
The Fund files its complete schedule of portfolio holdings with the U.S. Securities and Exchange Commission (“SEC”) for the first and third quarters of each fiscal year on Form N-Q. The Fund’s Forms N-Q are available, without charge, on the SEC’s website at www.sec.gov. The Fund’s Forms N-Q may be reviewed and copied at the SEC’s Public Reference Room in Washington, DC. Information on the operation of the Public Reference Room may be obtained by calling 1-800-SEC-0330. The Fund’s website at www.phf-hy.com contains schedules of portfolio investments of the Fund.
Proxy Voting
A description of the policies and procedures used by the Fund to vote proxies relating to portfolio securities, as well as information regarding how the Fund voted proxies relating to portfolio securities during the most recent 12-month period ended June 30, is available (i) without charge, on the Fund’s website at www.phf-hy.com and (ii) on the SEC’s website at www.sec.gov.
Privacy Policy
Protecting Your Privacy
Our Pledge to You
THE FUND IS COMMITTED TO YOUR PRIVACY. On this page, you will find the Fund’s policies and practices for collecting, disclosing, and safeguarding “nonpublic personal information,” which may include financial or other customer information. These policies apply to individuals who purchase Fund shares for personal, family, or household purposes, or have done so in the past. This notification replaces all previous statements of the Fund’s consumer privacy policy, and may be amended at any time. We’ll keep you informed of changes as required by law.
YOUR ACCOUNT IS MAINTAINED IN A SECURE ENVIRONMENT. The Fund maintains physical, electronic and procedural safeguards that comply with federal regulations to guard nonpublic personal information. The Fund’s agents and service providers have limited access to customer information based on their role in servicing your account.
THE FUND COLLECTS INFORMATION IN ORDER TO SERVICE AND ADMINISTER YOUR ACCOUNT. The Fund collects a variety of nonpublic personal information, which may include:
| | • | | Information we receive from you, such as your name, address, and social security number. |
| | • | | Information about your transactions with us, such as the purchase or sale of Fund shares. |
| | • | | Information we receive from agents and service providers, such as proxy voting information. |
THE FUND DOES NOT SHARE NONPUBLIC PERSONAL INFORMATION WITH ANYONE, EXCEPT AS PERMITTED OR REQUIRED BY LAW.
Thank you for this opportunity to serve you.
Dividend Reinvestment Plan
The Fund’s Dividend Reinvestment Plan offers you an automatic way to reinvest your dividends and capital gains distributions in additional shares of the Fund. For an enrollment form and detailed information about the Plan, please contact Computershare Investor Services, P.O. Box 2388, Chicago, IL 60690-2388, (888) 294-8217, and www.computershare.com.
19
PACHOLDER HIGH YIELD FUND, INC.
Directors and Officers (Unaudited)
The officers of the Fund are elected by and hold office at the discretion of the Board of Directors of the Fund. The Board of Directors has elected three officers of the Fund. The following table sets forth information concerning each executive officer of the Fund who served during all of the last fiscal year of the Fund. The Fund is not part of a fund complex and is the only fund overseen by the directors. None of the directors hold other directorships.
The business address of each director and officer of the Fund is 8044 Montgomery Road, Suite 555, Cincinnati, OH 45236
| | | | | | | | |
Interested Director Name
| | Age
| | Position(s) Held with the Fund
| | Term of Office and
Length of Time Served
| | Principal Occupation(s) During Past Five Years
|
William J. Morgan* | | 51 | | President and Director | | Elected annually; President since 2000; director since 1988. Chairman of the Board, 1997-2004 | | From March 1, 2005 to present, Managing Director, JPMorgan Investment Advisors, Inc. Prior to March 1, 2005, President, Treasurer and Director, Pacholder Associates, Inc. |
| | | | |
Non-Interested Directors
Name
| | Age
| | Position(s) Held with the Fund
| | Term of Office and
Length of Time Served
| | Principal Occupation(s) During Past Five Years
|
John F. Williamson | | 67 | | Chairman of the Board | | Elected annually; Chairman of the Board
since Feb. 2004 and director since 1991. | | Chairman and President, Williamson Associates, Inc. (investment adviser) Jan. 1997 to June 2002; Director of ICO, Inc., April 1995 to May 2002, Chairman from June 2001 to May 2002. |
| | | | |
George D. Woodard | | 59 | | Director | | Elected annually;
director since 1995. | | Manager, Henry & Horne, LLP (certified public accountants), since March 2000 and 1996-1999; Realtor with A.S.K. Realty, August 1999-February 2000. |
| | | | |
Daniel A. Grant | | 61 | | Director | | Elected annually;
director since 1992. | | President, Utility Management Services (business consulting). |
| | | | |
Officers
Name
| | Age
| | Position(s) Held with the Fund
| | Term of Office and
Length of Time Served
| | Principal Occupation(s) During Past Five Years
|
James P. Shanahan, Jr.* | | 44 | | Secretary | | Position held since 1988. | | From March 1, 2005 to present, Managing Director, JPMorgan Investment Advisors, Inc. Prior to March 1, 2005, Executive Vice President and General Counsel, Pacholder Associates, Inc. |
| | | | |
James E. Gibson* | | 41 | | Treasurer | | Position held since 2000. | | From March 1, 2005 to present, Vice President, JPMorgan Investment Advisors, Inc. Prior to March 1, 2005, Executive Vice President, Pacholder Associates, Inc. |
| | | | |
David A. Groshoff* | | 33 | | Chief Compliance Officer | | Position held since 2003. | | From March 1, 2005 to present, Vice President, JPMorgan Investment Advisors, Inc. Prior to March 1, 2005, Senior Vice President, Associate General Counsel & Chief Compliance Officer, Pacholder Associates, Inc. |
| * | | Messrs. Morgan, Shanahan, Gibson, and Groshoff are considered “interested persons” of the Fund as defined in the 1940 Act because of their affiliation with the Fund’s investment adviser, and with JPMorgan Investment Advisors, Inc., the sole member of the Fund’s investment adviser. |
20
The Registrant has adopted a code of ethics, as defined in Item 2 of Form N-CSR, which applies to the Registrant’s principal executive officer and principal financial officer. A copy of the code is filed as Exhibit 12(a)(1) to this Form.
| Item 3. | Audit Committee Financial Expert. |
The Registrant’s Board of Directors has determined that George D. Woodard, the Chairman of the Audit Committee of the Board, is an audit committee financial expert as defined in Item 3 of Form N-CSR. Mr. Woodard is considered “independent” for purposes of Item 3 of Form N-CSR.
| Item 4. | Principal Accountant Fees and Services. |
(a) – (d) Aggregate fees billed to the Registrant for the last two fiscal years for professional services rendered by the Registrant’s principal accountant were as follows:
| | | | | | |
| | | 2005 | | 2004 |
(a) Audit Fees | | $ | 61,000 | | $ | 59,500 |
(b) Audit-Related Fees | | | 5,000 | | | 4,500 |
(c) Tax Fees | | | 3,750 | | | 3,500 |
(d) All Other Fees | | | 0 | | | 0 |
Audit fees include amounts related to the audit of the Registrant’s annual financial statements and services normally provided by the accountant in connection with statutory and regulatory fillings. Audit-related fees include amounts for attestation services and review of internal controls. Tax fees include amounts related to tax compliance, tax planning, and tax advice. No fees were incurred for professional services other than audit, audit related, and tax compliance, tax advice and tax planning for fiscal years ended December 31, 2004 and 2005.
(e)(1) The Registrant’s Audit Committee has adopted a policy whereby audit and non-audit services performed by the Registrant’s principal accountant for the Registrant, its investment adviser, and any entity controlling, controlled by, or under common control with the investment adviser that provides ongoing services to the Registrant require pre-approval and/or review in advance at regularly scheduled Audit Committee meetings. Pre-approval may be authorized by one Audit Committee member with ratification at the next scheduled Audit Committee meeting. Waiver of pre-approval for audit or non-audit services requiring fees of a de minimis amount is not permitted.
(2) One hundred percent of the services included in (b) – (d) above were approved pursuant to paragraph (c)(7)(i)(C) of Rule 2-01 of Regulation S-X.
(f) Not applicable.
(g) The aggregate fees billed for the most recent fiscal year and the preceding year by the Registrant’s principal accountant for non-audit services rendered to the Registrant, its investment adviser, and any entity controlling, controlled by, or under common control with the investment adviser that provides ongoing services to the Registrant were $62,000,000 and $59,200,000, respectively.
(h) All non-audit services rendered in (g) above were pre-approved and/or reviewed by the Registrant’s audit committee. Accordingly, these services were considered by the Registrant’s Audit Committee in determining whether such services were compatible with maintaining the principal accountant’s independence.
| Item 5. | Audit Committee of Listed Registrants. |
The Registrant has a separately-designated standing Audit Committee established by the Board of Directors of the Registrant in accordance with Section 3(a)(58)(A) of
the Securities Exchange Act of 1934, as amended. It is composed of the following Directors, each of whom is not an “interested person” as defined in the Investment Company Act of 1940, as amended:
George D. Woodard
Daniel A. Grant
| Item 6. | Schedule of Investments. |
Included as part of the report to stockholders filed under Item 1 of this Form N-CSR.
| Item 7. | Disclosure of Proxy Voting Policies and Procedures for Closed-End Management Investment Companies. |
The Registrant has adopted proxy voting policies and procedures, as defined in Item 7 of Form N-CSR. A copy of the policies and procedures is filed as Exhibit 12(a)(3) to this Form.
| Item 8. | Portfolio Managers of Closed-End Management Investment Companies. |
PORTFOLIO MANAGEMENT
As of the date of this report, the portfolio manager primarily responsible for the day-to-day management of the Fund’s portfolio is William J. Morgan, President and Director of the Fund and a Manager of the Adviser.
Mr. Morgan has been managing the Fund since June 2000 and has been associated with the Adviser in an investment management capacity for more than five years.
OTHER ACCOUNTS MANAGED BY THE PORTFOLIO MANAGER
As of December 31, 2005, Mr. Morgan managed two mutual funds with a total of approximately $1.2 billion in assets; zero pooled investment vehicles; and seven other accounts with a total of approximately $169 million in assets.
POTENTIAL CONFLICT OF INTEREST
The portfolio manager acts as portfolio manager for multiple accounts on behalf of the Adviser and its affiliated entities. Because the portfolio manager manages assets for other investment companies and other accounts (including institutional clients, pension plans and certain high net worth individuals), there may be an incentive to favor one client over another resulting in conflicts of interest. For Instance, the Adviser may receive fees from the Fund that are higher than the fee it receives from certain accounts. The portfolio manager of the Fund does not currently manage assets for other investment companies or other accounts that charge a performance fee other than the Fund. In this instance, the portfolio manager in his capacity as an officer of the Adviser may have an incentive to favor the Fund over certain accounts. In order to manage these conflicts, the Adviser has adopted trade allocation and other policies
and procedures that it believes are reasonably designed to address these and other conflicts of interest.
PORTFOLIO MANAGER COMPENSATION
The portfolio manager’s total compensation program includes a base salary fixed from year to year and a variable performance bonus consisting of cash incentives and restricted stock and, in some cases, mandatory deferred compensation. These elements reflect individual performance and the performance of the Adviser’s business as a whole.
The portfolio manager’s performance is formally evaluated annually based on a variety of factors including the aggregate size and blended performance of the portfolios such portfolio manager manages. Individual contribution relative to client goals carries the highest impact. Portfolio manager compensation is primarily driven by meeting or exceeding clients’ risk and return objectives, relative performance to competitors or competitive indices and compliance with firm policies and regulatory requirements. Investment performance is generally more heavily weighted to the long-term.
Stock awards are granted as part of an employee’s annual performance bonus and comprise from 0% to 35% of the portfolio manager’s total award. As the level of incentive compensation increases, the percentage of compensation awarded in restricted stock also increases.
Up to 50% of the restricted stock portion of the portfolio manager’s bonus may instead be subject to a mandatory notional investment in selected mutual funds advised by the Adviser’s affiliates. When these deferred amounts vest over time, the portfolio manager receives cash equal to the market value of the notional investment in the selected mutual funds.
SECURITIES OWNERSHIP OF PORTFOLIO MANAGER
As of December 31, 2005, the dollar range of securities beneficially owned by the portfolio manager in the Fund is shown below:
William J. Morgan: $100,001 – $500,000
| Item 9. | Purchases of Equity Securities by Closed-End Management Investment Company and Affiliated Purchasers. |
There were no purchases covered by this Item during the period covered by this report.
| Item 10. | Submission of Matters to a Vote of Security Holders. |
The Registrant has not made material changes since the Registrant last provided disclosure in response to the requirements of Item 7(d)(2)(ii)(G) of Schedule 14A or this Item.
| Item 11. | Controls and Procedures. |
Registrant’s principal executive officer and principal financial officer have concluded, based on their evaluation of the Registrant’s disclosure controls and procedures as of a date within 90 days of the filing date of this Form N-CSR, that the Registrant’s disclosure controls and procedures are reasonably designed to ensure that information required to be disclosed by the Registrant on Form N-CSR is recorded, processed, summarized and reported within the required time periods and that information required to be disclosed by the Registrant in the reports that it files or submits on Form N-CSR is accumulated and communicated to the Registrant’s management, including its principal executive and principal financial officers, as appropriate to allow timely decisions regarding required disclosure.
There was one change to the Registrant’s internal control over financial reporting (as defined in Rule 30a-3(d) under the Investment Company Act of 1940) that occurred during the second fiscal quarter of the period covered by this report that has materially affected, or is reasonably likely to materially affect, the registrant’s internal control over financial reporting. This change involves implementation of new accounting procedures for securities subject to a plan of reorganization or similar transaction resulting from bankruptcy or similar insolvency proceedings. Under the new procedures, fund accounting will provide a recommendation for the appropriate accounting for the reorganization to the appropriate analyst and fund officer for review and approval. In addition, fund accounting will provide a weekly report to all of the analysts, traders and portfolio managers of the fund of all reorganization transactions on which the fund has voted but has not yet actually received all of the reorganization consideration expected to be received by the fund.
(a)(1) Code of Ethics – referred to in Item 2.
(a)(2a) Certification of principal executive and principal financial officer as required by Rule 30a-2(a) under the Investment Company Act of 1940 attached hereto as part of EX-99.CERT.
(a)(2b) Certification of principal executive and principal financial officer as required by Rule 30a-2(b) under the Investment Company Act of 1940 attached hereto as part of EX-99.906.CERT.
(a)(3) Proxy Voting Polices and Procedures – referred to in Item 7.
SIGNATURES
Pursuant to the requirements of the Securities Exchange Act of 1934 and the Investment Company Act of 1940, the Registrant has duly caused this report to be signed on its behalf by the undersigned, thereunto duly authorized.
| | | | |
Pacholder High Yield Fund, Inc. | | | | |
| | |
| | | | | March 10, 2006 |
William J. Morgan | | | | Date |
President (principal executive officer) | | | | |
Pursuant to the requirements of the Securities Exchange Act of 1934 and the Investment Company Act of 1940, this report has been signed below by the following persons on behalf of the Registrant and in the capacities and on the dates indicated.
| | | | |
| | |
| | | | | March 10, 2006 |
William J. Morgan | | | | Date |
President (principal executive officer) | | | | |
| | |
| | | | | March 10, 2006 |
James E. Gibson | | | | Date |
Treasurer (principal financial officer) | | | | |