UNITED STATES
SECURITIES AND EXCHANGE COMMISSION
Washington, D.C. 20549
FORM N-CSR
CERTIFIED SHAREHOLDER REPORT OF REGISTERED
MANAGEMENT INVESTMENT COMPANIES
Investment Company Act file number: 811-05639
Pacholder High Yield Fund, Inc.
(Exact name of registrant as specified in charter)
8044 Montgomery Road, Ste. 555, Cincinnati, OH 45236
(Address of principal executive offices) (Zip code)
Gary J. Madich
8044 Montgomery Road, Ste. 555
Cincinnati, OH 45236
(Name and address of agent for service)
Registrant’s telephone number, including area code: (513) 985-3200
Date of fiscal year end: December 31
Date of reporting period: January 1, 2006 through December 31, 2006
Form N-CSR is to be used by management investment companies to file reports with the Commission not later than 10 days after the transmission to stockholders of any report that is required to be transmitted to stockholders under Rule 30e-1 under the Investment Company Act of 1940 (17 CFR 270.30e-1). The Commission may use the information provided on Form N-CSR in its regulatory, disclosure review, inspection, and policymaking roles.
A registrant is required to disclose the information specified by Form N-CSR, and the Commission will make this information public. A registrant is not required to respond to the collection of information contained in Form N-CSR unless the Form displays a currently valid Office of Management and Budget (“OMB”) control number. Please direct comments concerning the accuracy of the information collection burden estimate and any suggestions for reducing the burden to Secretary, Securities and Exchange Commission, 450 Fifth Street, NW, Washington, DC 20549-0609. The OMB has reviewed this collection of information under the clearance requirements of 44 U.S.C. Section 3507.
| ITEM 1. | REPORTS TO STOCKHOLDERS. |
The following is a copy of the report transmitted to shareholders pursuant to Rule 30e-1 under the Investment Company Act of 1940 (17 CFR 270.30e-1).
PACHOLDER HIGH YIELD FUND, INC.
(Unaudited)
Dear Stockholders:
Fourth Quarter and Annual Overview
The Pacholder High Yield Fund, Inc. (the “Fund”) and the high yield market finished a strong 2006 on a positive note. For the year ended December 31, 2006, the Fund reported a 22.38% return based on net asset value (i.e., net of fees and expenses, including preferred stock dividends, and the effect of the Fund’s leveraged capital structure) and the Fund’s portfolio returned 18.68% (gross of leverage, fees and expenses), which compared favorably to the 12.47% average total return of the Morningstar Closed-End High Yield Category and the 11.84% return of the Credit Suisse First Boston (CSFB) High Yield Index, Developed Countries Only (“Index”).
The Fund’s performance over the 12 months was driven by strong results across many industry sectors, the absence of significant problems for most portfolio issuers and an underweight position in BB-rated securities, which provided lower returns than the high-yield market as a whole.
The Fund posted a 7.38% return based on net asset value and the Fund’s portfolio returned 5.70% (gross of leverage, fees and expenses) for the fourth quarter ended December 31, 2006, outperforming the 4.76% average total return of the Morningstar Closed-End High Yield Category and the Index’s 4.45% total return. The fourth quarter carried over the momentum from the third quarter, as the market posted five consecutive months (August through December) of returns above 1%. This momentum was driven by a combination of strong technicals in the market as well as the stable credit environment. High-yield issuers generally reported in line or improving results, with the consensus estimate of 2006 gross domestic product (GDP) growth in the range of 3.0% to 3.5%. However, it is clear that the rate of economic growth slowed during the second half of the year. We believe that certain industries, such as auto suppliers, will likely face further challenging conditions going forward and that more issuers may report negative surprises as economic growth slows. The trailing 12-month default rate for below-investment-grade issuers, as measured by Moody’s Investors Service, dropped from 1.8% at the end of 2005 to 1.7% in December 2006. Continued economic growth, strong corporate profit, low relative interest rates and abundant liquidity in the capital markets combined to keep the default rate low thus far in this economic cycle. Moody’s currently believes that the trailing 12-month default rate will rise modestly to 2.6% by the end of 2007, which is still well below its historical average of 5%.
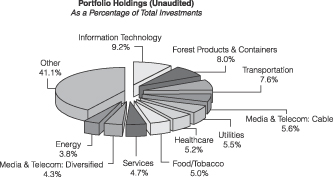
The fourth quarter showed positive performance across all 19 of the Index’s industry sectors. Industry sectors of the high-yield market that performed relatively well were aerospace (airlines), cable and healthcare (acute). Sectors that provided weak relative performance included food and tobacco, information technology and gaming. The Fund is well diversified, with investments in 181 issuers in 19 different industries. As of December 31, 2006, the Fund’s largest industry sector concentration was in information technology, which accounted for 9.17% of the portfolio’s total investments as of December 31, 2006 (see Figure 1 - Portfolio Holdings).
The strong performance of the high-yield market during the fourth quarter of 2006 was evident in the Index’s average price, yield and spread over U.S. Treasuries. The average price of the Index rose 2.50 points from 97.44 to 99.94, the average yield dropped 45 basis points (bps) from 8.38% to 7.93% and the spread over comparable U.S. Treasuries decreased by 55 bps from 373 to 318 bps.
The high-yield market experienced a steady supply of new issues in 2006, reaching a monthly record in November of $25.1 billion in new issuance. A number of these companies sought to lock in long-term debt at relatively low interest rates to refinance existing debt with higher interest rates. Although this refinancing is fundamentally positive for the companies able to lower their cost of debt, such companies continued the trend toward refinancing high coupon bonds held by investors, including the Fund, and replacing them with lower coupon bonds or bank debt.
The principal factors that determine the income available for common shares are the yield on the Fund’s investment portfolio, the cost of the preferred share dividends and the Fund’s expenses. Issuers refinancing at lower yields generally lowers the yield earned by the Fund and other high-yield investors. The dividend rate on the Fund’s preferred stock has risen, as the Federal Reserve raised short-term interest rates at 17 consecutive meetings (stopping in June 2006), which reduced income available for dividends to common shareholders. The Fund has historically maintained a level monthly dividend on its common shares at approximately the level of net income estimated to be available to common shareholders over the near-term time horizon (with the Fund’s investment advisory fee at the 0.90% midpoint of the “fulcrum fee”).
Fourth quarter returns for the broad equity indices were very positive. The Russell 2000, S&P 500, Nasdaq Composite and Dow Indexes returned 8.91%, 6.70%, 7.15% and 7.39%, respectively. Positive momentum in the equity markets is generally positive for high yield because a positive equity market can provide issuers with more financial flexibility and tends to reflect higher values for business assets to support leveraged capital structures.
Portfolio Strategy and Outlook
The Fund continues to pursue the dual investment strategy of reducing credit volatility while selectively investing in total return opportunities.
PACHOLDER HIGH YIELD FUND, INC.
(Unaudited)
Looking ahead, we believe that the underlying fundamentals in the high-yield market should continue to be positive in the near term, although probably not as positive as they have been for the past three years. We believe that near-term expectations for continued, although slowing, economic growth, moderate interest rates, moderate inflation and below-average default rates are likely to produce an environment that is favorable to high-yield credit.
Although we retain a positive near-term outlook, we think that it is prudent to continue to reduce the credit volatility of the portfolio and reduce exposure to securities that we think have a greater potential for negative volatility and do not offer commensurate return potential. Because the strength and duration of the economic expansion is not known, we will continue to adjust the Fund’s composition gradually over time, predicated on bottom-up fundamental analysis of the individual issuers and securities available in the market. As always, we appreciate your interest in the Fund and look forward to your continued support.
Sincerely,

Gary J. Madich, CFA
President
January 22, 2007
Portfolio Holdings Availability
The Fund’s monthly portfolio holdings are available on our website (www.phf-hy.com) no sooner than 30 days after each month end.
The performance quoted is past performance and is not a guarantee of future results. Closed-end funds are subject to certain market risks. Investment returns and principal value of an investment will fluctuate so that an investor’s shares, when sold, may be worth more or less than their original cost. Current performance may be higher or lower than the performance data shown.
JPMorgan Asset Management is the marketing name for the asset management businesses of JPMorgan Chase & Co. Those businesses include, but are not limited to, J.P. Morgan Investment Management Inc., JPMorgan Investment Advisors, Inc., Security Capital Research & Management Incorporated and J.P. Morgan Alternative Asset Management, Inc.
Figure 1
PACHOLDER HIGH YIELD FUND, INC.
Statement of Net Assets Applicable to Common Stockholders
December 31, 2006
| | | | | | | | | |
| Description | | Par (000) | | Value | | Percent
of Net
Assets* | |
| | | | | | | | | |
ASSET-BACKED SECURITIES — 0.3% | | | | | | | | | |
Citigroup Mortgage Loan Trust, Inc., Series 2005-HE3, Class M12, FRN, 7.35%, 9/25/352,9 (Cost $393,894) | | $ | 500 | | $ | 393,750 | | 0.3 | % |
| | | | | | | | | |
CORPORATE DEBT SECURITIES — 142.9% | | | | | | |
AEROSPACE — 5.2% | | | | | | | | | |
American Airlines, Inc., Collateral Trust Notes, 10.18%, 1/2/13 | | | 1,300 | | | 1,313,000 | | 1.0 | |
American Airlines, Inc., Pass Thru Cert, 7.379%, 5/23/16 | | | 616 | | | 597,772 | | 0.5 | |
American Airlines, Inc., Private Placement, Notes, 3.363%, 10/18/099 | | | 910 | | | 883,010 | | 0.7 | |
Bombardier, Inc., Sr Unsec’d Nt,
8%, 11/15/142 | | | 175 | | | 179,375 | | 0.1 | |
Continental Airlines, Inc., Pass Thru Cert, 9.798%, 4/1/21 | | | 1,914 | | | 2,105,889 | | 1.7 | |
Continental Airlines, Inc., Unsubordinated, 8.75%, 12/1/11 | | | 400 | | | 403,000 | | 0.3 | |
DRS Technologies, Inc., Sr Nt, 6.625%, 2/1/16 | | | 500 | | | 503,750 | | 0.4 | |
Northwest Airlines Corp., Co Guar, 10%, 2/1/094,6 | | | 725 | | | 685,125 | | 0.5 | |
| | | | | | | | | |
| | | | | | 6,670,921 | | 5.2 | |
CHEMICALS — 3.1% | | | | | | | | | |
Koppers Inc., Sec’d Nt, 9.875%, 10/15/136 | | | 119 | | | 129,412 | | 0.1 | |
Lyondell Chemical Co., Sr Nt, 8%, 9/15/1410 | | | 1,000 | | | 1,037,500 | | 0.8 | |
Mosaic Co., (The) Sr Nt, 7.375%, 12/1/142 | | | 125 | | | 128,281 | | 0.1 | |
Mosaic Co., (The) Sr Nt, 7.625%, 12/1/162 | | | 125 | | | 129,531 | | 0.1 | |
OM Group, Inc., Sr Sub Nt, 9.25%, 12/15/1110 | | | 1,000 | | | 1,046,250 | | 0.8 | |
Tronox Worldwide LLC/Tronox Finance Corp, Sr Nt, 9.5%, 12/1/12 | | | 1,500 | | | 1,578,750 | | 1.2 | |
| | | | | | | | | |
| | | | | | 4,049,724 | | 3.1 | |
CONSUMER PRODUCTS — 2.2% | | | | | | | | | |
Broder Bros. Co., Sr Nt, 11.25%, 10/15/1010 | | | 1,835 | | | 1,779,950 | | 1.4 | |
Hanesbrands, Inc., FRN, Sr Nt, 8.735%, 12/15/142,6 | | | 500 | | | 508,750 | | 0.4 | |
K2, Inc., Sr Nt, 7.375%, 7/1/14 | | | 500 | | | 505,000 | | 0.4 | |
| | | | | | | | | |
| Description | | Par (000) | | Value | | Percent
of Net
Assets* | |
CONSUMER PRODUCTS (continued) | | | | | | | | | |
Westpoint Stevens, Inc., Sr Nt, 7.875%, 6/15/051,4,9 | | $ | 1,000 | | $ | 100 | | 0.0 | % |
| | | | | | | | | |
| | | | | | 2,793,800 | | 2.2 | |
ENERGY — 6.8% | | | | | | | | | |
Bristow Group, Inc., Co Guar, 6.125%, 6/15/13 | | | 250 | | | 236,250 | | 0.2 | |
Chart Industries, Inc./Pre First Reserve Fund X LP Merger, Sr Sub Nt, 9.125%, 10/15/152 | | | 1,400 | | | 1,477,000 | | 1.1 | |
Complete Production Services, Inc., 8%, 12/15/162 | | | 500 | | | 512,500 | | 0.4 | |
El Paso Performance-Linked Trust, Sr Nt, 7.75%, 7/15/112 | | | 500 | | | 528,750 | | 0.4 | |
El Paso Production Holding Co., Co Guar, 7.75%, 6/1/13 | | | 750 | | | 784,687 | | 0.6 | |
Hanover Compressor Co., Sr Nt, 7.5%, 4/15/13 | | | 500 | | | 505,000 | | 0.4 | |
OPTI Canada, Inc., Co Guar, 8.25%, 12/15/142 | | | 1,180 | | | 1,212,450 | | 1.0 | |
Peabody Energy Corp., Co Guar, 7.375%, 11/1/16 | | | 500 | | | 532,500 | | 0.4 | |
PHI, Inc., Co Guar, 7.125%, 4/15/13 | | | 450 | | | 435,375 | | 0.4 | |
Range Resources Corp., Sr Sub Nt, 7.5%, 5/15/16 | | | 350 | | | 358,750 | | 0.3 | |
Secunda International Ltd. (Canada), FRN, Sec’d, 13.36%, 9/1/1210 | | | 1,500 | | | 1,550,625 | | 1.2 | |
VeraSun Energy Corp., Sr Unsec’d Nt, 9.875%, 12/15/12 | | | 250 | | | 265,000 | | 0.2 | |
Williams Partners LP/Williams Partners Finance Corp., 7.25%, 2/1/172 | | | 250 | | | 255,000 | | 0.2 | |
| | | | | | | | | |
| | | | | | 8,653,887 | | 6.8 | |
FINANCE — 3.6% | | | | | | | | | |
Ace Cash Express, Inc., Sr Nt, 10.25%, 10/1/142 | | | 1,000 | | | 1,012,500 | | 0.8 | |
Crum & Forster Holdings Corp., Sr Nt, 10.375%, 6/15/1310 | | | 1,510 | | | 1,634,575 | | 1.2 | |
Swett & Crawford, 1st Lien Bank Debt, 7.874%, 11/16/11 | | | 497 | | | 499,987 | | 0.4 | |
Swett & Crawford, 2nd Lien Bank Debt, 12.124%, 11/16/12 | | | 500 | | | 505,000 | | 0.4 | |
Thornburg Mortgage Inc., Sr Nt, 8%, 5/15/1310 | | | 1,000 | | | 990,000 | | 0.8 | |
| | | | | | | | | |
| | | | | | 4,642,062 | | 3.6 | |
3
PACHOLDER HIGH YIELD FUND, INC.
Statement of Net Assets Applicable to Common Stockholders (continued)
December 31, 2006
| | | | | | | | | |
| Description | | Par (000) | | Value | | Percent
of Net
Assets* | |
FOOD & DRUG — 0.6% | | | | | | | | | |
Southern States Coop, Inc., Sr Nt, 10.5%, 11/01/102 | | $ | 750 | | $ | 791,250 | | 0.6 | % |
| | | | | | | | | |
FOOD & TOBACCO — 8.5% | | | | | | | | | |
Alliance One International, Inc., Nt, 11%, 5/15/126 | | | 2,400 | | | 2,556,000 | | 2.0 | |
Alliance One International, Inc., Nt, 12.75%, 11/15/12 | | | 150 | | | 160,125 | | 0.1 | |
Chiquita Brands International, Inc., Sr Nt, 8.875%, 12/1/156 | | | 2,249 | | | 2,153,418 | | 1.7 | |
Constellation Brands, Inc., Sr Nt, 7.25%, 9/1/16 | | | 250 | | | 256,875 | | 0.2 | |
Cosan S.A Industria e Comerico (Brazil), Sr Nt, 9%, 11/1/092 | | | 300 | | | 318,750 | | 0.3 | |
Dean Foods Co., Sr Nt, 7%, 6/1/16 | | | 125 | | | 126,250 | | 0.1 | |
EI Pollo Loco, Inc., Sr Nt, 11.75%, 11/15/13 | | | 750 | | | 813,750 | | 0.6 | |
Eurofresh, Inc., Nt, 11.5%, 1/15/132 | | | 2,000 | | | 1,855,000 | | 1.4 | |
Golden State Foods Corp., Sr Sub Nt, 9.24%, 1/10/122,8,9 | | | 1,250 | | | 1,271,875 | | 1.0 | |
National Beef Packaging Co. LLC/NB Finance Corp., Sr Nt, 10.5%, 8/1/1110 | | | 756 | | | 797,580 | | 0.6 | |
Reynolds American, Inc., Nt, 7.625%, 6/1/16 | | | 500 | | | 529,767 | | 0.4 | |
Tom’s Foods, Inc., Sr Nt, 10.5%, 11/1/041,4,9 | | | 907 | | | 79,344 | | 0.1 | |
| | | | | | | | | |
| | | | | | 10,918,734 | | 8.5 | |
FOREST PRODUCTS & CONTAINERS — 13.6% | | | | | | |
Abitibi-Consolidated Co. of Canada,
Sr Nt, 8.375%, 4/1/156 | | | 1,500 | | | 1,297,500 | | 1.0 | |
Ainsworth Lumber Co. Ltd., Sr Nt, 6.75%, 3/15/14 | | | 285 | | | 212,325 | | 0.2 | |
Appleton Papers, Inc., Sr Sub Nt, 9.75%, 6/15/1410 | | | 1,500 | | | 1,545,000 | | 1.2 | |
Buckeye Technologies, Inc., Sr Sub Nt, 9.25%, 9/15/0810 | | | 1,000 | | | 1,000,000 | | 0.8 | |
Cascades, Inc., Sr Nt, 7.25%, 2/15/1310 | | | 1,500 | | | 1,496,250 | | 1.1 | |
Catalyst Paper Corp. (Canada), Sr Nt, 8.625%, 6/15/11 | | | 1,000 | | | 1,012,500 | | 0.8 | |
Constar International, Inc., FRN, Co Guar, 8.749%, 2/15/12 | | | 750 | | | 761,250 | | 0.6 | |
Constar International, Inc., Sr Sub Nt, 11%, 12/1/126 | | | 2,430 | | | 2,247,750 | | 1.7 | |
| | | | | | | | | |
| Description | | Par (000) | | Value | | Percent
of Net
Assets* | |
FOREST PRODUCTS & CONTAINERS (continued) | | | |
Domtar, Inc., Nt, 7.875%, 10/15/1110 | | $ | 725 | | $ | 752,187 | | 0.6 | % |
Georgia-Pacific Corp., Co Guar, 7%, 1/15/152 | | | 125 | | | 124,687 | | 0.1 | |
Georgia-Pacific Corp., Co Guar, 7.125%, 1/15/172 | | | 125 | | | 124,688 | | 0.1 | |
Graphic Packaging International Corp., Sr Sub Nt, 8.5%, 8/15/116 | | | 500 | | | 517,500 | | 0.4 | |
Graphic Packaging International Corp., Sr Sub Nt, 9.5%, 8/15/136 | | | 572 | | | 603,460 | | 0.5 | |
Plastipak Holdings, Inc., Sr Nt, 8.5%, 12/15/152 ,6 | | | 300 | | | 312,000 | | 0.2 | |
Portola Packaging, Inc., Sr Nt, 8.25%, 2/1/1210 | | | 2,175 | | | 2,006,437 | | 1.6 | |
Smurfit-Stone Container Enterprises, Inc., Sr Nt, 8.375%, 7/1/12 | | | 400 | | | 392,000 | | 0.3 | |
Smurfit-Stone Container Enterprises, Inc., Sr Nt, 9.75%, 2/1/1110 | | | 1,504 | | | 1,551,000 | | 1.2 | |
Tembec Industries, Inc. (Canada), Sr Nt, 7.75%, 3/15/126 | | | 2,180 | | | 1,275,300 | | 1.0 | |
Tembec Industries, Inc. (Canada), Sr Unsec’d Nt, 8.625%, 6/30/096 | | | 320 | | | 219,200 | | 0.2 | |
| | | | | | | | | |
| | | | | | 17,451,034 | | 13.6 | |
GAMING/LEISURE — 6.4% | | | | | | | | | |
HRP Myrtle Beach Operations LLC / HRP Myrtle Beach Capital Corp.,
FRN, Sec’d Nt, 10.12%, 4/1/122 | | | 1,000 | | | 1,000,000 | | 0.8 | |
Inn of the Mountain Gods Resort & Casino, Sr Nt, 12%, 11/15/1010 | | | 950 | | | 1,026,000 | | 0.8 | |
London Arena & Waterfront Finance LLC, Bank Debt, 8.89%, 3/9/12 | | | 498 | | | 499,988 | | 0.4 | |
MGM Mirage, Inc., Co Guar, 7.625%, 1/15/17 | | | 500 | | | 501,250 | | 0.4 | |
Pokagon Gaming Authority, Sr Nt, 10.375%, 6/15/142 | | | 250 | | | 273,750 | | 0.2 | |
Six Flags, Inc., Sr Nt, 8.875%, 2/1/10 | | | 250 | | | 241,875 | | 0.2 | |
Six Flags, Inc., Sr Nt, 9.625%, 6/1/1410 | | | 1,250 | | | 1,159,375 | | 0.9 | |
Six Flags, Inc., Sr Nt, 9.75%, 4/15/13 | | | 500 | | | 469,375 | | 0.4 | |
Trump Entertainment Resorts, Inc., Sec’d Nt, 8.5%, 6/1/156 | | | 1,750 | | | 1,741,250 | | 1.3 | |
Venetian Macau, Term Loan B, 8.12%, 5/25/13 | | | 1,333 | | | 1,346,666 | | 1.0 | |
| | | | | | | | | |
| | | | | | 8,259,529 | | 6.4 | |
4
PACHOLDER HIGH YIELD FUND, INC.
Statement of Net Assets Applicable to Common Stockholders (continued)
December 31, 2006
| | | | | | | | | |
| Description | | Par (000) | | Value | | Percent
of Net
Assets* | |
HEALTHCARE — 8.9% | | | | | | | | | |
Fresenius Medical Care Capital Trust IV, Co Guar, 7.875%, 6/15/1110 | | $ | 500 | | $ | 523,750 | | 0.4 | % |
HCA, Inc., Sec’d Nt, 9.125%, 11/15/142 | | | 475 | | | 507,656 | | 0.4 | |
HCA, Inc., Sec’d Nt, 9.25%, 11/15/162 | | | 800 | | | 857,000 | | 0.7 | |
HCA, Inc., Term Loan B, 7.614%, 11/14/13 | | | 500 | | | 506,250 | | 0.4 | |
Medical Services Co., FRN, Co Guar, 12.86%, 10/15/1110 | | | 2,150 | | | 2,037,125 | | 1.6 | |
Psychiatric Solutions, Inc., Sr Sub Nt, 10.625%, 6/15/13 | | | 333 | | | 366,300 | | 0.3 | |
TeamHealth, Inc., Sr Sub Nt, 11.25%, 12/1/1310 | | | 2,184 | | | 2,260,440 | | 1.7 | |
Tenet Healthcare Corp., Sr Nt, 9.25%, 2/1/156 | | | 250 | | | 250,000 | | 0.2 | |
Tenet Healthcare Corp., Sr Nt, 9.875%, 7/1/1410 | | | 1,750 | | | 1,780,625 | | 1.4 | |
US Oncology, Inc., Co Guar, 10.75%, 8/15/14 | | | 575 | | | 635,375 | | 0.5 | |
Vanguard Health Holding Co. II LLC., Sr Sub Nt, 9%, 10/1/1410 | | | 1,700 | | | 1,721,250 | | 1.3 | |
| | | | | | | | | |
| | | | | | 11,445,771 | | 8.9 | |
HOUSING — 2.7% | | | | | | | | | |
Beazer Homes USA, Inc., Sr Nt, 8.125%, 6/15/166 | | | 500 | | | 530,000 | | 0.4 | |
Fedders North America, Inc., Co Guar, 9.875%, 3/1/146 | | | 1,600 | | | 1,112,000 | | 0.9 | |
Interface, Inc., Sr Nt, 10.375%, 2/1/10 | | | 500 | | | 552,500 | | 0.4 | |
Interface, Inc., Sr Sub Nt, 9.5%, 2/1/14 | | | 535 | | | 561,750 | | 0.5 | |
Interline Brands, Inc., Sr Sub Nt, 8.125%, 6/15/14 | | | 350 | | | 359,625 | | 0.3 | |
K Hovnanian Enterprises, Inc., Sr Nt, 8.625%, 1/15/176 | | | 275 | | | 292,875 | | 0.2 | |
| | | | | | | | | |
| | | | | | 3,408,750 | | 2.7 | |
INFORMATION TECHNOLOGY — 15.6% | | | | | | |
Advanced Micro Devices, Inc., Sr Nt, 7.75%, 11/1/12 | | | 410 | | | 425,375 | | 0.3 | |
Amkor Technology, Inc., Sr Nt, 9.25%, 6/1/16 | | | 1,080 | | | 1,058,400 | | 0.8 | |
Compucom Systems, Inc., Sr Nt,
12%, 11/1/142 | | | 1,000 | | | 1,030,000 | | 0.8 | |
Dealer Computer Services, Term Loan 3rd Lien, 12.85%, 4/25/14 | | | 1,000 | | | 1,007,500 | | 0.8 | |
| | | | | | | | | |
| Description | | Par (000) | | Value | | Percent
of Net
Assets* | |
INFORMATION TECHNOLOGY (continued) | | | | | | |
Freescale Semiconductor, Inc., FRN, Sr Nt, 9.244%, 12/15/142,6 | | $ | 250 | | $ | 247,813 | | 0.2 | % |
Freescale Semiconductor, Inc., Sr Nt, 8.875%, 12/15/142,6 | | | 800 | | | 797,000 | | 0.6 | |
Freescale Semiconductor, Inc., Sr Sub Nt, 10.125%, 12/15/162 | | | 200 | | | 200,250 | | 0.2 | |
IKON Office Solutions, Inc., Sr Nt, 7.75%, 9/15/15 | | | 550 | | | 576,125 | | 0.4 | |
Intcomex, Inc., Sec’d Nt, 11.75%, 1/15/11 | | | 900 | | | 891,000 | | 0.7 | |
MagnaChip Semiconductor SA/MagnaChip Semiconductor Finance Co. (Luxembourg), FRN, Sec’d, 8.61%, 12/15/11 | | | 1,000 | | | 860,000 | | 0.7 | |
MagnaChip Semiconductor SA/MagnaChip Semiconductor Finance Co. (Luxembourg), Sec’d Nt, 6.875%, 12/15/116 | | | 1,000 | | | 845,000 | | 0.7 | |
MagnaChip Semiconductor SA/MagnaChip Semiconductor Finance Co. (Luxembourg), Sr Sub Nt, 8%, 12/15/146 | | | 1,740 | | | 1,165,800 | | 0.9 | |
NXP BV/NXP Funding LLC, FRN, Sec’d Nt. 8.11%, 10/15/132 | | | 400 | | | 406,000 | | 0.3 | |
NXP BV/NXP Funding LLC, Sec’d Nt, 7.875%, 10/15/142 | | | 200 | | | 206,750 | | 0.2 | |
NXP BV/NXP Funding LLC, Sr Nt, 9.5%, 10/15/152 | | | 1,725 | | | 1,768,125 | | 1.4 | |
Sanmina-SCI Corp., Sr Sub Nt, 8.125%, 3/1/16 | | | 360 | | | 348,300 | | 0.3 | |
Sirius Computer Solutions, 2nd Lien Bank Loan, 11.36%, 5/30/13 | | | 1,000 | | | 1,005,000 | | 0.8 | |
Smart Modular Technologies, FRN, Sr Nt, 10.86%, 4/1/12 | | | 423 | | | 442,035 | | 0.3 | |
Spansion LLC, Term Loan B, 8.375%, 10/31/12 | | | 500 | | | 501,875 | | 0.4 | |
Spansion, Inc., Sr Nt, 11.25%, 1/15/162,6 | | | 1,000 | | | 1,050,000 | | 0.8 | |
Stratus Technologies, Inc., 2nd Lien Term Loan, 14.35%, 3/28/12 | | | 1,000 | | | 960,000 | | 0.7 | |
Sungard Data Systems, Inc., Sr Unsec’d Nt, 9.125%, 8/15/13 | | | 500 | | | 525,000 | | 0.4 | |
TTM Technologies, Inc., Term Loan, 7.62%, 10/31/12 | | | 500 | | | 501,875 | | 0.4 | |
5
PACHOLDER HIGH YIELD FUND, INC.
Statement of Net Assets Applicable to Common Stockholders (continued)
December 31, 2006
| | | | | | | | | |
| Description | | Par (000) | | Value | | Percent
of Net
Assets* | |
INFORMATION TECHNOLOGY (continued) | | | | | | |
UGS Capital Corp. II, FRN, PIK, Sr Nt, 10.348%, 6/1/112 | | $ | 1,050 | | $ | 1,076,722 | | 0.8 | % |
Unisys Corp., Sr Nt, 8%, 10/15/12 | | | 1,750 | | | 1,730,313 | | 1.3 | |
Unisys Corp., Sr Nt, 8.5%, 10/15/156 | | | 500 | | | 490,000 | | 0.4 | |
| | | | | | | | | |
| | | | | | 20,116,258 | | 15.6 | |
MANUFACTURING — 5.2% | | | | | | | | | |
Case New Holland, Inc., Sr Nt, 9.25%, 8/1/11 | | | 500 | | | 529,375 | | 0.4 | |
Esco Corp., Sr Nt, 8.625%, 12/15/132,6 | | | 200 | | | 205,500 | | 0.2 | |
Milacron Escrow Corp., Sec’d Nt, 11.5%, 5/15/11 | | | 2,000 | | | 1,900,000 | | 1.5 | |
Polypore, Inc., Sr Sub Nt, 8.75%, 5/15/12 | | | 2,035 | | | 2,024,825 | | 1.6 | |
Trimas Corp., Co Guar, 9.875%, 6/15/1210 | | | 2,025 | | | 1,959,188 | | 1.5 | |
| | | | | | | | | |
| | | | | | 6,618,888 | | 5.2 | |
MEDIA & TELECOM: BROADCASTING — 3.1% | | | |
Barrington Broadcasting Group LLC/Barrington Broadcasting Capital Corp., Sr Sub Nt, 10.5%, 8/15/142 | | | 700 | | | 710,500 | | 0.5 | |
Fisher Communications, Inc., Sr Nt, 8.625%, 9/15/14 | | | 500 | | | 530,000 | | 0.4 | |
LBI Media, Inc., Sr Disc Nt, 11%, 10/15/137 | | | 625 | | | 538,281 | | 0.4 | |
LIN Television Corp., Sr Sub Nt, 6.5%, 5/15/136 | | | 500 | | | 476,250 | | 0.4 | |
Nexstar Finance Holdings LLC/Nexstar Finance Holdings, Inc., Sr Disc Nt, 11.67%, 4/1/137 | | | 750 | | | 672,188 | | 0.5 | |
Nexstar Finance, Inc., Sr Sub Nt, 7%, 1/15/14 | | | 725 | | | 681,500 | | 0.5 | |
Sinclair Broadcast Group, Inc., Co Guar, 8%, 3/15/12 | | | 500 | | | 516,250 | | 0.4 | |
| | | | | | | | | |
| | | | | | 4,124,969 | | 3.1 | |
MEDIA & TELECOM: CABLE — 9.6% | | | | | | | | | |
Adelphia Communications Corp., Sr Nt, 6%, 2/15/061,4 | | | 125 | | | 75 | | 0.0 | |
Adelphia Communications Corp., Sr Nt, 8.125%, 7/15/031,4 | | | 750 | | | 688,125 | | 0.5 | |
Adelphia Communications Corp., Sr Nt, 9.375%, 11/15/091,4 | | | 1,000 | | | 947,500 | | 0.8 | |
Block Communications, Inc., Sr Nt, 8.25%, 12/15/152 | | | 300 | | | 299,250 | | 0.2 | |
| | | | | | | | | |
| Description | | Par (000) | | Value | | Percent
of Net
Assets* | |
MEDIA & TELECOM: CABLE (continued) | | | | | | |
CCH I Holdings LLC, Co Guar, 11.125%, 1/15/146 | | $ | 850 | | $ | 748,000 | | 0.6 | % |
CCH I Holdings LLC/CCH I Holdings Capital Corp., Sec’d Nt, 11%, 10/1/15 | | | 2,305 | | | 2,365,506 | | 1.9 | |
Charter Communications Holdings II LLC/Charter Communications Holdings II Cap Corp., Sr Nt, 10.25%, 9/15/106 | | | 250 | | | 261,563 | | 0.2 | |
DirecTV Holdings LLC/DirecTV Financing Co., Sr Nt, 8.375%, 3/15/13 | | | 750 | | | 780,000 | | 0.6 | |
Intelsat Bermuda Ltd., Sr Nt, 9.25%, 6/15/162 | | | 600 | | | 645,000 | | 0.5 | |
Intelsat Bermuda Ltd., Sr Nt, 11.25%, 6/15/162 | | | 500 | | | 548,750 | | 0.4 | |
Intelsat Corp., Sr Nt, 9%, 8/15/14 | | | 749 | | | 791,131 | | 0.6 | |
Intelsat Subsidiary Holding Co. Ltd., Sr Nt, 8.25%, 1/15/13 | | | 500 | | | 507,500 | | 0.4 | |
Mediacom LLC/Mediacom Capital Corp. Sr Nt, 9.5%, 1/15/1310 | | | 1,384 | | | 1,425,520 | | 1.1 | |
NTL Cable plc, (United Kingdom), Sr Nt, 9.125%, 8/15/166 | | | 1,000 | | | 1,056,250 | | 0.8 | |
Quebecor Media Inc., (Canada), Sr Nt, 7.75%, 3/15/16 | | | 750 | | | 765,938 | | 0.6 | |
Videotron Ltee, Sr Unsec’d Nt, 6.375%, 12/15/1510 | | | 500 | | | 488,750 | | 0.4 | |
| | | | | | | | | |
| | | | | | 12,318,858 | | 9.6 | |
MEDIA & TELECOM: DIVERSIFIED — 6.9% | | | | | | |
Cenveo Corp., Sr Sub Nt, 7.875%, 12/1/13 | | | 650 | | | 624,000 | | 0.5 | |
DX III Holdings Corp., 1st Lien Term Loan, 8.364%, 1/27/11 | | | 461 | | | 461,612 | | 0.4 | |
Idearc, Inc., Sr Nt, 8%, 11/15/162 | | | 500 | | | 507,500 | | 0.4 | |
IMAX Corp., Sr Nt, 9.625%, 12/1/106 | | | 1,984 | | | 1,693,840 | | 1.3 | |
Lamar Media Corp., Sr Sub Nt, 6.625%, 8/15/18 | | | 750 | | | 743,438 | | 0.6 | |
Lamar Media Corp., Sr Sub Nt, 7.25%, 1/1/13 | | | 500 | | | 509,375 | | 0.4 | |
Phoenix Color Corp., Sr Sub Nt, 11%, 2/1/09 | | | 1,930 | | | 1,893,813 | | 1.5 | |
Primedia, Inc., Sr Nt, 8.875%, 5/15/11 | | | 375 | | | 382,500 | | 0.3 | |
Quebecor World Capital Corp. (Canada), Sr Nt, 6.125%, 11/15/13 | | | 850 | | | 733,125 | | 0.5 | |
Quebecor World Capital Corp. (Canada), Sr Nt, 8.75%, 3/15/162 | | | 250 | | | 239,375 | | 0.2 | |
6
PACHOLDER HIGH YIELD FUND, INC.
Statement of Net Assets Applicable to Common Stockholders (continued)
December 31, 2006
| | | | | | | | | |
| Description | | Par (000) | | Value | | Percent
of Net
Assets* | |
MEDIA & TELECOM: DIVERSIFIED (continued) | | | | | | |
Quebecor World Inc., (Canada), Sr Nt, 9.75%, 1/15/151,2 | | $ | 500 | | $ | 503,750 | | 0.4 | % |
RH Donnelley Corp., Sr Disc Nt, 6.875%, 1/15/13 | | | 250 | | | 239,688 | | 0.2 | |
RH Donnelley Corp., Sr Nt, 8.875%, 1/15/16 | | | 250 | | | 262,500 | | 0.2 | |
| | | | | | | | | |
| | | | | | 8,794,516 | | 6.9 | |
MEDIA & TELECOM: FIXED COMMUNICATION — 4.1% | | | |
Level 3 Financing, Inc., Co Guar, 9.25%, 11/1/142 | | | 1,000 | | | 1,020,000 | | 0.8 | |
Mastec, Inc., Sr Sub Nt, 7.75%, 2/1/08 | | | 373 | | | 372,067 | | 0.3 | |
McLeod USA, Inc., Sec’d Nt, 10.5%, 10/1/112 | | | 500 | | | 506,250 | | 0.4 | |
Qwest Communications, Sr Nt, 7.625%, 6/15/156 | | | 1,950 | | | 2,086,500 | | 1.6 | |
Time Warner Telecom Holdings, Inc., Sr Nt, 9.25%, 2/15/1410 | | | 1,250 | | | 1,335,938 | | 1.0 | |
| | | | | | | | | |
| | | | | | 5,320,755 | | 4.1 | |
MEDIA & TELECOM: WIRELESS COMMUNICATION — 2.6% | | | |
Cricket Communications, Inc., Sr Nt, 9.375%, 11/1/142 | | | 300 | | | 316,500 | | 0.2 | |
Dobson Cellular Systems, Inc., Sec’d, 9.875%, 11/1/1210 | | | 550 | | | 599,500 | | 0.5 | |
Horizon PCS, Inc., Sr Nt, 11.375%, 7/15/12 | | | 350 | | | 390,250 | | 0.3 | |
MetroPCS Wireless, Inc., Sr Nt, 9.25%, 11/1/142 | | | 1,750 | | | 1,828,750 | | 1.4 | |
Rogers Wireless, Inc., Sec’d Nt, 6.375%, 3/1/14 | | | 250 | | | 253,125 | | 0.2 | |
| | | | | | | | | |
| | | | | | 3,388,125 | | 2.6 | |
METALS & MINERALS — 1.4% | | | | | | | | | |
AK Steel Corp., Co Guar, 7.75%, 6/15/12 | | | 300 | | | 302,250 | | 0.2 | |
AK Steel Corp., Co Guar, 7.875%, 2/15/096 | | | 1,005 | | | 1,005,000 | | 0.8 | |
Aleris International, Inc., Sr Nt, 9%, 12/15/142 | | | 500 | | | 503,750 | | 0.4 | |
| | | | | | | | | |
| | | | | | 1,811,000 | | 1.4 | |
RETAIL — 3.2% | | | | | | | | | |
Brown Shoe Company, Inc., Sr Unsec’d Nt, 8.75%, 5/1/1210 | | | 750 | | | 791,250 | | 0.6 | |
General Nutrition Centers, Inc., Co Guar, 8.625%, 1/15/1110 | | | 250 | | | 263,125 | | 0.2 | |
| | | | | | | | | |
| Description | | Par (000) | | Value | | Percent
of Net
Assets* | |
RETAIL (continued) | | | | | | |
General Nutrition Centers, Inc., Sr Sub Nt, 8.5%, 12/1/1010 | | $ | 875 | | $ | 899,063 | | 0.7 | % |
Gregg Appliances, Inc., Co Guar, 9%, 2/1/13 | | | 399 | | | 381,045 | | 0.3 | |
GSC Holdings Corp., FRN, Co Guar, 9.235%, 10/1/11 | | | 550 | | | 570,625 | | 0.5 | |
Linens ‘N Things, Inc., FRN, Sec’d Nt, 10.985%, 1/15/146 | | | 1,250 | | | 1,212,500 | | 0.9 | |
| | | | | | | | | |
| | | | | | 4,117,608 | | 3.2 | |
SERVICES — 6.2% | | | | | | | | | |
Knowledge Learning Corp., Inc., Sr Sub Nt, 7.75%, 2/1/152 | | | 2,000 | | | 1,915,000 | | 1.5 | |
Mac-Gray Corp., Sr Nt, 7.625%, 8/15/15 | | | 650 | | | 659,750 | | 0.5 | |
NES Rentals, Term Loan B, Bank Debt, 12.125%, 7/20/13 | | | 1,500 | | | 1,511,250 | | 1.1 | |
Rental Services Corp., 9.5%, 12/1/142 | | | 200 | | | 206,500 | | 0.1 | |
SAC Holding Corp., Sr Nt, 8.5%, 3/15/1410 | | | 1,323 | | | 1,296,393 | | 1.0 | |
Stewart Enterprises, Inc., Sr Nt, 6.25%, 2/15/1310 | | | 1,834 | | | 1,765,225 | | 1.4 | |
United Rentals North America, Inc., Co Guar, 6.5%, 2/15/12 | | | 750 | | | 740,625 | | 0.6 | |
| | | | | | | | | |
| | | | | | 8,094,743 | | 6.2 | |
TRANSPORTATION — 14.0% | | | | | | | | | |
American Commercial Lines/ACL Finance Corp., Sr Nt, 9.5%, 2/15/15 | | | 475 | | | 527,844 | | 0.4 | |
Avis Budget Car Rental LLC/Avis Budget Finance, Inc., Sr Nt, 7.625%, 5/15/142 | | | 100 | | | 97,500 | | 0.1 | |
Eagle-Picher Industries, Inc., 1st Lien, 9.869%, 6/20/11 | | | 748 | | | 748,125 | | 0.6 | |
Eagle-Picher Industries, Inc., 2nd Lien, 13.87%, 12/30/11 | | | 750 | | | 772,500 | | 0.6 | |
Ford Motor Co., Nt, 7.45%, 7/15/316 | | | 1,875 | | | 1,471,875 | | 1.1 | |
Ford Motor Credit Co., FRN, Nt, 8.11%, 1/13/12 | | | 300 | | | 297,276 | | 0.2 | |
Ford Motor Credit Co., Nt, 8%, 12/15/16 | | | 450 | | | 438,187 | | 0.3 | |
Ford Motor Credit Co., Nt, 8.625%, 11/1/1010 | | | 1,230 | | | 1,266,108 | | 1.0 | |
GMAC LLC, Nt, 8%, 11/1/316 | | | 250 | | | 287,017 | | 0.2 | |
General Motors Corp., Debentures, 8.1%, 6/15/2410 | | | 2,450 | | | 2,125,375 | | 1.7 | |
General Motors Corp., Debentures, 8.25%, 7/15/236 | | | 1,525 | | | 1,418,250 | | 1.1 | |
7
PACHOLDER HIGH YIELD FUND, INC.
Statement of Net Assets Applicable to Common Stockholders (continued)
December 31, 2006
| | | | | | | | | | |
| Description | | Par (000) | | | Value | | Percent
of Net
Assets* | |
TRANSPORTATION (continued) | | | | | | | | | | |
Goodyear Tire & Rubber Co. (The), Sr Nt, 8.625%, 12/1/112 | | $ | 150 | | | $ | 154,875 | | 0.1 | % |
IdleAire Technologies Corp., Sr Disc Nt, 13.41%, 12/15/122,7 | | | 1,415 | a | | | 1,061,250 | | 0.8 | |
J.B. Poindexter & Co, Inc., Co Guar, 8.75%, 3/15/1410 | | | 1,750 | | | | 1,487,500 | | 1.2 | |
Lear Corp., Term Loan, Bank Debt, 7.864%, 4/25/12 | | | 700 | | | | 700,000 | | 0.5 | |
Lear Corp., Term Loan, Bank Debt, 7.87%, 4/25/12 | | | 300 | | | | 300,000 | | 0.2 | |
Lear Corp., Sr Nt,
8.5%, 12/1/132,6 | | | 350 | | | | 339,500 | | 0.3 | |
Lear Corp., Sr Nt,
8.75%, 12/1/162 | | | 900 | | | | 869,625 | | 0.7 | |
Pep Boys-Manny Moe & Jack, Sr Sub Nt, 7.50%, 12/15/14 | | | 500 | | | | 456,875 | | 0.4 | |
Quality Distribution LLC/QD Capital Corp., Co Guar, 9%, 11/15/10 | | | 750 | | | | 731,250 | | 0.6 | |
Quality Distribution LLC/QD Capital Corp., FRN, Co Guar, 9.86%, 1/15/1210 | | | 850 | | | | 862,750 | | 0.7 | |
TFM SA DE CV (Mexico), Sr Nt, 12.5%, 6/15/12 | | | 1,100 | | | | 1,188,000 | | 0.9 | |
Ultrapetrol (Bahamas) Ltd., 1st Mtg, 9%, 11/24/14 | | | 450 | | | | 437,062 | | 0.3 | |
| | | | | | | | | | |
| | | | | | | 18,038,744 | | 14.0 | |
UTILITIES — 9.4% | | | | | | | |
Calpine Canada Energy Finance Ulc, Sr Nt, 8.5%, 5/1/081,4,6 | | | 1,265 | | | | 1,119,525 | | 0.9 | |
Calpine Corp., Sec’d Nt, 9.875%, 12/1/111,2,4 | | | 250 | | | | 271,875 | | 0.2 | |
Calpine Corp., Sr Nt, 10.5%, 5/15/061,4 | | | 1,000 | | | | 955,000 | | 0.7 | |
Calpine Generating Co. LLC, FRN, Sec’d, 14.37%, 4/1/111,4 | | | 3,100 | | | | 3,332,500 | | 2.6 | |
Dynegy Holdings, Inc., Sr Unsec’d Nt, 7.125%, 5/15/18 | | | 1,000 | | | | 975,000 | | 0.8 | |
Midwest Generation LLC, Sec’d Nt, 8.75%, 5/1/34 | | | 500 | | | | 542,500 | | 0.4 | |
Mirant Americas Generation LLC, Sr Nt, 8.3%, 5/1/1110 | | | 1,250 | | | | 1,281,250 | | 1.0 | |
Mirant Americas Generation LLC, Sr Nt, 8.5%, 10/1/21 | | | 500 | | | | 506,250 | | 0.4 | |
Northwest Pipeline Corp., Sr Nt, 7%, 6/15/16 | | | 500 | | | | 522,500 | | 0.4 | |
| | | | | | | | | |
| Description | | Shares/Par
(000) | | Value | | Percent
of Net
Assets* | |
UTILITIES (continued) | | | | | | |
NRG Energy, Inc., Term Loan B, 7.36%, 2/2/13 | | $ | 498 | | $ | 500,609 | | 0.4 | % |
Reliant Energy, Inc., Sec’d Nt, 6.75%, 12/15/1410 | | | 1,000 | | | 977,500 | | 0.8 | |
Reliant Energy, Inc., Sec’d Nt, 9.5%, 7/15/1310 | | | 1,000 | | | 1,072,500 | | 0.8 | |
Southern Energy, Inc., Escrow, Sr Nt, 7.9%, 7/15/09 | | | 750 | | | 13,125 | | 0.0 | |
| | | | | | | | | |
| | | | | | 12,070,134 | | 9.4 | |
Total Corporate Debt Securities | | | | | | | | | |
(Cost $180,069,796) | | | | | | 183,900,060 | | 142.9 | |
| | | | | | | | | |
Total Fixed Income Investments | | | | | | | | | |
(Cost $180,463,690) | | | | | | 184,293,810 | | 143.2 | |
| | | | | | | | | |
PREFERRED STOCKS — 0.3% | | | | | | |
Glasstech, Inc., Series C, Pfd3,9 | | | — 11 | | | — | | 0.0 | |
Spanish Broadcasting System, Pfd, PIK, 10.75%, 10/15/13 | | | 3 | | | 326,340 | | 0.3 | |
| | | | | | | | | |
Total Preferred Stocks | | | | | | | | | |
(Cost $296,000) | | | | | | 326,340 | | 0.3 | |
| | | | | | | | | |
COMMON STOCKS — 5.4% | | | | | | |
Abovenet, Inc.1 | | | 2 | | | 102,120 | | 0.1 | |
Avado Brands, Inc.1,9 | | | 9 | | | 90,630 | | 0.1 | |
Bally Total Fitness Holding Corp.1,8,9 | | | 2 | | | 5,608 | | 0.0 | |
Bally Total Fitness Holding Corp.1,3,6,8,9 | | | 4 | | | 6,158 | | 0.0 | |
Continental AFA Dispensing Co. Inc.1,3,9 | | | 60 | | | 1 | | 0.0 | |
Eagle-Picher Industries, Inc.3,6 | | | 50 | | | 975,000 | | 0.7 | |
Glasstech, Inc., Class C1,3,9 | | | — 11 | | | — | | 0.0 | |
Lexington Coal Company1 | | | 25 | | | 17,211 | | 0.0 | |
Mattress Discounters Corp.1,3,9 | | | 8 | | | 27,736 | | 0.0 | |
Oglebay Norton Company1,8 | | | 241 | | | 4,683,315 | | 3.6 | |
Oglebay Norton Company1 | | | 32 | | | 618,802 | | 0.6 | |
Simonds Industries, Inc.1,3,9 | | | 8 | | | 280,024 | | 0.2 | |
Westpoint Stevens, Inc.1,3,9 | | | 14 | | | 149,908 | | 0.1 | |
XO Holdings, Inc.1 | | | 1 | | | 2,219 | | 0.0 | |
| | | | | | | | | |
Total Common Stocks | | | | | | | | | |
(Cost $12,523,762) | | | | | | 6,958,732 | | 5.4 | |
| | | | | | | | | |
8
PACHOLDER HIGH YIELD FUND, INC.
Statement of Net Assets Applicable to Common Stockholders (concluded)
December 31, 2006
| | | | | | | | | | |
| Description | | Shares/Par
(000) | | Value | | | Percent
of Net
Assets* | |
RIGHTS — 0.0%12 | | | | | | | |
Westpoint Stevens, Inc.1,3,9 | | | 7 | | $ | 11,472 | | | 0.0 | % |
Westpoint Stevens, Inc.1,3,9 | | | 13 | | | 22,049 | | | 0.0 | |
| | | | | | | | | | |
Total Rights | | | | | | | | | | |
(Cost $280,455) | | | | | | 33,521 | | | 0.0 | |
| | | | | | | | | | |
WARRANTS — 0.0%12 | | | | | | | |
Abovenet, Inc., 8/9/081,3,9 | | | 1 | | | 22,192 | | | 0.0 | |
Abovenet, Inc., 8/9/101,3,9 | | | 1 | | | 23,358 | | | 0.0 | |
XO Holdings, Inc., Series A, 1/16/101 | | | 1 | | | 744 | | | 0.0 | |
XO Holdings, Inc., Series B, 1/16/101 | | | 1 | | | 349 | | | 0.0 | |
XO Holdings, Inc., Series C, 1/16/101 | | | 1 | | | 174 | | | 0.0 | |
| | | | | | | | | | |
Total Warrants | | | | | | | | | | |
(Cost $417,200) | | | | | | 46,817 | | | 0.0 | |
| | | | | | | | | | |
Total Equity Investments | | | | | | | | | | |
(Cost $13,517,417) | | | | | | 7,365,410 | | | 5.7 | |
| | | | | | | | | | |
SHORT TERM INVESTMENT — 0.4% | | | | | | | |
Federated Prime Obligations Fund | | | | | | | | | | |
(Cost $502,442) | | | 502 | | | 502,442 | | | 0.4 | |
| | | | | | | | | | |
INVESTMENTS OF CASH COLLATERAL FOR SECURITIES LOANED — 21.1% | |
Bank of America N.A. —
Repurchase agreement5
5.33%, dated 12/29/06,
matures 01/02/07 repurchase
price $27,130,770 | | | | | | | | | | |
(Cost $27,114,705) | | $ | 27,115 | | | 27,114,705 | | | 21.1 | |
| | | | | | | | | | |
TOTAL INVESTMENTS | | | | | | | | | | |
(Cost $221,598,254) | | | | | | 219,276,367 | | | 170.4 | |
Payable Upon Return of Securities Loaned | | | (27,114,705 | ) | | (21.1 | ) |
Payable to Advisor | | | | | | (1,161,183 | ) | | (0.9 | ) |
Payable to Administrator | | | | | | (16,996 | ) | | 0.0 | |
Accounting Fees Payable | | | | | | (8,083 | ) | | 0.0 | |
Custody Fees Payable | | | | | | (2,579 | ) | | 0.0 | |
Unrealized Appreciation on Swap Agreements | | | 375,770 | | | 0.3 | |
Unrealized Depreciation on Swap Agreements | | | (70,777 | ) | | (0.1 | ) |
Other Assets in Excess of Other Liabilities | | | 3,434,057 | | | 2.7 | |
Less: Outstanding Preferred Stock
(2,640 shares at $25,000 per share) at liquidation value | | | (66,000,000 | ) | | (51.3 | ) |
| | | | | | | | | | |
Net Assets Applicable to Common Stockholders | | | | | $ | 128,711,871 | | | | |
| | | | | | | | | | |
| | | | | | | | | |
| Description | | | | Value | | | Percent
of Net
Assets* | |
Net Assets Applicable to Common Stockholders: | | | | | | | | | |
Common Stock, $.01 par value; 49,996,320 shares authorized 12,940,868 shares issued and outstanding | | | | $ | 129,409 | | | | |
Capital in excess of par value | | | | | 180,113,036 | | | | |
Undistributed net investment income | | | | | 229,904 | | | | |
Accumulated net realized loss from security transactions | | | | | (49,743,584 | ) | | | |
Net unrealized depreciation on investments | | | | | (2,016,894 | ) | | | |
| | | | | | | | | |
Net Assets Applicable to Common Stockholders | | | | $ | 128,711,871 | | | 100.0 | % |
| | | | | | | | | |
Net Asset Value Per Common Share
($128,711,871/12,940,868) | | $ | 9.95 | | | | |
| | | | | | | | | |
| * | | Applicable to common stockholders. |
1 | | Non-income producing security. |
2 | | Security exempt from registration under Rule 144A of the Securities Act of 1933. These securities may be resold in transactions exempt from registration, normally to qualified institutional buyers. These securities amounted to $33,308,203 and 25.9% of net assets applicable to common stockholders. |
3 | | Board valued security. These securities amounted to $1,517,898 and 1.2% of net assets applicable to common stockholders. |
5 | | Fully collateralized by U.S. Government Agency Mortgages. |
6 | | All or a portion of the security is on loan. Securities on loan have a fair market value of $26,896,049. |
7 | | Step-up bond. Interest rate is effective rate. |
8 | | Restricted security. These securities amounted to $5,966,956 and 4.6% of net assets applicable to common stockholders. |
9 | | Security deemed to be illiquid. These securities amounted to $3,267,215 and 2.5% of net assets applicable to common stockholders. |
10 | | All or a portion of this security is segregated for current or potential holdings of swaps, TBA, when-issued securities and delayed delivery securities. |
11 | | Amount rounds to less than 1,000 shares. |
12 | | Amount rounds to less than 0.1%. |
a | | Amount shown is whole number of units. |
| FRN | | Floating Rate Note. Rate shown is rate in effect at December 31, 2006. |
See accompanying Notes to Financial Statements.
9
PACHOLDER HIGH YIELD FUND, INC.
Statement of Operations
For the Year Ended December 31, 2006
| | | | |
| | | | |
INVESTMENT INCOME: | | | | |
Interest | | $ | 17,119,343 | |
Dividends | | | 159,907 | |
Securities lending (net) | | | 387,949 | |
| | | | |
Total Income | | | 17,667,199 | |
| | | | |
EXPENSES: | | | | |
Investment advisory fees (Note 6) | | | 2,615,456 | |
Administrative fees (Note 6) | | | 194,143 | |
Printing and other | | | 119,443 | |
Stock exchange listing fees | | | 24,999 | |
Accounting fees (Note 6) | | | 36,388 | |
Custodian and accounting fees (Note 6) | | | 19,908 | |
Transfer agent fees | | | 40,999 | |
Legal fees | | | 189,999 | |
Directors’ fees and expenses | | | 120,000 | |
Audit fee | | | 74,001 | |
Insurance | | | 33,999 | |
| | | | |
Operating Expenses | | | 3,469,335 | |
Commissions on auction rate preferred stock | | | 167,903 | |
| | | | |
Total Expenses | | | 3,637,238 | |
Less earnings credits | | | (2,315 | ) |
| | | | |
Net Expenses | | | 3,634,923 | |
| | | | |
Net Investment Income | | | 14,032,276 | |
| | | | |
NET REALIZED AND UNREALIZED GAIN/(LOSS) ON INVESTMENTS: | |
Net realized gain/(loss): | | | | |
Investments | | | 6,609,499 | |
Swaps | | | 258,186 | |
| | | | |
Net realized gain/(loss) on investments | | | 6,867,685 | |
| | | | |
Net change in unrealized appreciation/(depreciation): | | | | |
Investments | | | 7,132,971 | |
Swaps | | | (86,541 | ) |
| | | | |
Net change in unrealized appreciation/(depreciation) on investments | | | 7,046,430 | |
| | | | |
Net realized and unrealized gain/(loss) on investments | | | 13,914,115 | |
| | | | |
Net Increase/(Decrease) Resulting from Operations | | | 27,946,391 | |
DISTRIBUTIONS TO PREFERRED STOCKHOLDERS FROM NET INVESTMENT INCOME | | | (3,239,730 | ) |
| | | | |
NET INCREASE/(DECREASE) IN NET ASSETS APPLICABLE TO COMMON STOCKHOLDERS RESULTING FROM OPERATIONS | | $ | 24,706,661 | |
| | | | |
See accompanying Notes to Financial Statements.
Statements of Changes in Net Assets Applicable to Common Stockholders
| | | | | | | | |
| | | For the
Year Ended
December 31,
2006 | | | For the
Year Ended
December 31,
2005 | |
INCREASE/(DECREASE) IN NET ASSETS: | | | | | |
Operations: | | | | | | | | |
Net investment income | | $ | 14,032,276 | | | $ | 14,442,694 | |
Net realized gain/(loss) on investments | | | 6,867,685 | | | | (8,453,201 | ) |
Net change in unrealized appreciation/(depreciation) on investments | | | 7,046,430 | | | | (177,142 | ) |
Distributions to preferred stockholders from net investment income | | | (3,239,730 | ) | | | (2,157,713 | ) |
| | | | | | | | |
| | | | | | | | |
Net increase/(decrease) in net assets resulting from operations applicable to common shareholders | | | 24,706,661 | | | | 3,654,638 | |
| | | | | | | | |
DISTRIBUTIONS TO COMMON STOCKHOLDERS FROM: | | | | | | | | |
Net investment income | | | (11,636,804 | ) | | | (11,615,091 | ) |
| | | | | | | | |
Total distributions to common stockholders | | | (11,636,804 | ) | | | (11,615,091 | ) |
| | | | | | | | |
FUND SHARE TRANSACTIONS (NOTE 2): | | | | | |
Value of 22,682 and 22,866 shares issued in reinvestment of dividends to common stockholders in 2006 and 2005, respectively | | | 213,317 | | | | 209,289 | |
| | | | | | | | |
Total increase in net assets derived from fund share transactions | | | 213,317 | | | | 209,289 | |
| | | | | | | | |
Total net increase/(decrease) in net assets applicable to common stockholders | | | 13,283,174 | | | | (7,751,164 | ) |
NET ASSETS APPLICABLE TO
COMMON STOCKHOLDERS: | | | | | | | | |
Beginning of period | | | 115,428,697 | | | | 123,179,861 | |
| | | | | | | | |
End of period | | $ | 128,711,871 | | | $ | 115,428,697 | |
| | | | | | | | |
Undistributed Net Investment Income | | $ | 229,904 | | | $ | 1,013,224 | |
| | | | | | | | |
See accompanying Notes to Financial Statements.
10
PACHOLDER HIGH YIELD FUND, INC.
Financial Highlights
(Contained below is per share operating performance data for a share of common stock outstanding, total return performance, ratios to average net assets and other supplemental data. This information has been derived from information provided in the financial statements calculated using average shares outstanding and market price data for the Fund’s shares.)
| | | | | | | | | | | | | | | | | | | | |
| | | For the Year Ended December 31, | |
| | | 2006 | | | 2005 | | | 2004 | | | 2003 | | | 2002 | |
Net asset value, beginning of period | | $ | 8.94 | | | $ | 9.55 | | | $ | 8.59 | | | $ | 5.73 | | | $ | 7.78 | |
| | | | | | | | | | | | | | | | | | | | |
Net investment income | | | 1.09 | | | | 1.12 | | | | 1.08 | | | | 1.10 | | | | 1.41 | |
Net realized and unrealized gain/(loss) on investments | | | 1.07 | | | | (0.67 | ) | | | 0.93 | | | | 2.77 | | | | (2.15 | ) |
Cumulative effect on change in fixed income valuation (Note 1) | | | — | | | | — | | | | (0.07 | ) | | | — | | | | — | |
Distributions to preferred stockholders from net investment income | | | (0.25 | ) | | | (0.16 | ) | | | (0.08 | ) | | | (0.07 | ) | | | (0.12 | ) |
| | | | | | | | | | | | | | | | | | | | |
Net increase/(decrease) in net asset value resulting from operations | | | 1.91 | | | | 0.29 | | | | 1.86 | | | | 3.80 | | | | (0.86 | ) |
| | | | | | | | | | | | | | | | | | | | |
Distributions to Common Stockholders from: | | | | | | | | | | | | | | | | | | | | |
Net investment income | | | (0.90 | ) | | | (0.90 | ) | | | (0.90 | ) | | | (0.89 | ) | | | (1.15 | ) |
Return of capital | | | — | | | | — | | | | — | | | | (0.05 | ) | | | (0.04 | ) |
| | | | | | | | | | | | | | | | | | | | |
Total distributions to common stockholders | | | (0.90 | ) | | | (0.90 | ) | | | (0.90 | ) | | | (0.94 | ) | | | (1.19 | ) |
| | | | | | | | | | | | | | | | | | | | |
Net asset value, end of period | | $ | 9.95 | | | $ | 8.94 | | | $ | 9.55 | | | $ | 8.59 | | | $ | 5.73 | |
| | | | | | | | | | | | | | | | | | | | |
Market value per share, end of period | | $ | 9.80 | | | $ | 8.50 | | | $ | 9.82 | | | $ | 9.14 | | | $ | 6.16 | |
| | | | | | | | | | | | | | | | | | | | |
TOTAL INVESTMENT RETURN(1): | | | | | | | | | | | | | | | | | | | | |
Based on market value per common share(2) | | | 26.78 | % | | | (4.46 | %) | | | 18.67 | % | | | 67.19 | % | | | (19.91 | %) |
Based on net asset value per common share(3) | | | 22.38 | % | | | 3.33 | % | | | 22.79 | % | | | 68.92 | % | | | (13.05 | %) |
RATIOS TO AVERAGE NET ASSETS(4): | | | | | | | | | | | | | | | | | | | | |
Expenses (prior to expenses related to leverage)(5) | | | 1.86 | % | | | 1.50 | % | | | 1.83 | % | | | 1.80 | % | | | 0.83 | % |
Applicable to common stockholders only(6)(7) | | | 2.87 | % | | | 2.34 | % | | | 2.88 | % | | | 3.08 | % | | | 1.65 | % |
Expenses (including expenses related to leverage)(5) | | | 1.95 | % | | | 1.59 | % | | | 1.92 | % | | | 1.91 | % | | | 0.95 | % |
Applicable to common stockholders only(6)(7) | | | 3.01 | % | | | 2.48 | % | | | 3.03 | % | | | 3.26 | % | | | 1.90 | % |
Net investment income(6)(7) | | | 11.61 | % | | | 12.39 | % | | | 12.14 | % | | | 17.17 | % | | | 21.49 | % |
SUPPLEMENTAL DATA: | | | | | | | | | | | | | | | | | | | | |
Net assets at end of period, net of preferred stock (000) | | $ | 128,712 | | | $ | 115,429 | | | $ | 123,180 | | | $ | 110,476 | | | $ | 73,307 | |
Portfolio turnover rate | | | 75 | % | | | 95 | % | | | 73 | % | | | 51 | % | | | 40 | % |
SENIOR SECURITIES: | | | | | | | | | | | | | | | | | | | | |
Number of preferred shares outstanding at end of period | | | 2,640 | | | | 2,640 | | | | 2,640 | | | | 2,640 | | | | 2,640 | |
Asset coverage per share of preferred stock outstanding at end of period(8) | | $ | 73,755 | | | $ | 68,723 | | | $ | 71,660 | | | $ | 66,853 | | | $ | 52,768 | |
Involuntary liquidation preference and average market value per share of preferred stock | | $ | 25,000 | | | $ | 25,000 | | | $ | 25,000 | | | $ | 25,000 | | | $ | 25,000 | |
1 | | Total investment return excludes the effects of commissions. Dividends and distributions to common stockholders, if any, are assumed, for purposes of this calculation, to be reinvested at prices obtained under the Fund’s dividend reinvestment plan. Rights offerings, if any, are assumed, for purposes of this calculation, to be fully subscribed under the terms of the rights offering. |
2 | | Assumes an investment at the common share market value at the beginning of the period indicated and sale of all shares at the closing common share market value at the end of the period indicated. |
3 | | Assumes an investment at the common share net asset value at the beginning of the period indicated and sale of all shares at the closing common share net asset value at the end of the period indicated. |
4 | | Ratios calculated on an annualized basis of expenses and net investment income. Ratios do not include the effect of dividends to preferred stock. |
5 | | Ratios calculated relative to the average net assets of both common and preferred stockholders. |
6 | | Ratios calculated relative to the average net assets of common stockholders only. |
7 | | Information for the years 2002 through 2003 is not audited by previous auditors. Ratios have been derived from audited financial statements for the respective year. |
8 | | Calculated by subtracting the Fund’s total liabilities (not including the preferred stock) from the Fund’s total assets, and dividing this by the number of preferred shares outstanding. |
See accompanying Notes to Financial Statements.
11
PACHOLDER HIGH YIELD FUND, INC.
Notes to Financial Statements
| 1. | | SIGNIFICANT ACCOUNTING POLICIES — Pacholder High Yield Fund, Inc. (the “Fund”) is a closed-end, diversified management investment company with a leveraged capital structure. The Fund’s investment objective is to provide a high level of total return through current income and capital appreciation. Under normal circumstances, the Fund invests at least 80% of the value of its assets in high yield securities. The Fund invests primarily in fixed income securities of domestic companies. The Fund was incorporated under the laws of the State of Maryland in August 1988. |
The following is a summary of significant accounting policies followed by the Fund in the preparation of its financial statements.
| | A. | | SECURITY VALUATIONS — Fixed income securities (other than short-term investments maturing in 60 days or less), are valued each day based on readily available market quotations received from third party broker-dealers of comparable securities or independent pricing services approved by the Board of Directors. Such pricing services and broker-dealers generally provide bid-side quotations. Generally, short-term investments maturing in 60 days or less are valued at amortized cost, which approximates market value. Listed securities are valued at the last sale price on the exchange on which they are primarily traded. The value of National Market System equity securities quoted by the NASDAQ Stock Market shall generally be the NASDAQ Official Closing Price. Investments in other open-end investment companies are valued at such investment company’s current day closing net asset value per share. |
Securities or other assets for which market quotations are not readily available or for which market quotations do not represent the value at the time of pricing (including certain illiquid securities) are fair valued in accordance with procedures established and monitored by the Board of Directors. Valuations may be based upon current market prices of securities that are comparable in coupon, rating, maturity and industry. It is possible that the estimated values may differ significantly from the values that would have been used had a ready market for the investments existed, and such differences could have been material. At December 31, 2006, there were fair-valued securities of $1,517,898.
Prior to January 1, 2004, the Fund valued fixed income securities based on the mean of bid and asked prices. Effective January 1, 2004, the Fund changed its valuation policy to value fixed income securities based on bid prices, as bid prices are believed to be more representative of the price that could be obtained in sales transactions in the market for such securities. Bid prices generally are lower than those based on the mean of bid and asked prices. The cumulative effect of this accounting change on January 1, 2004 was to decrease the value of investments and net assets applicable to common stockholders by approximately $854,808 ($0.07 per common share). The financial highlights for periods prior to December 31, 2004 have not been restated to reflect this change in accounting policy.
| | B. | | REPURCHASE AGREEMENTS — Each repurchase agreement is valued at amortized cost. In connection with transactions in repurchase agreements, it is the Fund’s policy that a tri-party custodian take possession of the underlying collateral securities in a manner sufficient to enable the Fund to obtain collateral in the event of a counterparty default. If the counterparty defaults and the fair value of the collateral declines, realization of the collateral by the Fund may be delayed or limited. The repurchase agreements are fully collateralized by either or all of the following: U.S. Government agency securities, investment grade corporate bonds, and non-investment grade corporate bonds. |
| | C. | | FEDERAL TAXES — It is the Fund’s policy to make distributions to stockholders of net investment income and net realized capital gains to comply with the requirements of the Internal Revenue Code of 1986, as amended, applicable to regulated investment companies. |
The Fund intends to continue to qualify as a regulated investment company by complying with the appropriate provisions of the Internal Revenue Code and to distribute to stockholders each year substantially all of its taxable income, if any, including realized gains on investments.
The Fund has a policy of maintaining stable monthly distributions. Distributions paid by the Fund are subject to recharacterization for tax purposes. For the year ended December 31, 2006, a portion of dividends paid consisted of net realized gains. To the extent that capital loss carryforwards are available to offset the distribution of capital gains but were not so utilized, such capital gain distributions may be taxable to stockholders as ordinary income.
The amount of dividends and distributions from net investment income and net realized capital gains is determined in accordance with Federal income tax regulations, which may differ from accounting principles generally accepted in the United States of America. To the extent these “book/tax” differences are permanent in nature (i.e., that they result from other than timing of recognition - “temporary differences”), such amounts are reclassified within the capital accounts based on their Federal tax-basis treatment.
12
PACHOLDER HIGH YIELD FUND, INC.
Notes to Financial Statements (continued)
The following amounts were reclassified within the capital accounts:
| | | | | | | | | | |
| | | Capital in
Excess of
Par Value | | Undistributed
Net
Investment
Income | | Accumulated
Net Realized
Loss from
Security
Transactions | |
| | $ | 220,478 | | $ | 60,938 | | $ | (281,416 | ) |
The reclassification for the Fund relates primarily to differences in character for tax purposes of payments on swaps, taxable overdistributions and the reclassification of defaulted bonds.
The tax character of distributions paid during the years ended December 31, 2006 and 2005 was as follows:
| | | | | | |
| | | 2006 | | 2005 |
Common Stockholder | | | | | | |
Ordinary Income | | $ | 11,636,804 | | $ | 11,615,091 |
Preferred Stockholders | | | | | | |
Ordinary Income | | $ | 3,239,730 | | $ | 2,157,713 |
| | D. | | SECURITIES TRANSACTIONS AND INVESTMENT INCOME — Securities transactions are accounted for on the date the securities are purchased or sold (trade date). Realized gains and losses on securities transactions are determined on an identified cost basis. Interest income is determined on the basis of coupon interest accrued using the effective interest method adjusted for amortization of premiums and accretion of discounts. Dividend income is recorded on the ex-dividend date. |
| | E. | | SECURITIES LENDING — To generate additional income, the Fund may lend its securities, through JPMorgan Chase Bank, N.A. (“JPMCB”) as lending agent (an affiliate of the J.P. Morgan Investment Management Inc. (“JPMIM”)), to approved brokers and receives cash as collateral to secure the loans. The Fund receives payments from borrowers equivalent to the dividends and interest that would have been earned on securities lent while simultaneously seeking to earn income on the investment of collateral. Although the risk of lending is mitigated by the collateral, the Fund could experience a delay in recovering its securities and a possible loss of income or value if the borrower fails to return them. Loans are subject to termination by the Fund or the borrower at any time, and are, therefore, not considered to be illiquid investments. As of December 31, 2006, the Fund loaned securities having a value of $26,896,049. Collateral is marked to market daily to provide a level of collateral at not less than 100% of the value of loaned securities. The cash collateral of $27,114,705 received by the Fund at December 31, 2006 was invested in a repurchase agreement (with an interest rate of 5.33% and a maturity date of January 2, 2007). Information on the investment of cash collateral is shown in the Statement of Net Assets Applicable to Common Stockholders. |
Under the Securities Lending Agreement, JPMCB is entitled to a fee equal to: (i) 0.05% calculated on an annualized basis and accrued daily based upon the value of collateral received from Borrowers for each loan of U.S. Government and agency securities, and (ii) 0.10% calculated on an annualized basis and accrued daily based upon the value of collateral received from Borrowers for each loan of equities and corporate bonds. JPMCB received $16,808 in fees for services rendered in lending of securities during the year ended December 31, 2006.
| | F. | | EXPENSES AND DISTRIBUTIONS — Expenses are accrued as incurred. Dividends to common stockholders are paid from net investment income monthly and distributions of net realized capital gains, if any, are paid at least annually. Dividends to preferred stockholders are accrued daily based on a variable interest rate set at weekly auctions and are paid weekly from net investment income. Distributions are determined in accordance with federal income tax regulations which may differ from generally accepted accounting principles. |
| | G. | | WHEN, AS AND IF ISSUED SECURITIES — The Fund may engage in “when-issued” or “delayed delivery” transactions. The Fund records when-issued securities on the trade date and maintains security positions such that sufficient liquid assets will be available to make payment for the securities purchased. Securities purchased on a when-issued or delayed delivery basis begin earning interest on the settlement date. |
The Fund had no when-issued or delayed-delivery purchase commitments as of December 31, 2006.
| | H. | | LOAN PARTICIPATIONS AND ASSIGNMENTS — The Fund may invest in loan participations and assignments of all or a portion of loans. When the Fund purchases a loan participation, the Fund typically enters into a contractual relationship with the lender or third party selling such Participations (“Selling Participant”), but not the Borrower. In contrast, the Fund has direct rights against the |
13
PACHOLDER HIGH YIELD FUND, INC.
Notes to Financial Statements (continued)
| | Borrower on a loan when it purchases an assignment. As a result, the Fund assumes the credit risk of the Borrower, and with respect to loan participations, the Selling Participant and any other persons interpositioned between the Fund and the Borrower (“Intermediate Participants”). The Fund may not benefit directly from the collateral supporting the senior loan in which it has purchased the loan participation. |
| | I. | | UNFUNDED COMMITMENTS — At December 31, 2006, the Fund had the following unfunded loan commitments which could be extended at the option of the borrower: |
| | | |
Borrower | | Unfunded Commitments |
Isola Group S.A.R.L., 1st Lien Term Loan | | $ | 500,000 |
Isola Group S.A.R.L., 2nd Lien Term Loan | | | 250,000 |
| | J. | | ESTIMATES — The preparation of financial statements in conformity with accounting principles generally accepted in the United States of America requires management to make estimates and assumptions that affect the reported amounts of assets and liabilities at the date of the financial statements and the reported amounts of income and expenses during the reporting period. Actual results could differ from these estimates. |
| | K. | | INTEREST RATE SWAPS — Interest rate swap agreements involve the exchange by the Fund with another party of their respective commitments to pay or receive interest, e.g., an exchange of floating rate payments for fixed rate payments with respect to the notional amount of principal. Unrealized gains are reported as an asset and unrealized losses are reported as a liability on the Statement of Net Assets Applicable to Common Stockholders. The change in value of swaps, including the periodic amounts of interest to be paid or received on swaps, is reported as unrealized gains or losses in the Statement of Operations. A realized gain or loss is recorded upon payment or receipt of a periodic payment or termination of swap agreements. Swap agreements are stated at fair value. |
| | L. | | INDEMNIFICATIONS — The Fund’s officers and directors are indemnified against certain liabilities arising out of the performance of their duties to the Fund. In addition, in the normal course of business, the Fund enters into contracts with its vendors and others that provide for general indemnifications. The Fund’s maximum exposure under these arrangements is unknown, as this would involve future claims that may be made against the Fund. However, based on experience, the Fund expects the risk of loss to be remote. |
| 2. | | COMMON STOCK — At December 31, 2006, there were 49,996,320 shares of common stock with a $.01 par value authorized and 12,940,868 shares outstanding. During the years ended December 31, 2006 and December 31, 2005, the Fund issued 22,682 and 22,866 shares of common stock, respectively, in connection with its dividend reinvestment plan. |
| 3. | | PREFERRED STOCK — On June 29, 2001, the Fund issued 3,680 shares of Series W Auction Rate Cumulative Preferred Stock (“ARPS”) at an offering price of $25,000 per share. During 2002, the Fund redeemed a total of $26,000,000 or 1,040 shares of ARPS at various intervals and amounts. No redemptions have occurred since 2002. Dividends on these shares are paid weekly at an annual rate determined by a weekly auction. The Fund is required to maintain certain asset coverages as set forth in the Fund’s Articles Supplementary Creating and Fixing the Rights of Auction Rate Cumulative Preferred Stock. The ARPS is subject to mandatory redemption at a redemption price of $25,000 per share, plus accumulated and unpaid dividends, if the Fund is not in compliance with the required asset coverage (minimum 2 to 1) tests and restrictions. In general, the holders of the ARPS and the common stock vote together as a single class, except that the ARPS stockholders, as a separate class, vote to elect two members of the Board of Directors, and separate votes are required on certain matters that affect the respective interests of the ARPS and common stock. The ARPS has a liquidation preference of $25,000 per share, plus accumulated and unpaid dividends. At December 31, 2006, accrued ARPS dividends were $40,701. |
| 4. | | INTEREST RATE SWAPS — The Fund entered into interest payment swap arrangements with Citibank, N. A. New York (Citibank) for the purpose of partially hedging its dividend payment obligations with respect to the ARPS. Pursuant to each of the swap arrangements, the Fund makes payments to Citibank on a monthly basis at fixed annual rates. In exchange for such payments Citibank makes payments to the Fund on a monthly basis at a variable rate determined with reference to the one month London Interbank Offered Rate (LIBOR). The variable rates ranged from 4.29% to 5.35% for the year ended December 31, 2006. The effective date, notional contract amount, maturity, fixed and |
14
PACHOLDER HIGH YIELD FUND, INC.
Notes to Financial Statements (continued)
| | floating annual rates and unrealized appreciation/depreciation of the swaps are as follows: |
| | | | | | | | | | | | | | | |
Effective Date | | Notional Contract Amount | | Maturity | | Fixed Annual Rate | | | Floating Annual Rate* | | | Unrealized Appreciation/ (Depreciation) | |
10/1/2004 | | $ | 10 million | | 10/1/2007 | | 3.30 | % | | 5.35 | % | | $ | 162,951 | |
6/1/2005 | | $ | 5 million | | 6/2/2008 | | 4.10 | % | | 5.35 | % | | | 75,051 | |
6/1/2005 | | $ | 5 million | | 6/1/2009 | | 4.15 | % | | 5.35 | % | | | 102,762 | |
12/1/2005 | | $ | 5 million | | 12/1/2009 | | 4.74 | % | | 5.35 | % | | | 35,006 | |
8/14/2006 | | $ | 5 million | | 12/1/2008 | | 5.26 | % | | 5.35 | % | | | (19,092 | ) |
8/14/2006 | | $ | 5 million | | 6/1/2010 | | 5.26 | % | | 5.35 | % | | | (45,244 | ) |
12/1/2006 | | $ | 5 million | | 12/1/2010 | | 5.01 | % | | 5.35 | % | | | (6,441 | ) |
| * | | Represents rate in effect at December 31, 2006. |
Swap transactions, which involve future settlement, give rise to credit risk. Credit risk is the amount of loss the Fund would incur in the event counterparties failed to perform according to the terms of the contractual commitments. The Fund is exposed to credit loss in the event of nonperformance by the counterparty on interest rate swaps, but the Fund does not anticipate nonperformance by the counterparty. While notional contract amounts are used to express the volume of interest rate swap agreements, the amounts potentially subject to credit risk, in the event of nonperformance by counterparties, are substantially smaller.
For the year ended December 31, 2006, the Fund’s receipts under the swap agreements were greater than the amount paid and accrued to Citibank by $258,186 and are included as realized gain in the accompanying Statement of Operations.
The estimated fair value of the interest rate swap agreements at December 31, 2006, amounted to approximately $304,993 in net unrealized appreciation and is included in the accompanying Statement of Net Assets Applicable to Common Stockholders. Swap transactions present risk of loss in excess of the related amounts included in the Statement of Net Assets Applicable to Common Stockholders.
| 5. | | PURCHASES AND SALES OF SECURITIES — Purchases and sales of securities (excluding short-term securities) for the year ended December 31, 2006 aggregated $136,979,042 and $138,925,807, respectively. |
| 6. | | TRANSACTIONS WITH INVESTMENT ADVISOR, ADMINISTRATOR, ACCOUNTING SERVICES AGENT AND CUSTODIAN — For the year ended December 31, 2006, Pacholder & Company, LLC (“P&C”), an Ohio limited liability company which was wholly-owned by JPMorgan Investment Advisors Inc., served as investment advisor to the Fund under an Investment Advisory Agreement dated as of March 1, 2005 (the “2005 Agreement”). Under the terms of the 2005 Agreement, the Fund paid P&C an advisory fee that varied based on the total return investment performance of the Fund for the prior 12-month period relative to the percentage change in the Credit Suisse First Boston High Yield Index, Developed Countries Only™. The fee, which is accrued at least weekly and paid monthly, ranged from a maximum of 1.40% to a minimum of 0.40% (on an annualized basis) of the Fund’s average weekly net assets. For purposes of calculating the amount of the advisory fee, the Fund’s average weekly net assets was determined by taking the average of all determinations of such net assets during the applicable 12-month period and the Fund’s net assets meant the total assets of the Fund minus accrued liabilities of the Fund other than the principal amount of any outstanding senior securities representing indebtedness including the ARPS. Notwithstanding the foregoing, during the 12-month period following March 1, 2005, the Fund was obligated to pay P&C the minimum fee payable under the 2005 Agreement and any balance due based on the Fund’s investment performance during the period was paid to P&C upon completion of the 12-month period. For the year ended December 31, 2006, the advisory fee was calculated based on 1.40% of average weekly net assets (as defined above) of the Fund. At December 31, 2006, accrued advisory fees were $1,161,183. |
Certain officers and directors of the Fund were also members of the Board of Managers of P&C. Effective the close of business on December 31, 2006, P&C merged with JPMIM, a wholly-owned subsidiary of JPMorgan Asset Management Holdings, Inc, which is a wholly-owned subsidiary of JPMorgan Chase & Co. and an affiliate of P&C. Upon completion of the merger, JPMIM began serving as investment advisor to the Fund under an Investment Advisory Agreement effective as of January 1, 2007 (the “JPMIM Agreement”). The transaction did not result in any changes to the portfolio manager or his team. Additionally, the investment advisory fee payable by the Fund to JPMIM under the JPMIM Agreement is the same as the fee under the 2005 Agreement. Finally, the JPMIM Agreement contains only ministerial changes to reflect appointment of JPMIM as successor to P&C.
The Fund has an administrative services agreement with JPMorgan Funds Management, Inc. (the “Administrator”) (an affiliate of JPMIM) pursuant to which the Administrator provides administrative services to the Fund. Under the agreement, the Administrator receives from the
15
PACHOLDER HIGH YIELD FUND, INC.
Notes to Financial Statements (continued)
Fund a fee, accrued at least weekly and paid monthly, at the annual rate of 0.10% of the average weekly net assets of the Fund. At December 31, 2006, accrued administrative fees were $16,996.
Effective October 20, 2006, J.P. Morgan Investor Services, Co. (“JPMIS”), an indirect, wholly-owned subsidiary of JPMorgan Chase & Co., serves as the Fund’s Sub-administrator (the “Sub-administrator”). For its services as sub-administrator, JPMIS receives a portion of the fees payable to the Administrator.
Effective October 20, 2006, the Fund entered into a Global Custody and Fund Accounting Agreement (the “Agreement”) with JPMCB. For providing custody services under the Agreement, JPMCB is entitled to a fee from the Fund, accrued weekly and paid monthly, at an annual rate of 0.01% of the average weekly net assets of the Fund, plus certain transaction costs. For providing fund accounting services under the Agreement, JPMCB is entitled to a fee from the Fund, accrued weekly and paid monthly. The fund accounting fees are calculated utilizing a tiered schedule based on the aggregate assets in the Fund and in certain other funds advised by JPMIM and its affiliates. The tiered schedule is as shown below:
| | |
Tier | | Basis Points |
$0-$10 Billion | | 0.90 |
$10-$20 Billion | | 0.50 |
$20-$30 Billion | | 0.35 |
Over $30 Billion | | 0.30 |
The minimum fee is $20,000.
Based on the above, it is anticipated that the Fund will be charged $20,000 in fund accounting fees annually.
The amounts paid to JPMCB for the period ended December 31, 2006, were $5,035 and $6,079 for custody and fund accounting fees, respectively, and the amounts are included in custody and accounting fees, respectively, on the Statement of Operations.
At December 31, 2006, accrued custody and fund accounting fees were $2,579 and $8,083, respectively.
Prior to October 20, 2006, the Fund had an agreement with Bank One Trust Company, N.A. (an affiliate of P&C and JPMIM) to provide custodial services for the Fund. Under the agreement, Bank One Trust Company, N.A. received from the Fund a fee, accrued at least weekly and paid monthly, at the annual rate of 0.01% of the Fund’s average weekly net assets. The amount paid to Bank One Trust Company, N.A. for services performed through October 19, 2006, was $14,873 and is included in custody fees on the Statement of Operations.
Also, prior to October 20, 2006, the Fund had an agreement with the Administrator to provide fund accounting services. Under the agreement, the Administrator received from the Fund a fee, accrued at least weekly and paid monthly, at the annual rate of 0.025% of the first $100 million of the Fund’s average weekly net assets and 0.015% of such assets in excess of $100 million. The amount paid to the Administrator for fund accounting services performed through October 19, 2006, was $30,309 and is included in accounting fees on the Statement of Operations.
As of December 31, 2006, liabilities for the Fund, other than those previously indentified, included:
| | | |
Other liabilities | | $ | 85,612 |
| 7. | | COMPONENTS OF ACCUMULATED EARNINGS (LOSSES) — At December 31, 2006, the components of net assets applicable to common stockholders (excluding paid in capital) on a tax basis were as follow: |
| | | | |
| | | December 31,
2006 | |
Undistributed net investment income | | $ | — | |
| | | | |
Accumulated net realized gain/(loss) on investments | | $ | (49,729,284 | ) |
| | | | |
Gross Unrealized appreciation on investments | | $ | 10,417,698 | |
Gross Unrealized depreciation on investments | | $ | 12,178,287 | |
| | | | |
Net Unrealized appreciation/(depreciation) on investments | | $ | (1,760,589 | ) |
| | | | |
Cost of investments for Federal Tax purposes | | $ | 221,036,956 | |
| | | | |
The difference between the book-basis and tax basis unrealized appreciation/(depreciation) is attributable primarily to the difference between book and tax amortization methods for premium and market discount, and wash sale loss deferrals.
At December 31, 2006, the Fund had available a capital loss carryforward of $49,729,284, of which $2,587,486 expires in 2007, $4,746,544 expires in 2008, $4,438,792 expires in 2009, $8,135,473 expires in 2010, $20,873,746 expires in 2011, $2,030,683 expires in
16
PACHOLDER HIGH YIELD FUND, INC.
Notes to Financial Statements (concluded)
2012, and $6,916,560 expires in 2013, to offset any future net capital gains.
During the year ended December 31, 2006, the Fund utilized $5,163,020 of capital loss carryforwards.
| 8. | | SCHEDULE OF RESTRICTED SECURITIES — A restricted security is a security which has been purchased through a private offering and cannot be resold to the general public without prior registration under the Securities Act of 1933 (the “Act”) or pursuant to the resale limitations provided by Rule under the Act, or an exemption from the registration requirements of the Act. At December 31, 2006, the Fund held restricted securities representing 3.1% of the Fund’s long-term market value. The restricted securities held as of December 31, 2006 are identified below: |
| | | | | | | |
Security | | Description | | Acquisition Date | | Cost of Security |
Golden State Foods Corp. | | Bond | | 2/26/2004 | | $ | 1,250,000 |
Bally Total Fitness Holding Corp. | | Common Stock | | 12/30/2005 | | | 19,640 |
Bally Total Fitness Holding Corp. | | Common Stock | | 12/30/2005 | | | 24,275 |
Oglebay Norton Company | | Common Stock | | 1/27/2005 | | | 1,893,700 |
| 9. | | ILLIQUID SECURITIES — The Fund may invest in securities that are subject to legal or contractual restrictions on resale or are illiquid. An illiquid security is a security which cannot be disposed of promptly (within seven days) and in the usual course of business at approximately its fair value and includes repurchase agreements maturing in excess of seven days, time deposits with a withdrawal penalty, non-negotiable instruments and instruments for which no market exists. Disposal of these securities may involve time-consuming negotiations and expense, and prompt sale at the current valuation may be difficult. At December 31, 2006, the Fund held illiquid securities representing 1.7% of the Fund’s long-term market value. |
| 10. | | OTHER MATTERS — In July 2006, the Financial Accounting Standards Board issued Interpretation No. 48, Accounting for Uncertainty in Income Taxes — an Interpretation of FASB Statement No. 109 (the “Interpretation”). The Interpretation prescribes for all entities, including pass-through entities, a recognition threshold and measurement attribute for financial statement recognition and measurement of a tax position taken or expected to be taken in a tax return, and requires certain expanded tax disclosures. The Interpretation is effective for fiscal years beginning after December 15, 2006, and is to be applied to all open tax years as of the date of effectiveness. Management continues to evaluate the Interpretation and the impact on the Fund’s financial statements, but has not at this time quantified the impact, if any, resulting from the adoption of the Interpretation. |
In addition, in September 2006, Statement of Financial Accounting Standards No. 157, “Fair Value Measurements” (“SFAS 157”), was issued and is effective for fiscal years beginning after November 15, 2007. SFAS 157 defines fair value, establishes a framework for measuring fair value and expands disclosures about fair value measurements. Management is currently evaluating the impact the adoption of SFAS 157 will have on the Fund’s financial statement disclosures.
The Fund invests at least 80% of its assets in high yield securities. Investments in lower-rated securities or unrated securities of comparable quality tend to be more sensitive to economic conditions than higher rated securities. These securities involve a greater risk of default by the issuer because such securities are generally unsecured and are often subordinated to other creditors’ claims.
Investments in Credit Default Swaps
Beginning in March 2007, the Fund may from time to time enter into credit default swaps and CDX contracts (collectively, “CDS”) to manage the credit risk associated with owning a high yield bond or to gain exposure to a high yield bond without actually purchasing it. CDS are two party contracts for terms ranging from a few weeks to more than one year. Under a CDS agreement, one party (the buyer) receives the right to recoup the economic value of a decline in the value of debt securities of the reference issuer from the other party (the “seller”) if the credit event (a downgrade or default) occurs. This value is obtained by delivering a debt security of the reference issuer to the party in return for a previously agreed payment from the other party (frequently, the par value of the debt security). CDS include contracts on individual securities, and CDX contracts, which are contracts on baskets or indices of securities.
The use of CDS, like all swap agreements, is subject to certain risks. If a counterparty’s creditworthiness declines, the value of the swap would likely decline. Moreover, there is no guarantee that the Fund could eliminate its exposure under an outstanding swap agreement by entering into an offsetting swap agreement with the same or another party.
17
PACHOLDER HIGH YIELD FUND, INC.
Report of Independent Registered Public Accounting Firm
To the Board of Directors and Shareholders of
Pacholder High Yield Fund, Inc.
In our opinion, the accompanying statement of net assets, and the related statements of operations and of changes in net assets and the financial highlights present fairly, in all material respects, the financial position of Pacholder High Yield Fund, Inc. (the “Fund”) at December 31, 2006, the results of its operations for the year then ended, the changes in its net assets for each of the two years in the period then ended and the financial highlights for each of the three years in the period then ended, in conformity with accounting principles generally accepted in the United States of America. These financial statements and financial highlights (hereafter referred to as “financial statements”) are the responsibility of the Fund’s management; our responsibility is to express an opinion on these financial statements based on our audits. We conducted our audits of these financial statements in accordance with the standards of the Public Company Accounting Oversight Board (United States). Those standards require that we plan and perform the audit to obtain reasonable assurance about whether the financial statements are free of material misstatement. An audit includes examining, on a test basis, evidence supporting the amounts and disclosures in the financial statements, assessing the accounting principles used and significant estimates made by management, and evaluating the overall financial statement presentation. We believe that our audits, which included confirmation of securities at December 31, 2006 by correspondence with the custodian and brokers, provide a reasonable basis for our opinion. The financial highlights of the Fund as of December 31, 2003 and for each of the periods in the two years then ended were audited by other auditors whose report, dated February 20, 2004, expressed an unqualified opinion on the financial statements containing those financial highlights.
PricewaterhouseCoopers LLP
New York, New York
February 28, 2007
18
PACHOLDER HIGH YIELD FUND, INC.
Supplemental Information (Unaudited)
Portfolio Holdings Information
The Fund files its complete schedule of portfolio holdings with the U.S. Securities and Exchange Commission (“SEC”) for the first and third quarters of each fiscal year on Form N-Q. The Fund’s Forms N-Q are available, without charge, on the SEC’s website at www.sec.gov. The Fund’s Forms N-Q may be reviewed and copied at the SEC’s Public Reference Room in Washington, DC. Information on the operation of the Public Reference Room may be obtained by calling 1-800-SEC-0330. The Fund’s website at www.phf-hy.com contains schedules of portfolio investments of the Fund.
Proxy Voting
A description of the policies and procedures used by the Fund to vote proxies relating to portfolio securities, a well as information regarding how the Fund voted proxies relating to portfolio securities during the most recent 12-month period ended June 30, is available (i) without charge, on the Fund’s website at www.phf-hy.com and (ii) on the SEC’s website at www.sec.gov.
Approval of Investment Advisory Contract with J.P. Morgan Investment Management Inc.
Effective as of the close of business on December 31, 2006, P&C, the Fund’s previous investment adviser, merged with JPMIM, which became the Fund’s investment adviser pursuant to the JPMIM Agreement. P&C served as the Fund’s investment adviser pursuant to the 2005 Agreement.
The Fund’s Board of Directors (the “Board”) approved the JPMIM Agreement on December 12, 2006. As part of their deliberations, the Board, including the Board’s directors who are not “interested persons” (as defined in the Investment Company Act of 1940) of the Fund or JPMIM (the “Independent Directors”), discussed the proposed assumption of P&C’s responsibilities by JPMIM as legal successor to P&C, the nature and quality of the services to be provided by JPMIM under the JPMIM Agreement, and JPMIM’s compliance program and capabilities. The Independent Directors concluded that the portfolio manager and his team had provided the Fund with an appropriate level of high-quality services and that the quality of such services would likely continue as such personnel would continue in their roles with respect to the Fund on behalf of JPMIM. The Independent Directors further concluded that the JPMIM Agreement was essentially a continuation of the 2005 Agreement which was most recently renewed by the Board in May 2006, and that approval of the JPMIM Agreement was in the best interest of the Fund and its shareholders.
In their deliberations regarding the JPMIM Agreement, the Independent Directors did not identify any particular information that was all important or controlling for purposes of making their decision. The Independent Directors considered and found the following specific factors in support of approval of the JPMIM Agreement:
| | • | | The continuity of the investment advisory personnel between P&C and JPMIM and the expectation that there would be no changes in the portfolio manager or his team or day-to-day management of the Fund; |
| | • | | The expectation that JPMIM as successor to P&C will execute its obligations under the JPMIM Agreement consistently over time; |
| | • | | JPMIM has the requisite expertise and experience, as well as sufficient financial resources, to fulfill its commitments to the Fund under the JPMIM Agreement; |
| | • | | The terms of the JPMIM Agreement, including compensation, do not differ materially from the terms of the 2005 Agreement and the JPMIM Agreement contains only ministerial changes to reflect appointment of JPMIM as successor to P&C; |
| | • | | The investment advisory fee is the same under the JPMIM Agreement as under the 2005 Agreement and the Board most recently concluded in May 2006 that that fee was fair and reasonable in relation to the services provided by P&C and various industry averages for comparable funds; and |
| | • | | The JPMIM Agreement’s initial term will expire on June 30, 2007 and, accordingly, renewal of the JPMIM Agreement will be considered by the Board in May 2007. |
After consideration of the foregoing, the Board, including all of the Independent Directors, resolved to approve the JPMIM Agreement.
The factors considered and conclusions reached by the Board in May 2006 in connection with the renewal of the 2005 Agreement are summarized below.
On May 22, 2006, the Board considered renewal of the 2005 Agreement between the Fund and P&C. The Independent Directors relied upon comparisons of the advisory fee payable to P&C by the Fund to the investment advisory arrangements of other comparable closed-end funds. Because the Fund is a closed-end fund without daily inflows or outflows of new capital and because the investment advisory fee is a “fulcrum fee,” the Independent Directors did not give special consideration to whether economies of scale might be realized in managing the Fund’s assets.
19
PACHOLDER HIGH YIELD FUND, INC.
Supplemental Information (Unaudited) (continued)
In their deliberations regarding the 2005 Agreement, the Independent Directors did not identify any particular information that was all important or controlling for purposes of making their decision. The Independent Directors considered and found the following specific factors in support of approval of the continuation of the 2005 Agreement:
| | • | | P&C’s performance of its obligations under the 2005 Agreement and the expectation that there would not be any significant change with respect to the portfolio management personnel or day-to-day management of the Fund; |
| | • | | The expectation that P&C will continue to execute its obligations under the 2005 Agreement consistently over time; |
| | • | | P&C has the requisite expertise and experience, as well as sufficient financial resources, to fulfill its commitments to the Fund under the agreement; |
| | • | | The Fund’s performance for the past 1, 3, 5 and 10-year periods was above average compared to other closed-end funds in the Fund’s Morningstar peer group; |
| | • | | The Fund’s average annual total returns between 1989 and 2005 were above the average annual total returns for other closed-end funds in the Fund’s Morningstar peer group; and |
| | • | | P&C’s estimated profitability in respect of the agreement has been reasonable and appears to be in line with general industry standards. |
The Independent Directors relied on comparisons of the advisory fee under the 2005 Agreement to advisory fees paid by other closed-end high yield funds and found the following:
| | • | | The agreement’s 90 basis point fulcrum fee was somewhat higher than the average fixed advisory fee paid by other closed-end high yield funds, although the Fund’s overall expense ratio (at the fulcrum fee) has been slightly below the average expense ratio; |
| | • | | Although P&C earned the maximum 140 basis point fee in 2003 and 2004 and a 103 basis point fee in 2005, in 2001 and 2002 P&C earned the minimum 40 basis point fee, and the Fund’s actual advisory fee and expense ratio in 2001 and 2002 were materially lower than most other closed-end high yield funds; and |
| | • | | The two largest closed-end high yield funds have fixed advisory fees of 90 basis points and 115 basis points, respectively. |
The Independent Directors recognized that it is difficult to make comparisons of profitability from the investment advisory arrangements of other comparable closed-end funds because comparative information is not generally publicly available and is affected by numerous factors, including the structure of the particular adviser, the types of funds it manages, its business mix, numerous assumptions regarding allocations, and the adviser’s capital structure and the cost of capital. The Independent Directors also recognized that the Fund investment adviser should be entitled to earn a reasonable level of profits for the services it provides to the Fund. Based on these considerations, the Independent Directors found the compensation paid to P&C under the 2005 Agreement to be fair and reasonable in relation to the services provided by P&C.
Because P&C did not have any advisory clients other than the Fund, the Independent Directors did not compare the advisory services provided to the Fund under the contract to the investment advisory services being provided by P&C to other clients. However, they did consider the advisory fees charged by affiliates of P&C to other client accounts investing in high yield securities.
The Independent Directors considered the scope and quality of the services provided by P&C under the 2005 Agreement and noted that the scope of the services had expanded over time as a result of regulatory and other developments. The Independent Directors noted, for example, that P&C and its affiliates were responsible for maintaining and monitoring P&C’s and the Fund’s compliance programs, both of which have grown in scope and complexity as a result of new regulatory requirements that have been mandated over the past few years. As part of their deliberations, the Independent Directors also considered information concerning JPMorgan, including, among other matters, the nature and extent of its investment advisory businesses, its financial and other resources, its high yield assets under management, its investment company business, its fund support capabilities and any significant legal proceedings.
During the course of their deliberations, the Independent Directors reached the following conclusions, among others: (1) P&C was qualified to manage the assets of the Fund in accordance with the 2005 Agreement based in part on the Fund’s experience with P&C in the past; (2) the Fund’s performance over time has been above average compared to other closed-end funds in the Fund’s Morningstar peer group; and (3) the compensation to be paid to P&C under the 2005 Agreement was fair and reasonable in relation to the services provided by P&C and various industry averages for comparable funds.
20
PACHOLDER HIGH YIELD FUND, INC.
Supplemental Information (Unaudited) (continued)
Privacy Policy
Respecting and protecting customer privacy is vital to the Pacholder High Yield Fund, Inc. This Policy explains what the Pacholder High Yield Fund, Inc. does to keep our customer information private and secure.
Q. Who is Covered by the Privacy Policy
A. This Privacy Policy applies to consumers who are customers or former customers of Pacholder High Yield Fund, Inc. through record ownership of Fund shares. Our Privacy Policy is provided to customers when they open a new account. We also send it to current customers yearly. We may change our Policy. We will send you a new privacy policy if we broaden our information sharing practices about you.
Q. What information do you have about me?
A. To provide services and to help meet your needs, we collect information about you from various sources.
| | • | | We get information from you on applications or other forms, on our web site, or through other means. |
| | • | | We get information from transactions, correspondence, or other communications with us. |
Q. How do you safeguard information about me?
A. We take a number of steps to protect the privacy of information about you. Here are some examples:
| | • | | We keep information under physical, electronic and procedural controls that comply with or exceed governmental standards. |
| | • | | We authorize our employees, agents and contractors to get information about you only when they need it to do their work for us. |
| | • | | We require companies working for us to protect information. They agree to use it only to provide the services we ask them to perform for us. |
Q. Is information about me shared with others?
A. No, we do not share personally identifiable information about you except as noted below.
Q. Is information about me shared with service providers?
A. Yes, as permitted by law. We may share information about you with outside companies that work for us. These may include firms that help us maintain and service accounts. For instance, we will share information with the transfer agent for Pacholder High Yield Fund, Inc. The transfer agent needs this information to process your purchase and sale transactions, to pay dividends to you and to update your account.
Q. Is information about me shared in any other ways?
A. Yes. We may also share information about you in other ways, as required or permitted by law. Here are some examples of ways that we share information.
| | • | | To protect against fraud. |
| | • | | To respond to a subpoena. |
| | • | | To service your account. |
Special Notice for California Residents
In order to comply with California law, if your account has a California mailing address, we will not share information about you with third parties unless we first provide you with further privacy choices or unless otherwise permitted by law such as servicing your account.
Special Notice for Vermont Residents
In order to comply with Vermont law, if we disclose information about you to other financial institutions with which we have joint marketing agreements, we will only disclose your name, contact information and information about your transactions.
THE PACHOLDER HIGH YIELD FUND, INC.’s PRIVACY COMMITMENT. The Pacholder High Yield Fund, Inc. is committed to protecting the privacy of our customers, but we understand that the best protection requires a partnership with you. We encourage you to find out how you can take steps to further protect your own privacy by visiting us online at www.phf-hy.com.
Dividend Reinvestment Plan
The Fund’s Dividend Reinvestment Plan offers you an automatic way to reinvest your dividends and capital gains distributions in additional shares of the Fund. For an enrollment form and detailed information about the Plan, please contact Computershare Investor Services, P.O. Box 1689, Chicago, IL 60690-1689, (888) 294-8217, and www.computershare.com.
21
PACHOLDER HIGH YIELD FUND, INC.
Directors and Officers
| | |
Gary J. Madich, CFA President Joseph F. Sanzone Vice President Jessica K. Ditullio Secretary Arthur A. Jensen Treasurer Penny Grandominico Chief Compliance Officer | | John F. Williamson Chairman and Director George D. Woodard Director Daniel A. Grant Director William J. Morgan Director |
Investment Objective
A closed-end fund seeking a high level of total return
through current income and capital appreciation by
investing primarily in high-yield, fixed income securities
of domestic companies.
Investment Advisor
J.P. Morgan Investment Management Inc.
Administrator
JPMorgan Funds Management, Inc.
Custodian
JPMorgan Chase Bank, N.A.
Transfer Agent
Computershare Investor Services, LLC
Legal Counsel
Kirkpatrick & Lockhart Preston Gates Ellis LLP
Independent Registered Public Accounting Firm
PricewaterhouseCoopers LLP
Executive Offices
Pacholder High Yield Fund, Inc.
8044 Montgomery Road
Suite 555
Cincinnati, Ohio 45236
Shareholder Services
(800) 343-1113
Please visit our web site, www.phf-hy.com, for information on the Fund’s NAV, share price, news releases, and SEC filings. We created this site to provide stockholders quick and easy access to the timeliest information available regarding the Fund.
This report is for the information of stockholders of Pacholder High Yield Fund, Inc. It is not a prospectus, offering circular or other representation intended for use in connection with the purchase or sale of shares of the Fund or any securities mentioned in this report.
PACHOLDER HIGH YIELD FUND, INC.
ANNUAL REPORT
DECEMBER 31, 2006
Disclose whether, as of the end of the period covered by the report, the registrant has adopted a code of ethics that applies to the registrant’s principal executive officer, principal financial officer, principal accounting officer or controller, or persons performing similar functions, regardless of whether these individuals are employed by the registrant or a third party. If the registrant has not adopted such a code of ethics, explain why it has not done so.
The registrant must briefly describe the nature of any amendment, during the period covered by the report, to a provision of its code of ethics that applies to the registrant’s principal executive officer, principal financial officer, principal accounting officer or controller, or persons performing similar functions, regardless of whether these individuals are employed by the registrant or a third party, and that relates to any element of the code of ethics definition enumerated in paragraph (b) of this Item. The registrant must file a copy of any such amendment as an exhibit pursuant to Item 12(a)(1), unless the registrant has elected to satisfy paragraph (f) of this Item by positing its code of ethics on its website pursuant to paragraph (f)(2) of this Item, or by undertaking to provide its code of ethics to any person without charge, upon request, pursuant to paragraph (f)(3) of this Item.
If the registrant has, during the period covered by the report, granted a waiver, including an implicit waiver, from a provision of the code of ethics that applies to the registrant’s principal executive officer, principal financial officer, principal accounting officer or controller, or persons performing similar functions, regardless of whether these individuals are employed by the registrant or third party, that relates to one or more items set forth in paragraph (b) of this Item, the registrant must briefly describe the nature of the waiver, the name of the person to whom the waiver was granted, and the date of the waiver.
The Registrant has not granted any waiver, including an implicit waiver, from a provision of the code of ethics that applies to the Registrant’s principal executive officer, principal financial officer, principal accounting officer or controller, or persons performing similar functions.
| ITEM 3. | AUDIT COMMITTEE FINANCIAL EXPERT. |
(a) (1) Disclose that the registrant’s board of directors has determined that the registrant either:
(i) Has at least one audit committee financial expert serving on its audit committee; or
(ii) Does not have an audit committee financial expert serving on its audit committee.
The Registrant’s Board of Directors has determined that the Registrant has at least one audit committee financial expert serving on its Audit Committee.
(2) If the registrant provides the disclosure required by paragraph (a)(1)(i) of this Item, it must disclose the name of the audit committee financial expert and whether that person is “independent.” In order to be considered “independent” for purposes of this Item, a member of an audit committee may not, other than in his or her capacity as a member of the audit committee, the board of directors, or any other board committee:
(i) Accept directly or indirectly any consulting, advisory, or other compensatory fee from the issuer; or
(ii) Be an “interested person” of the investment company as defined in Section 2(a)(19) of the Act (15 U.S.C. 80a-2(a)(19)).
The audit committee financial expert is George D. Woodard. He is “independent” for purposes of Item 3.
(3) If the registrant provides the disclosure required by paragraph (a)(1)(ii) of this Item, it must explain why it does not have an audit committee financial expert.
Not applicable.
| ITEM 4. | PRINCIPAL ACCOUNTANT FEES AND SERVICES. |
(a) Disclose, under the caption Audit Fees, the aggregate fees billed for each of the last two fiscal years for professional services rendered by the principal accountant for the audit of the registrant’s annual financial statements or services that are normally provided by the accountant in connection with statutory and regulatory filings or engagements for those fiscal years.
|
AUDIT FEES |
2006 – $76,350 |
2005 – $61,000 |
(b) Disclose, under the caption Audit-Related Fees, the aggregate fees billed in each of the last two fiscal years for assurance and related services by the principal accountant that are reasonably related to the performance of the audit of the registrant’s financial statements and are not reported under paragraph (a) of this Item. Registrants shall describe the nature of the services comprising the fees disclosed under this category.
|
AUDIT-RELATED FEES (On a calendar year basis) |
2006 – $5,000 |
2005 – $5,000 |
The audit-related fees consist of aggregate fees billed for assurance and related services by the independent registered public accounting firm to the Registrant’s investment adviser (not including any sub-adviser whose role is primarily portfolio management and is subcontracted with or overseen by another investment adviser), and any entity controlling, controlled by or under common control with the investment adviser that provides ongoing services to the Registrant (“Service Affiliates”), that were reasonably related to the performance of the annual audit of the Registrant’s financial statements.
(c) Disclose, under the caption Tax Fees, the aggregate fees billed in each of the last two fiscal years for professional services rendered by the principal accountant for tax compliance, tax advice, and tax planning. Registrants shall describe the nature of the services comprising the fees disclosed under this category.
|
TAX FEES |
2006 – $4,480 |
2005 – $3,750 |
The tax fees consist of fees billed in connection with preparing the federal regulated investment company income tax returns for the Registrant for the tax years ended December 31, 2006 and 2005.
For the last fiscal year, no tax fees were required to be approved pursuant to paragraph (c)(7)(ii) of Rule 2-01 of Regulation S-X.
(d) Disclose, under the caption All Other Fees, the aggregate fees billed in each of the last two fiscal years for products and services provided by the principal accountant, other than the services reported in paragraphs (a) through (c) of this Item. Registrants shall describe the nature of the services comprising the fees disclosed under this category.
|
ALL OTHER FEES |
2006 – Not applicable |
2005 – Not applicable |
(e) (1) Disclose the audit committee’s pre-approval policies and procedures described in paragraph (c)(7) of Rule 2-01 of Regulation S-X.
The Registrant’s Audit Committee has adopted a policy whereby audit and non-audit services performed by the principal accountant for the Registrant, its investment adviser, and any entity controlling, controlled by, or under common control with the investment adviser that provides ongoing services to the Registrant require pre-approval and/or review in advance at regularly scheduled Audit Committee meetings.
(2) Disclose the percentage of services described in each of paragraphs (b) through (d) of this Item that were approved by the audit committee pursuant to paragraph (c)(7)(i)(C) of Rule 2-01 of Regulation S-X.
(f) If greater than 50 percent, disclose the percentage of hours expended on the principal accountant’s engagement to audit the registrant’s financial statements for the most recent fiscal year that were attributed to work performed by persons other than the principal accountant’s full-time, permanent employees.
None.
(g) Disclose the aggregate non-audit fees billed by the registrant’s accountant for services rendered to the registrant, and rendered to the registrant’s investment adviser (not including any sub-adviser whose role is primarily portfolio management and is subcontracted with or overseen by another investment adviser), and any entity controlling, controlled by, or under common control with the adviser that provides ongoing services to the registrant for each of the last two fiscal years of the registrant.
The aggregate non-audit fees billed by the independent registered public accounting firm for services rendered to the Registrant, and rendered to Service Affiliates, for the last two calendar year ends were $57.1 million in 2006 and $55.3 million in 2005.
(h) Disclose whether the registrant’s audit committee of the board of directors has considered whether the provision of non-audit services that were rendered to the registrant’s investment adviser (not including any subadviser whose role is primarily portfolio management and is subcontracted with or overseen by another investment adviser), and any entity controlling, controlled by, or under common control with the investment adviser that provides ongoing services to the registrant that were not pre-approved pursuant to paragraph (c)(7)(ii) of Rule 2-01 of Regulation S-X is compatible with maintaining the principal accountant’s independence.
The Registrant’s Audit Committee has considered whether the provision of the non-audit services that were rendered to Service Affiliates that were not pre-approved (not requiring pre-approval) is compatible with maintaining the independent public registered accounting firm’s independence. All services provided by the independent public registered accounting firm to the Registrant or to Service Affiliates that were required to be pre-approved were pre-approved as required.
| ITEM 5. | AUDIT COMMITTEE OF LISTED REGISTRANTS. |
(a) If the registrant is a listed issuer as defined in Rule 10A-3 under the Exchange Act (17CFR 240.10A-3), state whether or not the registrant has a separately-designated standing audit committee established in accordance with Section 3(a)(58)(A) of the Exchange Act (15 U.S.C. 78c(a)(58)(A)). If the registrant has such a committee, however designated, identify each committee member. If the entire board of directors is acting as the registrant’s audit committee as specified in Section 3(a)(58)(B) of the Exchange Act (15 U.S.C. 78c(a)(58)(B)), so state.
The Registrant has a separately-designated standing Audit Committee established by the Board of Directors of the Registrant in accordance with Section 3(a)(58)(A) of the Securities Exchange Act of 1934, as amended. It is composed of the following Directors, each of whom is not an “interested person” as defined in the Investment Company Act of 1940, as amended:
George D. Woodard
Daniel A. Grant
John F. Williamson
(b) If applicable, provide the disclosure required by Rule 10A-3(d) under the Exchange Act (17CFR 240.10A-3(d)) regarding an exemption from the listing standards for all audit committees.
Not Applicable
| ITEM 6. | SCHEDULE OF INVESTMENTS |
File Schedule I – Investments in securities of unaffiliated issuers as of the close of the reporting period as set forth in Section 210.12-12 of Regulation S-X, unless the schedule is included as part of the report to shareholders filed under Item 1 of this Form.
Included in Item 1.
| ITEM 7. | DISCLOSURE OF PROXY VOTING POLICIES AND PROCEDURES FOR CLOSED-END MANAGEMENT INVESTMENT COMPANIES. |
A closed-end management investment company that is filing an annual report on this Form N-CSR must, unless it invests exclusively in non-voting securities, describe the policies and procedures that it uses to determine how to vote proxies relating to portfolio securities, including the procedures that the company uses when a vote presents a conflict between the interests of its shareholders, on the one hand, and those of the company’s investment adviser; principal underwriter; or any affiliated person (as defined in Section 2(a)(3) of the Investment Company Act of 1940 (15 U.S.C. 80a-2(a)(3)) and the rules thereunder) of the company, its investment adviser, or its principal underwriter, on the other. Include any policies and procedures of the company’s investment adviser, or any other third party, that the company uses, or that are used on the company’s behalf, to determine how to vote proxies relating to portfolio securities.
The Registrant has adopted proxy voting policies and procedures, as defined in Item 7 of Form N-CSR. A copy of the policies and procedures is filed as Exhibit 12(a)(3) to this Form. The Board of Directors has delegated to the Fund’s investment adviser (the “Adviser”), proxy voting authority with respect to the Fund’s portfolio securities. To ensure that the proxies of portfolio companies are voted in the best interests of the Fund, the Fund’s Board of Directors has adopted the Adviser’s detailed proxy voting procedures (the “Procedures”) that incorporate guidelines (“Guidelines”) for voting proxies on specific types of issues.
The Adviser and its affiliated advisers are part of a global asset management organization with the capability to invest in securities of issuers located around the globe. Because the regulatory framework and the business cultures and practices vary from region to region, the Guidelines are customized for each region to take into account such variations. Separate Guidelines cover the regions of (1) North America, (2) Europe, Middle East, Africa, Central America and South America, (3) Asia (ex-Japan) and (4) Japan, respectively.
Notwithstanding the variations among the Guidelines, all of the Guidelines have been designed with the uniform objective of encouraging corporate action that enhances shareholder value. As a general rule, in voting proxies of a particular security, the Adviser will apply the Guidelines of the region in which the issuer of such security is organized. Except as noted below, proxy voting decisions will be made in accordance with the Guidelines covering a multitude of both routine and non-routine matters that the Adviser and its affiliated advisers have encountered globally, based on many years of collective investment management experience.
To oversee and monitor the proxy-voting process, the Adviser has established a proxy committee and appointed a proxy administrator in each global location where proxies are voted. The primary function of each proxy committee is to review periodically general proxy-voting matters, review and approve the Guidelines annually, and provide advice and recommendations on general proxy-voting matters as well as on specific voting issues. The procedures permit an independent voting service, currently Institutional Shareholder Services, Inc. (“ISS”) in the United States, to perform certain services otherwise carried out or coordinated by the proxy administrator.
Although for many matters the Guidelines specify the votes to be cast, for many others, the Guidelines contemplate case-by-case determinations. In addition, there will undoubtedly be proxy matters that are not contemplated by the Guidelines. For both of these categories of matters and to override the Guidelines, the Procedures require a certification and review process to be completed before the vote is cast. That process is designed to identify actual or potential material conflicts of interest (between the Fund on the one hand, and the Fund’s investment adviser, principal underwriter or an affiliate of any of the foregoing, on the other hand) and ensure that the proxy vote is cast in the best interests of the Fund. When a potential material conflict of interest has been identified, the proxy administrator and a subgroup of proxy committee members (composed of a member from the Investment Department and one or more members from the Legal, Compliance or Risk Management Departments) will evaluate the potential conflict of interest and determine whether such conflict actually exists, and if so, will recommend how the Adviser will vote the proxy. In addressing any material conflict, the Adviser may take one or more of the following measures (or other appropriate action): removing or “walling off” from the proxy voting process certain Adviser personnel with knowledge of the conflict, voting in accordance with any applicable Guideline if the application of the Guideline would objectively result in the casting of a proxy vote in a predetermined manner, or deferring the vote to ISS, which will vote in accordance with its own recommendation.
The following summarizes some of the more noteworthy types of proxy voting policies of the non-U.S. Guidelines:
| | • | | Corporate governance procedures differ among the countries. Because of time constraints and local customs, it is not always possible for the Adviser to receive and review all proxy materials in connection with each item submitted for a vote. Many proxy statements are in foreign languages. Proxy materials are generally mailed by the issuer to the sub-custodian which holds the securities for the client in the country where the portfolio company is organized, and there may not be sufficient time for such materials to be transmitted to the Adviser in time for a vote to be cast. In some countries, proxy statements are not mailed at all, and in some locations, the deadline for voting is two to four days after the initial announcement that a vote is to be solicited. The Adviser also considers the cost of voting in light of the expected benefit of the vote. |
| | • | | Where proxy issues concern corporate governance, takeover defense measures, compensation plans, capital structure changes and so forth, the Adviser pays particular attention to management’s arguments for promoting the prospective change the Adviser’s sole criterion in determining its voting stance is whether such changes will be to the economic benefit of the beneficial owners of the shares. |
| | • | | The Adviser is in favor of a unitary board structure of the type found in the United Kingdom as opposed to tiered board structures. Thus, the Adviser will generally vote to encourage the gradual phasing out of tiered board structures, in favor of unitary boards. However, since tiered boards are still very prevalent in markets outside of the United Kingdom, local market practice will always be taken into account. |
| | • | | The Adviser will use its voting powers to encourage appropriate levels of board independence, taking into account local market practice. |
| | • | | The Adviser will usually vote against discharging the board from responsibility in cases of pending litigation, or if there is evidence of wrongdoing for which the board must be held accountable. |
| | • | | The Adviser will vote in favor of increases in capital which enhance a company’s long-term prospects. The Adviser will also vote in favor of the partial suspension of preemptive rights if they are for purely technical reasons (e.g., rights offers which may not be legally offered to shareholders in certain jurisdictions). However, the Adviser will vote against increases in capital which would allow the company to adopt “poison pill” takeover defense tactics, or where the increase in authorized capital would dilute shareholder value in the long term. |
| | • | | The Adviser will vote in favor of proposals which will enhance a company’s long-term prospects. The Adviser will vote against an increase in bank borrowing powers which would result in the company reaching an unacceptable level of financial leverage, where such borrowing is expressly intended as part of a takeover defense, or where there is a material reduction in shareholder value. |
| | • | | The Adviser reviews shareholder rights plans and poison pill proposals on a case-by-case basis; however, the Adviser will generally vote against such proposals and vote for revoking existing plans. |
| | • | | Where social or environmental issues are the subject of a proxy vote, the Adviser will consider the issue on a case-by-case basis, keeping in mind at all times the best economic interests of its clients. |
| | • | | With respect to Asia, for routine proxies (e.g., in respect of voting at the Annual General Meeting of Shareholders) the Adviser’s position is to neither vote in favor or against. For Extraordinary General Meetings of Shareholders, however, where specific issues are put to a shareholder vote, these issues are analyzed by the respective country specialist concerned. A decision is then made based on his or her judgment. |
The following summarizes some of the more noteworthy types of proxy voting policies of the U.S. Guidelines:
| | • | | The Adviser considers votes on director nominees on a case-by-case basis. Votes generally will be withheld from directors who: (a) attend less than 75% of board and committee meetings without a valid excuse; (b) implement or renew a dead-hand poison pill; (c) are affiliated directors who serve on audit, compensation or nominating committees or are affiliated directors and the full board serves on such committees or the company does not have such committees; or (d) ignore a shareholder proposal that is approved for two consecutive years by a majority of either the shares outstanding or the votes cast. |
| | • | | The Adviser votes proposals to classify boards on a case-by-case basis, but will vote in favor of such proposal if the issuer’s governing documents contain each of eight enumerated safeguards (for example, a majority of the board is composed of independent directors and the nominating committee is composed solely of such directors). |
| | • | | The Adviser also considers management poison pill proposals on a case-by-case basis, looking for shareholder-friendly provisions before voting in favor. |
| | • | | The Adviser votes against proposals for a super-majority vote to approve a merger. |
| | • | | The Adviser considers proposals to increase common and/or preferred shares and to issue shares as part of a debt restructuring plan on a case-by-case basis, taking into account the extent of dilution and whether the transaction will result in a change in control. |
| | • | | The Adviser votes proposals on a stock option plan based primarily on a detailed, quantitative analysis that takes into account factors such as estimated dilution to shareholders’ equity and dilution to voting power. The Adviser generally considers other management compensation proposals on a case-by-case basis. |
| | • | | The Adviser also considers on a case-by-case basis proposals to change an issuer’s state of incorporation, mergers and acquisitions and other corporate restructuring proposals and certain social and environmental issue proposals. |
| ITEM 8. | PORTFOLIO MANAGERS OF CLOSED-END MANAGEMENT INVESTMENT COMPANIES. |
PORTFOLIO MANAGEMENT
As of the date of this report, the portfolio manager primarily responsible for the day-to-day management of the Registrant’s (also referred to herein as the “Fund”) portfolio is William J. Morgan, Director of the Fund and a managing director of the Fund’s investment adviser (the “Adviser”).
Mr. Morgan has been managing the Fund since June 2000 and has been associated with the Adviser or its predecessors in an investment management capacity for more than five years.
OTHER ACCOUNTS MANAGED BY THE PORTFOLIO MANAGER
As of December 31, 2006, Mr. Morgan managed two mutual funds with a total of approximately $1.3 billion in assets; one pooled investment vehicle with a total of approximately $8.6 million in assets; and seven other accounts with a total of approximately $210.6 million in assets. The Adviser is not paid a performance based fee in connection with the mutual funds and other accounts.
POTENTIAL CONFLICT OF INTEREST
The potential for conflicts of interest exists when the portfolio manager manages other accounts with similar investment objectives and strategies as the Fund (“Similar Accounts”). Potential conflicts may include, for example, conflicts between investment strategies and conflicts in the allocation of investment opportunities.
Responsibility for managing the Adviser’s and its affiliates’ clients’ portfolios is organized according to investment strategies within asset classes. Generally, client portfolios with similar strategies are managed by portfolio managers in the same portfolio management group using the same objectives, approach and philosophy. Underlying sectors or strategy allocations within a larger portfolio are likewise managed by portfolio managers who use the same approach and philosophy as similarly managed portfolios. Therefore, portfolio holdings, relative position sizes and industry and sector exposures tend to be similar across similar portfolios and strategies, which minimizes the potential for conflicts of interest.
The Adviser and/or its affiliates may receive more compensation with respect to certain Similar Accounts than that received with respect to the Fund or may receive compensation based in part on the performance of certain Similar Accounts. This may create a potential conflict of interest for the Adviser and its affiliates or the portfolio manager by providing an incentive to favor these Similar Accounts when, for example, placing securities transactions. In addition, the Adviser or its affiliates could be viewed as having a conflict of interest to the extent that the Adviser or an affiliate has a proprietary investment in Similar Accounts, the portfolio manager has personal investments in Similar Accounts or the Similar Accounts are investment options in the Adviser’s or its affiliates’ employee benefit plans. Potential conflicts of interest may arise with both the aggregation and allocation of securities transactions and allocation of investment opportunities because of market factors or investment restrictions imposed upon the Adviser and its affiliates by law, regulation, contract or internal policies. Allocations of aggregated trades, particularly trade orders that were only partially completed due to limited availability and allocation of investment opportunities generally, could raise a potential conflict of interest, as the Adviser or its affiliates may have an incentive to allocate securities that are expected to increase in value to favored accounts. Initial public offerings, in particular, are frequently of very limited availability. The Adviser and its affiliates may be perceived as causing accounts they manage to participate in an offering to increase the Adviser’s and its affiliates’ overall allocation of securities in that offering. A potential conflict of interest also may be perceived to arise if
transactions in one account closely follow related transactions in a different account, such as when a purchase increases the value of securities previously purchased by another account, or when a sale in one account lowers the sale price received in a sale by a second account. If the Adviser or its affiliates manage accounts that engage in short sales of securities of the type in which the Fund invests, the Adviser or its affiliates could be seen as harming the performance of the Fund for the benefit of the accounts engaging in short sales if the short sales cause the market value of the securities to fall.
As an internal policy matter, the Adviser or its affiliates may from time to time maintain certain overall investment limitations on the securities positions or positions in other financial instruments the Adviser or its affiliates will take on behalf of its various clients due to, among other things, liquidity concerns and regulatory restrictions. Such policies may preclude the Fund from purchasing particular securities or financial instruments, even if such securities or financial instruments would otherwise meet the Fund’s objectives.
The goal of the Adviser and its affiliates is to meet their fiduciary obligation with respect to all clients. The Adviser and its affiliates have policies and procedures designed to manage the conflicts. The Adviser and its affiliates monitor a variety of areas, including compliance with fund guidelines, review of allocation decisions and compliance with the Adviser’s Codes of Ethics and JPMorgan Chase & Co.’s Code of Conduct. With respect to the allocation of investment opportunities, the Adviser and its affiliates also have certain policies designed to achieve fair and equitable allocation of investment opportunities among its clients over time. For example:
Orders for the same equity security traded through a single trading desk or system are aggregated on a continual basis throughout each trading day consistent with the Adviser’s and its affiliates’ duty of best execution for its clients. If aggregated trades are fully executed, accounts participating in the trade will be allocated their pro rata share on an average price basis. Partially completed orders generally will be allocated among the participating accounts on a pro-rata average price basis, subject to certain limited exceptions. For example, accounts that would receive a de minimis allocation relative to their size may be excluded from the order. Another exception may occur when thin markets or price volatility require that an aggregated order be completed in multiple executions over several days. If partial completion of the order would result in an uneconomic allocation to an account due to fixed transaction or custody costs, the Adviser and its affiliates may exclude small orders until 50% of the total order is completed. Then the small orders will be executed. Following this procedure, small orders will lag in the early execution of the order, but will be completed before completion of the total order.
Purchases of money market instruments and fixed income securities cannot always be allocated pro-rata across the accounts with the same investment strategy and objective. However, the Adviser and its affiliates attempt to mitigate any potential unfairness by basing non-pro rata allocations traded through a single trading desk or system upon an objective predetermined criteria for the selection of investments and a disciplined process for allocating securities with similar duration, credit quality and liquidity in the good faith judgment of the Adviser or its affiliates so that fair and equitable allocation will occur over time.
PORTFOLIO MANAGER COMPENSATION
The portfolio manager’s total compensation program includes a base salary fixed from year to year and a variable performance bonus consisting of cash incentives and restricted stock and may include mandatory notional investments (as described below) in selected funds advised by the Adviser or its affiliates. These elements reflect individual performance and the performance of the Adviser’s business as a whole.
The portfolio manager’s performance is formally evaluated annually based on a variety of factors including the aggregate size and blended performance of the portfolios the portfolio manager manages. Individual contribution relative to client goals carries the highest impact. Portfolio manager compensation is primarily driven by meeting or exceeding clients’ risk and return objectives, relative performance to competitors or competitive indices and compliance with firm policies and regulatory requirements. In evaluating the portfolio manager’s performance with respect to the funds he manages, the funds’ pre-tax performance is compared to the appropriate market peer group and to each fund’s benchmark over one, three and five year periods (or such shorter time as the portfolio manager has managed a fund). Investment performance is generally more heavily weighted to the long-term.
Awards of restricted stock are granted as part of an employee’s annual performance bonus and comprise from 0% to 35% of the portfolio manager’s total bonus. As the level of incentive compensation increases, the percentage of compensation awarded in restricted stock also increases. Up to 50% of the restricted stock portion of the portfolio manager’s bonus may instead be subject to mandatory notional investment in selected mutual funds advised by the Adviser or its affiliates. When these awards vest over time, the portfolio manager receives cash equal to the market value of the notional investment in the selected funds.
SECURITIES OWNERSHIP OF PORTFOLIO MANAGER
As of December 31, 2006, the dollar range of securities beneficially owned by the portfolio manager in the Fund is shown below:
William J. Morgan: over $100,000
| ITEM 9. | PURCHASE OF EQUITY SECURITIES BY CLOSED-END MANAGEMENT INVESTMENT COMPANY AND AFFILIATED PURCHASERS. |
(a) If the registrant is a closed-end management investment company, provide the information specified in paragraph (b) of this Item with respect to any purchase made by or on behalf of the registrant or any “affiliated purchaser,” as defined in Rule 10b-18(a)(3) under the Exchange Act (17 CFR 240.10b-18(a)(3)), of shares or other units of any class of the registrant’s equity securities that is registered by the registrant pursuant to Section 12 of the Exchange Act (15 U.S.C. 781).
There were no purchases covered by this Item during the period covered by this report.
| ITEM 10. | SUBMISSION OF MATTERS TO A VOTE OF SECURITY HOLDERS. |
Describe any material changes to the procedures by which shareholders may recommend nominees to the registrant’s board of directors, where those changes were implemented after the registrant last provided disclosure in response to the requirements of Item 7(d)(2)(ii)(G) of Schedule 14A (17 CFR 240.14a-101), or this Item.
Not applicable.
| ITEM 11. | CONTROLS AND PROCEDURES. |
(a) Disclose the conclusions of the registrant’s principal executive and principal financial officers, or persons performing similar functions, regarding the effectiveness of the registrant’s disclosure controls and procedures (as defined in Rule 30a-3(c) under the Act (17 CFR 270.30a-3(c))) as of a date within 90 days of the filing date of the report that includes the disclosure required by this paragraph, based on the evaluation of these controls and procedures required by Rule 30a-3(b) under the Act (17 CFR 270.30a-3(b)) and Rules 13a-15(b) or 15d-15(b) under the Exchange Act (17 CFR 240.13a-15(b) or 240.15d-15(b)).
The Registrant’s principal executive and principal financial officers have concluded, based on their evaluation of the Registrant’s disclosure controls and procedures as of a date within 90 days of the filing date of this report, that the Registrant’s disclosure controls and procedures are reasonably designed to ensure that information required to be disclosed by the Registrant on Form N-CSR is recorded, processed, summarized and reported within the required time periods and that information required to be disclosed by the Registrant in the reports that it files or submits on Form N-CSR is accumulated and communicated to the Registrant’s management, including its principal executive and principal financial officers, as appropriate to allow timely decisions regarding required disclosure.
(b) Disclose any change in the registrant’s internal control over financial reporting (as defined in Rule 30a-3(d) under the Act (17 CFR 270.30a-3(d)) that occurred during the registrant’s second fiscal quarter of the period covered by this report that has materially affected, or is reasonably likely to materially affect, the registrant’s internal control over financial reporting.
JPMorgan Funds Management, Inc. serves as the Registrant’s Administrator. The Administrator and Sub-Administrator prepare financial reports and administrative filings on behalf of the Registrant. J.P. Morgan Investor Services Co. began serving as the Sub-Administrator effective October 20, 2006 and in such capacity, assisted with financial reporting for the period covered by this report. The Registrant utilizes the internal control procedures developed by the Administrator and the Sub-Administrator.
(a) File the exhibits listed below as part of this Form. Letter or number the exhibits in the sequence indicated.
(a)(1) Any code of ethics, or amendment thereto, that is the subject of the disclosure required by Item 2, to the extent that the registrant intends to satisfy the Item 2 requirements through filing of an exhibit.
The Registrant has adopted proxy voting policies and procedures, as defined in Item 7 of Form N-CSR. A copy of the policies and procedures is filed as Exhibit 12(a)(3) to this Form.
(a)(2) A separate certification for each principal executive officer and principal financial officer of the registrant as required by Rule 30a-2(a) under the Act (17 CFR 270.30a-2).
Certifications pursuant to Rule 30a-2(a) under the Investment Company Act of 1940 are attached hereto.
(a)(3) Any written solicitation to purchase securities under Rule 23c-1 under the Act (17 CFR 270.23c-1) sent or given during the period covered by the report by or on behalf of the registrant to 10 or more persons.
Not applicable.
(b) A separate or combined certification for each principal executive officer and principal financial officer of the registrant as required by Rule 30a-2(b) under the Act of 1940.
Certifications pursuant to Rule 30a-2(b) under the Investment Company Act of 1940 are attached hereto.
SIGNATURES
Pursuant to the requirements of the Securities Exchange Act of 1934 and the Investment Company Act of 1940, the registrant has duly caused this report to be signed on its behalf by the undersigned, thereunto duly authorized.
| | |
| Pacholder High Yield Fund, Inc. |
| |
By: | | /s/ Gary J. Madich |
| | Gary J. Madich |
| | President and Principal Executive Officer |
| | March 12, 2007 |
Pursuant to the requirements of the Securities Exchange Act of 1934 and the Investment Company Act of 1940, this report has been signed below by the following persons on behalf of the registrant and in the capacities and on the dates indicated.
| | |
| By: | | /s/ Gary J. Madich |
| | Gary J. Madich |
| | President and Principal Executive Officer |
| | March 12, 2007 |
| |
| By: | | /s/ Arthur A. Jensen |
| | Arthur A. Jensen |
| | Treasurer and Principal Financial Officer |
| | March 12, 2007 |